

Page 1

SPECTROPHOTOMETER
Cole Parmer
USER’S MANUAL
MODELS
83057-01; 83057-06
83059-10; 83059-15
V 2.0
Cole Parmer Instruments Company.
625 East Hills, IL 60061
800-323-4340
Page 2

TABLE OF CONTENTS
General information……………………………………………………………… 3
Safety………………………….........................................................……… 3
Electrical………………………………………………………………........ 3
Warning…………………………………………………………………….. 3
Performance………………………………………………………………… 4
Radio Interference………………………………………………………….. 4
Introduction…........................................................................……………… 4
Working Principle.......................................................................…………… 4
Unpacking Instructions.....................................................………………….. 5
Specifications….............................................................................................. 5
Installation.............................................................................…….................. 5
Operational Panel....................................................................……................ 7
Description of Keys....................................................................……............ 7
Operation Instruction............................................................……………................... 8
Spectrophotometer Initialization ......................................................................... 8
BASIC MODE-%T/Abs Measure...............................................……………. 11
Quantitative Test.......................................................................……………… 15
Define/Establish Test Method……………………………………….. 15
By Standards………………………………………………… 15
By Known Factors…………………………………………… 23
Run Tests ……………………………………………………………. 28
System Setup…………………………………………………………………….. 31
Edit clock …………………………………………………………… 31
Dark Current………………………………………………………….. 33
WL Calibration ……………………………………………………….. 34
Language ……………………………………………………………… 36
WL Correction………………………………………………………… 37
Firmware Version …………………………………………………….. 37
PC LINK………………………………………………………………………. 37
Wavelength Calibration…………….……………………………….……………….. 37
Holmium Oxide Filter Method………………………………………………… 37
Didymium Filter Method……………………………………………………… 38
Absorbance Accuracy Checks………………………………………………… 39
Stary Light Check……………………………………………………………… 39
Trouble Shooting………………………………………………………….................. 41
Error Codes Definitions……………………………………………………………… 42
2
Page 3

1. General information
The apparatus described in this manual is designed to be used by properly trained personnel in a
suitable equipped laboratory. For the correct and safe use of this apparatus it is essential that
laboratory personnel follow generally accepted safe procedures in addition to the safety
precautions called for in this manual.
The covers on this instrument may be removed for servicing. However, the inside of the power
supply unit is a hazardous area and its cover should not be removed under any circumstances.
There are no serviceable components inside this power supply unit. Avoid touching the high
voltage power supply at all times.
Some of the chemicals used in spectrophotometry are corrosive and/or inflammable and samples
may be radioactive, toxic, or potentially infective. Care should be taken to follow the normal
laboratory procedures for handling chemicals and samples.
Safety
Read the following before installing and using the instrument and its accessories.
Electrical
Before switching on the apparatus, make sure it is set to the voltage of the local power supply.
The power cord shall be inserted in a socket provided with a protective earth contact. The
protective action must not be negated by the use of an extension cord without a protective
conductor.
Warning
Any interruption of the protective conductor inside or outside the apparatus or disconnection of
the protective earth terminal is likely to make the apparatus dangerous. Intentional interruption
is prohibited.
Whenever it is likely that the protection has been impaired, the apparatus shall be made
inoperative and be secured against any unintended operation. NEVER touch or handle the
power supply due to the high voltage.
The protection is likely to be impaired if, for example, the apparatus
• Shows visible damage
• Fails to perform the intended measurements
• Has been subjected to prolonged storage under unfavorable conditions.
• Has been subjected to severe transport stresses
3
Page 4
Performance
To ensure that the instrument is working within its specification, especially when making
measurements of an important nature, carry out performance checks with particular reference to
wavelength and absorbance accuracy. Performance checks are detailed in this manual.
Radio Interference
For compliance with the EMC standards referred to in the EC Declaration of Conformity, it is
necessary that only shielded cables are used when connecting the instrument to computers and
accessories.
Introduction
Cole-Parmer Spectrophotometer is a single beam, general purpose instrument designed to meet
the needs of the Conventional Laboratory, They are ideal for various applications, such as:
Biochemistry, Petro-chemistry, Environmental Protection, Food and Beverage Labs, Water and
Waste Water Labs and other fields of quality control and research.
The spectrophotometer features a digital display, easy operation and wavelength range of 325nm
to 1000nm for visible and 200nm to 1000nm for UV model. It is ideal for measurements in the
visible wavelength region of the electromagnetic spectrum and UV model in ultraviolet and
visible wavelength region.
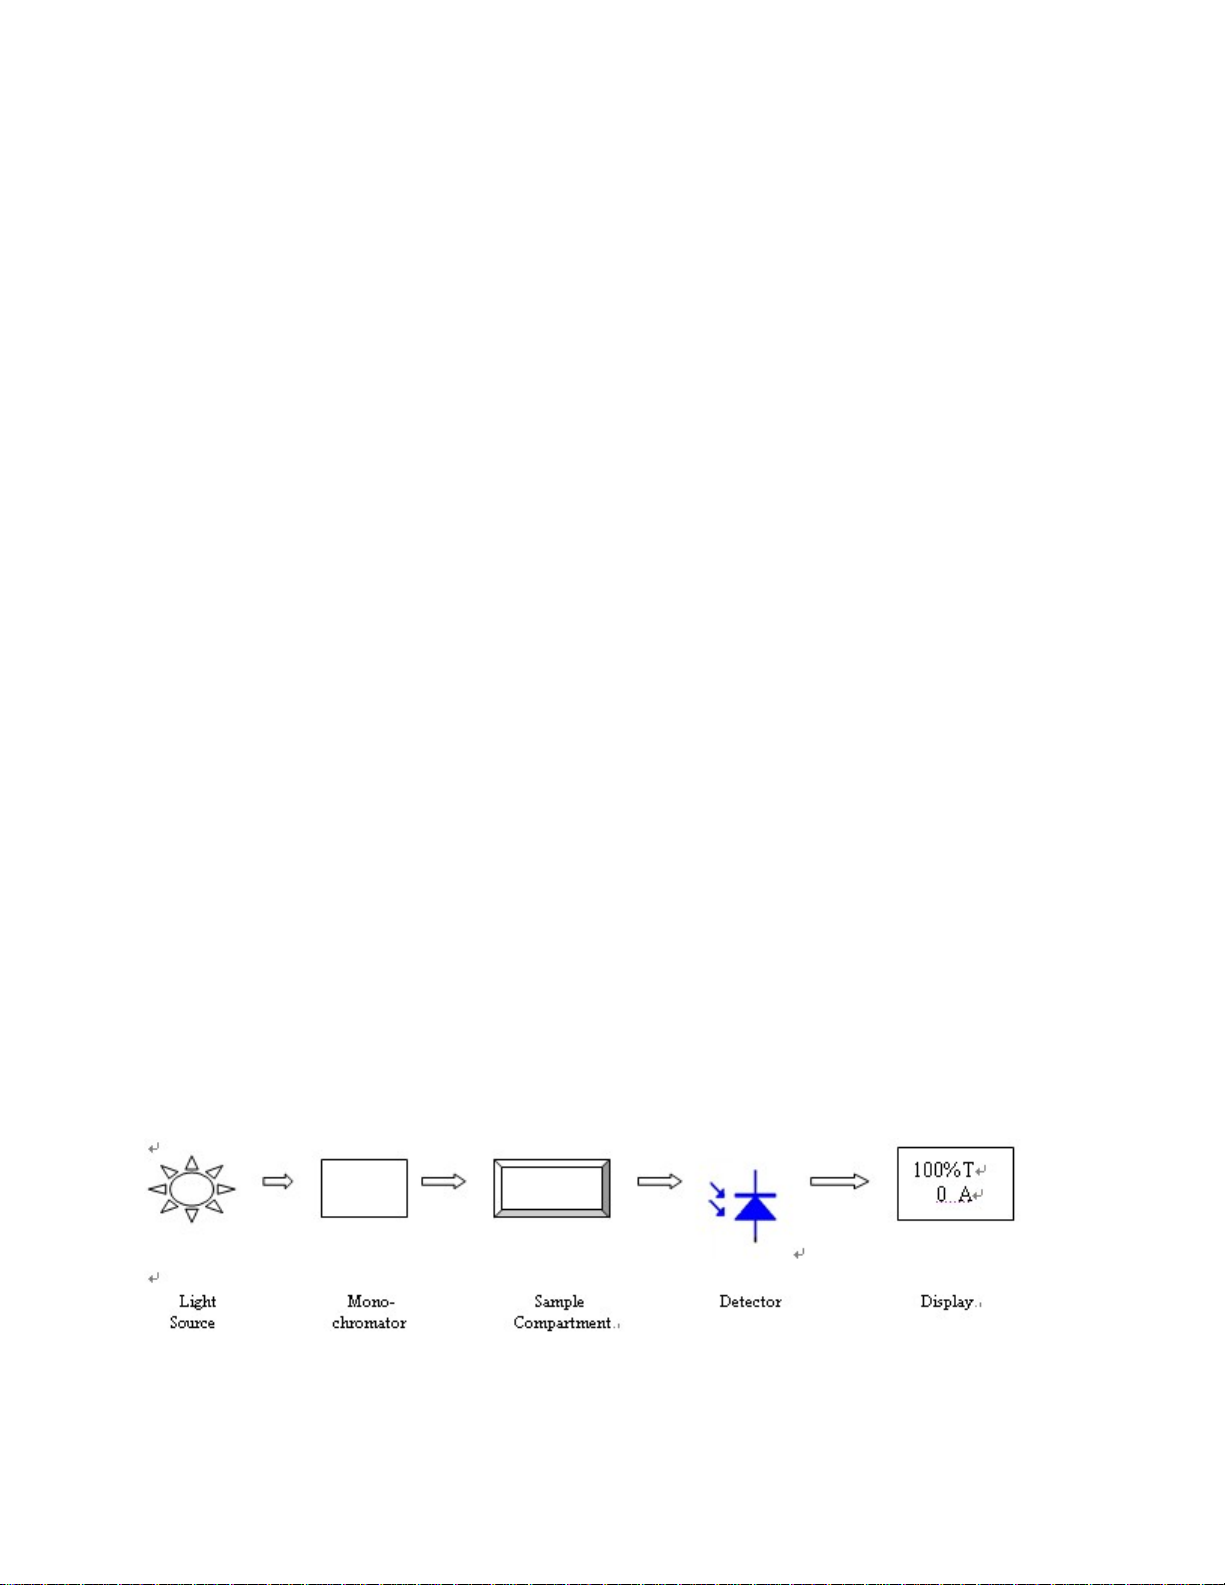
Working Principle
The spectrophotometer consists of five parts: 1) Halogen and deuterium (UV model only) lamp
to supply the light; 2) A Monochromator to isolate the wavelength of interest and eliminate the
unwanted second order radiation; 3) A sample compartment to accommodate the sample
solution; 4) A detector to receive the transmitted light and convert it to an electrical signal; and
5) A digital display to indicate absorbance or transmittance. The block diagram below illustrates
the relationship between these parts.
Block diagram for the Spectrophotometer
4
Page 5

In your spectrophotometer, light from the lamp is focused on the entrance slit of the
monochromator where the collimating mirror directs the beam onto the grating. The grating
disperses the light beam to produce the spectrum, a portion of which is focused on the exit slit of
the monochromator by a collimating mirror. From here the beam is passed to a sample
compartment through one of the filters, which helps to eliminate unwanted second order
radiation from the diffraction grating. Upon leaving the sample compartment, the beam is
passed to the silicon photodiode detector and causes the detector to produce an electrical signal
that is displayed on the digital display.
The spectrophotometer incorporates USB bi-directional port for connecting to a PC for using the
Application Software (not included with the instrument).
The RS232 Port is for use with RS232 printer and for firmware (built-in software) upgrade.
Unpacking Instructions
Carefully unpack the contents and check the materials against the following packing list to
ensure that you have received everything in good condition:
Packing List
Unless otherwise specially ordered the spectrophotometer package should include the following
items.
Description: ________________________ Quantity
Spectrophotometer...........……................. …............................................................ 1
Power Cord…………………………………......………………………………….. 1
Cuvettes, Glass ..................................……............... …............................................ Set of 4
Cuvettes, Quartz(UV model only)………………………………………………… Set of 2
Dust Cover...................................…….......…. …..................................................... 1
Manual................................................………............................................................. 1
5
Page 6
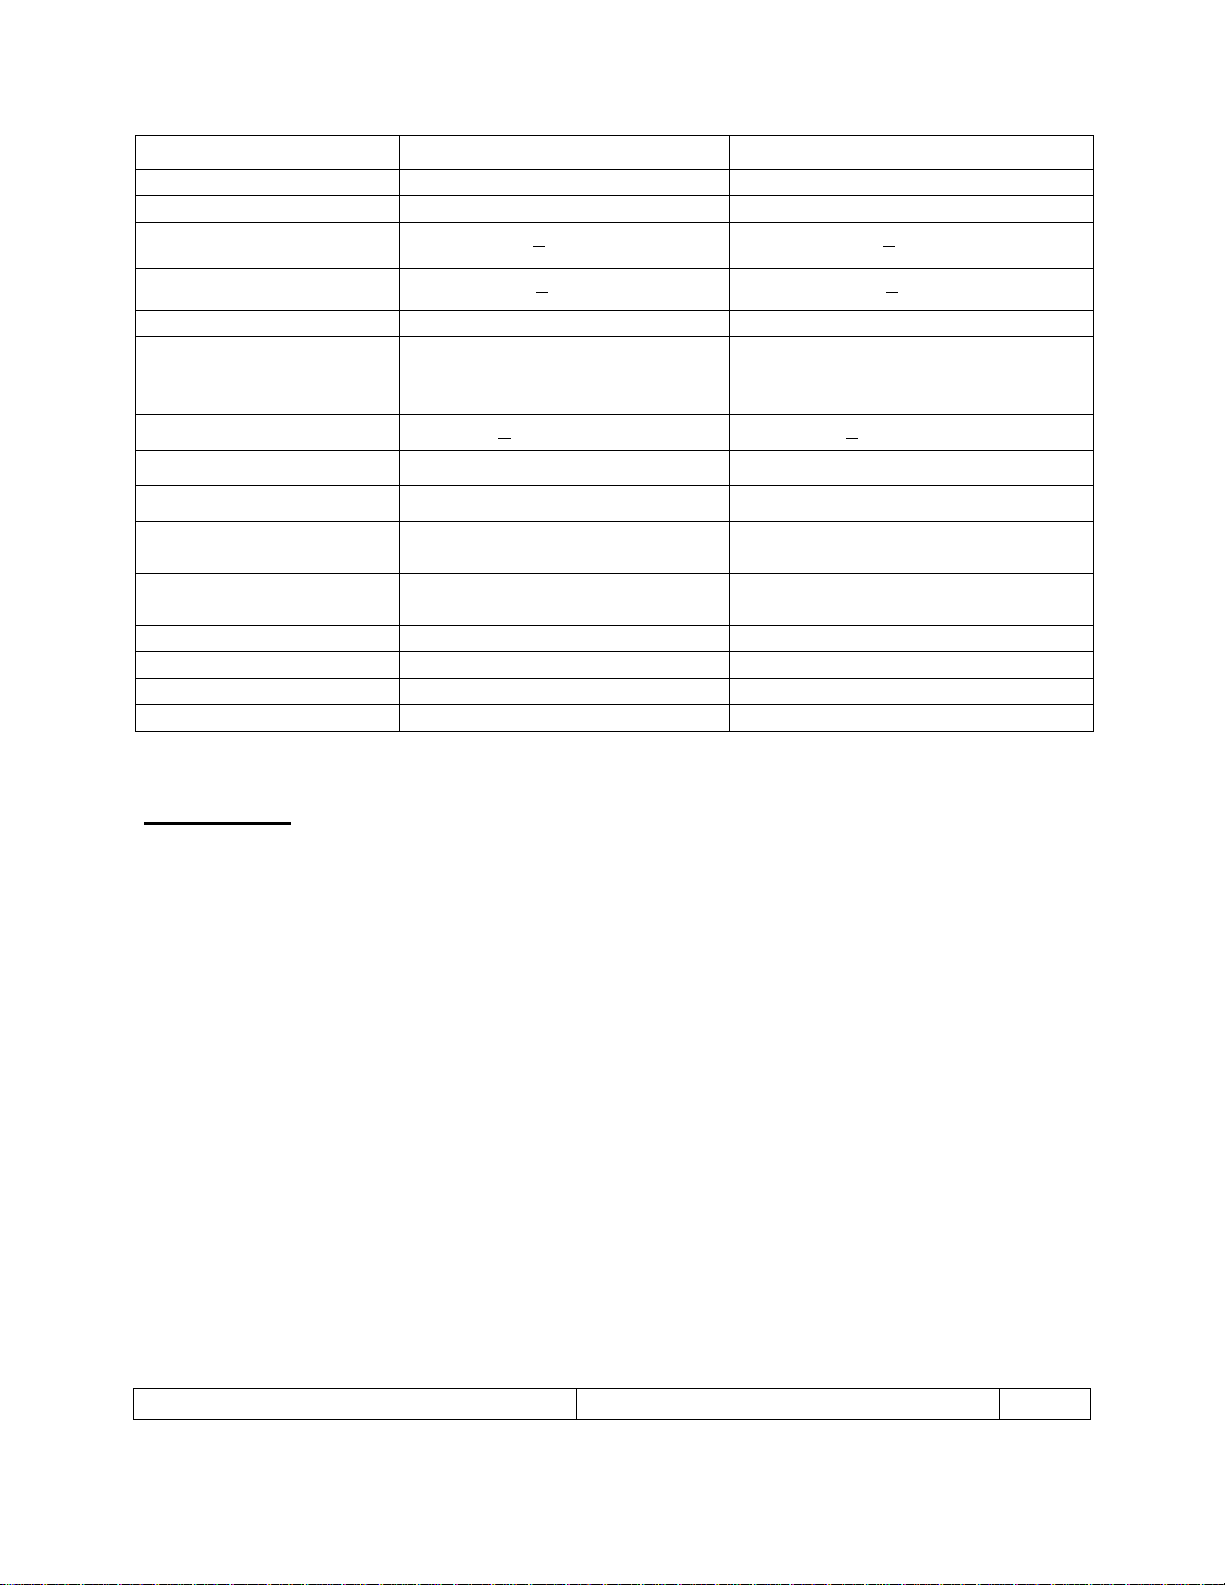
Specifications for 83057-01/83057-06 and 83059-10/83059-15
Wavelength Range 325-1000nm 200-1000nm
Spectral Bandpass 4nm 4nm
Wavelength Accuracy + 2 nm +2 nm
Wavelength Repeatability + 1nm +1nm
Stray Radiant Energy <0.3 @ 340 and 400nm <0.3 @ 220 and 340nm
Photometric Range 0 to 125%T
Photometric Accuracy + 0.004@0.5A + 0.004@0.5A
Display Graphic LCD 128x64 LCD Graphic 128x64
Control and Data Entry Touch Button Keypad Touch Button Keypad
83057-01/83057-06 83059-10/83059-15
0 to 125%T
-0.3 to 2.5 Abs
-9999 to 9999
0.3 to 2.5 Abs
-9999 to 9999
USB Port For PC connection (requires PC
software)
Data output For RS232 printer and firmware
upgrade
Power Requirements 90-240Vac, 50-60 Hz 90-240Vac, 50-60 Hz
Dimensions 550W x 400D x 270H (mm) 550W x 400D x 270H (mm)
Light Source Tungsten Halogen Tungsten Halogen/Deuterium
Weight 30 lbs. /14kg 46 lbs. /21kg
For PC connection (requires PC
software)
For RS232 printer and firmware
upgrade
Installation:
1. After carefully unpacking the contents, check the materials with the packing list to ensure that
you have received everything in good condition.
2. Place the instrument in a suitable location away from direct sunlight. In order to have the
best performance from your instrument, keep it as far as possible from any strong magnetic or
electrical fields or any electrical device that may generate high-frequency fields. Set the unit up
in an area that is free of dust, corrosive gases and strong vibrations.
3. Remove any obstructions or materials that could hinder the flow of air under and around the
instrument.
4. Turn on the instrument and allow it to warm up for 15 minutes before taking any readings.
6
Page 7
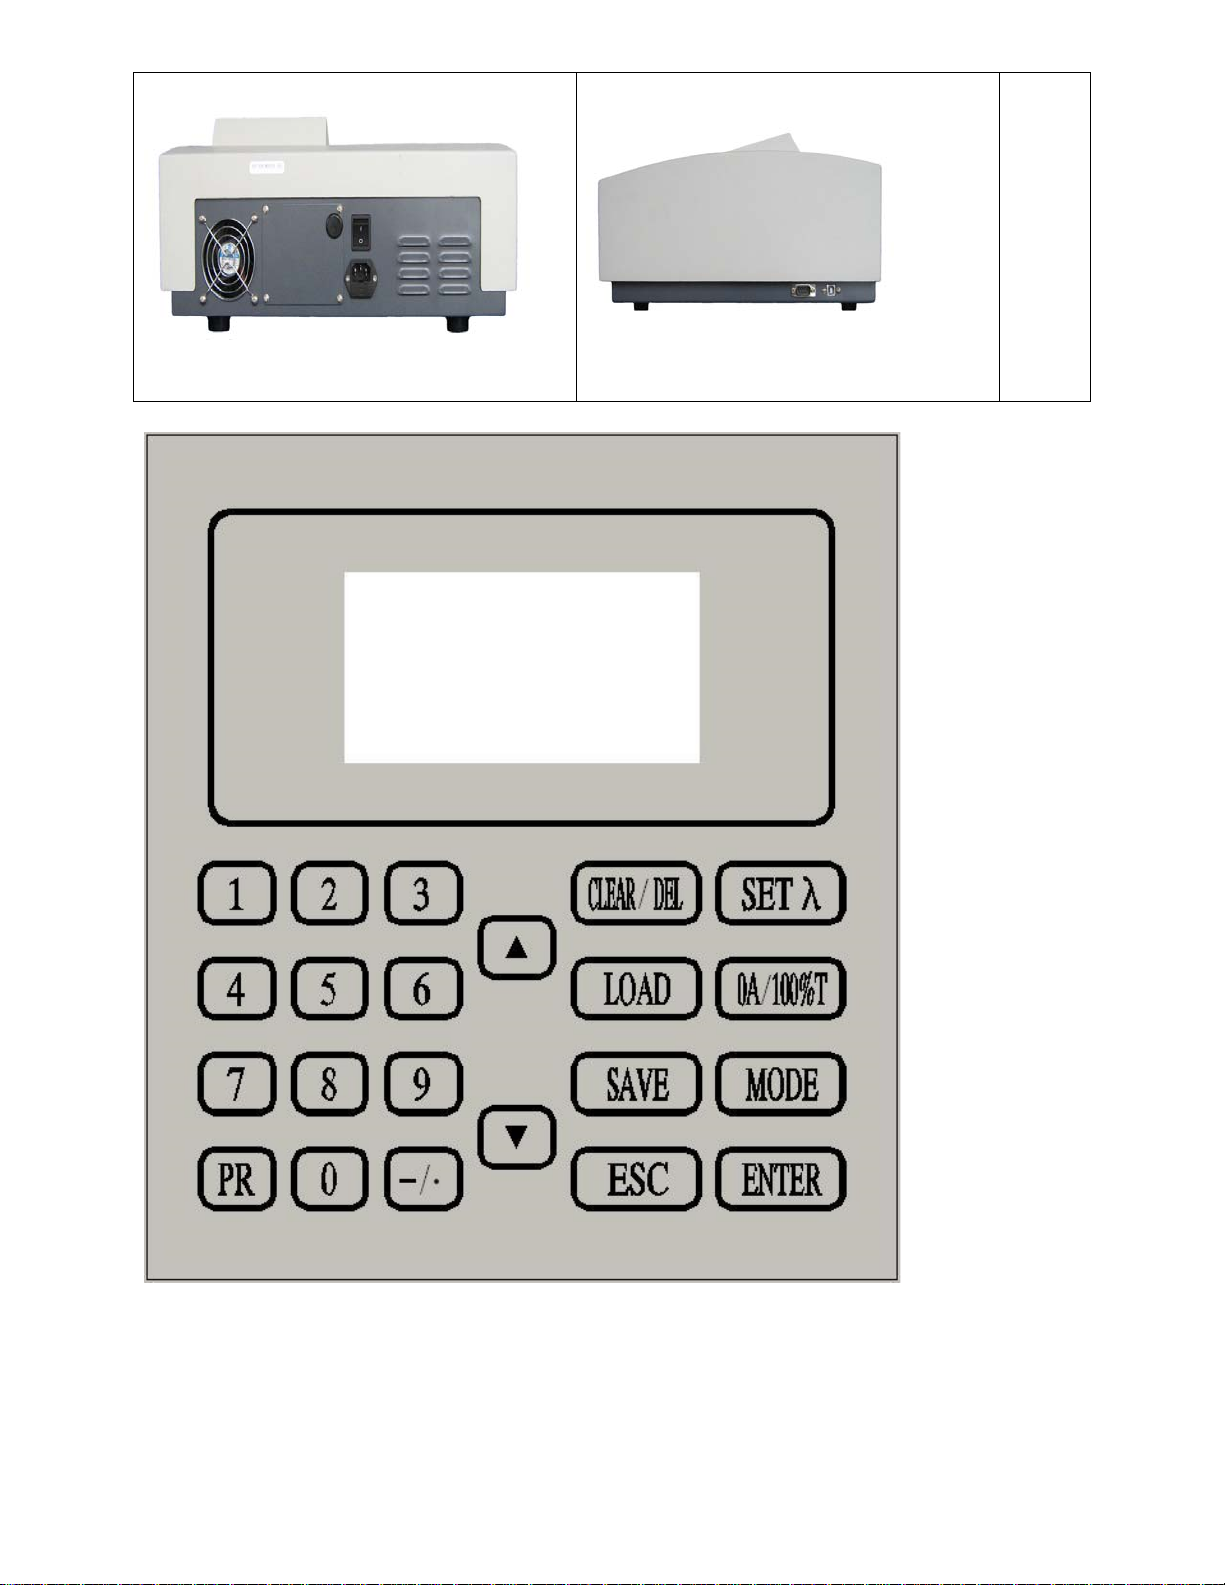
Operational Panel
7
Page 8
Description of Key Functions
【CLEAR/DEL】
Clear or delete
【SET λ】 Set wavelength
【0Abs/100%T】 Blank (
【LOAD】 Load saved curve;
Set 0Abs and 100%T) or establish baseline;
【MODE】 Select type of measurement;
【ESC】 Escape or back to previous screen;
【ENTER】 Confirm;
【PRINT】 Print test data
【∧】 Scroll up
【∨】 Scroll down
【 -/. 】 Minus/Dot
2. Operation Instruction:
2.1 Preparation and Initialization
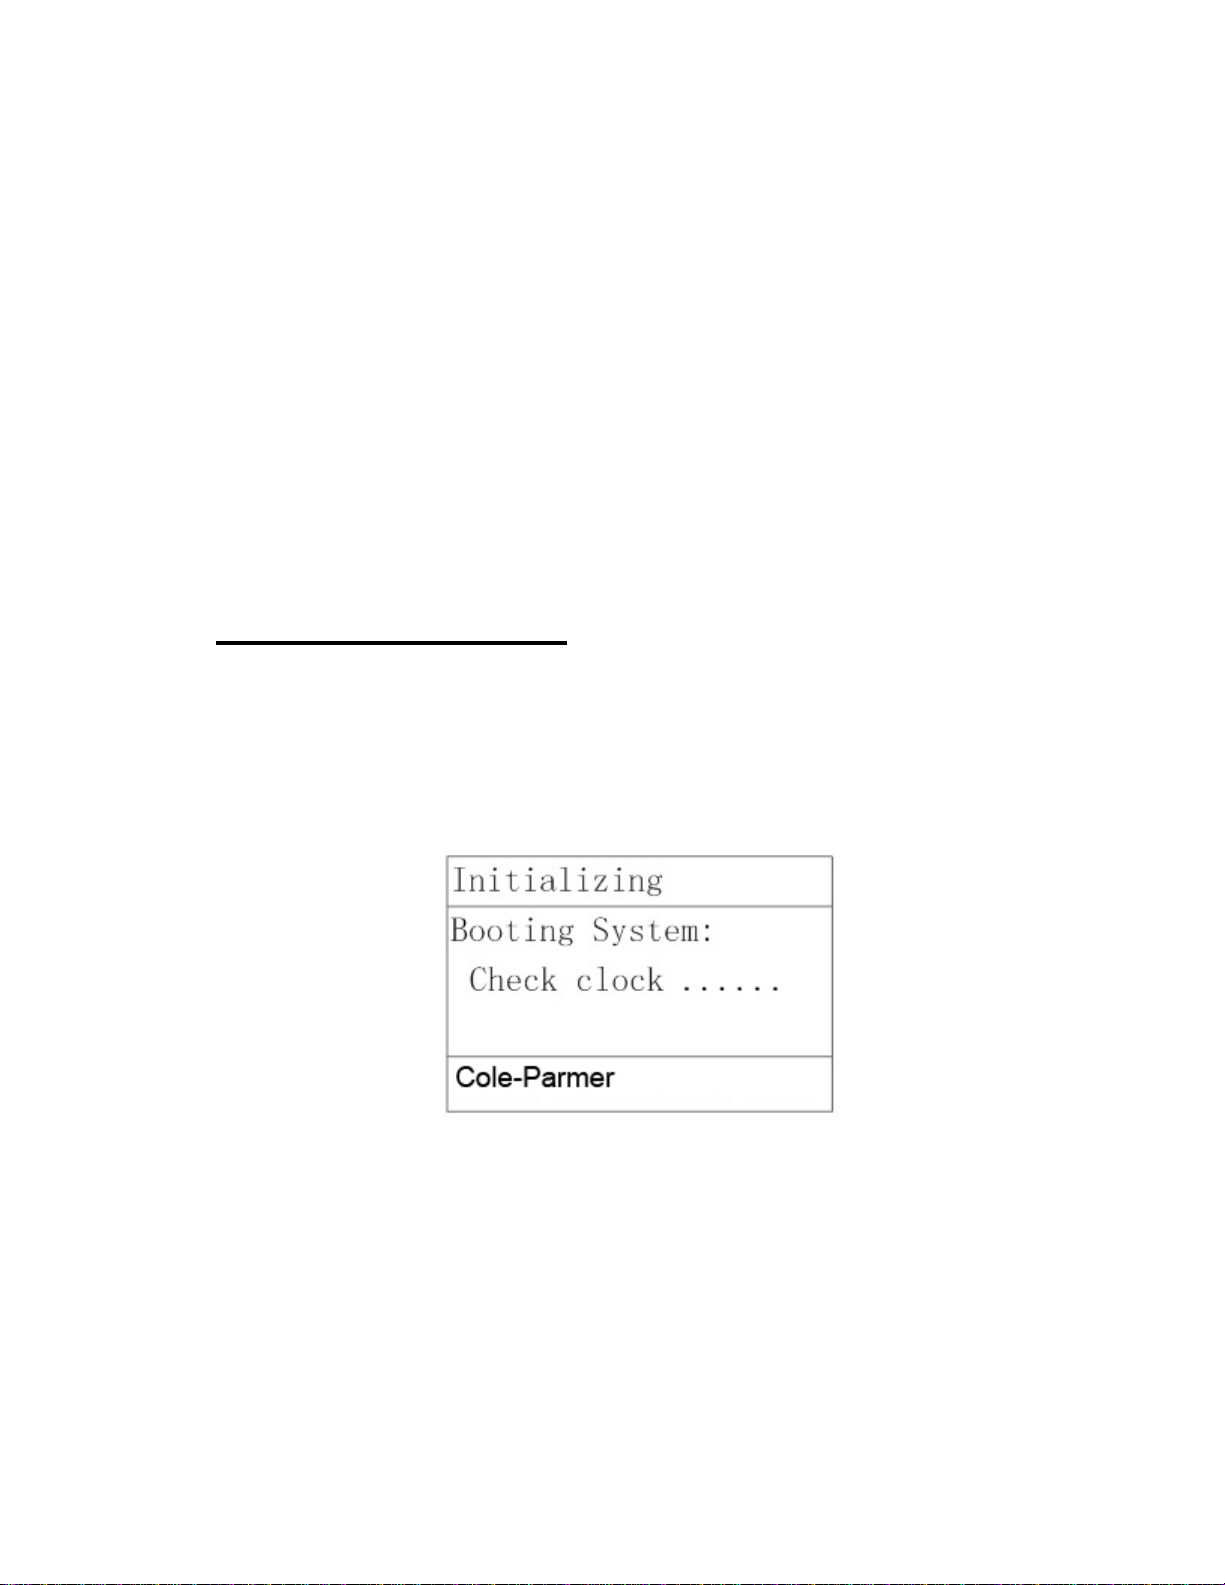
Turn on the spectrophotometer by pressing the Power Switch (IO) on the back of the instrument.
The instrument will automatically run a self-initialization check. The screen displays
sequentially the checking status.
8
Page 9
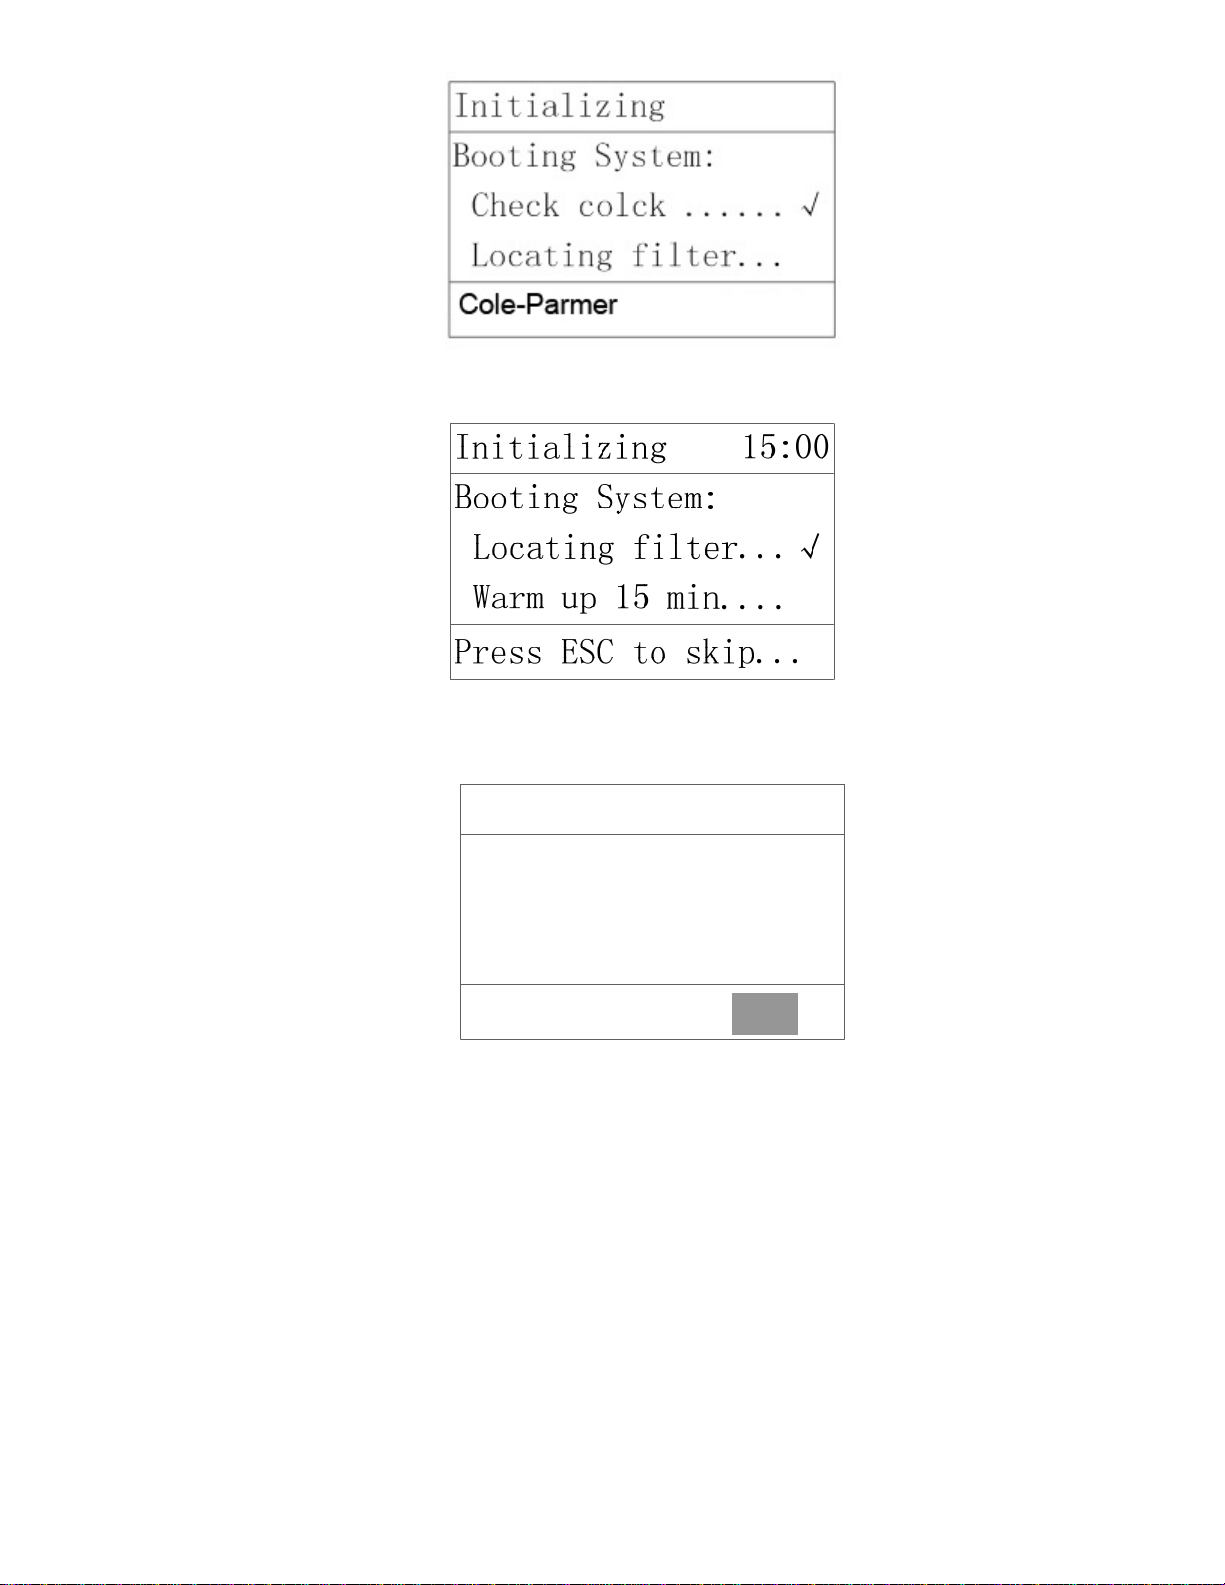
(You may press EXIT to skip 15 minutes warm up which is not recommended).
Initializing
Booting System:
Warm up 15 min....√
System calibration.
Please Select :
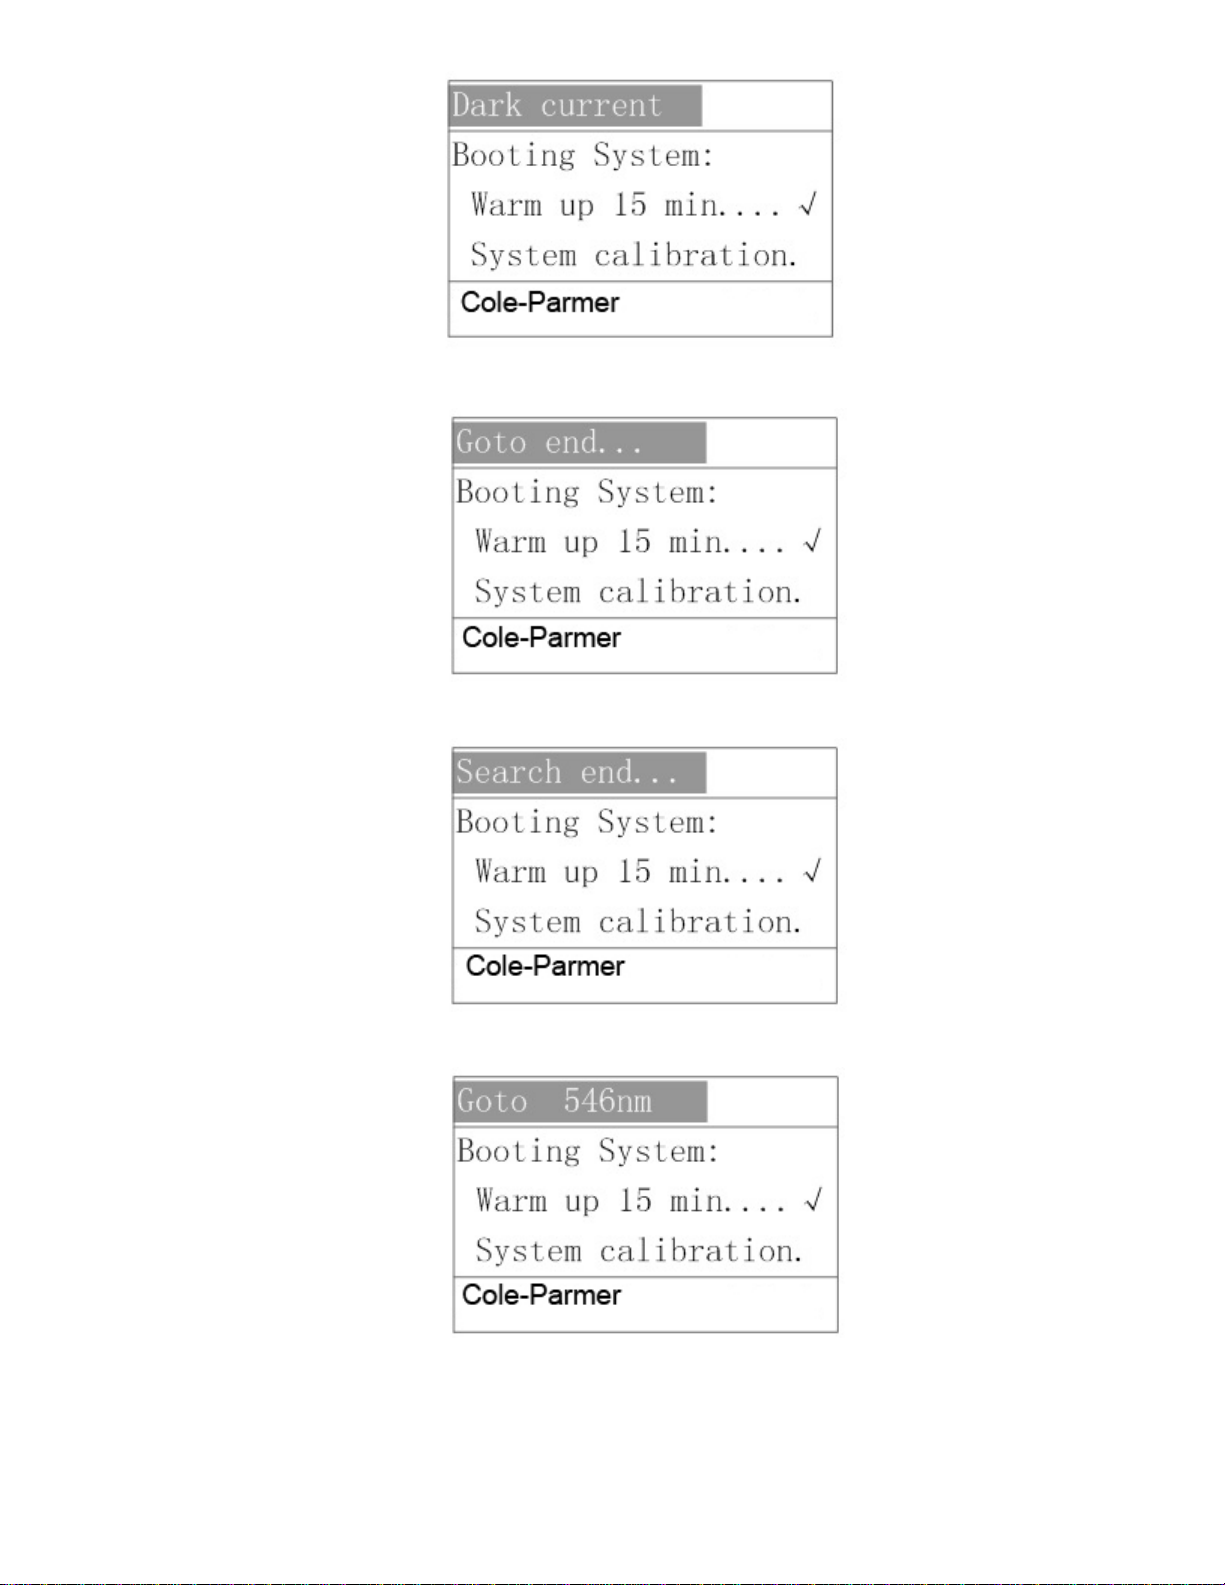
After 15 minutes warm up you need to choose either to run full System Calibration or not. If you
choose No, the instrument will use the previously saved calibration data and the display will
move to the main menu and ready to use. If you select Yes, the instrument will go through
system calibration. Below are some displays showing system calibration process.
(Note: If previously saved data is lost the instrument will automatically run system calibration)
9
No
Page 10
The instrument is ready for use. Below is the Main Menu.
10
Page 11
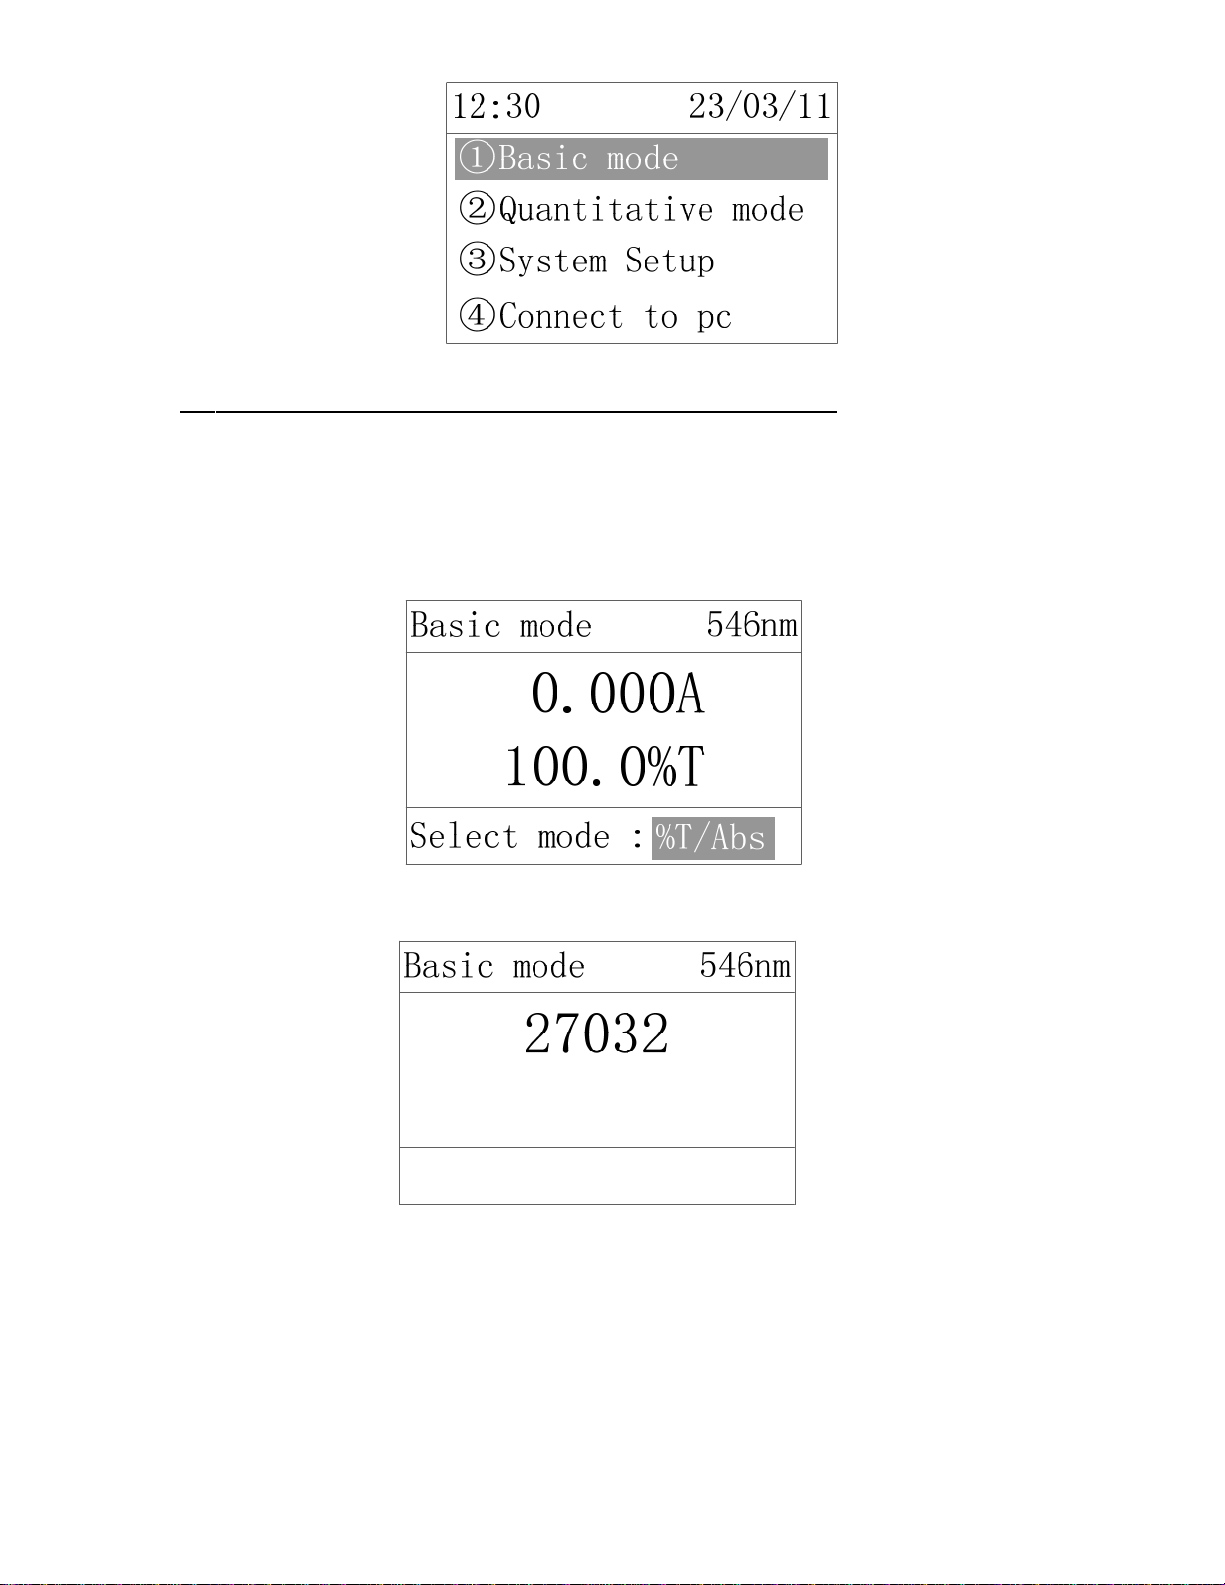
2.2 BASIC MODE ━ %T/Abs or Energy Measurement
2.2.1 Use arrow button to highlight BASIC MODE and then press ENTER to select
Basic mode.
2.2.2 Use【MODE】button to select type of test(%T/Abs or Energy).
If Energy type is selected the display will show the energy counts as shown below.
2.2.3 To reset wavelength press【SETλ】button. The display first shows the current
wavelength.
11
Page 12
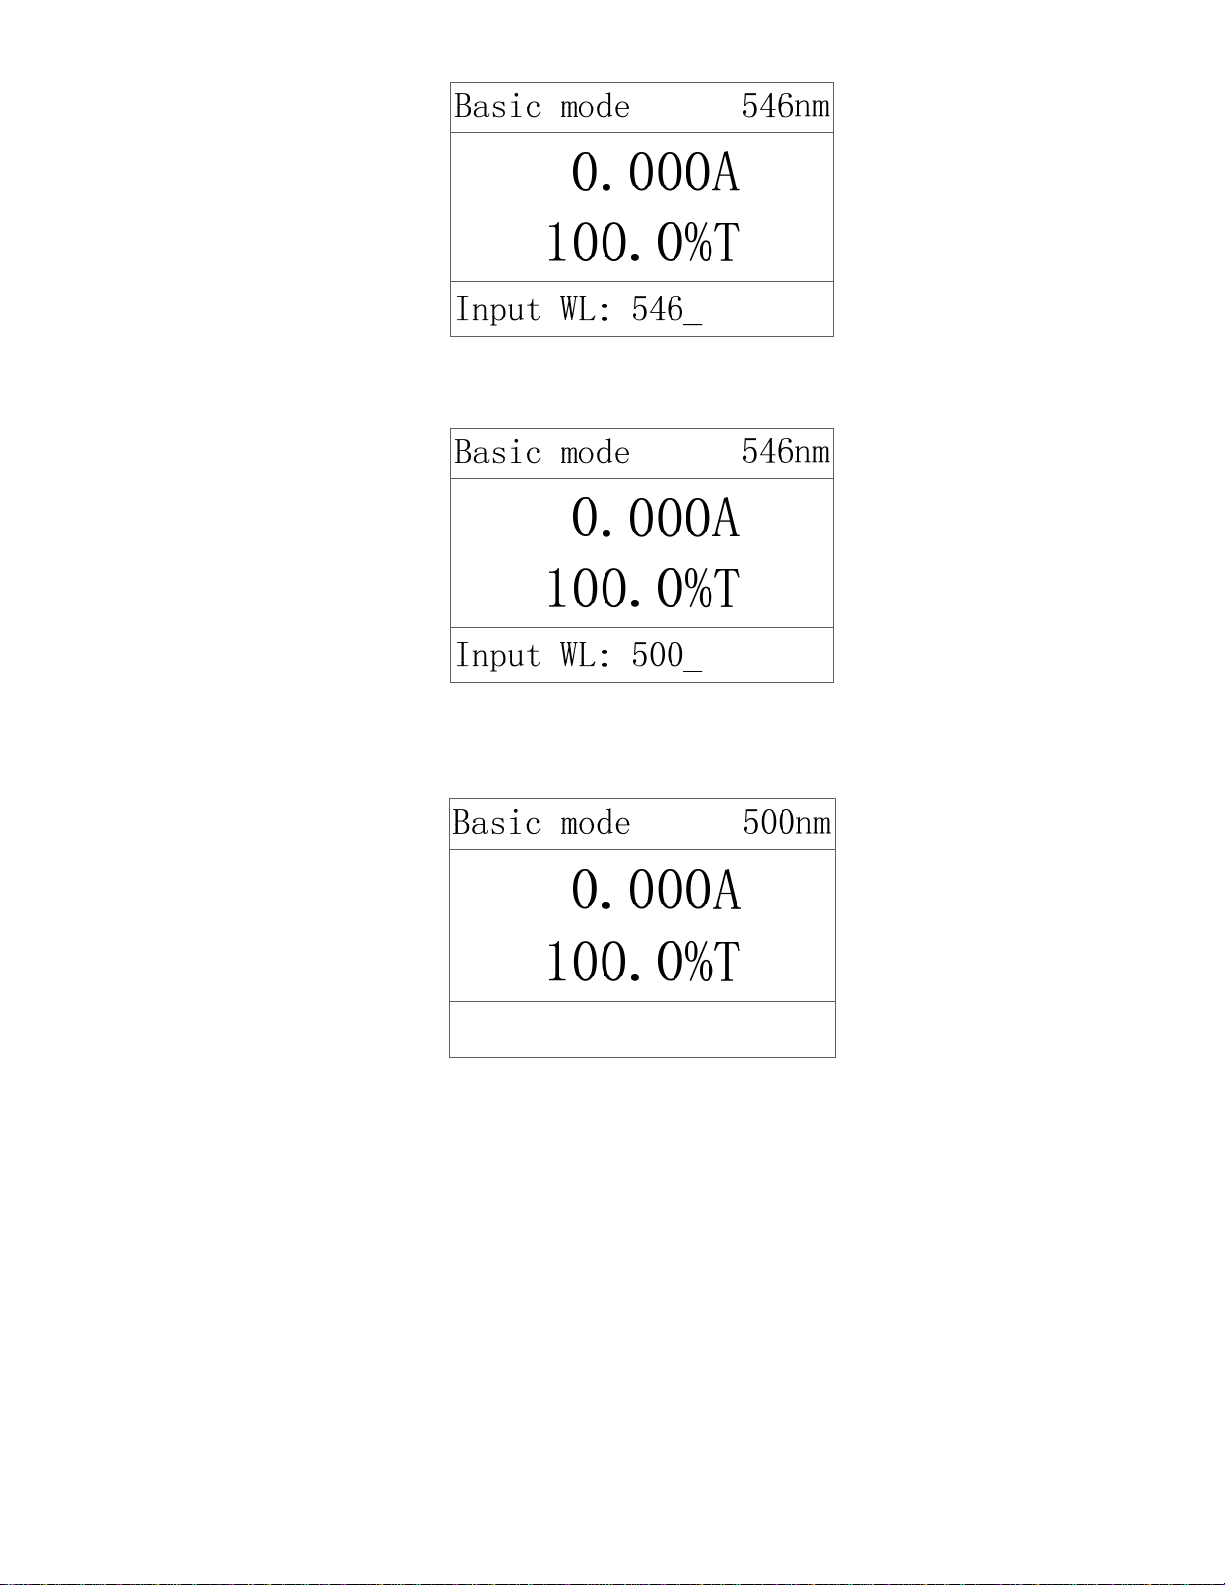
Enter the desired wavelength as shown below.
Press【ENTER】 button to confirm.The instrument will go from previous wavelength
(546nm) to the desired wavelength (500nm) and automatically blank.
Note: You must blank your reference before measure any sample. Follow your lab
procedures for preparing the reference liquid and the steps below to set the blank:
2.2.4 Make a blank reference solution by filling a clean cuvette with distilled or de-
ionized water or other specified solvent. Wipe the cuvette with tissue to remove the
fingerprints and droplets of liquid.
2.2.5 Fit the blank cuvette into the 4-cell holder and place the cuvette in the slot nearest
you. Push the rod so that the cuvette is in the light path. Close the lid.
2.2.6 Set 0.000A or 100%T by pressing 0A/100%T button.
12
Page 13
Energy low! 546nm
Blanking
Note: If “Energy low!” is displayed it might indicate the reference is too dark or
the light beam energy from the lamp is too weak.
2.2.7 Now it is ready to measure your samples:
2.2.8 Remove the blank cuvette if you are testing more than 3 samples. Set it aside in
the case that you may need to reset 0A/100%T later (i.e. change wavelength).
2.2.9 Rinse a second cuvette (or more) with a small amount of sample solution to be
tested. Fill the cuvette and wipe it.
2.2.10 Put the sample cuvette(s) in the sample compartment. Close the lid.
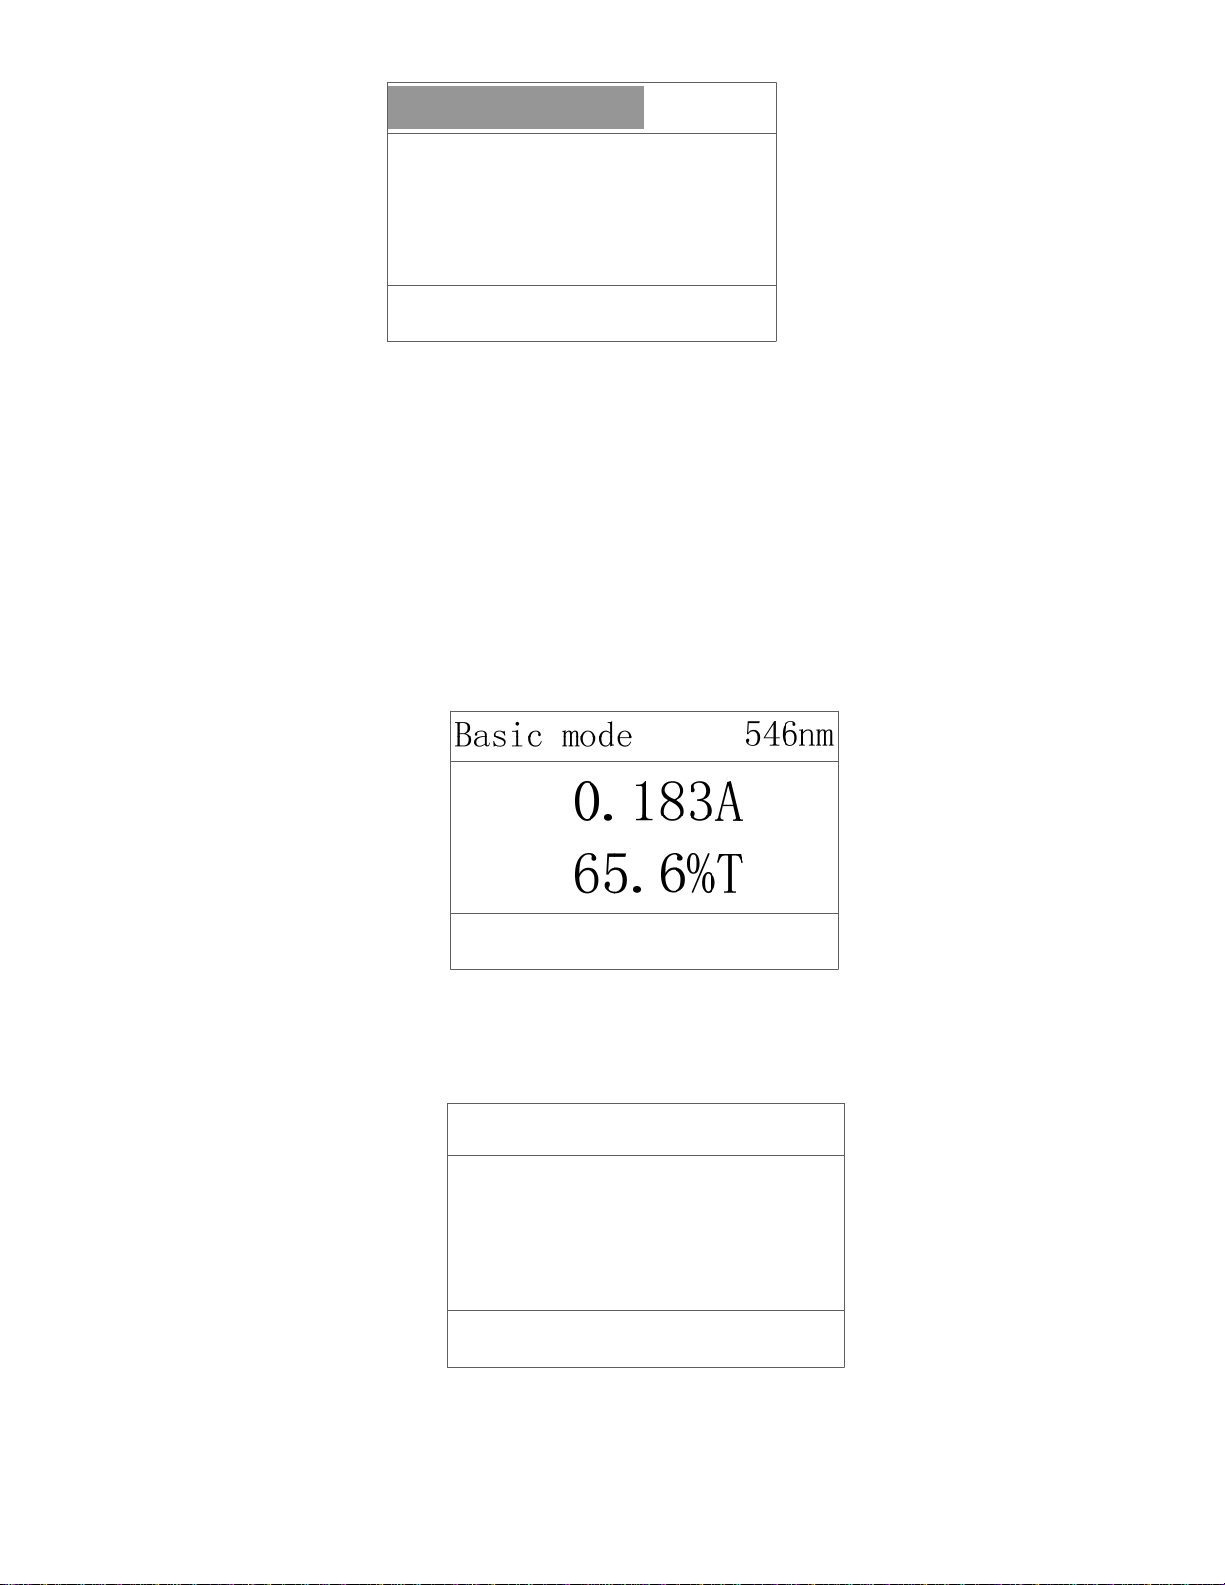
2.2.11 The current sample test result is displayed on the screen.
2.2.12 Press ENTER to confirm and log the result. Up to 20 test results can be logged.
When21st test result is confirmed the first test result will be automatically removed
from the list.
Basic mode
546nm
0.000A
100.0%T
01: 0.418 02: 0.436
13
Page 14

Note: Press【CLEAR/DEL】will delete the test result displayed on the right. If
no test result is logged at the bottom line display will show “No Data!!!”(for
deleting).
Note:
• If you are reading more than one cuvette, be sure to carefully move the cuvette holder to the
next position by pulling on the sample holder rod until the holder “click” into place.
• If you are reading 3 or less samples, then place the reference cuvette in the position nearest
you, and the samples in the next available position. This will shorten the time to read
samples and minimize the sample handling (opening and closing the sample compartment
lid, etc.)
To print the result press PRINT button.
2.3 Quantitative Test
14
Page 15

Test method (curve) must be defined and established before quantitative tests can be run.
This instrument has open platform for you to establish your own test methods (curves).
Such established method will be saved as defined test in “Pre-defined Test List”.
This instrument allows user to:
• Create New Curve
• Edit pre-defined and saved curve
• Delete pre-defined and saved curve
• Load pre-defined and saved curve
• Add pre-defined and saved curve to your favorite test folder for easy and fast access
To access quantitative test select
choose the function and press【ENTER】to confirm your selection
“Quantitative mode”at the main menu. Use【∧】,【∨】to
2.3.1 Create New Curve
At “Quantitative” use【∧】,【∨】to“①Create New Curve”and press【ENTER】to confirm
your selection. You can establish standard curve using known Standards solution or using known
Coefficient.
2.3.2 Create New Curve by Standards
At Create New Curve use【∧】,【∨】to select “①By Standards”and 【ENTER】to confirm
your selection.
15
Page 16

2.3.2.1 Set Parameters
At Standard screen,①Unit is highlighted with“Select Unit:ppm”at the bottom,use【∧】,
【∨】to scroll the unit list (ppm,ppb,ng/ul,ng/ml,g/l,mg/l,%). Press【 ENTER】to confirm
the unit selection.
Next is to select the wavelength, use 【0】~【9】numerical keys to enter the desired
wavelength(i.e. 500nm. Press【ENTER】to confirm the wavelength selection.
Then the type of curve needs to be selected. There are two kinds of curves; “Linear” or
“Linear through zero. Press【∧】,【∨】to choose and press【ENTER】your curve
selection.
The next step is to enter how many standards will be used to establish the curve.
Minimum two standards are required. Up to maximum of eight standards can be used.
16
Page 17

Use the numerical keys to enter the number of standards. Press【ENTER】to confirm
the selection.
Standard
②WL 500nm
③Curve Linear
④No of Stds
Enter number(2-8):2_
Up to 3 standard solutions of the same concentration standard can be measured. The
average will be used for final calculation. Use the numerical key to enter the desired
times of measurement for each standard concentration. DO NOT press【ENTER】yet!
Please insert the blank reference first before pressing【ENTER】.
2.3.2.3 Blank the Reference
Insert the blank reference and press 【ENTER】to blank.
17
Page 18

2.3.2.4 Measure the standards
After the parameters are setup and the reference is blanked it will automatically move to measure
the standards. In this case we have chosen:
1) Two standards
2) Three standard sample solutions for each standard concentration.
Follow the step by step instruction on the LCD screen to measure all the standard samples.
• Enter the concentration value of the first sample solution of the No.1 standard.(i.e. 0.05).
Press【ENTER】to confirm. The concentration value will be displayed on the screen.
• Insert the first standard sample of the No.1 standard into the cuvette holder in the optical
path.
18
Page 19

• Press ENTER to measure it. The measured the absorbance value is displayed.
• Then enter the concentration value of the second sample solution of the No. Standard. Insert
that solution into the cuvette holder in the optical path. Press 【ENTER】to measure it.
• Repeat the same procedures for the third standard sample solution of the No.1 standard.
After the last standard sample solution of the No.1 standard is measured the LC will show
“Confirm?Y” with Y highlighted. The instrument asks you to review and confirm the
measurement. Then follow the screen instruction to measure the rest of the standards.
Note: If any error occurs and you want to re-measure the No.1 standard solutions use
【∧】, 【∨】to switch to “Confirm?N”Press【ENTER】to repeat the measurement.
19
Page 20

20
Page 21

After the last standard sample solution has been measured the screen display will you if you
want to continue to processing the data. Select “Y” to continue.
Then you need to decide if you want to save the curve in the memory for future use.
If “Confirm to Save?No”is selected and confirmed,the curve will not be saved and the
curve will be displayed on the screen. Use【∧】and【∨】to switch display between the
curve and the equation. Press ENTER to start sample test. (The curve will be used for one-
time test only.)
2.3.2.5 Save Curve
The established curve is saved in sequence with numerical sequence number by default unless
you designate the slot for the curve. The newly established curve can be saved:
1) In sequence in the first available slot after the last saved curve on the list
2) to replace certain standard curve, or
21
Page 22

3) to the previously-deleted-curve-slot that is open.
When “Yes” is selected the slot after the last saved curve will be highlighted. You may press
ENTER to save in that slot. (Take note of the sequence number of the saved curve). If you
decide to save the in any other open slot or want to replace an existing saved curve, use the
【∧】and【∨】to highlight that open slot or saved curve, press ENTER to save.
Up to 200 curves can be saved. If No. 201 curve is established and needs to be saved the very
first pre-saved curve with sequence No. 001 will be highlighted. If you do not want to replace
the first saved curve please use 【∧】and【∨】to choose the slot save the new curve.
2.3.2.6 Replace previously saved curve
22
Page 23

If you decide to save the in any other open slot or want to replace an existing previously saved
curve, use the 【∧】and【∨】to highlight that open slot or saved curve, press ENTER to save.
2.3.2.7 Display Curve and Equation
The standard curve will be displayed regardless of your choice to save or not save the curve. Use
【∧】and【∨】to switch display between the curve and the equation. If you choose not to save
the curve before and now decide to save it you have the chance to do it now by pressing
【SAVE】button.
Press ENTER to start to test unknown samples.
2.3.3 Create Standard Curve by Coefficient
At “Create New Curve” use 【 ∧ 】 , 【 ∨ 】 to highlight“②By Coefficient”and press
【ENTER】to confirm the selection.
23
Page 24

Set the Parameters
At Standard screen,①Unit is highlighted with“Select Unit:ppm”at the bottom,use
【∧】,【∨】to scroll the unit list (ppm,ppb,ng/ul,ng/ml,g/l,mg/l,%). Press【 ENTER】to
confirm the unit selection.
Next is to select the wavelength, use 【0】~【9】numerical keys to enter the desired
wavelength(i.e. 500nm. Press【ENTER】to confirm the wavelength selection.
2
Then enter the slope K value of the standard curve.
24
Page 25

The next step is to enter the intercept B value
Then you need to decide to save the curve or not. Please refer to “Save Curve” and “Replace
previously saved Curve” described in “By Standards”
2.3.4 Edit Curve
At “Quantitative” use【∧】,【∨】to highlight“②Edit Curve”. Press【ENTER】to confirm
the selection.
25
Page 26

Edit Unit, Wavelength and any other parameter setting. Then run the standards measurement
with the new standards solutions to re-establish the curve. The newly established curve will
replace the previously saved curve.
Note: You may press【ESC】to cancel editing before measuring the new standards.
2.3.5 Delete Curve
At “Quantitative” use【 ∧ 】 ,【 ∨】 to highlight“③Delete Curve”. Press【 ENTER 】 to
confirm the selection.
Use【∧】,【∨】to highlight the Curve to be deleted and press【ENTER】to confirm your
selection.
You will be asked to confirm your selection. The default selection is “No”. Use 【∧】,【∨】to
switch to “Yes” and press ENTER to confirm to continue deleting process. (Press 【ESC】to
cancel delete and return to previous screen).
26
Page 27

To avoid possible accidental delete you will be asked one more time to confirm. “Are you sure:
NO” is displayed. Press 【ESC】to stop deleting process.
If you are absolutely sure you want to delete the curve switch “Yes” using【∧】or【∨】button.
Press【ENTER】and the curve will be permanently removed from the memory.
Now the sequence slot is kept and open.
27
Page 28

2.3.6 Load Curve to Run
At “Quantitative” use【∧】,【∨】to highlight“④Load Curve”. Press【ENTER】to get into
“Load Curve” screen.
Press【ENTER】to load the highlighted curve and run test.
2.3.7 Load Curve to “Favorite Tests”
At “Quantitative” use【∧】,【∨】to select“④Load Curve”. Press【ENTER】to get into
“Load Curve” screen.
Use【∧】,【∨】to highlight the curve . Press【LOAD】to load the curve to “Favorite Tests”
28
Page 29

Note: The same curve is still kept in the general saved curve list.
2.3.8 Favorite Tests
“Favorite Tests” is designed for easy access to the most frequently used curves. At
“Quantitative” use【∧】,【∨】to select“⑤Favorite Tests”. Press【ENTER】to confirm
your selection.
Select the desired curve in the favorite tests list and press
If you decide to remove certain curve from the “Favorite Tests” folder highlight the curve and press
【ENTER】to run test.
【CLEAR/DEL】. You will be asked to reconfirm your selection to remove the curve.
29
Page 30

2.3.9 Run Test using Standard Curve
Follow the instruction described in the previous section in this manual to load the standard
curve.
1) Insert blank reference into the cuvette holder in the optical path. Press 【0A/100%T】to
blank.
+0.562*A-0.341 500nm
Blanking...
No. Abs ppm
Insert sample into the cuvette holder in the optical path and press 【ENTER】to measure. The Absorbance
and Transmittance value of the current sample are displayed. The concentration value and the Absorbance
value of the sample are logged into the table.
30
Page 31

Repeat the above procedure to measure the other samples.
You may delete certain test result in the table. Move * to highlight the test result and press to
【CLEAR/DEL】it.
Press【PRINT】to print the test results.
2.4 DNA/Protein
There are three methods to choose for DNA Ratio, RNA ratio and concentrations of
RNA, dsDNA, ssDNA and olig.. Follow the screen step by step instruction to run
your tests.
3 System Setup
3.1 Clock Setup
31
Page 32

At the main menu select“System Setup”. Choose “Clock Setup” and press【ENTER】to
confirm.
3.1.1 Set Time
Highlight “Set Time”. Enter time in the order of hour, minute and second.
Enter time in the order of hour, minute and second. For example 19:30:00 stands for 7:30pm.
3.1.2 Set Date
The date is enter in the order of date (DD), month (MM) and year (YY). For example,
01.04.11stands for April 01, 2011.
32
Page 33

3.1.3 Dark Current
At “System Setup” select “Dark Current” to check and refresh the system dark current.
The marked“1”is the live dark current value at 0-gain which should not be zero or negative.
Press【ENTER】will refresh the dark current;Press【PRINT】to view the energy counts at
different gain-setting (from 0 to 7).
33
Page 34

3.1.4 WL Calibration (Wavelength Calibration)
At “System Setup” choose “WL Calibration” to recalibrate the system and the wavelength.
(If you decide not to recalibrate the wavelength press
a) Recheck Dark Current
Dark current
Calibration λ...
b) Move back to initial position
【ESC】to return back to“System Setup”.)
546nm
34
Page 35

Goto end...
Calibration λ...
546nm
c) Search the “0” order light for re-positioning
d) Finish wavelength calibration and move to 546nm
3.1.5 WL Correction (Wavelength Correction)
The wavelength is pre-calibrated and can be recalibrated using WL Calibration function. If for
any reason the wavelength accuracy is off it can be fine adjusted by reset it using the wavelength
correction function in the system setup.
Choose “WL Correction” in the System Setup menu. Use 【∧】,【∨】to select the correction
value. Press 【ENTER】to confirm the adjustment. The correction rang is +8nm~-7nm.
35
Page 36

3.1.6 Language
At “System Setup” select “Language”. Then choose the preferred language for operation.
3.1.7 Firmware Version
You can check the firmware version from the “System Setup”
36
Page 37

4 PC Connection
From main menu select“④Connect to pc”to allow PC software to control the instrument.
Main Menu
546nm
Controlled by PC...
Press ESC to return..
When the communication between the instrument and the computer is established via USB port
the computer is in control. For details of the PC software please refer to software manual.
5. Accuracy Check
5.1 Wavelength Calibration:
Normally spectrophotometer retains its wavelength calibration indefinitely. However if the
instrument receives a severe shock or is abused, use the following methods to check wavelength
calibration. Please note that this test requires Didymium filter, or the Holmium Oxide filter.
In the filter method, the didymium filter has two distinct absorbance peaks at 529nm
and 807nm. The Holmium filter has a distinct peak at 361nm. When the instrument is calibrated
properly you will find minimum Transmittance (maximum Absorbance) at the range +2nm from
these peaks. Note that the specific Transmittance values are not important as you are only
looking for the wavelength where the minimum transmittance (maximum Absorbance) occurs.
5.1.1 Holmium Oxide Filter Method:
37
Page 38

1. Turn instrument on and allow it to warm up for 15 minutes.
2. Select the BASIC MODE.
1. Set the wavelength to 350nm.
2. Make sure the cuvette holder is empty in the sample compartment. Close the sample
compartment lid.
3. Set zero Absorbance by pressing the 0A/100%T. The reading should then be 0.000A. If
not, press 0Abs/100%T again.
4. Remove the cuvette holder and insert the Holmium filter into it. Place it in the sample
compartment and close the lid.
5. Record the Absorbance reading on the LCD display.
6. Advance the wavelength setting by 1nm and repeat steps 2 to 5.
7. Repeat step 6 until the wavelength setting reaches 370nm.
8. Look for the maximum absorbance reading obtained, and this should be found between 359
and 363nm.
5.1.2 Didymium Filter Method:
1. Set the Wavelength to 800 nm.
2. Make sure the cuvette holder is empty in the sample compartment. Close the sample
compartment lid.
3. Set zero Abs by pressing the 0A/100%T. The reading should then be 0.000A. If not, press
0Abs/100%T again.
4. Remove the cuvette holder and insert the Didymium filter into it. Place it in the sample
compartment and close the lid.
5. Record the Absorbance reading on the LCD display.
6. Advance the wavelength setting by 1nm and repeat steps 2 to 5.
7. Repeat step 6 until the wavelength setting reaches 815nm.
8. Look for the maximum absorbance reading obtained, and this should be found between 805
and 809nm.
9. If a “middle” wavelength check is desired, set the wavelength to 522nm (optional)
38
Page 39

10. Make sure the cuvette holder is empty in the sample compartment. Close the sample lid.
11. Set zero Abs by pressing the 0A/100%T key. The reading should then be 0.000A .If not,
press 0Abs/100%T again
12. Remove the cuvette holder and insert the Didymium filter into it. Place it in the sample
compartment and close the lid.
13. Record the absorbance reading on the LCD display.
14. Advance the wavelength setting by 1nm and repeat steps 10 to 13.
15. Repeat step 14 until the wavelength setting reaches 536nm. Again, look for the maximum
absorbance reading. It should be between 527 and 531nm.
5.2 Absorbance Accuracy Checks
Specification: +0.004A at 0.5A.
The absorbance accuracy should be checked against a set of neutral density filters accurately calibrated to
the NIST standards. Contact your UNICO representative for more information (800-588-9776).
An alternative method using potassium dichromate is described below. Due to the many factors that
might affect the results (i.e. temperature, bandpass, weighing and diluting errors), this method is less
accurate and should only be used as a guide.
Reference: Johnson E A
Potassium Dichromate as an absorbance standard
PSG Bulletin 1967, No. 17, page 505
1. Make up N/100 sulfuric acid as the solvent and use part of it to make a solution containing 120
+0.5mg/litre of potassium dichromate.
2. Wash out a square cuvette with solvent, and fill with solvent.
3. Put the cuvette into the sample compartment and close the lid.
4. Select BASIC MODE and Set the wavelength to 350nm.
5. Set the reading to 0.000A using the 0Abs/100%T key.
6. Empty the cell. Wash out with dichromate solution, and fill with dichromate solution.
7. Put the cuvette into the sample compartment and close the lid.
8. Read the absorbance of the standard from the LCD display. The value should be Calibrated
Value + 0.004A. Refer to the notes above when interpreting the result.
Note: It is recommended that you refresh the Dark Current before check.
5.3 Stray Light Check
Specification: Less than 0.3%T at 340nm by ASTM E 387
A good indication as to whether the stray light level is within specification may be obtained as follows:
1. Set the wavelength to 340nm.
2. Select BASIC MODE With the sample compartment empty, close the lid and press the 0A/100%T
key to set the LCD display to 100.0%.
3. Prepare a solution containing 50gm/L of sodium nitrite (NaNO
39
) in distilled water and fill a square
2
Page 40

cuvette with this solution.
4. Place the cuvette in the sample compartment. Close the lid. The display should read<0.3%T.
Note:It is recommended that you refresh the Dark Current before check.
6 Lamp Replacement
6.1 Halogen Lamp Replacement
• Use screw drive to loosen M3 screws and remove the cover on the back of the instrument.
• Loosen the 2 lamp-securing screws (M2). Pull the bulb out and replace with a new lamp
(12V 20W) of the same type. The filament type must be identical. Secure the new lamp with
the locking screw. Tight it firm but do not over-tight to avoid damaging or breaking the
lamp
40
Page 41

7 Trouble Shooting
PROBLEM
Possible
Solution
Instrument Inoperative
Instrument cannot set
100%T (0.000A)
Incorrect T% to
Absorbance correlation
Display does not change
regardless of sample
concentration
Wrong wavelength setting. Check sample procedure and wavelength
Insufficient sample volume. Fill cuvette with more sample solution.
Stray sample preparation vapors. Prepare the sample away from the
Bubbles or particles in solution. Check sample preparation and analytical
Instrument drift and
noise
Incorrect readings
obtained
Wrong wavelength setting. Check analytical procedure and wavelength
Stray sample preparation vapors. Prepare sample away from instrument. Use
Bubbles or particles in solution. Check sample preparation and analytical
Instrument out of electronic
Power cord not connected to
outlet
Dead Power outlet Change to a different outlet
Internal fuse blown or defective
electronic component
Improper power input Check the power supply (100v-230v)
Light beam blocked Check sample holder. See if holder is
Lamp is misaligned. Check to see if light is focused properly on
Lamp light is weak or lamp is
defective
Defective electronic component. Call an authorized service engineer.
Bubbles or particles in solution. Check sample preparation and analytical
Defective electronic component. Call an authorized service engineer.
Concentration reading “frozen”. Sample Solution too Dark,
Defective electronic component
or loose wiring.
Lamp not adjusted
properly.(misalignment)
Lamp old or defective. Replace with a new lamp.
Power to lamp is not stable Check the power supply PCB to the lamp
Defective or dirty detector or
defective electronic component.
Insufficient sample volume Fill cuvette with more sample solution.
calibration.
Plug instrument in.
Call an authorized service engineer.
properly positioned and nothing is blocking
light path.
entrance slit of the monochromator. Call
Technical Service for details (800-588-9776).
Replace the lamp
procedure.
dilute it and redo
the measurement.
setting.
instrument. Use proper ventilation.
procedure.
Check wiring connections;
Call an authorized service engineer.
Check lamp has been properly installed or
has moved during transit.
Call an authorized service engineer.
setting. Check wavelength accuracy
according to procedure in this manual.
proper ventilation.
procedure.
Call an authorized service engineer.
41
Page 42

Error
Function Solution
Locating
lamp...X
Locating
filter…X
WL Zero-order!
Sys energy low!
WL Sensor 1...X
WL Sensor 1...X
(continued)
Instrument unable to
locate the lamp
change-over switch
Instrument unable to
initialize and/or locate
the secondary filter
1.Light beam alignment is off or is blocked
Pass system
calibration and WL
calibration but detects
light beam energy
low.
Unable to locate the
WL calibration
starting point
Unable to locate the
WL calibration
starting point
If D2/halogen change-over motor does not work
1) J3 connector on CPU and motor cable maybe
loose
2) D2/halogen motor is malfunctioning
3) U3 Chips (TD62083) on is defective.
If D2/halogen change-over motor works
1) J9 connector on CPU and micro-switch cable
maybe loose
2) micro-switch maybe malfuntioning
If the Filter wheel driving-motor does not work
1) J17 Connector on CPU and motor cable maybe
loose.
2) Filter driving motor maybe defective
(
3) U3
If Filter driving motor works
1) J4 connector on CPU and filter opt coupler cable
2) Opt-coupler
2.Halogen lamp is off or dead.
3.Filter wheel is malfunctioning and incorrect filter is
brought into the optical path.
Energy to the detector is low. The 0-order energy count is
less than 35000
ht beam alignment is off
1. Lig
2. Filter wheel is malfunctioning and incorrect filter is
brought into the optical path.
Show” WL sensor 1 …X” after humming(jamming):
Wavelength bar starting sensor is malfunctioning or dead
and the bar may be jammed at the bar-front end.
1) Check the sensor
2) Move the WL bar out of jam by pulling the WL
driving belt counter clockwise manually
Show” WL sensor 1 …X” without humming:
If Wavelength-driving motor does not work,
1) J11 connector on CPU or the motor cable maybe
2) Wavelength-driving motor is defective.
3) U8
If wavelength-driving motor works,
1) J5 connector on CPU for Opt coupler maybe
2) WL Opt coupler
TD62083)on the CPU maybe defective
maybe loose.
(
ST178)maybe malfunctioning
loose.
(
TD62064) on CPU is defective.
loose.
(
GK102)is malfunctioning.
42
Page 43

WL Sensor 2...X
System
calibration...X
Energy low!!
Energy high!!
3) Light beam is misaligned or blocked failing to
reach the detector.
4) Lamp is off/dead
5) Detector PCB malfunctioning (dark current either
negative or too high)
Wavelength bar
reaches the back end
and triggers the backend protection sensor
Unable to complete
system calibration
Lamp not on or dead
1. WL driving motor is malfunctioning and running
reversely
2. WL bar protection micro-switch is defective
If Wavelength-driving motor does not work,
1)J11 connector on CPU or the motor cable maybe loose.
2)Wavelength-driving motor is defective.
(
3)U8
If wavelength-driving motor works,
1)J5 connector on CPU for Opt coupler maybe loose.
2)WL Opt coupler
3)Light beam is misaligned or blocked failing to reach the
detector.
4)Lamp is off/dead
5)Detector PCB malfunctioning (dark current either
negative or too high)
1) Light is on but light beam fails to reach detector
2) Light may be blocked
3) Reference is too dark
4) Light optical path mis-aligned: not focused on
entrance slit; or internal optics off aligned to cause light
beam not out from the exit slit to sample compartment.
5) Secondary filter positioning is malfunctioning
Detector PCB malfunctioning (dark current too small or
negative or the board is defective)
1. Secondary filter positioning is malfunctioning
2. Detector PCB malfunctioning (dark current either too
high or the board is defective)
TD62064) on CPU is defective.
(
GK102)is malfunctioning.
43
 Loading...