

Page 1

.
GRMON3
A debug monitor for LEON-based computer systems
and SOC designs based on the GRLIB IP library
2019 User's Manual
The most important thing we build is trust
GRMON3 User's Manual
GRMON3-UM 1 www.cobham.com/gaisler
June 2019, Version 3.1.0
Page 2

Table of Contents
1. Introduction ............................................................................................................................. 5
1.1. Overview ...................................................................................................................... 5
1.2. Supported platforms and system requirements ..................................................................... 5
1.3. Obtaining GRMON ........................................................................................................ 5
1.4. Installation .................................................................................................................... 5
1.5. License ......................................................................................................................... 6
1.6. GRMON Evaluation version ............................................................................................ 6
1.7. Problem reports .............................................................................................................. 6
2. Debugging concept ................................................................................................................... 7
2.1. Overview ...................................................................................................................... 7
2.2. Target initialization ......................................................................................................... 7
2.2.1. LEON2 target initialization .................................................................................... 9
2.2.2. Configuration file target initialization ...................................................................... 9
2.3. Memory register reset values ............................................................................................ 9
3. Operation ............................................................................................................................... 10
3.1. Overview .................................................................................................................... 10
3.2. Starting GRMON ......................................................................................................... 10
3.2.1. Debug link options ............................................................................................. 10
3.2.2. Debug driver options .......................................................................................... 11
3.2.3. General options .................................................................................................. 11
3.3. GRMON command-line interface (CLI) ............................................................................ 12
3.4. Common debug operations ............................................................................................. 13
3.4.1. Examining the hardware configuration ................................................................... 13
3.4.2. Uploading application and data to target memory ..................................................... 14
3.4.3. Running applications .......................................................................................... 15
3.4.4. Inserting breakpoints and watchpoints .................................................................... 16
3.4.5. Displaying processor registers .............................................................................. 16
3.4.6. Backtracing function calls .................................................................................... 16
3.4.7. Displaying memory contents ................................................................................ 17
3.4.8. Instruction disassembly ....................................................................................... 18
3.4.9. Using the trace buffer ......................................................................................... 18
3.4.10. Profiling .......................................................................................................... 20
3.4.11. Attaching to a target system without initialization ................................................... 20
3.4.12. Multi-processor support ..................................................................................... 21
3.4.13. Stack and entry point ........................................................................................ 21
3.4.14. Memory Management Unit (MMU) support .......................................................... 21
3.4.15. CPU cache support ........................................................................................... 22
3.5. Tcl integration .............................................................................................................. 22
3.5.1. Shells ............................................................................................................... 22
3.5.2. Commands ........................................................................................................ 22
3.5.3. API .................................................................................................................. 23
3.6. Symbolic debug information ........................................................................................... 23
3.6.1. Multi-processor symbolic debug information ........................................................... 24
3.7. GDB interface .............................................................................................................. 24
3.7.1. Connecting GDB to GRMON ............................................................................... 24
3.7.2. Executing GRMON commands from GDB ............................................................. 25
3.7.3. Running applications from GDB ........................................................................... 25
3.7.4. Running SMP applications from GDB ................................................................... 26
3.7.5. Running AMP applications from GDB ................................................................... 26
3.7.6. GDB Thread support .......................................................................................... 27
3.7.7. Virtual memory ................................................................................................. 29
3.7.8. Specific GDB optimization .................................................................................. 31
3.7.9. GRMON GUI considerations ............................................................................... 31
3.7.10. Limitations of GDB interface ............................................................................. 31
3.8. Thread support ............................................................................................................. 31
GRMON3-UM
June 2019, Version 3.1.0
2 www.cobham.com/gaisler
Page 3

3.8.1. GRMON thread options ...................................................................................... 32
3.8.2. GRMON thread commands .................................................................................. 32
3.9. Forwarding application console I/O .................................................................................. 33
3.10. EDAC protection ........................................................................................................ 34
3.10.1. Using EDAC protected memory .......................................................................... 34
3.10.2. LEON3-FT error injection .................................................................................. 34
3.11. FLASH programming .................................................................................................. 35
3.11.1. CFI compatible Flash PROM .............................................................................. 35
3.11.2. SPI memory device ........................................................................................... 36
3.12. Automated operation ................................................................................................... 37
3.12.1. Tcl commanding during CPU execution ................................................................ 37
3.12.2. Communication channel between target and monitor ............................................... 37
3.12.3. Test suite driver ............................................................................................... 37
4. Graphical user interface ........................................................................................................... 39
4.1. Overview .................................................................................................................... 39
4.2. Starting GRMON GUI .................................................................................................. 39
4.3. Connect to target .......................................................................................................... 40
4.3.1. Debug link ........................................................................................................ 40
4.3.2. Options ............................................................................................................ 41
4.3.3. Argument contribution ........................................................................................ 41
4.3.4. Configurations ................................................................................................... 41
4.3.5. Connect ............................................................................................................ 41
4.4. Launch configurations ................................................................................................... 41
4.4.1. Target image setup ............................................................................................. 42
4.4.2. Launch properties ............................................................................................... 43
4.5. Views ......................................................................................................................... 44
4.5.1. CPU Registers View ........................................................................................... 44
4.5.2. IO Registers View .............................................................................................. 45
4.5.3. System Information View .................................................................................... 47
4.5.4. Terminals View ................................................................................................. 47
4.5.5. Memory View ................................................................................................... 48
4.5.6. Disassembly View .............................................................................................. 49
4.5.7. Messages View .................................................................................................. 50
4.6. Target communication ................................................................................................... 51
4.6.1. Memory view update .......................................................................................... 51
4.7. C/C++ level debugging .................................................................................................. 51
4.8. Limitations .................................................................................................................. 51
5. Debug link ............................................................................................................................. 52
5.1. UART debug link ......................................................................................................... 52
5.2. Ethernet debug link ....................................................................................................... 53
5.3. JTAG debug link .......................................................................................................... 53
5.3.1. Xilinx parallel cable III/IV ................................................................................... 55
5.3.2. Xilinx Platform USB cable .................................................................................. 55
5.3.3. Altera USB Blaster or Byte Blaster ....................................................................... 57
5.3.4. FTDI FT4232/FT2232 ......................................................................................... 58
5.3.5. Amontec JTAGkey ............................................................................................. 59
5.3.6. Actel FlashPro 3/3x/4/5 ....................................................................................... 59
5.3.7. Digilent HS1 ..................................................................................................... 59
5.4. USB debug link ........................................................................................................... 59
5.5. GRESB debug link ....................................................................................................... 61
5.5.1. AGGA4 SpaceWire debug link ............................................................................. 61
5.6. User defined debug link ................................................................................................. 62
5.6.1. API .................................................................................................................. 62
6. Debug drivers ......................................................................................................................... 64
6.1. AMBA AHB trace buffer driver ...................................................................................... 64
6.2. Clock gating ................................................................................................................ 64
6.2.1. Switches ........................................................................................................... 64
6.3. DSU Debug drivers ....................................................................................................... 64
GRMON3-UM
June 2019, Version 3.1.0
3 www.cobham.com/gaisler
Page 4

6.3.1. Switches ........................................................................................................... 64
6.3.2. Commands ........................................................................................................ 65
6.3.3. Tcl variables ..................................................................................................... 66
6.4. Ethernet controller ........................................................................................................ 66
6.4.1. Commands ........................................................................................................ 66
6.5. GRPWM core .............................................................................................................. 66
6.6. USB Host Controller ..................................................................................................... 67
6.6.1. Switches ........................................................................................................... 67
6.6.2. Commands ........................................................................................................ 67
6.7. I2C ............................................................................................................................. 67
6.8. I/O Memory Management Unit ....................................................................................... 67
6.9. Multi-processor interrupt controller .................................................................................. 68
6.10. L2-Cache Controller .................................................................................................... 68
6.10.1. Switches ......................................................................................................... 68
6.11. Statistics Unit ............................................................................................................. 69
6.12. LEON2 support .......................................................................................................... 71
6.12.1. Switches ......................................................................................................... 71
6.13. On-chip logic analyzer driver ........................................................................................ 71
6.14. Memory controllers ..................................................................................................... 72
6.14.1. Switches ......................................................................................................... 73
6.14.2. Commands ...................................................................................................... 74
6.15. Memory scrubber ........................................................................................................ 74
6.16. MIL-STD-1553B Interface ............................................................................................ 75
6.17. PCI ........................................................................................................................... 76
6.17.1. PCI Trace ....................................................................................................... 80
6.18. SPI ........................................................................................................................... 80
6.19. SpaceWire router ........................................................................................................ 80
6.20. SVGA frame buffer ..................................................................................................... 81
7. Support ................................................................................................................................. 82
A. Command index ..................................................................................................................... 83
B. Command syntax .................................................................................................................... 86
C. Tcl API ............................................................................................................................... 225
D. Fixed target configuration file format ....................................................................................... 234
E. License key installation .......................................................................................................... 236
F. Appending environment variables ............................................................................................ 237
G. Compatibility ....................................................................................................................... 238
G.1. Compatibility notes for GRMON2 ................................................................................. 238
G.2. Compatibility notes for GRMON1 ................................................................................. 238
GRMON3-UM
June 2019, Version 3.1.0
4 www.cobham.com/gaisler
Page 5

1. Introduction
1.1. Overview
GRMON is a general debug monitor for the LEON processor, and for SOC designs based on the GRLIB IP library.
GRMON includes the following functions:
• Read/write access to all system registers and memory
• Built-in disassembler and trace buffer management
• Downloading and execution of LEON applications
• Breakpoint and watchpoint management
• Remote connection to GNU debugger (GDB)
• Support for USB, JTAG, UART, Ethernet and SpaceWire debug links
• Tcl interface (scripts, procedures, variables, loops etc.)
• Graphical user interface
1.2. Supported platforms and system requirements
GRMON is currently provided for platforms: Linux (GLIBC >2.10), Windows 7 and Windows 10. To run the
GUI Java 8 is required. Both 32-bit and 64-bit versions are supported.
The available debug communication links for each platform vary and they may have additional third-party dependencies that have additional system requirements. See Chapter 5, Debug link for more information.
1.3. Obtaining GRMON
The primary site for GRMON is Cobham Gaisler website [http://www.gaisler.com/], where the latest version of
GRMON can be ordered and evaluation versions downloaded.
1.4. Installation
Follow these steps to install GRMON. Detailed information can be found futher down.
1. Extract the archive
2. Install the Sentinel LDK Runtime (GRMON Pro version only)
3. Optionally install third-party drivers for the debug interfaces.
4. Optionally setup the path for shared libraries (Linux only)
5. Optionally add GRMON to the environment variable PATH
To install GRMON, extract the archive anywhere on the host computer. The archive contains a directory for each
OS that GRMON supports. Each OS-folder contains additional directories as described in the list below. The 32bit and 64-bit version of each OS can be installed in parallel by extracting the archive to the same location.
grmon-pro-3.0.XX/<OS>/bin<BITS>
grmon-pro-3.0.XX/<OS>/lib<BITS>
grmon-pro-3.0.XX/<OS>/share
The professional version use a Sentinel LDK license key. See Appendix E, License key installation for installation
of the Sentinel LDK runtime.
Some debug interfaces requires installation of third-party drivers, see Chapter 5, Debug link for more information.
The bin<BITS> directory contains the executable. For convenience it is recommended to add the bin<BITS>
directory of the host OS to the environment variable PATH. See Appendix F, Appending environment variables
for instructions on how to append environment variables.
To be able to run the GUI, it is required to install the same bitness version of GRMON as the Java installation.
It is still possible to run both bit-versions of GRMON with the GUI. I.e to run GRMON 32-bit with a Java 64bit, install both bit-versions of GRMON.
GRMON3-UM
June 2019, Version 3.1.0
5 www.cobham.com/gaisler
Page 6

The lib<BITS> directory contains some additional libraries that GRMON requires. On the Windows platform
the lib<BITS> directory is not available. On the Linux platform, if GRMON fails to start because of some missing libraries that are located in this directory, then add this path to the environment variable LD_LIBRARY_PATH
or add it the ld.so.cache (see man pages about ldconfig for more information).
GRMON must find the share directory to work properly. GRMON will try to automatically detect the location
of the folder. A warning will be printed when starting GRMON if it fails to find the share folder. If it fails to
automatically detect the folder, then the environment variable GRMON_SHARE can be set to point the share/
grmon folder. For example on Windows it could be set to c:\opt\grmon-pro\windows\share\grmon
or on Linux it could be set to /opt/grmon-pro/linux/share/grmon.
1.5. License
The GRMON license file can be found in the share folder of the installation. For example on Windows it can
be found in c:\opt\grmon-pro\windows\share\grmon or on Linux it could be found in /opt/gr-
mon-pro/linux/share/grmon.
1.6. GRMON Evaluation version
The evaluation version of GRMON can be downloaded from Cobham Gaisler website [http://www.gaisler.com/].
The evaluation version may be used during a period of 21 days without purchasing a license. After this period,
any commercial use of GRMON is not permitted without a valid license. The following features are not available
in the evaluation version:
• GUI
• Support for LEON2, LEON3-FT, LEON4
• FT memory controllers
• SpaceWire drivers
• Custom JTAG configuration
• Profiling
• TCL API (drivers, init scripts, hooks, I/O forward to TCL channel etc)
1.7. Problem reports
Please send bug reports or comments to support@gaisler.com.
Customers with a valid support agreement may send questions to support@gaisler.com. Include a GRMON log
when sending questions, please. A log can be obtained by starting GRMON with the command line switch -log
filename.
The leon_sparc community at Yahoo may also be a source to find solutions to problems.
GRMON3-UM
June 2019, Version 3.1.0
6 www.cobham.com/gaisler
Page 7
2. Debugging concept
2.1. Overview
The GRMON debug monitor is intended to debug system-on-chip (SOC) designs based on the LEON processor.
The monitor connects to a dedicated debug interface on the target hardware, through which it can perform read
and write cycles on the on-chip bus (AHB). The debug interface can be of various types: the LEON3/4 processor
supports debugging over a serial UART, 32-bit PCI, JTAG, Ethernet and SpaceWire (using the GRESB Ethernet
to SpaceWire bridge) debug interfaces. On the target system, all debug interfaces are realized as AHB masters
with the Debug protocol implemented in hardware. There is thus no software support necessary to debug a LEON
system, and a target system does in fact not even need to have a processor present.
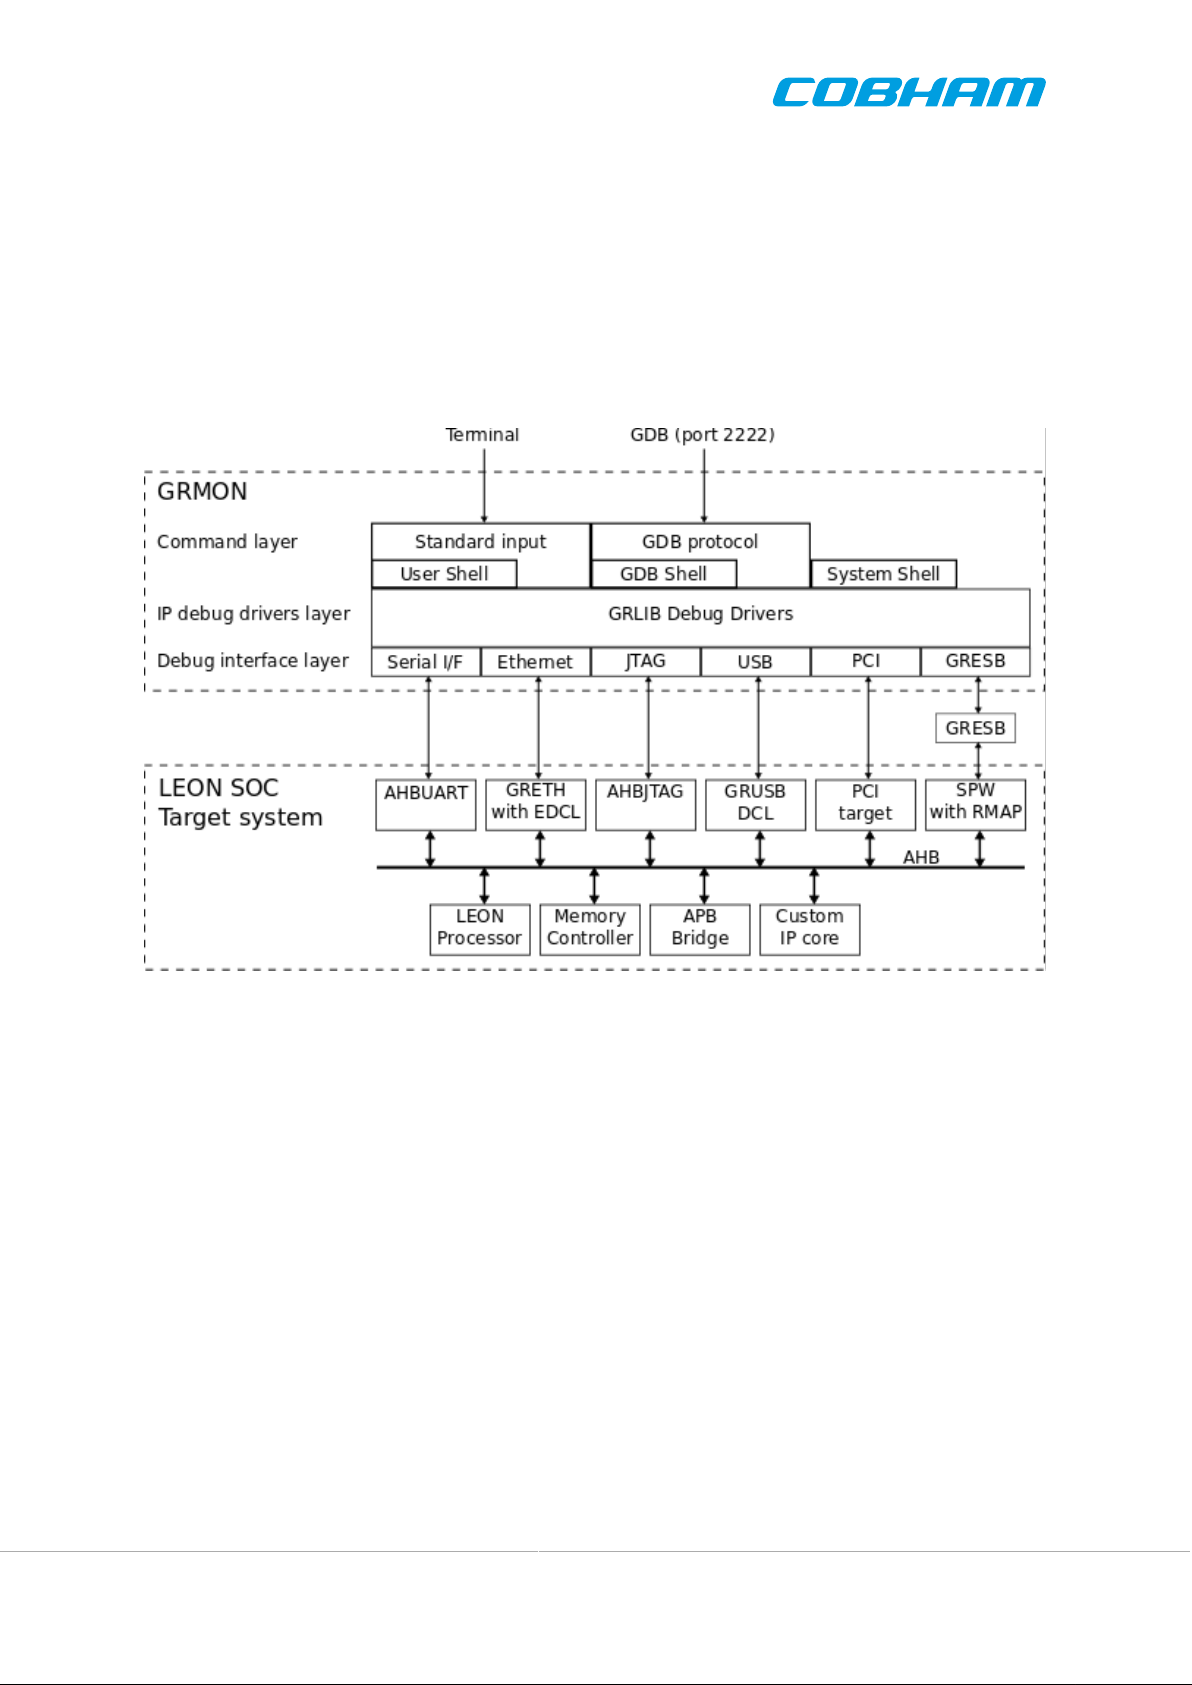
Figure 2.1. GRMON concept overview
GRMON can operate in two modes: command-line mode and GDB mode. In command-line mode, GRMON
commands are entered manually through a terminal window. In GDB mode, GRMON acts as a GDB gateway and
translates the GDB extended-remote protocol to debug commands on the target system.
GRMON is implemented using three functional layers: command layer, debug driver layer, and debug interface
layer. The command layer takes input from the user and parses it in a Tcl Shell. It is also possible to start a GDB
server service, which has its own shell, that takes input from GDB. Each shell has it own set of commands and
variables. Many commands depends on drivers and will fail if the core is note present in the target system. More
information about Tcl integration can be found in the Section 3.5, “Tcl integration”.
The debug driver layer implements drivers that probes and initializes the cores. GRMON will scan the target system
at start-up and detect which IP cores are present. The drivers may also provides information to the commands.
The debug interface layer implements the debug link protocol for each supported debug interface. Which interface
to use for a debug session is specified through command line options during the start of GRMON. Only interfaces
based on JTAG supports 8-/16-bit accesses, all other interfaces access subwords using read-modify-write. 32-bit
accesses are supported by all interfaces. More information can be found in Chapter 5, Debug link.
2.2. Target initialization
When GRMON first connects to the target system, it scans the system to detect which IP cores are present. This is
done by reading the plug and play information which is normally located at address 0xfffff000 on the AHB bus. A
GRMON3-UM
June 2019, Version 3.1.0
7 www.cobham.com/gaisler
Page 8

debug driver for each recognized IP core is then initialized, and performs a core-specific initialization sequence if
required. For a memory controller, the initialization sequence would typically consist of a memory probe operation
to detect the amount of attached RAM. For a UART, it could consist of initializing the baud rate generator and
flushing the FIFOs. After the initialization is complete, the system configuration is printed:
GRMON3 LEON debug monitor v3.0.0 32-bit professional version
Copyright (C) 2018 Cobham Gaisler - All rights reserved.
For latest updates, go to http://www.gaisler.com/
Comments or bug-reports to support@gaisler.com
GRLIB build version: 4111
Detected frequency: 40 MHz
Component Vendor
LEON3 SPARC V8 Processor Cobham Gaisler
AHB Debug UART Cobham Gaisler
JTAG Debug Link Cobham Gaisler
GRSPW2 SpaceWire Serial Link Cobham Gaisler
LEON2 Memory Controller European Space Agency
AHB/APB Bridge Cobham Gaisler
LEON3 Debug Support Unit Cobham Gaisler
Generic UART Cobham Gaisler
Multi-processor Interrupt Ctrl. Cobham Gaisler
Modular Timer Unit Cobham Gaisler
General Purpose I/O port Cobham Gaisler
Use command 'info sys' to print a detailed report of attached cores
grmon3>
More detailed system information can be printed using the ‘info sys’ command as listed below. The detailed system
view also provides information about address mapping, interrupt allocation and IP core configuration. Information
about which AMBA AHB and APB buses a core is connected to can be seen by adding the -v option. GRMON
assigns a unique name to all cores, the core name is printed to the left. See Appendix C, Tcl API for information
about Tcl variables and device names.
grmon3> info sys
cpu0 Cobham Gaisler LEON3 SPARC V8 Processor
AHB Master 0
ahbuart0 Cobham Gaisler AHB Debug UART
AHB Master 1
APB: 80000700 - 80000800
Baudrate 115200, AHB frequency 40000000.00
ahbjtag0 Cobham Gaisler JTAG Debug Link
AHB Master 2
grspw0 Cobham Gaisler GRSPW2 SpaceWire Serial Link
AHB Master 3
APB: 80000A00 - 80000B00
IRQ: 10
Number of ports: 1
mctrl0 European Space Agency LEON2 Memory Controller
AHB: 00000000 - 20000000
AHB: 20000000 - 40000000
AHB: 40000000 - 80000000
APB: 80000000 - 80000100
8-bit prom @ 0x00000000
32-bit sdram: 1 * 64 Mbyte @ 0x40000000
col 9, cas 2, ref 7.8 us
apbmst0 Cobham Gaisler AHB/APB Bridge
AHB: 80000000 - 80100000
dsu0 Cobham Gaisler LEON3 Debug Support Unit
AHB: 90000000 - A0000000
AHB trace: 128 lines, 32-bit bus
CPU0: win 8, hwbp 2, itrace 128, V8 mul/div, srmmu, lddel 1
stack pointer 0x43fffff0
icache 2 * 4096 kB, 32 B/line lru
dcache 1 * 4096 kB, 16 B/line
uart0 Cobham Gaisler Generic UART
APB: 80000100 - 80000200
IRQ: 2
Baudrate 38461
irqmp0 Cobham Gaisler Multi-processor Interrupt Ctrl.
APB: 80000200 - 80000300
gptimer0 Cobham Gaisler Modular Timer Unit
APB: 80000300 - 80000400
IRQ: 8
8-bit scalar, 2 * 32-bit timers, divisor 40
GRMON3-UM
June 2019, Version 3.1.0
8 www.cobham.com/gaisler
Page 9

grgpio0 Cobham Gaisler General Purpose I/O port
APB: 80000800 - 80000900
2.2.1. LEON2 target initialization
The plug and play information was introduced in the LEON3 processor (GRLIB), and is not available for LEON2
systems. LEON2 is supported by starting GRMON with the -sys leon2 switch or one of the switches that
correspond to a known LEON2 device, see Section 6.12, “LEON2 support”.
A LEON2 system has a fixed set of IP cores and address mapping. GRMON will use an internal plug and play table
that describes this configuration. The plug and play table used for LEON2 is fixed, and no automatic detection of
present cores is attempted. Only those cores that need to be initialized by GRMON are included in the table, so
the listing might not correspond to the actual target. It is however possible to load a custom configuration file that
describes the target system configuration using see Section 2.2.2, “Configuration file target initialization”
2.2.2. Configuration file target initialization
It is possible to provide GRMON with a configuration file that describes a static configuration by starting GRMON
with the switch -cfg filename.
The format of the plug and play configuration file is described in section Appendix D, Fixed target configuration
file format. It can be used for both LEON3 and LEON2 systems. An example configuration file is also supplied
with the GRMON professional distribution in share/src/cfg/leon3.xml.
2.3. Memory register reset values
To ensure that the memory registers has sane values, GRMON will reset the registers when commands that access
the memories are issued, for example run, load commands and similar commands. To modify the reset values,
use the commands listed in Section 6.14.2, “Commands”.
GRMON3-UM
June 2019, Version 3.1.0
9 www.cobham.com/gaisler
Page 10

3. Operation
This chapter describes how GRMON can be controlled by the user in a terminal based interactive debug session
and how it can be automated with scripts for batch execution. The first sections describe and exemplifies typical
operations for interactive use. The later sections describe automation concepts. Most interactive commands are
applicable also for automated use.
GRMON graphical user interface is described in Chapter 4, Graphical user interface.
3.1. Overview
An interactive GRMON debug session typically consists of the following steps:
1. Starting GRMON and attaching to the target system
2. Examining the hardware configuration
3. Uploading application program
4. Setup debugging, for example insert breakpoints and watchpoints
5. Executing the application
6. Debugging the application and examining the CPU and hardware state
Step 2 though 6 is performed using the GRMON terminal interface or by attaching GDB and use the standard
GDB interface. The GDB section describes how GRMON specific commands are accessed from GDB.
The following sections will give an overview how the various steps are performed.
3.2. Starting GRMON
On a Linux host, GRMON is started by giving the grmon command together with command line options in a
terminal window. It can run either the GUI or a commandline interface depending on if a debug link option is
provided or not.
On Windows hosts, there are two executable provided. The file grmon.exe is intended to be started in a Windows
command prompt (cmd.exe). It can run either the GUI or a commandline interface depending on if a debug link
option is provided or not. The executable grmon-gui.exe will always spawn a gui.
Command line options are grouped by function as indicated below.
• The debug link options: setting up a connection to GRLIB target
• General options: debug session behavior options
• Debug driver options: configure the hardware, skip core auto-probing etc.
NOTE: If any debug-link option is given to grmon or grmon.exe, then the GRMON command line interface
will be started.
If no debug-link option is given to grmon or grmon.exe, then the GRMON graphical user interface will be started.
For more information, see Chapter 4, Graphical user interface.
Below is an example of GRMON connecting to a GR712 evaluation board using the FTDI USB serial interface,
tunneling the UART output of APBUART0 to GRMON and specifying three RAM wait states on read and write:
$ grmon -ftdi -u -ramws 3
To connect to a target using the AHBUART debug link, the following example can be used:
$ grmon -uart -u
The -uart option uses the first UART of the host (ttyS0 or COM1) with a baud rate of 115200 baud by default.
3.2.1. Debug link options
GRMON connects to a GRLIB target using one debug link interface, the command line options selects which
interface the PC uses to connect to the target and optionally how the debug link is configured. All options are
described in Chapter 5, Debug link.
GRMON3-UM
June 2019, Version 3.1.0
10 www.cobham.com/gaisler
Page 11

3.2.2. Debug driver options
The debug drivers provide an interface to view and access AMBA devices during debugging and they offer device
specific ways to configure the hardware when connecting and before running the executable. Drivers usually auto-probe their devices for optimal configuration values, however sometimes it is useful to override the auto-probed
values. Some options affects multiple drivers. The debug driver options are described in Chapter 6, Debug drivers.
3.2.3. General options
The general options are mostly target independent options configuring the behavior of GRMON. Some of them
affects how the target system is accessed both during connection and during the whole debugging session. All
general options are described below.
grmon [options]
Options:
-abaud baudrate
Set baud-rate for all UARTs in the system, (except the debug-link UART). By default, 38400 baud is used.
-ambamb [maxbuses]
Enable auto-detection of AHBCTRL_MB system and (optionally) specifies the maximum number of buses
in the system if an argument is given. The optional argument to -ambamb is decoded as below:
0, 1: No Multi-bus (MB) (max one bus)
2..3: Limit MB support to 2 or 3 AMBA PnP buses
4 or no argument: Selects Full MB support
-c filename
Run the commands in the batch file at start-up.
-cfg filename
Load fixed PnP configuration from a xml-file.
-echo
Echo all the commands in the batch file at start-up. Has no effect unless -c is also set.
-edac
Enable EDAC operation in memory controllers that support it.
-freq sysclk
Overrides the detected system frequency. The frequency is specified in MHz.
-gdb [port]
Listen for GDB connection directly at start-up. Optionally specify the port number for GDB communications. Default port number is 2222.
-gui
Start the GRMON graphical user interface. This option must be combined with an option which specifies
the debug-link to use. See Chapter 4, Graphical user interface for more information.
-ioarea address
Specify the location of the I/O area. (Default is 0xfff00000).
-log filename
Log session to the specified file. If the file already exists the new session is appended. This should be used
when requesting support.
-ni
Read plug n' play and detect all system device, but don't do any target initialization. See Section 3.4.11,
“Attaching to a target system without initialization” for more information.
-nopnp
Disable the plug n' play scanning. GRMON won't detect any hardware and any hardware dependent functionality won't work.
-u [device]
Put UART 1 in FIFO debug mode if hardware supports it, else put it in loop-back mode. Debug mode will
enable both reading and writing to the UART from the monitor console. Loop-back mode will only enable
reading. See Section 3.9, “Forwarding application console I/O”. The optional device parameter is used to
select a specific UART to be put in debug mode. The device parameter is an index starting with 0 for the
first UART and then increasing with one in the order they are found in the bus scan. If the device parameter
is not used the first UART is selected.
GRMON3-UM
June 2019, Version 3.1.0
11 www.cobham.com/gaisler
Page 12

-udm [device]
Put UART 1 in FIFO debug mode if hardware supports it. Debug mode will enable both reading and writing
to the UART from the monitor console. See Section 3.9, “Forwarding application console I/O”. The optional
device parameter is used to select a specific UART to be put in debug mode. The device parameter is an
index starting with 0 for the first UART and then increasing with one in the order they are found in the bus
scan. If the device parameter is not used the first UART is selected.
-ulb [device]
Put UART 1 in loop-back mode. Loop-back mode will only enable reading from the UART to the monitor
console. See Section 3.9, “Forwarding application console I/O”. The optional device parameter is used to
select a specific UART to be put in debug mode. The device parameter is an index starting with 0 for the
first UART and then increasing with one in the order they are found in the bus scan. If the device parameter
is not used the first UART is selected.
-ucmd filename
Load script specified by filename into all shells, including the system shell.
-udrv filename
Load script specified by filename into system shell.
3.3. GRMON command-line interface (CLI)
The GRMON3 command-line interface features a Tcl 8.6 interpreter which will interpret all entered commands
substituting variables etc. before GRMON is actually called. Variables exported by GRMON can also be used
to access internal states and hardware registers without going through commands. The GRMON Tcl interface is
described in Section 3.5, “Tcl integration”.
GRMON dynamically loads libreadline.so if available on your host system, and uses the readline library to
enter and edit commands. Short forms of the commands are allowed, e.g lo, loa, or load, are all interpreted as load.
Tab completion is available for commands, Tcl variables, text-symbols, file names, etc. If libreadline.so
is not found, the standard input/output routines are used instead (no history, poor editing capabilities and no tabcompletion).
The commands can be separated in to three categories:
• Tcl internal commands and reserved key words
• GRMON built-in commands always available regardless of target
• GRMON commands accessing debug drivers
Tcl internal and GRMON built-in commands are available regardless of target hardware present whereas debug
driver commands may only be present on supported systems. The Tcl and driver commands are described in
Section 3.5, “Tcl integration” and Chapter 6, Debug drivers respectively. In Table 3.1 is a summary of all GRMON
built-in commands. For the full list of commands, see Appendix A, Command index.
Table 3.1. BUILT-IN commands
amem Asynchronous bus read
batch Execute batch script
bdump Dump memory to a file
bload Load a binary file
disassemble Disassemble memory
dump Dump memory to a file
dwarf print or lookup dwarf information
eeload Load a file into an EEPROM
execsh Run commands in the execution shell
exit Exit GRMON
gdb Controll the builtin GDB remote server
gui Control the graphical user interface
help Print all commands or detailed help for a specific command
GRMON3-UM
June 2019, Version 3.1.0
12 www.cobham.com/gaisler
Page 13

info Show information
load Load a file or print filenames of uploaded files
memb AMBA bus 8-bit memory read access, list a range of addresses
memh AMBA bus 16-bit memory read access, list a range of addresses
mem AMBA bus 32-bit memory read access, list a range of addresses
nolog Suppress stdout of a command
quit Quit the GRMON console
reset Reset drivers
rtg4fddr Print initialization sequence
rtg4serdes Print initialization sequence
sf2mddr Print initialization sequence
sf2serdes Print initialization sequence
shell Execute shell process
silent Suppress stdout of a command
symbols Load, print or lookup symbols
usrsh Run commands in threaded user shell
verify Verify that a file has been uploaded correctly
wash Clear or set memory areas
wmemb AMBA bus 8-bit memory write access
wmemh AMBA bus 16-bit memory write access
wmems Write a string to an AMBA bus memory address
wmem AMBA bus 32-bit memory write access
3.4. Common debug operations
This section describes and gives some examples of how GRMON is typically used, the full command reference
can be found in Appendix A, Command index.
3.4.1. Examining the hardware configuration
When connecting for the first time it is essential to verify that GRMON has auto-detected all devices and their
configuration correctly. At start-up GRMON will print the cores and the frequency detected. From the command
line one can examine the system by executing info sys as below:
grmon3> info sys
cpu0 Cobham Gaisler LEON3-FT SPARC V8 Processor
AHB Master 0
cpu1 Cobham Gaisler LEON3-FT SPARC V8 Processor
AHB Master 1
greth0 Cobham Gaisler GR Ethernet MAC
AHB Master 3
APB: 80000E00 - 80000F00
IRQ: 14
grspw0 Cobham Gaisler GRSPW2 SpaceWire Serial Link
AHB Master 5
APB: 80100800 - 80100900
IRQ: 22
Number of ports: 1
grspw1 Cobham Gaisler GRSPW2 SpaceWire Serial Link
AHB Master 6
APB: 80100900 - 80100A00
IRQ: 23
Number of ports: 1
mctrl0 Cobham Gaisler Memory controller with EDAC
AHB: 00000000 - 20000000
AHB: 20000000 - 40000000
AHB: 40000000 - 80000000
APB: 80000000 - 80000100
8-bit prom @ 0x00000000
32-bit static ram: 1 * 8192 kbyte @ 0x40000000
GRMON3-UM
June 2019, Version 3.1.0
13 www.cobham.com/gaisler
Page 14

32-bit sdram: 2 * 128 Mbyte @ 0x60000000
col 10, cas 2, ref 7.8 us
apbmst0 Cobham Gaisler AHB/APB Bridge
AHB: 80000000 - 80100000
dsu0 Cobham Gaisler LEON3 Debug Support Unit
AHB: 90000000 - A0000000
AHB trace: 256 lines, 32-bit bus
CPU0: win 8, hwbp 2, itrace 256, V8 mul/div, srmmu, lddel 1, GRFPU
stack pointer 0x407ffff0
icache 4 * 4096 kB, 32 B/line lru
dcache 4 * 4096 kB, 16 B/line lru
CPU1: win 8, hwbp 2, itrace 256, V8 mul/div, srmmu, lddel 1, GRFPU
stack pointer 0x407ffff0
icache 4 * 4096 kB, 32 B/line lru
dcache 4 * 4096 kB, 16 B/line lru
uart0 Cobham Gaisler Generic UART
APB: 80000100 - 80000200
IRQ: 2
Baudrate 38461, FIFO debug mode
irqmp0 Cobham Gaisler Multi-processor Interrupt Ctrl.
APB: 80000200 - 80000300
EIRQ: 12
gptimer0 Cobham Gaisler Modular Timer Unit
APB: 80000300 - 80000400
IRQ: 8
16-bit scalar, 4 * 32-bit timers, divisor 80
grgpio0 Cobham Gaisler General Purpose I/O port
APB: 80000900 - 80000A00
uart1 Cobham Gaisler Generic UART
APB: 80100100 - 80100200
IRQ: 17
Baudrate 38461
...
The memory section for example tells us that GRMON are using the correct amount of memory and memory
type. The parameters can be tweaked by passing memory driver specific options on start-up, see Section 3.2,
“Starting GRMON”. The current memory settings can be viewed in detail by listing the registers with info reg or
by accessing the registers by the Tcl variables exported by GRMON:
grmon3> info sys
...
mctrl0 Cobham Gaisler Memory controller with EDAC
AHB: 00000000 - 20000000
AHB: 20000000 - 40000000
AHB: 40000000 - 80000000
APB: 80000000 - 80000100
8-bit prom @ 0x00000000
32-bit static ram: 1 * 8192 kbyte @ 0x40000000
32-bit sdram: 2 * 128 Mbyte @ 0x60000000
col 10, cas 2, ref 7.8 us
...
grmon3> info reg
...
Memory controller with EDAC
0x80000000 Memory config register 1 0x1003c0ff
0x80000004 Memory config register 2 0x9ac05463
0x80000008 Memory config register 3 0x0826e000
...
grmon3> puts [format 0x%08x $mctrl0:: [TAB-COMPLETION]
mctrl0::mcfg1 mctrl0::mcfg2 mctrl0::mcfg3 mctrl0::pnp::
mctrl0::mcfg1:: mctrl0::mcfg2:: mctrl0::mcfg3::
grmon3> puts [format 0x%08x $mctrl0::mcfg1]
0x0003c0ff
grmon3> puts [format 0x%08x $mctrl0::mcfg2 :: [TAB-COMPLETION]
mctrl0::mcfg2::d64 mctrl0::mcfg2::sdramcmd
mctrl0::mcfg2::rambanksz mctrl0::mcfg2::sdramcolsz
mctrl0::mcfg2::ramrws mctrl0::mcfg2::sdramrf
mctrl0::mcfg2::ramwidth mctrl0::mcfg2::sdramtcas
mctrl0::mcfg2::ramwws mctrl0::mcfg2::sdramtrfc
mctrl0::mcfg2::rbrdy mctrl0::mcfg2::sdramtrp
mctrl0::mcfg2::rmw mctrl0::mcfg2::se
mctrl0::mcfg2::sdpb mctrl0::mcfg2::si
mctrl0::mcfg2::sdrambanksz
grmon3> puts [format %x $mctrl0::mcfg2::ramwidth]
2
3.4.2. Uploading application and data to target memory
A LEON software application can be uploaded to the target system memory using the load command:
GRMON3-UM
June 2019, Version 3.1.0
14 www.cobham.com/gaisler
Page 15

grmon3> load v8/stanford.exe
40000000 .text 54.8kB / 54.8kB [===============>] 100%
4000DB30 .data 2.9kB / 2.9kB [===============>] 100%
Total size: 57.66kB (786.00kbit/s)
Entry point 0x40000000
Image /home/daniel/examples/v8/stanford.exe loaded
The supported file formats are SPARC ELF-32, ELF-64 (MSB truncated to 32-bit addresses), srecord and a.out
binaries. Each section is loaded to its link address. The program entry point of the file is used to set the %PC,
%NPC when the application is later started with run. It is also possible to load binary data by specifying file and
target address using the bload command.
One can use the verify command to make sure that the file has been loaded correctly to memory as below. Any
discrepancies will be reported in the GRMON console.
grmon3> verify v8/stanford.exe
40000000 .text 54.8kB / 54.8kB [===============>] 100%
4000DB30 .data 2.9kB / 2.9kB [===============>] 100%
Total size: 57.66kB (726.74kbit/s)
Entry point 0x40000000
Image of /home/daniel/examples/v8/stanford.exe verified without errors
NOTE: On-going DMA can be turned off to avoid that hardware overwrites the loaded image by issuing the reset
command prior to load. This is important after the CPU has been executing using DMA in for example Ethernet
network traffic.
3.4.3. Running applications
After the application has been uploaded to the target with load the run command can be used to start execution.
The entry-point taken from the ELF-file during loading will serve as the starting address, the first instruction
executed. The run command issues a driver reset, however it may be necessary to perform a reset prior to loading
the image to avoid that DMA overwrites the image. See the reset command for details. Applications already
located in FLASH can be started by specifying an absolute address. The cont command resumes execution after
a temporary stop, e.g. a breakpoint hit. go also affects the CPU execution, the difference compared to run is that
the target device hardware is not initialized before starting execution.
grmon3> reset
grmon3> load v8/stanford.exe
40000000 .text 54.8kB / 54.8kB [===============>] 100%
4000DB30 .data 2.9kB / 2.9kB [===============>] 100%
Total size: 57.66kB (786.00kbit/s)
Entry point 0x40000000
Image /home/daniel/examples/v8/stanford.exe loaded
grmon3> run
Starting
Perm Towers Queens Intmm Mm Puzzle Quick Bubble Tree FFT
34 67 33 117 1117 367 50 50 250 1133
Nonfloating point composite is 144
Floating point composite is 973
CPU 0: Program exited normally.
CPU 1: Power down mode
The output from the application normally appears on the LEON UARTs and thus not in the GRMON console.
However, if GRMON is started with the -u switch, the UART is put into debug mode and the output is tunneled
over the debug-link and finally printed on the console by GRMON. See Section 3.9, “Forwarding application
console I/O”. Note that older hardware (GRLIB 1.0.17-b2710 and older) has only partial support for -u, it will not
work when the APBUART software driver uses interrupt driven I/O, thus Linux and vxWorks are not supported
on older hardware. Instead, a terminal emulator should be connected to UART 1 of the target system.
Since the application changes (at least) the .data segment during run-time the application must be reloaded before
it can be executed again. If the application uses the MMU (e.g. Linux) or installs data exception handlers (e.g.
eCos), GRMON should be started with -nb to avoid going into break mode on a page-fault or data exception.
Likewise, when a software debugger is running on the target (e.g. GDB natively in Linux user-space or WindRiver
Workbench debugging a task) soft breakpoints ("TA 0x01" instruction) will result in traps that the OS will handle
GRMON3-UM
15 www.cobham.com/gaisler
June 2019, Version 3.1.0
Page 16

and tell the native debugger. To prevent GRMON from interpreting it as its own breakpoints and stop the CPU
one must use the -nswb switch.
3.4.4. Inserting breakpoints and watchpoints
All breakpoints are inserted with the bp command. The subcommand (soft, hard, watch, bus, data, delete) given to
bp determine which type of breakpoint is inserted, if no subcommand is given bp defaults to a software breakpoint.
Instruction breakpoints are inserted using bp soft or bp hard commands. Inserting a software breakpoint will add
a (TA 0x1) instruction by modifying the target's memory before starting the CPU, while bp hard will insert a
hardware breakpoint using one of the IU watchpoint registers. To debug instruction code in read-only memories
or memories which are self-modifying the only option is hardware breakpoints. Note that it's possible to debug
any RAM-based code using software breakpoints, even where traps are disabled such as in trap handlers. Since
hardware breakpoints triggers on the CPU instruction address one must be aware that when the MMU is turned
on, virtual addresses are triggered upon.
CPU data address watchpoints (read-only, write-only or read-write) are inserted using the bp watch command.
Watchpoints can be setup to trigger within a range determined by a bit-mask where a one means that the address
must match the address pattern and a zero mask indicate don't care. The lowest 2-bits are not available, meaning
that 32-bit words are the smallest address that can be watched. Byte accesses can still be watched but accesses to
the neighboring three bytes will also be watched.
AMBA-bus watchpoints can be inserted using bp bus or bp data. When a bus watchpoint is hit the trace buffer
will freeze. The processor can optionally be put in debug mode when the bus watchpoint is hit. This is controlled
by the tmode command:
grmon3> tmode break N
If N = 0, the processor will not be halted when the watchpoint is hit. A value > 0 will break the processor and set
the AHB trace buffer delay counter to the same value.
NOTE: For hardware supported break/watchpoints the target must have been configured accordingly, otherwise
a failure will be reported. Note also that the number of watchpoints implemented varies between designs.
3.4.5. Displaying processor registers
The current register window of a LEON processor can be displayed using the reg command or by accessing the Tcl
cpu namespace that GRMON provides. GRMON exports cpu and cpuN where N selects which CPU's registers
are accessed, the cpu namespace points to the active CPU selected by the cpu command.
grmon3> reg
INS LOCALS OUTS GLOBALS
0: 00000008 0000000C 00000000 00000000
1: 80000070 00000020 00000000 00000001
2: 00000000 00000000 00000000 00000002
3: 00000000 00000000 00000000 00300003
4: 00000000 00000000 00000000 00040004
5: 00000000 00000000 00000000 00005005
6: 407FFFF0 00000000 407FFFF0 00000606
7: 00000000 00000000 00000000 00000077
psr: F34010E0 wim: 00000002 tbr: 40000060 y: 00000000
pc: 40003E44 be 0x40003FB8
npc: 40003E48 nop
grmon3> puts [format %x $::cpu::iu::o6]
407ffff0
Other register windows can be displayed using reg wN, when N denotes the window number. Use the float command to show the FPU registers (if present).
3.4.6. Backtracing function calls
When debugging an application it is often most useful to view how the CPU entered the current function. The bt
command analyze the previous stack frames to determine the backtrace. GRMON reads the register windows and
then switches to read from the stack depending on the %WIM and %PSR register.
GRMON3-UM
June 2019, Version 3.1.0
16 www.cobham.com/gaisler
Page 17

The backtrace is presented with the caller's program counter (%PC) to return to (below where the CALL instruction
was issued) and the stack pointer (%SP) at that time. The first entry (frame #0) indicates the current location of
the CPU and the current stack pointer. The right most column print out the %PC address relative the function
symbol, i.e. if symbols are present.
grmon3> bt
%pc %sp
#0 0x40003e24 0x407ffdb8 <Fft+0x4>
#1 0x40005034 0x407ffe28 <main+0xfc4>
#2 0x40001064 0x407fff70 <_start+0x64>
#3 0x4000cf40 0x407fffb0 <_hardreset_real+0x78>
NOTE: In order to display a correct backtrace for optimized code where optimized leaf functions are present a
symbol table must exist.
In a MP system the backtrace of a specific CPU can be printed, either by changing the active CPU with the cpu
command or by passing the CPU index to bt.
3.4.7. Displaying memory contents
Any memory location can be displayed and written using the commands listed in the table below. Memory commands that are prefixed with a v access the virtual address space seen by doing MMU address lookups for active
CPU.
Table 3.2. Memory access commands
Command
Description
Name
mem AMBA bus 32-bit memory read access, list a range of addresses
wmem AMBA bus 32-bit memory write access
vmem AMBA bus 32-bit virtual memory read access, list a range of addresses
memb AMBA bus 8-bit memory read access, list a range of addresses
memh AMBA bus 16-bit memory read access, list a range of addresses
vmemb AMBA bus 8-bit virtual memory read access, list a range of addresses
vmemh AMBA bus 16-bit virtual memory read access, list a range of addresses
vwmemb AMBA bus 8-bit virtual memory write access
vwmemh AMBA bus 16-bit virtual memory write access
vwmems Write a string to an AMBA bus virtual memory address
vwmem AMBA bus 32-bit virtual memory write access
wmemb AMBA bus 8-bit memory write access
wmemh AMBA bus 16-bit memory write access
wmems Write a string to an AMBA bus memory address
amem AMBA bus 32-bit asynchronous memory read access
NOTE: Most debug links only support 32-bit accesses, only JTAG links support unaligned access. An unaligned
access is when the address or number of bytes are not evenly divided by four. When an unaligned data read request
is issued, then GRMON will read some extra bytes to align the data, but only return the requested data. If a write
request is issued, then an aligned read-modify-write sequence will occur.
The mem command requires an address and an optional length, if the length is left out 64 bytes are displayed. If a
program has been loaded, text symbols can be used instead of a numeric address. The memory content is displayed
in hexadecimal-decimal format, grouped in 32-bit words. The ASCII equivalent is printed at the end of the line.
grmon> mem 0x40000000
40000000 a0100000 29100004 81c52000 01000000 ...)..... .....
GRMON3-UM
17 www.cobham.com/gaisler
June 2019, Version 3.1.0
Page 18

40000010 91d02000 01000000 01000000 01000000 . .............
40000020 91d02000 01000000 01000000 01000000 . .............
40000030 91d02000 01000000 01000000 01000000 . .............
grmon> mem 0x40000000 16
40000000 a0100000 29100004 81c52000 01000000 ...)..... .....
grmon> mem main 48
40003278 9de3bf98 2f100085 31100037 90100000 ..../...1..7....
40003288 d02620c0 d025e178 11100033 40000b4b & .%.x...3@..K
40003298 901223b0 11100033 40000af4 901223c0 ..#....3@.....#.
The memory access commands listed in Table 3.2 are not restricted to memory: they can be used on any bus
address accessible by the debug link. However, for access to peripheral control registers, the command info reg
can provide a more user-friendly output.
All commands in Table 3.2, , except for amem, return to the caller when the bus access has completed, which
means that a sequence of these commands generates a sequence of bus accesses with the same ordering. In situations where the bus accesses order is not critical, the command amem can be used to schedule multiple concurrent
read accesses whose results can be retrieved at a later time. This is useful when GRMON is automated using Tcl
scripts.
3.4.8. Instruction disassembly
If the memory contents is SPARC machine code, the contents can be displayed in assembly code using the disassemble command:
grmon3> disassemble 0x40000000 10
0x40000000: 88100000 clr %g4 <start+0>
0x40000004: 09100034 sethi %hi(0x4000d000), %g4 <start+4>
0x40000008: 81c12034 jmp %g4 + 0x34 <start+8>
0x4000000c: 01000000 nop <start+12>
0x40000010: a1480000 mov %psr, %l0 <start+16>
0x40000014: a7500000 mov %wim, %l3 <start+20>
0x40000018: 10803401 ba 0x4000d01c <start+24>
0x4000001c: ac102001 mov 1, %l6 <start+28>
0x40000020: 91d02000 ta 0x0 <start+32>
0x40000024: 01000000 nop <start+36>
grmon3> dis main
0x40004070: 9de3beb8 save %sp, -328, %sp <main+0>
0x40004074: 15100035 sethi %hi(0x4000d400), %o2 <main+4>
0x40004078: d102a3f4 ld [%o2 + 0x3f4], %f8 <main+8>
0x4000407c: 13100035 sethi %hi(0x4000d400), %o1 <main+12>
0x40004080: 39100088 sethi %hi(0x40022000), %i4 <main+16>
0x40004084: 3710003a sethi %hi(0x4000e800), %i3 <main+20>
0x40004088: d126e2e0 st %f8, [%i3 + 0x2e0] <main+24>
0x4000408c: d1272398 st %f8, [%i4 + 0x398] <main+28>
0x40004090: 400006a9 call 0x40005b34 <main+32>
0x40004094: 901262f0 or %o1, 0x2f0, %o0 <main+36>
0x40004098: 11100035 sethi %hi(0x4000d400), %o0 <main+40>
0x4000409c: 40000653 call 0x400059e8 <main+44>
0x400040a0: 90122300 or %o0, 0x300, %o0 <main+48>
0x400040a4: 7ffff431 call 0x40001168 <main+52>
0x400040a8: 3510005b sethi %hi(0x40016c00), %i2 <main+56>
0x400040ac: 2510005b sethi %hi(0x40016c00), %l2 <main+60>
3.4.9. Using the trace buffer
The LEON processor and associated debug support unit (DSU) can be configured with trace buffers to store both
the latest executed instructions and the latest AHB bus transfers. The trace buffers are automatically enabled by
GRMON during start-up , but can also be individually enabled and disabled using tmode command. The command
ahb is used to show the AMBA buffer. The command inst is used to show the instruction buffer. The command
hist is used to display the contents of the instruction and the AMBA buffers mixed together. Below is an example
debug session that shows the usage of breakpoints, watchpoints and the trace buffer:
grmon3> lo v8/stanford.exe
40000000 .text 54.8kB / 54.8kB [===============>] 100%
4000DB30 .data 2.9kB / 2.9kB [===============>] 100%
Total size: 57.66kB (786.00kbit/s)
Entry point 0x40000000
Image /home/daniel/examples/v8/stanford.exe loaded
GRMON3-UM
June 2019, Version 3.1.0
18 www.cobham.com/gaisler
Page 19

grmon3> bp Fft
Software breakpoint 1 at <Fft>
grmon3> bp watch 0x4000eae0
Hardware watchpoint 2 at 0x4000eae0
grmon3> bp
NUM ADRESS MASK TYPE SYMBOL
1 : 0x40003e20 (soft) Fft+0
2 : 0x4000eae0 0xfffffffc (watch rw) floated+0
grmon3> run
CPU 0: watchpoint 2 hit
0x40001024: c0388003 std %g0, [%g2 + %g3] <_start+36>
CPU 1: Power down mode
grmon3> inst
TIME ADDRESS INSTRUCTION RESULT
84675 40001024 std %g0, [%g2 + %g3] [4000eaf8 00000000 00000000]
84678 4000101c subcc %g3, 8, %g3 [00000440]
84679 40001020 bge,a 0x4000101c [00000448]
84682 40001024 std %g0, [%g2 + %g3] [4000eaf0 00000000 00000000]
84685 4000101c subcc %g3, 8, %g3 [00000438]
84686 40001020 bge,a 0x4000101c [00000440]
84689 40001024 std %g0, [%g2 + %g3] [4000eae8 00000000 00000000]
84692 4000101c subcc %g3, 8, %g3 [00000430]
84693 40001020 bge,a 0x4000101c [00000438]
84694 40001024 std %g0, [%g2 + %g3] [ TRAP ]
grmon3> ahb
TIME ADDRESS TYPE D[31:0] TRANS SIZE BURST MST LOCK RESP HIRQ
84664 4000eb08 write 00000000 2 2 1 0 0 0 0000
84667 4000eb0c write 00000000 3 2 1 0 0 0 0000
84671 4000eb00 write 00000000 2 2 1 0 0 0 0000
84674 4000eb04 write 00000000 3 2 1 0 0 0 0000
84678 4000eaf8 write 00000000 2 2 1 0 0 0 0000
84681 4000eafc write 00000000 3 2 1 0 0 0 0000
84685 4000eaf0 write 00000000 2 2 1 0 0 0 0000
84688 4000eaf4 write 00000000 3 2 1 0 0 0 0000
84692 4000eae8 write 00000000 2 2 1 0 0 0 0000
84695 4000eaec write 00000000 3 2 1 0 0 0 0000
grmon3> reg
INS LOCALS OUTS GLOBALS
0: 80000200 00000000 00000000 00000000
1: 80000200 00000000 00000000 00000000
2: 0000000C 00000000 00000000 4000E6B0
3: FFF00000 00000000 00000000 00000430
4: 00000002 00000000 00000000 4000CC00
5: 800FF010 00000000 00000000 4000E680
6: 407FFFB0 00000000 407FFF70 4000CF34
7: 4000CF40 00000000 00000000 00000000
psr: F30010E7 wim: 00000002 tbr: 40000000 y: 00000000
pc: 40001024 std %g0, [%g2 + %g3]
npc: 4000101c subcc %g3, 8, %g3
grmon3> bp del 2
grmon3> cont
Towers Queens Intmm Mm Puzzle Quick Bubble Tree FFT
CPU 0: breakpoint 1 hit
0x40003e24: a0100018 mov %i0, %l0 <Fft+4>
CPU 1: Power down mode
grmon3>
grmon3> hist
TIME ADDRESS INSTRUCTIONS/AHB SIGNALS RESULT/DATA
30046975 40003e20 AHB read mst=0 size=2 [9de3bf90]
30046976 40005030 or %l2, 0x1e0, %o3 [40023de0]
30046980 40003e24 AHB read mst=0 size=2 [91d02001]
30046981 40005034 call 0x40003e20 [40005034]
30046985 40003e28 AHB read mst=0 size=2 [b136201f]
30046990 40003e2c AHB read mst=0 size=2 [f83fbff0]
30046995 40003e30 AHB read mst=0 size=2 [82040018]
30047000 40003e34 AHB read mst=0 size=2 [d11fbff0]
30047005 40003e38 AHB read mst=0 size=2 [9a100019]
30047010 40003e3c AHB read mst=0 size=2 [9610001a]
When printing executed instructions, the value within brackets denotes the instruction result, or in the case of
store instructions the store address and store data. The value in the first column displays the relative time, equal
GRMON3-UM
19 www.cobham.com/gaisler
June 2019, Version 3.1.0
Page 20

to the DSU timer. The time is taken when the instruction completes in the last pipeline stage (write-back) of the
processor. In a mixed instruction/AHB display, AHB address and read or write value appears within brackets. The
time indicates when the transfer completed, i.e. when HREADY was asserted.
NOTE: As the AHB trace is disabled when a breakpoint is hit, AHB accesses related to instruction cache fetches
after the time of break can be missed. The command ahb force can be used enable AHB tracing even when the
processor is in debug mode.
NOTE: When switching between tracing modes with tmode the contents of the trace buffer will not be valid until
execution has been resumed and the buffer refilled.
3.4.10. Profiling
GRMON supports profiling of LEON applications when run on real hardware. The profiling function collects
(statistical) information on the amount of execution time spent in each function. Due to its non-intrusive nature,
the profiling data does not take into consideration if the current function is called from within another procedure.
Even so, it still provides useful information and can be used for application tuning.
NOTE: To increase the number of samples, use the fastest debug link available on the target system. I.a. do not
use I/O forwarding (start GRMON without the -u commandline option)
grmon3> lo v8/stanford.exe
40000000 .text 54.8kB / 54.8kB [===============>] 100%
4000DB30 .data 2.9kB / 2.9kB [===============>] 100%
Total size: 57.66kB (786.00kbit/s)
Entry point 0x40000000
Image /home/daniel/examples/v8/stanford.exe loaded
grmon3> profile on
grmon3> run
Starting
Perm Towers Queens Intmm Mm Puzzle Quick Bubble Tree FFT
CPU 0: Interrupted!
0x40003ee4: 95a0c8a4 fsubs %f3, %f4, %f10 <Fft+196>
CPU 1: Interrupted!
0x40000000: 88100000 clr %g4 <start+0>
grmon3> prof
FUNCTION SAMPLES RATIO(%)
Trial 0000000096 27.35
__window_overflow_rettseq_ret 0000000060 17.09
main 0000000051 14.52
__window_overflow_slow1 0000000026 7.40
Fft 0000000023 6.55
Insert 0000000016 4.55
Permute 0000000013 3.70
tower 0000000013 3.70
Try 0000000013 3.70
Quicksort 0000000011 3.13
Checktree 0000000007 1.99
_malloc_r 0000000005 1.42
start 0000000004 1.13
outbyte 0000000003 0.85
Towers 0000000002 0.56
__window_overflow_rettseq 0000000002 0.56
___st_pthread_mutex_lock 0000000002 0.56
_start 0000000001 0.28
Perm 0000000001 0.28
__malloc_lock 0000000001 0.28
___st_pthread_mutex_trylock 0000000001 0.28
3.4.11. Attaching to a target system without initialization
When GRMON connects to a target system, it probes the configuration and initializes memory and registers. To
determine why a target has crashed, or resume debugging without reloading the application, it might be desirable
to connect to the target without performing a (destructive) initialization. This can be done by specifying the ni switch during the start-up of GRMON. The system information print-out (info sys) will then however not be
able to display the correct memory settings. The use of the -stack option and the go command might also be
GRMON3-UM
June 2019, Version 3.1.0
20 www.cobham.com/gaisler
Page 21

necessary in case the application is later restarted. The run command may not have the intended effect since the
debug drivers have not been initialized during start-up.
3.4.12. Multi-processor support
In systems with more than one LEON processor, the cpu command can be used to control the state and debugging
focus of the processors. In MP systems, the processors are enumerated with 0..N-1, where N is the number of
processors. Each processor can be in two states; enabled or disabled. When enabled, a processor can be started by
LEON software or by GRMON. When disabled, the processor will remain halted regardless. One can pause a MP
operating system and disable a CPU to debug a hanged CPU for example.
Most per-CPU (DSU) debugging commands such as displaying registers, backtrace or adding breakpoints will be
directed to the active processor only. Switching active processor can be done using the 'cpu active N' command,
see example below. The Tcl cpu namespace exported by GRMON is also changed to point to the active CPU's
namespace, thus accessing cpu will be the same as accessing cpu1 if CPU1 is the currently active CPU.
grmon3> cpu
cpu 0: enabled active
cpu 1: enabled
grmon3> cpu act 1
grmon3> cpu
cpu 0: enabled
cpu 1: enabled active
grmon3> cpu act 0
grmon3> cpu dis 1
grmon3> cpu
cpu 0: enabled active
cpu 1: disabled
grmon3> puts $cpu::fpu::f1
-1.984328031539917
grmon3> puts $cpu0::fpu::f1
-1.984328031539917
grmon3> puts $cpu1::fpu::f1
2.3017966689845248e+18
NOTE: Non-MP software can still run on the first CPU unaffected of the additional CPUs since it is the target
software that is responsible for waking other CPUs. All processors are enabled by default.
Note that it is possible to debug MP systems using GDB, but the user are required to change CPU itself. GRMON
specific commands can be entered from GDB using the monitor command.
3.4.13. Stack and entry point
The stack pointer is located in %O6 (%SP) register of SPARC CPUs. GRMON sets the stack pointer before starting
the CPU with the run command. The address is auto-detected to end of main memory, however it is overridable
using the -stack when starting GRMON or by issuing the stack command. Thus stack pointer can be used by
software to detect end of main memory.
The entry point (EP) determines at which address the CPU start its first instruction execution. The EP defaults to
main memory start and normally overridden by the load command when loading the application. ELF-files has
support for storing entry point. The entry point can manually be set with the ep command.
In a MP systems if may be required to set EP and stack pointer individual per CPU, one can use the cpu command
in conjunction with ep and stack.
3.4.14. Memory Management Unit (MMU) support
The LEON optionally implements the reference MMU (SRMMU) described in the SPARCv8 specification. GRMON support viewing and changing the MMU registers through the DSU, using the mmu command. GRMON
also supports address translation by reading the MMU table from memory similar to the MMU. The walk com-
GRMON3-UM
June 2019, Version 3.1.0
21 www.cobham.com/gaisler
Page 22

mand looks up one address by walking the MMU table printing out every step taken and the result. To simply
print out the result of such a translation, use the va command.
The memory commands that are prefixed with a v work with virtual addresses, the addresses given are translated
before listing or writing physical memory. If the MMU is not enabled, the vmem command for example is an alias
for mem. See Section 3.4.7, “Displaying memory contents” for more information.
NOTE: Many commands are affected by that the MMU is turned on, such as the disassemble command.
3.4.15. CPU cache support
The LEON optionally implements Level-1 instruction-cache and data-cache. GRMON supports the CPU's cache
by adopting certain operations depending on if the cache is activated or not. The user may also be able to access
the cache directly. This is however not normally needed, but may be useful when debugging or analyzing different
cache aspects. By default the L1-cache is turned on by GRMON , the cctrl command can be used to change the
cache control register. The commandline switches -nic and -ndc disables instruction and data cache respectively.
With the icache and dcache commands it is possible to view and modify the current content of the cache or check
if the cache is consistent with the memory. Both caches can be flushed instantly using the commands cctrl flush.
The data cache can be flushed instantly using the commands dcache flush. The instruction cache can be flushed
instantly using the commands icache flush.
The GRLIB Level-2 cache is supported using the l2cache command.
3.5. Tcl integration
GRMON has built-in support for Tcl 8.6. All commands lines entered in the terminal will pass through a Tclinterpreter. This enables loops, variables, procedures, scripts, arithmetics and more for the user. I.a. it also provides
an API for the user to extend GRMON.
3.5.1. Shells
GRMON creates several independent TCL shells, each with its own set of commands and variables. I.e. changing
active CPU in one shell does not affect any other shell. In the commandline version there one shell available for
the user by default, the CLI shell, which is accessed from the terminal. In the GUI is possible to create and view
multiple shells.
Additional custom user shells for the commandline interface can be created with the command usrsh. Each custom
user shell has an associated Tcl interpreter running in a separate execution thread.
When the GDB service is running, a GDB shell is also available from GDB by using the command mon.
There is also a system shell and an execution shell running in the background that GRMON uses internally. Some
hooks must be loaded into these shells to work, see Appendix C, Tcl API for more information.
3.5.2. Commands
There are two groups of commands, the native Tcl commands and GRMON's commands. Information about the
native Tcl commands and their syntax can be found at the Tcl website [http://www.tcl.tk/]. The GRMON commands' syntax documentation can be found in Appendix B, Command syntax.
The commands have three types of output:
1. Standard output. GRMON's commands prints information to standard output. This information is often
structured in a human readable way and cannot be used by other commands. Most of the GRMON commands
print some kind of information to the standard output, while very few of the Tcl commands does that.
Setting the variable ::grmon::settings:suppress_output to 1 will stop GRMON commands
from printing to the standard output, i.e. the TCL command puts will still print it's output. It is also possible to
put the command silent in front of another GRMON command to suppress the output of a single command,
e.g. grmon3> puts [expr [silent mem 0x40000000 4] + 4]
GRMON3-UM
June 2019, Version 3.1.0
22 www.cobham.com/gaisler
Page 23

2. Return values. The return value from GRMON is seldom the same as the information that is printed to
standard output, it's often the important data in a raw format. Return values can be used as input to other
commands or to be saved in variables. All TCL commands and many GRMON commands have return
values. The return values from commands are normally not printed. To print the return value to standard
output one can use the Tcl command puts. I.a. if the variable ::grmon::settings:echo_result
to 1, then GRMON will always print the result to stdout.
3. Return code. The return code from a command can be accessed by reading the variable errorCode or
by using the Tcl command catch. Both Tcl and GRMON commands will have an error message as return
value if it fails, which is also printed to standard output. More about error codes can be read about in the
Tcl tutorial or on the Tcler's Wiki [http://wiki.tcl.tk/].
For some of the GRMON commands it is possible to specify which core the commands is operation on. This is
implemented differently depending for each command, see the commands' syntax documentation in Appendix B,
Command syntax for more details. Some of these commands use a device name to specify which core to interact
with, see Appendix C, Tcl API for more information about device names.
3.5.3. API
It is possible to extend GRMON using Tcl. GRMON provides an API that makes it possible do write own device
drivers, implement hooks and to write advanced commands. See Appendix C, Tcl API for a detailed description
of the API.
3.6. Symbolic debug information
GRMON will automatically extract the symbol information from ELF-files, debug information is never read from
ELF-files. The symbols can be used to GRMON commands where an address is expected as below. Symbols are
tab completed.
grmon3> load v8/stanford.exe
40000000 .text 54.8kB / 54.8kB [===============>] 100%
4000DB30 .data 2.9kB / 2.9kB [===============>] 100%
Image /home/daniel/examples/v8/stanford.exe loaded
grmon3> bp main
Software breakpoint 1 at <main>
grmon3> dis strlen 5
0x40005b88: 808a2003 andcc %o0, 0x3, %g0 <strlen+0>
0x40005b8c: 12800012 bne 0x40005BD4 <strlen+4>
0x40005b90: 94100008 mov %o0, %o2 <strlen+8>
0x40005b94: 033fbfbf sethi %hi(0xFEFEFC00), %g1 <strlen+12>
0x40005b98: da020000 ld [%o0], %o5 <strlen+16>
The symbols command can be used to display all symbols, lookup the address of a symbol, or to read in symbols
from an alternate (ELF) file:
grmon3> symbols load v8/stanford.exe
grmon3> symbols lookup main
Found address 0x40004070
grmon3> symbols list
0x40005ab8 GLOBAL FUNC putchar
0x4000b6ac GLOBAL FUNC _mprec_log10
0x4000d9d0 GLOBAL OBJECT __mprec_tinytens
0x4000bbe8 GLOBAL FUNC cleanup_glue
0x4000abfc GLOBAL FUNC _hi0bits
0x40005ad4 GLOBAL FUNC _puts_r
0x4000c310 GLOBAL FUNC _lseek_r
0x4000eaac GLOBAL OBJECT piecemax
0x40001aac GLOBAL FUNC Try
0x40003c6c GLOBAL FUNC Uniform11
0x400059e8 GLOBAL FUNC printf
...
Reading symbols from alternate files is necessary when debugging self-extracting applications (MKPROM), when
switching between virtual and physical address space (Linux) or when debugging a multi-core ASMP system
where each CPU has its own symbol table. It is recommended to clear old symbols with symbols clear before
switching symbol table, otherwise the new symbols will be added to the old table.
GRMON3-UM
23 www.cobham.com/gaisler
June 2019, Version 3.1.0
Page 24

3.6.1. Multi-processor symbolic debug information
When loading symbols into GRMON it is possible to associate them with a CPU. When all symbols/images are
associated with CPU index 0, then GRMON will assume its a single-core or SMP application and lookup all
symbols from the symbols table associated with CPU index 0.
If different CPU indexes are specified (by setting active CPU or adding cpu# argument to the commands) when
loading symbols/images, then GRMON will assume its an AMP application that has been loaded. GRMON will
use the current active CPU (or cpu# argument) to determine which CPU index to lookup symbols from.
grmon3> cpu active 1
grmon3> symbols ../tests/threads/rtems-mp2
Loaded 1630 symbols
grmon3> bp _Thread_Handler
Software breakpoint 1 at <_Thread_Handler>
grmon3> symbols ../tests/threads/rtems-mp1 cpu0
Loaded 1630 symbols
grmon3> bp _Thread_Handler cpu0
Software breakpoint 2 at <_Thread_Handler>
grmon3> bp
NUM ADRESS MASK TYPE CPU SYMBOL
1 : 0x40418408 (soft) 1 _Thread_Handler+0
2 : 0x40019408 (soft) 0 _Thread_Handler+0
3.7. GDB interface
This section describes the GDB interface support available in GRMON. GRMON supports GDB version 6.3, 6.4,
6.8 and 8.2. Other tools that communicate over the GDB protocol may also attach to GRMON, some tools such
as Eclipse Workbench and DDD communicate with GRMON via GDB.
GDB must be built for the SPARC architecture, a native PC GDB does not work together with GRMON. The
toolchains that Cobham Gaisler distributes comes with a patched and tested version of GDB targeting all SPARC
LEON development tools.
Please see the GDB documentation available from the official GDB homepage [http://www.gnu.org/software/gdb/].
3.7.1. Connecting GDB to GRMON
GRMON can act as a remote target for GDB, allowing symbolic debugging of target applications. To initiate GDB
communications, start the monitor with the -gdb switch or use the GRMON gdb start command:
$ grmon -gdb
...
Started GDB service on port 2222.
...
grmon3> gdb status
GDB Service is waiting for incoming connection
Port: 2222
Then, start GDB in a different window and connect to GRMON using the extended-remote protocol. By default,
GRMON listens on port 2222 for the GDB connection:
$ sparc-gaisler-elf-gdb /opt/bcc-2.0.7-rc.1-gcc/src/examples/stanford/stanford
GNU gdb (GDB) 8.2
Copyright (C) 2018 Free Software Foundation, Inc.
License GPLv3+: GNU GPL version 3 or later <http://gnu.org/licenses/gpl.html>
This is free software: you are free to change and redistribute it.
There is NO WARRANTY, to the extent permitted by law.
Type "show copying" and "show warranty" for details.
This GDB was configured as "--host=x86_64-pc-linux-gnu --target=sparc-gaisler-elf".
Type "show configuration" for configuration details.
For bug reporting instructions, please see:
<http://www.gnu.org/software/gdb/bugs/>.
Find the GDB manual and other documentation resources online at:
<http://www.gnu.org/software/gdb/documentation/>.
GRMON3-UM
June 2019, Version 3.1.0
24 www.cobham.com/gaisler
Page 25

For help, type "help".
Type "apropos word" to search for commands related to "word"...
Reading symbols from /opt/bcc-2.0.7-rc.1-gcc/src/examples/stanford/stanford...done.
(gdb) target extended-remote :2222
Remote debugging using :2222
__bcc_entry_point () at /opt/bcc-2.0.7-rc.1-gcc/src/libbcc/shared/trap/trap_table_mvt.S:81
81 RESET_TRAP(__bcc_trap_reset_mvt); ! 00 reset
(gdb)
3.7.2. Executing GRMON commands from GDB
While GDB is attached to GRMON, most GRMON commands can be executed using the GDB monitor command.
Output from the GRMON commands is then displayed in the GDB console like below. Some DSU commands are
naturally not available since they would conflict with GDB. All commands executed from GDB are executed in a
separate Tcl interpreter, thus variables created from GDB will not be available from the GRMON terminal.
(gdb) monitor hist
TIME ADDRESS INSTRUCTIONS/AHB SIGNALS RESULT/DATA
30046975 40003e20 AHB read mst=0 size=2 [9de3bf90]
30046976 40005030 or %l2, 0x1e0, %o3 [40023de0]
30046980 40003e24 AHB read mst=0 size=2 [91d02001]
30046981 40005034 call 0x40003e20 [40005034]
30046985 40003e28 AHB read mst=0 size=2 [b136201f]
30046990 40003e2c AHB read mst=0 size=2 [f83fbff0]
30046995 40003e30 AHB read mst=0 size=2 [82040018]
30047000 40003e34 AHB read mst=0 size=2 [d11fbff0]
30047005 40003e38 AHB read mst=0 size=2 [9a100019]
30047010 40003e3c AHB read mst=0 size=2 [9610001a]
(gdb)
3.7.3. Running applications from GDB
To load and start an application, use the GDB load and run command.
$ sparc-rtems-gdb v8/stanford.exe
(gdb) target extended-remote :2222
Remote debugging using :2222
main () at stanford.c:1033
1033 {
(gdb) load
Loading section .text, size 0xdb30 lma 0x40000000
Loading section .data, size 0xb78 lma 0x4000db30
Start address 0x40000000, load size 59048
Transfer rate: 18 KB/sec, 757 bytes/write.
(gdb) b main
Breakpoint 1 at 0x40004074: file stanford.c, line 1033.
(gdb) run
The program being debugged has been started already.
Start it from the beginning? (y or n) y
Starting program: /home/daniel/examples/v8/stanford.exe
Breakpoint 1, main () at stanford.c:1033
1033 {
(gdb) list
1028 /* Printcomplex( 6, 99, z, 1, 256, 17 ); */
1029 };
1030 } /* oscar */ ;
1031
1032 main ()
1033 {
1034 int i;
1035 fixed = 0.0;
1036 floated = 0.0;
1037 printf ("Starting \n");
(gdb)
To interrupt execution, Ctrl-C can be typed in GDB terminal (similar to GRMON). The program can be restarted
using the GDB run command but the program image needs to be reloaded first using the load command. Software
trap 1 (TA 0x1) is used by GDB to insert breakpoints and should not be used by the application.
GRMON translates SPARC traps into (UNIX) signals which are properly communicated to GDB. If the application
encounters a fatal trap, execution will be stopped exactly before the failing instruction. The target memory and
register values can then be examined in GDB to determine the error cause.
GRMON implements the GDB breakpoint and watchpoint interface and makes sure that memory and cache are
synchronized.
GRMON3-UM
25 www.cobham.com/gaisler
June 2019, Version 3.1.0
Page 26

3.7.4. Running SMP applications from GDB
If GRMON is running on the same computer as GDB, or if the executable is available on the remote computer that is
running GRMON, it is recommended to issue the GDB command set remote exec-file <remote-file-path>. After
this has been set, GRMON will automatically load the file, and symbols if available, when the GDB command
run is issued.
$ sparc-rtems-gdb /opt/rtems-4.11/src/rtems-4.11/testsuites/libtests/ticker/ticker.exe
GNU gdb 6.8.0.20090916-cvs
Copyright (C) 2008 Free Software Foundation, Inc.
License GPLv3+: GNU GPL version 3 or later <http://gnu.org/licenses/gpl.html>
This is free software: you are free to change and redistribute it.
There is NO WARRANTY, to the extent permitted by law. Type "show copying"
and "show warranty" for details.
This GDB was configured as "--host=i686-pc-linux-gnu --target=sparc-rtems"...
(gdb) target extended-remote :2222
Remote debugging using :2222
0x00000000 in ?? ()
(gdb) set remote exec-file /opt/rtems-4.11/src/rtems-4.11/testsuites/libtests/ticker/ticker.exe
(gdb) break Init
Breakpoint 1 at 0x40001318: file ../../../../../leon3smp/lib/include/rtems/score/thread.h, line 627.
(gdb) run
The program being debugged has been started already.
Start it from the beginning? (y or n) y
Starting program: /opt/rtems-4.11/src/rtems-4.11/testsuites/libtests/ticker/ticker.exe
If the executable is not available on the remote computer where GRMON is running, then the GDB command
load can be used to load the software to the target system. In addition the entry points for all CPU's, except the
first, must be set manually using the GRMON ep before starting the application.
$ sparc-rtems-gdb /opt/rtems-4.11/src/rtems-4.11/testsuites/libtests/ticker/ticker.exe
GNU gdb 6.8.0.20090916-cvs
Copyright (C) 2008 Free Software Foundation, Inc.
License GPLv3+: GNU GPL version 3 or later <http://gnu.org/licenses/gpl.html>
This is free software: you are free to change and redistribute it.
There is NO WARRANTY, to the extent permitted by law. Type "show copying"
and "show warranty" for details.
This GDB was configured as "--host=i686-pc-linux-gnu --target=sparc-rtems"...
(gdb) target extended-remote :2222
Remote debugging using :2222
trap_table () at /opt/rtems-4.11/src/rtems-4.11/c/src/lib/libbsp/sparc/leon3/../../sparc/shared/start
/start.S:69
69 /opt/rtems-4.11/src/rtems-4.11/c/src/lib/libbsp/sparc/leon3/../../sparc/shared/start/start.S: No
such file or directory.
in /opt/rtems-4.11/src/rtems-4.11/c/src/lib/libbsp/sparc/leon3/../../sparc/shared/start/start.S
Current language: auto; currently asm
(gdb) load
Loading section .text, size 0x1aed0 lma 0x40000000
Loading section .data, size 0x5b0 lma 0x4001aed0
Start address 0x40000000, load size 111744
Transfer rate: 138 KB/sec, 765 bytes/write.
(gdb) mon ep $cpu::iu::pc cpu1
(gdb) mon ep $cpu::iu::pc cpu2
(gdb) mon ep $cpu::iu::pc cpu3
Cpu 1 entry point: 0x40000000
(gdb) run
The program being debugged has been started already.
Start it from the beginning? (y or n) y
Starting program: /opt/rtems-4.11/src/rtems-4.11/testsuites/libtests/ticker/ticker.exe
3.7.5. Running AMP applications from GDB
If GRMON is running on the same computer as GDB, or if the executables are available on the remote computer
that is running GRMON, it is recommended to issue the GDB command set remote exec-file <remote-file-path>.
When this is set, GRMON will automatically load the file,and symbols if available, when the GDB command run is
issued. The second application needs to be loaded into GRMON using the GRMON command load <remote-file-
path> cpu1. In addition the stacks must also be set manually in GRMON using the command stack <address>
cpu# for both CPUs.
$ sparc-rtems-gdb /opt/rtems-4.10/src/samples/rtems-mp1
GNU gdb 6.8.0.20090916-cvs
Copyright (C) 2008 Free Software Foundation, Inc.
License GPLv3+: GNU GPL version 3 or later <http://gnu.org/licenses/gpl.html>
This is free software: you are free to change and redistribute it.
There is NO WARRANTY, to the extent permitted by law. Type "show copying"
and "show warranty" for details.
This GDB was configured as "--host=i686-pc-linux-gnu --target=sparc-rtems"...
GRMON3-UM
June 2019, Version 3.1.0
26 www.cobham.com/gaisler
Page 27

(gdb) target extended-remote :2222
Remote debugging using :2222
(gdb) set remote exec-file /opt/rtems-4.10/src/samples/rtems-mp1
(gdb) mon stack 0x403fff00 cpu0
CPU 0 stack pointer: 0x403fff00
(gdb) mon load /opt/rtems-4.10/src/samples/rtems-mp2 cpu1
Total size: 177.33kB (1.17Mbit/s)
Entry point 0x40400000
Image /opt/rtems-4.10/src/samples/rtems-mp2 loaded
(gdb) mon stack 0x407fff00 cpu1
CPU 1 stack pointer: 0x407fff00
(gdb) run
Starting program: /opt/rtems-4.10/src/samples/rtems-mp1
NODE[0]: is Up!
NODE[0]: Waiting for Semaphore A to be created (0x53454d41)
NODE[0]: Waiting for Semaphore B to be created (0x53454d42)
NODE[0]: Waiting for Task A to be created (0x54534b41)
^C[New Thread 151060481]
Program received signal SIGINT, Interrupt.
[Switching to Thread 151060481]
pwdloop () at /opt/rtems-4.10/src/rtems-4.10/c/src/lib/libbsp/sparc/leon3/startup/bspidle.S:26
warning: Source file is more recent than executable.
26 retl
Current language: auto; currently asm
(gdb)
If the executable is not available on the remote computer where GRMON is running, then the GDB command file
and load can be used to load the software to the target system. Use the GRMON command cpu act <num> before
issuing the GDB command load to specify which CPU is the target for the software being loaded. In addition the
stacks must also be set manually in GRMON using the command stack <address> cpu# for both CPUs.
$ sparc-rtems-gdb
GNU gdb 6.8.0.20090916-cvs
Copyright (C) 2008 Free Software Foundation, Inc.
License GPLv3+: GNU GPL version 3 or later <http://gnu.org/licenses/gpl.html>
This is free software: you are free to change and redistribute it.
There is NO WARRANTY, to the extent permitted by law. Type "show copying"
and "show warranty" for details.
This GDB was configured as "--host=i686-pc-linux-gnu --target=sparc-rtems".
(gdb) target extended-remote :2222
Remote debugging using :2222
0x40000000 in ?? ()
(gdb) file /opt/rtems-4.10/src/samples/rtems-mp2
A program is being debugged already.
Are you sure you want to change the file? (y or n) y
Reading symbols from /opt/rtems-4.10/src/samples/rtems-mp2...done.
(gdb) mon cpu act 1
(gdb) load
Loading section .text, size 0x2b3e0 lma 0x40400000
Loading section .data, size 0x1170 lma 0x4042b3e0
Loading section .jcr, size 0x4 lma 0x4042c550
Start address 0x40400000, load size 181588
Transfer rate: 115 KB/sec, 759 bytes/write.
(gdb) file /opt/rtems-4.10/src/samples/rtems-mp1
A program is being debugged already.
Are you sure you want to change the file? (y or n) y
Load new symbol table from "/opt/rtems-4.10/src/samples/rtems-mp1"? (y or n) y
Reading symbols from /opt/rtems-4.10/src/samples/rtems-mp1...done.
(gdb) mon cpu act 0
(gdb) load
Loading section .text, size 0x2b3e0 lma 0x40001000
Loading section .data, size 0x1170 lma 0x4002c3e0
Loading section .jcr, size 0x4 lma 0x4002d550
Start address 0x40001000, load size 181588
Transfer rate: 117 KB/sec, 759 bytes/write.
(gdb) mon stack 0x407fff00 cpu1
CPU 1 stack pointer: 0x407fff00
(gdb) mon stack 0x403fff00 cpu0
CPU 0 stack pointer: 0x403fff00
(gdb) run
The program being debugged has been started already.
Start it from the beginning? (y or n) y
Starting program: /opt/rtems-4.10/src/samples/samples/rtems-mp1
3.7.6. GDB Thread support
GDB is capable of listing a operating system's threads, however it relies on GRMON to implement low-level
thread access. GDB normally fetches the threading information on every stop, for example after a breakpoint is
GRMON3-UM
June 2019, Version 3.1.0
27 www.cobham.com/gaisler
Page 28

reached or between single-stepping stops. GRMON have to access the memory rather many times to retrieve the
information, GRMON. See Section 3.8, “Thread support” for more information.
Start GRMON with the -nothreads switch to disable threads in GRMON and thus in GDB too.
Note that GRMON must have access to the symbol table of the operating system so that the thread structures of
the target OS can be found. The symbol table can be loaded from GDB by one must bear in mind that the path is
relative to where GRMON has been started. If GDB is connected to GRMON over the network one must make
the symbol file available on the remote computer running GRMON.
(gdb) mon puts [pwd]
/home/daniel
(gdb) pwd
Working directory /home/daniel.
(gdb) mon sym load /opt/rtems-4.10/src/samples/rtems-hello
(gdb) mon sym
0x00016910 GLOBAL FUNC imfs_dir_lseek
0x00021f00 GLOBAL OBJECT Device_drivers
0x0001c6b4 GLOBAL FUNC _mprec_log10
...
When a program running in GDB stops GRMON reports which thread it is in. The command info threads can be
used in GDB to list all known threads, thread N to switch to thread N and bt to list the backtrace of the selected
thread.
Program received signal SIGINT, Interrupt.
[Switching to Thread 167837703]
0x40001b5c in console_outbyte_polled (port=0, ch=113 `q`) at rtems/.../leon3/console/debugputs.c:38
38 while ((LEON3_Console_Uart[LEON3_Cpu_Index+port]->status & LEON_REG_UART_STATUS_THE) == 0);
(gdb) info threads
8 Thread 167837702 (FTPD Wevnt) 0x4002f760 in _Thread_Dispatch () at rtems/.../threaddispatch.c:109
7 Thread 167837701 (FTPa Wevnt) 0x4002f760 in _Thread_Dispatch () at rtems/.../threaddispatch.c:109
6 Thread 167837700 (DCtx Wevnt) 0x4002f760 in _Thread_Dispatch () at rtems/.../threaddispatch.c:109
5 Thread 167837699 (DCrx Wevnt) 0x4002f760 in _Thread_Dispatch () at rtems/.../threaddispatch.c:109
4 Thread 167837698 (ntwk ready) 0x4002f760 in _Thread_Dispatch () at rtems/.../threaddispatch.c:109
3 Thread 167837697 (UI1 ready) 0x4002f760 in _Thread_Dispatch () at rtems/.../threaddispatch.c:109
2 Thread 151060481 (Int. ready) 0x4002f760 in _Thread_Dispatch () at rtems/.../threaddispatch.c:109
* 1 Thread 167837703 (HTPD ready ) 0x40001b5c in console_outbyte_polled (port=0, ch=113 `q`)
at ../../../rtems/c/src/lib/libbsp/sparc/leon3/console/debugputs.c:38
(gdb) thread 8
[Switching to thread 8 (Thread 167837702)]#0 0x4002f760 in _Thread_Dispatch ()
at rtems/.../threaddispatch.c:109
109 _Context_Switch( &executing->Registers, &heir->Registers );
(gdb) bt
#0 0x4002f760 in _Thread_Dispatch () at rtems/cpukit/score/src/threaddispatch.c:109
#1 0x40013ee0 in rtems_event_receive(event_in=33554432, option_set=0, ticks=0, event_out=0x43fecc14)
at ../../../../leon3/lib/include/rtems/score/thread.inl:205
#2 0x4002782c in rtems_bsdnet_event_receive (event_in=33554432, option_set=2, ticks=0,
event_out=0x43fecc14) at rtems/cpukit/libnetworking/rtems/rtems_glue.c:641
#3 0x40027548 in soconnsleep (so=0x43f0cd70) at rtems/cpukit/libnetworking/rtems/rtems_glue.c:465
#4 0x40029118 in accept (s=3, name=0x43feccf0, namelen=0x43feccec) at rtems/.../rtems_syscall.c:215
#5 0x40004028 in daemon () at rtems/c/src/libnetworking/rtems_servers/ftpd.c:1925
#6 0x40053388 in _Thread_Handler () at rtems/cpukit/score/src/threadhandler.c:123
#7 0x40053270 in __res_mkquery (op=0, dname=0x0, class=0, type=0, data=0x0, datalen=0, newrr_in=0x0,
buf=0x0, buflen=0)
at ../rtems/cpukit/libnetworking/libc/res_mkquery.c:199
#8 0x00000008 in ?? ()
#9 0x00000008 in ?? ()
Previous frame identical to this frame (corrupt stack?)
In comparison to GRMON the frame command in GDB can be used to select a individual stack frame. One can
also step between frames by issuing the up or down commands. The CPU registers can be listed using the info
registers command. Note that the info registers command only can see the following registers for an inactive
task: g0-g7, l0-l7, i0-i7, o0-o7, PC and PSR. The other registers will be displayed as 0:
gdb) frame 5
#5 0x40004028 in daemon () at rtems/.../rtems_servers/ftpd.c:1925
1925 ss = accept(s, (struct sockaddr *)&addr, &addrLen);
(gdb) info reg
GRMON3-UM
28 www.cobham.com/gaisler
June 2019, Version 3.1.0
Page 29

g0 0x0 0
g1 0x0 0
g2 0xffffffff -1
g3 0x0 0
g4 0x0 0
g5 0x0 0
g6 0x0 0
g7 0x0 0
o0 0x3 3
o1 0x43feccf0 1140772080
o2 0x43feccec 1140772076
o3 0x0 0
o4 0xf34000e4 -213909276
o5 0x4007cc00 1074252800
sp 0x43fecc88 0x43fecc88
o7 0x40004020 1073758240
l0 0x4007ce88 1074253448
l1 0x4007ce88 1074253448
l2 0x400048fc 1073760508
l3 0x43feccf0 1140772080
l4 0x3 3
l5 0x1 1
l6 0x0 0
l7 0x0 0
i0 0x0 0
i1 0x40003f94 1073758100
i2 0x0 0
i3 0x43ffafc8 1140830152
i4 0x0 0
i5 0x4007cd40 1074253120
fp 0x43fecd08 0x43fecd08
i7 0x40053380 1074082688
y 0x0 0
psr 0xf34000e0 -213909280
wim 0x0 0
tbr 0x0 0
pc 0x40004028 0x40004028 <daemon+148>
npc 0x4000402c 0x4000402c <daemon+152>
fsr 0x0 0
csr 0x0 0
NOTE: It is not supported to set thread specific breakpoints. All breakpoints are global and stops the execution
of all threads. It is not possible to change the value of registers other than those of the current thread.
3.7.7. Virtual memory
There is no way for GRMON to determine if an address sent from GDB is physical or virtual. If an MMU unit is
present in the system and it is enabled, then GRMON will assume that all addresses are virtual and try to translate
them. When debugging an application that uses the MMU one typically have an image with physical addresses
used to load data into the memory and a second image with debug-symbols of virtual addresses. It is therefore
important to make sure that the MMU is enabled/disabled when each image is used.
The example below will show a typical case on how to handle virtual and physical addresses when debugging with
GDB. The application being debugged is Linux and it consists of two different images created with Linuxbuild.
The file image.ram contains physical addresses and a small loader, that among others configures the MMU,
while the file image contains all the debug-symbols in virtual address-space.
First start GRMON and start the GDB server.
$ grmon -nb -gdb
Then start GDB in a second shell, load both files into GDB, connect to GRMON and then upload the application
into the system. The addresses will be interpreted as physical since the MMU is disabled when GRMON starts.
$ sparc-linux-gdb
GNU gdb 6.8.0.20090916-cvs
Copyright (C) 2008 Free Software Foundation, Inc.
License GPLv3+: GNU GPL version 3 or later <http://gnu.org/licenses/gpl.html>
This is free software: you are free to change and redistribute it.
There is NO WARRANTY, to the extent permitted by law. Type "show copying"
and "show warranty" for details.
This GDB was configured as "--host=i686-pc-linux-gnu --target=sparc-linux".
(gdb) file output/images/image.ram
Reading symbols from /home/user/linuxbuild-1.0.2/output/images/image.ram...(no d
ebugging symbols found)...done.
GRMON3-UM
June 2019, Version 3.1.0
29 www.cobham.com/gaisler
Page 30

(gdb) symbol-file output/images/image
Reading symbols from /home/user/linuxbuild-1.0.2/output/images/image...done.
(gdb) target extended-remote :2222
Remote debugging using :2222
t_tflt () at /home/user/linuxbuild-1.0.2/linux/linux-2.6-git/arch/sparc/kernel/h
ead_32.S:88
88 t_tflt: SPARC_TFAULT /* Inst. Access Exception
*/
Current language: auto; currently asm
(gdb) load
Loading section .text, size 0x10b0 lma 0x40000000
Loading section .data, size 0x50 lma 0x400010b0
Loading section .vmlinux, size 0x3f1a60 lma 0x40004000
Loading section .startup_prom, size 0x7ee0 lma 0x403f5a60
Start address 0x40000000, load size 4172352
Transfer rate: 18 KB/sec, 765 bytes/write.
The program must reach a state where the MMU is enabled before any virtual address can be translated. Software
breakpoints cannot be used since the MMU is still disabled and GRMON won't translate them into a physical.
Hardware breakpoints don't need to be translated into physical addresses, therefore set a hardware assisted breakpoint at 0xf0004000, which is the virtual start address for the Linux kernel.
(gdb) hbreak *0xf0004000
Hardware assisted breakpoint 1 at 0xf0004000: file /home/user/linuxbuild-1.0.2/l
inux/linux-2.6-git/arch/sparc/kernel/head_32.S, line 87.
(gdb) cont
Continuing.
Breakpoint 1, trapbase_cpu0 () at /home/user/linuxbuild-1.0.2/linux/linux-2.6-gi
t/arch/sparc/kernel/head_32.S:87
87 t_zero: b gokernel; nop; nop; nop;
At this point the loader has enabled the MMU and both software breakpoints and symbols can be used.
(gdb) break leon_init_timers
Breakpoint 2 at 0xf03cff14: file /home/user/linuxbuild-1.0.2/linux/linux-2.6-git
/arch/sparc/kernel/leon_kernel.c, line 116.
(gdb) cont
Continuing.
Breakpoint 2, leon_init_timers (counter_fn=0xf00180c8 <timer_interrupt>)
at /home/user/linuxbuild-1.0.2/linux/linux-2.6-git/arch/sparc/kernel/leon_ke
rnel.c:116
116 leondebug_irq_disable = 0;
Current language: auto; currently c
(gdb) bt
#0 leon_init_timers (counter_fn=0xf00180c8 <timer_interrupt>)
at /home/user/linuxbuild-1.0.2/linux/linux-2.6-git/arch/sparc/kernel/leon_ke
rnel.c:116
#1 0xf03ce944 in time_init () at /home/user/linuxbuild-1.0.2/linux/linux-2.6-gi
t/arch/sparc/kernel/time_32.c:227
#2 0xf03cc13c in start_kernel () at /home/user/linuxbuild-1.0.2/linux/linux-2.6
-git/init/main.c:619
#3 0xf03cb804 in sun4c_continue_boot ()
#4 0xf03cb804 in sun4c_continue_boot ()
Backtrace stopped: previous frame identical to this frame (corrupt stack?)
(gdb) info locals
eirq = <value optimized out>
rootnp = <value optimized out>
np = <value optimized out>
pp = <value optimized out>
len = 13
ampopts = <value optimized out>
(gdb) print len
$2 = 13
If the application for some reason need to be reloaded, then the MMU must first be disabled via GRMON. In
addition all software breakpoints should be deleted before the application is restarted since the MMU has been
disabled and GRMON won't translate virtual addresses anymore.
(gdb) mon mmu mctrl 0
mctrl: 006E0000 ctx: 00000000 ctxptr: 40440800 fsr: 00000000 far: 00000000
(gdb) load
Loading section .text, size 0x10b0 lma 0x40000000
Loading section .data, size 0x50 lma 0x400010b0
Loading section .vmlinux, size 0x3f1a60 lma 0x40004000
Loading section .startup_prom, size 0x7ee0 lma 0x403f5a60
Start address 0x40000000, load size 4172352
Transfer rate: 18 KB/sec, 765 bytes/write.
GRMON3-UM
30 www.cobham.com/gaisler
June 2019, Version 3.1.0
Page 31

(gdb) delete
Delete all breakpoints? (y or n) y
(gdb) hbreak *0xf0004000
Hardware assisted breakpoint 3 at 0xf0004000: file /home/user/linuxbuild-1.0.2/l
inux/linux-2.6-git/arch/sparc/kernel/head_32.S, line 87.
(gdb) run
The program being debugged has been started already.
Start it from the beginning? (y or n) y
Starting program: /home/user/linuxbuild-1.0.2/output/images/image.ram
Breakpoint 3, trapbase_cpu0 () at /home/user/linuxbuild-1.0.2/linux/linux-2.6-gi
t/arch/sparc/kernel/head_32.S:87
87 t_zero: b gokernel; nop; nop; nop;
Current language: auto; currently asm
(gdb) break leon_init_timers
Breakpoint 4 at 0xf03cff14: file /home/user/linuxbuild-1.0.2/linux/linux-2.6-git
/arch/sparc/kernel/leon_kernel.c, line 116.
(gdb) cont
Continuing.
Breakpoint 4, leon_init_timers (counter_fn=0xf00180c8 <timer_interrupt>)
at /home/user/linuxbuild-1.0.2/linux/linux-2.6-git/arch/sparc/kernel/leon_ke
rnel.c:116
116 leondebug_irq_disable = 0;
Current language: auto; currently c
3.7.8. Specific GDB optimization
GRMON detects GDB access to register window frames in memory which are not yet flushed and only reside
in the processor register file. When such a memory location is read, GRMON will read the correct value from
the register file instead of the memory. This allows GDB to form a function trace-back without any (intrusive)
modification of memory. This feature is disabled during debugging of code where traps are disabled, since no
valid stack frame exist at that point.
3.7.9. GRMON GUI considerations
The Graphical User Interface of GRMON can be used in parallel with GDB C/C++ level debugging. More details
are described in Section 4.7, “C/C++ level debugging”.
3.7.10. Limitations of GDB interface
GDB must be built for the SPARC architecture, a native PC GDB does not work together with GRMON. The
toolchains that Cobham Gaisler distributes comes with a patched and tested version of GDB targeting all SPARC
LEON development tools.
Do not use the GDB where commands in parts of an application where traps are disabled (e.g.trap handlers). Since
the stack pointer is not valid at this point, GDB might go into an infinite loop trying to unwind false stack frames.
The thread support might not work either in some trap handler cases.
The step instruction commands si or stepi are implemented by GDB inserting software breakpoints through GRMON. This is an approach that is not possible when debugging in read-only memory such as boot sequences executed in PROM/FLASH. One can instead use hardware breakpoints using the GDB command hbreak manually.
3.8. Thread support
GRMON has thread support for the operating systems shown below. The thread information is accessed using the
GRMON thread command. The GDB interface of GRMON is also thread aware and the related GDB commands
are described in the GDB documentation and in Section 3.7.6, “GDB Thread support”.
Supported operating systems
• RTEMS
• VXWORKS
• eCos
• Bare-metal
GRMON needs the symbolic information of the image that is being debugged in order to retrieve the addresses
of the thread information. Therefore the symbols of the OS must be loaded automatically by the ELF-loader
GRMON3-UM
31 www.cobham.com/gaisler
June 2019, Version 3.1.0
Page 32

using load or manually by using the symbols command. GRMON will traverse the thread structures located in
the target's memory when the thread command is issued or when GDB requests thread information. Bare-metal
threads are used by default if no OS threads can be found. In addition the startup switch -bmthreads can be
used to force bare-metal threads.
The target's thread structures are never changed, and they are only accessed when the thread command is executed.
Starting GRMON with the -nothreads switch disables the thread support in GRMON and the GDB server.
During debugging sessions it can help the developer a lot to view all threads, their stack traces and their states to
understand what is happening in the system.
3.8.1. GRMON thread options
The following command-line options are available for selecting how GRMON3 will handle threads.
-nothreads
Disable thread support.
-bmthreads
Force bare-metal thread support
-rtems version
Set RTEMS version for thread support, where the required argument version is one of the following:
rtems-5.0
rtems-4.12
rtems-4.11
rtems-4.10
rtems-4.8
rtems-4.6
3.8.2. GRMON thread commands
thread info lists all threads currently available in the operating system. The currently running thread is marked
with an asterisk.
grmon> thread info
Name | Type | Id | Prio | Ticks | Entry point | PC | State
------------------------------------------------------------------------------------------------ Int. | internal | 0x09010001 | 255 | 138 | _CPU_Thread_Idle_body | 0x4002f760 | READY
------------------------------------------------------------------------------------------------ UI1 | classic | 0x0a010001 | 120 | 290 | Init | 0x4002f760 | READY
------------------------------------------------------------------------------------------------ ntwk | classic | 0x0a010002 | 100 | 11 | rtems_bsdnet_schedneti | 0x4002f760 | READY
------------------------------------------------------------------------------------------------ DCrx | classic | 0x0a010003 | 100 | 2 | rtems_bsdnet_schedneti | 0x4002f760 | Wevnt
------------------------------------------------------------------------------------------------ DCtx | classic | 0x0a010004 | 100 | 4 | rtems_bsdnet_schedneti | 0x4002f760 | Wevnt
------------------------------------------------------------------------------------------------ FTPa | classic | 0x0a010005 | 10 | 1 | split_command | 0x4002f760 | Wevnt
------------------------------------------------------------------------------------------------ FTPD | classic | 0x0a010006 | 10 | 1 | split_command | 0x4002f760 | Wevnt
------------------------------------------------------------------------------------------------* HTPD | classic | 0x0a010007 | 40 | 79 | rtems_initialize_webse | 0x40001b60 | READY
-------------------------------------------------------------------------------------------------
thread bt ?id? lists the stack backtrace. bt lists the backtrace of the currently executing thread as usual.
grmon> thread bt 0x0a010003
%pc
#0 0x4002f760 _Thread_Dispatch + 0x11c
#1 0x40013ed8 rtems_event_receive + 0x88
#2 0x40027824 rtems_bsdnet_event_receive + 0x18
#3 0x4000b664 websFooter + 0x484
#4 0x40027708 rtems_bsdnet_schednetisr + 0x158
A backtrace of the current thread (equivalent to the bt command):
grmon> thread bt 0x0a010007
%pc %sp
#0 0x40001b60 0x43fea130 console_outbyte_polled + 0x34
GRMON3-UM
32 www.cobham.com/gaisler
June 2019, Version 3.1.0
Page 33

#1 0x400017fc 0x43fea130 console_write_support + 0x18
#2 0x4002dde8 0x43fea198 rtems_termios_puts + 0x128
#3 0x4002df60 0x43fea200 rtems_termios_puts + 0x2a0
#4 0x4002dfe8 0x43fea270 rtems_termios_write + 0x70
#5 0x400180a4 0x43fea2d8 rtems_io_write + 0x48
#6 0x4004eb98 0x43fea340 device_write + 0x2c
#7 0x40036ee4 0x43fea3c0 write + 0x90
#8 0x4001118c 0x43fea428 trace + 0x38
#9 0x4000518c 0x43fea498 websOpenListen + 0x108
#10 0x40004fb4 0x43fea500 websOpenServer + 0xc0
#11 0x40004b0c 0x43fea578 rtems_initialize_webserver + 0x204
#12 0x40004978 0x43fea770 rtems_initialize_webserver + 0x70
#13 0x40053380 0x43fea7d8 _Thread_Handler + 0x10c
#14 0x40053268 0x43fea840 __res_mkquery + 0x2c8
3.9. Forwarding application console I/O
If GRMON is started with -u [N] (N defaults to zero - the first UART), the LEON UART[N] is placed in
FIFO debug mode or in loop-back mode. Debug mode was added in GRLIB 1.0.17-b2710 and is reported by info
sys in GRMON as "DSU mode (FIFO debug)", older hardware is still supported using loop-back mode. In both
modes flow-control is enabled. Both in loop-back mode and in FIFO debug mode the UART is polled regularly
by GRMON during execution of an application and all console output is printed on the GRMON console. When
-u is used there is no point in connecting a separate terminal to UART1.
In addition it is possible to enable or disable UART forwarding using the command forward. Optionally it is also
possible to forward the I/O to a custom TCL channel using this command.
With FIFO debug mode it is also possible to enter text in GRMON which is inserted into the UART receive
FIFO. These insertions will trigger interrupts if receiver FIFO interrupts are enabled. This makes it possible to use
GRMON as a terminal when running an interrupt-driven O/S such as Linux or VxWorks.
The following restrictions must be met by the application to support either loop-back mode or FIFO debug mode:
1. The UART control register must not be modified such that neither loop-back nor FIFO debug mode is
disabled
2. In loop-back mode the UART data register must not be read
This means that -u cannot be used with PROM images created by MKPROM. Also loop-back mode can not be
used in kernels using interrupt driven UART consoles (e.g. Linux, VxWorks).
NOTE: RXVT must be disabled for debug mode to work in a MSYS console on Windows. This can be done
by deleting or renaming the file rxvt.exe inside the bin directory, e.g., C:\msys\1.0\bin. Starting with
MSYS-1.0.11 this will be the default.
3.9.1. UART debug mode
When the application is running with UART debug mode enabled the following key sequences will be available.
The sequences can be used to adjust the input to what the target system expects. For a key sequence to take effect,
both key presses must be pressed within 1.5 seconds of each other. Otherwise, they will be forwarded as is.
Table 3.3. Uart control sequences
Key sequence Action
Ctrl+A B Toggle delete to backspace conversion
Ctrl+A C Send break (Ctrl+C) to the running application
Ctrl+A D Toggle backspace to delete conversion
Ctrl+A E Toggle local echo on/off
Ctrl+A H Show a help message
Ctrl+A N Enable/disable newline insertion on carriage return
Ctrl+A S Show current settings
Ctrl+A Z Send suspend (Ctrl+Z) to the running application
Ctrl+A Ctrl+A Send a single Ctrl+A to the running application
GRMON3-UM
June 2019, Version 3.1.0
33 www.cobham.com/gaisler
Page 34

3.10. EDAC protection
3.10.1. Using EDAC protected memory
Some LEON Fault-Tolerant (FT) systems use EDAC protected memory. To enable the memory EDAC during execution, GRMON should be started with the -edac switch. Before any application is loaded, the wash command
might be issued to write all RAM memory locations and thereby initialize the EDAC check-sums. If a LEON CPU
is present in the system GRMON will instruct the CPU to clear memory, clearing memory on a CPU-less system
over a slow debug-link can be very time consuming.
$ grmon -edac
...
grmon3> wash
40000000 8.0MB / 8.0MB [===============>] 100%
60000000 256.0MB / 256.0MB [===============>] 100%
Finished washing!
By default wash writes to all EDAC protected writable memory (SRAM, SDRAM, DDR, etc.) areas which has
been detected or forced with a command line switch. start and stop parameters can also be given to wash a range.
Washing memory with EDAC disabled will not generate check bits, however it can be used to clear or set a memory
region even if the memory controller does not implement EDAC.
grmon3> wash 0x40000000 0x41000000
40000000 16.0MB / 16.0MB [===============>] 100%
Finished washing!
If the memory controller has support for EDAC with 8-bit wide SRAM memory, the upper part of the memory
will consist of check bits. In this case the wash will only write to the data area (the check bits will automatically
be written by the memory controller). The amount of memory written will be displayed in GRMON.
GRMON will not automatically write the check bits for flash PROMs. For 8-bit flash PROMs, the check bits can
be generated by the mkprom2 utility and included in the image. But for 32-bit flash PROMs the check bits must
be written by the user via the TCB field in MCFG3.
3.10.2. LEON3-FT error injection
All RAM blocks (cache and register-file memory) in LEON3-FT are Single Event Upset (SEU) protected. Error
injection function emulates SEU in LEON3-FT memory blocks and lets the user test the fault-tolerant operation of
LEON3-FT by inserting random bit errors in LEON3-FT memory blocks during program execution. An injected
error flips a randomly chosen memory bit in one of the memory blocks, effectively emulating a SEU. The user
defines error rate and can choose between two error distribution modes:
1. Uniform error distribution mode. The 'ei un NR T' command instructs GRMON to insert NR errors during
the time period of T minutes. After T minutes has expired no more errors are inserted, but the application
will continue its execution.
2. Average error rate mode. With the 'ei av R' command the user selects at which rate errors are injected.
Average error rate is R errors per second. Randomly generated noise is added to every error injection sample.
The time between two samples vary between zero up to two periods depending on the noise, where one
period is 1/R seconds. Errors are inserted during the whole program execution.
GRMON can also perform error correction monitoring and report error injection statistics including number of
detected and injected errors and error coverage, see ei command reference.
Error injection is performed during the run-loop of GRMON, to improve the performance and accuracy other
services in the run-loop should be disabled. For example profiling and UART tunneling should be disabled, and
one should select the fastest debug-link.
grmon> load rtems-tasks
40000000, .text 113.9kB / 113.9kB [===============>] 100%
4001c7a0, .data 2.7kB / 2.7kB [===============>] 100%
Total size: 116.56kB (786.00kbit/s)
Entry point 0x40000000
Image /home/daniel/examples/v8/stanford.exe loaded
grmon> ei un 100 1
Error injection enabled
100 errors will be injected during 1.0 min
GRMON3-UM
June 2019, Version 3.1.0
34 www.cobham.com/gaisler
Page 35

grmon> ei stat en
Error injection statistics enabled
grmon> run
...
grmon> ei stat
itag : 5/ 5 (100.0%) idata: 5/ 18 ( 27.8%)
dtag : 1/ 1 (100.0%) ddata: 4/ 22 ( 18.2%)
IU RF : 4/ 10 ( 25.0%)
FPU RF: 0/ 4 ( 0.0%)
Total : 19/ 60 ( 31.7%)
grmon>
NOTE: The real time elapsed is always greater than LEON CPU experienced since the LEON is stopped during
error injection. Times and rates given to GRMON are relative the experienced time of the LEON. The time the
LEON is stopped is taken into account by GRMON, however minor differences is to be expected.
3.11. FLASH programming
3.11.1. CFI compatible Flash PROM
GRMON supports programming of CFI compatible flash PROMs attached to the external memory bus, through the
flash command. Flash programming is only supported if the target system contains one of the following memory
controllers MCTRL, FTMCTRL, FTSRCTRL or SSRCTRL. The PROM bus width can be 8-, 16- or 32-bit. It is
imperative that the PROM width in the MCFG1 register correctly reflects the width of the external PROM.
To program 8-bit and 16-bit PROMs, GRMON must be able to do byte (or half-word) accesses to the target system.
To support this either connect with a JTAG debug link or have at least one working SRAM/SDRAM bank and
a CPU available in the target system.
Programming the EDAC checkbits for 8- or 32-bit PROMs is also supported. GRMON will automatically program
the checkbits if EDAC is enabled. EDAC can be enabled by the -edac commandline option, using the mcfg3
command or setting the register bit via the TCL variable mctrl#::mcfg3::pe. When programming 32-bit
EDAC checkbits it is required that no other AHB master is accessing the memory. Other masters can for example
be DMA or Spacewire RMAP accesses. When programming 8-bit EDAC checkbits, GRMON will ignore any data
that should have been written to the EDAC area of the memory.
There are many different suppliers of CFI devices, and some implements their own command set. The command
set is specified by the CFI query register 14 (MSB) and 13 (LSB). The value for these register can in most cases
be found in the datasheet of the CFI device. GRMON supports the command sets that are listed in Table 3.4,
“Supported CFI command set”.
Table 3.4. Supported CFI command set
Q13 Q14 Description
0x01 0x00 Intel/Sharp Extended Command Set
0x02 0x00 AMD/Fujitsu Standard Command Set
0x03 0x00 Intel Standard Command Set
0x00 0x02 Intel Performance Code Command
Some flash chips provides lock protection to prevent the flash from being accidentally written. The user is required
to actively lock and unlock the flash. Note that the memory controller can disable all write cycles to the flash also,
however GRMON automatically enables PROM write access before the flash is accessed.
The flash device configuration is auto-detected, the information is printed out like in the example below. One can
verify the configuration so that the auto-detection is correct if problems are experienced. The block lock status (if
implement by the flash chip) can be viewed like in the following example:
grmon3> flash
Manuf. : Intel
Device : MT28F640J3
GRMON3-UM
35 www.cobham.com/gaisler
June 2019, Version 3.1.0
Page 36

Device ID : 09169e01734a9981
User ID : ffffffffffffffff
1 x 8 Mbytes = 8 Mbytes total @ 0x00000000
CFI information
Flash family : 1
Flash size : 64 Mbit
Erase regions : 1
Erase blocks : 64
Write buffer : 32 bytes
Lock-down : Not supported
Region 0 : 64 blocks of 128 kbytes
grmon3> flash status
Block lock status: U = Unlocked; L = Locked; D = Locked-down
Block 0 @ 0x00000000 : L
Block 1 @ 0x00020000 : L
Block 2 @ 0x00040000 : L
Block 3 @ 0x00060000 : L
...
Block 60 @ 0x00780000 : L
Block 61 @ 0x007a0000 : L
Block 62 @ 0x007c0000 : L
Block 63 @ 0x007e0000 : L
A typical command sequence to erase and re-program a flash memory could be:
grmon3> flash unlock all
Unlock complete
grmon3> flash erase all
Erase in progress
Block @ 0x007e0000 : code = 0x80 OK
Erase complete
grmon3> flash load rom_image.prom
...
grmon3> flash lock all
Lock complete
3.11.2. SPI memory device
GRMON supports programming of SPI memory devices that are attached to a SPICTRL or SPIMCTRL core. The
flash programming commands are available through the cores' debug drivers. A SPI flash connected to the SPICTRL controller is programmed using 'spi flash', for SPIMCTRL connected devices the 'spim flash' command
is used instead. See the command reference for respective command for the complete syntax, below are some
typical use cases exemplified.
When interacting with a memory device via SPICTRL the driver assumes that the clock scaler settings have been
initialized to attain a frequency that is suitable for the memory device. When interacting with a memory device via
SPIMCTRL all commands are issued with the normal scaler setting unless the alternate scaler has been enabled.
A command sequence to save the original first 32 bytes of data before erasing and programming the SPI memory
device connected via SPICTRL could be:
spi set div16
spi flash select 1
spi flash dump 0 32 32bytes.srec
spi flash erase
spi flash load romfs.elf
The first command initializes the SPICTRL clock scaler. The second command selects a SPI memory device
configuration and the third command dumps the first 32 bytes of the memory device to the file 32bytes.srec.
The fourth command erases all blocks of the SPI flash. The last command loads the ELF-file romfs.elf into
the device, the addresses are determined by the ELF-file section address.
Below is a command sequence to dump the data of a SPI memory device connected via SPIMCTRL. The first command tries to auto-detect the type of memory device. If auto-detection is successful GRMON will report the device
selected. The second command dumps the first 128 bytes of the memory device to the file 128bytes.srec.
spim flash detect
spim flash dump 0 128 128bytes.srec
GRMON3-UM
June 2019, Version 3.1.0
36 www.cobham.com/gaisler
Page 37

3.12. Automated operation
GRMON can be used to perform automated non-interactive tasks. Some examples are:
• Test suite execution and checking
• Stand-alone memory test with scripted access patterns
• Generate SpaceWire or Ethernet traffic
• Peripheral register access during hardware bring-up without involving a CPU
• Evaluate how a large set of compiler option permutations affect application performance
3.12.1. Tcl commanding during CPU execution
In many situations it is necessary to execute GRMON Tcl commands at the same time as the processor is executing.
For example to monitor a specific register or a memory region of interest. Another use case is to change system
state independent of the processor, such as error injection.
When the target executes, the GRMON terminal is assigned to the target system console and is thus not available
for GRMON shell input. Furthermore, commands such as run and cont return to the user first when execution has
completed, which could be never for a non-behaving program.
Three different methods for executing Tcl commands during target execution are described below:
• Spawn one or more user Tcl shells. The user shells run in their own thread independent of the shell controlling
CPU execution. This is done with the usrsh command.
• Detach GRMON from the target. This means that the application continues running with GRMON no longer
having control over the execution. This is done with the detach and attach commands.
3.12.2. Communication channel between target and monitor
A communication channel between GRMON and the target can be created by sharing memory. Use cases include
when a target produces log or trace data in memory at run-time which is continuously consumed by GRMON
reading out the the data over the debug link. For this to work safely without the need to stop execution, some
arbitration over the data has to be implemented, such as a wait-free software FIFO.
As an example, the target processors could produce log entries into dedicated memory buffers which are monitored
by an exec hook. When new data is available for the consumer, the exec hook schedules an asynchronous bus read
with amem to fetch all new data. When the asynchronous bus read has finished, the exec hook acknowledges that
the data has been consumed so that the buffer can be reused for more produce data. One benefit of using amem is
that multiple buffers can be defined and fetched simultaneously independent of each other.
3.12.3. Test suite driver
GRMON can be used with a driver script for automatic execution of a test suite consisting of self-checking LEON
applications. For this purpose a script is created which contains multiple load and run commands followed by
system state checking at end of each target execution. State checking could by implemented by checking an application return value in a CPU register using the reg command. In case an anomaly is detected by the driver script,
the system state is dumped with commands such as reg, bt, inst and ahb for later inspection. All command output
is written to a log file specified with the GRMON command line option -log. It is also useful to implement a
time-out mechanism in an exec hook to mitigate against non-terminating applications.
The example below shows a simple test suite driver which uses some of the techniques described in this section
to test the applications named test000.elf, test001.elf and test002.elf. It can be run by issuing
$ grmon <debuglink> -u -c testsuite.tcl -log testsuite.log
$ grep FAIL testsuite.log
in the host OS shell. Target state will be dumped in the log file testsuite.log for each test case which returns
nonzero or crashes.
Example 3.1. Test suite driver example
# This is testsuite.tcl
set nfail 0
GRMON3-UM
37 www.cobham.com/gaisler
June 2019, Version 3.1.0
Page 38

proc dumpstate {} {
bt; thread info; reg; inst 256; ahb 256; info reg
}
proc testprog {tname} {
global nfail
puts "### TEST $tname BEGIN"
load $tname
set tstart [clock seconds]
set results [run]
set tend [clock seconds]
puts [format "### Test executed %d seconds" [expr $tend - $tstart]]
set exec_ok 0
foreach result $results {
if {$result == "SIGTERM"} {
set exec_ok 1
}
}
if {$exec_ok == 1} {
puts "### PASS: $tname"
} else {
incr nfail 1
puts "### FAIL: $tname ($results)"
dumpstate
}
puts "### TEST $tname END"
}
proc printsummary {} {
global nfail
if {0 == $nfail} {
puts "### SUMMARY: ALL TESTS PASSED"
} else {
puts "### SUMMARY: $nfail TEST(S) FAILED"
}
}
after 2000
testprog test000.elf
testprog test001.elf
testprog test002.elf
printsummary
exit
GRMON3-UM
June 2019, Version 3.1.0
38 www.cobham.com/gaisler
Page 39

4. Graphical user interface
This chapter describes how to operate the Grapical User Interface (GUI) introduced with GRMON3.
4.1. Overview
The GUI provides the user with a fully interactive environment with the possibility to monitor and control different
parts of the system in parallel. All functionality of the GRMON Tcl command line interface are accessible from
the terminal emulator view.
GRMON visualises hardware state by views includes the following functions:
• Debug-link and system configuration dialog
• Multi-core LEON and OS threads execution status and backtrace view
• Disassembly view with symbol information
• Memory, CPU register and I/O register inspection and edit views
• Optimized SPARC/LEON IU register view
• Basic execution control such as single-stepping, continuing, breaking
• Application launch dialog
• Tcl terminal views with history, tab-completion, etc.
• Application terminals via UART forwarding
• GRLIB SOC system hardware overview
Users which are already familiar with the GRMON CLI can use the GUI as a drop-in replacement with the added
interactive functionality.
Figure 4.1. The GRMON graphical user interface
4.2. Starting GRMON GUI
GRMON is started by executing the same grmon or grmon.exe binary as the CLI version. The switches described
in Section 3.2.3, “General options” determine the start-up operation.
If GRMON is started without any debug link command line options, then GRMON will start the GUI and open a
dialog window which allows for selecting debug link. This is described in Section 4.3, “Connect to target”.
GRMON3-UM
June 2019, Version 3.1.0
39 www.cobham.com/gaisler
Page 40

$ grmon
GRMON can optionally be started with the -gui option which will skip the dialog for selecting debug link. In this
case the GUI will start and the connection will be done according to the full command line, which must specify
a debug-link. Below is an example of starting the GUI and connecting to a LEON system using the FTDI USB
serial interface:
$ grmon -gui -ftdi
It is also possible to start the GUI from the command line interface by issuing the gui command. This is useful if
GRMON is first operated as a command line tool but the user selects to continue debugging using the graphical
represenation of the system. The on-going debug session and hardware state will not be altered but can be operated
and inspected from the GUI.
4.3. Connect to target
The System Configurations dialog is used to connect to the target system. It allows for selecting the debug link
and parameters which system initialization. See Figure 4.2.
The System Configurations is split into several tabs which group related settings. Here follows a brief summary
of each tab. Please browse the tabs to discover relevant settings.
• Debug Link - Choose debug link and set parameters
• System - Options related to initializations performed by GRMON when connecting to the target
• Operation - Controls how GRMON interacts with the target after connect
• Memory - Options related to memory controllers
• Misc - Driver specific options which need to be determined at connect
• GUI - Options related to how the GUI views are synchronized with the current target state
Figure 4.2. System Configurations dialog. The Debug Link tab is selected and Advanced Parameters are
displayed.
4.3.1. Debug link
The debug link to use is selected in the Choose debug link drop down menu in the Debug Link tab. as illustrated
in Figure 4.2. When a debug link has been selected, parameters specific for that debug link are displayed.
GRMON3-UM
June 2019, Version 3.1.0
40 www.cobham.com/gaisler
Page 41

All debug links supported by GRMON3 are displayed in the drop down menu, including those which may not be
available on the host and target system. For more information on the GRMON3 debug links and their individual
options, see Chapter 5, Debug link.
4.3.2. Options
The options presented in System Configurations are equivalent to the command-line options available in GRMON3
CLI. Clicking on the "?" icon next to an option will open the option specific documentation. Target initialization
and system related options can be activated in the different tabs of the connection dialog. This is done by clicking
on the button to the left of the parameter name, or on the name itself. A selected parameter is marked with a button
with an "X" and a different background color.
Figure 4.3. A selected parameter
Figure 4.4. A non-selected parameter
The most common GRMON options are always displayed in the respective tab. More GRMON options can be
displayed by clicking the Show Advanced Parameters... button.
4.3.3. Argument contribution
When a parameter or settings is selected, the corresponding command line argument is shown in the Argument
contribution box. All selected parameters and settings from the current tab is shown in the box. Switching tabs
will show different argument contributions.
Note that the debug link always contributes with an argument to the Argument contribution box. For example
choosing the USB debug link will add the argument -usb.
4.3.4. Configurations
Multiple system configurations can be used and managed in the connection dialog. This is useful for example when
the same host is used to connect to many different target systems. Another use case for the system configurations
is as a convenient way for connecting to the same target, but with different initialization options.
To create a new System Configuration, either click the new configuration button , or clone the current configuration by clicking the copy button . Delete a configuration using the delete button . These options are also
available from the context menu of the configuration in the listing on the left of the dialog.
When a configuration is modified, the two buttons Revert and Apply become enabled. Pressing the Apply button
stores the configuration, and Revert will undo any changes since last storage.
4.3.5. Connect
When the System Configuration is done, press the Connect to system button.
4.4. Launch configurations
A Launch configuration is a combination of application images and custom system preparations for images. In
its most basic form a launch configuration consists of a single application image selected by the user which is
loaded and started.
GRMON3-UM
June 2019, Version 3.1.0
41 www.cobham.com/gaisler
Page 42

4.4.1. Target image setup
Once connected to a system, an image can be uploaded to the system. To setup the image and related settings,
click the Target Image Configuration button in the main tool bar, or in the main menu under File > Launch
Target Image...
Figure 4.5. The Target Image Configuration dialog
A Target Image Launch Configuration consists of one or several application images which are associated to different CPUs. There are three different types of image launch configurations:
• Single Core Image Launch
• SMP Target Image Launch
• AMP Target Image Launch
An Single Core Target Image Launch also provides a simple interface to setup the application. This image launch
type is appropriate for applications that will use a single core. In the Single Core Target Image Launch, properties
are always assigned to the first cpu.
An SMP Target Image Launch provides an interface to setup the application for multiple cores. This image launch
type is appropriate for applications based on an SMP operating system, such as RTEMS SMP or VxWorks SMP.
In the SMP Target Image Launch, properties are always assigned to all CPUs.
In an AMP Target Image Launch, the user has full flexibility to assign launch properties for each CPU. This is
useful when different operating system instances are executed on different processors or sets of processors.
CPUs are added or removed by the user to match the target system. Each setting has a value and some of them can
be individually associated with one or more CPUs. For instance a breakpoint and symbol file might be associated
with CPU1, but not CPU2.
GRMON3-UM
June 2019, Version 3.1.0
42 www.cobham.com/gaisler
Page 43

Associate a setting with a CPU by clicking the cell that intersect the setting and the CPU and tick the check box.
Untick the check-box to reverse the association. Some settings can occur more than one time for the same CPU (i.e.
Symbol file), meaning that several symbol files can be supplied. If an incompatible or unsupported combination
of settings is associated to a CPU, then the background of the cells for the settings are set to bright red.
To edit the value of a setting click the cell in the Value column. Different settings are edited in different ways. If
the cell after clicking it shows a button with "...", this button opens a dialog to change the value. For example the
Image setting is edited by choosing a file from a dialog.
If any of the settings are invalid, then the dialog shows an error message at the top, and the button Launch Target
Image are disabled. Once the invalid settings are corrected, the button becomes enabled and the Target Image
can be launched.
A Target Image Configuration can be launched automatically at connect to the system. This can be selected in the
System configuration dialog option named Launch Target Image Configuration when connected.
4.4.2. Launch properties
A simple launch configuration typicaly consists of only the Image and Run Mode properties. Additional properties
can be added as required. The following list describes all available properties.
Properties:
Image
File name of an image file to load. More than one image can be added and each image can be assigned
to any number of CPUs.
Command: load
Verify Image
Verify each image after load to memory. The property is not CPU specific. Only one Verify Image property
can be specified.
Command: verify
Symbol file
File name of a symbol file to load. The symbols will be loaded into GRMON but no content from the file
will be loaded into the target memory. More than one image can be added and each image can be assigned
to any number of CPUs.
Command: symbols
Run Mode
• Run - Reset GRMON drivers and start the execution from the beginning of the application.
• Go - Start the execution from the beginning of the application with the current system CPU state.
At most one Run Mode can be specified. The recommended mode is Run for most applications. Go is useful
when the application itself is initilizing the target, such as a boot loader. The property is not CPU specific.
Note that it is also possible to omit the Run Mode property. In that case, the application could be started
with the run command in a shell.
Command: run, go
Break at Application
Inserts a breakpoint at application start. The breakpoint location is OS dependent, for example main() in a
bare-metal application and Init() in an RTEMS application. At most one Break at Application property
can be specified.
Command: bp
Break at Entry
Inserts a breakpoint at the entry point of the loaded image. At most one Break at Application property can
be specified.
GRMON3-UM
June 2019, Version 3.1.0
43 www.cobham.com/gaisler
Page 44

Command: bp
Breakpoint
Inserts a software (soft) breakpoint. The Value field can be either an address or a symbol name. More than
one soft breakpoints can be added and each can be assigned to any number of CPUs.
Command: bp soft
HW Breakpoint
Inserts a hardware (hard) breakpoint. The Value field can be either an address or a symbol name. More than
one hard breakpoints can be added and each can be assigned to any number of CPUs. Note that the number
of available hardware breakpoints is target specific.
Command: bp hard
R/W Watchpoint, Read Watchpoint, Write Watchpoint
Inserts a read/write, read or write hardware watchpoint. The Value field can be either an address or a symbol
name. More than one hard breakpoints can be added and each can be assigned to any number of CPUs.
Command: bp watch
Command: bp watch -read
Command: bp watch -write
Wash Memory
Clear all or part of memory before loading images. Multiple ranges can be defined by adding more Wash
Memory properties. The property is not CPU specific.
Command: wash
Stack Pointer, Entrypoint
Override stack pointer or entry point setting. An address or symbol can be specified. At most one stack
pointer per CPU can be assigned. At most one entry point per CPU can be assigned.
Command: stack
Command: ep
4.5. Views
GRMON3 GUI provides different views for displaying and managing the target system state. Some views are
derived from the Eclipse framework, such as the Memory View and the Disassembly View. Other views are customized for GRLIB/LEON systems and will be described in this section.
4.5.1. CPU Registers View
The CPU Registers view shows a selection of the CPU registers in a fixed and compact format. Which CPU
registers are shown for, depends on what CPU is relevant for the selected context in the Debug view.
Values are retrieved for the registers in two situation; either the register values is changed by a known mechanism
such as editing the value, or when the CPU execution is suspended. Values that have changed since last retrieval
are highlighted with a yellow background.
GRMON3-UM
June 2019, Version 3.1.0
44 www.cobham.com/gaisler
Page 45

Figure 4.6. The cpu registers view
4.5.1.1. Pinning
The CPU Registers view can be pinned to a context. When the view is pinned it continues to show registers for
the same context even when the selection changes in the debug view. The view then shows the pinned CPU name
in the top of the view, e.g. “cpu0”.
4.5.1.2. Context menu
Right click on any register value in the view to show the context menu (not relevant for the disassembly). If the
text in the register value box is a valid hexadecimal value the two commands >>Open address in Memory view<<
and >>Show disassembly at address<< will be available.
Open address in Memory view
Shows the Memory view and adds a memory monitor at the selected register value used as an address. The user
must select the visualization, e.g. “Hex Integer”.
Show disassembly at address
If no disassembly editors are open one will be opened, otherwise any opened will be used. The editor will focus
on the selected register value used as an address.
4.5.2. IO Registers View
The IO Registers view allows users to inspect and modify I/O registers of AMBA devices available on the target
hardware. Individual registers may be expanded into bit-fields which are presented as bit-masks or numbers. It
functions much like the Eclipse Registers view, but is optimized for GRLIB SoC systems.
Registers are grouped under the AMBA device it belongs to. A device may have registers from both APB and
AHB I/O space. The view presents the same information as the info CLI command.
The register view adapts to the register information available in GRMON. Users can add registers and bit-field
declarations for custom IP-cores by means of Tcl drivers as described in Appendix C, Tcl API. Registers unknown
to GRMON will not appear in the view.
GRMON3-UM
June 2019, Version 3.1.0
45 www.cobham.com/gaisler
Page 46

Figure 4.7. The I/O registers view
Register values that are changed since last update are highlighted with yellow. When expanding the register nodes
in the tree of the view, the left column is auto expanded to fit the content.
For bit registers consisting of only one bit, a flag, the value can be toggled by clicking the value, and then checking
or un-checking the check-box.
By default the most common registers are presented in the view. However all registers known to GRMON may
be presented by pressing the icon on the right top corner. Note that doing so may change the state of the hardware
since reading certain registers may affect the state of the hardware.
Values for registers are retrieved only when they are to be shown in the view. Unless another view or operation
requires the values of the registers to be loaded, the values are not retrieved until they are visible in the view.
The register values are updated from the target hardware because of a few different reason.
• Edit - when the value of a register changes as result of an edit
• Suspend - when a process is suspended, the visible registers are updated
• Refresh - the values can be re-fetched from the target hardware by pressing the refresh button, or by using
the periodic refresh.
NOTE:Note that changed values will not be highlighted if the register values are update via refresh, either by
clicking the refresh button or by periodic refreshes.
Click the arrow down icon in the toolbar to access the view pull down menu. Under the Layout item are different
options on how to customize the appearance of the view. For instance can which columns to display be specified
under Select Columns....
Figure 4.8. The I/O registers menu
GRMON3-UM
June 2019, Version 3.1.0
46 www.cobham.com/gaisler
Page 47

4.5.3. System Information View
This view shows a system overview with information about the IP-cores. The cores are listed with name, vendor,
function, bus connection, address range when relevant and the driver info available.
The information shown is retrieved by GRMON from the system. If any changes are expected in the available
IP-cores, or their related information, all the information can be retrieved anew from the system by pressing the
Refresh button.
As default, the view shows only basic information for the IP-cores. Press the Show Details button in the toolbar
to toggle between showing basic and all information.
Figure 4.9. The sytem informaion view
4.5.4. Terminals View
Terminals can be opened to interact with GRMON or to display the output from an application on the target system.
Figure 4.10. The terminals view showing a GRMON terminal
GRMON3-UM
June 2019, Version 3.1.0
47 www.cobham.com/gaisler
Page 48

Opening a new terminal
To open a new terminal tab to either GRMON or an application on the target system, click the new terminal button
in the view's toolbar. A dialog will ask for the type of the terminal. This can be either GRMON Terminal or
Application terminal. The GRMON terminal has no settings that can be made.
When opening an Application terminal the dialog ask for what UART of the system to use. Already busy UARTs
will be grayed out and not selectable.
Figure 4.11. Opening a new terminal view
To open a whole new Terminals View click the new Terminal View button in the view's toolbar.
Control characters in GRMON Terminal
The terminal accepts control characters such as Ctrl+C to break execution, and tab for auto completion, among
many. Other examples are arrow up and down to access previous entries.
This also means that copy-paste can't be done via keyboard commands, and is only available from the context
menu of the terminal tab.
For more information visit Eclipse's TM Terminal site [http://www.eclipse.org/tm/doc/index.php].
4.5.5. Memory View
The Memory View can be used to monitor and manipulate memory in the target system. It provides flexibility by
allowing different presentations (renderings) of target memory area.
Memory View is available from the main menu under Window > Show View > Memory. When adding a new
memory monitor, the user a dialog is displayed where the target address is specified.
Figure 4.12. Opening a new message view
Memory content is modified by double-clicking a cell and typing in a new value. The new value is written to the
target when enter is pressed.
GRMON3-UM
June 2019, Version 3.1.0
48 www.cobham.com/gaisler
Page 49

Figure 4.13. The memory view
The Memory View can be used to access any addressable locations as seen by the current debug link. For example
IO registers in raw format. It is possible to specify the memory content presentation, for example ASCII string,
by adding a new rendering from the New Renderings... tab. Endian can also be selected in the right-click context
menu on a cell.
The Memory View is updated automatically at certain system events, for example when execution stops, or when
a breakpoint is hit and after single-step by the user. This behavior can be disabled as described in Section 4.6.1,
“Memory view update”.
NOTE: Even though GRMON GUI is CPU and context aware, the Memory View is global and always operate on
physical addresses: no MMU translation is performed by the Memory View.
4.5.6. Disassembly View
Disassembly View provides a convenient method to inspect the instruction memory of an application. It also provides, in combination with the CPU Registers View, a powerful method for inspecting how CPU state is updated
on instruction level when single-stepping.
Disassembly View is available from the main menu under Window > Show View > Disassembly. When adding a
new memory monitor, the user a dialog is displayed where the target address is specified.
The currently highlighed row represents the instruction which is to be issued when execution continues. Execution
history is also highlighted in shaded color to represent instructions which have been recently executed. The rightmost column of the Disassembly View describes the name of the function which the instruction belongs to, together
with the offset from the function symbol.
GRMON3-UM
June 2019, Version 3.1.0
49 www.cobham.com/gaisler
Page 50

Figure 4.14. The disassembly view
Disassembly View is updated each time execution stops, for example at single-step or a breakpoing. Methods for
instruction stepping include:
• Single-step using the step command in a Tcl terminal.
• Single-step by clicking the toolbar button named Step Into, also available via the F5 shortkey.
A custom memory location can be disassembled by typing the address in the box at the top of the Disassembly View
labelled Enter location here. It can be used to disassemble instructions not related to the current CPU program
counter. Note that the input should be an address and not a symbol name.
The Disassembly View is context aware and will disassemble virtual memory as determined by the current CPU
or thread context.
4.5.7. Messages View
The Messages view displays messages from the application that may be helpful for the user. The messages ranges
from critical errors to less critical information of helpful nature. Messages can arise from many different situations,
such when running a target image, or changing a setting.
Messages are sorted by the date they were created, showing newer messages on the top of the list.
To see the full message with all information, double click the message in the view. This will open a dialog with
all information available.
Copy messages to the clipboard by selecting one or many and press the Copy button , or press the copy
command keyboard combination.
Remove one or more messages by selecting them and pressing the Remove button , or press delete on the
keyboard. Remove all messages by clicking the Remove All button .
GRMON3-UM
June 2019, Version 3.1.0
50 www.cobham.com/gaisler
Page 51

Figure 4.15. The message view
4.6. Target communication
4.6.1. Memory view update
GRMON3 GUI normally updates the memory views when target execution stops, for example on a breakpoint
or after single step. This can generate a large amount of traffic on a slow debug link in combination with large
memory views. To save bandwidth on the debug link, there is an option named Disable auto-updaging memory
view after execution, available in the connection dialog GUI tab. The corresponding command-line option is -
tcf-nomemupdate.
4.7. C/C++ level debugging
The GUI does not include C/C++ level debugging functionality. However the GUI can be used simultaneously
to C/C++ level debugging via the GDB socket as described in Section 3.7, “GDB interface”. When GDB has
connected to GRMON, GDB is in control of the debugging. Similar to the command line interface it is not possible
to alter processor state or breakpoints without destroying GDB's internal representation. Doing so will leave GDB
in an undefined state and cause various GDB C/C++ level issues.
When GDB has stopped the execution the GUI can be used to view all hardware state. It is also possible to update
hardware state not specifically controlled by GDB such as I/O registers.
4.8. Limitations
This section describes limitation of GRMON3 GUI and areas of incompatibility with GRMON3 CLI.
Address location input
Address location inputs to the GUI currently has to be specified as addresses and not as symbol names.
Commands entered in the GRMON Tcl terminals can be specified either as addresses or symbol names.
Breakpoint management
Breakpoints can be managed from the Tcl terminal with the bp command. However, there is currently no
support in the graphical user interface to manage breakpoints. The Disassembly View has context menu
selections for adding breakpoints. This is currently not supported in GRMON GUI.
Future versions of GRMON will include breakpoint management via the GUI.
GRMON3-UM
June 2019, Version 3.1.0
51 www.cobham.com/gaisler
Page 52

5. Debug link
GRMON supports several different links to communicate with the target board. However all of the links may not
be supported by the target board. Refer to the board user manual to see which links that are supported. There are
also boards that have built-in adapters.
NOTE: Refer to the board user manual to see which links that are supported.
The default communication link between GRMON and the target system is the host’s serial port connected to a
serial debug interface (AHBUART) of the target system. Connecting using any of the other supported link can
be performed by using the switches listed below. More switches that may affect the connection are listed at each
subsection.
-altjtag Connect to the target system using Altera Blaster cable (USB or parallel).
-eth Connect to the target system using Ethernet. Requires the EDCL core to be present in
the target system.
-digilent Connect to the target system Digilent HS1 cable.
-ftdi Connect to the target system using a JTAG cable based on a FTDI chip.
-gresb Connect to the target system through the GRESB bridge. The target needs a SpW core
with RMAP.
-jtag Connect to the target system the JTAG Debug Link using Xilinx Parallel Cable III or IV.
-usb Connect to the target system using the USB debug link. Requires the GRUSB_DCL core
to be present in the target.
-xilusb Connect to the target system using a Xilinx Platform USB cable.
-uart <device> Connect to the target system using a serial cable.
-user Connect to the target system using a custom user defined library.
8-/16-bit access to the target system is only supported by the JTAG debug links, all other interfaces access subwords using read-modify-write. All links supports 32-bit accesses. 8-bit access is generally not needed. An example of when it is needed is when programming a 8 or 16-bit flash memory on a target system without a LEON
CPU available. Another example is when one is trying to access cores that have byte-registers, for example the
CAN_OC core, but almost all GRLIB cores have word-registers and can be accessed by any debug link.
The speed of the debug links affects the performance of GRMON. It is most noticeable when loading large applications, for example Linux or VxWorks. Another case when the speed of the link is important is during profiling,
a faster link will increase the number of samples. See Table 5.1 for a list of estimated speed of the debug links.
Table 5.1. Estimated debug link application download speed
Name Estimated speed
UART ~100 kbit/s
JTAG (Parallel port) ~200 kbit/s
JTAG (USB) ~1 Mbit/s
GRESB ~25 Mbit/s
USB ~30 Mbit/s
Ethernet ~35 Mbit/s
5.1. UART debug link
To attach GRMON using the AHBUART debug link, first connect a cable between the UART connectors on target
board and the host system. Then power-up and reset the target board and start GRMON with the -uart option.
Use the -uart <device> option in case the target is not connected to the first UART port of your host. On
some hosts, it might be necessary to lower the baud rate in order to achieve a stable connection to the target. In
GRMON3-UM
June 2019, Version 3.1.0
52 www.cobham.com/gaisler
Page 53

this case, use the -baud switch with the 57600 or 38400 options. Below is a list of start-up switches applicable
for the AHBUART debug link.
Extra options for UART debug link:
-uart <device>
By default, GRMON communicates with the target using the first uart port of the host. This can be overridden by specifying an alternative device. Device names depend on the host operating system. On Linux
systems serial devices are named as /dev/tty## and on Windows they are named \\.\com#.
-baud <baudrate>
Use baud rate for the DSU serial link. By default, 115200 baud is used. Possible baud rates are 9600, 19200,
38400, 57600, 115200, 230400, 460800. Rates above 115200 need special uart hardware on both host and
target.
5.2. Ethernet debug link
If the target system includes a GRETH core with EDCL enabled then GRMON can connect to the system using
Ethernet. The default network parameters can be set through additional switches.
Extra options for Ethernet:
-eth [<ipnum>][:<port>]
Use the Ethernet connection and optionally use ipnum for the target system IP number and/or :port to
select which UDP port to use. Default IP address is 192.168.0.51 and port 10000.
-edclmem <kB>
The EDCL hardware can be configured with different buffer size. Use this option to force the buffer size (in
KB) used by GRMON during EDCL debug-link communication. By default the GRMON tries to autodetect
the best value. Valid options are: 1, 2, 4, 8, 16, 32, 64.
-edclus <us>
Increase the EDCL timeout before resending a packet. Use this option if you have a large network delays.
The default IP address of the EDCL is normally determined at synthesis time. The IP address can be changed
using the edcl command. If more than one core is present i the system, then select core by appending the name.
The name of the core is listed in the output of info sys.
Note that if the target is reset using the reset signal (or power-cycled), the default IP address is restored. The edcl
command can be given when GRMON is attached to the target with any interface (serial, JTAG, PCI ...), allowing
to change the IP address to a value compatible with the network type, and then connect GRMON using the EDCL
with the new IP number. If the edcl command is issued through the EDCL interface, GRMON must be restarted
using the new IP address of the EDCL interface. The current IP address is also visible in the output from info sys.
grmon3> edcl
Device index: greth0
Edcl ip 192.168.0.51, buffer 2 kB
grmon3> edcl greth1
Device index: greth1
Edcl ip 192.168.0.52, buffer 2 kB
grmon3> edcl 192.168.0.53 greth1
Device index: greth1
Edcl ip 192.168.0.53, buffer 2 kB
grmon3> info sys greth0 greth1
greth0 Cobham Gaisler GR Ethernet MAC
APB: FF940000 - FF980000
IRQ: 24
edcl ip 192.168.0.51, buffer 2 kbyte
greth1 Cobham Gaisler GR Ethernet MAC
APB: FF980000 - FF9C0000
IRQ: 25
edcl ip 192.168.0.53, buffer 2 kbyte
5.3. JTAG debug link
The subsections below describe how to connect to a design that contains a JTAG AHB debug link (AHBJTAG).
The following commandline options are common for all JTAG interfaces. If more than one cable of the same type
GRMON3-UM
June 2019, Version 3.1.0
53 www.cobham.com/gaisler
Page 54

is connected to the host, then you need to specify which one to use, by using a commandline option. Otherwise
it will default to the first it finds.
Extra options common for all JTAG cables:
-jtaglist
List all available cables and exit application.
-jtagcable <n>
Specify which cable to use if more than one is connected to the computer. If only one cable of the same type
is connected to the host computer, then it will automatically be selected. It's also used to select parallel port.
-jtagserial <sn>
Specify which cable to use by serial number if more than one is connected to the computer.
-jtagdevice <n>
Specify which device in the chain to debug. Use if more than one is device in the chain is debuggable.
-jtagcomver <version>
Specify JTAG debug link version.
-jtagretry <num>
Set the number of retries.
-jtagcfg <filename>
Load a JTAG configuration file, defining unknown devices.
JTAG debug link version
The JTAG interface has in the past been unreliable in systems with very high bus loads, or extremely slow AMBA AHB slaves, that lead to GRMON reading out AHB read data before the access had actually completed on
the AHB bus. Read failures have been seen in systems where the debug interface needed to wait hundreds of
cycles for an AHB access to complete. With version 1 of the JTAG AHB debug link the reliability of the debug
link has been improved. In order to be backward compatible with earlier versions of the debug link, GRMON
cannot use all the features of AHBJTAG version 1 before the debug monitor has established that the design in fact
contains a core with this version number. In order to do so, GRMON scans the plug and play area. However, in
systems that have the characteristics described above, the scanning of the plug and play area may fail. For such
systems the AHBJTAG version assumed by GRMON during plug and play scanning can be set with the switch jtagcomver<version>. This will enable GRMON to keep reading data from the JTAG AHB debug interface
until the AHB access completes and valid data is returned. Specifying the version in systems that have AHBJTAG
version 0 has no benefit and may lead to erroneous behavior. The option -jtagretry<num> can be used to set
the number of attempts before GRMON gives up.
JTAG chain devices
If more than one device in the JTAG chain are recognized as debuggable (FPGAs, ASICs etc), then the device to
debug must be specified using the commandline option -jtagdevice. In addition, all devices in the chain must
be recognized. GRMON automatically recognizes the most common FPGAs, CPLDs, proms etc. But unknown
JTAG devices will cause GRMON JTAG chain initialization to fail. This can be solved by defining a JTAG
configuration file. GRMON is started with -jtagcfg switch. An example of JTAG configuration file is shown
below. If you report the device ID and corresponding JTAG instruction register length to Cobham Gaisler, then
the device will be supported in future releases of GRMON.
# JTAG Configuration file
# Name Id Mask Ir length Debug I/F Instr. 1 Instr. 2
xc2v3000 0x01040093 0x0fffffff 6 1 0x2 0x3
xc18v04 0x05036093 0x0ffeffff 8 0
ETH 0x103cb0fd 0x0fffffff 16 0
Each line consists of device name, device id, device id mask, instruction register length, debug link and user
instruction 1 and 2 fields, where:
Name String with device name
Id Device identification code
Mask Device id mask is ANDed with the device id before comparing with the identification codes
obtained from the JTAG chain. Device id mask allows user to define a range of identification
codes on a single line, e.g. mask 0x0fffffff will define all versions of a certain device.
GRMON3-UM
54 www.cobham.com/gaisler
June 2019, Version 3.1.0
Page 55

Ir length Length of the instruction register in bits
Debug I/F Set debug link to 1 if the device implements JTAG Debug Link, otherwise set to 0.
Instr. 1 Code of the instruction used to access JTAG debug link address/command register (default is
0x2). Only used if debug link is set to 1.
Instr. 2 Code of the instruction used to access JTAG debug link data register (default is 0x3). Used only
if debug link is set to 1.
NOTE: The JTAG configuration file can not be used with Altera blaster cable (-altjtag).
5.3.1. Xilinx parallel cable III/IV
If target system has the JTAG AHB debug link, GRMON can connect to the system through Xilinx Parallel Cable
III or IV. The cable should be connected to the host computers parallel port, and GRMON should be started with
the -jtag switch. Use -jtagcable to select port. On Linux, you must have read and write permission, i.e.
make sure that you are a member of the group 'lp'. I.a. on some systems the Linux module lp must be unloaded,
since it uses the port.
Extra options for Xilinx parallel cable:
-jtag
Connect to the target system using a Xilinx parallel cable III/IV cable
5.3.2. Xilinx Platform USB cable
JTAG debugging using the Xilinx USB Platform cable is supported on Linux and Windows 7 systems. The platform cable models DLC9G and DLC10 are supported. The legacy model DLC9 is not supported. GRMON should
be started with -xilusb switch. Certain FPGA boards have a USB platform cable logic implemented directly on
the board, using a Cypress USB device and a dedicated Xilinx CPLD. GRMON can also connect to these boards,
using the --xilusb switch.
Extra options for Xilinx USB Platform cable:
-xilusb
Connect to the target system using a Xilinx USB Platform cable.
-xilmhz [12|6|3|1.5|0.75]
Set Xilinx Platform USB frequency. Valid values are 12, 6, 3, 1.5 or 0.75 MHz. Default is 3 MHz.
On Linux systems, the Xilinx USB drivers must be installed by executing ’./setup_pcusb’ in the ISE bin/bin/
lin directory (see ISE documentation). I.a. the program fxload must be available in /sbin on the used host,
and libusb must be installed.
On Windows hosts follow the instructions below. The USB cable drivers should be installed from Xilinx ISE,
ISE Webpack or Vivado Lab Tools. Xilinx ISE 9.2i or later is required, or Xilinx Vivado Lab Tools 2017.4. Then
install the filter driver, from the libusb-win32 project [http://libusb-win32.sourceforge.net], by running install-fil-
ter-win.exe from the libusb package.
1. Install the ISE, ISE-Webpack, iMPACT or Vivado Lab Tools by following their instructions. This will
install the drivers for the Xilinx Platform USB cable. Xilinx ISE 9.2i or later is required, or Vivado 2017.4.
After the installation is complete, make sure that the Xilinx tools can find the Platform USB cable.
2. Then run libusb-win32-devel-filter-1.2.6.0.exe, which can be found in the folder '<gr-
mon-ver>/share/grmon/', where <grmon-ver> is the path to the extracted win32 or win64 folder
from the the GRMON archive. This will install the libusb filter driver tools. Step through the installer dialog
boxes as seen in Figure 5.1 until the last dialog. The libusb-win32-devel-filter-1.2.6.0.exe
installation is compatible with both 64-bit and 32-bit Windows.
3. Make sure that 'Launch filter installer wizard' is checked, then press Finish. The wizard
can also be launched from the start menu.
GRMON3-UM
June 2019, Version 3.1.0
55 www.cobham.com/gaisler
Page 56

GRMON3-UM
June 2019, Version 3.1.0
56 www.cobham.com/gaisler
Page 57

Figure 5.1.
4. At the first dialog, as seen in Figure 5.2, choose 'Install a device filter' and press Next.
5. In the second dialog, mark the Xilinx USB cable. You can identify it either by name Xilinx USB Cable
in the 'Description' column or vid:03fd in the 'Hardware ID' column. Then press Install to continue.
6. Press OK to close the pop-up dialog and then Cancel to close the filter wizard. You should now be able to
use the Xilinx Platform USB cable with both GRMON and iMPACT.
Figure 5.2.
The libusb-win32 filter installer wizard may have to be run again if the Xilinx Platform USB cable is connected
to another USB port or through a USB hub.
5.3.3. Altera USB Blaster or Byte Blaster
For GRLIB systems implemented on Altera devices GRMON can use USB Blaster or Byte Blaster cable to connect
to the system. GRMON is started with -altjtag switch. Drivers are included in the the Altera Quartus software,
see Actel's documentation on how to install on your host computer.
The connection is only supported by the 32-bit version of GRMON. And it also requires Altera Quartus version
less then or equal to 13.
GRMON3-UM
June 2019, Version 3.1.0
57 www.cobham.com/gaisler
Page 58

On Linux systems, the path to Quartus shared libraries has to be defined in the LD_LIBRARY_PATH environment
variable, i.e.
$ export LD_LIBRARY_PATH=$LD_LIBRARY_PATH:/usr/local/quartus/linux
$ grmon -altjtag
GRMON3 LEON debug monitor v3.0.0 32-bit professional version
...
On Windows, the path to the Quartus binary folder must the added to the environment variable PATH, see Appendix F, Appending environment variables in how to this. The default installation path to the binary folder should
be similar to C:\altera\11.1sp2\quartus\bin, where 11.1sp2 is the version of Quartus.
Extra options for Altera Blaster:
-altjtag
Connect to the target system using Altera Blaster cable (USB or parallel).
5.3.4. FTDI FT4232/FT2232
JTAG debugging using a FTDI FT2232/FT4232 chip in MPSSE-JTAG-emulation mode is supported in Linux
and Windows. GRMON has support for two different back ends, one based on libftdi 0.20 and the other based
on FTDI's official d2xx library.
When using Windows, GRMON will use the d2xx back end per default. FTDI’s D2XX driver must be installed.
Drivers and installation guides can be found at FTDI's website [http://www.ftdichip.com].
In Linux, the libftdi back end is used per default. The user must also have read and write permission to the device
file. This can be achieved by creating a udev rules file, /etc/udev/rules.d/51-ftdi.rules, containing
the lines below and then reconnect the USB cable.
ATTR{idVendor}=="0403", ATTR{idProduct}=="6010", MODE="666"
ATTR{idVendor}=="0403", ATTR{idProduct}=="6011", MODE="666"
ATTR{idVendor}=="0403", ATTR{idProduct}=="6014", MODE="666"
ATTR{idVendor}=="0403", ATTR{idProduct}=="cff8", MODE="666"
Extra options for FTDI:
-ftdi [libftdi|d2xx]
Connect to the target system using a JTAG cable based on a FTDI chip. Optionally a back end can be
specified. Defaults to libftdi on Linux and d2xx on Windows
-ftdidetach
On Linux, force the detachment of any kernel drivers attached to the USB device.
-ftdimhz <mhz>
Set FTDI frequency divisor. Values between 0.0 and 30.0 are allowed (values higher then 6.0 MHz are
hardware dependent) The frequency will be rounded down to the closest supported frequency supported
by the hardware. Default value of mhz is 1.0 MHz
-ftdivid <vid>
Set the vendor ID of the FTDI device you are trying to connect to. This can be used to add support for
3rd-party FTDI based cables.
-ftdipid <pid>
Set the product ID of the FTDI device you are trying to connect to. This can be used to add support for
3rd-party FTDI based cables.
-ftdigpio <val>
Set the GPIO signals of the FTDI device. The lower 16bits sets the level of the GPIO and the upper bits
set the direction.
Bits 0-3 Reserved
Bits 4-3 GPIOL 0-3 level
Bits 8-15 GPIOH 0-7 level
Bits 16-19 Reserved
Bits 20-23 GPIOL 0-3 direction
Bits 24-31 GPIOH 0-7 direction
GRMON3-UM
June 2019, Version 3.1.0
58 www.cobham.com/gaisler
Page 59

5.3.5. Amontec JTAGkey
The Amontec JTAGkey is based on a FTDI device, therefore see Section 5.3.4, “FTDI FT4232/FT2232” about
FTDI devices on how to connect. Note that the user does not need to specify VID/PID for the Amontec cable. The
drivers and installation guide can be found at Amontec's website [http://www.amontec.com].
5.3.6. Actel FlashPro 3/3x/4/5
Support for Actel FlashPro 3/3x/4/5 is only supported by the professional version.
On Windows 32-bit, JTAG debugging using the Microsemi FlashPro 3/3x/4 is supported for GRLIB systems implemented on Microsemi devices. This also requires FlashPro 11.4 software or later to be installed on the host computer (to be downloaded from Microsemi's website). Windows support is detailed at the website. GRMON is started with the -fpro switch. Technical support is provided through Cobham Gaisler only via support@gaisler.com.
JTAG debugging using the Microsemi FlashPro 5 cable is supported on both Linux and Windows, for GRLIB systems implemented on Microsemi devices, using the FTDI debug link. See Section 5.3.4, “FTDI FT4232/FT2232”
about FTDI devices on how to connect. Note that the user does not need to specify VID/PID for the FlashPro 5
cable. This also requires FlashPro 11.4 software or later to be installed on the host computer (to be downloaded
from Microsemi's website). Technical support is provided through Cobham Gaisler only via support@gaisler.com.
Extra options for Actel FlashPro:
-fpro
Connect to the target system using the Actel FlashPro cable. (Windows)
5.3.7. Digilent HS1
JTAG debugging using a Digilent JTAG HS1 cable is supported on Linux and Windows systems. Start GRMON
with the -digilent switch to use this interface.
On Windows hosts, the Digilent Adept System software must be installed on the host computer, which can be
downloaded from Digilent's website.
On Linux systems, the Digilent Adept Runtime x86 must be installed on the host computer, which can be downloaded from Digilent's website. The Adept v2.10.2 Runtime x86 supports the Linux distributions listed below.
CentOS 4 / Red Hat Enterprise Linux 4
CentOS 5 / Red Hat Enterprise Linux 5
openSUSE 11 / SUSE Linux Enterprise 11
Ubuntu 8.04
Ubuntu 9.10
Ubuntu 10.04
On 64-bit Linux systems it's recommended to install the 32-bit runtime using the manual instructions from the
README provided by the runtime distribution. Note that the 32-bit Digilent Adept runtime depends on 32-bit
versions of FTDI's libd2xx library and the libusb-1.0 library.
Extra options for Digilent HS1:
-digilent
Connect to the target system using the Digilent HS1 cable.
-digifreq <hz>
Set Digilent HS1 frequency in Hz. Default is 1 MHz.
5.4. USB debug link
GRMON can connect to targets equipped with the GRUSB_DCL core using the USB bus. To do so start GRMON
with the -usb switch. Both USB 1.1 and 2.0 are supported. Several target systems can be connected to a single
host at the same time. GRMON scans all the USB buses and claims the first free USBDCL interface. If the first
target system encountered is already connected to another GRMON instance, the interface cannot be claimed and
the bus scan continues.
GRMON3-UM
June 2019, Version 3.1.0
59 www.cobham.com/gaisler
Page 60

On Linux the GRMON binary must have read and write permission. This can be achieved by creating a udev
rules file, /etc/udev/rules.d/51-gaisler.rules, containing the line below and then reconnect the
USB cable.
SUBSYSTEM=="usb", ATTR{idVendor}=="1781", ATTR{idProduct}=="0aa0", MODE="666"
On Windows a driver has to be installed. The first the time the device is plugged in it should be automatically
detected as an unknown device, as seen in Figure 5.3. Follow the instructions below to install the driver.
Figure 5.3.
1. Open the device manager by writing 'mmc devmgmt.msc' in the run-field of the start menu.
2. In the device manager, find the unknown device. Right click on it to open the menu and choose 'Update
Driver Software...' as Figure 5.4 shows.
Figure 5.4.
3. In the dialog that open, the first image in Figure 5.5, choose 'Browse my computer for driver
software'.
4. In the next dialog, press the Browse button and locate the path to <grmon-win32>/share/gr-
mon/drivers, where grmon-win32 is the path to the extracted win32 folder from the the GRMON
archive. Press 'Next' to continue.
5. A warning dialog might pop-up, like the third image in Figure 5.5. Press 'Install this driver
software anyway' if it shows up.
6. Press 'Close' to exit the dialog. The USB DCL driver is now installed and GRMON should be able to
connect to the target system using the USB DCL connection.
GRMON3-UM
June 2019, Version 3.1.0
60 www.cobham.com/gaisler
Page 61

Figure 5.5.
5.5. GRESB debug link
Targets equipped with a SpaceWire core with RMAP support can be debugged through the GRESB debug link
using the GRESB Ethernet to SpaceWire bridge. To do so start GRMON with the -gresb switch and use the
any of the switches below to set the needed parameters.
For further information about the GRESB bridge see the GRESB manual.
Extra options for the GRESB connection:
-gresb [<ipnum>]
Use the GRESB connection and optionally use ipnum for the target system IP number. Default is
192.168.0.50.
-link <num>
Use link linknum on the bridge. Defaults to 0.
-dna <dna>
The destination node address of the target. Defaults to 0xfe.
-sna <sna>
The SpW node address for the link used on the bridge. Defaults to 32.
-dpa <dpa1> [,<dpa2>, ... ,<dpa12>]
The destination path address. Comma separated list of addresses.
-spa <spa1> [,<spa2>, ..., <spa12>]
The source path address. Comma separated list of addresses.
-dkey <key>
The destination key used by the targets RMAP interface. Defaults to 0.
-clkdiv <div>
Divide the TX bit rate by div. If not specified, the current setting is used.
-gresbtimeout <sec>
Timeout period in seconds for RMAP replies. Defaults is 8.
-gresbretry <n>
Number of retries for each timeout. Defaults to 0.
5.5.1. AGGA4 SpaceWire debug link
It is possible to debug the AGGA4 via SpaceWire, using the GRESB Ethernet SpaceWire Bridge, by combining the
commandline switches '-gresb' and '-sys agga4' when starting GRMON. In addition, the following options
can also be added: -link, -clkdiv, -gresbtimeout and -gresbretry.
The AGGA4 SpaceWire debug link does not use a regular SpaceWire packet protocol, therefore the GRESB must
be setup to tunnel all the packets as raw data. To achieve this the GRESB must be configured to use separate
routing tables, this setting can only be enabled via the web interface.
GRMON3-UM
June 2019, Version 3.1.0
61 www.cobham.com/gaisler
Page 62

The GRESB routing tables for the SpaceWire port and the TCP port that will be used must also be configured.
The routing tables can be setup via the web interface or using the software distributed with the GRESB. All the
node addresses in the routing table for the SpaceWire port must be configured to forward packets to the TCP port
without any header deletion. The routing table for the TCP port must be setup in the same way but to forward the
packets from all nodes to the SpaceWire port instead. A Linux bash script and a Windows bat-script is provided
with GRMON professional distribution in folder share/grmon/tools, that can be used with the GRESB
software to setup the routing tables. The scripts must be able to find the GRESB software, so either the PATH
environment variable must be setup or execute the scripts from the GRESB software folder.
GRESB separate routing table mode shall be used when connecting to the AGGA4 SpaceWire debug link. This
can be configured in the GRESB web interface: "Routing table configuration"->"Set/view Mode"->"Set Separate
mode".
5.6. User defined debug link
In addition to the supported DSU communication interfaces (Serial, JTAG, ETH and PCI), it is possible for the
user to add a custom interface using a loadable module. The custom DSU interface must provide functions to read
and write data on the target system’s AHB bus.
Extra options for the user defined connection:
-dback <filename>
Use the user defined debug link. The debug link should be implemented in a loadable module pointed out
by the filename parameter.
-dbackarg <arg>
Set a custom argument to be passed to the user defined debug link during start-up.
5.6.1. API
The loadable module must export a pointer variable named DsuUserBackend that points to a struct ioif,
as described below:
struct ioif {
int (*wmem) (unsigned int addr, const unsigned int *data, int len);
int (*gmem) (unsigned int addr, unsigned int *data, int len);
int (*open) (char *device, int baudrate, int port);
int (*close) ();
int (*setbaud) (int baud, int pp);
int (*init) (char* arg);
};
struct ioif my_io = {my_wmem, my_gmem, NULL, my_close, NULL, my_init};
struct ioif *DsuUserBackend = &my_io;
On the Linux platform, the loadable module should be compiled into a library and loaded into GRMON as follows:
> gcc -fPIC -c my_io.c
> gcc -shared my_io.o -o my_io.so
> grmon -dback my_io.so -dbackarg "my argument"
On the Windows platform, the loadable module should be compiled into a library and loaded into GRMON as
follows:
> gcc -c my_io.c
> gcc -shared my_io.o -o my_io.dll
> grmon -dback my_io.dll -dbackarg "my argument"
The members of the struct ioif are defined as:
int (*wmem) (unsigned int addr, const unsigned int *data, int len);
A function that performs one or more 32-bit writes on the AHB bus. The parameters indicate the AHB
(start) address, a pointer to the data to be written, and the number of words to be written. The data is in
little-endian format (note that the AMBA bus on the target system is big-endian). If the len parameter is
zero, no data should be written. The return value should be the number of words written.
int (*gmem) (unsigned int addr, unsigned int *data, int len);
A function that reads one or more 32-bit words from the AHB bus. The parameters indicate the AHB (start)
address, a pointer to where the read data should be stored, and the number of words to be read. The returned
GRMON3-UM
June 2019, Version 3.1.0
62 www.cobham.com/gaisler
Page 63

data should be in little-endian format (note that the AMBA bus on the target system is big-endian). If the
len parameter is zero, no data should be read. The return value should be the number of words read.
int (*open) (char *device, int baudrate, int port);
Not used, provided only for backwards compatibility. This function is replaced by the function init.
int (*close) ();
Called when disconnecting.
int (*setbaud) (int baud, int pp);
Not used, provided only for backwards compatibility.
int (*init) (char* arg);
Called when initiating a connection to the target system. The parameter arg is set using the GRMON start-up
switch -dbackarg <arg>. This allows to send arbitrary parameters to the DSU interface during start-up.
An example module is provided with the professional version of GRMON located at <grmon3>/share/gr-
mon/src/dsu_user_backend.
GRMON3-UM
June 2019, Version 3.1.0
63 www.cobham.com/gaisler
Page 64

6. Debug drivers
This section describes GRMON debug commands available through the TCL GRMON shell.
6.1. AMBA AHB trace buffer driver
The at command and its subcommands are used to control the AHBTRACE buffer core. It is possible to record
AHB transactions without interfering with the processor. With the commands it is possible to set up triggers formed
by an address and an address mask indicating what bits in the address that must match to set the trigger off. When
the triggering condition is matched the AHBTRACE stops the recording of the AHB bus and the log is available
for inspection using the at command. The at delay command can be used to delay the stop of the trace recording
after a triggering match.
Note that this is an stand alone AHB trace buffer it is not to be confused with the DSU AHB trace facility. When
a break point is hit the processor will not stop its execution.
The info sys command displays the size of the trace buffer in number of lines.
ahbtrace0 Cobham Gaisler AMBA Trace Buffer
AHB: FFF40000 - FFF60000
Trace buffer size: 512 lines
6.2. Clock gating
The GRCLKGATE debug driver provides an interface to interact with a GRCLKGATE clock gating unit. A
command line switch can be specified to automatically reset and enable all clocks, controlled by clock gating
units, during GRMON's system initialization.
The GRCLKGATE core is accessed using the command grcg, see command description in Appendix B, Command
syntax for more information.
6.2.1. Switches
-cginit [,<mask>,<mask>,...]
Reset and enable all clock-signals controlled by GRCLKGATE during initialization. If no mask is set then
all clock-signals will be enabled. If a mask is specified, then clock-signals that will be enabled depends on
the mask. One mask per GRCLKGATE core.
6.3. DSU Debug drivers
The DSU debug drivers for the LEON processor(s) is a central part of GRMON. It handles most of the functions
regarding application execution, debugging, processor register access, cache access and trace buffer handling. The
most common interactions with the DSU are explained in Chapter 3, Operation. Additional information about the
configuration of the DSU and the LEON CPUs on the target system can be listed with the command info sys.
dsu0 Cobham Gaisler LEON4 Debug Support Unit
AHB: D0000000 - E0000000
AHB trace: 64 lines, 32-bit bus
CPU0: win 8, hwbp 2, itrace 64, V8 mul/div, srmmu, lddel 1, GRFPU-lite
stack pointer 0x4ffffff0
icache 2 * 8 kB, 32 B/line lrr
dcache 2 * 4 kB, 32 B/line lrr
CPU1: win 8, hwbp 2, itrace 64, V8 mul/div, srmmu, lddel 1, GRFPU-lite
stack pointer 0x4ffffff0
icache 2 * 8 kB, 32 B/line lrr
dcache 2 * 4 kB, 32 B/line lrr
6.3.1. Switches
Below is a list of commandline switches that affects how the DSU driver interacts with the DSU hardware.
-nb
When the -nb flag is set, the CPUs will not go into debug mode when a error trap occurs. Instead the OS
must handle the trap.
GRMON3-UM
June 2019, Version 3.1.0
64 www.cobham.com/gaisler
Page 65

-nswb
When the -nswb flag is set, the CPUs will not go into debug mode when a software breakpoint occur. This
option is required when a native software debugger like GDB is running on the target LEON.
-dsudelay <ms>
Set the DSU polling period. Normally GRMON will poll the DSU as fast as possible.
-nic
Disable instruction cache
-ndc
Disable data cache
-stack <addr>
Set addr as stack pointer for applications, overriding the auto-detected value.
-mpgsz
Enable support for MMU page sizes larger then 4kB. Must be supported by hardware.
6.3.2. Commands
The driver for the debug support unit provides the commands listed in Table 6.1.
Table 6.1. DSU commands
about Show information about GRMON
ahb Print AHB transfer entries in the trace buffer
attach Stop execution and attach GRMON to processor again
at Print AHB transfer entries in the trace buffer
bp Add, delete or list breakpoints
bt Print backtrace
cctrl Display or set cache control register
cont Continue execution
cpu Enable, disable CPU or select current active cpu
dcache Show, enable or disable data cache
dccfg Display or set data cache configuration register
detach Resume execution with GRMON detached from processor
ei Error injection
ep Set entry point
float Display FPU registers
forward Control I\/O forwarding
go Start execution without any initialization
hist Print AHB transfer or intruction entries in the trace buffer
icache Show, enable or disable instruction cache
iccfg Display or set instruction cache configuration register
inst Print intruction entries in the trace buffer
leon Print leon specific registers
mmu Print or set the SRMMU registers
perf Measure performance
profile Enable, disable or show simple profiling
reg Show or set integer registers.
run Reset and start execution
stack Set or show the intial stack-pointer
step Step one ore more instructions
GRMON3-UM
June 2019, Version 3.1.0
65 www.cobham.com/gaisler
Page 66

stop Interrupts current CPU execution
tmode Select tracing mode between none, processor-only, AHB only or both.
va Translate a virtual address
vmemb AMBA bus 8-bit virtual memory read access, list a range of addresses
vmemh AMBA bus 16-bit virtual memory read access, list a range of addresses
vmem AMBA bus 32-bit virtual memory read access, list a range of addresses
vwmemb AMBA bus 8-bit virtual memory write access
vwmemh AMBA bus 16-bit virtual memory write access
vwmems Write a string to an AMBA bus virtual memory address
vwmem AMBA bus 32-bit virtual memory write access
walk Translate a virtual address, print translation
6.3.3. Tcl variables
The DSU driver exports one Tcl variable per CPU (cpuN), they allow the user to access various registers of
any CPU instead of using the standard reg, float and cpu commands. The variables are mostly intended for Tcl
scripting. See Section 3.4.12, “Multi-processor support” for more information how the cpu variable can be used.
6.4. Ethernet controller
The GRETH debug driver provides commands to configure the GRETH 10/100/1000 Mbit/s Ethernet controller
core. The driver also enables the user to read and write Ethernet PHY registers. The info sys command displays
the core’s configuration settings:
greth0 Cobham Gaisler GR Ethernet MAC
AHB Master 2
APB: C0100100 - C0100200
IRQ: 12
edcl ip 192.168.0.201, buffer 2 kbyte
If more than one GRETH core exists in the system, it is possible to specify which core the internal commands
should operate on. This is achieved by appending a device name parameter to the command. The device name is
formatted as greth# where the # is the GRETH device index. If the device name is omitted, the command will
operate on the first device. The device name is listed in the info sys information.
The IP address must have the numeric format when setting the EDCL IP address using the edcl command, i.e. edcl
192.168.0.66. See command description in Appendix B, Command syntax and Ethernet debug interface in
Section 5.2, “Ethernet debug link” for more information.
6.4.1. Commands
The driver for the greth core provides the commands listed in Table 6.2.
Table 6.2. GRETH commands
edcl Print or set the EDCL ip
mdio Show PHY registers
phyaddr Set the default PHY address
wmdio Set PHY registers
6.5. GRPWM core
The GRPWM debug driver implements functions to report the available PWM modules and to query the waveform
buffer. The info sys command will display the available PWM modules.
grpwm0 Cobham Gaisler PWM generator
APB: 80010000 - 80020000
GRMON3-UM
June 2019, Version 3.1.0
66 www.cobham.com/gaisler
Page 67

IRQ: 13
cnt-pwm: 3
The GRPWM core is accessed using the command grpwm, see command description in Appendix B, Command
syntax for more information.
6.6. USB Host Controller
The GRUSBHC host controller consists of two host controller types. GRMON provides a debug driver for each
type. The info sys command displays the number of ports and the register setting for the enhanced host controller
or the universal host controller:
usbehci0 Cobham Gaisler USB Enhanced Host Controller
AHB Master 4
APB: C0100300 - C0100400
IRQ: 6
2 ports, byte swapped registers
usbuhci0 Cobham Gaisler USB Universal Host Controller
AHB Master 5
AHB: FFF00200 - FFF00300
IRQ: 7
2 ports, byte swapped registers
If more than one ECHI or UCHI core exists in the system, it is possible to specify which core the internal commands
should operate on. This is achieved by appending a device name parameter to the command. The device name is
formatted as usbehci#/usbuhci# where the # is the device index. If the device name is omitted, the command
will operate on the first device. The device name is listed in the info sys information.
6.6.1. Switches
-nousbrst
Prevent GRMON from automatically resetting the USB host controller cores.
6.6.2. Commands
The drivers for the USB host controller cores provides the commands listed in Table 6.3.
Table 6.3. GRUSBHC commands
ehci Controll the USB host ECHI core
uhci Controll the USB host UHCI core
6.7. I2C
The I2C-master debug driver initializes the core’s prescaler register for operation in normal mode (100 kb/s). The
driver supplies commands that allow read and write transactions on the I2C-bus. I.a. it automatically enables the
core when a read or write command is issued.
The I2CMST core is accessed using the command i2c, see command description in Appendix B, Command syntax
for more information.
6.8. I/O Memory Management Unit
The debug driver for GRIOMMU provides commands for configuring the core, reading core status information,
diagnostic cache accesses and error injection to the core’s internal cache (if implemented). The debug driver also
has support for building, modifying and decoding Access Protection Vectors and page table structures located in
system memory.
The GRIOMMU core is accessed using the command iommu, see command description in Appendix B, Command
syntax for more information.
The info sys command displays information about available protection modes and cache configuration.
iommu0 Cobham Gaisler IO Memory Management Unit
GRMON3-UM
67 www.cobham.com/gaisler
June 2019, Version 3.1.0
Page 68

AHB Master 4
AHB: FF840000 - FF848000
IRQ: 31
Device index: 0
Protection modes: APV and IOMMU
msts: 9, grps: 8, accsz: 128 bits
APV cache lines: 32, line size: 16 bytes
cached area: 0x00000000 - 0x80000000
IOMMU TLB entries: 32, entry size: 16 bytes
translation mask: 0xff000000
Core has multi-bus support
6.9. Multi-processor interrupt controller
The debug driver for IRQMP provides commands for forcing interrupts and reading core status information. The
debug driver also supports ASMP and other extension provided in the IRQ(A)MP core. The IRQMP and IRQAMP
cores are accessed using the command irq, see command description in Appendix B, Command syntax for more
information.
The info sys command displays information on the cores memory map. I.a. if extended interrupts are enabled it
shows the extended interrupt number.
irqmp0 Cobham Gaisler Multi-processor Interrupt Ctrl.
APB: FF904000 - FF908000
EIRQ: 10
6.10. L2-Cache Controller
The debug driver for L2C is accessed using the command l2cache, see command description in Appendix B,
Command syntax for more information. It provides commands for showing status, data and hit-rate. It also provides
commands for enabling/disabling options and flushing or invalidating the cache lines.
If the L2C core has been configured with memory protection, then the l2cache error subcommand can be used
to inject check bit errors and to read out error detection information.
L2-Cache is enabled by default when GRMON starts. This behavior can be disabled by giving the -nl2c command line option which instead disables the cache. L2-Cache can be enabled/disabled later by the user or by software in either case. If -ni is given, then L2-Cache state is not altered when GRMON starts.
When GRMON is started without -ni and -nl2c, the L2-Cache controller will be configured with EDAC disabled, LRU replacement policy, no locked ways, copy-back replacement policy and not using HPROT to determine
cachability. Pending EDAC error injection is also removed.
When connecting without -ni, if the L2-Cache is disabled, the L2-Cache contents will be invalidated to make
sure that any random power-up values will not affect execution. If the L2-Cache was already enabled, it is assumed
that the contents are valid and L2-Cache is flushed to backing memory and then invalidated.
When enabling L2-Cache, the subcommand l2cache disable flushinvalidate can be used to atomically invalidate
and write back dirty lines. The inverse operation is l2cache invalidate followed by l2cache enable. For debugging
the state of L2-Cache itself, it may be more appropriate to use l2cache disable as it does not have any side effects
on cache tags.
The info sys command displays the cache configuration.
l2cache0 Cobham Gaisler L2-Cache Controller
AHB Master 0
AHB: 00000000 - 80000000
AHB: F0000000 - F0400000
AHB: FFE00000 - FFF00000
IRQ: 28
L2C: 4-ways, cachesize: 128 kbytes, mtrr: 16
6.10.1. Switches
-nl2c
Disable L2-Cache on start-up.
GRMON3-UM
June 2019, Version 3.1.0
68 www.cobham.com/gaisler
Page 69

6.11. Statistics Unit
The debug driver for L4STAT provides commands for reading and configuring the counters available in a L4STAT
core. The L4STAT core can be implemented with two APB interfaces. GRMON treats a core with dual interfaces
the same way as it would treat a system with multiple instances of L4STAT cores. If several L4STAT APB
interfaces are found the l4stat command must be followed by an interface index reported by info sys. The info sys
command displays also displays information about the number of counters available and the number of processor
cores supported.
l4stat0 Cobham Gaisler LEON4 Statistics Unit
APB: E4000100 - E4000200
cpus: 2, counters: 4, i/f index: 0
l4stat1 Cobham Gaisler LEON4 Statistics Unit
APB: FFA05000 - FFA05100
cpus: 2, counters: 4, i/f index: 1
The L4STAT core is accessed using the command l4stat, see command description in Appendix B, Command
syntax for more information.
If the core is connected to the DSU it is possible to count several different AHB events. In addition it is possible
to apply filter to the signals connected to the L4STAT (if the DSU supports filter), see command ahb filter
performance in Appendix B, Command syntax.
The l4stat set command is used to set up counting for a specific event. All allowed values for the event parameters
are listed with l4stat events. The number and types of events may vary between systems. Example 6.1 shows
how to set counter zero to count data cache misses on processor one and counter one to count instruction cache
misses on processor zero.
Example 6.1.
grmon3> l4stat 1 events
icmiss - icache miss
itmiss - icache tlb miss
ichold - icache hold
ithold - icache mmu hold
dcmiss - dcache miss
... more events are listed ...
grmon3> l4stat 1 set 0 1 dcmiss
cnt0: Enabling dcache miss on cpu/AHB 1
grmon3> l4stat 1 set 1 0 icmiss
cnt1: Enabling icache miss on cpu/AHB 0
grmon3> l4stat 1 status
CPU DESCRIPTION VALUE
0: cpu1 dcache miss 0000000000
1: cpu0 icache miss 0000000000
2: cpu0 icache miss 0000000000 (disabled)
3: cpu0 icache miss 0000000000 (disabled)
NOTE: Some of the L4STAT events 0x40-0x7F can be counted either per AHB master or independent of master.
The l4stat command will only count events generated by the AHB master specified in the l4stat set command.
The L4STAT debug driver provides two modes that are used to continuously sample L4STAT counters. The driver
will print out the latest read value(s) together with total accumulated amount(s) of events while polling. A poll
operation can either be started directly or be deferred until the run command is issued. In both cases, counters
should first be configured with the type of event to count. When this is done, one of the two following commands
can be issued: l4stat pollst sp int hold or l4stat runpollst sp int
The behavior of the first command, l4stat poll, depends on the hold argument. If hold is 0 or not specified, the
specified counter(s) (st - sp) will be enabled and configured to be cleared on read. These counters will then be
polled with an interval of int seconds. After each read, the core will print out the current and accumulated values for
all counters. If the hold argument is 1, GRMON will not initialize the counters. Instead the first specified counter
GRMON3-UM
69 www.cobham.com/gaisler
June 2019, Version 3.1.0
Page 70

(st) will be polled. When counter st is found to be enabled the polling operating will begin. This functionality
can be used to, for instance, let software signal when measurements should take place.
Polling ends when at least one of the following is true: User pressed CTRL+C (SIGINT) or counter st becomes
disabled. When polling stops, the debug driver will disable the selected counter(s) and also disable the automatic
clear feature.
The second command, l4stat runpoll, is used to couple the poll operation with the run command. When l4stat
runpoll st sp int has been issued, counters st - sp will be polled after the run command is given. The interval
argument in this case does not specify the poll interval seconds but rather in terms of iterations when GRMON
polls the Debug Support Unit to monitor execution. A suitable value for the int argument in this case depends on
the speed of the host computer, debug link and target system.
Example 6.2 is a transcript from a GRMON session where a vxWorks image is loaded and statistics are collected
while it runs.
Example 6.2.
grmon3> l4stat 1 set 0 0 icmiss 0
cnt0: Configuring icache miss on cpu/AHB 0
grmon3> l4stat 1 set 1 0 dcmiss 0
cnt1: Configuring dcache miss on cpu/AHB 0
grmon3> l4stat 1 set 2 0 load 0
cnt2: Configuring load instructions on cpu/AHB 0
grmon3> l4stat 1 set 3 0 store 0
cnt3: Configuring store instructions on cpu/AHB
grmon3> l4stat 1 status
CPU DESCRIPTION VALUE
0: cpu0 icache miss 0000000000 (disabled)
1: cpu0 dcache miss 0000000000 (disabled)
2: cpu0 load instructions 0000000000 (disabled)
3: cpu0 store instructions 0000000000 (disabled)
grmon3> l4stat 1 runpoll 0 3 5000
Setting up callbacks so that polling will be performed during 'run'
grmon3> load vxWorks
00003000 .text 1.5MB / 1.5MB [===============>] 100%
0018F7A8 .init$00 12B [===============>] 100%
0018F7B4 .init$99 8B [===============>] 100%
0018F7BC .fini$00 12B [===============>] 100%
0018F7C8 .fini$99 8B [===============>] 100%
0018F7E0 .data 177.5kB / 177.5kB [===============>] 100%
Total size: 1.72MB (2.03Mbit/s)
Entry point 0x3000
Image vxWorks loaded
grmon3> run
TIME COUNTER CURRENT READ CURRENT RATE TOTAL READ TOTAL RATE
5.88 0 1973061 335783 1973061 335783
5.88 1 7174279 1220946 7174279 1220946
5.88 2 22943354 3904587 22943354 3904587
5.88 3 491916 83716 491916 83716
11.16 0 0 0 1973061 176718
11.16 1 11014132 2082460 18188411 1629056
11.16 2 33072417 6253057 56015771 5017087
11.16 3 15751 2978 507667 45470
... output removed ...
51.35 0 0 0 1973061 38425
51.35 1 12113004 2079486 101754132 1981657
51.35 2 36365101 6242936 306891414 5976697
51.35 3 17273 2965 627067 12212
And alternative to coupling polling to the run command is to break execution, issue detach and then use the l4stat
poll command. There are a few items that may be worth considering when using poll and runpoll.
• All counters are not read in the same clock cycle. Depending on the debug link used there may be a significant
delay between the read of the first and the last counter.
• Measurements are timed on the host computer and reads experience jitter from several sources.
• A counter may overflow after 232 target clock cycles. The poll period (interval) should take this into account
so that counters are read (and thereby cleared) before an overflow can occur.
GRMON3-UM
70 www.cobham.com/gaisler
June 2019, Version 3.1.0
Page 71

• Counters are disabled when polling stops
• l4stat runpoll is only supported for uninterrupted run. Commands like bp and cont may disrupt measure-
ments.
• If the L4STAT core has two APB interfaces, initialize it via the interface to which traffic causes the least
disturbance to other system bus traffic.
6.12. LEON2 support
A LEON2 system has a fixed set of IP cores and address mapping. GRMON will use an internal plug and play table
that describes this configuration. The plug and play table used for LEON2 is fixed, and no automatic detection of
present cores is attempted. Only those cores that need to be initialized by GRMON are included in the table, so
the listing might not correspond to the actual target.
By default, GRMON will enable the UART receivers and transmitters for the AT697E/F by setting the corresponding bits in the IODIR register to output. This can be disabled by providing the commandline switch -at697-
nouart, GRMON will then reset the IODIR to inputs on all bits.
6.12.1. Switches
-sys at697
-sys at697e
Disable plug and play scanning and configure GRMON for an AT697E system
-sys at697f
Disable plug and play scanning and configure GRMON for an AT697F system
-at697-nouart
Disable GPIO alternate UART function. When this is set, GRMON will reset the GPIO dir register bits to
input. By default GRMON will setup the GPIO dir register to enable both UARTs for the AT697E/F.
-sys agga4
Disable plug and play scanning and configure GRMON for an AGGA4 system
-agga4-nognss
Disable the built-in support for the GNSS core to make sure that GRMON never makes any accesses to the
core. This flag should be used if no clock is provided to the GNSS core.
-sys leon2
Disable plug and play scanning and configure GRMON for a LEON2 system
6.13. On-chip logic analyzer driver
The LOGAN debug driver contains commands to control the LOGAN on-chip logic analyzer core. It allows to set
various triggering conditions and to generate VCD waveform files from trace buffer data.
The LOGAN core is accessed using the command la, see command description in Appendix B, Command syntax
for more information.
The LOGAN driver can create a VCD waveform file using the la dump command. The file setup.logan is
used to define which part of the trace buffer belong to which signal. The file is read by the debug driver before a
VCD file is generated. An entry in the file consists of a signal name followed by its size in bits separated by whitespace. Rows not having these two entries as well as rows beginning with an # are ignored. GRMON will look for
the file in the current directory. I.e. either start GRMON from the directory where setup.logan is located or
use the Tcl command cd, in GRMON, to change directory.
Example 6.3.
#Name Size
clk 1
seq 14
edclstate 4
txdstate 5
dataout0 32
dataout1 32
dataout2 32
dataout3 32
writem 1
writel 1
nak 1
lock 1
GRMON3-UM
June 2019, Version 3.1.0
71 www.cobham.com/gaisler
Page 72

The Example 6.3 has a total of 128 traced bits, divided into twelve signals of various widths. The first signal in
the configuration file maps to the most significant bits of the vector with the traced bits. The created VCD file can
be opened by waveform viewers such as GTKWave or Dinotrace.
Figure 6.1. GTKWave
6.14. Memory controllers
SRAM/SDRAM/PROM/IO memory controllers
Most of the memory controller debug drivers provides switches for timing, wait state control and sizes. They also
probes the memory during GRMON's initialization. In addition they also enables some commands. The mcfg#
sets the reset value 1 of the registers. The info sys shows the timing and amount of detected memory of each type.
Supported cores: MCTRL, SRCTRL, SSRCTRL, FTMCTRL, FTSRCTRL, FTSRCTRL8
mctrl0 European Space Agency LEON2 Memory Controller
AHB: 00000000 - 20000000
AHB: 20000000 - 40000000
AHB: 40000000 - 80000000
APB: 80000000 - 80000100
8-bit prom @ 0x00000000
32-bit sdram: 1 * 64 Mbyte @ 0x40000000
col 9, cas 2, ref 7.8 us
PC133 SDRAM Controller
PC133 SDRAM debug drivers provides switches for timing. It also probes the memory during GRMON's initialization. In addition it also enables the sdcfg1 affects, that sets the reset value 1 of the register. Supported cores:
SDCTRL, FTSDCTRL
DDR memory controller
The DDR memory controller debug drivers provides switches for timing. It also performs the DDR initialization
sequence and probes the memory during GRMON's initialization. It does not enable any commands. The info sys
shows the DDR timing and amount of detected memory. Supported cores: DDRSPA
DDR2 memory controller
The DDR2 memory controller debug driver provides switches for timing. It also performs the DDR2 initialization
sequence and probes the memory during GRMON's initialization. In addition it also enables some commands. The
ddr2cfg# only affect the DDR2SPA, that sets the reset value 1 of the register. The commands ddr2skew and
ddr2delay can be used to adjust the timing. The info sys shows the DDR timing and amount of detected memory
Supported cores: DDR2SPA
ddr2spa0 Cobham Gaisler Single-port DDR2 controller
AHB: 40000000 - 80000000
1
The memory register reset value will be written when GRMON's resets the drivers, for example when run or load is called.
GRMON3-UM
72 www.cobham.com/gaisler
June 2019, Version 3.1.0
Page 73

AHB: FFE00100 - FFE00200
32-bit DDR2 : 1 * 256 MB @ 0x40000000, 8 internal banks
200 MHz, col 10, ref 7.8 us, trfc 135 ns
SPI memory controller
The SPI memory controller debug driver is affected by the common memory commands, but provides commands
spim to perform basic communication with the core. The driver also provides functionality to read the CSD register
from SD Card and a command to reinitialize SD Cards. The debug driver has bindings to the SPI memory device
layer. These commands are accessed via spim flash. Please see Section 3.11.2, “SPI memory device” for more
information. Supported cores: SPIMCTRL
6.14.1. Switches
-edac
Enable EDAC operation (FTMCTRL)
-edac8[4|5]
Overrides the auto-probed EDAC area size for 8-bit RAM. Valid values are 4 if the EDAC uses a quarter
of the memory, or 5 if the EDAC uses a fifth. (FTMCTRL)
-rsedac
Enable Reed-Solomon EDAC operation (FTMCTRL)
-mcfg1 <val>
Set the reset value for memory configuration register 1 (MCTRL, FTMCTRL, SSRCTRL)
-mcfg2 <valn>
Set the reset value for memory configuration register 2 (MCTRL, FTMCTRL)
-mcfg3 <val>
Set the reset value for memory configuration register 3 (MCTRL, FTMCTRL, SSRCTRL)
-pageb
Enable SDRAM page burst (FTMCTRL)
-normw
Disables read-modify-write cycles for sub-word writes to 16- bit 32-bit areas with common write strobe
(no byte write strobe). (MCTRL, FTMCTRL)
ROM switches:
-romwidth [8|16|32]
Set the rom bit width. Valid values are 8, 16 or 32. (MCTRL, FTMCTRL, SRCTRL, FTSRCTRL)
-romrws <n>
Set n number of wait-states for rom reads. (MCTRL, FTMCTRL, SSRCTRL)
-romwws <n>
Set n number of wait-states for rom writes. (MCTRL, FTMCTRL, SSRCTRL)
-romws <n>
Set n number of wait-states for rom reads and writes. (MCTRL, FTMCTRL, SSRCTRL)
SRAM switches:
-nosram
Disable SRAM and map SDRAM to the whole plug and play bar. (MCTRL, FTMCTRL, SSRCTRL)
-nosram5
Disable SRAM bank 5 detection. (MCTRL, FTMCTRL)
-ram <kB>
Overrides the auto-probed amount of static ram bank size. Bank size is given in kilobytes. (MCTRL, FTMCTRL)
-rambanks <n>
Overrides the auto-probed number of populated ram banks. (MCTRL, FTMCTRL)
-ramwidth [8|16|32]
Overrides the auto-probed ram bit width. Valid values are 8, 16 or 32. (MCTRL, FTMCTRL)
-ramrws <n>
Set n number of wait-states for ram reads. (MCTRL, FTMCTRL)
-ramwws <n>
Set n number of wait-states for ram writes. (MCTRL, FTMCTRL)
GRMON3-UM
June 2019, Version 3.1.0
73 www.cobham.com/gaisler
Page 74

-ramws <n>
Set n number of wait-states for rom reads and writes. (MCTRL, FTMCTRL)
SDRAM switches:
-cas <cycles>
Programs SDRAM to either 2 or 3 cycles CAS latency and RAS/CAS delay. Default is 2. (MCTRL, FTMCTRL, SDCTRL, FTSDCTRL)
-ddr2cal
Run delay calibration routine on start-up before probing memory (see ddr2delay scan command).(DDR2SPA) (DDR2SPA)
-nosdram
Disable SDRAM. (MCTRL, FTMCTRL)
-ref <us>
Set the refresh reload value. (MCTRL, FTMCTRL, SDCTRL, FTSDCTRL)
-regmem
Enable registered memory. (DDR2SPA)
-trcd <cycles>
Programs SDRAM to either 2 or 3 cycles RAS/CAS delay. Default is 2. (DDRSPA, DDR2SPA)
-trfc <ns>
Programs the SDRAM trfc to the specified timing. (MCTRL, FTMCTRL, DDRSPA, DDR2SPA)
-trp3
Programs the SDRAM trp timing to 3. Default is 2. (MCTRL, FTMCTRL, DDRSPA, DDR2SPA)
-twr
Programs the SDRAM twr to the specified timing. (DDR2SPA)
-sddel <value>
Set the SDCLK value. (MCTRL, FTMCTRL)
-sd2tdis
Disable SDRAM 2T signaling. By default 2T is enabled on GR740 during GRMON initialization. (GR740
SDCTRL)
6.14.2. Commands
The driver for the Debug support unit provides the commands listed in Table 6.4.
Table 6.4. MEMCTRL commands
ddr2cfg1 Show or set the reset value of the memory register
ddr2cfg2 Show or set the reset value of the memory register
ddr2cfg3 Show or set the reset value of the memory register
ddr2cfg4 Show or set the reset value of the memory register
ddr2cfg5 Show or set the reset value of the memory register
ddr2delay Change read data input delay.
ddr2skew Change read skew.
mcfg1 Show or set reset value of the memory controller register 1
mcfg2 Show or set reset value of the memory controller register 2
mcfg3 Show or set reset value of the memory controller register 3
sdcfg1 Show or set reset value of SDRAM controller register 1
sddel Show or set the SDCLK delay
spim Commands for the SPI memory controller
6.15. Memory scrubber
The MEMSCRUB core is accessed using the command scrub, see command description in Appendix B, Command
syntax for more information. It provides commands for reading the core’s status, and performing some basic
operations such as clearing memory.
GRMON3-UM
June 2019, Version 3.1.0
74 www.cobham.com/gaisler
Page 75

The info sys command displays information on the configured burst length of the scrubber.
memscrub0 Cobham Gaisler AHB Memory Scrubber
AHB Master 1
AHB: FFE01000 - FFE01100
IRQ: 28
burst length: 32 bytes
6.16. MIL-STD-1553B Interface
The info sys command displays the enabled parts of the core, and the configured codec clock frequency. The
GR1553B core is accessed using the command mil, see command description in Appendix B, Command syntax
for more information.
gr1553b0 Cobham Gaisler MIL-STD-1553B Interface
APB: FFA02000 - FFA02100
IRQ: 26
features: BC RT BM, codec clock: 20 MHz
Device index: 0
Examining data structures
The mil bcx and mil bmx commands prints the contents of memory interpreted as BC descriptors or BM entries,
in human readable form, as seen in Example 6.4.
Example 6.4.
grmon3> mil bcx 0x40000080
Address TType RTAddr:SA WC Bus Tries SlTime TO Options Result vStat BufPtr
========== ===== =========== == === ======= ====== == ======= ======= ==== ========
0x40000080 BC-RT 05:30 1 B 01:Same 0 14 s NoRes 1 0000 40000000
0x40000090 RT-BC 05:30 1 B 01:Same 0 14 s [Not written] 40000040
0x400000a0 BC-RT 05:30 2 B 01:Same 0 14 s [Not written] 40000000
0x400000b0 RT-BC 05:30 2 B 01:Same 0 14 s [Not written] 40000040
0x400000c0 BC-RT 05:30 3 B 01:Same 0 14 s [Not written] 40000000
0x400000d0 RT-BC 05:30 3 B 01:Same 0 14 s [Not written] 40000040
0x400000e0 BC-RT 05:30 4 B 01:Same 0 14 s [Not written] 40000000
Data transfers
If the GR1553B core is BC capable, you can perform data transfers directly from the GRMON command line. The
commands exist in two variants: mil get and mil put that specify data directly on the command line and through
the terminal, and mil getm and mil putm that sends/receives data to an address in RAM.
In order to perform BC data transfers, you must have a temporary buffer in memory to store descriptors and data,
this is set up with the mil buf command.
The data transfer commands use the asynchronous scheduling feature of the core, which means that the command
can be performed even if a regular BC schedule is running in parallel. The core will perform the transfer while
the primary schedule is idle and will not affect the schedule. It can even be run with BC software active in the
background, as long as the software does not make use of asynchronous transfer lists.
If the primary schedule blocks the asynchronous transfer for more than two seconds, the transfer will be aborted
and an error message is printed. This can happen if the running schedule does not have any slack, or if it is stuck
in suspended state or waiting for a sync pulse with no previous slot time left. In this case, you need to stop the
ordinary processing (see mil halt) and retry the transfer.
Temporary data buffer
Many of the mil subcommands need a temporary data buffer in order to do their work. The address of this buffer
is set using the mil buf command and defaults to the start of RAM. By default the driver will read out the existing
contents and write it back after the transfer is done, this can be changed using the mil bufmode command.
If the core is on a different bus where the RAM is at another address range, the scratch area address in the core’s
address space should be given as an additional coreaddr argument to the mil buf command.
Halting and resuming
The mil halt command will stop and disable the RT,BC and BM parts of the core, preventing them from creating
further DMA and 1553 bus traffic during debugging. Before this is done, the current enable state is stored, which
allows it to later be restored using mil resume. The core is halted gracefully and the command will wait for current
ongoing transfers to finish.
GRMON3-UM
75 www.cobham.com/gaisler
June 2019, Version 3.1.0
Page 76

The state preserved between mil halt and mil resume are:
• BC schedules' (both primary and async) states and next positions. If schedule is not stopped, the last transfer
status is also preserved (as explained below)
• BC IRQ ring position
• RT address, enable status, subaddress table location, mode code control register, event log size and position
• BM enable status, filter settings, ring buffer pointers, time tag setup
State that is not preserved is:
• IRQ set/clear status
• BC schedule time register and current slot time left.
• RT bus words and sync register
• RT and BM timer values
• Descriptors and other memory contents
For the BC, some extra handling is necessary as the last transfer status is not accessible via the register interface.
In some cases, the BC must be probed for the last transfer status by running a schedule with conditional suspends
and checking which ones are taken. This requires the temporary data buffer to be setup (see mil buf).
Loop-back test
The debug driver contains a loop-back test command mil lbtest for testing 1553 transmission on both buses between two devices. In this test, one of the devices is configured as RT with a loop-back subaddress 30. The other
device is configured as BC, sends and receives back data with increasing transfer size up to the maximum of 32
words.
The mil lbtest command needs a 16K RAM scratch area, which is either given as extra argument or selected using
the mil buf command as described in the previous section.
Before performing the loop-back test, the routine performs a test of the core’s internal time base, by reading out
the timer value at a time interval, and displays the result. This is to quickly identify if the clock provided to the
core has the wrong frequency.
In the RT case, the command first configures the RT to the address given and enables subaddress 30 in loopback mode with logging. The RT event log is then polled and events arriving are printed out to the console. The
command exits after 60 seconds of inactivity.
In the BC case, the command sets up a descriptor list with alternating BC-to-RT and RT-to-BC transfers of increasing size. After running through the list, the received and transmitted data are compared. This is looped twice,
for each bus.
6.17. PCI
The debug driver for the PCI cores are mainly useful for PCI host systems. It provides a command that initializes
the host. The initialization sets AHB to PCI memory address translation to 1:1, AHB to PCI I/O address translation
to 1:1, points BAR1 to 0x40000000 and enables PCI memory space and bus mastering, but it will not configure
target bars. To configure the target bars on the pci bus, call pci conf after the core has been initialized. Commands
for scanning the bus, disabling byte twisting and displaying information are also provided.
The PCI cores are accessed using the command pci, see command description in Appendix B, Command syntax
for more information. Supported cores are GRPCI, GRPCI2 and PCIF.
The PCI commands have been split up into several sub commands in order for the user to have full control over
what is modified. The init command initializes the host controller, which may not be wanted when the LEON target
software has set up the PCI bus. The typical two different use cases are, GRMON configures PCI or GRMON scan
PCI to viewing the current configuration. In the former case GRMON can be used to debug PCI hardware and
the setup, it enables the user to set up PCI so that the CPU or GRMON can access PCI boards over I/O, Memory
and/or Configuration space and the PCI board can do DMA to the 0x40000000 AMBA address. The latter case
is often used when debugging LEON PCI software, the developer may for example want to see how Linux has
configured PCI but not to alter anything that would require Linux to reboot. Below are command sequences of
the two typical use cases on the ML510 board:
GRMON3-UM
June 2019, Version 3.1.0
76 www.cobham.com/gaisler
Page 77

grmon3> pci init
grmon3> pci conf
PCI devices found:
Bus 0 Slot 1 function: 0 [0x8]
Vendor id: 0x10b9 (ULi Electronics Inc.)
Device id: 0x5451 (M5451 PCI AC-Link Controller Audio Device)
IRQ INTA# LINE: 0
BAR 0: 1201 [256B]
BAR 1: 82206000 [4kB]
Bus 0 Slot 2 function: 0 [0x10]
Vendor id: 0x10b9 (ULi Electronics Inc.)
Device id: 0x1533 (M1533/M1535/M1543 PCI to ISA Bridge [Aladdin IV/V/V+])
Bus 0 Slot 3 function: 0 [0x18]
Vendor id: 0x10b9 (ULi Electronics Inc.)
Device id: 0x5457 (M5457 AC'97 Modem Controller)
IRQ INTA# LINE: 0
BAR 0: 82205000 [4kB]
BAR 1: 1101 [256B]
Bus 0 Slot 6 function: 0 [0x30] (BRIDGE)
Vendor id: 0x3388 (Hint Corp)
Device id: 0x21 (HB6 Universal PCI-PCI bridge (non-transparent mode))
Primary: 0 Secondary: 1 Subordinate: 1
I/O: BASE: 0x0000f000, LIMIT: 0x00000fff (DISABLED)
MEMIO: BASE: 0x82800000, LIMIT: 0x830fffff (ENABLED)
MEM: BASE: 0x80000000, LIMIT: 0x820fffff (ENABLED)
Bus 0 Slot 9 function: 0 [0x48] (BRIDGE)
Vendor id: 0x104c (Texas Instruments)
Device id: 0xac23 (PCI2250 PCI-to-PCI Bridge)
Primary: 0 Secondary: 2 Subordinate: 2
I/O: BASE: 0x00001000, LIMIT: 0x00001fff (ENABLED)
MEMIO: BASE: 0x82200000, LIMIT: 0x822fffff (ENABLED)
MEM: BASE: 0x82100000, LIMIT: 0x821fffff (ENABLED)
Bus 0 Slot c function: 0 [0x60]
Vendor id: 0x10b9 (ULi Electronics Inc.)
Device id: 0x7101 (M7101 Power Management Controller [PMU])
Bus 0 Slot f function: 0 [0x78]
Vendor id: 0x10b9 (ULi Electronics Inc.)
Device id: 0x5237 (USB 1.1 Controller)
IRQ INTA# LINE: 0
BAR 0: 82204000 [4kB]
Bus 1 Slot 0 function: 0 [0x100]
Vendor id: 0x102b (Matrox Electronics Systems Ltd.)
Device id: 0x525 (MGA G400/G450)
IRQ INTA# LINE: 0
BAR 0: 80000008 [32MB]
BAR 1: 83000000 [16kB]
BAR 2: 82800000 [8MB]
ROM: 82000001 [128kB] (ENABLED)
Bus 2 Slot 2 function: 0 [0x210]
Vendor id: 0x10b9 (ULi Electronics Inc.)
Device id: 0x5237 (USB 1.1 Controller)
IRQ INTB# LINE: 0
BAR 0: 82202000 [4kB]
Bus 2 Slot 2 function: 1 [0x211]
Vendor id: 0x10b9 (ULi Electronics Inc.)
Device id: 0x5237 (USB 1.1 Controller)
IRQ INTC# LINE: 0
BAR 0: 82201000 [4kB]
Bus 2 Slot 2 function: 2 [0x212]
Vendor id: 0x10b9 (ULi Electronics Inc.)
Device id: 0x5237 (USB 1.1 Controller)
IRQ INTD# LINE: 0
BAR 0: 82200000 [4kB]
Bus 2 Slot 2 function: 3 [0x213]
Vendor id: 0x10b9 (ULi Electronics Inc.)
Device id: 0x5239 (USB 2.0 Controller)
IRQ INTA# LINE: 0
BAR 0: 82203200 [256B]
GRMON3-UM
June 2019, Version 3.1.0
77 www.cobham.com/gaisler
Page 78

Bus 2 Slot 3 function: 0 [0x218]
Vendor id: 0x1186 (D-Link System Inc)
Device id: 0x4000 (DL2000-based Gigabit Ethernet)
IRQ INTA# LINE: 0
BAR 0: 1001 [256B]
BAR 1: 82203000 [512B]
ROM: 82100001 [64kB] (ENABLED)
When analyzing the system, the sub commands info and scan can be called without altering the hardware configuration:
grmon3> pci info
GRPCI initiator/target (in system slot):
Bus master: yes
Mem. space en: yes
Latency timer: 0x0
Byte twisting: disabled
MMAP: 0x8
IOMAP: 0xfff2
BAR0: 0x00000000
PAGE0: 0x40000001
BAR1: 0x40000000
PAGE1: 0x40000000
grmon3> pci scan
Warning: PCI driver has not been initialized
Warning: PCI driver has not been initialized
PCI devices found:
Bus 0 Slot 1 function: 0 [0x8]
Vendor id: 0x10b9 (ULi Electronics Inc.)
Device id: 0x5451 (M5451 PCI AC-Link Controller Audio Device)
IRQ INTA# LINE: 0
BAR 0: 1201 [256B]
BAR 1: 82206000 [4kB]
Bus 0 Slot 2 function: 0 [0x10]
Vendor id: 0x10b9 (ULi Electronics Inc.)
Device id: 0x1533 (M1533/M1535/M1543 PCI to ISA Bridge [Aladdin IV/V/V+])
Bus 0 Slot 3 function: 0 [0x18]
Vendor id: 0x10b9 (ULi Electronics Inc.)
Device id: 0x5457 (M5457 AC'97 Modem Controller)
IRQ INTA# LINE: 0
BAR 0: 82205000 [4kB]
BAR 1: 1101 [256B]
Bus 0 Slot 6 function: 0 [0x30] (BRIDGE)
Vendor id: 0x3388 (Hint Corp)
Device id: 0x21 (HB6 Universal PCI-PCI bridge (non-transparent mode))
Primary: 0 Secondary: 1 Subordinate: 1
I/O: BASE: 0x0000f000, LIMIT: 0x00000fff (DISABLED)
MEMIO: BASE: 0x82800000, LIMIT: 0x830fffff (ENABLED)
MEM: BASE: 0x80000000, LIMIT: 0x820fffff (ENABLED)
Bus 0 Slot 9 function: 0 [0x48] (BRIDGE)
Vendor id: 0x104c (Texas Instruments)
Device id: 0xac23 (PCI2250 PCI-to-PCI Bridge)
Primary: 0 Secondary: 2 Subordinate: 2
I/O: BASE: 0x00001000, LIMIT: 0x00001fff (ENABLED)
MEMIO: BASE: 0x82200000, LIMIT: 0x822fffff (ENABLED)
MEM: BASE: 0x82100000, LIMIT: 0x821fffff (ENABLED)
Bus 0 Slot c function: 0 [0x60]
Vendor id: 0x10b9 (ULi Electronics Inc.)
Device id: 0x7101 (M7101 Power Management Controller [PMU])
Bus 0 Slot f function: 0 [0x78]
Vendor id: 0x10b9 (ULi Electronics Inc.)
Device id: 0x5237 (USB 1.1 Controller)
IRQ INTA# LINE: 0
BAR 0: 82204000 [4kB]
Bus 1 Slot 0 function: 0 [0x100]
Vendor id: 0x102b (Matrox Electronics Systems Ltd.)
Device id: 0x525 (MGA G400/G450)
GRMON3-UM
June 2019, Version 3.1.0
78 www.cobham.com/gaisler
Page 79

IRQ INTA# LINE: 0
BAR 0: 80000008 [32MB]
BAR 1: 83000000 [16kB]
BAR 2: 82800000 [8MB]
ROM: 82000001 [128kB] (ENABLED)
Bus 2 Slot 2 function: 0 [0x210]
Vendor id: 0x10b9 (ULi Electronics Inc.)
Device id: 0x5237 (USB 1.1 Controller)
IRQ INTB# LINE: 0
BAR 0: 82202000 [4kB]
Bus 2 Slot 2 function: 1 [0x211]
Vendor id: 0x10b9 (ULi Electronics Inc.)
Device id: 0x5237 (USB 1.1 Controller)
IRQ INTC# LINE: 0
BAR 0: 82201000 [4kB]
Bus 2 Slot 2 function: 2 [0x212]
Vendor id: 0x10b9 (ULi Electronics Inc.)
Device id: 0x5237 (USB 1.1 Controller)
IRQ INTD# LINE: 0
BAR 0: 82200000 [4kB]
Bus 2 Slot 2 function: 3 [0x213]
Vendor id: 0x10b9 (ULi Electronics Inc.)
Device id: 0x5239 (USB 2.0 Controller)
IRQ INTA# LINE: 0
BAR 0: 82203200 [256B]
Bus 2 Slot 3 function: 0 [0x218]
Vendor id: 0x1186 (D-Link System Inc)
Device id: 0x4000 (DL2000-based Gigabit Ethernet)
IRQ INTA# LINE: 0
BAR 0: 1001 [256B]
BAR 1: 82203000 [512B]
ROM: 82100001 [64kB] (ENABLED)
grmon3> pci bus reg
grmon3> info sys pdev0 pdev5 pdev10
pdev0 Bus 00 Slot 01 Func 00 [0:1:0]
vendor: 0x10b9 ULi Electronics Inc.
device: 0x5451 M5451 PCI AC-Link Controller Audio Device
class: 040100 (MULTIMEDIA)
BAR1: 00001200 - 00001300 I/O-32 [256B]
BAR2: 82206000 - 82207000 MEMIO [4kB]
IRQ INTA# -> IRQX
pdev5 Bus 00 Slot 09 Func 00 [0:9:0]
vendor: 0x104c Texas Instruments
device: 0xac23 PCI2250 PCI-to-PCI Bridge
class: 060400 (PCI-PCI BRIDGE)
Primary: 0 Secondary: 2 Subordinate: 2
I/O Window: 00001000 - 00002000
MEMIO Window: 82200000 - 82300000
MEM Window: 82100000 - 82200000
pdev10 Bus 02 Slot 03 Func 00 [2:3:0]
vendor: 0x1186 D-Link System Inc
device: 0x4000 DL2000-based Gigabit Ethernet
class: 020000 (ETHERNET)
subvendor: 0x1186, subdevice: 0x4004
BAR1: 00001000 - 00001100 I/O-32 [256B]
BAR2: 82203000 - 82203200 MEMIO [512B]
ROM: 82100000 - 82110000 MEM [64kB]
IRQ INTA# -> IRQW
A configured PCI system can be registered into the GRMON device handling system similar to the on-chip AMBA
bus devices, controlled using the pci bus commands. GRMON will hold a copy of the PCI configuration in memory
until a new pci conf, pci bus unreg or pci scan is issued. The user is responsible for updating GRMON's PCI
configuration if the configuration is updated in hardware. The devices can be inspected from info sys and Tcl
variables making read and writing PCI devices configuration space easier. The Tcl variables are named in a similar
fashion to AMBA devices, for example puts $pdev0::status prints the STATUS register of PCI device0. See pci
bus reference description and Appendix C, Tcl API.
NOTE: Only the pci info command has any effect on non-host systems.
Also note that the pci conf command can fail to configure all found devices if the PCI address space addressable
by the PCI Host controller is smaller than the amount of memory needed by the devices.
GRMON3-UM
79 www.cobham.com/gaisler
June 2019, Version 3.1.0
Page 80

The pci scan command may fail if the PCI buses (PCI-PCI bridges) haven't been enumerated correctly in a multi-bus PCI system.
After registering the PCI bus into GRMON's device handling system commands may access device information
and Tcl may access variables (PCI configuration space registers). Accessing bad PCI regions may lead to target
deadlock where the debug-link may disconnect/hang. It is the user's responsibility to make sure that GRMON's PCI
information is correct. The PCI bus may need to be re-scanned/unregistered when changes to the PCI configuration
has been made by the target OS running on the LEON.
6.17.1. PCI Trace
The pci trace commands are supported by the cores PCITRACE, GRPCI2 and GRPCI2_TB. The commands can
be used to control the trace and viewing trace data. With the commands it is possible to set up trigger conditions that
must match to set the trigger off. When the triggering condition is matched the AHBTRACE stops the recording
of the PCI bus and the log is available for inspection using the pci trace log command. The pci trace tdelay
command can be used to delay the stop of the trace recording after a trigging match.
The info sys command displays the size of the trace buffer in number of lines.
pcitrace0 Cobham Gaisler 32-bit PCI Trace Buffer
APB: C0101000 - C0200000
Trace buffer size: 128 lines
pci0 Cobham Gaisler GRPCI2 PCI/AHB bridge
AHB Master 5
AHB: C0000000 - D0000000
AHB: FFF00000 - FFF40000
APB: 80000600 - 80000700
IRQ: 6
Trace buffer size: 1024 lines
pcitrace1 Cobham Gaisler GRPCI2 Trace buffer
APB: 80040000 - 80080000
Trace buffer size: 1024 lines
6.18. SPI
The SPICTRL debug driver provides commands to configure the SPI controller core. The driver also enables the
user to perform simple data transfers. The info sys command displays the core’s FIFO depth and the number of
available slave select signals.
spi0 Cobham Gaisler SPI Controller
APB: C0100000 - C0100100
IRQ: 23
FIFO depth: 8, 2 slave select signals
Maximum word length: 32 bits
Supports automated transfers
Supports automatic slave select
Controller index for use in GRMON: 0
The SPICTRL core is accessed using the command spi, see command description in Appendix B, Command syntax
for more information.
The debug driver has bindings to the SPI memory device layer. These commands are accessed via spi flash. Please
see Section 3.11.2, “SPI memory device” for more information.
NOTE: For information about the SPI memory controller (SPIMCTRL), see Section 6.14, “Memory controllers ”.
6.19. SpaceWire router
The SPWROUTER core is accessed using the command spwrtr, see command description in Appendix B, Command syntax for more information. It provides commands to display the core’s registers. The command can also
be used to display or setup the routing table.
The info reg command only displays a subset of all the registers available. Add -all to the info reg command to
print all registers, or specify one or more register to print a subset. Add -l to info reg to list all the register names.
grmon3> info reg -all -l spwrtr0
GRMON3-UM
80 www.cobham.com/gaisler
June 2019, Version 3.1.0
Page 81

GRSPW Router
0xff880004 rtpmap_1 Port 1 routing table map
0xff880008 rtpmap_2 Port 2 routing table map
0xff88000c rtpmap_3 Port 3 routing table map
...
grmon3> info reg spwrtr0::pctrl_2 spwrtr0::rtpmap_2 spwrtr0::rtpmap_64
GRSPW Router
0xff880808 Port 2 control 0x1300002c
GRSPW Router
0xff880008 Port 2 routing table map 0x00000021
GRSPW Router
0xff880100 Logical addr. 64 routing table map 0x00001c38
In addition, all registers and register fields are available as variables, see Tcl API more information.
The info sys command displays how many ports are implemented in the router.
spwrtr0 Cobham Gaisler GRSPW Router
AHB: FF880000 - FF881000
Instance id: 67
SpW ports: 8 AMBA ports: 4 FIFO ports: 0
6.20. SVGA frame buffer
The SVGACTRL debug driver implements functions to report the available video clocks in the SVGA frame
buffer, and to display screen patters for testing. The info sys command will display the available video clocks.
svga0 Cobham Gaisler SVGA frame buffer
AHB Master 2
APB: C0800000 - C0800100
clk0: 25.00 MHz clk1: 25.00 MHz clk2: 40.00 MHz clk3: 65.00 MHz
The SVGACTRL core is accessed using the command svga, see command description in Appendix B, Command
syntax for more information.
The svga draw test_screen command will show a simple grid in the resolution specified via the format selection.
The color depth can be either 16 or 32 bits.
The svga draw file command will determine the resolution of the specified picture and select an appropriate
format (resolution and refresh rate) based on the video clocks available to the core. The required file format is
ASCII PPM which must have a suitable amount of pixels. For instance, to draw a screen with resolution 640x480,
a PPM file which is 640 pixels wide and 480 pixels high must be used. ASCII PPM files can be created with, for
instance, the GNU Image Manipulation Program (The GIMP).
The svga custom period horizontal-active-video horizontal-front-porch horizon-
tal-sync horizontal-back-porch vertical-active-video vertical-front-porch
vertical-sync vertical-back-porch command can be used to specify a custom format. The custom
format will have precedence when using the svga draw command.
GRMON3-UM
June 2019, Version 3.1.0
81 www.cobham.com/gaisler
Page 82

7. Support
For support contact the Cobham Gaisler support team at support@gaisler.com.
When contacting support, please identify yourself in full, including company affiliation and site name and address.
Please identify exactly what product that is used, specifying if it is an IP core (with full name of the library
distribution archive file), component, software version, compiler version, operating system version, debug tool
version, simulator tool version, board version, etc.
The support service is only for paying customers with a support contract.
GRMON3-UM
June 2019, Version 3.1.0
82 www.cobham.com/gaisler
Page 83

Appendix A. Command index
This section lists all documented commands available in GRMON3.
Table A.1. GRMON command oveview
Command
Name
about Show information about GRMON
ahb Print AHB transfer entries in the trace buffer
amem Asynchronous bus read
attach Stop execution and attach GRMON to processor again
at Print AHB transfer entries in the trace buffer
batch Execute batch script
bdump Dump memory to a file
bload Load a binary file
bp Add, delete or list breakpoints
bt Print backtrace
cctrl Display or set cache control register
cont Continue execution
cpu Enable, disable CPU or select current active cpu
dcache Show, enable or disable data cache
dccfg Display or set data cache configuration register
dcom Print or clear debug link statistics
ddr2cfg1 Show or set the reset value of the memory register
ddr2cfg2 Show or set the reset value of the memory register
ddr2cfg3 Show or set the reset value of the memory register
ddr2cfg4 Show or set the reset value of the memory register
ddr2cfg5 Show or set the reset value of the memory register
ddr2delay Change read data input delay.
ddr2skew Change read skew.
detach Resume execution with GRMON detached from processor
disassemble Disassemble memory
dump Dump memory to a file
dwarf print or lookup dwarf information
edcl Print or set the EDCL ip
eeload Load a file into an EEPROM
ehci Controll the USB host ECHI core
ei Error injection
ep Set entry point
execsh Run commands in the execution shell
exit Exit GRMON
flash Write, erase or show information about the flash
float Display FPU registers
Description
GRMON3-UM
June 2019, Version 3.1.0
83 www.cobham.com/gaisler
Page 84

Command
Name
forward Control I\/O forwarding
gdb Controll the builtin GDB remote server
go Start execution without any initialization
gr1553b MIL-STD-1553B Interface commands
grcg Control clockgating
grpwm Controll the GRPWM core
grtmtx Control GRTM devices
gui Control the graphical user interface
help Print all commands or detailed help for a specific command
hist Print AHB transfer or intruction entries in the trace buffer
i2c Commands for the I2C masters
icache Show, enable or disable instruction cache
iccfg Display or set instruction cache configuration register
info Show information
inst Print intruction entries in the trace buffer
iommu Control IO memory management unit
irq Force interrupts or read IRQ(A)MP status information
l2cache L2 cache control
l3stat Control Leon3 statistics unit
l4stat Control Leon4 statistics unit
la Control the LOGAN core
leon Print leon specific registers
load Load a file or print filenames of uploaded files
mcfg1 Show or set reset value of the memory controller register 1
mcfg2 Show or set reset value of the memory controller register 2
mcfg3 Show or set reset value of the memory controller register 3
mdio Show PHY registers
memb AMBA bus 8-bit memory read access, list a range of addresses
memh AMBA bus 16-bit memory read access, list a range of addresses
mem AMBA bus 32-bit memory read access, list a range of addresses
mil MIL-STD-1553B Interface commands
mmu Print or set the SRMMU registers
nolog Suppress stdout of a command
pci Control the PCI bus master
perf Measure performance
phyaddr Set the default PHY address
profile Enable, disable or show simple profiling
quit Quit the GRMON console
reg Show or set integer registers.
reset Reset drivers
Description
GRMON3-UM
June 2019, Version 3.1.0
84 www.cobham.com/gaisler
Page 85

Command
Name
rtg4fddr Print initialization sequence
rtg4serdes Print initialization sequence
run Reset and start execution
scrub Control memory scrubber
sdcfg1 Show or set reset value of SDRAM controller register 1
sddel Show or set the SDCLK delay
sf2mddr Print initialization sequence
sf2serdes Print initialization sequence
shell Execute shell process
silent Suppress stdout of a command
spim Commands for the SPI memory controller
spi Commands for the SPI controller
spwrtr Spacewire router information
stack Set or show the intial stack-pointer
step Step one ore more instructions
stop Interrupts current CPU execution
svga Commands for the SVGA controller
symbols Load, print or lookup symbols
thread Show OS-threads information or backtrace
timer Show information about the timer devices
tmode Select tracing mode between none, processor-only, AHB only or both.
uhci Controll the USB host UHCI core
usrsh Run commands in threaded user shell
va Translate a virtual address
verify Verify that a file has been uploaded correctly
vmemb AMBA bus 8-bit virtual memory read access, list a range of addresses
vmemh AMBA bus 16-bit virtual memory read access, list a range of addresses
vmem AMBA bus 32-bit virtual memory read access, list a range of addresses
vwmemb AMBA bus 8-bit virtual memory write access
vwmemh AMBA bus 16-bit virtual memory write access
vwmems Write a string to an AMBA bus virtual memory address
vwmem AMBA bus 32-bit virtual memory write access
walk Translate a virtual address, print translation
wash Clear or set memory areas
wmdio Set PHY registers
wmemb AMBA bus 8-bit memory write access
wmemh AMBA bus 16-bit memory write access
wmems Write a string to an AMBA bus memory address
wmem AMBA bus 32-bit memory write access
Description
GRMON3-UM
June 2019, Version 3.1.0
85 www.cobham.com/gaisler
Page 86

Appendix B. Command syntax
This section lists the syntax of all documented commands available in GRMON3
GRMON3-UM
June 2019, Version 3.1.0
86 www.cobham.com/gaisler
Page 87

1. about - syntax
NAME
about - Show information about GRMON
SYNOPSIS
about
DESCRIPTION
about
Show information about GRMON
GRMON3-UM
June 2019, Version 3.1.0
87 www.cobham.com/gaisler
Page 88

2. ahb - syntax
NAME
ahb - Print AHB transfer entries in the trace buffer
SYNOPSIS
ahb ?length?
ahb subcommand ?args...?
DESCRIPTION
ahb ?length?
Print the AHB trace buffer. The ?length? entries will be printed, default is 10.
ahb break boolean
Enable or disable if the AHB trace buffer should break the CPU into debug mode. If disabled it will freeze
the buffer and the CPU will continue to execute. Default value of the boolean is true.
ahb force ?boolean?
Enable or disable the AHB trace buffer even when the processor is in debug mode. Default value of the
boolean is true.
ahb performance ?boolean?
Enable or disable the filter on the signals connected to the performance counters, see “LEON3 Statistics
Unit (L3STAT)” and “LEON4 Statistics Unit (L4STAT)”. Only available for DSU3 version 2 and above,
and DSU4.
ahb timer ?boolean?
Enable the timetag counter when in debug mode. Default value of the boolean is true. Only available for
DSU3 version 2 and above, and DSU4.
ahb delay cnt
If cnt is non-zero, the CPU will enter debug-mode after delay trace entries after an AHB watchpoint was
hit.
ahb filter reads ?boolean?
ahb filter writes ?boolean?
ahb filter addresses ?boolean? ?address mask?
Enable or disable filtering options if supported by the DSU core. When enabling the addresses filter, the
second AHB breakpoint register will be used to define the range of the filter. Default value of the boolean
is true. If left out, then the address and mask will be ignored. They can also be set with the command ahb
filter range. (Not available in all implementations)
ahb filter range address mask
Set the base address and mask that the AHB trace buffer will include if the address filtering is enabled.
(Only available in some DSU4 implementations).
ahb filter bwmask mask
ahb filter dwmask mask
Set which AHB bus/data watchpoints that the filter will affect.
ahb filter mmask mask
ahb filter smask mask
Set which AHB masters or slaves connected to the bus to exclude. (Only available in some DSU4 implementations)
ahb status
Print AHB trace buffer settings.
RETURN VALUE
Upon successful completion, ahb returns a list of trace buffer entries. Each entry is a sublist on the format format:
{AHB time addr data rw trans size master lock resp bp}. The data field is a sublist of 1,2 or 4
words with MSB first, depending on the size of AMBA bus. Detailed description about the different fields can be
found in the DSU core documentation in document grip.pdf. [http://gaisler.com/products/grlib/grip.pdf]
The other subcommands have no return value.
GRMON3-UM
June 2019, Version 3.1.0
88 www.cobham.com/gaisler
Page 89

EXAMPLE
Print 10 rows
grmon3> ahb
TIME ADDRESS D[127:96] D[95:64] D[63:32] D[31:0] TYPE ...
266718 FF900004 00000084 00000084 00000084 00000084 read ...
266727 FF900000 0000000D 0000000D 0000000D 0000000D write ...
266760 000085C0 C2042054 80A06000 02800003 01000000 read ...
266781 000085D0 C2260000 81C7E008 91E80008 9DE3BF98 read ...
266812 0000B440 00000000 00000000 00000000 00000000 read ...
266833 0000B450 00000000 00000000 00000000 00000000 read ...
266899 00002640 02800005 01000000 C216600C 82106040 read ...
266920 00002650 C236600C 40001CBD 90100011 1080062E read ...
266986 00000800 91D02000 01000000 01000000 01000000 read ...
267007 00000810 91D02000 01000000 01000000 01000000 read ...
TCL returns:
{AHB 266718 0xFF900004 {0x00000084 0x00000084 0x00000084 0x00000084} R 0 2 2
0 0 0 0} {AHB 266727 0xFF900000 {0x0000000D 0x0000000D 0x0000000D 0x0000000D}
W 0 2 2 0 0 0 0} {AHB 266760 0x000085C0 {0xC2042054 0x80A06000 0x02800003
0x01000000} R 0 2 4 1 0 0 0} {AHB 266781 0x000085D0 ...
Print 2 rows
grmon3> ahb 2
TIME ADDRESS D[127:96] D[95:64] D[63:32] D[31:0] TYPE ...
266986 00000800 91D02000 01000000 01000000 01000000 read ...
267007 00000810 91D02000 01000000 01000000 01000000 read ...
TCL returns:
{AHB 266986 0x00000800 {0x91D02000 0x01000000 0x01000000 0x01000000} R 0 2 4
1 0 0 0} {AHB 267007 0x00000810 {0x91D02000 0x01000000 0x01000000 0x01000000}
R 0 3 4 1 0 0 0}
SEE ALSO
Section 3.4.9, “Using the trace buffer”
tmode
GRMON3-UM
June 2019, Version 3.1.0
89 www.cobham.com/gaisler
Page 90

3. amem - syntax
NAME
amem - Asynchronous bus read
SYNOPSIS
amem
amem list
amem subcommand ?arg?
DESCRIPTION
The amem command is used to schedule bus read transfers for later retrieval of the result. Each transfer is associated with a handle that has to be created before starting a transfer. Multiple concurrent transfers are supported
by using separate handles per transfer.
amem
amem list
List all amem handles and their states. An amem state is one of IDLE, RUN or DONE.
amem add name
Create a new amem handle named named name. The name is used as an identifier for the handle when
using other amem commands.
amem delete name
Delete the amem handle named name.
amem eval name address length
Schedule a bus read access for the handle name to read length bytes, starting at address. If a transfer
is already in progress, then the command will fail with the error code set to EBUSY.
amem wait name
Wait for an access to finish. The command returns when handle name is no longer in the RUN state.
amem result name
Return the result of a previous read access if finished, or raise an error if not finished.
amem prio name ?value?
Display or set debug link priority for a handle. 0 is the highest priority and 4 is the lowest.
amem state name
Display and return the current state of a handle.
RETURN VALUE
amem list returns a list of amem handle entries. Each entry is a sublist of the format: {name state}.
amem result returns the read data.
amem prio returns the priority.
amem state returns one of the strings IDLE, RUN or DONE.
EXAMPLE
Create a handle named myhandle and schedule a read of 1 MiB from address 0 in the background.
grmon3> amem add myhandle
Added amem handle: myhandle
grmon3> amem eval myhandle 0 0x100000
grmon3> set myresult [amem result myhandle]
List handles
grmon3> amem list
GRMON3-UM
June 2019, Version 3.1.0
90 www.cobham.com/gaisler
Page 91

grmon3> amem list
NAME STATE ADDRESS LENGTH PRIO NREQ BYTES ERRORS
myhandle IDLE - - 4 1 1048576 0
test0 DONE 0x00000004 0x00000064 4 1 100 0
SEE ALSO
mem
Section 3.4.7, “Displaying memory contents”
GRMON3-UM
June 2019, Version 3.1.0
91 www.cobham.com/gaisler
Page 92

4. attach - syntax
attach - Stop execution and attach GRMON to processor again
SYNOPSIS
attach
DESCRIPTION
attach
This command will stop the execution on all CPUs that was started by the command detach and attach
GRMON again.
RETURN VALUE
Command attach has no return value.
GRMON3-UM
June 2019, Version 3.1.0
92 www.cobham.com/gaisler
Page 93

5. at - syntax
NAME
at - Print AHB transfer entries in the trace buffer
SYNOPSIS
at ?length?
at subcommand ?args...?
DESCRIPTION
at ?length? ?devname?
Print the AHB trace buffer. The ?length? entries will be printed, default is 10.
at bp1 ?options? ?address mask? ?devname?
at bp2 ?options? ?address mask? ?devname?
Sets trace buffer breakpoint to address and mask. Available options are -read or -write.
at bsel ?bus? ?devname?
Selects bus to trace (not available in all implementations)
at delay ?cnt? ?devname?
Delay the stops the trace buffer recording after match.
at disable ?devname?
Stops the trace buffer recording
at enable ?devname?
Arms the trace buffer and starts recording.
at filter reads ?boolean? ?devname?
at filter writes ?boolean? ?devname?
at filter addresses ?boolean? ?address mask? ?devname?
Enable or disable filtering options if supported by the core. When enabling the addresses filter, the second
AHB breakpoint register will be used to define the range of the filter. Default value of the boolean is true. If
left out, then the address and mask will be ignored. They can also be set with the command at filter range.
at filter range ?address mask? ?devname?
Set the base address and mask that the AHB trace buffer will include if the address filtering is enabled.
at filter mmask mask ?devname?
at filter smask mask ?devname?
Set which AHB masters or slaves connected to the bus to exclude. (Only available in some DSU4 implementations)
at log ?devname?
Print the whole AHB trace buffer.
at status ?devname?
Print AHB trace buffer settings.
RETURN VALUE
Upon successful completion, at returns a list of trace buffer entries , on the same format as the command ahb. Each
entry is a sublist on the format format: {AHB time addr data rw trans size master lock resp irq
bp}. The data field is a sublist of 1,2 or 4 words with MSB first, depending on the size of AMBA bus. Detailed
description about the different fields can be found in the DSU core documentation in document grip.pdf. [http://
gaisler.com/products/grlib/grip.pdf]
The other sub commands have no return value.
EXAMPLE
Print 10 rows
grmon3> at
TIME ADDRESS D[127:96] D[95:64] D[63:32] D[31:0] TYPE ...
266718 FF900004 00000084 00000084 00000084 00000084 read ...
266727 FF900000 0000000D 0000000D 0000000D 0000000D write ...
GRMON3-UM
June 2019, Version 3.1.0
93 www.cobham.com/gaisler
Page 94

266760 000085C0 C2042054 80A06000 02800003 01000000 read ...
266781 000085D0 C2260000 81C7E008 91E80008 9DE3BF98 read ...
266812 0000B440 00000000 00000000 00000000 00000000 read ...
266833 0000B450 00000000 00000000 00000000 00000000 read ...
266899 00002640 02800005 01000000 C216600C 82106040 read ...
266920 00002650 C236600C 40001CBD 90100011 1080062E read ...
266986 00000800 91D02000 01000000 01000000 01000000 read ...
267007 00000810 91D02000 01000000 01000000 01000000 read ...
TCL returns:
{AHB 266718 0xFF900004 {0x00000084 0x00000084 0x00000084 0x00000084} R 0 2 2 0
0 0 0 0} {AHB 266727 0xFF900000 {0x0000000D 0x0000000D 0x0000000D 0x0000000D}
W 0 2 2 0 0 0 0 0} {AHB 266760 0x000085C0 {0xC2042054 0x80A06000 0x02800003
0x01000000} R 0 2 4 1 0 0 0 0} {AHB 266781 0x000085D0 ...
Print 2 rows
grmon3> at 2
TIME ADDRESS D[127:96] D[95:64] D[63:32] D[31:0] TYPE ...
266986 00000800 91D02000 01000000 01000000 01000000 read ...
267007 00000810 91D02000 01000000 01000000 01000000 read ...
TCL returns:
{AHB 266986 0x00000800 {0x91D02000 0x01000000 0x01000000 0x01000000} R 0 2 4 1
0 0 0 0} {at 267007 0x00000810 {0x91D02000 0x01000000 0x01000000 0x01000000}
R 0 3 4 1 0 0 0 0}
SEE ALSO
Section 3.4.9, “Using the trace buffer”
tmode
GRMON3-UM
June 2019, Version 3.1.0
94 www.cobham.com/gaisler
Page 95

6. batch - syntax
NAME
batch - Execute a batch script
SYNOPSIS
batch ?options? filename ?args...?
DESCRIPTION
batch
Execute a TCL script. The batch is similar to the TCL command source, except that the batch command
sets up the variables argv0, argv and argc in the global namespace. While executing the scrip, argv0 will
contain the script filename, argv will contain a list of all the arguments that appear after the filename and
argc will be the length of argv.
OPTIONS
-echo
Echo all commands/procedures that the TCL interpreter calls.
-prefix ?string?
Print a prefix on each row when echoing commands. Has no effect unless -echo is also set.
RETURN VALUE
Command batch has no return value.
GRMON3-UM
June 2019, Version 3.1.0
95 www.cobham.com/gaisler
Page 96

7. bdump - syntax
NAME
bdump - Dump memory to a file.
SYNOPSIS
bdump address length ?filename?
DESCRIPTION
The bdump command may be used to store memory contents a binary file. It's an alias for 'dump -binary'.
bdump address length ?filename?
Dumps length bytes, starting at address, to a file in binary format. The default name of the file is
"grmon-dump.bin"
RETURN VALUE
Command bdump has no return value.
EXAMPLE
Dump 32kB of data from address 0x40000000
grmon3> bdump 0x40000000 32768
GRMON3-UM
June 2019, Version 3.1.0
96 www.cobham.com/gaisler
Page 97

8. bload - syntax
NAME
bload - Load a binary file
SYNOPSIS
bload ?options...? filename ?address? ?cpu#?
DESCRIPTION
The bload command may be used to upload a binary file to the system. It's an alias for 'load -binary'. When a file
is loaded, GRMON will reset the memory controllers registers first.
bload ?options...? filename ?address? ?cpu#?
The load command may be used to upload the file specified by filename. If the address argument
is present, then binary files will be stored at this address, if left out then they will be placed at the base
address of the detected RAM. The cpu# argument can be used to specify which CPU it belongs to. The
options is specified below.
OPTIONS
-delay ms
The -delay option can be used to specify a delay between each word written. If the delay is non-zero
then the maximum block size is 4 bytes.
-bsize bytes
The -bsize option may be used to specify the size blocks of data in bytes that will be written. Sizes that
are not even words may require a JTAG based debug link to work properly. See Chapter 5, Debug link
for more information.
-wprot
If the -wprot option is given then write protection on the core will be disabled
RETURN VALUE
Command bload returns a guessed entry point.
EXAMPLE
Load and then verify a binary data file at a 16MBytes offset into the main memory starting at 0x40000000.
grmon3> bload release/ramfs.cpio.gz 0x41000000
grmon3> verify release/ramfs.cpio.gz 0x41000000
SEE ALSO
Section 3.4.2, “Uploading application and data to target memory”
GRMON3-UM
June 2019, Version 3.1.0
97 www.cobham.com/gaisler
Page 98

9. bp - syntax
NAME
bp - Add, delete or list breakpoints
SYNOPSIS
bp ?address? ?cpu#?
bp type ?options? address ?mask? ?cpu#?
bp delete ?index?
bp enable ?index?
bp disable ?index?
DESCRIPTION
The bp command may be used to list, add or delete all kinds of breakpoints. The address parameter that is
specified when creating a breakpoint can either be an address or a symbol. The mask parameter can be used to
break on a range of addresses. If omitted, the default value is 0xfffffffc (i.e. a single address).
Software breakpoints are inserted by replacing an instruction in the memory with a breakpoint instruction. I.e. any
CPU in a multi-core system that encounters this breakpoint will break.
Hardware breakpoints/watchpoints will be set to a single CPU core.
When adding a breakpoint a cpu# may optionally be specified to associate the breakpoint with a CPU. The CPU
index will be used to lookup symbols, MMU translations and for hardware breakpoints/watchpoints.
bp ?address? ?cpu#?
When omitting the address parameter this command will list breakpoints. If the address parameter is specified, it will create a software breakpoint.
bp soft address ?cpu#?
Create a software breakpoint.
bp hard address ?mask? ?cpu#?
Create a hardware breakpoint.
bp watch ?options? address ?mask? ?cpu#?
Create a hardware watchpoint. The options -read/-write can be used to make it watch only reads or
writes, by default it will watch both reads and writes.
bp bus ?options? address ?mask? ?cpu#?
Create an AMBA-bus watchpoint. The options -read/-write can be used to make it watch only reads
or writes, by default it will watch both reads and writes.
bp data ?options? value ?mask? ?cpu#?
Create an AMBA data watchpoint. The value and mask parameters may be up to 128 bits, but number of
bits used depends on width of the bus on the system. Valid options are -addr and -invert. If -addr
is specified, then also -read or -write are valid. See below for a description of the options.
bp delete ?index..?
When omitting the index all breakpoints will be deleted. If one or more indexes are specified, then those
breakpoints will be deleted. Listing all breakpoints will show the indexes of the breakpoints.
bp enable ?index..?
When omitting the index all breakpoints will be enabled. If one or more indexes are specified, then those
breakpoints will be enabled. Listing all breakpoints will show the indexes of the breakpoints.
bp disable ?index..?
When omitting the index all breakpoints will be disabled. If one or more indexes are specified, then those
breakpoints will be disabled. Listing all breakpoints will show the indexes of the breakpoints.
OPTIONS
-read
This option will enable a watchpoint to only watch loads at the specified address. The -read and -write
are mutual exclusive.
GRMON3-UM
June 2019, Version 3.1.0
98 www.cobham.com/gaisler
Page 99

-write
This option will enable a watchpoint to only watch stores at the specified address. The -read and -write
are mutual exclusive.
-addr address mask
This option will combine an AMBA data watchpoint with a a bus watchpoint so it will only trigger if a
value is read accessed from a certain address range.
-invert
The AMBA data watchpoint will trigger of value is NOT set.
--
End of options. This might be needed to set if value the first parameter after the options is negative.
RETURN VALUE
Command bp returns an breakpoint id when adding a new breakpoint.
When printing all breakpoints, a list will be returned containing one element per breakpoint. Each element has
the format: {ID ADDR MASK TYPE ENABLED CPU SYMBOL {DATA INV DATAMASK}}. AMBA watchpoints and AMBA data watchpoints will only have associated CPUs if has a symbol. The last subelement is only
valid for AMBA data watchpoints.
EXAMPLE
Create a software breakpoint at the symbol main:
grmon3> bp soft main
Create a AMBA bus watchpoint that watches loads in the address range of 0x40000000 to 0x400000FF:
grmon3> bp bus -read 0x40000000 0xFFFFFF00
SEE ALSO
Section 3.4.4, “Inserting breakpoints and watchpoints”
GRMON3-UM
June 2019, Version 3.1.0
99 www.cobham.com/gaisler
Page 100

10. bt - syntax
NAME
bt - Print backtrace
SYNOPSIS
bt ?cpu#?
DESCRIPTION
bt ?cpu#?
Print backtrace on current active CPU, optionally specify which CPU to show.
RETURN VALUE
Upon successful completion bt returns a list of tuples, where each tuple consist of a PC- and SP-register values.
EXAMPLE
Show backtrace on current active CPU
grmon3> bt
TCL returns:
{1073746404 1342177032} {1073746020 1342177136} {1073781172 1342177200}
Show backtrace on CPU 1
grmon3> bt cpu1
TCL returns:
{1073746404 1342177032} {1073746020 1342177136} {1073781172 1342177200}
SEE ALSO
Section 3.4.6, “Backtracing function calls”
GRMON3-UM
June 2019, Version 3.1.0
100 www.cobham.com/gaisler
 Loading...