

Page 1

We Azure you; we’ll make it simple.
Nov 2020
Smart Azure Calculator User Manual
Page 2

02
Introduction
Congratulations on your subscription to the Smart Azure Calculator! This will allow you to develop much faster, more accurate
and above all, more convincing price proposals for Azure Migrate projects. It's going to help you win more Azure Migrate deals!
The Smart Azure Calculator is a powerful tool, part of a method we developed over the years after winning hundreds of Azure
Migrate projects in the past years. Based on these experiences we have developed a training to help you to be more successful
in selling Azure Migrate project. See for yourself: https://bit.ly/35WdJBd
If you follow this guide, you will get the most out of the Smart Azure Calculator. If you prefer to watch demos instead, go to:
https://youtu.be/cf5pUmL8ilo.
We also keep a blog explaining Azure pricing development, explaining new programs and sharing our experience on how to sell
Azure Migrate projects. If you, as an Azure professional, want to stay informed about all the commercial aspects of Azure,
follow our blog: Blog – The CloudLab
After subscribing via Azure Marketplace to the Smart Azure Calculator, you get access to the homepage of the Smart Azure
Calculator.
Page 3
03
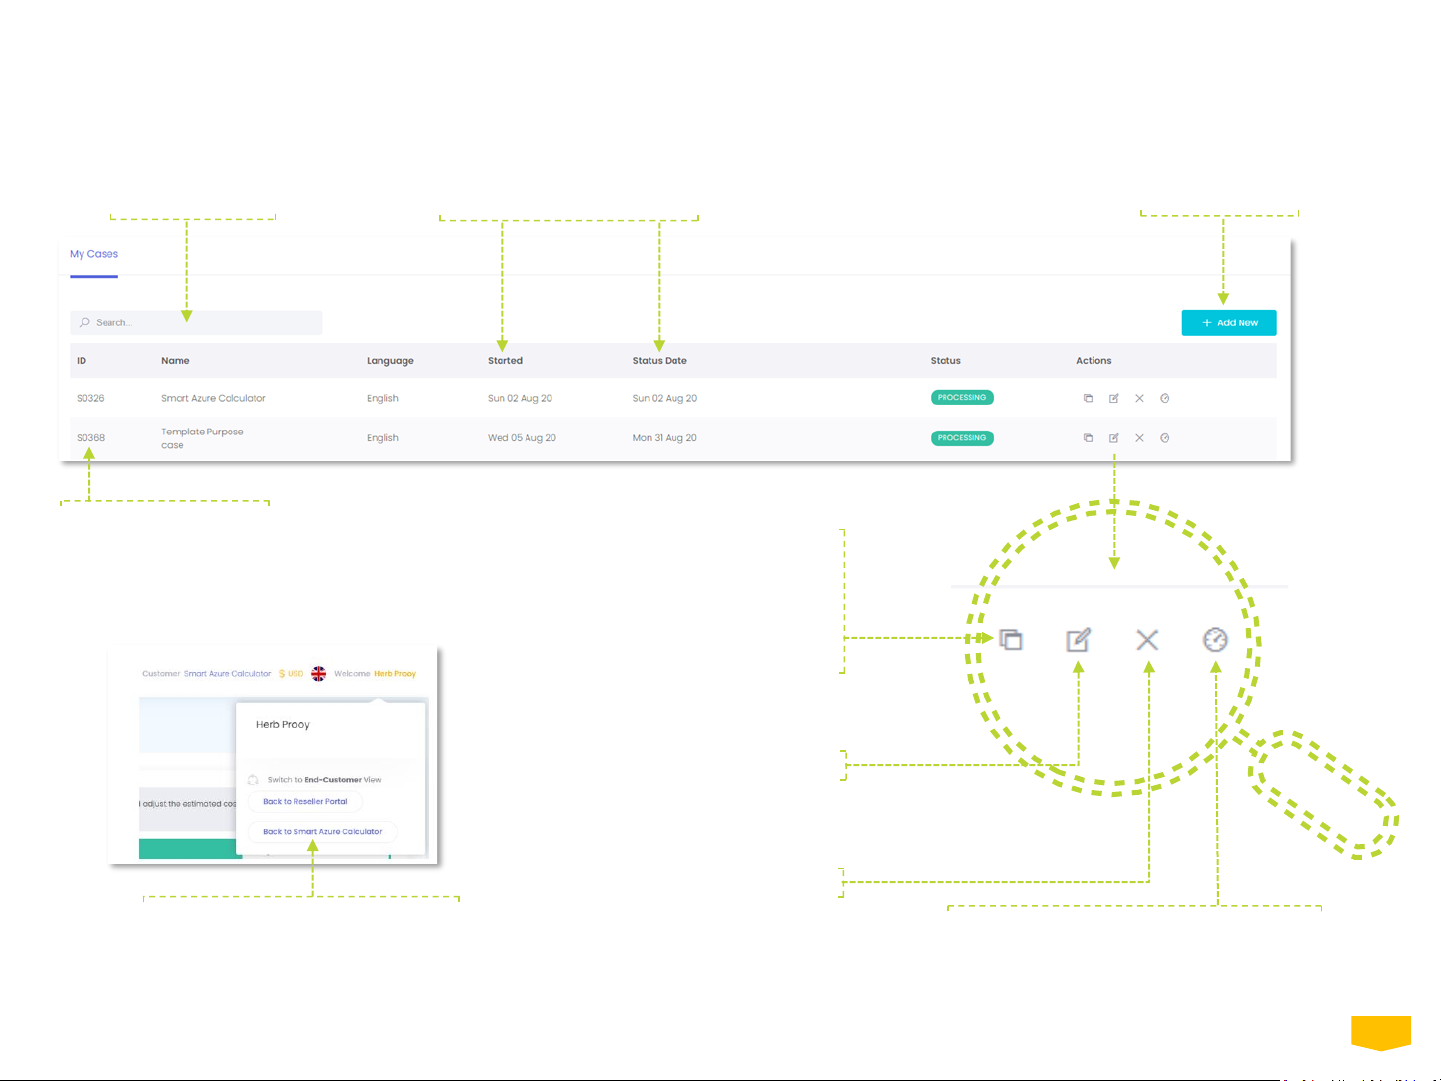
The Smart Azure Calculator begins at "My Cases" homepage where you have an overview of all your cases. You can start new cases, clone or delete
them if they are no longer needed.
Home page -My Cases
All cases can be arranged by
pressing the column names.
Search your cases.
Start a new case.
Cloning the selected case will
create another case with same
case data, useful as a second
scenario, an alternative offer or as
a template to start a quick specific
calculation, for example, WVD.
Modify the case name.
Delete the case.
Drilldown to the case of the Smart Azure
Calculator and start working on building
your case to establish the Azure price
estimate and offer.
Every case has a unique
number. Reference ID if
Support is required.
You can return to My Cases
homepage at any time by clicking on
your name in the top right corner
and selecting this button.
Page 4
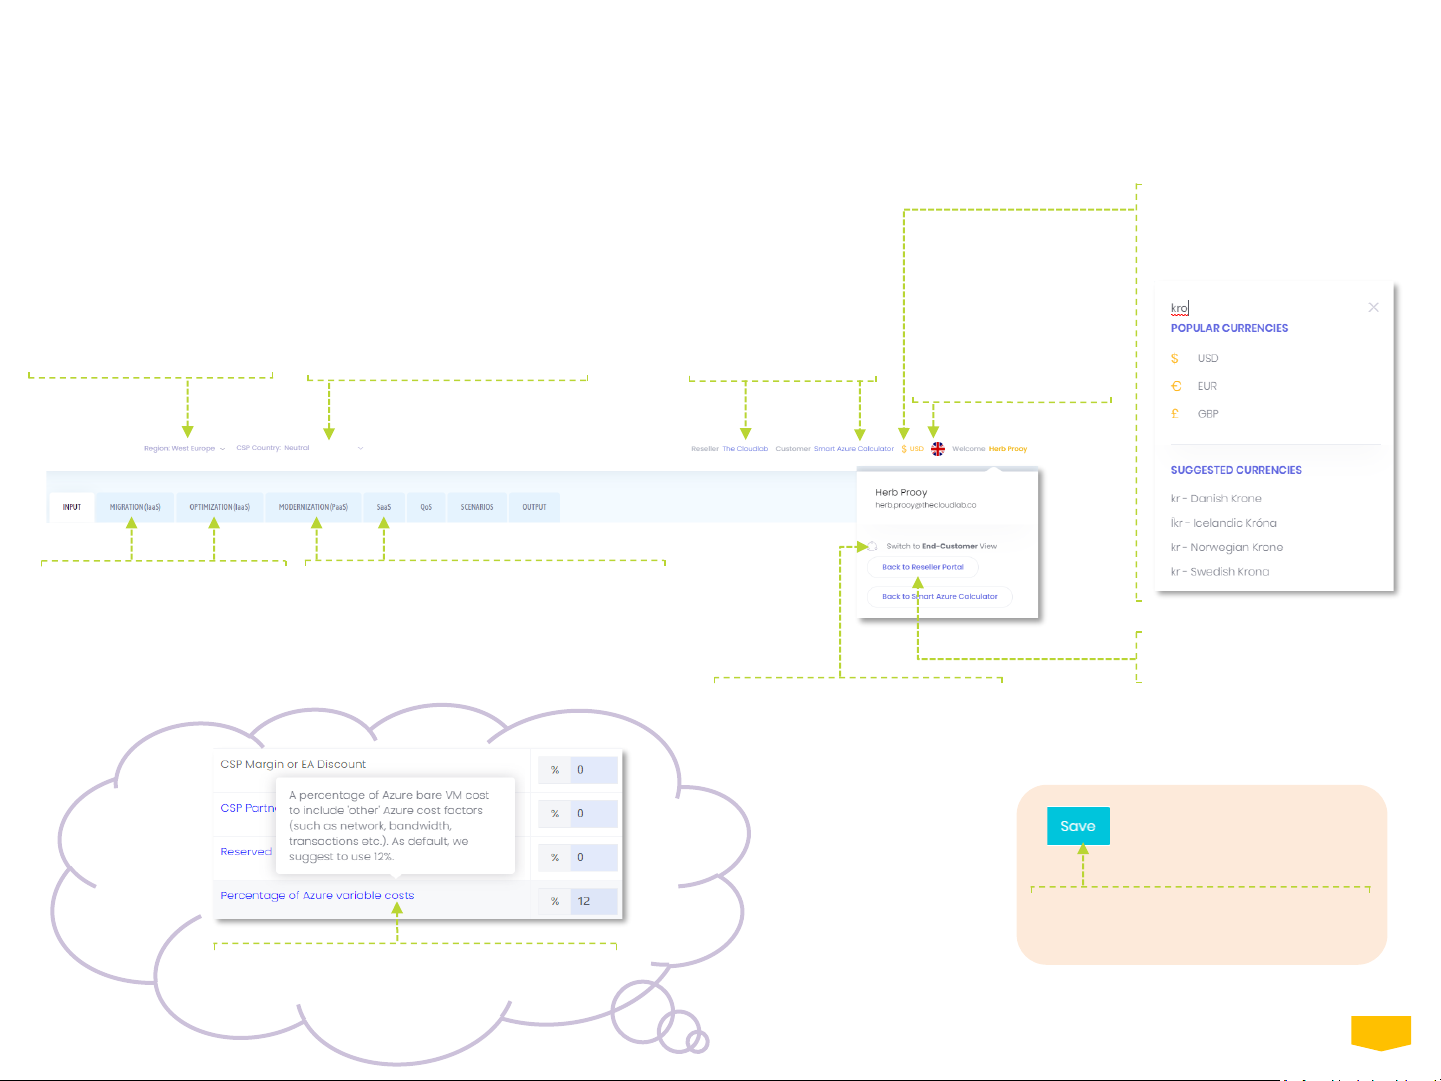
Available in English
now. Other languages
will be added soon.
04
Go back to Reseller Portal
to access other cases.
Search for your currency of
choice. The selected currency
is also the currency used in
the Output files.
The Dashboard has 8 TABs to work the whole case and is covering what is called the steps of “Customer Cloud Journey”. Go through every TAB even if
you don’t change any variable. It is important to save any inputted fields as applicable. If you don’t, the graphs and tables in the Output files could
have another outcome.
The Dashboard explained
Within the Dashboard, some fields are in blue.
Move your cursor over the blue-text fields to
show relevant explanation accordingly.
If you update any input field or section,
always press “Save” before moving on.
Switch to End-Customer views to
hide margin related content
when reviewing the App side-byside with your end-customers.
Migration and Optimization
are mandatory TABs to tune
Azure infrastructure before
extending your cost analysis.
Before you start the case,
double check if selected
Azure Region is the correct
one. Change as required and
the price plan of selected
Azure Region will be loaded
automatically.
Microsoft Partners can choose
to source software licenses via
the CSP program. Select the CSP
Country of your choice or select
‘Neutral’ for global pricing.
Name of the Reseller
and Customer
Click these TABS if you want to analyze the
total cost of ownership (TCO) of available
Modernization (PaaS) options; Azure SQL /
Windows Virtual Desktop or SaaS options;
Business Central / Dynamics 365.
Page 5
05
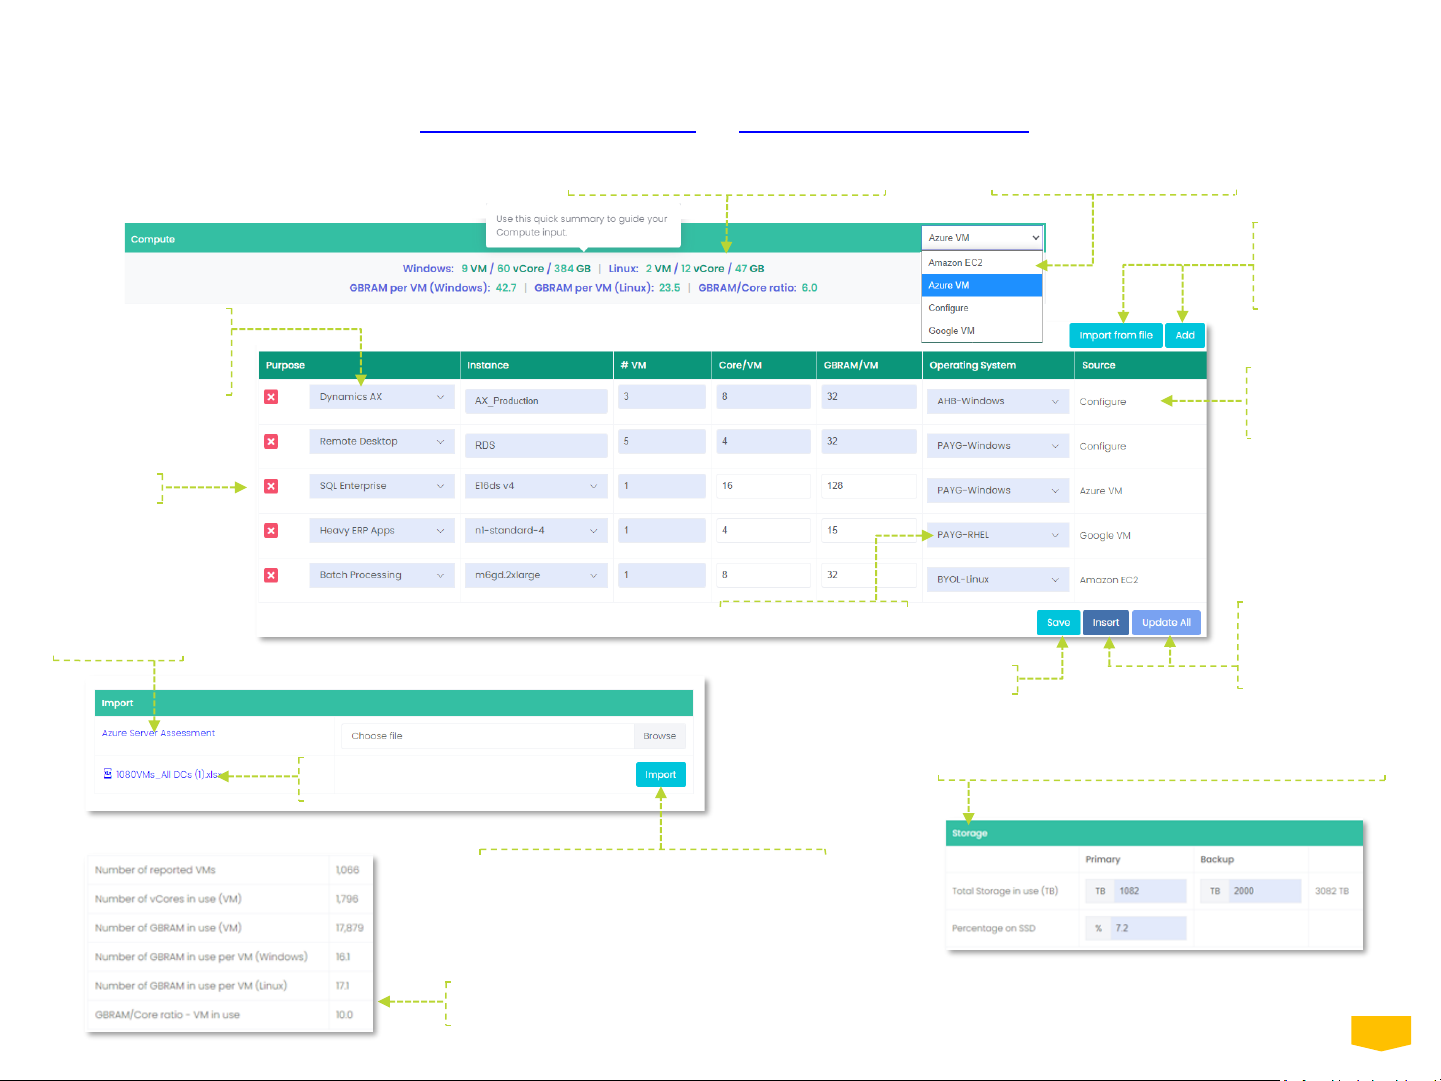
Input tab is where you load your case data. There are two options for loading case data into the Smart Azure Calculator; manual or automated via
imports. Watch these instructional demos: https://youtu.be/ekYchf6_oRA and https://youtu.be/Yw1nATcmF9o.
Input
Delete row.
For ‘Configure’
source, specify
the VM size.
Select the source of VM
specification before adding.
Instant summary to assist data input.
Select OS for the VM.
Save input for editing later.
Upon completing
input, choose to
insert or update
all into VM grid.
Overview of data input, grouped over KPIs, to quickly
understand current infrastructure dynamics.
Storage Input Summary; manually filled or Imported.
When Import is initiated, an import
Validation screen opens (see next page).
Click imported filename to re-open
import screen (see next page).
Add lines or
Import from file
for different VM
sources.
Automatically
import Azure
Migrate Excel
output files.
Assign Purpose to
VM(s) to estimate
the best-matched
Azure VM.
Page 6
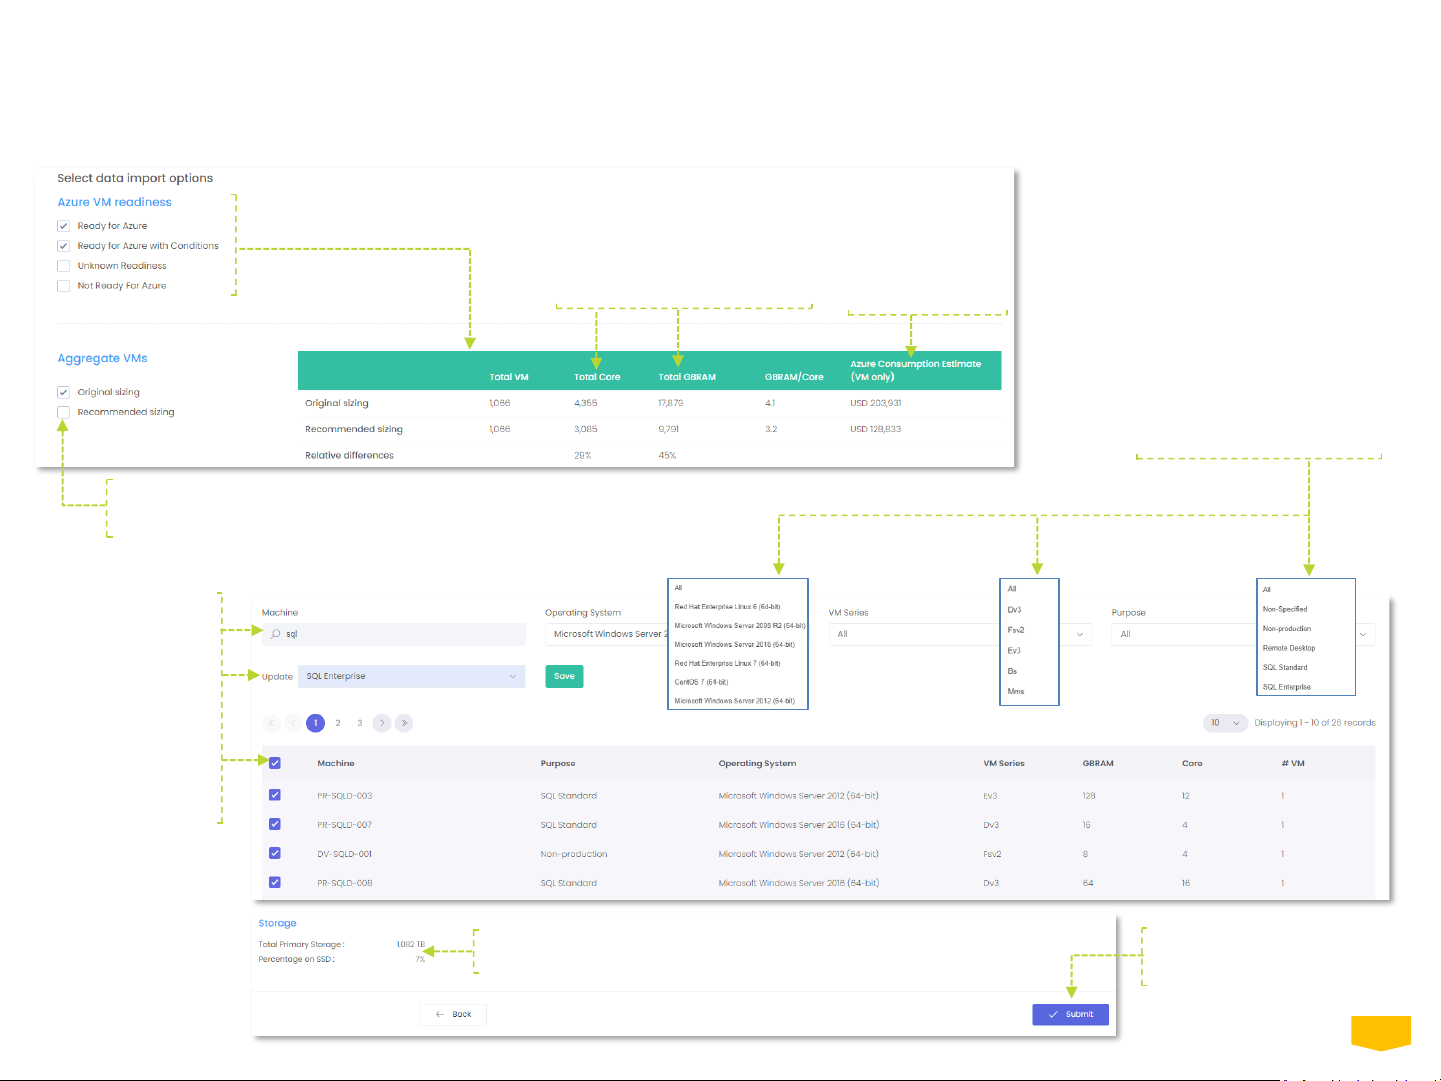
Once Import is initiated, the App opens the Import Validation screen. Here you can select the scope of business case based on the Azure VM
readiness. The important step is to define as much as possible the Purpose of all VMs and VM groups.
Import Validation
Select the set of VMs to
include in business case.
Indication of the
monthly Azure
VM cost.
Review the details of the
original and recommended
VM sizing.
Aggregated storage volumes for Primary
Storage based on Import options.
After Submit, return to
Input page to review
Customer cost.
Select which data set you will use to continue to build the business case. We
advise to take the Original sizing because the Right Sizing effort in later steps
within the App will be better understood by the customer.
06
Use the available filters to
further verify and complete
VM Purpose setup.
Search for VM(s) by
keywords.
Select all or some
records, choose the
Purpose value to
update to and click
save.
Repeat as necessary
for next groups.
Page 7
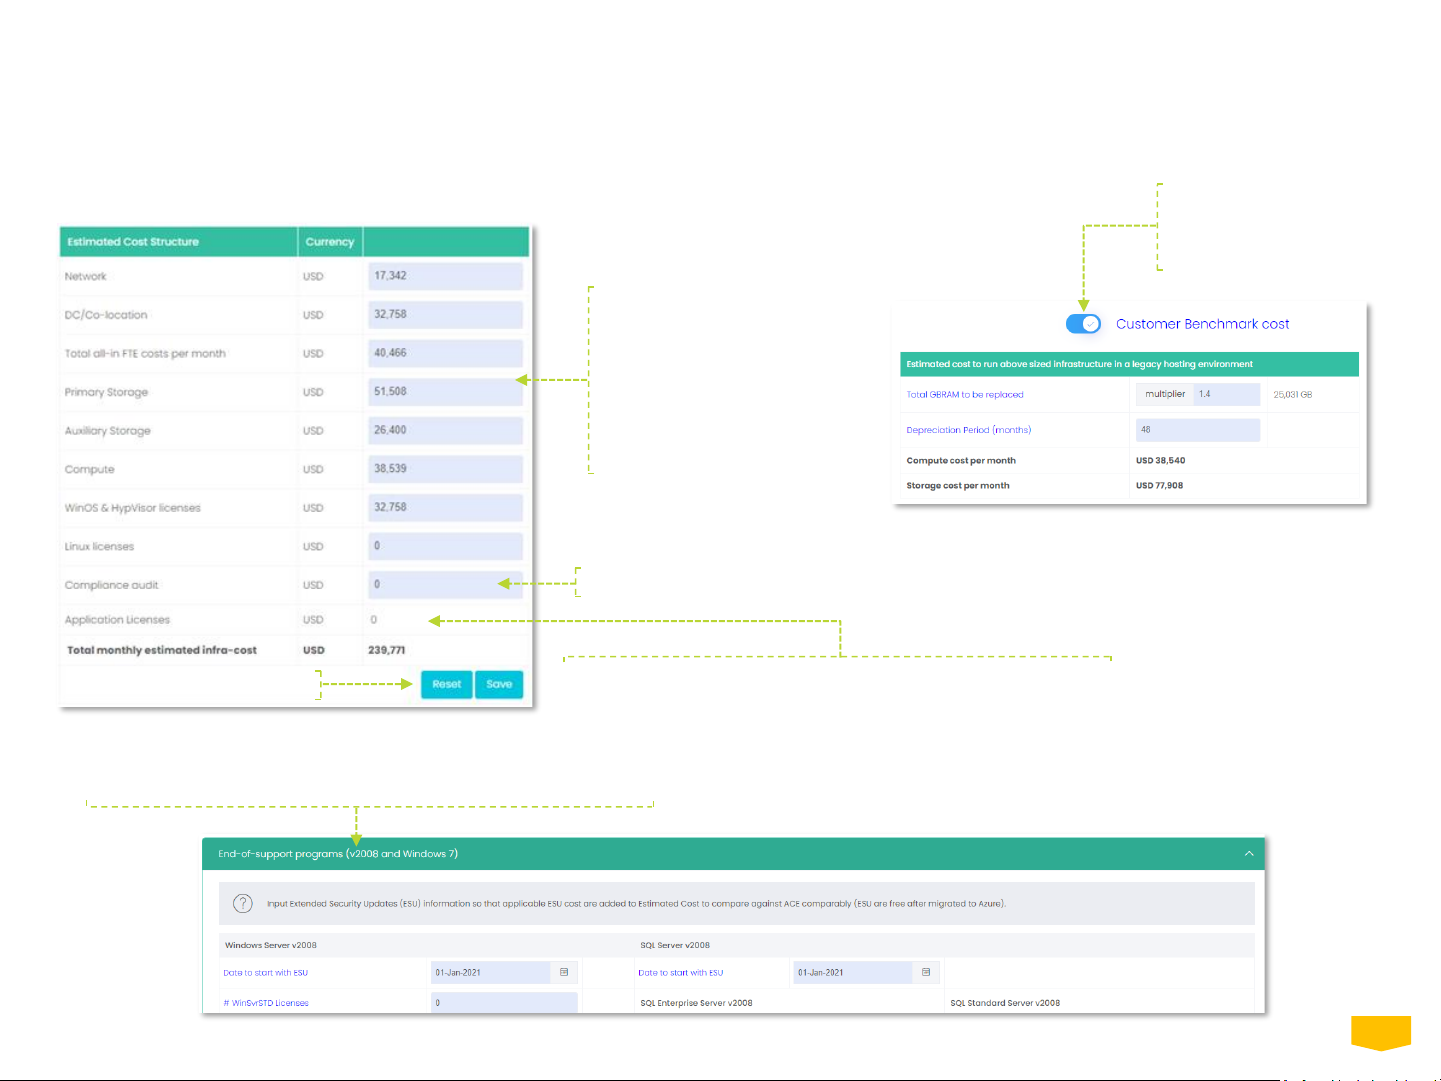
Based on the Input variables, the App estimates the Benchmark cost for an infrastructure of the same size running in a legacy hosting environment.
The benchmark calculation is built from data set of more then 800 Azure migrate viability studies. Going forward, the benchmark cost estimate will be
referred to as "Customer Cost“ and shall become your guide in building a competitive business case and prompting the customer to share his real cost
levels to get an even more valuable Output.
If the Customer is still running v2008 or Win7 workloads, fill in the
details and calculated ESU cost will be added to Customer Cost.
Input -Customer Benchmark Cost
Turn off if you are not
interested in comparing
Azure cost evaluations
against Customer Cost.
Monthly benchmark
cost is calculated for
key cost types. All
fields are editable in
case the customer is
willing to share his
actual costs, to make
the business case
more relevant.
Reset all fields back to zero.
Add the monthly audit cost if applicable.
Application license costs are added here as soon they are entered
in the Application TABs, such as Azure SQL, WVD, BC or D365.
07
Page 8
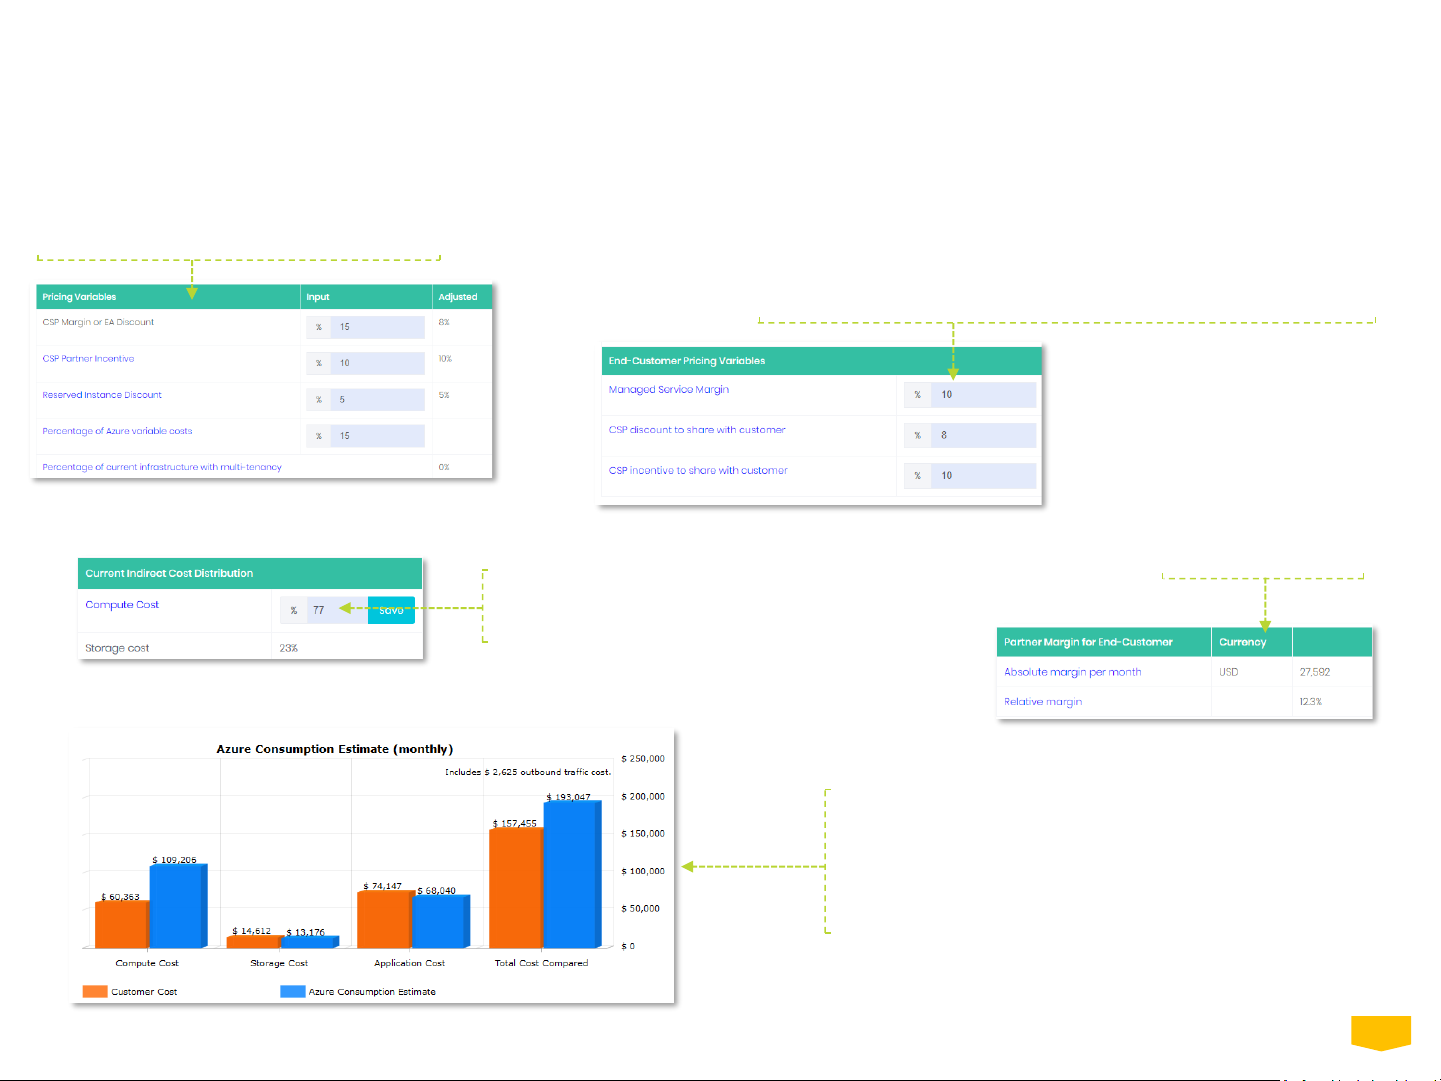
The total absolute and
relative margin you
have built into the
Azure consumption
estimate you present
to the customer.
If you are working an end-customer case and want to make a margin on
your Azure offering, manage within this table. All the presented graphs
in the App will include the margin set here. ‘Sharing’ discount or
incentive means the percentage of your CSP/EA discount and/or
incentive you leave for your customer. The end-customer margins
appear in the ‘Adjusted’ column in the first table.
In this table, you can adjust the applicable
costs, via the Input column.
In the Azure Consumption Estimate (ACE)
Comparison graph, the monthly ACE is
presented compared with the monthly
current Customer Cost. The Azure estimate
displays the end-customer net price,
including shared discount/incentives, along
with, your service margin, if added.
08
In this step, the cost comparison is built between the monthly estimated Customer Cost and Azure Cost, assuming the customer’s workloads are
already running on an Azure infrastructure today with the same size and utilization, in terms of CPU/Cores and RAMs, without any of Azure benefits:
the so-called “lift and shift” scenario.
Migration (IaaS) - Pricing variables and adjustments
You can influence the calculated
Customer Indirect cost distribution
over Compute and Storage cost.
Page 9
Add VM lines
as applicable in
respective VM
Category.
09
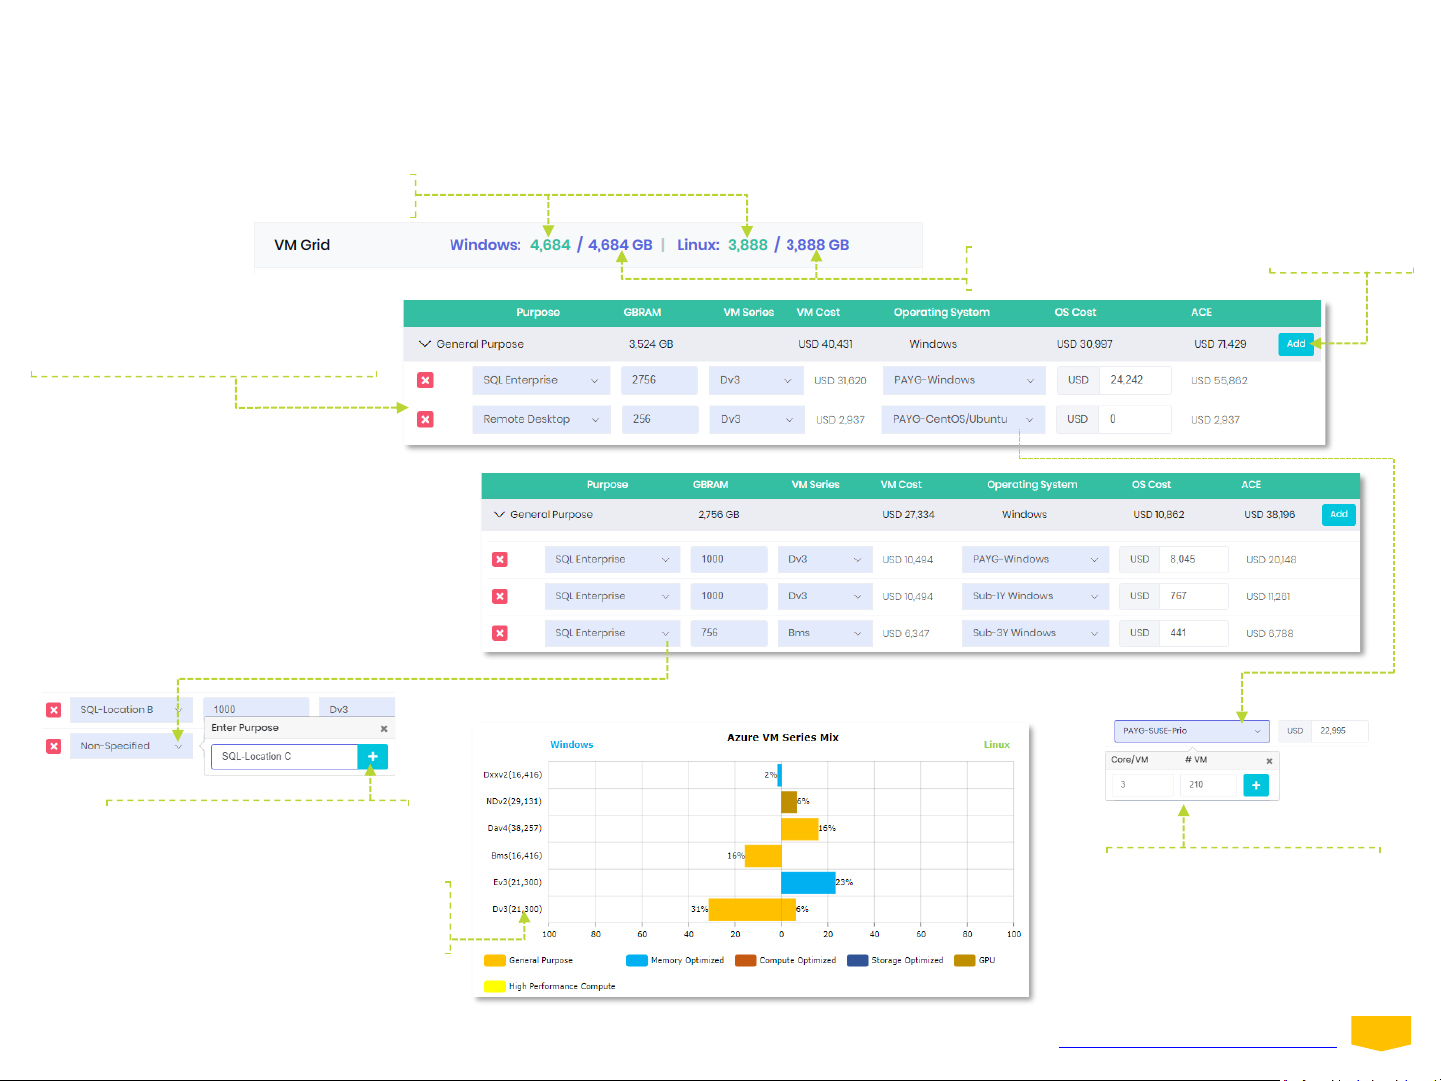
In this section you manage the mixture of VMs you want to build the comparison with. Azure VM series differs based on GBRAM/Core ratios and
price. The VM Grid is filled with a mixture of VMs based on the Input. Building the right mix of VMs can bring big savings.
Migration (IaaS) - The VM grid
Total GBRAM
from VM grid
VM grid contain records derived
automatically from Input. Review and
edit VM grid records as applicable.
Customer’s Windows
and Linux GBRAM
You can split and detail to every
workload/purpose as needed. For example,
SQL Enterprise workload can be split into 3
lines, total number of GBRAM remains the
same (2,756 GBRAM) but by selecting better
suited VM series and be smart in sourcing
Operating System, the ACE for SQL Enterprise
environments can drop by USD 17,666 or 32%.
Understand CPU benchmark
rating of each VM-series as a
guide to configuring VMs.
Create custom Purpose ‘labels’ to
detail each VM infrastructure.
Estimate Windows Subscription
and Other Linux (RH, SUSE,
Ubuntu Advantage) OS Costs
based on number of Core/VM
and # VM.
The pricing of Azure VM can be complex. To learn the secrets of developing a competitive Azure price offer, watch https://youtu.be/WzI85ocypgE.
Page 10

The Storage section starts with the representation of the
Primary Storage Mix. You can adjust the mix of Primary SSD
using ‘Price per GB’ as a guide. ‘Price per GB’ includes applicable
discounts/margins.
If backup storage size exceeds multiple times of primary storage
total, it makes sense to mix storage over Cool and Archive.
10
Input current number of VMs
under DR and the number of
VMs that truly need to be
protected under ASR, relevant
ASR cost is added to ACE.
In this part, you manage the setup of the comparable Azure Primary storage, the mixture of SAS and SSD as well as the configuration of the Backup
storage. ASR or outboundtraffic could come up as a significant cost if they are sizeable.
Migration (IaaS) - Storage, ASR and Network
For more background on storage, watch https://youtu.be/kYCSEHoFjHU.
Specify the public outbound traffic in terms of TB/month. Do not include the
traffic routed via private networks or for backup synchronization.
It is advisable to request a special price if Outbound Traffic is above 500TB.
Alternatively, consider Azure ExpressRoute to optimize the Outbound Traffic
cost. Fill in the custom price per GB/month to re-calculate total Outbound
Traffic cost accordingly.
Page 11

Based on the suggestions made, your own judgment or
Customer’s Input, you estimate the potential cost saving of
Right Sizing.
11
In this section, the effects of the true consumption model of Azure are visualized. Pay for what you use is making the big difference in current hosting
pricing models. (Pro)Active monitoring, analyzing workloads and better utilization of an Azure infrastructure should pay off. For more background on
Optimization, watch this video https://youtu.be/PhGQvOwEgwE. For more detailsabout Right Sizing, you can read in the Blog https://bit.ly/2UU9iAs.
Optimization (IaaS) - Right Sizing
Migrating storage always
provide the opportunity
to improve storage usage.
The App is giving you two suggestions for Right Sizing. The first one is the difference between the processor performance
of the current aged infrastructure compared with selected Azure VMs. If the Input comes from Azure Migrate, the Right
Sizing suggestion between Original Sizing and Recommended sizing (see page 6) is listed here.
The effect of Compute
and Storage Right Sizing
are visualized in terms of
monthly cost savings.
Values from bottom to top represents Compute, Storage, Application and *Miscellaneous costs
* Miscellaneous consists of Compliance audit cost in Total Customer Cost and Networking cost in ACE
Page 12

Based on purpose setup in VM Grid, the App is calculating the potential of snoozing VMs. You set
the snoozing % or monthly hours for each VM-line to include this benefit in ACE calculations.
The effect of these two benefits is that the Azure
consumption will drop significantly. Relative partner margin
will not drop, however, in absolute term, it will. In this table,
the effect of that drop in absolute margin is visualized.
12
The next Optimization step is snoozing; achieving savings by switching off unused VMs for a given period. Typically, VMs qualifying for snoozing are all
non-production environments for development, testing or internal systems etc. Furthermore, there is always the hidden potential of VM that a
customer doesn’t use during nighttime or weekends and load-balancedVMs etc. Snoozing is free of charge and can save a lot of money.
Optimization (IaaS) - Snoozing
You set the snoozing % or monthly hours for each VM-line
to include this benefit in ACE calculations.
The benefits of
snoozing on the
monthly Compute
cost visualized.
Values from bottom to top represents Compute, Storage, Application and *Miscellaneous costs
* Miscellaneous consists of Compliance audit cost in Total Customer Cost and Networking cost in ACE
Page 13

Values from bottom to top represents Compute, Storage, Application and *Miscellaneous costs
* Miscellaneous consists of Compliance audit cost in Total Customer Cost and Networking cost in ACE
In the graph, you review the effect of Reserved
Instance (RI) on the monthly Azure consumption
for the selected VMs, mouse-over each cost
breakdown to understand the cost component.
In this table, with the VMs selected, you can allocate 1Y or 3Y
Reserved Instances to commit for each VM and understand
the commitment cost.
CSP discounts are not applicable for Reserved
Instances. For this, Microsoft is offering CSPs a RIdiscount. Here you can define how much of that
discount you want to pass over to customer. The
Managed Service margin previously set is also
applicable on the ACE calculations.
13
The last Optimization step is about Reserved Instances. Microsoft is giving the possibility to pay upfront for Azure consumption of selected VM types,
giving substantial discounts if your customer is committing to consume VM-series volumes for one or three years.
Optimization (IaaS) - Reserved Instances
If the Azure consumption is dropping due to the Reserved
Instances, then margin is dropping as well and visualized in
this table. At the bottom of the table, the upfront absolute
margin on committed VMs is calculated, if applicable.
Review the commitment for the Reserved Instances.
Page 14

After configuration of the PaaS or
SaaS solution, you must select
which option you want to carry
forward with the overall TCO
analysis.
Once you save an option, the
totals of the different cost
categories are adjusted. The ACE
graph gives a summary of TCO
analysis per cost category. The
absolute and relative margin
estimates are also presented.
Relevant RI Commitment for SQL
VMs and Azure SQL is displayed.
In these two TABs, you will get the chance of going beyond the advanced hosting capabilities of Azure by investigating the potential benefits of
introducing the Modernization and SaaS offerings available on Azure. The structure of each Application TAB are consistent with key sections, we shall
explain using the Azure SQL as an example.
Modernization (PaaS) and SaaS
14
At the last section of each TAB, add the missing
information about the current environment with
respect to SQL environments. This is essential to
calculate the potential added value of Azure SQL.
You start by evaluating and
adjusting the Azure IaaS
solution, before building the
PaaS and/or SaaS options.
After configuring all the
options, you will review the
impact not only in the total
TCO impact, breakdown by
cost category per option.
This will allow a deeper
understanding of the cost
differences in price build-up,
which, in turn, provide new
insights to further finetune
costs and/or margins.
Page 15

15
Azure SQL Database is the intelligent, scalable, cloud database server managed by Microsoft. It is an alternative for managing your own SQL Servers
and databases either on-premise or on Azure. Here you analyze the TCO effect of the different options to run your SQL databases. For a demo of this
functionality, watch: https://youtu.be/H9Mb7COtNXY.
Azure SQL (PaaS) - SQL on Azure (IaaS)
Check and tune the SQL on Azure configuration.
If necessary, go back to the VM Grid to adjust.
You can also select the sourcing of SQL licenses.
Review current customer’s SQL
Administration cost and adjust
as applicable for managing SQL
servers on Azure.
In SQL Storage, the prices of SQL storage are
specified based on inputted SQL sizing.
Estimated current Customer Costs
are made available to facilitate
evaluation of cost differences.
Optimize SQL License Cost
according to available core
constrain factor of 2 or 4.
Eligible Memory Optimized
VMs can be setup as
Extreme Memory Optimized
VMs to constrain to lower
active vCPU(s).
Page 16

Select Reserved
Instances for 1Y
or 3Y to see the
RI Commitment
totals.
Different DTUs comes with their included storage and maximum available storage. If your
DTU configurations involves high storage volume, be mindful of the included storage for
your DTU sizing and maximum available storage and deduct included storage from your
storage requirements to arrive at a more realistic Storage Cost.
16
Azure SQL Database have two purchasing models. One is based on the underlying number of Cores of the compute tier, the other is based on
Database Transaction Unit (DTU) with bundled compute and storage for common workloads. By default, the App lands SQL Enterprise capacity in
vCore and SQL Standard in DTU. In this TAB, you find a comprehensive UI, including all Azure SQL configuration options and conditions, to fine tune the
most optimal Azure on SQL configuration.
Azure SQL (PaaS) - Azure SQL (PaaS)
Add Azure SQL records
for relevant purchasing
model to detail the
suitable mix for SQL.
Choose SQL license option and input
SQL License Cost in case of BYOL.
The number of cores is based
Standard/Enterprise VMs found in
the SQL License table above. Adjust
to arrive at the ideal configuration
as desired.
The number of Assigned GBRAM is
related to the Cores via a fixed factor.
Choose the vCore
service tier.
SQL storage volumes as specified
by customer, adjust as appropriate.
Managed Instance backup defaults
to read-access geo-redundant
storage (RA-GRS). Tune the
Backup and Long Term Retention
(LTR) options as required if you are
not going with managed.
Select single database or elastic
pool with its service level.
DTU can be estimated from total SQL cores. As a guide,
multiply # of Core by 75 (Basic), 100 (Standard) or 125
(Premium) to arrive at DTU total. Adjust the number of
DTUs if you work with other factors.
If you want to better understandhow Azure SQL Database works and configures, read https://docs.microsoft.com/en-us/azure/sql-database/.
Page 17

Windows Virtual Desktop is a comprehensive desktop and app virtualization service running on Azure. It is an alternative for managing your own
Remote Desktop Servers and databases either on-premise or on Azure. In this TAB, you analyze the TCO effect of the different options to achieve your
existing Remote Desktop requirements translated into a WVD solution. For a demo of this functionality, watch https://youtu.be/CoDU_zkWSI4.
Windows Virtual Desktop
Verify the Remote App or Remote Desktop
on Azure configuration. If necessary, go back
to the VM Grid to adjust.
Included in WVD pricing is RD Gateway, Broker Session, Host, Database. To level
the cost comparison, it is recommended to reduce the WVD Compute Cost.
Recommended default is 11% reduction on WVD Compute cost. If applicable,
update your estimated percentage reduction on WVD Compute cost.
Select the desired
WVD license.
Estimated current customer cost are
made available to facilitate evaluation
of cost differences. ESU Win7 cost are
included in current cost if applicable.
Input the total BYOL cost in License
Cost if you have BYOL Licenses.
Add WVD records to
detail the suitable mix
for overall WVD needs.
By default, the App lands non-Office Remote Desktop
users into Windows 10 Enterprise E3 and Office users
into Microsoft 365 Business licenses. Citrix Products
are defaulted as 0. Edit as applicable.
For Windows VM-series selected for the WVD infrastructure, its Windows
OS license comes for free(select PAYG-Windows OS in VM grid). Snoozing
benefits and Reserved instances are applicable for WVD infrastructure.
Total Users for Office and Non-Office configuration
Customer’s Remote Desktop and Office Users
In the last section of
TAB, enter information
about current Remote
Desktop environment for
useful calculations.
17
Page 18

18
Business Central is a business management solution for small and mid-sized organizations that automates and streamlines business processes and
helps you manage your business. For a demo of this functionality, watch: https://youtu.be/EOOmXOt6F1k.
Business Central - NAV/GP on Azure (IaaS)
Check and tune the NAV/GP on Azure
configuration. If necessary, go back to the VM
Grid to adjust. You can also select the sourcing
of SQL licenses for NAV/GP SQL VMs.
Review the Current NAV/GP monthly cost spread over the
Depreciation period as provided by Customer’s input.
Current Customer SQL license cost for NAV/GP is
approximated based on Customer's input for SQL
Standard. Adjust the SQL license cost for Current
Customer's NAV/GP infrastructure as applicable.
If you are working an end-customer case
and want to make a margin on your
Business Central offering, manage within
this End-Customer pricing variables table.
Optimize SQL License Cost
according to available core
constrain factor of 2 or 4.
Eligible Memory Optimized
VMs can be setup as
Extreme Memory Optimized
VMs to constrain to lower
active vCPU(s).
Page 19

19
Business Central offers on-premises and online solutions. Compare on-premises costing against cloud solution to determine which solution is
financially viable for each case.
Business Central - on-premises vs cloud
Converted users are calculated based on existing concurrent full
users multiplied by 3. Microsoft is offering this migration benefit
to convert 1 concurrent user to 3 named users.
Input extra named
users for Full User
and Team Member
as required.
Add records to detail the
suitable mix for each
solution for comparison.
Input extra named
users for Full User
and Team Member
as required.
Monthly cost are calculated based customer inputs. Adjust the
monthly cost as appropriate to arrive at a suitable configuration.
Based on customer input,
Essentials or Premium
price plan is defaulted.
Adjust as required.
Based on customer
input, Essentials or
Premium price plan
is selected. Adjust as
required.
Page 20

Tick the applicable configuration(s) if they exists in current AX and/or
CRM infrastructure to level with Dynamics 365 capabilities.
20
Dynamics 365 revolutionizes CRM and ERP by applying intelligence to all forms of data. Dynamics 365 is the world’s connected business cloud
designed to help you better understand your business, develop and execute tactics/strategies to be successful. For a demo of this functionality, watch
https://youtu.be/EOOmXOt6F1k.
Dynamics 365 - AX/CRM on Azure (IaaS)
Review the Current CRM/AX monthly cost spread over the
Depreciation period as provided by Customer’s input.
Manage the margins on Dynamics 365
offering for end-customer case.
Check and tune the AX/CRM on Azure configuration. If
necessary, go back to the VM Grid to adjust. You can also
select the sourcing of SQL licenses for AX/CRM SQL VMs.
Estimated current customer costs are made available
to enable evaluation of cost differences.
Prices of AX/CRM Storage are specified
based on inputted AX storage sizing.
Optimize SQL License Cost
according to available core
constrain factor of 2 or 4.
Eligible Memory Optimized
VMs can be setup as
Extreme Memory Optimized
VMs to constrain to lower
active vCPU(s).
Page 21

21
Dynamics 365 combines enterprise resource planning (ERP) and customer relationship management (CRM) into one cloud-based solution for
medium to large organizations.
Dynamics 365
User subscriptions are defaulted based on
customer inputs. Edit as appropriate.
Add record(s) for the Dynamics
365 areas and detail the desired
mix as appropriate.
Monthly costs are calculated
based customer inputs. Adjust
each cost as required to arrive
at a suitable configuration.
Page 22

Fill in the Customer SLA details.
Making a choice for Azure is not only about money, the Quality of Services is important as well. In this section, a comparison is made between the
Customer’s SLA and the SLA of Azure. To understand how to sell better using Quality of Services, watch this: https://youtu.be/curN2lg_Dbw.
22
Quality of Service
Annual audit cost are updated
to Customer Cost automatically
for cost comparisons.
Page 23

The migration cost variables are adjusted in the third table. In the first two lines, you can add external cost (per month) for training and/or support.
Estimated migration cost is the cost of a migration engineer to move a VM with workload to Azure. USD 200 cost per VM is a market standard for inhouse migration. Specialized migration companies offer prices for migrating VMs at USD 50 per VM or even lower.
23
Scenarios TAB offers the possibility to develop 3 financial migration scenarios to bring over your customer workloads to Azure. Scenarios provide
insights on effects of migration speed on Cost developments overtime, additional cumulative cashflow and, if applicable, Microsoft Incentives
(dependent on committed Azure consumptiontarget). To understand the use and purpose of Scenarios,watch https://youtu.be/XGInIfzkPAU.
In the first table of Scenarios, different variables for setting the scenarios are defined. We advise to base the first 2 scenarios on a migration effort by
in-house staff, plus external expertise if needed, where rule of thumb is migrating maximum 100 VMs per month. Use Scenario 3 for a radical
approach, by outsourcing migration to a specialized company, using tools in combination with a ‘migration factory’ in a low-cost setting with
migration up to 1,000 VMs per month. For Scenario 3, the lead time before the migration project is longer than in Scenario 1 and 2.
In the second table, adjust the variables that have to do with remaining liabilities and book
values after the Datacenter contract ends, based on the depreciation period the customer
is using and thinking smart about the remaining book-values.
If the Azure cost are substantial lower than the Customer Cost, it could be more beneficial
to close the current DC, pay a penalty and end with higher book values.
Scenarios
In the fourth table, the Microsoft Incentive program variables can be managed, if applicable for your case. If unsure, check with your Microsoft rep.
Azure Consumption Target is set on a trial-and-error basis.
Select Datacenter Migration Program to generate Incentive Payout charts to visualize potential payout against targets.
Adjust the values to understand incentive payout
potential for available Azure Migration Program.
In the last table, the results of 3 scenarios are summarized in terms of major KPIs. There can be up to 3 graphs per scenario to assist with visualizing
your Scenario building - cost development, cumulative cash flow and lastly, incentive payout (as applicable).
Page 24

24
In the Output section, you create the Customer Presentation, including graphs and tables supporting the price offer. The second Output file is a Word
document with all the case details, settings, all graphs and all tables. The last document is an Internal Memo summarizing the case and defining the
margins you will make in the case. To understand what you can do to improve your margin, watch this video: https://youtu.be/ObkoCEowWx0.
Output
Review the final Azure Consumption Estimate Comparison graph
after Optimization, Modernization and SaaS (as applicable). The
latest margin information is also presented for overall review
before you select your preferred output files.
Download the Output files with the actual case data,
graphs and tables, to build your presentation, quote
or an internal memo for deal approval purposes.
The output files are generated in native format to
make it easy to customize it to your specific needs.
If Customer Cost is not required, switch off the Customer
Benchmark cost in the presentation to the Customer. The
Customer Cost values will not be displayed.
Selling Azure Migrate requires another approach than legacy hosting offers. In this video we share our experiences and insights on how to be
successful: https://youtu.be/RtvRBgMrjc8.
Page 25

25
In many Azure Migrate cases, you must compete against AWS. We have run many compete cases and developed a couple of slides in the Customer
Presentation which can help you in winning the deal.
Output -Competing with AWS
The App calculates the difference between Azure and AWS Windows
server license costs based on all case data sets. For this, you must
utilize Azure AHB benefits for Windows OS licenses. You can select
‘AHB-Windows’ for VM OS within the VM Grid (see page 9).
Azure Site Recovery is an enormous added value for
many customers. It guarantees much higher availability
at a low cost. AWS’ disaster recovery solution is much
more expensive than that of Azure. The App calculates
the cost difference based on case data.
We have made a video to share our experiences on how to compete successfully against AWS, watch https://youtu.be/o813JONPyiM.
Page 26

Switch to End-Customer views to hide
margin related content when reviewing the
App side-by-side with your end-customers.
26
After going through this manual or working with the Smart Azure Calculator, you have learnt that in order to make a successful price proposal, the
involvement of the customer is important. Smart Azure Calculator offers different possibilitiesto get the customers’ buy-in.
Getting the Customer buy-in
In the Output TAB, you can send an email invite
to your Customer Expert(s) with an active link to
review your case.
If Send Invite is triggered again, latest URL is the
latest and previous URL will not work.
If desired, delete the active CE URL to ensure there
is no unauthorized access to your case.
All cost estimates are presented as Customer
net pricing, inclusive of your Customershared margins and/or service margin.
Giving the customer access to their own case will not only increase their involvement but also their understanding of how the dynamics of Azure
pricing work and what opportunities there are for them to reduce Azure costs.
Page 27

27
Success in winning new Azure Migrate business!
We Azure you; we’ll make it simple.
At least we try
Have any question or suggestion for further improvements?
Send us an email: info@thecloudlab.com
 Loading...