

Page 1

Cisco Network Analysis Module (NAM) Traffic Analyzer User Guide, 5.0
January 2011
Americas Headquarters
Cisco Systems, Inc.
170 West Tasman Drive
San Jose, CA 95134-1706
USA
http://www.cisco.com
Tel: 408 526-4000
800 553-NETS (6387)
Fax: 408 527-0883
Text Part Number: OL-22617-01
Page 2

THE SPECIFICATIONS AND INFORMATION REGARDING THE PRODUCTS IN THIS MANUAL ARE SUBJECT TO CHANGE WITHOUT NOTICE. ALL
STATEMENTS, INFORMATION, AND RECOMMENDATIONS IN THIS MANUAL ARE BELIEVED TO BE ACCURATE BUT ARE PRESENTED WITHOUT
WARRANTY OF ANY KIND, EXPRESS OR IMPLIED. USERS MUST TAKE FULL RESPONSIBILITY FOR THEIR APPLICATION OF ANY PRODUCTS.
THE SOFTWARE LICENSE AND LIMITED WARRANTY FOR THE ACCOMPANYING PRODUCT ARE SET FORTH IN THE INFORMATION PACKET THAT
SHIPPED WITH THE PRODUCT AND ARE INCORPORATED HEREIN BY THIS REFERENCE. IF YOU ARE UNABLE TO LOCATE THE SOFTWARE LICENSE
OR LIMITED WARRANTY, CONTACT YOUR CISCO REPRESENTATIVE FOR A COPY.
The Cisco implementation of TCP header compression is an adaptation of a program developed by the University of California, Berkeley (UCB) as part of UCB’s public
domain version of the UNIX operating system. All rights reserved. Copyright © 1981, Regents of the University of California.
NOTWITHSTANDING ANY OTHER WARRANTY HEREIN, ALL DOCUMENT FILES AND SOFTWARE OF THESE SUPPLIERS ARE PROVIDED “AS IS” WITH
ALL FAULTS. CISCO AND THE ABOVE-NAMED SUPPLIERS DISCLAIM ALL WARRANTIES, EXPRESSED OR
LIMITATION, THOSE OF MERCHANTABILITY, FITNESS FOR A PARTICULAR PURPOSE AND NONINFRINGEMENT OR ARISING FROM A COURSE OF
DEALING, USAGE, OR TRADE PRACTICE.
IN NO EVENT SHALL CISCO OR ITS SUPPLIERS BE LIABLE FOR ANY INDIRECT, SPECIAL, CONSEQUENTIAL, OR INCIDENTAL DAMAGES, INCLUDING,
WITHOUT LIMITATION, LOST PROFITS OR LOSS OR DAMAGE TO DATA ARISING OUT OF THE USE OR INABILITY TO USE THIS MANUAL, EVEN IF CISCO
OR ITS SUPPLIERS HAVE BEEN ADVISED OF THE POSSIBILITY OF SUCH DAMAGES.
Cisco and the Cisco Logo are trademarks of Cisco Systems, Inc. and/or its affiliates in the U.S. and other countries. A listing of Cisco's trademarks can be found at
www.cisco.com/go/trademarks. Third party trademarks mentioned are the property of their respective owners. The use of the word partner does not imply a partnership
relationship between Cisco and any other company. (1005R)
Any Internet Protocol (IP) addresses and phone numbers used in this document are not intended to be actual addresses and phone numbers. Any examples, command display
output, network topology diagrams, and other figures included in the document are shown for illustrative purposes only. Any use of actual IP addresses or phone numbers in
illustrative content is unintentional and coincidental.
Cisco Network Analysis Module (NAM) Traffic Analyzer User Guide, 5.0
© 2011 Cisco Systems, Inc. All rights reserved.
IMPLIED, INCLUDING, WITHOUT
Page 3

About This Guide xi
CONTENTS
CHAPTER
1 Overview 1-1
Introducing NAM Traffic Analyzer 5.0 1-1
Dashboards 1-2
Logical Site 1-2
New Application Classification Architecture 1-3
Standards-Based NBI 1-3
NetFlow v9 Data Export 1-4
Historical Analysis 1-4
SNMP v3 Support -- NAM to Router/Switch Support 1-5
Overview of the NAM Platforms 1-5
Logging In 1-6
Navigating the User Interface 1-6
Common Navigation and Control Elements 1-6
Menu Bar 1-6
Detailed Views 1-7
Context Menus 1-8
Quick Capture 1-8
Interactive Report 1-9
Chart View / Grid View 1-9
Mouse-Over for Details 1-10
Zoom/Pan Charts 1-10
Sort Grid 1-11
Bytes / Packets 1-11
Statistics 1-11
Context-Sensitive Online Help 1-12
OL-22617-01
Understanding How the NAM Works 1-12
Understanding How the NAM Uses SPAN 1-14
Understanding How the NAM Uses VACLs 1-14
Understanding How the NAM Uses NDE 1-15
Understanding How the NAM Uses WAAS 1-16
Configuration Overview 1-17
Configuring and Viewing Data 1-19
User Guide for the Cisco Network Analysis Module (NAM) Traffic Analyzer, 5.0
iii
Page 4

Contents
Cisco WAAS NAM Virtual Service Blade 1-20
CHAPTER
2 Setting Up The NAM Traffic Analyzer 2-1
Default Functions 2-1
Traffic Analysis 2-1
Application Response Time Metrics 2-2
Voice Signaling/RTP Stream Monitoring 2-2
Traffic Usage Statistics 2-3
Traffic 2-3
SPAN 2-3
About SPAN Sessions 2-3
Creating a SPAN Session 2-6
Editing a SPAN Session 2-8
Deleting a SPAN Session 2-9
Data Sources 2-9
SPAN 2-10
ERSPAN 2-10
VACL 2-17
NetFlow 2-18
WAAS 2-29
Understanding WAAS 2-29
Response Time Monitoring from WAAS Data Sources 2-30
Managing WAAS Devices 2-32
Adding Data Sources for New WAAS Device 2-33
Editing WAAS Data Sources 2-34
Deleting a WAAS Data Source 2-34
Auto Create of New WAAS Devices 2-35
Hardware Deduplication 2-35
iv
Alarms 2-36
Alarm Actions 2-36
Alarm Action Configuration 2-37
Editing Alarm Actions 2-38
Deleting Alarm Actions 2-38
Thresholds 2-39
Setting Host Thresholds 2-40
Setting Conversation Thresholds 2-41
Setting Application Thresholds 2-42
Setting Response Time Thresholds 2-43
Setting DSCP Thresholds 2-44
User Guide for the Cisco Network Analysis Module (NAM) Traffic Analyzer, 5.0
OL-22617-01
Page 5

Setting RTP Stream Thresholds 2-45
Setting Voice Signaling Thresholds 2-46
Setting NDE Interface Thresholds 2-47
Editing an Alarm Threshold 2-48
Deleting a NAM Threshold 2-48
User Scenario 2-49
Data Export 2-49
NetFlow 2-49
Viewing Configured NetFlow Exports 2-50
Configuring NetFlow Data Export 2-51
Editing NetFlow Data Export 2-53
Scheduled Exports 2-53
Editing a Scheduled Export 2-54
Deleting a Scheduled Export 2-54
Custom Export 2-55
Contents
Managed Device 2-55
Device Information 2-55
NBAR Protocol Discovery 2-57
Network 2-58
Sites 2-58
Definition Rules 2-59
Viewing Defined Sites 2-60
Defining a Site 2-61
Editing a Site 2-63
NDE Interface Capacity 2-63
Creating an NDE Interface 2-63
DSCP Groups 2-64
Creating a DSCP Group 2-64
Editing a DSCP Group 2-66
Deleting a DSCP Group 2-66
Classification 2-66
Applications 2-67
Creating a New Application 2-68
Editing an Application 2-69
Deleting a Protocol 2-70
Application Groups 2-70
Creating an Application Group 2-70
Editing an Application Group 2-70
Deleting an Application Group 2-70
OL-22617-01
User Guide for the Cisco Network Analysis Module (NAM) Traffic Analyzer, 5.0
v
Page 6

Contents
URL-based Applications 2-71
Example 2-72
Editing a URL-Based Application 2-73
Deleting a URL-based Application 2-73
Encapsulations 2-73
Monitoring 2-74
Aggregation Intervals 2-74
Response Time 2-76
Voice 2-76
RTP Filter 2-78
URL 2-78
Enabling a URL Collection 2-78
Changing a URL Collection 2-80
Disabling a URL Collection 2-80
WAAS Monitored Servers 2-80
Adding a WAAS Monitored Server 2-81
Deleting a WAAS Monitored Server 2-81
CHAPTER
3 Monitoring and Analysis 3-1
Navigation 3-2
Context Menus 3-2
Interactive Report 3-2
Saving Filter Parameters 3-3
Traffic Summary 3-4
Response Time Summary 3-5
Site Summary 3-6
Alarm Summary 3-6
Analyzing Traffic 3-8
Application 3-9
Hosts Detail 3-9
Host 3-10
Applications Detail 3-10
NDE Interface Traffic Analysis 3-11
Viewing Interface Details 3-12
DSCP Detail 3-12
DSCP 3-12
Application Groups Detail 3-13
URL Hits 3-14
Viewing Collected URLs 3-14
vi
User Guide for the Cisco Network Analysis Module (NAM) Traffic Analyzer, 5.0
OL-22617-01
Page 7

Filtering a URL Collection List 3-14
Host Conversations 3-15
Network Conversation 3-15
Top Application Traffic 3-15
Application Traffic By Host 3-17
WAN Optimization 3-17
Top Talkers Detail 3-17
Application Performance Analysis 3-18
Transaction Time (Client Experience) 3-18
Traffic Volume and Compression Ratio 3-18
Average Concurrent Connections (Optimized vs. Passthru) 3-18
Multi-Segment Network Time (Client LAN - WAN - Server LAN) 3-18
Conversation Multi-Segments 3-18
Response Time 3-19
Application Response Time 3-22
Network Response Time 3-22
Server Response Time 3-23
Client Response Time 3-23
Client-Server Response Time 3-23
Server Application Responses 3-23
Server Application Transactions 3-24
Server Network Responses 3-25
Client-Server Application Responses 3-26
Client-Server Application Transactions 3-27
Client-Server Network Responses 3-28
Contents
OL-22617-01
Managed Device 3-29
Interface 3-30
Interfaces Stats Table 3-30
Interface Statistics Over Time 3-31
Health 3-31
Switch Health 3-31
Router Health 3-35
NBAR 3-37
Media 3-37
RTP Streams 3-38
Purpose 3-38
Monitoring RTP Streams 3-39
Voice Call Statistics 3-39
Calls Table 3-40
User Guide for the Cisco Network Analysis Module (NAM) Traffic Analyzer, 5.0
vii
Page 8

Contents
RTP Conversation 3-42
CHAPTER
4 Capturing and Decoding Packet Data 4-1
Sessions 4-2
Viewing Capture Sessions 4-3
Configuring Capture Sessions 4-4
Software Filters 4-7
Creating a Software Filter 4-8
Editing a Software Capture Filter 4-11
Hardware Assisted Filters 4-12
Configuring a Hardware Filter 4-12
Files 4-15
Analyzing Capture Files 4-17
Error Scan 4-17
Downloading Capture Files 4-18
Deleting a Capture File 4-19
Deleting Multiple Files 4-19
Viewing Packet Decode Information 4-20
Browsing Packets in the Packet Decoder 4-21
Filtering Packets Displayed in the Packet Decoder 4-21
Viewing Detailed Protocol Decode Information 4-22
Using Alarm-Triggered Captures 4-23
Custom Display Filters 4-23
Creating Custom Display Filters 4-23
Editing Custom Display Filters 4-26
Deleting Custom Display Filters 4-27
CHAPTER
viii
5 User and System Administration 5-1
System Administration 5-1
Resources 5-2
Network Parameters 5-2
SNMP Agent 5-3
Working with NAM Community Strings 5-4
System Time 5-5
Synchronizing the NAM System Time with the Switch or Router 5-6
Synchronizing the NAM System Time Locally 5-6
Configuring the NAM System Time with an NTP Server 5-7
E-Mail Setting 5-7
Web Data Publication 5-8
User Guide for the Cisco Network Analysis Module (NAM) Traffic Analyzer, 5.0
OL-22617-01
Page 9

Capture Data Storage 5-8
Creating NFS Storage Locations 5-9
Editing NFS Storage Locations 5-10
Creating iSCSI Storage Locations 5-11
Editing iSCSI Storage Locations 5-11
Syslog Setting 5-12
SNMP Trap Setting 5-12
Creating a NAM Trap Destination 5-12
Editing a NAM Trap Destination 5-13
Deleting a NAM Trap Destination 5-13
Preferences 5-13
Diagnostics 5-14
System Alerts 5-14
Audit Trail 5-14
Tech Support 5-15
Contents
CHAPTER
User Administration 5-16
Local Database 5-16
Recovering Passwords 5-16
Changing Predefined NAM User Accounts on the Switch or Router 5-17
Creating a New User 5-17
Editing a User 5-18
Deleting a User 5-18
Establishing TACACS+ Authentication and Authorization 5-19
Configuring a TACACS+ Server to Support NAM Authentication and Authorization 5-20
Configuring a Cisco ACS TACACS+ Server 5-20
Current User Sessions 5-22
6 NAM Traffic Analyzer 5.0 Usage Scenarios 6-1
Deployment 6-2
Deploying NAMs in the Branch 6-2
Deploying NAMs for Voice/Video applications 6-2
Deploying NAMs for WAN Optimization 6-2
Deploying Multi-NAM Consolidation 6-2
Autodiscovery Capabilities of NAM 6-3
Creating Custom Applications 6-3
Utilizing Sites to Create a Geographically Familiar Deployment 6-3
Integrating NAM with Third Party Reporting Tools 6-3
Integrating NAM with LMS 6-4
OL-22617-01
Monitoring 6-4
User Guide for the Cisco Network Analysis Module (NAM) Traffic Analyzer, 5.0
ix
Page 10

Contents
Understanding Traffic Patterns at the Network Layer 6-4
Understanding Traffic patterns for DiffServ-Enabled Networks 6-4
Using NAM to Evaluate Application-Level Performance Monitoring for TCP-Interactive
Applications 6-4
Using NAM to Evaluate Application-Level Performance Monitoring for UDP Realtime
Applications 6-5
Using NAM to Evaluate Potential Impact of WAN Optimization Prior to Deployment 6-5
Troubleshooting 6-5
Using NAM for Problem Isolation 6-5
Using NAM for SmartGrid Visibility 6-6
APPENDIX
APPENDIX
A Troubleshooting A-1
General NAM Issues A-1
Error Messages A-2
Packet Drops A-2
NAM Not Responding A-2
NAM Behavior A-3
WAAS Troubleshooting A-3
B Supported MIB Objects B-1
Supported MIBs B-1
User Guide for the Cisco Network Analysis Module (NAM) Traffic Analyzer, 5.0
x
OL-22617-01
Page 11

About This Guide
This guide describes how to use Cisco Network Analysis Module Traffic Analyzer 5.0 (NAM 5.0)
software. This preface has the following sections:
• Chapter Overview, page xi
• Audience, page xii
• Conventions, page xii
• Notices, page xii
• Obtaining Documentation and Submitting a Service Request, page xiii
For a list of the platforms that Cisco NAM 5.0 supports, see Overview of the NAM Platforms, page 1-5.
Chapter Overview
This guide contains the following chapters:
• Chapter 1, “Overview” provides an overview of the NAM Traffic Analyzer, discusses new features
in this release, describes the new GUI, and provides information about how to use various
components of the NAM Traffic Analyzer.
OL-22617-01
• Chapter 2, “Setting Up The NAM Traffic Analyzer,” provides information about the first steps users
should take after booting up the NAM and setting up the NAM Traffic Analyzer applications.
• Chapter 3, “Monitoring and Analysis” provides information about options for viewing and
monitoring various types data.
• Chapter 4, “Capturing and Decoding Packet Data” provides information about setting up multiple
sessions for capturing, filtering, and decoding packet data, managing the data in a file control
system, and displaying the contents of the packets.
• Chapter 5, “User and System Administration” provides information about performing user and
system administration tasks and generating diagnostic information for obtaining technical
assistance.
• Chapter 6, “NAM Traffic Analyzer 5.0 Usage Scenarios” provides scenarios for NAM deployment
and the details you may need to know about them.
User Guide for the Cisco Network Analysis Module (NAM) Traffic Analyzer, 5.0
xi
Page 12

Audience
This guide is designed for network administrators who are responsible for setting up and configuring
Network Analysis Modules (NAMs) to monitor traffic and diagnose emerging problems on network
segments. As a network administrator, you should be familiar with:
• Basic concepts and terminology used in internetworking.
• Network topology and protocols.
• Basic UNIX commands or basic Windows operations.
Conventions
This document uses the following conventions:
Item Convention
Commands and keywords boldface font
Variables for which you supply values italic font
Displayed session and system information
Information you enter
Variables you enter
Menu items and button names boldface font
Selecting a menu item in paragraphs Option > Network Preferences
Selecting a menu item in tables Option > Network Preferences
screen font
boldface screen font
italic screen font
About This Guide
Caution Means reader be careful. In this situation, you might do something that could result in equipment
Notices
User Guide for the Cisco Network Analysis Module (NAM) Traffic Analyzer, 5.0
xii
Note Means reader take note. Notes contain helpful suggestions or references to material not covered in the
publication.
damage or loss of data.
The Third Party and Open Source Copyright Notices for the Cisco Network Analysis Module, Release
5.0 contains the licenses and notices for open source software used in NAM Traffic Analyzer 5.0. NAM
5.0 includes software developed by the OpenSSL Project for use in the OpenSSL Toolkit
(
http://www.openssl.org/). This document is available on www.cisco.com with the NAM Traffic
Analyzer technical documentation.
OL-22617-01
Page 13

About This Guide
Obtaining Documentation and Submitting a Service Request
For information on obtaining documentation, submitting a service request, and gathering additional
information, see the monthly What’s
revised Cisco
http://www.cisco.com/en/US/docs/general/whatsnew/whatsnew.html
Subscribe to the What’s New in Cisco Product Documentation as a Really Simple Syndication (RSS) feed
and set content to be delivered directly to your desktop using a reader application. The RSS feeds are a free
service and Cisco currently supports RSS
technical documentation, at:
New in Cisco Product Documentation, which also lists all new and
Ve r si o n 2.0.
OL-22617-01
User Guide for the Cisco Network Analysis Module (NAM) Traffic Analyzer, 5.0
xiii
Page 14

About This Guide
xiv
User Guide for the Cisco Network Analysis Module (NAM) Traffic Analyzer, 5.0
OL-22617-01
Page 15

CHAP T ER
1
Overview
This chapter provides information about the Cisco Network Analysis Module Traffic Analyzer,
Release
This chapter contains the following sections:
• Introducing NAM Traffic Analyzer 5.0, page 1-1
• Overview of the NAM Platforms, page 1-5
• Logging In, page 1-6
5.0 and describes the new features and how to navigate the interface.
–
Dashboards, page 1-2
–
Logical Site, page 1-2
–
New Application Classification Architecture, page 1-3
–
Standards-Based NBI, page 1-3
–
NetFlow v9 Data Export, page 1-4
–
Historical Analysis, page 1-4
–
SNMP v3 Support -- NAM to Router/Switch Support, page 1-5
• Navigating the User Interface, page 1-6
• Understanding How the NAM Works, page 1-12
–
Understanding How the NAM Uses SPAN, page 1-14
–
Understanding How the NAM Uses VACLs, page 1-14
–
Understanding How the NAM Uses NDE, page 1-15
–
Understanding How the NAM Uses WAAS, page 1-16
• Configuration Overview, page 1-17
Introducing NAM Traffic Analyzer 5.0
The Cisco Network Analysis Module (NAM) Traffic Analyzer software enables network managers to
understand, manage, and improve how applications and services are delivered to end users.
The NAM combines flow-based and packet-based analysis into one solution. The NAM can be used for
traffic analysis of applications, hosts, and conversations, performance-based measurements on
application, server, and network latency, quality of experience metrics for network-based services such
as Voice over IP (VoIP) and video, and problem analysis using deep, insightful packet captures. The
User Guide for the Cisco Network Analysis Module (NAM) Traffic Analyzer, 5.0
OL-22617-01
1-1
Page 16
Introducing NAM Traffic Analyzer 5.0
Cisco NAM includes an embedded, web-based Traffic Analyzer GUI that provides quick access to the
configuration menus and presents easy-to-read performance monitoring and analysis on web, voice, and
video traffic.
Dashboards
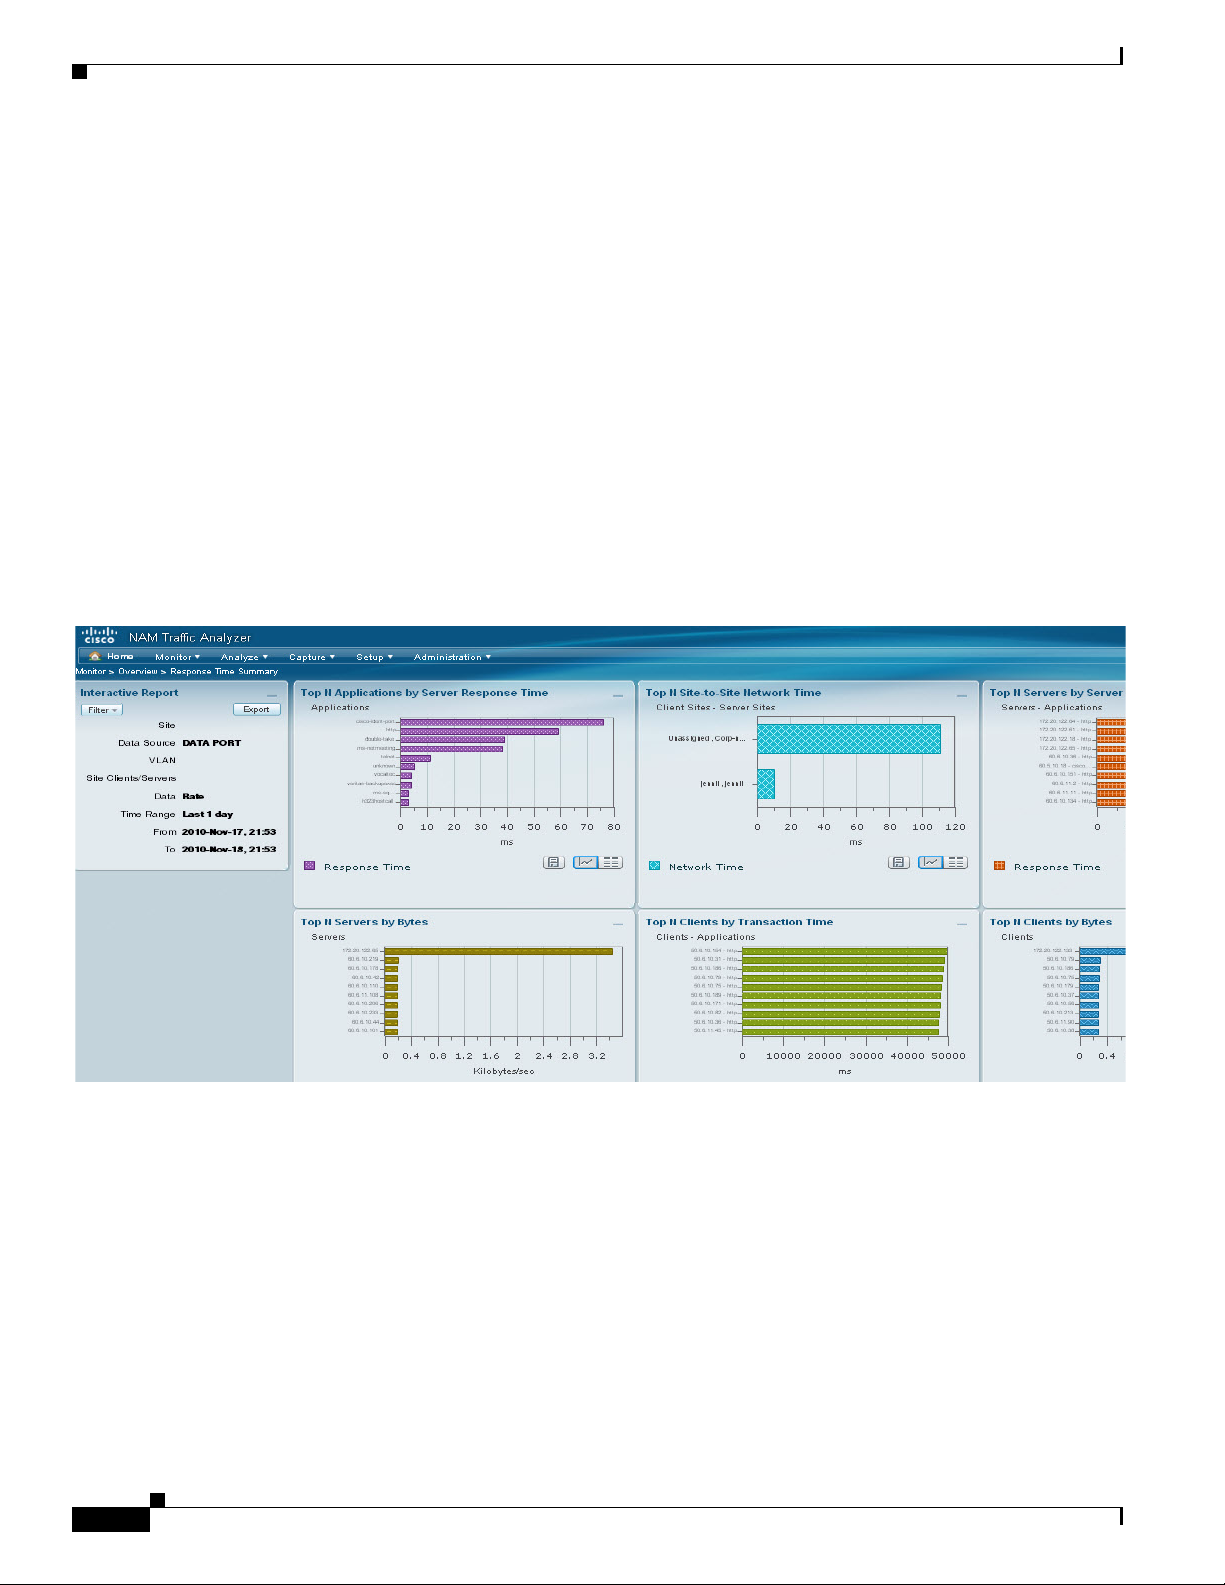
The Cisco NAM Traffic Analyzer, Release 5.0 introduces a redesigned interface and user experience,
with more intuitive workflows and interactive reporting capabilities. The dashboard-style layouts show
multiple charts in one window, thereby giving you the ability to view a lot of information at once.
There are two types of dashboards in NAM 5.0: One type is the “summary” views found under the
Monitor menu, and the other type is the “over time” views found under the Analyze menu. The Monitor
dashboards allow you to view network traffic, application performance, site performance, and alarms at
a glance. From there, you can isolate one area, for example an application with response time issues, and
then drill-down to the Analyze dashboard for further investigation.
Figure 1-1 shows an example of one of the Monitoring dashboards in the NAM 5.0 release.
Figure 1-1 Dashboard in NAM 5.0
Chapter 1 Overview
Logical Site
User Guide for the Cisco Network Analysis Module (NAM) Traffic Analyzer, 5.0
1-2
The Analyze dashboards allow you to zoom or pan to reselect the range. As you change the range, the
related graphs at the bottom will update.
The dashboards can be extracted as a PNG. You can also create a Scheduled Export to have the
dashboards extracted regularly and sent to you in CSV or HTML format (see
page 2-53).
Cisco NAM Traffic Analyzer 5.0 introduces the capability for users to define a site, with which you can
aggregate and organize performance statistics. A site is a collection of hosts (network endpoints)
partitioned into views that help you monitor traffic and troubleshoot problems. A site can be defined as
Scheduled Exports,
OL-22617-01
Page 17
Chapter 1 Overview
Introducing NAM Traffic Analyzer 5.0
a set of subnets specified by an address prefix and mask, or using other criteria such as a remote device
data source (for example, remote WAE device and segment information). If you want to limit the view
of your network analysis data to a specific city, a specific building, or even a specific floor of a building,
you can use the sites function.
You can also include multiple types of data sources in the site definition, and you can then get an
aggregated view of all network traffic.
The pre-defined “Unassigned Site” makes it easy to bring up a NAM without having to configure
user-defined sites. Hosts that do not belong to any user-defined site will automatically belong to the
Unassigned Site.
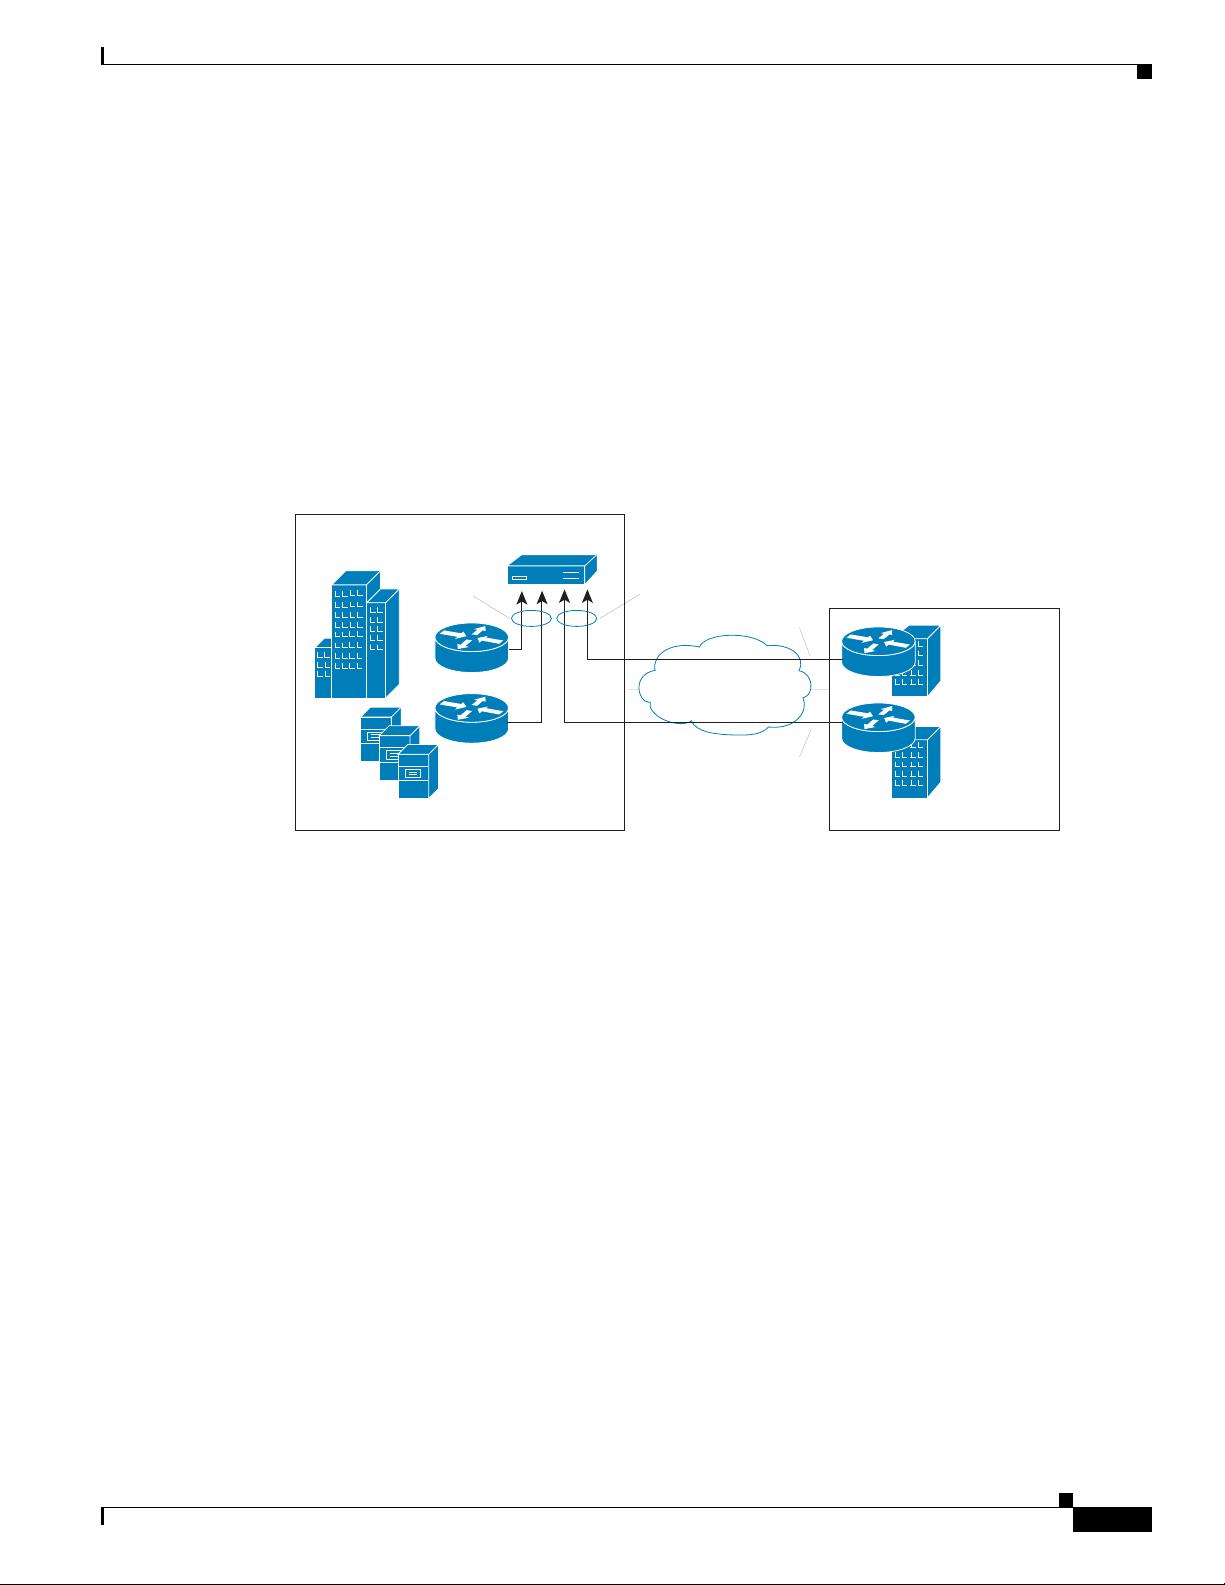
Figure 1-2 shows an example of how a network may be configured using sites.
Figure 1-2 Site Level Aggregation
San Jose
Campus
San Jose
Site San
Jose
NAM
Site New
Yo r k
Netflow
New York
NYC
Building 1
Datacenter
San Jose
For information about defining and editing a site, see Sites, page 2-58.
New Application Classification Architecture
In previous releases of NAM, the RMON-2 protocol directory infrastructure was used to identify
applications and network protocols. In NAM Traffic Analyzer Release 5.0, the application classification
scheme is changed to align with the methodology used by Cisco with technologies such as NBAR
(Network-Based Application Recognition) and SCL. It also accepts standardized application identifiers
exported by Cisco platforms with NDE (NetFlow Data Export).
This allows you to gain application visibility with consistent and unique application identifiers across
the network. For example, you can view applications using a global unique identifier, as compared with
multiple classification engines using different applications identifiers.
For information about set up, see Classification, page 2-66.
Standards-Based NBI
FX
NYC
Building 2
197645
OL-22617-01
NBI (Northbound Interface), also referred to as API (Application Programming Interface) enables
partners and customers to provision the NAM and extract performance data. Previous releases of NAM
were limited to SNMP s, and direct-URL knowledge for access to some data, including the method by
which CSV-formatted data is retrieved.
User Guide for the Cisco Network Analysis Module (NAM) Traffic Analyzer, 5.0
1-3
Page 18

Introducing NAM Traffic Analyzer 5.0
With NAM 5.0, the NBI is expanded to include a Representational State Transfer (REST) web service
for configuration, and retrieval of data pertaining to sites. Also introduced is the capability to export
high-volume performance data in the form of Netflow v9 (see the next section,
Export”).
Note REST does not support retrieval of performance data for sites.
REST is a set of guidelines for doing web services over HTTP. It takes advantage of the HTTP method
(GET, POST, UPDATE, DELETE) as part of the request.
The REST request/response messages using the REST web service will contain XML data in the body
content of the HTTP request. An XML schema will describe the message content format. All REST
request/response messages are handled in XML format. Then the REST web service consumer can use
any HTTP client to communitate with the REST server. To use the REST web service via HTTPS, the
NAM crypto patch needs to be installed on the NAM.
The NBI web service will provide an external API interface for provisioning and retrieving performance
data. For application developers who want to use the NAM APIs to provision network services and
leverage data, see the Cisco Network Analysis Module 5.0 API Programmer’s Guide. The developers
who use the APIs should have an understanding of a high-level programming language such as Java or
an equivalent.
Chapter 1 Overview
“NetFlow v9 Data
NetFlow v9 Data Export
The NAM uses NetFlow as a format for the ongoing streaming of aggregated data, based on the
configured set of descriptors or queries of the data attributes in NAM. The NAM as a producer of NDE
(NetFlow Data Export) packets is a new feature for NAM Traffic Analyzer 5.0. The NAM's new
functionality of NDE is part of its new NBI.
NetFlow collects traffic statistics by monitoring packets that flow through the device and storing the
statistics in the NetFlow table. NDE converts the NetFlow table statistics into records, and exports the
records to an external device, which is called a NetFlow collector.
The NDE Descriptor is a permanent definition of the NAM aggregated data query of aggregated NAM
data, which must be exported to designated destinations across the network using the industry-wide
standard of NetFlow v9 instead of the standard UDP transport.
The NDE Descriptor defines the data query that remains in effect as long as the NDE descriptor exists
in NAM’s permanent storage. Having it instantiated means that the NAM will be exporting the matching
aggregated data records continuously (in a specified frequency) until the NDE descriptor is deleted or
updated.
For information about set up, see Data Export, NetFlow, page 2-49.
Historical Analysis
Unlike previous versions of the NAM, in which you have to configure targeted historical reports in
advance, the NAM Traffic Analyzer 5.0 stores short-term and long-term data that you can view using the
new dashboards.
The NAM proactively collects and stores up to 72 hours of data at a granularity of 1, 5, or 10 minute
intervals, and longer-term data with a granularity of 1 to 2 hours, This allows you to specify different
time periods to view trends over time and identify potential problems.
1-4
User Guide for the Cisco Network Analysis Module (NAM) Traffic Analyzer, 5.0
OL-22617-01
Page 19

Chapter 1 Overview
SNMP v3 Support -- NAM to Router/Switch Support
Simple Network Management Protocol Version 3 (SNMPv3) is an interoperable standards-based
protocol for network management. The security features provided in SNMPv3 are:
• Message integrity—Ensuring that a packet has not been tampered with in-transit.
• Authentication—Determining the message is from a valid source.
• Encryption—Scrambling the contents of a packet prevent it from being seen by an unauthorized
source.
With NAM 5.0, you have the ability to manage devices with SNMPv3.
Note For the WS-SVC-NAM-1 and WS-SVC-NAM-2 platforms, SNMPv3 is not required. SNMP requests
and responses are communicated over an internal interface within the chassis, and SNMPv3 is not used.
Overview of the NAM Platforms
Overview of the NAM Platforms
The following models differ in memory, performance, disk size, and other capabilities. Therefore, some
allow for more features and capabilities (for example, the amount of memory allocated for capture).
Throughout this User Guide, there will be Notes explaining that some features apply only to specific
platforms. If there is no Note, then that feature or aspect applies to all NAM platforms.
NAM 5.0 software supports the following NAM models (SKU):
• Cisco NAM 2204 Appliances
–
NAM2204-RJ45
–
NAM2204-SFP
• Cisco NAM 2220 Appliance
–
NAM2220
• Cisco 6500 Series Switches and Cisco 7600 Series Routers
–
WS-SVC-NAM-1
–
WS-SVC-NAM-1-250S
–
WS-SVC-NAM-2
–
WS-SVC-NAM-2-250S
• Cisco Branch Routers
–
NME-NAM-80S
–
NME-NAM-120S
OL-22617-01
NAM 5.0 virtual blade software also supports the following virtual blade:
• Cisco WAAS NAM Virtual Service Blade
Note The Cisco Nexus 1010 Virtual Services Appliance is not supported with NAM Traffic Analyzer
Release
5.0. The suggested upgrade path for Nexus 1010 NAM 4.2 users is from NAM 4.2 to 4.2.1N,
and then to NAM 5.1 (when available).
User Guide for the Cisco Network Analysis Module (NAM) Traffic Analyzer, 5.0
1-5
Page 20

Logging In
Logging In
Chapter 1 Overview
Log into the NAM by using the username and password that the NAM installer provided you, and click
the Login button. If you are having problems logging in:
• Make sure you are using a browser that is currently supported for use with NAM 5.0:
English Firefox 3.6+ or Microsoft Internet Explorer 8+ (Microsoft Internet Explorer 7 is not
supported)
• Make sure you are using a platform that is currently supported for use with NAM 5.0:
Microsoft Windows XP or Microsoft Windows 7. The Macintosh platform is not supported on this
release.
• Make sure you have JavaScript enabled.
• Clear the browser cache and restart the browser (not necessarily if installing NAM for the first time).
• Make sure cookies are enabled in your browser.
• If you see the following message: “Initializing database. Please wait until initialization process
finishes,” you must wait until the process finishes.
• Make sure you had accepted the license agreement (WAAS VSB users only) and that the license has
not expired
To view the full documentation set (including the User Guide and Release Notes) for the Cisco NAM
Traffic Analyzer 5.0, go to the NAM Technical Documentation area on Cisco.com:
http://www.cisco.com/en/US/products/sw/cscowork/ps5401/
tsd_products_support_series_home.html
Navigating the User Interface
NAM 5.0 introduces a redesigned interface and user experience, with more intuitive workflows and
improved operational efficiency. This section describes the improved navigation and control elements in
the user interface.
Note All times in the Traffic Analyzer are typically displayed in 24-hour clock format. For example, 3:00 p.m.
is displayed as 15:00.
Common Navigation and Control Elements
Menu Bar
To perform the NAM functions, use the menu bar.
1-6
The selections enable you to perform the necessary tasks:
Home: Brings you to the Traffic Summary Dashboard (Monitor > Overview > Traffic Summary).
User Guide for the Cisco Network Analysis Module (NAM) Traffic Analyzer, 5.0
OL-22617-01
Page 21
Chapter 1 Overview
Detailed Views
Navigating the User Interface
Monitor: See “summary” views that allow you to view network traffic, application performance, site
performance, and alarms at a glance.
Analyze: See various “over-time” views for traffic, WAN optimization, response time, managed device,
and media functions.
Capture: Configure multiple sessions for capturing, filtering, and decoding packet data, manage the data
in a file control system, and display the contents of the packets.
Setup: Perform all setup needed to run Cisco NAM Traffic Analyzer 5.0.
Administration: Perform user and system administration tasks, and generate diagnostic information for
obtaining technical assistance.
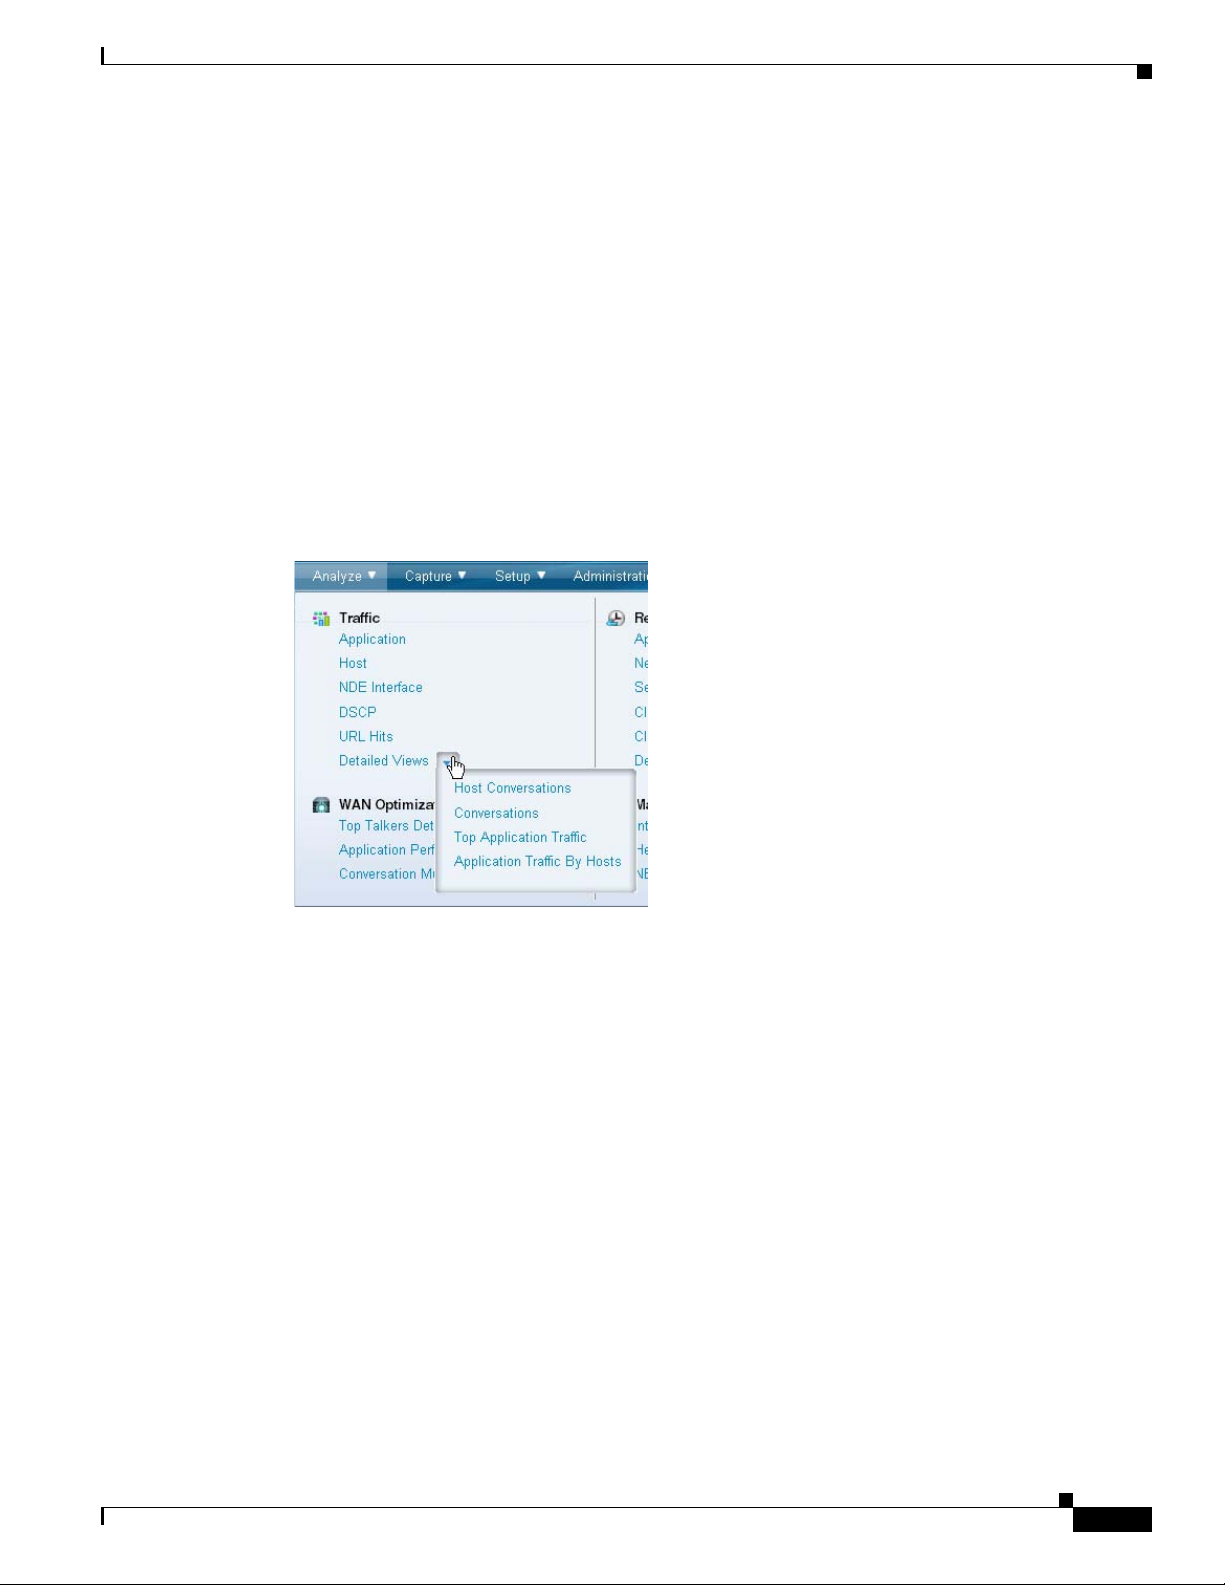
Under some topics in the mega-menu, the last selection is “Detailed Views.” Click the small arrow to the
right of the menu selections to see the sub-menu and the functions available.
OL-22617-01
User Guide for the Cisco Network Analysis Module (NAM) Traffic Analyzer, 5.0
1-7
Page 22
Navigating the User Interface
Context Menus
Chapter 1 Overview
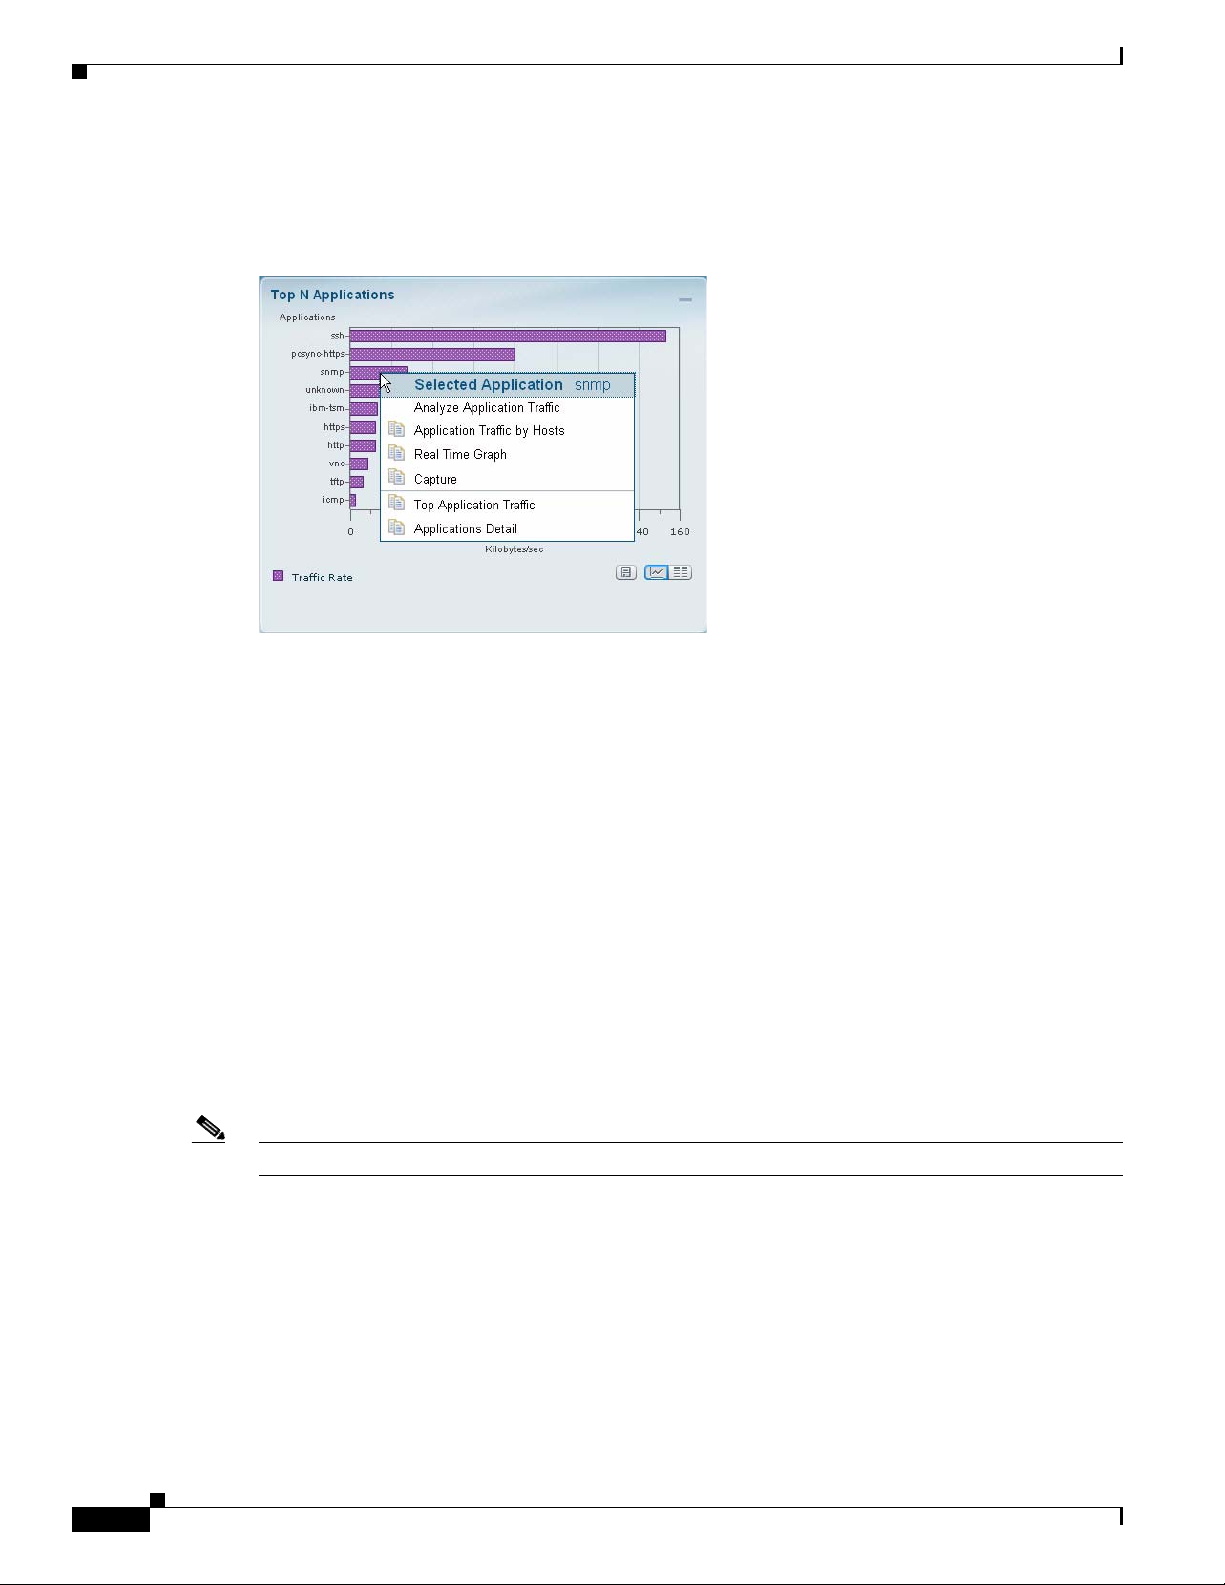
On most charts that appear on the dashboards, you can left-click on a colored bar of data to get a context
menu, with which you can get more detailed information about that item.
Quick Capture
Note Quick Capture does not use site definition/filter.
The example above is from the Traffic Summary Dashboard, Top N Applications chart. The description
to the right of “Selected Application” in the menu shows what item you had clicked on (in this case,
“snmp”).
The menu items above the separator line are specific to the selected element of the Top N chart. The
items below the separator line are not specific to the selected element, but apply to the Top N chart.
From the Context menu of many of the bar charts that show Applications or Hosts or VLANs. you can
start a Capture.
For example, when you click on an Application in a barchart (as in the screenshot above) and choose
Capture, the following is done automatically:
• A memory-based capture session is created
• A software filter is created using that application
• The capture session is started
• The decode window pops open and you can immediately see packets being captured.
1-8
User Guide for the Cisco Network Analysis Module (NAM) Traffic Analyzer, 5.0
OL-22617-01
Page 23
Chapter 1 Overview
Interactive Report
Navigating the User Interface
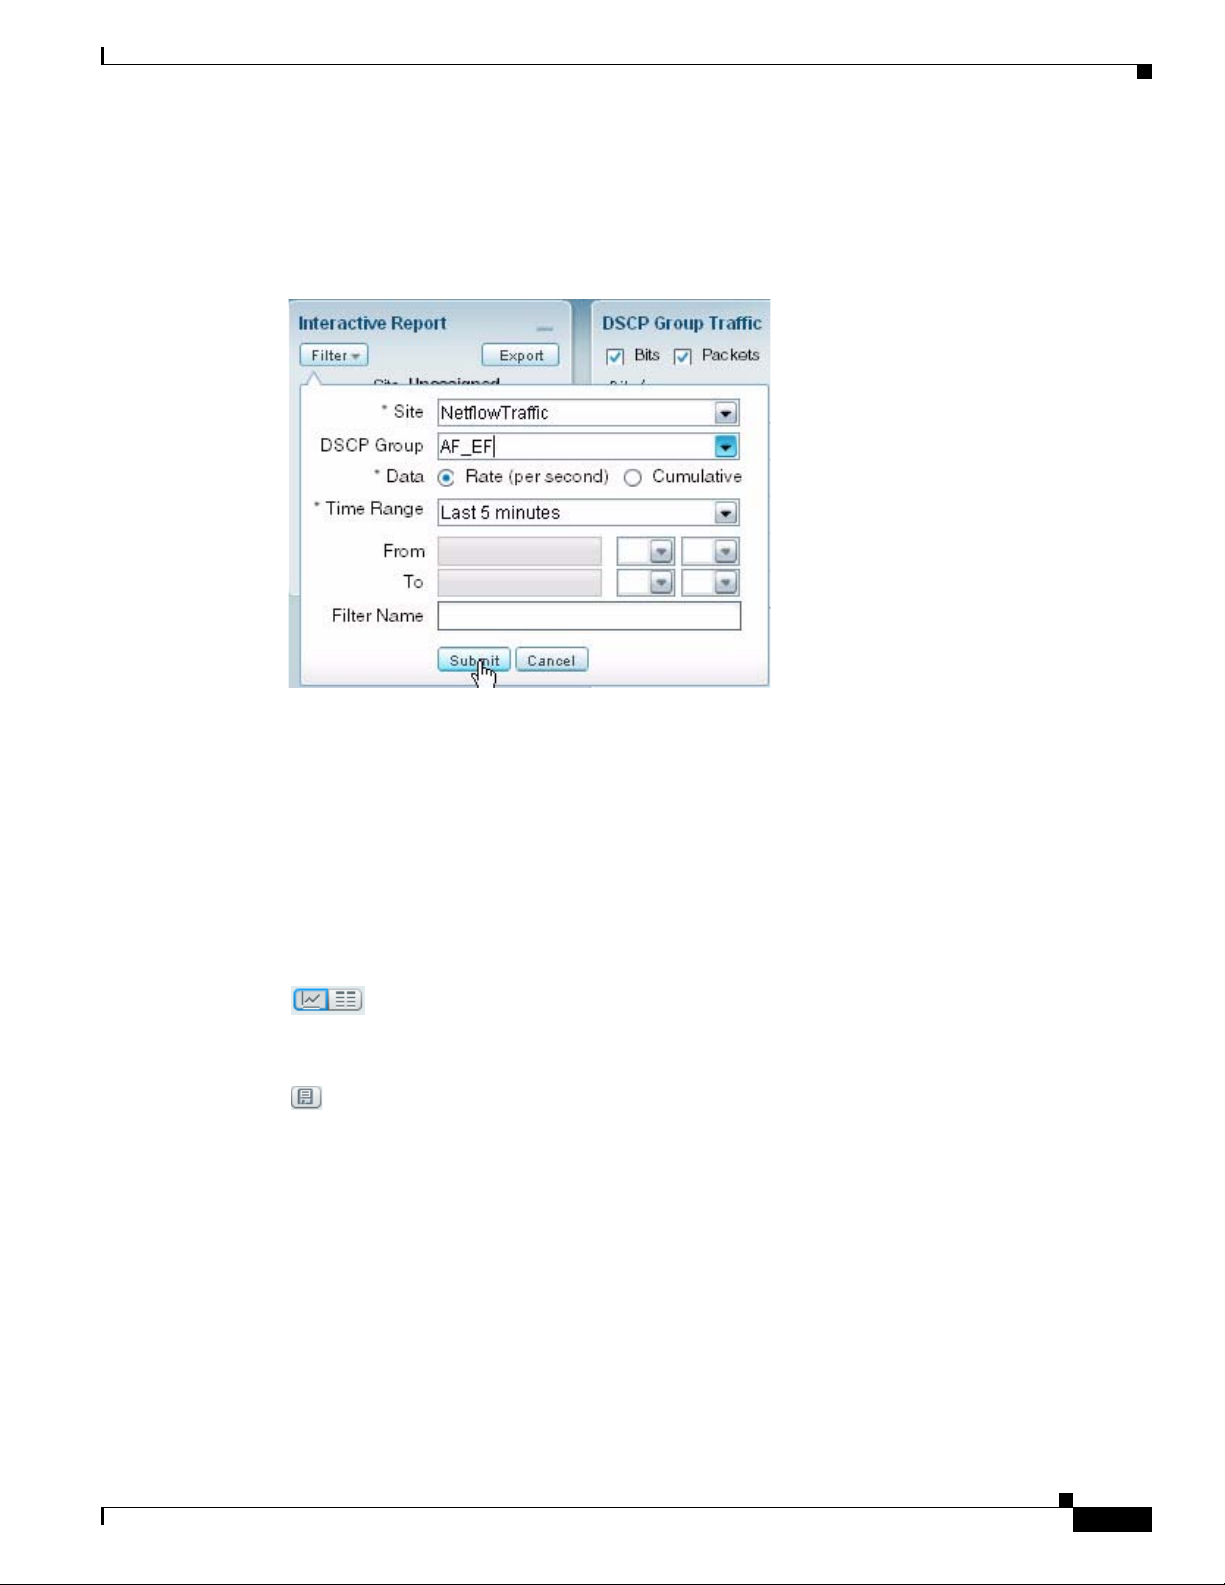
On most Monitoring and Analyze screens, you can use the Interactive Report on the left side of the
screen to view and change the parameters of the information displayed in the charts. You can redefine
the parameters by clicking the Filter button on the left side of the Interactive Report.
The reporting time interval selection changes depending upon the dashboard you are viewing, and the
NAM platform you are using. The NAM supports up to five saved Interactive Reports.
Chart View / Grid View
Most of the data presented by the NAM can be viewed as either a Chart or a Grid. The Chart view
presents an overview of the data in an integrated manner, and can show you trending information. The
Grid view can be used to see more precise data. For example, to get the exact value of data in graphical
view, you would need to hover over a data point in the Chart to get the data, whereas the same data is
easily visible in table format using Grid view. To toggle between the two views, use the Chart and Grid
icons at the bottom of the panel:
Next to that icon is the “Show as Image” icon, with which you save the chart you are viewing as a PNG
file.
OL-22617-01
User Guide for the Cisco Network Analysis Module (NAM) Traffic Analyzer, 5.0
1-9
Page 24
Navigating the User Interface
Mouse-Over for Details
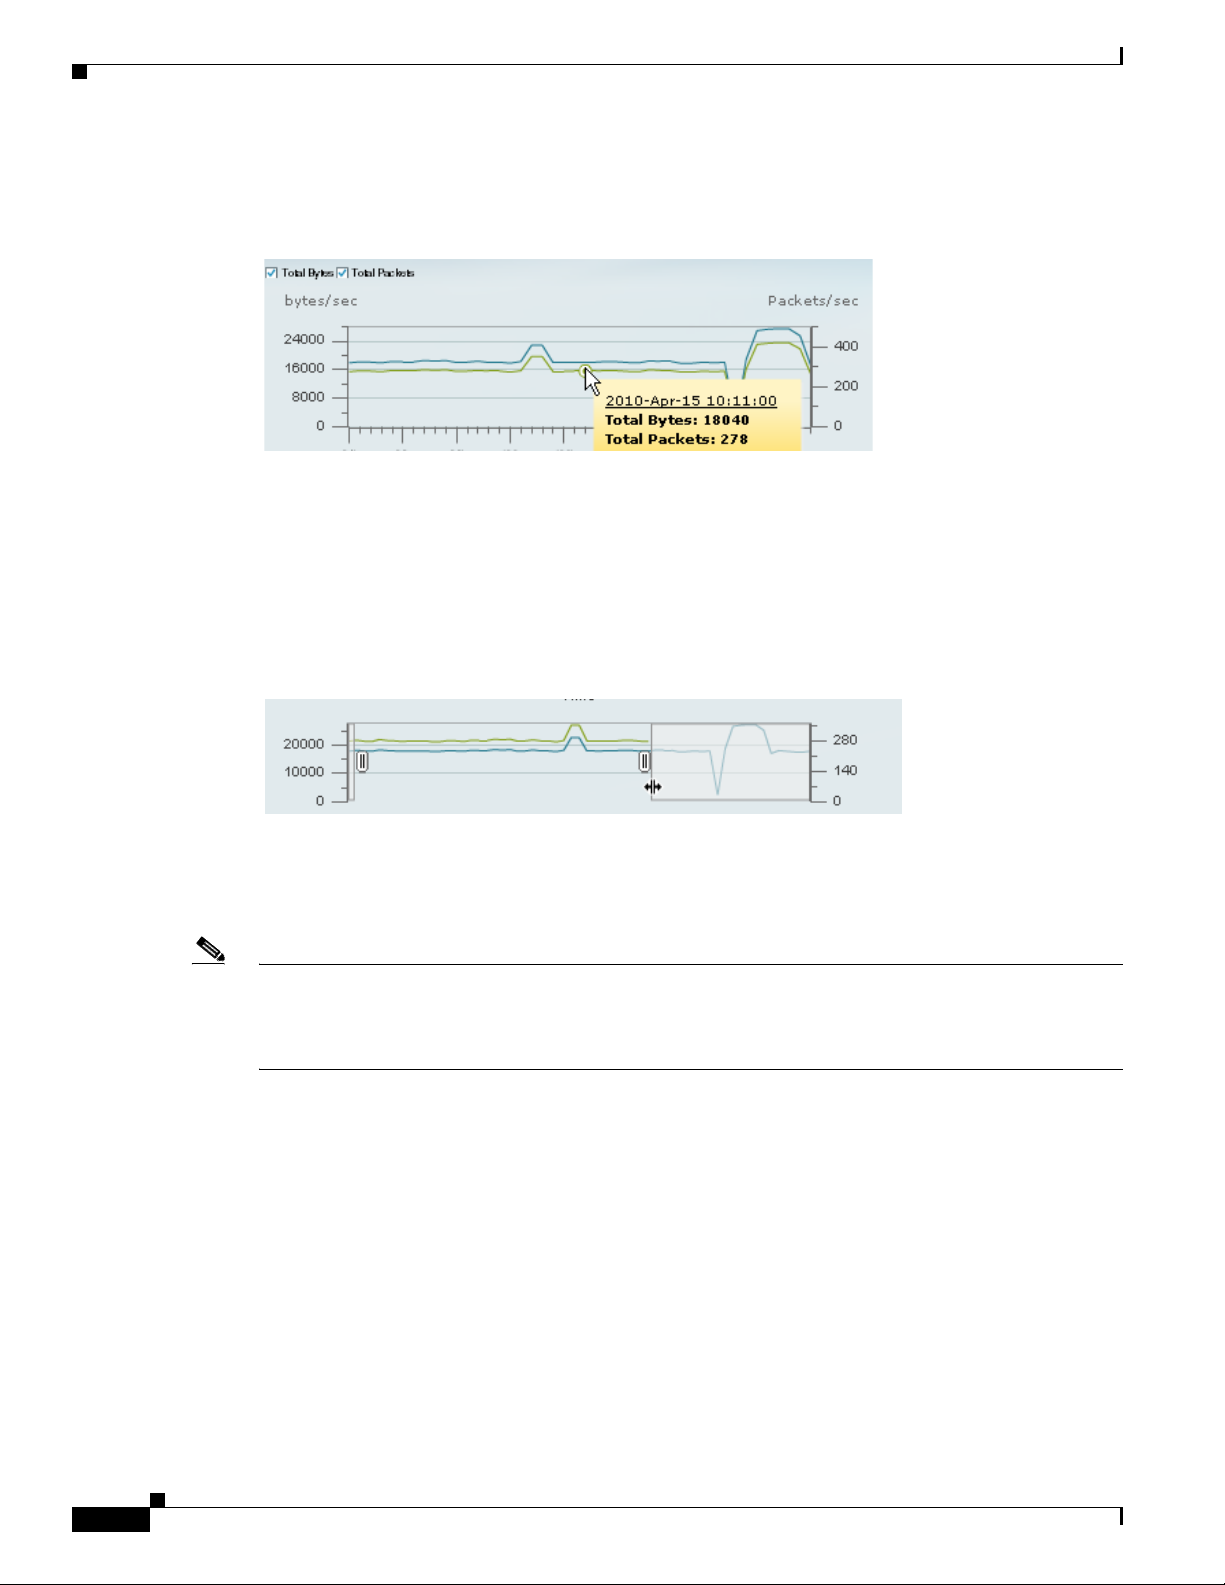
When in Chart view, you can mouseover the chart to get more detailed information about what occurred
at a specific time.
Many of the line charts in NAM are “dual-axis,” meaning there is one metric shown on the left axis of
the chart and another metric shown on the right axis of the chart.
For example, in the figure above, Total Bytes per second is shown on the left axis, and Total Packets per
second is shown on the right axis.
Chapter 1 Overview
Zoom/Pan Charts
Note In a bar chart which you can zoom/pan, each block represents data collected during the previous interval
For many charts, you can drag the beginning or end to change the time interval, as shown below.
The time interval change on the zoom/pan chart will affect the data presented in the charts in the bottom
of the window. The zoom/pan time interval also affects the drill-down navigations; if the zoom/pan
interval is modified, the context menu drill-downs from that dashboard will use the zoom/pan time
interval.
(the time stamp displayed at the bottom of each block is the end of the time range). Therefore, you may
have to drag the zoom/pan one block further than expected to get the desired data to populate in the charts
in the bottom of the window.
1-10
User Guide for the Cisco Network Analysis Module (NAM) Traffic Analyzer, 5.0
OL-22617-01
Page 25
Chapter 1 Overview
Sort Grid
Bytes / Packets
Navigating the User Interface
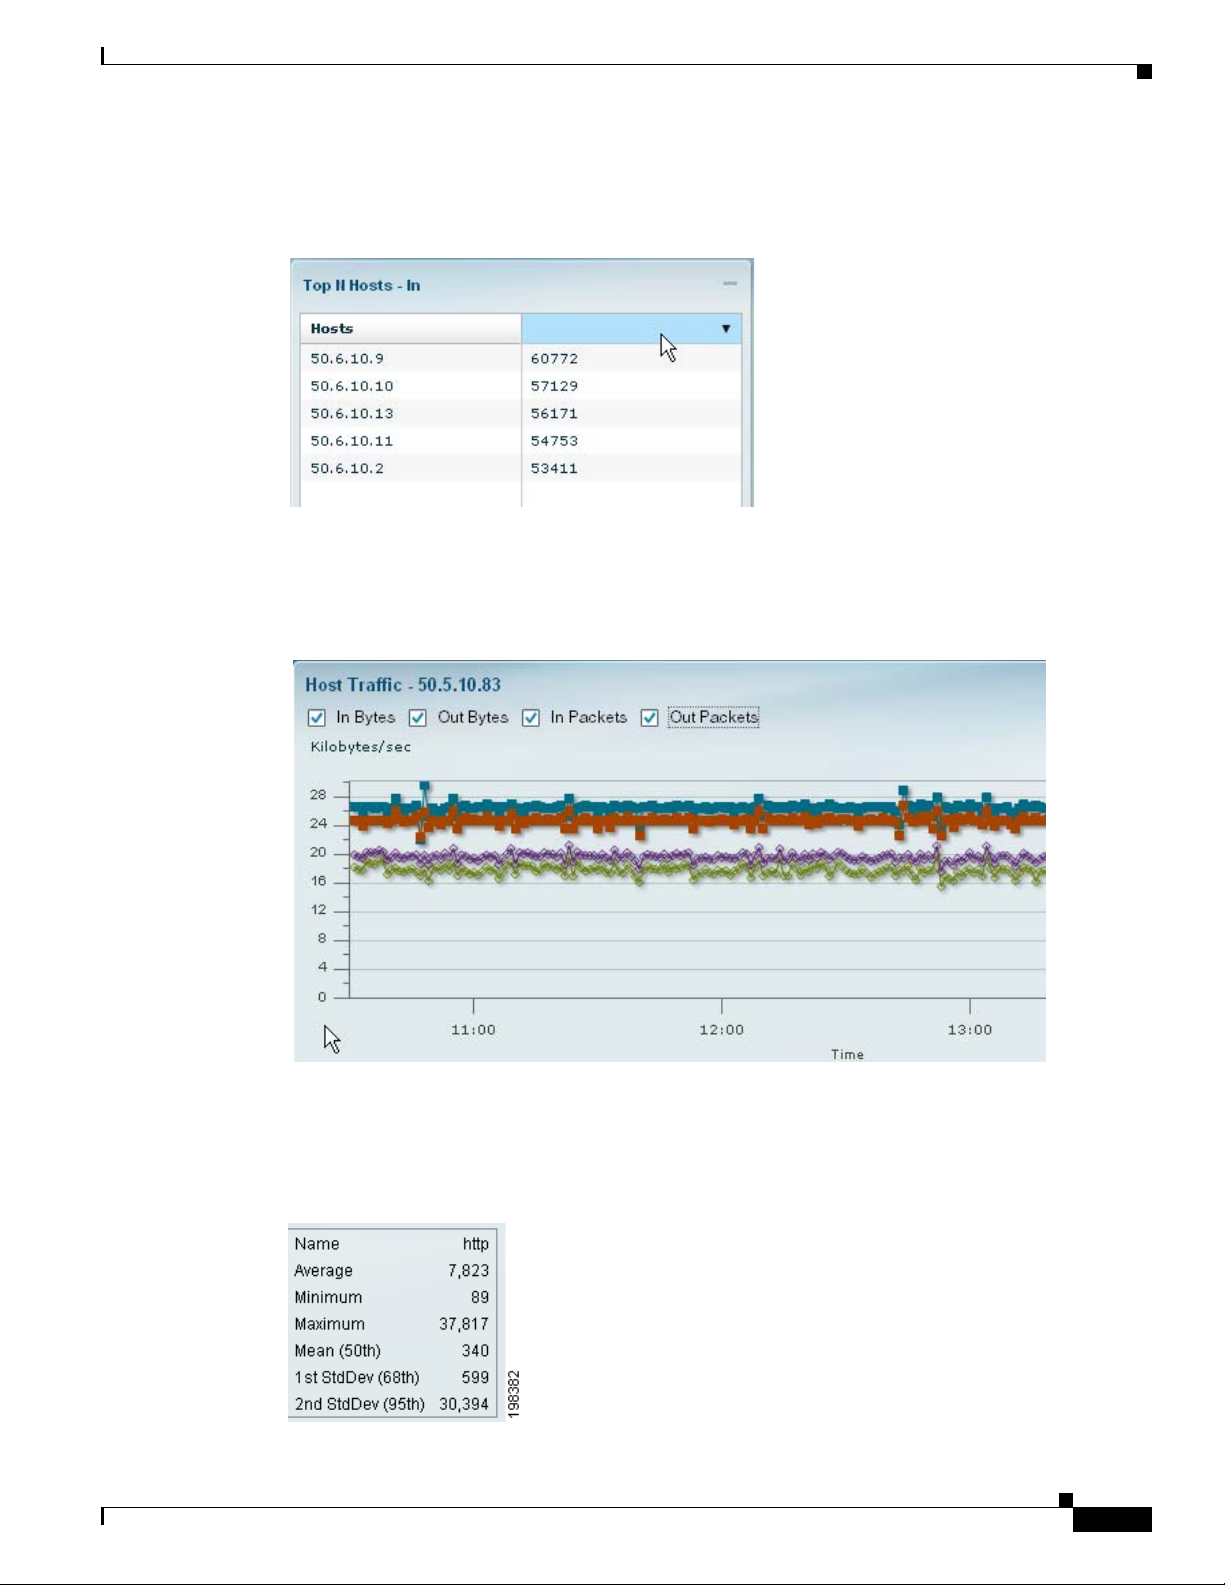
When looking at information in Grid view, you can sort the information by clicking the heading of any
column. Click it again to sort in reverse order.
On most Analyze charts, you can use the “Bytes” and “Packets” check boxes at the top to specify which
information you would like the chart to display.
Statistics
OL-22617-01
The Statistics legend gives you the minimum, maximum, and average statistics of the data. This will
display the initial data retrieved for the selector.
User Guide for the Cisco Network Analysis Module (NAM) Traffic Analyzer, 5.0
1-11
Page 26
Understanding How the NAM Works
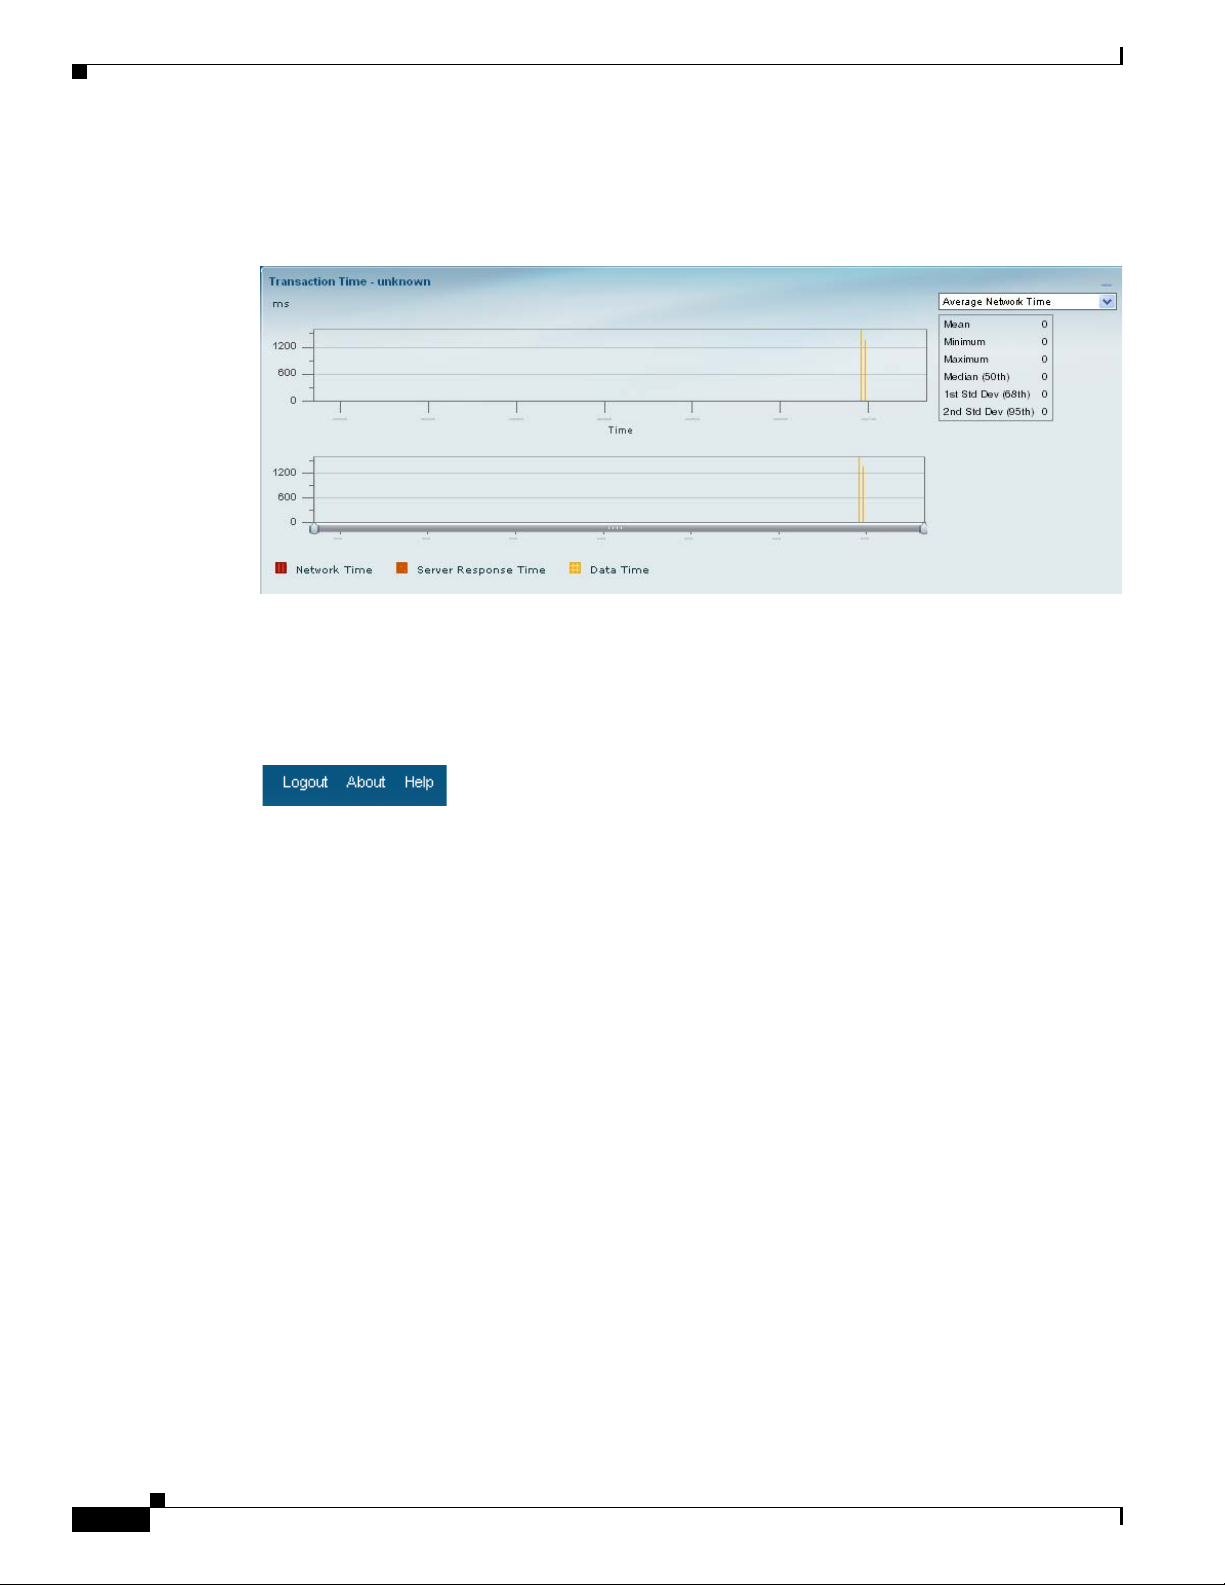
Above the Statistics legend is a dropdown selector, which allows you to choose which of the metrics
shown in the “over-time” chart you would like reflected in the Statistics legend. For example, if the line
chart has Bytes or Packets in the check boxes above the line chart, the selector over the Statistics legend
will show the same choices, Bytes or Packets.
Chapter 1 Overview
Context-Sensitive Online Help
The “Help” link on the top-right corner of the NAM Traffic Analyzer interface will bring you to the Help
page for that particular screen of the GUI..
In addition to the Help link on the top-right corner of each page, some pages also have a blue “i”, which
provides help for that specific subject.
Understanding How the NAM Works
The Network Analysis Module (NAM) product family addresses the following major functional areas:
• Network layer Traffic Analysis. The NAM provides comprehensive traffic analysis to identify what
applications are running over the network, how much network resources are consumed, and who is
using these applications. The NAM offers a rich set of reports with which to view traffic by Hosts,
Application or Conversations. See the discussions about Dashboards, starting with
page 3-4.
• Application Response Time. The NAM can provide passive measurement of TCP-based applications
for any given server or client, supplying a wide variety of statistics like response time, network flight
time, and transaction time.
• WAN Optimization insight. The NAM can provide insight into WAN Optimization offerings that
compress and optimize WAN Traffic for pre- and post-deployment scenarios. This is applicable for
Optimized and Passthru traffic.
• Voice Quality Analysis. The NAM provides application performance for real time applications like
Voice and Video. The NAM can compute MOS, as well as provide RTP analysis for the media
stream. See
Media, page 3-37.
Traffic Summary,
1-12
User Guide for the Cisco Network Analysis Module (NAM) Traffic Analyzer, 5.0
OL-22617-01
Page 27

Chapter 1 Overview
Understanding How the NAM Works
• Advanced Troubleshooting. The NAM provides robust capture and decode capabilities for packet
traces that can be triggered or terminated based on user-defined thresholds.
• Open instrumentation. The NAM is a mediation and instrumentation product offering, and hence
provides a robust API that can be used by partner products as well as customers that have home
grown applications. See the Cisco NAM 5.0 API Programmer’s Guide.
The NAM delivers the above functionality by analyzing a wide variety of data sources that include:
• Port mirroring technology like SPAN and RSPAN/ERSPAN. The NAM can analyze Ethernet VLAN
traffic from the following sources: Ethernet, Fast Ethernet, Gigabit Ethernet, trunk port, or Fast
EtherChannel SPAN, RSPAN, or ERSPAN source port
• VA C L
• NetFlow Data Export (NDE). The NAM can analyze NetFlow Data Export (NDE) from Managed
Devices (Routers/Switches)
• WAAS
• SNMP
• Network Tap Device. Applies to Cisco NAM 2200 Series appliances only.
The NAM Traffic Analyzer 5.0 retains the ability to use SNMP as a southbound interface for
configuration and data retrieval from switches and routers. NAM 5.0 moves away from RMON and
toward web services and Netflow Data Export as the northbound interface for data objects. NAM 5.0 will
continue to support baseline manageability features of SNMP such as MIB-2 and IF-TABLE, and the
health status and interface statistics that can be used by external products like Fault and Configuration
Management offerings (for example, CiscoWorks LMS).
For more information about SPAN, RSPAN, and ERSPAN, see the "Configuring Local SPAN, RSPAN,
and ERSPAN" chapter in the Catalyst 6500 Series Switch Software Configuration Guide.
http://www.cisco.com/en/US/docs/switches/lan/catalyst6500/ios/12.2SX/
configuration/guide/span.html
For more general information about NDE, see this section in the Cisco 7600 Series Cisco IOS Software
Configuration Guide, 12.2SX.
http://www.cisco.com/en/US/docs/routers/7600/ios/12.2SXF/
configuration/guide/nde.html
Table 1-1 summarizes the traffic sources that are used for NAM monitoring.
Ta b l e 1-1 Summary of Traffic Sources for NAM Monitoring
Traffic Source LAN WAN
Ports VLANs Ports VLANs
VACL capture Yes Yes Yes N/A
NetFlow Data Export NDE (local) Yes Yes Yes Yes
NetFlow Data Export NDE (remote) Yes Yes Yes Yes
SPAN Yes Yes No No
ERSPAN Yes Yes No No
The next sections describe how the NAM uses the supported data sources:
• Understanding How the NAM Uses SPAN, page 1-14
• Understanding How the NAM Uses VACLs, page 1-14
OL-22617-01
User Guide for the Cisco Network Analysis Module (NAM) Traffic Analyzer, 5.0
1-13
Page 28

Understanding How the NAM Works
• Understanding How the NAM Uses NDE, page 1-15
• Understanding How the NAM Uses WAAS, page 1-16
Understanding How the NAM Uses SPAN
A switched port analyzer (SPAN) session is an association of a destination port with a set of source ports,
configured with parameters that specify the monitored network traffic. You can configure up to two
SPAN sessions in a Catalyst 6500 or 7600 Routers chassis. Newer Cisco IOS images may support more
than two SPAN sessions. Consult the Cisco IOS document for the number of SPAN sessions supported
per switch or router.
The WS-SVC-NAM-1 platform provides a single destination port for SPAN sessions. The
WS-SVC-NAM-2 platform provides two possible destination ports for SPAN and VLAN access control
list (VACL) sessions. Multiple SPAN sessions to the NAM are supported, but they must be destined for
different ports. The NAM destination ports for use by the SPAN graphical user interface (GUI) are
named DATA PORT 1 and DATA PORT 2 by default. In the CLI, SPAN ports are named as shown in
Table 1-2.
Ta b l e 1-2 SPAN Port Names
Chapter 1 Overview
Module Cisco IOS Software
WS-SVC-NAM-1 data port
WS-SVC-NAM-2 data port 1 and data port 2
For more information about SPAN and how to configure it on the Catalyst 6500 series switches, see the
Catalyst 6500 Series Switch Software Configuration Guide:
http://www.cisco.com/en/US/docs/switches/lan/catalyst6500/ios/12.2SX/configuration/
guide/span.html
For more information about SPAN and how to configure it on the Cisco 7600 series router, see the Cisco
7600 Series Cisco IOS Software Configuration Guide, 12.2SX:
http://www.cisco.com/en/US/docs/routers/7600/ios/12.2SXF/configuration/guide/span.html
Note Due to potentially very high volume of ERSPAN traffic from the source, we recommend that you do not
terminate the ERSPAN session on the NAM management port. Instead, you should terminate ERSPAN
on the switch, and use the switch’s SPAN feature to SPAN the traffic to NAM data ports.
Understanding How the NAM Uses VACLs
A VLAN access control list can forward traffic from either a WAN interface or VLANs to a data port on
the NAM. A VACL provides an alternative to using SPAN; a VACL can provide access control based on
Layer 3 addresses for IP and IPX protocols. The unsupported protocols are access controlled through the
MAC addresses. A MAC VACL cannot be used to access control IP or IPX addresses.
There are two types of VACLs: one that captures all bridged or routed VLAN packets and another that
captures a selected subset of all bridged or routed VLAN packets. Catalyst operating system VACLs can
only be used to capture VLAN packets because they are initially routed or bridged into the VLAN on
the switch.
1-14
User Guide for the Cisco Network Analysis Module (NAM) Traffic Analyzer, 5.0
OL-22617-01
Page 29

Chapter 1 Overview
Understanding How the NAM Works
A VACL can provide access control for all packets that are bridged within a VLAN or that are routed
into or out of a VLAN or, with Release 12.1(13)E or later releases, a WAN interface. Unlike regular
Cisco IOS standard or extended ACLs that are configured on router interfaces only and are applied on
routed packets only, the VACLs apply to all packets and can be applied to any VLAN or WAN interface.
The VACLs are processed in the hardware.
A VACL uses Cisco IOS access control lists (ACLs). A VACL ignores any Cisco IOS ACL fields that
are not supported in the hardware. Standard and extended Cisco IOS ACLs are used to classify packets.
Classified packets can be subject to a number of features, such as access control (security), encryption,
and policy-based routing. Standard and extended Cisco IOS ACLs are only configured on router
interfaces and applied on routed packets.
After a VACL is configured on a VLAN, all packets (routed or bridged) entering the VLAN are checked
against the VACL. Packets can either enter the VLAN through a switch port or through a router port after
being routed. Unlike Cisco IOS ACLs, the VACLs are not defined by direction (input or output).
A VACL contains an ordered list of access control entries (ACEs). Each ACE contains a number of fields
that are matched against the contents of a packet. Each field can have an associated bit mask to indicate
which bits are relevant. Each ACE is associated with an action that describes what the system should do
with the packet when a match occurs. The action is feature dependent. Catalyst 6500 series switches and
Cisco 7600 series routers support three types of ACEs in the hardware: IP, IPX, and MAC-Layer traffic.
The VACLs that are applied to WAN interfaces support only IP traffic.
When you configure a VACL and apply it to a VLAN, all packets entering the VLAN are checked against
this VACL. If you apply a VACL to the VLAN and an ACL to a routed interface in the VLAN, a packet
coming into the VLAN is first checked against the VACL and, if permitted, is then checked against the
input ACL before it is handled by the routed interface. When the packet is routed to another VLAN, it
is first checked against the output ACL applied to the routed interface and, if permitted, the VACL
configured for the destination VLAN is applied. If a VACL is configured for a packet type and a packet
of that type does not match the VACL, the default action is deny.
When configuring VACLs, note the following:
• VACLs and context-based access control (CBAC) cannot be configured on the same interface.
• TCP Intercepts and Reflexive ACLs take precedence over a VACL action on the same interface.
• Internet Group Management Protocol (IGMP) packets are not checked against VACLs.
Note You cannot set up VACL using the NAM interface.
For details on how to configure a VACL with Cisco IOS software, see the Catalyst 6500 Release 12.2SXF
and Rebuilds Software Configuration Guide.
http://www.cisco.com/en/US/docs/switches/lan/catalyst6500/ios/12.2SXF/native/configuration/
guide/vacl.html
For details on how to configure a VACL on a WAN interface and on a LAN VLAN, see VACL, page 2-17.
Understanding How the NAM Uses NDE
The NAM uses NetFlow as a format for the ongoing streaming of aggregated data, based on the
configured set of descriptors or queries of the data attributes in NAM. NetFlow Data Export (NDE) is a
remote device that allows you to monitor port traffic on the NAM; the NAM can collect NDE from local
or remote switch or router for traffic analysis.
OL-22617-01
User Guide for the Cisco Network Analysis Module (NAM) Traffic Analyzer, 5.0
1-15
Page 30

Understanding How the NAM Works
To use an NDE data source for the NAM, you must configure the remote device to export the NDE
packets. The default UDP port is 3000, but you can configure it from the NAM CLI as follows:
root@nam2x-61.cisco.com# netflow input port ?
<port> - input NDE port number
The distinguishing feature of the NetFlow v9 format, which is the basis for an IETF standard, is that it
is template-based. Templates provide an extensible design to the record format, a feature that must allow
future enhancements to NetFlow services without requiring concurrent changes to the basic flow-record
format.
For more detailed information about NAM and NetFlow, see NetFlow, page 2-18.
For more information on NetFlow, see http://www.cisco.com/go/netflow or the “Configuring NetFlow
Data Export” chapter in the Cisco 7600 Series Cisco IOS Software Configuration Guide, 12.2SX.
http://www.cisco.com/en/US/docs/routers/7600/ios/12.2SXF/
configuration/guide/nde.html
For specific information about creating and managing NDE queries, see the Cisco Network Analysis
Module 5.0 API Programmer’s Guide.
Chapter 1 Overview
Understanding How the NAM Uses WAAS
Cisco Wide Area Application Services (WAAS) software optimizes the performance of TCP-based
applications operating in a wide area network (WAN) environment and preserves and strengthens branch
security. The WAAS solution consists of a set of devices called Wide Area Application Engines (WAEs)
that work together to optimize WAN traffic over your network.
When client and server applications attempt to communicate with each other, the network devices
intercepts and redirects this traffic to the WAEs to act on behalf of the client application and the
destination server.
WAEs provide information about packet streams traversing through both LAN and WAN interfaces of
WAAS WAEs. Traffic of interest can include specific servers and types of transaction being exported.
NAM processes the data exported from the WAAS and performs application response time and other
metrics calculations and enters the data into reports you set up.
The WAEs examine the traffic and using built-in application policies to determine whether to optimize
the traffic or allow it to pass through your network not optimized.
You can use the WAAS Central Manager GUI to centrally configure and monitor the WAEs and
application policies in your network. You can also use the WAAS Central Manager GUI to create new
application policies so that the WAAS system will optimize custom applications and less common
applications.
For more information about WAAS data sources and managing WAAS devices, see Understanding
WAAS, page 2-29.
1-16
User Guide for the Cisco Network Analysis Module (NAM) Traffic Analyzer, 5.0
OL-22617-01
Page 31

Chapter 1 Overview
Configuration Overview
Configuration Overview
Table 1-3. “Configuration Overview” leads you through the basic configuration steps you can follow for
the NAM Traffic Analyzer 5.0.
These are not necessarily in the order in which you need to perform them, and many are optional
features.
Ta b l e 1-3 Configuration Overview
Action Description GUI Location User Guide Location
Install the NAM
Configure the Managed Device
Information
-- -- Platform-specific
Installation and
Configuration Guides
(
http://www.cisco.com/en/
US/products/sw/cscowork/
ps5401/prod_installation_
guides_list.html)
Traffic will populate on the
dashboards if you have configured
Setup > Managed Device
> Device Information
See Managed Device,
page 2-55.
the managed device.
Verify that traffic has started
Verify that Application Response
Time Metrics are being gathered
Note This only applies to the
NAM 2200 Series
Appliance or an
NME-NAM device.
Traffic usage statistics for
applications, hosts, conversations,
VLANs, and DSCP are available on
the Traffic Summary Dashboard.
This will start automatically after
you turn on the NAM.
The NAM Traffic Analyzer
software provides response time
measurements and various
user-experience-related metrics,
which are computed by monitoring
and time-stamping packets sent
from the user to the server
providing services.
This will start automatically after
you turn on the NAM.
Home (Traffic Summary
Dashboard)
or
Monitor > Overview >
Traffic Summary
Analyze > Response
Time.
You can view response
times for applications,
networks, servers, and
clients.
See Traffic Analysis,
page 2-1.
See Application Response
Time Metrics, page 2-2
OL-22617-01
User Guide for the Cisco Network Analysis Module (NAM) Traffic Analyzer, 5.0
1-17
Page 32

Chapter 1 Overview
Configuration Overview
Table 1-3 Configuration Overview (continued)
Action Description GUI Location User Guide Location
Verify that Voice/RTP Stream
Traffic is being gathered
After the NAM Traffic Analyzer is
started, Voice/RTP stream traffic
will automatically start being
monitored. The NAM enables you
to monitor all RTP stream traffic
among all SPANed traffic, without
Analyze > Media > RTP
Streams
or
Analyze > Media > Voice
Call Statistics.
See Voice Signaling/RTP
Stream Monitoring,
page 2-2
having to know the signalling traffic
used in negotiating the RTP
channels.
This will start automatically after
you turn on the NAM.
Set up the System Time
You will need to set up the System
Time correctly; if you do not have
Administration > System
> System Time
System Time, page 5-5
the time synchronized, then you
will see either incorrect or no data.
Configure NDE Data Export
The NAM as a producer of NDE
(NetFlow Data Export) packets is a
Setup > Data Export >
NetFlow
NetFlow, page 2-49
new feature for NAM Traffic
Analyzer 5.0. The NAM's new
functionality of NDE is part of its
new NBI.
The NAM sends out NDE packets
only in NDE v9 format.
Configure sites
A site is a collection of hosts
Setup > Network > Sites. See Sites, page 2-58.
(network endpoints) partitioned
into views that help you monitor
traffic and troubleshoot problems.
If you want to limit the view of your
network data to a specific city, a
specific building, or even a specific
floor of a building, you can use the
Sites function.
We recommend that sites are
configured using prefix-based
subnets instead of based on data
source.
Define Alarms and Thresholds
Alarms are predefined conditions
based on a rising data threshold, a
falling data threshold, or both. You
can choose for what types of events
you want the NAM to notify you,
Setup > Alarms > Actions
and
Setup > Alarms >
Thresholds
Alarm Actions, page 2-36
Thresholds, page 2-39
and how you want to be notified.
Alarms that will be used for
Thresholds should be created first,
then then the Thresholds created
second.
1-18
User Guide for the Cisco Network Analysis Module (NAM) Traffic Analyzer, 5.0
OL-22617-01
Page 33

Chapter 1 Overview
Configuration Overview
Table 1-3 Configuration Overview (continued)
Action Description GUI Location User Guide Location
Configure Capture
Capture allows you to set up up to
ten sessions for capturing, filtering,
Capture > Packet
Capture/Decode
Chapter 4, “Capturing and
Decoding Packet Data.”
and decoding packet data, manage
the data in a file control system, and
display the contents of the packets.
Configure Scheduled Export
You can set up scheduled jobs that
will generate a daily report at a
specified time, in the specified
In the Interactive Report
(left side of the dashboard),
click the Export button.
Scheduled Exports,
page 2-53
interval, and then e-mail it to a
specified e-mail address.
Set up Northbound API
NBI (Northbound Interface), also
referred to as API (Application
Programming Interface), enables
partners and customers to provision
the NAM and extract performance
data.
You can write your own scripts
For application developers
who want to use the NAM
APIs to provision network
services and leverage data,
see the Cisco Network
Analysis Module 5.0 API
Programmer’s Guide.
based on the NAM Northbound
API, but there is setup in the NAM
GUI needed.
Set up TACACS+ server
TACACS+ is a Cisco Systems
enhancement that provides
additional support for
authentication and authorization.
Administration > Users >
TACACS+
Configuring a TACACS+
Server to Support NAM
Authentication and
Authorization, page 5-20
When a user logs into the NAM
Traffic Analyzer, TACACS+
determines if the username and
password are valid and what the
access privileges are.
Change System Preferences
You can change many preferences,
such as refresh interval, Top N
Administration > System
> Preferences
Chapter 5, “User and
System Administration.”
Entries, Data Displayed, and
enabling Audit Trail, as needed.
Configuring and Viewing Data
Some of the NAM 5.0 features require configuration of sites. A site is a collection of hosts, or network
endpoints, partitioned into views that help you monitor traffic and troubleshoot problems (see
page 2-58 for more detailed information). These features include those in which the NAM provides
measurements of application performance on networks where WAAS devices are deployed, and
dashboards that show traffic levels between sites and alarms levels per site. All other NAM features can
still be used without defining any sites (the default configuration).
If you have set up sites, you will be able to select a particular site to view in the Interactive Report and
view data relevant to that site only. In some cases, you can select both a Client Site and a Server Site to
view data pertaining to interaction between hosts at different sites.
OL-22617-01
Sites,
User Guide for the Cisco Network Analysis Module (NAM) Traffic Analyzer, 5.0
1-19
Page 34

Configuration Overview
Cisco WAAS NAM Virtual Service Blade
To set up the NAM Traffic Analyzer, Release 5.0 on a Cisco WAAS NAM Virtual Service Blade, you
need to follow these steps:
Step 1 Confirm that you have completed the steps in Chapter 4, “Configuring NAM-WAAS Integration” of the
Cisco WAAS NAM Virtual Service Blade Installation and Configuration Guide, specifically for
“Configuring WAAS to Send Flow Information to NAM VSB” and “Configuring WAAS Data Source in
NAM.”
Step 2 Configure a site for the Client network. See Sites, page 2-58.
Step 3 Configure another site for the Server network. See Sites, page 2-58.
Step 4 Choose Setup > Monitoring > WAAS Servers and click the Add button to add WAAS servers.
Step 5 Add a specific host IP address of the server that you want to monitor. If there are multiple IP addresses,
you can paste them in.
Step 6 To verify that you have set up the WAAS-NAM propertly, choose Analyze > WAN Optimization >
Application Performance Analysis and make sure you can see data (passthrough traffic). If you have
not properly configured the Client Site and the Server Site, you will not see data in the charts.
Chapter 1 Overview
1-20
User Guide for the Cisco Network Analysis Module (NAM) Traffic Analyzer, 5.0
OL-22617-01
Page 35

CHAP T ER
2
Setting Up The NAM Traffic Analyzer
This chapter provides information about functions that will begin automatically, and other setup tasks
you will need to perform for NAM Traffic Analyzer Release 5.0.
It contains the following sections:
• Default Functions, page 2-1
• Traffic, page 2-3
• Alarms, page 2-36
• Data Export, page 2-49
• Managed Device, page 2-55
• Network, page 2-58
• Classification, page 2-66
• Monitoring, page 2-74
Follow the Installation and Configuration Guide for your specific NAM product to see information about
how to install the product, configure it, log in, and get started.
Default Functions
After the NAM Traffic Analyzer is turned on, some functions will begin automatically, without any setup
steps necessary. These functions are:
• Traffic Analysis, page 2-1
• Application Response Time Metrics, page 2-2
• Voice Signaling/RTP Stream Monitoring, page 2-2
• Traffic Usage Statistics, page 2-3
Traffic Analysis
Traffic usage statistics for applications, hosts, conversations, VLANs, and DSCP will begin populating
on the Traffic Summary dashboard (Monitor > Overview > Traffic Summary).
OL-22617-01
User Guide for the Cisco Network Analysis Module (NAM) Traffic Analyzer, 5.0
2-1
Page 36

Default Functions
Application Response Time Metrics
The NAM Traffic Analyzer software provides response time measurements and various
user-experience-related metrics, which are computed by monitoring and time-stamping packets sent
from the user to the server providing services.
These Application Response Time Metrics are available to view under the menu Analyze > Response
Time. You can view response times for applications, networks, servers, and clients.
After the NAM Traffic Analyzer is started, these metrics will begin to populate.
Voice Signaling/RTP Stream Monitoring
After the NAM Traffic Analyzer is started, voice signaling and RTP stream traffic will automatically
start being monitored. The NAM enables you to monitor all RTP stream traffic among all SPANed traffic,
without having to know the signalling traffic used in negotiating the RTP channels. When RTP Stream
Monitoring is enabled, the NAM:
• Identifies all RTP streams among the SPANed traffic
Chapter 2 Setting Up The NAM Traffic Analyzer
• Monitors the identified RTP traffic
• Sends syslog, trap, e-mail, and trigger captures for RTP streams that violate stream statistics
thresholds on the following metrics:
–
Number of Consecutive Packet Loss
Each RTP packet has an RTP header that contains a sequence number. The sequence number
increments by one for each RTP packet received in the same RTP stream. A gap in the sequence
numbers identifies a packet loss. If the gap in sequence numbers jump is more than the
threshold, the NAM raises an alarm condition.
–
Packet Loss percent
There are two types of percent packet loss percent: Adjusted Packet Loss and Actual Packet
Loss. Actual Packet Loss indicates expected packets that never appear in the NAM. Adjusted
Packet Loss includes actual packets lost and packets that arrive with large delay beyond the
expected buffer capacity of the endpoint.
–
Jitter: Packets delay compare to the expected receiving time
–
Concealment Seconds: Seconds in which there is one or more packet lost
–
Severe Concealment Seconds: Seconds in which there is more than 5% of packet lost
You can set up thresholds at Setup > Alarms > Thresholds.
You can define filter entries to narrow down to the subset of RTP streams so the NAM monitors only
those RTP streams matching the filter criteria.
To verify that the voice signaling/RTP traffic has begun, choose Analyze > Media > RTP Streams or
Analyze > Media > Voice Call Statistics.
2-2
User Guide for the Cisco Network Analysis Module (NAM) Traffic Analyzer, 5.0
OL-22617-01
Page 37

Chapter 2 Setting Up The NAM Traffic Analyzer
Traffic Usage Statistics
The NAM Traffic Analyzer provides traffic statistics broken out by application, host, conversation,
VLAN, and DSCP code point. Summary dashboards show Top N charts broken out by these attributes,
as well as detailed views in tabular form. Analysis dashboards show usage over time by one particular
application, host, and so forth, as well as other interesting measurements for the particular element being
analyzed over a user-specified period of time.
Traffic
The NAM 5.0 Traffic Analyzer menu selections for setting up Traffic are:
• SPAN, page 2-3
• Data Sources, page 2-9
• Hardware Deduplication, page 2-35
Traffic
SPAN
A switched port analyzer (SPAN) session is an association of a destination port with a set of source ports,
configured with parameters that specify the monitored network traffic. See
more information about data sources.
The following sections describe SPAN sessions on devices running the NAM:
• About SPAN Sessions, page 2-3
• Creating a SPAN Session, page 2-6
• Editing a SPAN Session, page 2-8
• Deleting a SPAN Session, page 2-9
About SPAN Sessions
Note This section applies to WS-SVC-NAM-1 and WS-SVC-NAM-2 devices, the NAM 2220 and 2204
appliances, and the NME-NAM branch routers.
Depending on the IOS running on the Supervisor, port names are displayed differently. Newer versions
of IOS software display a port name as Gi2/1 to represent a Gigabit port on module 2 port 1. In the VSS,
a port name might be displayed as Gi1/2/1to represent a Gigabit port on switch 1, module2, port 1.
The NME-NAM device has two Gigabit Ethernet ports—an internal interface and an external interface.
One of the two interfaces must be selected as the NAM management port for IP traffic (such as HTTP
and SNMP). The NAM can monitor traffic for analysis on the internal interface, the external interface,
or both simultaneously. A typical configuration is to monitor LAN and WAN traffic on the internal
interface. However, the external interface can be used to monitor LAN traffic.
WS-SVC-NAM-1 devices can have only one active SPAN session. You can select a switch port or
EtherChannel as the SPAN source; however, you may select only one SPAN type. WS-SVC-NAM-2
devices and switch software support two SPAN destination ports.
Data Sources, page 2-9 for
OL-22617-01
User Guide for the Cisco Network Analysis Module (NAM) Traffic Analyzer, 5.0
2-3
Page 38

Traffic
Before you can monitor data, you must direct specific traffic flowing through a switch to the NAM for
monitoring purposes. Use the methods described in
Ta b l e 2-1 Methods of Directing Traffic
Method Usage Notes
Switch SPAN
You can direct a set of physical ports, a set of VLANs, or a set of EtherChannels to the
NAM.
Selecting an EtherChannel as a SPAN source is the same as selecting all physical ports
comprising the EtherChannel as the SPAN source.
Switch Remote SPAN (RSPAN)
You can monitor packet streams from remote switches, assuming that all traffic from a
remote switch arrives at the local switch on a designated RSPAN VLAN. Use the
RSPAN VLAN as the SPAN source for the NAM.
NetFlow Data Export (NDE)
You can monitor NDE records directly from remote switches or routers. You must
configure the NDE source to the NAM from a local switch or remote router, using the
switch CLI. For received NDE traffic, a default site will be created including all
interfaces from that device. See
SPAN and NDE sources can be in effect simultaneously.
Chapter 2 Setting Up The NAM Traffic Analyzer
Table 2-1, Methods of Directing Traffic.
Sites, page 2-58.
Note Starting with NAM release 5.0, in addition to being a consumer of NDE
records, the NAM is also a producer of NDE data packets.
Table 2-2, SPAN Sources, describes the types of SPAN sources and the possible ways to configure them.
Ta b l e 2-2 SPAN Sources
SPAN Source Configured with one of the following:
Any set of physical ports
Any EtherChannel
Any set of VLANs configured on the local switch
• NAM Traffic Analyzer (the NAM GUI)
• Switch CLI
• Supervisor portCopyTable (SNMP)
• NAM Traffic Analyzer (the NAM GUI)
• Switch CLI
• Supervisor portCopyTable (SNMP)
• NAM Traffic Analyzer (the NAM GUI)
• Switch CLI
• Supervisor portCopyTable (SNMP)
2-4
User Guide for the Cisco Network Analysis Module (NAM) Traffic Analyzer, 5.0
OL-22617-01
Page 39

Chapter 2 Setting Up The NAM Traffic Analyzer
Table 2-3, Active SPAN Sessions Dialog, describes the fields on the SPAN Sessions screen.
Ta b l e 2-3 Active SPAN Sessions Dialog
Column Description
Session ID
Ty pe
Source
Dest. Port
Direction
Status
Traffic
Monitor session ID of the SPAN.
Note For switches running Cisco IOS software only.
Type of SPAN source
Source of the SPAN session.
When creating a SPAN session, you can select all ports regardless of their state.
See
Table 2-4, Possible SPAN States for a description of the possible SPAN
states.
Note For switches running Cisco IOS software only.
Destination port of the SPAN session.
Direction of the SPAN traffic.
Status of the SPAN session:
Create
Save
Add Dest. Port 1
Add Dest. Port 2
Edit
Delete
Refresh
Active—Traffic at the SPAN source is being copied to the SPAN destination
Inactive—Traffic at the SPAN source will not be copied to the SPAN
destination
Unknown—A mixture of both active and inactive status
Create a SPAN session.
Saves the current active SPAN session in the running-configuration to the
startup-configuration for switches running Cisco IOS software only.
Add NAM Port 1 to the selected SPAN session as a SPAN destination. This
button is labeled Add Dest. Port on the WS-SVC-NAM-1.
Note Does not apply to the NAM appliances.
Add NAM Port 2 to the selected SPAN session as a SPAN destination. This
option is not available on the WS-SVC-NAM-1.
Note Does not apply to the NAM appliances.
Edit the selected SPAN session.
Delete the selected SPAN session.
Click to update the SPAN session information.
OL-22617-01
Note IOS supports only two SPAN sessions, but each SPAN session can have more than one destination. The
Add Dest. Port 1 and Add Dest. Port 2 buttons enable you to make the NAM dataport an additional
destination to an existing local SPAN session.
User Guide for the Cisco Network Analysis Module (NAM) Traffic Analyzer, 5.0
2-5
Page 40

Traffic
Chapter 2 Setting Up The NAM Traffic Analyzer
Note Deleting or editing a SPAN session that has multiple SPAN destinations will affect all SPAN
destinations.
Table 2-4 lists the possible SPAN states. The SPAN state displays in parenthesis in the Source - Direction
column.
Ta b l e 2-4 Possible SPAN States
State Description
Active
SPAN source is valid and traffic from the source is being copied to the SPAN
destination
NotInService
SPAN source might be valid, but traffic that appears at the source will not be
copied to the SPAN destination
NotReady
The SPAN source might be valid, but traffic that appears at the source will not be
copied to the SPAN destination
CreateAndGo
The SPAN source might be valid, but the SPAN source is being added to the SPAN
session
CreateAndWait
The SPAN source might be valid, and the SPAN source is being added to the
SPAN session
Destroy
The SPAN source is being removed from the SPAN session.
Creating a SPAN Session
Note This section applies to WS-SVC-NAM-1 and WS-SVC-NAM-2 devices, and the NAM 2220 and 2204
appliances.
The following procedure shows you how to create a SPAN session on a switch.
Step 1 Choose Setup > Traffic > SPAN Sessions. The SPAN window displays as shown in Figure 2-1.
Figure 2-1 SPAN Sessions
2-6
User Guide for the Cisco Network Analysis Module (NAM) Traffic Analyzer, 5.0
OL-22617-01
Page 41

Chapter 2 Setting Up The NAM Traffic Analyzer
Step 2 Click the Create button.
The Create SPAN Session Dialog displays (the fields are described in Table 2-5, Create SPAN Session
Dialog). Switch Port is the default for the SPAN Type.
Step 3 Select the appropriate information.
Ta b l e 2-5 Create SPAN Session Dialog
Field Description
Monitor Session
SPAN Type
SPAN Destination Interface
Switch Module List
SPAN Traffic Direction
Traffic
Monitor session of the SPAN.
• SwitchPort
• VLAN
• EtherChannel
• RSPAN VLAN
Note You can have only one RSPAN VLAN source per SPAN
session.
The NAM interface to which you want to send data.
Lists all modules on the switch other than NAMs and Switch
Fabric Modules.
• Rx
• Tx
• Both
Note Not applicable to RSPAN VLAN SPAN types.
Available Sources
Add
Remove
Remove All
Selected Sources
Refresh
SPAN sources that are available for the selected SPAN type.
Adds the selected SPAN source.
Removes the selected SPAN source.
Removes all the SPAN sources.
SPAN sources selected.
Causes the NAM to update the switch configuration information with
current configuration.
Submit
Step 4 To create the SPAN session, click Submit. The Active Sessions window displays.
Step 5 To save the current active SPAN session in the running-configuration to the startup-configuration for
Creates the SPAN configuration; saves the configuration.
switches running Cisco IOS software only, click Save in the active SPAN session window.
Note For switches running Cisco IOS software, all pending running-configuration changes will be
saved to the startup-configuration.
OL-22617-01
Step 6 To verify the SPAN session was created and to view the data, go to the Top N charts on the Traffic
Analysis dashboard (Monitor > Overview > Traffic Summary).
User Guide for the Cisco Network Analysis Module (NAM) Traffic Analyzer, 5.0
2-7
Page 42

Traffic
Editing a SPAN Session
You can only edit SPAN sessions that have been directed to the NAM.
Note This section applies to WS-SVC-NAM-1 and WS-SVC-NAM-2 devices, and the NAM 2220 and 2204
appliances.
Note Editing an existing SPAN session that has multiple SPAN destinations will affect all destinations.
To edit a SPAN session:
Step 1 Choose Setup > Traffic > SPAN Sessions.
The Active SPAN Sessions dialog box displays.
Step 2 Select the SPAN session to edit, then click Edit.
The Edit SPAN Session Dialog Box displays. The fields are described in Table 2-6, Edit SPAN Session
Dialog Box.
Chapter 2 Setting Up The NAM Traffic Analyzer
Step 3 Make the appropriate changes.
Ta b l e 2-6 Edit SPAN Session Dialog Box
Field Description
Monitor Session
SPAN Type
SPAN Destination interface
Switch Module List
SPAN Traffic Direction
Available Sources
Add
Remove
Remove All
Selected Sources
Refresh
Submit
Reset
Monitor session of the SPAN.
Type of SPAN session.
The NAM interface to which you want to send data.
Lists all modules on the switch other than NAMs and Switch
Fabric Modules.
Direction of the SPAN traffic.
SPAN sources available for the selected SPAN type.
Adds the selected SPAN source
Removes the selected SPAN source.
Removes all the SPAN sources.
SPAN sources selected.
Causes the NAM to update the switch configuration information with
current configuration.
Saves changes.
Clears all changes since previous Submit.
2-8
User Guide for the Cisco Network Analysis Module (NAM) Traffic Analyzer, 5.0
OL-22617-01
Page 43

Chapter 2 Setting Up The NAM Traffic Analyzer
Deleting a SPAN Session
Note This section does not apply to NME-NAM devices.
Note Deleting a SPAN session that has multiple SPAN destinations will affect all destinations.
To delete a SPAN session, select it from the Active SPAN Session dialog box, then click Delete.
Data Sources
Data sources are the source of traffic for the NAM Traffic Analyzer. Some examples are: physical data
ports of the NAM where you get SPAN data, a specific router or switch that sends NetFlow to the NAM,
or a WAAS device segment that sends data to NAM or ERSPAN and which goes to NAM's management
port.
A new feature in NAM 5.0 is the “auto discovery” of data sources, in which you can click the Auto
Create button to tell the NAM to automatically discover the data sources. You will be able to see details
such as the IP addresses of devices sending packets to the NAM and the time that the last NDE packet
was received (in NAM 4.x, this was called “Listening Mode”).
Traffic
Note If you have configured sites (see Sites, page 2-58), you can assign data sources to that particular site. If
you do this, and you also configure data sources, the two could overlap since sites can also be a primary
“view” into data sources. If there is a mismatch between the two, you will not see any data.
Note We recommend that you configure a site using subnets instead of selecting a data source. See Specifying
a Site Using Subnets, page 2-59.
The following sections contain specific information about the types of data sources:
• SPAN, page 2-10
• ERSPAN, page 2-10
• VACL, page 2-17
• NetFlow, page 2-18
• WAAS, page 2-29
The NAM Data Sources page (Setup > Traffic > Data Sources) lists the data sources configured for that
NAM Traffic Analyzer.
OL-22617-01
User Guide for the Cisco Network Analysis Module (NAM) Traffic Analyzer, 5.0
2-9
Page 44

Traffic
The fields are explained in Tab le 2-7, NAM Data Sources.
Ta b l e 2-7 NAM Data Sources
Field Description
Device
DATA PORT if it is a local physical port, or the IP address of the
learned device.
Ty pe
The source of traffic for the NAM.
DATA PORT if it is a local physical port.
WAAS, ERSPAN, or NETFLOW if a data stream exported from the
router or switch or WAE device.
Activity
Status
Data Source
Data Source Details
Shows the most recent activity.
ACTIVE or INACTIVE.
The Name given to the data source.
“Physical Port”, or information about the data source being Enabled
or Disabled.
Chapter 2 Setting Up The NAM Traffic Analyzer
SPAN
ERSPAN
A switched port analyzer (SPAN) session is an association of a destination port with a set of source ports,
configured with parameters that specify the monitored network traffic. You can configure up to two
SPAN sessions in a Catalyst 6500 or 7600 Routers chassis.
For information about SPAN sessions, see SPAN, page 2-3.
This section describes how to configure Encapsulated Remote Switched Port Analyzer (ERSPAN) of the
Catalyst 6500 switch or Cisco 7600 series router as a NAM data source. You configure ERSPAN as a
NAM data source from the Catalyst 6500 switch or Cisco 7600 series router command line interface, not
the NAM GUI.
As an ERSPAN consumer, the NAM can receive ERSPAN packets on its management port from devices
such as Cisco routers and switches. Those packets are analyzed as if that traffic had appeared on one of
the NAM data ports. The NAM supports ERSPAN versions 1 and 3. Incoming ERSPAN data is parsed
by the NAM, stored in its internal database, and presented in the GUI in the same way as traffic from
other data sources.
For the NAM to receive ERSPAN from an external switch or router, that device must be configured to
send ERSPAN packets to the NAM’s IP address.
See the following sections about using ERSPAN as a data source:
• Enabling Auto-Creation of ERSPAN Data Sources Using the Web GUI, page 2-11
• Enabling Auto-Creation of ERSPAN Data Sources Using the CLI, page 2-11
2-10
• Disabling Auto-Creation of ERSPAN Data Sources Using the Web GUI, page 2-12
• Disabling Auto-Creation of ERSPAN Data Sources Using the CLI, page 2-12
• Creating ERSPAN Data Sources Using the Web GUI, page 2-12
• Creating ERSPAN Data Sources Using the CLI, page 2-12
User Guide for the Cisco Network Analysis Module (NAM) Traffic Analyzer, 5.0
OL-22617-01
Page 45

Chapter 2 Setting Up The NAM Traffic Analyzer
• Deleting ERSPAN Data Sources Using the Web GUI, page 2-14
• Deleting ERSPAN Data Sources Using the CLI, page 2-15
• Configuring ERSPAN on Devices, page 2-16
Enabling Auto-Creation of ERSPAN Data Sources Using the Web GUI
There is a convenient “auto-create” feature for data sources, which is enabled by default. With the
auto-create feature, a new data source will automatically be created for each device that sends ERSPAN
traffic to the NAM, after the first packet is received. Manual creation of ERSPAN data sources using the
NAM GUI or the CLI is typically not necessary. When manually creating a data source, you may specify
any name you want for the data source. A data source entry must exist on the NAM in order for it to
accept ERSPAN packets from an external device.
Auto-created ERSPAN data sources will be assigned a name in the format ERSPAN-<IP
Address>-ID-<Integer>, where IP Address is the IP address of the sending device, and Integer is the
Session-ID of the ERSPAN session on that device. For example, device 192.168.0.1 sending ERSPAN
packets with the Session ID field set to 12 would be named “ERSPAN-192.168.0.1-ID-12.” You can edit
these auto-created data sources and change the name if desired.
One device can be configured to send multiple separate ERSPAN sessions to the same NAM. Each
session will have a unique Session ID. The NAM can either group all sessions from the same device into
one data source, or have a different data source for each Session ID. When data sources are auto-created,
they will be associated with one particular Session ID. When manually created, you can instruct the
NAM to group all traffic from the same device into one data source. If you check the Session check box,
and enter a Session ID in the Value field, the data source will only apply to that specific session. If you
leave the check box unchecked, all ERSPAN traffic from the device will be grouped together into this
data source, regardless of Session ID.
To configure the NAM to automatically create data sources when it receives ERSPAN packets from an
external device, use the following steps. Remember however, that the auto-create feature is turned on by
default, so these steps are typically not necessary.
Traffic
Step 1 Click Setup > Traffic > NAM Data Sources.
Step 2 Click the Auto Create button on the bottom left of the window.
Step 3 Check the ERSPAN check box to toggle auto-creation of ERSPAN data sources to “on”.
Step 4 Click the Submit button.
Enabling Auto-Creation of ERSPAN Data Sources Using the CLI
Configuration of the auto-create feature is also possible using the NAM CLI. Because the auto-create
feature is turned on by default, in most cases these steps are not necessary.
To configure the NAM to automatically create data sources when it receives ERSPAN packets from an
external device, use the "autocreate-data-source" command as follows:
root@172-20-104-107.cisco.com# autocreate-data-source erspan
ERSPAN data source autocreate successfully ENABLED
User Guide for the Cisco Network Analysis Module (NAM) Traffic Analyzer, 5.0
OL-22617-01
2-11
Page 46

Traffic
The NAM will now automatically create a ERSPAN data source for each device that sends ERSPAN
packets to it. The data source will have the specific Session ID that is populated by the device in the
ERSPAN packets sent to the NAM. If the same device happens to send ERSPAN packets to the NAM
with different Session ID values, a separate data source will be created for each unique Session ID sent
from the device.
Disabling Auto-Creation of ERSPAN Data Sources Using the Web GUI
Step 1 Click Setup > Traffic > NAM Data Sources.
Step 2 Click the Auto Create button on the bottom left of the window.
Step 3 Uncheck the ERSPAN check box to toggle auto-creation of ERSPAN data sources to “off”.
Step 4 Click the Submit button.
Disabling Auto-Creation of ERSPAN Data Sources Using the CLI
To disable auto-creation of ERSPAN data sources, use the no autocreate-data-source command as
follows:
root@172-20-104-107.cisco.com# no autocreate-data-source erspan
ERSPAN data source autocreate successfully DISABLED
root@172-20-104-107.cisco.com#
Chapter 2 Setting Up The NAM Traffic Analyzer
Creating ERSPAN Data Sources Using the Web GUI
To manually configure a ERSPAN data source on the NAM using the GUI, for example if the
auto-creation feature is turned off, use the following steps:
Step 1 Click Setup > Traffic > NAM Data Sources.
Step 2 Click the Create button along the bottom of the window.
Step 3 In the Type drop-down list, select “ERSPAN”.
Step 4 Enter the IP address of the device that will export ERSPAN to the NAM.
Step 5 Give the Data Source a name. This name will appear anywhere there is a Data Source drop-down list.
Step 6 (Optional) Check the Session check box and enter an Session ID into the Value field if the data source
should only apply to that specific session. If you leave the check box unchecked, all ERSPAN traffic
from the device will be grouped together into this data source, regardless of Session ID.
Devices can be configured with multiple ERSPAN Sessions. The packets exported may have the same
source IP address, but the Session ID exported will be a different for each session. If you want to include
only one Session in the data source, you must check the “Session” box and provide the value of that
Session ID.
Step 7 Click the Submit button.
2-12
User Guide for the Cisco Network Analysis Module (NAM) Traffic Analyzer, 5.0
OL-22617-01
Page 47

Chapter 2 Setting Up The NAM Traffic Analyzer
Creating ERSPAN Data Sources Using the CLI
To manually configure a ERSPAN data source on the NAM using the CLI (for example if the
auto-creation feature is turned off), use the following steps. Note that when using the CLI, there are two
separate phases involved: First, you must create a “device” entry on the NAM and remember the device
ID, and then you must create a data source entry using this device ID. In the NAM GUI, these two phases
for creating ERSPAN data sources are combined together.
Step 1 Enter the command device erspan. You will now be in erspan device subcommand mode as shown here:
root@172-20-104-107.cisco.com# device erspan
Entering into subcommand mode for this command.
Type 'exit' to apply changes and come out of this mode.
Type 'cancel' to discard changes and come out of this mode.
root@172-20-104-107.cisco.com(sub-device-erspan)#
Step 2 Enter ? to see all the command options available, as in the example below:
root@172-20-104-107.cisco.com(sub-device-netflow)# ?
? - display help
address - device IP address (*)
cancel - discard changes and exit from subcommand mode
exit - create device and exit from sub-command mode
help - display help
show - show current config that will be applied on exit
Traffic
(*) - denotes a mandatory field for this configuration.
root@172-20-104-107.cisco.com(sub-device-netflow)#
Step 3 Enter the IP address of the device as shown in this example (required):
root@172-20-104-107.cisco.com(sub-device-erspan)# address 192.168.0.1
Step 4 Typ e show to look at the device configuration that will be applied and verify that it is correct:
root@172-20-104-107.cisco.com(sub-device-erspan)# show
DEVICE TYPE : ERSPAN (Encapsulated Remote SPAN)
DEVICE ADDRESS : 192.168.0.1
root@172-20-104-107.cisco.com(sub-device-erspan)#
Step 5 Typ e exit to come out of the subcommand mode and create the device. Remember the ID value that was
assigned to the new device (you will need it to create the data source).
root@172-20-104-107.cisco.com(sub-device-erspan)# exit
Device created successfully, ID = 1
root@172-20-104-107.cisco.com#
Step 6 Enter the command data-source erspan. You will now be in erspan data source subcommand mode as
shown here:
root@172-20-104-107.cisco.com# data-source erspan
OL-22617-01
Entering into subcommand mode for this command.
Type 'exit' to apply changes and come out of this mode.
Type 'cancel' to discard changes and come out of this mode.
root@172-20-104-107.cisco.com(sub-data-source-erspan)#
User Guide for the Cisco Network Analysis Module (NAM) Traffic Analyzer, 5.0
2-13
Page 48

Traffic
Chapter 2 Setting Up The NAM Traffic Analyzer
Step 7 Enter ? to see all the command options available, as in the example below:
root@172-20-104-107.cisco.com(sub-data-source-erspan)# ?
? - display help
cancel - discard changes and exit from subcommand mode
device-id - netflow device ID (*)
exit - create data-source and exit from sub-command mode
help - display help
name - data-source name (*)
session-id - erspan Session ID
show - show current config that will be applied on exit
(*) - denotes a mandatory field for this configuration.
root@172-20-104-107.cisco.com(sub-data-source-erspan)#
Step 8 Enter the device ID from Step 4.
root@172-20-104-107.cisco.com(sub-data-source-erspan)# device-id 1
Step 9 Enter the name you would like for the data source (required):
root@172-20-104-107.cisco.com(sub-data-source-erspan)# name MyFirstErspanDataSource
Step 10 If desired, supply the specific Session ID for this ERSPAN data source (optional):
root@172-20-104-107.cisco.com(sub-data-source-erspan)# session-id 123
Step 11 Type show to look at the data source configuration that will be applied and verify that it is correct:
root@172-20-104-107.cisco.com(sub-data-source-netflow)# show
DATA SOURCE NAME : MyFirstErspanDataSource
DATA SOURCE TYPE : ERSPAN (Encapsulated Remote SPAN)
DEVICE ID : 1
DEVICE ADDRESS : 192.168.0.1
SESSION ID : 123
root@172-20-104-107.cisco.com(sub-data-source-erspan)#
Step 12 Type exit to come out of the subcommand mode and create the data source:
root@172-20-104-107.cisco.com(sub-data-source-erspan)# exit
Data source created successfully, ID = 3
The data source is now created, and ERSPAN records from the device will be received and accepted by
the NAM as they arrive.
Deleting ERSPAN Data Sources Using the Web GUI
To delete an existing ERSPAN data source, use the following steps. Note that if the auto-creation feature
is turned on, and the device continues to send ERSPAN packets to the NAM, the data source will be
recreated again automatically as soon as the next ERSPAN packet arrives. Therefore, if you wish to
delete an existing ERSPAN data source, it is usually advisable to first turn the ERSPAN auto-create
feature off, as described earlier.
2-14
Step 1 Click Setup > Traffic > NAM Data Sources
Step 2 Click on the data source you would like to delete to highlight it.
User Guide for the Cisco Network Analysis Module (NAM) Traffic Analyzer, 5.0
OL-22617-01
Page 49

Chapter 2 Setting Up The NAM Traffic Analyzer
Step 3 Click the Delete button along the bottom of the window.
Deleting ERSPAN Data Sources Using the CLI
To delete a ERSPAN data source using the CLI, use the following steps. Note that when using the CLI,
there are generally two separate phases involved. First you should delete the data source, then delete the
device if you have no other data sources using the same device (for example with a different Engine ID
value). As a shortcut, if you simply delete the device, then all data sources using that device will also be
deleted.
Step 1 Show all data sources so you can find the ID of the one you want to delete:
root@172-20-104-107.cisco.com# show data-source
DATA SOURCE ID : 1
DATA SOURCE NAME : DATA PORT 1
TYPE : Data Port
PORT NUMBER : 1
-----------
Traffic
DATA SOURCE ID : 2
DATA SOURCE NAME : DATA PORT 2
TYPE : Data Port
PORT NUMBER : 2
-----------
DATA SOURCE ID : 3
DATA SOURCE NAME : MyFirstErspanDataSource
TYPE : ERSPAN (Encapsulated Remote SPAN)
DEVICE ID : 2
DEVICE ADDRESS : 192.168.0.1
ENGINE ID : 123
-----------
root@172-20-104-107.cisco.com#
Step 2 Use the no data-source command to delete the data source:
root@172-20-104-107.cisco.com# no data-source 3
Successfully deleted data source 3
root@172-20-104-107.cisco.com#
Step 3 Show all devices so you can find the ID of the one you want to delete:
root@172-20-104-107.cisco.com# show device
DEVICE ID : 1
DEVICE TYPE : ERSPAN (Encapsulated Remote SPAN)
IP ADDRESS : 192.168.0.1
INFORMATION : No packets received
STATUS : Inactive
------
OL-22617-01
root@172-20-104-107.cisco.com#
User Guide for the Cisco Network Analysis Module (NAM) Traffic Analyzer, 5.0
2-15
Page 50

Traffic
Step 4 Use the no device command to delete the device:
root@172-20-104-107.cisco.com# no device 1
Sucessfully deleted device 1
root@172-20-104-107.cisco.com#
Note that if the auto-creation mode is on, and the device continues to send ERSPAN packets to the NAM,
the data source (and device entry) will be recreated again automatically as soon as the next ERSPAN
packet arrives. Therefore, if you wish to delete an existing ERSPAN data source, it is usually advisable
to first turn the ERSPAN auto-create feature off, as described earlier.
Configuring ERSPAN on Devices
There are two ways to configure ERSPAN so that the NAM receives the data:
• Sending ERSPAN Data to Layer 3 Interface, page 2-16
• Sending ERSPAN Data Directly to the NAM Management Interface, page 2-17
Sending ERSPAN Data to Layer 3 Interface
To send the data to a layer 3 interface on the Switch housing the NAM, configure the ERSPAN source
session. The ERSPAN destination session then sends the traffic to a NAM data-port. After performing
this configuration, you can select the DATA PORT X data source to analyze the ERSPAN traffic.
Chapter 2 Setting Up The NAM Traffic Analyzer
Note This method causes the ERSPAN traffic to arrive on one of the NAM data ports, which is the most
efficient method and will not have any adverse effect on the NAM’s IP connectivity. Therefore, we
recommend this method.
Sample Configuration of ERSPAN Source
monitor session 1 type erspan-source
no shut
source interface Fa 3/47
destination
erspan-id N
ip address aa.bb.cc.dd
origin ip address ee.ff.gg.hh
Where:
• erspan-id N is the ERSPAN ID
• aa.bb.cc.dd is the IP address of the destination switch (loopback address or any routable IP address)
• ee.ff.gg.hh is the source IP address of the ERSPAN traffic
Sample Configuration of ERSPAN Destination
monitor session 1 type erspan-destination
no shut
destination analysis-module 2 data-port 2
source
erspan-id N
ip address aa.bb.cc.dd
2-16
Where:
• erspan-id N matches the ERSPAN ID at the source switch
User Guide for the Cisco Network Analysis Module (NAM) Traffic Analyzer, 5.0
OL-22617-01
Page 51

Chapter 2 Setting Up The NAM Traffic Analyzer
• aa.bb.cc.dd is the IP address defined at the destination
You can now connect to the NAM to monitor and capture traffic of the Data Port 2 data source.
Sending ERSPAN Data Directly to the NAM Management Interface
To send the data directly to the NAM management IP address (management-port), configure the
ERSPAN source session. No ERSPAN destination session configuration is required. After performing
this configuration on the Catalyst 6500 switch or Cisco 7600 series router, when ERSPAN packets are
sent to the NAM, it will automatically create a data source for that packet stream. If the auto-create
feature is not enabled, you will have to manually create the data source for this ERSPAN stream of traffic
(see
Creating ERSPAN Data Sources Using the Web GUI, page 2-12).
Note This method causes the ERSPAN traffic to arrive on the NAM management port. If the traffic level is
high, this could have negative impact on the NAM’s performance and IP connectivity.
Sample Configuration
monitor session 1 type erspan-source
no shut
source interface Fa3/47
destination
erspan-id Y
ip address aa.bb.cc.dd
origin ip address ee.ff.gg.hh
Traffic
Where:
• Interface fa3/47 is a local interface on the erspan-source switch to be monitored
• Y is any valid span session number
• aa.bb.cc.dd is the management IP address of the NAM
• ee.ff.gg.hh is the source IP address of the ERSPAN traffic
VACL
A VLAN access control (VACL) list can forward traffic from either a WAN interface or VLANs to a data
port on the NAM. A VACL provides an alternative to using SPAN; a VACL can provide access control
based on Layer 3 addresses for IP and IPX protocols. The unsupported protocols are access controlled
through the MAC addresses. A MAC VACL cannot be used to access control IP or IPX addresses.
Configuring VACL on a WAN Interface
Because WAN interfaces do not support the SPAN function, you must use the switch CLI to manually
configure a VACL in order to monitor WAN traffic with the NAM. This feature only works for IP traffic
over the WAN interface.
VACL can also be used of there is no available SPAN session to direct traffic to the NAM. In this case,
a VACL can be set up in place of a SPAN for monitoring VLAN traffic.
The following example shows how to configure a VACL on an ATM WAN interface and forward both
ingress and egress traffic to the NAM. These commands are for switches running Cisco IOS version
12.1(13)E1 or higher. For more information on using these features, see your accompanying switch
documentation.
Cat6509#config terminal
Cat6509(config)# access-list 100 permit ip any any
OL-22617-01
User Guide for the Cisco Network Analysis Module (NAM) Traffic Analyzer, 5.0
2-17
Page 52

Traffic
Chapter 2 Setting Up The NAM Traffic Analyzer
Cat6509(config)# vlan access-map wan 100
Cat6509(config-access-map)# match ip address 100
Cat6509(config-access-map)# action forward capture
Cat6509(config-access-map)# exit
Cat6509(config)# vlan filter wan interface AM6/0/0.1
Cat6509(config)# analysis module 3 data-port 1 capture allowed-vlan 1-4094
Cat6509(config)# analysis module 3 data-port 1 capture
Cat6509(config)# exit
To monitor egress traffic only, get the VLAN ID that is associated with the WAN interface by using the
following command:
Cat6509#show cwan vlan
Hidden VLAN swidb->i_number Interface
1017 94 ATM6/0/0.1
Once you have the VLAN ID, configure the NAM data port using the following command:
Cat6509(config)# analysis module 3 data-port 1 capture allowed-vlan 1017
To monitor ingress traffic only, replace the VLAN number in the capture configuration with the native
VLAN ID that carries the ingress traffic. For example, if VLAN 1 carries the ingress traffic, you would
use the following command:
Cat6509(config)# analysis module 3 data-port 1 capture allowed-vlan 1
Configuring VACL on a LAN VLAN
For VLAN Traffic monitoring on a LAN, traffic can be sent to the NAM by using the SPAN feature of
the switch. However, in some instances when the traffic being spanned exceeds the monitoring capability
of the NAM, you might want to pre-filter the LAN traffic before it is forwarded. This can be done by
using VACL.
The following example shows how to configure VACL for LAN VLAN interfaces. In this example, all
traffic directed to the server 172.20.122.226 on VLAN 1 is captured and forwarded to the NAM located
in slot 3.
Cat6509#config terminal
Cat6509#(config)#access-list 100 permit ip any any
Cat6509#(config)#access-list 110 permit ip any host 172.20.122.226
Cat6509#(config)#vlan access-map lan 100
Cat6509#(config-access-map)match ip address 110
Cat6509#(config-access-map)#action forward capture
Cat6509#(config-access-map)#exit
Cat6509#(config)#vlan access-map lan 200
Cat6509#(config-access-map)#match ip address 100
Cat6509#(config-access-map)#action forward
Cat6509#(config-access-map)#exit
Cat6509#(config)#vlan filter lan vlan-list 1
Cat6509#(config)#analysis module 3 data-port 1 capture allowed-vlan 1
Cat6509#(config)#analysis module 3 data-port 1 capture
Cat6509#(config)#exit
NetFlow
2-18
The NAM can function as a NetFlow consumer, or a NetFlow producer (new in NAM Traffic Analyzer
5.0), or both. For information about NAM as an NDE producer, see
page 2-51.
User Guide for the Cisco Network Analysis Module (NAM) Traffic Analyzer, 5.0
Configuring NetFlow Data Export,
OL-22617-01
Page 53

Chapter 2 Setting Up The NAM Traffic Analyzer
As a consumer, the NAM can receive NetFlow packets on its management port from devices such as
Cisco routers and switches. Those records are stored in its collection database as if that traffic had
appeared on one of the NAM data ports. The NAM understands NetFlow v1, v5, v6, v7, v8, and v9.
Incoming NetFlow data is parsed by the NAM, stored in its internal database, and presented in the GUI
in the same way as traffic from other data sources.
For the NAM to receive NetFlow packets from an external switch or router, that device must be
configured by export flow records to the NAM’s IP address and the correct UDP port number. The default
port number on which the NAM listens for NetFlow packets is port 3000. This can be modified using the
NAM CLI, but the important point is that the same port must be configured on the NAM and the
exporting device(s). Depending on the external device, you may need to enable the NetFlow feature on
a per-interface basis.
See the following sections about NetFlow as a data source:
• Understanding NetFlow Interfaces, page 2-19
• Understanding NetFlow Flow Records, page 2-19
• Managing NetFlow Data Sources, page 2-20
• Configuring NetFlow on Devices, page 2-20
Traffic
Understanding NetFlow Interfaces
To use a device as an NDE data source for the NAM, you must configure the device itself to export NDE
packets to UDP port 3000 on the NAM. You might need to configure the device itself on a per-interface
basis. An NDE device is identified by its IP address. In NAM Traffic Analyzer 5.0, the default UDP port
of 3000 can be changed with a NAM CLI command (see
You can define additional NDE devices by specifying the IP addresses and (optionally) the community
strings. Community strings are used to upload convenient text strings for interfaces on the managed
devices that are monitored in NetFlow records.
Remote NDE devices may export information pertaining to any or all of their individual interfaces. The
NAM keeps track of the interface associated with any flow information received from the device. On the
NDE Interface Analysis page (Analyze > Traffic > NDE Interface), you can view information for any
selected interface on the device. This page will display the interface utilization or throughput over time,
as well as show the top Applications, Hosts, and DSCP groups in both the input and output directions
for the interface.
Understanding NetFlow Flow Records
An NDE packet contains multiple flow records. Each flow record has two fields:
• Input SNMP ifIndex
• Output SNMP ifIndex
Configuring NetFlow on Devices, page 2-20).
OL-22617-01
Note This information might not be available because of NDE feature incompatibility with your Cisco IOS
version, or because of an NDE flow-mask configuration.
In most cases, turning on NetFlow on an interface populates the NetFlow cache in the device with flows
that are in the input direction of the interface. As a result, the input SNMP ifIndex field in the flow record
has the ifIndex of the interface on which NetFlow was turned on.
Sample NetFlow Network, Figure 2-2,
shows a sample network configuration with a NetFlow router.
User Guide for the Cisco Network Analysis Module (NAM) Traffic Analyzer, 5.0
2-19
Page 54

Traffic
Host A
Host B Host C
Router
a
b
c
91629
Chapter 2 Setting Up The NAM Traffic Analyzer
Figure 2-2 Sample NetFlow Network
Table 2-8, Reporting Flow Records lists the reported flows if NetFlow is enabled on interface a.
Ta b l e 2-8 Reporting Flow Records
Input Interface Output Interface Are Flows Reported?
a b Ye s
a c Yes
b c No
b a No
c a No
c b No
Managing NetFlow Data Sources
A data source entry must exist on the NAM in order for it to accept NetFlow records from an external
device. Data source entries may be created manually using the NAM web GUI or the CLI. When
manually creating a data source, you may specify any name you want for the data source.
For convenience however, manual creation of NetFlow data sources is not necessary. There is an
“auto-create” feature which is enabled by default. With the auto-create feature, a new data source will
automatically be created for each device which sends NDE traffic to the NAM when the first packet is
received.
Auto-created NetFlow data sources will be assigned a name in the format NDE-<IP
Address>-ID-<Integer>, where <IP Address> is the IP address of the exporting device, and <Integer>
is the Engine-ID that the device populates in the packets (part of the NetFlow Data Export standard). An
example might be “NDE-192.168.0.1-ID-12” for device 192.168.0.1 sending NDE packets with the
Engine ID field set to 12. You can edit these auto-created data sources and change the name if you want
to, as well as optionally specifying SNMP credentials for the device, as described later in this document.
Configuring NetFlow on Devices
The configuration commands for NetFlow devices to export NDE packets to the NAM are platform and
device specific. The example configuration commands provided here are the ones most commonly found
for devices running Cisco IOS. For more detailed information, see your device documentation.
2-20
User Guide for the Cisco Network Analysis Module (NAM) Traffic Analyzer, 5.0
OL-22617-01
Page 55

Chapter 2 Setting Up The NAM Traffic Analyzer
For Devices Running Cisco IOS
Step 1 Select the interface on which you wish to turn on routed flow cache.
Prompt# configure terminal
Prompt(config)# interface <type slot/port>
Prompt(config-if)# ip route-cache flow
Step 2 Export routed flow cache entries to UDP port 3000 of the NAM.
Prompt(config)# ip flow-export destination <NAM IP address> 3000
Note Newer Cisco IOS images support Flexible NetFlow. This feature allows you to configure a router
or switch to export certain fields of network traffic flow to the NAM. From the NAM’s
perspective, it is not practical to have incomplete flow information, such as flow records with no
packet count but byte count. Another exactly is flow records without a source address but with
a destination address. These incomplete flow records make the presentation in the NAM GUI
confusing. Cisco highly recommends that you export full flow (for example, NDEv5 format)
information to the NAM.
Traffic
For Devices Supporting Multi-Layer Switching Cache Running Cisco IOS
Step 1 Select the version of NDE.
Prompt(config)# mls nde sender version <version-number>
Note The NAM supports NDE versions 1, 5, 6, 7, 8, and 9 aggregation caches.
Step 2 Select NDE flow mask.
Prompt(config)# mls flow ip full
Step 3 Enable NetFlow export.
Prompt(config)# mls nde sender
Step 4 Export NetFlow to UDP port 3000 of the NAM.
Prompt(config)# ip flow-export destination <NAM IP address> 3000
For Devices Supporting NDE v8 Aggregations Running Cisco IOS
Step 1 Select a v8 aggregation.
Prompt(config)# ip flow-aggregation cache <aggregation-type>
OL-22617-01
Where aggregation-type can be:
• destination-prefix
• source-prefix
User Guide for the Cisco Network Analysis Module (NAM) Traffic Analyzer, 5.0
2-21
Page 56

Traffic
Chapter 2 Setting Up The NAM Traffic Analyzer
• protocol-port
• prefix
Step 2 Enable the aggregation cache.
Prompt(config-flow-cache)# enable
Step 3 Export the flow entries in the aggregation cache to NAM UDP port 3000.
Prompt(config-flow-cache)#export destination <NAM address> 3000
For Devices That Support NDE Export From Bridged-Flows Statistics
Step 1 Enable bridged-flows statistics on the VLANs.
Prompt>(enable) set mls bridged-flow-statistics enable <vlan-list>
Step 2 Export the NDE packets to UPD port 3000 of the NAM
Prompt>(enable) set mls nde <NAM address> 3000
For NAMs Located in a Device Slot
If the NAM is located in one of the device slots, the device can be set up to export NDE packets to the
NAM.
Step 1 Select the version of NDE.
Prompt>(enable) set mls nde version <nde-version-number>
Step 2 Select NDE flow mask to be full.
Prompt>(enable) sel mls nde full
Step 3 Enable NDE export.
Prompt>(enable) set mls nde enable
Step 4 Export the NDE packets to the NAM.
Prompt>(enable) set snmp extendedrmon netflow enable <NAM-slot>
Enabling Auto-Creation of NetFlow Data Sources Using the Web GUI
To configure the NAM to automatically create data sources when it receives NDE packets from an
external device, use the following steps. Remember however, that the auto-create feature is turned on by
default, so these steps are typically not necessary.
2-22
Step 1 Click Setup > Traffic > NAM Data Sources.
Step 2 Click the Auto Create button on the bottom left of the window.
Step 3 Check the Netflow check box to toggle auto-creation of NDE data sources on.
User Guide for the Cisco Network Analysis Module (NAM) Traffic Analyzer, 5.0
OL-22617-01
Page 57

Chapter 2 Setting Up The NAM Traffic Analyzer
Step 4 Click the Submit button.
Enabling Auto-Creation of NetFlow Data Sources Using the CLI
Configuration of the auto-create feature is also possible using the NAM CLI. Remember that the
auto-create feature is turned ON by default, so in most cases these steps are not necessary.
To configure the NAM to automatically create data sources when it receives NDE packets from an
external device, use the following steps:
Use the autocreate-data-source command as follows:
root@172-20-104-107.cisco.com# autocreate-data-source netflow
NDE data source autocreate successfully ENABLED
The NAM will now automatically create a NetFlow data source for each device that sends NetFlow
packets to it. The data source will have the specific Engine ID that is populated by the device in the NDE
packets sent to the NAM. If the same device happens to send NDE packets to the NAM with different
Engine ID values, a separate data source will be created for each unique Engine ID sent from the device.
Traffic
Disabling Auto-Creation of NetFlow Data Sources Using the Web GUI
Step 1 Click Setup > Traffic > NAM Data Sources.
Step 2 Click the Auto Create button on the bottom left of the window.
Step 3 Uncheck the Netflow check box to toggle auto-creation of NDE data sources off.
Step 4 Click the Submit button.
Disabling Auto-Creation of NetFlow Data Sources Using the CLI
To disable auto-creation of NetFlow data sources, use the no autocreate-data-source command as
follows:
root@172-20-104-107.cisco.com# no autocreate-data-source netflow
NDE data source autocreate successfully DISABLED
root@172-20-104-107.cisco.com#
Creating NetFlow Data Sources Using the Web GUI
To manually configure a NetFlow data source on the NAM using the GUI, for example if the
auto-creation feature is turned OFF, use the following steps:
OL-22617-01
Step 1 Click Setup > Traffic > NAM Data Sources.
Step 2 Click the Create button along the bottom of the window.
Step 3 In the Type drop-down list, select “NetFlow.”
Step 4 Enter the IP address of the device that will export NDE to the NAM (required).
Step 5 Give the Data Source a name. This name will appear anywhere there's a Data Source drop-down list.
User Guide for the Cisco Network Analysis Module (NAM) Traffic Analyzer, 5.0
2-23
Page 58

Traffic
Chapter 2 Setting Up The NAM Traffic Analyzer
Step 6 (Optional) If you know the specific value of the Engine ID on the device you would like to monitor,
check the “Engine” check box, and enter the value of the Engine ID. If the “Engine” check box is left
unchecked, then all NDE records exported by the device will be grouped into the same data source,
regardless of the Engine ID populated in the NDE packets (in most cases the Engine check box can be
left blank and you don't have to worry about the Engine ID value).
Some devices have multiple Engines which independently export NDE records. For example, on some
Cisco routers, NDE records can be exported by the Supervisor module as well as individual line cards.
The packets exported may have the same source IP address, but the Engine ID exported by the Supervisor
will be a different value than the Engine ID(s) exported by the line card(s). If you want to include only
one Engine in the data source, you must check the “Engine” box and provide the value of that Engine ID.
Step 7 (Optional) SNMP v1/v2c RO Community String: If SNMP v1 or v2c will be used to communicate with
the device, enter the community string that is configured on the device that is going to export NetFlow
packets to the NAM.
Step 8 (Optional) “Enable SNMP v3”: If SNMP v3 will be used to communicate with the device, fill in the
fields within the v3-specific dialog.
Step 9 (Optional) If desired, fill in the SNMP credentials for the device. If valid SNMP credentials are provided,
the NAM can upload readable text strings from the device to describe the interfaces on that device rather
than just displaying the interfaces as numbers. You may specify either SNMPv2c or SNMPv3
credentials. See
Table 2-9, SNMP Credentials.
Ta b l e 2-9 SNMP Credentials
Field Description
Mode: No Auth, No Priv SNMP will be used in a mode with no authentication and no
privacy.
Mode: Auth, No Priv SNMP will be used in a mode with authentication, but no
privacy.
Mode: Auth and Priv SNMP will be used in a mode with both authentication and
privacy.
User Name Enter a username, which will match the username
configured on the device.
Auth Password Enter the authentication password associated with the
username that was configured on the device. Verify the
password.
Auth Algorithm Choose the authentication standard which is configured on
the device (MD5 or SHA-1).
Privacy Password Enter the privacy password, which is configured on the
device. Verify the password.
Privacy Algorithm Enter the privacy algorithm, which is configured on the
device (AES or DES).
2-24
Step 10 Click the Submit button.
User Guide for the Cisco Network Analysis Module (NAM) Traffic Analyzer, 5.0
OL-22617-01
Page 59

Chapter 2 Setting Up The NAM Traffic Analyzer
Creating NetFlow Data Sources Using the CLI
To manually configure a NetFlow data source on the NAM using the CLI, for example if the
auto-creation feature is turned off, use the following steps. Note that when using the CLI, there are two
separate phases involved. First you must create a “device” entry on the NAM and remember the device
ID. Then you must create a data source entry using this device ID. For convenience, these two phases
are combined together when using the GUI to create NetFlow data sources.
Step 1 Enter the command device netflow. You will now be in netflow device subcommand mode as shown
here:
root@172-20-104-107.cisco.com# device netflow
Entering into subcommand mode for this command.
Type 'exit' to apply changes and come out of this mode.
Type 'cancel' to discard changes and come out of this mode.
root@172-20-104-107.cisco.com(sub-device-netflow)#
Step 2 Enter ? to see all the command options available, as in the example below:
root@172-20-104-107.cisco.com(sub-device-netflow)# ?
? - display help
address - device IP address (*)
cancel - discard changes and exit from subcommand mode
community - SNMPv2c community string
exit - create device and exit from sub-command mode
help - display help
show - show current config that will be applied on exit
snmp-version - SNMP version to use to communicate with device
v3-auth-passphrase - SNMPv3 authentication passphrase
v3-auth-protocol - SNMPv3 authentication protocol
v3-priv-passphrase - SNMPv3 privacy passphrase
v3-priv-protocol - SNMPv3 privacy protocol
v3-sec-level - SNMPv3 security level
v3-username - SNMPv3 username
Traffic
OL-22617-01
(*) - denotes a mandatory field for this configuration.
root@172-20-104-107.cisco.com(sub-device-netflow)#
Step 3 Enter the IP address of the device as shown in this example (required):
root@172-20-104-107.cisco.com(sub-device-netflow)# address 192.168.0.1
Step 4 If desired, enter the SNMP credentials for the device, as in the example below. If you specify
snmp-version v2c, then you should enter the community string for the device. If you specify
snmp-version v3, then you should enter the security level, username, authentication protocol,
authentication passphrase, privacy protocol, and privacy passphrase.
root@172-20-104-107.cisco.com(sub-device-netflow)# snmp-version v2c
root@172-20-104-107.cisco.com(sub-device-netflow)# community public
Step 5 Typ e show to look at the device configuration that will be applied and verify that it is correct:
root@172-20-104-107.cisco.com(sub-device-netflow)# show
DEVICE TYPE : NDE (Netflow Data Export)
DEVICE ADDRESS : 192.168.0.1
SNMP VERSION : SNMPv2c
V2C COMMUNITY : public
V3 USERNAME :
User Guide for the Cisco Network Analysis Module (NAM) Traffic Analyzer, 5.0
2-25
Page 60

Traffic
Chapter 2 Setting Up The NAM Traffic Analyzer
V3 SECURITY LEVEL : No authentication, no privacy
V3 AUTHENTICATION : MD5
V3 AUTH PASSPHRASE :
V3 PRIVACY : DES
V3 PRIV PASSPHRASE :
root@172-20-104-107.cisco.com(sub-device-netflow)#
Step 6 Typ e exit to come out of the subcommand mode and create the device. Remember the ID value that was
assigned to the new device, you will need it to create the data source!
root@172-20-104-107.cisco.com(sub-device-netflow)# exit
Device created successfully, ID = 1
root@172-20-104-107.cisco.com#
Step 7 Enter the command data-source netflow. You will now be in netflow data source subcommand mode as
shown here:
root@172-20-104-107.cisco.com# data-source netflow
Entering into subcommand mode for this command.
Type 'exit' to apply changes and come out of this mode.
Type 'cancel' to discard changes and come out of this mode.
root@172-20-104-107.cisco.com(sub-data-source-netflow)#
Step 8 Enter ? to see all the command options available, as in the example below:
root@172-20-104-107.cisco.com(sub-data-source-netflow)# ?
? - display help
cancel - discard changes and exit from subcommand mode
device-id - netflow device ID (*)
engine-id - netflow Engine ID
exit - create data-source and exit from sub-command mode
help - display help
name - data-source name (*)
show - show current config that will be applied on exit
(*) - denotes a mandatory field for this configuration.
root@172-20-104-107.cisco.com(sub-data-source-netflow)#
Step 9 Enter the device ID from Step 4 (required):
root@172-20-104-107.cisco.com(sub-data-source-netflow)# device-id 1
Step 10 Enter the name you would like for the data source (required):
root@172-20-104-107.cisco.com(sub-data-source-netflow)# name MyFirstNdeDataSource
Step 11 If desired, supply the specific Engine ID for this NDE data source (optional):
root@172-20-104-107.cisco.com(sub-data-source-netflow)# engine-id 123
Step 12 Type show to look at the data source configuration that will be applied and verify that it is correct:
root@172-20-104-107.cisco.com(sub-data-source-netflow)# show
2-26
DATA SOURCE NAME : MyFirstNdeDataSource
DATA SOURCE TYPE : NDE (Netflow Data Export)
DEVICE ID : 1
DEVICE ADDRESS : 192.168.0.1
ENGINE ID : 123
root@172-20-104-107.cisco.com(sub-data-source-netflow)#
User Guide for the Cisco Network Analysis Module (NAM) Traffic Analyzer, 5.0
OL-22617-01
Page 61

Chapter 2 Setting Up The NAM Traffic Analyzer
Step 13 Type exit to come out of the subcommand mode and create the data source:
root@172-20-104-107.cisco.com(sub-data-source-netflow)# exit
Data source created successfully, ID = 3
The data source is now created, and NDE records from the device will be received and accepted by the
NAM as they arrive.
Deleting NetFlow Data Sources Using the Web GUI
To delete an existing NetFlow data source, use the following steps. Note that if the auto-creation feature
is turned on, and the device continues to send NDE packets to the NAM, the data source will be
re-created again automatically as soon as the next NDE packet arrives. Therefore, if you wish to delete
an existing NetFlow data source, it is usually advisable to first turn the NetFlow auto-create feature off,
as described earlier.
Step 1 Click Setup > Traffic > NAM Data Sources.
Step 2 Click on the data source you would like to delete.
Traffic
Step 3 Click the Delete button along the bottom of the window.
Deleting NetFlow Data Sources Using the CLI
To delete a NetFlow data source using the CLI, use the following steps. Note that when using the CLI,
there are generally two separate phases involved. First you should delete the data source, then delete the
device if you have no other data sources using the same device (for example with a different Engine ID
value). As a shortcut, if you simply delete the device, then all data sources using that device will also
be deleted.
Step 1 Show all data sources so you can find the ID of the one you want to delete:
root@172-20-104-107.cisco.com# show data-source
DATA SOURCE ID : 1
DATA SOURCE NAME : DATA PORT 1
TYPE : Data Port
PORT NUMBER : 1
-----------
DATA SOURCE ID : 2
DATA SOURCE NAME : DATA PORT 2
TYPE : Data Port
PORT NUMBER : 2
-----------
OL-22617-01
DATA SOURCE ID : 3
DATA SOURCE NAME : MyFirstNdeDataSource
TYPE : NDE (Netflow Data Export)
DEVICE ID : 2
DEVICE ADDRESS : 192.168.0.1
ENGINE ID : 123
-----------
User Guide for the Cisco Network Analysis Module (NAM) Traffic Analyzer, 5.0
2-27
Page 62

Traffic
Chapter 2 Setting Up The NAM Traffic Analyzer
root@172-20-104-107.cisco.com#
Step 2 Use the no data-source command to delete the data source:
root@172-20-104-107.cisco.com# no data-source 3
Successfully deleted data source 3
root@172-20-104-107.cisco.com#
Step 3 Show all devices so you can find the ID of the one you want to delete:
root@172-20-104-107.cisco.com# show device
DEVICE ID : 1
DEVICE TYPE : NDE (Netflow Data Export)
IP ADDRESS : 192.168.0.1
SNMP VERSION : SNMPv2c
V2C COMMUNITY : public
V3 USERNAME :
V3 SECURITY LEVEL : No authentication, no privacy
V3 AUTHENTICATION : MD5
V3 AUTH PASSPHRASE :
V3 PRIVACY : DES
V3 PRIV PASSPHRASE :
INFORMATION : No packets received
STATUS : Inactive
------
root@172-20-104-107.cisco.com#
Step 4 Use the no device command to delete the device:
root@172-20-104-107.cisco.com# no device 1
Successfully deleted device 1
root@172-20-104-107.cisco.com#
Note that if the auto-creation mode is on, and the device continues to send NDE packets to the NAM,
the data source (and device entry) will be re-created again automatically as soon as the next NDE packet
arrives. Therefore, if you wish to delete an existing NetFlow data source, it is usually advisable to first
turn the NetFlow auto-create feature off, as described earlier.
Testing NetFlow Devices
You can test the SNMP community strings for the devices in the Devices table. To test a device, select
it from the Devices table, then click Tes t. The Device System Information Dialog Box displays.
Table 2-10, Device System Information Dialog Box describes the fields.
Ta b l e 2-10 Device System Information Dialog Box
Field Description
Name
Hardware
Device Software Version
System Uptime
Location
Name of the device.
Hardware description of the device.
The current software version running on the device.
Total time the device has been running since the last
reboot.
Location of the device.
2-28
User Guide for the Cisco Network Analysis Module (NAM) Traffic Analyzer, 5.0
OL-22617-01
Page 63

Chapter 2 Setting Up The NAM Traffic Analyzer
Table 2-10 Device System Information Dialog Box (continued)
Field Description
Contact
SNMP read from device
If the device is sending NetFlow Version 9 (V9) and the NAM has received the NDE templates, then a
V9 Templates button appears below the Device System Information window.
Note NetFlow v9 templates do not appear in all NDE packets. When there are no templates, the V9 Templates
button does not appear.
WAAS
Understanding WAAS
Traffic
Contact information for the device.
SNMP read test result. For the local device only.
Cisco Wide Area Application Services (WAAS) software optimizes the performance of TCP-based
applications operating in a wide area network (WAN) environment and preserves and strengthens branch
security. The WAAS solution consists of a set of devices called Wide Area Application Engines (WAEs)
that work together to optimize WAN traffic over your network.
When client and server applications attempt to communicate with each other, the network devices
intercept and redirect this traffic to the WAEs to act on behalf of the client application and the destination
server.
WAEs provide information about packet streams traversing through both LAN and WAN interfaces of
WAAS WAEs. Traffic of interest can include specific servers and types of transaction being exported.
NAM processes the data exported from the WAAS and performs application response time calculations
and enters the data into reports you set up.
The WAEs examine the traffic and use built-in application policies to determine whether to optimize the
traffic or allow it to pass through your network not optimized.
You can use the WAAS Top Talkers Detail Dashboard to analyze the traffic for optimization. See Top
Talkers Detail, page 3-17 for more information.
Cisco WAAS helps enterprises to meet the following objectives:
• Provide branch office employees with LAN-like access to information and applications across a
geographically distributed network.
• Migrate application and file servers from branch offices into centrally managed data centers.
• Minimize unnecessary WAN bandwidth consumption through the use of advanced compression
algorithms.
OL-22617-01
• Provide print services to branch office users. WAAS allows you to configure a WAE as a print server
so you do not need to deploy a dedicated system to fulfill print requests.
• Improve application performance over the WAN by addressing the following common issues:
–
Low data rates (constrained bandwidth)
–
Slow delivery of frames (high network latency)
–
Higher rates of packet loss (low reliability)
User Guide for the Cisco Network Analysis Module (NAM) Traffic Analyzer, 5.0
2-29
Page 64

Traffic
For more information about WAAS and configuring the WAAS components, see the document:
Cisco Wide Area Application Services Configuration Guide, OL-16376-01
http://www.cisco.com/en/US/docs/app_ntwk_services/waas/waas/v4019/configuration/guide/
waas4cfg.html
Response Time Monitoring from WAAS Data Sources
The NAM processes the TCP flow data exported from the WAAS and performs application response time
(ART) calculations and reports. You use the NAM GUI to create a WAAS data source to monitor WAAS
traffic statistics. In addition to ART, NAM monitors and reports other traffic statistics of the WAAS data
sources including application, host, and conversation information.
The NAM provides different ART metrics by collecting data at different points as packets flow along
their paths. The NAM provides five different collection points, each represented by a WAAS data source.
Figure 2-3, “WAAS Data Sources (Data Collection Points)”, shows an example of the data collection
points. The solid line represents data exported from a WAAS device and/or directly monitored traffic
like SPAN. The broken line represents data exported from a WAAS device only.
Figure 2-3 WAAS Data Sources (Data Collection Points)
Chapter 2 Setting Up The NAM Traffic Analyzer
Client
Edge
WAE
Client
TCP 1 TCP 2 TCP 3
Client
WAN
Server
WAN
NAM
Core
WAE
Server
Server
You can use the NAM GUI to configure data sources at the locations in the network described in
Table 2-11, WAAS Data Collection Points.
Ta b l e 2-11 WAAS Data Collection Points
Setting Description
Client
This setting configures the WAE device to export the original (LAN side) TCP
flows originated from its clients to NAM for monitoring. To monitor this point,
configure a Client data source.
Client WAN
This setting configures the WAE device to export the optimized (WAN side)
TCP flows originated from its clients to NAM for monitoring. To monitor this
point, configure a Client WAN data source.
Server WAN
This setting configures the WAE device to export the optimized (WAN side)
TCP flows from its servers to NAM for monitoring. To monitor this point,
configure a Server WAN data source.
205558
2-30
User Guide for the Cisco Network Analysis Module (NAM) Traffic Analyzer, 5.0
OL-22617-01
Page 65

Chapter 2 Setting Up The NAM Traffic Analyzer
Table 2-11 WAAS Data Collection Points (continued)
Setting Description
Server
Passthrough
You can also configure a data source to use Export Passthrough data. For more information about
configuring WAAS data sources, see
Monitoring Client Data Sources
By monitoring the TCP connections between the client and the WAE device (Client segment in
Figure 2-3), you can measure the following ART metrics:
• Total Response Time as experienced by the client
• Total Transaction Time as experienced by the client
• Bandwidth usage (bytes/packets) before optimization
Traffic
This setting configures the WAE device to export the original (LAN side) TCP
flows from its servers to NAM for monitoring. To monitor this point, configure
a Server data source.
This setting configures the WAE device to export the TCP flows that are passed
through unoptimized.
Editing WAAS Data Sources, page 2-34.
• Number of transactions and connections.
• Network Time broken down into two segments: client-edge and edge-server
Monitoring WAN Data Sources
By monitoring the TCP connections between the edge and core WAE devices (Client WAN and Server
WAN segments in
• Bandwidth usage (bytes/packets) after optimization
• Network Time of the WAN segment
Monitoring Server Data Sources
By monitoring the TCP connections between the core WAE devices and the servers (Server segment in
Figure 2-3), you can measure the following ART metrics:
• Server Response Time (without proxy acceleration/caching server)
• Network Time between the core WAE device and the servers
Note NAM measures Network Time by monitoring the TCP three-way handshake between the devices.
Figure 2-3), you can measure the following:
OL-22617-01
User Guide for the Cisco Network Analysis Module (NAM) Traffic Analyzer, 5.0
2-31
Page 66

Chapter 2 Setting Up The NAM Traffic Analyzer
Traffic
Deployment Scenarios
Table 2-12, WAAS Data Source Configurations lists six different deployment scenarios you might
consider to monitor the optimized traffic on your WAAS network. Scenario #1 is typical when using
WS-SVC-NAM-1 and WS-SVC-NAM-2 blades. Scenario #2 is typical when using NME-NAM devices.
Ta b l e 2-12 WAAS Data Source Configurations
Deployment Scenario Edge WAE Data Source Core WAE Data Source
1 • Clients in the edge (branch)
Client Server
• Servers in the core (data center)
• NAM in the core
2 • Clients in the edge (branch)
• Servers in the core (data center)
• NAM in the edge
3 • Servers in the edge (branch)
• Clients in the core (data center)
• NAM in the core
4 • Servers in the edge (branch)
• Clients in the core (data center)
• NAM in the edge
5 • Clients and servers in the edge (branch) and the core (data
center)
• NAM in the core
6 • Clients and servers in the edge (branch) and the core (data
center)
• NAM in the edge
Server WAN
Client
Server
Client WAN
Server Client
Client WAN
Server
Client
Server WAN
Client
Server
Client
Server
Client WAN
Server WAN
Client
Server
Client
Server
Client WAN
Server WAN
Managing WAAS Devices
Before you can monitor WAAS traffic, you must first configure the WAAS device to export WAAS flow
record data to the NAM using the WAAS command-line interface (CLI) flow monitor command like the
following:
flow monitor tcpstat-v1 host <nam IP address>
flow monitor tcpstat-v1 enable
After you enable flow export to the NAM using WAAS CLI commands like those above, WAAS devices
will be detected and automatically added to the NAM’s WAAS device list.
User Guide for the Cisco Network Analysis Module (NAM) Traffic Analyzer, 5.0
2-32
OL-22617-01
Page 67

Chapter 2 Setting Up The NAM Traffic Analyzer
You must then configure the WAAS segments you want to monitor as WAAS data sources: Client, Client
WAN, Server WAN, and/or Server. See
information.
You can also use the Central Manager (CM) to centrally issue WAAS CLI commands to configure a large
number of WAEs at one time.
Note In addition to configuring the WAAS devices, you must specify which application servers you want to
monitor among the servers being optimized by WAAS devices. See
page 2-80, for more detailed information.
For more information about WAAS and configuring the WAAS components, see the document:
Cisco Wide Area Application Services Configuration Guide, OL-16376-01
http://www.cisco.com/en/US/docs/app_ntwk_services/waas/waas/v4019/configuration/guide/
waas4cfg.html
This section contains the following topics:
• Adding Data Sources for New WAAS Device, page 2-33
• Editing WAAS Data Sources, page 2-34
Traffic
Editing WAAS Data Sources, page 2-34, for more detailed
WAAS Monitored Servers,
• Deleting a WAAS Data Source, page 2-34
Adding Data Sources for New WAAS Device
The NAM uses WAAS data sources to monitor traffic collected from different WAAS segments: Client,
Client WAN, Server WAN, and Server. Each WAAS segment is represented by a data source. You can
set up the NAM to monitor and report other traffic statistics of the WAAS data sources such as
application, host, and conversation information in addition to the monitored Response Time metrics.
Note This step is not usually necessary because export-enabled WAAS devices are detected and added
automatically. See
WAAS export to the NAM.
To manually add a WAAS device to the list of devices monitored by the NAM:
Step 1 Choose Setup > Traffic > NAM Data Sources.
Step 2 Click Create.
The NAM Data Source Configuration Dialog appears.
Step 3 Choose “WAAS” from the list of Types.
Step 4 Enter the device IP address in the IP field.
Managing WAAS Devices, page 2-32, for more information about how to enable
OL-22617-01
Step 5 Check the check boxes for the appropriate WAAS Segments. See (Table 2-11).
Step 6 (Optional) If Response Time Export is enabled (see Custom Export, page 2-55), and you want to export
passthrough traffic, check the Passthrough Response Time check box.
Step 7 Click Submit to add the new WAAS custom data source.
User Guide for the Cisco Network Analysis Module (NAM) Traffic Analyzer, 5.0
2-33
Page 68

Traffic
Editing WAAS Data Sources
The NAM uses WAAS data sources to monitor traffic collected from different WAAS segments: Client,
Client WAN, Server WAN, and Server. Each WAAS segment is represented by a data source. You can
set up the NAM to monitor and report other traffic statistics of the WAAS data sources such as
application, host, and conversation information in addition to the monitored Response Time metrics.
To edit a WAAS device’s custom data source:
Step 1 Choose Setup > Traffic > NAM Data Sources. The data sources are displayed.
Step 2 Click the WAAS device you want to modify, and then click the Edit button.
You can configure the WAAS data sources to monitor the following WAAS segments as shown in
Figure 2-3, WAAS Data Sources (Data Collection Points):
• Client—This setting configures the WAE device to export the original (LAN side) TCP flows
originated from its clients to NAM for monitoring.
• Client WAN— This setting configures the WAE device to export the optimized (WAN side) TCP
flows originated from its clients to NAM for monitoring.
• Server WAN—This setting configures the WAE device to export the optimized (WAN side) TCP
flows from its servers to NAM for monitoring.
Chapter 2 Setting Up The NAM Traffic Analyzer
• Server—This setting configures the WAE device to export the original (LAN side) TCP flows from
its servers to NAM for monitoring.
SPAN data sources might take the place of the WAE Server data sources listed in Tab le 2-12. For
example, if you already configure SPAN to monitor the server LAN traffic, it is not necessary to enable
the Server data source on the WAE device.
Note The following step is optional and applies only when the NAM is configured to export data to an External
Response Time Reporting Console, such as the NetQos Super Agent.
Step 3 To export WAAS pass-through data to the External Response Time Reporting Console, check the
Passthrough Response Time check box.
Note WAAS pass-through data is not analyzed by the NAM.
See Custom Export, page 2-55 for more information.
Deleting a WAAS Data Source
To delete a WAAS custom data source:
2-34
Step 1 Choose Setup > Traffic > NAM Data Sources. The data sources are displayed.
Step 2 Choose the WAAS custom data source you want to delete, then click the Delete button.
A dialog box displays the device address and asks if you are sure you want to delete the device.
User Guide for the Cisco Network Analysis Module (NAM) Traffic Analyzer, 5.0
OL-22617-01
Page 69

Chapter 2 Setting Up The NAM Traffic Analyzer
Auto Create of New WAAS Devices
If you have numerous WAE devices, you can set up the NAM to configure newly discovered WAE
devices using a predefined configuration template using the NAM Auto Config option.
Note If most of your WAE devices are edge WAE, you might want to set the auto config to be that of the edge
device, then manually configure the data center WAE. For example, select the Client segment for
monitoring.
To configure WAAS auto-config:
Step 1 Choose Setup > Traffic > NAM Data Sources. The data sources are displayed.
Step 2 Click the Auto Create button.
The NAM Data Source Configuration Dialog displays.
Step 3 Check the WA A S check box.
Step 4 Check the check boxes for the desired Segments. See Editing WAAS Data Sources, page 2-34, for more
information.
Traffic
Hardware Deduplication
Note This section applies only to Cisco NAM 2200 Series appliances.
NAM 5.0 supports hardware-based detection of duplicate packets and allows you to configure a single
deduplication filter across all adapter ports.
After you enable deduplication, the NAM appliance detects and filters the duplicated packets. The packet
is identified as duplicated if all inspected segments match another packet within the specific time
window.
In addition to the duration-based timeout, there is also a fixed packet-count timeout. There cannot be
more than 7 packets between the duplicate packets. If packets 0 and 8 are identical, packet 8 will be
dropped. If packets 0 and 9 are identical, packet 9 will not be dropped.
To configure packet deduplication:
Step 1 Choose Setup > Traffic > Hardware Deduplication.
The Deduplication window displays.
Step 2 Check the Enabled check box to enable packet deduplication.
Step 3 Enter a value in the Time Window (1-127 in milliseconds) for the search or buffer period.
The value you set in the Time Window indicates the length of time (n milliseconds) in which two packets
can be considered duplicates. If the Time Window is 100 ms but two identical packets arrive 120ms apart,
the second packet would not be dropped. If the identical packets arrive 80 ms apart, the second packet
would be dropped.
Step 4 Click to choose a segment of the packet to inspect for deduplication.
OL-22617-01
User Guide for the Cisco Network Analysis Module (NAM) Traffic Analyzer, 5.0
2-35
Page 70

Alarms
Alarms
Chapter 2 Setting Up The NAM Traffic Analyzer
The default inspects the entire packet. The second option inspects all segments except the ISL portion
of the packet. The third option inspects all segments except the ISL, MAC, and VLAN portions of the
packet. The fourth option inspects all segments except the ISL, MAC, and VLAN portions of the packet.
The final (bottom) option inspects only the UDP/TCP and payload segments of the packet.
Note Regardless of the option you choose, the packet checksum is ignored.
Step 5 Click Submit to enable the settings you have entered, or click Reset to cancel any change.
Alarms are predefined conditions based on a rising data threshold, a falling data threshold, or both. You
can choose what types of events for which you want the NAM to notify you, and how you want to be
notified.
This is the order that you will typically follow for setting up alarms and alarm thresholds:
Step 1 Depending on the type of alarm action you would like to configure, define the way you would like to be
Step 2 Define the Alarm Action at Setup > Alarms > Actions.
Step 3 Define the Threshold for this alarm at Setup > Alarms > Thresholds.
Alarm Actions
notified (by e-mail, trap, trigger capture, or syslog).
• For e-mail server settings: Choose Administration > System > E-Mail Setting
• For trap settings: Choose Administration > System > SNMP Trap Setting
• For capture session settings: Choose Capture > Packet Capture/Decode > Sessions
• For syslog settings: Choose Administration > System > Syslog Setting
The NAM 5.0 Traffic Analyzer menu selections for setting up Alarms are:
• Alarm Actions, page 2-36
• Thresholds, page 2-39
• User Scenario, page 2-49
Alarms are predefined conditions based on a rising data threshold, a falling data threshold, or both. You
can set thresholds and alarms on various network parameters such as increased utilization, severe
application response delays, and voice quality degradation and be alerted to potential problems.
2-36
Note NAM 5.0 supports IPv6 for all alarm functionality.
User Guide for the Cisco Network Analysis Module (NAM) Traffic Analyzer, 5.0
OL-22617-01
Page 71

Chapter 2 Setting Up The NAM Traffic Analyzer
Note You could see two alarms for the same occurrence if both the source and the destination are in the same
site.
When you choose Setup > Alarms > Actions, you will see events that have been created. See Table 2-13,
Alarm Configuration for descriptions of the fields.
Ta b l e 2-13 Alarm Configuration
Field Description
Name
Email
Trap
Trigger Capture
Syslog Remote
Status
Alarms
Name given to the alarm at setup.
If turned on, will show “Enable”. If not turned on,
will show “Disable.” E-mail server settings are
configured on Administration > System >
E-Mail Setting.
If configured, will show “Community: xxxxx” as
configured on Administration > System >
SNMP Trap Setting. If not configured, will be
blank.
If configured, will show “Session:xxxxx” as
configured on Capture > Packet
Capture/Decode > Sessions. If no captures are
configured, will be blank.
If turned on, will say “Enable”. If turned off, will
say “Disable.” Settings configured on
Administration > System > Syslog Setting.
“Missing Trap” means that the trap configured for
that alarm action has been deleted.
“OK” means the Alarm action was successfully
created.
Alarm Action Configuration
When a threshold’s rising water mark is crossed, the alarm condition is met. This will trigger the alarm
action to take effect. The NAM supports the following alarm actions:
• E-mail syslog: An alarm action that e-mails the syslog content of the alarm condition. To avoid
e-mail flooding the network, the NAM does not send more than five e-mails in any given hour.
• Trap: An alarm action that sends NAM trap message to one or more trap servers. Any trap server
that has the same community string will receive the trap message. The NAM use Cisco Syslog MIB
in the trap message. To avoid trap flooding, the NAM’s limit is ten trap messages per interval.
• Remote syslog: An alarm action that sends syslog messages to remote syslog servers. The NAM’s
limit is ten syslog messages per interval to avoid flooding the network.
• Trigger capture: An alarm action to start or stop a pre-defined capture session.
The NAM supports any combination of the above four actions in one alarm condition.
OL-22617-01
User Guide for the Cisco Network Analysis Module (NAM) Traffic Analyzer, 5.0
2-37
Page 72

Alarms
Chapter 2 Setting Up The NAM Traffic Analyzer
To configure e-mail alarm actions:
Step 1 Choose Setup > Alarms > Actions.
The Alarm Action page displays any configured actions. If none of the four actions (e-mail, trap, capture,
or syslog) are configured, you will see “No data available.”
Step 2 Click the Create button.
Step 3 Enter a Name for the action (up to 63 characters).
Step 4 Choose the type of alarm action:
• Email: The NAM will use the e-mail address configured in Administration > System > E-Mail
Setting. NAM alarm mail is sent as a result of NAM alarms, not router or switch alarms.
The NAM sends up to five e-mails per hour per function (traffic and NDE, voice signaling, RTP, and
application response time). Also, in each e-mail, there could be up to five alarm messages. These
limits are in place to avoid e-mail overload.
If you have configured e-mail alarms and do not receive e-mail, then your NAM does not have any
alarms.
If the NAM is planning to send you many alarm messages, the e-mail may state, for example, “5 of
2,345 alarm messages.”
• Trap: Choose the SNMP community where you would like traps to be sent. The NAM will use the
community configured in Administration > System > SNMP Trap Setting. After the
“Community” field appears, choose the community string from the drop-down list.
• Trigger Captu re: From the Session drop-down, select the session (the list will be empty if there is
no capture session configured in Capture > Packet Capture/Decode > Sessions. Click the “Start”
or “Stop” radio button.
• Syslog: This will log syslog messages. The default setting is to log syslog messages locally to the
NAM. If you want to log syslog messages to remote servers, set up the destination information at
Administration > System > Syslog Setting.
Step 5 Click Submit.
The Alarm Action table displays the newly configured action in its list.
Editing Alarm Actions
To edit an alarm action:
Step 1 Choose Setup > Alarms > Actions.
The Alarm Action table displays any configured Alarms.
Step 2 Choose the alarm event you want to modify, and click the Edit button.
Deleting Alarm Actions
To delete an alarm:
2-38
User Guide for the Cisco Network Analysis Module (NAM) Traffic Analyzer, 5.0
OL-22617-01
Page 73

Chapter 2 Setting Up The NAM Traffic Analyzer
Step 1 Choose Setup > Alarms > Actions.
The Alarm Action table displays any configured Alarms.
Step 2 Choose the alarm event you want to remove, and click the Delete button.
Thresholds
The NAM Traffic Analyzer will inspect incoming performance records and apply a configured set of
thresholds to the most recent interval of data to detect threshold violations. You can use the NAM GUI
to set up alarm thresholds for variables with values that trigger alarms.
Note You could receive two alarms for the same occurrence if both the source and the destination are in the
same site.
The NAM Threshold Alarms window (Setup > Alarms > Thresholds) displays already-configured
thresholds. If you hover over the arrow next to the threshold Name, as shown in
view of the selected threshold will display.
Alarms
Figure 2-4, a detailed
Figure 2-4 NAM Threshold Window and Threshold Details
See Table 2-14, Threshold Configuration for descriptions of the fields on the Threshold screen.
Ta b l e 2-14 Threshold Configuration
Field Description
Name
Ty pe
Application
Site
Host
Name of the threshold.
You can configure eight types of thresholds. See Figure 2-5 for a complete list.
Application associated with this threshold.
Site associated with this threshold.
Host associated with this threshold.
OL-22617-01
User Guide for the Cisco Network Analysis Module (NAM) Traffic Analyzer, 5.0
2-39
Page 74

Alarms
Chapter 2 Setting Up The NAM Traffic Analyzer
Table 2-14 Threshold Configuration
Field Description
Severity
High or Low (user-configured classification). These alarms are displayed on
the Alarm Summary dashboard (Monitor > Overview > Alarm Summary).
You can choose to view High, Low, or High and Low alarms.
Action
Rising action and Falling action (if configured). Alarms are predefined
conditions based on a rising data threshold, a falling data threshold, or both.
Status
“OK” if configuration is complete. Otherwise, the issue will be listed (for
example, “Missing Src Site”).
You can set up alarm thresholds by defining threshold conditions for monitored variables on the NAM
Traffic Analyzer.
Figure 2-5 Create Threshold
Figure 2-5 shows the threshold types you can configure:
To see the specific steps required for setting up a threshold type, choose the type from the list below:
• Setting Host Thresholds, page 2-40
• Setting Conversation Thresholds, page 2-41
• Setting Application Thresholds, page 2-42
• Setting Response Time Thresholds, page 2-43
• Setting DSCP Thresholds, page 2-44
• Setting RTP Stream Thresholds, page 2-45
• Setting Voice Signaling Thresholds, page 2-46
• Setting NDE Interface Thresholds, page 2-47
Setting Host Thresholds
Step 1 Choose Setup > Alarms > Thresholds.
Step 2 Click the Create button and choose the Host tab.
Step 3 The Host Alarm Threshold Configuration window displays. Fill in the fields as appropriate. Table 2-15,
Host Alarm Thresholds describes the fields available on this screen.
Ta b l e 2-15 Host Alarm Thresholds
2-40
Field Description
Name
Site
Give the Host Alarm Threshold a name.
Choose a site from the list. See Sites, page 2-58 for information on setting up a
site.
User Guide for the Cisco Network Analysis Module (NAM) Traffic Analyzer, 5.0
OL-22617-01
Page 75

Chapter 2 Setting Up The NAM Traffic Analyzer
Table 2-15 Host Alarm Thresholds (continued)
Field Description
Host
Application
DSCP
Severity
Actions
Host Metrics
(per second)
Add Metrics
(button)
Delete (button)
Alarms
Choose a host from the list.
You can type in the name of the host if the drop-down list does not contain the
desired host.
Choose an application from the list. You can enter the first few characters to
narrow the selection in the drop-down list.
Choose a DSCP value from the list. You can enter the first few characters to
narrow the selection in the drop-down list.
Choose High or Low. These will display on the Alarm Summary dashboard
(Monitor > Overview >Alarm Summary), where you can choose to view High,
Low, or High and Low alarms.
From the drop-down lists, choose a Rising action and a Falling action (optional).
During threshold creation, by default, the falling action is the same as rising
action. See
Alarm Actions, page 2-36 for information on setting up alarm actions.
Choose the type of metric from the list, and then enter a value for a Rising
threshold and a Falling threshold.
Click the Add Metrics button to add another row.
Click the Delete button to remove that Metrics row.
Note If you leave a selection blank, it means that that parameter will not be considered. If you select
“Any”, it will use any of the selections for that parameter, if encountered.
Step 4 Click Submit to set the thresholds, click Reset to reset the thresholds to their default value, or click
Cancel to remove any changes you might have made.
Step 5 When finished, click Submit.
Setting Conversation Thresholds
Step 1 Choose Setup > Alarms > Thresholds.
Step 2 Click the Create button and choose the Conversation tab.
Step 3 The Conversation Alarm Threshold Configuration window displays. Fill in the fields as appropriate.
Table 2-16, Conversation Alarm Thresholds describes the fields available on this screen.
Ta b l e 2-16 Conversation Alarm Thresholds
Field Description
Name
Application
Give the Conversation Alarm Threshold a name.
Choose an application from the list. You can start typing the first
few characters to narrow the list.
OL-22617-01
User Guide for the Cisco Network Analysis Module (NAM) Traffic Analyzer, 5.0
2-41
Page 76

Alarms
Table 2-16 Conversation Alarm Thresholds (continued)
Field Description
Severity
Choose High or Low. These will display on the Alarm Summary
dashboard (Monitor > Overview >Alarm Summary), where you
can choose to view High, Low, or High and Low alarms.
Source Site/Host
Make a selection from the drop-down lists, or leave as “Any.” See
Sites, page 2-58 for information on setting up a site.
Destination Site/Host
Make a selection from the drop-down lists, or leave as “Any.” See
Sites, page 2-58 for information on setting up a site.
Actions
From the lists, choose a Rising action and a Falling action
(optional). See
Alarm Actions, page 2-36 for information on setting
up alarm actions.
Conversation Metrics (per
second)
Add Metrics (button)
Delete (button)
Choose from one of the six metrics, and then enter a Rising
threshold and a Falling threshold.
Click the Add Metrics button to add another row.
Click the Delete button to remove that Metrics row.
Chapter 2 Setting Up The NAM Traffic Analyzer
Note If you leave a selection blank, it means that that parameter will not be considered. If you select
“Any”, it will use any of the selections for that parameter, if encountered.
Step 4 Click Submit to set the thresholds, click Reset to reset the thresholds to their default value, or click
Cancel to remove any changes you might have made.
Step 5 When finished, click Submit.
Setting Application Thresholds
Step 1 Choose Setup > Alarms > Thresholds.
Step 2 Click the Create button and choose the Application tab.
Step 3 The Application Alarm Threshold Configuration window displays. Fill in the fields as appropriate.
Table 2-17, Application Alarm Thresholds describes the fields available on this screen.
Ta b l e 2-17 Application Alarm Thresholds
Field Description
Name
Site
Application
DSCP
Give the Application Alarm Threshold a name.
Choose a site from the list. See Sites, page 2-58 for information on
setting up a site.
Choose an application from the list. You can start typing the first
few characters to narrow the list.
Choose a DSCP value 0-63, or Any.
2-42
User Guide for the Cisco Network Analysis Module (NAM) Traffic Analyzer, 5.0
OL-22617-01
Page 77

Chapter 2 Setting Up The NAM Traffic Analyzer
Table 2-17 Application Alarm Thresholds (continued)
Field Description
Severity
Actions
Application Metrics (per
second)
Add Metrics (button)
Delete (button)
Note If you leave a selection blank, it means that that parameter will not be considered. If you select
“Any”, it will use any of the selections for that parameter, if encountered.
Alarms
Choose High or Low. These will display on the Alarm Summary
dashboard (Monitor > Overview >Alarm Summary), where you
can choose to view High, Low, or High and Low alarms.
From the lists, choose a Rising action and a Falling action
(optional). See
Alarm Actions, page 2-36 for information on setting
up alarm actions.
Choose Bytes or Packets, and then enter a Rising threshold and a
Falling threshold.
Click the Add Metrics button to add another row.
Click the Delete button to remove that Metrics row.
Step 4 Click Submit to set the thresholds, click Reset to reset the thresholds to their default value, or click
Cancel to remove any changes you might have made.
Step 5 When finished, click Submit.
Setting Response Time Thresholds
Step 1 Choose Setup > Alarms > Thresholds.
Step 2 Click the Create button and choose the Response Time tab.
Step 3 The Response Time Alarm Threshold Configuration window displays. Fill in the fields as appropriate.
Table 2-18, Response Time Thresholds describes the fields available on this screen.
Ta b l e 2-18 Response Time Thresholds
Field Description
Name
Application
Severity
Client Site/Host
Server Site/Host
Give the Response Time Alarm Threshold a name.
Choose an application from the list. You can start typing the first
few characters to narrow the list.
Choose High or Low. These will display on the Alarm Summary
dashboard (Monitor > Overview >Alarm Summary), where you
can choose to view High, Low, or High and Low alarms.
Make a selection from the lists. See Sites, page 2-58 for information
on setting up a site.
Make a selection from the lists, or leave as “Any.” See Sites,
page 2-58 for information on setting up a site.
OL-22617-01
User Guide for the Cisco Network Analysis Module (NAM) Traffic Analyzer, 5.0
2-43
Page 78

Alarms
Chapter 2 Setting Up The NAM Traffic Analyzer
Table 2-18 Response Time Thresholds (continued)
Field Description
Actions
From the lists, choose a Rising action and a Falling action
(optional). See
Alarm Actions, page 2-36 for information on setting
up alarm actions.
Response Time Metrics
Choose a metric from the list, and then enter a Rising threshold and
a Falling threshold. For the Packets and Bytes-related metrics, the
entry is per second. For the time-related metrics, the unit is ms.
Add Metrics (button)
Delete (button)
Note If you leave a selection blank, it means that that parameter will not be considered. If you select
Click the Add Metrics button to add another row.
Click the Delete button to remove that Metrics row.
“Any”, it will use any of the selections for that parameter, if encountered.
Step 4 Click Submit to set the thresholds, click Reset to reset the thresholds to their default value, or click
Cancel to remove any changes you might have made.
Step 5 When finished, click Submit.
Setting DSCP Thresholds
Step 1 Choose Setup > Alarms > Thresholds.
Step 2 Click the Create button and choose the DSCP tab.
Step 3 The DSCP Alarm Threshold Configuration window displays. Fill in the fields as appropriate. Tabl e 2-19,
DSCP Alarm Thresholds describes the fields available on this screen.
Ta b l e 2-19 DSCP Alarm Thresholds
Field Description
Name
Site
DSCP
Severity
Actions
DSCP Metrics (per second)
Add Metrics (button)
Delete (button)
Give the DSCP Alarm Threshold a name.
Choose a site from the list. See Sites, page 2-58 for information on
setting up a site.
Chose a DSCP value from the list.
Choose High or Low. These will display on the Alarm Summary
dashboard (Monitor > Overview >Alarm Summary), where you
can choose to view High, Low, or High and Low alarms.
From the drop-down lists, choose a Rising action and a Falling
action (optional).
Choose one of the metric types from the list, and then enter a Rising
threshold and a Falling threshold.
Click the Add Metrics button to add another row.
Click the Delete button to remove that Metrics row.
2-44
User Guide for the Cisco Network Analysis Module (NAM) Traffic Analyzer, 5.0
OL-22617-01
Page 79

Chapter 2 Setting Up The NAM Traffic Analyzer
Note If you leave a selection blank, it means that that parameter will not be considered. If you select
“Any”, it will use any of the selections for that parameter, if encountered.
Step 4 Click Submit to set the thresholds, click Reset to reset the thresholds to their default value, or click
Cancel to remove any changes you might have made.
Step 5 When finished, click Submit.
Setting RTP Stream Thresholds
Step 1 Choose Setup > Alarms > Thresholds.
Step 2 Click the Create button and choose the RTP Streams tab.
Step 3 The RTP Stream Alarm Threshold Configuration window displays. Fill in the fields as appropriate.
Table 2-20, RTP Streams Thresholds describes the fields available on this screen.
Alarms
Ta b l e 2-20 RTP Streams Thresholds
Field Description
Name
Severity
Give the RTP Streams Alarm Threshold a name.
Choose High or Low. These will display on the Alarm Summary dashboard
(Monitor > Overview >Alarm Summary), where you can choose to view
High, Low, or High and Low alarms.
Codec
Source Site/Host
Choose a Codec from the list.
Make a selection from the drop-down lists, or leave as “Any.” See Sites,
page 2-58 for information on setting up a site.
Severity
Choose High or Low. These will display on the Alarm Summary dashboard
(Monitor > Overview >Alarm Summary), where you can choose to view
High, Low, or High and Low alarms.
Actions
From the drop-down lists, choose a Rising action and a Falling action
(optional). See
alarm actions.
Alarm Actions, page 2-36 for information on setting up
OL-22617-01
User Guide for the Cisco Network Analysis Module (NAM) Traffic Analyzer, 5.0
2-45
Page 80

Alarms
Table 2-20 RTP Streams Thresholds (continued)
Field Description
RTP Stream Metrics
Choose a metric from the list:
• Jitter: Variation of packet arrival time compare to expected arrival time.
• Adjusted packet loss percent: Percent of packet loss which includes
packets actually lost and packets that arrived beyond the NAM
expected buffering capability of the endpoint.
• Actual packet loss percent: Percent of packets that the NAM has never
seen.
• MOS: Mean opinion score that is composed of both jitter and adjusted
packet loss.
• Concealment seconds: Number of seconds in which the NAM detected
packets lost.
• Severe concealment seconds: Number of seconds in which the NAM
detected packets lost of more than 5%.
Enter a Rising threshold and a Falling threshold.
Add Metrics (button)
Delete (button)
Click the Add Metrics button to add another row.
Click the Delete button to remove that Metrics row.
Chapter 2 Setting Up The NAM Traffic Analyzer
Note If you leave a selection blank, it means that that parameter will not be considered. If you select
“Any”, it will use any of the selections for that parameter, if encountered.
Step 4 Click Submit to set the thresholds, click Reset to reset the thresholds to their default value, or click
Cancel to remove any changes you might have made.
Step 5 When finished, click Submit.
Setting Voice Signaling Thresholds
You can set up the NAM to monitor voice call quality. When Cisco Call Manager’s call detail records
option is enabled, Cisco IP phones, both SCCP and SIP, will report the call’s jitter and packet loss at the
end of the call. The NAM intercepts this information and raises an alarm when the alarm condition
crosses the rising threshold.
To set up a voice signaling threshold:
Step 1 Choose Setup > Alarms > Thresholds.
2-46
User Guide for the Cisco Network Analysis Module (NAM) Traffic Analyzer, 5.0
OL-22617-01
Page 81

Chapter 2 Setting Up The NAM Traffic Analyzer
Step 2 Click the Create button and choose Voice Signaling tab.
Step 3 The Voice Signaling Alarm Threshold Configuration window displays. Fill in the fields as appropriate.
Table 2-21, Voice Signaling Thresholds describes the fields available under the Voice Signaling Metrics
drop-down menu.
Ta b l e 2-21 Voice Signaling Thresholds
Field Description
Name
Severity
Actions
Voice Signaling Metrics
Add Metrics (button)
Delete (button)
Alarms
Give the Voice Signaling Alarm Threshold a name.
Choose High or Low. These will display on the Alarm Summary
dashboard (Monitor > Overview >Alarm Summary), where you can
choose to view High, Low, or High and Low alarms.
Choose a Rising action and a Falling action from the lists (optional).
See
Alarm Actions, page 2-36 for information on setting up alarm
actions.
Choose Jitter to enable an alarm when the NAM detects jitter to be
more than the value set here.
Check Packet Loss % to enable an alarm when the NAM detects
Packet Loss percentage to be outside of the values you entered.
Click the Add Metrics button to add another row.
Click the Delete button to remove that Metrics row.
Note If you leave a selection blank, it means that that parameter will not be considered. If you select
“Any”, it will use any of the selections for that parameter, if encountered.
Step 4 Click Submit to set the voice signaling thresholds, click Reset to reset the thresholds to their default
value, or click Cancel to remove any changes you might have made.
Step 5 When finished, click Submit.
Setting NDE Interface Thresholds
Step 1 Choose Setup > Alarms > Thresholds.
Step 2 Click the Create button and choose the NDE Interface tab.
The NDE Interface Alarm Threshold Configuration screen displays. The fields are described in
Table 2-22, NDE Interface Alarm Thresholds.
Ta b l e 2-22 NDE Interface Alarm Thresholds
Field Description
Name
Data Source
Interface
Give the NDE Interface Alarm Threshold a name.
Choose a data source from the list.
Choose an interface from the list.
OL-22617-01
User Guide for the Cisco Network Analysis Module (NAM) Traffic Analyzer, 5.0
2-47
Page 82

Alarms
Chapter 2 Setting Up The NAM Traffic Analyzer
Table 2-22 NDE Interface Alarm Thresholds (continued)
Field Description
Direction
Severity
Choose Ingress or Egress.
Choose High or Low. These will display on the Alarm Summary dashboard
(Monitor > Overview >Alarm Summary), where you can choose to view
High, Low, or High and Low alarms.
Actions
Choose a Rising action and a Falling action from the lists (optional). See
Alarm Actions, page 2-36 for information on setting up alarm actions.
NDE Interface Metrics
(per second)
Add Metrics (button)
Delete (button)
Note If you leave a selection blank, it means that that parameter will not be considered. If you select
Choose Bytes or Packets, and enter a Rising and Falling threshold.
Click the Add Metrics button to add another row.
Click the Delete button to remove that Metrics row.
“Any”, it will use any of the selections for that parameter, if encountered.
Step 3 Click Submit to set the thresholds, click Reset to reset the thresholds to their default value, or click
Cancel to remove any changes you might have made.
Editing an Alarm Threshold
To edit an alarm threshold:
Step 1 Choose Setup > Alarms > Thresholds.
The Thresholds table displays.
Step 2 Select the alarm to edit, then click Edit.
The dialog box displays for the type of alarm; for example, “Host Threshold.”
Step 3 Make the necessary changes.
Step 4 Click Submit to save your changes, click Reset to reset the thresholds to the values set before you edited
them, or click Cancel to cancel the edit and return to the previous page.
Deleting a NAM Threshold
To delete a NAM alarm threshold, simply select it from the Alarms table, then click Delete.
Click OK to confirm deletion, or click Cancel to leave the configuration unchanged.
2-48
User Guide for the Cisco Network Analysis Module (NAM) Traffic Analyzer, 5.0
OL-22617-01
Page 83

Chapter 2 Setting Up The NAM Traffic Analyzer
User Scenario
If you want the NAM to notify you of any violations of Response Time metrics for a particular server,
and then initiate a packet capture, complete the following steps:
Step 1 Set up the e-mail and capture settings.
a. Choose Administration > System > E-Mail Setting to define the e-mail settings.
a. Choose Capture > Packet Capture/Decode > Sessions and create a capture session for this
particular server.
Step 2 Define an Alarm Action.
a. Choose Setup > Alarms > Actions.
b. Click the Create button.
c. Enter a Name.
d. Check the “Email” check box.
e. Check the “Trigger Capture” check box, choose the session you created in Step 1 from the
drop-down menu, and select the Start or Stop radio button.
f. Click the Submit button.
Data Export
Step 3 Define the Threshold for this alarm.
Data Export
a. Choose Setup > Alarms > Thresholds.
b. Click the Create button.
c. Choose the Response Time tab.
d. Give the Response Time Alarm Threshold a Name, and choose the Application and Severity.
e. Choose the server from the Host drop-down list.
f. Choose the action you created in Step 2, define the metrics for the thresholds, and click the Submit
button.
The NAM 5.0 Traffic Analyzer selections for setting up Data Export are:
• NetFlow, page 2-49
• Scheduled Exports, page 2-53
• Custom Export, page 2-55
NetFlow
OL-22617-01
The NAM as a producer of NDE (NetFlow Data Export) packets is a new feature for NAM Traffic
Analyzer 5.0. The NAM’s new functionality of NDE is part of its new NBI.
User Guide for the Cisco Network Analysis Module (NAM) Traffic Analyzer, 5.0
2-49
Page 84

Data Export
Chapter 2 Setting Up The NAM Traffic Analyzer
NetFlow collects traffic statistics by monitoring packets that flow through the device and storing the
statistics in the NetFlow table. NDE converts the NetFlow table statistics into records, and exports the
records to an external device, which is called a NetFlow collector. The NAM sends out NDE packets only
in NDE v9 format.
There are currently six record types (or templates) that NAM exports (four in Core Stats, one in ART):
• Application
• Host
• Client Server Response Time
• Application Conversations
• Network Conversations
• RTP Metrics
The NDE data is exported in a fixed selection of aggregated data records that are shipped with the
product. This part of the NDE descriptor defines what is to be exported:
• Record Type
• Period (in minutes)
• NetFlow options selector
After you select the Record Type, you will make selections for Filters. The purpose of the Filter is to
restrict the set of exported records to the subset matching the filter's conditions;
• Depending on which fields are contained in the specified record type, the filter can specify
conditions on site, application (whenever applicable), and host (or server, or client, depending on
record type)
• The semantics of multiple conditions is conjunctive; for example, if filter specifies “siteA” and
“app1,” then the values in exported records will have to match both “siteA” and “app1.”
• Filter specification is optional, and by default all fields can be assumed as having value of Any
• The host (if applicable, or server, or client, depending on record type) allows multiple values to be
selected. If multiple values are specified, for example “host1, host2”, then the NAM assumes “host1
or host2.”
The following sections describe setting up NetFlow Data Export:
• Viewing Configured NetFlow Exports, page 2-50
• Configuring NetFlow Data Export, page 2-51
• Editing NetFlow Data Export, page 2-53
Viewing Configured NetFlow Exports
Step 1 Choose Setup > Data Export > NetFlow.
2-50
Step 2 The NetFlow Exports screen appears (shown in Figure 2-6).
User Guide for the Cisco Network Analysis Module (NAM) Traffic Analyzer, 5.0
OL-22617-01
Page 85

Chapter 2 Setting Up The NAM Traffic Analyzer
Figure 2-6 NetFlow Exports Screen
Already defined NetFlow Exports will be listed on the screen. If you hover over the “quick view” arrow
icon next to the Record Type, as shown in
NetFlow export will display.
Data Export
Figure 2-4, a detailed view of the filter details of the selected
The fields are described in Table 2-23.
Configuring NetFlow Data Export
To configure NetFlow Data Export, perform the following steps:
Step 1 Choose Setup > Data Export > NetFlow.
Step 2 Click the Create button.
Step 3 At the NetFlow Export Configuration screen, fill in the fields. See Tab le 2-23, NetFlow Exports Fields
for field descriptions.
Ta b l e 2-23 NetFlow Exports Fields
Field Description
Description
Destination IP
Address
Destination Port
A description of the NetFlow Export.
The IP address of the device to be exported to. Only IPv4 addresses are supported.
The port number of the device to be exported to.
Valid characters: 1-9. Length: Min 1, Max 65535.
OL-22617-01
User Guide for the Cisco Network Analysis Module (NAM) Traffic Analyzer, 5.0
2-51
Page 86

Data Export
Table 2-23 NetFlow Exports Fields (continued)
Field Description
Export Record
Ty pe
Export Interval
(min)
The record types supported by NAM for NetFlow are:
• Application
• Host
• ART Client Server Application
• Application Conversations
• Network Conversations
• RTP Metrics
Choose the desired export time interval (1, 5, 10, 15, 30, or 60 minutes).
The Export Interval column values are dependent upon Aggregation intervals.
• Core/media aggregation interval value is utilized for the following record types: Application, Host,
Network Conversation, Application conversation, and RTP Metrics.
• Response Time aggregation interval is utilized for the Client Server Response Time record type.
Options
(button)
The NetFlow option selection contains a set of check boxes. These allow independent selections of on or
off settings for individual NetFlow options, which can be exported in addition to the NDE packets with data
and templates, as follows:
Chapter 2 Setting Up The NAM Traffic Analyzer
Filter
• Mapping of integer application ID values into application names (as strings)
• Mapping of integer site ID values into site names and descriptions (as strings)
If there are several NetFlow Export Descriptors defined for the same destination, then the last user’s
selection of option exports flags is enforced on all descriptor instances that exist for the same export
destination.
After you choose the Export Record Type (above), the Filter menus populate depending on your selection.
• Site: List of created sites for the NAM (configured in Setup > Network > Sites). Select Any to use any
of the selections for that parameter.
Note When you choose a record type with two sites (for example serverSite and clientSite in Client
Server Response Time), the value specified by the filter will apply to either of these fields. If a
certain site is chosen, then the filter will match records having the specified value in any of the site
fields.
• Application: All applications created on the NAM (configured in Setup > Classification >
Applications). Select Any to use any of the selections for that parameter.
• Source: Enter a valid host address (hostname, IPv4 address, IPv6 address, or MAC address). Click the
right arrow to add it to the list of Chosen Sources.
• Destination: Enter a valid host address (hostname, IPv4 address, IPv6 address, or MAC address). Click
the right arrow to add it to the list of Chosen Destinations.
• Host: List of available hosts. Click the right arrow to add it to the list of Chosen Hosts. If more than
one host is selected, the filter will apply to records with the value being one of the selected set.
• Client: Enter a valid host address (hostname, IPv4 address, IPv6 address, or MAC address). Click the
right arrow to add it to the list of Chosen Clients.
• Server: List of available servers. Click the right arrow to add it to the list of Chosen Servers.
2-52
User Guide for the Cisco Network Analysis Module (NAM) Traffic Analyzer, 5.0
OL-22617-01
Page 87

Chapter 2 Setting Up The NAM Traffic Analyzer
Step 4 Click the Submit button to save the configuration, or click the Reset button to clear the fields, or click
the Cancel button to exit the screen without configuration.
Editing NetFlow Data Export
Step 1 Choose Setup > Data Export > NetFlow.
Step 2 Highlight the export you want to edit and click the Edit button.
Step 3 Make the desired changes.
Step 4 Click:
• The Submit button to submit the edits
• The Reset button to clear the changes you made
• The Cancel button to close the dialog box and return to the previous screen.
Data Export
Scheduled Exports
You can set up scheduled jobs that will generate a daily report at a specified time, in the specified
interval, and then e-mail it to a specified e-mail address. You can also obtain a report on the spot clicking
on the Preview button, rather than wait for the scheduled time. This report can also be sent after you
preview it.
At the Setup > Data Exports > Scheduled Export screen, you will only be able to edit or delete an
already-configured scheduled export. The creation of can only be done from a “Monitor” or “Analyze”
screen.
To set up a Scheduled Export:
Step 1 When you are on most screens under the “Monitor” or “Analyze” menus, the Interactive Report is
available on the left side of the screen. Click the Export button in the Interactive Report box.
Step 2 Choose the Export Type (Daily or Weekly).
Step 3 Choose the Export Time (when you would like the report delivered to you): Day and Hour.
Step 4 Choose the Report Time (if Daily) or the Data Time Range (if Weekly). This is the interval of time you
would like measured.
• The Report Time for a daily report is restricted to the current 24 hours.
• The Report Time for a weekly report is always from 17:00 to 17:00, for however many days chosen.
For example:
• If you choose Export Type “Weekly,” Data Time Range “Last 2 Days,” and Export Time: Day
“Wednesday” and Hour “13:00,” the report will show data from Sunday at 17:00 to Tuesday at 17:00.
OL-22617-01
• If you choose Export Time: Day “Wednesday” and Hour “18:00,” the report will show data from
Monday at 17:00 to Wednesday at 17:00.
Step 5 Enter the e-mail address to which you would like the report delivered.
User Guide for the Cisco Network Analysis Module (NAM) Traffic Analyzer, 5.0
2-53
Page 88

Data Export
Note With NAM Traffic Analyzer 5.0, you can only configure one e-mail address.
Step 6 Choose the delivery option (HTML or CSV).
Step 7 Enter the report description, which will appear at the end of the filename of the report delivered to you.
Step 8 Click:
• The Reset button to clear the values in the dialog box
• The Preview button to preview the report
• The Submit button to submit the request for the scheduled job
• The Cancel button to close the dialog box and return to the previous screen
Editing a Scheduled Export
Step 1 Choose Setup > Data Export > Scheduled Exports.
Step 2 Highlight the job you would like to edit.
Chapter 2 Setting Up The NAM Traffic Analyzer
Step 3 Click the Edit button.
Step 4 Modify the information as desired. On this screen, you can only change the Email, Delivery Option
(HTML or CSV), and Report Description.
Step 5 Click:
• The Submit button to submit the request for the scheduled job
• The Reset button to clear the values in the dialog box
• The Cancel button to close the dialog box and return to the previous screen.
Deleting a Scheduled Export
Step 1 Choose Setup > Data Export > Scheduled Exports.
Step 2 Highlight the job you would like to delete.
Step 3 Click the Delete button.
Step 4 Click OK to confirm, or click Cancel to return to the previous screen without deleting the job.
2-54
User Guide for the Cisco Network Analysis Module (NAM) Traffic Analyzer, 5.0
OL-22617-01
Page 89

Chapter 2 Setting Up The NAM Traffic Analyzer
Custom Export
You can enable Custom Export to send response time data to an external reporting console such as
NetQoS SuperAgent.
After you enable Custom Export, you may also want to enable the “Export Passthrough Response Time”
option when creating a WAAS Data Source (Setup > NAM Data Sources > Auto Create).
To enable the NAM to export response time data to an external console:
Step 1 From the NAM GUI, choose Setup > Data Export > Custom Export.
The Response Time Export window displays.
Step 2 Check the Enable Export check box.
Step 3 Enter the IP address of the external reporting console in the IP Address field.
Step 4 Enter the UDP port number of the external console (blank is default).
Step 5 Optionally, click Export Non-WAAS Traffic.
This enables the export of SPAN and other data as well as WAAS traffic.
Step 6 Click Submit to enable traffic export, or click Reset to clear the changes from the screen.
Managed Device
Managed Device
A managed device is the device on which SPAN is configured, and where system health ifTable statistics
are polled via SNMP.
The NAM 5.0 Traffic Analyzer menu selections for setting up Managed Devices are:
• Device Information, page 2-55
• NBAR Protocol Discovery, page 2-57
Device Information
To view the switch information, choose Setup > Managed Device > Device Information. The fields are
described in
Ta b l e 2-24 Switch Information
Field Description
SNMP Test information
Name
Hardware
Supervisor Software Version
System Uptime
Location
Table 2-24, Switch Information.
Displays the IP address of the NAM and the switch that the SNMP test
occurred on.
Name of the switch.
Hardware description of the switch.
Current software version of the Supervisor.
Total time the switch has been running.
Physical location of the switch.
OL-22617-01
User Guide for the Cisco Network Analysis Module (NAM) Traffic Analyzer, 5.0
2-55
Page 90

Managed Device
Table 2-24 Switch Information (continued)
Field Description
Contact
SNMP read from switch
SNMP write to switch
Mini-RMON on switch
Contact name of the network administrator for the switch.
SNMP read test result.
SNMP write test result.
For Cisco IOS devices, displays the status if there are any ports with
Mini-RMON configured (Available) or not (Unavailable).
NBAR on switch
VLAN Traffic Statistics on Switch
Displays if NBAR is available on the switch.
Displays if VLAN data is Available or Unavailable.
Note Catalyst 6500 Series switches require a Supervisor 2 or MSFC2
card.
NetFlow Status
For Catalyst 6500 Series devices running Cisco IOS, if NetFlow is
configured on the switch, Remote export to NAM <address> on port
<number> displays, otherwise the status will display Configuration
unknown.
Chapter 2 Setting Up The NAM Traffic Analyzer
Note For the WS-SVC-NAM-1 and WS-SVC-NAM-2 platforms, SNMPv3 is not required. SNMP
requests and responses are communicated over an internal interface within the chassis, and
SNMPv3 is not used.
This section describes how to set router/managed device parameters.
Note This section applies only to NME-NAM devices (branch routers) and Cisco 2200 Series Appliances.
Step 1 Choose Setup > Managed Device > Device Information.
The Router System Information displays as shown in Table 2-25, Router/Managed Device System
Information.
Ta b l e 2-25 Router/Managed Device System Information
Field Description
Name
Hardware
Managed Device Software
Version
Managed Device System
Uptime
Location
Contact
Managed Device
SNMP v1/v2c RW Community
String
Name of the router.
Hardware description of the router.
Current software version of the router.
Total time the switch has been running.
Physical location of the router.
Name of the network administrator for the router.
IP address of the router.
Name of the SNMP read-write community string configured on the
router
2-56
User Guide for the Cisco Network Analysis Module (NAM) Traffic Analyzer, 5.0
OL-22617-01
Page 91

Chapter 2 Setting Up The NAM Traffic Analyzer
Table 2-25 Router/Managed Device System Information (continued)
Field Description
Verify String
Enable SNMP V3
Mode: No Auth, No Priv
Mode: Auth, No Priv
Mode: Auth and Priv
User Name
Auth Password
Auth Algorithm
Privacy Password
Privacy Algorithm
Managed Device
Verify the SNMP .
Check the check box to enable SNMP Version 3 (with NAM 5.0, you
have the ability to manage devices with SNMPv3). If SNMPv3 is not
enabled, the community string is used.
SNMP will be used in a mode with no authentication and no privacy.
SNMP will be used in a mode with authentication, but no privacy.
SNMP will be used in a mode with both authentication and privacy.
Enter a username, which will match the username configured on the
device.
Enter the authentication password associated with the username that
was configured on the device. Verify the password.
Choose the authentication standard which is configured on the device
(MD5 or SHA-1).
Enter the privacy password, which is configured on the device. Verify
the password.
Enter the privacy algorithm, which is configured on the device (AES
or DES).
Step 2 Click the Test Connectivity button to perform an SNMP test. Click Close when finished.
Step 3 Click Submit to submit the information and close the window.
NBAR Protocol Discovery
Note NBAR is supported on ISR routers and switches with the Catalyst 6500 Supervisor Engine 32
Programmable Intelligent Services Accelerator (PISA) running IOS 12.2(18)ZY (or later).
To set up NBAR Protocol Discovery, choose Setup > Managed Device > NBAR Protocol Discovery.
From the NBAR Protocol Discovery window, you can view the NBAR Status information and enable or
disable NBAR on all interfaces.
You must enable the NBAR Interfaces feature for the NAM to provide information about ethernet ports.
Note If your switch does not support NBAR, a message displays indicating that NBAR is not supported on
your switch.
OL-22617-01
User Guide for the Cisco Network Analysis Module (NAM) Traffic Analyzer, 5.0
2-57
Page 92

Network
Chapter 2 Setting Up The NAM Traffic Analyzer
If NBAR Protocol Discovery is enabled, the NBAR Interfaces window lists known interfaces by name
and type.
Ta b l e 2-26 NBAR Interface Details
Field / Operation Description
Enable
(check box)
Interface
Interface Description
Table 2-26, NBAR Interface Details describes the fields on the screen.
Check indicates that NBAR is enabled.
Name of the interface.
Depending on the IOS running on the Supervisor, port names are displayed
differently.
Newer versions of IOS software display a port name as Gi2/1 to represent a
Gigabit port on module 2 port 1.
In the Virtual Switch software (VSS), a port name might be displayed as
Gi1/2/1to represent a Gigabit port on switch 1, module2, port 1.
Description of the interface.
Network
Sites
To narrow the list of interfaces, choose “Interface Name” or “Interface Description” from the drop-down
list, enter any part of the interface name or description in the text box, and click the Filter button. To
clear the Filter text box, click Clear. To return to showing all interfaces, check the All check box and
click the Submit button.
Check the check box to enable an interface, and then click the Submit button.
The Save button will save the router’s running configuration to startup configuration.
The NAM 5.0 Traffic Analyzer menu selections for setting up the Network are:
• Sites, page 2-58
• NDE Interface Capacity, page 2-63
• DSCP Groups, page 2-64
A site is a collection of hosts (network endpoints) partitioned into views that help you monitor traffic
and troubleshoot problems. If you want to limit the view of your network analysis data to a specific city,
a specific building, or even a specific floor of a building, you can use the Sites function.
2-58
Note If there are multiple data sources configured for the same site, the same traffic may be accounted for
more than once, resulting in inflated traffic statistics. For example, if the NAM is configured to receive
SPAN traffic for a particular site, and also is receiving Netflow records for that same site, they will both
be combined in the traffic statistics. In this case, if you then want to only see the statistics for a particular
data source, you would need to use the Interactive Report window on the left side of the screen to specify
both the Site and Data Source.
User Guide for the Cisco Network Analysis Module (NAM) Traffic Analyzer, 5.0
OL-22617-01
Page 93

Chapter 2 Setting Up The NAM Traffic Analyzer
The site definition is very flexible and can accommodate various scenarios. The site definition is used
not only for viewing of data, but for data export and data retention as well. Normally, a site is defined
by its subnet(s), but a site can also be defined using the following rules:
• Subnet (IP address prefix)
• Subnet from a data source
• Subnet from a given VLAN of a SPAN data source
• WAE device serving the site
The preferred way to define sites is using subnets, and should be used whenever possible.
Note The same rule cannot be defined in multiple sites.
Note If you are configuring a WAAS device, you will need to add WAAS servers to the NAM. See Auto Create
of New WAAS Devices, page 2-35.
See the following sections to set up sites:
• Definition Rules, page 2-59
• Viewing Defined Sites, page 2-60
Network
• Defining a Site, page 2-61
• Editing a Site, page 2-63
Definition Rules
Specifying a Site Using Subnets
Normally, subnets alone are sufficient to define a site. For example:
Site Data-Center = subnet 172.20.0.0/16
In certain scenarios when there are overlapping IP address spaces in the networks (for example, in
private networks where hosts from different sites have the same IP addresses), then data sources or
VLANs can be used to differentiate the subnets. For example:
Site NewYork = subnet 10.11.0.0/16 from "NDE-NewYork" data source.
Site LosAngeles = subnet 10.11.0.0/16 from "NDE-LosAngeles" data source.
Site Sale-Dept = subnet 10.11.0.0/16 from VLAN 10 of "DATA PORT 1" data source.
Site Finance-Dept = subnet 10.11.0.0/16 from VLAN 12 of "DATA PORT 1" data source.
Specifying a Site Using WAE devices (WAAS Data Sources)
For WAAS traffic, you can define a site associated with a WAE device without specifying the site’s
subnets. Simply select all of the WAAS data sources coming from the WAE device(s) serving that site.
Site SanJose = WAE-SJ-Client, WAE-SJ-CltWAN, and WAE-SJ-Passthrough data sources.
OL-22617-01
Note We recommend that you use subnets to specify WAAS-optimized sites. Use this method only if the site’s
subnets cannot be determined.
User Guide for the Cisco Network Analysis Module (NAM) Traffic Analyzer, 5.0
2-59
Page 94

Network
Specifying a Site Using Multiple Rules
You can define a site using a combination of multiple rules described above. For example, if a site has
both optimized and non-optimized traffic, it can be defined using a combination of WAAS data sources
and a subnet from a NDE data source.
When defining a site using multiple data sources, be careful to make sure that those data sources do not
have duplicated traffic to avoid double counting the site traffic statistics.
Resolving Ambiguity (Overlapping Site Definitions)
Conflicting rules are not allowed in site definitions. Of the following two scenarios, the second one is
not allowed.
1.2.3.0/24 from SPAN1 = SiteA
1.2.3.0/24 from SPAN1 = SiteB
Using a prefix is the preferred method. Data source and VLAN are secondary. In the following two
scenarios, the first would receive the higher priority.
1.2.3.0/24 = Site D
WAE1-Client datasrc = Site E
The longest prefix has higher priority (same data source/VLAN). In the following two scenarios, the first
would receive the higher priority.
Chapter 2 Setting Up The NAM Traffic Analyzer
The more refined (specific) rule has higher priority. In the following two scenarios, the first would
receive the higher priority.
Viewing Defined Sites
Step 1 Choose Setup > Network > Sites.
Step 2 The Sites screen appears. Defined sites will be listed in the table.
1.2.3.0/24 from SPAN1 = Site A
1.2.0.0/16 from SPAN1 = Site C
1.2.3.0/24 from SPAN1 = Site A
1.2.3.0/24 (any datasrc) = Site D
2-60
User Guide for the Cisco Network Analysis Module (NAM) Traffic Analyzer, 5.0
OL-22617-01
Page 95

Chapter 2 Setting Up The NAM Traffic Analyzer
The fields on this screen are described in Tab le 2-27, Sites Screen.
Ta b l e 2-27 Sites Screen
Field Description
Name
Description
Rule
Status
Defining a Site
Network
Name of the site.
Description of what the site includes.
Lists the first rule assigned to the selected site. If you see periods
next to the site rule (...), then multiple rules were created for that
site. To see the list of all rules, click the quick view icon (after
highlighting the site, click the small arrow on the right).
Shows if the site is Enabled or Disabled.
The “Definition Rules” section on page 2-59 gives specific information about various scenarios. To set
up a Site or Sites:
Step 1 Choose Setup > Network > Sites.
Step 2 Click the Create button.
Step 3 The Site Configuration window appears. Enter a Name, Description, Subnet, Data Source, and/or VLAN
as appropriate.
OL-22617-01
User Guide for the Cisco Network Analysis Module (NAM) Traffic Analyzer, 5.0
2-61
Page 96

Network
See Figure 2-7 for an example.
Figure 2-7 Site Configuration Screen
Chapter 2 Setting Up The NAM Traffic Analyzer
The fields are defined below in Table 2-28, Site Configuration Screen Fields.
Ta b l e 2-28 Site Configuration Screen Fields
Field Description
Name
Description
Disable Site
(check box)
Unique text string for naming a site.
Optional text string for describing site.
If you check this check box, the NAM will skip this site when classifying traffic. This is useful if the
site is no longer active, but the user would still like to access historical site data in the database.
Otherwise, the user should delete sites that are not needed.
Subnet
IP address subnet (IPv4/IPv6 address and mask); for example, 10.1.1.0/24. Click the blue “i” to get
information about Site Rules.
You can click the Detect button to tell the NAM to look for subnets in the traffic. See the next section,
Subnet Detection.
Data Source
Specify the data source where the site traffic is coming from.
Leave this field blank if the site traffic can come from multiple data sources.
VLAN
Specify the VLAN where the site traffic is coming from.
Note The VLAN selection is not enabled for NDE and WAAS data sources.
Leave this field blank if the site traffic can come from multiple VLANs.
2-62
User Guide for the Cisco Network Analysis Module (NAM) Traffic Analyzer, 5.0
OL-22617-01
Page 97

Chapter 2 Setting Up The NAM Traffic Analyzer
Step 4 Click the Submit button.
Note The “Unassigned” site (with a description of “Unclassified hosts”) includes any that do not
match any of your site configurations. Sites are classified at the time of packet processing.
Subnet Detection
When you click the Detect button at Setup > Network > Sites > Sites Configuration, the NAM will
look for subnets detected within in the past hour. See
the fields.
Ta b l e 2-29 Subnet Detection
Field Description
Subnet Mask
Enter the subnet mask.
Network
Table 2-29, Subnet Detection for information about
Data Source
Interface
Filter Subnets Within Network
Unassigned Site (check box)
When you click the Detect button, the NAM will find those that meet the criteria that you entered.
Editing a Site
You can edit sites that have been created. Note that the “Unassigned' site cannot be edited or deleted.
Step 1 Choose Setup > Network > Sites.
Step 2 Highlight the site that you have configured.
Step 3 Click the Edit button.
Step 4 Edit the desired field.
Step 5 Click Submit to save the changes, or click Reset and OK to reinstate the site’s previous settings, or click
Cancel to cancel any changes and return to the main Sites page.
Note If the bit mask is less than 32, the NAM will detect an IPv4 subnet. If the bit
mask is between 32 and 64, then it will detect an IPv6 subnet.
Choose the data source in which you would like to detect subnets.
Choose the interface in which you would like to detect subnets.
Enter an IPv4 or IPv6 address
The “Unassigned” site includes any that do not match any of your site configurations.
Sites are classified at the time of packet processing.
OL-22617-01
User Guide for the Cisco Network Analysis Module (NAM) Traffic Analyzer, 5.0
2-63
Page 98

Network
NDE Interface Capacity
After you have set up NetFlow data sources (see NetFlow, page 2-18), you can go to the NDE Interface
Capacity screen at Setup > Network > NDE Interface Capacity to specify the speed of each interface.
This allows the NAM to calculate interface utilization on the NDE Interface Traffic Analysis screen
(Analyze > Traffic > NDE Interface). Otherwise, the NAM can only display the throughput of the
interface, but cannot show its utilization.
You can click Edit to edit the interface. You can edit the name (for example, WAN link to Boston) and
speed of the interface.
The interface name and speed will be automatically discovered by the NAM if you configure the router’s
SNMP credentials in Setup > NAM Data Sources > Create > Type: NETFLOW.
Creating an NDE Interface
To add an interface, at the NDE Interface Capacity screen (Setup > Network > NDE Interface
Capacity), click the Add button. Then fill in the fields as described in
Chapter 2 Setting Up The NAM Traffic Analyzer
Table 2-30, Add NDE Interface.
Note It is normally not necessary to manually create NDE interfaces. They will be discovered automatically
DSCP Groups
when the device sends NDE packets to the NAM.
Ta b l e 2-30 Add NDE Interface
Field Description
Device
ifIndex
ifName
ifSpeed(Mbps)
Differentiated services monitoring (DiffServ) is designed to monitor the network traffic usage of
Differentiated Services Code Point (DSCP) values. To monitor DSCP, you must configure at least one
aggregation profile, and one or more aggregation groups associated with each profile. This section
describes how to set up the DSCP groups.
You can define two or three different groups of traffic, and assign the various DSCP values to each group.
Or you can assign one particular value for the first group and give it a name, and then assign all the rest
to the other (or default) group and give that a name.
For detailed information about setting DSCP values, see Implementing Quality of Service Policies with
DSCP:
http://www.cisco.com/en/US/tech/tk543/tk757/technologies_tech_note09186a00800949f2.shtml
Enter the IPv4 or IPv6 address.
Unique identifying number associated with a physical or
logical interface. Valid characters: 0-9.
Name of the interface. Valid characters are A-Z, a-z, 0-9
An estimate of the interface’s current bandwidth in bits per
second.
2-64
User Guide for the Cisco Network Analysis Module (NAM) Traffic Analyzer, 5.0
OL-22617-01
Page 99

Chapter 2 Setting Up The NAM Traffic Analyzer
These topics help you set up and manage the DSCP groups:
• Creating a DSCP Group, page 2-64
• Editing a DSCP Group, page 2-66
• Deleting a DSCP Group, page 2-66
Creating a DSCP Group
To create a DSCP Group:
Step 1 Choose Setup > Network > DSCP Groups.
The DSCP Groups table displays.
Step 2 Click the Create button.
The DSCP Group Configuration window displays.
Step 3 Fill in the fields as described in Table 2-31, DSCP Group Setup Dialog Box.
Ta b l e 2-31 DSCP Group Setup Dialog Box
Network
Field Description Usage Notes
Name
Name of the profile. Enter the name of the profile you are creating. The maximum is 64
characters.
Label Format
DSCP DSCP numbers from 0 to 63. After selecting the DSCP radio button,
you can freely choose any of the 64 possible values and assign them
to Groups.
AF / EF / CS Assured Forwarding (AF) guarantees a certain amount of bandwidth
to an AF class and allows access to extra bandwidth,
Expedited Forwarding (EF) is used for traffic that is very sensitive
to delay, loss and jitter, such as voice or video traffic.
Class Selector (CS) the last 3 bits of the 6-bit DSCP field, so these
correspond to DSCP 0 through DSCP
Bit Field Six bits in the IP header of a packet. See Table 2-32.
Table 2-32, DSCP Group Label Formats shows the available formats and associated values.
Ta b l e 2-32 DSCP Group Label Formats
DSCP Format (DSCP 0
through DSCP 63)
AF/EF/CS Format Bit Field Format
DSCP 0 - 000000
DSCP 8 CS1 001000
DSCP 10 AF11 001010
DSCP 12 AF12 001100
DSCP 14 AF13 001110
DSCP 16 CS2 010000
7.
OL-22617-01
User Guide for the Cisco Network Analysis Module (NAM) Traffic Analyzer, 5.0
2-65
Page 100

Classification
Chapter 2 Setting Up The NAM Traffic Analyzer
Table 2-32 DSCP Group Label Formats (continued)
DSCP Format (DSCP 0
through DSCP 63) AF/EF/CS Format Bit Field Format
DSCP 18 AF21 010010
DSCP 20 AF22 010100
DSCP 22 AF23 010110
DSCP 24 CS3 011000
DSCP 26 AF31 011010
DSCP 28 AF32 011100
DSCP 30 AF33 011110
DSCP 32 CS4 100000
DSCP 34 AF41 100010
DSCP 36 AF42 100100
DSCP 38 AF43 100110
DSCP 40 CS5 101000
DSCP 46 EF 101110
DSCP 48 CS6 110000
DSCP 56 CS7 111000
Step 4 Click Submit to save your changes, or click Reset to cancel.
Editing a DSCP Group
To edit a DSCP group:
Step 1 Choose Setup > Network > DSCP Groups.
The DSCP groups window displays.
Step 2 Select the profile to edit, then click Edit.
Step 3 Make the necessary changes, then click Submit to save your changes, or click Reset to cancel.
Deleting a DSCP Group
To delete one or more DSCP groups, simply select the profiles from the DSCP Groups table, then click
Delete.
Classification
2-66
In Network Analysis Module release 5.0, the RMON-based protocol directory is replaced with a new
application ID classification system. When defining applications, you will be able to view and select
from a list of candidate IP addresses and port numbers for the traffic being analyzed.
User Guide for the Cisco Network Analysis Module (NAM) Traffic Analyzer, 5.0
OL-22617-01
 Loading...