

Page 1

Navini Networks, Inc. Ripwave Base Station I&C Guide
Export BTS Data
After successfully calibrating a BTS and before performing the calibration verification
procedure, export the BTS configuration data to a text file. This is done by highlighting the
specific BTS in the Configuration and Alarms Manager (CAM) window, and on the Main Menu
select File > Export BTS Data. This text file will be used as input by the “IC Closeout Tool”
(Part Number 40-00217-00), shown in Appendix V.
Perform the Calibration Verification Procedure
Base Station Calibration Verification is a set of procedures to verify that the equipment has
passed calibration and that the RF portion of the equipment is operating within acceptable
parameters. The results of the tests should be documented in the Base Station Calibration
Verification Form, which is part of the “IC Closeout Tool” (Part Number 40-00217-00).
This procedure is described in Appendix Q.
Single Antenna Element Test
The object of the RFS Single Antenna Element Test Procedure is to verify the functionality of
each antenna element in the Ripwave Radio Frequency Subsystem (RFS). The 8 antenna
elements work together to create the beam forming effect that results from using a Smart
Antenna - Phased Array technology. Using 8 combined antenna elements concentrates the beam
of radiation, adding up to 9 dB of gain, both in the downlink and in the uplink
In the downlink there is an additional 9 dB of gain because there are 8 antenna elements
transmitting simultaneously in the RFS. This gain is not available in the uplink because there is
only one antenna element transmitting at any time in the Modem.
In a Non-TTA BTS, each antenna element has an associated Low Noise Amplifier (LNA) in the
RFS and a Power Amplifier (PA) in the RF Shelf of the BTS. In a TTA BTS, each antenna
element has an associated PA in the RFS and an RF Converter (RFC) in the BTS shelf. In order
to verify that each individual antenna element is working properly, we have to power off the
LNA/PA/RFCs for all the antenna elements, then turn them on individually one at a time and
verify that a test Modem can communicate with the base station through that single antenna
element (Appendix R
).
Install & Test Customer EMS Operations
If you have been using a Test EMS up to this point, you will now need to install and test the
customer’s EMS server. This involves installing the EMS Server and Client on a computer that is
connected through the system backhaul. When connecting the Ripwave equipment to the
98
Page 2

Navini Networks, Inc. Ripwave Base Station I&C Guide
backhaul, refer to the Regulatory Information in Chapter 1, Page 8 – specifically regarding
cabling to Ethernet or T1/E1 backhauls. Ethernet connections require a UL497B listed protection
device to be installed between the BTS and the first network device. T1/E1 connections must be
routed from the BTS through a UL497 listed protection device at the demarcation point. The
interconnect cables for T1/E1 backhauls must be a minimum #26 AWG wire, in accordance with
NEC/CEC standards. If the customer’s EMS is already installed and has been used for testing
purposes, skip to the “Verify System Performance” section of this chapter.
Install EMS Software
The EMS software installation procedures can be found in the EMS Software Installation Guide,
P/N 40-00017-00. After installing the EMS Server and Client applications, the EMS needs to be
configured with the settings that are designated for the Base Station. The settings are found in the
Network Architecture Plan provided by the customer.
Ensure connection between the Base Station and the backhaul. The connection to the Base
Station will be either an Ethernet connection or T1 connections.
Verify EMS to Base Station Connectivity
Follow the steps below to ensure the EMS and Base Station can communicate.
Step 1. Open a Command Prompt window on the computer where the EMS is installed.
Step 2. Ping the Base Station using the CLI command ping <base station ip address>. Verify
that a reply from the Base Station is received.
Perform Calibration Using Customer’s EMS
This step is necessary only if you have been using a Test EMS up to this point. You will need to
install the customer’s EMS server and software. Calibrate the Base Station using the customer’s
EMS. Follow the same calibration procedures described earlier in this chapter, Calibrate the Base
Station. Perform the procedure three times and make sure that the results are stable (±3).
99
Page 3

Navini Networks, Inc. Ripwave Base Station I&C Guide
Verify System Performance
Location (FTP) Test
Location Tests are performed to see if the system file transfer functions are working as predicted
between Modem and Base Station. First you perform three uploads and three downloads from
one locations in line-of-sight (LOS) with the Base Station at a distance of about 2 km. Then you
perform three uploads and three downloads at several additiona locations in either line-of-sight
or non-line-of-sight (NLOS) with the Base Station. The number recommended number of
additional locations is 4 for panel antennas and 7 for Omni antennas.
The Location (FTP) Test procedure is described in Appendix S
data is contained in the “IC Closeout Tool” (Part Number 40-00217-00).
The results are sent to Navini Networks Technical Support for evaluation
. The form used to collect the
Drive Study
The Drive Study is performed to verify if the system’s coverage area is as predicted and, if
necessary, to fine-tune the RF model.
The procedure is described in Appendix T. The form used to collect the data is contained in the
“IC Closeout Tool” (Part Number 40-00217-00).
You will perform the Drive Study by driving back and forth through a sector, staying on major
roads about a kilometer apart. Special attention has to be paid to the null and fringe areas. You
will follow this scheme for each sector in the site, recording the results of all tests. The test
results will be sent for evaluation, along with the Location (FTP) test results, to Navini Networks
Technical Support. If the results are not adequate, Technical Support will have you adjust some
of the RF parameters and perform the Drive Study again.
Verify System Operation With Multiple Modems
Set up three computers with Modems connected to them. Perform file transfers from all three
computers to verify Base Station operation.
100
Page 4

Navini Networks, Inc. Ripwave Base Station I&C Guide
Back Up EMS Database
After all system installation and commissioning activities are complete, perform a backup of the
EMS database. The procedure can be found in the EMS Administration Guide. Place the backup
files on a different system server where they will be periodically backed up on a tape drive.
Customer Acceptance
To conclude the installation and commissioning activities, gather all of the required documents
and forms from the installation and commissioning procedures to create a comprehensive system
I&C package. Refer to Appendix U for a summary of the documentation package. The customer
and Navini Networks will sign the Customer Acceptance Form. A copy of this form is provided
in Appendix W. The signed form and the system I &C package are provided to the customer.
The original, signed Customer Acceptance Form and system I &C package are stored in the
Navini Networks Technical Support database.
101
Page 5
Navini Networks, Inc. Ripwave Base Station I&C Guide
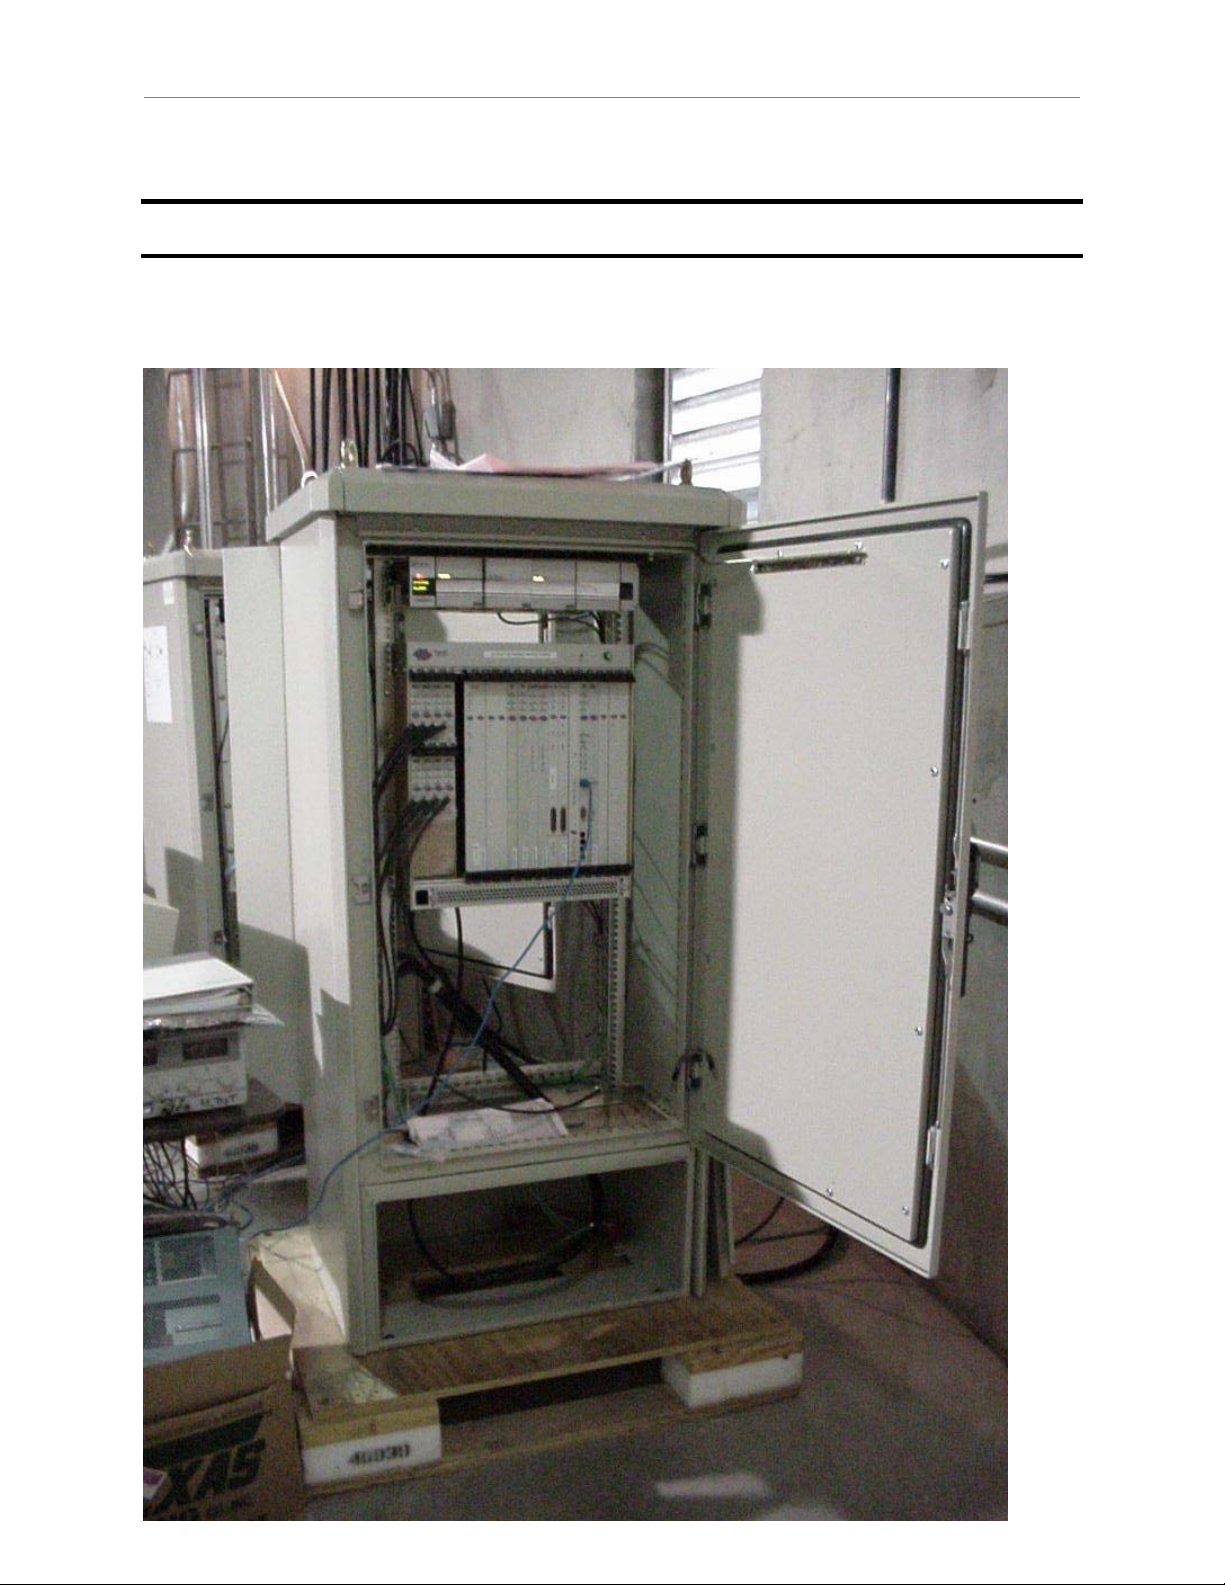
Appendix C: BTS Specifications
Figure C7: TTA Digital Chassis (Front)
102
Page 6
Navini Networks, Inc. Ripwave Base Station I&C Guide
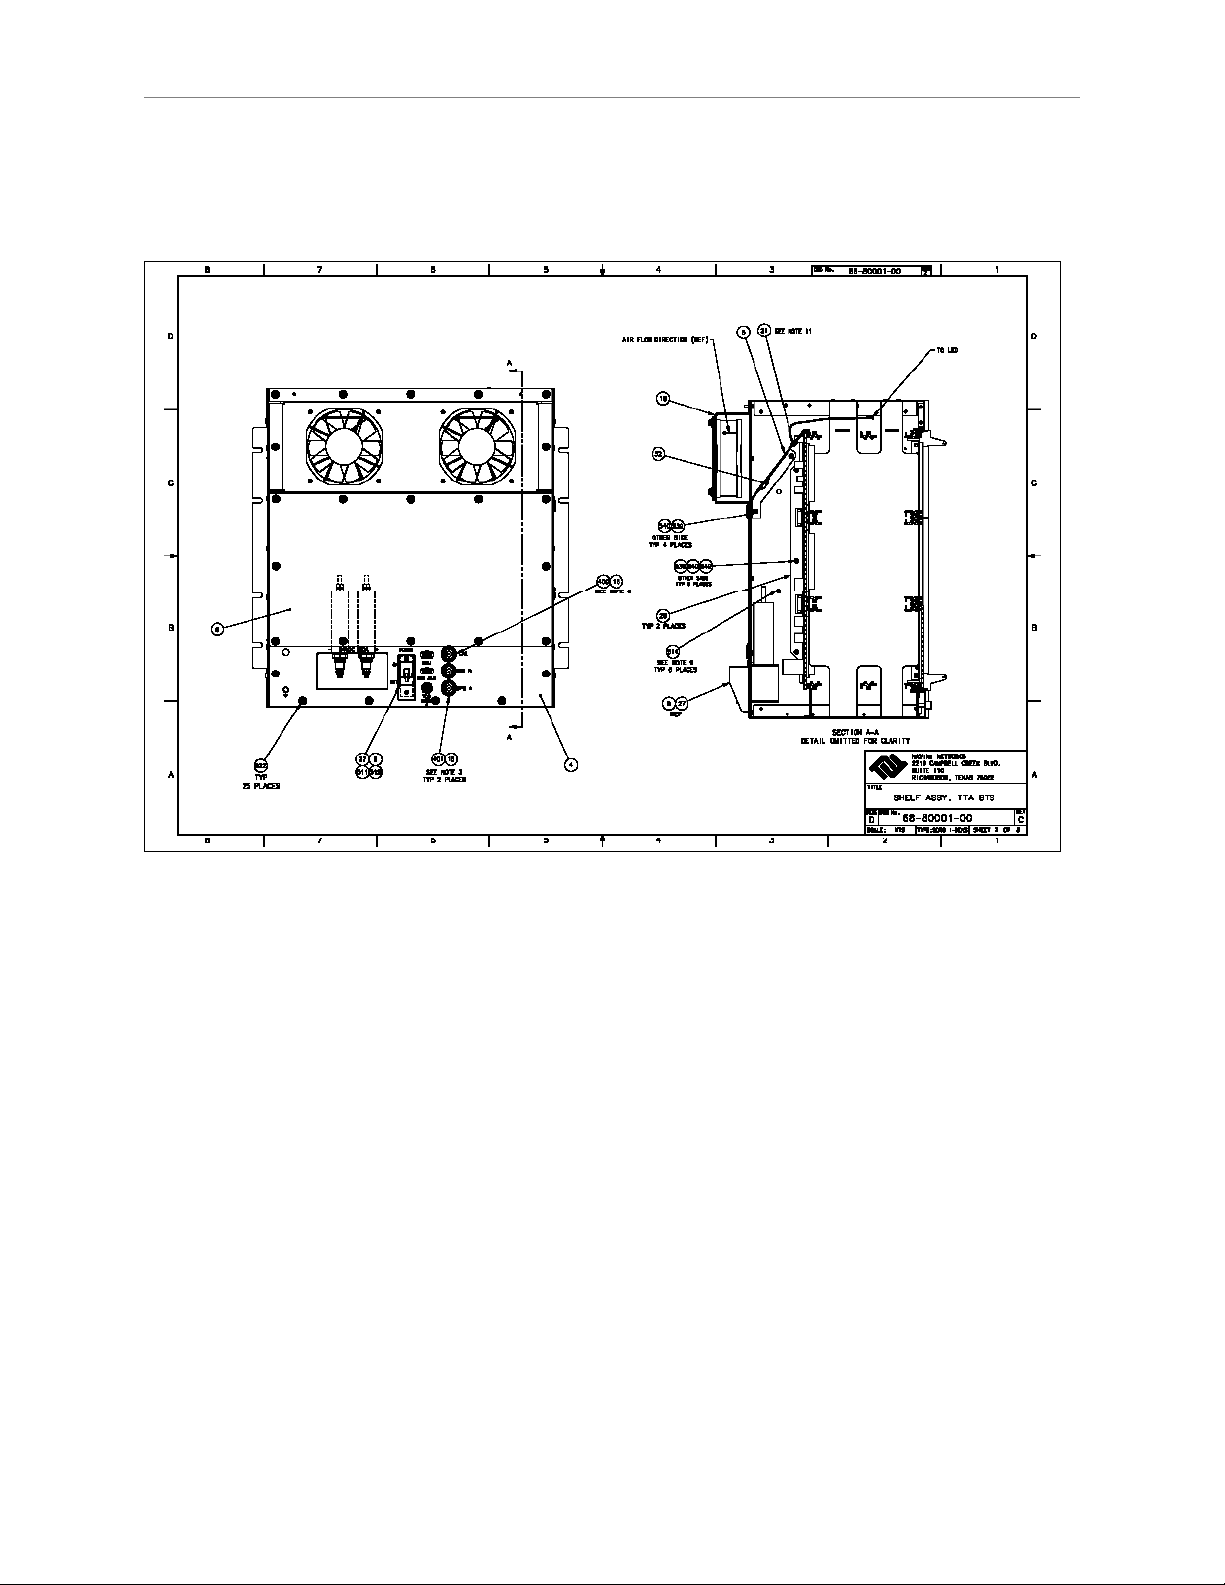
Figure C8: TTA Digital Chassis (Back)
103
Page 7
Navini Networks, Inc. Ripwave Base Station I&C Guide
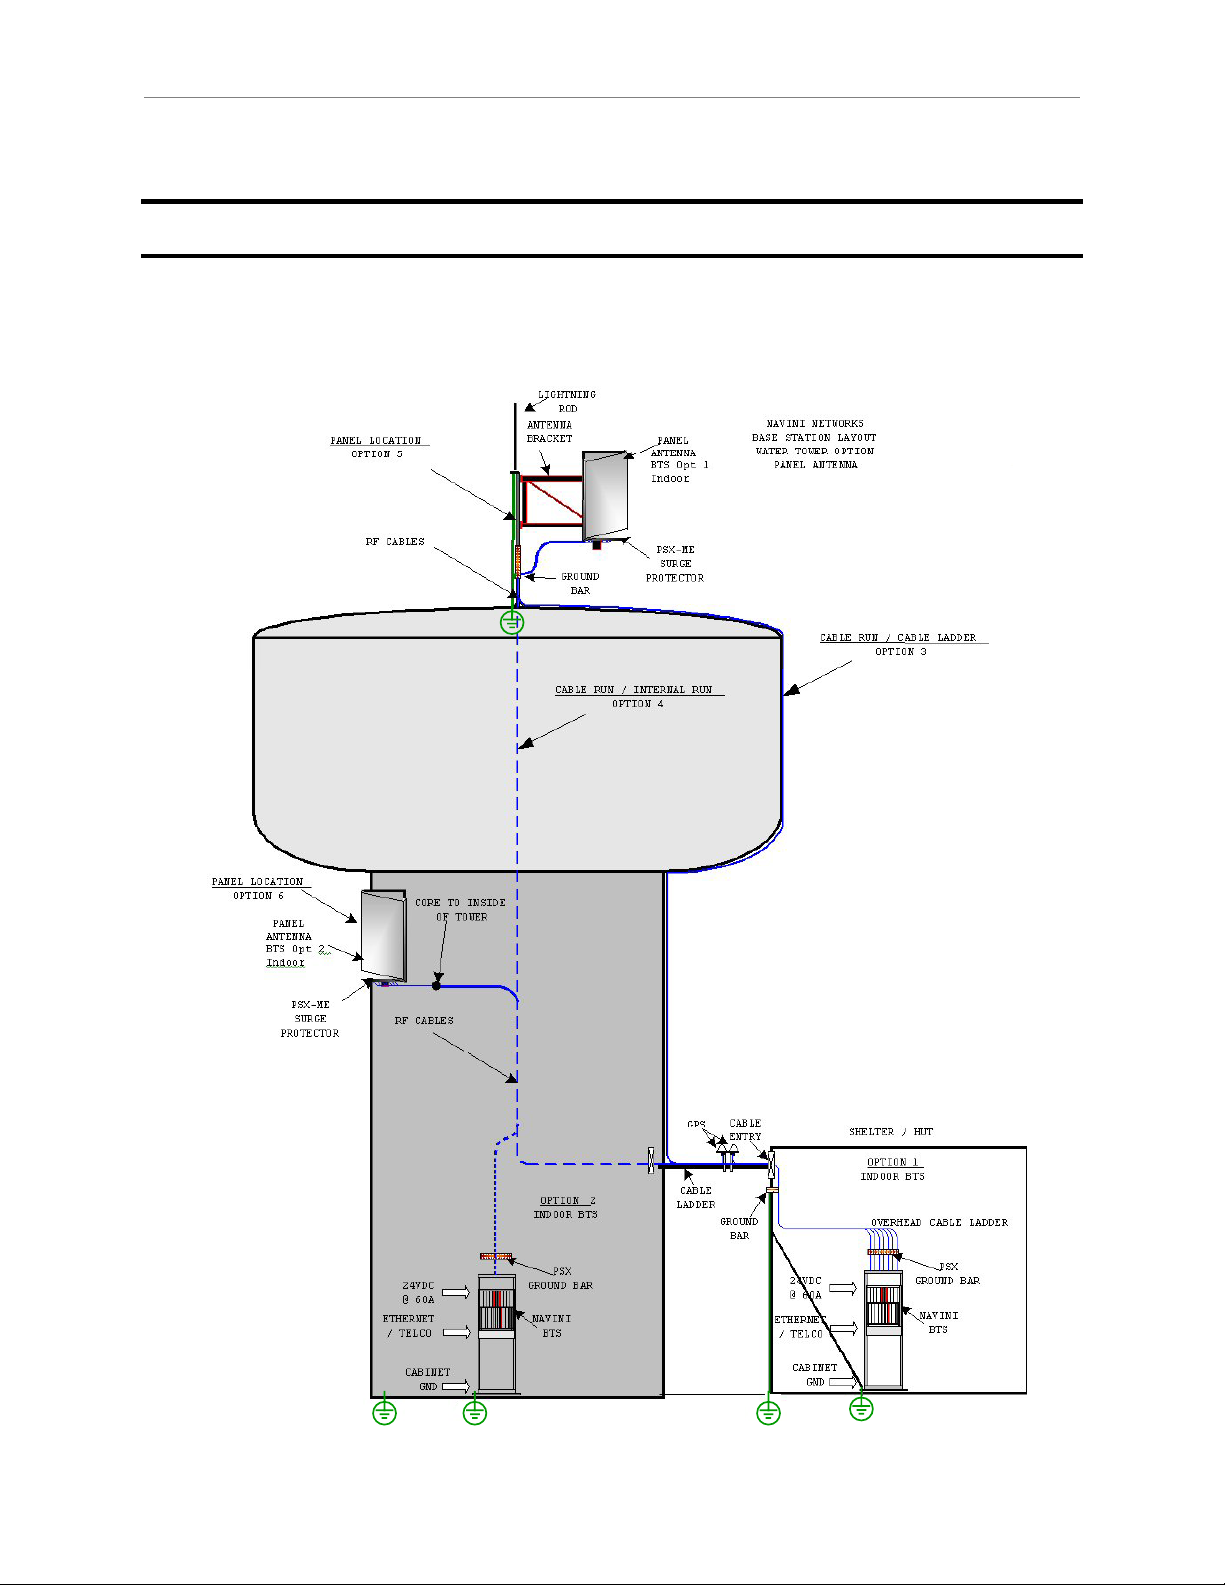
Appendix G: Sample Base Station Drawing
Figure G1: Sample Base Station Drawing
104
Page 8

Navini Networks, Inc. Ripwave Base Station I&C Guide
NOTE
1.CABLE BUNDLE CONSIST OF 9 RF CABLES AND 1 POWER/DATA CABLE
2.RF CABLE TYPE TO BE DETERMINED BASED ON RUN LENGTH AND DB
LOSS/FT
3.CABLE HANGERS TO BE SPECIFIED/RECOMMENDED BY TOWER CREW
4.ANTENNA BRACKET TO BE SUPPLIED BY CUSTOMER AS RECOMMENDED BY
TOWER CREW
5.BTS REQUIRES 24VDC @ 60A.
6.PSX-ME SURGE PROTECTORS TO BE INSTALLED IN-LINE BETWEEN RF
CABLE AND ANTENNA
7.PSX SURGE PROTECTOR TO BE MOUNTED ON GROUND BAR CLOSE TO BTS
CABINET/CHASSIS
8.ETHERNET/TELCO BACKHAUL TO BE PROVIDED BY CUSTOMER
9.ALL INSTALLED EQUIPMENT/MATERIALS MUST BE PROPERLY GROUNDED
10.OPTION 1 IS FOR AN INDOOR BTS INSTALL, OPTION 2 IS FOR
OUTDOOR BTS
CUSTOMER
SITE NAME
LOCATION
1 PANEL L OCATION OP TI O N 5 =DOME TOP 6=S IDE
2
ANTENNA BRACKET TYPE
3
PSX-M E SURGE PROTECTOR PCS
4
ANTENNA AZIMUTH
5
ANTENNA HEIGH T
6
ANTENNA DOWNTIL T
7
TOWE R JUMPER LENGTH
8
TOWER JUMPER CABLE TYPE
DEGREES
FEET
M AIN FEEDER TYPE
9
M AIN FEEDER LENGTH
10 FEET
GRO UND BUS S BAR
11 PC S
CABLE HANGER TYPE
12
WEATHERPROOFI NG KIT
13 PC S
14 GRO UNDING CABL E LENG T H FEET
15 PC S
GRO UNDING KI T
16 PC S
HOISTING GRIP
17
GPS M OUNT
18 GPS CABLE LENGTH FEET
19 GPS CABLE TYPE
20 LOCATION OPTION 1=SHELTER 2=INSIDE TOWER
21 CABLE RUN OPTIO N 3= E XTE RNAL 4=I NTERNAL
22 JUM PER CABLE LENGTH FEET
23 JUM PER CABLE TYPE
24 PSX SURGE PROTECTOR PCS
25 GPS SURGE PROTECTOR PCS
26 ALT GROUND BUS S BAR P CS
27 24VDC/60A POWER SUPPLY
28 INDO OR RACK/CABINET
105
Page 9

Navini Networks, Inc. Ripwave Base Station I&C Guide
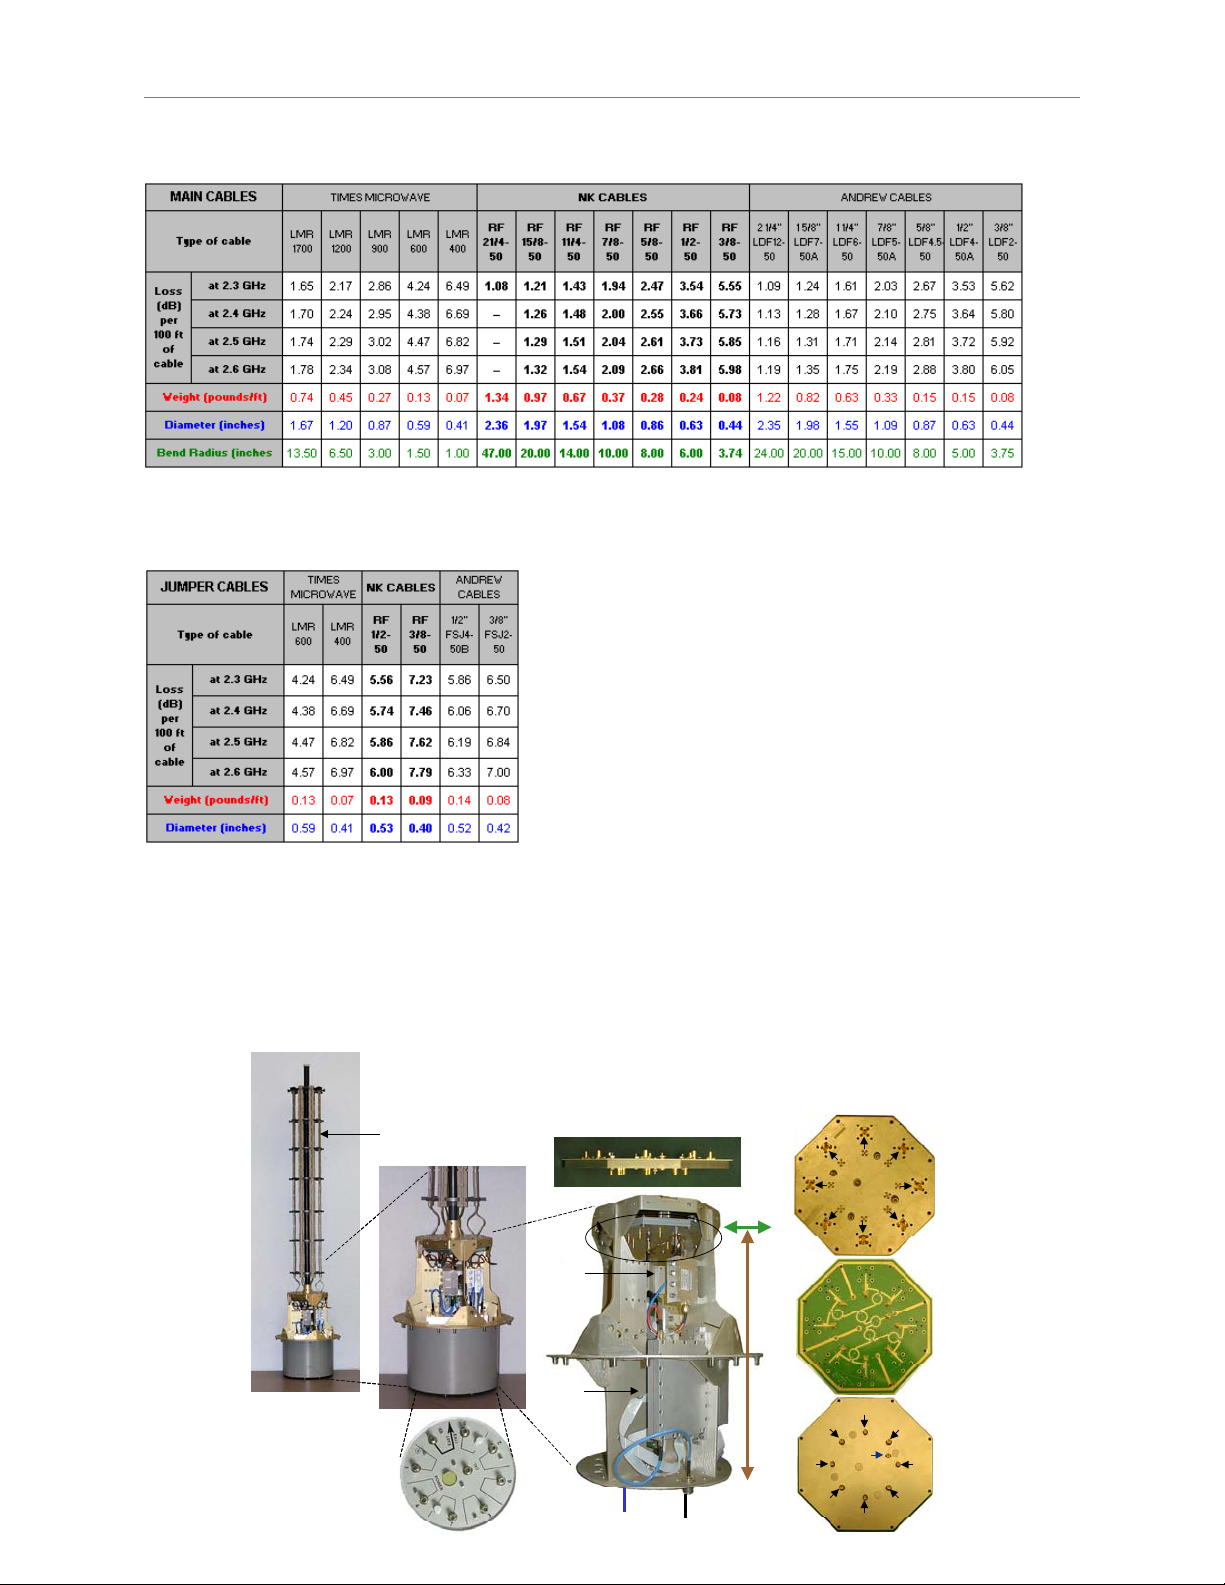
Appendix H: Antenna Power & Cable Selection
Non-TTA Systems
Overview
There are 3 types of cables that are part of a non-TTA Base Station installation: antenna (RF)
cables, calibration (CAL) cable, and data/power cable (not used with the TTA systems). In
addition both the RF and CAL cables are made of a longer Main segment, which typically
consists of a low-loss but heavier and less rigid cable and two shorter Jumper cables (one
connecting the Main segment to the RFS and the other connecting the main segment to the BTS),
which typically have a higher loss, but are lighter and more flexible.
The RF cables are eight coaxial cables that carry RF signals between the BTS and the RFS. The
CAL cable is a single coaxial cable that provides a common second path for the RF signals
between the BTS and the RFS for system calibration.
The RF cable paths and the CAL cable path are interconnected through the Cal Board located in
the RFS. The Cal Board introduces a loss of 27 to 31 dB between the common Cal Cable path
and each RF Cable path. As a result of this, most of the power sent to or received at the antenna
elements travels through the RF Cable paths, and only a small fraction of it is derived to the CAL
Cable path.
The purpose of this section is to describe the calculations used to determine the combinations of
Main and Jumper Cables that are adequate for a particular system. This determination is made
taking into consideration the operating frequency band of the system, the maximum output
power that the RF/PA cards can deliver, the maximum and minimum power level that the SYN
card can output or accept as input during calibration, the losses introduced by the cables and the
different system components that the RF signal must go through, etc. I some cases the number
of subcarrriers, whether FCC regulations apply, whether a Standard Filter in the back of the BTS
is used or not, the weight of the cables on the tower and the bent radius of the main cables must
also be taken into consideration.
The calculations described in this section are performed automatically by an Excel spreadsheet.
It is assumed here that the same combination of Main and Jumper cables will be used for the RF
and CAL paths.
The power and data cable is only taken into consideration if the weight of the cables on the tower
must be kept below a certain allowed maximum.
106
Page 10

Navini Networks, Inc. Ripwave Base Station I&C Guide
An excel program (P/N 40-00219-00) is provided to perform all the necessary calculations
automatically
Data Input
The Cable selection procedure requires the following data to be entered in the green fields of the
spreadsheet:
Figure H1 – Data Input
Operating Frequency Band – Select one of the following:
2.3 GHz (6 sub-carriers)
2.3 GHz (10 sub-carriers)
2.4 GHz (combo chassis)
2.5 GHz
2.6 GHz (split chassis)
2.6 GHz (combo chassis)
Regulatory Body:
FCC, European, or Other
Type of RFS
Units
:
:
Omni or Panel
Active or Passive
US or Metric (that is: lb/ft/in or kg/m/cm)
107
Page 11

Navini Networks, Inc. Ripwave Base Station I&C Guide
Does the system include a Standard Filter in the back of the BTS?
With or Without Standard Filter
Must the system comply with regulatory Requirements regarding the Maximum PA Output?
Yes or No
Length of the Main cable (in feet or meters)
Vertical Drop from the Antenna or Buss Bar (in feet or meters) – This represents how much of
length of each Main cable segment will add its weight on the tower.
Type of Jumper Cable – Select one of the following:
LMR 600 (Times Microwave)
LMR 400 (Times Microwave)
RF 1/2-50 (NK Cables)
RF 3/8-50 (NK Cables)
FSJ4-50B (Andrew Cables)
FSJ2-50 (Andrew Cables)
You can always select another Jumper cable later and repeat the calculations.
Length of the Higher Jumper Cable segments (Main to RFS) in feet or meters
Length of the Lower Jumper Cable segments (Main to BTS) in feet or meters.
Maximum Allowed Weight for All Cables (in pounds or kilograms) – This weight should not be
exceeded by the combination of the following three components:
• the weight of the higher Jumper cable segments
• the weight of the length of the Main Cable segments (8 x RF + CAL) that actually
contributes weight to the tower (estimated as the Vertical Drop)
• the weight of the length of the Power and Data cable that actually contributes weight
to the tower (estimated as the length of one Higher Jumper Cable segment + the Vertical
Drop)
NOTE: If the total weight of all cables on the tower is not an issue, enter a sufficiently large
value in this field (larger than the actual weight of the cables), for example, 3000 lb (1500 kg).
Minimum Required Bend Radius for the Main Cable (in inches)
– This value is important only if
the Main cable will be bent. If this is not an issue, enter a sufficiently large value, for example,
50 inches (130 cm).
Desired TX Power (in dBm)
– This is the level of power that you want to be delivered at the base
of each antenna element.
Desired RX Sensitivity (in dBm)
– This is the level of power at which you want the signal from
the modems to arrive at the base of the antenna elements. This value is defined as the minimum
108
Page 12
Navini Networks, Inc. Ripwave Base Station I&C Guide
level of received power required for successful decoding of the received signal, and should be 11
dB above the noise floor. The mechanism of uplink power control will ensure that the signal
transmitted by each modem arrives at the RFS at the desired level.
Other Input Data Provided by the Spreadsheet Program
Data supplied by the program appears in white fields
Loss & Weight – These are the loss of the selected type of Jumper Cable, in dB per foot (or dB
per meter) and the weight in pounds per foot (or kilograms per meter), respectively.
Back Plane Loss – This is the loss between the SYN card and the point at which the CAL cable
is connected in the back of the BTS. This loss is estimated as 5.0 dB.
Minimum and Maximum Cal Board Loss – These values represent the extremes of the range of
possible losses through the Cal Board (between the point at which the CAL Cable is connected
and the points where each one of the eight RF Cables are connected). There are, therefore, eight
such paths in a Cal Board. The Minumum Cal Board Loss is estimated as 27 dB and the
Maximum Card Board Loss is estimated as 31 dB.
Weight of the Power and Data Cable – Estimated as 0.785 pound per foot (1.168 kg/m).
Gain Per Antenna Element – That is, 12 dB for Omni antennas and 17 dB for Panel antennas.
Internal Data Tables
Three Data tables are used for the calculations:
TABLE H1 - Operating Parameters
TABLE H2 - Main Cable Parameters
109
Page 13
Navini Networks, Inc. Ripwave Base Station I&C Guide
TABLE H3 - Jumper Cable Parameters
Rationale Behind the Formulas
Please refer to Figures H2, H3 and H4 during the following discussion.
Figure H2 – A Look Inside an Omni RFS
Side View
Side View
Filter
Filter
Filter
LNA
LNA
LNA
Side View
Cal
Cal
Cal
Board
Board
Board
Loss
Loss
Loss
RFS Loss
RFS Loss
RFS Loss
Top
Top
Top
Bottom
Bottom
Bottom
RF
RF
RF
RF
RF
RF
RF
RF
RF
RF
Antenna Elements
Antenna Elements
Cavity
Cavity
Cavity
RF
RF
RF
RF
RF
RF
RF
RF
CAL
CAL
CAL
CAL
RF
RF
RF
RF
RF
RF
RF
RF
RF
RF
RF
RF
RF
RF
RF
RF
RF
RF
RF
RF
RF
RF
RF
RF
RF
RF
Bottom
Bottom
Bottom
View
View
View
Cal
Cal
Cal
Cable
Cable
Cable
110
RF
RF
RF
Cable
Cable
Cable
Bottom
Bottom
Bottom
covered
covered
covered
RF
RF
RF
RF
RF
RF
RF
RF
RF
RF
RF
RF
Page 14

Navini Networks, Inc. Ripwave Base Station I&C Guide
Figure H3 – Tx Path Calibration
Cal Board Loss
Cal Cable Loss
Cal Cable Loss
Cal Board Loss
RF
RF
Tx Power at the Antenna
Tx Power at the Antenna
RFS Loss
RFS Loss
RF
RF
RF
RF
RF
RF
Cable
Cable
Loss
Loss
BTS Loss
BTS Loss
(Std Filter or
(Std Filter or
Bypass Cable)
Bypass Cable)
PA Output Power
PA Output Power
Tx Power at the Ant =
Tx Power at the Ant =
PAPAPAPAPAPAPAPA
PAPAPAPAPAPAPAPA
CCMDMCHPIFSYN
CCMDMCHPIFSYN CCMDMCHPIFSYN
PA Output Power
PA Output Power
– BTS Loss
– BTS Loss
– RF Cable Loss
– RF Cable Loss
–RFS Loss
–RFS Loss
SYN Input Power =
SYN Input Power =
Tx Power at the Ant.
Tx Power at the Ant.
– Cal Board Loss
– Cal Board Loss
– Cal Cable Loss
– Cal Cable Loss
– Back Plane Loss
– Back Plane Loss
RF
RF
IF
SYN
SYN
Card
Card
Input
Input
Power
Power
Back
Back
Plane
Plane
Loss
Loss
RF
RF
BB
BB
IF
BB Dig.
BB Dig.
Figure H4 – Rx Path Calibration
Cal Board Loss
Cal Board Loss
Rx Power at the Antenna
Rx Power at the Antenna
LNA Gain
LNA Gain
RF
RF
Cable
Cable
Loss
Loss
CCMDMCHPIFSYN
CCMDMCHPIFSYN CCMDMCHPIFSYN
PAPAPAPAPAPAPAPA
PAPAPAPAPAPAPAPA
BTS Loss
BTS Loss
(Std Filter or
(Std Filter or
Bypass Cable)
Bypass Cable)
PA Input Power
PA Input Power
Rx Power at the Ant =
Rx Power at the Ant =
SYN Output Power
SYN Output Power
– Back Plane Loss
– Back Plane Loss
– Cal Cable Loss
– Cal Cable Loss
– Cal Board Loss
– Cal Board Loss
RF
RF
SYN
SYN
Card
Card
Output
Output
Power
Power
Cal Cable Loss
Cal Cable Loss
Back
Back
Plane
Plane
Loss
Loss
RF
RF
RF
RF
BB
BB
BB
BB
RF
RF
RF
RF
IF
IF
Dig.
Dig.
111
Page 15

Navini Networks, Inc. Ripwave Base Station I&C Guide
There are upper and lower limits to the TX Power and RX Sensitivity to which a BTS can be set.
One of the two conditions that determine the Maximum amount of power that can be delivered at
the antenna elements (Max TX Power1) is how much power can be output by the each one of the
PAs. The losses in the RF paths are: (1) the BTS Loss introduced by the Standard Filter, if used,
or by the Bypass Cable, if no filter is used; (2) The loss on the RF Cable (Main + Higher and
Lower Jumper cables + 6 terminators and lightening arrestors, estimated as 0.6 dB); and (3) the
loss at the base of the RFS, between the N-type connectors where the RF & Cal cables are
connected and the SMA connectors at the bottom of the Cal Board.
Max Tx Power1 = Max PA Output
– BTS Loss [Formula 1]
– RF Cable Loss
– RFS Loss
The other condition is related to the Calibration process. During the calibration of the TX paths
(one at a time), a fraction of the power delivered by the a PA to the corresponding antenna
element is derived through the Cal Board to the common CAL cable and through the BTS back
plane until it arrives at the SYN card. The Calibration process requires that the Input Power
received by the SYN card be in a certain range. Lets find a formula for the Max TX Power2
(power at the antenna elements) that would allow the system to be calibrated. Above this level
the input power received by the SYN card would be over the maximum allowed.
Therefore,
Max SYN Card Input = Max Tx Power2
– Min Cal Board Loss
– CAL Cable Loss
– Back Plane Loss
or
Max Tx Power
= Max SYN Card Input
2
+ Min Cal Board Loss [Formula 2]
+ CAL Cable Loss
+ Back Plane Loss
As both conditions must be satisfied, we take the most restrictive one, that is, the one that
produces the lower value:
Max Tx Power = Min { Max Tx Power
, Max Tx Power2 } [Formula 3]
1
Substituting the Min SYN Card Input for the Max SYN Card Input and the Min Cal Board Loss
for the Max Cal Board Loss in Formula 4 we get the formula for the Min TX Power (at the
antenna elements) that allows the system to be calibrated. Below this level the input power
received by the SYN card would be less than the minimum required.
112
Page 16

Navini Networks, Inc. Ripwave Base Station I&C Guide
Min Tx Power= Min SYN Card Input
+ Max Cal Board Loss [Formula 4]
+ CAL Cable Loss
+ Back Plane Loss
Let’s now determine the maximum and minimum RX Sensitivity at which the BTS can be
calibrated. During the RX Paths calibration, the SYN card generates an RF signal that must
travel to (and suffer losses at) the BTS Back Plane, the CAL Cable, and the Calibration Board
before it arrives at the base of the antenna elements. The maximum and minimum level of power
that can be delivered at the antenna elements during this simulated reception (that is, the possible
range for the RX Sensitivity) are determined, respectively, by the maximum and minimum level
of the signal output by the SYN card. Setting the RX Sensitivity outside this range will make the
system impossible to calibrate.
Max Rx Sensitivity = Max SYN Card Output
+ Min Cal Board Loss [Formula 5]
+ CAL Cable Loss
+ Back Plane Loss
Min Rx Sensitivity = Min SYN Card Output
+ Max Cal Board Loss [Formula 6]
+ CAL Cable Loss
+ Back Plane Loss
Notice that when determining maximum power levels (formulas 3 and 5) we assume the Cal
Board path that introduces the minimum possible loss (27 dB), while when determining
minimum power levels (formulas 4 and 6) we assume the Cal Board path that introduces the
maximum possible loss (31 dB).
The Procedure
1. Eliminate the Main Cables with Bend Radius exceeding the minimum required
Compare the Bend Radius for each type of Main Cable (last row in Table I2) with the Minimum
Required Bend Radius given as input data. Eliminate from further consideration the Main
Cables that have a Bend Radius exceeding the minimum required.
2. Eliminate combinations of cables that weight too much
Calculate the weight of the Higher Jumper cable for the selected type of Jumper Cable
Weight of Higher Jumper Cable= [Formula 7]
Length of the Higher Jumper Cable
× Weight of one foot of the Selected type of Jumper Cable
113
Page 17

Navini Networks, Inc. Ripwave Base Station I&C Guide
Calculate the weight of the section of main Cable hanging from the tower for each type Main
cable.
Weight on Tower of one type of Main Cable = [Formula 8]
Vertical Drop
× Weight of one foot of that type of Main Cable
Calculate the weight of the power and data cable
Weight of a P&D Cable = [Formula 9]
(Length of the Higher Jumper Cable
+ Vertical Drop)
× Weight of one foot of P&D Cable
Calculate the weight of all cables on the tower for each type Main cable
Weight of All Cables = [Formula 10]
(Weight of Higher Jumper Cable
+ Weight on Tower of one type of Main Cable) × 9
+ Weight of P&D Cable
Eliminate for further consideration the cable combinations that exceed the maximum allowed
weight for all cables.
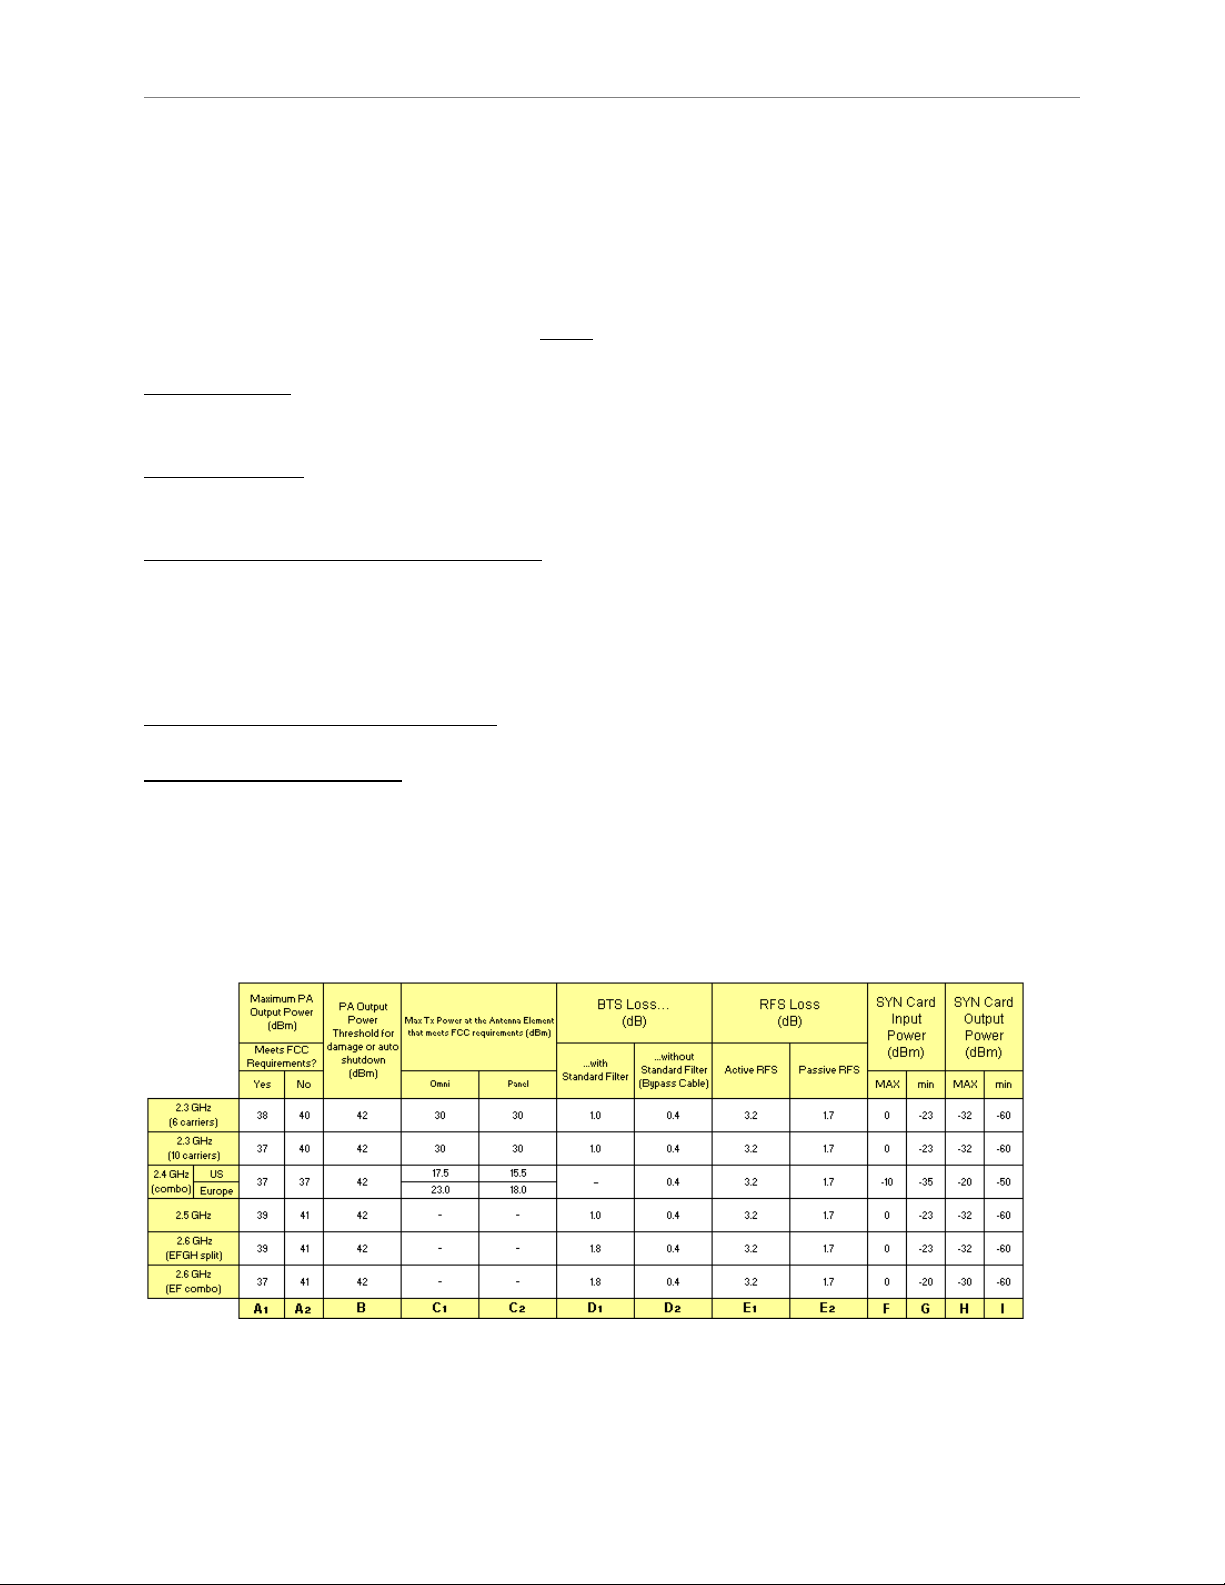
3. Perform preliminary calculations in Table H1
Using the Input Data, fill the cells A through I at the bottom of the Table H1 with the appropriate
values.
• Select first one row based on the operating frequency (plus the number of sub-carriers
if 2.3 GHz or whether the chassis is split or combo if 2.6 GHz).
• For that row, copy the values in columns B, F, G, H and I at the bottom of the table.
• Choose between the value in column A1 and the value in column A2 based on
whether your system must comply with FCC regulations or not (write it down at the
bottom of the table and call it A).
• If the operating frequency is 2.3 or 2.4 GHz, choose between the value on column C1
or the value in column C2 based on the antenna type, Omni or Panel; If the operating
frequency is 2.4 GHz, take also into consideration whether the regulatory body is the
FCC or European (write the value down at the bottom of the table and call it C).
• Choose between the value in column D1 and the value in column D2 based on
114
Page 18

Navini Networks, Inc. Ripwave Base Station I&C Guide
whether your system has a Standard Filter in the back of the BTS (write it down at the
bottom of the table and call it D).
• Choose between the value in column E1 and the value in column E2 based on
whether your system has an Active or Passive RFS (write it down at the bottom of the
table and call it E)
4. Calculate the total loss for the combination of each type of Main Cable and the selected
type of Jumper Cable
Calculate the loss of the Higher and Lower Jumper Cables. Read the loss per 100 ft for the
selected type of the selected Jumper Cable for the Operating Frequency Band of your system,
then divide it by 100 and multiply it times the Length of the Higher Jumper Cable.
Loss of Higher Jumper Cable = [Formula 11]
Length of the Higher Jumper Cable ÷ 100
× Loss per 100 feet of the Selected type of Jumper Cable
Loss of Lower Jumper Cable = [Formula 12]
Length of the Lower Jumper Cable ÷ 100
× Loss per 100 feet of the Selected type of Jumper Cable
Calculate the loss of the Main Cable. Read the loss per 100 ft for each type of Main Cable for
the Operating Frequency Band of your system, then divide it by 100 and multiply it times the
Length of the Main Cable.
Loss of one type of Main Cable = [Formula 13]
Length of the Main Cable ÷ 100
× Loss per 100 feet of that type of Main Cable
Calculate the TOTAL CABLE LOSS (RF or CAL Cable) for each type
of Main Cable. This is
the sum of the losses on both Jumper Cables plus the loss of one type of Main Cable, plus 0.6 dB
for terminators and surge arrestors.
TOTAL CABLE LOSS = [Formula 14]
Loss of Higher Jumper Cable
+ Loss of Lower Jumper Cable
+ Loss of one type of Main Cable
+ 0.6 dB
5. Calculate the maximum and minimum values of TX Power and RX Sensitivity at the
base of the antenna elements and build Table I5 with the results.
Notice that TOTAL CABLE LOSS in Formula 14 is the same as RF Cable Loss in Formula 1
and the same as CAL Cable Loss in formulas 2, 4, 5 and 6.
115
Page 19

Navini Networks, Inc. Ripwave Base Station I&C Guide
Use Formula 1 to calculate Max Tx Power1 (what the PAs could deliver) for each type of Main
Cable. Use values “A”, “D” and “E” from Table 1 respectively for Max PA Output, BTS Loss,
and RFS Loss; and the values from Formula 14 for RF Cable Loss.
Use Formula 2 to calculate Max Tx Power2 (maximum value at which the Tx Paths of the BTS
can be calibrated) for each type of Main Cable. Use value “F” from Table 1 for Max SYN Card
Input; the Min Cal Board Loss and Back Plane Loss values given as Input Data; and the values
from Formula 14 for CAL Cable Loss.
Choose the lower value of the previous two for each type of Main Cable. This is the actual Max
Tx Power. (Formula 3).
Use Formula 4 to calculate Min Tx Power (minimum value at which the Tx Paths of the BTS can
be calibrated) for each type of Main Cable. Use value “G” from Table 1 for Min SYN Card
Input; the Max Cal Board Loss and Back Plane Loss values given as Input Data; and the values
from Formula 14 for CAL Cable Loss.
Use Formula 5 to calculate Max Rx Sensitivity (maximum value at which the Rx Paths of the
BTS can be calibrated) for each type of Main Cable. Use value “H” from Table 1 for Max SYN
Card Output; the Min Cal Board Loss and Back Plane Loss values given as Input Data; and the
values from Formula 14 for CAL Cable Loss.
Use Formula 6 to calculate Min Rx Sensitivity (minimum value at which the Rx Paths of the
BTS can be calibrated) for each type of Main Cable. Use value “I” from Table 1 for Min SYN
Card Output; the Max Cal Board Loss and Back Plane Loss values given as Input Data; and the
values from Formula 14 for CAL Cable Loss.
Build Table H5. You may also calculate the Maximum EIRP for each cable combination by
adding the Gain per Antenna Element (12 dB if Omni, 17 dB if Panel to the Max Tx Power.
6. The following is an example of the calculations performed with the Cable Selection
Spreadsheet with the data shown in Figure H1
Figure H5 – Results
116
Page 20

Navini Networks, Inc. Ripwave Base Station I&C Guide
Notice that, in this example, one cable combination is Not Available (there is no Loss data for
that main Cable at the selected Frequency Band), one cable combination exceeds the maximum
weight allowed, two Main Cables are not flexible enough to be bent as required and four cable
combinations were eliminated because they cannot deliver the desired level of TX Power at the
antenna elements.
At this point you could repeat the calculations with a different type of jumper cable and compare
the results.
In this example, eleven cable combinations have been identified which meet all the requirements
of the system. Now the question is “which one should be used?” To answer this question, other
factors such as cable cost or company policy can be taken into consideration.
Finally, keep in mind that if you select a cable combination that barely meets the requirements,
specially for TX Power (but sometimes also for RX Sensitivity), and over time the performance
of your system degrades, one or both of these parameters may fall out of range and your system
would become impossible to calibrate forcing you to reduce the TX Power or rise the RX
Sensitivity, thus reducing the capacity and/or coverage radius of your system.
117
Page 21

Navini Networks, Inc. Ripwave Base Station I&C Guide
Cable Selection for TTA Systems
Cable selection for a TTA system is extremely simple. Just follow the steps listed below. Notice
that if you are using only the Secondary (Built-In) Surge Protection, you need N-QMA cables,
but if you are using Primary Surge Protection (surge protectors in the RFS and on a ground buss
bar close to the BTS), then you need N-N cables from the RFS to the buss bar and a set of 9 NQMA jumper cables from the buss bar to the BTS
1. Determine the operating frequency
2. Determine the distance between the antenna (RFS) and the BTS. This distance plus ant
slack for service and drip loops is your cable length
3. Determine if there are any restrictions regarding cable weight on the tower and minimum
cable bend radius
4. Select the right cable using the Tables H4 through H6 below.
5. If you need to use LMR400 or LMR600 cables, refer to Table H2 above for the loss,
weight and bend radius data.
TABLE H4 – Power Loss Budget and Maximum Cable Lengths for TTA Systems
Freq. Band
Freq. Band
2.01 GHz
2.01 GHz
2.3 GHz
2.3 GHz
2.4 GHz
2.4 GHz
2.5–2.7 GHz
2.5–2.7 GHz
3.4–3.7 GHz
3.4–3.7 GHz
Min/Max
Min/Max
Cable Loss
Cable Loss
Allowed
Allowed
(dB)
(dB)
5 ≤ loss ≤ 25
5 ≤ loss ≤ 25
5 ≤ loss ≤ 25
5 ≤ loss ≤ 25
5 ≤ loss ≤ 20
5 ≤ loss ≤ 20
5 ≤ loss ≤ 25
5 ≤ loss ≤ 25
5 ≤ loss ≤ 30
5 ≤ loss ≤ 30
Max Cable Length
Max Cable Length
Bundled Individual
Bundled Individual
RG6 RG11 LMR-240 LMR-400 LMR-600
RG6 RG11 LMR-240 LMR-400 LMR-600RG6 RG11 LMR-240 LMR-400 LMR-600
50–250 ft
50–250 ft
(15–76 m)
(15–76 m)
45–230 ft
45–230 ft
(14–70 m)
(14–70 m)
45–180 ft
45–180 ft
(14–55 m)
(14–55 m)
45–215 ft
45–215 ft
(14–65 m)
(14–65 m)
35–220 ft
35–220 ft
(11–67 m)
(11–67 m)
80–390 ft
80–390 ft
(24–119 m)
(24–119 m)
70–350 ft
70–350 ft
(21–107 m)
(21–107 m)
70–275 ft
70–275 ft
(21–275 m)
(21–275 m)
65–335 ft
65–335 ft
(20–84 m)
(20–84 m)
55–340 ft
55–340 ft
(17–104 m)
(17–104 m)
45–215 ft
45–215 ft
(14–65 m)
(14–65 m)
40–200 ft
40–200 ft
(12–61 m)
(12–61 m)
40–155 ft
40–155 ft
(12–47 m)
(12–47 m)
40–190 ft
40–190 ft
(12–58 m)
(12–58 m)
35–190 ft
35–190 ft
(11–58 m)
(11–58 m)
85–415 ft
85–415 ft
(26–126 m)
(26–126 m)
70–355 ft
70–355 ft
(21–108 m)
(21–108 m)
75–295 ft
75–295 ft
(23–90 m)
(23–90 m)
70–355 ft
70–355 ft
(21–108 m)
(21–108 m)
60–360 ft
60–360 ft
(18–110 m)
(18–110 m)
130–640 ft
130–640 ft
(40–195 m)
(40–195 m)
115–565 ft
115–565 ft
(35–172 m)
(35–172 m)
115–450 ft
115–450 ft
(35–137 m)
(35–137 m)
110–540 ft
110–540 ft
(33–164 m)
(33–164 m)
85–540 ft
85–540 ft
(27–165 m)
(27–165 m)
118
Page 22

Navini Networks, Inc. Ripwave Base Station I&C Guide
TABLE H5 – Cable Specs
Bundled Individual
Bundled Individual
RG6 RG11 LMR-240 LMR-400 LMR-600
RG6 RG11 LMR-240 LMR-400 LMR-600RG6 RG11 LMR-240 LMR-400 LMR-600
2.01 GHz
2.01 GHz
2.3 GHz
2.3 GHz
Cable Loss
Cable Loss
2.4 GHz
dB/ft
dB/ft
(dB/m)
(dB/m)
Type of Connectors
Type of Connectors
(RA: Right Angle
(RA: Right Angle
ST: Straight)
ST: Straight)
Weight: lb/ft (kg/m)
Weight: lb/ft (kg/m)
Min. Bend Radius: in (mm)
Min. Bend Radius: in (mm)
2.4 GHz
2.5–2.7 GHz
2.5–2.7 GHz
3.4–3.7 GHz
3.4–3.7 GHz
0.100
0.100
(0,328)
(0,328)
0.109
0.109
(0,358)
(0,358)
0.111
0.111
(0,364)
(0,364)
0.116
0.116
(0,380)
(0,380)
0.138
0.138
(0.453)
(0.453)
QMA (RA)
QMA (RA)
QMA (RA)
N-type (ST)
N-type (ST)
N-type (ST)
0.45 (0.67) 0.85 (1.26) 0.034 (0.05) 0.068 (0.10) 0.131 (0.20)
0.45 (0.67) 0.85 (1.26) 0.034 (0.05) 0.068 (0.10) 0.131 (0.20)
22 (560) 32 (813) 0.75 (19) 1.0 (25) 6.0 (152)
22 (560) 32 (813) 0.75 (19) 1.0 (25) 6.0 (152)
75 Ohm 50 OhmImpedance
75 Ohm 50 OhmImpedance
0.064
0.064
(0,210)
(0,210)
0.071
0.071
(0,233)
(0,233)
0.073
0.073
(0,239)
(0,239)
0.075
0.075
(0,246)
(0,246)
0.088
0.088
(0,289)
(0,289)
N-type (ST)
N-type (ST)
N-type (ST)
0.116
0.116
(0,379)
(0,379)
0.123
0.123
(0,405)
(0,405)
0.126
0.126
(0,413)
(0,413)
0.132
0.132
(0,431)
(0,431)
0.155
0.155
(0,509)
(0,509)
QMA (RA)
QMA (RA)
QMA (RA)
QMA (ST)
QMA (ST)
QMA (ST)
N-type (RA)
N-type (RA)
N-type (RA)
N-type (ST)
N-type (ST)
N-type (ST)
0.060
0.060
(0,197)
(0,197)
0.070
0.070
(0,230)
(0,230)
0.068
0.068
(0,223)
(0,223)
0.070
0.070
(0,230)
(0,230)
0.083
0.083
(0,272)
(0,272)
N-type (RA)
N-type (RA)
N-type (RA)
N-type (ST)
N-type (ST)
N-type (ST)
0.039
0.039
(0,128)
(0,128)
0.044
0.044
(0,144)
(0,144)
0.044
0.044
(0,144)
(0,144)
0.046
0.046
(0,151)
(0,151)
0.055
0.055
(0,180)
(0,180)
N-type (RA)
N-type (RA)
N-type (RA)
N-type (ST)
N-type (ST)
N-type (ST)
TABLE H6 – Antenna Power and Rx Sensitivity
Antenna Power and Rx Sensitivity
Antenna Power and Rx Sensitivity
TTA Systems Non-TTA Systems
TTA Systems Non-TTA Systems
2.3 GHz
2.3 GHz
2.4 GHz
2.4 GHz
2.5–2.7 GHz
2.5–2.7 GHz
3.4–3.7
3.4–3.7
GHz
GHz
with filter
with filter
without filter
without filter
Antenna Power
Antenna Power
(dBm)
(dBm)
min MAX min MAX
min MAX min MAX
20 30 –95 –75
20 30 –95 –75
10 24 –85 –65
10 24 –85 –65
20 30 –95 –75
20 30 –95 –75
20 29 –90 –70
20 29 –90 –70
20 30 –90 –70
20 30 –90 –70
Rx Sensitivity
Rx Sensitivity
(– dBm)
(– dBm)
WARNING! The maximum values showed in this table are capabilities of the
hardware. Stringent regulatory restrictions may apply depending on the country where
the equipment is being installed. Check the applicable regulations of the country's
regulatory body for compliance. The maximum Antenna Power can also be limited by
antenna cable loss and filtering requirements depending on regulatory body.
Antenna Power
Antenna Power
(dBm)
(dBm)
min MAX min MAX
min MAX min MAX
20 30 –95 –75
20 30 –95 –75
10 24 –85 –65
10 24 –85 –65
20 30 –95 –75
20 30 –95 –75
Rx Sensitivity
Rx Sensitivity
(–dBm)
(–dBm)
119
 Loading...