

Page 1

Portable network analyzer
USER MANUAL
(M98230801-03-14A)
Page 2

AR6 portable network analyzer
Date
Revision
Description
28-01-2013
12F
Original manual
02-06-2014
14A
Several modifications. LED description in flexible clamps
LOG OF REVIS ION S
Page 2 of 69 User Manual
Page 3
AR6 portable network analyzer
Always wear the necessary personal protective equipment.
SAFETY INSTRUCTIONS
Follow the warnings in this manual, which are indicated using the following symbols.
DANGER: Warns of a risk, which could result in personal injury or material damage.
WARNING: Indicates that special attention should be paid to a specific point.
Incorrect connectio n, handling or maintenance of the unit may result in death, seriou s
injuries or fire hazard. Avoid handling the device while it is connected to the power
supply.
Follow the installation an d maintenance instructio ns throughout the unit's ent ire working
life. Specifically, follow the recommended installation instructions in the user country’s
Electrical Code or Regulations.
If the unit must be installed in areas with high-voltage (HV) equipment, the personnel
involved must be prop erly trained and authorised to operate in areas with high-voltage
risk.
ATTENTION
Disclaimer
CIRCUTOR, SA reserves the right to modify the units or their specifications appearing in this manual
without prior notice.
The CIRCUTOR guarantee is two years from the purc hase date and is limited to refunding the purchas e
price, free repair or replac em ent of the def ective unit, if the un it is retur ned to t he C IRCUTOR after -sales
service within the guarantee period.
CIRCUTOR, SA supplies its customers with the latest versions of the unit specifications and instruction
manuals on its website: www.circutor.com.
Recommendations before using the unit
The energy supply must be switched off and the unit disconnected before handling, changing the
connection or replacing units.
It is important to only use the original connec tion cables and ac cessories th at come with t he unit. These
products are specially designed to be used with this device and meet current safety standards.
The unit manufacturer is not liable for any damage caus ed by users or installers not com plying with the
warnings and/or recommendations that appear in this manual, nor for damage caused by using nonoriginal products and accessories.
If the instructions preceded by the WARNING symbol are not respected or followed
correctly, this could cause personal injury or damage to the unit and/or installations.
The unit must be connected to the external power supply using suitable over-current
protection device and a switch that can disconnect it from the power supply.
Inspect the work ing area pr ior to installati on. Do not use th e de vice in ha zard ous areas or where there is
a risk of explosion. Avoid using the device in damp locations
User Manual Page 3 of 69
Page 4

AR6 portable network analyzer
Page 4 of 69 User Manual
Page 5

AR6 portable network analyzer
TABLE OF CONTEN TS
LOG OF REVISIONS ......................................................................................................................................... 2
SAFETY INSTRUCTIONS ................................................................................................................................. 3
DISCLAIMER ...................................................................................................................................................... 3
RECOMMENDATIONS BEFORE USING THE UNIT ...................................................................................... 3
TABLE OF CONTENTS ..................................................................................................................................... 5
1 VERIFICATION UPON RECEPTION ....................................................................................................... 8
1.1 COMPONENTS AND ACCESSORIES .................................................................................................................. 8
1.2 STORAGE ........................................................................................................................................................ 8
2 DESCRIPTION OF THE UNIT .................................................................................................................. 8
2.1 INTRODUCTION................................................................................................................................................ 8
2.2 DESCRIPTION .................................................................................................................................................. 9
2.2.1 Active menu ......................................................................................................................................... 9
2.2.2 Active measurement .......................................................................................................................... 9
2.2.3 Upper icons ......................................................................................................................................... 9
2.2.4 Configuration summary...................................................................................................................... 9
2.2.5 Date and time .................................................................................................................................... 10
2.2.6 Power button (On/Off) ...................................................................................................................... 10
2.2.7 REC/STOP Button (Log Control) .................................................................................................... 10
2.2.8 Validation (ENTER) button .............................................................................................................. 10
2.2.9 Navigation keys ................................................................................................................................. 11
2.2.10 Buttons for drop-do wn men us .................................................................................................... 11
2.2.11 Icons .............................................................................................................................................. 11
2.2.12 Screen ........................................................................................................................................... 11
2.3 CONNECTORS ............................................................................................................................................... 11
2.3.1 Voltage inputs .................................................................................................................................... 11
2.3.2 Current inputs .................................................................................................................................... 11
2.3.3 USB port ............................................................................................................................................ 11
2.3.4 Expansion module ............................................................................................................................ 12
2.3.5 Auxiliary power supply ..................................................................................................................... 12
3 INSTRUCTIONS FOR USE .....................................................................................................................12
4 TECHNICAL FEATURES .........................................................................................................................13
4.1 EXTERNAL POWER SUPPLY ................................................................................................................. 13
4.2 AUXILIARY POWER SUPPLY ................................................................................................................. 13
4.3 BATTERY .................................................................................................................................................... 13
4.3.1 Rechargeable main power supply battery .................................................................................... 13
4.3.2 Clock power supply internal battery ............................................................................................... 13
4.4 CURRENT INPUTS ................................................................................................................................... 14
4.5 CURRENT CLAMPS .................................................................................................................................. 14
4.6 VOLTAGE INPUTS..................................................................................................................................... 14
4.7 UNIT ACCURACY ...................................................................................................................................... 15
4.8 ENVIRONMENTAL CONDITIONS........................................................................................................... 15
4.9 MECHANICAL FEATURES ...................................................................................................................... 16
4.10 SCREEN ................................................................................................................................................. 16
4.10.1 LCD features ................................................................................................................................ 16
4.11 MEMORY................................................................................................................................................ 16
4.11.1 Log capacity.................................................................................................................................. 17
4.11.2 Memory errors .............................................................................................................................. 17
4.12 ICONS AND SYMBOLS ........................................................................................................................ 18
5 START-UP .................................................................................................................................................18
5.1 BATTERY INSTALLATION ........................................................................................................................ 18
User Manual Page 5 of 69
Page 6

AR6 portable network analyzer
5.2 POWER ON ................................................................................................................................................ 20
6 DROP-DOWN MENUS AND KEYBOARD .............................................................................................20
7 MAIN MENU ..............................................................................................................................................21
8 SETTINGS MENU ....................................................................................................................................22
8.1 BIOS CONFIGURATION ................................................................................................................................. 22
8.1.1 Language ........................................................................................................................................... 22
8.1.2 Time to switch off display ................................................................................................................ 23
8.1.3 Contrast .............................................................................................................................................. 23
8.1.4 Time to lock keyboard ...................................................................................................................... 23
8.1.5 Password ........................................................................................................................................... 23
8.1.6 Phase colours ................................................................................................................................... 23
8.1.7 Screen background .......................................................................................................................... 23
8.2 CLOCK SETUP ............................................................................................................................................ 23
8.3 DECIMALS SETUP ....................................................................................................................................... 24
8.4 USB CONFIGURATION ................................................................................................................................... 24
8.4.1 Safe memory access........................................................................................................................ 24
9 SYSTEM INFORMATION MENU ...........................................................................................................25
9.1.1 Update ................................................................................................................................................ 25
9.1.2 Recover SD ....................................................................................................................................... 25
9.1.3 Format SD with a PC program ....................................................................................................... 26
10 MEASUREMENT MANAGER MENU .....................................................................................................26
10.1 CREATE .................................................................................................................................................... 27
10.2 MODIFY .................................................................................................................................................... 27
10.2.1 T ransformer’s ratios ..................................................................................................................... 28
10.2.2 Measurement configuration ........................................................................................................ 29
10.2.3 Variable selection ......................................................................................................................... 30
10.2.4 Events setup (EVQ setup) .......................................................................................................... 31
10.2.5 Transients ...................................................................................................................................... 32
10.2.6 T rigger interval .............................................................................................................................. 33
10.2.7 Periodic trigger ............................................................................................................................. 34
10.2.8 Phototriggerconditions using measured data .......................................................................... 34
10.2.9 Recordingtrigger conditions ....................................................................................................... 35
10.3 CLEAR ...................................................................................................................................................... 35
10.4 CLEAR ALL ................................................................................................................................................ 35
10.5 REMOVE .................................................................................................................................................... 35
10.6 ACTIVATE .................................................................................................................................................. 35
11 MEASUREMENT ANALYSIS MENU ......................................................................................................36
11.1 RECORDS ............................................................................................................................................. 36
11.2 PHOTOS ................................................................................................................................................. 37
11.3 DISTURBANCES ........................................................................................................................................ 38
11.3.1 Disturbance wave shape ............................................................................................................ 38
11.3.2 RMS value of a transient or event ............................................................................................. 39
11.4 UNIPEDE TABLE ..................................................................................................................................... 39
11.4.1 Events grouping in accordance with UNIPEDE criteria ......................................................... 40
12 WAVEFORM MENU ................................................................................................................................41
12.1 PHOTO .................................................................................................................................................... 42
12.2 PAUSE ...................................................................................................................................................... 42
12.3 RUN .......................................................................................................................................................... 42
12.4 ZOOM IN, ZOOM OUT ................................................................................................................................ 42
13 METER MENU ..........................................................................................................................................43
13.1 REAL TIM E RMS VALUES SCREEN ........................................................................................................... 43
Page 6 of 69 User Manual
Page 7

AR6 portable network analyzer
13.1.1 VIEW maximum or minimum values option (consumed or generated) ............................... 44
13.2 POWER QUALITY SCREEN ..................................................................................................................... 44
13.2.1 VIEW quality maximum or minimum values option ................................................................ 44
13.3 ACCUMULATED ENERGY SCREEN ........................................................................................................... 45
13.4 MAXIMUM DEMAND SCREEN ................................................................................................................... 45
14 PHASORS MENU ....................................................................................................................................45
15 QUADRANTS MENU ...............................................................................................................................46
16 HARMONICS MENU ................................................................................................................................47
17 CONNECTION DIAGRAMS ....................................................................................................................49
17.1 THREE-PHASE CONNECTION WITH NEUTRAL ........................................................................... 49
17.2 THREE-PHASE CONNECTION WITH NEUTRAL ........................................................................... 49
17.3 THREE-PHASE ARON CONNECTION ............................................................................................. 49
17.4 TWO-PHASE CONNECTION .............................................................................................................. 50
17.5 SINGLE-PHASE CONNECTION ........................................................................................................ 50
17.6 MEASURED / CALCULATED ELECTRICAL PARAMETERS IN ACCORDANCE WITH THE CONNECTION TYPE . 51
18 SCREEN INFORMATION ........................................................................................................................55
18.1 UPPER BAR ICONS ................................................................................................................................... 55
18.2 BATTERY CHARGE .................................................................................................................................... 56
18.3 BUTTON PAD LOCK ................................................................................................................................... 56
18.4 PHASES CONNECTION .............................................................................................................................. 56
18.5 EVENT DETECTION ................................................................................................................................... 57
18.5.1 Recording status .......................................................................................................................... 57
18.5.2 Memory capacity .......................................................................................................................... 57
18.5.3 USB connection ........................................................................................................................... 57
18.5.4 Snapshot ........................................................................................... ¡Error! Marcador no definido.
18.6 MENU TREE .............................................................................................................................................. 58
18.7 SWITCHING OFF THE ANALYZER ............................................................................................................... 59
19 TYPES OF FILES GENERATED ............................................................................................................59
19.1 REC.STD FILES ...................................................................................................................................... 59
19.2 PHO.STD FILE ........................................................................................................................................ 64
19.3 EQV.STD FILE ......................................................................................................................................... 64
19.4 LOG.EVA FILES ....................................................................................................................................... 65
19.5 LOCATION OF LOGS .................................................................................................................................. 66
19.6 FILE DOWNLOADING .......................................................................................................................... 66
20 SOFTWARE UPDATE ..............................................................................................................................66
21 POWER VISION PLUS ............................................................................................................................66
22 FREQUENTLY ASKED QUESTIONS .....................................................................................................67
22.1 CAN I EXP AND THE ANAL YZER'S INTERNAL MEMORY? ............................................................................. 67
22.2 THE UNIT IS NOT RESPONDING TO THE BUTTONS. WHAT COULD BE HAPPENING AND HOW CAN I FIX IT?
67
22.3 WHAT DOES THE UNIT LOG WHEN IT T AKE S A SNAPSHOT? .................................................................. 67
22.4 WHAT DOES IT LOG WHEN IT CAPTURES THE WAVE SHAPE OF AN EVENT? ........................................... 67
22.5 WHAT SOFTWARE IS USED T O ANAL YSE THE LOGGED DATA? .................................................................. 67
23 MAINTENANCE AND TECHNICAL SERVICE ......................................................................................68
24 GUARANTEE ............................................................................................................................................68
25 CE CERTIFICATION ................................................................................................................................69
User Manual Page 7 of 69
Page 8
AR6 portable network analyzer
We recommend always using cables and accessories supplied by
1 VERIFICATION UPON RECEPTION
Check the following points when the user receive the unit:
The unit meets the specifications of the user order.
The unit has not suffered any damage during transport.
Perform an external visual inspection of the unit prior to switching it on
Check that the power supply voltage of the unit is right for the mains to which it is to be
connected
1.1 COMPONENTS AND ACCESSORIES
The AR6 analyzer comes with the following:
• AR6 portable network analyzer
• 100...240 Vac / 12 Vdc 3.33 A (40 W max) power supply
• AR6 battery
• 5 voltage measuring cables
• Bag with coloured ties for voltage cables
• 5 crocodile clamps
• USB communication cable
• 4 coloured adhesive connector labels
• “Power Vision plus” software CD
• Manufacturer's Certificate of Production
• User’s manual.
• SD FAT32 memory (inserted in the unit)
CIRCUTOR. Otherwise, CIRCUTOR is not liable for potential operation or
safety issues
1.2 STORAGE
The unit should be stored according to the following recommendations:
Avoid placing it on uneven surfaces.
Do not store in outdoor areas, humid areas or areas exposed to the splashing of water.
Do not install near hot spots (maximum ambient temperature: 45 ºC)
Avoid saline and corrosive environments.
Avoid storing the unit in areas where a lot of dust is generated or where the risk of
chemical or other types of contamination is present.
Do not place any weight on top of the unit.
2 DESCRIPTION OF THE UNIT
2.1 INTRODUCTION
This manual contains all the necessary information for the safe use of the AR6network analyzer
and to help the user to get the best performance from it.
AR6 analyzers incorporate the latest technology and offer the most advanced features on t he
market in the area of measurement and logging of electrical parameters in industrial or
residential networks.
Read this manual carefully before connecting the unit in order to avoid incorrect use that
may cause permanent damage.
Page 8 of 69 User Manual
Page 9
AR6 portable network analyzer
2.2 DESCRIPTION
The AR6 is a portable network analyzer for measuring grid parameters. It is the latest version of
the CIRCUTOR S.A. AR 4 and AR 5 portable analyzer series.
It is a digital measuring instrument that takes samples of voltage waves and current and
calculates RMS voltage and current values with a specific TMP averaged time. It includes a 1
GB internal memory for storing the data recorded at different installations.
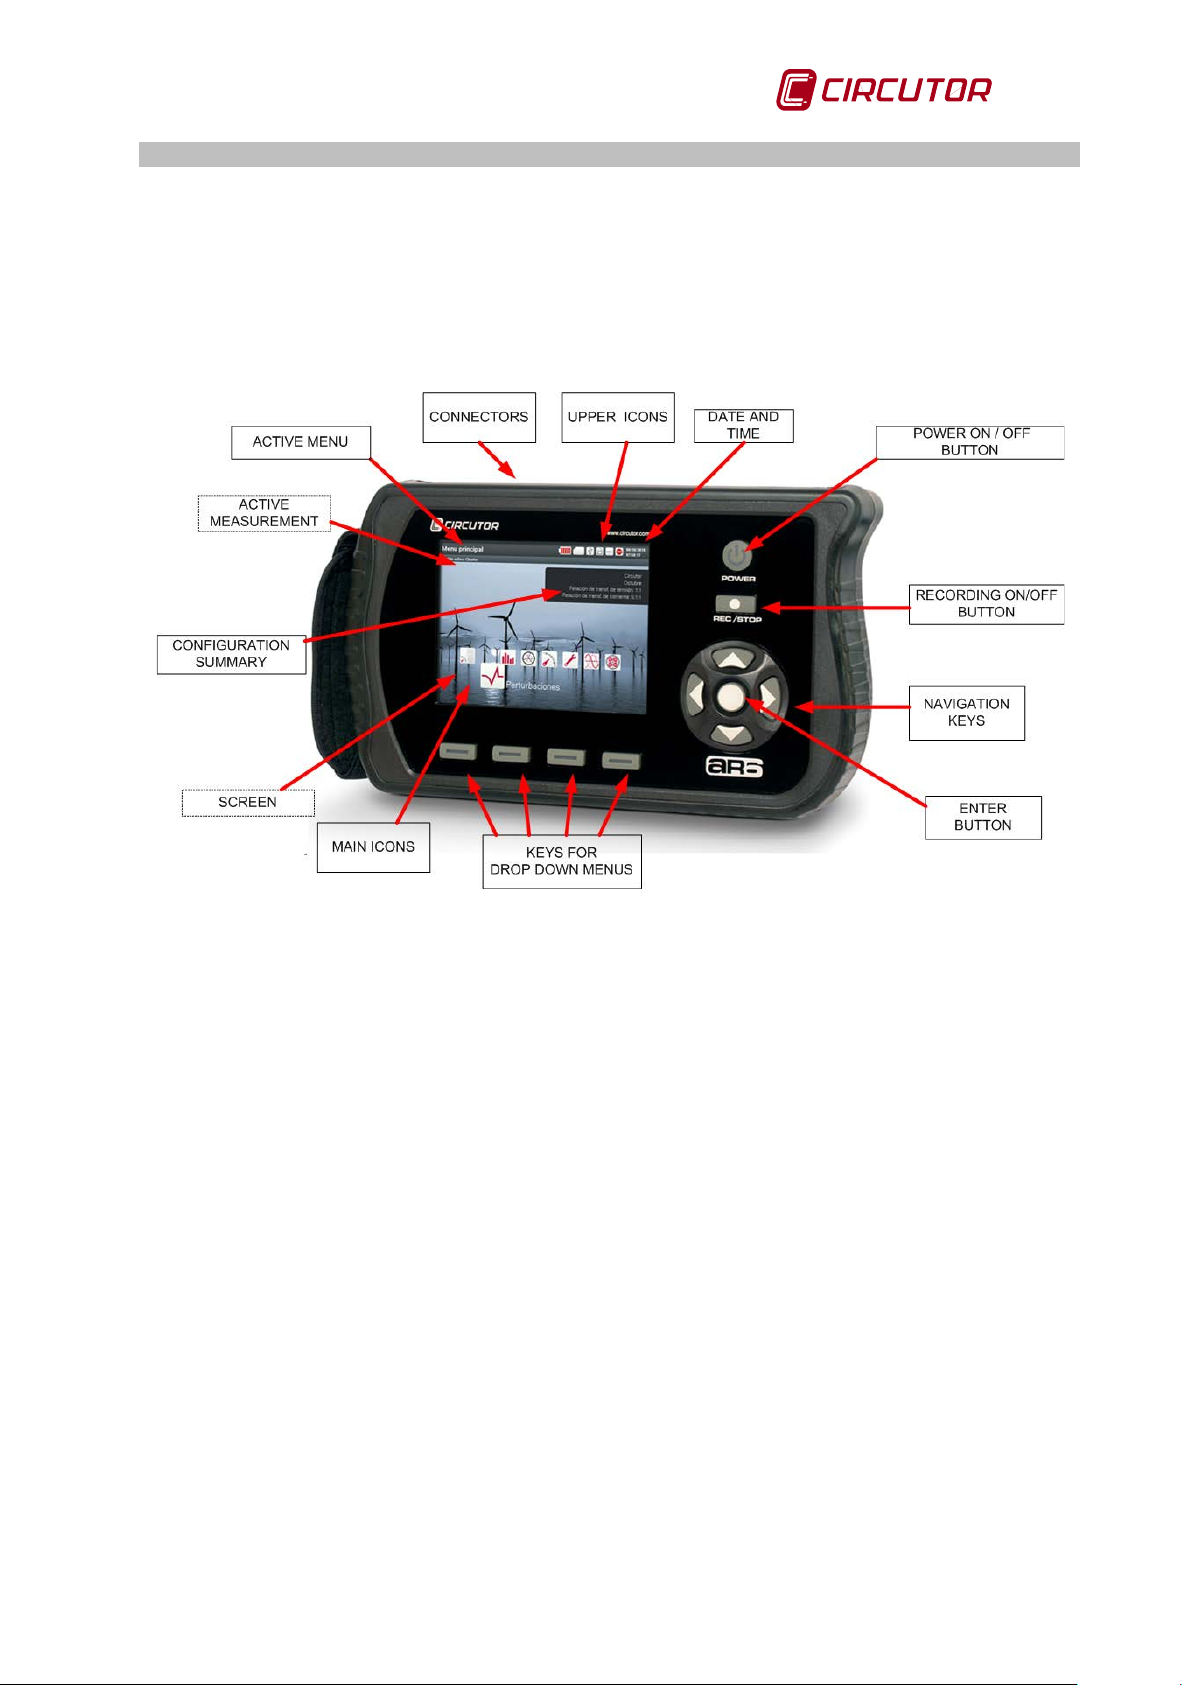
The figure shows the instrument's control buttons and main screen.
Fig.2-1.- Main screen of the AR6
2.2.1 Active menu
The bar at the top shows the name of the screen being displayed.
2.2.2 Active measurement
It shows the name of the file where data are saved in the event this is required by the user.
2.2.3 Upper icons
These icons give analyzer’s status information. For more information see the chapter entitled
Upper bar icons
2.2.4 Configuration summary
The unit shows a measurement configuration summary window so that the correct configuration
of the analyzer can be verified. It displays the following information:
User Manual Page 9 of 69
Page 10

AR6 portable network analyzer
Fig.2-2.- Window showing the configuration
CORCO: Active measurement name
Three-phase 4 wires 50 Hz (DEFAULT TEXT). Description of the measurement (by
default the unit indicates the type of circuit selected when creating the measurement,
indicating DEFAULT TEXT). Users may change the measurement description text.
Voltage ratios 1/1 - 300: Transformers ratio for the voltage channel.
Current ratios: 100 -1/1 : 0- 1/1 : 0 – 1/1: Transformers ratio for the different current
channels. The three blocks correspond to the phase clamps, the neutral clamp and the
earth l eakag e current clamp.
Phase clamps; 100-1/1 means: 100 is the nominal current of the connected phase
clamp; 1/1 indicates that the unit recognises the clamp and auto-configures the scale.
The user must manually configure the scale only in the case of multi-scale clamps or
primary /5 clamps.
Neutral clamp; 0-1/1 : 0 means there is no neutral clamp. If used, this block would
indicate the parameters of the neutral clamp. 1/1 indicates that the unit is self-configured
Earth leakage current clamp; 0-1/1 : 0 means there is no earth current leakage clamp.
If used, this block would indicate the parameters of the neutral clamp. 1/1 indicates that
the unit is self-configured
Recording period: 600 seconds: That is the configured log period.
Next trip: Condition (pending): This indicates if the recording needs a certain trigger
condition (parameter threshold or time gap). If it is not configured, the unit will display
"disabled"
2.2.5 Date and time
This displays the date and time at when the unit was configured.
2.2.6 Power b utton (On/Off)
To switch the analyzer ON or OFF, the user must press the ON/OFF button and confirm the
action on the menu that appears on the screen.
The button will light up either red or green in colour. The colour green indicates the unit is ON
and, if flashing, that it is in energy saving mode, with the screen off. Intermittent red indicates
that it is connected to the network and that the battery is charging, and the LED OFF means
that the analyzer is switched OFF.
2.2.7 REC/STOP Button (Log Control)
Once the user has configured and connected the unit, its correct connection must be verified by
checking the values displayed by the unit. If the connection is verified as correct, the user may
begin recording data by pressing this button. Likewise, in case that the user wishes to interrupt
an on going recording , this button must be pressed.
2.2.8 Validation (ENTER) button
This is used to run the function selected among the various options from the configuration and
display screens, or from the dynamic drop-down menu. It is referred to in this manual with the λ
sign.
Page 10 of 69 User Manual
Page 11
AR6 portable network analyzer
2.2.9 Navigation keys
The unit has 4 navigation keys. These buttons have arrows drawn on them to indicate the
direction of cursor movement. In this manual these buttons are referred to with the ▲/▼, ◄/►
icons.
2.2.10 Buttons for drop-down menus
The analyzer function buttons are variable or "dynamic". The options displayed on dropping
down the menus for each of the function buttons are, different depending on the current screen.
2.2.11 Icons
The main menu icons help the user quickly and easily access the configuration, system
information and display screens. For more information on each of the shortcut icons see chapter
18 entitled SCREEN INFORMATION
2.2.12 Screen
5.7” VGA LCD screen that can simultaneously display data from 9 channels: Voltages U1, U2,
U3 , phase to neutral (terminal UN) , UN, Neutral voltage referred to earth (terminal U
currents I1, I2, I3, IN, I
LEAK
.
EARTH
) and
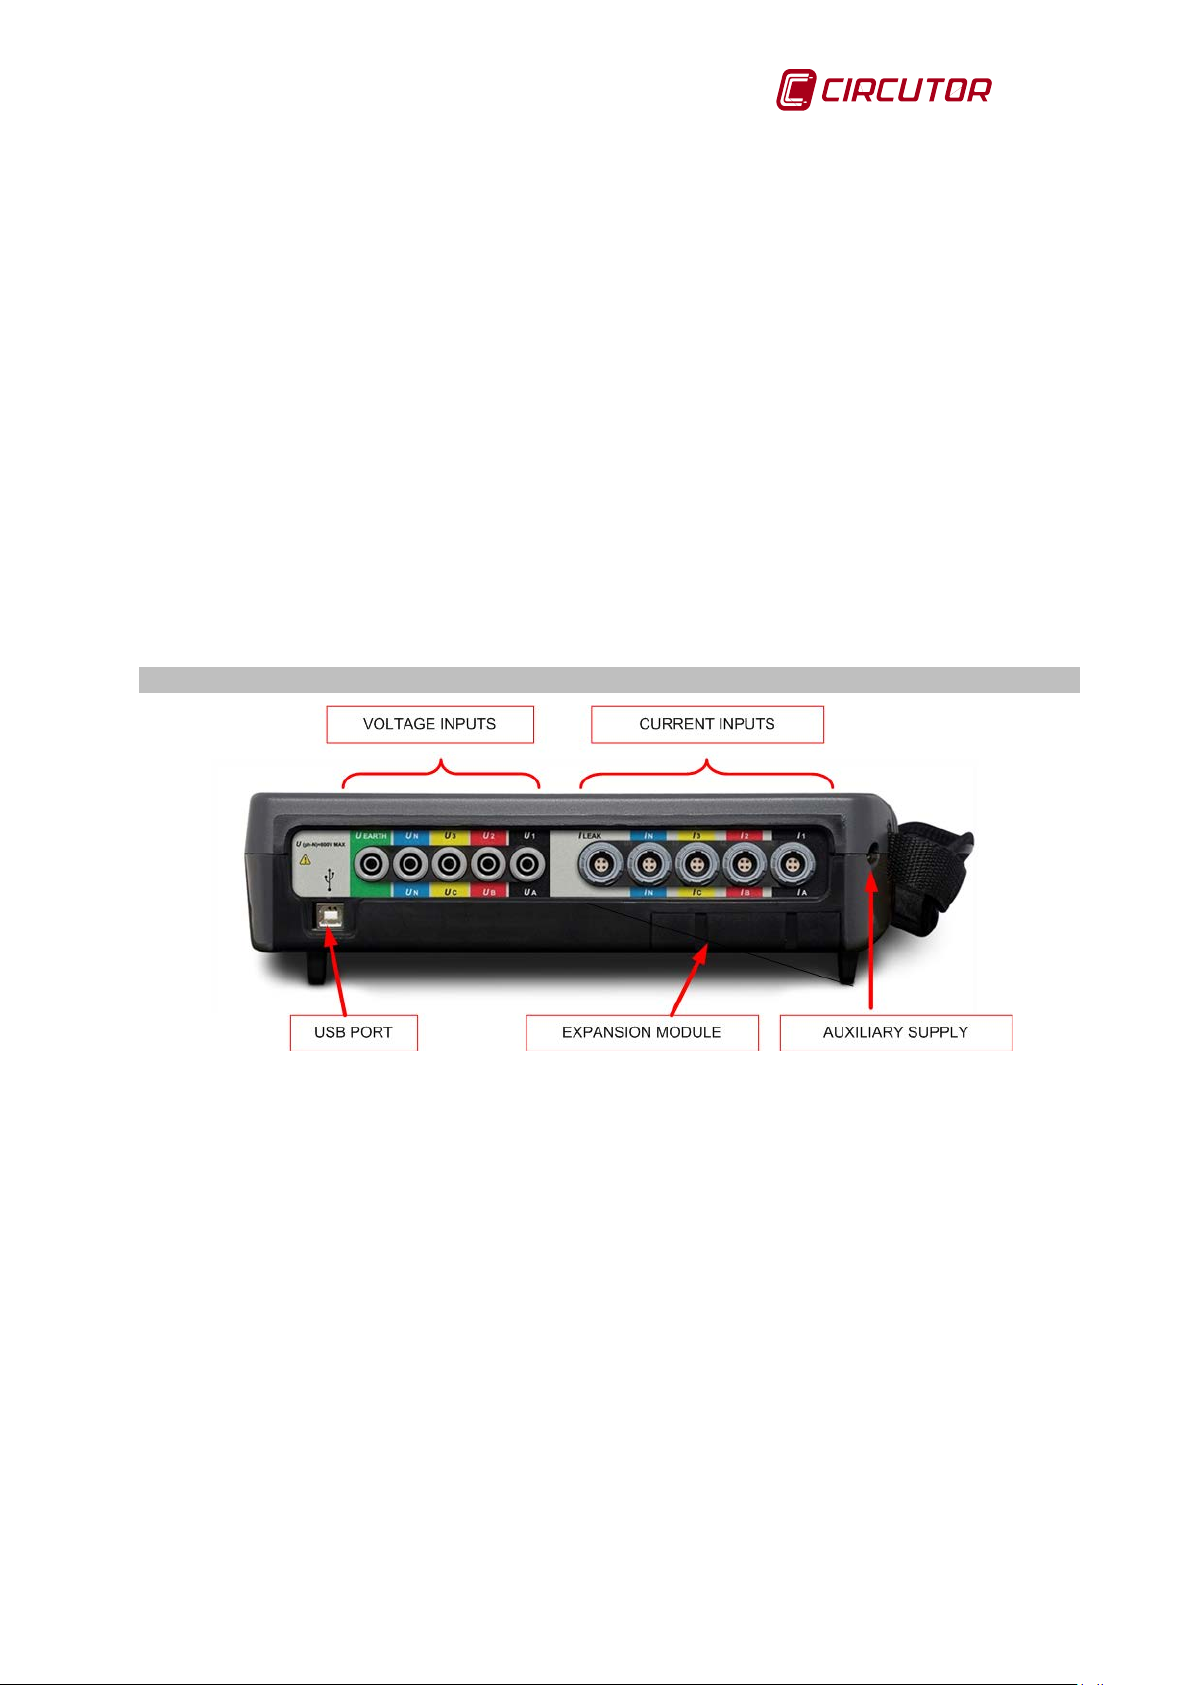
2.3 CONNECTORS
Fig.2-3.- Connections on the top of the AR6
2.3.1 Voltage inputs
The voltage inputs of the AR6 are found on the top part of the unit, as shown in Fig.2-3. They
are identified with the symbols U1 (U
A), U2 (UB), U3 (UC), UN (UN) and Uearth and identified
with different colours (identifier adhesive label may be chosen by the user).
2.3.2 Current inputs
The analyzer's current inputs are also found on the top of the analyzer, as shown in Fig.2-3.
This current inputs are identified with the symbols I1 (I
A), I2 (IB), I3 (IC), IN (IN) and I
LEAK
. The
identification colours depend on the identifier adhesive chosen by the user.
2.3.3 USB port
This is a type B USB communications port, used for downloading recorded data. When the
analyzer is connected to a computer, the unit is recognized as an external drive, so it is not
necessary to communicate with the unit in order to download stored files, simply drag the files to
the desired directory of the computer or download them using the PowerVisionPlus® software.
User Manual Page 11 of 69
Page 12
AR6 portable network analyzer
protection may be compromised.
2.3.4 Expansion module
This module is not supplied in standard analyzers. The arrow indicates only the positioning of
the slot for possible expansion modules. If the user has purchased a special measurement
module to extend the features of the standard analyzer, this is where expansion modules are
installed. The features of each one of the expansion modules are found in their respective
particular manuals.
2.3.5 Auxiliary power supply
This is the slot for the AR6 power supply connector. See the power supply features in chapter 4,
entitled TECHNICAL FEATURES.
3 INSTRUCTIONS FOR USE
The AR6 analyzer is a configurable measuring instrument that may be used in different ways,
which the user may select by means of different menu choices. It allows configuration of
different measuring methods, various r ecording times and log and trip conditions. Functions like
snapshots, averaging, rebooting maximum and minimum values display, wave shapes display,
rate of harmonic distortion, active and reactive power, both inductive and capacitive, energy
consumed and generated, among many other parameters can be displayed and/or recorded.
In order to ensure correct operation, carefully read the instructions given in this manual before
beginning measurements.
WARNING: Read this manual before using the analyzer.
If the analyzer is used in a manner other than that specified by the manufacturer, its
Page 12 of 69 User Manual
Page 13
AR6 portable network analyzer
Rated voltage
100…240 Vac
Power supply frequency
50…60 Hz
Output voltage
12 Vdc
Current
3.33 A
Max. power
40 W
Rated voltage
12 Vdc
Current
2 A
Maximum power
24 W
Consumption
30 VA
BATTERY
NiMH (Nickel-Metal Hydride)
Voltage
6 V
Capacity
4,200 mAh
Charge time
2 to 3 h
4hrs with LCD on
8hrs with LCD off
Lithium battery
CR2025
Voltage
3 V
Capacity
600 mA/h
Battery life without charging
10 years
4 TECHNICAL FEATURES
4.1 EXTERNAL POWER SUPPLY
An external alternating current power supply comes with the unit. It may be used to power the
unit while recording or to recharge the battery.
4.2 AUXILIARY POWER SUPPLY
4.3 BATTERY
The AR6 has a built-in Nickel-Metal Hydride battery for the unit's main power supply which gives
it autonomy of operation and logging. It also has another internal Lithium battery that
permanently powers the internal clock.
4.3.1 Rechargeable main power supply battery
Battery life while in use
4.3.2 Clock power supply internal battery
User Manual Page 13 of 69
Page 14
AR6 portable network analyzer
Inputs for current measurement
I1 I2 I3 IN Leakage
Input voltage
0…2 V
RMS
Measurement margin
from 1 to 120% of In
Primary current measurement In
Depends on clamp
Admissible overload
3 In
Consumption
≤0.0004 VA
Accuracy of the instrument
(excluding the clamp)
1 digit (we must add the margin of error of
the clamp used to this number)
pass filter (option to activate or deactivate)
Input impedance
10 kΩ
RATIO
200 A
blue
5…200 A
2,000 A
red
50...2,000 A
20,000 A
blue + red
500...20,000 A
Inputs for voltage measurement
U1 U2 U3 UN U
EARTH
Input margin
Unom= 10 to 800 V
RMS
phase-neutral
Measured accuracy
0.5%± 1 dig it
Number of inputs
5
Peak voltage
2,500 Vpeak
Bandwidth
3.2 kHz
Input impedance
10 MΩ
4.4 CURRENT INPUTS
0.5%±
Special features
Earth leakage current measurement via low-
4.5 CURRENT CLAMPS
The AR6 can use single-scale or multi-scale clamps. When using single-scale clamps the
instrument automatically recognises the clamps connected to it; in the case of multi-scale
clamps, when the clamps are connected a menu pops up to configure the current transformer’s
ratio (see current clamp configuration).
When using E-FLEX 54 cm multi-scale clamps the scales are as indicated in
Table 4-1
Table 4-1.- E-FLEX 54 cm clamps
Clamp
TURNDOWN
LED
Range (2.5...100%)
E-FLEX 54 cm (See note 1)
Note 1: E-FLEX clamps have built-in LEDS to indicate the scale at which they are working.
When they work at a low scale the blue LED lights up, when they work at a medium scale the
red LED lights up and when they work at a high scale both LED light up.
4.6 VOLTAGE INPUTS
Page 14 of 69 User Manual
Page 15

AR6 portable network analyzer
Permanent overvoltage
1,000 V
RMS
Transitory overvoltage <1 s
2,500 Vpeak
Absolute maximum voltage
6 kV
Consumption
≤0.04 VA
Maximum voltage in the voltage measurement circuit
1000 V CAT III / 600 V CAT IV for elevations below 2000 m.
1000 V CAT II / 600 V CAT III / 300 V CAT IV for above 2000 m
Variable
Resolution
Accuracy
Margin
Currents * (2 V input)
0.1 mA
± 0.5%
10% … 120% of In
Voltage
0.01 V
± 0.5%
20% … 120% of Un
Active power
0.1 W
± 1%
Reactive power
0.1 VAr
± 1%
Apparent power
0.1 VA
± 1%
Frequency
0.01 Hz
± 0.01 Hz
45 … 65 Hz
Active Energy
1 W·h
± 1%
Reactive energy
1 VAr·h
± 1%
Voltage THD
% x 10
± 0.5%
10% … 120% of Un
Current THD
% x 10
± 0.5%
20% … 120% of In
PST Flicker
% x 10
± 5%
Voltage Imbalance
% x 10
V oltage Asy mmetry
% x 10
Crest Factor
x100
± 0.5%
1.0…1.875
-10…+50 ºC
Storage temperature
-10…+60 ºC
Altitude
2,000 m
Humidity without condensation
5...95%
4.7 UNIT ACCURACY
* The unit's accuracy in current and in power does not include the margins of error of the
clamps connected to it.
4.8 ENVIRONMENTAL CONDITIONS
Operating temperature
User Manual Page 15 of 69
Page 16
AR6 portable network analyzer
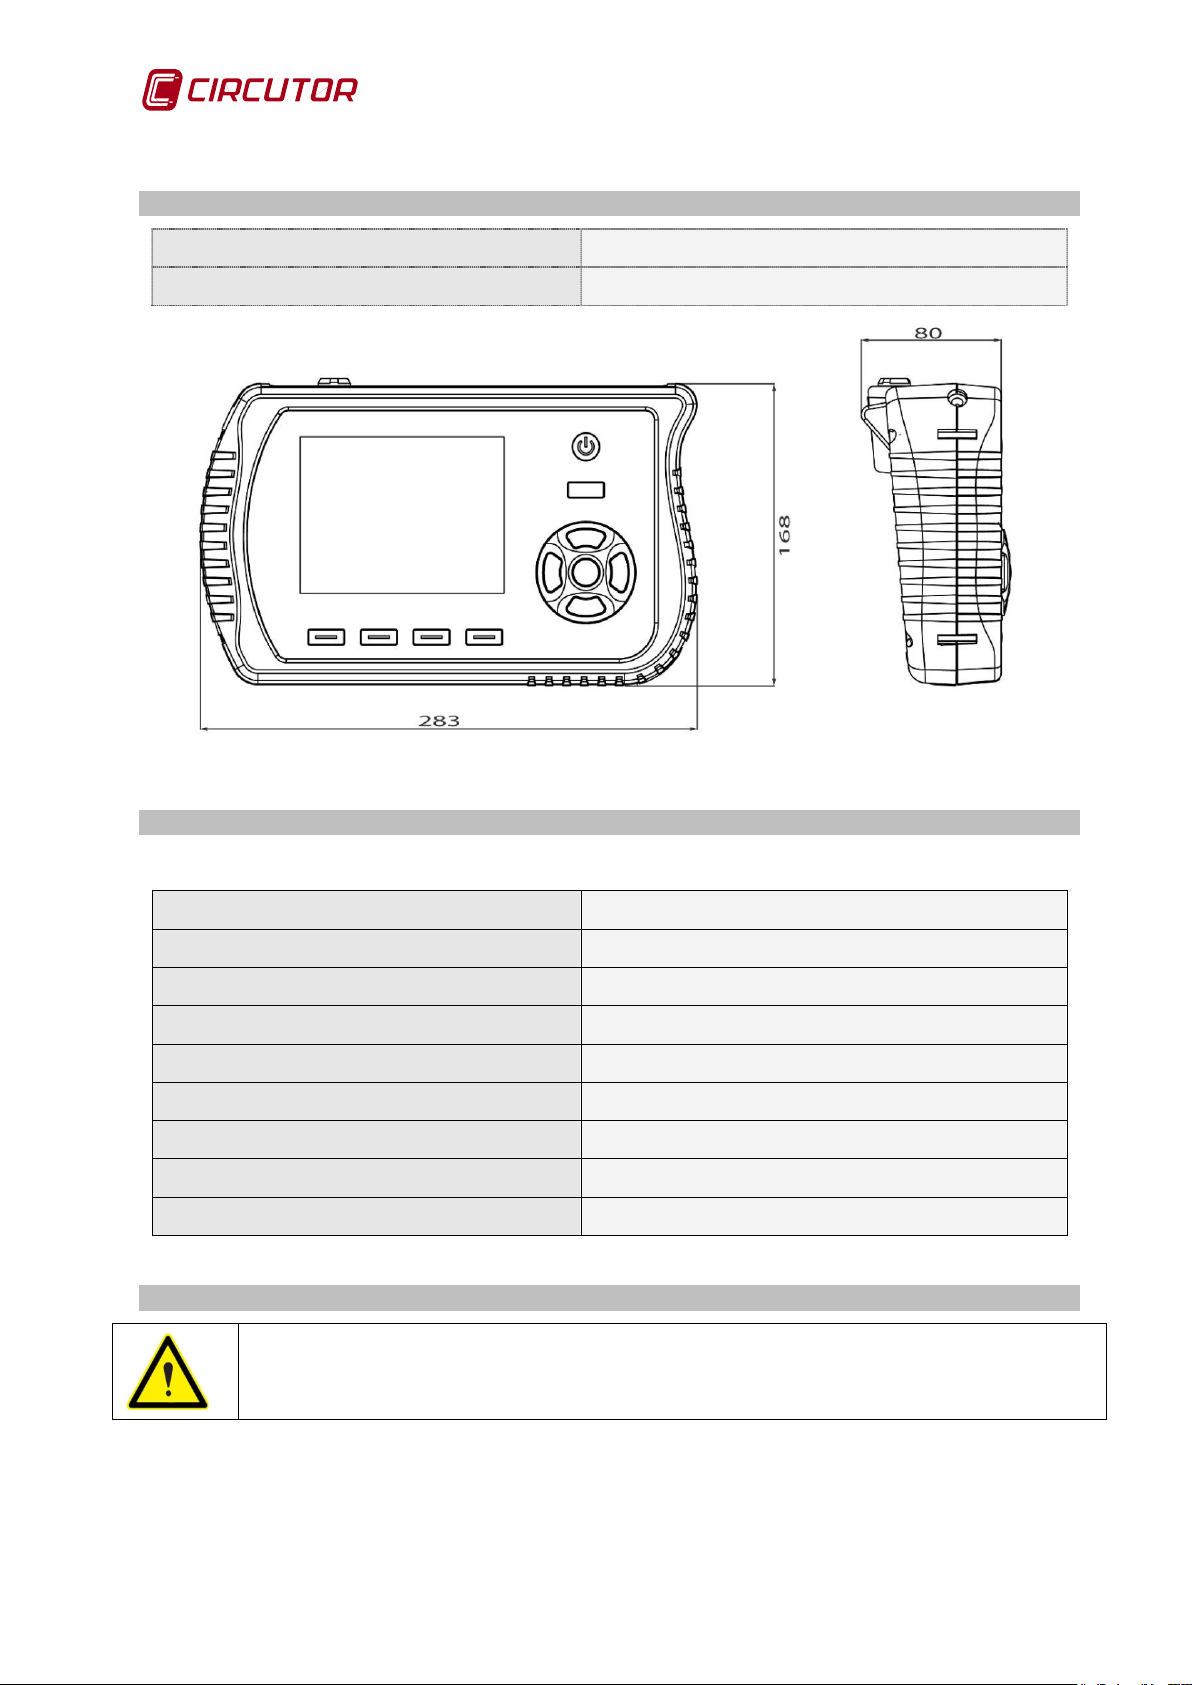
Outer dimensions
283 x 168 x 80 mm
Weight
1.640 kg
Panel size
5.7”(diagonal measurement)
Active area of the LCD
Width 116.16 mm x Height 87.12 mm
No. of Pixels
Horizontal (640x3) x Vertical 480
Resolution type
VGA
Pixel size
Horiz. 0.1815 mm x Vert. 0.1815 mm
Pixel colour
RGB vertical lines
Display colour
White
No. of colours
262K
Back lighting
LED
4.9 MECHANICAL FEATURES
4.10 SCREEN
4.10.1 LCD features
4.11 MEMORY
Fig.4-1.- Dimensions
The internal memory must be handled with all possible precautions to prevent files
from being corrupted. Switch the instrument OFF to remove it.
The unit has an internal SD memory. It is not designed so that users must remove the memory
to read the data logged on it, as the data can be accessed and downloaded using a USB cable.
Users may change the unit's memory for one with greater capacity if necessary. It is very
important that the new memory card have the same folder structure as the one being
changed and be in FAT32 format.
Page 16 of 69 User Manual
Page 17
AR6 portable network analyzer
Model
Features
Capacity up to 32 GB
Capacity of up to 32 GB
Table 4-2 shows a list of some valid cards and their features.
Table 4-2.- Compatible card models
SD
SHDC
4.11.1 Log capacity
The standard AR6 log for a 4-wire, three-phase system, saving all variables, occupies 4,230
bytes and the log header occupies 1,586 bytes (approx. 2 kb). Therefore, the log capacity can
be calculated using the following approximation:
N. of logs = (SD memory capacity in Mb * 1000 - No. files *2)/ 4.23
Log hours in 1 file = (SD memory capacity in Mb * 1000 - 2) * log period in seconds / (3,600 *
4.23)
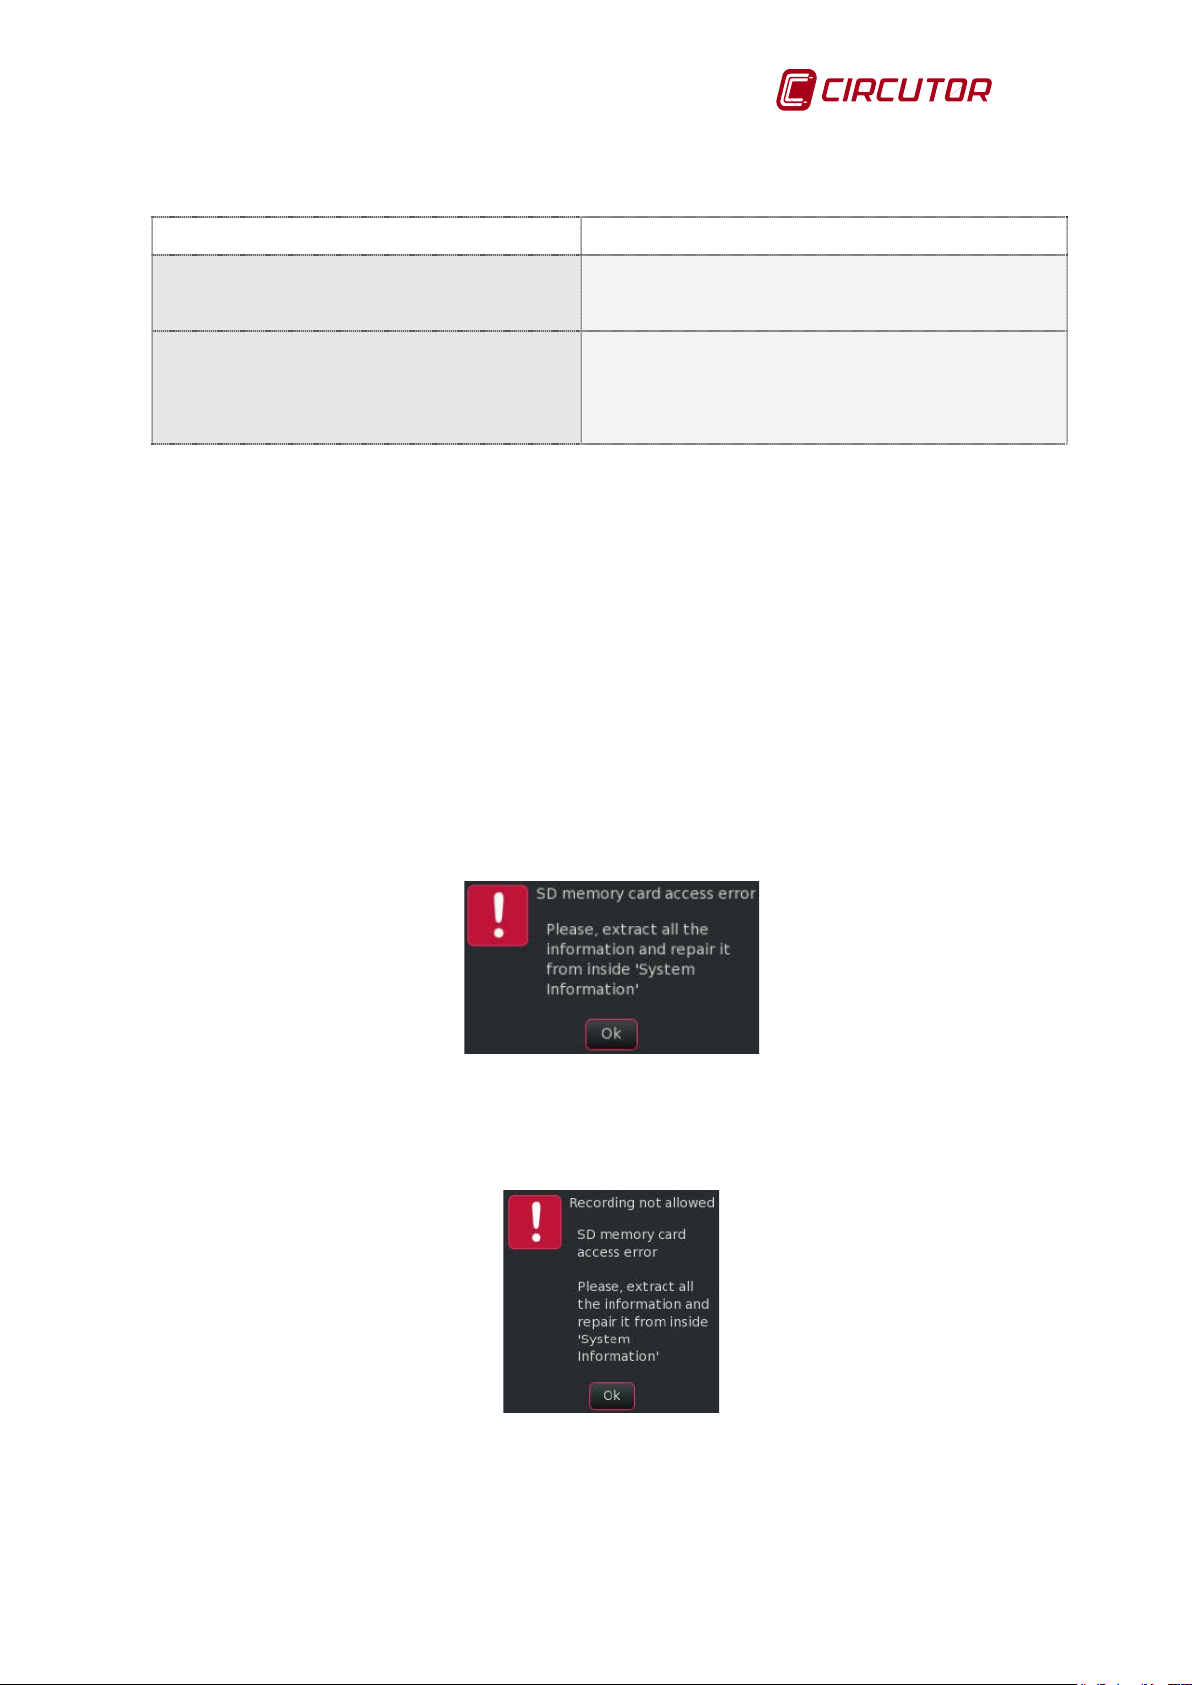
4.11.2 Memory errors
It may occur that for reasons unrelated to the unit some memory partitions become inaccessible
or corrupt and the information stored in those memory sectors is lost. If the unit detects a write
access problem in log mode that prevents data from being logged to memory it will stop the log
automatically and warn the user that there is an access problem using the following alert. It will
also remove the SD memory detection icon from the upper menu.
1.10 standard specification
2.0 specification, class 4
Minimum transfer speed of 4 MB/s
Fig.4-2.- Memory access error
If the user accepts the warning but does not retrieve the card using the "Retrieve SD" tool in the
system's information menu and instead tries to log, the unit will show the following warning as a
reminder.
Fig.4-3.- Memory access and retrieval error
User Manual Page 17 of 69
Page 18
AR6 portable network analyzer
Also, the input terminals of the measuring circuit must be
4.12 ICONS AND SYMBOLS
Double insulation Protection class identifier.
Manufactured in Europe. Under European standards.
These products have been designed and manufactured with top quality
components that can be recycled and reused.
Electrical and electronic products contain substances that can harm the environment if they are
not adequately treated.
This symbol means that electrical and electronic units should not be disposed of with other
household waste at the end of their useful life.
Please take the obsolete products being replaced to a waste collection point or contact the user
local government.
The European Union has established specific collection systems for electronic and electrical
unit waste.
REI-RAEE Record No.: 3338
5 START-UP
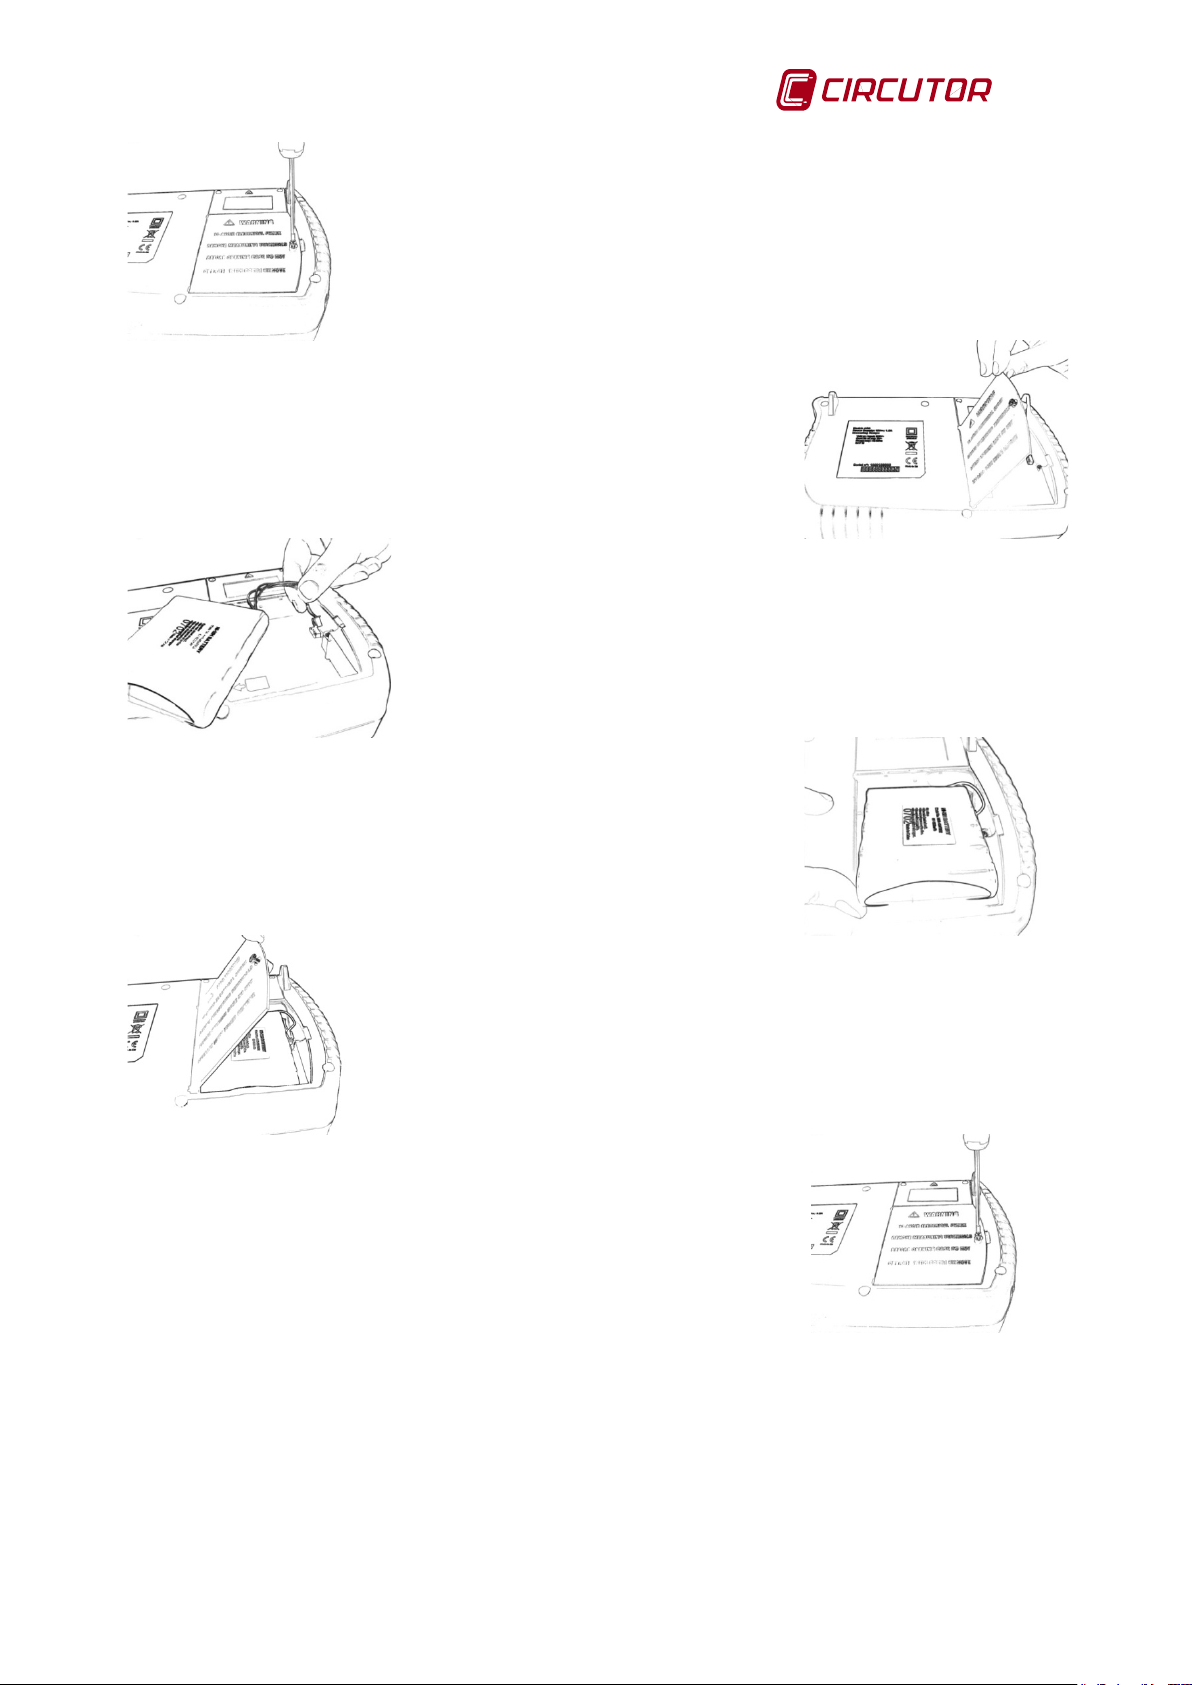
5.1 BATTERY INSTALLATION
The analyzer comes without the battery installed in order to ensure its good condition. The user
must install the battery before taking any other step. To do this, the procedure below must be
followed.
Once installed, we recommend fully charging it for a minimum of 6 hours. Do the same when
replacing the unit's battery with a new one.
In order to install the battery, the unit must be disconnected from any external
power supply.
disconnected.
Page 18 of 69 User Manual
Page 19
AR6 portable network analyzer
connector in the receptacle
5.) Install the cover after verifying that none of the cables have
1.) Remove the screw from the battery cover.
2.) Lift the cover to make the battery compartment accessible.
3.) Insert the battery cables and
indicated for the battery. Make sure that the connector is
positioned correctly, and do not force it.
4.) Once the battery is connected to the unit, position it so that the
power supply cables are not stretched, compressed, and will not
be damaged by the cover.
been damaged and that the battery is firmly in place.
6.) Lock down the cover again with the screw
Fig.5-1.- Steps to insert / replace the battery
User Manual Page 19 of 69
Page 20
AR6 portable network analyzer
MEASUREMENT TYPE
MESSAGE AREA
DATE / TIME
CONFIGURATION
MAIN MENU OPTIONS
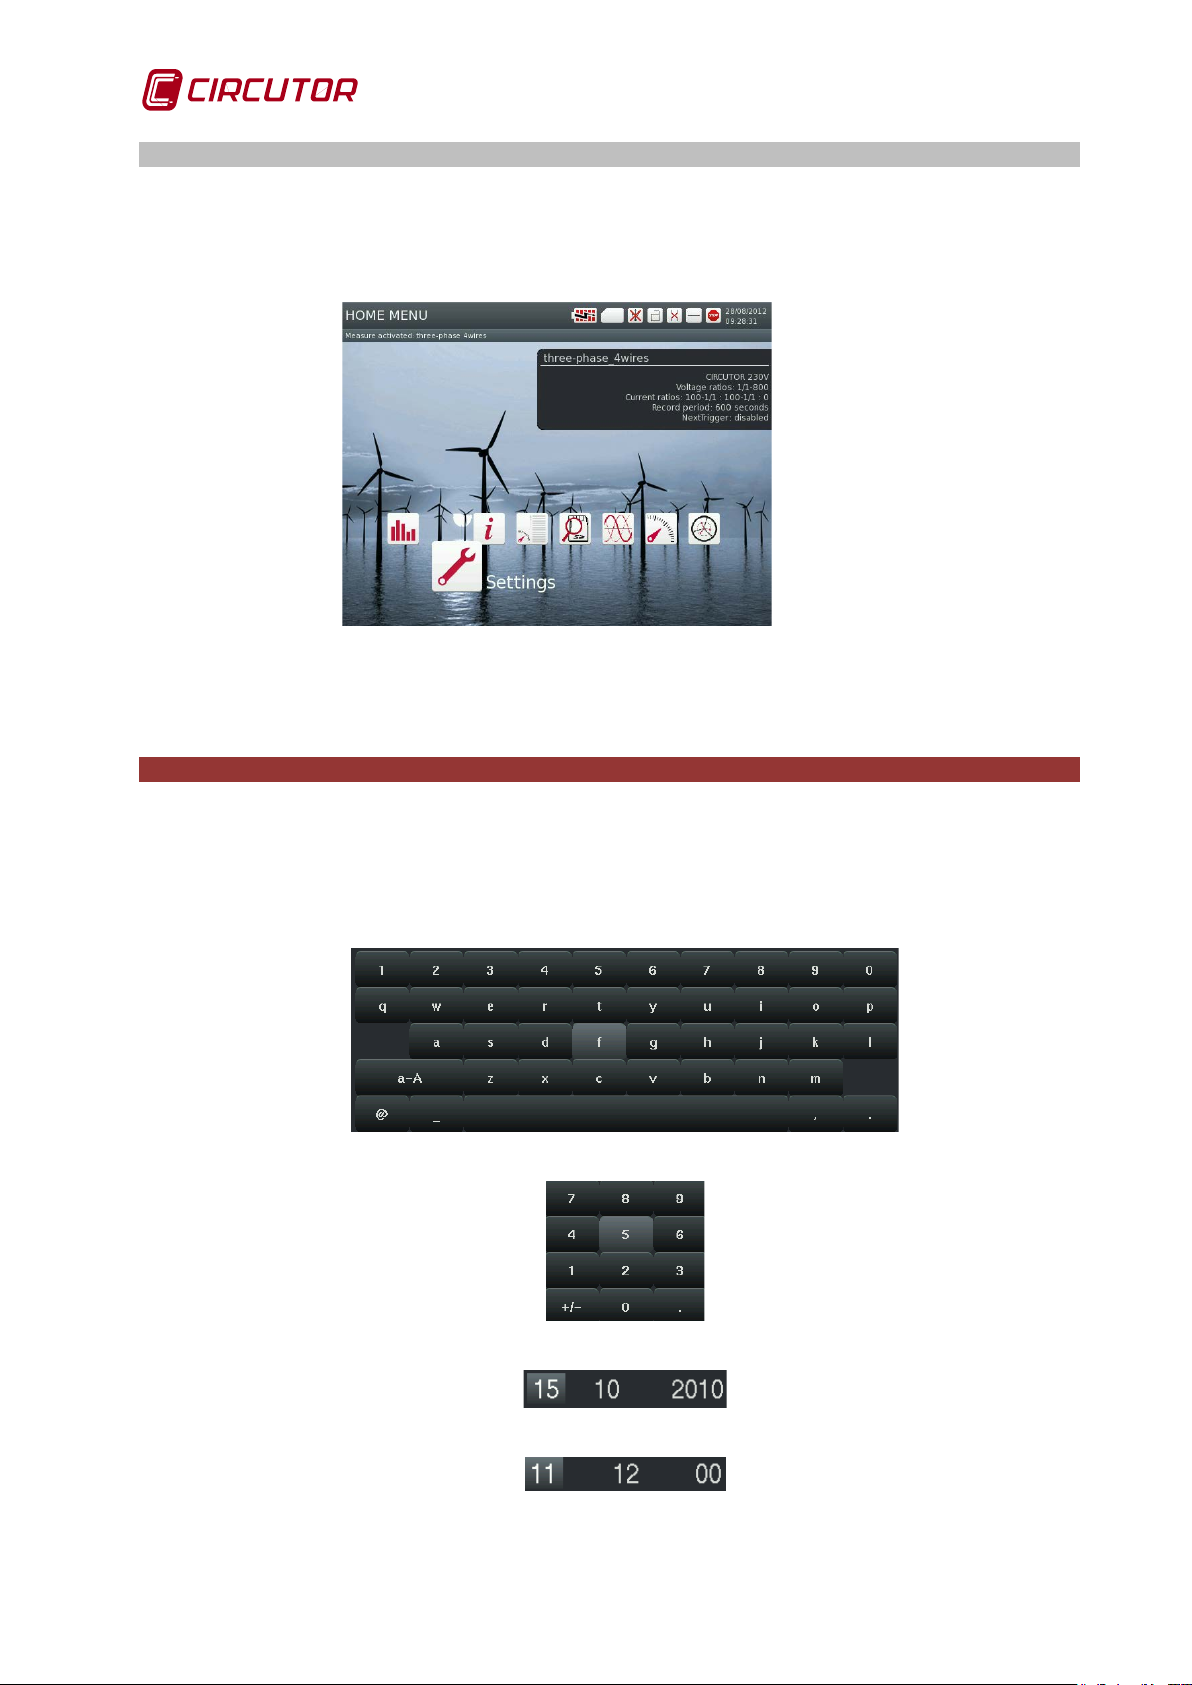
5.2 POWER ON
Once the battery has been installed, press the POWER button and hold it down for a few
seconds. The analyzer will start-up showing the home screen and giving access to the main
menu.
Fig.5-2.- Home screen
6 DROP-DOWN MENUS AND KEYBOARD
To change the value of a field, enter it and click t he ENTER k ey (identified in the following
paragraphs as λ). This opens the virtual keyboard or the possible configuration options for
the field and allows the user to enter any value or text, depending on each case. The keys
or options displayed will be different depending upon the field to be configured.
Alphanumeric:
Numeric:
Date:
Time:
Page 20 of 69 User Manual
Page 21

AR6 portable network analyzer
Selection:
The arrow buttons ◄/ ► and ▼/ ▲ move the selection cursor to the desired menu option. Theλ
button is used to confirm the selection and change to the desired display screen.
The options to cancel, delete or confirm entered values are activated by means of the dynamic
function keys, which functions are displayed at the bottom part of the corresponding screen.
7 MAIN MENU
The main menu of the AR6 has various icons that indicate the different configuration and display
options available to the user in a simple and intuitive manner.
The main menu icons are:
SETTINGS
SYSTEM INFORMATION
MEASUREMENT MANAGER
MEASUREMENT ANAL YSIS
WAVEFORM
METER
PHASORS
QUADRANTS
HARMONICS
Fig.7-1.- Main menu
Fig.7-2.- Main menu:
User Manual Page 21 of 69
Page 22

AR6 portable network analyzer
selection of logging and display parameters of
Allows saving changes to the configuration or
To configure the unit, select first the SETTINGS menu.
8 SETTINGS MENU
The “Settings” menu allows the
the analyzer .
The dynamic menu options for the configuration menu are:
Button Function Description
Main Menu Brings up the main menu
restore the default values.
Configuration options:
When the user enter
The basic menu has four screens, selectable with the dynamic key GO TO :
• BIOS configuration
• Clock setup.
• Decimals
• US B c onfiguration
8.1 BIOS CONFIGURATION
When the BIOS configuration options selected, the screen in Fig.8-1 appears. This screen
allows configuration of most of the common aspects of the unit. This configuration is maintained
for all screens and logs. The configurable items in the BIOS configuration screen are described
below
Fig.8-1.- BIOS configuration screen
8.1.1 Language
This field is to select the language for the unit menus and messages.
Page 22 of 69 User Manual
Page 23

AR6 portable network analyzer
blue
blue
Fig. 8-2.- Clock configuration
The “Clock setup” options allow the
configuration of the date and time format and
WARNING !Changing the unit time will cause all the data logged on the memory
8.1.2 Time to switch off display
This field is to select the time during which the screen will light after the last change. Once this
time has elapsed, the screen will switch OFF and go into a low power status to increase battery
autonomy and life. In this status, the Power ON/OFF button will be flashing in green.
8.1.3 Contrast
This field is to select the screen contrast. This field is given in %. A correct configuration can
extend battery autonomy and life.
8.1.4 Time to lock keyboard
This field is to select Enter the desired time, in minutes, after which the button pad will lock. If
this function is not desired, enter a zero (0) value.
8.1.5 Password
This field is to select a password, if used. Enter a 4-figure password which will be used to
unlock the unit's button pad once the locking time has elapsed.
8.1.6 Phase colours
The AR6 has colour templates to identify the phases. The available names and colours are
shown in the following table:
Table 8-1.- Options of colour codes to identify phases
EU black red yellow blue grey green
UK red yellow blue black grey green
CA red black
USA black red
L1 / A L2 / B L3 / C LN / N LK / K earth
white grey green
white grey green
8.1.7 Screen background
The user can change the screen background using this option of the menu. The selected image
will be used as background for all screens.
8.2 CLOCK SETUP
Displayed parameters:
the desired date and time.
It also allows the selection of time zone.
to be erased
User Manual Page 23 of 69
Page 24

AR6 portable network analyzer
8.3 DECIMALS SETUP
On this screen the user can select the units of measurement and the number of decimal places
to be displayed.
Fig.8-3.- Configuration of the number of decimal places
NOTE: Notice that in the harmonics option the user can select between % (to view the
percentage of each harmonic with respect to the fundamental) or V/I (to view the value of
voltage or current represented by each harmonic)
8.4 USB CONFIGURATION
This option allows the user to enable or disable the AR6's connection to a computer through the
USB channel
8.4.1 Safe memory access
The unit has an internal memory card that stores the logs and parameters for the different
measurements created by the user. To safely access the information on the internal memory
follow these steps:
1. Activate the analyzer's USB-B port in the USB setup menu (The port must be enabled
and in file mode)
2. Connect the USB cable to the computer and the analyzer
3. Access the memory contents from the computer
4. Use th e Safe Eject option to disconnect the disk drive that corresponds to the analyzer
from the computer.
5. Disconnect the USB cable
6. Disable the analyzer in the USB-B port (from the USB Configuration menu)
* The unit automatically disconnects file mode when the user leave this screen.
Not using the Safe Eject option to remove the analyzer's memory unit can
cause irreparable damage to the information contained on the memory or
lock out the unit; in this case the user must switch off the unit to get it
back again.
Page 24 of 69 User Manual
Page 25

AR6 portable network analyzer
The information screen shows a summary of the unit's most important data,
Recover SD: Allows memory card data to be
recovered if a problem is detected.
sections 10.3 and 10.4
9 SYSTEM INFORMATION MENU
such as: serial number, memory status, internal firmware versions, etc.
Viewed parameters:
• Analyzer ser ial number
• Installed update version
• Pr oc essor and software versions (GUI,
DSP and PWS) and language.
• Sof tware version (Linux)
• Bat tery charge level
• Available and total system capacity
Fig.9-1.- Syst em information
The dynamic menu options for this screen are:
Button Function Description
Main Menu Brings up the main menu
Update: Allowing updating of the device software.
9.1.1 Update
The unit copies the *.bin file of the new firmware to be saved on the unit. A process bar
indicates the update status on the unit's screen.
9.1.2 Recover SD
This action should be performed if data loss is detected during logging. If
the user need to delete the information from a log the user must use the
"clear measurement or "clear all measurement" functions explained in
When the user select Recover SD, all the content on the card and the instrument's internal
memory will be deleted. The actions performed by the analyzer are:
- Delete the memory card partitions
- Generate partitions
- Format the card in FAT32 format
- Restore the internal memory.
The unit displays the following warning when this option is selected.
Fig.9-2.- Warning screen
User Manual Page 25 of 69
Page 26

AR6 portable network analyzer
This action should be performed if problems are detected when accessing
installed values and partitions, recovering the areas with access or write
the left and click the ENTER button ,
Fig. 10-1.- List of measurements
The screen displays a list of the various
these measurements may be active at any given
an example; "test" appears marked with a square
with a dot in it, indicating that this is the active
ment allows configuration of the
analyzer for measuring and logging in a specific
u are to create new
, modify existing ones, delete
(clean) files associated with an already existing
or the files of all the existing
measurement
e detail
If "Details" is selected, the unit indicates a PC tool to format the unit's SD card and the
configuration that should be used. (see section 9.1.3 )
9.1.3 Format SD with a PC program
the SD memory. The indicated tool is used to restore the card with its factoryproblems (corrupt areas).
The r ecommended tool to format the SD card is "SD Formatter", available
at
www.sdcard.org/downloads” with the following options activated:
Format Type: Full (OverWrite)
Format Size Adjustment On
10 MEASUREMENT MANAGER MENU
The measurement administrator screen allows the user to create standard
templates in order to configure the unit simply and rapidly for data
acquisition and recording. To start this menu, select the icon in the figure at
measurement files created on the unit. Only one of
moment. The figure shows a list of measurements as
measurement.
One measure
installation.
The options for the dynamic ACTIONS button on this screen are:
Button Function Description
Main Menu Brings up the main menu
The options of this men
measurement files
measurements
measurements, permanently delete a
or activate it. They are all explained in mor
below
Page 26 of 69 User Manual
Page 27

AR6 portable network analyzer
Enables confirmation of the creation of a
measurement.
To create a new measurement, select from among the
AR6 default templates or any of the measurements
Once a name for the new measurement has been
entered, select CREATE. The analyzer displays a
Once created, the current clamps and voltage
(The analyzer will ask for confirmation of the
10.1 CREATE
To create a new measurement file the user must enter the name for the measurement. To
configure it, the user must select it among the available templates, or if necessary select a
measurement from those previously created as templates. To do so, select the Templates option
from the VIEW menu.
Fig. 10-2.- Creation of a new measurement
Fig.10-3.- Previously created templates and measurements
The options for the dynamic ACTIONS button for this screen are:
Button Function Description
BACK Brings up the previous screen.
previously created by the user.
confirmation window before creating the measurement.
transformers ratio configuration screen is displayed.
10.2 MODIFY
The unit allows modification of the measurements created at any time, whether it is the active
measurement or another from the list of measurements.
Editing the active measurement implies the deletion of all the files previously
generated by the measurement.
edition process in order to prevent the user from deleting data accidentally)
User Manual Page 27 of 69
Page 28

AR6 portable network analyzer
the unit warns the user with the following
warnings, as they indicate the deletion of data
TRANSFORMER’S RATIOS:
Circuit, recording time, THD calculation
Conditions to start logging based on
electrical parameters.
clamps
When trying to modify the active measurement,
confirmation message. It is important to read t he
stored in the memory for that measurement.
The dynamic ACTIONS button for all the modification screens offers the options indicated in the
GO TO menu:
Button Function Description
BACK Brings up the previous screen.
Select in order to save the changes
Ratios of transformers used
MEASUREMENT SETUP:
and Maximum Demand.
VARIABLE SELECTION:
Selection of the variables to be logged.
EVQ SETUP:
Detection of quality events *.EVQ
TRANSIENT:
Transient detection
TRIGGER INTERVAL:
Recording period (start and stop time)
PERIODIC TRIGGER:
Repeated periodic recordings
PHOTO CONDITIONS:
Conditions for snapshot capture *.PHO
RECORDING CONDITIONS:
10.2.1 Transformer’s ratios
Fig.10-4.- Transformer’s ratios configuration screen
The unit lets the user configure the voltage transformer ratios as well as the full scale voltage.
The correct configuration of this full scale value enables the unit to work with maximum
accuracy.
When the unit detects that the current clamps are connected it shows the configuration
screen for the voltage transformers and current sensors. The unit detects the ratio of the
Page 28 of 69 User Manual
Configurable Parameters:
• Primary and secondary voltage
• Voltage turndown ratio
• Scale of the clamp installed on the
phase meter.
• Scale of the clamps on neutral
meter.
• Scale of the earth leakage current
Page 29

AR6 portable network analyzer
scale current clamps and configures them
scale clamps or 5 A primary clamps. For all other cases, it
automatically recognises the clamps and configures the current scale
Name
Name of the measurement.
indicate specific
data to facilitate locating or referencing the measurement.
Indicates the configuration of the measurement. The user can
• Three-phase, 4-wire
[50…60 Hz]
where the measurement is
[1…7,200 seconds
the electrical parameters (in seconds). This
[minutes]
should program the energy integration
connected current sensors and shows their scale. If multi-scale sensors are connected, the user
must select manually the desired one. The analyzer shows one by default. The current ratios
can also be modified if the user is measuring at the secondary of a 5A transformer with 5
Ampere clamps, but wishes to view the values measured with respect to the primary of the
installation. Similarly, the ratio by default of the voltage transformer is 1/1. If this is not the case,
the primary and secondary voltages must be programmed for the voltage transformers.
The device recognises singleautomatically. The AR6 only allows configuration of the current transformer’s ratio if
it detects multi-
10.2.2 Measurement configuration
Configuring a measurement involves the creation of a folder where all the configurat i on files and
data records will be saved.
Fig.10-5.- Measurement configuration screen (Example)
The configurable fields on the Measurement screen are:
Table 10-1.- Configurable fields on the measurement screen
Option Description
Description
Description of the measurement. Lets the user
select between:
• Single-phase
Circuit type
• Two-phases
• Three-phases, 3-wire
• ARON three -phase, 3-wire
Nominal frequency
Nominal frequency of the network
being taken. The user can select 50 or 60 Hz
Log period
The log period for
period is commonly used as averaging period for the variables.
Maximum demand
In this field the user
time to perform the Maximum Demand calculation.
User Manual Page 29 of 69
Page 30

AR6 portable network analyzer
to program the integration periods to
). There are
two programming options: a) Juxtaposed consecutive periods
(fixed) or b) Scrolling window (sliding)
select if the measurement is taken with the
Erroneous configuration of
this section will cause measurement errors.
checking the difference in value of leakages seen through a
filtered earth leakage relay (such as the immunised relays
manufactured by CIRCUTOR) or without the filter.
t the form of calculation for the rate of
total harmonic distortion. The options are RMS and
Fundamental (see NOTE)
()% = 100
(
)
Fig. 10-6.- Variables selection screen
Maximum Demand
calculation algorithm
Ground connection
Leakage filter connected
This field a llows the user
obtain Maximum Demand (kWh in a cert ain per iod
This let s the user
earthing cable connected or not.
Activates a high-frequency filter in the measurement. Useful for
THD Algorithm
This let s the user selec
[RMS or fundamental]
NOTE: Forms of calculating THD for a magnitude X
)
(
- Fundamental
Standard sometimes calls it d(X)%, but the IEEE Standard st ill calls it THD(X)%
()
% = 100
- RMS
Distortion refers to the fundamental component (the IEC
)
(
Distortion refers to the total RMS value
10.2.3 Variable selection
On this screen the unit allows the selection of the variables the user wish to log
Screen sections:
• Basic options
• Basic parameters
• Quality
• Harmonics
• Wave shapes
The unit will log the variables that the user selects on this screen. The options are grouped
under the following headings:
Basic options: These options generally affect the overall measurement. For example, the option
to log consumption (2 quadrants) or consumption and generation (4 quadrants). It also lets the
user select whether it must log instantaneous values, maximum and minimum values, averag e
three-phase values, etc.
Basic parameters: This lets the user select the individual variables. Users can select the specific
variables they wish to log, such as voltages, currents, quality parameters, wave shapes and
number of harmonics.
Use the ◄/ ► buttons to move between basic options, basic parameters, quality, harmonics,
wave shapes; use the ▼/ ▲ buttons to move between the variable fields to be selected. Use the
λbutton to activate or deactivate the variable or group of variables.
Page 30 of 69 User Manual
Page 31

AR6 portable network analyzer
Outage hysteresis
5 times, after which the log is permanently disabled to prevent a bad EVQ
10.2.4 Events setup (EVQ setup)
This menu lets the user configure the events logged by the AR6.
Configurable Parameters:
• Enable
• Rated voltage
• Peak threshold
• Peak hysteresis
• Sag threshold
• Sag hysteresis
• Outage threshold
•
Fig.10-7.- Events configuration
Fig.10-8 shows some examples of events that are described below.
Fig.10-8.- Examples of events
Fig.10-8 shows an example of a swell event, bound by time interval t0. The duration of the event
is equal to the time that the signal was above the configured threshold value (equal to 110 % of
Vnom) plus the time that the signal takes to decrease its value, including the programmed
hysteresis, usually 2%.
Other events visible in Fig.10-8 are those bounded by intervals t1, t2 and t3. These events are
two sags (t1 and t3) and one interruption (t2). According to the IEC Standard, a sag means that
the voltage is between 90% and 10% of V
and an interruption means that the voltage drops
nom
below 10% in the three phases. (in this case an outage is logged in interval t2, the duration of
which includes the hysteresis,
Quality events logged by the AR6 must last a minimum of 10 ms. If the event does not last this
long it is not logged as such, although it does affect the calculated average value of that period.
The quality events log is automatically disabled for 10 minutes when it detects
more than 1 event/second for 15 seconds. This deactivation process is repeated
configuration from filling up the analyzer's internal memory.
User Manual Page 31 of 69
Page 32

AR6 portable network analyzer
10.2.5 Transients
The detection of transients lets the user detect different types of voltage wave defects. When
the user clicks on the transients menu option the screen in Fig. 10-11 or similar will appear.
Clicking the” Detection mode" window allows the selection among the following options:
Configurable options for detection method:
• Peak
• Wave
• RMS Va lue
• Disabled
Fig. 10-9.- Configurable options for capturing transients
PEAK
The detection of transients based on the peak value occurs when the absolute value of one or
several voltage samples exceed a certain threshold value set in t his screen. The sett ing should
be large enough to avoid it from being tripped with normal amplitudes or even those slightly
above 110% of the nominal peak value.
The detection is based on phase-neutral voltage value. If there is no neutral, the set value
should be the maximum phase-phase voltage value divided by3
Fig. 10-10.- Peak value defect
Configurable Parameters:
• Peak voltage in V phase to
neutral
Fig. 10-11.- Configuration for transient detection based on Peak value
WAVE
The detection of transients using the “wave” option occurs when there is a defect in the wave
shape so that the it exceeds the limits of a square defined by a threshold value (V phase to
neutral) and a duration (indicated in % of the period)
Page 32 of 69 User Manual
Page 33

AR6 portable network analyzer
screen
15 seconds. This deactivation process is repeated 5
he log is permanently disabled to prevent a bad transient
Fig.10-12.- Wave shape defect
Configurable Parameters:
• Threshold in V , phase to neutral
Fig. 10-13.- Wave shape defect configuration
• Duration in % of the cycle
RMS Values
The detection of transients based on RMS values is achieved by comparing the value of each
cycle of each channel with the RMS value of the previous cycle of the same channel. If the
difference between RMS values exceeds that configured by the user, the current cycle is logged
as a defect. The user can program a difference of between 30 and 800 V
RMS
.
Fig.10-14.- Difference in RMS value defect
Disabled: This option lets the user disable the detection of transients
The transients log is automatically disabled for 10 minutes when it detects more
than 1 transient/second in
times, after which t
detection configuration from filling up the analyzer's internal memory.
10.2.6 Trigger interval
The trigger interval menu lets the user configure the start and end dates and times to activate
the data logging.
User Manual Page 33 of 69
Page 34

AR6 portable network analyzer
conditions created. The active conditions
Configurable Parameters:
• Date and time to start recording
• Date and time to end recording.
Fig.10-15.- Log interval configuration screen
10.2.7 Periodic trigger
The periodic trigger menu lets the user configure the start and end times and the days of the
week to activate the data logging.
Configurable Parameters:
• Recording start time
• Recording end time.
• Day of the week the previous recording
condition must be applied.
Fig.10-16.- Periodic log configuration screen
After configuring a log interval or a periodic log the user must activate this configuration using
the (Enable / Disable) option in the ACTIONS menu. Once the desired logging condition has
been enabled, the user must click the λ (REC/STOP) button
The unit waits for the condition to be met to start logging. This is indicated in the messages area
(Fig.5-2) with the icon.
10.2.8 Photo trigger conditions using measured data
A “Photo” or "snapshot" is an instantaneous log of all the variables measured by the analyzer,
including wave shapes. The PHOTO CONDITIONS menu lets the user configure the logical
equations to trip (trigger) a snapshot (capture of data), using the measured data as trigger
variables. With the create or modify option on the dynamic menu the user can easily and
intuitively create or edit the trip formulas by following the menus
Viewed parameters:
The screen displays the list of “photo”
are indicated with the activated check mark.
Fig.10-17.- Screen showing a trip condition for a snapshot
Upon selecting the create new or edit existing condition option, the following screen is
displayed, in which the user may create the trip conditions needed and may combine them
with other trip operations using the logical functions AND and OR.
Page 34 of 69 User Manual
Page 35

AR6 portable network analyzer
has a limit of 10 different snapshot conditions. After it reaches this limit it
(REC/STOP) log button after
Fig.10-18.- Creation of “photo” trigger conditions
The AR6
does not allow the user to create any more conditions.
To prepare the analyzer to start the data logging in accordance with the programming
of log intervals, periodic logs or transients, click the λ
programming the desired star t-up and stop conditions.
10.2.9 Recording trigger conditions
The network analyzer allows the use of formulae similar to those used for “photo” recordings
to create the trigger conditions for data logging start/stop.
This let s the user program the log recording parameters when certain conditions are met,
otherwise the log will stop.
10.3 CLEAR
Delete the selected measurement files keeping their configuration. This is the recommended
procedure to delete recorded data which are no longer necessary in the analyzer.
10.4 CLEAR ALL
Delete the data for all the measurements the unit has saved, keeping their configuration.
This is the recommended procedure to delete data stored on the analyzer's memory.
10.5 REMOVE
Permanently remove the selected measurement. This option erases the recorded data and
also the configuration.
10.6 ACTIVATE
Change the measurement selected for active logging. It performs the same function as the
confirmation button
User Manual Page 35 of 69
• on a measurement at the cursor location.
Page 36

AR6 portable network analyzer
display logs, snapshots or
. To start this menu, select
Fig. 11-1.- List of measurements
grey cursor to move to the
. The log must be
stopped to analyse a measurement. Once the
11 ME ASUREMENT ANALYSIS MENU
This main menu option lets the user
disturbances logged for each measurement file
the icon in the figure to the left and click the confirmation button
The screen displays a list of the various
measurements created on the unit. Only one of
these measurements will be active.
Use the
measurement to be analysed
measurement has been selected, drop down the
ACTIONS menu to select.
The options for the dynamic ACTIONS button (bottom part of the screen) are:
Key Function Description
Home Brings up the main menu
• Records: Displays the STD registered parameters
• Photos: Displays the Photo registered in the measure
selected.
• Disturbances: Displays the disturbances detected in
the measure selected.
• UNIPEDE table: Allows grouping the registered
quality events in a table.
11.1 RECORDS
Logs are shown on the same display screens as instantaneous parameters . T he diff ere nce
is that the date and time of the displayed log is shown at the top of the screen.
Page 36 of 69 User Manual
Fig.11-2.- Records
Page 37

AR6 portable network analyzer
Allows selection of a date and time to view the
recorded parameters on the screen.
Allows the display to be switched between
instantaneous, maximum and minimum values and
Allows selection between different display options
RMS Values, Quality, Energy, Maximum Demand,
Allows selection of a date and time to view the
recorded parameters on the screen.
display options
RMS Values, Quality, waveform, graph and list of
The options for the dynamic menus of this screen (bottom part of the screen) are:
Key Function Description
BACK Brings up the previous screen.
between consumed and generated values.
shown in the menu.
waveform, graph and list of harmonics.
Within each option it allows selection of the "Go to" option to select the desired display date
and time.
11.2 PHOTOS
The information logged in “PHOTOS” is displayed in the RMS value display tables. The
tables show the instantaneous values of each variable taken at the time of the snapshot.
The options for the dynamic keys (menu at the bottom of screen) are as follows:
Key Function Description
BACK Brings up the previous screen.
User Manual Page 37 of 69
Allows selection between different
shown in the menu.
harmonics.
Page 38

AR6 portable network analyzer
11.3 DISTURBANCES
Disturbances recorded by the analyzer appear on a table, in which a short information about
each one is displayed. The information is preceded by an acknowledgement icon for each
disturbance type and its numerical information as an average voltage value, previous value,
final value and duration.
Parameters displayed:
• Different disturbance types detected (the
Fig. 11-3.- Example of the disturbance type icon
example shows a table with several
types of records)
• The phase affected by the disturbance
• The date and time when the disturbance
occurred.
• The disturbance duration in milliseconds.
Fig. 11-4.- Example of a disturbance table. In this case the selected one is a sag
The disturbances screen lets the user see several types of disturbances. Each one is identified
with an specific icon. Fig.11-5shows the icons identifying different types of disturbances.
NOTE: The configuration of what is considered to be a disturbance corresponds with the
configuration made by the user for the PHOTO and EVQ events logging configuration page.
SWELL
SAG
INTERRUPTION
TRANSIENT
Fig.11-5.- Various types of disturbances that can be logged
The user can move through the various disturbances displayed in the table by using the ▼/ ▲
navigation buttons. Once the cursor is located over a specific disturbance, it is possib le to see
the captured wave shape by clicking the confirmation button λ
11.3.1 Disturbance wave shape
This is a graphic screen showing the wave shape of the event selected from the table. On this
screen, as with the rest of the graphic screens, it is possible to zoom different areas. The
dynamic key ACTIONS , opens a menu to Zoom IN or OUT any zone of the graph.
Fig.11-6.- Examples of wave shape screens
Page 38 of 69 User Manual
Page 39

AR6 portable network analyzer
The selected part of the signal can be magnified
using the ZOOM IN option. The ZOOM OUT option
cancels the magnification of the image displayed.
Allows the selected transients display to be switched
between wave shape and RMS graphic and vice
versa.
The dynamic keys in the waveform screens offer the following functions:
Button Function Description
BACK Brings up the previous screen.
11.3.2 RMS value of a transient or event
This menu option allows the display, in graphic form, of RMS values of a selected event or
transient
Fig.11-7.- RMS value of a transient or event
11.4 UNIPEDE TABLE
The AR6 can view what is known as a UNIPEDE table on its screen. This table is a summary of
the quality events logged by the unit, grouped in accordance with their amplitude and duration;
an example is shown in Fig.11-8.
Fig.11-8.- Example of a UNIPEDE Table
In this table, it is possible to view the events of each phase independently or group them into
a single average value for the three phases (what we will call the three-phase value). The
analyzer performs the time grouping f ollowing the crit eria of the EN 50160 quality standard,
which are summarised below.
User Manual Page 39 of 69
Page 40

AR6 portable network analyzer
11.4.1 Events grouping in accordance with UNIPEDE criteria
- In three-phase systems a swell starts when the value U
of the voltage of one or more
RMS
phases exceeds the set-point for detecting an over-voltage (usually 110% of rated value); it
ends when the value U
for all the phases is less than or equal to the set-point minus the
RMS
configured hysteresis value (t0)
Fig.11-9.- Start and end of a swell in a three-phase system
- In three-phase systems a sag starts when the value U
of the voltage of one or more
RMS
phases is below the threshold for detecting sags (usually 90% of rated value); it ends when
the U
is greater than or equal to the threshold plus the configured hysteresis value (t1)
RMS
or if all phases are below the interruption level (usually 10% of rated value).
Fig.11-10.- Start and end of a sag in a three-phase system
- In three-phase systems an interruption starts when the value U
of the voltage of all the
RMS
phases is below the threshold for detecting interruptions (usually 10% of rated value); it
ends when the value URMS of any phase is greater than or equal to the threshold plus the
configured hysteresis value (t2).
Fig.11-11.- Start and end of an interruption in a three-phase system
In the values shown for the individual phases, the time shown refers to each event; no
grouping is done.
The available dynamic menu options for the UNIPEDE table screen are:
Page 40 of 69 User Manual
Page 41

AR6 portable network analyzer
Updates the data in the table after
reactivating the log without changing the
active measurement.
Allows changing the display of the values in
the table among the individual events of each
Snapshot, captures all the instantaneous values
along with the voltage and
Run, restarts screen refreshing, showing the values
Zoom in and Zoom out operate the zoom to increase
Button Function Description
BACK Brings up the previous screen.
12 WAVEFORM MENU
The WAVEFORM screen shows the temporary graphics for one or several voltages,
for one or several currents or for voltages and currents at the same time. The user
can select the desired phase: L1, L2, L3, LIII or LN
phase or the events grouped in three-phase
Fig.12-1.- Wave shapes screen
The dynamic menu options for the "wave shapes" screen are:
Button Function Description
Main Menu Brings up the main menu
measured by the analyzer
current wave shapes.
Pause, stops screen refreshing,
in real time.
and reduce the image size
User Manual Page 41 of 69
Page 42

AR6 portable network analyzer
L2, L3, L123 or LN
phases in order to display the wave shapes
Fig. 12-2.- Selection of the zoom area
Once the position is locked, the
size of the selection box may be
Allows selection among L1,
individually.
12.1 PHOTO
The Photo option captures all the instantaneous values measured by the analyzer along with
the voltage and current wave shapes.
12.2 PAUSE
The "Pause" option stops screen refreshing and keeps the values of the variables on the screen
12.3 RUN
The "Run" option restarts screen refreshing, showing the values in real time.
12.4 ZOOM IN, ZOOM OUT
The analyzer allows magnification of the image on the wave shapes screen. In order to do this,
the image must be paused. Use the ▼/ ▲ buttons to move the cursor to the "Pause" option of
the ACTIONS menu.
Then select Zoom Image, and a white box with a dashed border appears on the graphics
screen. This is the zoom area.
Use the ◄/ ► and ▼/ ▲ buttons to move the box to the desired area. The λ button confirms the
position of the box and changes the colour to red.
Fig. 12-3.- Zoom area expanded
changed using the ◄/ ► and ▼/
▲ buttons. Once the area is
selected, click λ to zoom.
Once pressed, the selected area is
magnified.
Use the ◄/ ► and ▼/ ▲ buttons to
select Zoom Out and press λ to
undo the zoom
Page 42 of 69 User Manual
Page 43

AR6 portable network analyzer
The METER menu allows to measure and record data. Data are presented in
Allows starting and stopping data recording (Pause /
all
measured by the analyzer
along with the waveforms of voltages and currents.
in a
the name of the active
can erase
the maximum and minimum values stored.
Allows the display to be switched between
It
The user can choose to display the measured and
or power
quality parameters of network or energy or power
• Frequency
13 METER MENU
different screens in table format. The available screens are:
• RMS values screen.
• Power quality screen.
• Ener gy screen.
• Power demand screen.
The dynamic menu options on this screen are as shown below. The different screens are
selected from the dynamic GO TO menu.
Button Function Description
Main Menu Br ings up the main menu
Run). The Photo option allows the capture of
instantaneous values
This PHOTO data ar e recorded in the SD ca rd,
file with extension .PHO and
measure. W ith the Reset options, the user
instantaneous, maximum and minimum values.
also gives consumed and generated values.
calculated electrical parameters (RMS)
demand.
13.1 REAL TIME RMS VALUES SCREEN
The instantaneous values screen appears by default when the user enters t he METER menu. It
displays the RMS values of the basic electrical parameters.
Displayed parameters:
• Phase-neutral voltage, Vpn
• Phase-phase voltage, Vpp
• Current, A
• Active power, kW
• Reactive power, kvarL
• Reactive power, kvarC
• Apparent power, kVA
• Power factor, PF
• cosphi is cosϕ
Fig.13-1.- Example of an RMS instantaneous values screen
User Manual Page 43 of 69
Page 44

AR6 portable network analyzer
Frequency
13.1.1 VIEW maximum or minimum values option (consumed or generated)
There are three basic display models that are selected in the dynamic VIEW menu:
Instantaneous, Maximum and Minimum. If either the Maximum or Minimum option is selected in
the VIEW menu, the screen in Fig.13-2 will appear. In the Powers section, the user can see
Maximum or Minimum values of generated or consumed power. Use the ▼/ ▲ buttons to
toggle between the value, the date and the time at which the maximum or minimum values
occurred. Power consumed is indicated with a red arrow and power generated by a green
arrow .
Viewed parameters:
• Phase-neutral voltage, Vpn
• Phase-phase voltage, Vpp
• Current, A
• Active power, kW
• Reactive power, kvarL
• Reactive power, kvarC
• Apparent power, kVA
• Power factor, PF
• Cos phi angle ϕ
•
Fig.13-2.- Example of a maximum values consumed screen
13.2 POWER QUALITY SCREEN
On this screen the parameters most relevant to the quality of the measured network are
displayed
Displayed parameters:
• Instantaneous flick e r (WA)
• PST Flicker
• Crest factor
• K-Factor
• THD V, THD V odd, THD V even
• THD A, THD A odd, THD A even
• Imbalance V , A
• Asymmetry V , A
Fig.13-3.- Example of instantaneous power quality display
The dynamic menu options for this screen are the same as those indicated in the beginning of
section 0.
13.2.1 VIEW quality maximum or minimum values option
Displays the maximum or minimum values (according to selection) of the quality parameters.
Use the ▼/ ▲ buttons to toggle between these values. For each case, the date and the time at
which the maximum or minimum values occurred is displayed.
The dynamic menu options for this screen are the same as those indicated in the beginning of
section 0.
Page 44 of 69 User Manual
Page 45

AR6 portable network analyzer
•
•
•
•
Energies consumed and generated are
shown separately for all of them
(instantaneous value)
Angles between phases
13.3 ACCUMULATED ENERGY SCREEN
This screen shows t he accumulated values of consumed and generated energy from the last
reset of the energy meters.
Viewed parameters:
Active energy, kWh
Capacitive reactive energy, KvarCh,
Inductive reactive energy, KvarLh,
Apparent energy, kvah,
Fig. 13-4.- Example of accumulated energies screen
The dynamic menu options for this screen are the same as those indicated in the beginning of
section 0.
13.4 MAXIMUM DEMAND SCREEN
This screen measures the maximum or instantaneous energy demand values.
Displayed parameters:
• Total active power [kW] of LIII
• Total apparent power [kVA] of
LIII
• Total current by phase [A] of
Fig. 13-5.- Example of a maximum demand screen
LIII, L1, L2, L3.
The dynamic menu options for this screen are the same as those indicated in the beginning of
section 0 , except for the VIEW menu, which only has the instantaneous and maximum options.
14 PHASORS MENU
The screen shows the phasors representation of the voltages and currents of each
phase and the phase angle of each of them with respect to the voltage in L1.
Displayed Parameters:
• Phasors of V and I
• Modules of V and I and
phase angles referred to V1
•
(L1-L2, L2-L3 and L1-L3)
for V and I
• Phase shift between V and
I of different phases.
• Phase sequence.
User Manual Page 45 of 69
Fig.14-1.-Phasors screen
Page 46

AR6 portable network analyzer
option captures all the instantaneous values along
option stops screen refreshing and the "Run"
option restarts screen refreshing, showing the values in real
time.
Allows selection among L1, L2, L3 in order to display them
instantaneous values
along with the voltage and current wave shapes of the
The "Pause" option stops screen refreshing and the
"Run" option restarts screen refreshing, showing the
values in real time.
The dynamic menu options for this screen are:
Button Function Description
Main Menu Brings up the main menu
The Photo
with the voltage and current wave shapes of the three phases.
15 QUADRANTS MENU
This screen shows the power values of each phase and the three-phase system
as a whole, indicating the quadrant for each one. The powers indicated are:
• Active power kW
• Inductive reactive power kvarL
• Capacit ive reactive power kvarC
• Power factor
• cosphi (Cos ϕ)
The "Pause"
individually or L123 to display them simultaneously
Fig.15-1.- Main screen of the quadrants menu
The dynamic menu options for this screen are:
Button Function Description
Main Menu Brings up the main menu
The Photo option captures all the
three phases.
Page 46 of 69 User Manual
Page 47

AR6 portable network analyzer
This screen displays the harmonics content of voltages and currents
Photo option captures all the instantaneous values
along with the voltage and current wave shapes of the three
The "Pause" option stops screen refreshing and the "Run"
option restarts screen refreshing, showing the values in real
time.
select the voltages and currents displayed
independently and select the phase or phases to display (or
displayed, up to
16 HARMONICS MENU
measured by the instrument. This data can be presented in a bar graph ( Fig.
16-1) or in table format
Move through the spectrum using the ◄/ ► buttons to select the various harmonics. Selecting a
harmonic changes it to dark grey and its values are displayed in the table at the bottom of the
screen; see Fig. 16-1 and Fig.16-2.
Parameters displayed:
• Harmonic distortion.
• THD according to selection
• THD of even harmonics
• THD of odd harmonics
Fig. 16-1.- Graphic representation of harmonics (as an
example, voltage harmonics in the three phases)
• Fundamental
• Fundamental %.
Fig.16-2.- Table at the bottom. Shows general data of harmonics and data for a selected
harmonic in the bar graph(in the example, 11th order harmonic)
The dynamic menu options at the bottom of the screen for the "harmonics" menu are:
Button Function Description
Main Menu Brings up the main menu
The
phases.
Lets the user
neutral for current)
n=50 ,in graphic or in table format (list).
Lets the user select the harmonics to be
User Manual Page 47 of 69
Page 48

AR6 portable network analyzer
When us er enters in the Harmonics menu (graph or table) the screen shows harmonics in real
time. The user can use the "Pause" / “Run” options on the ACTIONS menu to stop refreshing
the screen, or to go back to the real time representation.
Fig.16-3 and Fig.16-4 show an example of the representation in table format.
Fig.16-3.- Harmonics representation in table format (as an example, voltage in the three
phases)
Fig.16-4.- Table at the bottom. Shows general harmonics data and data for the selected
harmonic (in the example, second order harmonic)
The dynamic menu for this screen has the same options as the harmonic graphic screen.
Page 48 of 69 User Manual
Page 49

AR6 portable network analyzer
For measurements requiring connection of the earthing cable, the
active measurement menu must be correctly
17 CONNECTI ON DIAGRAMS
corresponding option in the
configured
17.1 THREE-PHASE CONNECTION WITH NEUTRAL
If the proper clamps are used, this allows measurement of the voltage and current of the three
phases and neutral, voltage between neutral and earth and leakage current.
Fig.17-1.- Connection for measurement of a three-phase system with neutral and earth
17.2 THREE-PHASE CONNECTION WITH NEUTRAL
Measurement of the voltage and current of the three phases and leakage current.
Fig.17-2.- Connection for measurement of a three-phase system without neutral and with earth
17.3 THREE-PHASE ARON CONNECTION
Measurement of the voltage of the three phases.Measurement of the phase current L1-L3 and
calculation of current in L2.Measurement of leakage current.
User Manual Page 49 of 69
Page 50

AR6 portable network analyzer
Fig.17-3.- Connection for measurement of a three-phase system, without neutral, using the Aron
method
17.4 TWO-PHASE CONNECTION
Measurement of the voltage between two phases, current of the two phases and leakage
current.
Fig.17-4.- Connection for measurement of a system with two phases + neutral
17.5 SINGLE-PHASE CONNECTION
Measurement of the voltage and current between phase and neutral, voltage between neutral
and earth and leakage current.
Fig.17-5.- Connection for measuring a single-phase system with earth
Page 50 of 69 User Manual
Page 51

AR6 portable network analyzer
THREE-PHASE CONNECTION 4 WIRES
Display Variables
L1
L2
L3
LN
LIII
LK
Max
Min
Phase-Neutral Voltage
Phase-Phase Voltage
Current
Consumed Active Power
Consumed Inductive Power
Consumed Capacitive Power
Consumed Apparent Power
Consumed Power Factor (*)
Consumed Cos Phi (*)
Generated Active Power
Generated Inductive Power
Generated Capacitive Power
Generated Apparent Power
Generated Power Factor (*)
Generated Cos Phi (*)
Crest factor
K - Factor
Voltage THD
Voltage THD even
Voltage THD odd
Current THD
Current THD even
Current THD odd
Inst. Flicker (WA)
PST Flicker
Frequency
Voltage Imbalance
Voltage Asymmetry
Current Imbalance
Current Asymmetry
Voltage Harmonics (1-50)
Current Harmonics (1-50)
Active Power Maximum Demand
Apparent Power Maximum Demand
Average Current Maximum
Demand
Current L1, L2, L3 Maximum
Demand
Consumed Active Energy
17.6 MEASURED / CALCULATED ELECTRICAL PAR AMETERS IN ACCORDANCE WITH THE CONNECTION TYPE
User Manual Page 51 of 69
Page 52

AR6 portable network analyzer
Consumed Inductive Energy
Consumed Capacitive Energy
Consumed Apparent Energy
Generated Active Energy
Generated Inductive Energy
Generated Capacitive Energy
Generated Apparent Energy
Wave shapes
Phasor representation
THREE-PHASE CONNECTION 3 WIRES / ARON THREE-PHASE 3 WIRES
Display Variables
L1
L2
L3
LN
LIII
LK
Max
Min
Phase-Neutral Voltage
Phase-Phase Voltage
Current
Consumed Active Power
Consumed Inductive Power
Consumed Capacitive Power
Consumed Apparent Power
Consumed Power Factor (*)
Consumed Cos Phi (*)
Generated Active Power
Generated Inductive Power
Generated Capacitive Power
Generated Apparent Power
Generated Power Factor (*)
Generated Cos Phi (*)
Crest factor
K - Factor
Voltage THD
Voltage THD even
Voltage THD odd
Current THD
Current THD even
Current THD odd
Inst. Flicker (WA)
PST Flicker
Frequency
Voltage Imbalance
Voltage Asymmetry
Current Imbalance
Current Asymmetry
Voltage Harmonics (1-50)
Current Harmonics (1-50)
(*) The cosine and power factor angles have a default value of 1 if there are no variables for their calculation
Page 52 of 69 User Manual
Page 53

AR6 portable network analyzer
Active Power Maximum Demand
Apparent Power Maximum
Demand
Average Current Maximum
Demand
Current L1, L2, L3 Maximum
Demand
Consumed Active Energy
Consumed Inductive Energy
Consumed Capacitive Energy
Consumed Apparent Energy
Generated Active Energy
Generated Inductive Energy
Generated Capacitive Energy
Generated Apparent Energy
Wave shapes
Phasor representation
TWO-PHASE CONNECTION
Display Variables
L1
L2
L3
LN
LIII
LK
Max
Min
Phase-Neutral Voltage
Phase-Phase Voltage
Current
Consumed Active Power
Consumed Inductive Power
Consumed Capacitive Power
Consumed Apparent Power
Consumed Power Factor (*)
Consumed Cos Phi (*)
Generated Active Power
Generated Inductive Power
Generated Capacitive Power
Generated Apparent Power
Generated Power Factor (*)
Generated Cos Phi (*)
Crest factor
K - Factor
Voltage THD
Voltage THD even
Voltage THD odd
Current THD
Current THD even
Current THD odd
Inst. Flicker (WA)
PST Flicker
(*) The cosine and power factor angles have a default value of 1 if there are no variables for their calculation
User Manual Page 53 of 69
Page 54

AR6 portable network analyzer
Frequency
Voltage Imbalance
Voltage Asymmetry
Current Imbalance
Current Asymmetry
Voltage Harmonics (1-50)
Current Harmonics (1-50)
Active Power Maximum Demand
Apparent Power Maximum Demand
Average Current Maximum Demand
Current L1, L2, L3 Maximum
Demand
Consumed Active Energy
Consumed Inductive Energy
Consumed Capacitive Energy
Consumed Apparent Energy
Generated Active Energy
Generated Inductive Energy
Generated Capacitive Energy
Generated Apparent Energy
Wave shapes
Phasor representation
SINGLE-PHASE CONNECTION
Display Variables
L1
L2
L3
LN
LIII
LK
Max
Min
Phase-Neutral Voltage
Phase-Phase Voltage
Current
Consumed Active Power
Consumed Inductive Power
Consumed Capacitive Power
Consumed Apparent Power
Consumed Power Factor (*)
Consumed Cos Phi (*)
Generated Active Power
Generated Inductive Power
Generated Capacitive Power
Generated Apparent Power
Generated Power Factor (*)
Generated Cos Phi (*)
Crest factor
K - Factor
Voltage THD
(*) The cosine and power factor angles have a default value of 1 if there are no variables for their calculation
Page 54 of 69 User Manual
Page 55

AR6 portable network analyzer
Voltage THD even
Voltage THD odd
Current THD
Current THD even
Current THD odd
Inst. Flicker (WA)
PST Flicker
Frequency
Voltage Imbalance
Voltage Asymmetry
Current Imbalance
Current Asymmetry
Voltage Harmonics (1-50)
Current Harmonics (1-50)
Active Power Maximum Demand
Apparent Power Maximum Demand
Average Current Maximum Demand
Current L1, L2, L3 Maximum Demand
Consumed Active Energy
Consumed Inductive Energy
Consumed Capacitive Energy
Consumed Apparent Energy
Generated Active Energy
Generated Inductive Energy
Generated Capacitive Energy
Generated Apparent Energy
Wave shapes
Phasor representation
(*) The cosine and power factor angles have a default value of 1 if there are no variables for their calculation
18 SCREEN I NFORMATION
Information about the analyzer screen and location of the various icons that appear on the
upper bar of the analyzer menu are described below. Some icons change status based on
programming, recording, memory or battery conditions.
18.1 UPPER BAR ICONS
The icons on the upper part of the screen indicate the status of the unit and are present on all
screens. Each one's location on the screen and a brief description is shown in the figure
User Manual Page 55 of 69
Page 56

AR6 portable network analyzer
The battery charge level is at its minimum. The user must immediately connect
The unit is being powered by the battery and this shows the battery charge
The unit is being powered by an auxiliary power supply and the battery is in
Indicates that the unit is locked with a password to prevent other users from
18.2 BATTERY CHARGE
the auxiliary power supply.
status.
the process of being charg ed.
18.3 BUTTON PAD LOCK
Indicates that the unit does not have the button pad password enabled
changing its configuration.
18.4 PHASES CONNECTION
Fig.18-1.- Main screen
Indicates that the sequence of phases connected to the analyzer is correct.
Indicates that the unit has a possible connection area in the phases.
Page 56 of 69 User Manual
Page 57

AR6 portable network analyzer
Indicates that the analyzer is not detecting any event or transient based on the
Indicates that the unit is detecting an event at the moment, based on the
Indicates to the user that the analyzer is in display mode. This icon allows the
Indicates that the unit has a trip (trigger) programmed to periodically perform
Indicates that the memory is full and the user must clear it in order to make
Indicates that the unit has communications through the USB port enabled. In
Indicates that the analyzer is in the process of capturing the instantaneous
18.5 EVENT DETECTION
configuration established by the user.
configuration established by the user.
Indicates that the detection and logging of quality events (EVQ) or transients
events (TRN) has been automatically disabled.
18.5.1 Recording status
unit configuration parameters to be modified.
REC indicates to the user that the unit is in recording mode.
an automatic logging.
There are three kinds of trip (trigger) conditions to obtain and log data.
NOTE: The trip function only operates when the analyzer is in the log (REC) mode.
• Time interval trigger: Log of electrical parameters is activated in a specific
programmed time interval.
• Periodic trigger: Repetitive and periodic log of electrical parameters is activated in a
specific programmed time interval.
• Variable: Log is activated when a specific variable meets a programmed trigger
condition.
18.5.2 Memory capacity
Indicates that the internal memory of the analyzer is empty
Indicates that 60% of the unit's memory is free.
new recordings.
18.5.3 USB connection
Indicates that the USB port of the unit is not activated.
this status the unit does NOT allow data logging.
18.5.4 Photo
parameters and wave shapes of a photo.
User Manual Page 57 of 69
Page 58

AR6 portable network analyzer
18.6 MENU TREE
Menu tree navigation is performed by choosing the desired option using the ◄/► cursor
buttons. Select the desired option from the menu and validate it by clicking the central
button λ.
Fig.18-2.- Menu tree
Page 58 of 69 User Manual
Page 59

AR6 portable network analyzer
The size of the REC files will vary in accordance with the parameters
occupies 4,230 bytes, for a total of 5,816 bytes≈ 6 kb
18.7 SWITCHING OFF THE ANALYZER
To switch off the analyzer, press the POWER button. An alert message appears
indicating that the system will shut down, allowing the user to confirm or cancel
(Fig.18-3).
This alert also appears when the battery charge level is critical, and advises the user to
connect the analyzer to the external power supply in order to charge the battery.
Fig.18-3.- Switch off alert message
19 TYPES OF FILES GENERATED
19.1 REC.STD FILES
This type of file stores logs with the average value of the variables for the configured
logging time. The voltages and currents are indicated in RMS value. Each log also
contains a wave shape capture for one cycle of all the channels. The variables logged in
each capture vary depending on the configured connection type (three-phase 4 wire,
three-phase 3 wire / three-phase 3 wire (Aron), two-phase or single-phase connections)
and the user's selection (see the tables below).
selected for logging . The file hea der has a size of 1,586 bytes and each
logging (in 4 wire three-phase measuring with all the variables selected)
The variables for each connection type are shown in the following tables.
User Manual Page 59 of 69
Page 60

AR6 portable network analyzer
THREE PHASE 4 WIRES CONNECTION
STD recording variables
L1
L2
L3
LN
LIII
LK
Máx
Mín
Phase-Neutral Voltage
X X X X X X
X
Phase-Phase Voltage
X X X X X
X
Current X X X X X X X X
Consumed Active Power
X X X X X
X
Consumed Inductive Power
X X X
X X X
Consumed Capacitive Power
X X X
X X X
Consumed Apparent Power
X X X
X X X
Consumed Power Factor
X X X
X X X
Consumed Cos Phi
X X X
X X X
Generated Active Power
X X X
X X X
Generated Inductive Power
X X X
X X X
Generated Capacitive Power
X X X
X X X
Generated Apparent Power
X X X
X X X
Generated Power Factor
X X X
X X X
Generated Cos Phi
X X X
X X X
Crest factor
X X X X
X
K Factor X X X X X
Voltage THD
X X X X X
X
Current THD
X X X X X
X
Inst. Flicker (WA)
X X X X
PST Flicker
X X X X Frequency
X
X
X
Voltage Imbalance
X
X
X
Voltage Asymmetry
X
X
X
Current Imbalance
X
X
X
Current Asymmetry
X
X
X
Voltage Harmonics (1-50)
X X X
X
Current Harmonics (1-50)
X X X
X
Active Power Maximum Demand
X
Apparent Power Maximum Demand
X
Average Current Maximum Demand
X
Current L1, L2, L3 Maximum Demand
X X X
Consumed Active Energy
X
Consumed Inductive Energy
X
Consumed Capacitive Energy
X
Consumed Apparent Energy
X
Generated Active Energy
X
Generated Inductive Energy
X
Generated Capacitive Energy
X
Generated Apparent Energy
X
Page 60 of 69 User Manual
Page 61

AR6 portable network analyzer
THREE PHASE 3 WIRES or THREE PHASE 3 WIRES ARON CONNECTIONS
STD recording variables
L1
L2
L3
LN
LIII
LK
Máx
Mín
Phase-Neutral Voltage
Phase-Phase Voltage
X X X X X
X
Current
X X X X X X
X
Consumed Active Power
X X X X X
X
Consumed Inductive Power
X X X X X
X
Consumed Capacitive Power
X X X X X
X
Consumed Apparent Power
X X X X X
X
Consumed Power Factor
X X X X X
X
Consumed Cos Phi
X X X X X
X
Generated Active Power
X X X X X
X
Generated Inductive Power
X X X X X
X
Generated Capacitive Power
X X X X X
X
Generated Apparent Power
X X X X X
X
Generated Power Factor
X X X X X
X
Generated Cos Phi
X X X X X
X
Crest factor
X X X
X
X
K Factor
X X X
X
X
Voltage THD
X X X
X
X
Current THD
X X X
X
X
Inst. Flicker (WA)
X X X
PST Flicker
X X X
Frequency
X
X
X
Voltage Imbalance
X
X
X
Voltage Asymmetry
X
X
X
Current Imbalance
X
X
X
Current Asymmetry
X
X
X
Voltage Harmonics (1-50)
X X X
Current Harmonics (1-50)
X X X
Active Power Maximum Demand
X
Apparent Power Maximum Demand
X
Average Current Maximum Demand
X
Current L1, L2, L3 Maximum Demand
X X X
Consumed Active Energy
X
Consumed Inductive Energy
X
Consumed Capacitive Energy
X
Consumed Apparent Energy
X
Generated Active Energy
X
Generated Inductive Energy
X
Generated Capacitive Energy
X
Generated Apparent Energy
X
User Manual Page 61 of 69
Page 62

AR6 portable network analyzer
TWO PHASE CONNECTION
STD recording variables
L1
L2
L3
LN
LIII
LK
Máx
Mín
Phase-Neutral Voltage
X
X
X X
X
X
Phase-Phase Voltage
X
X
X
X
Current
X
X
X
X X X
X
Consumed Active Power
X
X
X
X
X
Consumed Inductive Power
X
X
X
X
X
Consumed Capacitive Power
X
X
X
X
X
Consumed Apparent Power
X
X
X
X
X
Consumed Power Factor
X
X
X
X
X
Consumed Cos Phi
X
X
X
X
X
Generated Active Power
X
X
X
X
X
Generated Inductive Power
X
X
X
X
X
Generated Capacitive Power
X
X
X
X
X
Generated Apparent Power
X
X
X
X
X
Generated Power Factor
X
X
X
X
X
Generated Cos Phi
X
X
X
X
X
Crest factor
X
X
X
X
K Factor
X
X
X
X
Voltage THD
X
X X
X
X
Current THD
X
X X
X
X
Inst. Flicker (WA)
X
X X
PST Flicker
X
X X
Frequency
X
X
X
Voltage Imbalance
X
X
X
Voltage Asymmetry
X
X
X
Current Imbalance
X
X
X
Current Asymmetry
X
X
X
Voltage Harmonics (1-50)
X
X X
Current Harmonics (1-50)
X
X X
Active Power Maximum Demand
X
Apparent Power Maximum Demand
X
Average Current Maximum Demand
X
Current L1, L2, L3 Maximum Demand
X
X
Consumed Active Energy
X
Consumed Inductive Energy
X
Consumed Capacitive Energy
X
Consumed Apparent Energy
X
Generated Active Energy
X
Generated Inductive Energy
X
Generated Capacitive Energy
X
Generated Apparent Energy
X
Page 62 of 69 User Manual
Page 63

AR6 portable network analyzer
SINGLE PHASE CONNECTION
STD recording variables
L1
L2
L3
LN
LIII
LK
Máx
Mín
Phase-Neutral Voltage
X
X
X X
X
Phase-Phase Voltage
Current X
X X X X X
Consumed Active Power
X
X
X
X
Consumed Inductive Power
X
X
X
X
Consumed Capacitive Power
X
X
X
X
Consumed Apparent Power
X
X
X
X
Consumed Power Factor
X
X
X
X
Consumed Cos Phi
X
Generated Active Power
X
X
X
X
Generated Inductive Power
X
X
X
X
Generated Capacitive Power
X
X
X
X
Generated Apparent Power
X
X
X
X
Generated Power Factor
X
X
X
X
Generated Cos Phi
X
X
X
X
Crest factor
X
X
X
K Factor X
X
X
Voltage THD
X
X
X
X
Current THD
X
X
X
X
Inst. Flicker (WA)
X
X
PST Flicker
X
X Frequency
X
X
X
Voltage Imbalance
X
X
X
Voltage Asymmetry
X
X
X
Current Imbalance
X
X
X
Current Asymmetry
X
X
X
Voltage Harmonics (1-50)
X
X Current Harmonics (1-50)
X
X
Active Power Maximum Demand
X
Apparent Power Maximum Demand
X
Average Current Maximum Demand
X
Current L1, L2, L3 Maximum Demand
X
Consumed Active Energy
X
Consumed Inductive Energy
X
Consumed Capacitive Energy
X
Consumed Apparent Energy
X
Generated Active Energy
X
Generated Inductive Energy
X
Generated Capacitive Energy
X
Generated Apparent Energy
X
X
X
X
User Manual Page 63 of 69
Page 64

AR6 portable network analyzer
4,700 bytes≈ 5 kb
measuring with all the variables selected) occupies 2,094 bytes, for a total of
2,328 bytes≈ 3 kb
19.2 PHO.STD FILE
This kind of file contains logs of the instantaneous electrical parameters measured by the
analyzer during a network cycle. A photo trip may be caused by:
• Manual trip: All data display screens allow a photo to be taken manually using the
PHOTO option of the ACTIONS menu.
• Trip due to a photo condition: The trip condition is usually connected to a variable
value.
In a PHOTO.STD file the instrument stores various “photos” made in t he same measurement
set of files. In each “photo”, all variables measured by the AR6 are logged instantaneously,
along with one cycle wave shape of all input channels.
The PHO file header has a size of 1,222 bytes and each logging (in 4 wire threephase measuring with all the variables selected) occupies 3,478 bytes, for a total of
19.3 EQV.STD FILE
This file type contains logs of quality events in any of the 3 voltage channels L1, L2, or L3.
Events detection can be configured to detect.
Voltage sags
Swells
Voltage interruptions
The various events that are detected in the electrical network being analysed are stored in this
file. The following data is stored from each one of the events.
• Dat e of Event: This is the date the event occurred. This value is obtained with a 1 cycle
accuracy.
• Event type: The event is stored if it is an interruption, a sag, or a swell in the limits
defined in setup of the AR6. The record indicates the phase in which it occurred,
• Dur at i on of the Event: Duration in milliseconds.
• Minimum and maximum voltage of the Event: When an interruption or sag is
produced, the minimum RMS½* voltage value obtained during the event is stored. The
maximum value will be saved if the event is a swell.
• M ean voltage of the Event: This is the average of RMS½* voltages during the duration
of the transient.
• Voltage previous to the Event: The RMS½* voltage value just before the event started.
• Wave shape from 2 cycles of the event: The analyzer stores a record of the half cycle
previous to the detection of the event. The record finishes one-half cycles after the event
has finished. This leaves it perfectly delimited, shows its c omplete course and allows a full
analysis.
The RMS½ Value* is the RMS value of a voltage or current, re-calculated every half cycle, in
accordance with EN 61000-4-30
The EVQ file header has a size of 234 bytes and each log (in 4 wire three-phase
Page 64 of 69 User Manual
Page 65

AR6 portable network analyzer
Event Name
Description
BAT_OFF
Battery level that causes the unit to switch off.
CLEAR_ENERGY
Deleting energy.
Deleting maximum values, minimum values or maximum and
minimum values.
CLEAR_MAX_DEMAND
Deleting maximum demand.
Change of a configuration parameter other than transformer’s
ratios
_CHANGED
SETUP_TIME_CHANGED
Change of date and/or time
of the REC_START event)
Exiting a trip time window (associated with the immediate
of the REC_STOP event)
DELETED_STD_FILE
Deleting configuration files due to erasing a measurement
POWER_ON
Unit switched on
POWER_OFF
Unit switched off
REC_STOP
Stop manual or trip logging
REC_START
Start manual or trip logging
TRIGGER_CONDITION_ON
Trip activation due to a variable condition
TRIGGER_CONDITION_OFF
Trip deactivation due to a variable condition
EVQ / TRN per second for 15 sec.)
Automatic enabling of events or transients (after 10 min. has
elapsed since deactivation)
19.4 LOG.EVA FILES
The AR6 analyzer has a log type called EVA in which the device's events are stored. A
device event is understood as any change of the measurement configuration that
affects the header of STD files, such as switching the unit ON or OFF, modifying the
transformer’s ratios, battery charge status, deleting maximum values or other
parameters. The complete list of events is shown in Table 19-1.
Table 19-1.- Table of variables for LOG.EVA files
CLEAR_MAX_MIN
SETUP_CHANGED
SETUP_TRANS_RATIO
TRIGGER_ON
TRIGGER_OFF
Change of transformer’s ratio configurations
Entering in a trip time window (associated with the immediate
subsequent generation
subsequent generation
EVQ_STOP
EVQ_START
Automatic deactivation of events or transients (after detecting 1
User Manual Page 65 of 69
Page 66

AR6 portable network analyzer
Updating removes *.EVQ, *.PHO and *.REC files due to a change in its their
internal structure. Make sure to copy the data stored on the memory before
19.5 LOGS LOCATION
The recorded files are located in the internal memory of the analyzer, in the subdirectory
DB_Measures.
Subdirectories as well as measurements/configurations that may have been created are
all found in this subdirectory.
The AR6 analyzer always measures, calculates and records according to an active
measurement configuration (see CONFIGURATION), thus the recording files stored in
the subdirectory corresponding to the measurement active at the time of recording.
19.6 FILE DOWNLOADING
• Switch on the analyzer and enable the analyzer's USB port communication using
the USB Configuration function.
• Connect the analyzer to the PC using the supplied USB cable and the computer
will detect the analyzer and recognise it as an external drive.
• Recover the files from the corresponding measurement file on the external drive
unit.
Do not leave the USB activation screen to communicate with the analyzer as the
unit modifies the port configuration when the user exits this screen.
20 SOFTWARE UPDATE
the user update the analyzer.
To update the AR6 analyzer the user must download the firmware version from the CIRCUTOR
web site:
Follow the steps indicated in the update manual. The steps may vary depending on the unit
version.
21 POW ER VISIO N PLUS
Power Vision Plus is the software that lets the user download and manage the data logged by
the AR6 network analyzer.
http://www.circutor.es/noticias/ar6-new-firmware_n_1046.aspx
Page 66 of 69 User Manual
Page 67

AR6 portable network analyzer
It is a tool that helps users the analysis of data through graphics and tables.
Power Vision Plus is an essential tool to run reports and audits as it lets the user export the
images and attach them to documents.
For more information, download the full Power Vision Plus manual from the CIRCUTOR
website:
www.circutor.es
22 FREQUENTLY ASKED QUESTIONS
22.1 CAN I EXPAND THE ANALYZER'S INTERNAL MEMORY?
Users can expand the unit's memory capacity by changing the SD. The SD must have FAT32
format and may have up to 32 Gb of capacity.
22.2 THE UNIT IS NOT RESPONDING TO THE BUTTONS. WHAT COULD BE HAPPENING AND HOW CAN I FIX IT?
Generally the locking is caused by clicking a sequence of buttons that lock it out. To unlock the
buttons, briefly press the unit's off button. The unit will then respond to all buttons.
22.3 WHAT DOES THE UNIT LOG WHEN IT TA KES A SNAPSHOT?
The analyzer logs 1 wave shape cycle of the 9 channels with resolution of 128 samples per
channel, as well as the RMS values of the instantaneous, variables, harmonics, phasors and
energy. Maximum and minimum values, quality parameters and maximum demand.
22.4 WHAT DOES IT LOG WHEN IT CAPTURES THE WAVE SHAPE OF AN EVENT?
It logs 2 wave shape cycles, ½ of the previous cycle and 1½ cycles after the detection of the
event, with a resolution of 128 samples per channel.
22.5 WHAT SOFTWARE IS USED TO ANALYSE THE LOGGED DATA?
The data is downloaded and analysed with the Power Vision Plus software that comes with the
unit.
User Manual Page 67 of 69
Page 68

AR6 portable network analyzer
No returns will be accepted and no unit will be repaired or replaced if it is
not accompanied by a report indicating the defect detected or the reason
The guarantee will be void if the unit has been improperly used or the
storage, installation and maintenance instructions listed in this manual
National Electrical Code or that
surpassing the limits indicated in the technical and environmental
23 MAINTENANCE AND TECHNICAL SERVICE
In the case of any query in relation to unit operation or malfunction, please contact the
CIRCUTOR, SA
CIRCUTOR Technical Assistance Service (TAS)
Vial Sant Jordi, s/n 08232 - Viladecavalls (Barcelona)
Tel.: 902 449 459 (Spain) / +34 937 452 900 (outside of Spain)
e-mail:
WEBSITE:
24 GUARANTEE
CIRCUTOR guarantees its products against any manufacturing defect for two years after the
delivery of the unit.
CIRCUTOR will repair or replace any defective factory product returned during the guarantee
period.
sat@circutor.es
Technical Assistance Service.
www.circutor.es
•
for the return.
•
have not been followed. "Improper usage" is defined as any operating or
storage condition contrary to the
features of this manual.
CIRCUTOR
•
other parts of the installation, nor will it cover any possible sanctions
derived from a possible failure, improper installation or "improper usage"
of the unit. Consequently, this guarantee does not apply to failures
occurring in the following cases:
- Swells and/ or electrical disturbances in the supply;
- Water, if the product does not have the appropriate IP classification;
- Poor ventilation and/or excessive temperatures;
- Improper installation and/or lack of maintenance;
accepts no liability due to the possible damage to the unit or
- Buyer repairs or modifications without the manufacturer's authorisation.
Page 68 of 69 User Manual
Page 69

AR6 portable network analyzer
25 CE certification
User Manual Page 69 of 69
 Loading...