

Page 1

Portable DWDM OTDR
OPERATING MANUAL
ChallengerOptics
CO-OTDR-DWDM
ChallengerOptics.com
Wavelength Specic Optical Testing and Measurement Equipment
1.0 Using This Manual .........................................3
2.0 Safety ....................................................4
3.0 Quick Start Guide .........................................6
4.0 Inspection and Identication...............................8
4.1 Inspection
4.2 Identication and Conguration
5.0 OTDR Description .........................................9
5.1 OTDR Physical Description
5.2 Home Screen Display
5.3 Power Requirements
5.4 Battery Replacement
6.0 OTDR Operations.........................................12
6.1 Key Pad
6.2 Entering OTDR Function
6.3 Icon Denitions
6.4 Main OTDR screen
6.5 OTDR Parameter Settings Screen
6.6 Auto Test
6.7 Manual Exper t Mode
6.8 Trace Analysis
6.9 Loss Measurements
6.10 Loss Measurement Settings
6.11 Event Analysis
7.0 Project Management .....................................28
7.1 Project Management Description
7.2 Project Management Operation
8.0 File Management.........................................32
8.1 File Management Description
8.2 File Management Operation
9.0 Tunable Laser Source . . . . . . . . . . . . . . . . . . . . . . . . . . . . . . . . . . . . .35
9.1 Laser Safety
9.2 TLS Quick Star t Guide
9.3 Operation
10.0 Fault Locate..............................................41
10.1 Fault Locater Description
10.2 LTS Fault Locater Operation
11.0 Video Scope..............................................45
11.1 Entering Video Scope Function
11.2 Video Scope Display
11.3 Video Scope File/Help Icon Menu
11.4 Video Scope Operations Icon Menu
11.5 Video Scope Operation
11.6 Pass/Fail Criteria Tables
12.0 Visual Fault Locater.......................................50
12.1 VFL Safety
12.2 VFL Description
12.3 VFL Operation
13.0 Specications . . . . . . . . . . . . . . . . . . . . . . . . . . . . . . . . . . . . . . . . . . . . 51
14.0 Repair/Warranty/ Version Control .........................53
14.1 Repair Information
14.2 Warranty Information
14.3 Version Control
CONTENTS
090817
Page 2

ChallengerOptics.com
Wavelength Specic Optical Testing and Measurement Equipment
Chapter 1.0 - Using this Manual / 03
ChallengerOptics.com
Wavelength Specic Optical Testing and Measurement Equipment
This manual contains operation information for the Challenger Cable Sales CO-OTDR Optical Time
Domain Reectometer. This OTDR may be operated by using the touch scree or the on board key
pad. The touch screen is a resistive style screen and only proper stylus devices should be used
when operating the OTDR using the touch screen capability.
This guide is written to instruct operation via the on board keypad. There will be tips throughout
the manual to assist with touch screen operation.
PRECAUTIONS
Optical time domain reectometer are optical instruments that do emit laser radiation
and though this level of radiation is not considered a danger, there are safety
considerations and certain practices that should be followed.
Please read and follow all warning and caution information noted in this manual.
There are warnings, cautions and notes posted throughout this manual.
WARNING
A warning alerts to situations that could cause personal injury.
CAUTION
A caution alerts to situations that may cause damage to the equipment or produce poor
testing conditions resulting in inaccurate test results.
Information contained in this manual is believed to be accurate and reliable. However, no
responsibility is assumed by Challenger Cable Sales for its use nor for any infringements
of patents or other rights of third parties that may result from its use. No license is
granted by implication or otherwise under any patent rights of Challenger Cable Sales.
The information contained in the publications is subject to change without notice.
Chapter 2.0 - Safety / 04
Chapter 3 of this manual is a quick start guide. Prior to using the quick start guide or operating
the equipment in any way, it is highly suggested the user reads all safety information.
The information in this chapter pertains to safety consideration of OTDRs in general.
This product has been designed and tested in accordance with the manufacturer’s safety
standards, and has been supplied in a safe condition.
This document contains information that must be followed by the user to ensure safe operation
and to maintain the product in a safe condition. Failure to follow these safety warnings and
cautions can result in harm to the user or damage to the instrument.
WARNING
Personnel should always be aware when working with ber optic test equipment that
active bers may be present, therefore infrared optical energy may be present.
Never look directly into the end of a connected ber optic cable or ber optic interface
of optical test equipment, to do so could expose the user to laser radiation and could
result in personal injury.
To Prevent Fire or Shock Hazard:
- Do not install battery types other than those specied by the manufacturer
- Do not use the charger without the batteries installed
- Do not expose the battery charger to rain or excessive moisture
- Do not use the AC adapter when there are signs of damage to the enclosure or cord
- Ensure the correct charger is being used for the local line voltage
-Do not use any other charger than the one provided with this instrument.
Page 3

ChallengerOptics.com
Wavelength Specic Optical Testing and Measurement Equipment
ChallengerOptics.com
Wavelength Specic Optical Testing and Measurement Equipment
Chapter 2.0 - Safety / 05
CAUTION
Fiber-optic connectors are easily contaminated or damaged. The connection to the
OTDR is physical contact type of connections and dirty or damaged connectors may
impair the instruments capabilities at minimum and at worst result in the need to return
the OTDR to the factory for expensive repairs. Prior to making any connection to the
unit, ensure that all proper cleaning procedures have been followed. Use UPC Finish
Connectors Only -- DO NOT insert APC connectors into the optical ports.
The OTDR is equipped with a protection circuit to avoid damage from live ber
connections The instrument will not operate properly with active bers. Even with this
protection, high power output from EDFA’s or other equipment can damage detectors
and should never be connected to the OTDR.
If a live ber is connected to the OTDR and a scan is attempted, a warning dialog will
be displayed as in g. 2.1. Immediately remove the live ber from the OTDR and press
select to continue testing.
Failure to follow these cautions statements may void the warranty of, or cause
damage to this equipment.
Chapter 3.0 - Quick Start Guide / 06
Press to turn on the OTDR.
This quick start guide demonstrates use by way of the touch screen unless the keypad is required.
Touch the OTDR icon located in the center of the Home screen.
Connect the ber to the appropriate OTDR Optical Port.
Touch the (wavelength (Lambda) icon) on the left side of the parameter area of the display
to bring up the wavelength selection pages. Touch the desired wavelength for testing or select
the next page.
If approximate ber length is unknown:
Press to have the OTDR start a test using the selected wavelength with the OTDR
determining the most appropriate range and pulse width.
If approximate ber length is known:
Set the Wavelength as above.
Touch the (Average icon) to cycle through the available averaging times of Real-Time, 15
seconds, 1, 4, 16 or 40 minutes.
Touch the (Pulse Width icon) to cycle through the available pulse widths of 5ns, 10ns,
30ns, 100ns, 300ns, 1us, 3us, 10us or 20us. (Not all pulse widths will be available, only pulse
widths appropriate for the selected range will be presented)
AutoTest
Page 4

ChallengerOptics.com
Wavelength Specic Optical Testing and Measurement Equipment
ChallengerOptics.com
Wavelength Specic Optical Testing and Measurement Equipment
Chapter 3.0 - Quick Start Guide / 07
Touch the (Range icon) to cycle through the available ranges of 500m, 1km, 4km, 16km,
64km, 128km or 256km.
Touch scan or press the Scan button to start a trace. A second touch or press will stop a trace.
To operate the cursors, touch the A ➞ B area of the screen or press the A/B button to toggle
between A and B as the active cursor. To move the cursors, with the desired cursor as the active
cursor (solid vertical cursor line) touch the screen and the cursor will snap to that location, leave
the cursor in contact with the display and drag the cursor to the desired location. The left and
right buttons on the display may also be used.
To view the event table with the trace, touch the Event tab in the center of the display.
To view the schematic with the trace, touch the Schematic tab in the center/right of the display
To save a trace, touch the button and use the left or right buttons to highlight the Quick
Save icon.
Touch it or press . The le will be saved to the active folder (project).
Menu
Select
Chapter 4.0 - Inspection / Identication / 08
4.1 Inspection
Before shipment, this instrument was inspected and found to be in perfect working order and
free of defects.
The shipping carton contains the following:
1. OTDR with Protective boot
2. Universal AC/DC charger with interchangeable mains
3. USB cable
4. Manual and CertSoft software on CD.
5.Set of interchangeable adapters, SC, and FC.
4.2 Identication and Conguration
The instrument’s Model/Part Number, Serial Number and Date of Manufacture are indicated on a
label located on the back of the unit. The instrument’s history is led at the factory by model/part
number and serial number. The unit's serial number is also located on the top plate just above
the USB Port.
Page 5

ChallengerOptics.com
Wavelength Specic Optical Testing and Measurement Equipment
ChallengerOptics.com
Wavelength Specic Optical Testing and Measurement Equipment
5.1 OTDR Physical Description
Instrument Enclosure
The CO-OTDR is packaged in a rugged housing which is further protected with a rubberized
boot. Although the front panel is weather resistant, care must be taken to avoid liquids and
contaminants around the fragile optical and electrical connectors, and the glass display. Use a
mild cleaning agent and soft damp cloth to clean up the panels and the outside case. See the
maintenance section to clean the optical connector. NEVER open the instrument for cleaning.
Return to the factory for servicing if necessary.
Front Panel
Top panel
Chapter 5.0 - OTDR Description / 09
Power Button
Key Pad
Color Touch Screen
Protective Rubber Boot
Visual Fault Locater
Power Jack
OTDR Port
Video Probe Port
USB Port
Unit Serial Number
Battery Charge Indicator
Chapter 5.0 - OTDR Description / 10
5.2 Home Screen Display
This unit is equipped with a 4” color TFT resistive touch display. All keyboard functions are also
executable on the touch screen.
5.3 Power Requirements
The CO-OTDR-DWDM is equipped with a 100-240V-0.4A input universal battery charger with 15V,
1.2A, (center positive output). The charger is supplied with interchangeable mains plugs for North
America, Great Britain, Europe and Australia. The units internal power supply is an 11.1V 2600
mAh Li-ion battery. Typically, fully discharged batteries require 2 hours of recharging.
WARNING
To Prevent Fire or Shock Hazard: Do not install other battery types. Do not use the
charger without the batteries installed. Do not expose the battery charger to rain or
excessive moisture. Do not use the AC adapter when there are signs of damage to
the enclosure or cord. Do not use any charger other than the one provided with this
instrument. Any other condition will void the warranty.
Visual Fault Locater
If unit is equipment with a VFL,
selecting this icon with will cycle
through the CW, Modulate and O.
Loss Test Set
If CW source is available,
Select this icon to access the
CW mode of the light source.
Video Scope Icon
Select this icon to open the
video scope function.
Optical Time Domain Icon
Select this icon to open the
OTDR function
Firmware Version
Fault Finder
Select this icon to open the
basic fault nder mode
Page 6

ChallengerOptics.com
Wavelength Specic Optical Testing and Measurement Equipment
ChallengerOptics.com
Wavelength Specic Optical Testing and Measurement Equipment
Chapter 5.0 - OTDR Description / 11
5.4 Battery Replacement
Batteries are factory installed. The unit should be returned to the factory for a new battery if
required. It is suggested batteries receive a charge at least one a month.
WARNING
To Prevent Fire or Shock Hazard:
- Do not install battery types other than those specied by the manufacturer
- Do not use the charger without the batteries installed
- Do not expose the battery charger to rain or excessive moisture
- Do not use the AC adapter when there are signs of damage to the enclosure or cord
- Ensure the correct charger is being used for the local line voltage
- Do not use any other charger than the one provided with this instrument.
Failure to follow these caution statements could cause unsafe conditions for
the operator and equipment and may void the warranty.
Chapter 6.0 - OTDR Operations / 12
6.1 Key Pad
Power button, turns the unit On and O.
(Hold for 1 second)
Scan button starts a scan or stops scan.
AutoTest button operates range nder trace
mode. The Range Finder mode momentarily
checks test conditions and starts a scan at the
wavelength selected by the user but allows the OTDR to determine the pulse width
and range parameters.
The Menu button displays and hides the icon menu at the top of the display. It will
also back out of most menu selected screens. In the project folder and le manager it
opens the le/edit menu bar. When the menu is displayed at the top of the screen, the
focus of the LRUD buttons and the select buttons are on the icon menu and no longer
on the trace cursors.
Toggles between A and B as the active cursors.
Selects the Zoom level, each press increments through the levels of 1x, 2x, 4x, 8x, 16x
and 32x.
In the menu mode, the select button actuates highlighted item.
While in the trace mode the directional buttons are used to move the cursors. In the Menu mode,
the Left and right buttons move between the icons. The up button hides the menu bar or moves
cursor up in drop-down menus and the down button opens drop-down menus or move cursor
down while in a drop-down menu.
Select
A / B
AutoTest
Menu
Scan
Select
Zoom
Zoom
Select
Scan
Menu
AutoTest
A / B
Page 7

ChallengerOptics.com
Wavelength Specic Optical Testing and Measurement Equipment
ChallengerOptics.com
Wavelength Specic Optical Testing and Measurement Equipment
Chapter 6.0 - OTDR Operations / 13
6.2 Entering OTDR Function
Press the power button the to turn on the OTDR.
Use the LRUD buttons to highlight the OTDR icon and press the select button to enter
the OTDR function.
6.3 Icon Denitions
Home Brings the user back to the home page
Quick Save Saves the current trace to the current folder
Quick Load Recalls the next le, chronologically in the current folder
Tool Box Set screen brightness and calibrate touch screen
Project Folder Opens project management
File Manager Opens le management
Schematic View Opens the Fib-R-Map and event analysis view
Settings Opens the parameters setting page
Splice Zone Setting Turns on LSA/Splice markers
Help Opens the context sensitive help menu
Lambda (Wavelength) Cycles through available wavelengths
Averaging Cycles through averaging times
Pulse Width Cycles through available pulse widths
Range Cycles through available test ranges
Index of Refraction Opens the Index of Refraction entry screen
IOR
6.4 Main OTDR Screen
There are three tabs on the main OTDR screen. OTDR, Events and Schematic. Use the OTDR
tab to view the trace with the loss and distance measurements. Use the Events tab to view an
interactive event table with the trace and numbered events or the Schematic tab to view an
interactive schematic view of the events with the trace and numbered events. Selecting an event
in the event table or the schematic view will snap the active cursor to that event.
"B" Cursor with Position Data
"A" Cursor with Position Data
Main Trace Screen
Distance Increment
Indicators
Screen Tabs - Touching OTDR,
Events and Schematic tabs
change the bottom portion of
the display from parameters
and measurement data for the
OTDR, the event table for Events
and the schematic view for
Schematic (See below)
Zoom Control
Displays the zoom level, and the
values in distance and dB per
grid division. Touch anywhere
in the area to cycle through the
zoom levels.
Scan Button
Displays scan state / status and
the charge level of the batteries.
Touch anywhere in the area to
start or stop a scan.
Loss Method
Displays splice loss, LSA splice loss,
dB per Km and ORL. Touch anywhere
in this area to cycle through the loss
methods.
Test Parameters
Displays test parameters of
wavelength, averaging time,
pulse width, range and ORL.
Touch the symbol or value to
cycle through the available
settings.
"A-B" Cursor Status / Select
Displays the 2pt loss and
distance between the "A" and
"B" cursors. Touching anywhere
in this area will toggle between
active cursors.
Chapter 6.0 - OTDR Operations / 14
Trace Screen
w/ Measurement Data
Trace Screen
w/ Schematic view
Trace Screen w/ Event Table
g 6.2
g 6.3
Page 8

ChallengerOptics.com
Wavelength Specic Optical Testing and Measurement Equipment
ChallengerOptics.com
Wavelength Specic Optical Testing and Measurement Equipment
6.5 OTDR Parameter Settings Screen
To access the parameter settings screen press the menu button, use the LRUD buttons to
highlight the setting icon and press the select button. An alternate manner to open this screen is
to long touch the screen in the test parameter section of the main OTDR screen.
Trace Parameter Settings
Event Table/Fib-R-Map
Sensitivity Settings
Pass/Fail Thresholds
Settings
End of Fiber Pass/Fail Threshold
Setting
Date and Time
Chapter 6.0 - OTDR Operations / 15
g 6.4
Trace Parameter Settings
The cursor is the yellow highlighted area. (If the yellow cursor is on a value that is selected, that
block will be highlighted green) The blue values are the currently selected values. To move
through this section, use the Up/Down buttons to move between parameters and the Left/Right
buttons to change parameter values.
There are two additional setting in this area that are not available on the main OTDR screen,
distance unit and pulse width unit.
Event Table/Fib-R-Map Sensitivity Settings
The cursor is the yellow highlighted area. (If the yellow cursor is on a value that is selected, that
block will be highlighted green) The blue values are the currently selected values. There are
three levels of sensitivity for the event table and Fib-R-Map. The lowest setting possible should
be used to help lter out any events, that may be caused by short pulse widths, but are not true
perturbations in the optical signal
Pass/Fail Threshold Settings
There are ve pass/fail thresholds that may be set. Use the LRUD buttons to move between
threshold categories, once a categories is highlighted, press select to change the focus of the
LRUD buttons. Use the up/down button to make changes to the highlighted digit and the left/
right buttons to move the another digit. Once the desired value is entered, press selected again.
Continue until all thresholds settings have been completed.
Date/Time Settings
Use the LRUD buttons to highlight the calendar month and press select. Use the left and right
buttons to change the month and press select. Use the LRUD buttons, highlight the date and
press select.
Use the LRUD to buttons to highlight the clock and press select. Use the up/down buttons to
make changes to the highlighted digit and the left/right buttons to move the another digit.
Once the desired time is entered, press selected.
Exit Parameter Setting Screen
Press the menu button or touch Return to exit the parameter page.
Chapter 6.0 - OTDR Operations / 16
Page 9

ChallengerOptics.com
Wavelength Specic Optical Testing and Measurement Equipment
ChallengerOptics.com
Wavelength Specic Optical Testing and Measurement Equipment
WARNING
Before connecting a patch cord or ber under test, be certain the ber has no active
optical sources or instruments connected to the other end. Skin or eye damage could
result from other high power sources e.g. EDFAs, or instrument damage could occur
voiding the warranty.
Clean connector thoroughly prior to connection to the appropriate port of the OTDR.
Failure to ensure the connectors used with the OTDR are properly cleaned can result in
poor launch conditions at the minimum or damage to the optical interface that requires
the unit be returned to the factory for repair.
6.6 Auto Test
Auto Test is a useful feature when the approximate length of the ber to be tested is unknown.
To use the AutoTest, only the IOR and Wavelength need to be set by the user.
Set IOR
It is necessary to have the Index of Refraction set as close as possible to the actual IOR of the
ber. If this is unknown it is best to use the default setting on the OTDR. To view the current IOR
for a wavelength, open the menu use the left/right button to highlight the IOR Icon. Press select
and the IOR for the wavelength that is the active will be displayed. To change the IOR, use the
on screen QWERTY keyboard to enter the new value and touch save. Each wavelength stores an
independent IOR.
Set Wavelength
To select the wavelength, press the menu button to display the menu at the top of the display.
Use the LRUD buttons to highlight the Lambda (Wavelength) icon, press select to open the page
with available wavelengths displayed. Use the touch screen to select a wavelength or move to
the next page of available wavelengths.
Start Auto Test
Press the AutoTest button and the unit will set the average time to short, the appropriate pulse
width and range parameters for the ber under test.
Chapter 6.0 - OTDR Operations / 17
WARNING
Before connecting a patch cord or ber under test, be certain the ber has no active
optical sources or instruments connected to the other end. Skin or eye damage could
result from other high power sources e.g. EDFAs, or instrument damage could occur
voiding the warranty.
Clean connector thoroughly prior to connection to the appropriate port of the OTDR.
Failure to ensure the connectors used with the OTDR are properly cleaned can result in
poor launch conditions at the minimum or damage to the optical interface that requires
the unit be returned to the factory for repair.
6.7 Manual / Expert Mode
Set IOR
It is necessary to have the Index of Refraction set as close as possible to the actual IOR of the
ber. If this is unknown it is best to use the default setting on the OTDR. To view the current IOR
for a wavelength, open the menu use the left/right button to highlight the IOR Icon. Press select
and the IOR for the wavelength that is the active will be displayed. To change the IOR, use the
on screen QWERTY keyboard to enter the new value and touch save. Each wavelength stores an
independent IOR.
Set Wavelength
To select the wavelength, press the menu button to display the menu at the top of the display.
Use the LRUD buttons to highlight the Lambda (Wavelength) icon, press select to open the page
with available wavelengths displayed. Use the touch screen to select a wavelength or move to
the next page of available wavelengths.
Chapter 6.0 - OTDR Operations / 18
Page 10

ChallengerOptics.com
Wavelength Specic Optical Testing and Measurement Equipment
ChallengerOptics.com
Wavelength Specic Optical Testing and Measurement Equipment
Pulse Width
5ns 10ns 30ns 100ns 300ns 1µ 3µ 10µ 20µ
500m ü ü ü ü ü
1km ü ü ü ü ü
4km ü ü ü ü ü
16km ü ü ü ü ü
64km ü ü ü ü ü
128km ü ü ü ü ü
256km ü ü ü ü ü
Set Range
To set the range, press the menu button and use the LRUD buttons to highlight the range icon.
Use the select button to cycle to the desired range.
Set Pulse Width
To set the pulse width press the menu button and use the LRUD buttons to highlight the pulse
width icon. Use the select button to cycle to the desired pulse width
Set Averaging Time
To set the averaging time press the menu button and use the LRUD buttons to highlight the
averaging icon. Use the select button to cycle through the averaging times of RT (Real Time), 15,
or 60 seconds, 2 or 4, 8 or 20 minutes.
Scan
Once all the proper settings have been entered, press the Scan button to take the trace. To stop
the trace press the scan button again.
Range
Chapter 6.0 - OTDR Operations / 19
6.8 Trace Analysis
Unit of Measure
The distance unit of measure may be either displayed in Kilometer (Km), Kilo feet (Kf) or Miles
(Mi). To set the unit of measure, press the menu button, use the LRUD buttons to highlight the
settings icon and press select to open the parameter screen. Use the down button to move the
cursor to the D.Unit line in the parameter menu, and use the left or right button to highlight
the desired unit of measure and press select. Press the menu button or touch Return to exit the
parameter settings page.
Zoom
There are six zoom levels, 1x, 2x, 4x, 8x,16x and 32X. To change the zoom level, press the zoom
button on the keypad. This will cycle through the six levels. When viewing the trace at a zoom
level other than 1x, the active cursor is centered on the trace display and when the cursors are
moved, the trace moves and the cursor will remain centered.
Cursor Movement
The active cursor is displayed as a solid line and the non-active cursor as a dashed line. Pressing
the A/B button on the keypad toggles between the two cursors as the active cursor. The cursors
are moved using the left and right buttons.
6.9 Loss Measurements
2 Point loss
2 Point loss measurements take into account the dierence in vertical height between where
the A and B cursors cross the ber trace to determine loss. This information is located on the
main OTDR screen in the A-B section of the trace information as shown in Fig. 6.2. This is a quick
method of checking the loss between any two points on a ber optic link.
dB/km
The dB/Km (dB/Kft or dB/Mi) loss method takes the 2 Point loss in dB and divides by the distance
between the cursors in Km (Kilometers), Kf (Kilo feet) or Mi (Miles). For accurate dB/.... loss
measurements, the two cursors must be on level back scatter points at least 100m apart (NA will
show for distances that are too short).
Chapter 6.0 - OTDR Operations / 20
Page 11

ChallengerOptics.com
Wavelength Specic Optical Testing and Measurement Equipment
ChallengerOptics.com
Wavelength Specic Optical Testing and Measurement Equipment
Optical Return Loss
This Optical Return Loss (ORL) is separate from the event ORL (Reectance) that is displayed in
the event analysis under the TYPE header for an individual event. The measurement displayed
in the loss measurement area of the main OTDR screen and in the E (End of Fiber) row in the
TYPE column is an optical return loss based on the entire link. It is the total accumulated light
reected back to the source along the telecommunication link.
Basic Splice Loss
Splice Loss method is meant to be used in noisy environments when it is dicult to attain an LSA
area that lays at on the back scatter before and after the cursor. This method takes an average
of the selected points before and after the active cursor and uses this average to make a good
estimation of the event loss. This is an estimation but this method may be more accurate than
LSA Splice Loss method in noisy environments.
When using the splice loss It is necessary to set these areas in clear back scatter (areas that do not
consist of other events) to acquire the most accurate measurements. For accurate measurements,
these areas can not include other events such as reective or splice events. Set a cursor at the
beginning of an event and set splice loss measurement areas as directed below and as shown
in Fig. 6.6 for accurate splice loss measurements. Splice loss measurement areas will follow the
undulations of the back scatter line unlike LSA areas.
Least Squares Approximation (LSA)
Least Squares Approximation (LSA) Splice loss method gives the user a visual aid in setting splice
loss areas. This method can be more accurate by aording the ability to see the slope of the splice
loss areas, however: it can also supply a reading with greater error if not used properly. The splice
loss lines must be set to overlay the back scatter of a trace without over lapping any other events.
Unlike basic splice lose, LSA measurement areas are drawn as straight lines without regard to the
undulations of the back scatter
6.10 Loss Measurement Settings
Setting Splice Loss Measurement Areas. To set the basic splice loss measurement/ LSA ares,
the OTDR must be in Splice AVG or Splice LSA mode. To adjust the splice loss areas around the
cursors, press the menu button, highlight the LSA icon and press select. The splice lose position
indicator will be displayed at splice loss position number 1 as indicated in Fig. 6.6 Use the left
and right buttons to adjust the loss measurement area. Press the select button to move the
splice lose position indicator to the position number 2, set the area and continue with positions
3 and 4 in the same manner. Press select when done with position number 4 to hide the splice
lose position indicator and reset the focus of the keyboard back to the cursors. Press the menu
button at any time to escape the splice lose settings sequence.
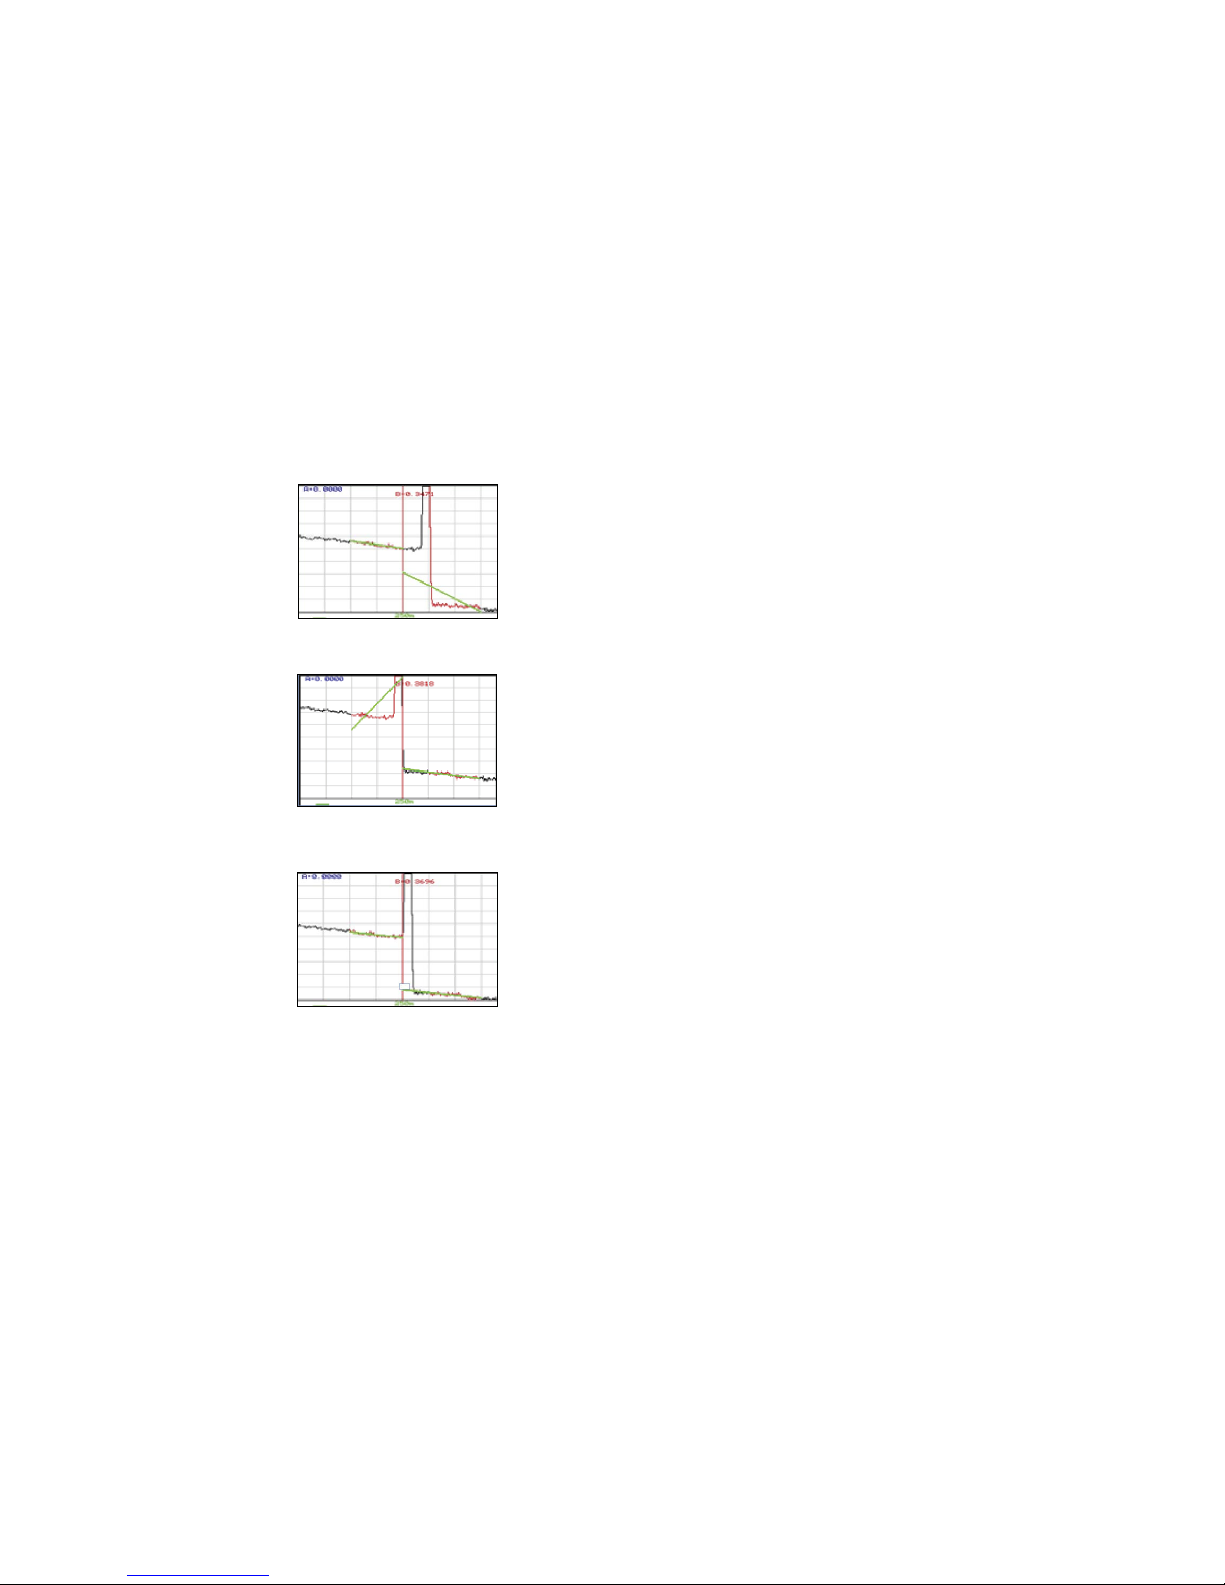
Chapter 6.0 - OTDR Operations / 21 Chapter 6.0 - OTDR Operations / 22
Splice Loss Adjustment Areas
Splice Loss Adjustment Positions
LSA Splice Loss
Measurement Areas
LSA Splice Loss
Measurements
Basic Splice Loss
Measurements
Basic Splice Loss
Measurement Areas
Active Splice
Zone Cursor
Active Splice
Zone Cursor
Splice Loss Position
#1
Splice Loss Position
#4
Splice Loss Position
#3
Splice Loss Position
#2
g 6.6
g 6.5
Page 12
ChallengerOptics.com
Wavelength Specic Optical Testing and Measurement Equipment
ChallengerOptics.com
Wavelength Specic Optical Testing and Measurement Equipment
Chapter 6.0 - OTDR Operations / 23
LSA Examples
LSA Set Too Early:
The LSA area and cursor are set too early.
The right most green LSA indicator line
is not over laying the back scatter of the
trace properly
LSA Set Too Late:
The LSA area and cursor are set too late.
The left most green LSA indicator line is
not over laying the back scatter of the
trace
Proper LSA Setting:
The LSA area and cursor are set properly.
The green LSA indicator line is over
laying the back scatter of the trace
properly.
g 6.7
g 6.8
g 6.9
6.11 Event Analysis
Enter Event Analysis
To enter event analysis, press the menu button and use the left / right buttons to highlight the
Schematic View analysis icon and press select.
Threshold Settings
There are four threshold settings, EOF, Loss, ORL and Link. (See Fig 6.4) The EOF is not a Pass/Fail
threshold, it is used to set a loss value to determine the end of ber. IF the EOF threshold is set for
3dB, then the rst event that has a loss of 3dB or greater will be deemed the EOF.
To change the threshold settings, press the Menu button, use the left/right buttons to highlight
the settings icon and press select. The cursor is the yellow highlighted area. (If the yellow
cursor is on a value that is the current selection, that block will be highlighted green.) The
setting highlighted in blue is the current setting. Use the LRUD buttons to highlight the desired
threshold category and press the select button. Use the up/down buttons to set the digit,
and use the left/right buttons to move to the next or previous digit. Once the desired setting
is entered, press the select button. Use the LRUD buttons to move to the next setting until all
thresholds have been set as desired. To exit the parameter screen, press the menu button.
Splice, ORL and Link are all thresholds for Pass/Fail purposes.
Examples of these settings are as follows:
Splice: If a 1.00dB splice loss is acceptable, set the threshold to 1.00. If a splice loss of
1.00 is the fail point, set the threshold to 0.99
ORL: If a -50dB reectance is acceptable, set the threshold to 50. If -50dB is the fail
point, set the threshold to 50.5.
Link: If a 20dB, link loss is acceptable, set the threshold to 20. If 20db link loss is the
fail point, set the threshold to 19.5.
Sensitivity Settings
There are three levels of sensitivity for the event table and Fib-R-Map. (See Fig 6.4) To change the
event sensitivity, press the Menu button, use the left/right buttons to highlight the settings icon
and press select. The cursor is the yellow highlighted area. (If the yellow cursor is on a value that
is the current selection, that block will be highlighted green.) The setting highlighted in blue is
the current setting. Use the LRUD buttons to highlight the desired setting and press select. To
exit the parameter screen, press the menu button.
Chapter 6.0 - OTDR Operations / 24
Page 13

ChallengerOptics.com
Wavelength Specic Optical Testing and Measurement Equipment
ChallengerOptics.com
Wavelength Specic Optical Testing and Measurement Equipment
The lowest setting possible should be used to help lter out any false events that may be caused
by short pulse widths, but are not true perturbations in the optical signal. High sensitivity
presents events with loss down to approximately 0.1dB, Medium (Md) with events down to
approximately 0.2dB and Low (Lo) for event down to about 0.5dB. Longer pulse widths, and
averaging help to lower the number of false events. Highest sensitivity settings should only be
used for traces with high signal level, low noise, long pulse width and long average.
Event Analysis Screen
Chapter 06 - OTDR Operations / 25
Fib-R-Map
(Schematic View)
Event Table
Event Map with
adjustable splice zones
Trace Parameters
g 6.10
Fib-R-Map
Event Table
Failing Event is Red
Event Number
Range of the Trace
Red Ares is Currently
Being Displayed
Reective Events
Event Location
Fiber Link Length
Passing event
is green
Event Number
Pass/Fail
Event Location Event Loss in dB
Loss Between
Events
dB Per/Km
Between Events
Event Type or
Reectance Value
EOF Location Link Loss
EOF Data
System ORL
Link Data Line
Link
dB Per/Km
Chapter 06 - OTDR Operations / 26
Non-Reective Event
g 6.11
g 6.11
Page 14

ChallengerOptics.com
Wavelength Specic Optical Testing and Measurement Equipment
ChallengerOptics.com
Wavelength Specic Optical Testing and Measurement Equipment
Table Denitions
# Event Number: Indicates the event in sequence, where the higher the number the further
distance from the OTDR the event occurs. “E” (End) is the event determined to be the End of Fiber
(EOF). "L" is the link row and contains information about the entire link tested.
Pass/Fail: if any one of the thresholds are not met for and event, the P/F column will display a
red F. The parameter that failed will also be displayed in red. If all the parameters are met, this
column will display P. The Pass/Fail threshold for the event labeled "L" is the loss displayed in the
2POINT column, the link loss threshold.
Km or KF or MI: Event Location, Km for Kilometer or KF if unit of measure is Kilo-feet MI for mile.
This is the distance/location that the event occurs along the ber link.
Splice: Event Loss, is the splice loss (event loss) of the numbered event. (A positive number is
the amount of loss and a negative number indicates a gain normally due to mismatched index of
refraction.) This is a settable threshold for the Pass/Fail feature. The "E" event will display N/A as
this is not an event that would have meaning. The "L" line of the table is the link and as such does
not have an event (Splice) loss.
2POINT: 2 Point Loss is the loss measured from the end of the dead zone of the previous event
to the beginning of current event. The value in the "L" line of the table for this column is the link
loss. The loss from the beginning of the trace to the event determined to be the EOF. This is the
value used to determine if the ber link passes or fails it's loss threshold.
dB/Km: dB per Kilometer if in KM and DB/KF if in Kilo-Feet and DB/MI if in mile unit of measure.
This is the calculated loss per Km, Kf or Mi from the end of the dead zone of the previous event to
the beginning of the current event. The value in the "L" line of the table for this column is the dB
Per/KM, Kf or Mi for the total link.
TYPE: Event Type is the type of event or the ORL measurement. If the event has no reection,
“splc” will be displayed and if the event contains a reection, the event reectance value will
be displayed. For the last event which is labeled "L" in the # column, the value displayed is the
system ORL.
Chapter 6.0 - OTDR Operations / 27 Chapter 7.0 - Project Management / 28
7.1 Project Management Description
Project Management allows the user to save a set of parameters to be recalled for use at a later
time. It also incorporates the le management system to save traces to the active project folder.
When the OTDR is turned on, the default project is [NONE]. If an existing project is not open or a
new one not set, all traces will be saved to the [NONE] folder.
Project Management Screen
Project Management Menu
The menu for project management may be operated with the touch screen, however, this manual
describes the manner of operation with the keypad. To open the menu press the menu button.
There are four tabs available, File, Edit, View and Help. Use the left or right buttons to move to a
desired tab and use the select or the down button to open the drop-down menus. Pressing the
menu button again or the up button will hide the operations menu.
Project Folder
List
Project
Details/Properties
g 7.1
g 7.2
Page 15

ChallengerOptics.com
Wavelength Specic Optical Testing and Measurement Equipment
ChallengerOptics.com
Wavelength Specic Optical Testing and Measurement Equipment
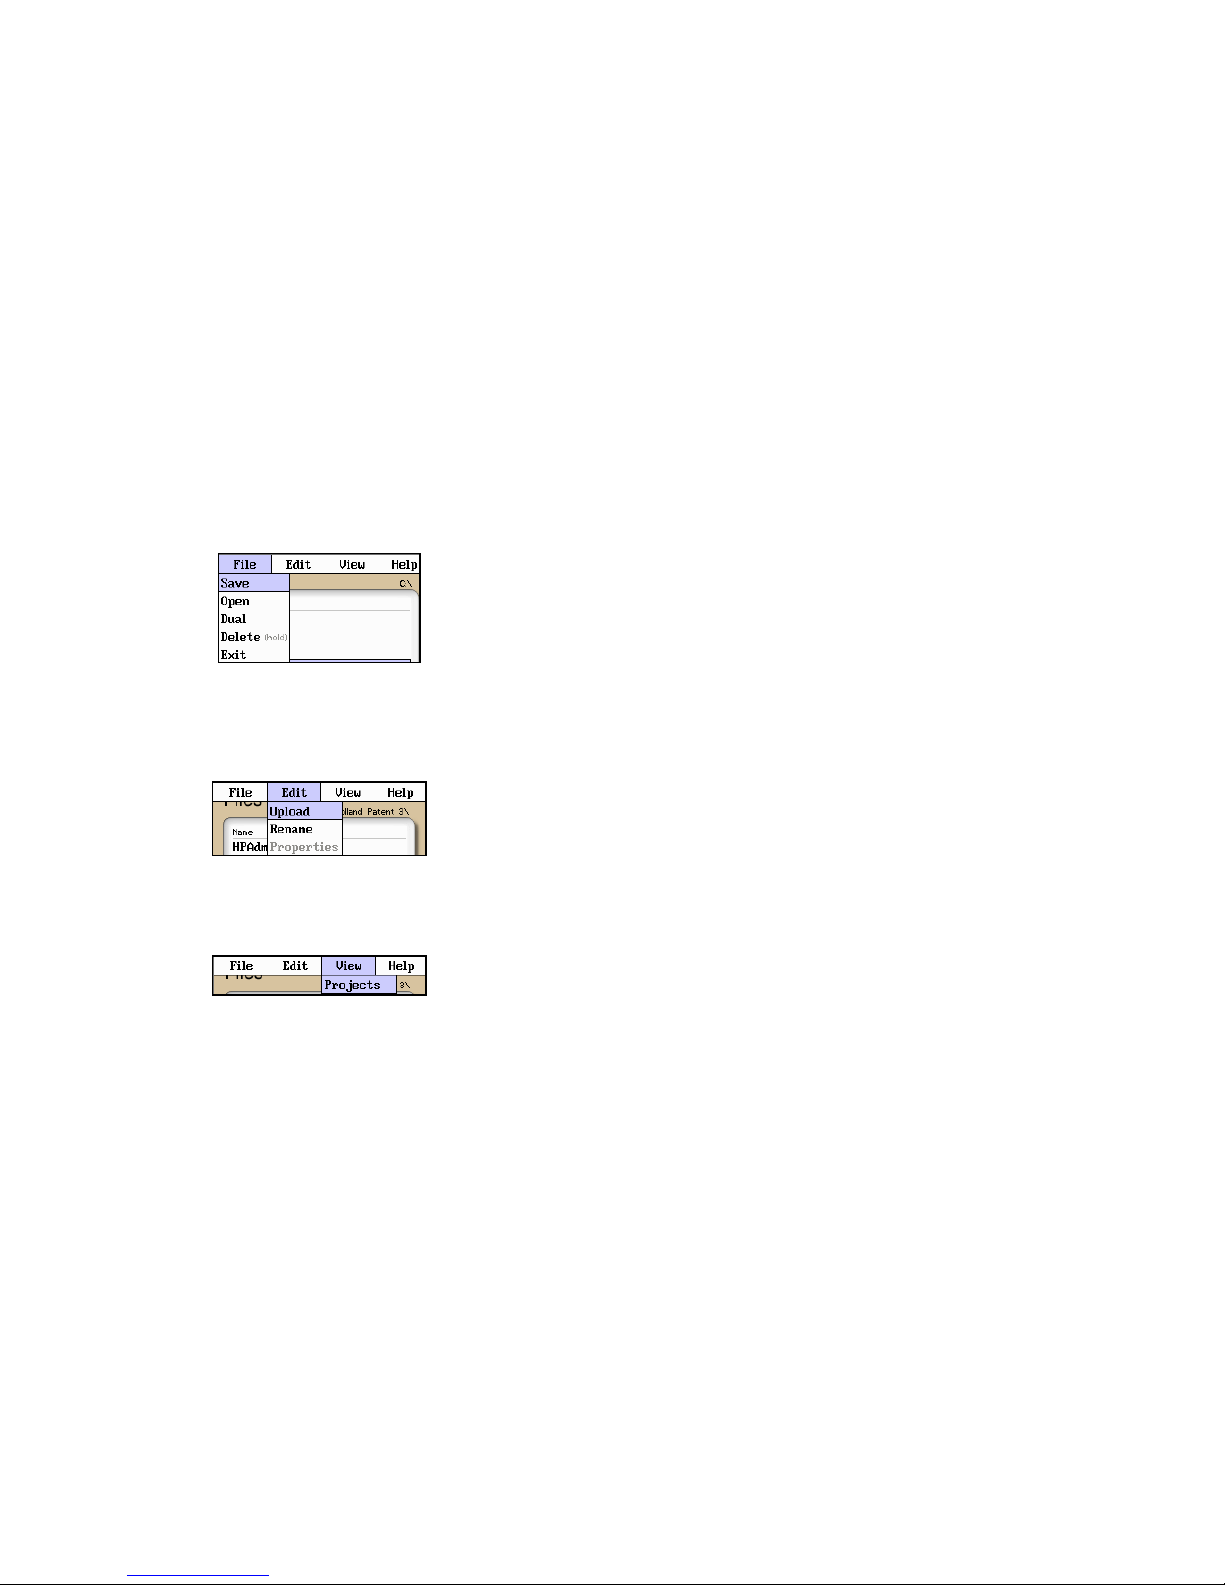
Chapter 7.0 - Project Management / 29
Project Management File Tab
To open the drop down menu under le, with le tab highlighted, press select or the down
button. Use the down or up buttons to move through the drop down menu and select to
choose and operation. Selecting new will open a new project folder using the current parameter
settings. Open will open the highlighted project, dual is not operational in the project
management and therefore grayed out, delete permanently removes the highlighted project.
(The delete button must be held for at least one second to remove projects.) Once delete is
selected, the project and all les associated with that project are deleted. Use exit to leave the
project manager and return to the trace screen.
Project Management Edit Tab
To open the drop-down the menu under edit, with the edit tab highlighted, press select or the
down button. Use the down or up buttons to move through the drop down menu and press
select to choose an operation. Upload is used to transfer les to the CertSoft software. Rename
allows the highlighted folder name to be modied while maintaining all settings and associated
les. Properties allows the user to edit the properties displayed at the bottom of the project
window.
Project Management View and Help Tabs
View oers the user the opportunity to move to the le manager from the projects page. With
view highlighted, press select or the down button to open the drop-down menu, with the les
tab highlighted, press select to move to the le management page. For on board help pages,
highlight the help tab and press select.
g 7.3
g 7.4
g 7.5
7.2 Project Management Operation
Create a New Project
The parameters that are stored for a project are; range, pulse width, average, wavelength,
distance units, pulse width units, event sensitivity and the thresholds. To create a new project,
press menu, select the settings icon, set the parameters as required, when all setting are
established, use the arrow button to highlight the return button or touch return at any time while
in the settings screen. Press the menu button, highlight the project folder icon and press select.
With the le tab highlighted, press select or the down button to open the drop down menu. Use
the down or up buttons to highlight new and press select again. Use the on screen QWERTY
keyboard to name the folder and touch save. The folder names are limited to 16 characters.
To enter details about the project, use the up and down buttons to highlight the project that was
just created and press the menu button. Use the left or right button to highlight the edit tab, use
the down button to highlight properties and press select. Use the up and down buttons to select
the desired eld to be entered or modied and press select. Use the QWERTY keyboard to enter
the information and touch save when complete. Up to 24 characters may be entered for these
elds. To exit the project screen, press menu, press select, use the down button to highlight exit
and press select again.
Open an Existing Project
To open a project, press the menu button, highlight the project folder and press select. Use the
up or down buttons to highlight the desires project folder and press select. This will open the le
management screen listing all the les previously stored in this project. All saved traces will now
be stored to this project ,until a new project is created or another project is opened.
Delete a Project
To delete a project, with the project to be deleted highlighted, open the le drop down menu,
highlight delete and press and hold select. Ensure the proper project is selected as once deleted,
the folder and les cannot be recalled.
Upload a Folder to CertSoft
To upload a folder and all it's associated les from the OTDR to the computer, open the CertSoft
software and ensure the OTDR is connected to the computer with the USB cable.
Highlight the project to be uploaded, press menu to open le manager menu, use the right
button to highlight edit tab, press select or the down button to open the drop down menu and
with upload highlighted, press select. The folder with all les will be uploaded to the target folder
selected on the computer.
Chapter 7.0 - Project Management / 30
Page 16

ChallengerOptics.com
Wavelength Specic Optical Testing and Measurement Equipment
ChallengerOptics.com
Wavelength Specic Optical Testing and Measurement Equipment
Rename a Project
To rename a project, have the project to be renamed highlighted, press menu, to open the
project management menu. Use the left and right buttons to highlight edit tab and press select
or the down button to open the drop-down menu. Use the down button to highlight rename
and press select. The project name will be displayed with the on board QWERTY keyboard. Use
the keyboard to rename the project and touch save.
Modify Properties
To modify the properties, have the project to modied highlighted. Press menu, highlight edit/
properties and press select. The project properties will be displayed, use the up/down buttons to
highlight the eld to be changed, use the on board QWERTY keyboard to make the change and
touch save. Continue with the changes needed, when compete highlight close and press select.
Use the left and right buttons to highlight edit tab and press select or the down button to
open the drop-down menu. Use the down button to highlight properties and press select.
The properties list will be display, use the up or down buttons to highlight the property to
be modied and press select. The QWERTY keyboard will be displayed with the property
information. Press save when done with the change. Continue with the changes needed, when
compete highlight close and press select.
Temporary Modication of Parameters
Test parameters may be temporarily changed by selecting new settings, such as wavelength,
average time, pulse width, and range directly on the main OTDR screen with the touch screen
capabilities or open the parameter settings screen, set the new parameter and save. All
subsequent test will use the new settings until the original settings are returned or the folder is
reopened resetting the project parameters. To make temporary changes to event sensitivity or
thresholds, open the parameters settings page.
Exit Project Management
To exit the project management, press menu, use the left or right buttons to highlight the le tab,
press select or the down button to open the drop down menu. Use the down button to highlight
Exit and press select.
Chapter 7.0 - Project Management / 31 Chapter 8.0 - File Management / 32
8.1 File management Description
File Management is use to save and recall traces. It operates in conjunction with the projects
manager in that if a project folder is open, the les saved to and listed in the le manager are
associated with the open project. When the OTDR is turned on, the default folder is [NONE],
therefore, any les save without opening a project will be save to the [NONE] folder. Any les
saved in the scope function will also be associated with the open folder.
File Management Screen
File Management File Menu
The menu for le management may be operated with the touch screen, however, this manual
describes the manner of operation with the keypad. To open the le management menu press
the menu button.
OTDR Traces Files List
Trace Details/Properties
Project Folder Being Viewed
g 8.1
g 8.2
Page 17
ChallengerOptics.com
Wavelength Specic Optical Testing and Measurement Equipment
ChallengerOptics.com
Wavelength Specic Optical Testing and Measurement Equipment
Chapter 8.0 - File Management / 33
File Management File Tab
To open the drop down menu under le, with le highlighted, press select or press the down
button. Use the down or up arrow to move through the drop down menu and press select to
open the highlighted operation. The operations are Save, Open, Dual, Delete and Exit. Save stores
the current trace, Open displays the trace that is currently highlighted, Dual opens a secondary
trace, Delete permanently removes a le and Exit closes the le management screen.
File Management Edit Tab
To open the drop down menu under edit, with edit highlighted, press select or press the down
button. Use the down or up arrow to move through the drop down menu and press select to
choose a highlighted operation. Upload is used to transfer the highlighted le to the CertSoft
software. Rename allows the highlighted le name to be modied. Properties is grayed out and not
accessible from this location.
File Management View/Help Tab
View oers the user the opportunity to move to the projects management page from the le
management page. With view highlighted, press select or the down arrow to drop down the view tab
and press select to move to the le management page. For on board help pages, highlight the help
tab and press select.
8.2 File management Operation
Save a Trace File
To save a trace, press menu, highlight the le manager icon and press select. Press select or the
down button to open the drop down menu and with save highlighted, press select again. The le
naming window will open and the on board QWERTY key board will be available. Use the touch
keyboard to name the le and touch save. The le names are limited to 16 characters. This method
should be used to set the base le name for a group of traces. These le names are save exactly as
entered. To save les with a chronologically numbered sux, use the quick save. Quick Save uses
the last enter base le name.
g 8.3
g 8.4
g 8.5
Chapter 8.0 - File Management / 34
Open/View a Trace
To open a trace, press the menu button, highlight the le folder and press select. Use the up or
down buttons to highlight the trace to be viewed and press select.
Dual Trace Mode
Dual trace mode may be used to view and compare two traces. Both traces must be of the same
range setting. To utilize dual trace feature, rst open the primary trace as you would a normally,
by highlighting the trace in le management, pressing menu to open the le management menu,
with le highlighted, open the drop-down menu use the down button to highlight dual and
press select. The trace opened using the dual feature is the secondary trace and all information
displayed is that of the primary trace. To exit the dual trace mode, start a scan with the scan
button.
Delete a File
To delete a le, with the le to be deleted highlighted, press menu or the down button to open
the le drop down menu, use the down or up buttons highlight delete and press select for at
least one second. Ensure the proper le is selected as once deleted, the le cannot be recalled.
Upload a Trace to CertSoft
To upload a trace from the OTDR to the computer, Open the CertSoft software and ensure the
OTDR is connected to the computer with the USB cable.
Highlight the le to be uploaded, press menu to open le manager menu, use the right button
to highlight the edit tab, press select or the down button to open the drop down menu and with
upload highlighted, press select. The le will be uploaded to the target folder on the computer .
Rename a Trace File
To rename a trace le, have the le to be renamed highlighted. Press menu, use the left or right
button to highlight edit, press select, or the down button to open the drop-down menu, press
the down button to highlight rename and press select. The le name will be displayed with the
on board QWERTY keyboard. Use the keyboard to rename the project and touch save.
Exit File Management
To exit the le management, press menu, use the left or right buttons to highlight the le tab,
press select or the down button to open the drop down menu. Use the down button to highlight
Exit and press select.
Page 18
ChallengerOptics.com
Wavelength Specic Optical Testing and Measurement Equipment
ChallengerOptics.com
Wavelength Specic Optical Testing and Measurement Equipment
Chapter 9.0 - Tunable Laser Source / 35
9.1 Laser Safety
The Tunable Laser Source has been congured to provide laser radiation in the C Band of
operation. (1530-1565nm) L Band may be available upon request with a range of (1565-1625nm).
Please see the warning label in gure 9.1.
This is displayed on the left hand side of the
body of the TLS. The unit has been designed
to comply with 21 CFR (Code of Federal
Regulations) 1040.10 and 1040.11, for Class
1M emission limits. Although Class 1 levels are
not considered to be hazardous, we suggest limiting exposure by never looking directly into the
optical aperture. Also, do not under any circumstance view or inspect the laser output bers,
connectors or the ber under test through collimating or focusing optics unless the unit is turned
o, batteries are removed and the power adapter is disconnected.
CAUTION
Personnel should always be aware when working with ber optic test equipment that
active bers may be present, therefore infrared optical energy may be present.
Fiber-optic connectors are easily contaminated or damaged. The connection to this
tunable light source is a physical contact type of connection and dirty or damaged
connectors will impair the instrument’s capabilities at the minimum and at worst result
in the need to return the equipment to the factory for expensive repairs.
Never look directly into the end of a connected ber optic cable or ber optic interface
of optical test equipment, to do so could expose the user to laser radiation and could
result in personal injury.
g 9.1
9.2 TLS Quick Start Guide
Prior to any operation please read the laser safety section of this chapter.
To operate the TLS at a specic wavelength/frequency/channel in CW mode follow this
quick start guide:
Touch the TLS icon on the Home screen.
The Laser Output is displayed in the center of the screen. Touch this value to cycle
through units of, Wavelength (nm), Frequency (THz) and Channel (Ch). 0.4nm
(0.05THz), 0.8nm (0.10THz) or 1.6nm (0.20THz).
Touch and hold the blue wavelength/frequency/channel selector on the scale. Drag
the selector to the desired output value.
Touch the step size indicator to cycle through step sizes until set at 0.40nm for
wavelength, 50 GHz for frequency or 0.5 Ch for channel is displayed.
Touch the power value and a numeric keypad will be displayed. Enter the desired
power value within the ranges set at the top of the display and touch OK.
Touch the Laser icon to energize the laser in a CW mode. Touch the Laser icon a second
time to turn o the laser.
Chapter 9.0 - Tunable Laser Source / 36
Page 19

ChallengerOptics.com
Wavelength Specic Optical Testing and Measurement Equipment
ChallengerOptics.com
Wavelength Specic Optical Testing and Measurement Equipment
9.3 Operation
From the home screen, touch the TLS icon to enter the tunable laser source feature.
TLS Screen Description
Home Icon Help Icon
Laser Start/Stop/Activity Indicator
Power
Step Size Dwell Time
Output Value
Low End Slide
Output Unit
Active Output Slide
High End Slide
Channel Scale
Snap to Lowest Laser
Output
Laser Output Down
Laser or Sweep Start/
Pause
Laser Output
UP
Snap to Highest Laser
Output
Chapter 9.0 - Tunable Laser Source / 37
g 9.2
Touch Screen Operation
Laser Start/Stop/Activity Indicator Flashing indicates active laser Starts and stops laser/sweep
Home Icon Brings the user back to the home page
Help Icon Opens the context sensitive help menu
Step Size Cycles through available step sized in nm, Freq, and Ch
Power Opens numeric keypad to enter power level
Dwell Time Opens numeric keypad to enter dwell time or CW mode
Output Value Laser output value in nm, Freq or Ch
Output Unit Indicates displayed output unit
Active Output Slide Used to select/indicate output laser
Channel Scale Full scale of available laser output
Low end Slide Used to select lowest laser output of sweep
High End Slide Used to select highest laser output of sweep
Snap to Lowest laser Output Moves the active slide to the lowest laser output set by the Low End Slide
Snap to highest laser Output Moves the active slide to the highest laser output set by the High End Slide
Laser Output Down Moves the low end slide down the scale
Laser or Sweep Start/Pause Start and stops the laser/sweep
Laser Output Up Moves the high end slide up the scale
Chapter 9.0 - Tunable Laser Source / 38
Page 20

ChallengerOptics.com
Wavelength Specic Optical Testing and Measurement Equipment
ChallengerOptics.com
Wavelength Specic Optical Testing and Measurement Equipment
Setting Parameters
Set Output Units
The output may be displayed in wavelength or frequency or channel. To set the units, touch the
output value in the center of the screen to cycle through the available units.
Set Step Size
There are three available step sizes when selecting output or for sweep purposes. While in
wavelength mode, the steps are 0.4nm, 0.8nm or 1.6nm. In Frequency mode they are 0.05THz,
0.10THz or 0.20THz, and in channel mode they are .5, 1 or 2 channel steps. The step size changes
to the appropriate unit when the output units are changed. To set the step size, touch the step
size indicator to cycle through the available choices.
Power Level
The power level of the signal is adjustable from approximately +2 dBm to +11 dBm in increments
of 0.01 dBm. To set the power level, touch the power level indicator and an numeric keypad will
be displayed. At the top of the keypad will be the available power level range. Enter the desired
power to 0.01dBm. Once entered touch OK or to back out without change, touch cancel.
Dwell Time
To set the dwell time when operating in sweep mode, touch the dwell time indicator. A numeric
key pad will be displayed. The dwell time may be set from 2.00 to 60.00 seconds for sweep mode
operation. Enter the desired dwell time and touch OK or to exit without change touch cancel.
A dwell time of 0.00 is used for manual operation. This will set the laser to a CW mode at the
output value displayed. The output may be changed with either the active output slide or the up
or down channel select buttons.
Set Low and High End Laser Output
To set the low end laser output, touch the Low end slide and release. The output indicator and
the Up and down arrows will change to green. The focus of the up down movement arrows and
snap to end arrows changes to the low end slide. Use these arrows, or the slide to set the low end
laser output.
Touch the red high end slide to change the output indicator and focus of the arrows to the high
end slide to set the high end laser output.
Chapter 9.0 - Tunable Laser Source / 39
Manual/CW Operation
To re the laser in a CW mode, Set the output to the desired unit, set the step size if required and
set the power lever to dBm level required. Set the dwell time to 0.00. When the laser is red with
the Laser Start/Stop /Activity Indicator or the Laser or Sweep Start/Pause, it will be in CW mode.
To change the output laser, use the arrows at the bottom of the display to move or snap the laser
to a value or use the Active Output Slide to set the desired wavelength, frequency or channel.
Touch the Laser Start/Stop /Activity Indicator or the Laser or Sweep Start/Pause again to turn o
the laser.
Sweep Operation
To run a sweep of the laser, set the output to the desired unit, set the step size, power level and
dwell Time as described above. Use the low end and high end sliders to set the low and high end
laser levels to be red. Touch the Laser Start/Stop /Activity Indicator or the Laser or Sweep Start/
Pause
Exit Tunable Laser Feature
Touch the Home icon to return to the home screen.
WARNING
Even if the indicator shows the laser to be o never looking into the end of a ber
connected to the TLS or directly into the connector port. Do not under any circumstance
view or inspect the laser output bers, connectors or the ber under test through
collimating or focusing optics unless the unit is turned o, batteries are removed and
the power adapter is disconnected.
Chapter 9.0 - Tunable Laser Source / 40
Page 21

ChallengerOptics.com
Wavelength Specic Optical Testing and Measurement Equipment
ChallengerOptics.com
Wavelength Specic Optical Testing and Measurement Equipment
Chapter 10.0 - Fault Locate / 41
10.1 Fault Locater Description
The Fault Locater is a simple auto test feature which displays the test results in event table with
the Fib-R-Map schematic view. The fault locater will take a scan of the ber in auto test mode.
The user sets the wavelength to be tested and the OTDR will set the pulse width and range to
best suite the ber under test at the selected wavelength.
If Pass/Fail information is desired, rst enter the OTDR mode and set the Pass/Fail threshold to
meet requirements.
To enter the Fault Locater mode, touch the Fault icon on the home screen. The screen below will
be displayed. The rst time the mode is entered it will be void if data, it may be populated with
data from a previous session.
Fault Locater Screen
The fault locater screen includes the event table, Fib-R-Map (Schematic View) and event map view
of highlighted event.
Fib-R-Map
(Schematic View)
Event Table
Event Map with
adjustable splice zones
Trace Parameters
g 10.1
Chapter 10.0 - Fault Locate / 42
Fib-R-Map
Event Table
Failing Event is Red
Event Number
Range of the Trace
Red Ares is Currently
Being Displayed
Reective Events
Event Location
Fiber Link Length
Passing event
is green
Event Number
Pass/Fail
Event Location Event Loss in dB
Loss Between Previous
and Current Events
dB Per/Km, Kf or Mi
Between Events
Event Type or
Reectance Value
EOF Location Link Loss
EOF Event
Information
System ORL
Link Information
Link dB Per/Km, Kf or Mi
Non-Reective Event
g 10.2
g 10.3
Page 22

ChallengerOptics.com
Wavelength Specic Optical Testing and Measurement Equipment
ChallengerOptics.com
Wavelength Specic Optical Testing and Measurement Equipment
Event Table Denitions
# Event Number:
Indicates the event in sequence, where the higher the number the further distance from the
OTDR the event occurs. “E” (End) is the event determined to be the End of Fiber (EOF). "L" is the
link row and contains information about the entire link tested.
P:
Pass/Fail, if any one of the thresholds are not met for and event, the P/F column will display an F.
The parameter that failed will be displayed in red. If all the parameters are met, this column will
display a P. There is no Pass/Fail threshold for the last event labeled "E" (End) and the Pass/Fail for
the "L" (Link) row includes the 2POINT column, which for the link is the total link loss and the TYPE
column which for the link row is the system ORL.
Km or KF or MI:
Event Location, Km for Kilometer or KF if unit of measure is Kilo-feet MI for mile. This is the
distance/location that the event occurs along the ber link.
Splice:
Event Loss, is the splice loss (event loss) of the numbered event. (A positive number is the
amount of loss and a negative number indicates a gain normally due to mismatched index of
refraction.) This is a settable threshold for the Pass/Fail feature. The "E" event will display N/A as
this is not an event that would have meaning. The "L" line of the table is the link and as such does
not have an event (Splice) loss.
2POINT:
2 Point Loss is the loss measured from the end of the dead zone of the previous event to the
beginning of current event. The value in the "L" line of the table for this column is the link loss.
The loss from the beginning of the trace to the event determined to be the EOF. This is the value
used to determine if the ber link passes or fails it's loss threshold.
dB/Km:
dB per Kilometer if in KM and DB/KF if in Kilo-Feet and DB/MI if in mile unit of measure. This is
the calculated loss per Km, Kf or Mi from the end of the dead zone of the previous event to the
beginning of the current event. The value in the "L" line of the table for this column is the dB Per/
KM, Kf or Mi for the total link.
TYPE:
Event Type is the type of event or the ORL measurement. If the event has no reection, “splc” will
be displayed and if the event contains a reection, the event reectance value will be displayed.
For the last event which is labeled "L" in the # column, the value displayed is the system ORL.
Chapter 10.0 - Fault Locate / 43
10.2 Fault Locater Operation
Set Wavelength
To set the wavelength rst enter the OTDR mode and touch the Lambda icon or wavelength to
open the wavelength selection pages. Use the touch screen to select a wavelength or move to
the next pages of available wavelengths.
Start Scan
To start a scan, touch in the bottom right corner of the display. A "Please Wait, Scanning"
message will be displayed. The scan will take about 15 seconds.
View Test in OTDR Screen
To View a test in the full OTDR mode, touch an event in the table and the scan will be displayed in
trace mode with the active cursor at the selected even.
Exit Fault Locater
To exit the fault locater mode touch the Home icon.
Chapter 10.0 - Fault Locate / 44
Page 23

ChallengerOptics.com
Wavelength Specic Optical Testing and Measurement Equipment
ChallengerOptics.com
Wavelength Specic Optical Testing and Measurement Equipment
Chapter 11.0 - Video Scope / 45
11.1 Entering Video Scope Function
To operate the video scope, from the home screen, highlight the Scope icon and press the select
button. If a probe is not connected already, connect the VIS300 video probe to the video probe
port on the top of the OTDR.
11.2 Video Scope Display
11.3 Video Scope File/help Icon Menu
The Icons at the top of the display are Home, le save, project management, le management
and Help.
Home
Press the menu button, use the left and right buttons to highlight the home icon and press select
to return to the home Screen.
File Manager
Pass/Fail Label Icon
Brightness Adjustment Icon
Quick Save
Help Icon
Pass/Fail Marker
25um Ring
130um Ring
(Green)
Live View/Pause View
Indicator
250um Ring
120um Ring
(Yellow)
Home Icon
Pass/Fail Grading Ring
Overlay Icon
Contaminant Scale
Project Folder
g 11.1
Quick Save
Press the menu button, use the left or right buttons to highlight the quick save icon and press the
select button to store a le image of the scope screen in the le folder within an active project.
Scope les will be preceded by a target icon.
Project Management
To open project management, press the menu button, use the left or right buttons to highlight
the project management folder icon and press select. Use the project management folder
to open the project that the scope images are to be stored. When entering the video scope
function, the active folder will be the one last used in the OTDR or LTS. For more information
about the project management system, please refer to Chapter 7 of this guide.
File Management
To open le management, press the menu button, use the left or right buttons to highlight the
le management icon and press select. Use File management to view a list of saved les or to
open a stored image. File types are identied by the preceding icon. Trace les are indicated by a
trace icon, LTS le by an LTS icon and scope les are preceded by scope (target) icon
Help
Press the menu button, use the left and right buttons to highlight the help icon and press select
to view the help information.
11.4 Video Scope Operation Icon Menu
The following functions are only available for use when the video scope is in live scan mode.
Grading Rings
Used to turn on and o the rings that indicate the IEC61300-3-35 grading zones.
Enter the menu mode with the menu button, use the LRUD buttons to highlight the pass/fail
grading rings overlay icon and press the select button. Exit the menu mode and use the LRUD
buttons to center the image in the rings. Use the Pass/Fail Criteria Tables from page 45 to grade
the connector end face. 2, 3, 5 and 10 micron contaminant examples are displayed just below the
connector image on the video scope display.
Pass/Fail Label
Used to cycle through P/F (Pass/Fail) O, P/F Man (In Red "Fail"), P/F Man (In Green "Pass") and
P/F auto. To set the pass/fail indicator, press the menu button, use the left or right buttons to
highlight the pass/fail icon and press select to cycle through the pass/fail states.
Chapter 11.0 - Video Scope / 46
Page 24

ChallengerOptics.com
Wavelength Specic Optical Testing and Measurement Equipment
ChallengerOptics.com
Wavelength Specic Optical Testing and Measurement Equipment
Brightness
Press the menu button, use the left and right buttons to highlight the brightness icon, use the
Select button to cycle through the adjustments for the brightness level.
11.5 Video Scope Operation
Video Probe Tips
There are a number of video probe tips available. To remove a tip from the Probe, grasp the
probe tip and unscrew the tip retention nut from the tip. Pull the tip straight up from the probe.
To place a tip on the probe, ensure the lens is clean, slide the tip on to the end of the probe and
tighten the tip retention nut. Do not over tighten the retention nut.
Viewing/Focusing a Connector
With the video scope turned on and the video probe plugged into the OTDR, insert a connector
in to universal tip or insert the panel adapter tip into the appropriate port. The scope must be
in the live scanning mode to make focus adjustments. Use the focus ring to get the connector
image as sharp as possible. When using panel adapters it is possible to turn the body of the probe
to while the adapter is inserted into the panel to make focus adjustments.
Tip Retention Nut
Focusing Ring
Adapter Tip
Chapter 11.0 - Video Scope / 47
g 11.2
Centering a Connector Image
Once the image is stable and focused, use the stylus to touch the approximate center of the
connector to snap the image near the center of the display and the center of the grading rings.
Use the LRUD buttons to ne tune the image to the center of the display.
Pausing Image Scan
To freeze an image in position and focus level for inspection, press the scan button. This will
pause the image at the current position and focus level. Simply press the scan button again to set
the operational mode back to live mode for focus and position adjustments
Grading Rings
Turn on or o the grading rings by pressing menu and using the left or right buttons to highlight
the grading ring icon and press select. The unit must be in live scan mode to turn the rings o or
on.
Manual Pass/Fail
Use the pass/fail criteria tables on the next page to determine if the connector passes the
IEC61300-3-35 standard. There is a guide to contamination size located at the bottom of the
image. To mark a connector as Pass or Fail, enter the menu mode, highlight the Pass/Fail Label
icon and press select to cycle through pass, fail, or no grading. This must be done in the Live Scan
mode. Once the pass fail status has be entered, the scan may be paused with the scan button
and the points of contamination that caused a failure may be marked on the image.
Manually Marking Points of Contamination
To mark the points of contamination the unit must be in paused mode. Pick up the
contamination marker by using the stylus and touching the contamination sample size that is
required. Touch the image to place the marker. The marker may be ne tuned with the stylus
to cover the contamination point on the image to be marked. Once the marker is positioned
properly, touch the area just below the image that states, "Place marker, touch here to apply" to
lock the marker in place. Repeat this as necessary to mark all the points that need to be indicated
for the pass/fail status. At this point the image should be save with the Quick Save icon
Auto Pass/Fail
Once the image has been centered in the grading rings, set the P/F icon to Auto and press
the scan button. The video scope will evaluate the image and grade it with Pass or Fail.
Contamination will be displayed on the image.
Exiting Video Scope Operation
Enter the menu mode, use the left or right buttons to highlight the Home icon and press select.
Chapter 11.0 - Video Scope / 48
Page 25

ChallengerOptics.com
Wavelength Specic Optical Testing and Measurement Equipment
ChallengerOptics.com
Wavelength Specic Optical Testing and Measurement Equipment
11.6 Pass/Fail Criteria Tables
Fiber End Face Criteria Table for Angled PC Polished Connectors
Zone Description Diameter Allowable Scratches (W) Allowable Defects (D)
A Critical Zone 0µm to 25µm ≤ 4µm None
B Cladding Zone 25µm to 120µm No limit No Limit < 2µm
5 from 2µm to 5µm
None > 5µm
C Adhesive Zone 120µm to 130µm No limit No limit
D Contact Zone 130µm to 250µm No limit None ≥ 10 µm
Fiber End Face Criteria Table for Ultra PC Polished Connectors
Zone Description Diameter Allowable Scratches (W) Allowable Defects (D)
A Critical Zone 0µm to 25µm None None
B Cladding Zone 25µm to 120µm No limit ≤ 3µm No Limit < 2µm
None > 3µm 5 from 2µm to 5µm
None > 5µm
C Adhesive Zone 120µm to 130µm No limit No limit
D Contact Zone 130µm to 250µm No limit None ≥ 10 µm
Fiber End Face Criteria Table for SM PC Polished Conn. (Single Mode Fiber, RL≥ 26 dB)
Zone Description Diameter Allowable Scratches (W) Allowable Defects (D)
A Critical Zone 0µm to 25µm 2 ≤ 3µm 2 ≤ 3µm
None > 3µm None > 3µm
B Cladding Zone 25µm to 120µm No limit ≤ 3µm No Limit < 2µm
None > 3µm 5 from 2µm to 5µm
None > 5µm
C Adhesive Zone 120µm to 130µm No limit No limit
D Contact Zone 130µm to 250µm No limit None ≥ 10 µm
Chapter 11.0 - Video Scope / 49 Chapter 12.0 - Visual Fault Locater / 50
12.1 VFL Safety
CAUTION
This Visual Fault Locater is classied as a Class II laser system and must be used with
all commensurate safe ty precautions . Never view the light emanating from the ber
directly. Place a white pie ce of paper at th e end of the ber and look for the presence
of a red spot on the pap er.
12.2 VFL Description
The Visual Fault Locater emits visible (red) light at the 650 nm wavelength. Its intended function
is to allow an operator to identify the exact location of a break, microbend, or other discontinuity
in a ber optic cable. As the radiation is visible, light emanating from a break or micro bend
enables the user to locate the exact position of a fault even at very short distances that would not
be detectable by conventional means such as an Optical Time-Domain Reectometer, (OTDR). It
is also useful for identifying a particular ber in a cable by exciting the ber to be located with
visible radiation.
12.3 VFL Operation
The Visual Fault Locater is access from the Home screen.
The ber to be tested is connected to the VFL port of the OTDR by means of a standard 2.5
mm ber optic connector. The source may be used in one of its two modes, Modulated or
Continuous. In the modulated mode the laser is turned on and o at a 6 Hz rate. The laser is on
for approximately one third of the cycle. This mode is helpful in permitting the user to identify
the source radiation in the presence of high levels of ambient light. It also aids in conserving
battery life.
The usable range for fault location depends on many factors, the type of ber, the type of cable,
the overall loss.
To activate the VFL, tap the VFL icon to cycle through the available states of o, Continuous and
Modulated.
Page 26

ChallengerOptics.com
Wavelength Specic Optical Testing and Measurement Equipment
ChallengerOptics.com
Wavelength Specic Optical Testing and Measurement Equipment
Chapter 13.0 - Specications / 51
CAUTION
Never look directly into the end of a connected
ber optic cable or ber optic interface of
optical test equipment, to do so could expose
the user to laser radiation and could result in
personal injury.
OPTICAL TIME DOMAIN REFLECTOMETER
Wavelength 1527.4 - 1565.4nm
Dynamic Range 35 dB
Pulse Width 5 - 20,000 ns
Units of Measurement Kilometer, Kilo feet and Mile
Event Dead zone 1m
Attenuation Dead Zone 4m
Resolution .125 - 32m
Distance Uncertainty ±(0.75m + 0.005% x distance + sampling resolution)
Full Scale Distance Range 0.25-64km MM, 0.25-240km SM
Typical Real-time Refresh Rate 2 Hz
Group Index of Refraction (GIR) 1.024 - 2.048
Linearity ± .05 dB/dB
Memory Capacity ~1000
Memory Type Internal
TUNABLE LASER SOURCE
Range Frequency 191.5 - 196.25 THz
Wavelengths 1527.4-1565.4nm, ITU Channels 15 - 62.5
Frequency Accuracy 1.5 GHz
Line Width 1 MHz
Side Mode Suppression Ration 40 dB
Maximum Output Power 13 dBm (Typ.)
Output Power Range 6 dB
Power Setting Resolution 0.01 dB
Power Variation over Wavelength Range ± 0.5 dB
Minimum Channel Spacing 50 GHz (0.4nm)
Fiber Type 9/125 µm
Relative Intensity Noise -140 dB/Hz
CCS reserves the ri ght to change speci cations without no tice. CCS reserves the ri ght to change speci cations without no tice.
Laser Safety
VISIBLE FAULT LOCATER
Emitter Type Laser Photo diode 1100 - 1700nm InGaAs -70 - +9dBm
with interchangeable FC Adapter
Wavelength 650nm ±5nm
Connector Type 2.5mm Universal
Output Power 1mW Max.
GENERAL
Display 4” color touch screen
Power Supply / Charger 100-240V universal
Battery Li-ion 10 hr type.
Storage Temperature -20° to 60°C
Operating Temperature Range Operation 0° to + 40°C
Dimensions (without rubber boot) 8.4607” L x 3.89” W x 1.65” H
Weight 1.6 lbs.
Communications ports USB
Connector Styles FC and SC Interchangeable
Accessories Included Universal power supply with mains for US, UK, CE and
AU. Interchangeable FC and SC adapters, Windows
TM
Compatible Software, USB Cable, Manual on CD,
2 stylus and Rubber Boot
Chapter 13.0 - Specications / 52
Page 27

ChallengerOptics.com
Wavelength Specic Optical Testing and Measurement Equipment
ChallengerOptics.com
Wavelength Specic Optical Testing and Measurement Equipment
Chapter 14.0 - Repair/Warranty/ Version Control / 53
14.1 Repair Information
If repair is required, simply call the factory at 1-310-338-9971 for return instructions and a RMA
number.
14.2 Warranty Information
This product, including all mechanical, electrical, and optical parts and assemblies are
unconditionally warranted to be free of defects in workmanship and material for a period of one
(1) year from the date of delivery.
This warranty does not apply to expendable parts such as batteries or optical panel connectors,
nor to any instrument or component which has been subjected to misuse, alteration, or ber
connector damage. It is the customer’s responsibility to understand all the instructions and
specications prior to operating this instrument. This warranty does not extend to any loss or
damage consequent to the failure of the warranted product.
14.3 Version Control
Through a Program of continuous improvement the upgrade of the features and performance
of this instrument are an on going process. The instrument rmware version is accessible in the
lower right corner of the home screen. The version changes and approximate release dates are as
follows.
 Loading...