

Page 1
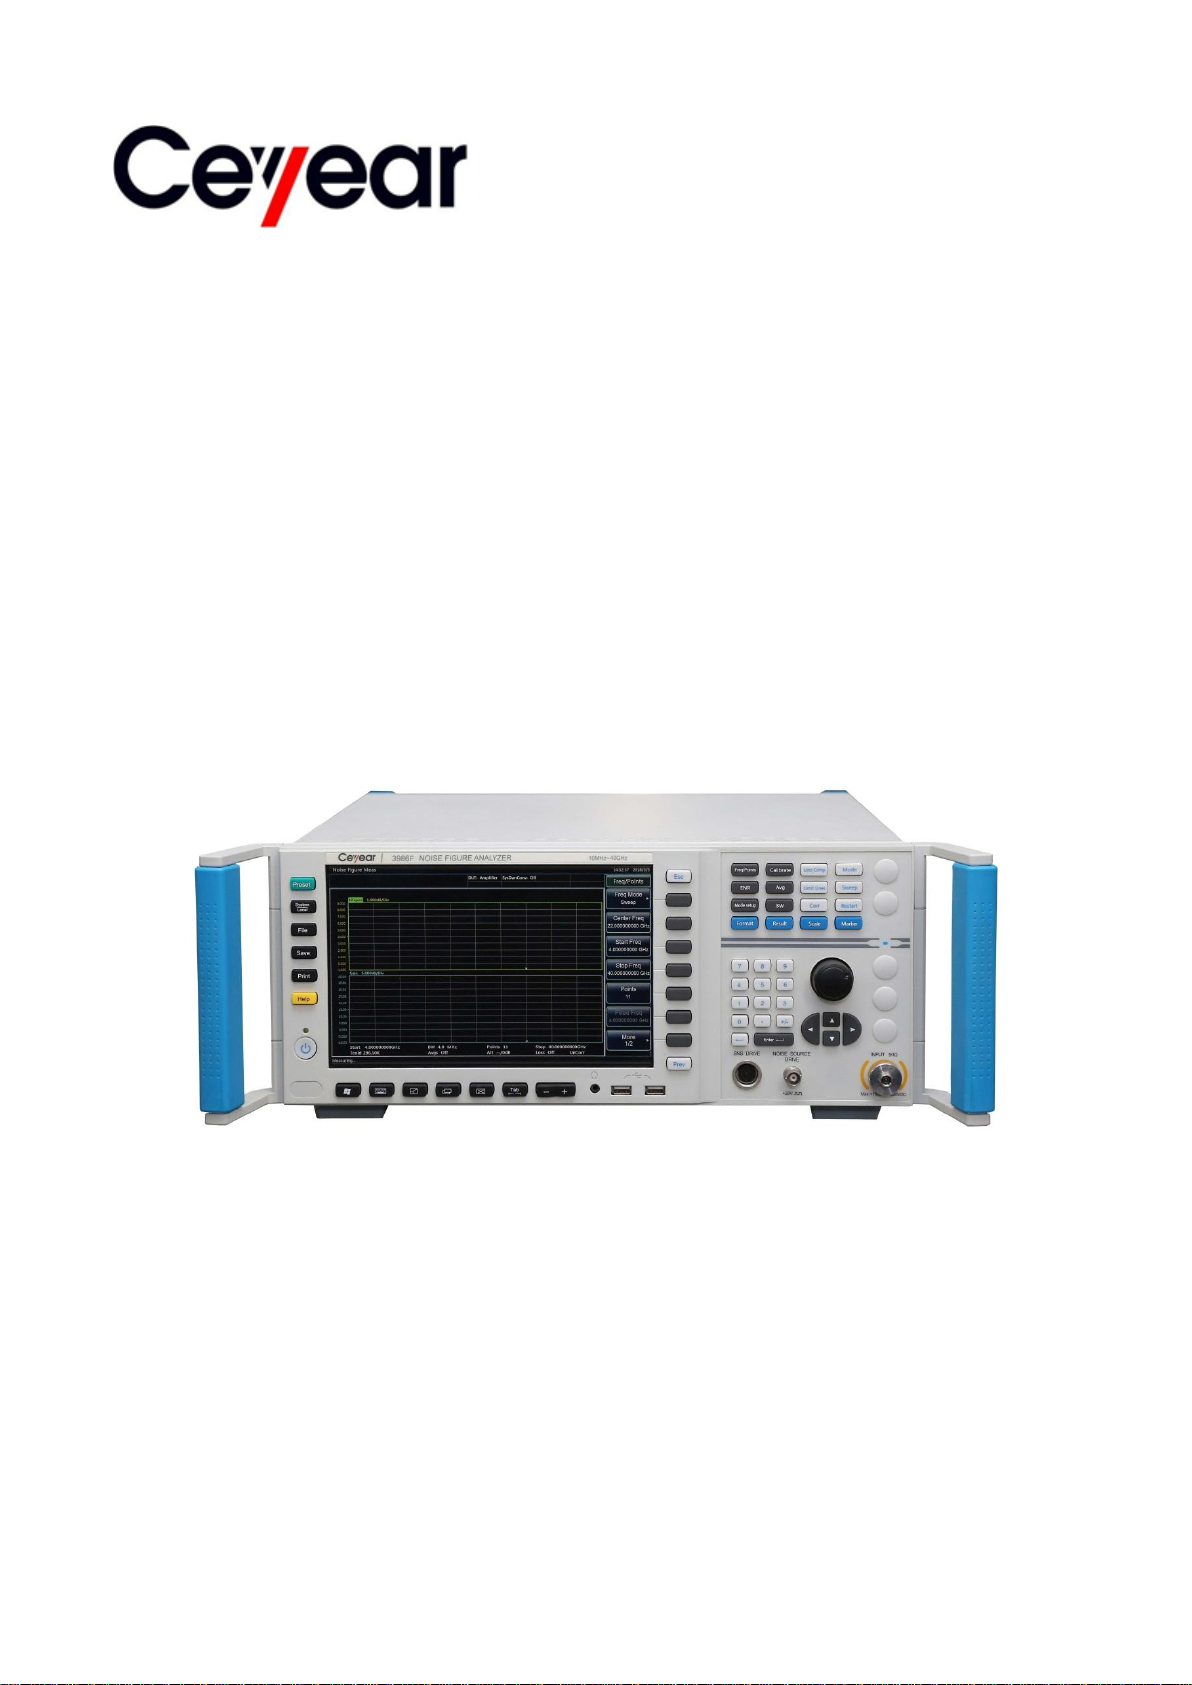
3986 Series
Noise Figure Analyzer
User Manual
China Electronics Technology Instruments Co. Ltd
Page 2

Page 3

This manual is suitable for the following models of noise figure analyzer:
3986A Noise Figure Analyzer (10MHz~4GHz)
3986D Noise Figure Analyzer (10MHz~18GHz)
3986E Noise Figure Analyzer (10MHz~26.5GHz)
3986F Noise Figure Analyzer (10MHz~40GHz)
3986H Noise Figure Analyzer (10MHz~50GHz)
Options:
3986-H01, 16603/16604 series noise source: used as a noise power standard for noise figure
measurements.
3986-H02, 711XX series high-performance co-axial adapter: used to connect the noise source to
the noise figure analyzer.
3986-H03, multi-core cable: used for smart noise source driver interface and noise source
connection of noise figure analyzer.
3986-H04, BNC(m)-BNC(m): used for connection of normal noise source driver interface and
standard noise source for noise figure analyzer
3986-H05, aluminum alloy transportation case: high-strength, lightweight aluminum alloy
transportation case that comes with handle and wheels for ease of transport.
3986-H98, English kit: English display, English manual, English interface, and English operating
system.
Version: A.1, December 2017, China Electronics Technology Instruments Co., Ltd.
Address: No.98, Xiangjiang Road, Qingdao City, China
Tel: +86-0532-86896691
Website: www.ceyear.com
E-mail: [email protected]
Postal code: 266555
Page 4
Attention
Foreword
Thank you for choosing the
3986 series noise figure
analyzer developed and
manufactured by CETI!
We are devoted to providing for
you high-quality products and
first-class after-sales service
with your most concerns and
demands in mind. Our
consistent aim is providing
excellent quality and good
service, and this is our sincere
commitment for all users.
Manual No.
AV2.735.1012SS
Version
A.1 2017.12
China Electronics Technology
Instruments Co., Ltd.
Manual Authorization
This manual may be subject to
change without notice. CETI
reserves all the rights to the
final explanation for all the
information and terminologies
referred to in this manual.
The copyright of this manual
belongs to China Electronic
Instrument Co., Ltd. No entity
or individual may modify the
contents of this manual without
the authorization of the
company, and may not copy or
distribute this manual for profit.
Upon infringement, China
Electronic Instrument Co., Ltd.
reserves the right to pursue
legal responsibilities.
Product Warranty
The warranty for this product is
18 months from the day of
delivery. Instrument
manufacturer will repair or
replace the damaged parts
according to the actual
situation in the warranty period.
In order to ship the product
back to the manufacturer for
repairs, the user must pay
shipping and handling fees.
After maintenance and repair,
the manufacturer will ship the
product back to the user along
with reimbursement of the
shipping and handling fees.
Product Quality
Certification
This product is certified to fulfill
the standards indicated in this
manual from the day of delivery.
Calibration measurements
have been carried out based on
national standards. Related
information is available to the
user for reference.
Technology Instruments Co.,
Ltd. is certified by ISO 9001
and ISO 14001 standards.
Safety Precautions
WARNING indicates a danger
It reminds the user to be
cautious of a certain operation
process, operation method or
the similar. Failure to follow the
rules or operate correctly may
result in the personal injury.
The conditions indicated by
WARNING should be fully
understood and met before the
next operation.
CAUTION indicates an
important information rather
than danger. It reminds the
user to be cautious of a certain
operation process, operation
method or the similar. Failure to
follow the rules or operate
correctly may cause the
damage to the instrument or
loss of important data. The
conditions indicated by
CAUTION should be fully
understood and met before the
next operation.
Quality/Environmental
Management
The quality and environmental
management systems have
always been implemented
during development,
manufacturing and test of this
product. China Electronics
Page 5

Page 6

Page 7

3986 Series noise figure analyzer
1
Table of Contents
Table of Contents
1 About This Manual ...................................................................................... 1
1.1 About This Manual ......................................................................................................... 1
1.2 Related Documents ....................................................................................................... 2
2 Overview..................................................................................................... 5
2.1 General .......................................................................................................................... 5
2.2 Safety guide ................................................................................................................... 5
2.2.1 Safety signs ................................................................................................................................... 6
2.2.2 Operation status and position ..................................................................................................... 7
2.2.3 Electrical safety ............................................................................................................................. 8
2.2.4 Operation precautions .................................................................................................................. 8
2.2.5 Maintenance .................................................................................................................................. 9
2.2.6 Transport ........................................................................................................................................ 9
2.2.7 Waste management/environmental protection ....................................................................... 10
3 Start Guide ................................................................ ................................ 11
3.1 Preparation before Use ................................................................................................ 11
3.1.1 Preparations before operation ................................................................................................... 11
3.1.2 Configuration of operating system ........................................................................................... 20
3.1.3 Routine maintenance ................................................................................................................. 26
3.2 Description of front and rear panels ............................................................................. 27
3.2.1 Description of front panel ........................................................................................................... 27
3.2.2 Description of rear panel ........................................................................................................... 32
3.3 Basic operating instructions ......................................................................................... 35
3.3.1 Display annotation ...................................................................................................................... 35
3.3.2 User interaction ........................................................................................................................... 38
3.3.3 Set preset and poweron states ................................................................................................. 39
3.3.4 Perform file operations ............................................................................................................... 40
3.3.5 Input ENR ..................................................................................................................................... 44
3.3.6 Set measurement frequencies .................................................................................................. 50
3.3.7 Set bandwidth and average....................................................................................................... 53
3.3.8 Calibrate Noise Figure Analyzer ............................................................................................... 53
3.3.9 Display measurement result ...................................................................................................... 56
3.3.10 Measure fixed frequency ......................................................................................................... 64
4 Operation guide ...................................................................................... 67
4.1 Basic operation guide .................................................................................................. 67
Page 8

3986 Series noise figure analyzer
2
Table of Contents
4.1.1 Measurement mode .................................................................................................................... 67
4.1.2 Mode Setup.................................................................................................................................. 68
4.1.3 System Connection .................................................................................................................... 74
4.1.4 Selection of External Local Oscillators .................................................................................... 77
4.1.5 Examples of Basic Amplifier Measurement ............................................................................ 78
4.2 Advanced operation guide ........................................................................................... 82
4.2.1 Guide for Upconverter and Downconverter Measurement ................................................... 82
4.2.2 Examples of upconverter and downconverter mode measurement ................................... 92
4.2.3 Guide for System Downconverter Mode Measurement ...................................................... 100
4.2.4 Examples of System Downconverter Mode Measurement ................................................ 105
4.2.5 Frequency Limit .......................................................................................................................... 113
4.2.6 Loss compensation .................................................................................................................... 117
4.2.7 Limit lines function .................................................................................................................... 121
5 Key Grouping and Menu Description ...................................................... 125
5.1 Measurement Key Group ........................................................................................... 125
5.1.1【Freq/Points】Key ................................................................................................................... 125
5.1.2【Calibrate】Key ....................................................................................................................... 127
5.1.3【ENR】Key ............................................................................................................................... 129
5.1.4【Avg】Key ................................................................................................................................ 132
5.1.5【Mode Setup】Key .................................................................................................................. 133
5.1.6【BW】Key ................................................................................................................................. 136
5.2 Control Key Group ..................................................................................................... 136
5.2.1【Loss Comp】Key ................................................................................................................... 137
5.2.2【Mode】Key ............................................................................................................................. 139
5.2.5【Corr】Key ................................................................................................................................ 143
5.2.6【Restart】Key .......................................................................................................................... 145
5.3 Display Key Group ..................................................................................................... 145
5.3.1【Format】Key ........................................................................................................................... 145
5.3.2【Result】Key ............................................................................................................................ 146
5.3.3【Scale】Key ............................................................................................................................. 147
5.4 System Key Group ..................................................................................................... 152
5.4.1【Preset】Key ............................................................................................................................ 152
5.4.2【System/Local】Key ............................................................................................................... 152
5.4.3【File】Key ................................................................................................................................. 157
5.4.4【Save】Key .............................................................................................................................. 157
Page 9

3986 Series noise figure analyzer
3
Table of Contents
5.4.5【Print】Key ............................................................................................................................... 158
5.4.6【Help】Key ............................................................................................................................... 158
6 Remote Control ..................................................................................... 159
6.1 Remote control basis ................................................................................................. 159
6.1.1 Remote interface ....................................................................................................................... 159
6.1.2 Message ..................................................................................................................................... 161
6.1.3 SCPI ............................................................................................................................................ 162
6.1.4 Command sequence and synchronization ........................................................................... 169
6.1.5 Status reporting system ........................................................................................................... 170
6.1.6 Programming considerations .................................................................................................. 172
6.2 Remote interface and its configuration ....................................................................... 173
6.2.1 LAN ............................................................................................................................................. 173
6.2.2 GPIB............................................................................................................................................ 174
6.3 Basic programming method of the VISA interface ...................................................... 174
6.3.1 Installation of VISA library ........................................................................................................ 174
6.3.2 Initialize Controller .................................................................................................................... 174
6.3.3 Initialization of instrument ........................................................................................................ 175
6.3.4 Sending of setting command .................................................................................................. 175
6.3.5 Reading of instrument status .................................................................................................. 175
6.3.6 Read Frequency Marker .......................................................................................................... 176
6.3.7 Synchronization of command .................................................................................................. 176
6.4 I/O library .................................................................................................................. 177
6.4.1 Overview of I/O library .............................................................................................................. 177
6.4.2 Installation and configuration of I/O library ........................................................................... 178
7 Fault Diagnosis and Repair ................................................................... 181
7.1 Working principle........................................................................................................ 181
7.2 Fault diagnosis and troubleshooting .......................................................................... 182
7.2.1Basic fault diagnosis process ................................................................................................... 183
7.2.2Common faults and troubleshooting methods ....................................................................... 183
7.3 Repair Method ........................................................................................................... 186
7.3.1Contact us ................................................................................................................................... 186
7.3.2Packaging and delivery ............................................................................................................. 187
8. Specifications and Test Methods ............................................................ 189
8.1 Statement ................................................................................................................... 189
8.2 Product features ......................................................................................................... 189
8.3 Specifications ............................................................................................................. 190
Page 10

3986 Series noise figure analyzer
4
Table of Contents
8.3.1 Frequency Range ..................................................................................................................... 191
8.3.2 Frequency Reference Accuracy ............................................................................................. 191
8.3.3 Frequency Tuning Accuracy .................................................................................................... 191
8.3.4 Noise Figure Measurement Range and Measurement Uncertainty .................................. 191
8.3.5 Gain Measurement Range and Measurement Uncertainty ................................................ 191
8.3.6 Input VSWR ............................................................................................................................... 191
8.3.7 Instrument‘s own Noise Figure ............................................................................................... 191
8.3.8 Jitter ............................................................................................................................................ 191
8.3.9 Noise Source Drive Voltage .................................................................................................... 192
8.4 Supplementary Information ........................................................................................ 192
8.4.1 Measurement Bandwidth ......................................................................................................... 192
8.4.2 Sweep Points ............................................................................................................................. 192
8.4.3 Front Panel Port ........................................................................................................................ 192
8.4.4 Rear Panel Port ......................................................................................................................... 192
8.5 Performance Characteristics Test .............................................................................. 193
8.5.1 Recommended test methods .................................................................................................. 193
8.5.2 Performance Test Record Table of 3986 Series Noise Figure Analyzers ........................ 203
8.5.3 Performance Test Auxiliary Table of 3986 Series Noise Figure Analyzers ...................... 204
Appendixes ................................................................................................ 209
Appendix A Terminology ................................................................................................... 209
Noise .................................................................................................................................................... 209
Thermal noise ...................................................................................................................................... 209
Shot noise ............................................................................................................................................ 209
Available noise power ........................................................................................................................ 209
Spectral density for available noise power ..................................................................................... 209
Noise temperature .............................................................................................................................. 209
Equivalent input noise temperature ................................................................................................. 210
Reference noise temperature ........................................................................................................... 210
Noise figure .......................................................................................................................................... 210
Hot and cold state ............................................................................................................................... 210
Hot and cold noise power .................................................................................................................. 210
Y factor method ................................................................................................................................... 210
ENR ................................................................................................................................................... 210
Noise Figure Analyzer ......................................................................................................................... 211
Noise Source ........................................................................................................................................ 211
Noise sideband..................................................................................................................................... 211
Page 11

3986 Series noise figure analyzer
5
Table of Contents
Measurement Mode ............................................................................................................................. 211
Loss Comp ............................................................................................................................................ 211
Preselector ........................................................................................................................................... 212
LO .................................................................................................................................................... 212
Spurious responses ............................................................................................................................ 212
Frequency range ................................................................................................................................. 213
RF attenuation ..................................................................................................................................... 213
Input impedance.................................................................................................................................. 213
Gain compress .................................................................................................................................... 213
IF attenuation ....................................................................................................................................... 213
Appendix B SCPI Command Lookup Table ..................................................................... 214
Appendix C Quick Search Table of Error Messages ........................................................ 224
Page 12

3986 Series noise figure analyzer
6
Table of Contents
Page 13

1 About This Manual
1
1.1 About This Manual
1 About This Manual
This section introduces the function, structure, and main contents of the user manual for the 3986 series
noise figure analyzer and also provides documents associated with the use of the instrument.
About this manual………… ………………………………………………………………………………1
Related Documents………………… ……………………………………………………………………2
1.1 About This Manual
This manual introduces the basic function and operational procedures of the 3986 series noise figure
analyzer. It describes the safety precautions, how to get started, operation guide, button categories and
menu items, remote control, troubleshooting and fault repair, technical standards and testing protocols,
etc. to help you quickly familiarize with and understand the operation and main features of the apparatus.
To facilitate your familiarity with the instrument, please read this manual carefully before operating the
instrument, and then follow the instructions of manual.
The chapters included in this User's Manual are as follows:
Overview
This chapter generally introduces the main performance characteristics, typical application and
operational safety precautions of the 3986 series noise figure analyzer, so that the user can know about
the main performance characteristics of the instrument and operate the instrument safely in accordance
with the instructions.
Start Guide
This chapter describes the preparation for use, instructions for front and rear panels, setting of analyzer
reset status, file operations, form processing and instructions for basic measurements of Series 3986
Noise Figure Analyzer, so that the user can have a preliminary knowledge about the instrument and
measurement process and become familiar with the operation methods of the 3986 series noise figure
analyzer quickly.
Operation Guide
This chapter describes in detail the various measurement modes and operating procedures of the
instrument in two parts: basic operation guide and advanced operation guide. The basic operation guide
is intended for users who are not familiar with the use of the 3986 series noise figure analyzer. The guide
systematically introduces and lists the various settings of the instrument so that users may gain a basic
understanding of the noise figure analyzer. The advanced operation guide is intended for users who are
already comfortable with the general use of the instrument but not familiar with certain specific functions.
This guide introduces several relatively complex testing procedures and operational techniques to help
users in carrying out measurements. For example: converter noise figure measurement, system
downcoverter mode extension measurement, loss compensation and line limits functions, etc.
Button categories and menu items
This chapter introduces the menu structure and items by key function for user‘s query and reference.
Remote Control
This chapter introduces the remote control methods of the instrument so that the user can rapidly master
the method to control the instrument in a remote way. It is further divided into the following four sections:
remote control basis, which introduces the concepts related to remote control, software configuration,
remote interface, SCPI, etc.; instrument interface configuration methods, which introduces the remote
interface connection methods and software configuration methods of the 3986 series microwave power
meter; basic programming methods of the VISA interface, which gives a basic programming example in
the form of text description plus programming examples so that the user can quickly grasp the
programming methods; the I/O function library, which introduces the basic concept of the instrument
driver and the basic installation and configuration of the IVI-COM/IVI-C driver.
Fault Diagnosis and Repair
Page 14

1 About This Manual
2
1.2 Related Documents
This chapter introduces the working principle of the instrument, troubleshooting steps, common
malfunctions and ways to solve and repair the problem.
Specifications and Test Methods
This section lists the performance standards and technical parameters of the 3986 series noise figure
analyzer, and provides recommended procedures for measurement, so that the users can more
thoroughly understand the main performance indicators of the product. The standard working conditions
of the 3986 series noise figure analyzer are: atmospheric temperature of 0℃~+40℃, pressure of 1 atm.
Data collection should be performed at an atmospheric temperature of 23℃±3℃.
Appendixes
This chapter list important information related to the 3986 series noise figure analyzer, including:
terminology, SCPI lookup table, error information lookup table, etc.
1.2 Related Documents
The documents related to the 3986 series noise figure analyzer include:
Quick Start Guide
Online support
User Manual
Programming Manual
Quick Start Guide
This manual introduces the settings of the 3986 series noise figure analyzer as well as the basic
operating methods of measurement with the aim of enabling users to quickly understand the features
and basic local and remote control operation of the instrument. Main chapters included in this manual
are as follows:
About This Manual
Preparation before Use
Typical Applications
Getting Help
User Manual
This manual gives a detailed introduction of features and operation methods of the instrument, including
information about configuration, measurement, remote control, maintenance, etc. so as to provide users
with an all-round understanding of the features of the instrument and aid users in learning the most
common measurement procedures. Main chapters included in this manual are as follows:
About This Manual
Overview
Start Guide
Operation Guide
Button categories and menu items
Remote Control
Fault Diagnosis and Repair
Specifications and Test Methods
Appendixes
Programming Manual
This manual describes the basics of remote control programming, basics of SCPI, SCPIs, examples of
Page 15

1 About This Manual
3
1.2 Related Documents
programming, and I/O driver library, for the purpose of guiding the user to master the SCPIs and
methods of the instrument quickly and comprehensively. Main chapters included in this manual are as
follows:
Remote Control
SCPI
Programming Examples
Error Description
Appendixes
Online support
Online help is integrated with the product in order to provide quick navigation and enable convenient
access by local and remote users. The contents are the same as those in the user manual.
Page 16

1 About This Manual
4
1.2 Related Documents
Page 17

2 Overview
5
2.1 General
2 Overview
This chapter introduces the main performance characteristics and application scope of the 3986 series
noise figure analyzer, as well as the methods for proper operation and precautions for electrical safety.
General………………………………………………………………………………………………………5
Safety guide…………………………………………………………………………………………………5
2.1 General
The 3986 series noise figure analyzer can cover a frequency range of 10MHz to 50GHz. It contains a
highly sensitive receiver, user-friendly interface, high-definition dual-channel display, an abundance of
external connection ports, dual-noise source driver, etc. It is able to measure the noise figure of
amplifiers, downconverters and upconverters; supports the measurement of multi-stage converters; and
supports extended frequency range measurements. With complete loss compensation function, the loss
in the measurement channel can be compensated by means of fixed and/or table form before and/or
after the device under test,which would greatly benefit precise measurement of noise figure of
automatic test system or microwave chips.The limit lines function provides pass/fail notification to
simplify pass/fail assessment. The product can be applied to microwave and millimeter wave amplifiers,
mixers, attenuators and other components to measure noise figure and gain, and is suitable for scientific
research, production, testing, and technical security evaluation in such fields as radar, communication
and navigation.
A mechanical switch is built at the input port of the 3986D/E/F/H series noise figure analyzer to switch
the frequency range between 10MHz to 4GHz and 4GHz to 18/26.5/40/50GHz. The mechanical switch
has a limited service life. To maximize the reliable life of the switch, please avoid frequencies setting
across 4 GHz as much as possible.
2.2 Safety guide
Please carefully read and strictly follow the precautions below!
We will spare no effort to ensure that all production processes meet the latest safety standards and
provide users with the highest security. Our product and its auxiliary equipment have been designed and
tested in accordance with relevant safety standards, and a quality assurance system has been
established for product quality monitoring to ensure that the product complies with these standards. To
keep the equipment in good condition and ensure safe operation, please observe the precautions in this
manual. In case of any doubt, please contact us for consultation.
It is your responsibility to use the product in an appropriate manner. Please carefully read and follow
safety instructions prior to use. This product is applicable to measurement in laboratory environments or
on the site. Always remember to use this product within its restricted conditions to avoid personal injury
or property damage. Any problems caused by failure to use this product properly or as required are to be
accounted by yourself, and we will not bear any responsibility therefrom. Therefore, please always follow
the safety instructions to prevent any risks of personal injury or property damage. Please keep the
product document properly and deliver them to the end user.
Safety signs………… ……………………………………………………………………………………6
Operation status and position………………… …………………………………………………………7
Electrical safety…………………………………… ………………………………………………………8
Page 18
2 Overview
6
Symbol
Meaning
Symbol
Meaning
CAUTION, which indicates
information that requires special
attention from the user, or
operation information or
instructions require attention from
the user.
Power ON/OFF
ATTENTION, which represents
handling of heavy equipment.
Readiness Indicator
DANGER! Risk of electric shock.
Direct current (DC)
WARNING! Risk of scalding.
Alternating current (AC)
Protection of conductive terminal
Direct/alternating current (DC/AC)
Ground
Reinforced insulation protection of
instrument
Grounding terminal
EU mark of battery
For detailed description, please refer to
Paragraph 1 of ―2.2.7 Waste
disposal/environmental protection‖。
ATTENTION, care should be
taken to handle the electrostatic
sensitive device.
EU mark of separate collection of electronic
device
For detailed description, please refer to
Paragraph 2 of ―2.2.7 Waste
disposal/environmental protection‖。
2.2 Safety guide
Operation precautions…………………………… ………………………………………………………8
Maintenance……………………………………… ………………………………………………………9
Transport……………………………………………… ……………………………………………………9
Waste disposal/environmental protection…………… …………………………………………………10
2.2.1 Safety signs
2.2.1.1 Safety signs on the product
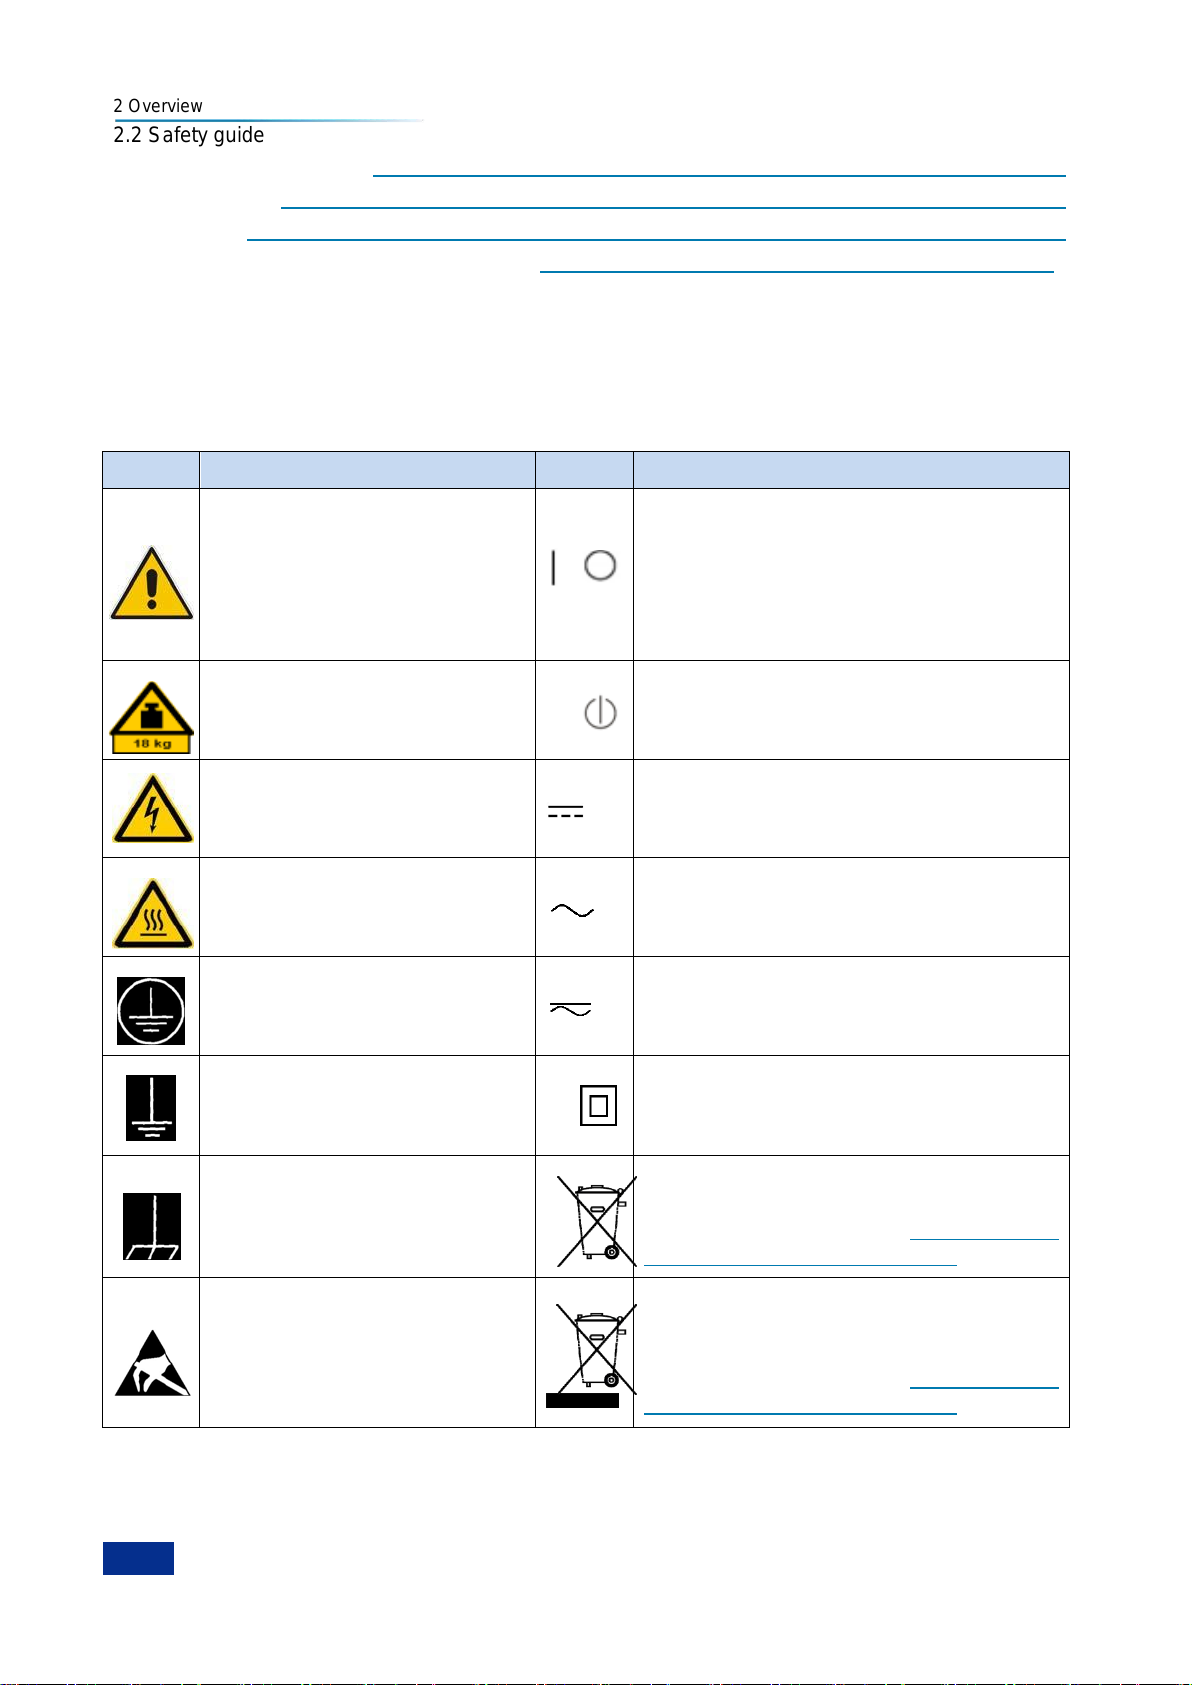
The warning signs on the product are given as follows (see Table 2.1):
Table 2.1 Safety Signs on the Product
Page 19
2 Overview
7
Symbol
Meaning
Symbol
Meaning
WARNING! Risk of radiation.
For detailed description, please
refer to Paragraph 5 of ―2.2.4
Operation precautions‖。
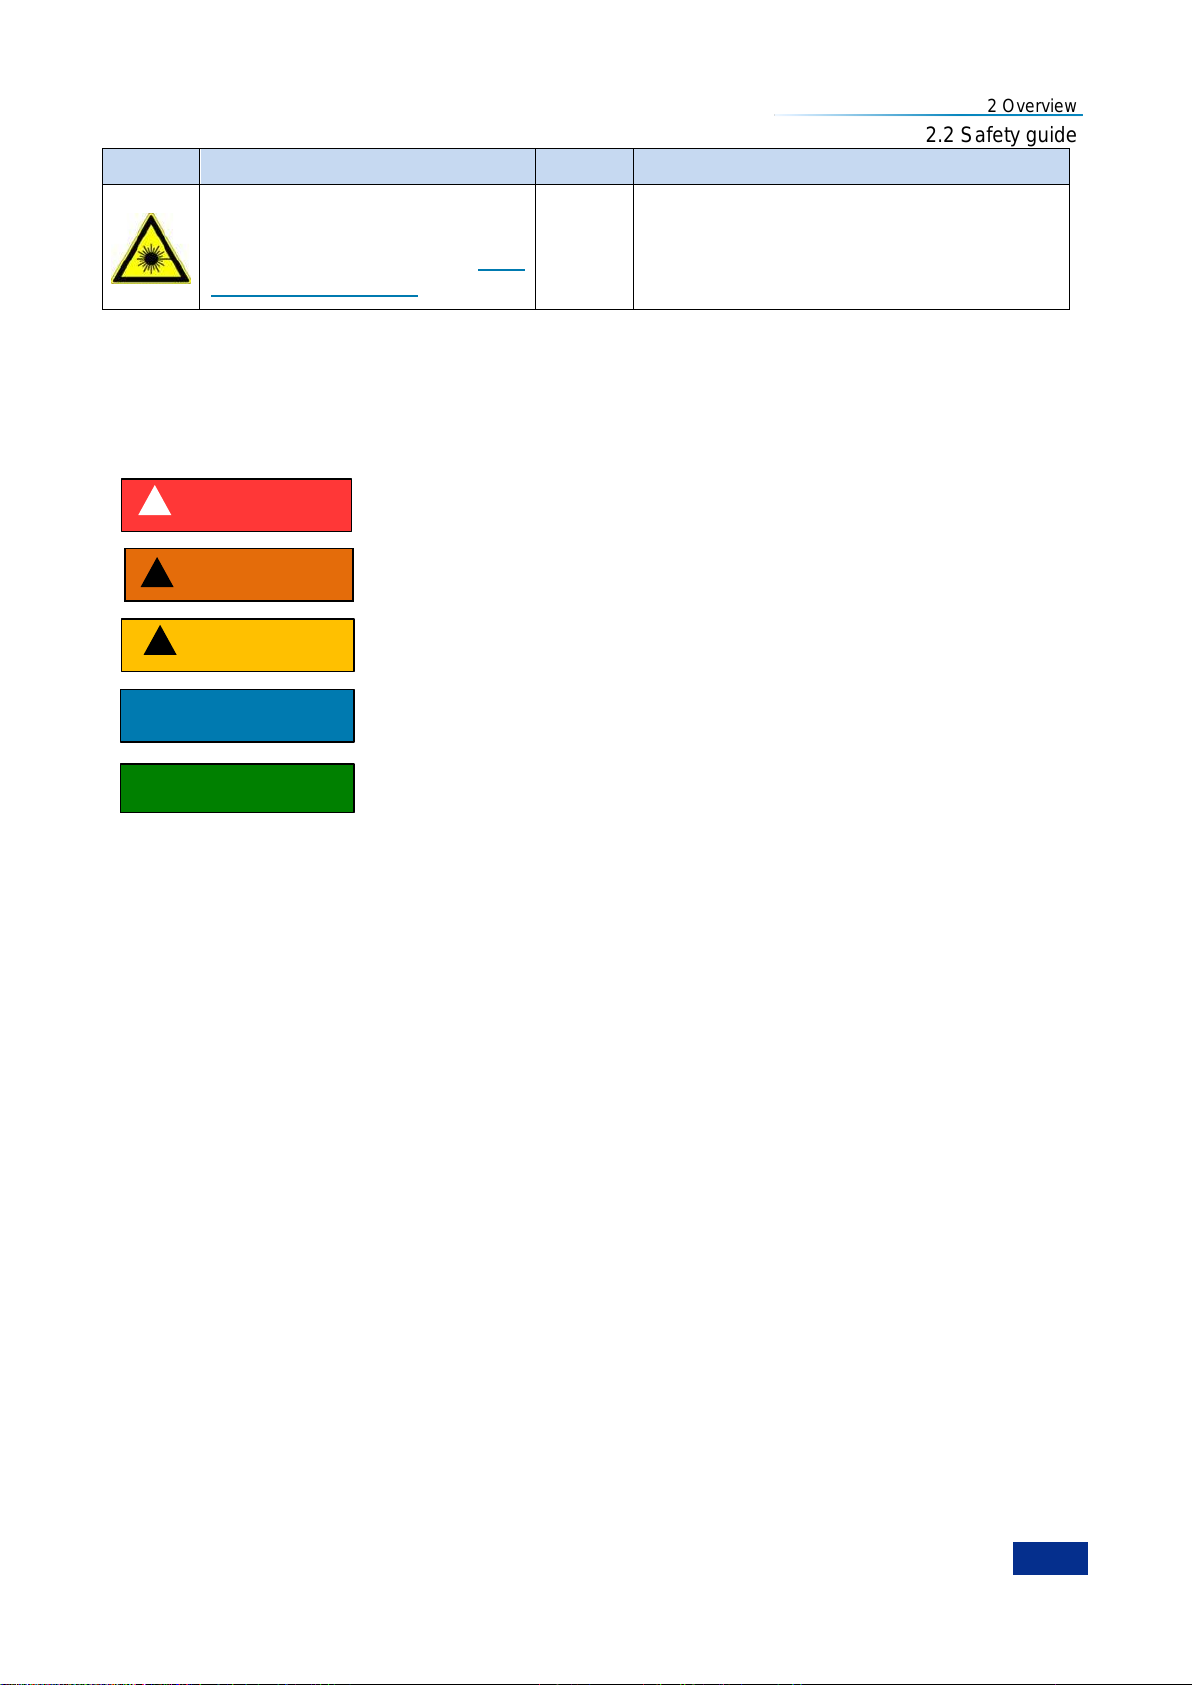
DANGER indicates a situation which, if not being avoided, will lead to
personal injury or equipment damage.
WARNING indicates a situation which, if not being avoided, will lead to
personal injury or equipment damage.
CAUTION indicates a situation which, if not being avoided, will lead to
minor or moderate personal injury or equipment damage.
ATTENTION indicates an important information rather than a danger.
NOTE indicates information about the instrument and its operation.
CAUTION
Attention
NOTE
WARNING
DANGER
2.2 Safety guide
2.2.1.2 Safety signs in the manual
For the purpose of this manual, the following safety warning signs are used to remind the user of
operating the instrument safely and paying attention to relevant information,:
2.2.2 Operation status and position
Before instrument operation, please pay attention to the followings:
1) Unless otherwise stated, the 3986 series noise figure analyzer must satisfy the following
environmental requirements: be placed on a flat surface. The maximum altitude at which the
instrument is operated and transported should not be greater than 4,600 m. The actual supply
voltage is allowed to vary within ±10% of the specified voltage, and the supply frequency is allowed
to vary within ±5% of the specified frequency.
2) Unless otherwise stated, the instrument not subject to waterproof treatment should not be placed on
a watery surface, vehicle, cabinet, table or other unfixed objects that don't meet the load-bearing
condition. Please place and fix the instrument reliably on the surface of a solid object (e.g. anti-static
workbench).
3) Do not place the instrument in an environment that is prone to fogging. For example, if the
instrument is moved in an alternate cooling and heating environment, water droplets will be formed
on the instrument, causing electric shock and other hazards.
4) Do not place the instrument on the surface of a radiating object (e.g. radiator). The ambient
temperature in which the instrument works should not exceed the value given in the section
regarding description of relevant indicators of the product. Overheating of the product will result in
electric shock, fire and other hazards.
5) Do not insert anything into the instrument through the openings on the housing or cover the notches
or openings on the instrument because they are designed for internal ventilation to prevent the
instrument from overheating.
Page 20

2 Overview
8
2.2 Safety guide
2.2.3 Electrical safety
Electrical safety precautions of the instrument:
1) Before turning on the instrument, ensure that the supply voltage matches the indicated supply
voltage of the apparatus.
2) With reference to the power requirements on the instrument's rear panel, a three-core power cord is
used to ensure reliable grounding of the power wire during use. Poor floating or grounding may
cause damage to the instrument or harm to the user.
3) Do not damage the power cord; otherwise leakage will occur, which may damage the instrument
and even cause injury to the operator. If an external power cord or terminal board is used, check it
before use to ensure the electrical safety.
4) If the power outlet is not equipped with ON/OFF switch, the instrument can be directly unplugged for
deenergization. For this purpose, it is necessary to ensure that the instrument can be plugged and
unplugged conveniently.
5) Do not use a damaged power cord. It is necessary to check the integrity and safety of the power
cord before connecting it to the instrument, and place it reasonably to avoid the influence due to
human factors, e.g. the operator is tripped by an excessively long power cord.
6) The outlet should be kept clean and tidy, and the plug and outlet should be contacted properly and
firmly.
7) The outlet and power cord should not be overloaded; otherwise, fire or electric shock will be caused.
8) Unless otherwise permitted, the instrument enclosure should not be opened; otherwise, the internal
circuits and components will be exposed, causing unnecessary damage or injury.
9) If the instrument needs to be fixed at the test site, a protective ground wire should be installed
between the test site and the instrument by a qualified electrician.
10) Appropriate overload protection measures should be taken to avoid instrument damage or personal
injury caused by overload voltage (in the event of lightning for example).
11) Please note that if the instrument catches fire, it may release gases or liquids that are toxic to the
human body.
2.2.4 Operation precautions
1) The instrument operator should have certain professional technical knowledge and certain ability of
emergency response.
2) Before moving or transporting the instrument, please refer to the relevant instructions in ―2.2.6
Transport‖.
3) If the instrument operator suffers from allergy (e.g. rash, frequent sneezing, red eyes, or breathing
difficulty) during operation due to the inevitable use of substances (such as nickel) that may cause
personal allergy in the process of production of the instrument, please seek medical advice promptly
to find the cause and resolve the symptom.
4) Before dissembling the apparatus for waste management, please consult the instructions in the
―2.2.7 Waste disposal/environmental protection‖.
5) As the radio frequency instrument will produce a high level of electromagnetic radiation, a pregnant
woman and an operator with a heart pacemaker need special protection.
6) To prevent static electricity from causing damage to the instrument, an anti-static table mat, footpad,
and wristband should be worn to manage static voltage so that it does not exceed 500 V.
Page 21

2 Overview
9
2.2 Safety guide
7) Use connectors and cables that comply with the specified conditions and check them before
carrying out any operations.
8) Ensure that the power of the RF input port of the instrument is less than the maximum safe input
level of +15dBm to avoid burning the instrument.
9) Do not hot-swap components where it is forbidden, such as GPIB or monitor interfaces.
10) It is forbidden to remove any connector protectors and matching devices provided by the instrument
to avoid causing damage to the connectors or measurement errors.
11) Use the power button on the front panel to turn the instrument on or off normally. Do not disconnect
the power source abruptly. Doing so may cause the system to function abnormally.
12) To ensure the accuracy of the measurement, the instrument must be pre-heated for 30 minutes
before running a measurement.
13) It is forbidden to delete factory data.
14) The instrument adopts an open Windows environment. It is forbidden to modify the configuration of
the BIOS. Doing so will cause the instrument to initiate and function abnormally.
15) Users may only delete his/her own saved files. It is forbidden to delete system files.
16) When transferring files via USB ports or network interface, ensure that they are safe and reliable to
avoid infecting the instrument.
17) To build a test system using GPIB or a network port, the address of the GPIB and the network port
must be configured correctly.
18) If the instrument malfunctions, do not dissemble it, but send .it back to the manufacturer for
maintenance and repair.
2.2.5 Maintenance
1) Only authorized technical personnel who have been professionally trained is allowed to open the
casing of the instrument. Before performing such operation, it is necessary to disconnect the power
cord to prevent instrument instrument or even personal injury.
2) The instrument should be repaired, replaced or maintained by a professional electronic engineer
designated by the manufacturer. The replaced and maintained part should be subject to safety test
to ensure safe use of the product in the future.
2.2.6 Transport
1) If the instrument is heavy, please move it carefully, and if necessary, use an aid (such as crane) to
move the instrument so as to avoid body damage.
2) The instrument handle is suitable for personal handling, and it should not be used to fix the
instrument on the carrier for transportation. To prevent property damage or personal injury, please
transport the equipment based on the safety regulations specified by the manufacturer.
3) When operating the equipment on a transport vehicle, the driver must be cautious to ensure the
safety of transport. The manufacturer is not responsible for any unforeseen circumstances during
the transport process. Therefore, please do not operate the apparatus when it is being transported.
In addition, safety measures should be reinforced in order to ensure that the product is transported
safely.
Page 22

2 Overview
10
2.2 Safety guide
2.2.7 Waste management/environmental protection
1) Please do not dispose of equipment marked with batteries or rechargeable batteries with unsorted
waste. These wastes should be individually collected and disposed of at an appropriate collection
point or through the customer service center of the manufacturer.
2) Please do not dispose of electronic equipment with unsorted waste. These wastes should be
individually collected. The manufacturer has the right and responsibility to aid the end user in
managing waste products. If necessary, please contact the customer service center of the
manufacturer for the corresponding procedures in order to avoid environmental harm.
3) When the product or the internal components are subjected to mechanical or thermal reprocessing,
toxic substances may be released (e.g. lead, niobium, nickel, etc.) To avoid causing harm to the
user, the equipment must only be dissembled by technical personnel who have received
professional training and have the relevant experience in handling the equipment.
4) During reprocessing, the product may release toxic material or fuel. Please refer to the operational
safety procedures outlined by the manufacturer and use specific measures for processing in order
to avoid causing harm to the user.
Page 23
3 Start Guide
11
Attention
3.1 Preparation before Use
3 Start Guide
This Chapter describes the preparation for use, instructions for front and rear panels, setting of analyzer
reset status, file operations, use of form processing and instructions for basic measurements of 3986
Series Noise Figure Analyzer, to enable users get a preliminary knowledge and the measurement
process of the noise figure analyzer. The content contained in this chapter is consistent with that in
relevant chapters of Quick Start Guide.
Preparation for Use………………… ……………… ………………………………………………11
Instructions for Front and Rear Panels…… … … ………………………………………………27
Basic Operating Instructions…………………… … …… ……………………………………………35
3.1 Preparation before Use
Preparations before operation……………… … ……………………………………………………11
OS configuration……………………………… … ……………………………………………………20
Routine maintenance………………………… … …………………………………………………26
3.1.1 Preparations before operation
This section provides precautions for initial use of Series 3986 Noise Figure Analyzer.
To prevent injuries and analyzer damages:
To avoid the electric shock, fire and personal injury:
1) Please do not dissemble the casing of the instrument.
2) Do not attempt to dismantle or modify any part not described in this manual. In case that the user
disassemble the analyzer without approval and cause the electromagnetic shielding performance
degradation and component damages that affect the reliability within the warranty period, we will not
provide free repairs.
3) Please read related content in ―2.2 Guidelines for Safe Use‖ and the safety cautions for operations
below carefully and pay attention to related requirements for specific operating environment in
technical specifications.
Electrostatic protection:
Pay attention to the ESD protection measures in the workplace to avoid the damage to instrument.
Please see ―2.2 Guidelines for Safe Use‖ for details.
Page 24
3 Start Guide
12
Item
Quantity
Function
Main unit
3986
1 — Standard parts
3-core power cord
1 — USB mouse 1 —
User Manual 1 —
Programming Manual
1
—
NOTE
Attention
3.1 Preparation before Use
During instrument operation, please pay attention to the following aspects:
An improper operating position or measurement setting can damage the instrument or appliances
connected to it. Before powering on the instrument, please pay attention to the followings:
1) To ensure that the fan blade and radiating hole are unobstructed, keep the instrument at least
15cmaway from the wall, and ensure that all ventilation holes of the fan are unobstructed;
2) Keep the instrument dry;
3) Place the instrument horizontally and reasonably;
4) Ensure that the surrounding temperature is in accordance with the requirements in the technical
specifications.
5) The power of input signal shall not exceed the rating.
Effect of electromagnetic interference (EMI):
The electromagnetic interference can affect the measurement results, therefore, it is necessary to:
1) select appropriate shielded cables, For example, use RF shielded twisted pair/network connection
cable.
2) Always use a protective sleeve to cover a cable connection port not used temporarily.
3) Refer to the EMC class identified in the technical specifications.
3.1.1.1 Unpacking
1) Visual inspection
Step 1. Check if the packaging box and shockproof package are broken; if so, keep the outer package
and continue to check in accordance with the following steps;
Step 2. Unpack and check if the main unit and accessories are broken;
Step 3. Check the following items against Table 3.1 carefully;
Step 4. If the outer package is broken, the instrument or accessories are damaged or there is any error
of the delivery, it is strictly forbidden to switch on the instrument! Please contact our service
hotline provided in this manual and we will repair or replace them quickly as appropriate.
2) Model confirmation
The Series 3986 Noise Figure Analyzer will be delivered with the items shown in Table 3.1.
Table 3.1 Packing List of Series 3986
Page 25
3 Start Guide
13
Packing list 1 —
Noise source option
16603 1 —
16604 1 —
Working temperature
0℃~40℃
Relative humidity
Not controlled at 0℃~10℃
5% - 95% at 10℃~30℃
5% - 75% at 30℃40℃
Altitude
(0 - 4600) m
Instrument Part
Radiation Distance
Rear part
≥150mm
Left and right parts
≥60mm
Attention
3.1 Preparation before Use
3.1.1.2 Environmental requirements
Series 3986 Noise Figure Analyzer shall be operated in a place meeting the following environmental
requirements:
1) Operating environment
The operating environment shall meet the requirements specified in Table 3.2.
Table 3.2 Requirements for Operating Environment of Series 3896
The above environmental requirements are only defined for the operating environment of the instrument
and are not within the scope of specifications.
2) Radiation requirements
In order to ensure that the ambient temperature of the instrument is within the temperature range
required for the operating environment, it shall meet the requirements for heat dissipation space of the
instrument, as shown in Table 3.3:
Table 3.3 Requirements for Heat Dissipation of Series 3986
3) ESD protection
The static electricity is destructive to electronic components and equipment. Generally, we will use two
anti-static measures, including combination of conductive table mat and wrist combination as well as
combination of conductive floor mat and ankle strap. If these two combinations are used together, a
good anti-static protection can be provided. For the safety of users , anti-static components must
provided an isolation resistance of at least 1 MΩ to the ground.
Please use the following anti-static measures to reduce damages caused by static electricity:
1) Ensure that all instruments are properly grounded to avoid generating static electricity;
2) Before connecting the coaxial cable to the instrument,contact its inner and outer conductors with the
ground temporarily;
3) The staff shall wear anti-static wrist straps or adopt other anti-static measures before contacting
joints and core wires or carrying out any assembly operation.
Page 26
3 Start Guide
14
Power Supply
Parameter
Applicable Scope
Voltage, frequency
220V±22V, 50Hz-60Hz
110V±11V, 50Hz-60Hz/400Hz
Power consumption
(power-on)
<250W
<250W
Power consumption
(standby)
<20W
<20W
NOTE
3.1 Preparation before Use
Voltage range:
The above anti-static measures can‘t be taken in a place where the voltage exceeds 500 V.
3.1.1.3 Power on/off
1) Precautions before power-on
It is necessary to check the following items before powering on the instrument:
a) Confirmation of power supply parameters
Series 3986 Noise Figure Analyzer is equipped with a built-in 220VAC power module (using 220VAC
power supply) or 110V/220V adaptive AC power module (optional, using 110VAC or 220VAC power
supply; the internal AC power module is adaptive to external AC power supply voltage for automatic
switching of working modes). Therefore, please check the power supply requirements indicated on the
rear panel before using the Noise Figure Analyzer. The requirements for external power supply for the
normal operation of the Noise Figure Analyzer are listed in Table 3.4.
Table 3.4 Requirements for Power Supply of Series 3986
To prevent mutual interference of power supplies:
In order to prevent damages of the instrument hardware due to the mutual interference of several
devices via power supplies, especially peak pulses generated by high power equipment, it is
recommended to use the 220VAC or 110 VAC regulated power supply.
b) Confirmation and connection of power cord
Series 3986 Noise Figure Analyzer is equipped with a port in compliance with the national safety
standard for 3-core power cords. Before energizing the Noise Figure Analyzer, it must be confirmed that
the protective ground wire in the power cord has been reliably grounded; either floating or
improper grounding can cause the instrument to be destroyed or injuries to the operator. It is prohibited
to use a power cord without a protective ground. When connected to a suitable power socket, the power
cord realizes grounding of the instrument enclosure. The power cord should be rated at ≥250V for
voltage and ≥6A for current.
Page 27
3 Start Guide
15
3.1 Preparation before Use
Grounding
Poor or incorrect grounding may cause instrument damage and even personal injury. Before energizing
the Noise Figure Analyzer, it must be ensured that the power supply is properly grounded.
Please use the power socket with a protective ground. Do not replace the protective ground wire with an
external cable, power cord or autotransformer without grounding protection. If an autotransformer must
be used, the common port must be connected to the protective ground wire of the power port.
When connecting the instrument to the power cord:
Step 1. Check if the power cord is damaged;
Step 2. Use the power cord to connect the power port on the rear panel of the instrument to a
well-grounded 3-core power socket.
2) First power-on
The methods and precautions for instrument power-on/power-off are as follows:
a) Connection of power supply
Verify the power supply parameters and the power cord before powering on for the first time; see
―Precautions before power-on‖ for details.
When connecting the power supply, connect one end of the power cord supplied with the Noise Figure
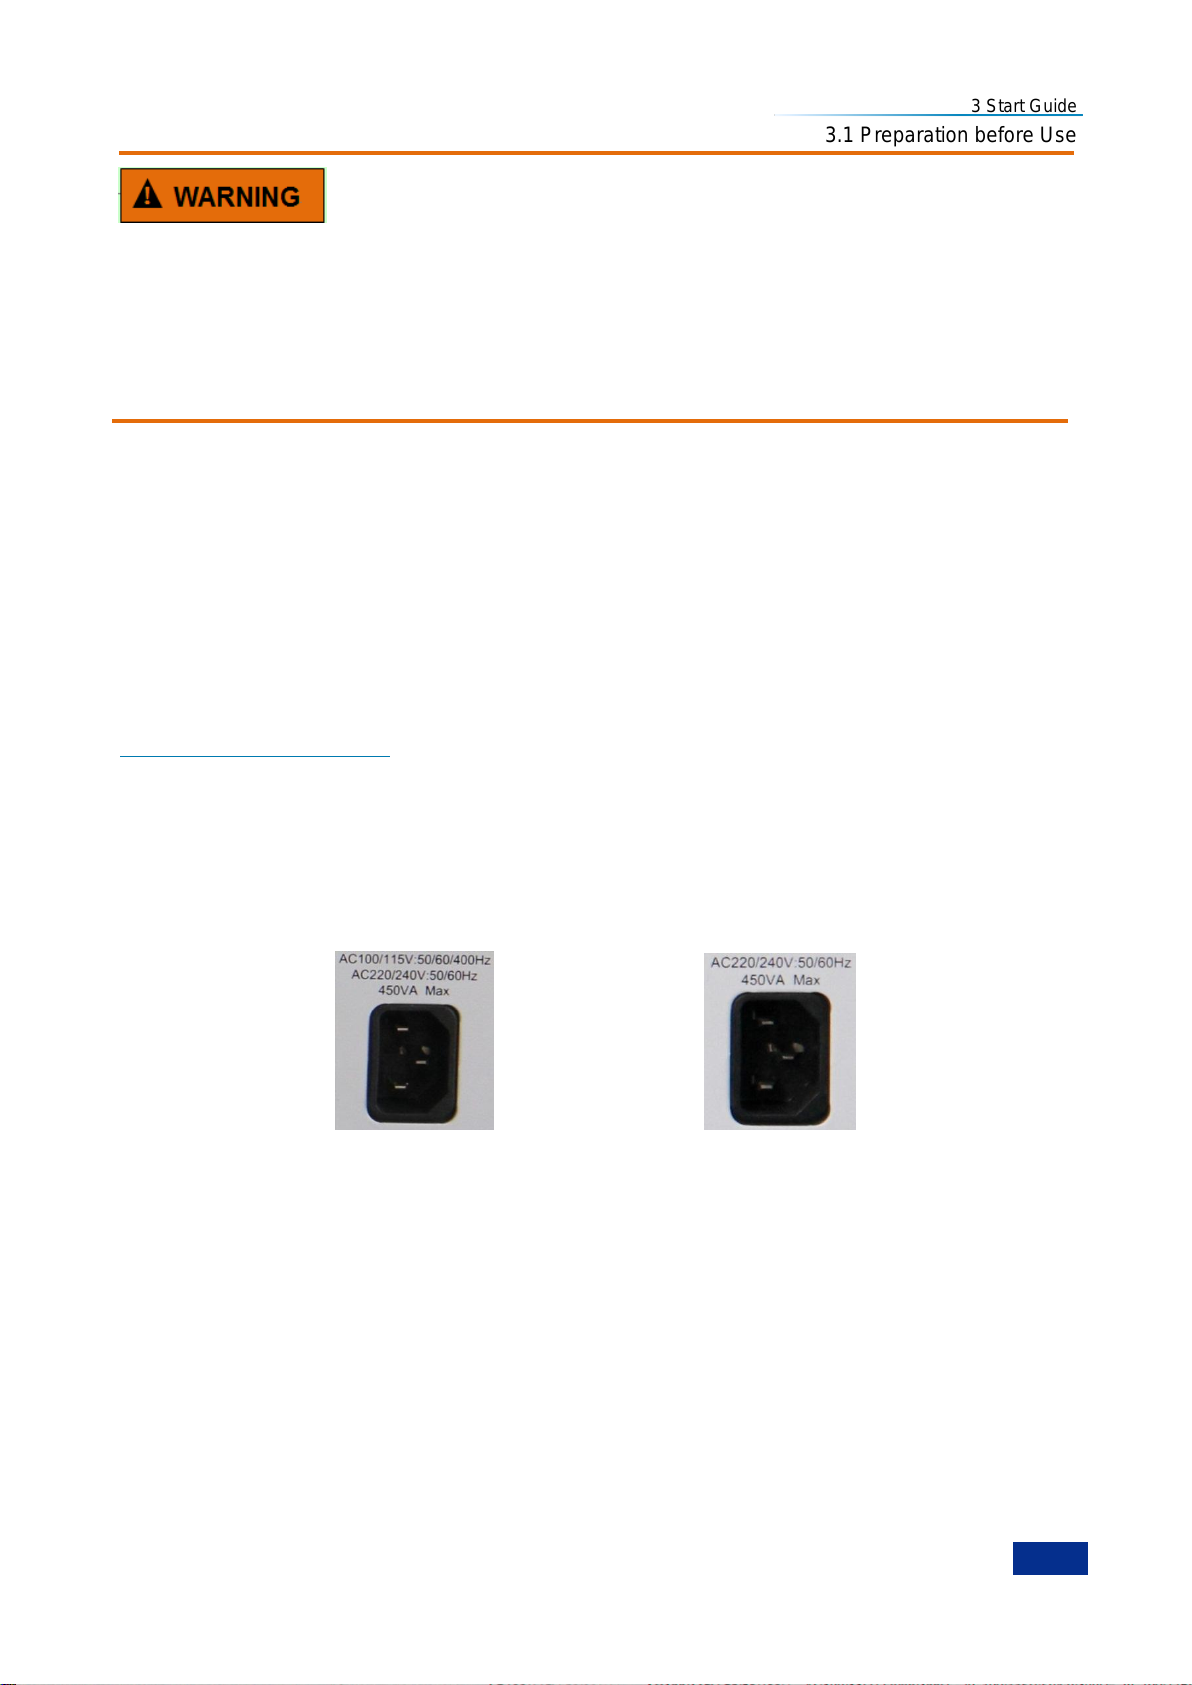
Analyzer in the packaging box or a 3.1-core power cord as required to the power port on the rear panel
of the analyzer, as shown in Fig. 3.1; the required voltage parameter is indicated beside the port to
remind users to use specified voltage; and than, connect the other end of the power cord to the AC
power supply as required.
110V/220VAC adaptive power module 220VAC power module
Fig. 3.1 Power Port on Rear Panel of Series 3986
b) Power on/off
i Power-on
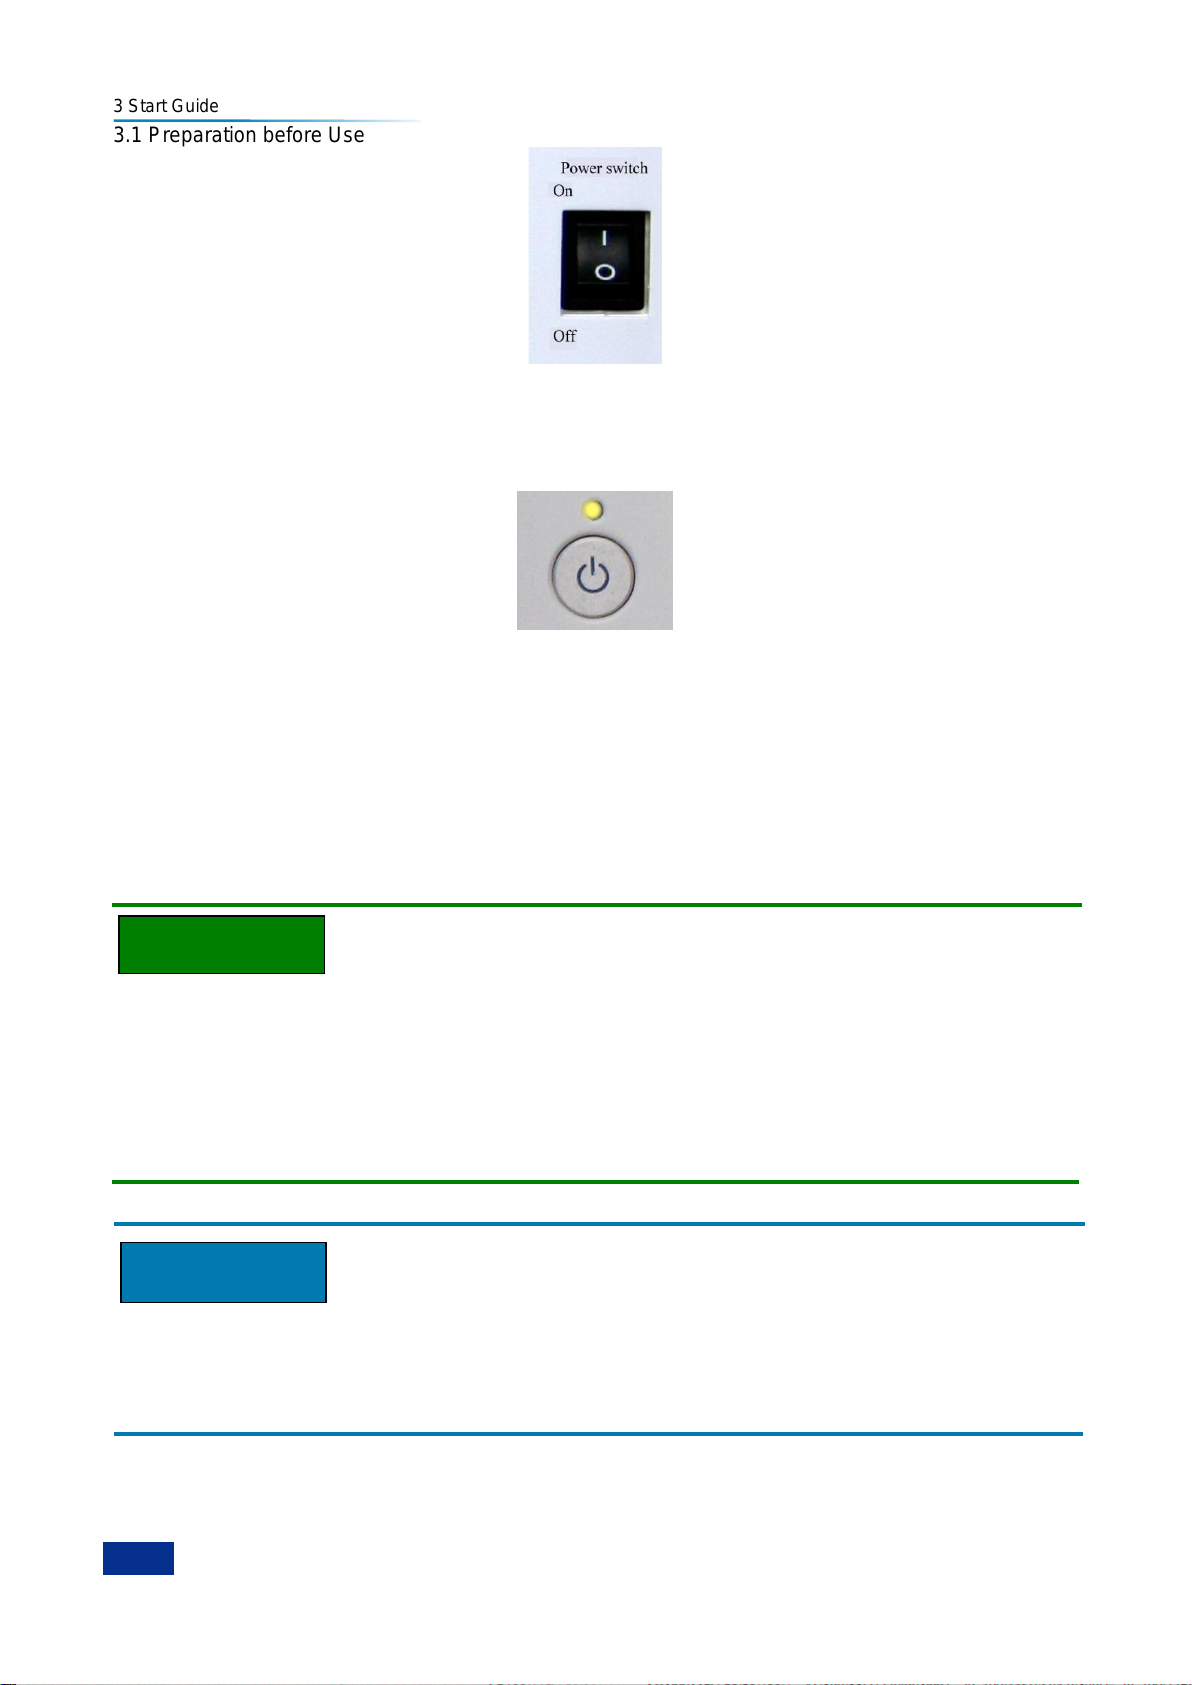
Step 1. Turn on the power switch of the rear panel, as shown in Fig. 3.2, and check if the standby
indicator above the power switch of front panel lights up in yellow, which indicate that the
instrument is in standby.
Page 28
3 Start Guide
16
Attention
NOTE
3.1 Preparation before Use
Fig. 3.2 Power Switch on Rear Panel of Series 3986
Step 2. Do not connect any device to the Noise Figure Analyzer before power-on; turn on the power
switch of the front panel, as shown in Fig. 3.3 and the indicator above the power switch of front
panel turns to green.
Fig. 3.3 Power Switch on Front Panel of Series 3986
Step 3. The user interface of the front panel displays related information of the starting process: briefly
display the manufacturer name and logo and then go to the OS menu. There are two options in
the menu and users have no need to operate this menu during normal use. the user does not
need to operate the menu. After the timer reaches ―0‖, Windows 7 will start automatically.
Step 4. After Windows 7 launches, the system runs the initialization program of the Noise Figure
Analyzer automatically and display the main operation interface, in which the analyzer can be
operated.
10MHz time base and warm-up
During the cold start (started from full shut-down status), Series 3986 Noise Figure Analyzer shall be
warmed up for a period of time to enable the analyzer to reach the operating temperature at 10MHz time
base. If the analyzer starts from standby mode, it does not require the time base warm-up. When the
specifications are tested, the instrument should warm up for 0.5 h (please refer to the relevant
instructions for specifications in the specifications for details).
System startup:
The analyzer is equipped with a console based on Windows computer; during the BIOS boot test and
Windows loading, no user intervention is needed but the power supply shall not be cut off and no
settings in BIOS shall be changed.
ii Power-off
Step 1. Turn off the power switch on the bottom left of front panel. Then the analyzer goes into the
shut-down process (software and hardware may need some time to process before power-off)
Page 29
3 Start Guide
17
Attention
CAUTION
3.1 Preparation before Use
and after several seconds, the analyzer powers off when the indicator above the power switch
turns from green to yellow.
Step 2. Turn the power switch on the rear panel to OFF position or disconnect the power supply of the
analyzer.
Analyzer power-off:
During normal operation, the analyzer shall only be powered off by operating the power switch of the
front panel. Do not operate the power switch of the rear panel or disconnect the power supply directly, or
otherwise the analyzer cannot go into the power-off status, which may damage the analyzer or cause the
current status/measurement data being lost. Please shut down the analyzer properly.
c) Disconnection of power supply
In abnormal conditions, the analyzer shall be power off to avoid causing personal injuries. At this time,
just disconnect the power cord (from the AC power outlet or rear panel power outlet of the instrument).
Therefore, a sufficient operating space should be reserved during instrument operation so that the power
supply can be disconnected directly when necessary.
3.1.1.4 Correct use of connector
Connectors are often used in various tests by analyzer and when connecting them, the followings shall
be noted:
1) Check connectors
It is necessary to wear an anti-static wrist strap when checking the connectors. It is recommended to use
a magnifier to check:
the electroplated surface for wear and deep scratches;
the thread for deformation;
the thread and joint surface for metallic particles;
the inner conductor for bending and breakage;
the screw for improper rotation.
Check the connectors to prevent damaging the analyzer ports:
Any damaged connector may damage the good connector connected to it even for the first time of
measuring connection, and to protect the ports of the analyzer, the connector to be used shall be
checked before connection.
2) Connection
The connectors should be checked and cleaned before measurement and connection to ensure that
they are clean and undamaged. It is necessary to wear an anti-static wrist strap during connection. The
correct connection methods and procedures are as follows:
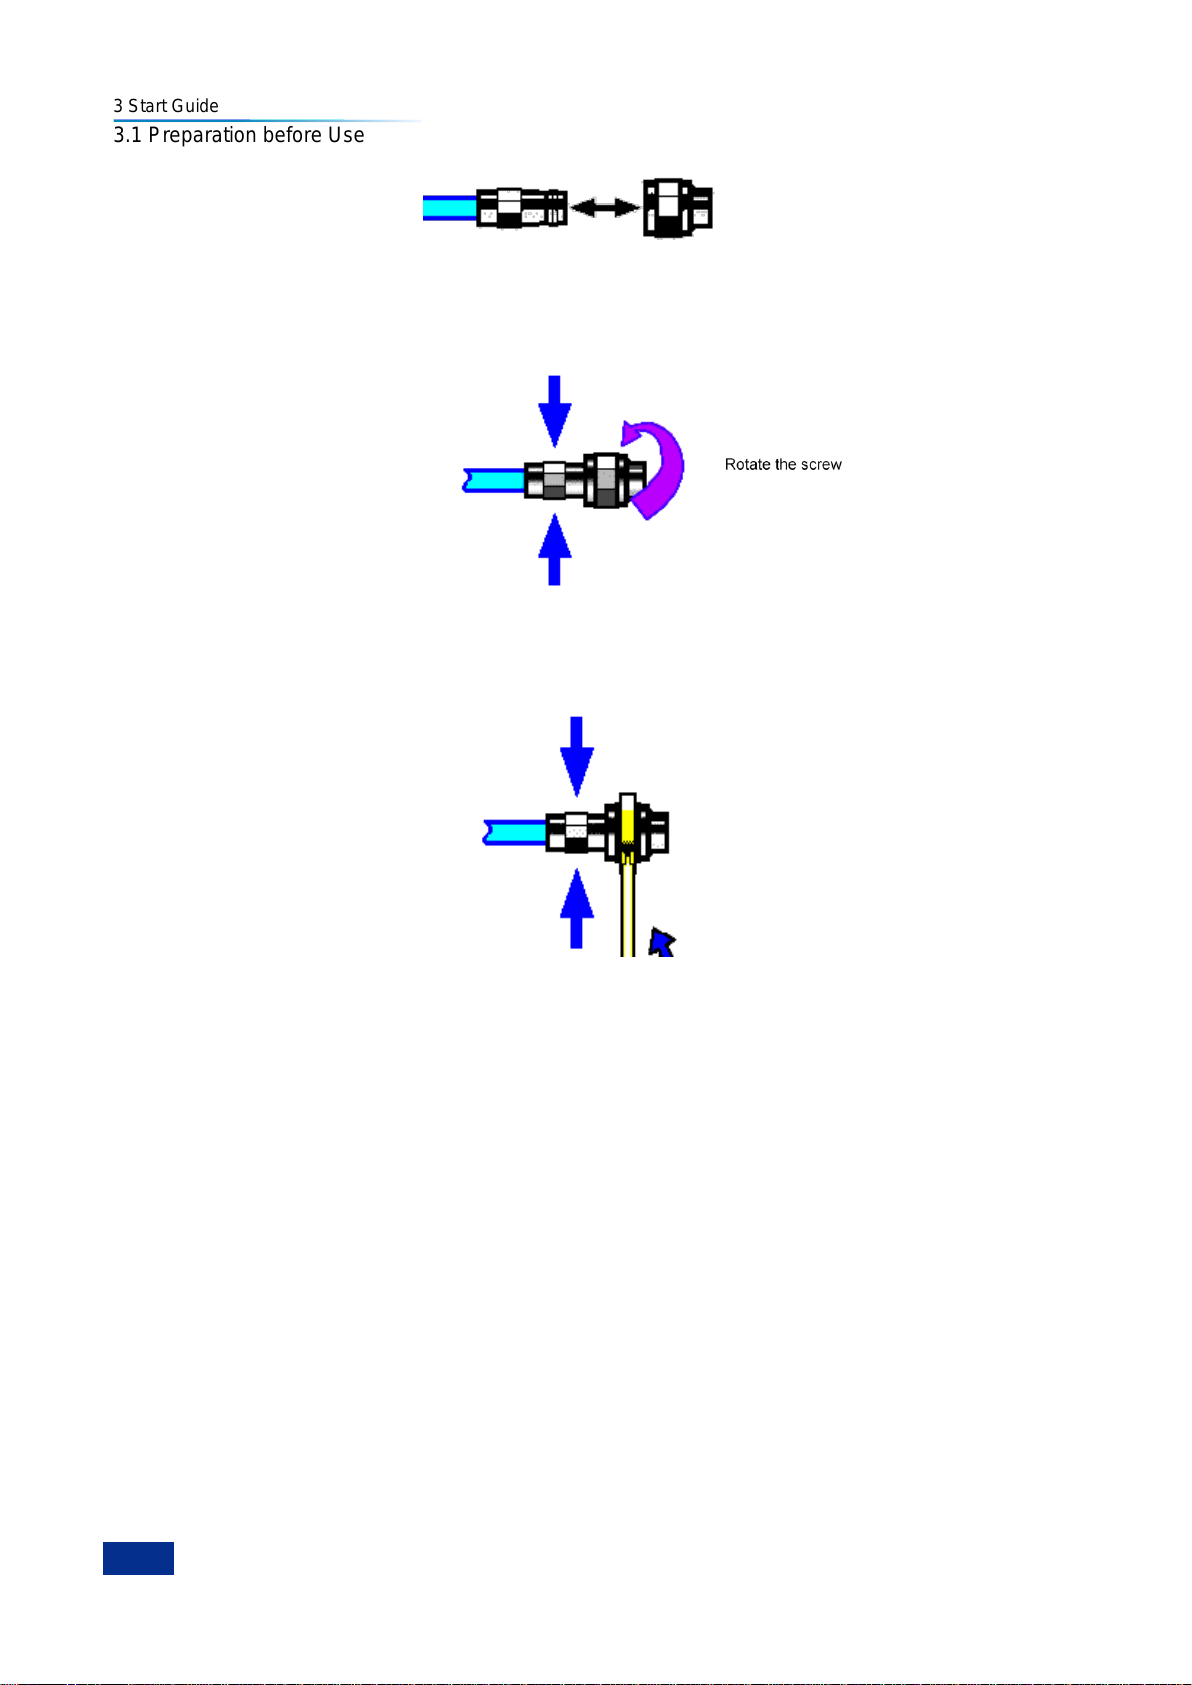
Step 1. As shown in Fig. 3.4, align the axis of both devices to be connected to ensure the pins of male
connector can concentrically slide into the holes of female connect;
Page 30
3 Start Guide
18
Keep it
unmoved
Keep it
3.1 Preparation before Use
Fig. 3.4 Diagram - Connecting Connector
Step 2. As shown in Fig. 3.5, move both connectors straight together, so that they can be connected
smoothly; rotate the threaded sleeve of connector (rather than the connector itself) until it is
tightened; during connection, there can be no relative rotary motion both connectors;
Fig. 3.5 Diagram - Rotating Connector
Step 3. As shown in Fig. 3.6, use a torque wrench to tighten the connectors and finish the connection;
the torque wrench shall not exceed the starting break point and an auxiliary wrench can be
used to prevent the connector rotating.
unmoved
Fig. 3.6 Diagram - Use of Wrench
3) Disconnection
Step 1. Support the connectors to prevent applying twisting, rocking or bending force to any one of the
connectors;
Step 2. Use a open-end wrench to prevent the connector body from rotating;
Step 3. Use another wrench to loosen the threaded sleeve;
Step 4. Rotate the threaded sleeve by hand and finish the disconnection;
Step 5. Separate both connectors straight。
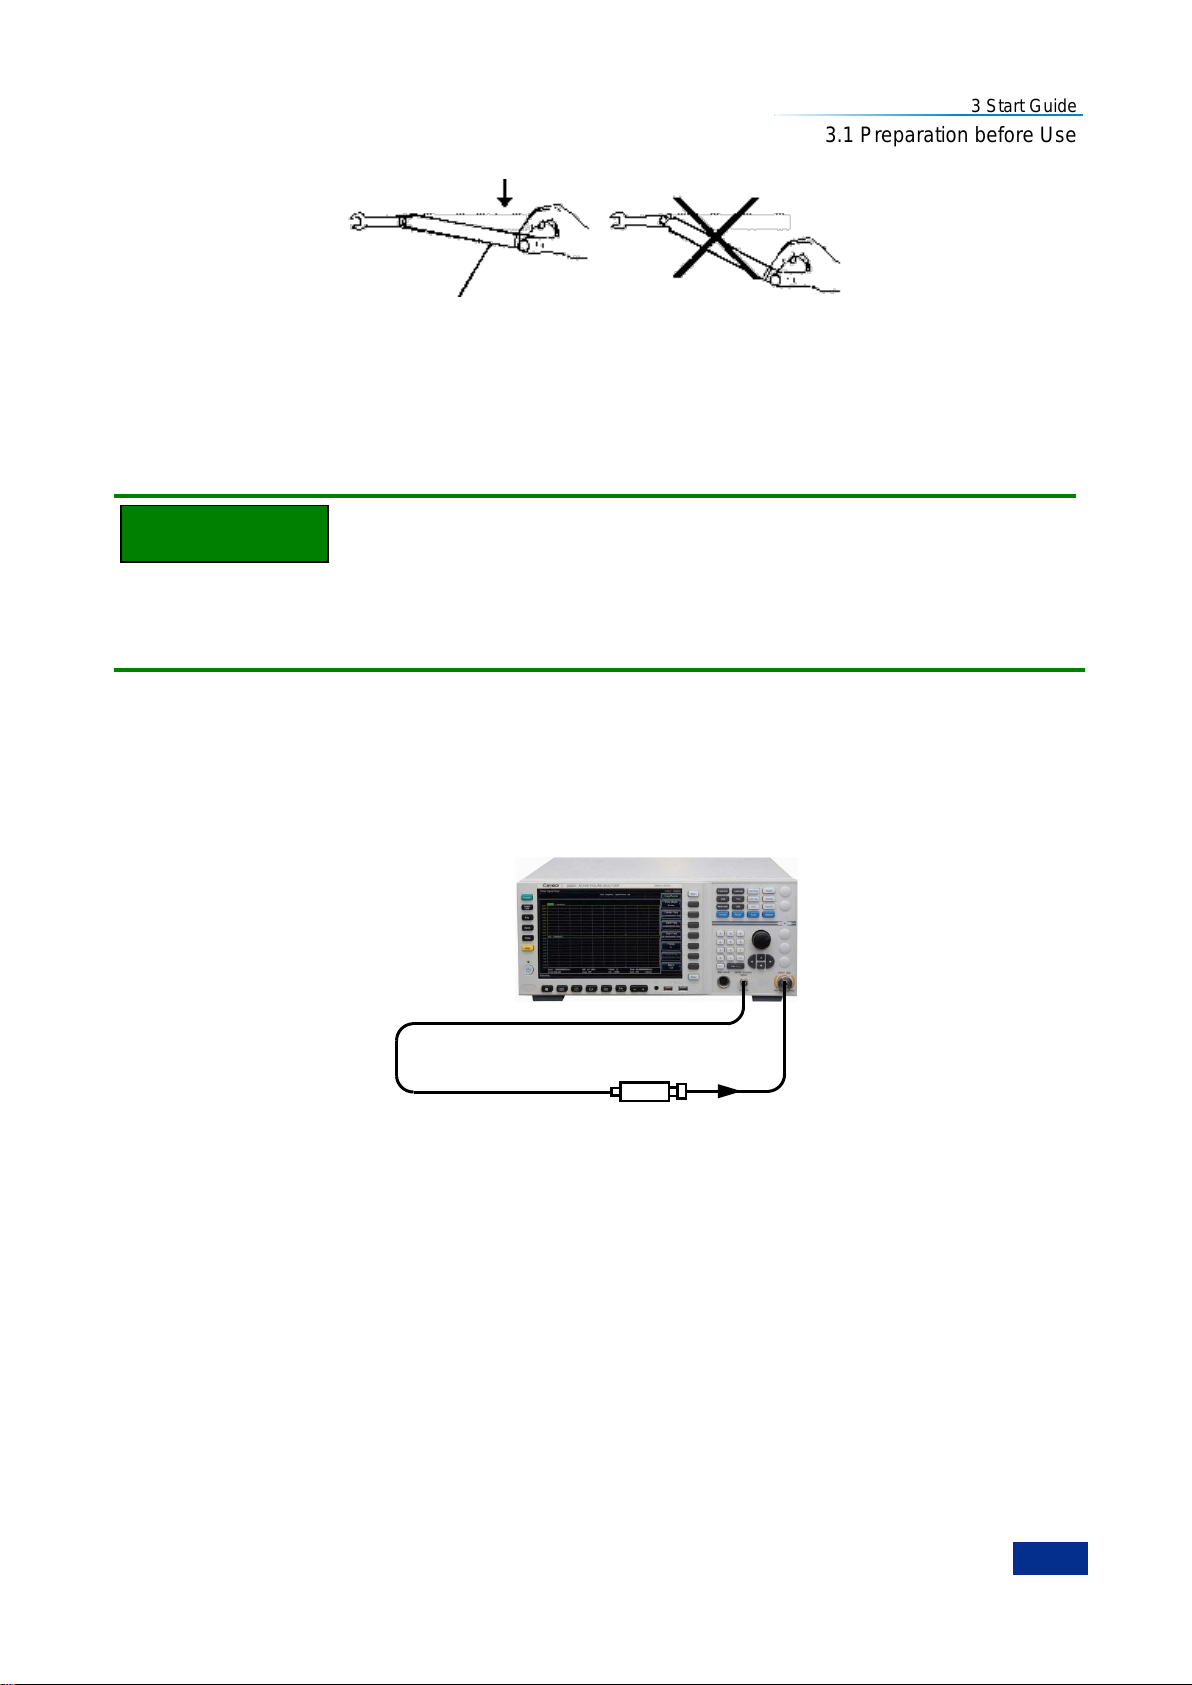
4) Use of the torque wrench
The torque wrench should be used as indicated in Figure 3.7. Please pay attention to the following points
when using the torque wrench:
Confirm that the torque of the torque wrench is set correctly before use;
Ensure that the angle between the torque wrench and the other wrench (used to support the
connector or cable) is less than 90o before applying a force;
Hold the end of torque wrench‘s handle and apply force perpendicular to the handle until reach the
break point of torque wrench.
Page 31
3 Start Guide
19
Noise source
NOTE
Torque direction
Stop applying a force when the handle bends
3.1 Preparation before Use
Fig. 3.7 Use of Torque Wrench
3.1.1.5 User checks
Series 3986 Noise Figure Analyzer shall be checked, after being powered on for the first time, whether it
is working properly for subsequent measurements.
Hard keys on the front panel and soft keys of the menu are described in the following forms:
1) Hard key:【XXX】, where XXX is the name of the hard key;
2) Soft key: [XXX], where XXX is the name of menu soft key or button.
If a soft key entry corresponds to several status, the selected entry will have a blue background to
indicate its status is active. e.g.: [Sweep Mode Cont Single] indicates the single sweeping is active.
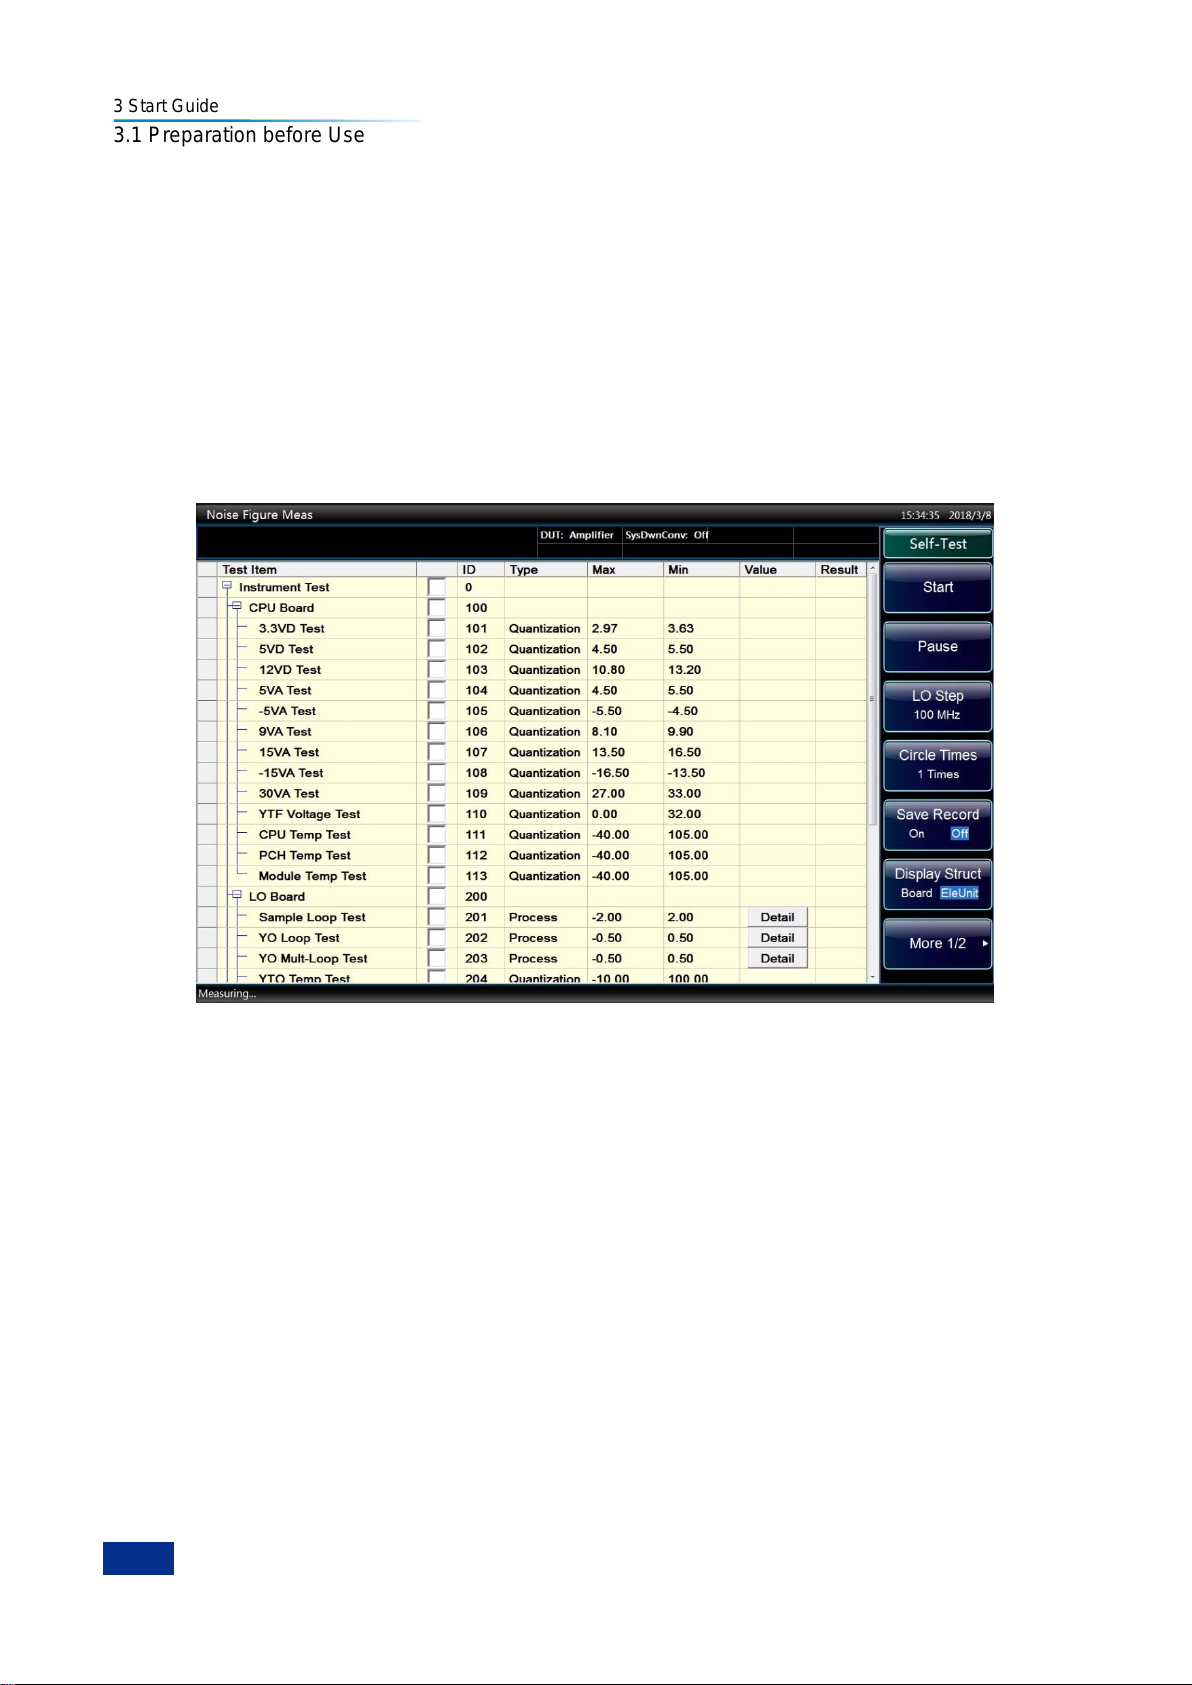
1) Function verification
After power-on and warm-up of Series 3986 Noise Figure Analyzer, connect the analyzer and noise
source as shown in Fig. 3.8.
Fig. 3.8 Connection of Noise Figure Analyzer and Noise Source
Set the analyzer as below:
Step 1. Load the excess noise ratio (ENR) of the noise source used and set the start frequency of the
analyzer at 10MHz and the stop frequency at 4GHz; check if the analyzer display the noise
figure measuring traces are normally, and the noise figure measurements shall meet the
requirements for noise figure indicators of the analyzer;
Step 2. Set the start frequency of the analyzer at 4GHz and the stop frequency at 18/26.5/40/50GHz
depends on the models; check if the analyzer display the noise figure measuring traces are
normally, and the noise figure measurements shall meet the requirements for noise figure
indicators of the analyzer;
Step 3. Press【Calibrate】key to go to the Calibrate menu; press [Calibrate] twice; then the analyzer can
calibrate and the noise figure and gain values displayed after calibration are close to 0dB.
Page 32
3 Start Guide
20
3.1 Preparation before Use
2) Self-test
Self-test is not necessary every time the instrument is turned on. Self-test is only needed to be done
when the analyzer works abnormally.
Step 1. Press【System/Local】key to go to the system menu;
Step 2. Select the [Self-test] from the soft menu to access the self-test interface;
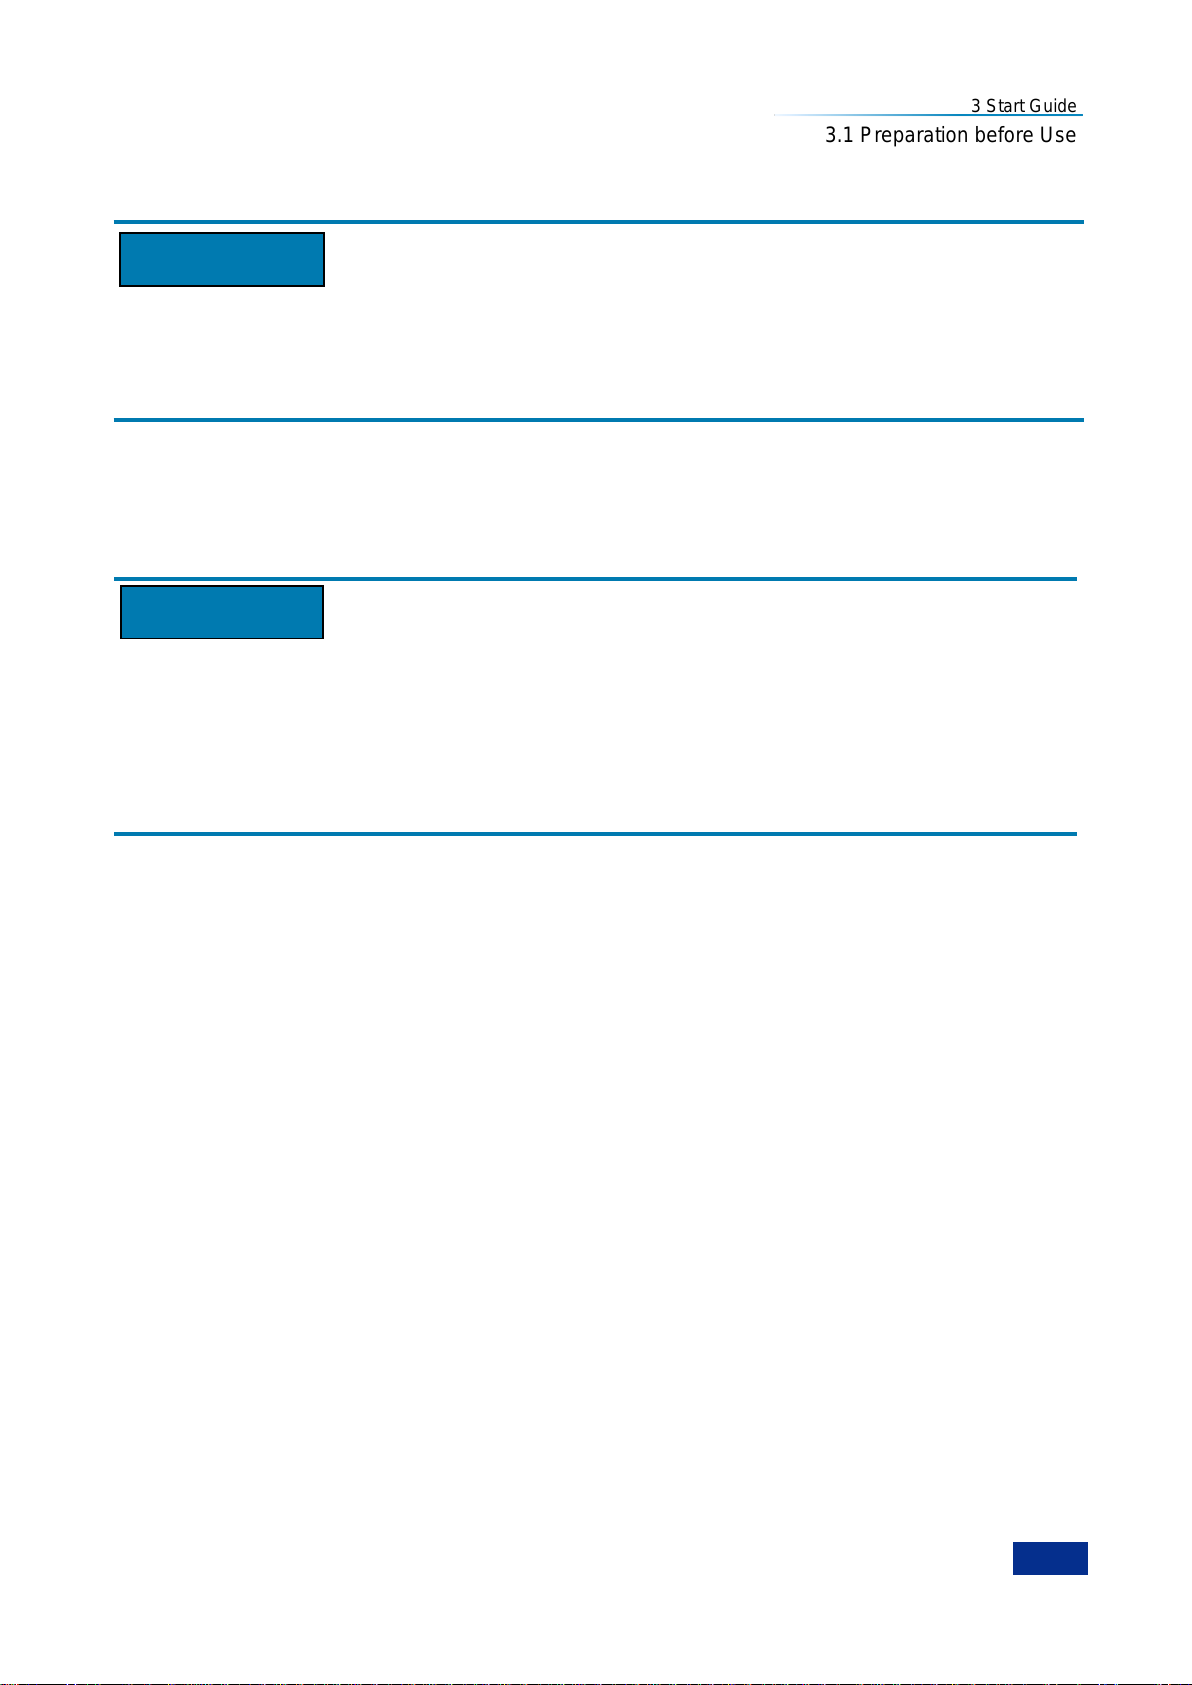
Step 3. Select the items to be tested and click [Start] soft menu to start the test, and the test results are
shown in the column Result, as shown in Fig. 3.9. Check the test results: all passed indicates
the analyzer works normally; any failed item indicates the analyzer work abnormally in the
corresponding aspect, please contact our service hotline provided in this manual and we will
repair or replace them quickly as appropriate. After the above two steps are successfully
completed, the analyzer is ready for operate.
Fig. 3.9 Self Test Screen of Series 3986
3.1.2 Configuration of operating system
This section describes the OS of Series 3986 Noise Figure Analyzer and its configuration and
maintenance. To ensure the normal operation of software functions, the following instructions for the
analyzer‘s OS below shall be referenced.
3.1.2.1 Description of instrument software
The main unit software of Series 3986 Noise Figure Analyzer is running on Windows 7, which has been
installed and configured as per specific demands of the analyzer.
3.1.2.2 Use of Windows 7
The administrator account has the permissions to:
1) install third-party software;
2) configure network and printer;
3) read and write any files on the hard disk;
4) add and delete user accounts and passwords;
Page 33
3 Start Guide
21
Attention
Attention
3.1 Preparation before Use
5) reconfigure Windows settings;
6) run other applications.
Third-party software may affect the analyzer’s performance:
Series 3986 Noise Figure Analyzer is equipped with open Windows environment, and installing other
third-party software may affect the analyzer‘s performance Only software tested by the manufacturer
and compatible with the main unit software can be run.
3.1.2.3 Windows 7 configuration
Before delivery, the operating system of Series 3986 Noise Figure Analyzer has been optimized to the
best configuration, and any changes in the OS settings may cause a decrease in the performance of the
analyzer. Generally, no changes need to be made forWindows OS settings.
Change of system settings may cause problems:
In case that the any problems in use of the analyzer or system crash due to changes of system settings,
users can use the system recovery tool of the analyzer to recover the OS and applications, or contact
our service hotline provided in this manual and we will solve the problems as quickly as possible.
In order to facilitate the measurement reporting and system integration, user can change the following
items as needed.
1) Configuring USB devices
Series 3986 Noise Figure Analyzer is provided with USB ports on front and rear panels for connecting
USB devices directly. If there are no enough USB ports, USB hubs may be used to meet the demands.
Following USB devices can be connected to the analyzer:
Hot-plug USB memory for updating data;
CD-ROM drive for installing firmware and programs;
Keyboard and mouse for editing data and operating the analyzer;
Printer for outputting measurement results.
The Windows 7 operating system supports plug-and-play devices, so it is convenient to install USB
devices, and when a device is connected to USB port, Windows 7 will automatically search for matching
device drivers. If no available driver is found, the system will prompt to find the driver directory to
complete the installation.
If an USB device is removed from USB port, Windows 7 system will automatically detect a change in
hardware configuration, and the plug of USB device will not affect the analyzer‘s working state; the
method for connecting USB devices is described below:
a) Connecting memory or CD-ROM drive
If the memory or CD-ROM drive is installed successfully, Windows 7 system will prompt ―The device has
been installed successfully and is ready to use‖ and automatically display the path name and prompt
(e.g. ―D:‖).
Page 34
3 Start Guide
22
3.1 Preparation before Use
b) Connecting keyboard
Windows 7 system will automatically detect the USB keyboard connected to the analyzer and default the
input language as Chinese (ZH) - Simplified - US; the keyboard properties can be configured via
[Start]→[Control Panel]→[Language and Region]→[Keyboard and Language] menus and buttons.
c) Connecting mouse
Windows 7 system will automatically detect the mouse connected to the analyzer; the mouse properties
can be configured via [Start]→[Control Panel]→[Mouse] menu and buttons.
d) Connecting printer
Use Windows Control Panel to configure printers. Using an external USB mouse and keyboard can
make the printer configuration easier. If you need to install a new printer, you only need to install the
printer‘s driver. The printer manufacturer will provide the printer installer. You can also install the driver
through the external USB optical drive.
2) Configuring GPIB
The user may need to modify the GPIB address when building a system with a noise figure analyzer.
The GPIB address of the machine is 8 by default. The method to change the GPIB address is as follows:
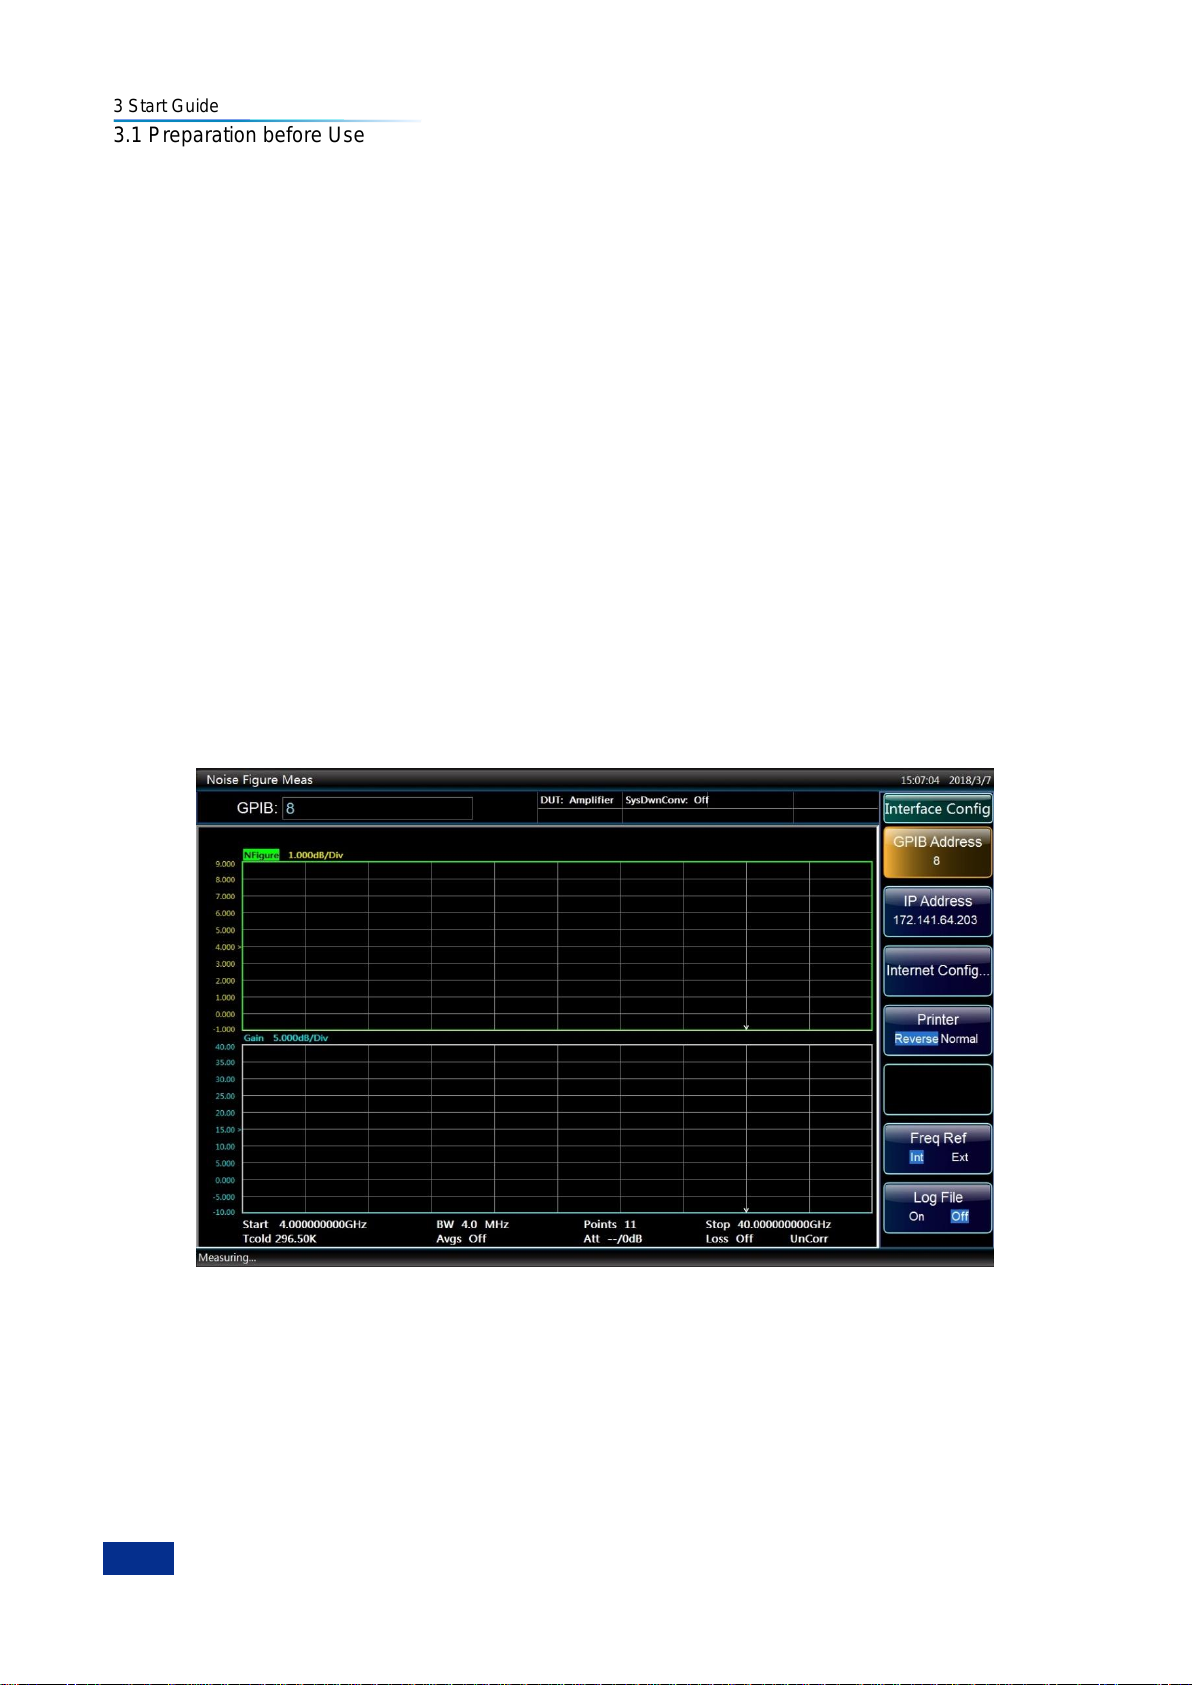
Press【System/Local】→[Interface Config]→[GPIB Address] and go to the screen shown in Fig. 3.10; you
can change the address in ―GPIB Addr‖ box with numeric keys on the front panel.
Fig. 3.10 Change GPIB Address
3) Configuring network
a) Changing host name
The host name (computer name) of Series 3986 Noise Figure Analyzer has been preset as ―3986-PC‖
before delivery. To avoid duplication of network names, users can change the host name in case that
several Series 3986 analyzer are connected to same network. The host name can be changed as below
(see Help document of Microsoft Windows 7):
Page 35
3 Start Guide
23
3.1 Preparation before Use
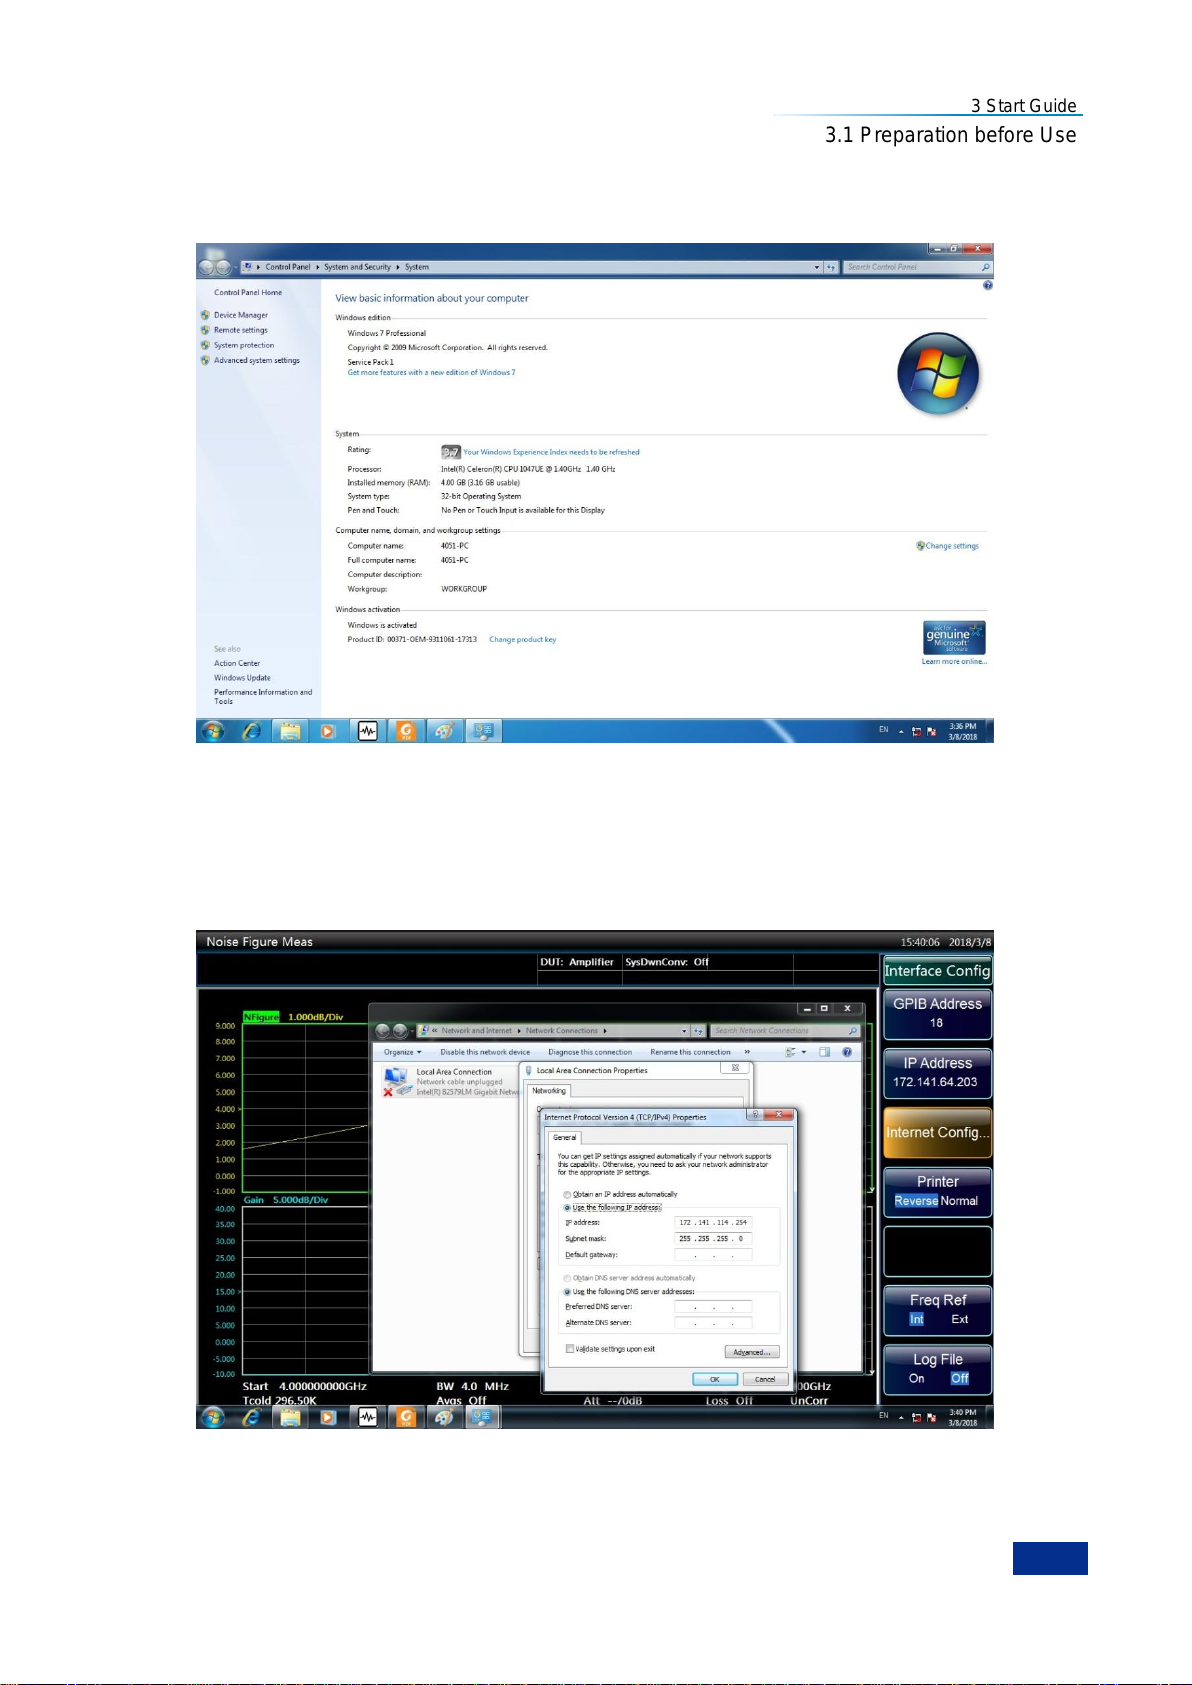
Step 1. Press [Start], right click [Computer], and click [Properties]→[Change Settings]→[Change], as
shown in 3.11;
Step 2. Edit or enter new host name in ―Computer Name‖ box, click [OK] and reboot.
Fig. 3.11 Change Host Name
b) Configuring IP address, subnet mask and default gateway
Press【System/Local】→[Interface Config]→[Internet Config] and the network connection setting page
pops up; double click [Local Connection 2]→[Internet Protocol version 4 (TCP/IPv4)]→[Properties], as
shown in Fig. 3.12, and there you can change the local IP address, subnet mask and default gateway.
Fig. 3.12 Configuring IP Address, Subnet Mask and Default Gateway
c) Changing system firewall settings
The firewall is used to prevent unauthorized users from remotely operating the analyzer, so the
Page 36

3 Start Guide
24
Attention
3.1 Preparation before Use
manufacturer advises to enable the firewall protection. Before delivery, Series 3986 Noise Figure
Analyzer has been set to enable firewall protection for port connections related to system and all remote
operations.
Only the administrator has the permission to change the firewall settings.
4) Configuring BIOS
Settings have been configured for the analyzer in BIOS.
The BIOS settings cannot be changed:
Settings have been configured for the analyzer in BIOS and users shall not change any BIOS settings, or
otherwise the analyzer may not be started and operated normally.
5) External monitor
An external monitor (or projector) can be connected to the ―Display Port‖ connector on the rear panel of
the analyzer as described below:
Step 1. Connect the external monitor to the ―Display Port‖ connector on the rear panel of Series 3986
analyzer.
Step 2. The analyzer has been set to Automatic Dual-View and other display modes can be selected
via the GPU Settings on the bottom right of the system task bar.
Step 3. Click [Graph]→[Output to] in GPU Settings to select the device to display:
―Monitor‖: only displaying via external monitor;
―Built-in display‖: only displaying via the analyzer‘s LCD screen;
―Clone display‖: displaying via LCD screen and external monitor.
Step 4. If necessary, change the screen resolution to be used.
6) Setting date/time
Date/time is displayed on the status bar at the top right of the Series 3986 Noise Figure Analyzer
operation interface and the file storage will synchronize the storage time information; users can set the
date/time in Windows 7 system.
3.1.2.4 Windows 7 system security and maintenance
1) Antivirus software
Installing antivirus software may have some negative effects on the performance of the instrument, and it
is strongly advised that users do not to use the instrument as a common computer to browse or transfer
documents so as not to get infected with virus.
Before using USB mobile storage devices, a computer with the latest antivirus software should be used
to process these mobile devices to kill virus may exist and ensure that they do not become a viral carrier.
Once the analyzer‘s system platform is infected with virus, the operation of measurement and control
programs and the use experience will be affected; in this case, it is recommended to perform system
recovery. See ―System maintenance‖for the system recovery operations.
Page 37

3 Start Guide
25
3.1 Preparation before Use
2) System maintenance
a) Windows 7 system backup
It is recommended to backup the system regularly; to do this you can use the System Recovery Tool to
completely backup the analyzer data and system, see ―3.1.2.5 System backup recovery‖.
Before using the analyzer for other purposes other than normal use such as long-term Internet
connection and installing third-party software, it is recommended to backup the analyzer system to avoid
accidental inflection of virus and other operations harmful to the system.
The Windows 7 operating system has the same data backup function that can backup all data on the
analyzer and create a system disk that can be used to restore Windows in case of serious failure. See
help document of Windows 7 for more details. Additionally, third party backup software can be used, but
there is a need to ensure that this software does not conflict with the analyzer‘s system software. It is
recommended to backup the system data on external devices such as a network hard drive or USB hard
drive.
b) Windows 7 system recovery
Windows 7 has the system recovery function that can restore the system to the state of a previous
moment. However, the built-in system backup recovery function of Window cannot work successfully
every time, so it‘s not recommended to use this backup program.
3) Partitions and use of hard disk
The hard disk has three partitions: ―C:‖, ―D:‖ and ―E:‖.
Windows 7 OS and the analyzer‘s applications are installed in Disk C. Third-party software can also be
installed in Disk C. Disk C is the only disk for backup and recovery.
Disk D is mainly used for the key response program KeyMap and storage of user data.
Disk E is mainly used to store data, including software data stored by users and system backup of Disk
C. Backup data in Disk E can be copied to external storage media so that even the hard drive needs to
be replaced, only the backup data will be recovered to the new hard drive.
3.1.2.5 System backup recovery
1) Hard drive OS or data recovery
The analyzer‘s hard drive recovery system can used to fix software errors on Disk C (may be caused by
loss of system files or data) or recover the original factory data.
Recovery of original factory data will affect on the following entries:
User-defined Windows 7 settings, such as newly added user accounts, need to be reset after
system recovery;
Other third-party software installed by users needs to be re-installed after system recovery.
Using the data recovery function to repair hard drive errors may result in the loss of data or files, so the
data generated during measurements should be stored in an Disk E; it is recommended to periodically
transfer the data to a computer or other storage media through local network connections.
2) How to use the analyzer recovery program
Step 1. Check if the analyzer is shut down.
Step 2. Plug a standard keyboard into the PS/2 interface on the rear panel.
Page 38
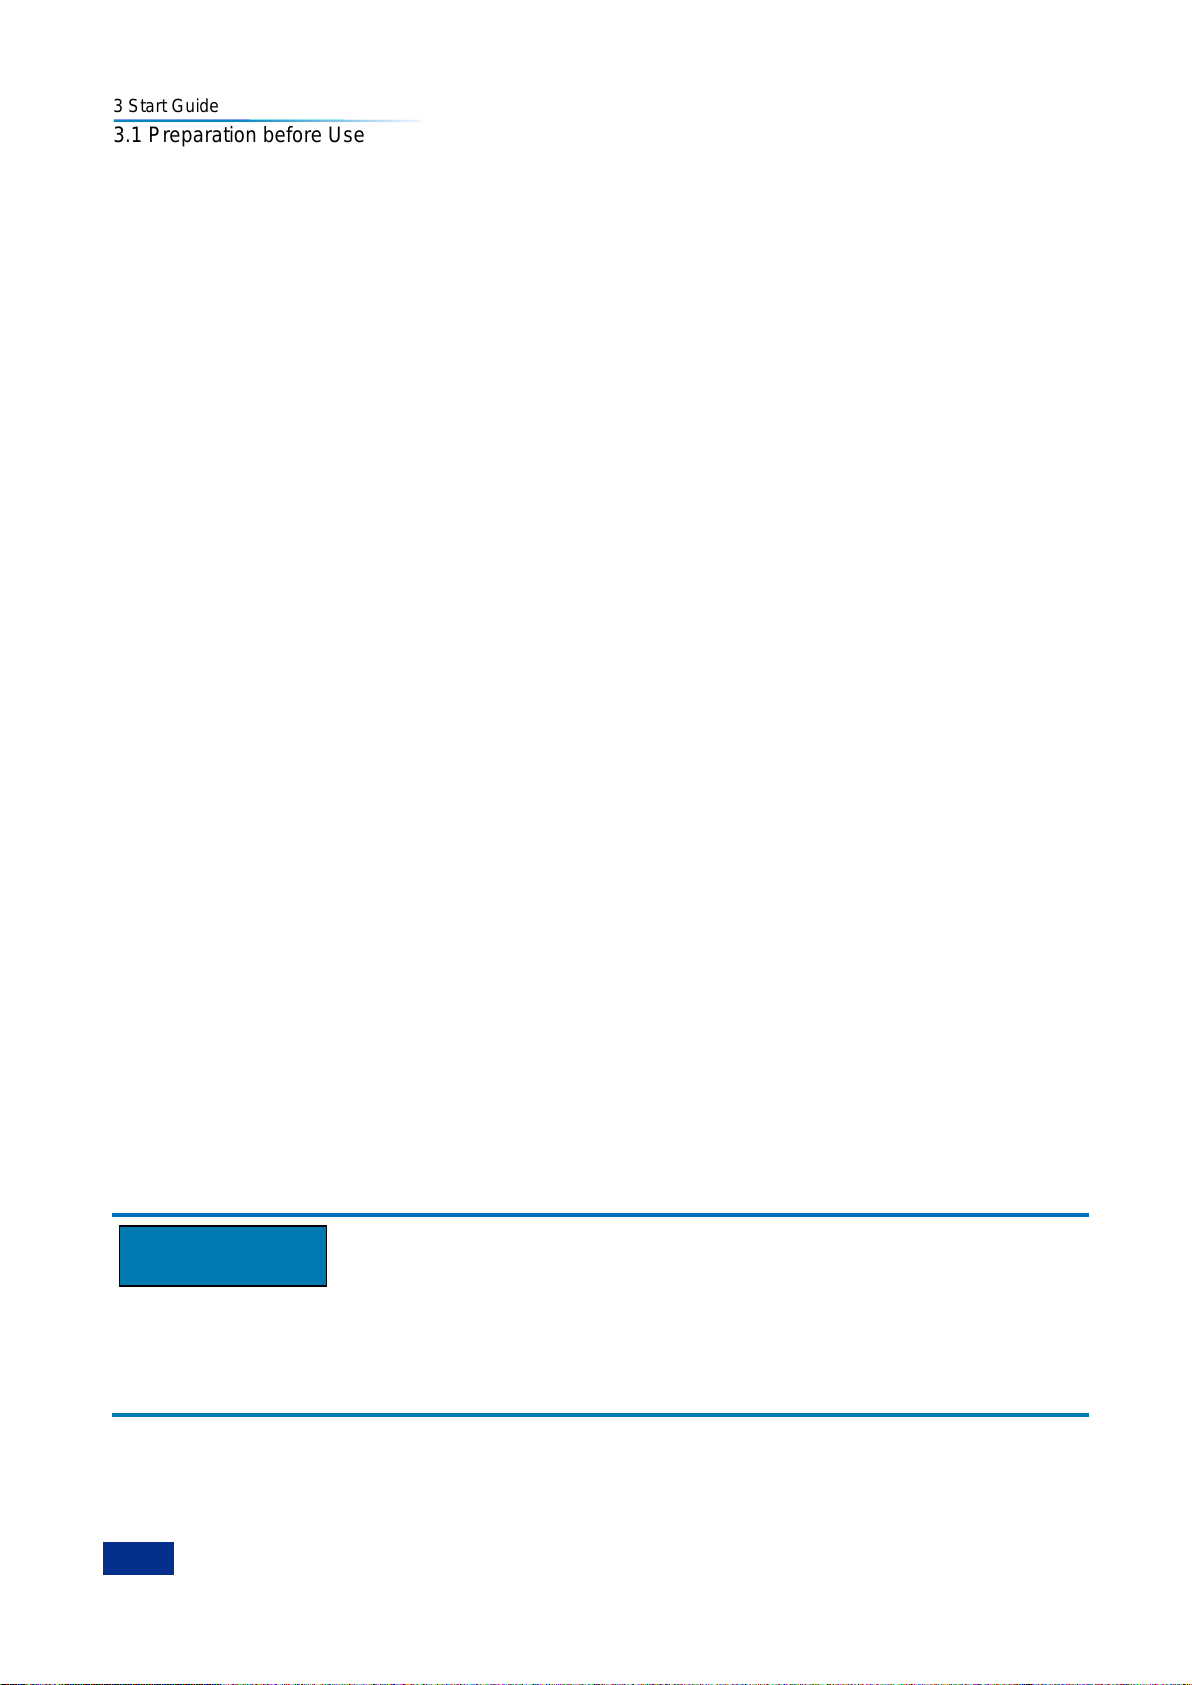
3 Start Guide
26
Attention
3.1 Preparation before Use
Step 3. Switch on the analyzer and after the display of system information, an OS menu with timer
appears:
[Windows 7]
[System Recovery Tool]
When the timer counts down to 0, use the Up/down arrows on the standard keyboard to highlight the
[System Recovery Tool] and press Enter after selecting it.
Step 4. Perform the recovery in the recovery program screen as below:
1) Select the first option [GHOST, DISKGEN, PQMAGIC, MHDD, DOS], wait and go to the next
operation prompt screen;
2) Select the third option [GHOST11.2], wait and go to the GHOST11.2 screen, and press Enter when
the dialog box with [OK] button;
3) Select [Local]→[Partition]→[From Image]; in the Open Files dialog box, press Tab to activate ―File
name‖ box to input ―E:\SystemGhost.GHO‖;
4) In the Select Source Partition and Select File dialog box pops up, press Tab to switch to [OK] and
press Enter; in the Select Destination Device dialog box pops up, press Tab to switch to [OK] and
press Enter; in the Select Destination Partition dialog box pops up, select the first partition, press
Tab to switch to [OK] and press Enter;
5) In the Warning and Confirmation dialog box, select [Yes] and press Enter;
6) The the system recovery finishes, reboot as prompted.
Step 5. After the analyzer reboots, the system will be restored to the status of last backup.
3.1.3 Routine maintenance
This section describes the routine maintenance methods of Series 3986 Noise Figure Analyzer.
3.1.3.1 Cleaning
1) Cleaning of instrument surface
Clean the instrument surface as per the following steps:
Step 1. Shut down the analyzer, and disconnect the power cord;
Step 2. Wipe the surface gently with dry or slightly wet cloth; it is prohibited to wipe the interior;
Step 3. Do not use any chemical detergents such as alcohol, acetone and other detergents can be
diluted.
2) Cleaning LCD
Cleaning display
The display screen is coated with a layer of anti-static coating, and therefore detergents with fluoride or
acidic or alkalic detergents shall not be used. Do not spray detergent onto the display panel directly, or
otherwise it may penetrate into the analyzer and cause damages.
The LCD needs to be cleaned after a period of time. Please operate according to the following steps:
Step 1. Shut down the analyzer, and disconnect the power cord;
Step 2. Wipe the display panel gently with clean and soft cotton cloth dipped with detergent;
Page 39
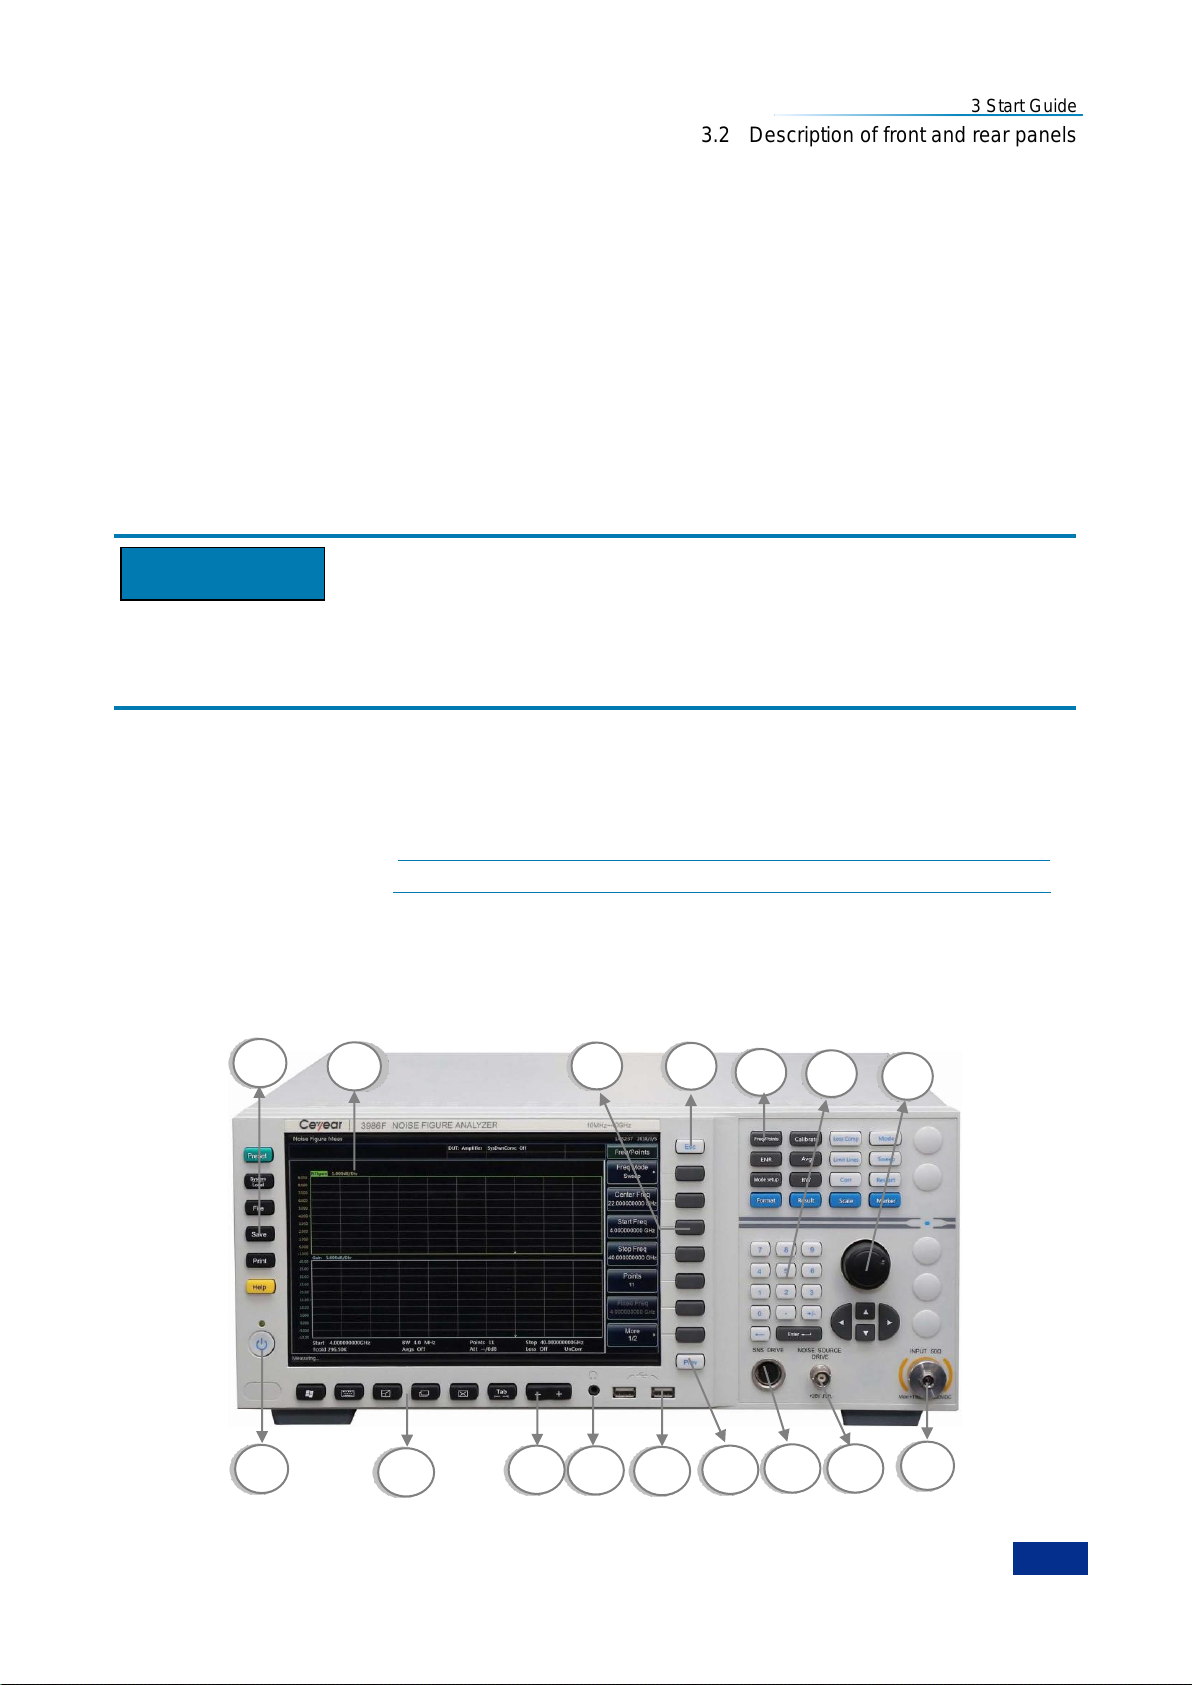
3 Start Guide
27
2
5
3
4 6 7
8
10
9
12
13
14
15
16
Attention
3.2 Description of front and rear panels
Step 3. Dry the display panel with clean and soft cotton cloth;
Step 4. Connect the power cord after the detergent dries thoroughly.
3.1.3.2 Input port maintenance
There is an input port (50Ω) on the front panel of Series 3986 Noise Figure Analyzer, which may affect
measurement results if damaged or having dust accumulated inside; please maintain the port as
described below:
1) The conductor in the port shall be kept away from the dust and kept clean.
2) In order to prevent electrostatic discharge (ESD), do not directly contact the internal conductor of
the port.
3) Do not use a damaged port connector.
4) Use a hairdryer to clean the port and don‘t use tools such as sandpaper to grind the port surface.
Port impedance matching:
The input port on the front panel of Series 3986 Noise Figure Analyzer is available to 50Ω connectors.
Connecting a connector with unmatched impedance will affect the measurement result.
3.2 Description of front and rear panels
This section describes the front and rear panels of Series 3986 Noise Figure Analyzer and their
functions.
Instructions for front panel…………………………………………………………………………………27
Instructions for rear panel………………………………………………………… ………………………32
3.2.1 Description of front panel
This section describes components of the front panel of Series 3986 Noise Figure Analyzer and their
functions, as shown in Fig. 3.13.
Fig. 3.13 Front Panel of Series 3986 Noise Figure Analyzer
Page 40
3 Start Guide
28
Key Name
Functional Description
Preset
Restore the analyzer to the default status.
System/Local
Provide functions related to system settings such as: error list, reset, calibration,
self-test, configuration information.
File
Provide functions for storage and calling of files.
Save
Provide the function of saving screen image files.
Print
To customize print output, select and configure printers.
Help
To show online help.
3.2 Description of front and rear panels
1. Power button
2. System function keys
3. Display screen
4. Soft keys
5. Cancel key
6. Measurement setting keys
7. Numeric key area
8. Knob and arrow keys
9. Input ports
10. Normal noise source drive port
11. Smart noise source drive port
12. Back key
13. USB port
14. Headphone jack
15. Volume key
16. Window key
3.2.1.1 Power button
The power button locates at the bottom left of front panel and is used to start and shut down the
analyzer.
3.2.1.2 System function keys
System function keys are used to set system level functions as shown in Table 3.5.
Table 3.5 Instruction of System Function Keys
3.2.1.3 Display screen
All measurement results are displayed on the screen of front panel. Additionally, the screen also displays
status and setting information and enable you to switch between different measurement tasks.
3.2.1.4 Soft keys
There are seven dark gray keys not identified, called ―soft key‖. The corresponding commands of these
soft keys are dynamic, and the displayed functions depend on the current selected mode and
measurement and are directly related to the recently used keys. Press a soft key and its corresponding
function is highlighted. The soft key menu corresponding to【Frequency/Points】 key is shown in Fig.
3.14.
1) Select soft key
Press the corresponding soft key on the right directly;
Use the mouse pointer to click the key on the screen.
2) Navigate in soft key menu
[More 1/2] indicates that the menu contains multiple soft keys cannot be shown in one page. Press
the menu, the next group of soft keys appears;
The symbol ―▶‖ in a soft key tab indicate that the soft key has a sub-menu. Press the soft key, the
sub-menu appears;
The key【Prev】used to go back to the parent menu.
Page 41
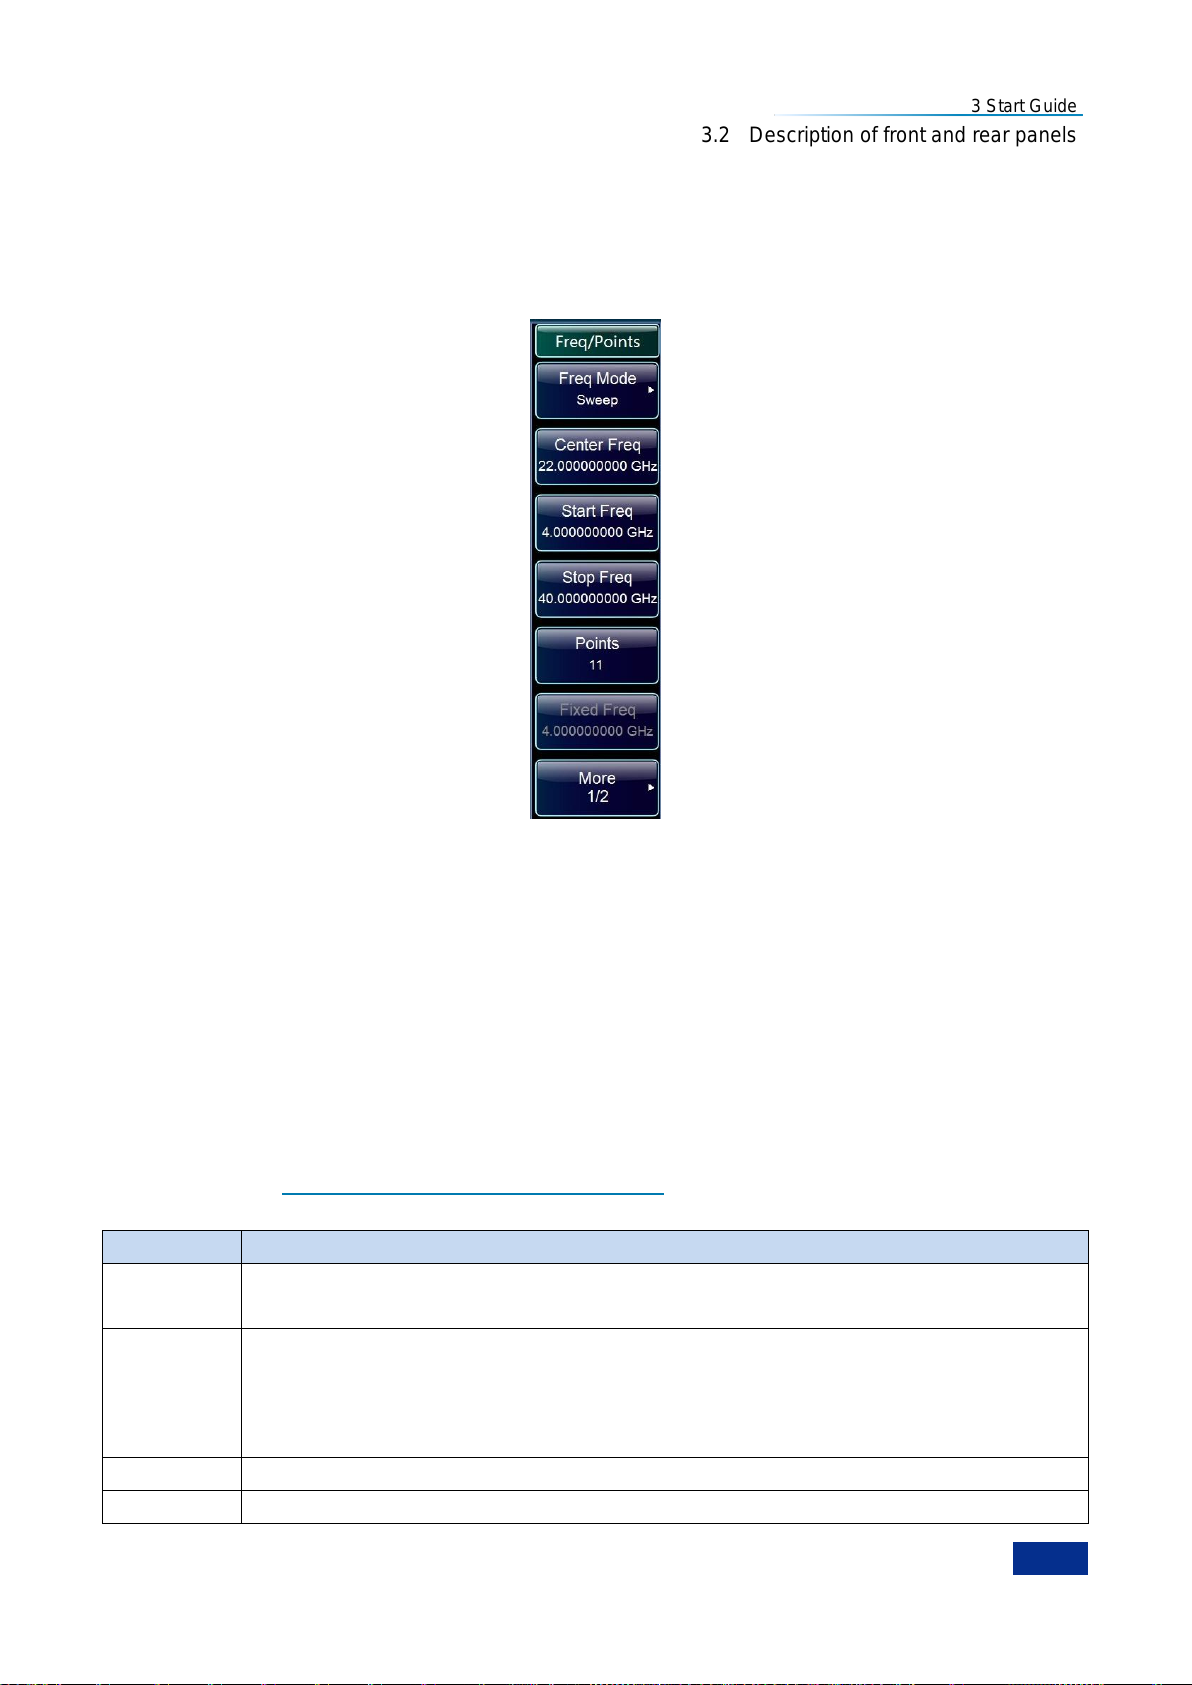
3.2 Description of front and rear panels
29
Key Name
Functional Description
Freq/Points
Press this key to go to setting menus such as Freq Mode, Center Freq, Start Freq, Stop
Freq and Points.
Calibrate
Press this key to go to the Calibrate menu. In the Calibrate menu, press the [Calibrate]
soft key twice to perform the calibration program. The calibration function is used for the
noise figure measurement with second-order correction, which is to deduct the analyzer‘s
noise to get the noise figure and gain of device under test (DUT).
ENR
Press this key to go to the ENR setting and editing menu.
Avg
Press this key to go to the Average setting menu.
3) Soft key operations
When a soft key is pressed, one of the following actions will be performed:
open a dialog box to input data;
open or close a function;
open a sub-menu (only for soft key with the symbol ―▶‖).
3 Start Guide
Fig. 3.14 Soft Key Menu
4) Soft key status identified with colors
The soft key selected will be highlighted. If a function of the analyzer cannot be used temporarily due to a
specific setting, the related soft key will be disabled and the text will be grayed.
3.2.1.5【Esc】key
This key is used to exit from any functional operation without changing the current parameters, including:
canceling the active function, quitting the numeric operation and exiting from the file dialog box.
3.2.1.6 Measurement setting keys
The measurement setting keys provides most common measurement settings and functions, as shown
in Table 3.6. See ―5 Instructions for Key Groups and Menus‖ for detailed function descriptions.
Table 3.6 Measurement Setting Keys
Page 42
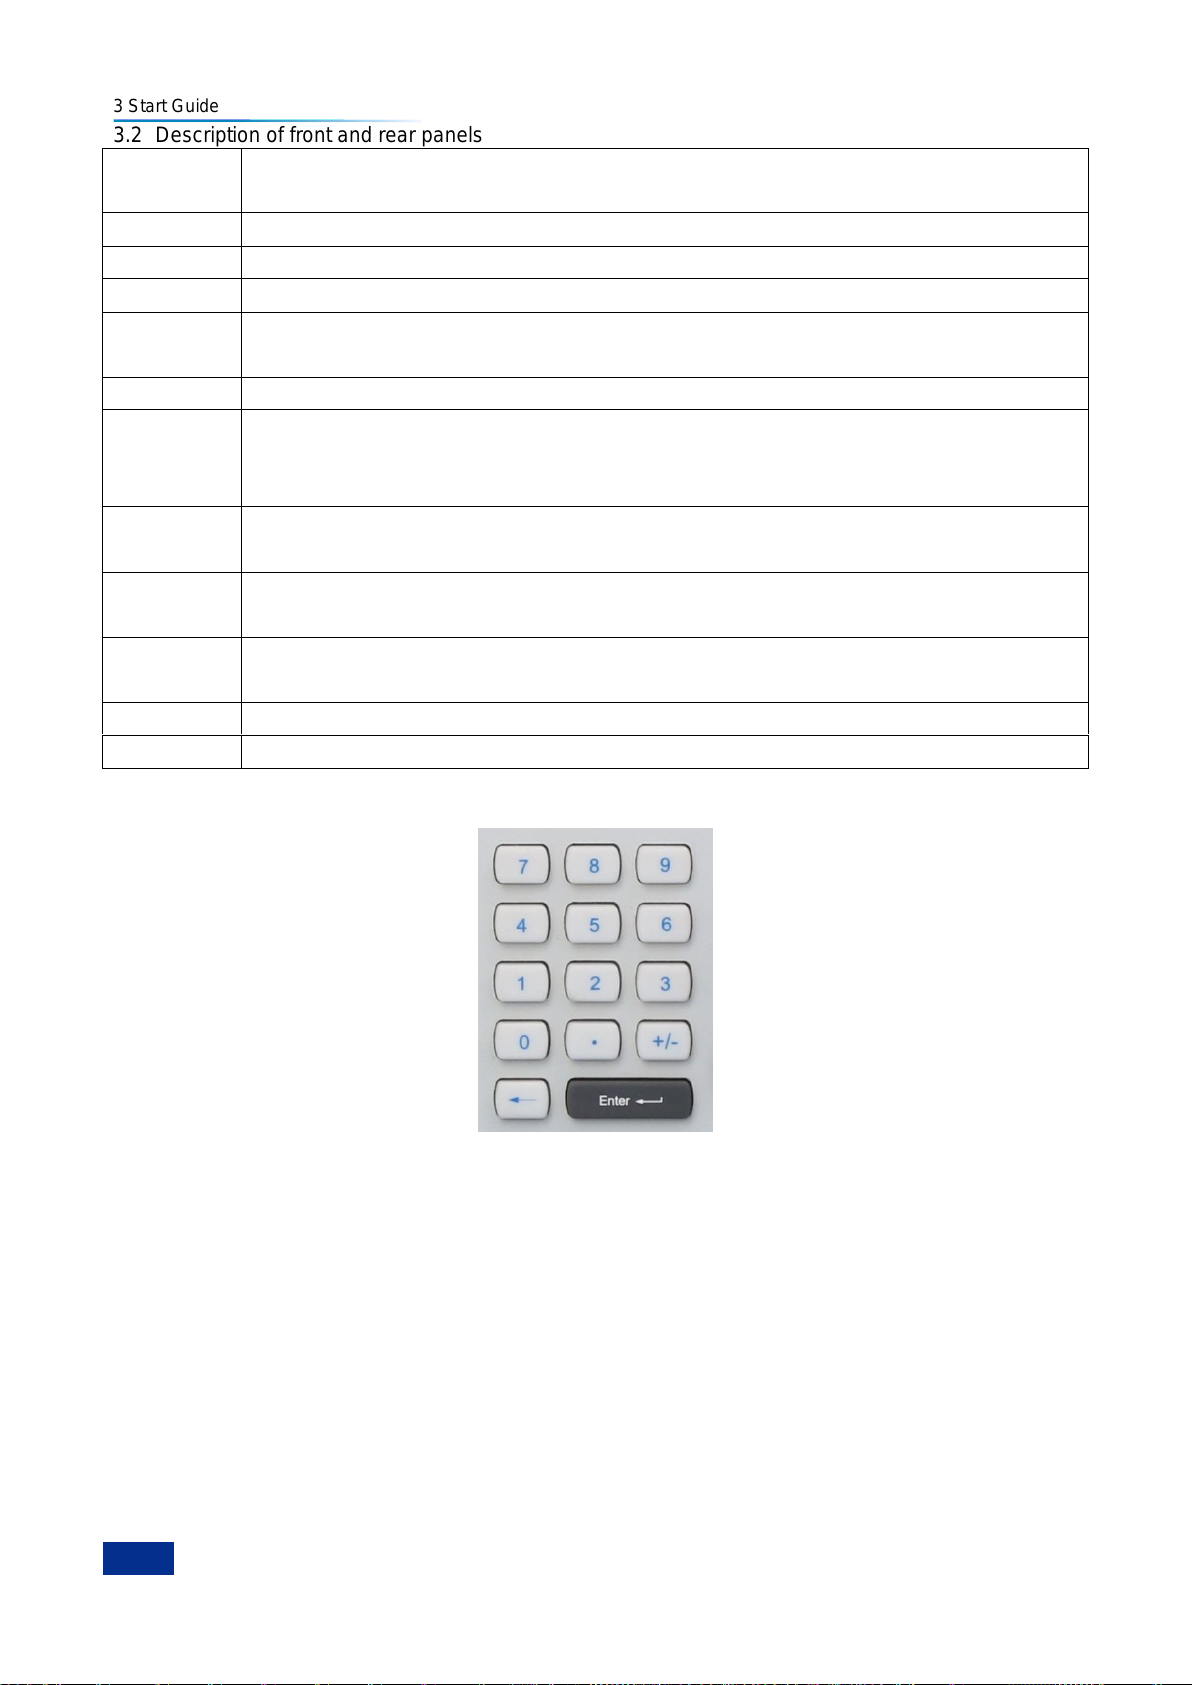
3 Start Guide
30
Mode Setup
Press this key to go to the Mode Setup menu, including DUT Setup, Ext OL Config,
Uncertainty Calculator and Extend Setup.
BW
To set the measuring bandwidth.
Loss Comp
Press this key to go to the Loss Comp menu.
Mode
Used for analyzer‘s function extension and defaulted as standalone mode.
Limit Lines
Press this key to go to the Limit Line Setup menu; the limit line is used to mark the
boundary of trace.
Sweep
Press this key to go to the Sweep setting menu.
Corr
Press this key to open or close the measurement correction. The default status depends
on whether a calibration is performed previously; if calibrated, the default value is
Correction On; if not, the default value is Correction Off.
Restart
If this key is pressed during measurement, the current measurement will be stopped and
a new measurement started.
Format
Press this key to select the display format of measurement data, including graph, table
and tester.
Result
Press this key to go to the Trace setting menu. Measurement and display results includes
noise figure, gain, Y-factor, Teffective, PHot and PCold.
Scale
Press this key to specify units and display limit for each active measurement result.
Marker
Press this key to go to corresponding marker setting menu.
3.2 Description of front and rear panels
3.2.1.7 Numeric keys
To input numeric parameters. Including the following keys:
1) Number pad
To input numbers in editing dialog box.
2) Decimal point
To insert a decimal point ―.‖ at the cursor position.
3) Symbol key
To change the symbol of numeric parameters. To input a ―-‖ symbol at the cursor position when inputing
numeric parameters.
Page 43
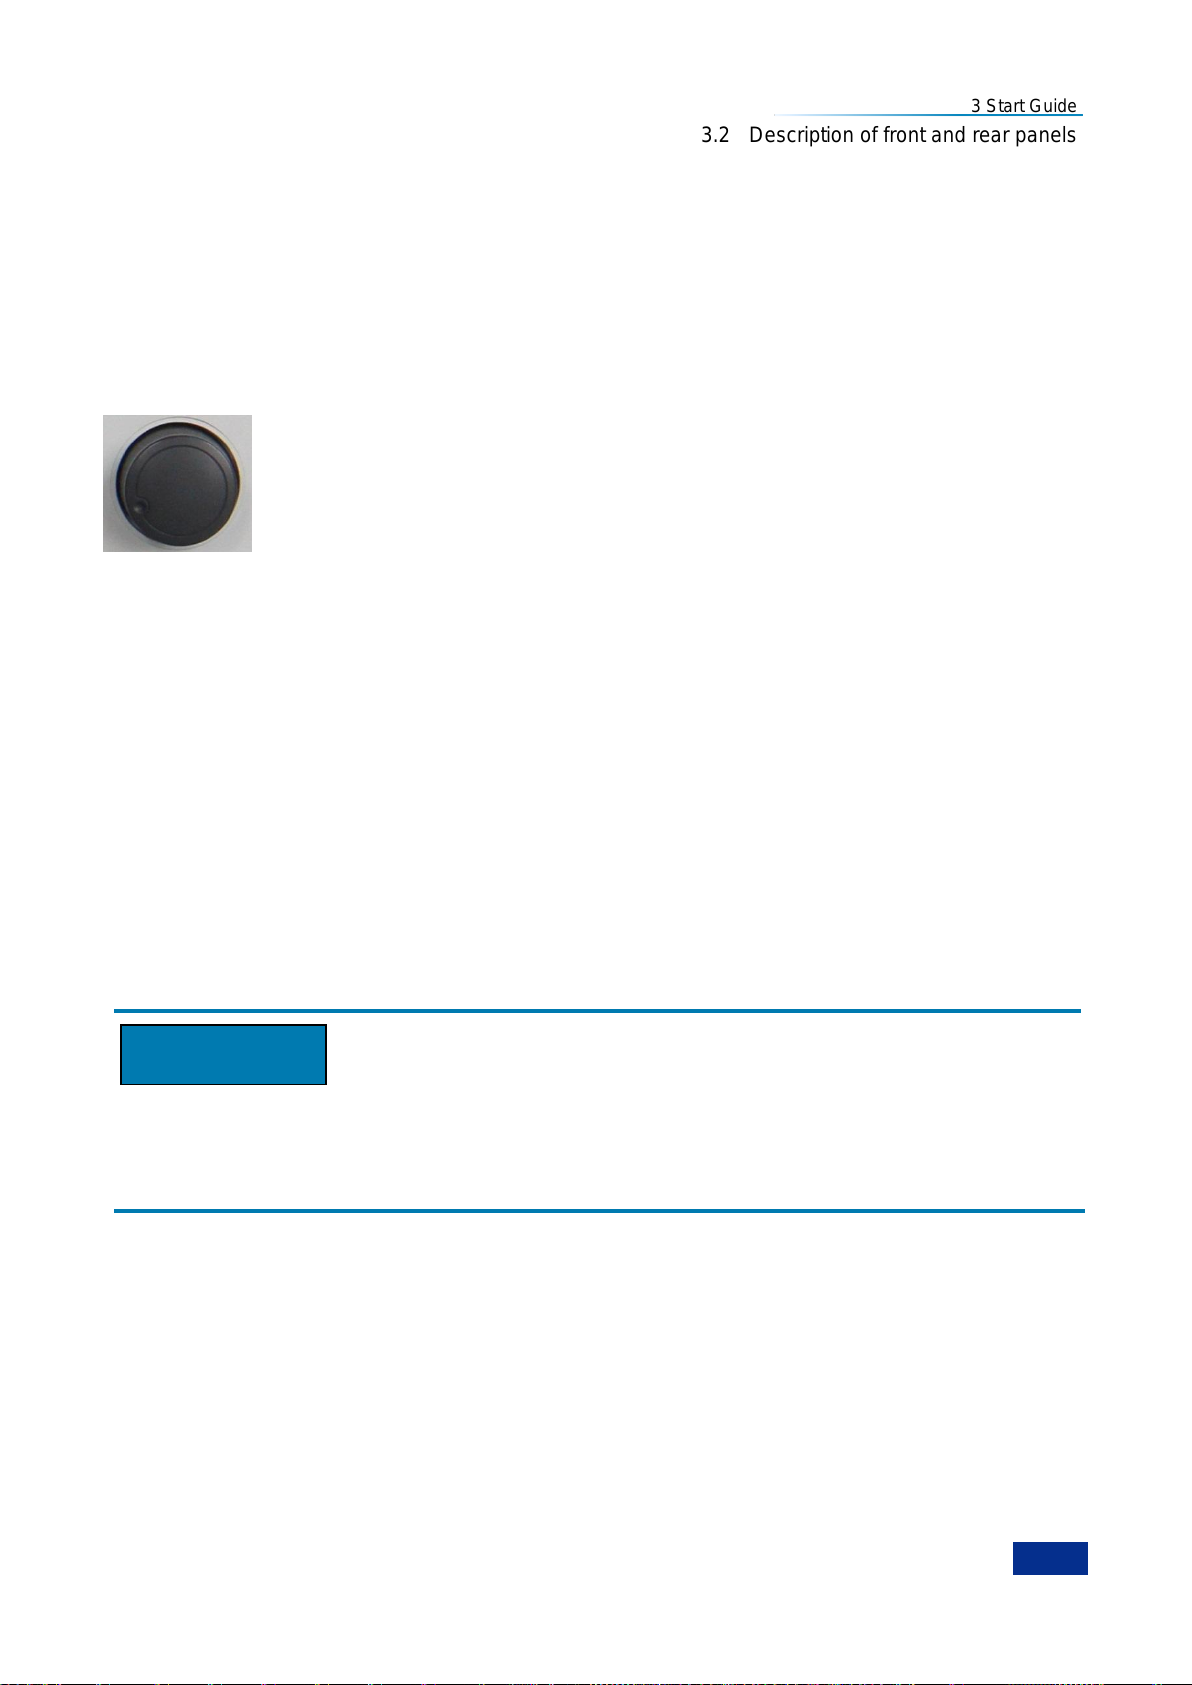
3.2 Description of front and rear panels
31
Attention
4) 【←】key
To delete the input to the left of cursor.
5) 【Enter】key
To confirm the non-dimensional input as a new value.
3.2.1.8 Knob and arrow keys
1) Knob functions
To increase (clockwise) or decrease (counterclockwise) the instrument parameters
by specified steps when inputing numbers;
To move the marker on screen and display trace positions;
It works similarly to the【Enter】key when pressed.
2) 【▲】and【▼】keys
To increase or decrease instrument parameters in number editing dialog boxes.
3 Start Guide
3) 【】and【】keys
To move the cursor in alphanumeric value editing dialog boxes;
To scroll forward and backward items in the frequency list;
To move the selection bar horizontally in tables.
3.2.1.9 INPUT ( 50Ω )
The measurement & calibration of the analyzer‘s noise figure and measurement of DUT‘s noise figure
and gain can be performed by connecting the noise source or DUT‘s output via an adapter or cable to
the analyzer‘s input port.
Do not overload the input port and the input signal shall not not exceed the maximum allowable value.
The RF power level input by the analyzer‘s RF port shall not exceed +15dBM, and the DC voltage input
shall not exceed ±20VDC . If the above conditions are not met, the front parts of the analyzer‘s internal
receiver will be damaged first.
3.2.1.10 Noise Source Drive
+28V pulse voltage is provided for standard noise sources. When there is +28V output, switch on the
noise source; when there is no +28V output, switch off the noise source.
3.2.1.11 SNS Drive
The smart noise source drive & communication port is provided to load ENR data, monitoring ambient
temperature and switching on/off smart noise sources.
Page 44
3 Start Guide
32
Icon
Name
Function description
Start Menu
key of
Windows
system
To display Windows ―Start‖ menu to perform other operations or settings.
Once this key is pressed, the measurement control program will lose the
focus resulting in the keyboard of front panel unavailable; press this key
again to close ―Start‖ menu and enable the measurement control
program get the focus again.
Virtual
Keyboard key
To switch between on-screen keyboard display
Window key
To switch between single and dual window modes
Activated
Trace Switch
key
To switch the activation status of trace.
Close key
To close the measurement program
Tab key
To switch among different areas of Windows dialog box to activate
functions.
3.2 Description of front and rear panels
3.2.1.12 【Prev】key
Press the【Prev】key to go back to parent menu of the soft menu.
3.2.1.13 USB interface
Standard Type A USB2.0 port. To connect USB peripherals such as keyboard, mouse, CD driver and
hard drive.
3.2.1.14 Headphone jack
To connect headphone
3.2.1.15 【- +】KEY
Volume key to adjust headphone volume.
3.2.1.16 Window keys
Icons and function description of window keys are listed in Table 3.7.
Table 3.7 Measurement Setting Keys
3.2.2 Description of rear panel
This section describes components of the rear panel of Series 3986 Noise Figure Analyzer and their
functions, as shown in Fig. 3.15.
Page 45
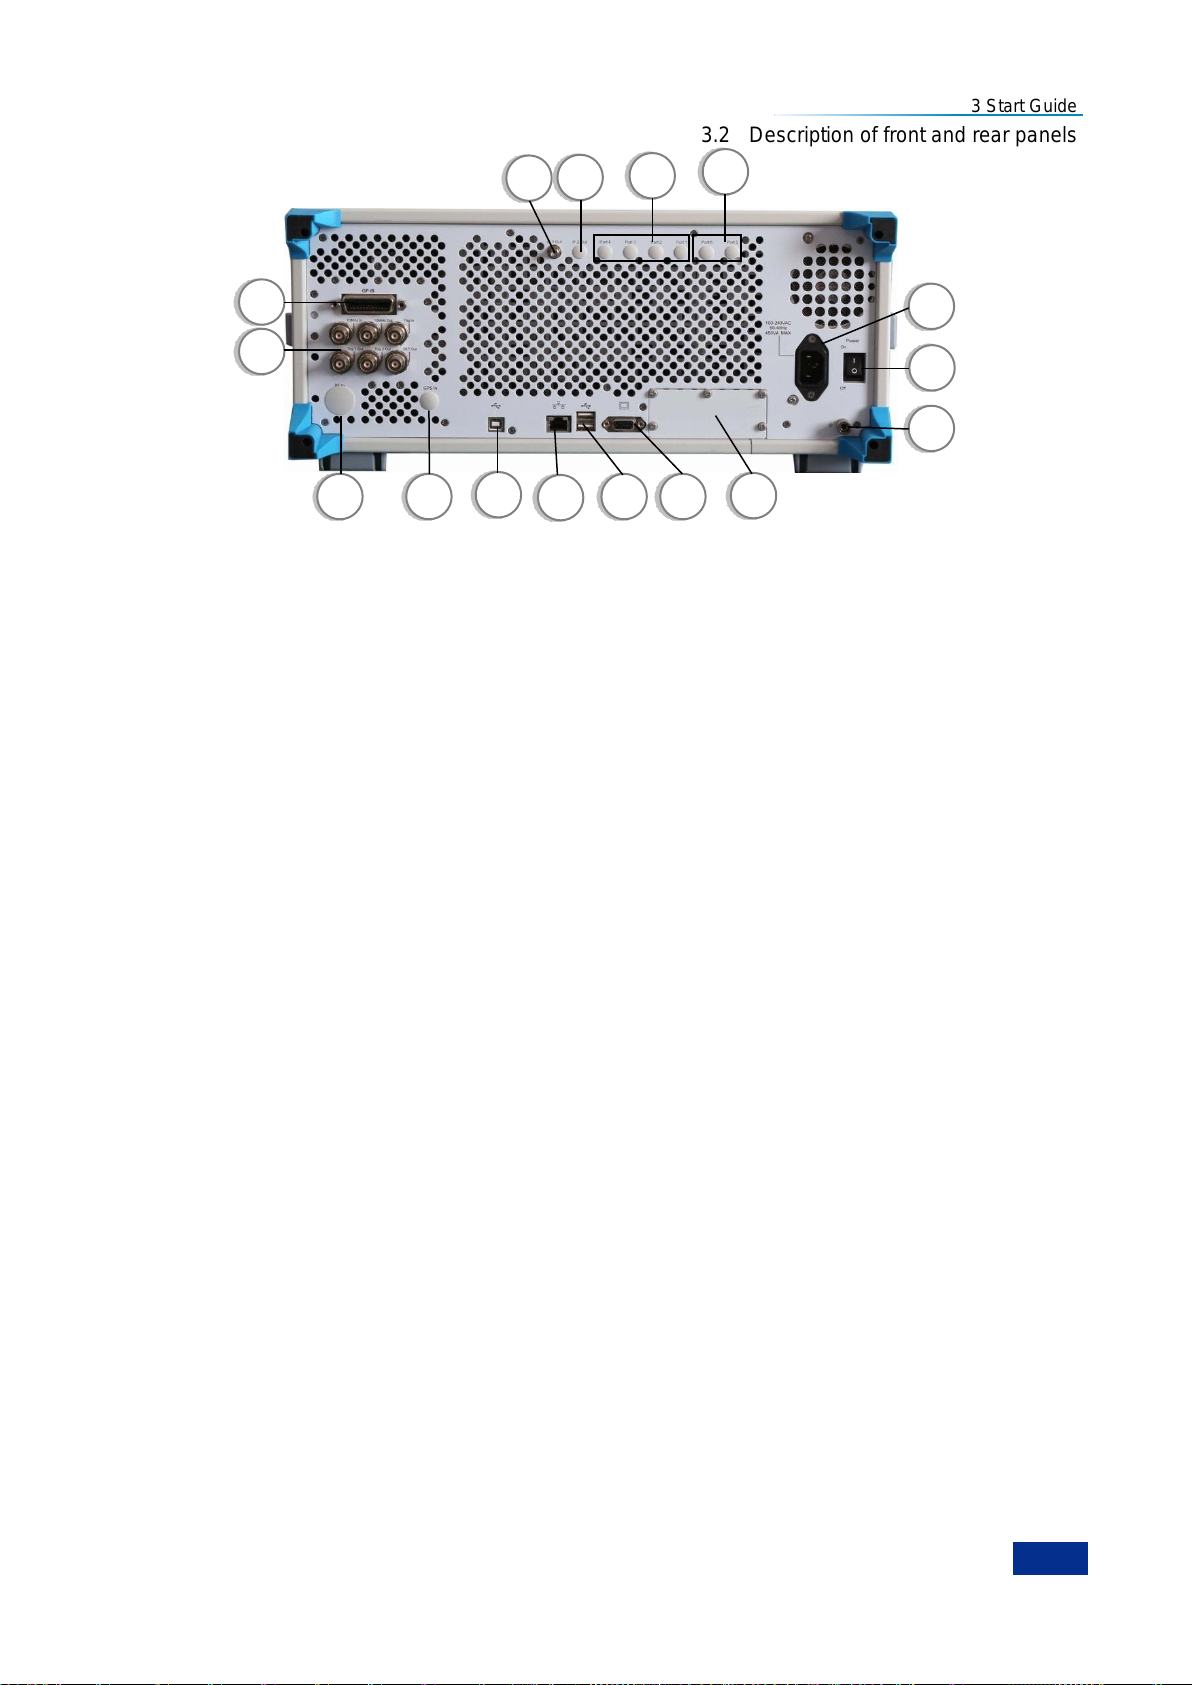
3 Start Guide
33
2
1
3
4
5
6
7
8
9
10
11
12
13
14
15
16
3.2 Description of front and rear panels
Fig. 3.15 Rear Panel of Series 3986 Noise Figure Analyzer
1. Power input port
2. Power switch
3. Grounding terminal
4. Option module
5. External monitor port
6. USB interface
7. LAN interface
8. USB slave port
9. Positioning antenna input
10. Rear panel RF input
11. Rear panel BNC input/output
12. GPIB interface
3.2.2.1 Power input port
Instrument AC power input.
3.2.2.2 Power switch
Master power switch of the analyzer.
3.2.2.3 Ground terminal
For reliable grounding of the analyzer.
3.2.2.4 Option module
13. IF output 1
14. IF output 2
15. Wideband output
16. Narrowband output
Not available for this series.
3.2.2.5 External monitor port
VGA port, to connect external VGA monitor.
3.2.2.6 USB interface
Standard Type A USB2.0 port. To connect USB peripherals such as keyboard, mouse, CD driver and
hard drive.
3.2.2.7 LAN interface
RJ45 port and TCP/IP port, 10/100/1000M adaptive, for remote operations.
3.2.2.8 USB slave port
Type B USB2.0 port. USB TMC linked to external computer-based equipment controller to control the
Page 46
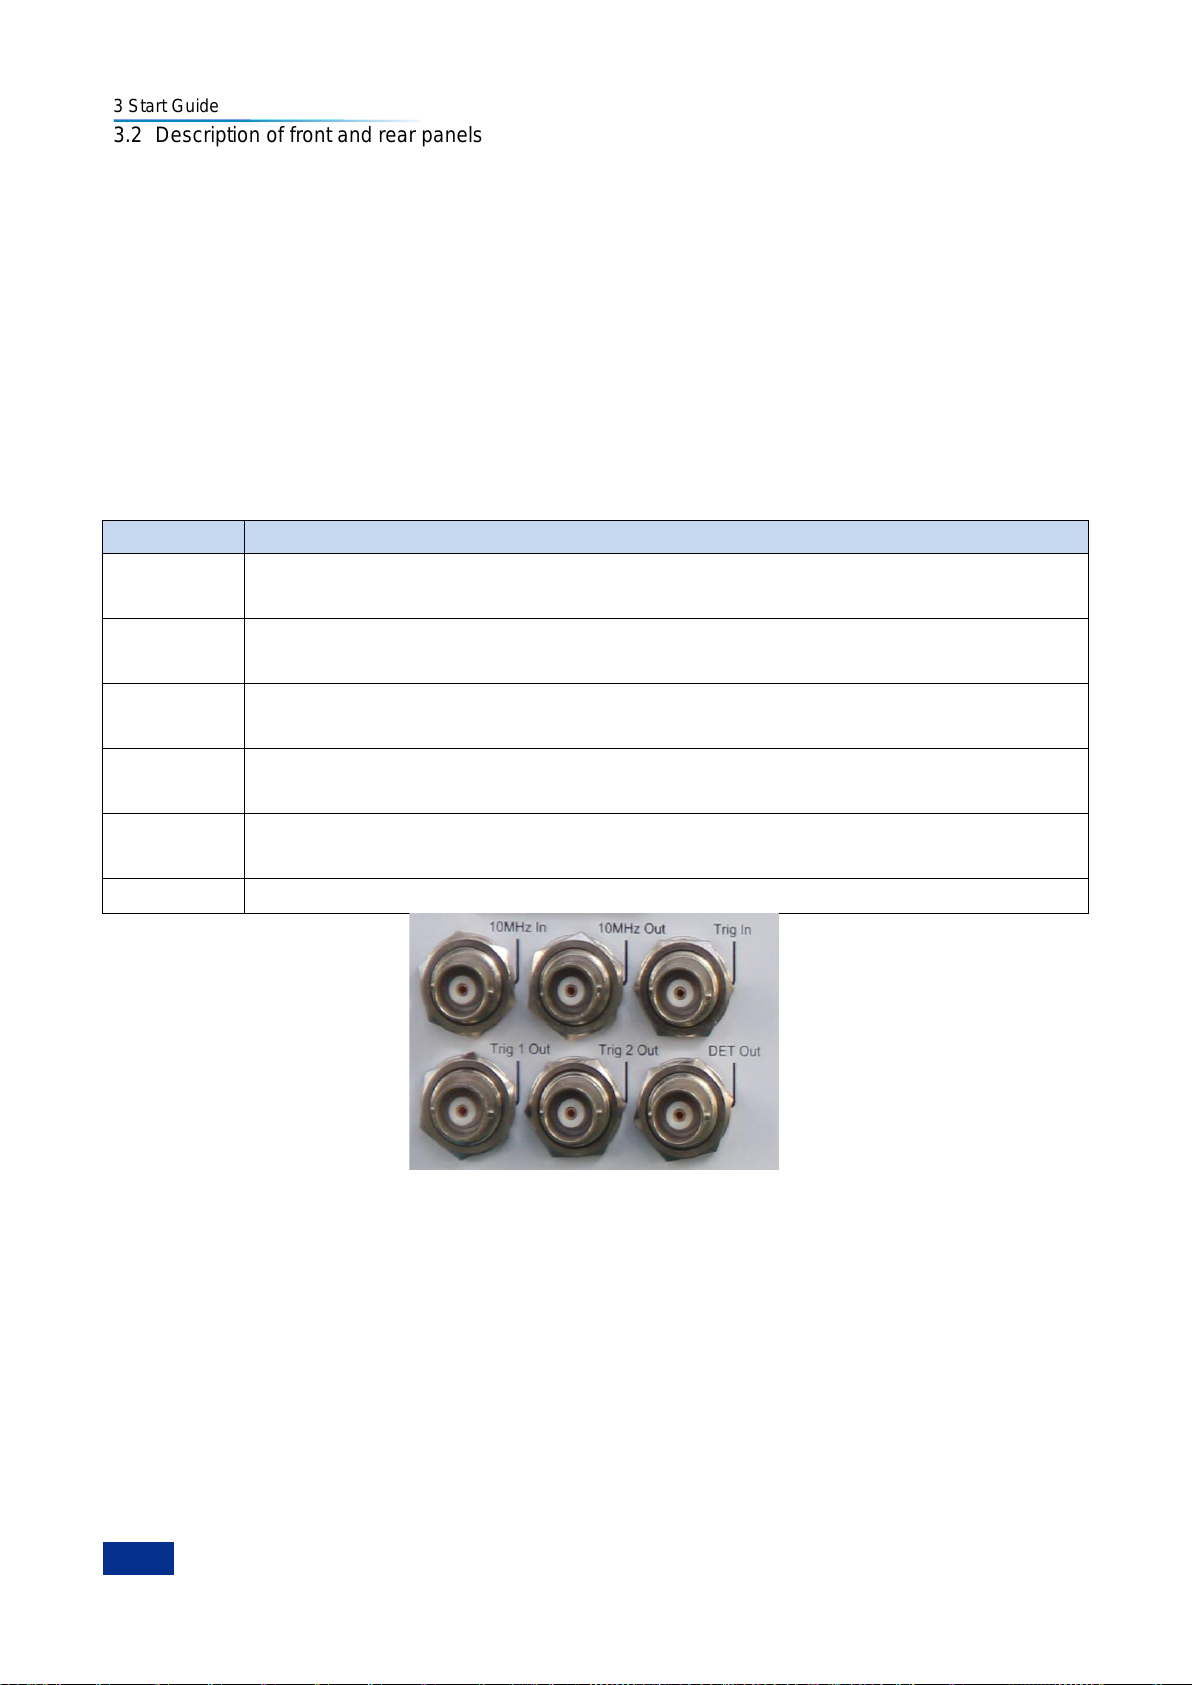
3 Start Guide
34
Port name
Port description
10MHz In
BNC female, used for 10MHz reference signal input, amplitude greater than 0dBm
required.
10MHz Out
BNC female, used for internal 10MHz reference signal output. Used to lock the frequency
of other test equipment to the analyzer‘s frequency reference.
Trig In
BNC female, used for external trigger signal input of the rear panel, input voltage range
[-5V, +5V], not available for this series.
Trig 1 Out
BNC female, TTL level, trigger signal output for synchronizing other test equipment.
Output signal types configurable via input/output menu, not available for this series.
Trig 2 Out
BNC female, TTL level, trigger signal output for synchronizing other test equipment.
Output signal types configurable via input/output menu, not available for this series.
DET Out
BNC female, used for video detection signal output, not available for this series.
3.2 Description of front and rear panels
analyzer and high-speed data transfer.
3.2.2.9 Positioning antenna input
Not available for this series.
3.2.2.10 Rear panel RF input
Optional port depending on the analyzer‘s frequency range, used for input connections when building
test system.
3.2.2.11 Rear panel BNC input/output
BNC ports on the rear panel and their descriptions are shown in Table 3.8 and Fig. 3.16.
Table 3.8 Measurement Setting Keys
Fig. 3.16 BNC Ports on Rear Panel
3.2.2.12 GPIB interface
Standard IEEE488 port supporting SCPI language, used to remotely control the analyzer.
3.2.2.13 IF output 1
The second IF output for channel test, not available here.
3.2.2.14 IF output 2
The third IF output for channel test, not available here.
Page 47
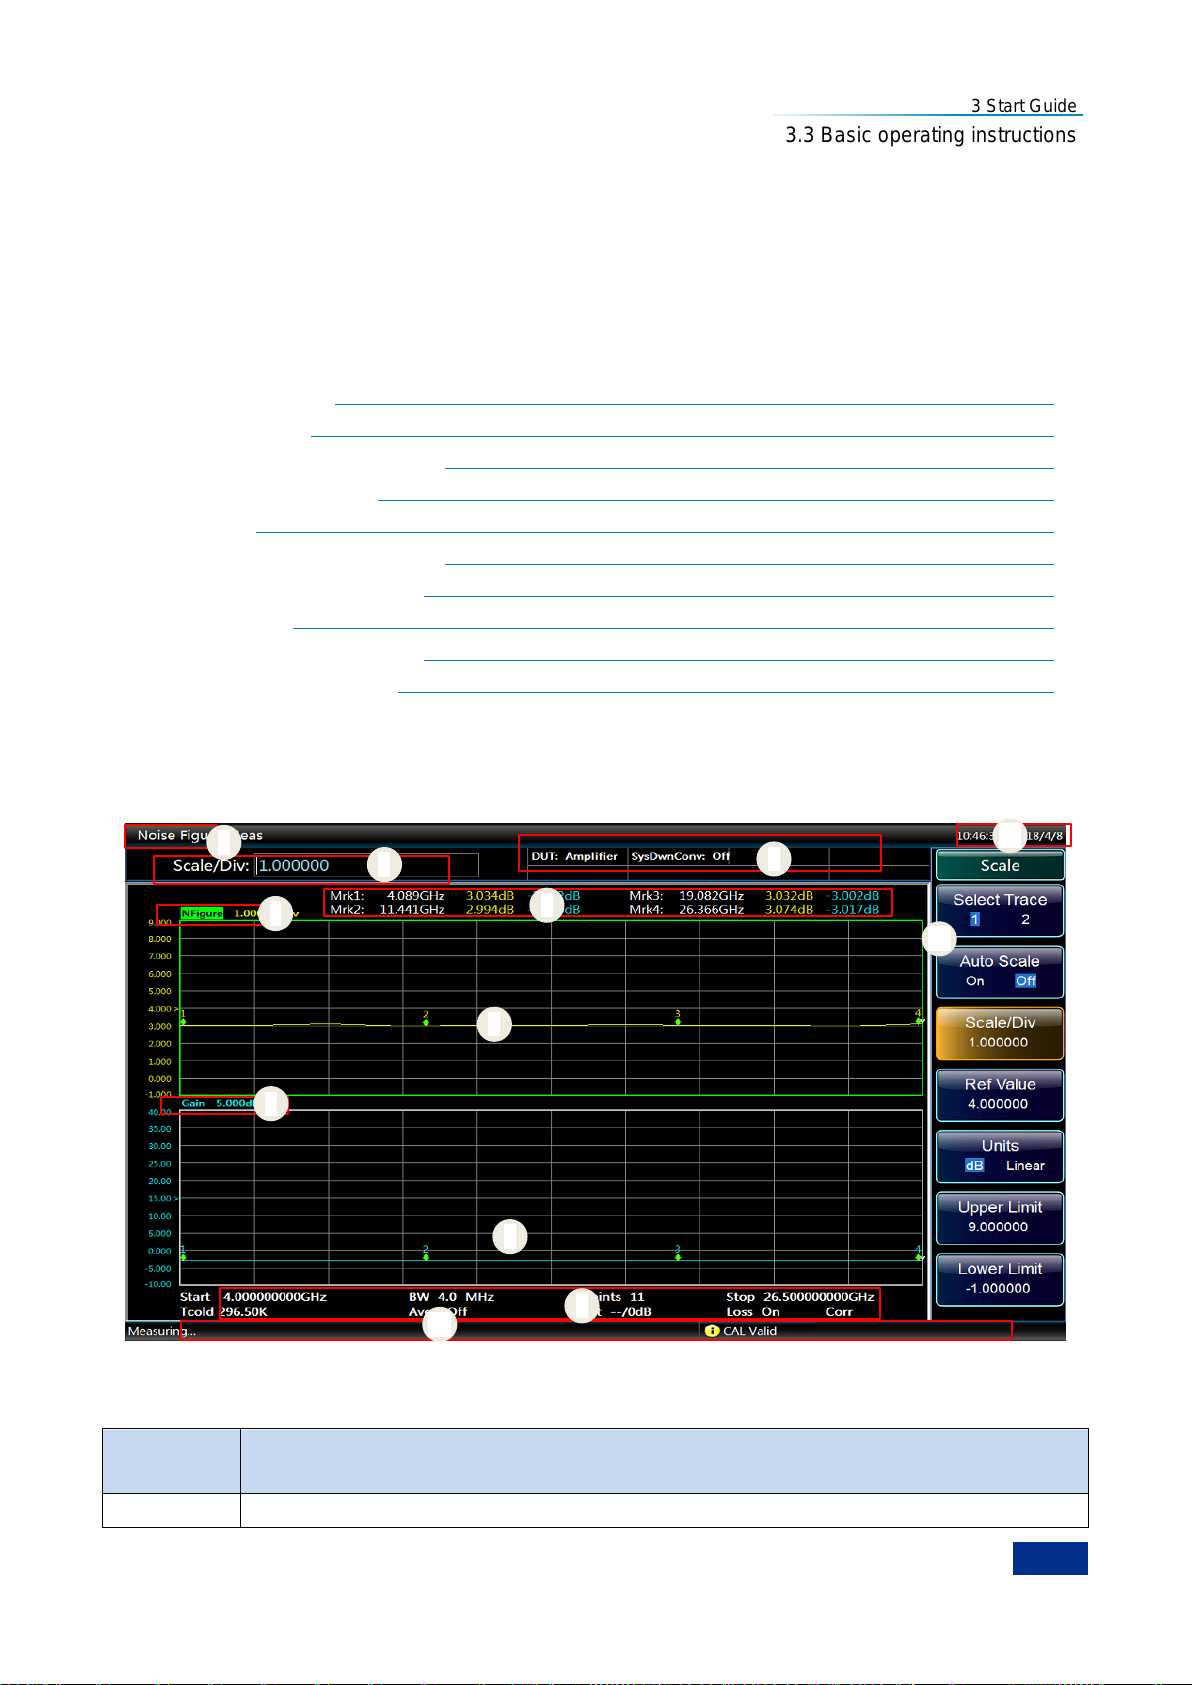
3 Start Guide
35
Graphic
Number
Function description
1
Title bar, displaying the currently active function
7 8 12 1 2 4 5
6
9
10
3
11
3.3 Basic operating instructions
3.2.2.15 Wideband output
Not supported and not available here.
3.2.2.16 Narrowband output
Not supported and not available here.
3.3 Basic operating instructions
Display annotation………… ……………………………………………………………………………35
User interaction……………… …………………………………………………………………………38
Set preset and poweron states… ………………………………………………………………………39
Perform file operations…………… ……………………………………………………………………40
Input ENR……………………………………………………………………………………………………44
Set measurement frequencies……………………………………………………………………………50
Set bandwidth and average………………………………………………………………………………53
Calibrate NFA………………………………………………………………………………………………53
Display measurement result………………………………………………………………………………56
Measure fixed frequency…………………………………………………………………………………64
3.3.1 Display annotation
The measurement display annotation, shown in Fig. 3.17, is referenced by numbers. Table 3.9 describes
each function, followed with detailed information.
Fig. 3.17 Measurement display of 3986 series NFA
Table 3.9 Display annotation item description
Page 48
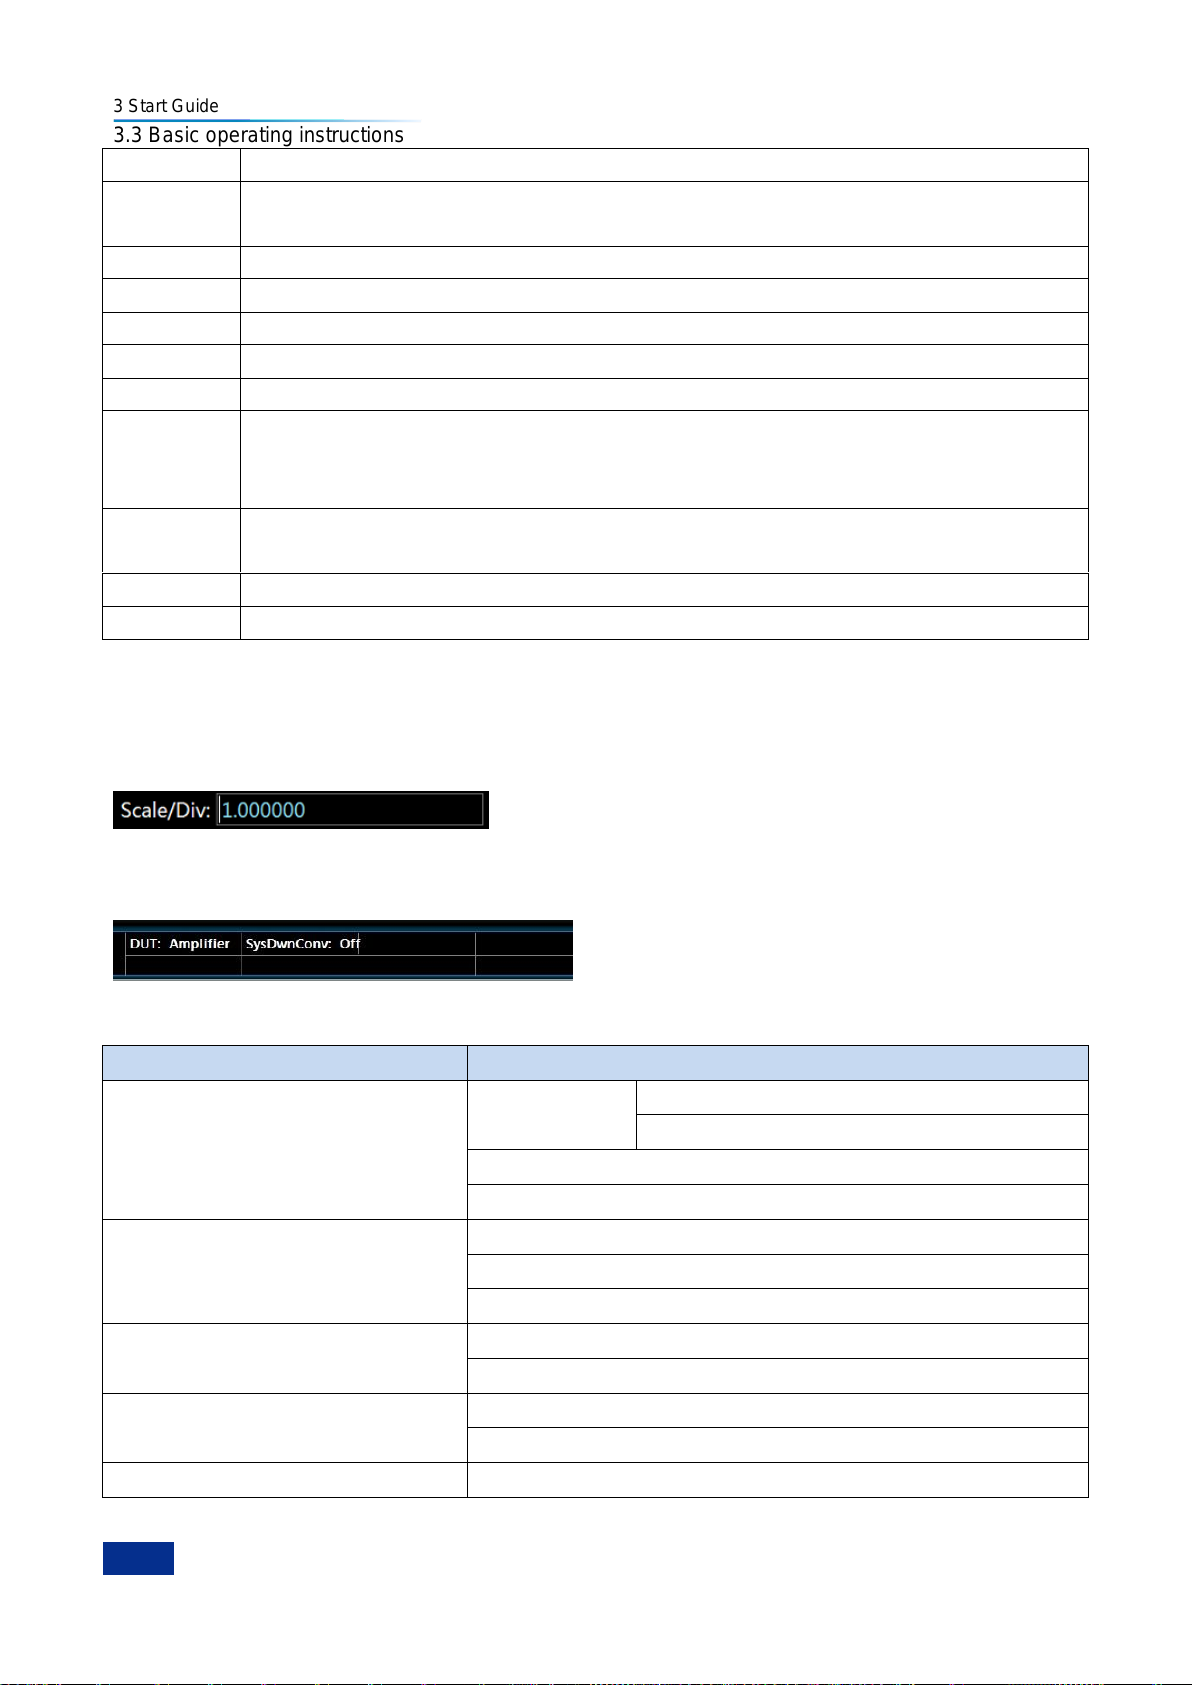
3 Start Guide
36
2
Result input area, for entering measurement setup data
3
Mode setup column, showing the current mode information, such as DUT type, sideband,
LO control, LO mode, frequency property and so on
4
Marker display column
5
Upper graph measurement result, controlled by [Result - Trc 1] menu key
6
Lower graph measurement result, controlled by [Result - Trc 2] menu key
7
Result - Trc 1 measurement
8
Result - Trc 2 measurement
9
Measurement setup information display bar; this example displays the start frequency,
bandwidth, points, stop frequency, cold temperature, average, attenuation,
compensation, correction state, etc.
10
Instrument status bar, displaying the measurement progress, instrument status and error
information
11
Time and date display
12
Soft key menu, displaying the menu corresponding to the latest operation.
Information Content
Corresponding setup option
DUT
Amplifier
SysDwnConv: Off
SysDwnConv: On
DownConv
UpConvr
Sideband
LSB
USB
DSB
LO mode
Fixed
Variable
Ext LO Ctrl
On
Off
Freq Context
RF-Input or IF-Input
3.3 Basic operating instructions
3.3.1.1 Title bar
The title bar displays the currently active function.
3.3.1.2 Result input area
It is used to enter result(s) for the currently active function.
3.3.1.3 Mode setup column
This column displays the setup information related to the instrument for viewing, as shown in Table 3.10.
Table 3.10 Description of the Mode Setting Display Area
Page 49
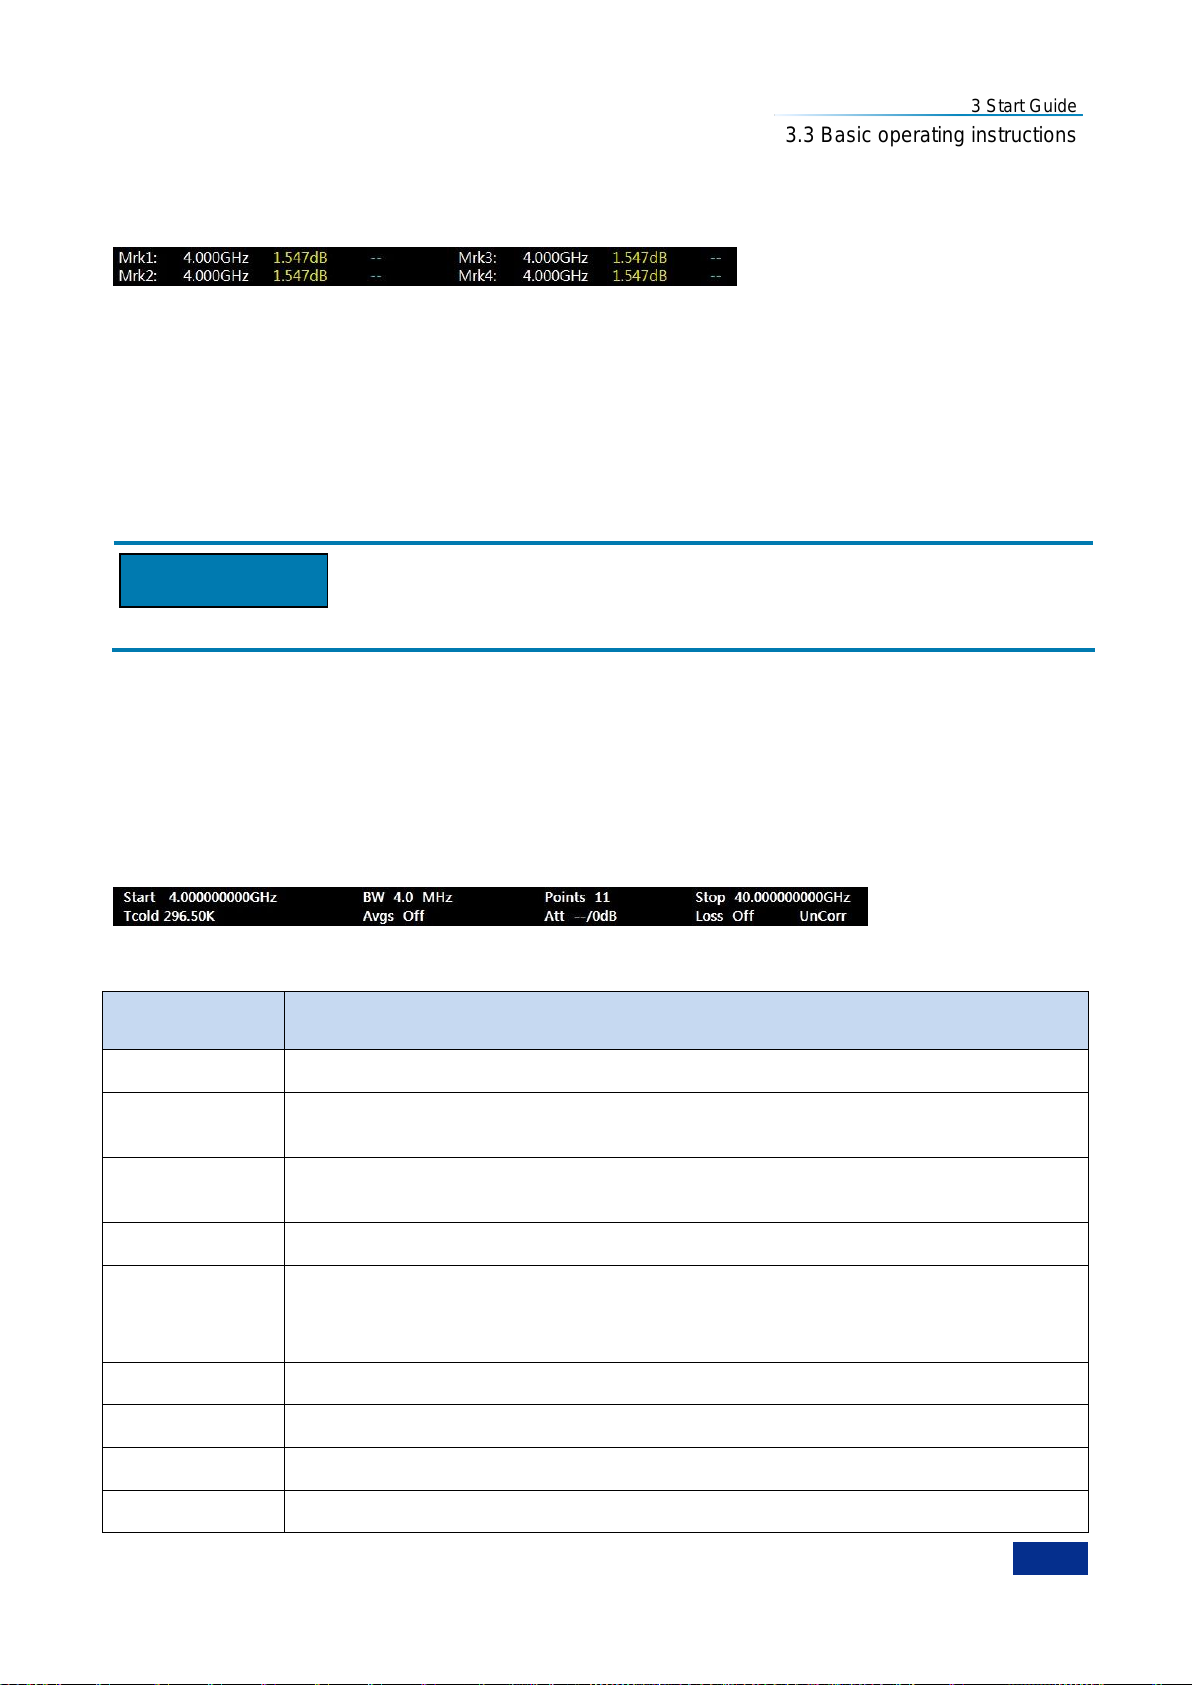
3 Start Guide
37
Information
Content
Meaning
Start
Display the start frequency of sweep measurement.
BW
Measurement bandwidth; this noise figure analyzer has 6 options: 4MHz, 2MHz,
1MHz, 400kHz, 200kHz and 100kHz.
Points
Display the number of measurement frequency points. The number of sweep
measurement points ranges from 2 to 401, and the default is 11.
Stop
Display the stop frequency of sweep measurement.
Tcold
Display the ambient temperature during measurement. When being connected to a
smart noise source (SNS), the noise figure analyzer can monitor the ambient
temperature and update this value.
Avgs
The number of averages
Att
Display the value of RF/microwave input attenuation.
Loss
Display the compensation status, On or Off.
UnCorr
Display the measurement correction state, corrected or uncorrected.
Attention
3.3 Basic operating instructions
3.3.1.4 Marker displays column
This column displays the trace 1 and trace 2 results on X and Y axes when markers are activated under
graph mode.
3.3.1.5 Upper graph measurement result
The upper graph measurement result can be selected through the [Result-Trc 1] menu. The options
include noise figure, gain, Y-factor, Teffective, PHot and PCold.
3.3.1.6 Lower graph measurement result
The lower graph measurement result can be selected through the [Result-Trc 2] menu. The options
include noise figure, gain, Y-factor, Teffective, PHot and PCold.
Unable to select the same measurement result for both the upper graph and the lower graph.
3.3.1.7 Result-Trc 1 measurement
The trace result related to the upper graph measurement result.
3.3.1.8 Result-Trc 2 measurement
The trace result related to the lower graph measurement result.
3.3.1.9 Measurement setup information
The description of each setup information is shown in Table 11.
Table 3.11 Measurement setup information description
Page 50
3 Start Guide
38
3.3 Basic operating instructions
3.3.1.10 Instrument status bar
The status bar below the graphs displays the instrument status or error messages (if any).
1) Measurement progress
The left of the status bar below the graphs displays the progress of current operation.
2) Calibration state
Display the calibration as valid. If any error or abnormality is detected, error code and information will be
displayed.
3.3.1.11 Time and date display
The time and date information is displayed at the upper right corner of the screen.
3.3.1.12 Soft key menu
Display the menu corresponding to the latest operation.
3.3.2 User interaction
Available means for interaction:
1) Instrument keypad;
2) Knob;
3) Arrow keys;
4) Soft keys.
All tasks can be accomplished through such user interface. All keys correspond to those operations on
an external keyboard (such as arrow keys, Enter key and so on) and comply with the Microsoft standard,
except the special keys of the instrument.
3.3.2.1 【 】Next trace key
This key is used to change the active trace for the corresponding settings. When a trace is active, the
corresponding window displaying the trace is enabled. Only when the trace is active can each setting be
performed.
3.3.2.2 Input data
You can use the following method to input data into the dialog box:
1) Use the keys available on the front panel, for example, the keypad, knob or arrow keys;
2) Use the soft keys on the virtual keyboard;
3) Use an external keyboard connected to the NFA.
Characteristics of Windows dialog box: For certain applications, for example, if you want to install a
printer, the Windows defined dialog boxes will be used, and the knob and function keys of the NFA are
not applicable.
The keypad is only used to enter numeric data when you input a numeric value to a certain segment.
4) Use the keypad to enter a value, or change the current value by rotating the knob or pressing the
up/down arrow keys【▲】and【▼】.
Page 51
3 Start Guide
39
3.3 Basic operating instructions
5) After each complete numerical entry, you need to press the unit menu keys to add a unit to the input.
6) If no unit is needed, press the【Enter】key or one unit key to confirm the input. The editing row is
highlighted to confirm the input.
3.3.3 Set preset and poweron states
The 3986 series NFA has the following preset and poweron states:
Factory default: The default configuration originally set by developers at factory, which is also the
optimum setting that can satisfy most measurements and cannot be changed by the user.
User preset state: The configuration set by the user for specific measurement;
User power on state: The initial configuration of the instrument at power on; users can define and save a
specific configuration as the power on state. The factory default is set as the power on state of the
instrument upon delivery.
Preset state: The state that the instrument returns to after users press the【Preset】key; users can set
either factory default state or the user preset state. If incorrect configuration defined by users leads to
NFA failure, users can preset the instrument to the factory state.
3.3.3.1 Save user preset/poweron state
Step 1. Complete the NFA result settings as you need.
Step 2. Press the【System/Local】key.
Step 3. Press the [PowerOn/Preset] menu key.
Step 4. Press the [Save UserPreset] menu key to save the User Preset state; press the [Save
PowerOn] menu key to save the user PowerOn state.
3.3.3.2 Set preset state
Step 1. Press the【System/Local】key.
Step 2. Press the [PowerOn/Preset] menu key.
Step 3. Press the [Preset] menu key to set the preset switch. If you want to return the NFA to its factory
default, set the preset switch to [Preset Factory User preset]; if you want to return the NFA to
the user preset state, set the preset switch to [Preset Factory User].
3.3.3.3 Save factory default as user preset/poweron state
Step 1. Press the【System/Local】key .
Step 2. Press the [PowerOn/Preset] menu key.
Step 3. Press the [Preset] menu key, and set the switch to [Preset Factory User].
Step 4. Press the [Preset] key to return the NFA to factory default.
Step 5. Press the【System/Local】key.
Step 6. Press the [PowerOn/Preset] menu key.
Step 7. Press the [Save UserPreset] menu key to save the factory default as the user defined state
upon preset; press the [Save PowerOn] menu key to save the factory default as the user
defined state upon power on.
Page 52
3 Start Guide
40
Attention
NOTE
3.3 Basic operating instructions
3.3.4 Perform file operations
3.3.4.1 File types
The types of files can be saved include:
1) ENR Files (*.ENR), including Meas ENR Files and Cal ENR Files
2) State Files (*.STA)
3) LimitLine Files(*.LIM), including LimitLine1/2/3/4 Files
4) Freq List Files (*.LST)
5) LossComp Files (*.LOS), including Before/After LossComp Files
6) Trace Files (*.TRC)
The types of files to be loaded include:
1) ENR Files (*.ENR), including Meas ENR Files and Cal ENR Files
2) State Files (*.STA)
3) LimitLine Files(*.LIM), including LimitLine1/2/3/4 Files
4) Freq List Files (*.LST)
5) LossComp Files(*.LOS), including Before/After LossComp Files
Except trace files, all other files previously stored by the users can be reloaded to the NFA.
3.3.4.2 Saving/loading files
The 3986 series NFA provides the file saving/loading function.
1) Saving files
Saving files means to save files (limit lines, ENR tables, traces, frequency lists and loss compensation
tables) to the specified directory.
It is recommended to save limit lines, ENR tables, traces, frequency lists or loss compensation tables to
the User (D:) drive.
Use the following steps to save a file:
Step 1. Press the【File】key to enter the file saving/loading menu.
Step 2. Press the [Save…] menu key. "Save as" dialog box appears, as shown in Fig. 3.18.
Step 3. Select the drive you want to save the file to, for example, User (D:).
Step 4. You can determine the path and file name as you need. For example, save the file to the root
directory of drive (D:).
Step 5. Select the type of file you want to save from the Save As type dialog box , for example, if you
want to save a state file, select the State Files (*STA) with mouse.
Step 6. Enter the file name to the File name dialog box using the numeric keys of NFA, on-screen
keyboard or an external keyboard.
Step 7. Click the [Save] button on the dialog box to save the file to the specified directory.
Page 53
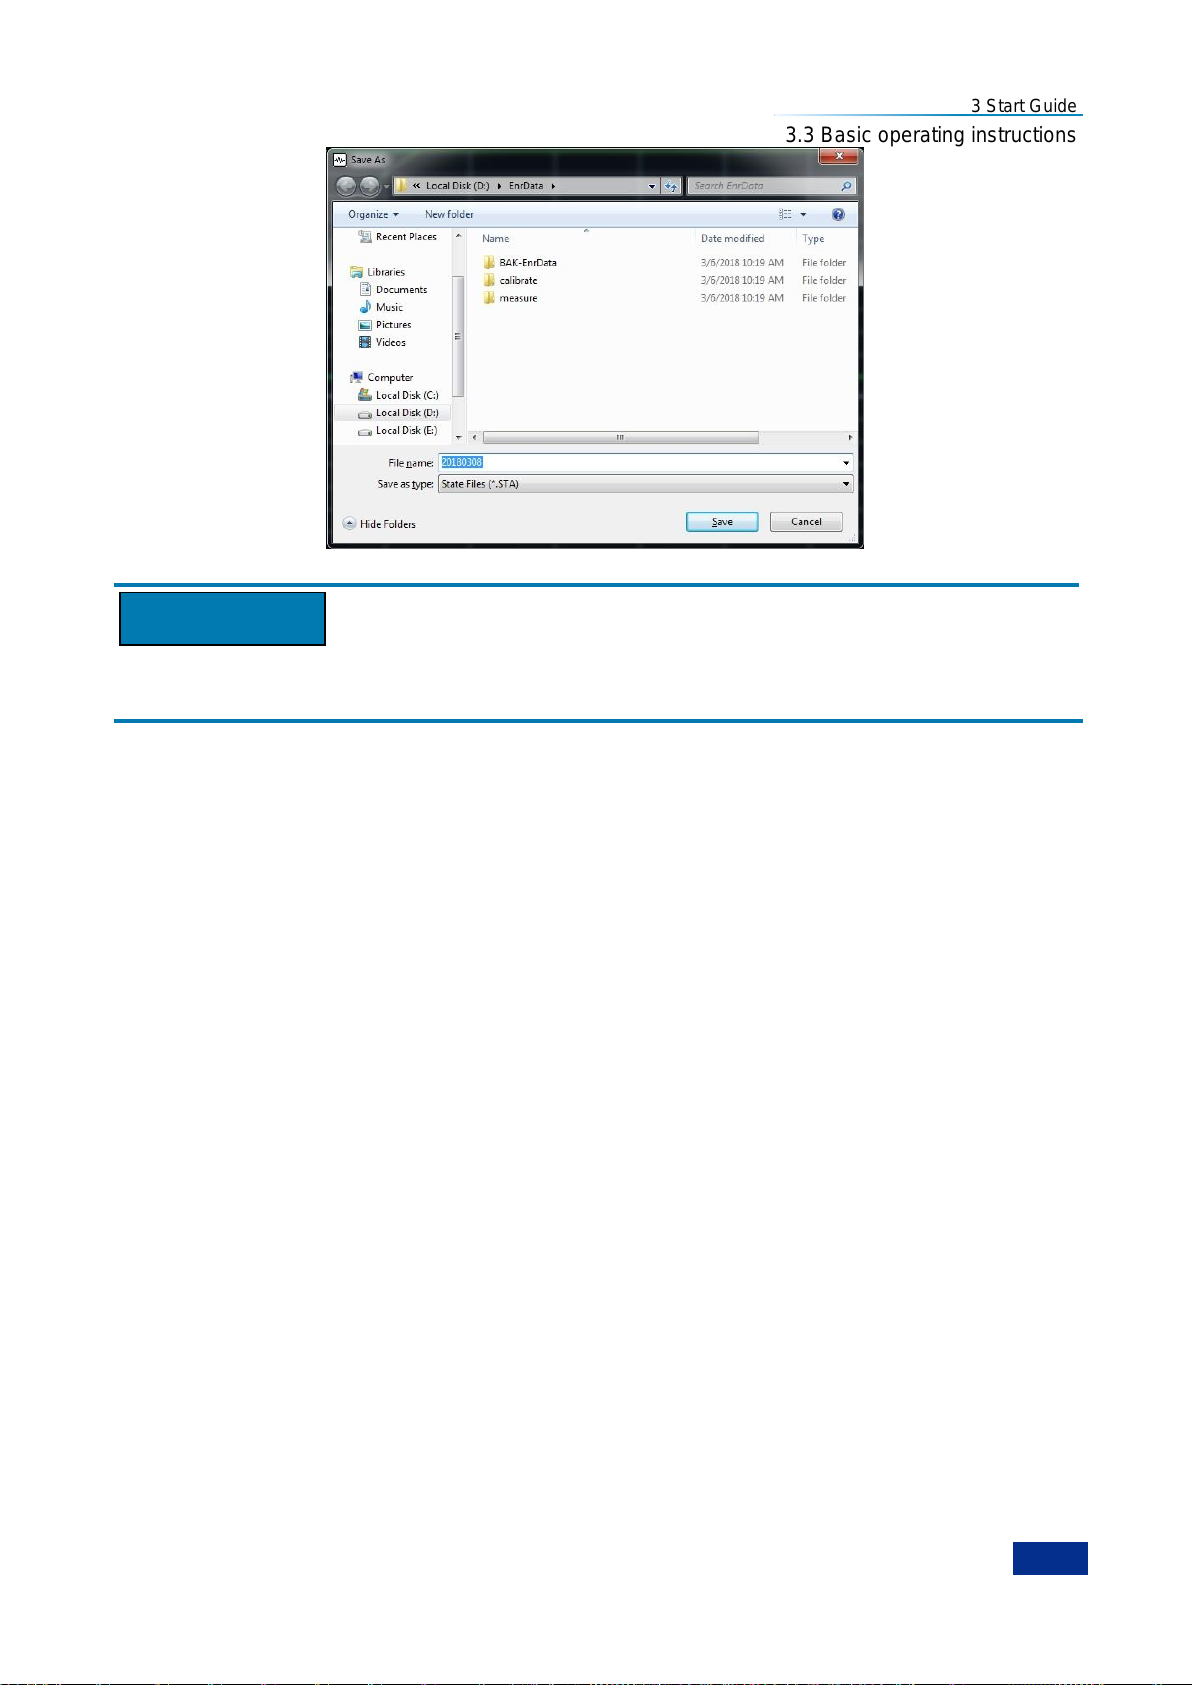
3 Start Guide
41
Attention
3.3 Basic operating instructions
Fig. 3.18 File saving display
If you want to use on-screen keyboard to enter the file name, be sure to open the on-screen keyboard
before the Windows operation display appears, i.e., before Step 2.
2) Loading files
Loading files means to load data files and state files previously stored on the disk back to the NFA
measurement program for use.
The types of files can be loaded include:
ENR Files (*.ENR), including Meas ENR Files and Cal ENR Files
State Files (*.STA)
LimitLine Files(*.LIM), including LimitLine1/2/3/4 Files
Freq List Files (*.LST)
LossComp Files(*.LOS), including Before/After LossComp Files
Use the following steps to load files:
Step 1. Press the【File】key to enter the file saving/loading menu.
Step 2. Press the [Load…] menu key. "Open" dialog box appears, as shown in Fig. 3.19.
Step 3. Select the drive you want to save the file to, for example, User (D:).
Step 4. Select the path where the file to be loaded is saved, for example, ―D\ENR-Data‖.
Step 5. Select the type of the file in "File name" input box, for example, ―Meas ENR Files (*.ENR)‖.
Step 6. Select the file to be loaded, for example, ―346CK01.enr‖.
Step 7. Click the [Open] button on the dialog box to load the specified file from the user drive to the NFA
measurement program.
Page 54
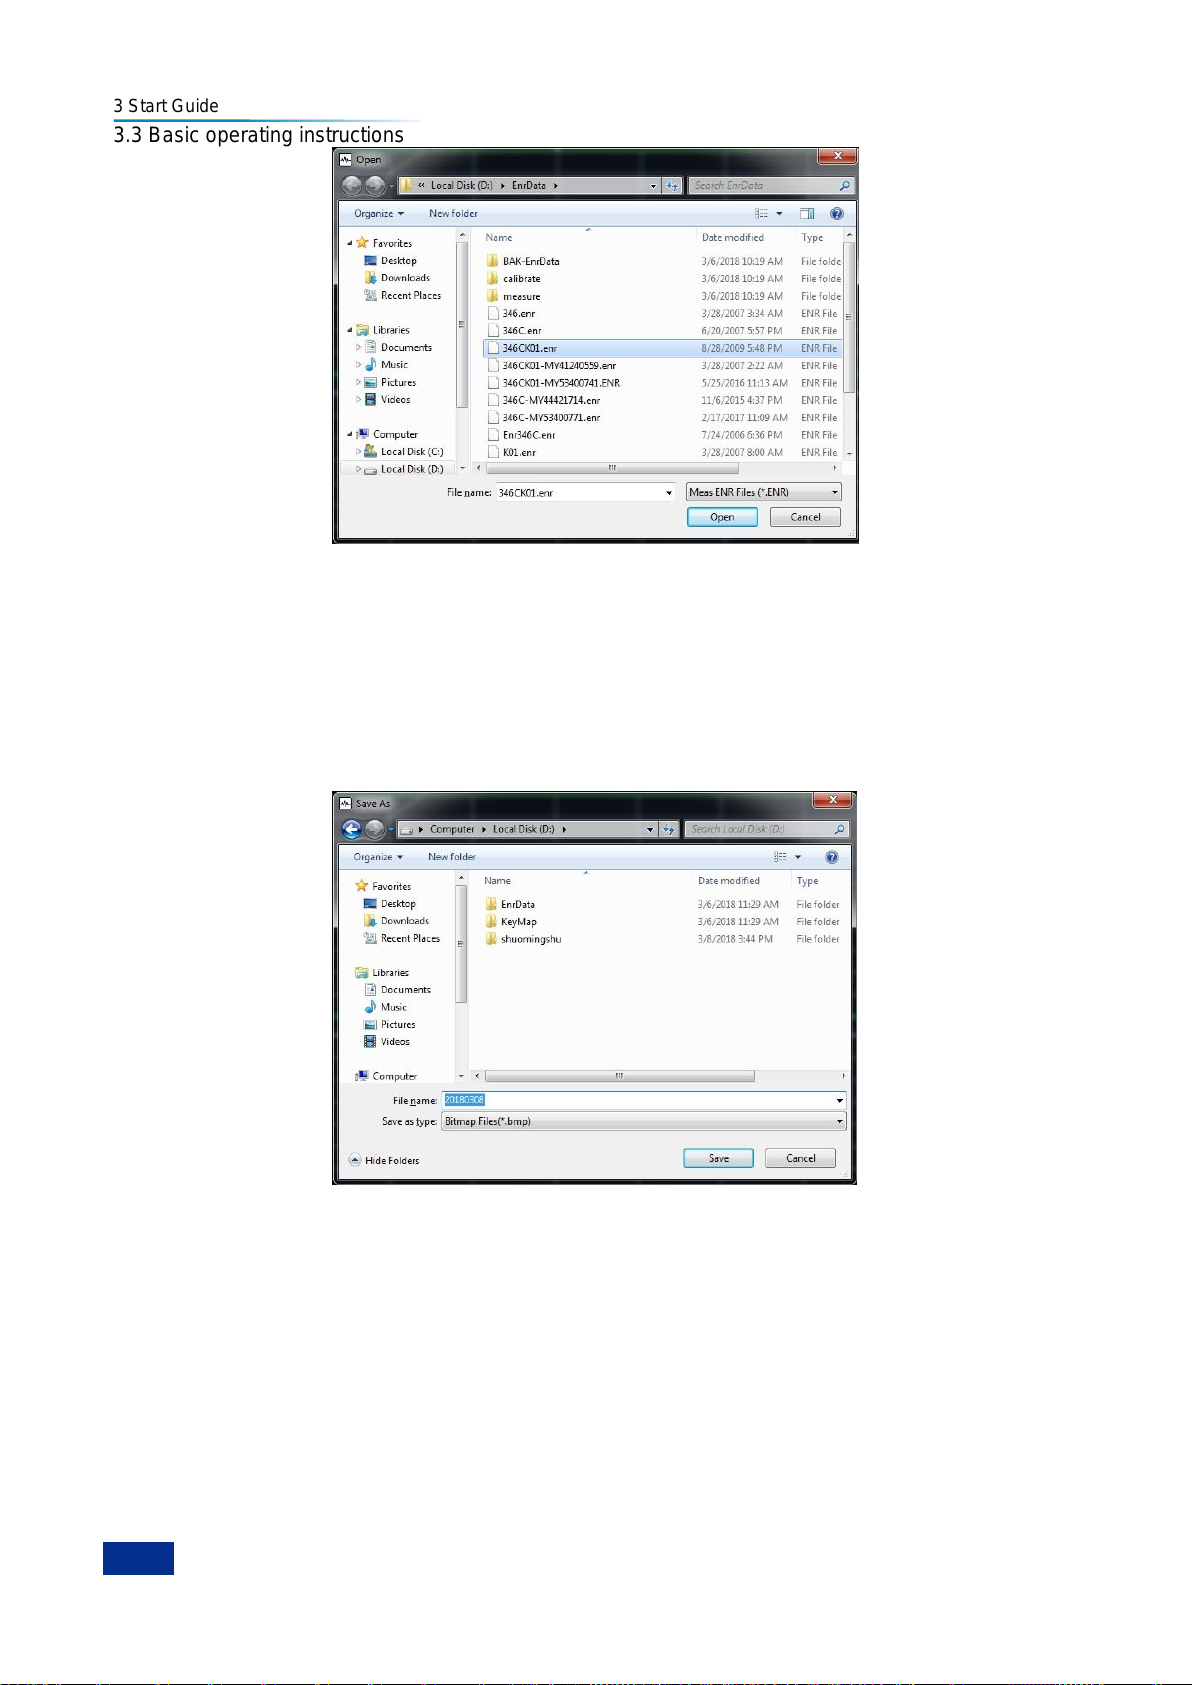
3 Start Guide
42
3.3 Basic operating instructions
Fig. 3.19 File loading display
3.3.4.3 Printing/saving screenshots
The 3986 series NFA provides screenshots saving (as bmp format) and printing functions.
1) Saving screenshots
Use the following steps to save a screenshot:
Step 1. Press the【Save】key. "Save as" dialog box appears, as shown in Fig. 3.20.
Fig. 3.20 Saving a screenshot
Step 2. Select the drive you want to save the file to, for example, User (D:).
Step 3. You can determine the file name and path as you need. For example, save the file to the root
directory of drive (D:).
Step 4. Enter the file name to the File name input box using the numeric keys of NFA or an external
keyboard.
Step 5. Click the [Save] button on the dialog box to save the file to the specified directory.
2) Printing a screenshot
Page 55
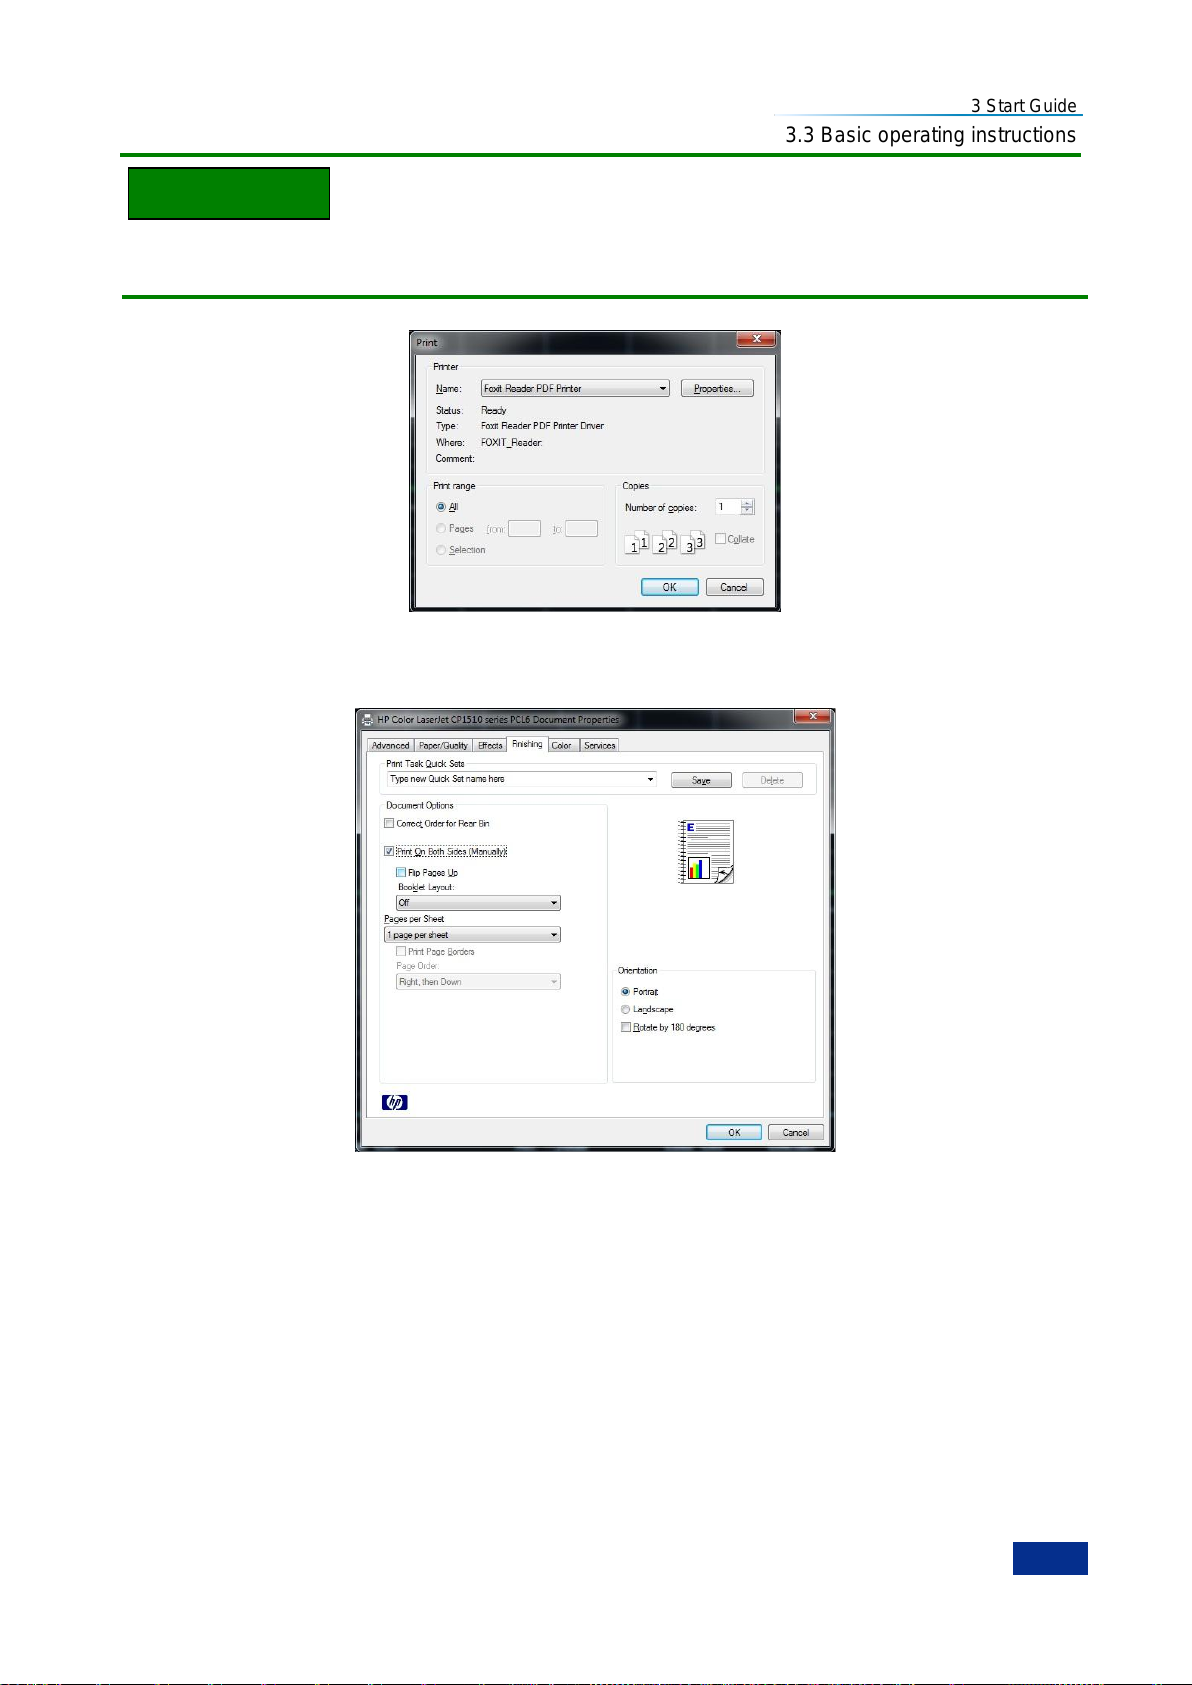
3 Start Guide
43
NOTE
3.3 Basic operating instructions
Install the printer driver as follows:
Before printing, you need to install the support printer driver to the 3986 series NFA.
Step 1. Press the【Print】key. "Print" dialog box appears, as shown in Fig. 3.21.
Fig. 3.21 Print dialog box
Step 2. Configure the printer. Select the appropriate printer. To customize the configuration, click the
Properties button to access the printer properties display, as shown in Fig. 3.22.
Fig. 3.22 Printer properties display
Step 3. Click the [OK] button on the dialog box to complete the screenshot printing.
3.3.4.4 File directory management
The 3986 series NFA does not provide separate file directory management functions for file browsing,
cutting, pasting and deleting operations. Please exit the NFA program and perform the specific
operations in the Windows interface.
3.3.4.5 Working with tables
The ENR table, frequency list, limit line and loss compensation table use table formats. Table 3.12
outlines how to perform various table editing and processing functions.
Page 56
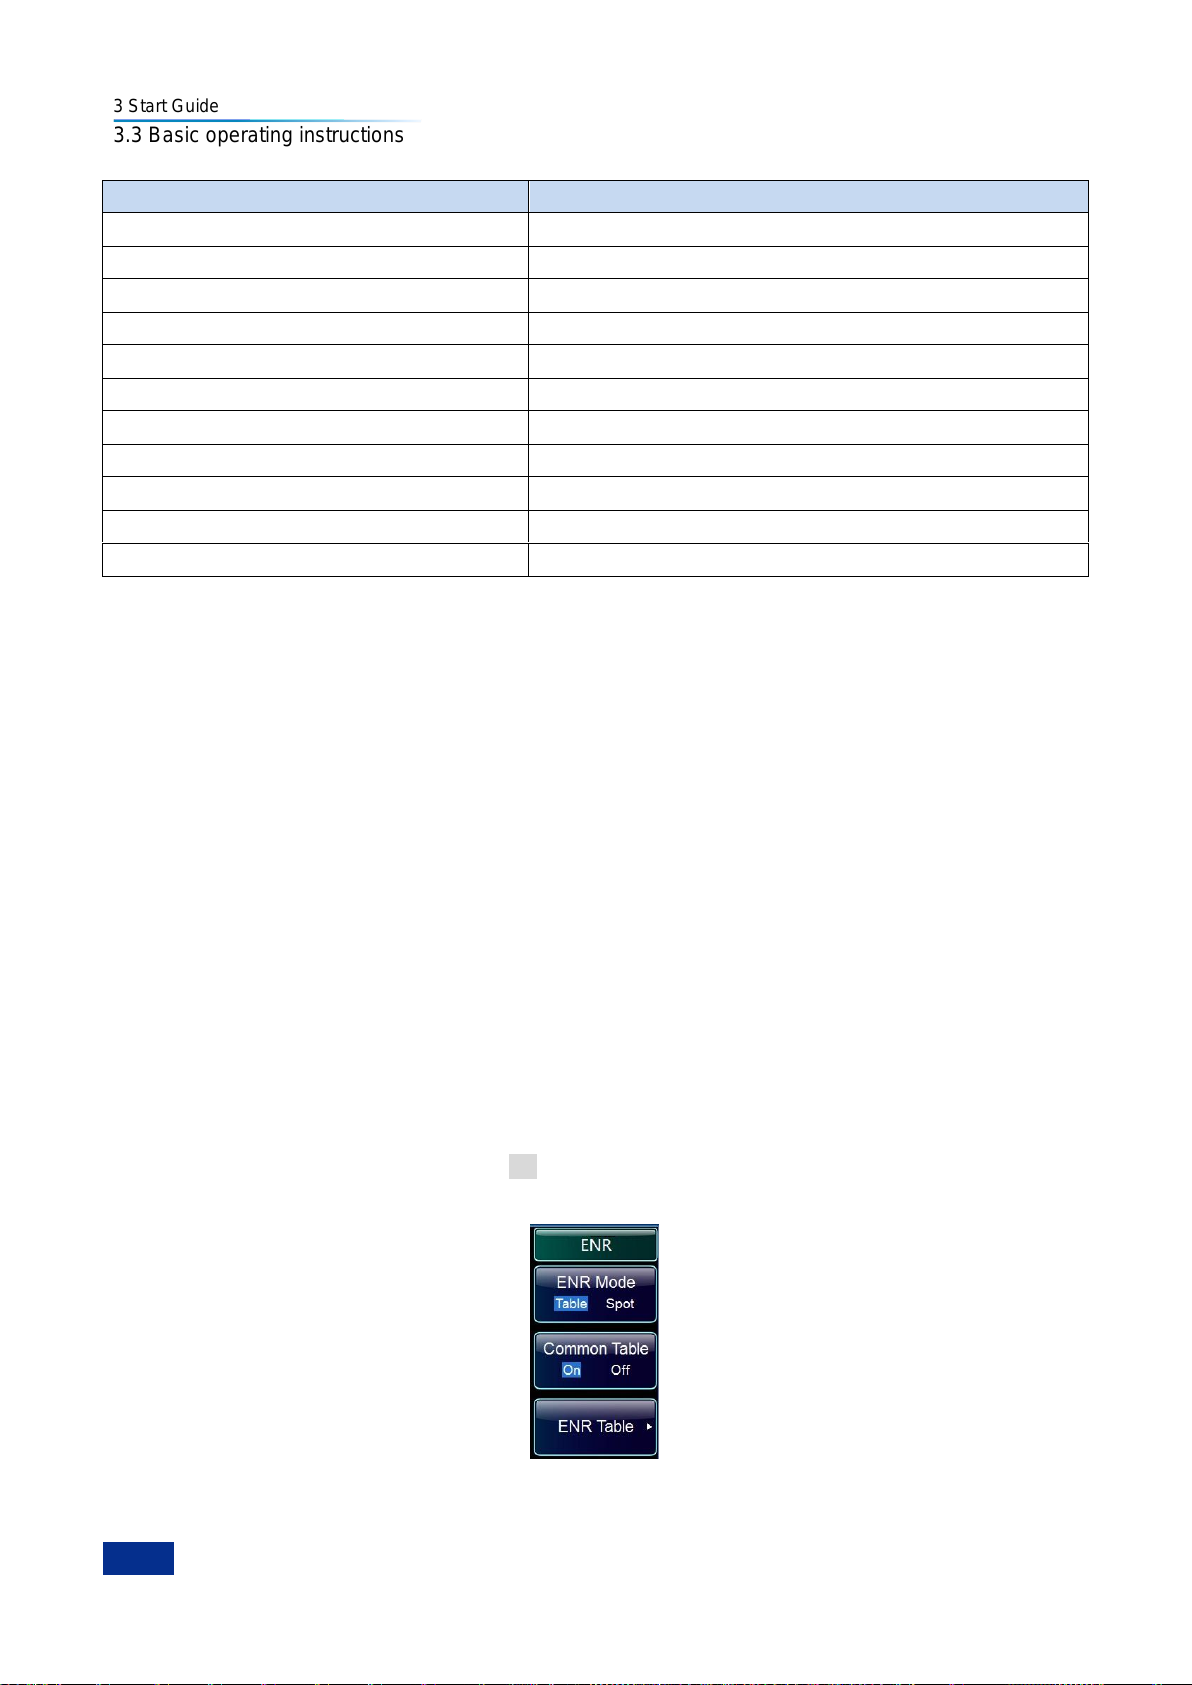
3 Start Guide
44
Description
Method
Move the active entry in the table
Arrow keys:【】and【】
Clear all entries in the table
[Clear Table] menu key
Delete a single row
[Delete Row] menu key
Add a new entry
[Add] menu key
Move the active entry up by one row
[Row up] menu key
Move the active entry down by one row
[Row down] menu key
Move the table up by one page
[Page up] menu key
Move the table down by one page
[Page down] menu key
Enter a value
Numeric keypad,【▲】and【▼】arrow keys, or knob
Finish entering value
Unit menu keys
Connect limit line points
【▲】and【▼】arrow keys, or knob
3.3 Basic operating instructions
Table 3.12 Using tables
3.3.5 Input ENR
ENR data can be entered into the noise figure analyzer as a table of values or as a single spot value.
The table of values is used for sweep measurement. The single spot value is used for single frequency
measurements or it is applied across the whole frequency measurement range.
There are two types of noise sources which are compatible with the 3986 series noise figure analyzer.
The first type is a normal noise source, for example the 16603 series, normal Keysight 346 series noise
source, etc. The ENR data for these normal noise sources can be entered manually either by using the
keypad or using the ENR data previously stored on a disk. The other type is a smart noise source (SNS),
for example 16604 series and Keysight 4000 series smart noise source, of which the ENR data can be
loaded to the analyzer automatically.
3.3.5.1 ENR common table setting
You can use the same ENR table for calibration and measurement when the same noise source is used
in calibration and measurement processes, or you can use separate ENR tables for calibration and
measurement when different noise sources are used in calibration and measurement processes.
1) Common ENR Table On mode
To use the same ENR table for calibration and measurement, press the【ENR】key and the [Common
Table] menu key to select [Common Table On Off];See Fig. 3.23, and this is the default setting.
In this mode, the format of the ENR table file to be loaded and saved is Meas ENR Files(*.ENR).
Fig. 3.23 Common ENR Table On menu
Page 57
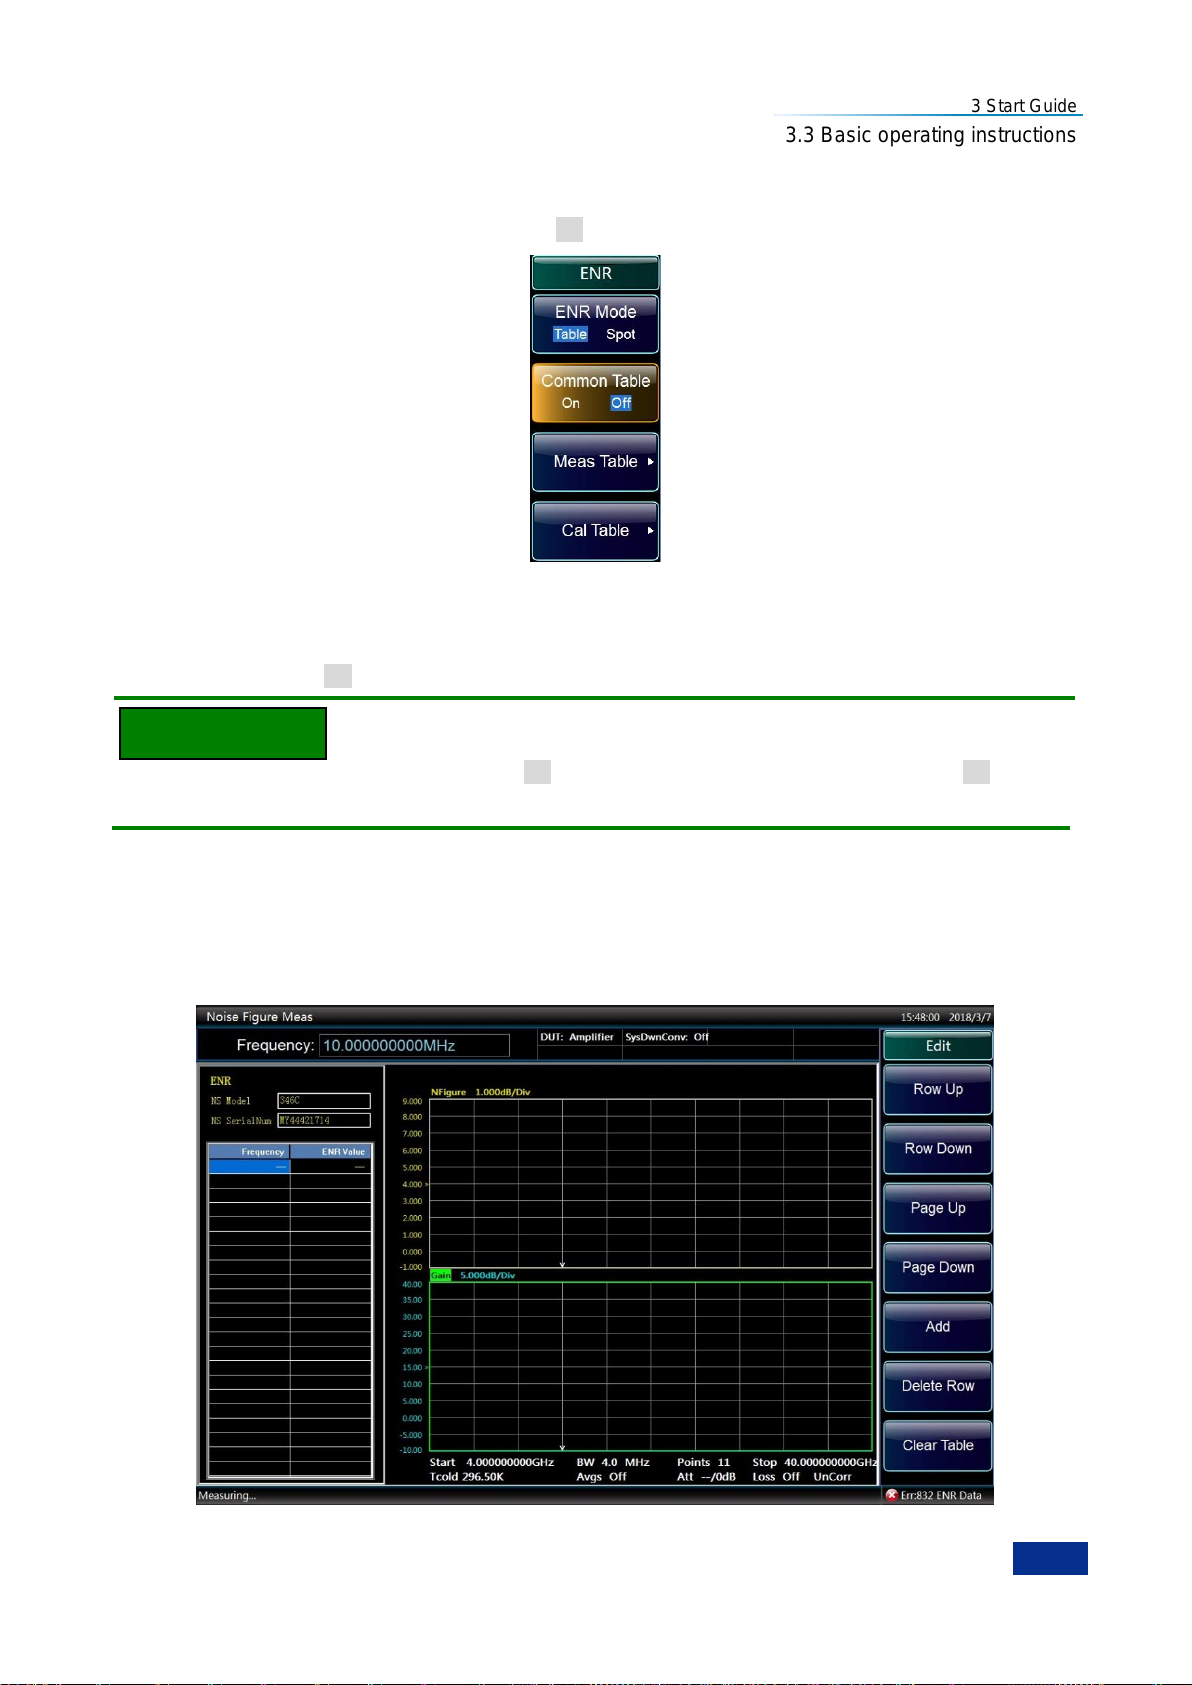
3 Start Guide
45
NOTE
3.3 Basic operating instructions
2) Common ENR Table Off mode
To use different ENR tables for calibration and measurement, press the【ENR】key and the [Common
Table] menu key to set it to [Common Table On Off]; see Fig. 3.24.
Fig. 3.24 Common ENR Table Off menu
In this mode, the Meas ENR Table and Cal ENR Table can be edited, loaded and saved separately for
calibration and measurement.
In the [Common Table On Off] mode, the ENR data in the [ENR Table] are those in the Meas ENR Table.
If you use a SNS when [Common Table On Off] is set, you need to set [Auto load ENR On Off] and use
[Fill from SNS] menu to fill the Cal ENR Table or Meas ENR Table with SNS ENR data.
3.3.5.2 Input ENR manually
Follow the steps below to input ENR manually:
Step 1. Press the【ENR】key.
Step 2. Press the [ENR Table] menu key. An ENR table appears on the display with the first frequency
point highlighted. See Fig. 3.25.
Fig. 3.25 ENR table
Page 58
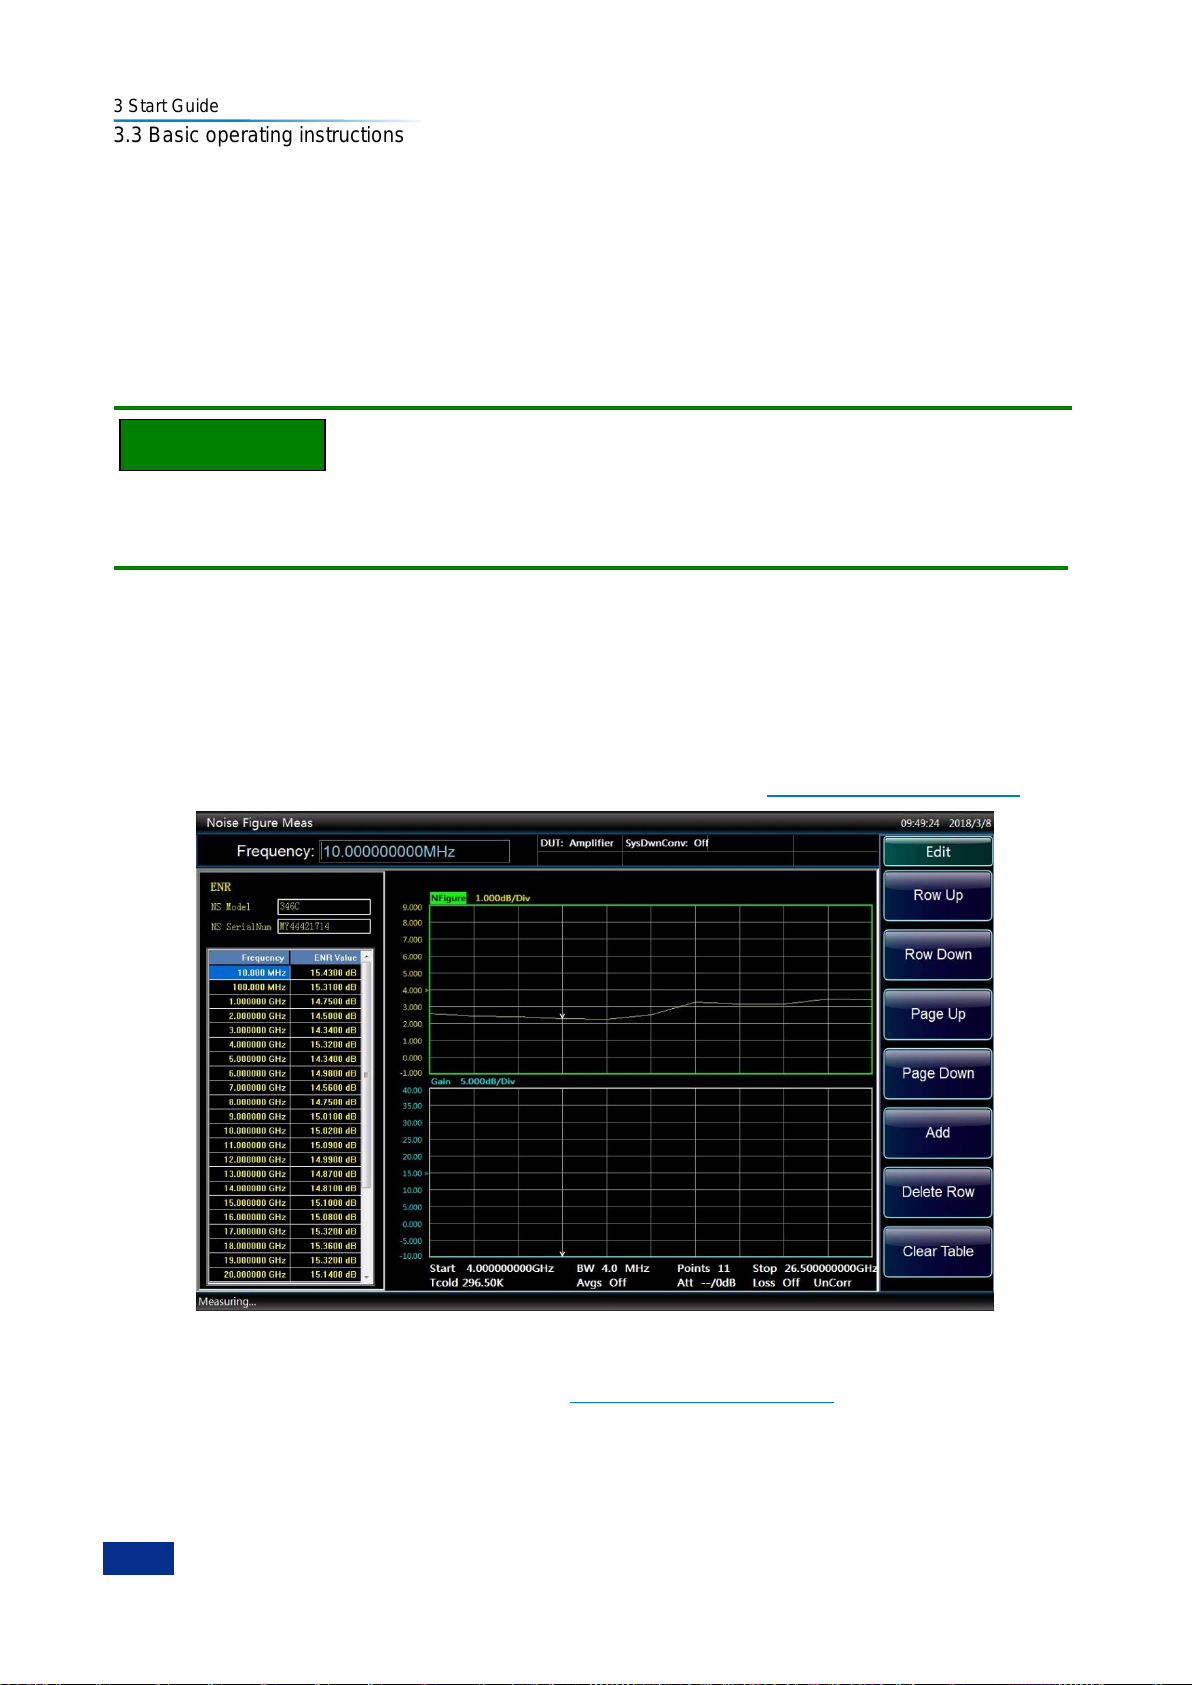
3 Start Guide
46
NOTE
3.3 Basic operating instructions
Step 3. Press the [Model ID] menu key and enter the noise source model using an external keyboard
and numeric keys.
Step 4. Press the [Serial] menu key and enter the noise source serial number using an external
keyboard and numeric keys.
Step 5. Press the [Edit] menu key. The table editing and navigation menu items now appear for
frequency point selection.
Step 6. Enter the frequency value in the table using the numeric keys, and finish it using the unit menu
keys.
To facilitate the manual entering of frequency/ENR data pair, if the frequency column is already set in
default ENR nominal frequency point order, you only need to press the【Enter】key to complete the
entering of default frequencies in the frequency column.
Step 7. After entering the frequency value, the highlight will automatically moves to the ENR value
column. Enter the corresponding ENR value using numeric keys, and finish it using [dB], [K], [C]
or [F] unit menu keys. The K, C or F entry is converted to dB appearing in the ENR table.
Step 8. After entering the ENR value, the highlight automatically moves to the next frequency point in
the frequency column for entering the next frequency/ENR pair in the ENR table.
Step 9. Repeat Step 6 and Step 7 until all needed frequency and ENR values are entered, as shown in
Fig. 3.26. For details on working with the ENR table, refer to ―3.3.4.5 Working with tables‖.
Fig. 3.26 Typical ENR table with entered data
Step 10. Once you have completed entering the ENR data, press the【File】key to save the ENR table.
For details of saving ENR files, refer to ―3.3.4 Perform file operations‖.
Page 59
3 Start Guide
47
NOTE
NOTE
3.3 Basic operating instructions
The data in the current ENR table still exists after the NFA is preset. You can insert a frequency/ENR pair
into the ENR Table entry in any order, as the NFA automatically sorts the frequency list into ascending
order. When results are needed at non-cardinal ENR data points, a linearly interpolated value is
automatically used at adjacent points.
3.3.5.3 Load ENR table from a disk
If the noise source to be used has its ENR data previously stored on a disk, you can load this ENR data
into NFA as follows.
Step 1. Press the【File】key.
Step 2. Press the [Load…] menu key.
Step 3. Select the file path where the ENR table file has been saved with mouse.
Step 4. Select the file type as Meas ENR Files (*.ENR) with mouse.
Step 5. Select the appropriate file name, and press the [Open (O)] button. For more details of loading
an ENR file, refer to ―3.3.4.2 Saving/loading files‖.
3.3.5.4 Saving an ENR table
You can save an ENR table to the NFA disk as follows:
Step 1. Press the【File】key.
Step 2. Press the [Save…] menu key. ―Save as‖ dialog box will appear.
Step 3. Select a location where you want to save the ENR table.
Step 4. Select the file type that you want to save the file in. There are two types, the Meas ENR Files (*.
ENR) and Cal ENR Files (*. ENR).
Step 5. Input the file name using the numeric keys of NFA, on-screen keyboard or an external
keyboard.
Step 6. Click the [Save] button to save the file. For more details of saving a file, refer to ―3.3.4.2
Saving/Loading files‖.
In the [Common Table On Off] mode, the file type, i.e., Meas ENR Files (*. ENR) or Cal ENR Files (*.
ENR), shall be specified when saving a file.Cal ENR Files(*.ENR). The saved ENR files can be loaded to
corresponding tables according to the files types (Meas ENR Files or Cal ENR Files) selected.
3.3.5.5 Input fixed ENR value
During the measurement in spot frequency mode, you can input a fixed ENR value corresponding to the
fixed frequency. The fixed ENR value can also be applied across the whole measurement frequency
range.
1) Input fixed ENR value
Step 1. Press the【ENR】key.
Step 2. Press the [ENR Mode] menu key, and select the [ENR Mode, Table Spot] mode.
Step 3. Press the [Spot ENR] menu key.
Step 4. Press the [Spot Mode] menu key, and select the [Spot Mode ENR Thot] mode.
Page 60
3 Start Guide
48
NOTE
3.3 Basic operating instructions
Step 5. Press the [Spot ENR], enter an ENR value using numeric keys, and finish it using unit menu
keys. The [dB], [K], [C] or [F] unit menu key can be used, the K , C or F entry is automatically
converted to appear in the ENR table as dB, and the default value is 15.200dB.
2) Enabling Spot ENR mode
Step 1. Press the【ENR】key.
Step 2. Press the [ENR Mode] menu key, and select the [ENR Mode, Table Spot] mode.
Step 3. Press the [Spot ENR] menu key.
Step 4. Press the [Spot Mode] menu key, and select the [Spot Mode ENR Thot] mode. This is the
default setting.
3.3.5.6 Input Spot THot
1) Input Spot THot
Step 1. Press the【ENR】key.
Step 2. Press the [ENR Mode] menu key, and select the [ENR Mode, Table Spot] mode.
Step 3. Press the [Spot ENR] menu key.
Step 4. Press the [Spot Mode] menu key, and select the [Spot Mode ENR THot] mode.
Step 5. Press the [Spot THot] menu key, input Spot THot using the numeric keys, and finish it using the
unit menu keys. The [K], [C] or [F] unit menu key can be used, the C or F entry is automatically
converted to appear as K, and the default value is 9892.80K.
2) Enabling Spot THot mode
Step 1. Press the【ENR】key.
Step 2. Press the [ENR Mode] menu key, and select the [ENR Mode, Table Spot] mode.
Step 3. Press the [Spot ENR] menu key.
Step 4. Press the [Spot Mode] menu key, and set the [Spot Mode ENR THot] mode.
3.3.5.7 Using Smart Noise Source
If there is a SNS connected to the NFA SNS DRIVE port, the 3986 series NFA, by default, selects the
SNS as its noise source. If an SNS is not connected, the NFA uses the normal noise source.
1) Selecting the noise source preference
If noise sources are connected to both ports, you need to select a preference either Normal or SNS. The
default setting is SNS.
2) Steps for selecting the noise source preference
Step 1. Press the【ENR】key.
Step 2. Press the [SNS Setup] menu key.
Step 3. Press the [Preference] menu key, and select SNS or Normal according to specific conditions.
3) Loading the SNS ENR data to the common table
You can enable the 3986 series NFA to automatically load the ENR data to the common table. To enable
Page 61
3 Start Guide
49
NOTE
NOTE
3.3 Basic operating instructions
the automatic loading after connecting a SNS, set the Auto Load ENR to On. If you do not want to
automatically load the ENR data to the common table from the SNS, set the Auto Load ENR to Off.
If you have selected [Auto Load ENR On Off], you can use the [Fill from SNS] menu key to load the ENR
data from the SNS. This menu key is active only when a SNS is connected.
Do not disconnect the SNS from the NFA port when the ENR data is being transferred, otherwise the
data stored in the SNS would be affected.
4) Loading the SNS ENR data to the Meas Table or Cal Table
Step 1. Press the【ENR】key.
Step 2. Press the [SNS Setup] menu key.
Step 3. Press the [Auto Load ENR] menu key, and set it to [Auto Load ENR On Off] mode.
Step 4. Press the [Common Table] menu key, and set it to [Common Table On Off] mode.
Step 5. Press the [Meas Table] or [Cal Table] menu key.
Step 6. Press the [Fill from SNS] menu key, and wait until all data is loaded.
When a SNS is connected and the [Auto Load ENR On Off] is enabled, the common table is set
automatically, and the SNS ENR data is loaded to the common table automatically. You can use the [Fill
from SNS] menu key to load the SNS ENR data manually. This allows you to select either the Meas
Table or the Cal Table as your loading destination.
3.3.5.8 Setting Tcold
During the measurements in different ambient temperature conditions, you can change Tcold. The
default value is 296.50K.
There are three methods to change the Tcold. This depends on the type of noise source you are using.
1) The first method is to enter a Tcold manually. It is applicable to either type of noise source.
2) The second method is applicable when you use a SNS. The NFA loads the Tcold from the SNS and
updates it periodically.
3) The third method is applicable when you use a SNS and you can set the value to be updated as you
need.
1) Changing the User Tcold manually
Step 1. Press the【ENR】key.
Step 2. Press the [Tcold] menu key.
Step 3. Press the [User Tcold] menu key.
Step 4. Enter the actual measured temperature value using numeric keys, and finish it using unit menu
keys.The [K], [C] or [F] unit menu key can be used. The C or F entry is converted to appear as
K.
When using a SNS, the SNS Tcold menu key must be set to [SNS Tcold On Off] for this function to work.
Page 62
3 Start Guide
50
NOTE
Attention
3.3 Basic operating instructions
The lower limit of the Tcold is 0K, the upper limit is 29,650,000K, and the default value is 296.50K The K
value is always displayed, and the C or F entry is automatically converted to appear as K.
2) Setting the SNS Tcold to update automatically
This function is available only when the 3986 series NFA is connected to a SNS.
Step 1. Press the【ENR】key.
Step 2. Press the [TCold] menu key.
Step 3. Press the [SNS Tcold] menu key, and set it to [SNS Tcold On Off]. This is the default setting.
3) Loading the Tcold from the SNS manually
This function is available only when the 3986 series NFA is connected to a SNS.
Step 1. Press the【ENR】key.
Step 2. Press the [TCold] menu key.
Step 3. Press the [SNS Tcold] menu key, and set it to [SNS Tcold On Off].
Step 4. Press the [User Tcold from SNS] menu key. The 3986 series NFA loads the Tcold from the SNS
and displays it in the User Tcold menu key.
When using a SNS, the SNS Tcold menu key must be set to [SNS Tcold On Off] for this function to work.
3.3.6 Set measurement frequencies
Before setting the measurement frequencies, you need to select a frequency mode. The 3986 series
NFA provides three frequency modes for selection:
1) Sweep --the measurement frequencies are obtained from the start and stop frequencies (or
equivalent center and span) and the number of measurement points.
2) Fixed --measure a fixed frequency.
3) List --the measurement frequencies are obtained from the frequency list entries.
3.3.6.1 Selecting sweeping frequency mode
In sweeping frequency mode, set the start and stop frequencies (or equivalent center and span
frequencies) and the number of measurement points. These measurement points are equally spaced
over the frequency span. The maximum number of points is 401, and the default number of points is 11.
Make a measurement over a frequency range as follows:
Step 1. Press the【Freq/Points】key.
Step 2. Press the [Freq Mode] and [Sweep] menu keys to set the frequency mode to Sweep. This is the
default setting.
Step 3. Press the [Start Freq] and [Stop Freq] respectively, enter the frequency values using the
numeric keypad, and finish it using unit menu keys.
Step 4. Press the [Points] menu key, enter the number of measurement points using numeric keys, and
press the【Enter】key or [OK] menu key to finish the input. You can also use【▲】and【▼】
arrow keys or rotate the knob to change the number of measurement points. One step varies
Page 63
3 Start Guide
51
NOTE
3.3 Basic operating instructions
the number by +/-1.
Step 3 and Step 4 can be substituted by the following:
Step 5. Or, press the [Center Freq], [More 1/2] and [Span]. Enter the center frequency and span values
using the numeric keypad, and finish it using unit menu keys.
Step 6. Press the [More 2/2].
Step 7. Press the [Points] menu key.
Step 8. Enter the number of measurement points using numeric keys, and press the【Enter】key or
[OK] menu key to finish the input. You can also use【▲】and【▼】arrow keys or rotate the knob
to change the number of measurement points. One step varies the number by +/-1.
3.3.6.2 Selecting fixed frequency mode
The fixed frequency mode is used when you want to make a measurement at a single frequency. Make a
measurement at a single frequency as follows:
Step 1. Press the【Freq/Points】key.
Step 2. Press the [Freq Mode] and [Fixed] menu key.
Step 3. Press the [Fixed Freq] menu key, and enter the frequency value using numeric keys and unit
menu keys.
3.3.6.3 Selecting list frequency mode
The list frequency mode is used to make a measurement at frequency points of interest. Set the NFA to
the list frequency mode as follows:
Step 1. Press the【Freq/Points】key.
Step 2. Press the [Freq Mode] menu key.
Step 3 Press the [List] menu key to set the frequency mode to List.
Create a frequency list as follows:
1) Specify each frequency point manually.
2) Create a frequency list according to the sweep points.
1) Creating a frequency list manually
Step 1. Follow the above steps to set the frequency mode to List.
Step 2. Press the [More 1/2], and press the [Freq List] menu key. An empty frequency list appears on
the display with the first point activated, as shown in Fig. 3.27.
Step 3. Enter the frequency value using numeric keys, and finish it using unit menu keys.
Step 4. The highlight will move to the next entry of the Edit dialog box automatically. Enter the
frequency value using the numeric keys, and finish it using the unit menu keys. You can also
use the [Row up], [Row down], [Add] or [Delete Row] menu key to do corresponding editing.
Step 5. Repeat Step 4 until your frequency list is completed. The frequency list with data entry is shown
in Fig. 3.28.
No matter which order is followed when you enter frequency values the 3986 series NFA continually
sorts the values into ascending order.
Page 64
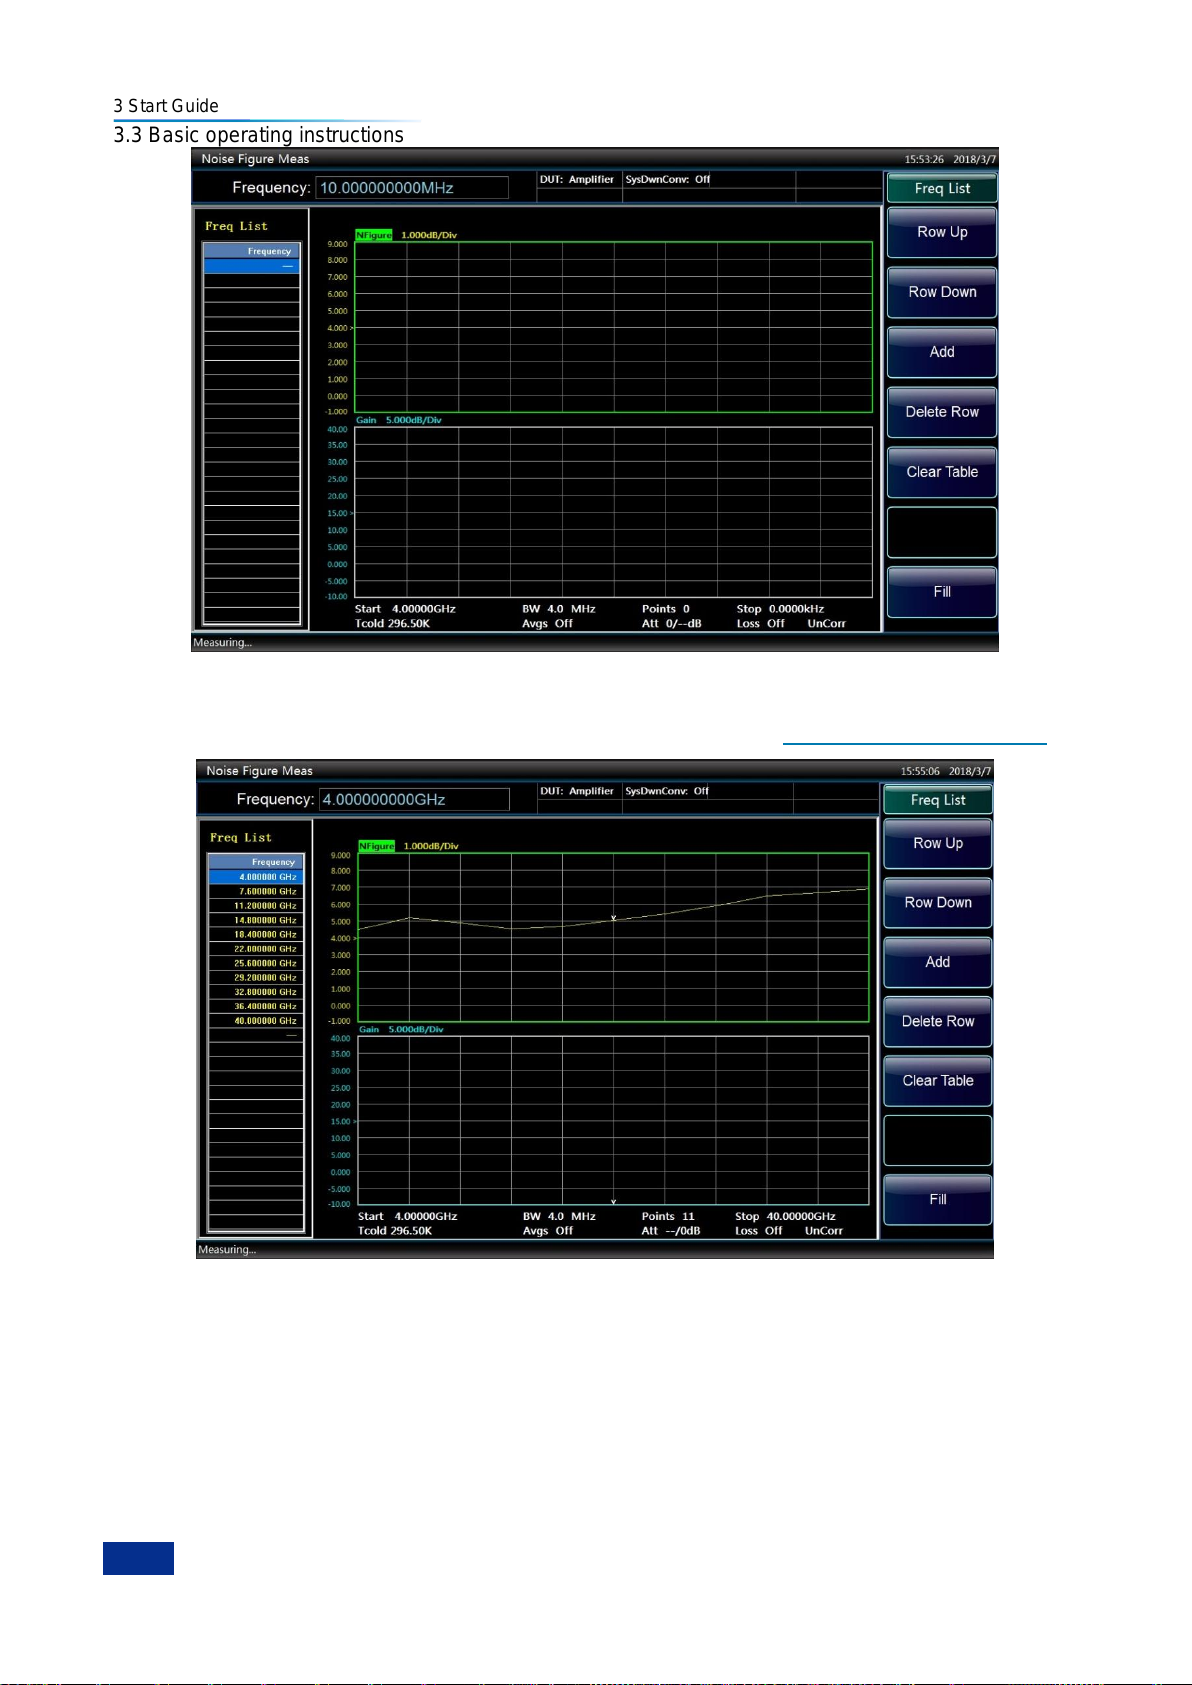
3 Start Guide
52
3.3 Basic operating instructions
Fig.3.27 An empty frequency list
Step 6. As you need, use the【File】key and [Save…] menu key to save the edited frequency list to the
disk of the 3986 series NFA. For details of saving files, refer to―3.3.4 Perform file operations‖.
Fig. 3.28 Typical frequency list with entered data
2) Creating a frequency list according to the sweep points
You can create a frequency list according to the frequency range and number of points set in the sweep
mode.
Step 1. Follow the above steps to set the frequency mode to List.
Step 2. Press the [More 1/2].
Step 3. Press the [Freq List].
Page 65
3 Start Guide
53
3.3 Basic operating instructions
Step 4. Press the [Fill]. This clears the current frequency list and fills the list with frequencies generated
by the sweep frequency mode.
3.3.7 Set bandwidth and average
3.3.7.1 Effect of the bandwidth and average on speed, jitter and measurement accuracy
Jitter is a natural occurrence when measuring random noise. To reduce jitter, you must increase the
number of averages or increase the measurement bandwidth. If the bandwidth is reduced, you need to
increase the number of averages to reduce jitter.The greater the number of averages set, the more
accurate the measurement, as this reduces the jitter on measurement. However, this will also lead to
slow measuring speed.Therefore, there is a trade-off between the measuring speed and accuracy.
3.3.7.2 Setting the bandwidth
The default bandwidth is 4MHz. Set the bandwidth as follows:
Step 1. Press the【BW】key.
Step 2. Press the [BW] menu key to set it to Manual mode, enter the bandwidth value using the
numeric keypad, and finish the input using unit menu keys. You can also use the【▲】and【▼】
arrow keys or rotate the knob to change the bandwidth value. The 3986 series NFA provides 6
bandwidths for step change, which are 4MHz, 2MHz, 1MHz, 400kHz, 200kHz and 100kHz.
3.3.7.3 Setting average
Increased number of averages reduces jitter and provides more accurate measurement result. However,
the measurement speed is sacrificed. The maximum number of averages is 512, and the default value is
1, equivalent to setting the average to Off.
Set the number of averages as follows:
Step 1. Press the【Avg】key.
Step 2. Press the [Average] menu key to set the average mode to On. The default setting is Off.
Step 3. Enter the number of averages using the numeric keypad, and finish it with the【Enter】key or
OK] menu key. You can also use【▲】and【▼】arrow keys or the knob to change the number
of averages. One step varies the number by +/-1.
3.3.8 Calibrate Noise Figure Analyzer
To compensate for the noise contribution of the NFA, the associated cabling and so forth in the
measurement path, a calibration is necessary. The calibration measures the NFA‘s noise contribution
with no DUT (device under test) in place. The correction is then applied to the measurement with the
DUT in place. This correction is often referred to as the second stage calibration. To perform calibration,
you need to enter the ENR values and set up the frequency range, measurement points, bandwidth,
average and so on.
1) Interpolated results
You obtain interpolated results from the NFA whenever you change certain measurement results, for
example, changing the number of measurement points, or reducing the measurement frequency range.
2) Correction mark
Whenever any of the NFA changes invalidates the current calibration, the annotation Corr at the bottom
right corner of the display is switched to Uncorr. Fig. 3.29 shows this mark.
Page 66
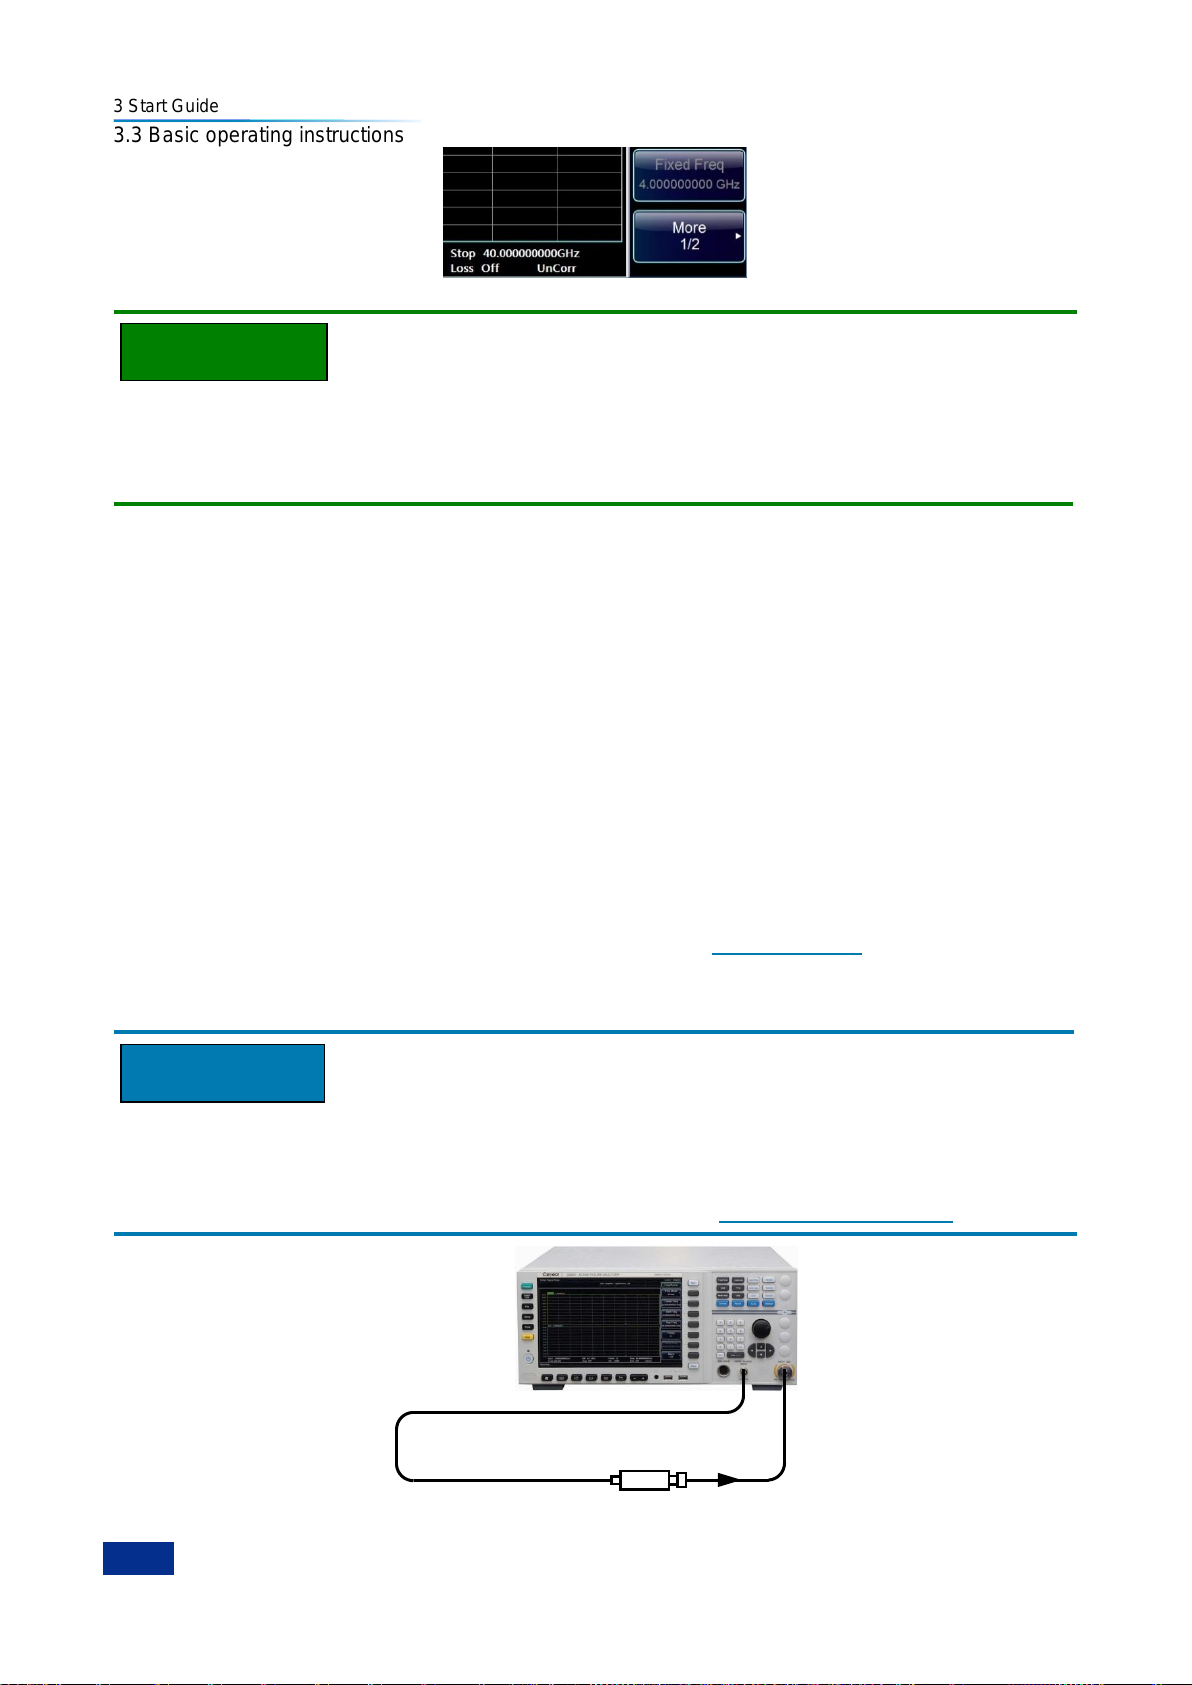
3 Start Guide
54
Noise source
NOTE
Attention
3.3 Basic operating instructions
Fig. 3.29 Corr/UnCorr mark
If you change the frequency range to the value greater than the current calibration range, the NFA state
is switched to UnCorr automatically; If you change the frequency range to the value less than the current
calibration range, or if you change the measurement points, the corrected state of NFA maintains,
however, a prompt ―User cal interpolated‖ appears.
You must calibrate the NFA whenever:
1) You restart the instrument.
2) You preset the NFA.
3) You select a measurement frequency or frequency range outside the currently calibrated range.
4) You change the fixed IF frequency in the fixed IF frequency mode.
5) You change the frequency mode.
6) You change the measurement mode.
7) There is a large temperature variation since the last calibration.
8) The calibrated input attenuator ranges cannot satisfy your measurement requirement, for example,
measuring a large-gain DUT.
3.3.8.1 Performing a calibration
Step 1. Verify that the correct ENR table is loaded in the NFA, or the ENR values of the noise source are
entered into the NFA. For more details, please refer to ―3.3.5 Input ENR‖.
Step 2. Configure the measurement mode, frequency range, number of points, number of averages, etc.
Step 3. Connect the noise source output directly to the NFA input, as shown in Fig. 3.30.
You may need to use connector adapters to connect the noise source output to the NFA input during
calibration. The connectors you use need to be included in the measurement. If you remove the
connectors from the measurement you need to apply loss compensation to compensate for any loss
caused by the removal of connectors. For details, please refer to―4.2.6 Loss compensation‖.
Fig. 3.30 Calibration connection
Page 67
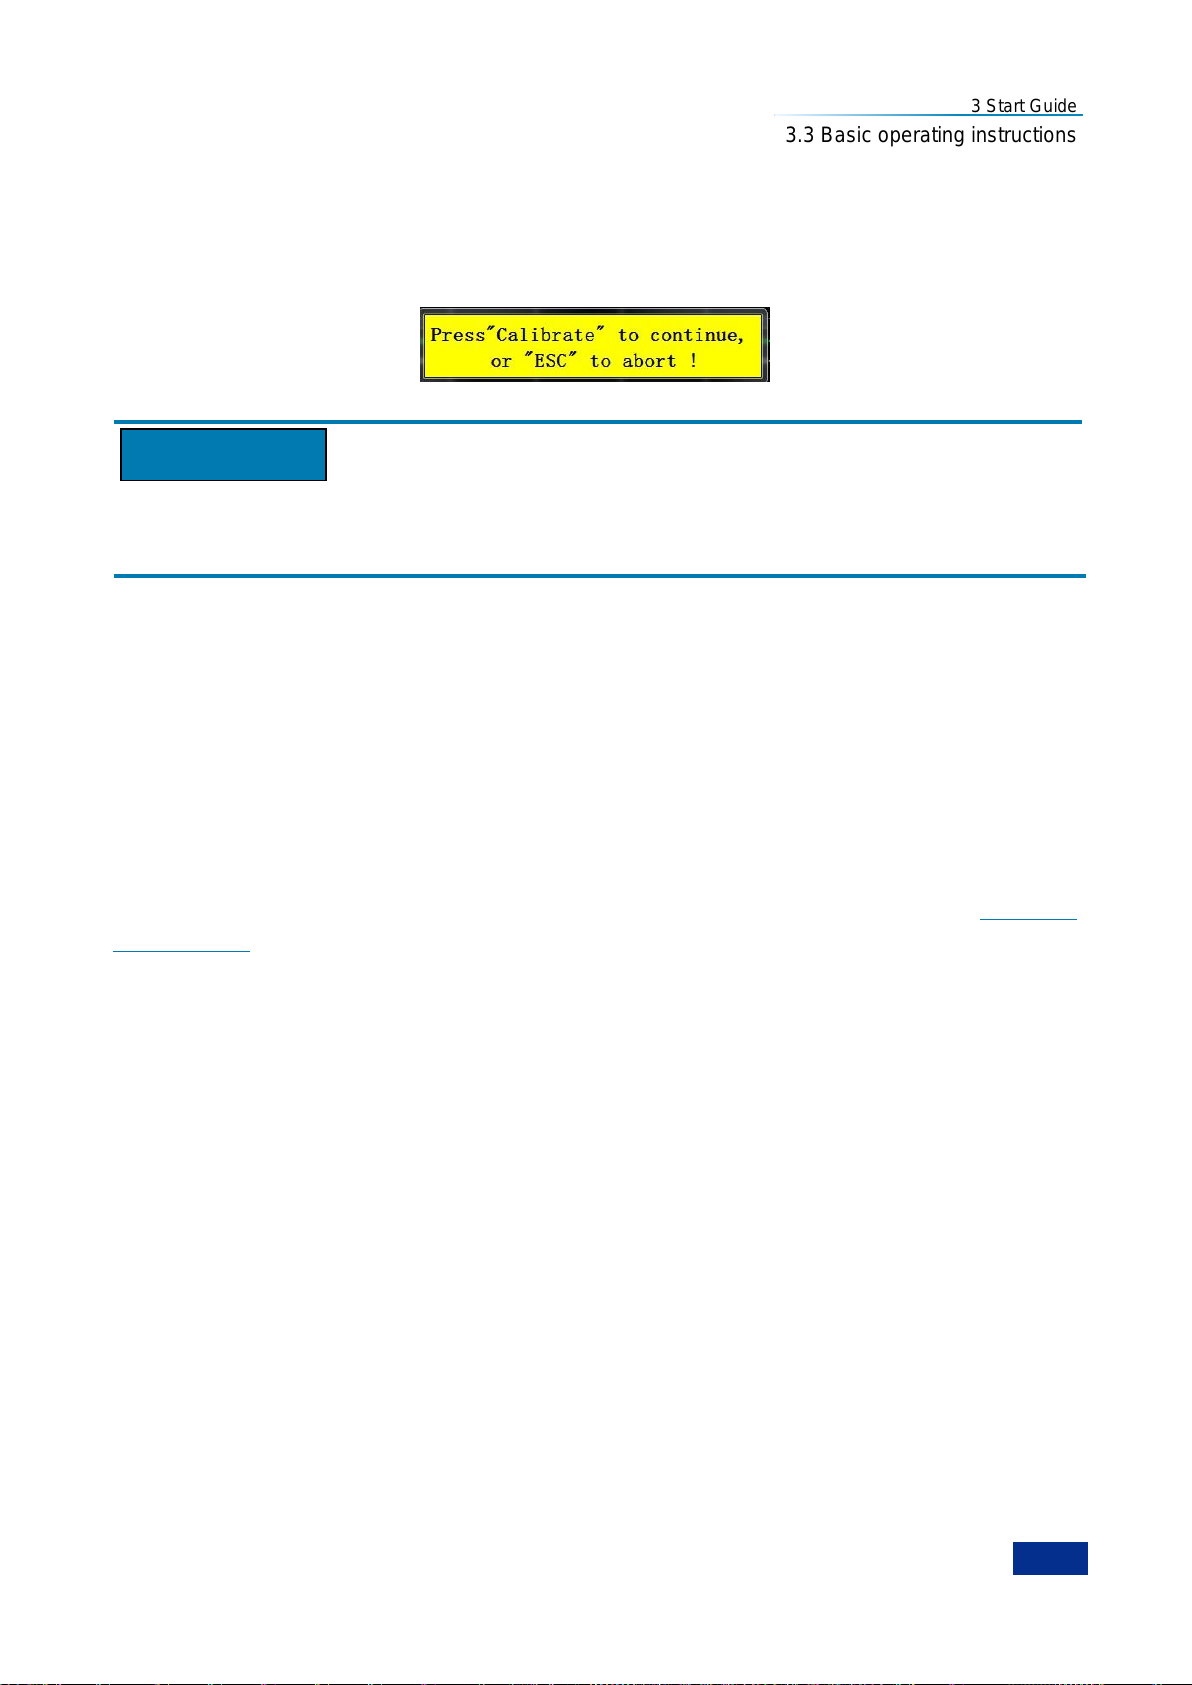
3 Start Guide
55
Attention
3.3 Basic operating instructions
Step 4. If it is required to select an input attenuator range, press the【Corr】key to set the RF/μW Min
Cal Att and RF/μW Max Cal Att.
Step 5. Press the【Calibrate】key to enter the Calibrate menu.
Step 6. Press [Calibrate] menu key twice to calibrate. The first time you press the menu key you are
prompted to press it again. A message prompts as shown in Fig. 3.31:
Fig. 3.31 Calibration prompt
This two-stroke key press feature prevents you from accidentally pressing the [Calibrate] menu key and
erasing the calibration data. The purpose of calibration is to correct the second stage noise of NFA itself.
After the calibration is finished, the Uncorr display at the bottom right corner changes to Corr display.
3.3.8.2 Selecting RF calibration attenuation range
When working in the RF frequency range of 10MHz to 4GHz, the 3986 series NFA has a default input
attenuation range for calibration of 0dB to 20dB. The step value is 5dB. In the default mode, the
calibration takes 5 sweeps as 5 attenuator ranges need to be calibrated. The greater the attenuator
range selected, the greater the number of calibration sweeps there are, hence, the longer the calibration
routine.
When measuring a high-gain device, you may need to increase the input attenuation. If you do not know
the gain of the DUT, you can perform calibration using the default range.
If the gain is too large, there is a need to add an external attenuator to the DUT and correct for the
attenuation using the loss compensation function. For details of this function, please refer to―4.2.6 Loss
compensation ‖.
Select the RF calibration attenuation range as follows:
Step 1. Press the【Corr】key to enter the Corr/Att setup menu.
Step 2. Press the [RF Min Cal Att] menu key, enter the attenuation value using numeric keys, and finish
it using unit menu keys. You can also use【▲】and【▼】arrow keys or the knob to change the
attenuation value. One step changes the value by +/-5dB.
Step 3. Press the [RF Max Cal Att] menu key, enter the attenuation value using numeric keys, and
finish it using unit menu keys. You can also use【▲】and【▼】arrow keys or the knob to change
the attenuation value. One step changes the value by +/-5dB.
3.3.8.3 Selecting Microwave calibration attenuation range
When working in the microwave frequency range of 4GHz to 18/26.5/40/50GHz, the 3986 series NFA
has a default input attenuation for calibration of 10dB. You can set the microwave attenuation range
manually, and the calibration is performed according to the attenuation range set. Unlike the RF
attenuators, however, the microwave attenuators cannot autorange after calibration. Therefore, if the NF
and gain of the DUT is too large, you need to change the microwave attenuation range manually. In most
cases, 0dB attenuation is appropriate. The maximum microwave input power and measurement range of
DUT are shown in Table 3.13.
Page 68
3 Start Guide
56
Attenuation
Maximum input power
Approximate measurement range
0dB
-35dBm
Combined NF and gain of DUT<35dB
5dB
-30dBm
Combined NF and gain of DUT<40dB
10dB
-25dBm
Combined NF and gain of DUT<40dB
NOTE
3.3 Basic operating instructions
Table 3.13 Maximum microwave input power and measurement range of DUT
The measurement ranges given in Table 3.13 are obtained when the ENR of the noise source is
assumed as 6dB and the operating bandwidth of the DUT is 5GHz. If the ENR of the noise source used
is larger or the DUT bandwidth is wider, the target measurement range would decrease.
Select the microwave input attenuation range as follows:
Step 1. Press the【Corr】key to enter the Corr/Att setup menu.
Step 2. Press the [μW Min Cal Att], enter the attenuation value using numeric keys, and finish it using
unit menu keys. You can also use 【▲】and【▼】arrow keys or the knob to change the
attenuation value. One step changes the value by +/-5dB.
Step 3. Press the [μW Max Cal Att], enter the attenuation value using numeric keys, and finish it using
unit menu keys. You can also use 【▲】and【▼】arrow keys or the knob to change the
attenuation value. One step changes the value by +/-5dB.
3.3.8.4 Setting the microwave input attenuation before measurement
The microwave attenuators cannot autorange according to the gain and NF of the DUT. Hence, when
making a microwave measurement, you must manually set the microwave input attenuation to prevent
the output power of the DUT from exceeding the maximum permissible input power of the NFA.
Set the microwave input attenuation before measurement as follows:
Step 1. Press the【Sweep】key.
Step 2. Press the [Manual Meas] menu key.
Step 3. Press the [Att Setup].
Step 4. Press the [μW Att] menu key to set it to the Fixed mode.
Step 5. Press the [μW Att] menu key and select the attenuation value you want.
If you want to set the RF input attenuation, the above procedure for setting the microwave input
attenuation applies, except that you need to set the RF attenuation to [RF Att Auto Fixed] mode and
select the appropriate RF attenuation value in Step 4 and Step 5.
3.3.9 Display measurement result
The following display format are available:
1) Graph, Table or Meter mode
2) Single or dual-graph display allowing any two available result displayed simultaneously
3) Combine option to display two result on the same graph
4) Switch the marker indicating the trace value on and off
5) Switch the graticule on or off
6) Switch display annotation on or off
Page 69
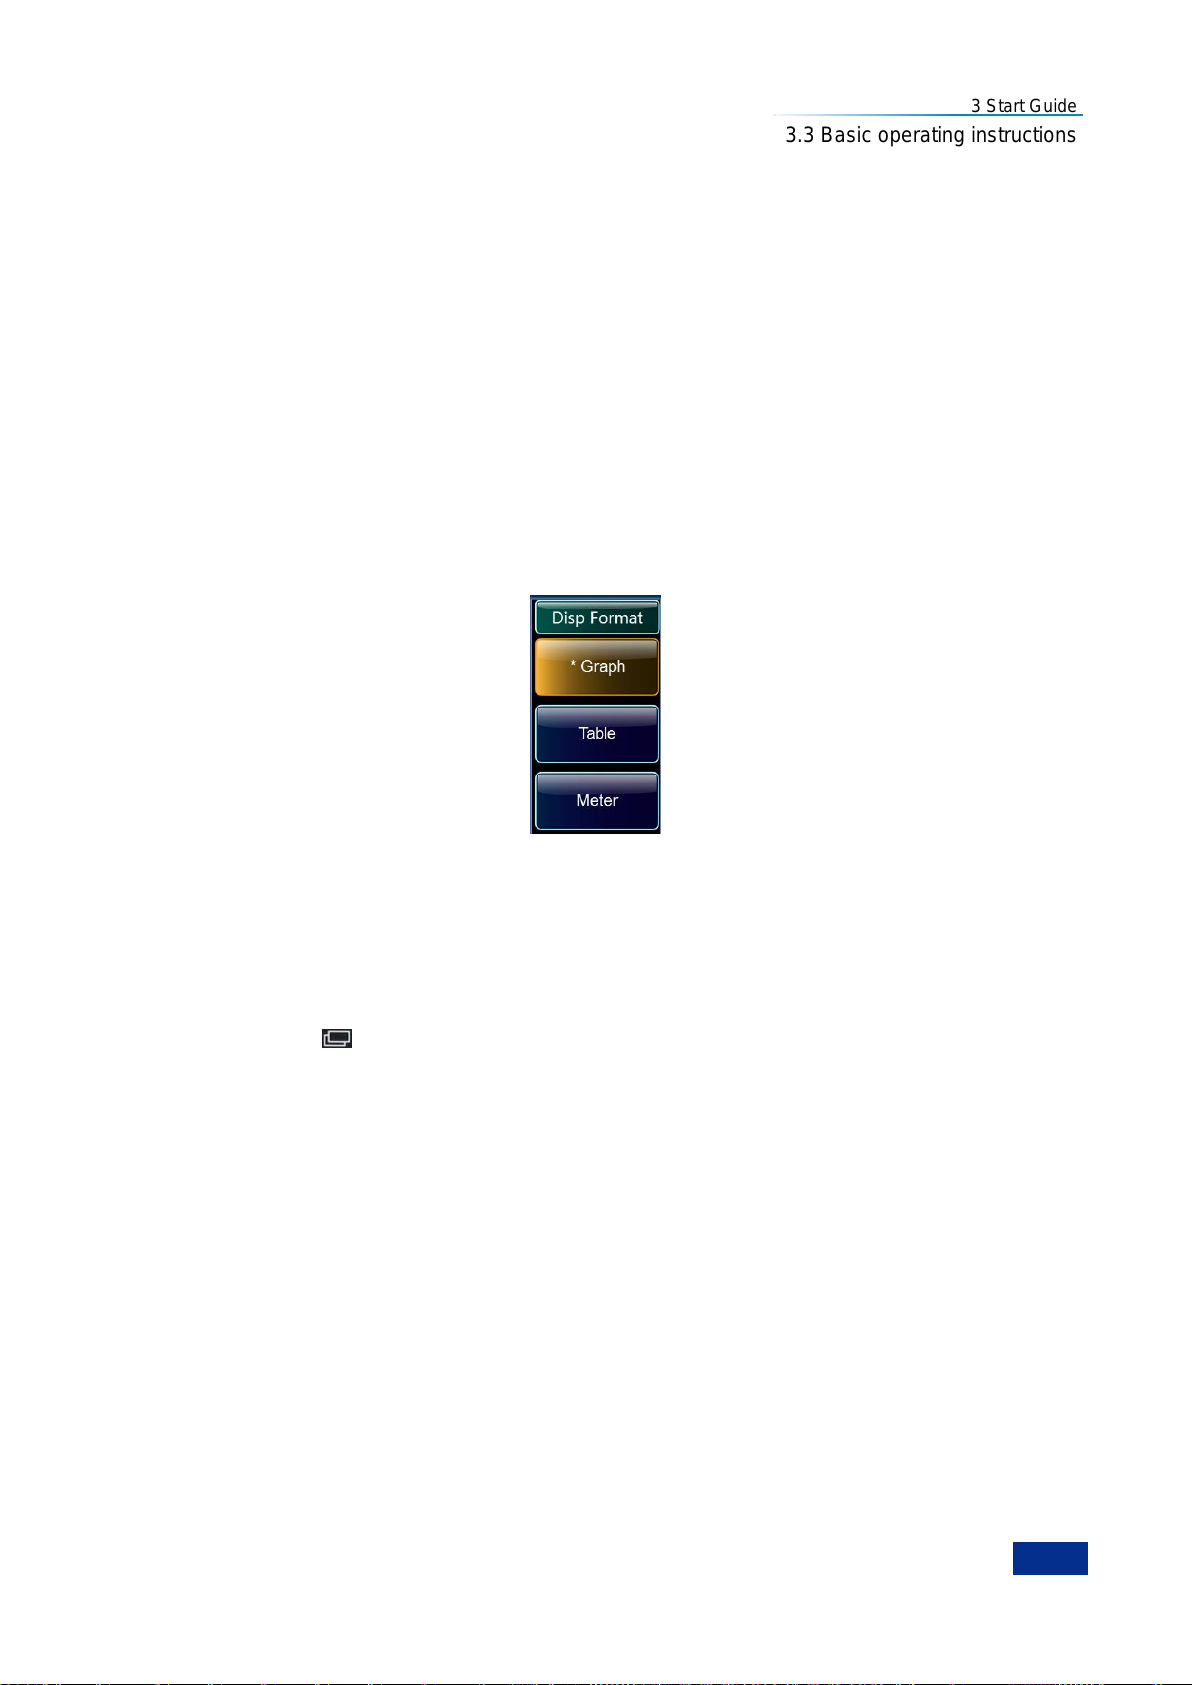
3 Start Guide
57
3.3 Basic operating instructions
3.3.9.1 Selecting the display format
You can display the measurement result in:
1) Graph
2) Table
3) Meter
The dual-graph display is the default setting. The upper graph is the measurement trace of noise figure
and the lower graph is the measurement trace of gain. In the Graph format and Meter format, you can
choose to display two results. In the Table format, at most 6 results can be displayed.
1) Set the display format as follows:
Step 1. Press the【Format】key.
Step 2. Press the [Display Format] menu key to access the display format menu.
Step 3. Press the [Graph] menu key to select the Graph format. This is the default setting.
Press the [Table] or [Meter] menu key to select the display mode you want, as shown in Fig. 3.32.
Fig. 3.32 Display format menu
2) Changing the active trace
In the graph mode, the active graph is highlighted by a green bolder, and the result title of the active
graph is highlighted in green background.
There are two methods to change the active trace:
Method 1: Press the【 】key at the bottom of the screen.
Method 2: Press the【Result】key and press the [Result-Trc 1] or [Result-Trc 2] menu key to enable the
trace you want.
3.3.9.2 Selecting the result types to display
The measurement results are as follows and shown in Fig. 3.33, with their units in parenthesis for
selection:
1) Noise figure (dB or linear)
2) Gain (dB or linear)
3) Y-Factor (dB or linear)
4) Teffective (Kelvin, K; Celsius, C; Fahrenheit, F)
5) PHot (dB or linear)
6) PCold (dB or linear)
Specify which result to display as follows:
Step 1. Press the【Result】key to access the trace result selection menu.
Page 70
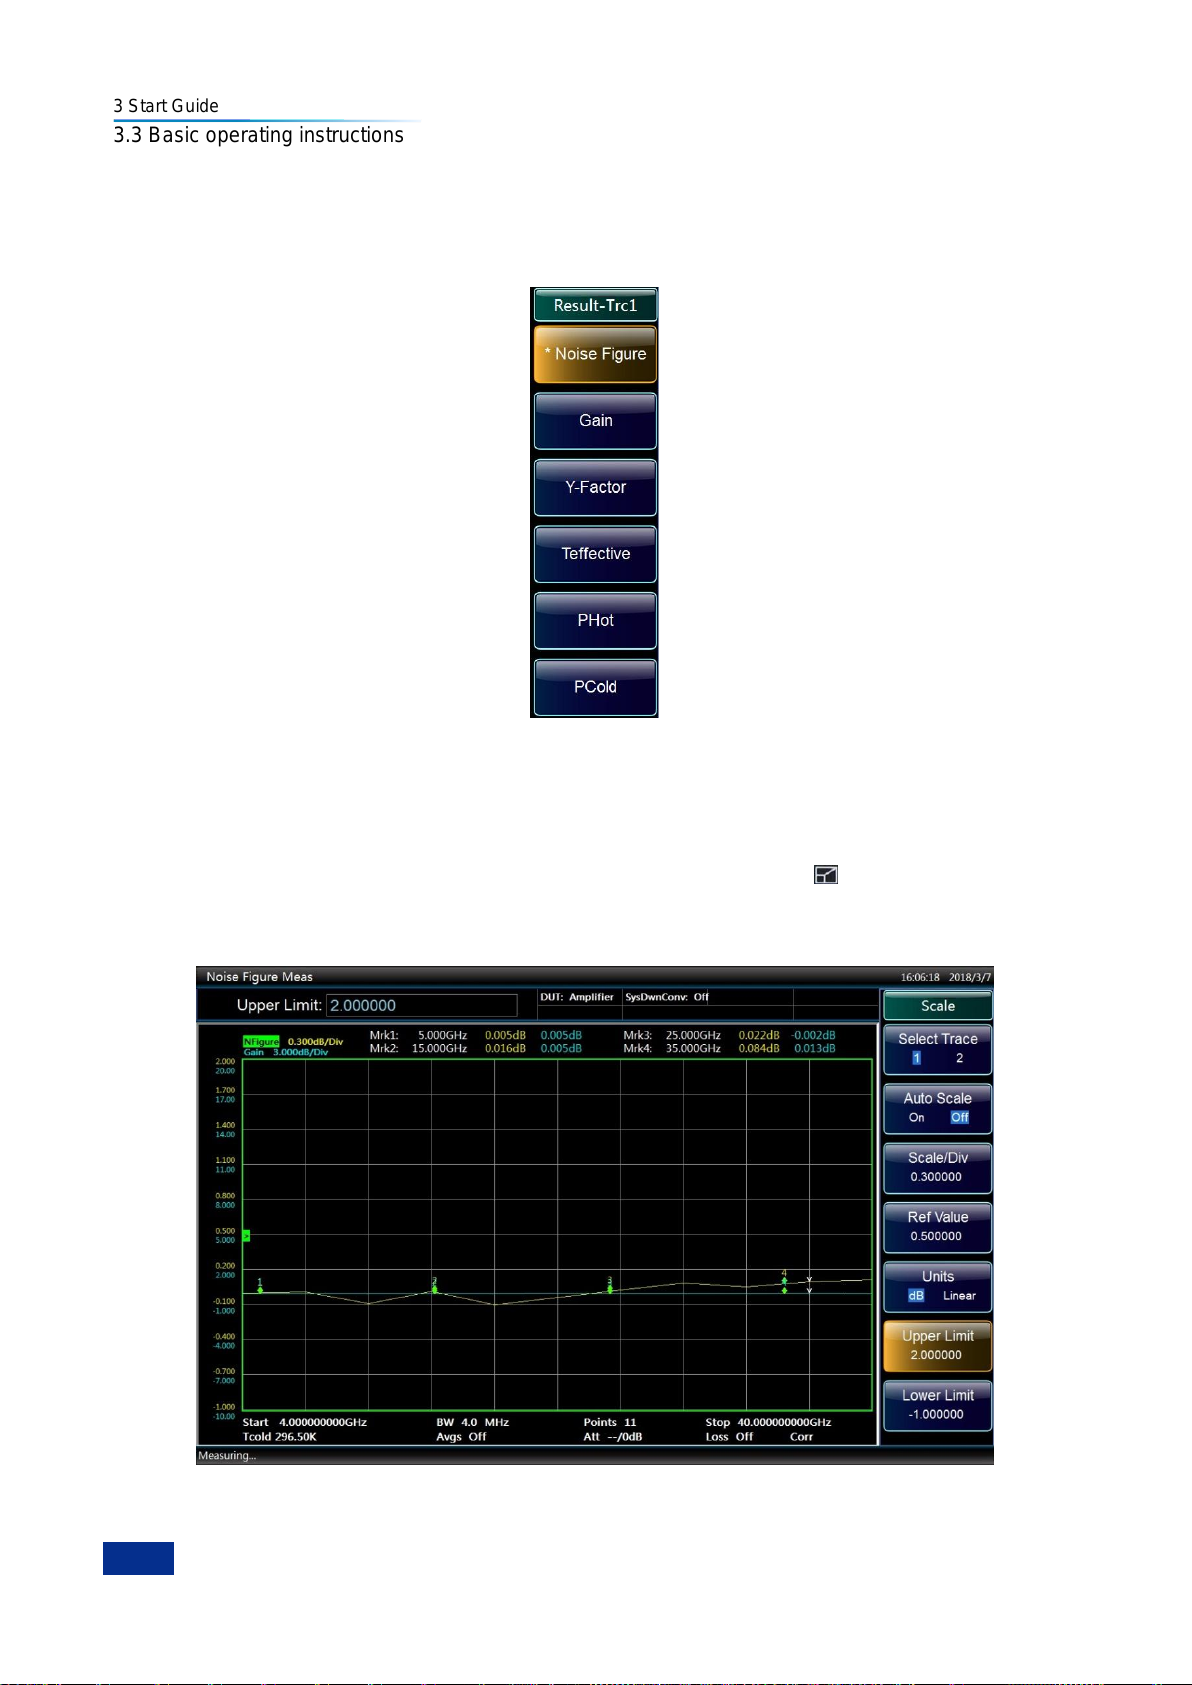
3 Start Guide
58
3.3 Basic operating instructions
Step 2. Press the [Result-Trc 1] or [Result-Trc 2] menu key to select the corresponding trace to
display the result .
Step 3. Press the [Noise figure], [Gain], [Y-Factor], [Teffective], [PHot] or [PCold] menu key to
select the result you want to display.
Fig. 3.33 Measurement result menu
3.3.9.3 Setting graph displaying in graph format mode
1) Changing the display between single graph and dual graph
In graph format mode, the default setting is dual graph. You can press the【 】key at the bottom of the
screen and then the active graph fills the screen as a single graph, as shown in Fig. 3.34. Pressing the
key again returns the single-graph display to dual graph display.
Fig. 3.34 Typical single graph display
Page 71
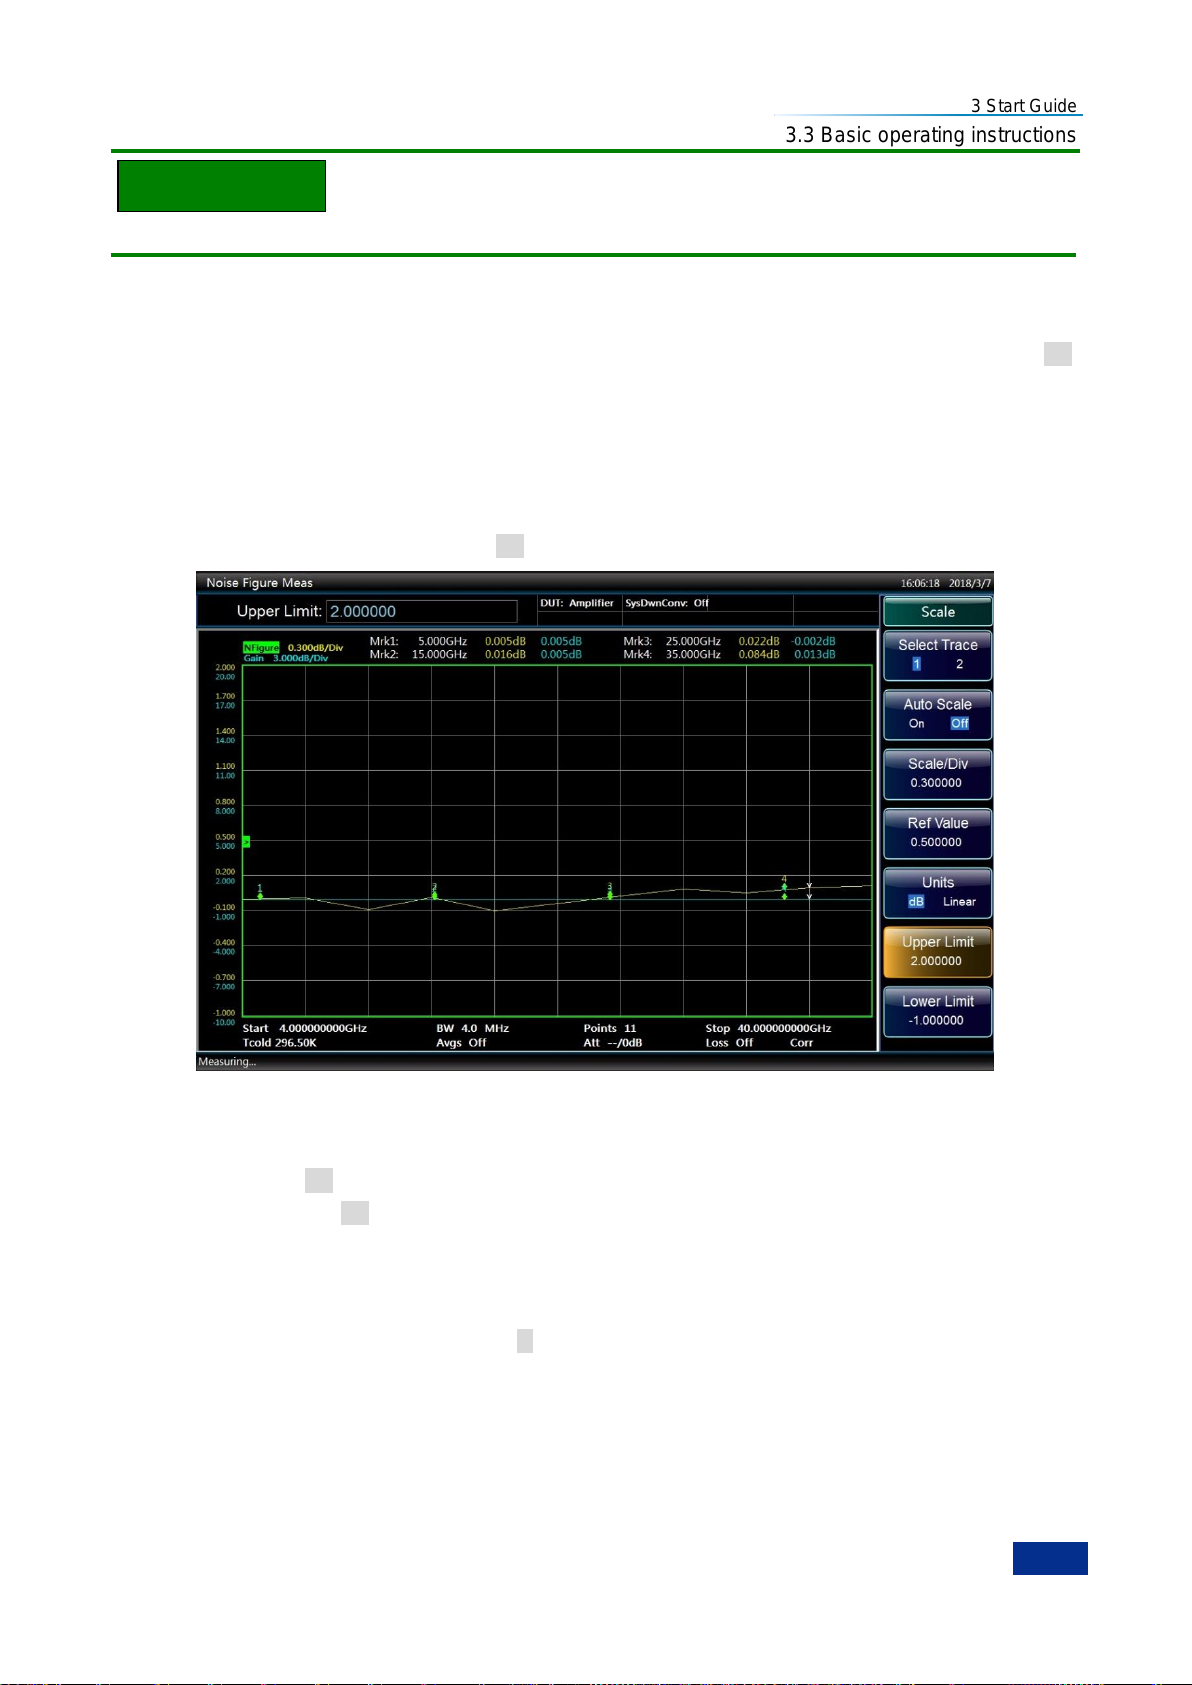
3 Start Guide
59
NOTE
3.3 Basic operating instructions
When in single graph mode, pressing the Next Trace key displays the other single graph.
2) Combining two graphs on the same graph
You can combine the upper and lower graphs from a dual-graph display into a combined single graph.
The title of the active trace is highlighted in green background. The default setting is [Combined On Off]
and the two trace graphs are not combined. Combine the two trace graphs as follows:
Step 1. Press the【Format】key.
Step 2. Press the [Display Format] and [Graph] menu keys to select the graph format. This is the default
setting.
Step 3. Press the [Combined] menu key to turn the Combined switch on, as shown in Fig. 3.35. The
default setting is [Combined On Off].
Fig. 3.35 Typical display with two traces combined on the same graph
3) Switching the graticule on or off
When the [Graticule On Off] is set, the graticules are displayed on the screen. This is the default setting.
When the [Graticule On Off] is set, the graticules are not displayed on the screen. Turn the graticule on
or off as follows:
Step 1. Press the【Format】key to access the format control menu.
Step 2. Press the [Graticule] menu key to turn the graticule on or off. The graph with graticule off is
shown in Fig. 3.36. The [Graticule On Off] mode is the default setting.
Page 72
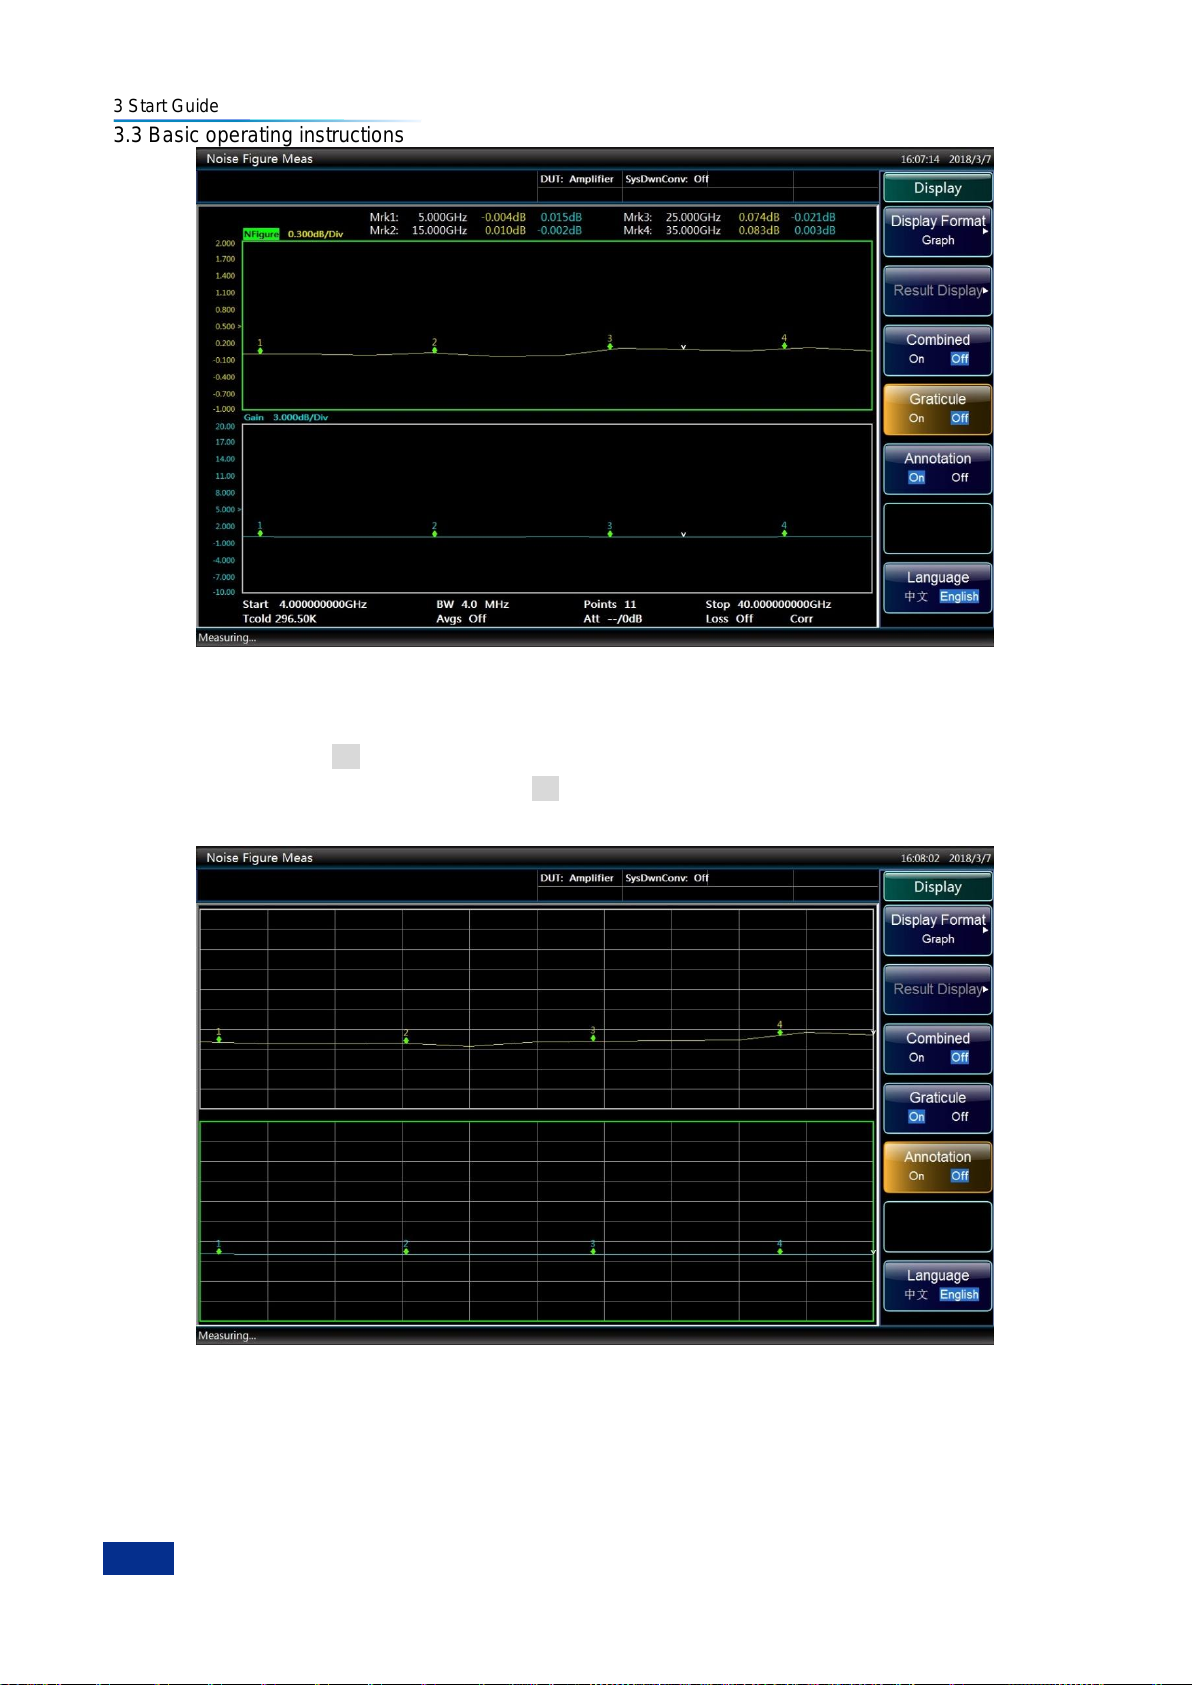
3 Start Guide
60
3.3 Basic operating instructions
Fig. 3.36 Typical graph display with graticule switched off
4) Switch display annotation on or off
When the [Annotation On Off] is set, measurement settings and markers are displayed. This is the
default setting. When the [Annotation On Off] is set, measurement settings and markers are not
displayed, as shown in Fig. 3.37.
Fig. 3.37 Typical graph display with annotation switched off
Turn the annotation on or off as follows:
Step 1. Press the【Format】key to access the format control menu.
Step 2. Press the [Annotation] menu key to select displaying the measurement settings or not.
Page 73
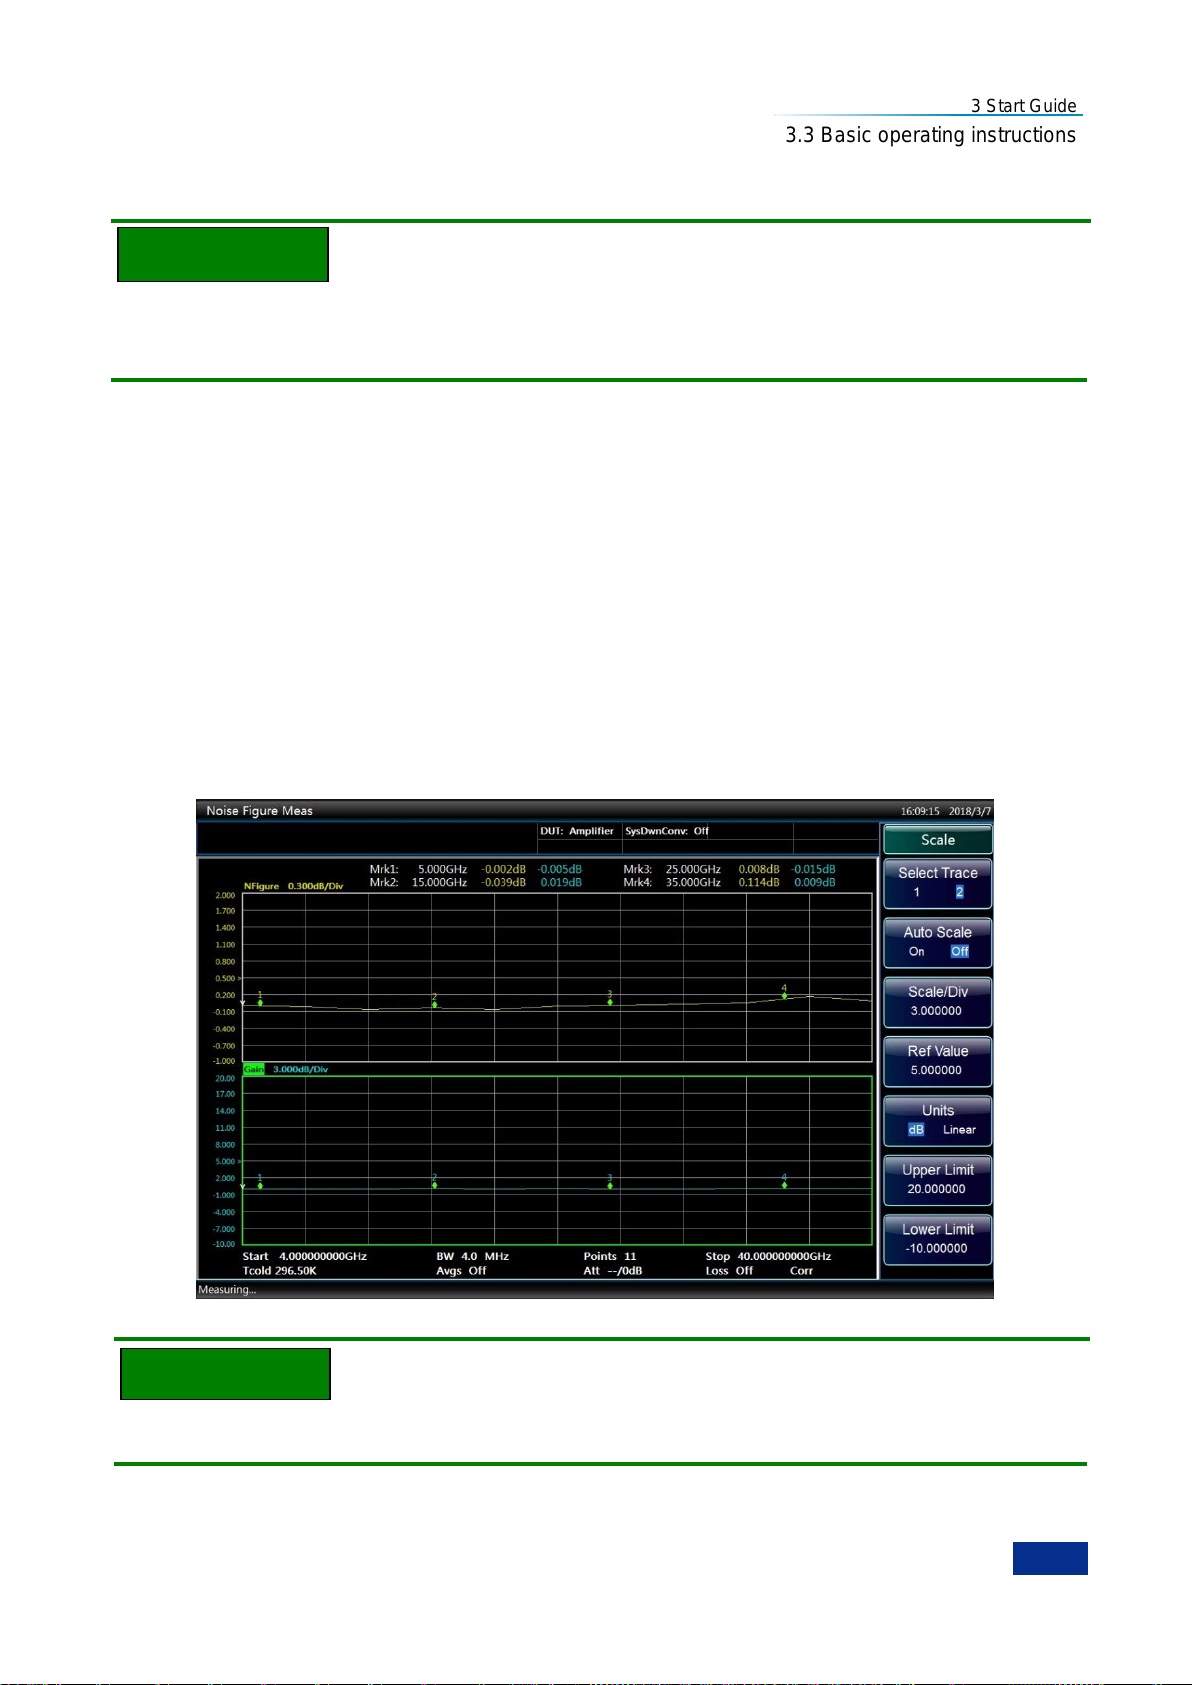
3 Start Guide
61
NOTE
NOTE
3.3 Basic operating instructions
3.3.9.4 Setting the scaling
You can set the result‘s scale results in the active trace graph to view the result better.
Enable the Autoscale function. The NFA will automatically set the upper limit, lower limit and
scale/division to optimize the trace display, with the trace displayed in approximately 80% area of the
window.
1) Setting the scale to display the trace
Select the active trace and set the scale results as follows:
Step 1. Press the【Scale】key.
Step 2. Press the [Trace] menu key to select the active trace of which the scale you want to set. A
typical noise figure display in graph format is shown in Fig. 3.38.
Step 3. Press the [Units] menu key to select either dB or linear unit.
Step 4. Press the [Upper Limit] menu key, enter the upper limit value using numeric keys, and finish it
by pressing the [OK] menu key.
Step 5. Press the [Lower Limit] menu key, enter the lower limit value using numeric keys, and finish it
by pressing the [OK] menu key.
Step 6. Press the [Scale/Div] menu key, enter the scale per division value using numeric keys, and
finish it by pressing the [OK] menu key.
Fig. 3.38 Typical noise figure displayed on a graph
The [Upper Limit], [Lower limit] and [Scale/Div] settings are coupled, therefore changing one of these
may affect the others.
Page 74
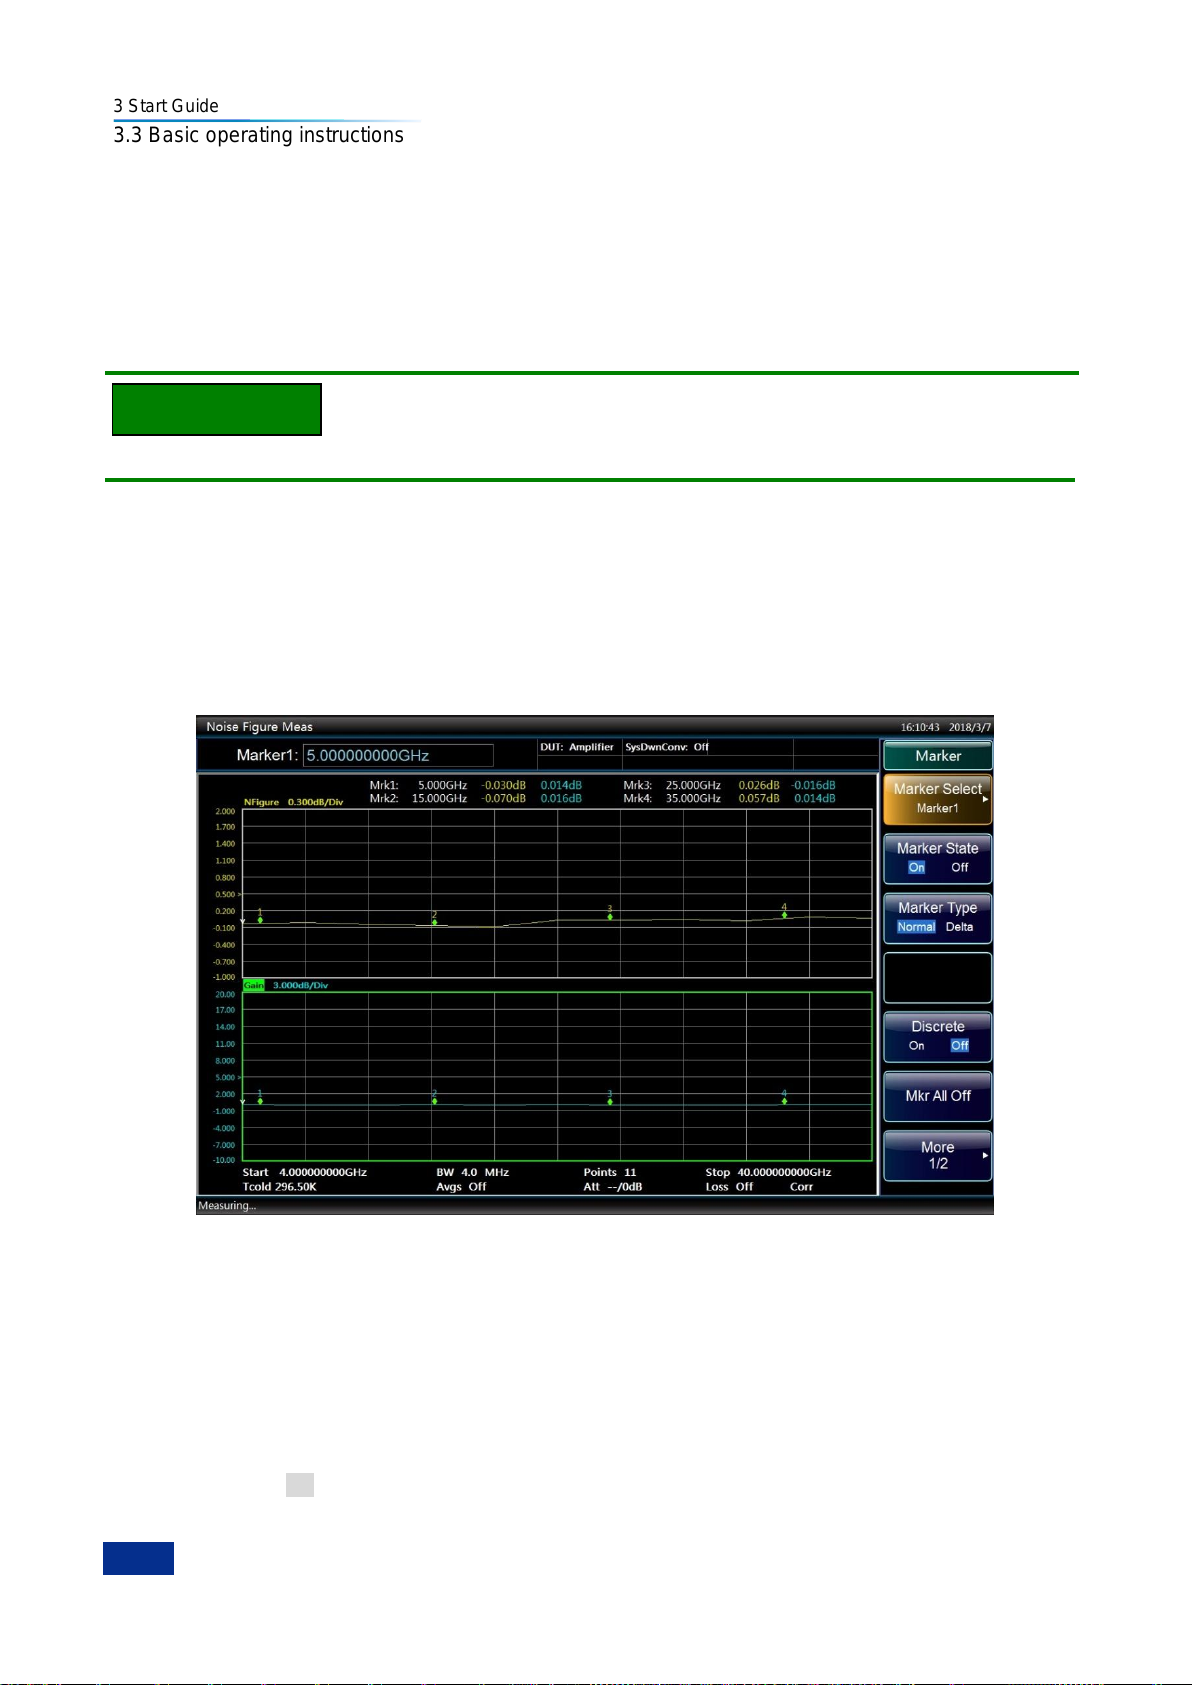
3 Start Guide
62
NOTE
3.3 Basic operating instructions
2) Setting the reference level
Step 1. Press the【Scale】key to access the scale setting menu. Some of these settings are only
effective in graph format mode.
Step 2. Press the [Ref Value] menu key, enter the value using numeric keys, and finish it using the [OK]
menu key.
3.3.9.5 Working with markers
The marker functions only apply in graph format mode.
Marker functions the measure frequency and measurement result by placing a diamond-shaped marker
at a point on the trace. The measurement result displayed depends on the result type selected.
The NFA has 4 markers, Marker 1, Marker 2, Marker 3 and Marker 4. The markers are coupled to both
the upper trace and lower trace.
Each marker can be enabled as a normal or delta marker. The active marker‘s frequency is displayed in
the active function area. The enabled marker‘s results are displayed in the annotation above the upper
graph, as shown in Fig. 3.39.
Fig. 3.39 Four normal markers
1) Setting normal markers
Step 1. Press the【Marker】key to access the marker setting menu.
Step 2. Press the [Marker Select] menu key.
Step 3. Press the [Maker 1], [Marker 2], [Marker 3] or [Marker 4] menu key to select the marker of
interest. The [Marker 1] is the default option.
Step 4. Press the [Marker State] menu key to set the marker state to On. The default setting is [Marker
State On Off].
Step 5. Press the [Marker Type] menu key to enable normal type markers. This is the default setting, as
Page 75
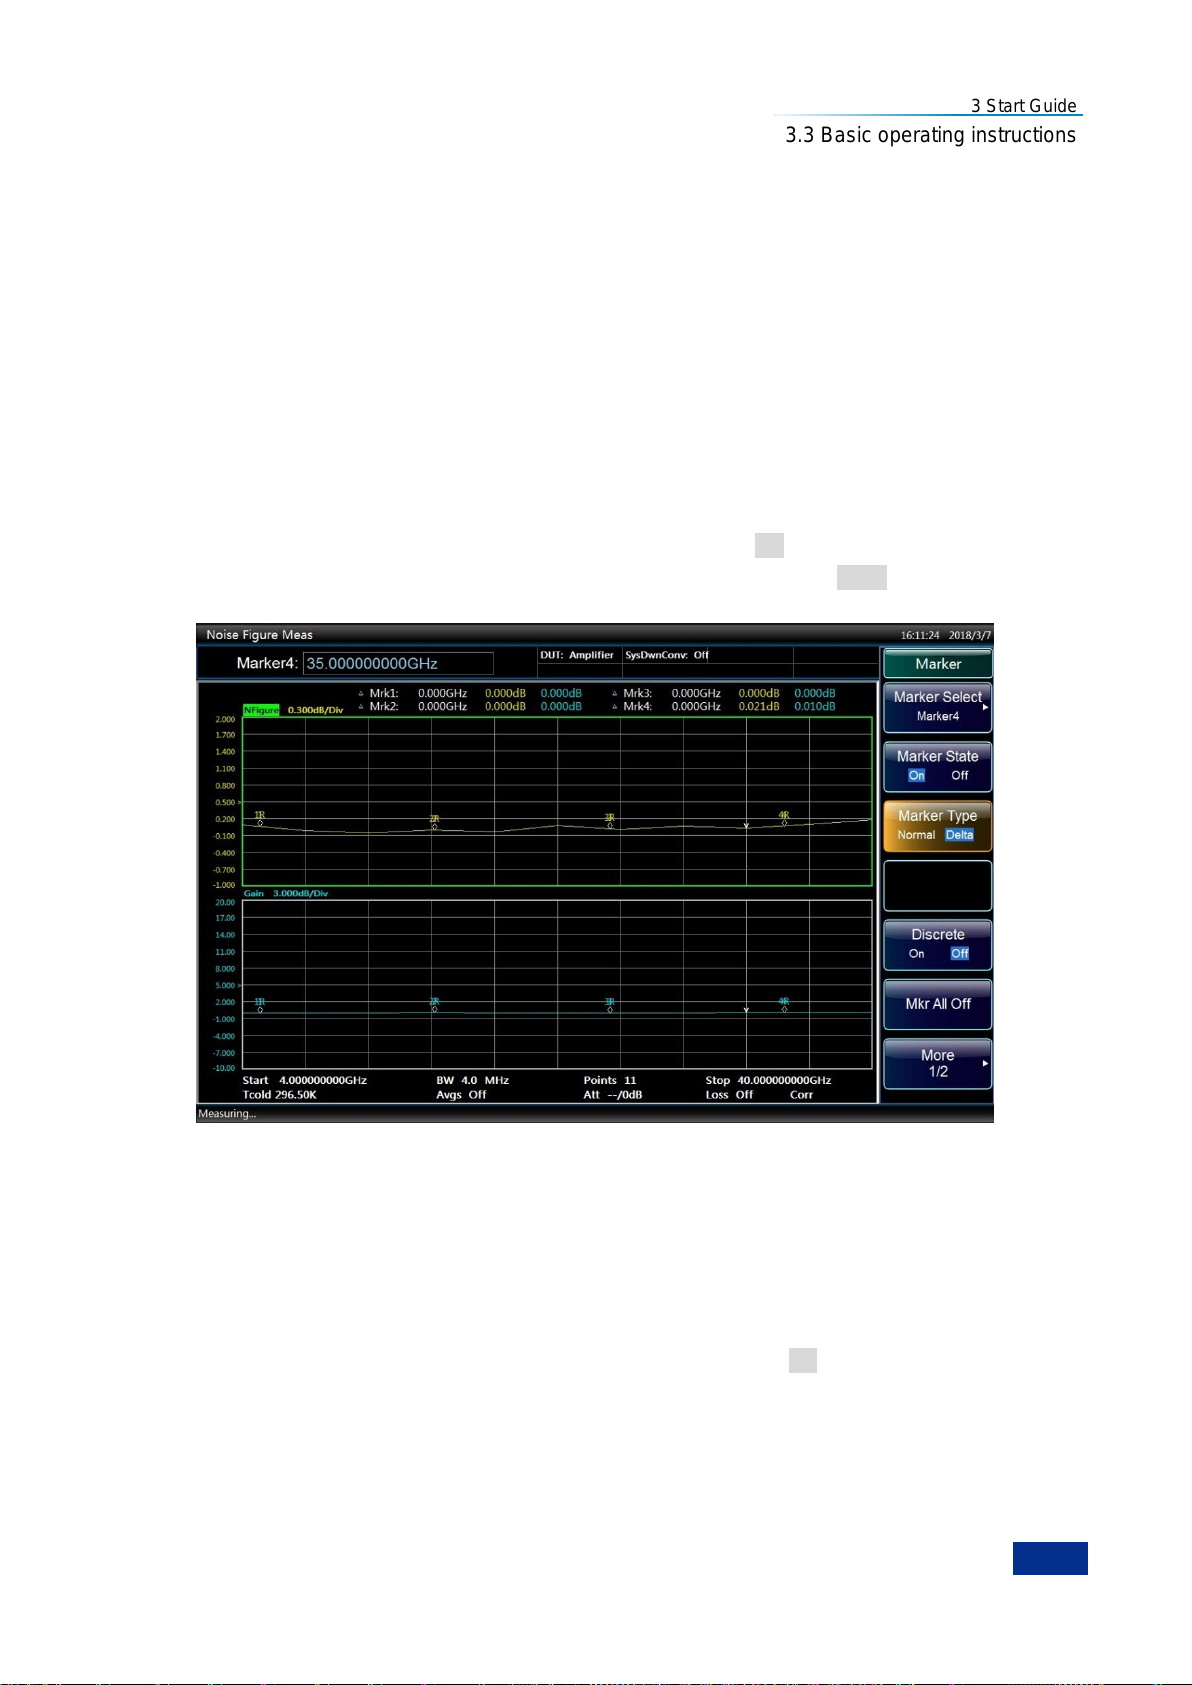
3 Start Guide
63
3.3 Basic operating instructions
shown in Fig. 3.39. When the markers are enabled, turn the knob to place the markers at the
points on the trace you want to measure or use numeric keys and unit keys to enter the
frequency of interest. The marker frequency and measurement result are annotated above the
graph. Its frequency value is displayed in the result input area.
2) Setting the delta marker
The delta markers enable you to measure the difference (including frequency and measurement results)
between the reference marker and the delta marker position on the trace.
Step 1. Press the【Marker】key to access the marker setting menu.
Step 2. Press the [Marker Select] menu key.
Step 3. Press the [Maker 1], [Marker 2], [Marker 3] or [Marker 4] menu key to select the marker of
interest. The [Marker 1] is the default option.
Step 4. Press the [Marker State] menu key to set it to [Marker State On Off].
Step 5. Press the [Marker type] menu key to set it to [Marker Type Normal Delta] mode, as shown in
Fig. 3.40.
Fig. 3.40 Four delta markers
3) Turning an active marker off
Step 1. Press the【Marker】key to access the marker setting menu.
Step 2. Press the [Marker Select] menu key.
Step 3. Press the [Maker 1], [Marker 2], [Marker 3] or [Marker 4] menu key to select the marker you
want to turn off.
Step 4. Press the [Marker State] menu key to set it to [Marker State On Off] mode.
4) Turning all markers off
Step 1. Press the【Marker】key to access the marker setting menu.
Step 2. Press the [Mkr All Off] menu key.
Page 76
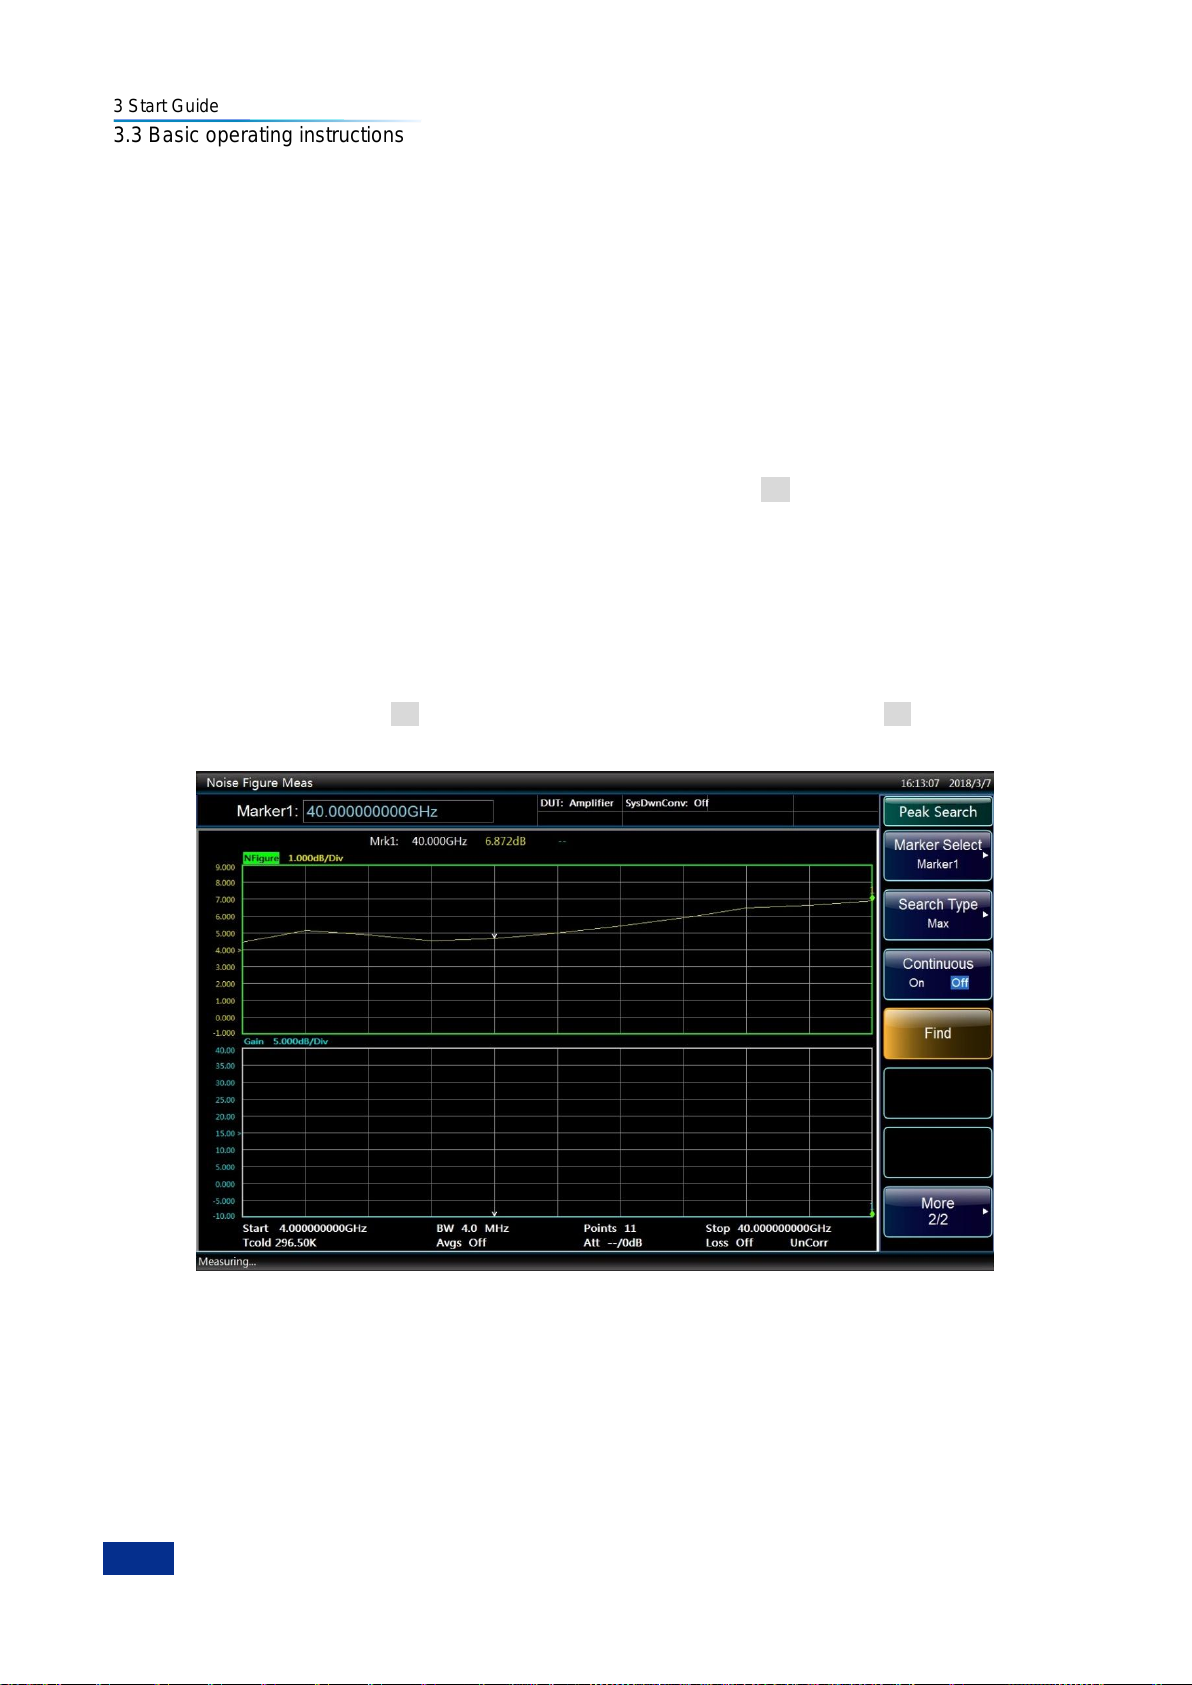
3 Start Guide
64
3.3 Basic operating instructions
5) Searching with markers
The Searching function allows you to place an active marker on the minimum or maximum point of the
trace, while in normal or delta state. In normal marker state, the minimum or maximum point found is
displayed; in delta marker state, the delta between the minimum or maximum point found and the
reference level is displayed.
Search for minimum or maximum point as follows:
Step 1. Press the【Marker】key to access the marker setting menu.
Step 2. Press the [Marker Select] menu key.
Step 3. Press the [Maker 1], [Marker 2], [Marker 3] or [Marker 4] menu key to select the marker of
interest
Step 4. Press the [Marker State] menu key to set it to [Marker State On Off].
Step 5. Press the [Marker Type] menu key to select normal or delta type markers.
Step 6. Press the [More 1/2] menu key.
Step 7. Press the [Search Type] menu key.
Step 8. Press the [Max] or [Min] menu key to select the point of interest.
Step 9. Press the [Find] menu key to search for minimum or maximum point on the trace. If you want to
search for maximum or minimum point after each sweep, press the [Continuous] menu key to
set it to [Continuous On Off] mode. The default setting is [Continuous On Off]. Fig. 4.41 shows
the maximum point found.
Fig. 3.41 Maximum point searching function
3.3.10 Measure fixed frequency
The fixed frequency measurement is the simplest type of measurement. It is made by measuring a
device at a specific frequency. The meter display format is ideal for displaying the results of a fixed
frequency measurement.
The following example measures an amplifier at a fixed frequency. The operating frequency range of the
amplifier is within the frequency range of the NFA.
Page 77
3 Start Guide
65
Frequency range
Typical Gain
Typical noise figure
50MHz
-10dB
10dB
NOTE
3.3 Basic operating instructions
You need to select an appropriate noise source, either a normal noise source or a SNS. The normal
noise source input is connected to the +28V noise source drive port on the NFA front panel using a BNC
cable and its output is connected to the input port of the NFA (50). The SNS input is connected to the
SNS port on the NFA front panel using a special multi-core cable and its output is connected to the input
port of the NFA (50).
The following example measures the corrected noise figure and gain of a device at a frequency of
50MHz and verifies that it meets the manufacturer‘s specification listed in Table 3.15. The average is On
and set to 4. The bandwidth is set to the default 4MHz.
Table 3.15 Technical specifications of the DUT
Make a fixed frequency measurement as follows:
Step 1. Turn the NFA on by pressing the 【Power】key and wait for the initialization process to complete.
To obtain greater accuracy, it is recommended to warm the NFA up for at least 30 min.
Step 2. Press the【Preset】key.
Step 3. Press the【ENR】key and [ENR Mode] menu key to select the Spot ENR mode.
Step 4. Press the [Spot] menu key, and press the [Spot Mode] menu key to select ENR. This is the
default setting.
Step 5. Press the [Spot ENR] menu key, enter the corresponding ENR value using numeric keys and
finish it using the [dB], [K], [C] or [F] unit menu key. The K, C or F entry is automatically
converted to appear as dB. If the frequency you want to measure is not a listed ENR value,
then you need to interpolate to an appropriate value. The default ENR value is 15.200dB.
If the noise source ENR data has been entered and saved previously, ignore Step 3 through Step 5.
When an unlisted ENR value is used, the NFA interpolates point automatically. The normal noise figure
ENR values are normally found on the body of the noise source, the certificate of calibration or on the
disk supplied with the noise source. The SNS ENR values are loaded to the NFA automatically.
Step 6. Press the【Freq/Points】key.
Step 7. Press the [Freq Mode] menu key, and press the [Fixed] menu key to select the fixed frequency
mode.
Step 8. Press the [Fixed Freq] menu key, enter 50 using numeric keys, and finish it by pressing the
[MHz] unit menu key.
Step 9. Press the【Avg】 key, and press the [Average] menu key to set it to [Average On Off] mode.
Enter ―4‖ using the numeric key, and finish it by pressing the [OK] menu key.
Step 10. Press the【BW】key, and press the [BW] menu key to set it to [BW Auto Manual] mode. Enter
―4‖ using the numeric key, and finish it by pressing the [MHz] menu key. The default value is 4
MHz.
Step 11.Connect the noise source to the NFA for calibration as shown in Fig. 3.42. Press the 【Calibrate】
key to access calibrate menu, and press [Calibrate] menu key twice to calibrate the NFA.
Page 78
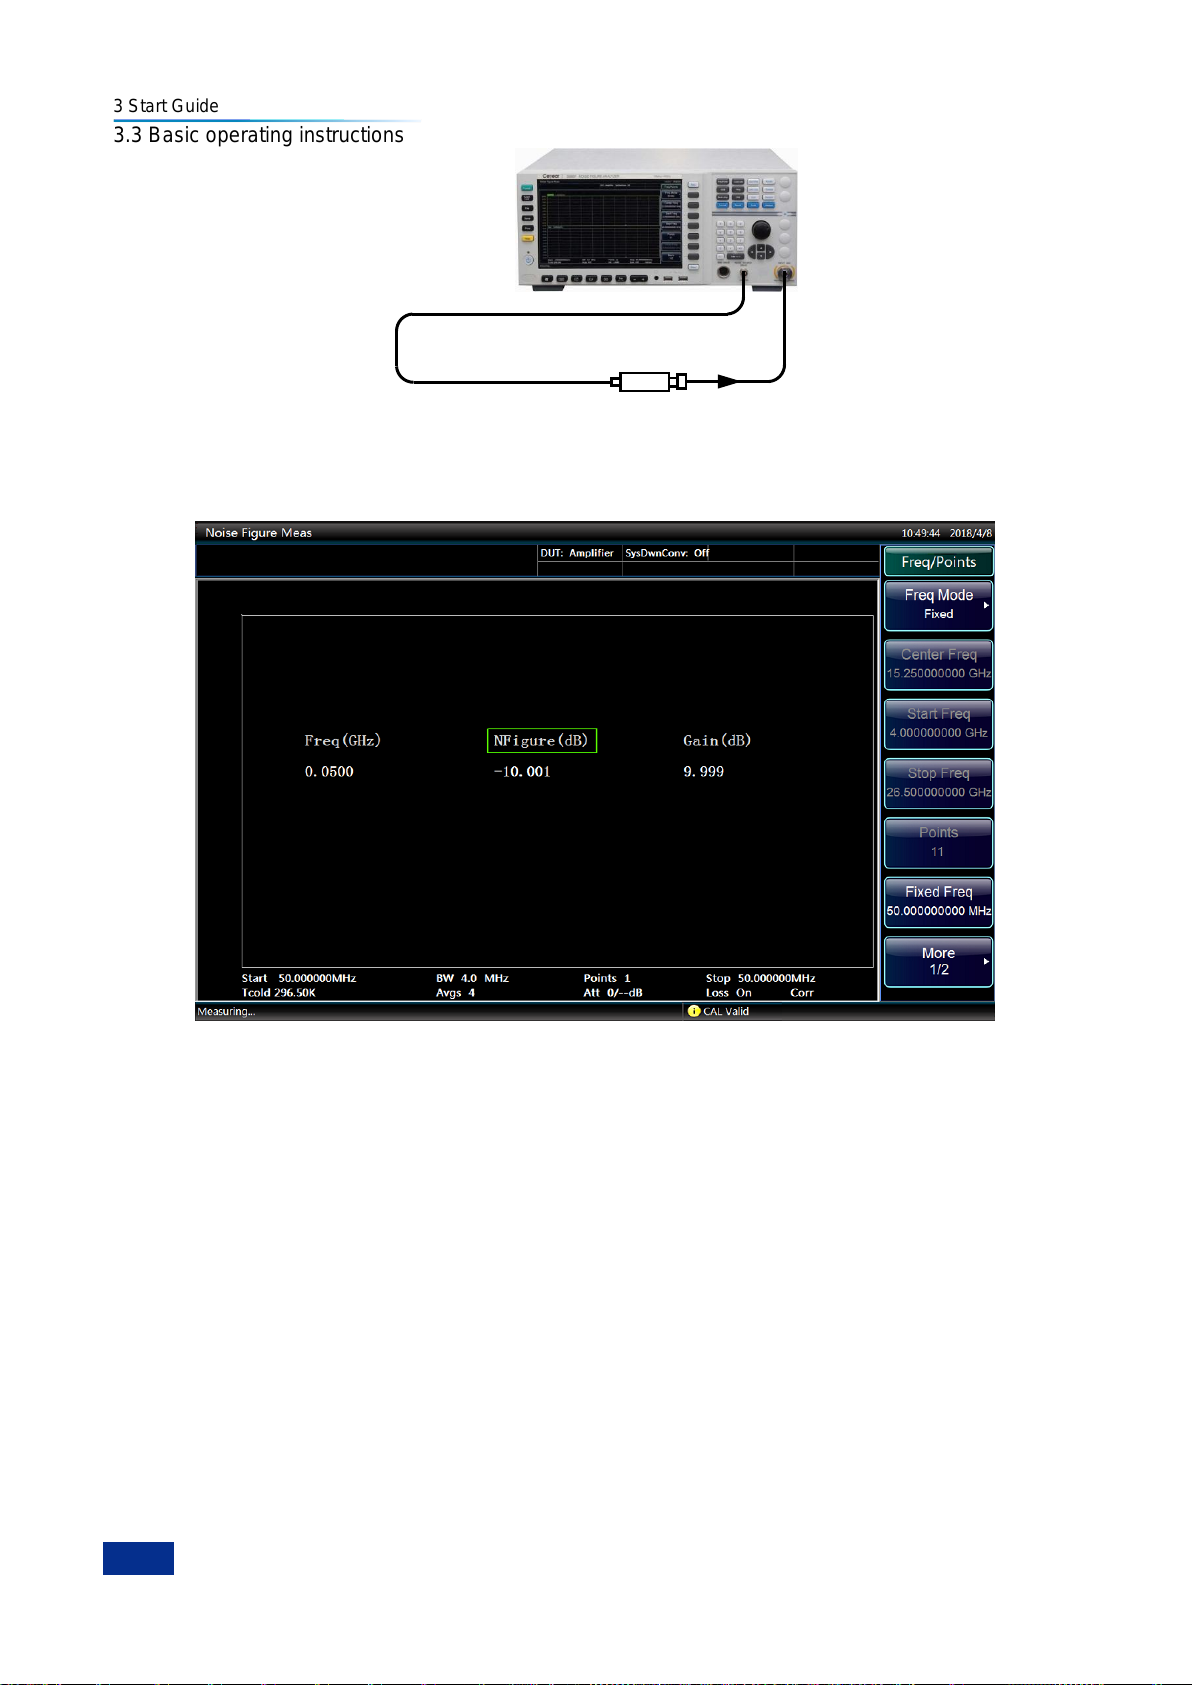
3 Start Guide
66
Noise source
3.3 Basic operating instructions
Fig. 3.42 Calibration connection
Step 12. Press the【Format】key, and the [Display Format] menu key to select the [Meter] menu key.
Step 13. Connect the device under test between the noise source output and the NFA input. The
measurement result is displayed in meter format, similar to Fig. 3.43.
Fig. 3.43 Fixed frequency measurement result in meter format
The result displayed in Fig. 3.43 shows the DUT noise figure and gain at 50 MHz. The DUT meets the
specifications listed in Table 3.15.
Page 79
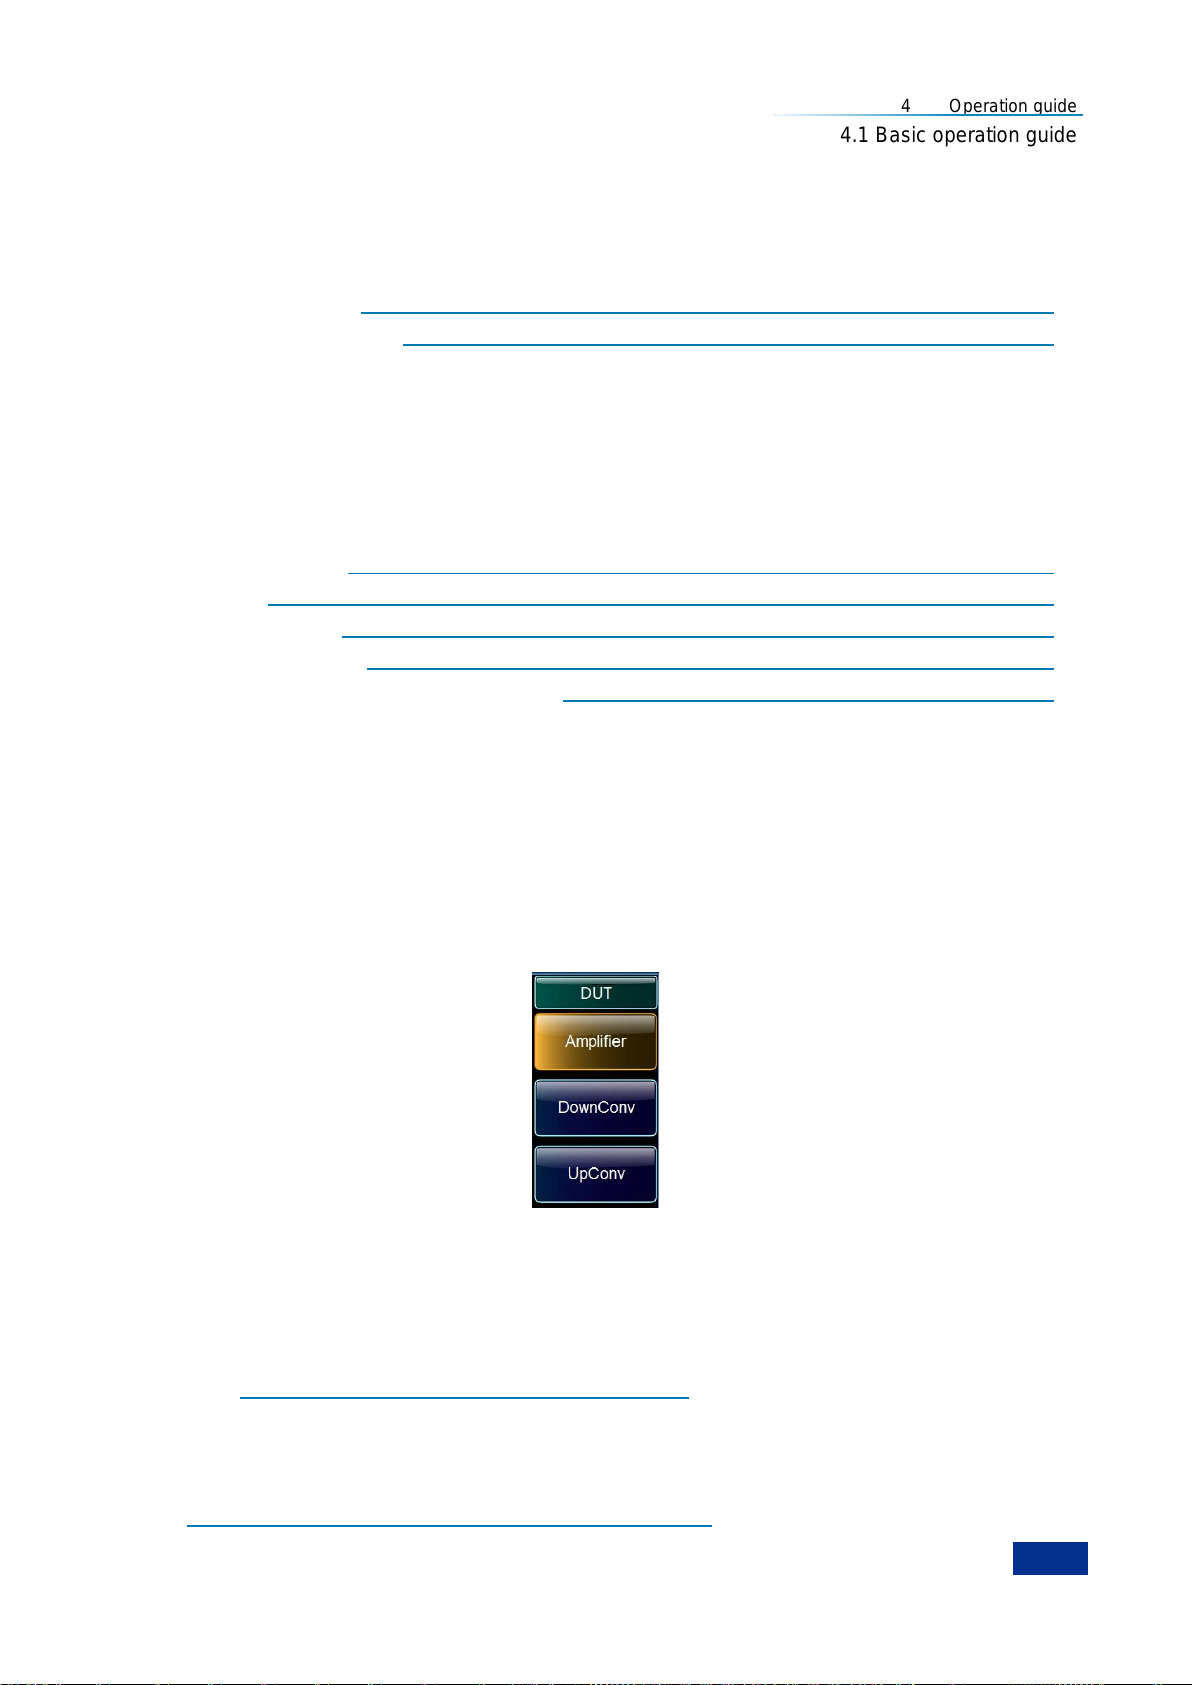
4 Operation guide
67
4.1 Basic operation guide
4 Operation guide
This chapter introduces how to operate the 3986 series NFA in different measurement modes and
explains in detail the measurement procedures and related precautions.
Basic operation guide………………………………………………………………………………………67
Advanced operation guide…………………………………………………………………………………82
4.1 Basic operation guide
This part mainly covers the common operation of 3986 series NFA, such as the measurement mode,
mode setup, system connection and external LO selection. It provides an example of a basic amplifier
measurement to help users get familiar with the 3986 series NFA and grasp the basic measurement
method quickly.
Measurement mode………………… ……………………………………………………………………67
Mode setup…… ……………………………………………………………………………………………68
System connection……………… ………………………………………………………………………74
External LO selection……………… ……………………………………………………………………77
Example of a basic amplifier measurement…… ………………………………………………………78
4.1.1 Measurement mode
The 3986 series NFA is able to measure the noise figure of an amplifier-type device or system and also
display the gain result of the DUT. It is also able to measure the noise figure and gain of a quasi-linear
device or system, such as an upconverter, downconverter and receiver. There are three measurement
modes, amplifier, downconverter and up-converter.
Press the【Mode Setup】key to access the mode setup menu. Press the [DUT Setup] menu key to select
the DUT type.There are three types of DUT, as shown in Fig. 4.1.
Fig. 4.1 DUT type selection menu
1) Amplifier——The DUT is an amplifier-type device with no frequency conversion. The amplifier
mode includes a basic amplifier measurement mode and a system downconverter mode. The basic
amplifier measurement mode is used when the frequency range of the DUT is within the NFA‘s
frequency range. The measurement procedures of this basic measurement and the precautions are
described in ―4.1.5 Example of a basic amplifier measurement‖.
When the operating frequency of a device is beyond the NFA‘s frequency range, you can enable the
system downconverter measurement mode. In this mode, the noise figure of the device is measured by
adding an external mixer to the NFA. For details about the measurement procedure and precautions,
refer to―4.2.4 Example of a system downconverter measurement‖.
Page 80
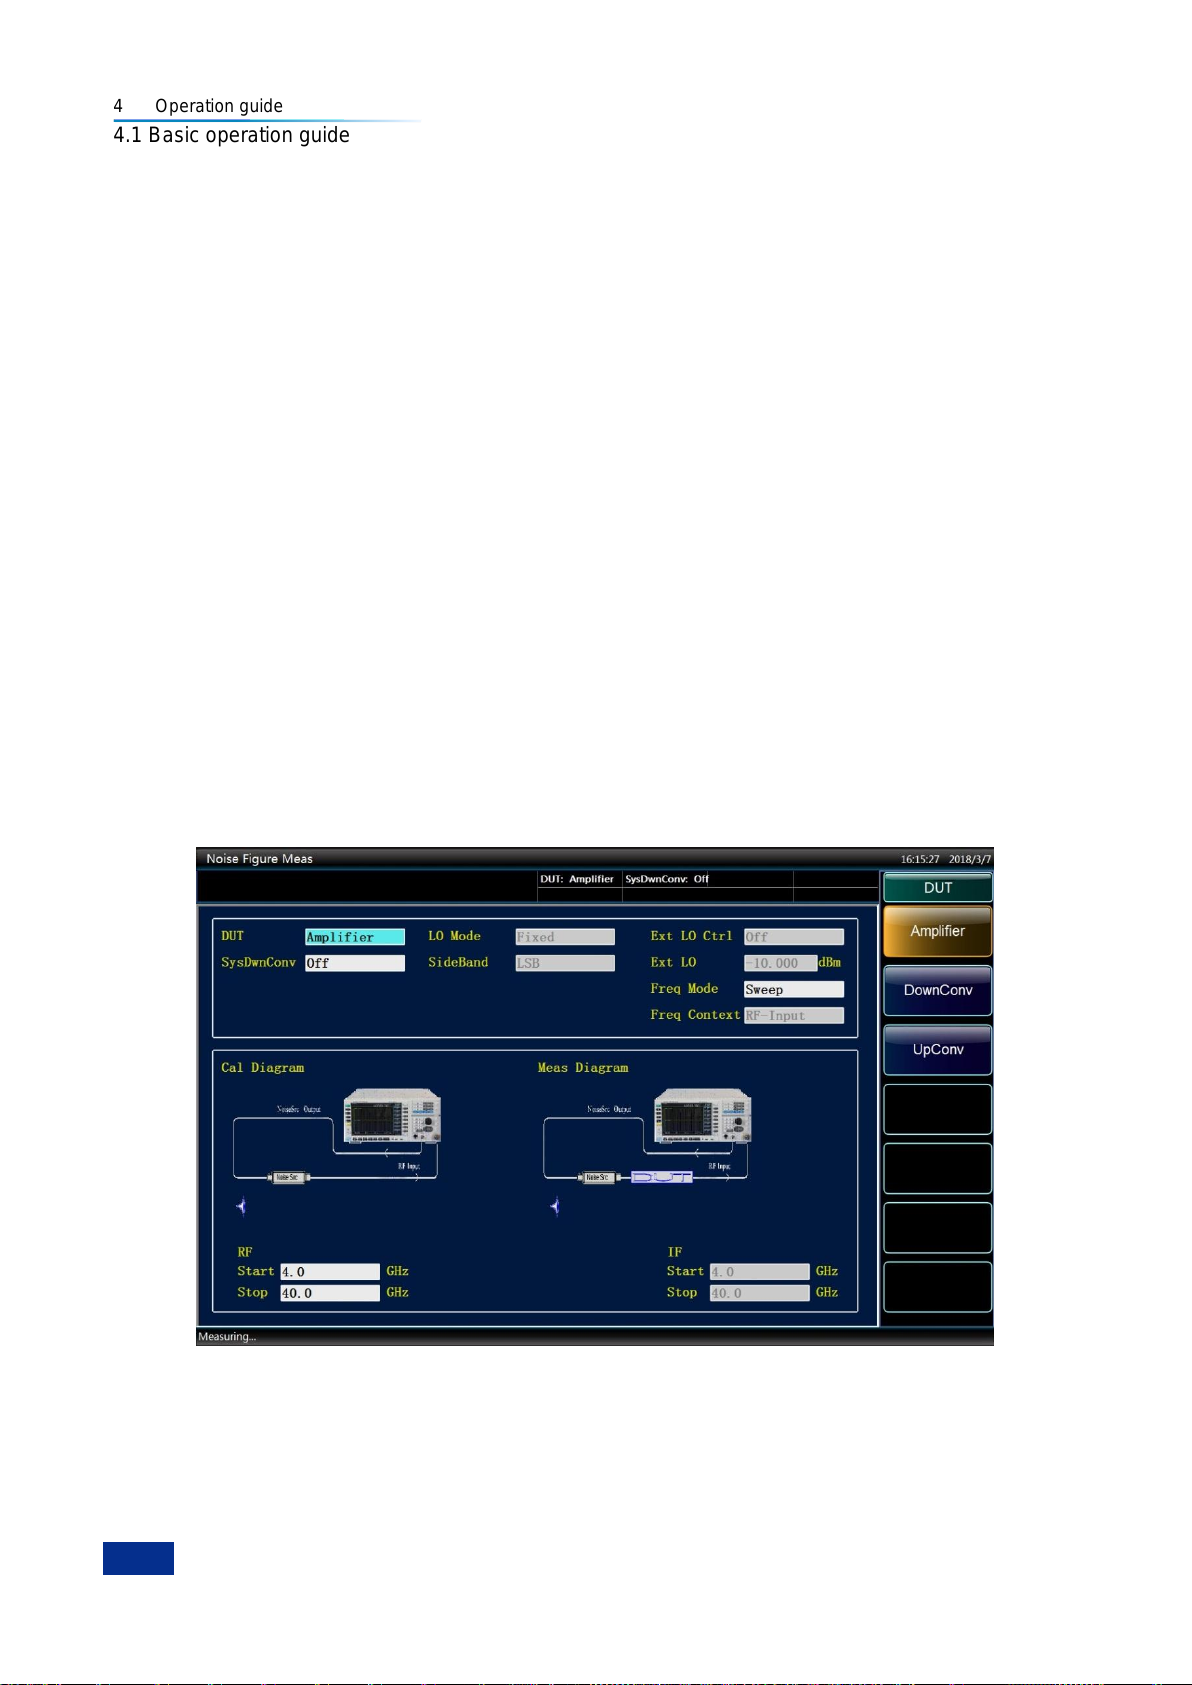
4 Operation guide
68
4.1 Basic operation guide
2) DownConv——The frequency downconversion occurs in the DUT itself not in the measurement
test system. There are two modes setup, fixed LO variable IF and variable LO fixed IF.
3) UpConv——The frequency upconversion occurs in the DUT itself not in the measurement test
system. There are two modes setup, fixed LO variable IF and variable LO fixed IF.
The noise figure measurement involving frequency conversion includes the follow two cases:
1) The frequency conversion is part of the DUT. For example, the DUT is a down converter or a up
converter.
2) The frequency conversion is part of the measurement test system (system downconverter). The
DUT is to be measured at a higher frequency than the NFA‘s frequency range covers, hence an external
system downconverter and local oscillator are added to the measurement test system to extend the
NFA‘s frequency range.
The 3986 series NFA can make a single frequency conversion and also support multiple frequency
conversion. In variable LO and fixed IF mode, the NFA can also control the output frequency and power
of an LO source using the SCPI commands.
4.1.2 Mode Setup
4.1.2.1 Amplifier measurement mode setup
The 3986 series NFA provides dedicated user interface to allow easy measurement setup and integrated
measurement parameters input. There is no need to switch between each setup to complete various
settings in each measurement mode. The measurement mode setup is shown in Fig. 4.2. You can
enable each setting by using the mouse or pressing the【】and【】arrow keys .
Fig. 4.2 Measurement mode setup display
1) Basic amplifier mode setup
The basic amplifier mode is the default setting of the 3986 series NFA when the instrument is switched
on. You can also set the basic amplifier measurement mode as follows:
Step 1. Press the【Preset】 key to return the instrument to the factory default state, and press the
Page 81
4 Operation guide
69
NOTE
4.1 Basic operation guide
【Mode Setup】to access the mode setting menu.
Step 2. Press the [DUT Setup] menu key and the [Amplifier] menu key to select the amplifier
measurement mode.
Step 3. In the mode setup display, set the system downconverter to Off.
Step 4. Enable the RF start and RF stop input respectively, enter the frequency value of measurement
using numeric keys, and finish it using unit keys. You can also press the【Freq/Points】key, and
then press the [Start Freq] and [Stop Freq] menu keys to set the frequency results of
measurement.
2) System downconverter mode setup
The DUT is an amplifier-type device with the same input and output frequency, such as an amplifier or a
filter and etc. However, the operating frequency of the DUT is beyond the frequency range the 3986
series NFA covers. Therefore, an external system downconverter is connected during noise figure
measurement to convert the operating frequency within the NFA‘s frequency range. There are two
available modes for selection in the system downconverter measurement:
a) Variable LO and fixed IF
In this mode, the NFA is set at a fixed IF frequency. The sweep LO and system downconverter convert
the RF frequency range to a fixed IF which the NFA can receive. The mode setup is as follows:
Step 1. Press the 【Preset】 key to return the instrument to the factory default state, and press the
【Mode Setup】to access the mode setting menu.
Step 2. Press the [DUT Setup] menu key and the [Amplifier] menu key to select the amplifier
measurement mode.
Step 3. In the mode setup display, set the system downconverter to On.
Step 4. Enable the LO mode setup, and select the ―variable‖.
Step 5. Enable the sideband setup, and set the measurement sideband based on the specific operating
sideband of the system downconverter. There are three options, lower sideband (LSB), upper
sideband (USB) and double sideband (DSB).
Step 6. Enable the external LO control option, and set the external LO control to On or Off. In the
variable LO mode, it is recommended to set it to On.
Step 7. Activate the external LO power input box and input the external LO power value with the
numeric key and complete the input setting with the unit key.
Step 8. Enable the frequency mode setup, and select the frequency sweep mode. There are two
available modes, Sweep and List. Normally, the Sweep mode is selected.
Step 9. Activate the RF start frequency and RF stop frequency input box, input the measured frequency
value with the numeric key, and complete the input with unit key.
.
In this variable LO and fixed IF mode, when the external LO control is set to On, the NFA can control the
output frequency and power of the external LO through the LAN ports. The LO output frequency
simultaneously traces the RF frequency to achieve automatic sweep measurement. If the external LO
control option is set to ―Off‖, the user shall manually set the frequency and power value of the external
LO The formula for LO frequency is: FLO=FRF+FIF (LSB), FLO=FRF-FIF (USB) and FLO=F
RF
(DSB)
.
Page 82
4 Operation guide
70
NOTE
WARNING
4.1 Basic operation guide
If the list mode is selected, you need to edit the sweep frequency list.
Step 10. Activate the fixed IF frequency input box and set the IF frequency. Input the IF frequency with
the numeric key, and press the corresponding unit key to complete the input.
b) Fixed LO and variable IF
In this mode, the external LO is locked at a fixed frequency and the NFA works within the IF frequency
range of the system downconverter. The fixed LO and system downconverter convert the RF frequency
range to the IF frequency range within the NFA. The mode setup is as follows:
Step 1. Press the【Preset】 key to return the instrument to the factory default state, and press the
【Mode Setup】to access the mode setting menu.
Step 2. Press the [DUT Setup] menu key and the [Amplifier] menu key to select the amplifier
measurement mode.
Step 3. In the mode setup display, set the system downconverter to On.
Step 4. Enable the LO mode setup, and select ―Fixed‖.
Step 5. Enable the sideband setup, and set the measurement sideband based on the specific operating
sideband of the system downconverter. There are two options, lower sideband (LSB) and upper
sideband (USB).
When the system downconverter works in fixed LO and variable IF mode, only the single sideband
measurement (including USB and LSB) can be set.
Step 6. Enable the external LO control option, and set the external LO control to On or Off. In the fixed
LO mode, it is normally set to Off.
Step 7. Activate the external LO power input box and input the external local oscillator power value with
the numeric key and complete the input setting with the unit key.
Step 8. Enable the frequency mode setting and select the frequency sweep mode. There are three
modes available, Sweep, Fixed and List. Normally, the Sweep mode is selected.
Step 9. Activate the RF start frequency and RF stop frequency input box, input the measured frequency
value with the numeric key, and complete the input with unit key. If List mode is selected, you
need to edit the sweep frequency list.
Step 10. Activate the fixed LO frequency input box, input the frequency of local oscillator with the
numeric key, and press the corresponding unit key to complete the input.
If the external LO control option is set to ―Off‖, the user shall manually set the frequency and power value
of external LO.
4.1.2.2 Downconverter measurement mode setup
In the downconverter measurement mode, the output frequency (IF) of the DUT is lower than the input
frequency (RF), for example, the DUT is a mixer or receiver. There are two measurement modes setup
for selection:
Page 83
4 Operation guide
71
NOTE
4.1 Basic operation guide
1) Variable LO and fixed IF
In this mode, the NFA works at a fixed IF frequency of the DUT. The mode setup is as follows:
Step 1. Press the【Preset】 key to return the instrument to the factory default state, and press the
【Mode Setup】to access the mode setting menu.
Step 2. Press the [DUT Setup] menu key and the [DownConv] menu key to select the downconverter
measurement mode. When this measurement mode is selected, the system downconverter
setup is disabled, i.e., the system downconverter mode is not available in the downconverter
measurement mode.
Step 3. Enable the LO mode setup, and select the ―variable‖.
Step 4. Enable the sideband setup, and set the measurement sideband based on the specific operating
sideband of the downconverter. The NFA provides three options, lower sideband (LSB), upper
sideband (USB) and double sideband (DSB).
Step 5. Enable the external LO control option, and set the external LO control to On or Off. In the
variable LO mode, it is recommended to set it to On.
Step 6. Activate the external LO power input box and input the external local oscillator power value with
the numeric key and complete the input setting with the unit key.
In this variable LO and fixed IF mode, when the external LO control is set to On, the NFA can control the
output frequency and power of the external LO through the LAN ports. The LO output frequency
simultaneously traces the RF frequency to achieve automatic sweep and NF measurement. If the
external LO control option is set to ―Off‖, the user shall manually set the frequency and power value of
external LO. The formulas for calculating the LO frequency are: FLO=FRF+FIF (LSB); FLO=FRF-F
and FLO=F
(DSB).
RF
(USB);
IF
Step 7. Enable the frequency mode setup, and select the frequency sweep mode. There are three
available modes, the Sweep, Fixed and List. Normally, the Sweep mode is selected.
Step 8 Activate the RF start frequency and RF stop frequency input box, input the measured frequency
value with the numeric key, and complete the input with unit key. If List mode is selected, you
need to edit the sweep frequency list.
Step 9. Activate the fixed IF frequency input box and set the IF frequency. Input the IF frequency with
the numeric key, and press the corresponding unit key to complete the input.
2) Fixed LO and variable IF
In this mode, the LO of the mixer under test is locked at a fixed IF frequency and the NFA works within
the IF frequency range of the mixer. The mode setup is as follows:
Step 1. Press the【Preset】 key to return the instrument to the factory default state, and press the
【Mode Setup】to access the mode setting menu.
Step 2. Press the [DUT Setup] menu key and the [DownConv] menu key to select the downconverter
measurement mode. When this measurement mode is selected, the system downconverter
mode is disabled, i.e., the system downconverter mode is not available in the downconverter
measurement mode.
Step 3. Enable the LO mode setup, and select ―Fixed‖.
Page 84
4 Operation guide
72
NOTE
4.1 Basic operation guide
Step 4. Set the measurement sideband based on the specific operating sideband of the downconverter.
The NFA provides three options for selection, the lower sideband (LSB), upper sideband (USB)
and double sideband (DSB).
Step 5. Enable the external LO control option, and set the external LO control to On or Off. In the fixed
LO mode, it is normally set it to Off.
Step 6. Activate the external LO power input box and input the external local oscillator power value with
the numeric key and complete the input setting with the unit key.
Step 7. Enable the frequency mode setup, and select the frequency sweep mode. There are three
available modes, the Sweep, Fixed and List. Normally, the Sweep mode is selected.
Step 8. Enable the measurement frequency type setup option, and select and set the RF or IF value of
the DUT. This example selects the IF-Input. This means to set the IF frequency of the DUT, and
the instrument calculates the RF frequency of the DUT automatically.
Step 9. Activate the fixed LO frequency input box, input LO frequency of the mixer the numeric key, and
press the corresponding unit key to complete the input
Step 10. Activate the IF start frequency and IF stop frequency input box, input the IF frequency with the
numeric key, and press the corresponding unit key to complete the input.
The downconverter works in the fixed LO and variable IF mode. Under the Mode Setup boot interface,
the measurement frequency type defaults to "IF-input". It is recommended that the user prefer the
default setting. If the user sets the type of measurement frequency as "RF-input", the operation
corresponds to the Step 10. Activate the RF start frequency and RF stop frequency input box, input the
RF start frequency and stop frequency of the mixer with numeric key and complete the input with unit key.
If the external LO control option is set to ―Off‖, the user shall manually set the frequency and power value
of external LO.
4.1.2.3 Upconverter measurement mode setup
In the upconverter measurement mode, the output frequency (IF) of the DUT is higher than the input
(RF), for example, the DUT is a receiver. There are two upconverter measurement modes for selection:
1) Variable LO and fixed IF
In this mode, the NFA works at a fixed IF frequency of the DUT. The mode setup is as follows:
Step 1. Press the【Preset】key to return the instrument to the factory default state, and press the【Mode
Setup】to access the mode setting menu.
Step 2. Press the [DUT Setup] menu key and the [UpConv] menu key to select the upconverter
measurement mode. When the measurement mode is selected, the system downconverter
setting is disabled, i.e. the downconverter mode is not available in the upconverter
measurement mode.
Step 3. Enable the LO mode setup, and select the ―variable‖.
Step 4. Enable the sideband setup option, and set the measurement sideband based on the specific
operating sideband of the DUT. The NFA provides two options, the lower sideband (LSB) and
upper sideband (USB).
Step 5. Enable the external LO control option, and set the external LO control to On or Off. In the
Page 85
4 Operation guide
73
NOTE
WARNING
4.1 Basic operation guide
variable LO mode, it is recommended to set it to On.
Step 6. Activate the external LO power input box and input the external LO power value with the
numeric key and complete the input setting with the unit key.
Upconverter works in the variable LO and fixed IF mode. When the external LO control option is set to
―On‖, the NFA can control the output frequency and power of external LO via the LAN. The LO output
frequency simultaneously traces the RF frequency to achieve automatic sweep measurement. If the
external LO control option is set to ―Off‖, the user shall manually set the frequency and power value of
the external LO. The formulas for calculating the LO frequency are: FLO=FRF+FIF (LSB) and FLO =F
FRF(USB).
Step 7. Enable the frequency mode setup, and select the frequency sweep mode. There are three
available modes, the Sweep, Fixed and List. Normally, the Sweep mode is selected.
Step 8. Activate the RF start frequency and RF stop frequency input box, input the measured frequency
value with the numeric key, and complete the input with unit key. If List mode is selected, you
need to edit the sweep frequency list.
Step 9. Activate the fixed IF frequency input box and set the IF frequency. Input the IF frequency with
the numeric key, and press the corresponding unit key to complete the input.
-
IF
2) Fixed LO and variable IF
In this mode, the LO of the DUT is locked at a fixed frequency and the NFA works within the IF frequency
range of the DUT. The fixed LO and upconverter convert the RF frequency range to the IF frequency
range within the NFA. The mode setup is as follows:
Step 1. Press the 【Preset】 key to return the instrument to the factory default state, and press the
【Mode Setup】to access the mode setting menu.
Step 2. Press the [DUT Setup] menu key and the [UpConv] menu key to select the upconverter
measurement mode. When the measurement mode is selected, the system downconverter
setting is disabled, i.e. the downconverter mode is not available in the upconverter
measurement mode.
Step 3. Enable the LO mode setup, and select ―Fixed‖.
Step 4. Set the sideband based on the operating sideband of the upconverter. The NFA provides two
sideband setup options, the LSB and USB.
In the upconverter measurement mode, only the USB and LSB can be set. The formulas for calculating
the LO frequency are: FLO=FRF+FIF(LSB) and FLO =FIF-FRF (USB).
Step 5. Enable the external LO control option, and set the external LO control to On or Off. In the fixed
LO mode, it is normally set to Off.
Step 6. Activate the external LO power input box and input the external LO power value with the
numeric key and complete the input setting with the unit key.
Step 7. Enable the frequency mode setup, and select the frequency sweep mode. There are three
available modes, the Sweep, Fixed and List. Normally, the Sweep mode is selected.
Page 86
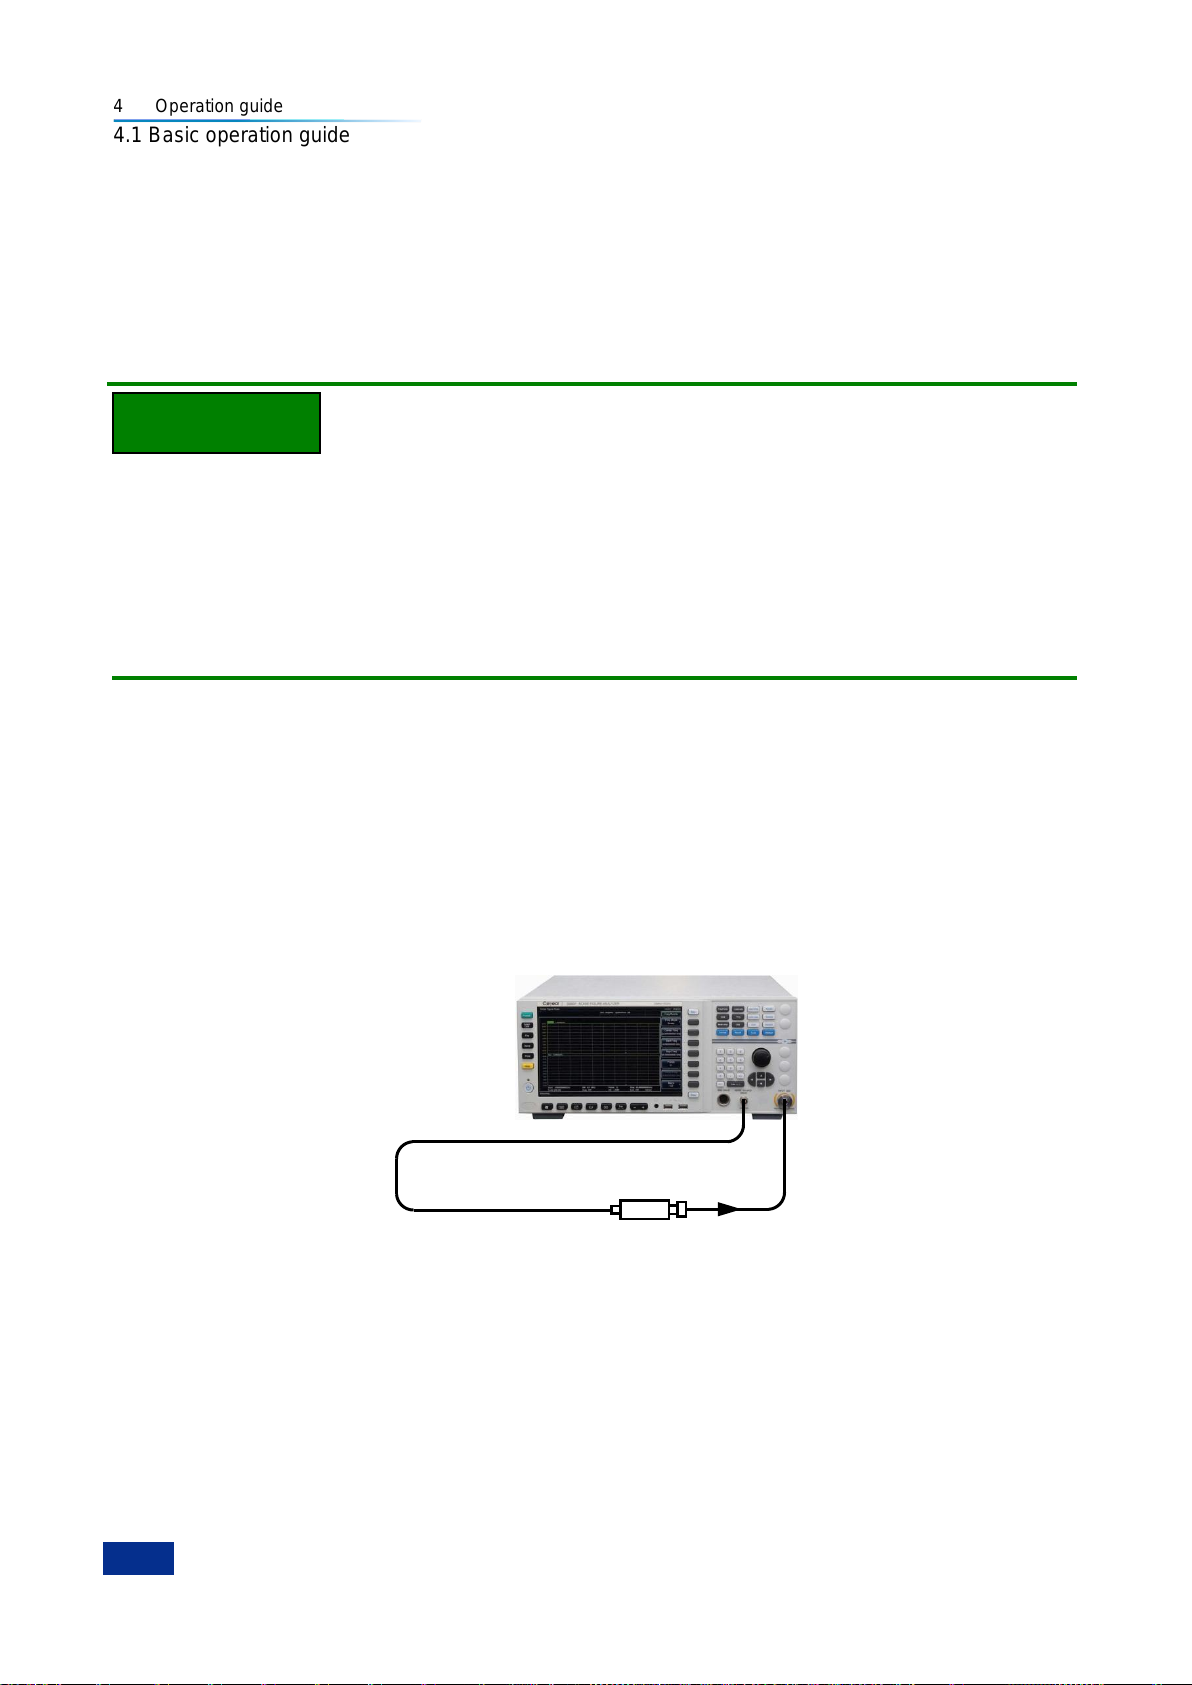
4 Operation guide
74
Noise source
NOTE
4.1 Basic operation guide
Step 8. Enable the measurement frequency type setup, and select and set the RF or IF value of the
mixer. This example selects the IF-Input. This means to set the IF frequency of the mixer, and
the instrument calculates the RF frequency of the mixer automatically.
Step 9. Activate the fixed LO frequency input box, input the LO frequency of the mixer with the numeric
key, and press the corresponding unit key to complete the input
Step 10. Activate the IF start frequency and IF stop frequency input box, input the measured frequency
value with the numeric key, and complete the input with unit key.
The upconverter works in the fixed LO and variable IF mode. Under the Mode Setup boot interface, the
measurement frequency type defaults to "IF-input". It is recommended that the user prefer the default
setting. If the user sets the type of measurement frequency as "RF-input", the operation corresponds to
the Step 10. Activate the RF start frequency and RF stop frequency input box, input the RF start
frequency and stop frequency of the measured upconverter with numeric key and complete the input
with unit key. If the external LO control option is set to Off, the user shall manually set the frequency and
power value of the external LO.
4.1.3 System Connection
4.1.3.1 Basic Amplifier Measurement Mode
The calibration connection of the basic amplifier measurement mode is shown in Fig. 4.3. When a
normal noise source is used, connect the noise source drive input end to the +28V noise source drive
port on the noise figure analyzer panel with a BNC cable, and connect the noise source output to the
input port (50Ω) of the noise figure analyzer. When a smart noise source is used, connect the noise
source to the smart noise source drive port on the noise figure analyzer panel with a multi-core cable,
and connect the noise source output to the input port (50Ω) of the noise figure analyzer.
Fig. 4.3 Calibration Connection Diagram of Basic Amplifier Measurement Mode
After the calibration is completed, insert the DUT between the noise source output and the input port
(50Ω) of the noise figure analyzer for measurement. The measurement connection of the basic amplifier
measurement mode is shown in Fig. 4.4.
Page 87
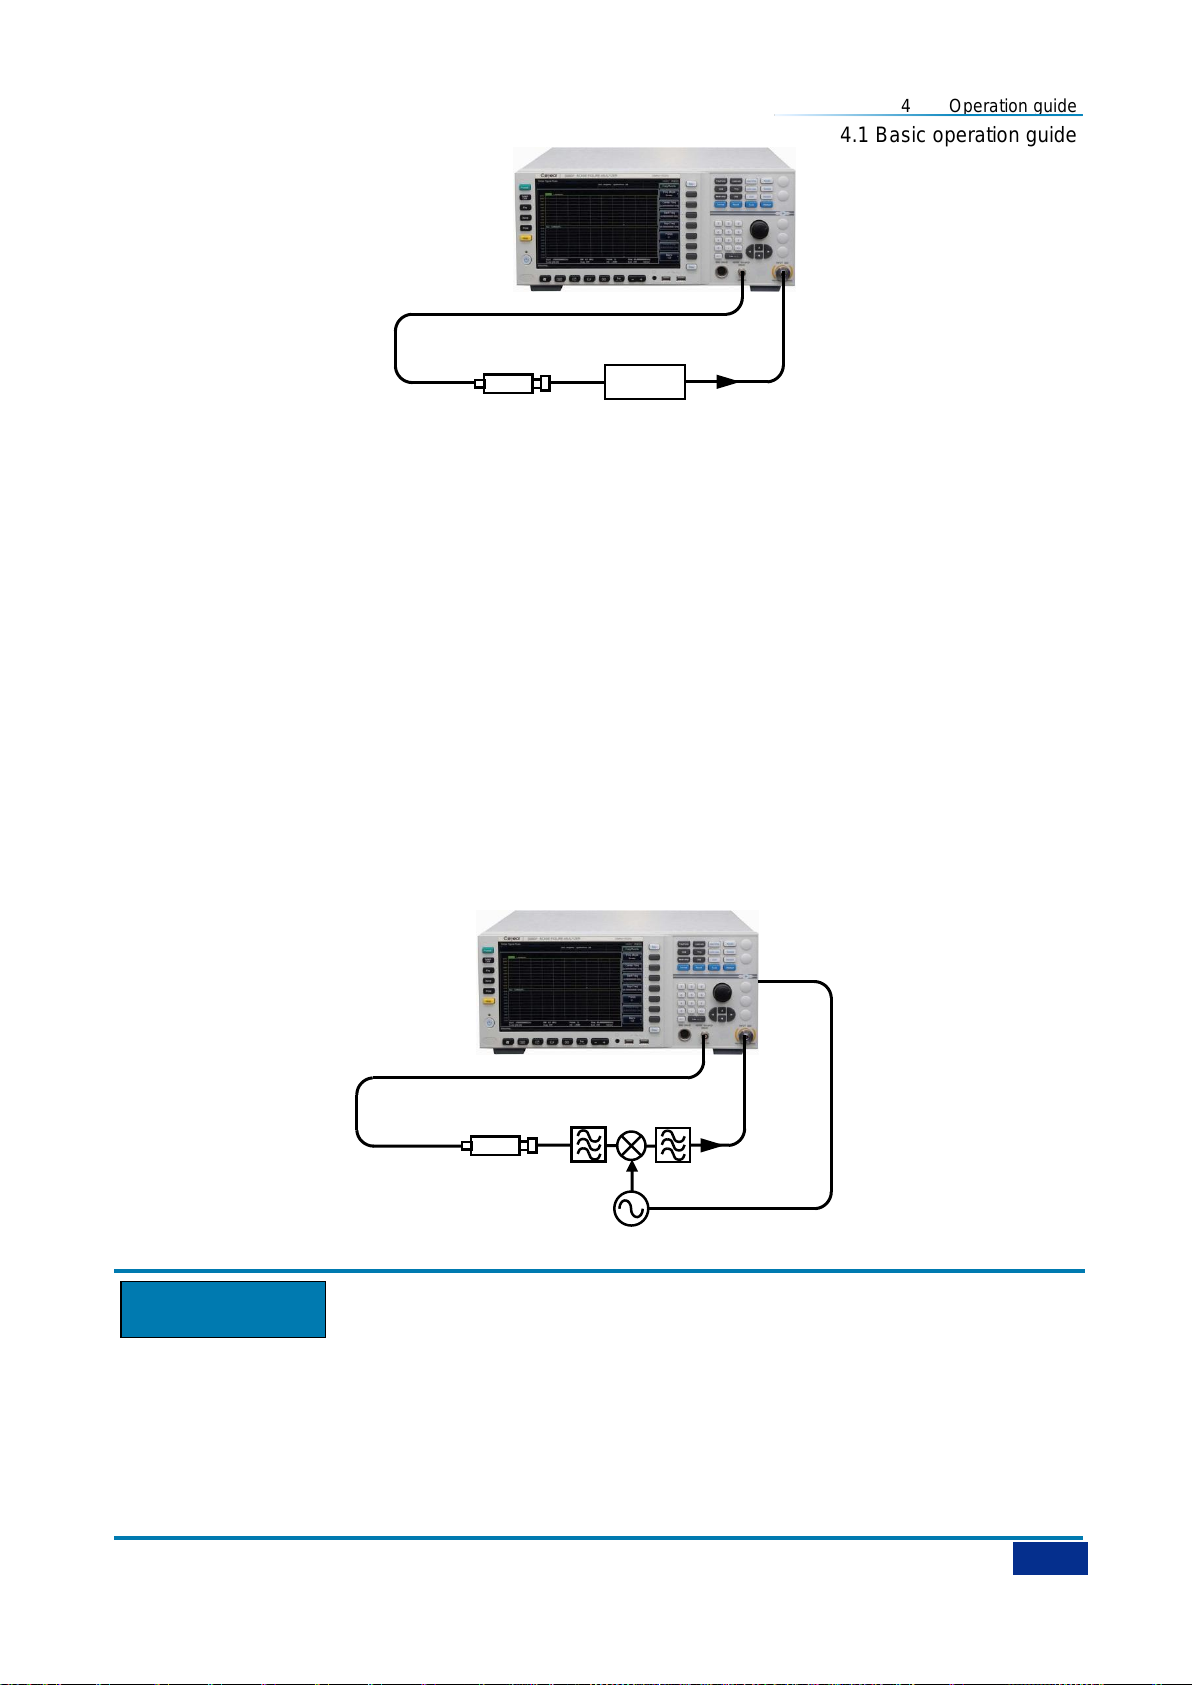
4 Operation guide
75
Noise source
DUT
Noise source
LO
LAN
Attention
4.1 Basic operation guide
Fig.4.4 Measurement Connection Diagram of Basic Amplifier Measurement Mode
4.1.3.2 System Downconverter Mode
Steps for system connection:
Step1. When a normal noise source is used, connect the noise source drive input end to the +28V
noise source drive port on the noise figure analyzer panel with a BNC cable, and connect the
noise source output to the RF input port of the system downconverter. When a smart noise
source is used, connect the noise source to the smart noise source drive port on the noise
figure analyzer panel with a multi-core cable, and connect the noise source output to the RF
input port of the downconverter of the system. The IF output port of the system downconverter
is connected to the input port (50Ω) of the noise figure analyzer.
Step 2. The noise figure analyzer controls external LO through the LAN interface. Connect the noise
figure analyzer to the corresponding interface of the LO with a network cable. In the fixed IF
mode setting of variable LO , control the output frequency and power of the LO with the LAN of
the noise figure analyzer, so as to enable automatic sweep frequency measurement. The
calibration connection of the system frequency conversion mode is shown in Fig. 4.5.
Fig.4.5 Calibration Connection Diagram of System Downconverter Mode
The system downconverter mode is extend frequency measurement of amplifier-class DUTs. External
mixer is used as part of the test system for the whole calibration and measurement process. In this mode,
the frequency conversion is performed in the measurement system rather than in the DUTs. To reduce
the measurement uncertainty, it is preferably to select the system downconverter with the small
conversion loss and noise figure, and the IF output port of the system downconverter shall be well
isolated from the LO.
Page 88
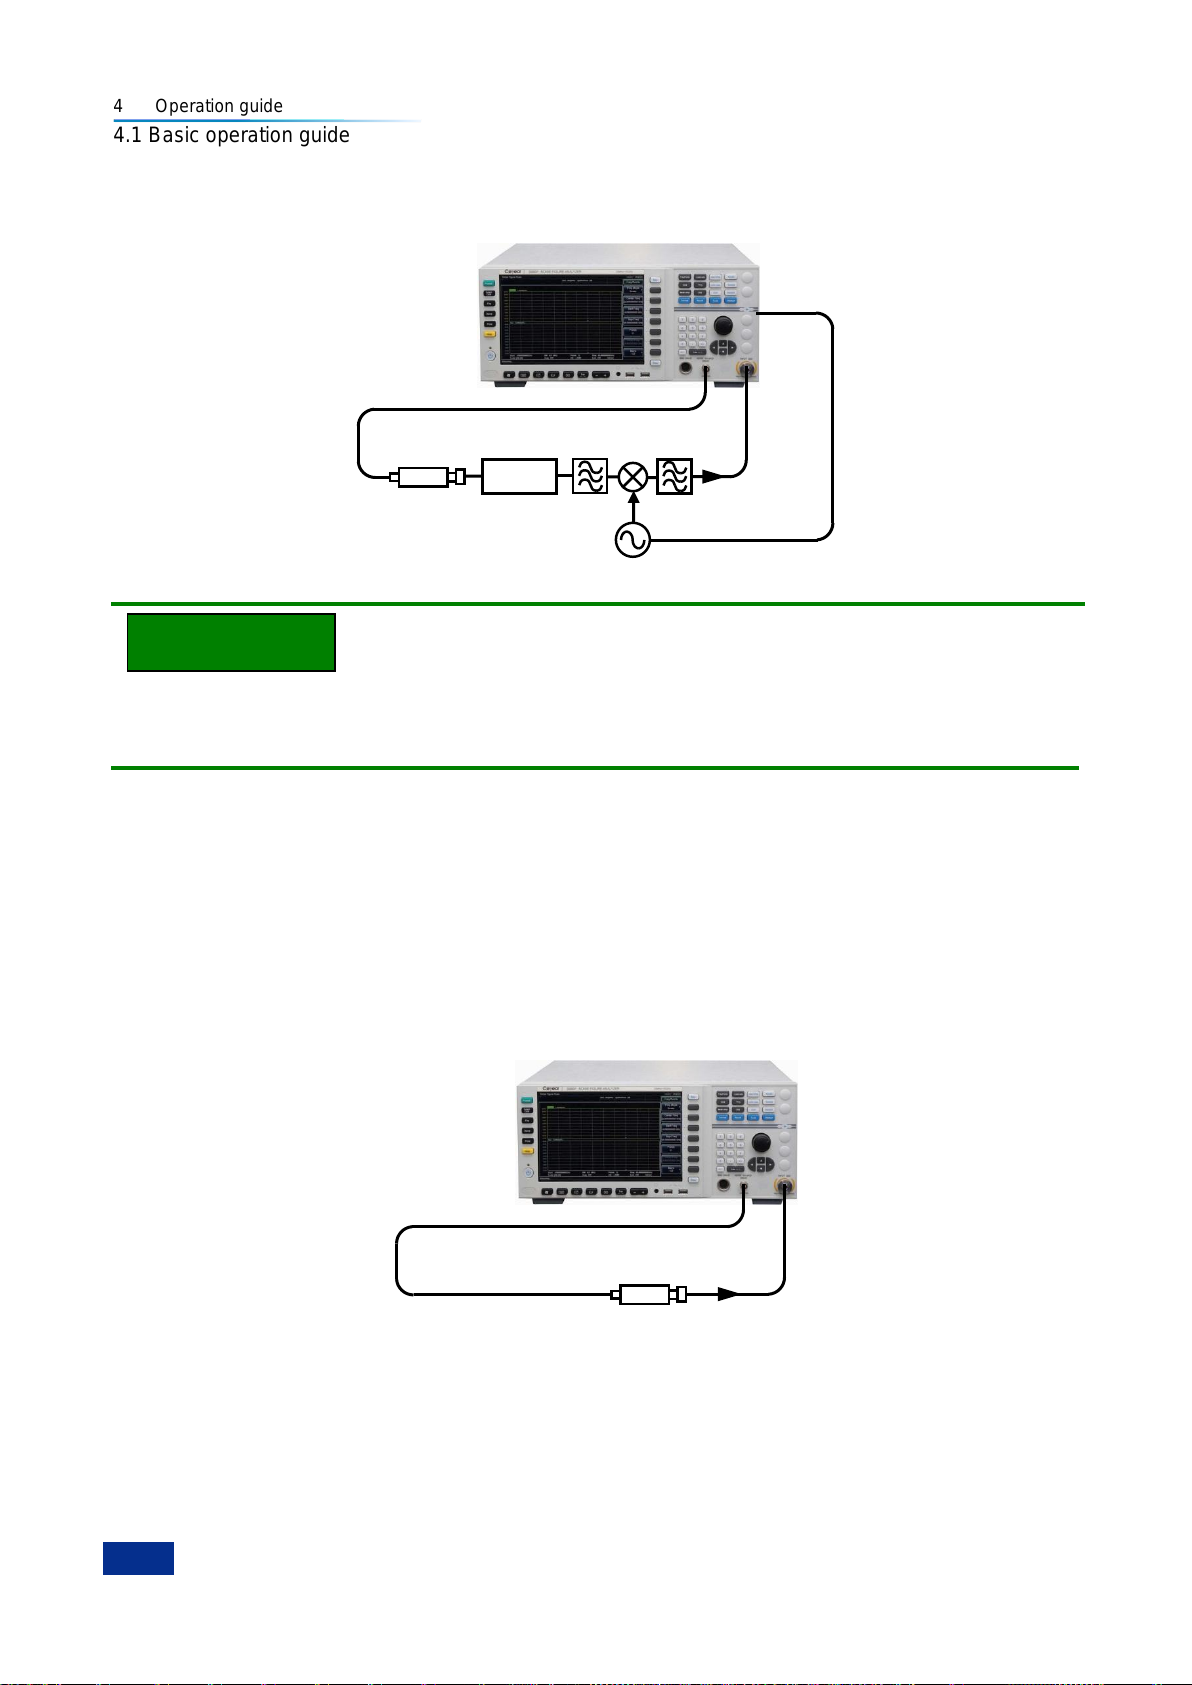
4 Operation guide
76
DUT
Noise source
LO
LAN
Noise source
NOTE
4.1 Basic operation guide
Step 3. After the calibration is completed, insert the DUT between the noise source output and the RF
input port of the system downconverter for measurement. The measurement connection of the
system downconverter mode is shown in Fig.4.6.
Fig.4.6 Measurement Connection Diagram of System Downconverter Mode
A 10 MHz time base frequency reference can be connected to lock the noise figure analyzer and the LO
to the same frequency reference, for which the method is connecting the 10 MHz reference output/input
of the noise figure analyzer to the 10 MHz reference input/output port of the LO.
4.1.3.3 Upconverter and downconverter measurement mode
Steps for system connection:
Step 1. The noise figure analyzer controls external LO through the LAN interface. Connect the noise
figure analyzer and the LO‘s corresponding interface with a network cable. In the variable LO
and fixed IF mode, the noise figure analyzer control the output frequency and power of the LO
with the LAN, so as to enable automatic sweep measurement of the noise figure.
Step 2. The calibration connection of the converter test mode is shown in Fig.4.7. Turn on the noise
figure analyzer and press the【Preset】key to restore the factory default status.
Fig.4.7 Calibration Connection of Upconverter and Downconverter Test Mode
Step 3. After the calibration is completed, insert the DUT between the noise source output and the input
port (50Ω) of the noise figure analyzer for measurement. The measurement connection of the
converter test mode is shown in Fig. 4.8.
Page 89
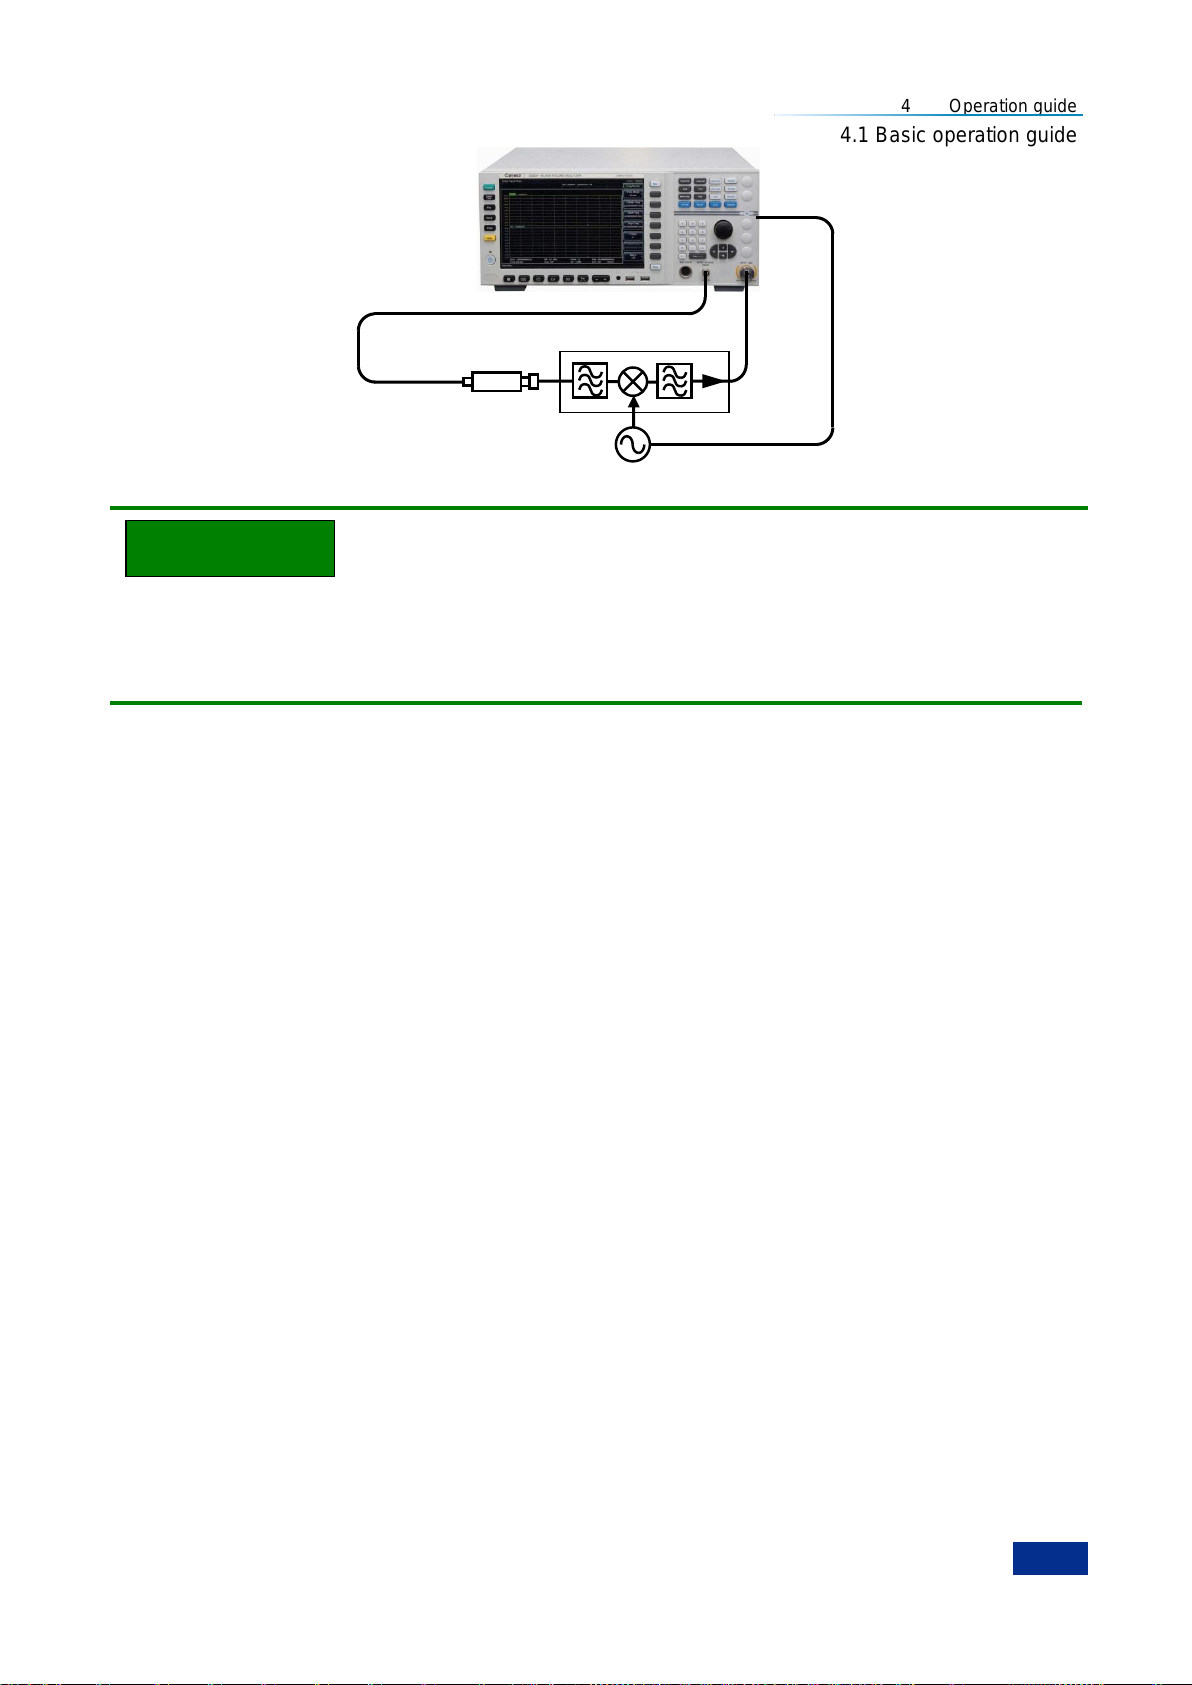
4 Operation guide
77
Noise source
LO
LAN
DUT
NOTE
4.1 Basic operation guide
Fig.4.8 Measurement Connection of Upconverter and Downconverter Measurement Mode
The calibrations and measurement connections of the upconverter and downconverter are identical. A
10MHz time base frequency reference can be connected to lock the noise figure analyzer and local
oscillator to the same frequency reference, for which the method is connecting the 10MHz reference
output/input of the noise figure analyzer to the 10MHz reference input/output port of the local oscillator.
4.1.4 Selection of External Local Oscillators
When upconverter and downconverter measurements are performed, it is required to convert the RF
range of the upconverter and downconverter to the IF frequency range that the noise figure analyzer can
receive through the external local oscillator. In the measurement process of system downconverter
mode, it is required to convert the RF frequency range of the DUT to the IF frequency range that the
noise figure analyzer can receive through the external local oscillator and the system downconverter, so
that the external local oscillator, the system downconverter and the noise figure analyzer can form a
noise figure measurement system for extend frequency measurement. This section mainly describes the
details related to the selection of external local oscillators.
4.1.4.1 Setting External Local Oscillator
The noise figure analyzer can control the output frequency and power of the external local oscillator by
mode setting. Special note: When the upconverter and downconverter or the system downconverter
works in the variable LO and fixed IF mode, the noise figure analyzer control the output frequency and
power of the LO with the LAN so as to enable automatic sweep measurement of the noise figure. The
setting related to the control of external LO is shown as below:
1) Set the IP address of the external local oscillator.
2) Set the settling time of the local oscillator.
3) Set the multiplier of the local oscillator.
4) Set the divider of the local oscillator.
5) Set the frequency offset of the local oscillator.
4.1.4.2 Influence of External Local Oscillator Signal Noise on Noise Figure Measurement
In the process of frequency conversion, the noise of the local oscillator signal may also enter the
receiving frequency band of the noise figure analyzer. Due to the influence of local oscillator noise, the
Page 90
4 Operation guide
78
Frequency range
Typical Gain
Typical noise figure
1GHz to 4GHz
-3dB
3dB
Attention
4.1 Basic operation guide
measured noise figure of the frequency converter is higher than the actual noise figure.
The power of the spurious signal of the local oscillator must be very low. If the spurious signal level of the
local oscillator is high at a certain frequency, a peak value will appear on the IF when the noise figure is
measured at the corresponding frequency point. Ideally the noise of local oscillator (including the power
of spurious signal) should be kept below -90 dBm in general.
If the converter has good isolation so as to well suppress the local oscillator noise, the influence of the
noise and spurious signals of the local oscillator on the measurement results can be reduced. If the
isolation between the local oscillator and the IF of the converter is poor, the local oscillator is required to
have a lower spurious power. If not, the noise of local oscillator can easily enter the noise figure analyzer
through the converter due to poor isolation, resulting in higher measured noise figure.
If the upconverter and downconverter adopt specific local oscillator signals in practical applications, it is
better to select this local oscillator signal as the local oscillator source for the noise figure measurement.
In this way the noise figure of the DUT under actual working conditions can be measured. When
performing extend frequency measurement in the system downconverter mode, the local oscillator
signal must have a low noise floor within the range of F
± FIF, which can reduce the noise figure of the
LO
noise figure extend frequency test system and improve the noise measurement accuracy.
4.1.4.3 Principles for Selecting Local Oscillators
1) The frequency range of the local oscillator should meet the requirements for the RF range, the IF
range and sideband selection of the DUT.
2) When performing variable LO sweep measurement, the noise figure analyzer can control the
frequency and power output of the LO through a LAN for the purpose of automatic sweeping
measurement of noise figure.
3) The local oscillator should be able to provide enough power to drive the converter.
4) The local oscillator should have good frequency accuracy and repeatability.
4.1.5 Examples of Basic Amplifier Measurement
The basic amplifier measurement is the most commonly used measurement mode of the noise figure
analyzer, which is used for measuring DUTs without frequency conversion, such as amplifiers,
attenuators and filters, isolators, and etc. And the frequency range of the selected noise figure analyzer
can cover the operating frequency range of the DUT.
This section describes the basic noise figure measurement and various related operations with the
attenuator measurement as the example. In the example, the frequency range of the attenuator is
1GHz~4GHz, and its technical specifications are shown in Table 4.1.
Table 4.1 Technical Specifications of Attenuator
4.1.5.1 Calibrate
The first step is to calibrate the noise figure analyzer for noise figure measurement with second-stage
correction.
Page 91
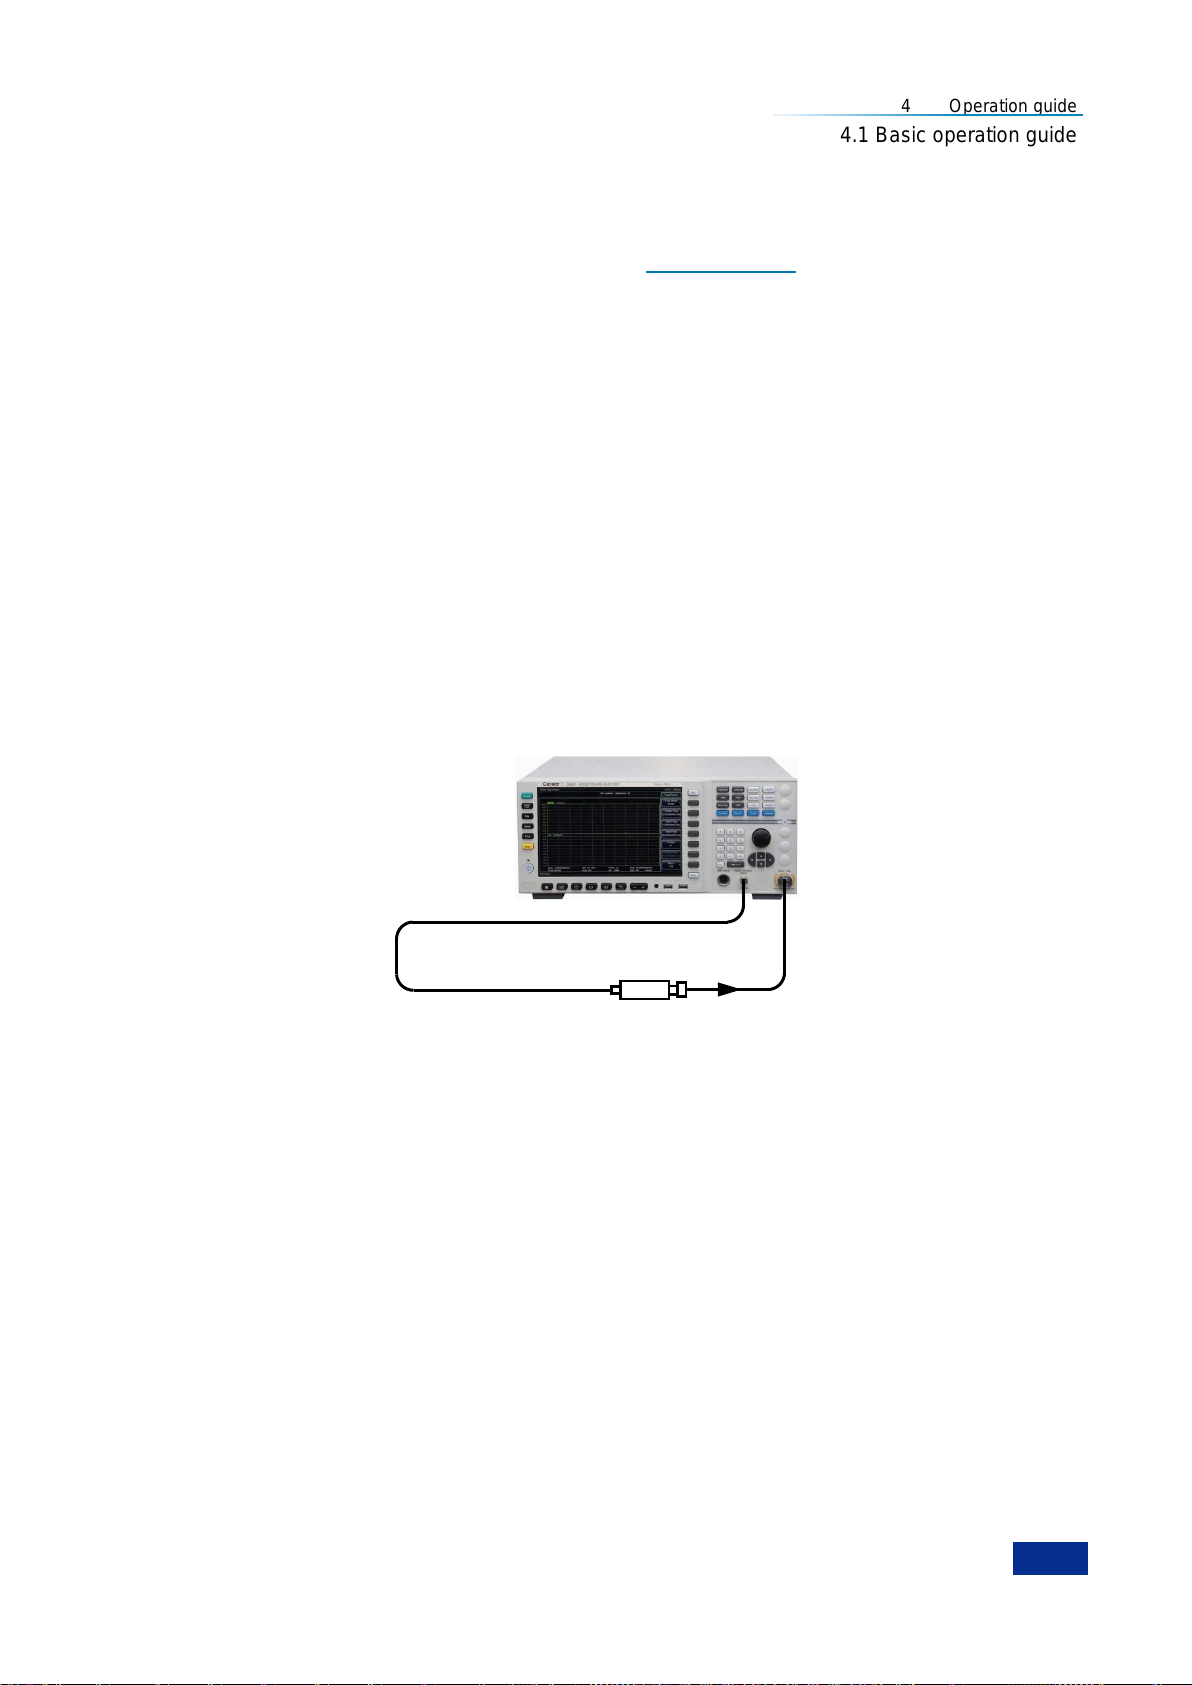
4 Operation guide
79
Noise source
4.1 Basic operation guide
Step 1. Turn on the power switch and wait for the startup program of the NFA to be activated. For better
measurement accuracy, it is recommended to warm up the NFA for more than 30 minutes.
Step 2. Press the green【Preset】key to restore the noise figure analyzer to the factory default state.
Step 3. Input the ENR of the noise source according to ―3.3.5 Input ENR‖.
Step 4. Press the【Freq/Points】key to set the measurement frequency parameters.
1) Freq Mode - Sweep, which is the default frequency mode for noise figure analyzer.
2) Start Freq - 1GHz.
3) Stop Freq - 4GHz.
4) Points - 11, the default value of the noise figure analyzer is 11.
Step 5. Press the【Avg】key and the [Average] menu key panel to set the [Average On Off] mode, press
the numeric key to input the average number "2", and press [OK] key to complete the input.
Step 6. Press the【Corr】key to set RF Min Cal Att and RF Max Cal Att as required. The default RF Min
Cal Att is 0 dB while the RF Max Cal Att is 20 dB. When the default attenuation is used, this
step can be omitted.
Step 7. As shown in Fig.4.9, connect the noise source drive input end to the +28V noise source drive
port on the noise figure analyzer panel with a BNC cable. (When an smart noise source is used,
connect the noise source to the smart noise source drive port on the noise figure analyzer
panel with a multi-core cable), and connect the noise source output to the input port (50Ω) of
the noise figure analyzer.
Fig. 4.9 Diagram of Calibration Connection with Normal Noise Source
Step 8. Press 【Calibrate】key to enter the Calibrate menu, and press the [Calibrate] menu key twice for
calibration.
Page 92
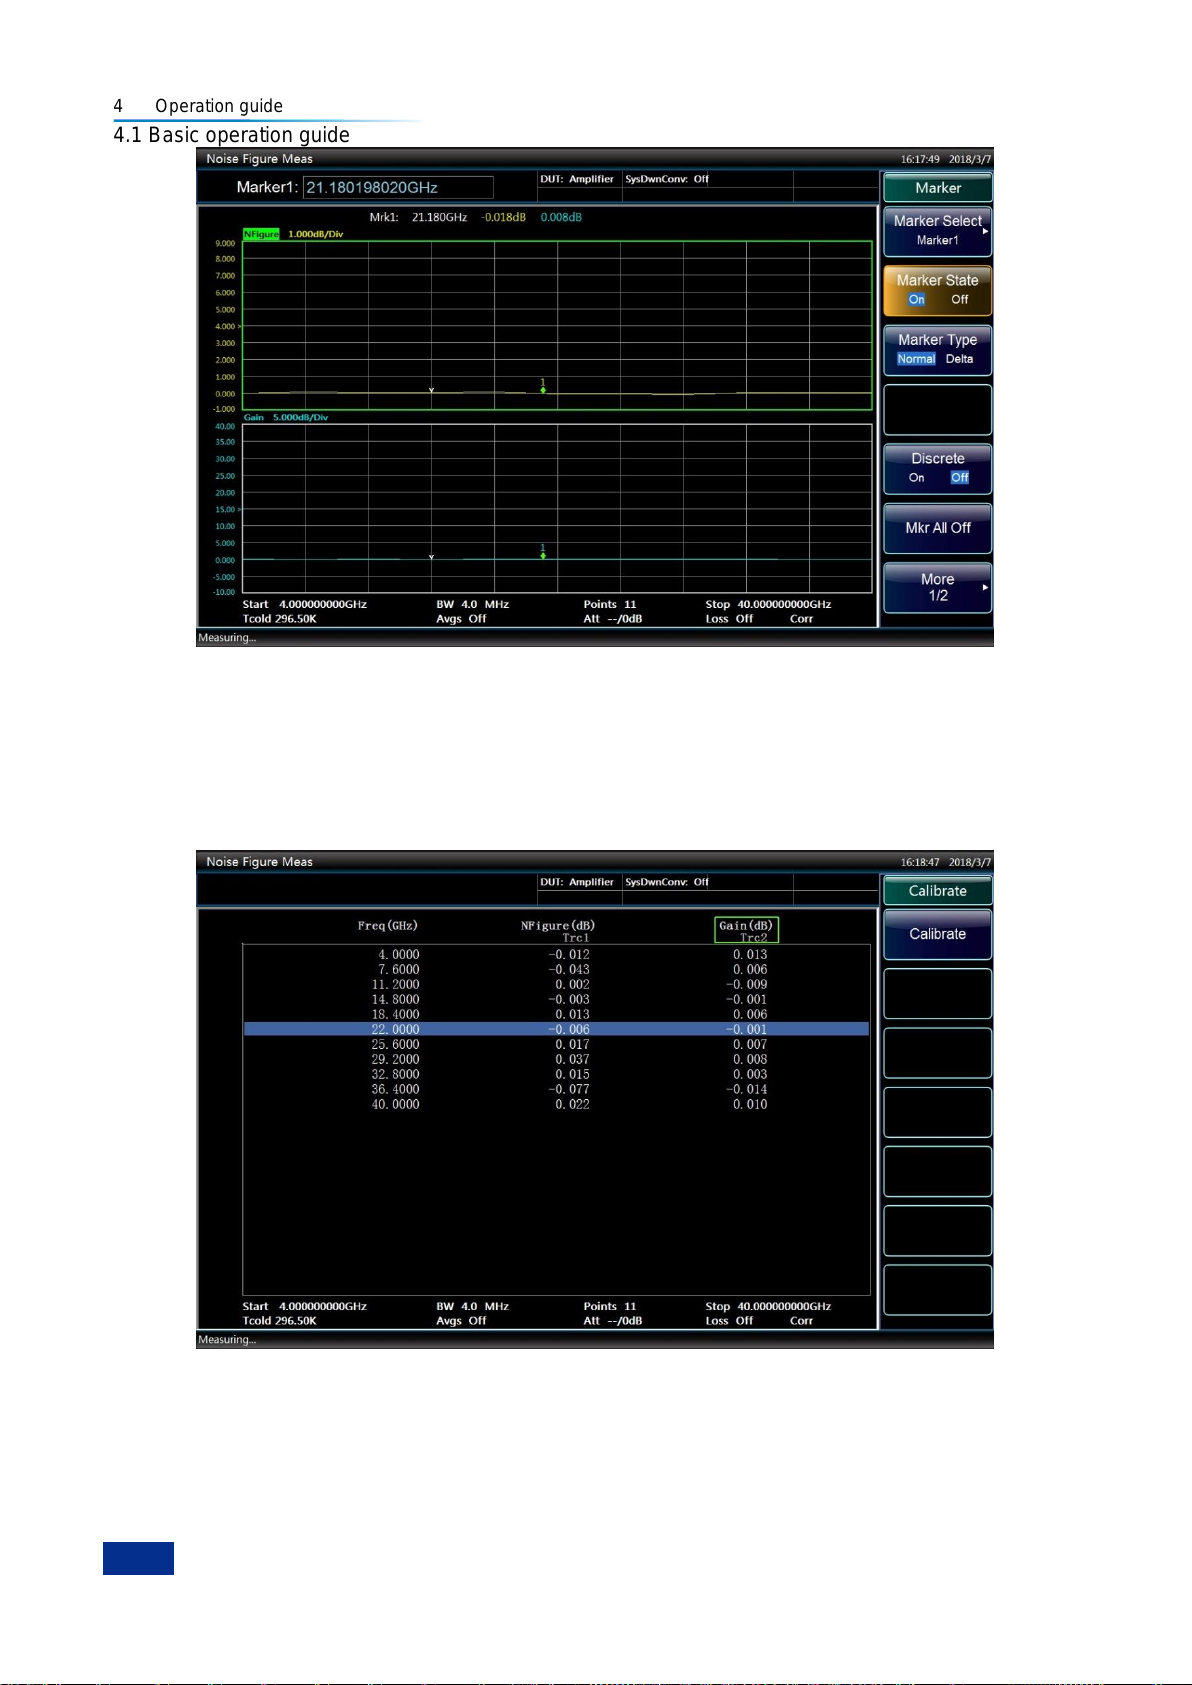
4 Operation guide
80
4.1 Basic operation guide
Fig.4.10 Typical Graph Display Result after Calibration
After the calibration is completed, the correction status at the bottom of the display screen will change
from "Uncorr" to "Corr" automatically. If the DUT is not connected, the displayed values of noise figure
and gain are close to 0 dB. The graph display is as shown in Figure 4.10, while table display is as shown
in Fig. 4.11. Since the excitation is a white noise signal, the calibrated display values of noise figure and
gain will jitter up and down around 0dB.
Fig. 4.11 Typical Table Display Result after Calibration
4.1.5.2 Measurement
After the calibration is completed, measure the noise figure and the gain of the DUT:
Step 1. Disconnect the noise source output port from the input port (50) of the noise figure analyzer.
Step 2. Connect the DUT output to the input port (50) of the noise figure analyzer.
Page 93
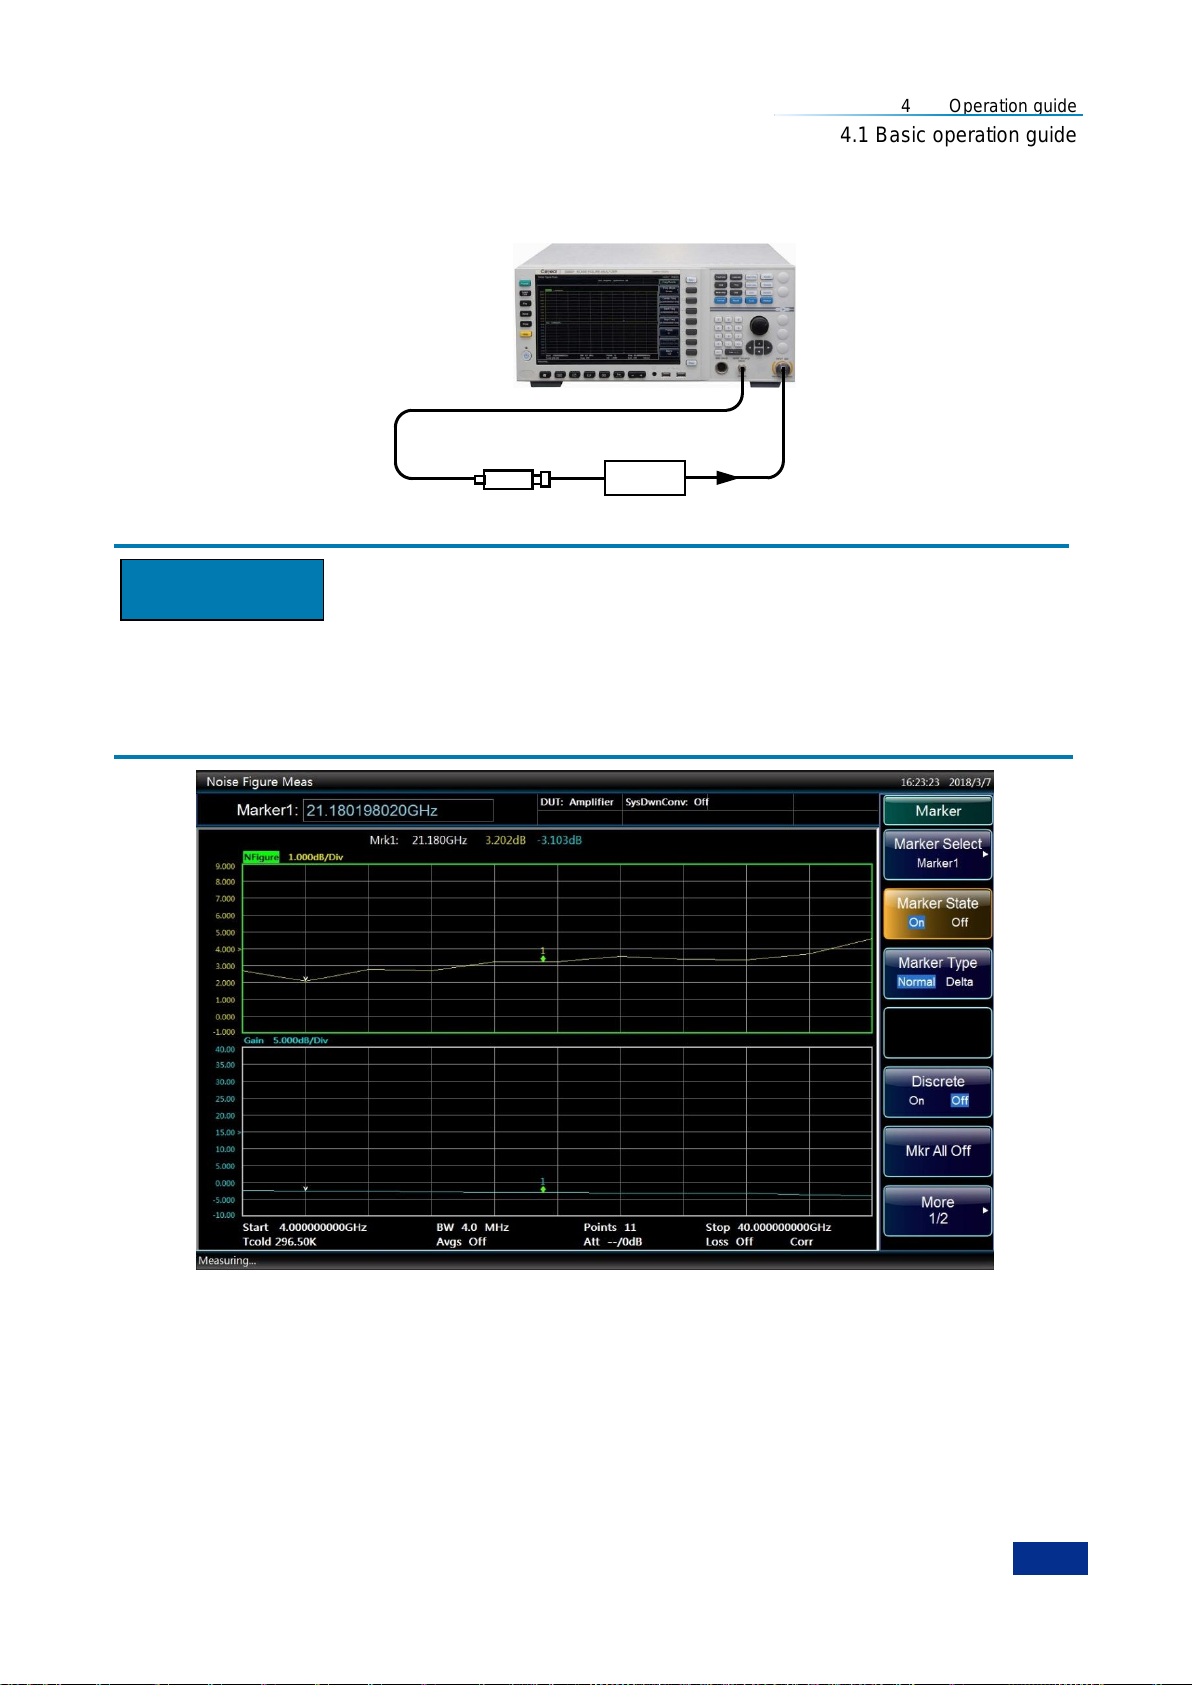
4 Operation guide
81
Noise source
DUT
Attention
4.1 Basic operation guide
Step 3. Connect the noise source output to the DUT input as shown in Figure 4.12. After the connection
is completed, the measurement result will be displayed on the display screen of the noise figure
analyzer. The graph display result is as shown in Fig.4.13.
Figure 4.12 Connect DUT for Measurement
The noise figure analysis can accurately measure a gain range of -20dB~+40dB. If the gain of the DUT
exceeds the optimum gain measurement range of the noise figure analyzer, you can add an attenuator
at the output of the DUT and utilize the loss compensation function of the noise figure analyzer to
improve the noise figure measurement accuracy.
Figure 4.13 Graph Display of Measurement Results
Step 4. Press the【Format】key, [Display Format] menu key and the [Table] menu key to select the table
display mode. The displayed result is shown in Figure 4.14.
Page 94
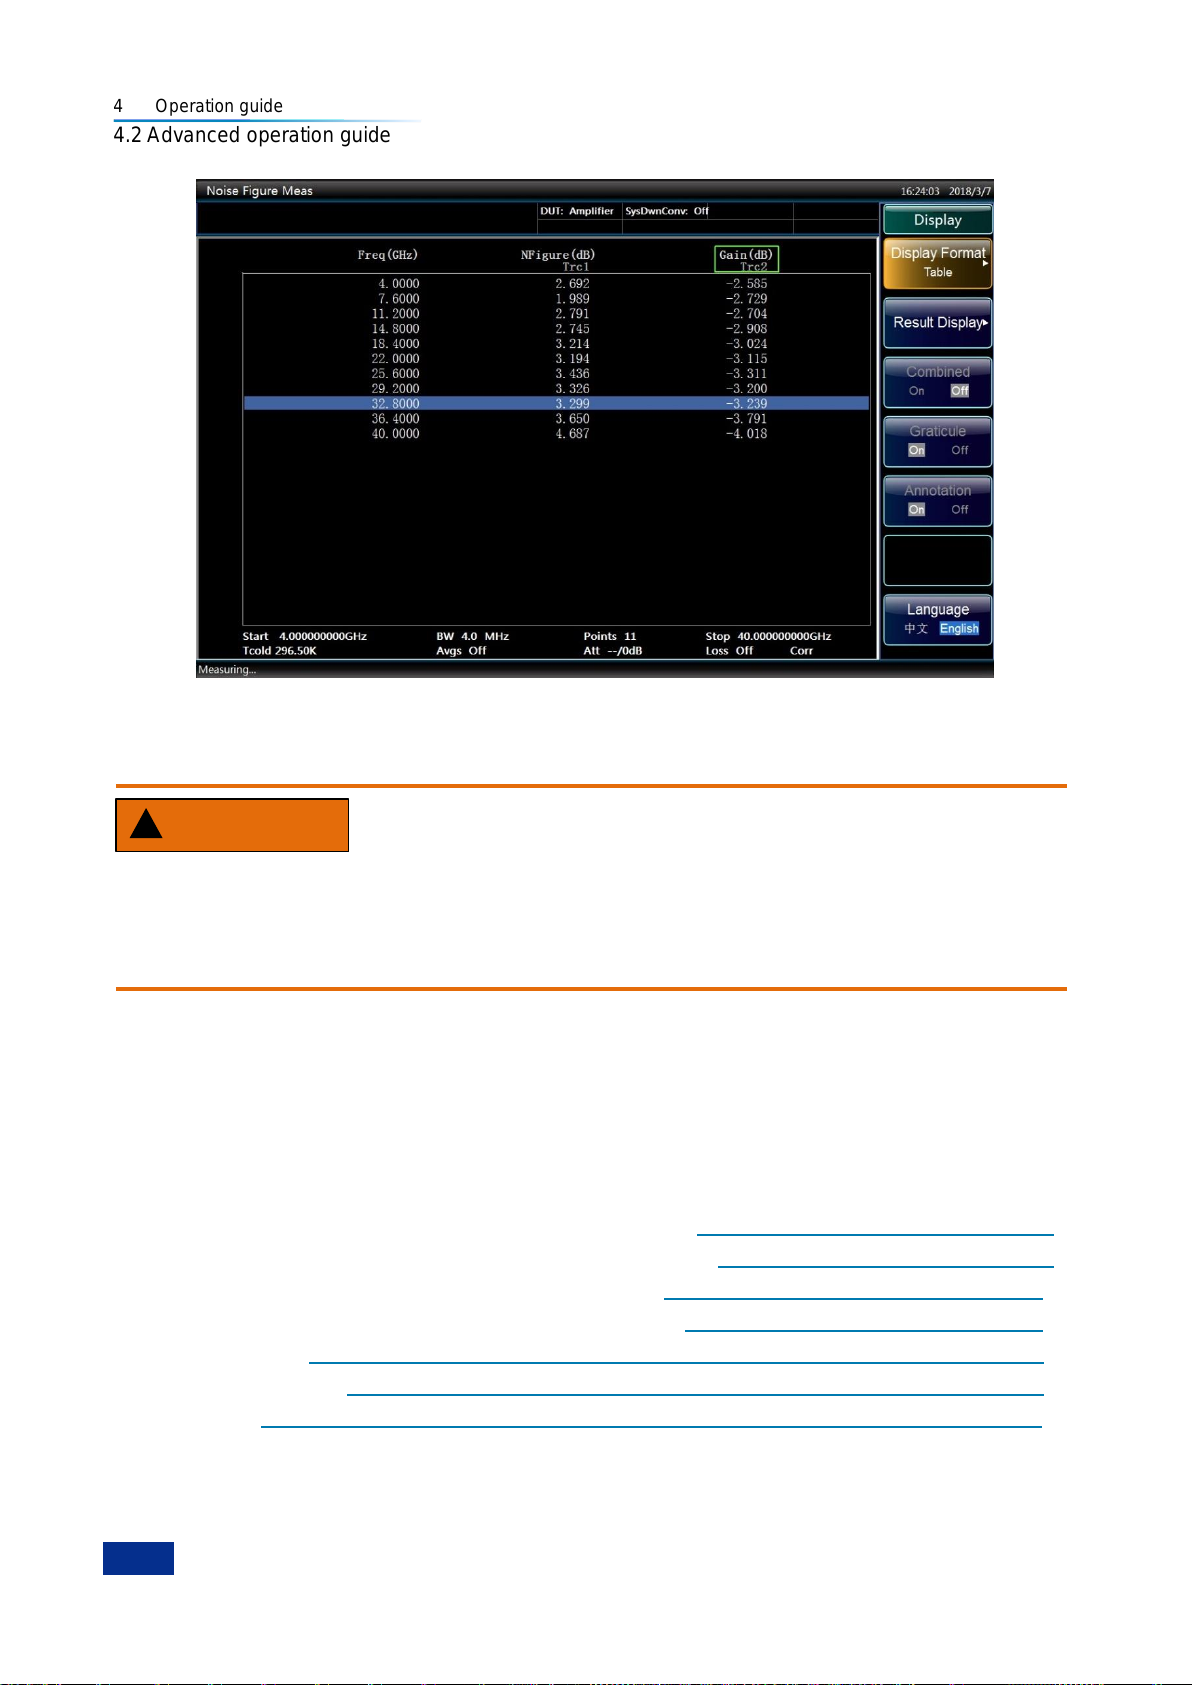
4 Operation guide
82
WARNING
4.2 Advanced operation guide
Figure 4.14 Table Display of Measurement Results
The results shown in Figure. 4.13 and Figure. 4.14 show that the noise figure of the DUT is about 3.0dB,
and the gain -3dB, which meets the specifications in Table 4.1.
Prevent damages to the instrument:
When measuring the active DUTs of the amplifier class, the power supplies of the DUT and the noise
figure analyzer must be in common ground connection, otherwise front-end components of the internal
receiver of the noise figure analyzer may be damaged.
4.2 Advanced operation guide
This part introduces the relatively complicated measurement and operation procedures of 3986 series
noise figure analyzer, mainly including the measurement guide and examples of upconverter and
downconverter, measurement guide and examples of system downconverter mode, frequency limit, loss
compensation and limit lines, so as to help the user to use the noise figure analyzer with agility and
master its extended functions.
Guide for Upconverter and Downconverter Measurement……………………………………………82
Examples for Upconverter and Downconverter Measurement…………………………………………92
Guide for System Downconverter Mode Measurement………………………………………………100
Examples of System Downconverter Mode Measurement……………………………………………105
Frequency Limit……………………………………………………………………………………………113
Loss Compensation………………………………………………………………………………………117
Limit Lines…………………………………………………………………………………………………121
4.2.1 Guide for Upconverter and Downconverter Measurement
In the upconverter and downconverter measurement mode, the DUT (device under test) proceeds
Page 95
4 Operation guide
83
Attention
4.2 Advanced operation guide
frequency transformation itself, but no frequency transformation occurs in calibration channel. During
calibration, the noise source is to be connected to the input port of the noise figure analyzer, the hot and
cold noise powers are measured, and then the noise figure analyzer calculates its native noise figure
with the use of the ENR value corresponding to the intermediate frequency (IF) in ENR table. The hot
and cold noise power and the noise figure analyzer‘s own noise figure are applied in the noise figure and
gain calculation of DUT. During the measurement, noise figure analyzer measures the hot and cold noise
power of the DUT cascaded with the noise figure analyzer when the noise source is on and off. Noise
figure analyzer calculates the radio frequency (RF) input frequency of the DUT, and computes the noise
figure with the use of the ENR value corresponding to the RF frequency in the ENR table. When the
measured point is out of the nominal ENR frequency range, the instrument will apply the linear
interpolation method to get the ENR value .
In the upconverter and downconverter measurement mode, the 3986 series noise figure analyzer only
calibrates within the IF range of the upconverter and downconverter. When the converter operates in
variable LO mode, the default settings of the start frequency and stop frequency of 3986 series noise
figure analyzer correspond to the RF range of the DUT; when the converter operates in fixed LO mode,
the default settings of the start frequency and stop frequency correspond to the IF range of the DUT.
The upconverter and downconverter measurements usually work in two modes.
1) Variable LO and fixed IF
When upconverter and down converter are in variable LO mode, they output fixed IF, and the noise
figure analyzer operates at the fixed IF point of the DUT. This mode is applied to measurie the RF
response features of the DUT.
2) Fixed LO and variable IF
When the upconverter and downconverter are in fixed LO mode, they output sweeping IF, and the noise
figure analyzer operates at the sweeping IF range of the DUT. This mode is applied to measure the IF
response features of the DUT.
Technical details related to the upconverter and downconverter noise figure measurement procedures
are described in detail below, so to help you accurately measure the noise figure with the noise figure
analyzer.
4.2.1.1 Sideband and image frequency
For the upconverter and downconverter noise figure measurement, the noise source as the
measurement standard excitation outputs the broadband white noise of which the noise sideband higher
than the local oscillator is called as upper sideband, i.e. USB, and the noise sideband lower than the
local oscillator is called as lower sideband, i.e. LSB. For the simple analysis, the output of mixer ideally
includes the sum frequency and difference frequency signals of RF and LO frequency. Therefore, for the
purpose of fixed IF frequency and fixed LO frequency, there are two different RF input frequencies being
transformed to IF output frequency as shown in Fig.4.15.
Page 96
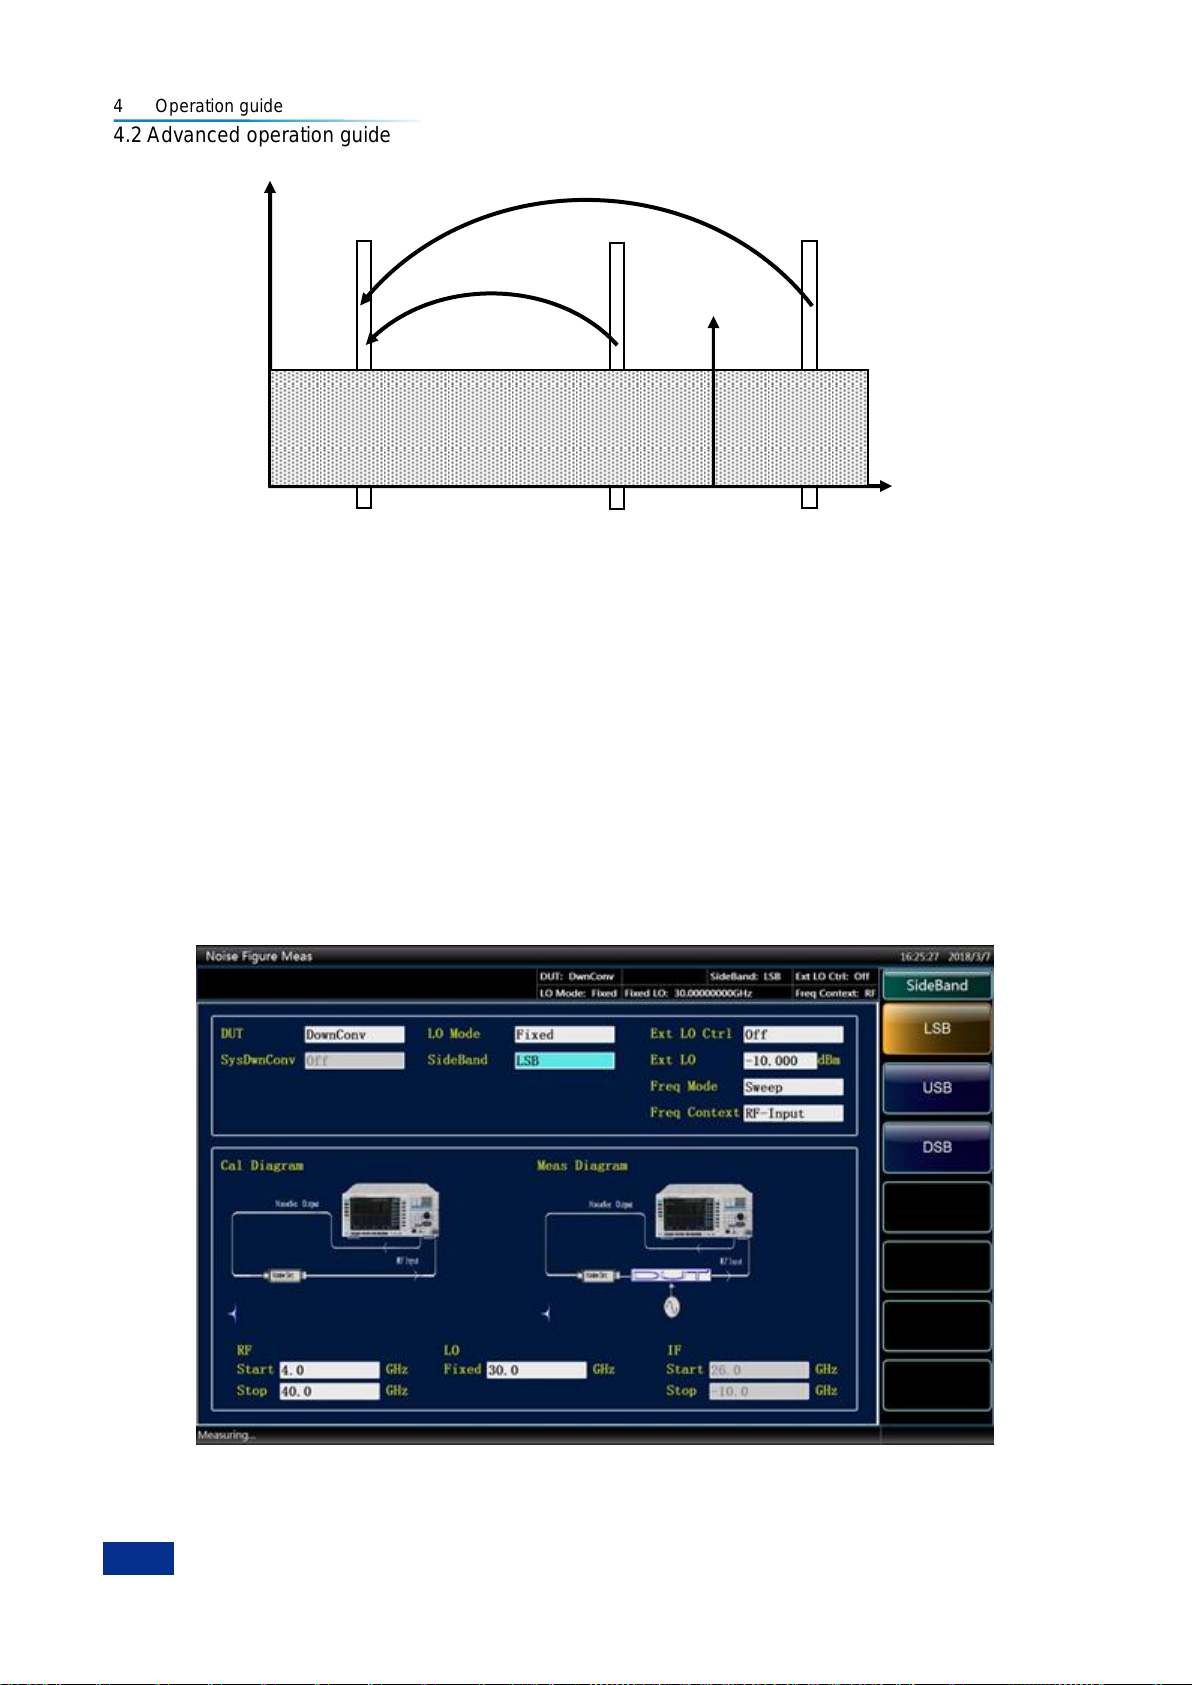
4 Operation guide
84
NFA input
FLO-F
LSB
Mixing
F
USB-FLO
Mixing
FLO
Amplitude
Freq
LSB input
LSB
Broadband noise
4.2 Advanced operation guide
Figure 4.15 Sideband Description
The 3986 series noise figure analyzer is capable of measuring the single-sideband and double-sideband
noise figure with the functions of setting, controlling the measurement and processing the data for the
single sideband (upper sideband and lower sideband) and double sideband. The setting interface of
sideband is as shown in Fig.4.16.
If the input port of mixer is connected with filter, only the noise from the upper sideband or lower
sideband can enter the mixer and is transformed to the IF band which is then input into the noise figure
analyzer. This measurement is called as the single-sideband measurement, i.e. the single-sideband
(SSB), including LSB and USB. If no filter is provided at the input port of the mixer, the noise from both
upper sideband and lower sideband can enter the mixer and is transformed to the IF band which is then
input into the noise figure analyzer. This measurement is called as the double sideband measurement,
i.e. the double sideband (DSB).
Fig.4.16 Sideband Setup
Page 97

4 Operation guide
85
4.2 Advanced operation guide
4.2.1.2 Single-sideband measurement
1) Instructions for single-sideband (SSB) measurement
Most of the mixers are used for the single-sideband (SSB) mixing (including the lower sideband and
upper sideband). Therefore, the single-sideband noise figure shall be measured. For the
single-sideband measurement, the image frequency sideband, LO leakage and other products of
higher-harmonic mix shall be removed with the proper filter. The expensive filter is necessary for the
single-sideband measurement. Therefore, the double sideband measurement may also be selected with
necessary correction and compensation.
The filter shall be selected properly according to the measurement requirements and in consideration of
the following factors:
First, determine the working frequency range of DUT: RF input, LO input and IF output.
Calculate the image frequency range.
Calculate the frequency range covered by the harmonic mixing mode of the LO.
Select one filter between the noise source and DUT which permits the useful input frequency band
and prevents the unnecessary sideband signals.
Based on the local oscillator frequency range (and harmonic), determine whether the noise figure
analyzer input shall be protected by a filter to prevent the analyzer sensitivity from deteriorating due
to the local oscillator leakage.
It is necessary to place one filter between the DUT and noise figure analyzer to prevent the noise
figure measurement accuracy from being affected by the leakage from local oscillator to IF port.
If the filter is unable to meet all requirements due to the mutual conflict between any above frequency
ranges, the frequency range may be measured in sections with different filter for each frequency section.
If DUT is a complicated mixer and it already contains the filter for the corresponding frequency section,
make sure that the mixer is working at the single-sideband mode. For the noise figure measurement of
such mixer, the external filter is unnecessary.
Single-sideband mixer measurement is as shown in Fig.4.17 (downconverter, lower sideband), the
built-in filter of the mixer inhibits the upper sideband signal to make sure that the mixer is working at the
single-sideband mode. With the decrease of IF frequency, upper sideband and lower sideband become
closer to local oscillator frequency, which makes the filtering more difficult. With the decrease of IF, it is
impossible to conduct the filtering and single-sideband measurement. The filter bandwidth restricts the
sweep range of LO or IF during the measurement.
Page 98
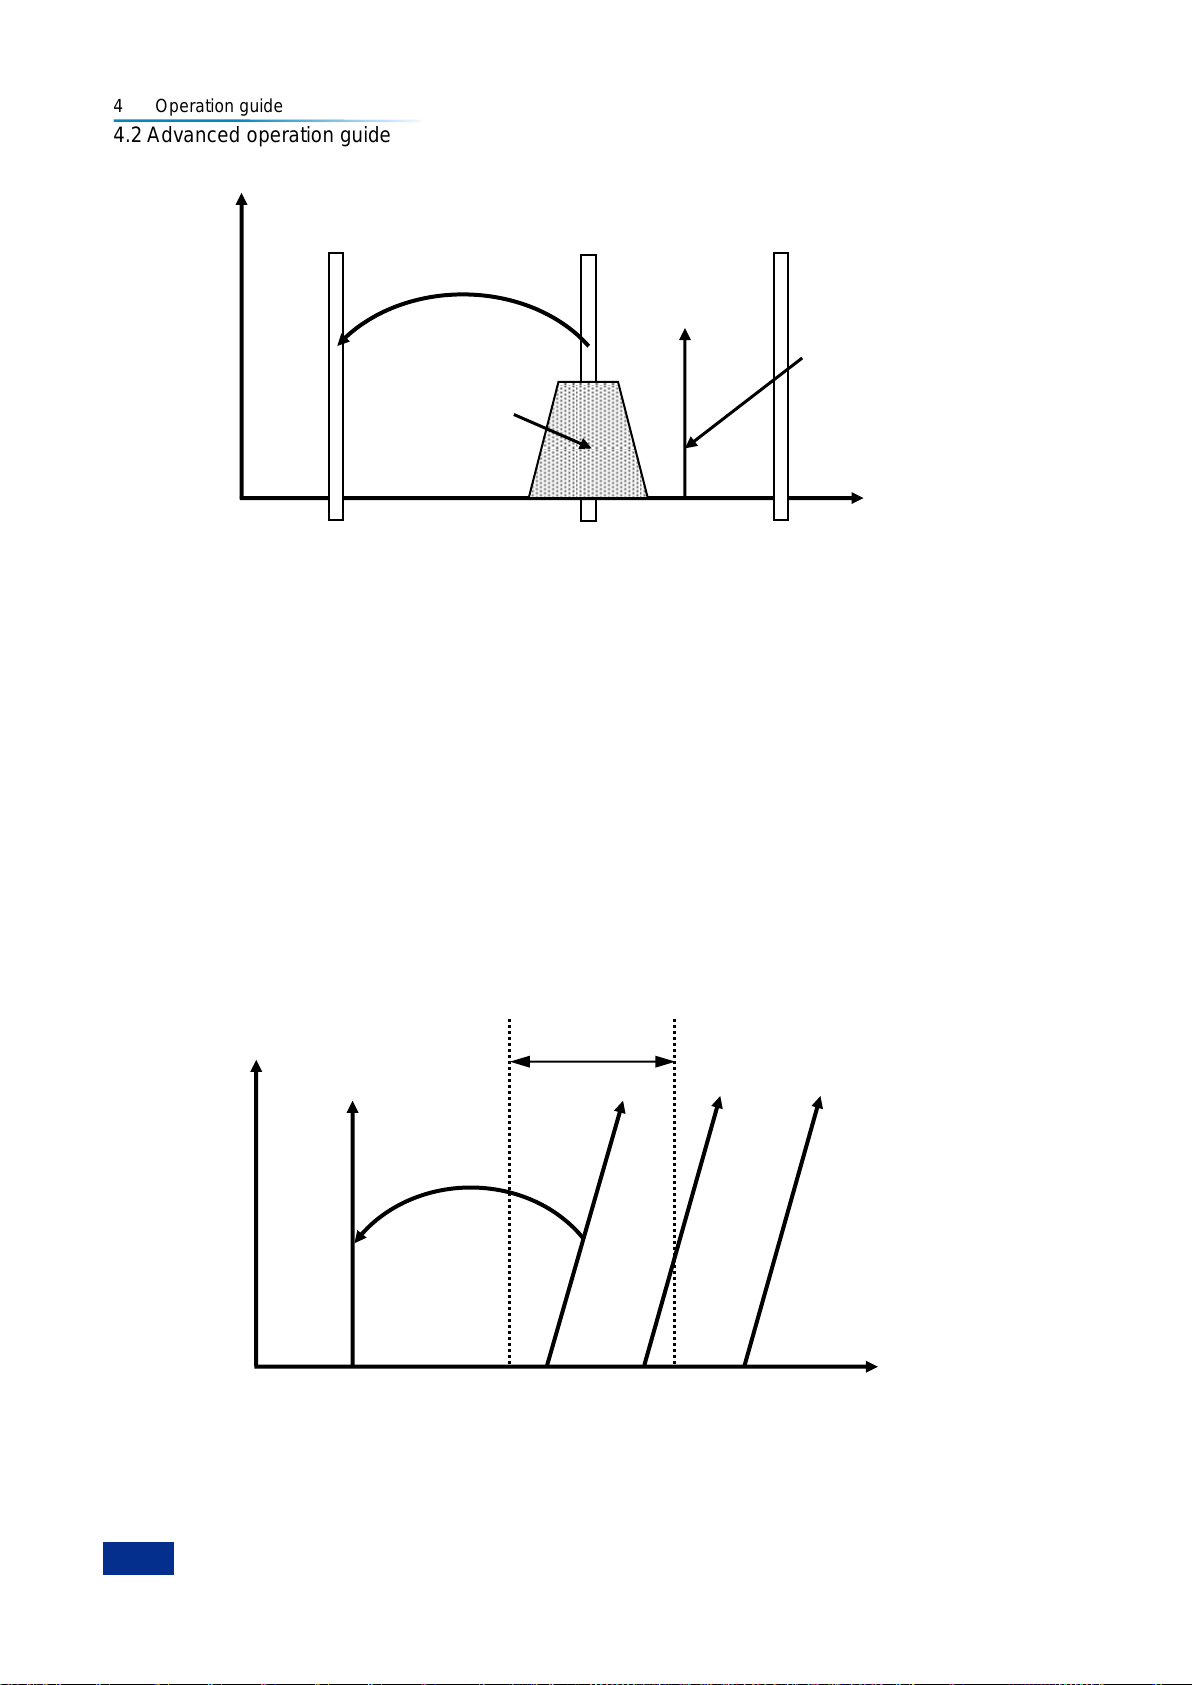
4 Operation guide
86
NFA input frequency band
FLO-F
LSB
Mixing
FLO
Ampl
Freq
LSB input
LSB output
The noise arriving
at the frequency
mixer through DUT
Based on the
frequencies of local
oscillator, it may be
necessary to
Connect the output
end of DUT with the
filter to inhibit the
local oscillator
leakage signal
FIF
FLO
Sweep point
Frequency
USB
LSB
Filter passband
Start
Stop
FLO-F
LSB
Mixing
4.2 Advanced operation guide
filter
Fig. 4.17 Single-sideband Mixer Measurement
The noise figure analyzer according to the mixer measurement mode setup, conduct the corresponding
frequency calculations, control the working frequency of noise figure analyzer and the output frequency
of external local oscillator, and measure the noise figure properly.
2) Local oscillator mode setup
a) Variable LO
In the Variable LO (fixed IF) mode, the LO frequency of measured converter is under the sweep status,
the IF frequency of converter which is input to the noise figure analyzer port is the fixed value.
i. Lower sideband variable LO and fixed IF
The changing situations of filter passband, RF frequency, sweep LO frequency and fixed IF for the
downconverter sweep measurement of lower sideband variable LO and fixed IF mode are as shown in
Fig.4.18. This mode measures the noise figure of the mixer, and this is the typical application of
single-sideband mode.
The filter is used to inhibit the upper sideband (USB) via the lower sideband (LSB). Actual filter has a
certain transitional bandwidth. Therefore, a gap shall be left between the maximum frequency of lower
sideband and the minimum frequency of upper sideband. For the actual measurement, a higher IF may
Fig.4.18 Lower Sideband Measurement
Page 99
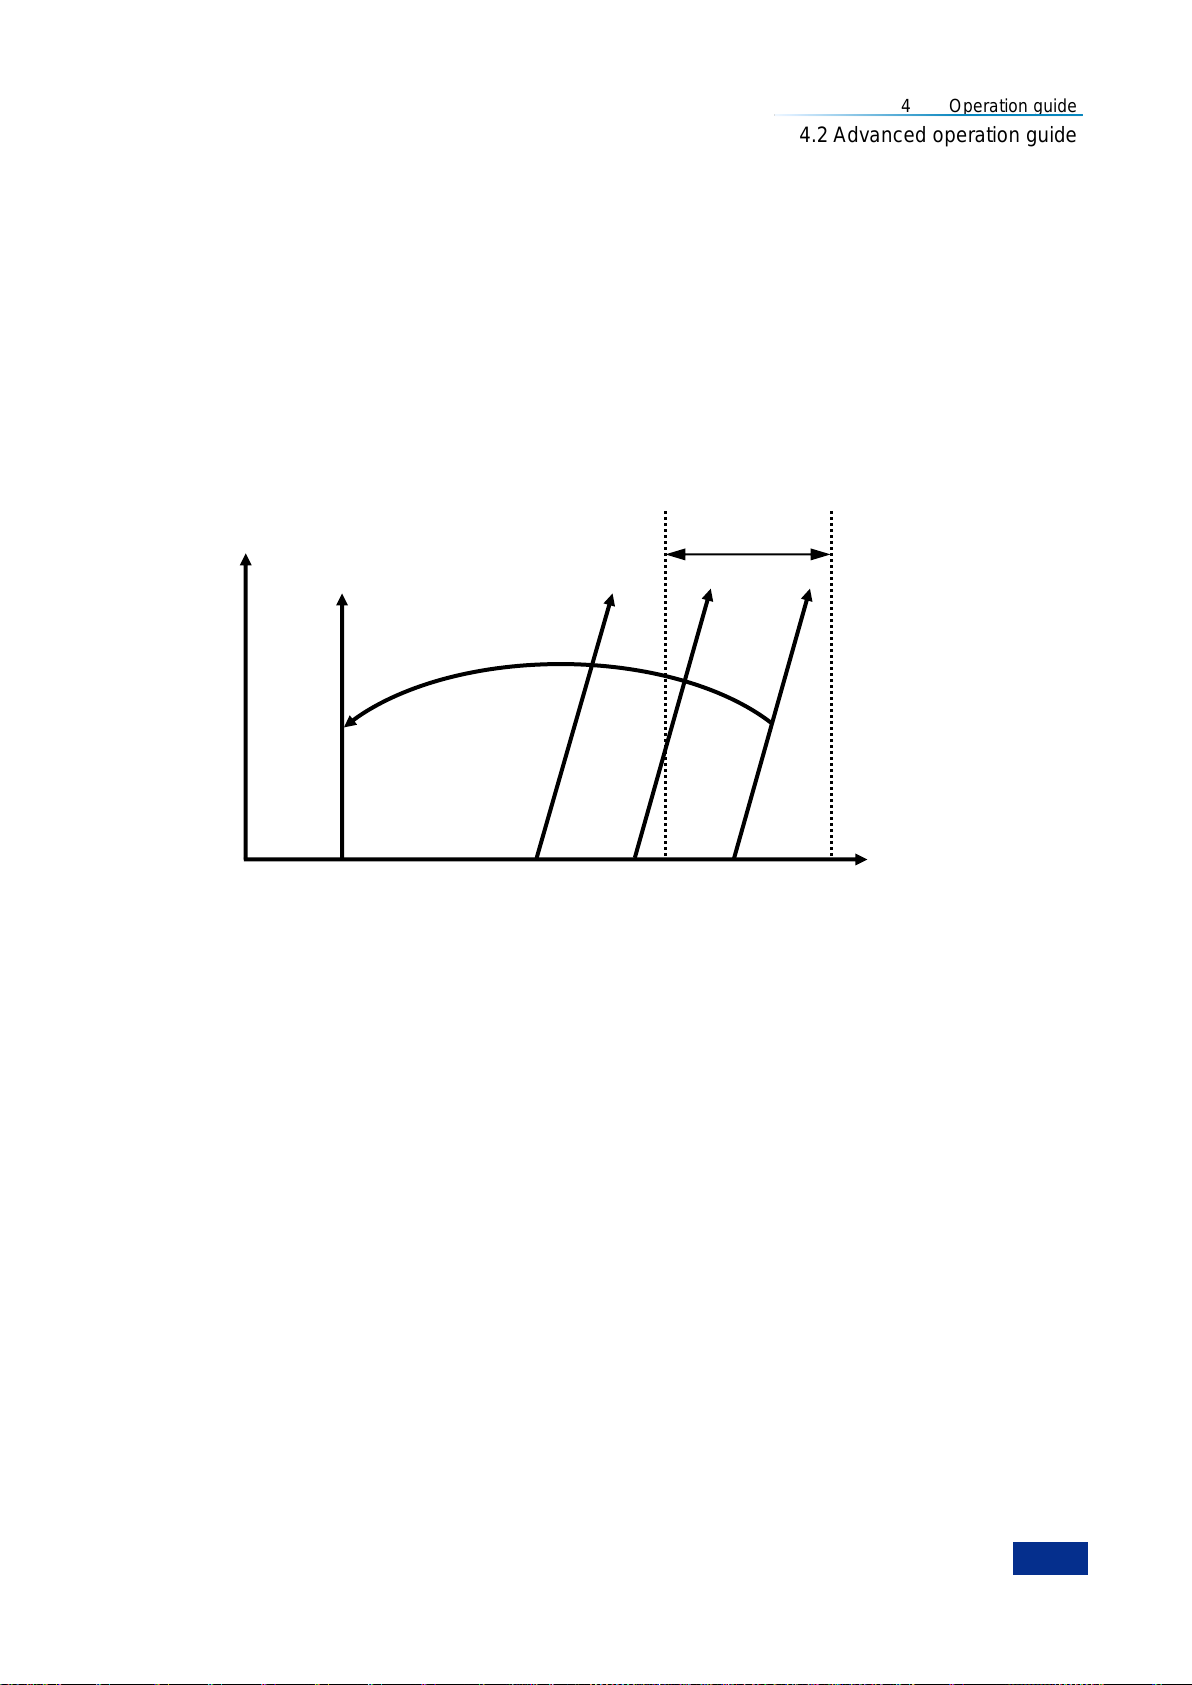
4 Operation guide
87
FLO
USB
Sweep point
Frequency
LSB
Filter passband
Start
Stop
FIF
F
USB-FLO
Mixing
4.2 Advanced operation guide
be used to enlarge the frequency gap between the upper sideband (LSB) and lower sideband (LSB) so
as to conduct the sweep measurement at broader range and simplify the filter design.
The filter may be low-pass type or band-pass type, and shall permit the signals within the lower sideband
sweep frequency range but inhibits the signals within the upper sideband sweep frequency range. The
sweep width as shown in Fig.4.18 shall not be more than 2×IF frequency.
ii. Upper sideband variable LO and fixed IF
Upper sideband variable LO and fixed IF mode is similar with the lower sideband variable LO and fixed
IF mode, and the filter shall be band-pass type or high-pass type. Band-pass filter has the advantage of
inhibiting the parasitic harmonic mixing mode signal. The related settings of this mode are as shown in
Fig.4.19, similarly the sweep width shall be less than 2×IF frequency range minus the filter transitional
bandwidth.
Fig.4.19 Upper Sideband Measurement
b) Fixed LO
The main advantage of fixed LO is that the programmable local oscillator signal source is unnecessary.
The disadvantages include the limited available sweep width and more stringent requirements for the
sideband selection filter. At the fixed LO (variable IF) mode, the mixer‘s output sweep IF is input to the
noise figure analyzer input port , and the LO frequency is fixed during the measurement.
i. Lower sideband fixed LO variable IF
Fig.4.20 shows how the noise figure analyzer sweeps the tuned receiving frequency reversely from HF
to LF with the increase of RF frequency at the lower sideband measurement mode. The filter in need
may be low-pass type or band-pass type, with the maximum sweep width not more than the maximum IF
frequency minus the transitional bandwidth of filter.
Page 100
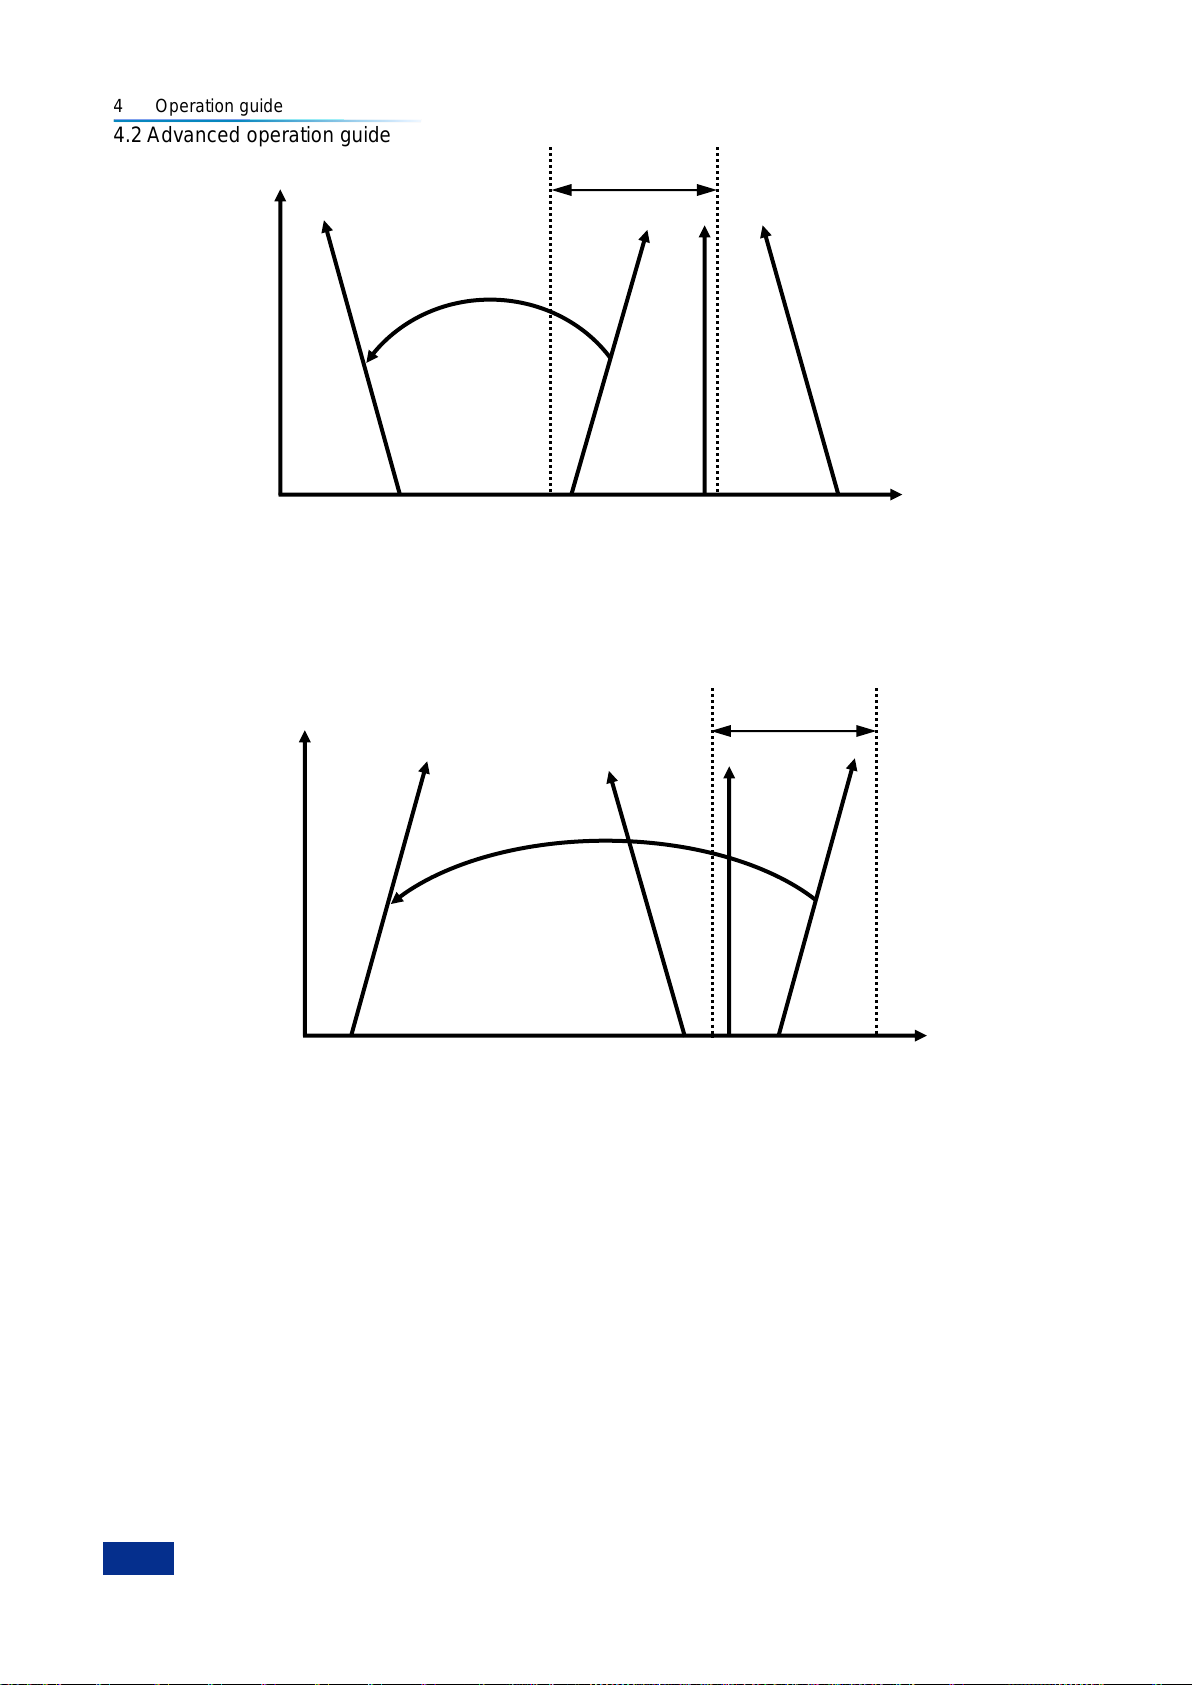
4 Operation guide
88
Start
Stop
FLO
Sweep point
Frequency
USB
LSB
Filter passband
FIF
FLO-F
LSB
Mixing
Start
Stop
FLO
Sweep points
Frequency
USB
LSB
Filter passband
FIF
F
USB-FLO
Mixing
4.2 Advanced operation guide
Fig.4.20 Lower Sideband Measurement
ii. Upper sideband fixed LO variable IF
Fig.4.21 shows how the noise figure analyzer tunes the receiving frequency at normal direction at the
upper sideband fixed LO mode. The filter may be band-pass type or high-pass type, with the maximum
sweep width not more than the maximum IF frequency minus the transitional bandwidth of filter.
Fig.4.21 Upper Sideband Measurement
4.2.1.3 Double sideband measurement
1) Instructions for double sideband (DSB) measurement
Double sideband noise figure measurement mode is necessary for the following two conditions:
The filter can not be provided for inhibiting the image frequency.
Single-sideband filter can not cover the necessary measurement frequency range.
The filtering is necessary for the double sideband measurement. However, the performance indicator
requirements for filter may be simplified significantly. The above measurement advantages of double
sideband is at the expense of frequency resolution and measurement accuracy.
If the IF frequency of DUT is low, it can be ensured that the noise source ENR, DUT gain and noise
figure is linear between two sidebands, and the average power of two sidebands is equal to the noise
power of center frequency point and local oscillator frequency point.
Fig.4.22 shows that the noise from both sidebands will increase combinedly during the measurement
 Loading...