

Cerio CS-2424G User Manual
CERIO Corporation
24 Port 10/100/1000M Gigabit Web Managed Switch with 4
CS-2424G
SFP Ports
User’s Manual

FCC Warning
This device has been tested and found to comply with limits for a Class A digital device, pursuant
to Part 2 and 15 of the FCC Rules. These limits are designed to provide reasonable protection
against harmful interference when the equipment is operated in a commercial environment.
This equipment generates, uses and can radiates radio frequency energy and, if not installed
and used in accordance with the user’s manual, may cause interference in which case user will
be required to correct the interference at his own expense.
CE Mark Warning
This is a Class A product. In a domestic environment, this product may cause radio interference
in which case the user many be required to take adequate measures.

1. Introduction ......................................................................................................................................... 6
1.1 Feature ........................................................................................................................................ 6
1.2 Package Contents .................................................................................................................... 8
1.3 Front Panel ................................................................................................................................. 8
1.4 Rear Panel Layout .................................................................................................................... 9
2. Software Configuration .................................................................................................................. 10
2.1 Example of Segment: (Windows 7).................................................................................... 10
2.2 System login username and password information ..................................................... 14
3. System Status ................................................................................................................................... 15
3.1 Device Information ................................................................................................................. 15
3.2 Port Flow Chart ....................................................................................................................... 16
3.3 Traffic Statistics ...................................................................................................................... 16
3.4 MAC Tabl e ................................................................................................................................ 17
3.5 System Load ............................................................................................................................ 18
3.6 Network Detection .................................................................................................................. 19
4. Network .............................................................................................................................................. 20
4.1 IP Address ................................................................................................................................ 20
4.2 MAC Address ........................................................................................................................... 21
4.3 DNS Settings............................................................................................................................ 21
4.4 DHCP Protect (snooping) ..................................................................................................... 22
4.5 DHCP Option82 ....................................................................................................................... 23
4.6 IGMP Snooping ....................................................................................................................... 24
4.7 Multicast VLAN........................................................................................................................ 26
4.8 Voice VLAN .............................................................................................................................. 26
4.9 MAC VLAN ................................................................................................................................ 28
4.10 802.1x ......................................................................................................................................... 28
4.11 LLDP .......................................................................................................................................... 31
4.12 STP ............................................................................................................................................. 32
4.13 Loop Detection ........................................................................................................................ 34
4.14 Jumbo Frame ........................................................................................................................... 35
4.15 RSTP .......................................................................................................................................... 35
4.16 SNMP ......................................................................................................................................... 36
5. Port Configuration ........................................................................................................................... 37
5.1 Port Configuration.................................................................................................................. 37
5.2 MDIX Configuration................................................................................................................ 38
5.3 Port Mirroring .......................................................................................................................... 38

5.4 MAC Limit ................................................................................................................................. 39
5.5 Port Aggregation .................................................................................................................... 40
5.6 Port-IP-MAC-Binding ............................................................................................................. 42
5.7 Rate Limit.................................................................................................................................. 43
5.8 Storm Control .......................................................................................................................... 44
6. Security .............................................................................................................................................. 45
6.1 Port Grouping .......................................................................................................................... 45
6.2 Port Isolation ........................................................................................................................... 46
6.3 MAC filter .................................................................................................................................. 46
6.4 DOS Defense ........................................................................................................................... 47
7. VLAN Configuration ........................................................................................................................ 49
7.1 802.1Q VLAN ............................................................................................................................ 49
7.2 PVID............................................................................................................................................ 50
8. ACL ...................................................................................................................................................... 50
8.1 MAC ACL ................................................................................................................................... 50
8.2 IP ACL ........................................................................................................................................ 51
9. QoS ...................................................................................................................................................... 53
9.1 Global Setting .......................................................................................................................... 53
9.2 Queue Weight .......................................................................................................................... 53
9.3 Queue Algorithm ..................................................................................................................... 54
9.4 Default Priority ........................................................................................................................ 55
9.5 Priority Mapping ..................................................................................................................... 55
9.6 QOS Trust ................................................................................................................................. 56
10. System Setting ................................................................................................................................. 57
10.1 Quick Settings ......................................................................................................................... 57
10.2 Web Management ................................................................................................................... 57
10.3 Internal No. ............................................................................................................................... 58
10.4 Administrator ........................................................................................................................... 58
10.5 System Config ......................................................................................................................... 59
10.6 Firmware Upgrade .................................................................................................................. 60
10.7 System Time ............................................................................................................................ 60
10.8 Reboot ....................................................................................................................................... 62
11. System Log ........................................................................................................................................ 63
11.1 Event Log.................................................................................................................................. 63
11.2 Alarm Log ................................................................................................................................. 64
11.3 Security Log ............................................................................................................................. 64
11.4 Network Log ............................................................................................................................. 65

Specifications ............................................................................................................................................... 66

1. Introduction
CERIO CS-2000 Series Model: CS-2424G is a powerful high-performance 4 SFP Gigabit 24
port 10/100/1000Mbps web managed switch and supports Remote control and management
through a web-based User Interface. This Layer 2 Web Managed switch supports Spanning
Tree / Rapid Spanning Tree protocol, Port base IEEE802.1Q VLAN Tagging, IGMP snooping,
IEEE802.1p port-based QoS, and Bandwidth control / Loop Detection. CS-2424G’s high
performance gigabit design provides reliable performance and allows for easy management of
auto-negotiation speeds.
The CERIO CS-2000 Series CS-2424G Web Managed Switch is ideal for minimizing network
downtime, connecting subnets for improved performance, and enabling the bandwidth
demanded for multimedia and imaging applications. CS-2424G effectively reduces operational
costs by allowing network administrators to remotely access and monitor their network,
ultimately eliminating the need for constant on-site maintenance staff. CS-2424G’s layer 2 web
managed design also increases network security by providing enhanced network control
through port management and visible MAC table addresses/clients. This device’s high feature
and high performance design, paired with an easy to use web interface, effectively improves
both network management and efficiency for medium and large sized applications
1.1 Feature
Complying with IEEE 802.3 10Base-T, IEEE 802.3u 100Base-TX, IEEE 802.3ab
1000Base-T, IEEE 802.3z 1000Base-SX/LX,IEEE 802.3az EEE
24port 10/100/1000Mbps TX Auto-Negotiation Ethernet Switch ,
Supports 4 Gigabit SFP uplink ports and MinIGBic1000Base-SX/LX
Full/Half-Duplex capability on each TX port , Auto-learning networking configurations
Supports store & forward operation
Supporting the flow control: back pressure for Half-duplex and IEEE 802.3x for Full-duplex
mode
Non-blocking & Non-head-of-line blocking full-wire speed forwarding
Supports network interface Auto MDIX function for auto TX/RX swap
Automatic Source MAC Address Learning and Aging
Provides 9K Jumbo frames to improve network utilization of a large file transfers

Supports up to 8K MAC addresses
Up to 4Mb Packet Buffer size
VLAN and IEEE802.1Q tag-base VLAN based on ports & VIDs; add/remove/modify tag
IEEE802.3ad Link Aggregation LACP
Provides IGMP v1/v2/v3 snooping function
Supports Bandwidth Control with KB/s size control
Supports 802.1x protocol to support CHAP, EAP mode and port/MAC based network
access control
Supports DoS (Denial of Service) Defense for enhanced network security
Link Layer Discovery Protocol (LLDP) and LLDP-MED
Supports DHCP Snooping function to prevent access by unauthorized hosts and DHCP
servers
Each port supports limiting the number of MAC Addresses with IP and MAC address
Binding
Supports Access Control List (ACL) for MAC and IP Address filtering
Supports QoS Quality of Service, Port-based QoS bandwidth management, 802.1q priority
Tag based with 8 priority Queues and 8 Weights
Supports bandwidth control to set control traffic limits (inflow and outflow) for each port
Supports Port Mirroring function
Supports Spanning Tree Protocol (STP) and Rapid Spanning Tree Protocol (RSTP)
Supports proxy DNS Server and NTP network time synchronization function
Supports Event Log, Alarm Log, Security Log, Network Log, and Protocol Log
Supports web-based HTTP web management user interface and supports SNMP v1/v2c
Supports GUI display for monitoring network data status by port, traffic analysis by port,
and device CPU and Memory loading for convenient administrative network analysis and
management
CS-2424G Main Unit
x1
D Manual
x1
Power Cord
x1
19” Mount Brackets
x1
Warranty Card
x1
1.2 Package Contents
Before you start to install this switch, please verify your package contains the following items:
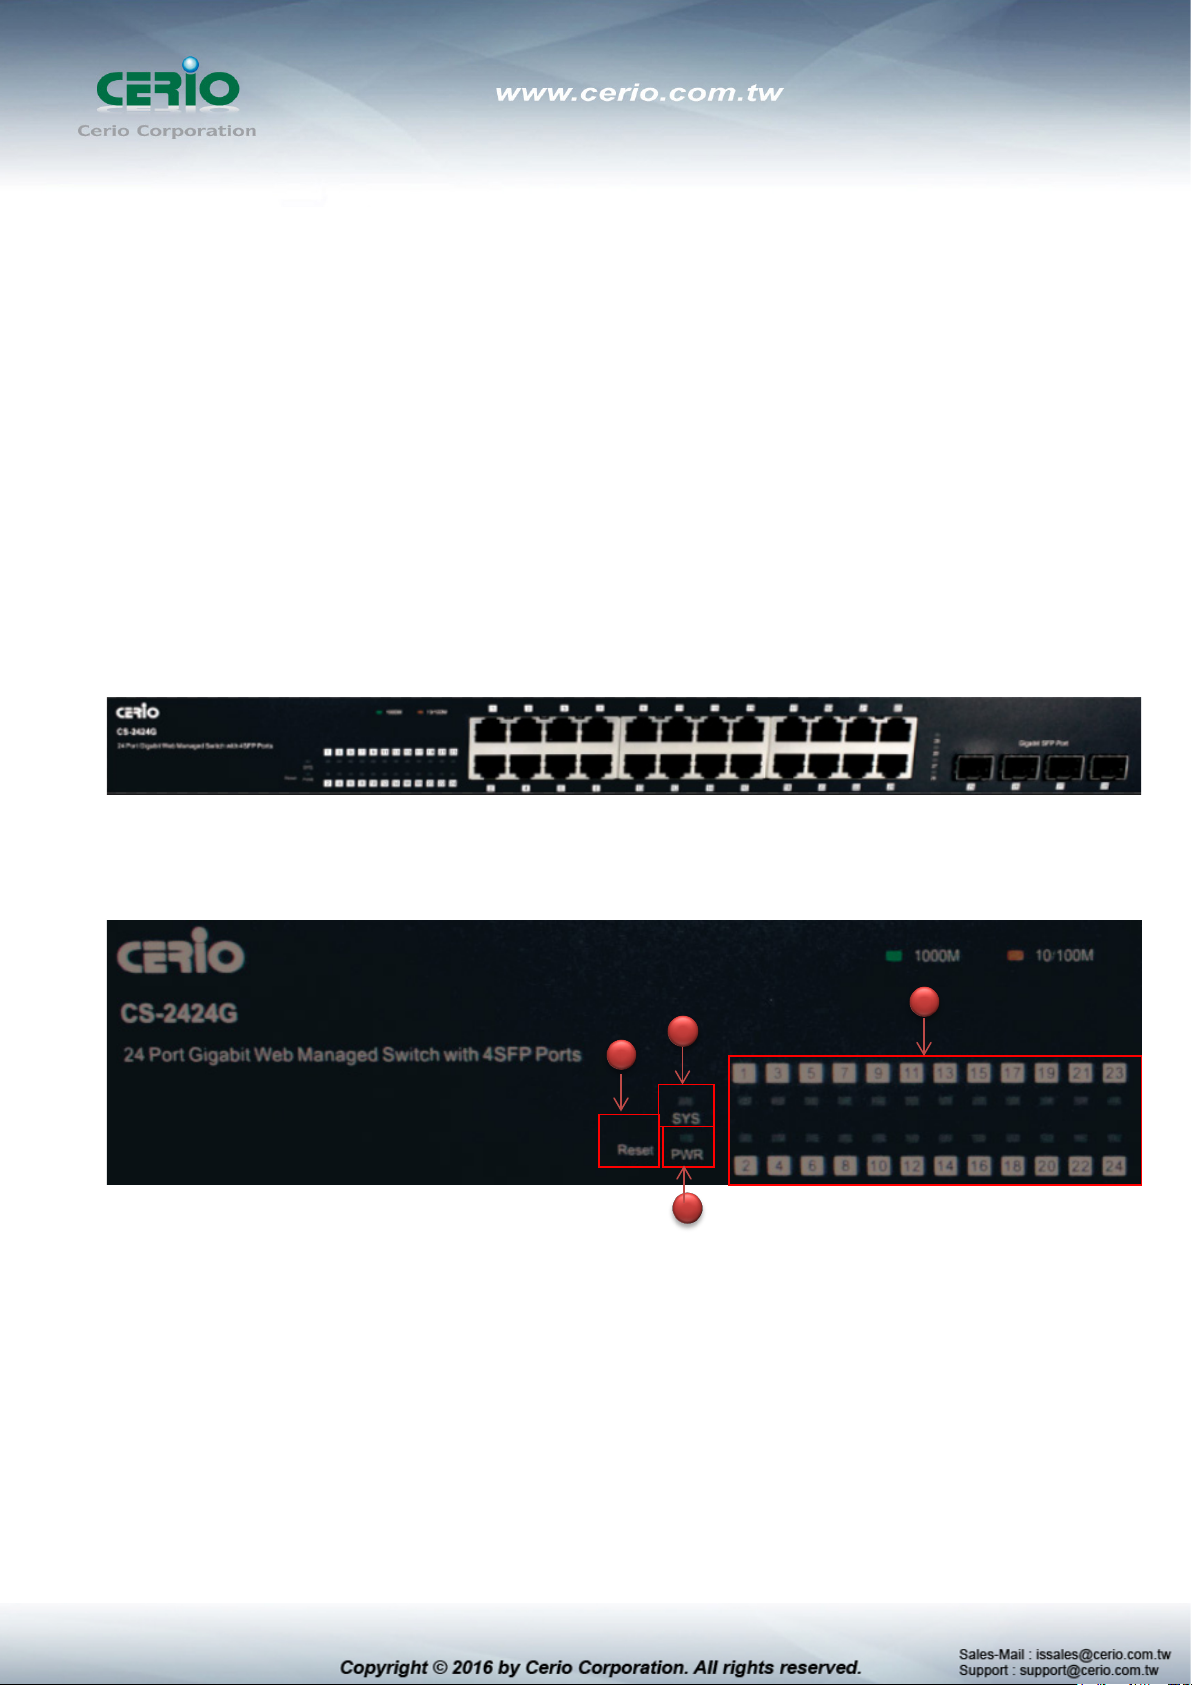
1.3 Front Panel
Status LED lights for 24 Port 10/100/1000Mps with 4 SFP Port
Status Explanation
4
2
1
1) Hardware Reset button, press and hold for approximately 10 seconds. Once all the LED
lights begin to flash, release the button to reset to default
2) System operational LED light
3) Power LED light.
3
4) 24 10/100/1000Mbps Port Link/ACT LED status light.
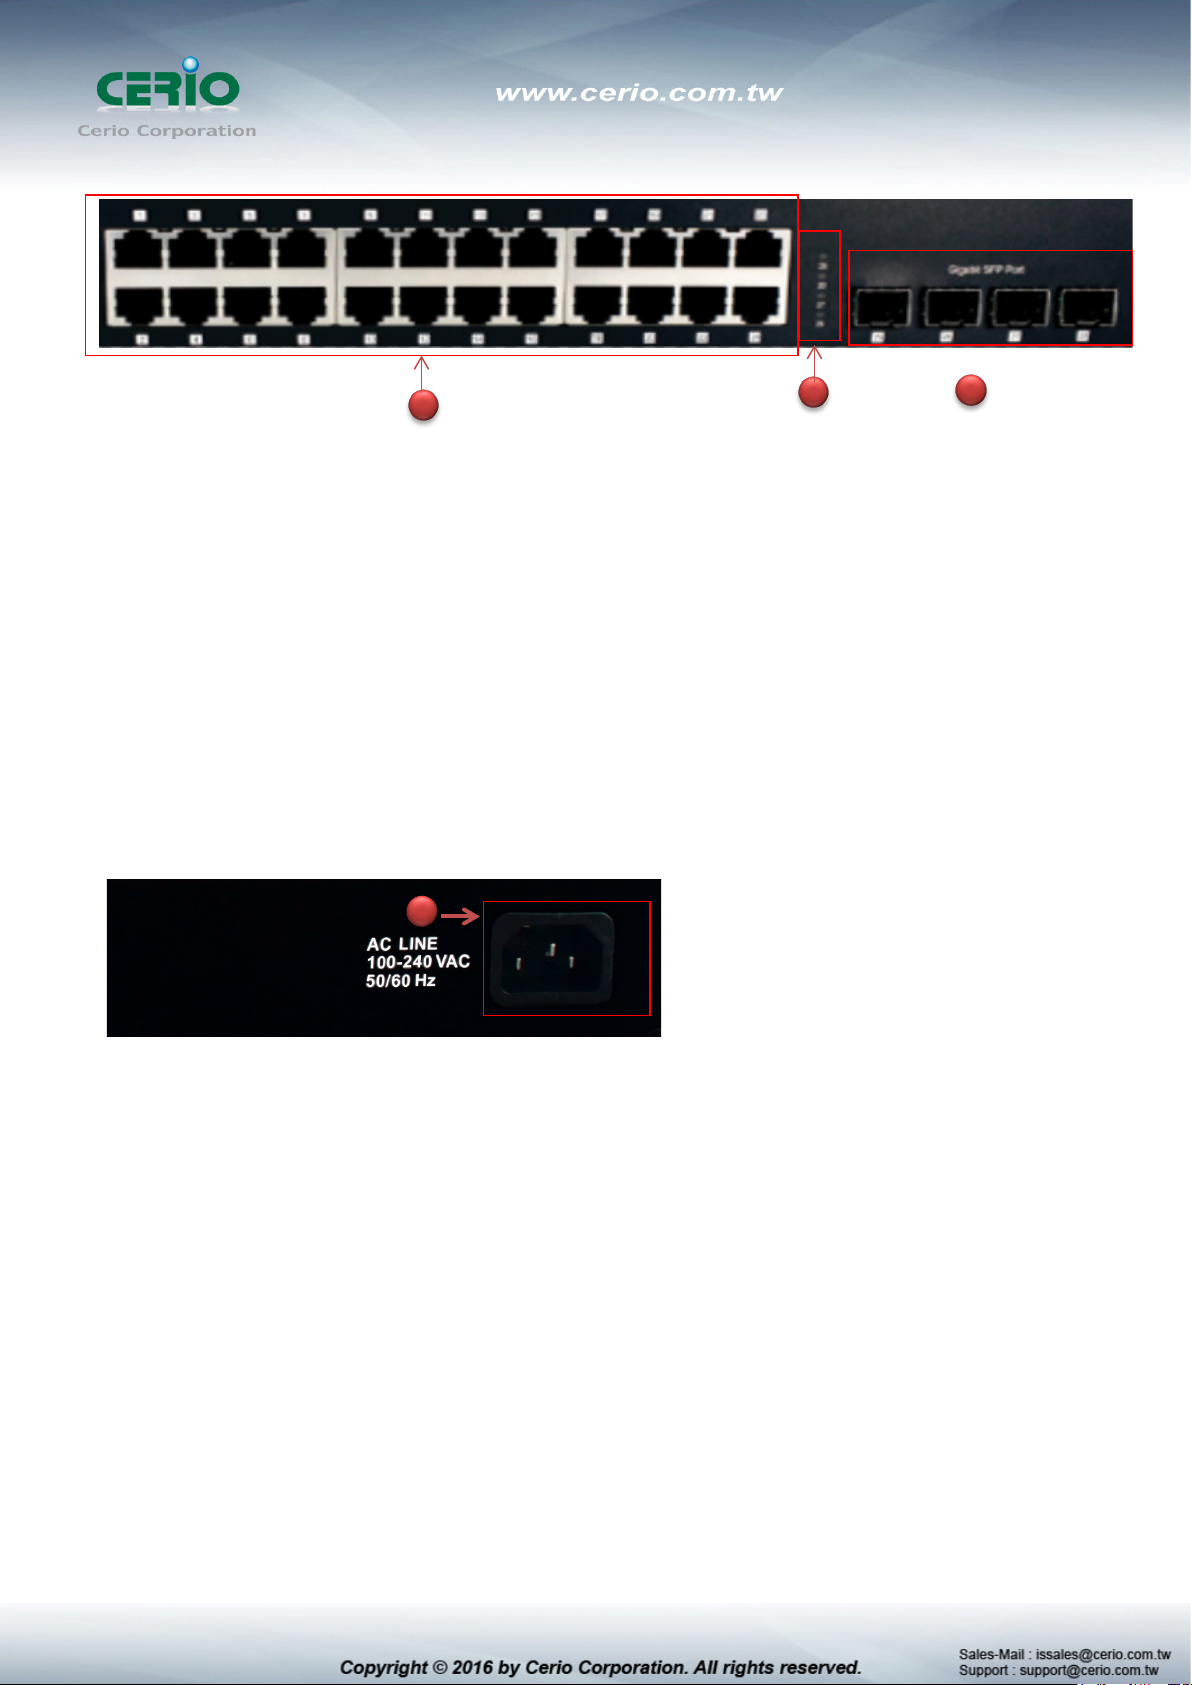
1
1) 24 10/100/1000Mbps Ethernet Ports
2) 4 SFP LED Status lights
3) 4 Fiber Ports
1.4 Rear Panel Layout
1
2 3
1) AC input (100-240V/AC, 50-60Hz) UL Safety

2. Software Configuration
CS-2424G supports web-based configuration. Upon the completion of hardware installation,
CS-2424G can be configured through a PC/NB by using its web browser such as Internet Explorer
6.0 or later.
Set the IP segment of the administrator's computer to be in the same range as CS-2424G for
accessing the system. Do not duplicate the IP Address used here with IP Address of CS-2424G or
any other device within the network. Please refer to the following steps
2.1 Example of Segment: (Windows 7)
Step 1 :
Please click on the computer icon in the bottom right window, and click “Open Network and
Sharing Center”
Step 2 :
In the Network and Sharing Center page, click on the left side of “Change adapter setting”
button

Step 3 :
In “Change adapter setting” Page, right click on Local LAN then select “Properties”
Double click
Step 4 :
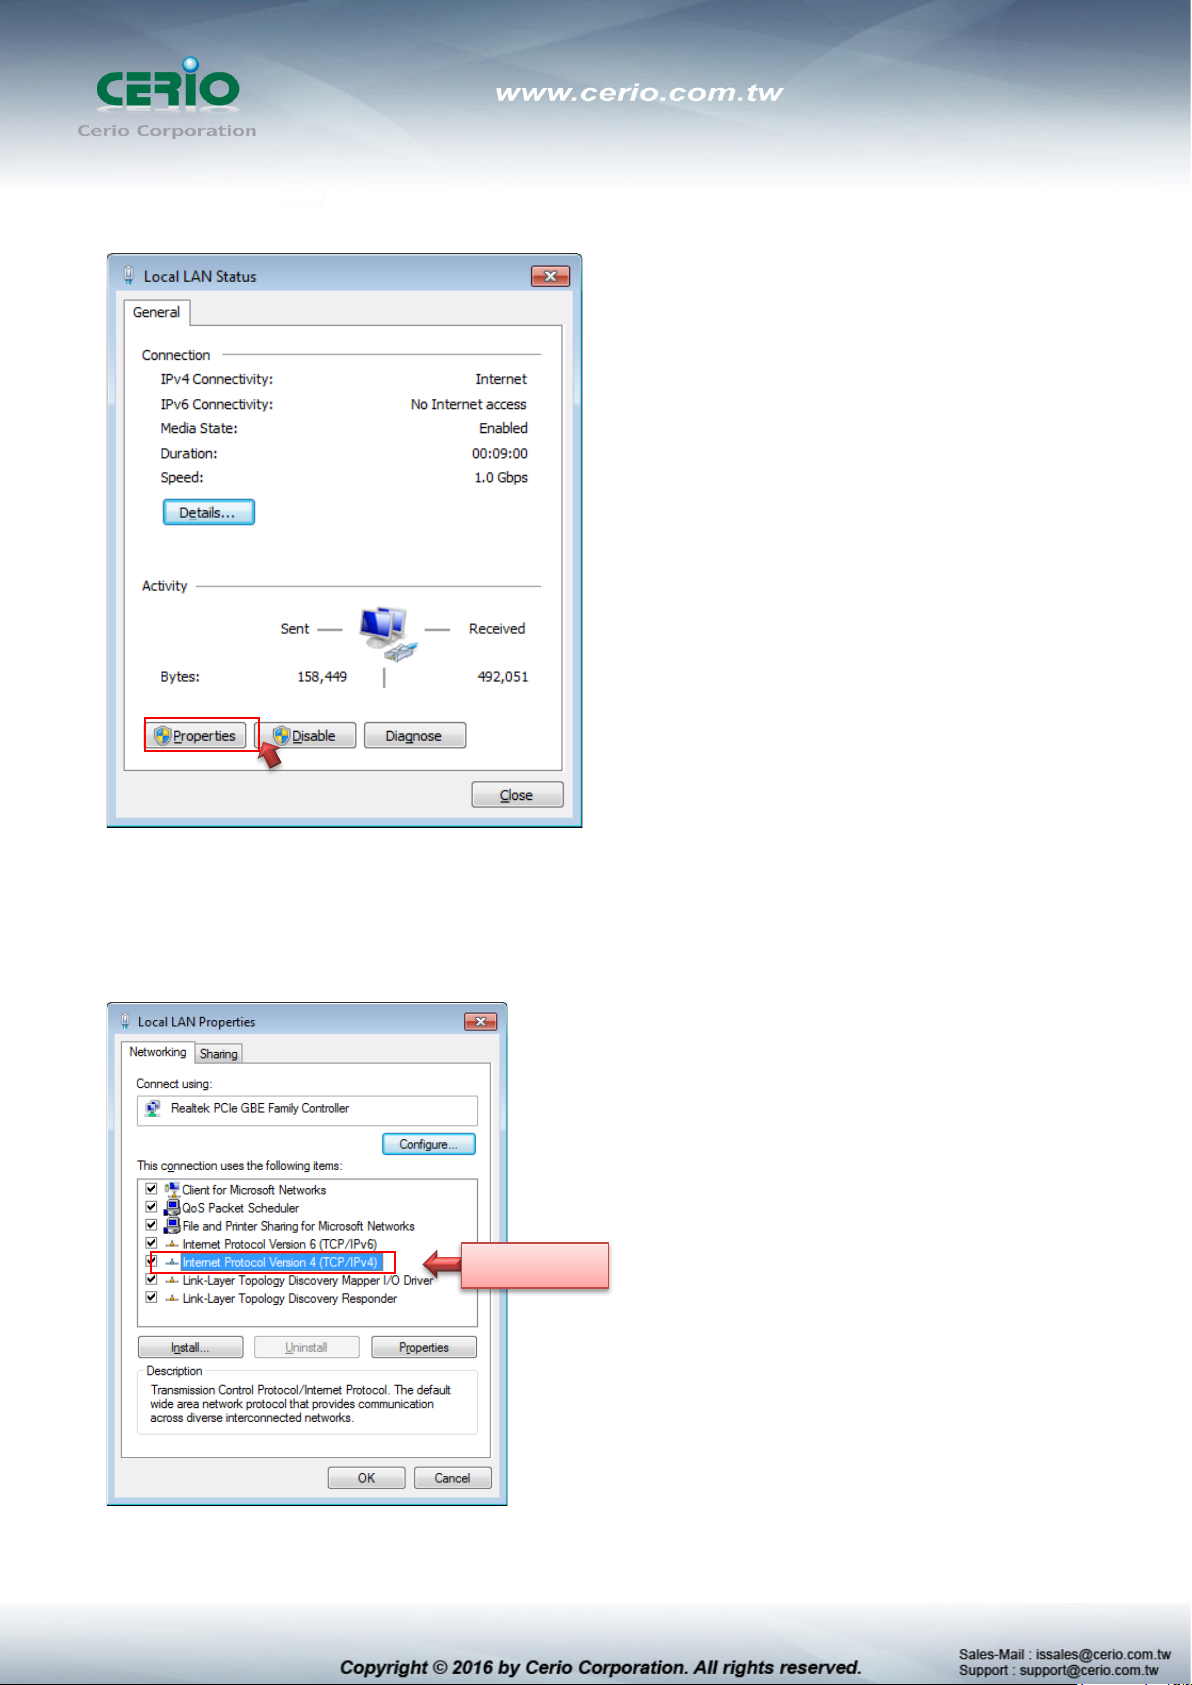
In the “Properties” page, click the “Properties” button to open TCP/IP setting
Step 5 :
In Properties page for setting IP addresses, find “Internet Protocol Version 4 (TCP/IPv4)”
and double click to open TCP/IPv4 Properties window
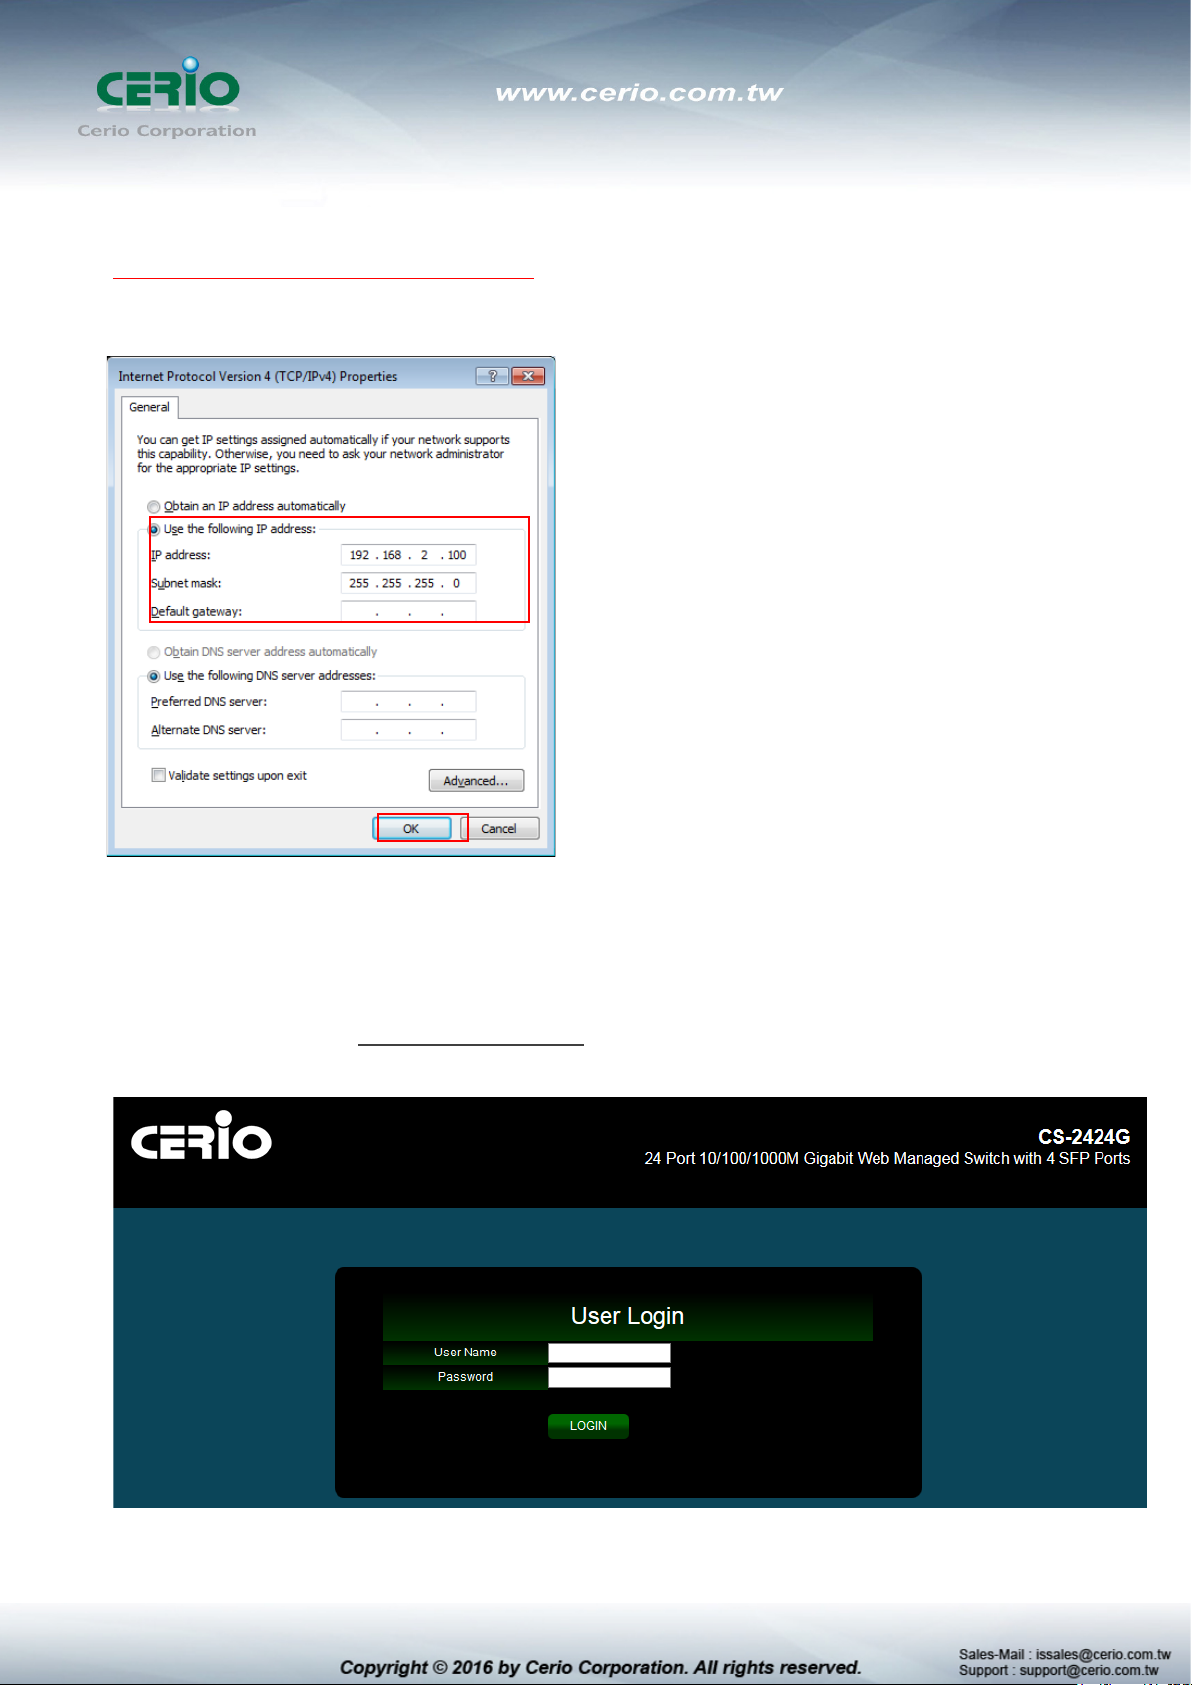
Step 6 :
Select “Use the following IP address”, and fix in IP Address to: 192.168.2.X
ex. The X is any number from 1 to 253
Subnet mask : 255.255.255.0
And Click "OK" to complete fixing the computer IP settings
Step 7 :
Open Web Browser
Without a valid certificate, users may encounter the following problem in IE7 when they try to
access system's WMI (https://192.168.2.200). There will be a “Certificate Error”, because the
browser treats system as an illegal website.

Management Account
Username
Password
default
System login Overview page will appear after successful login.
2.2 System login username and password information
The CS-2424G web switch default IP is 192.168.2.200
Into the management page as follows, please enter Username and password
Default IP Address: 192.168.2.200
Default Username and Password
Root Account
root
After the authentication procedure, the home page will shows up. Select one of the configurations
by clicking the icon.
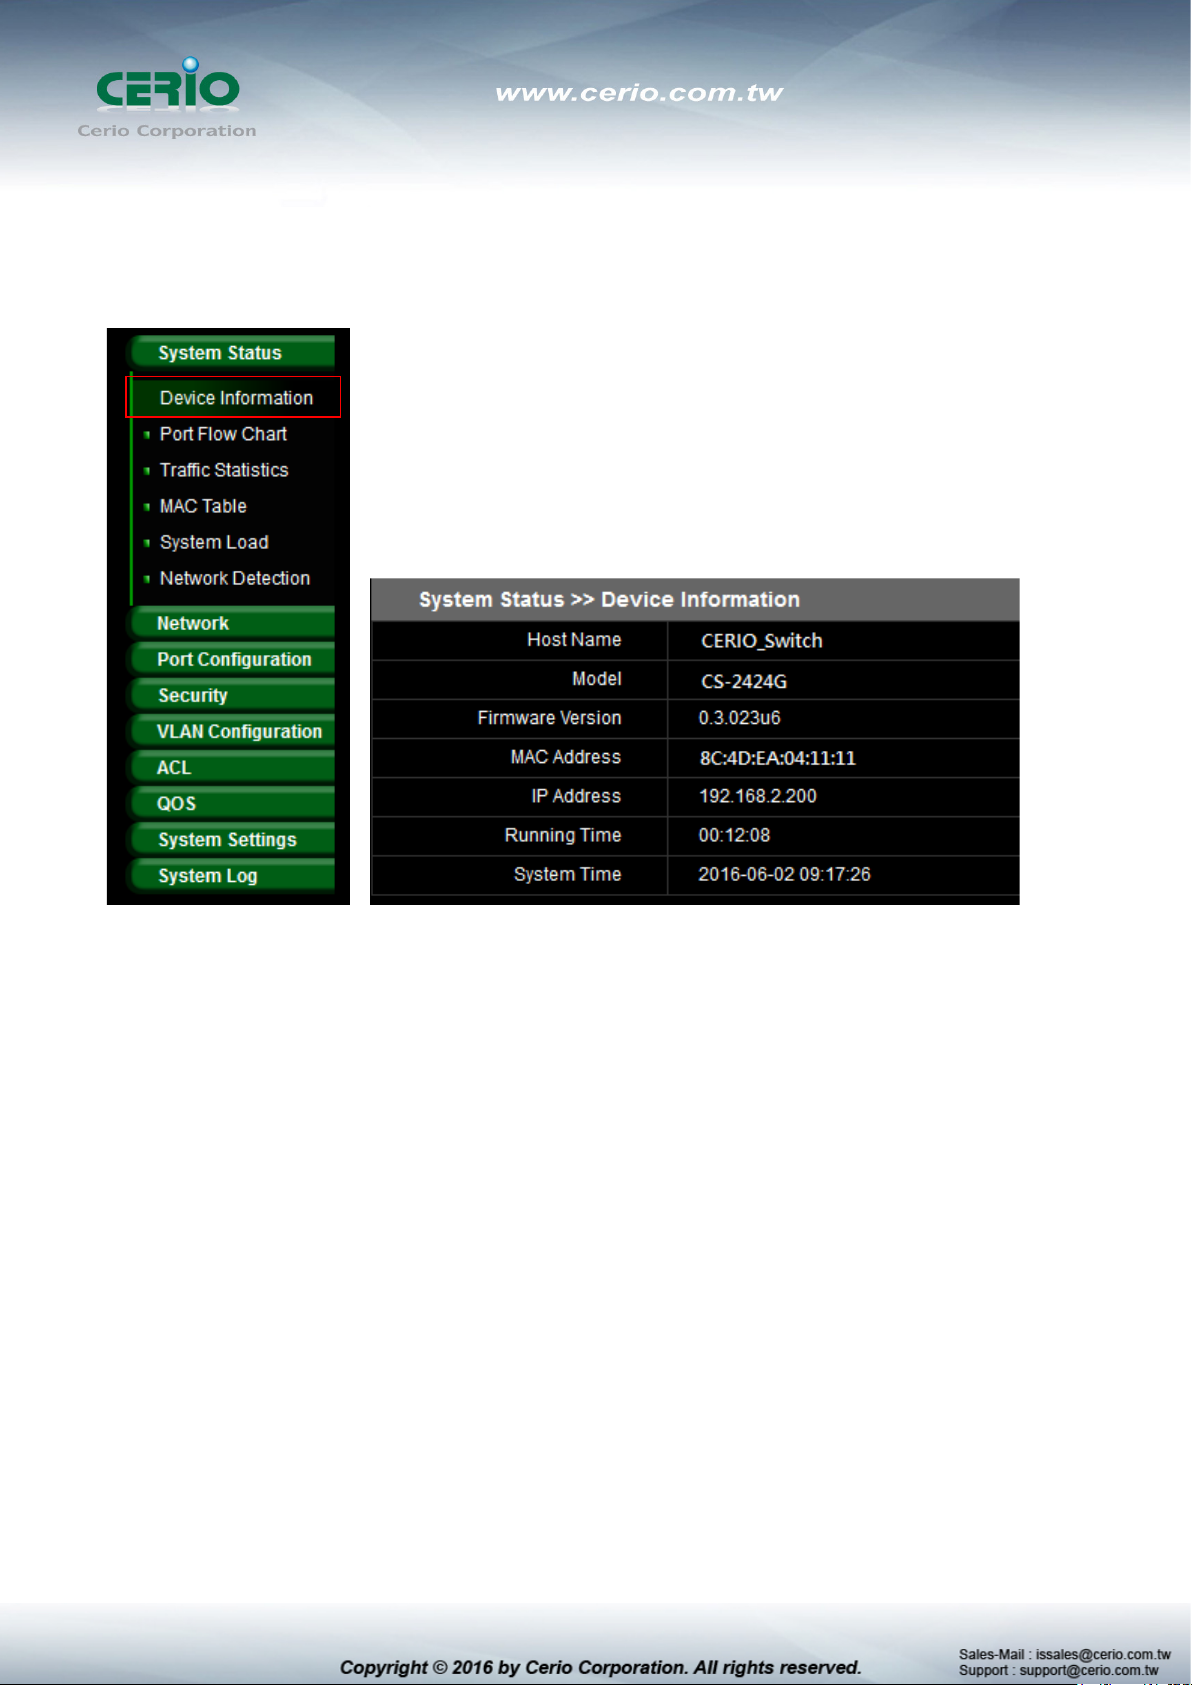
3. System Status
3.1 Device Information
This administrator can check device system information from the “Device Information” tab
Host Name: Display host name for the device.
Model: Display switch model name.
Firmware Version: Display system firmware version.
MAC Address: Display MAC address for the device.
IP Address: Display system login IP address.
Running Time: Display system working time.
System Time: Display system time.
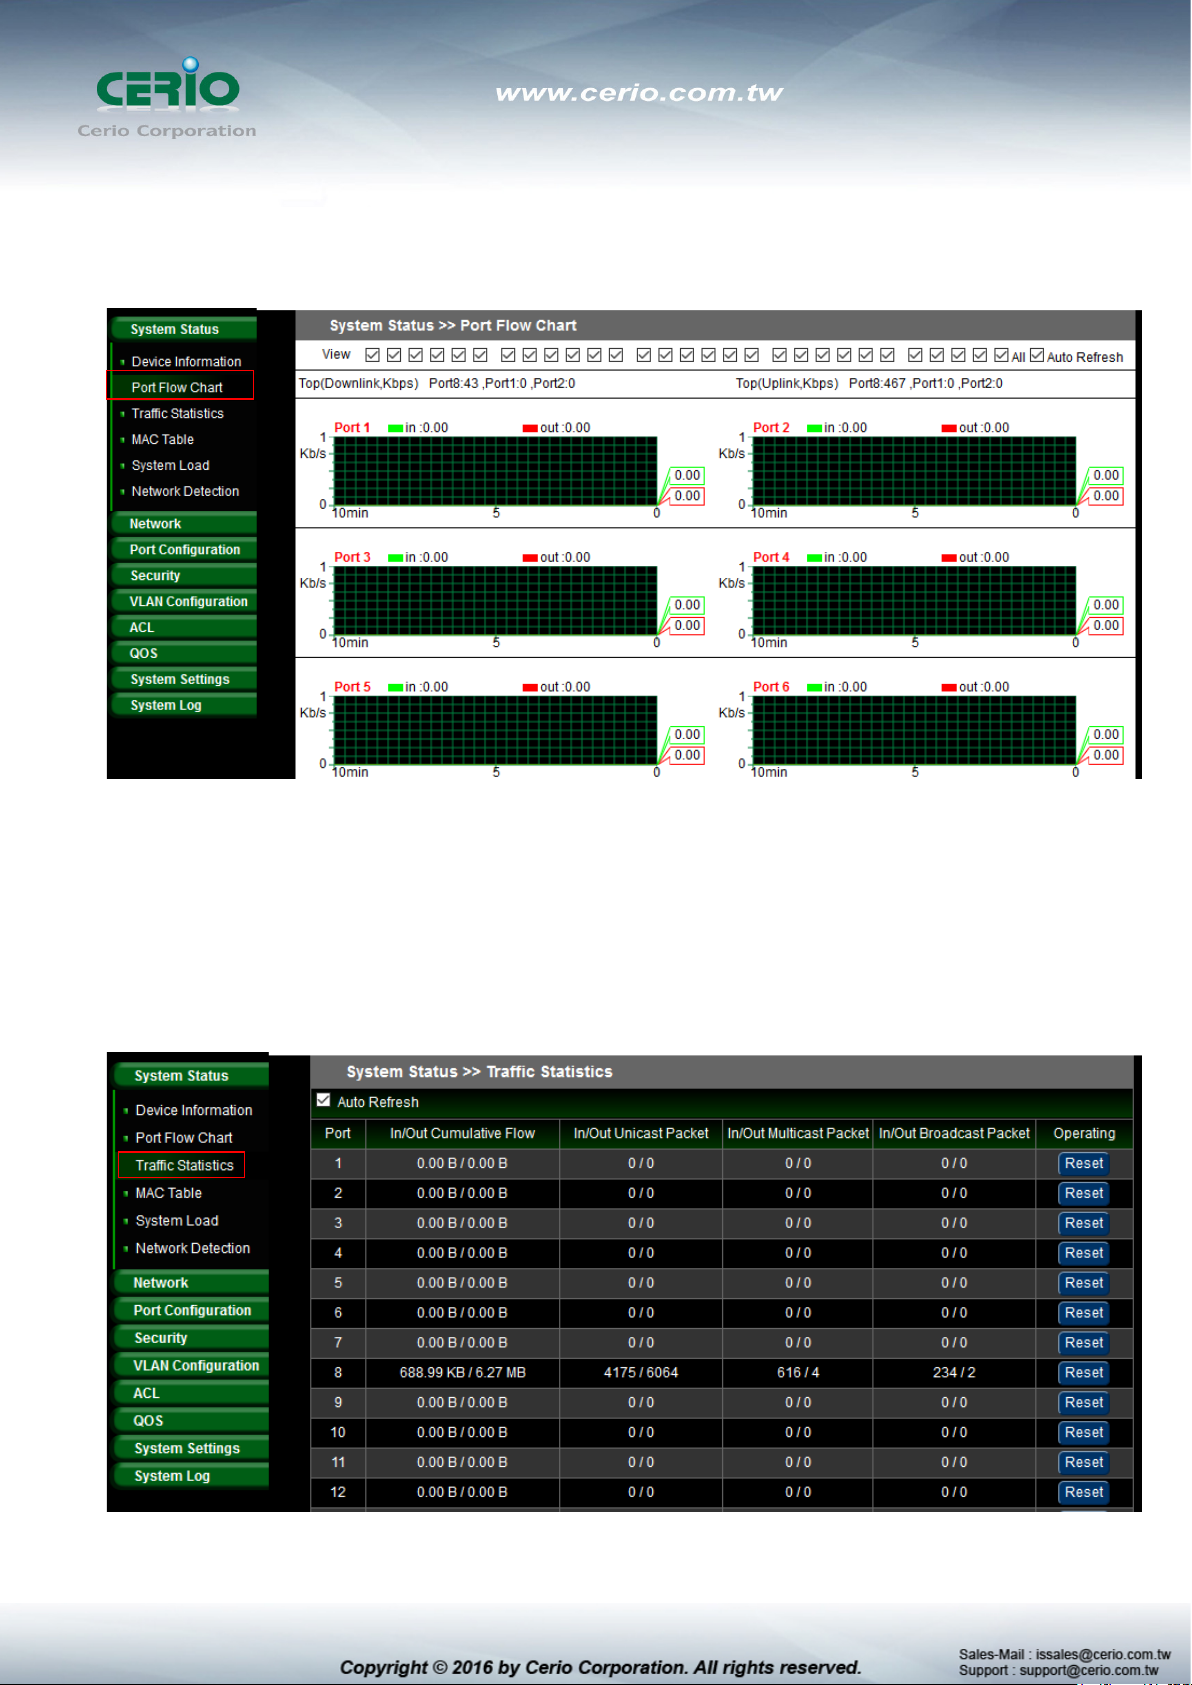
3.2 Port Flow Chart
Administrator can monitor ports through graphical flow charts.
View: Administrator can select all or one port to monitor.
3.3 Traffic Statistics
Administrator can check the cumulative flow of each port.
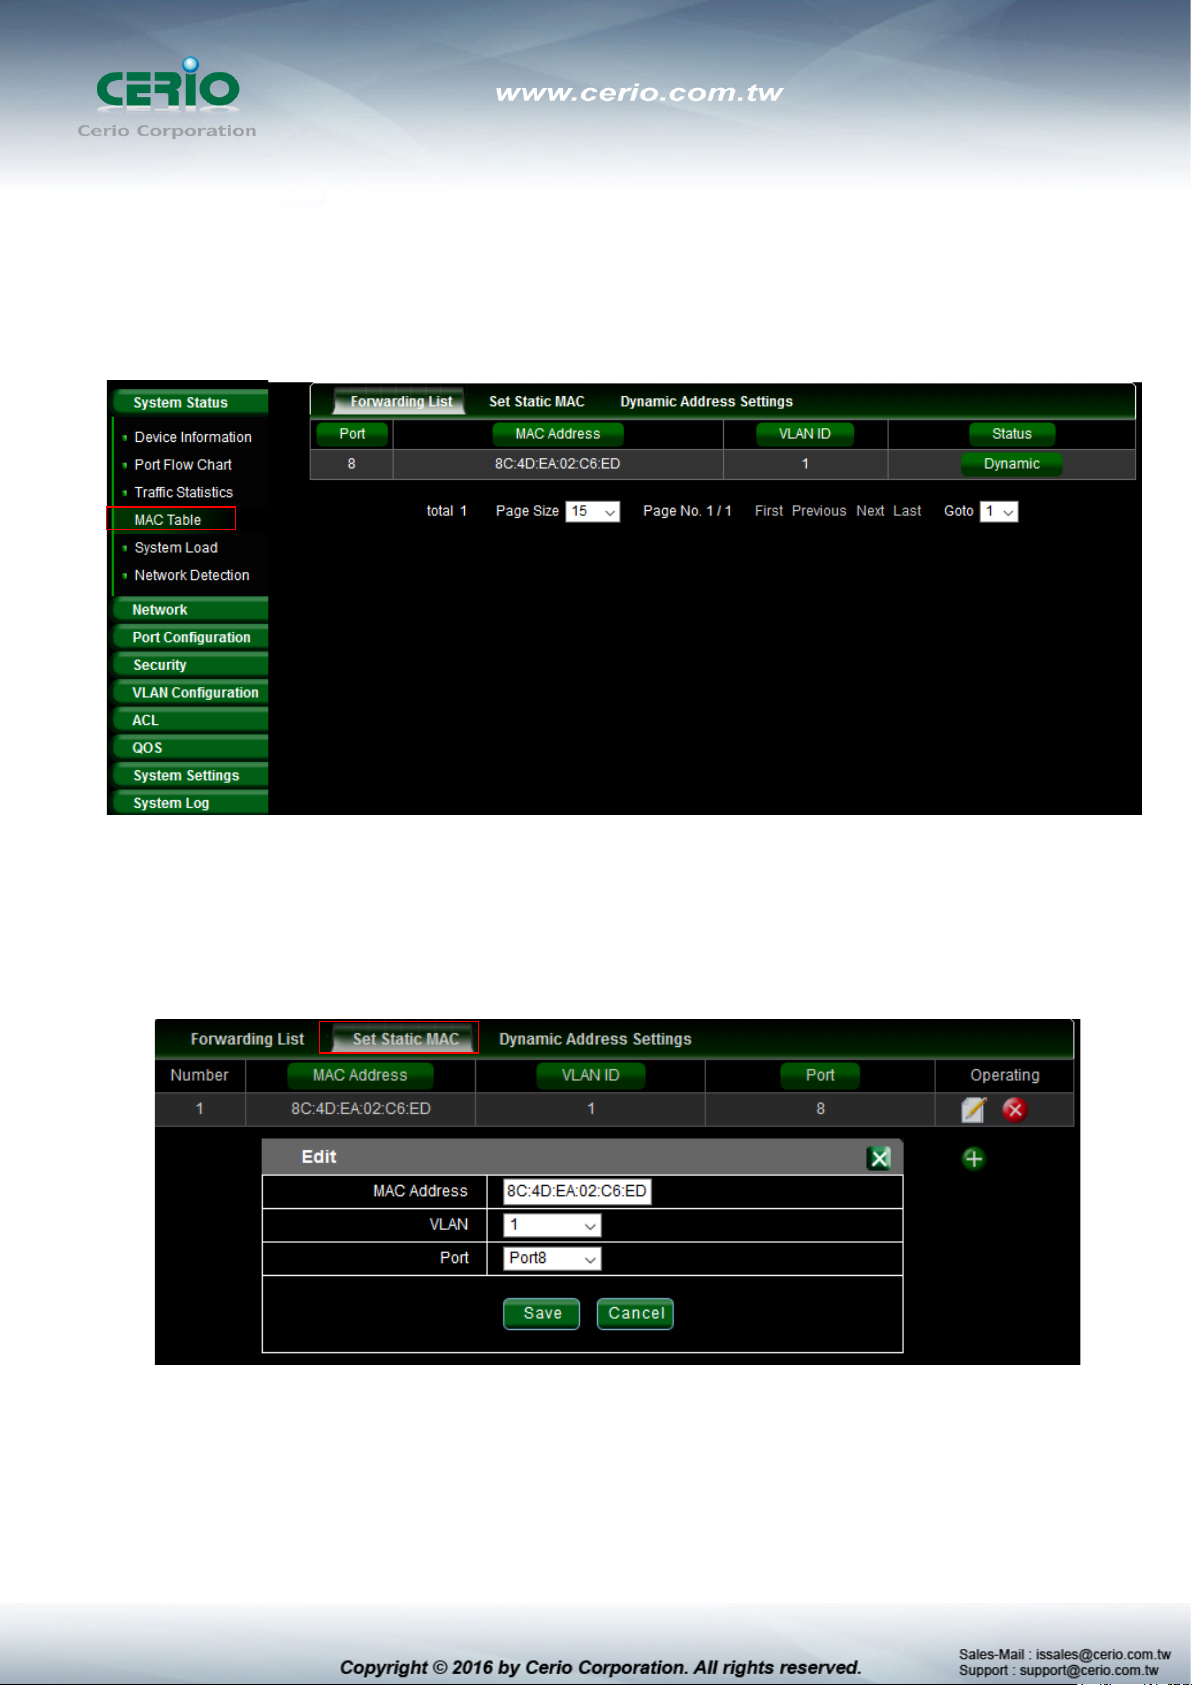
3.4 MAC Table
The MAC Table page can monitor device MAC information based on the connected port.
Administrators can set individual ports to static or dynamic MAC addresses. If dynamic MAC
Address is selected, administrators can then set dynamic aging time.
Forwarding List: Display MAC address of the devices.
Status: Administrator can click the status button to change from static to dynamic
MAC address.
Set Static MAC: When using a port for a fixed device (e.g. server), administrators can set
static MAC address of the port.
MAC Address: Administrator can set the MAC address of the device.
VLAN: Administrator can select for the device network VLAN ID.
Port: Select linked port for the device.
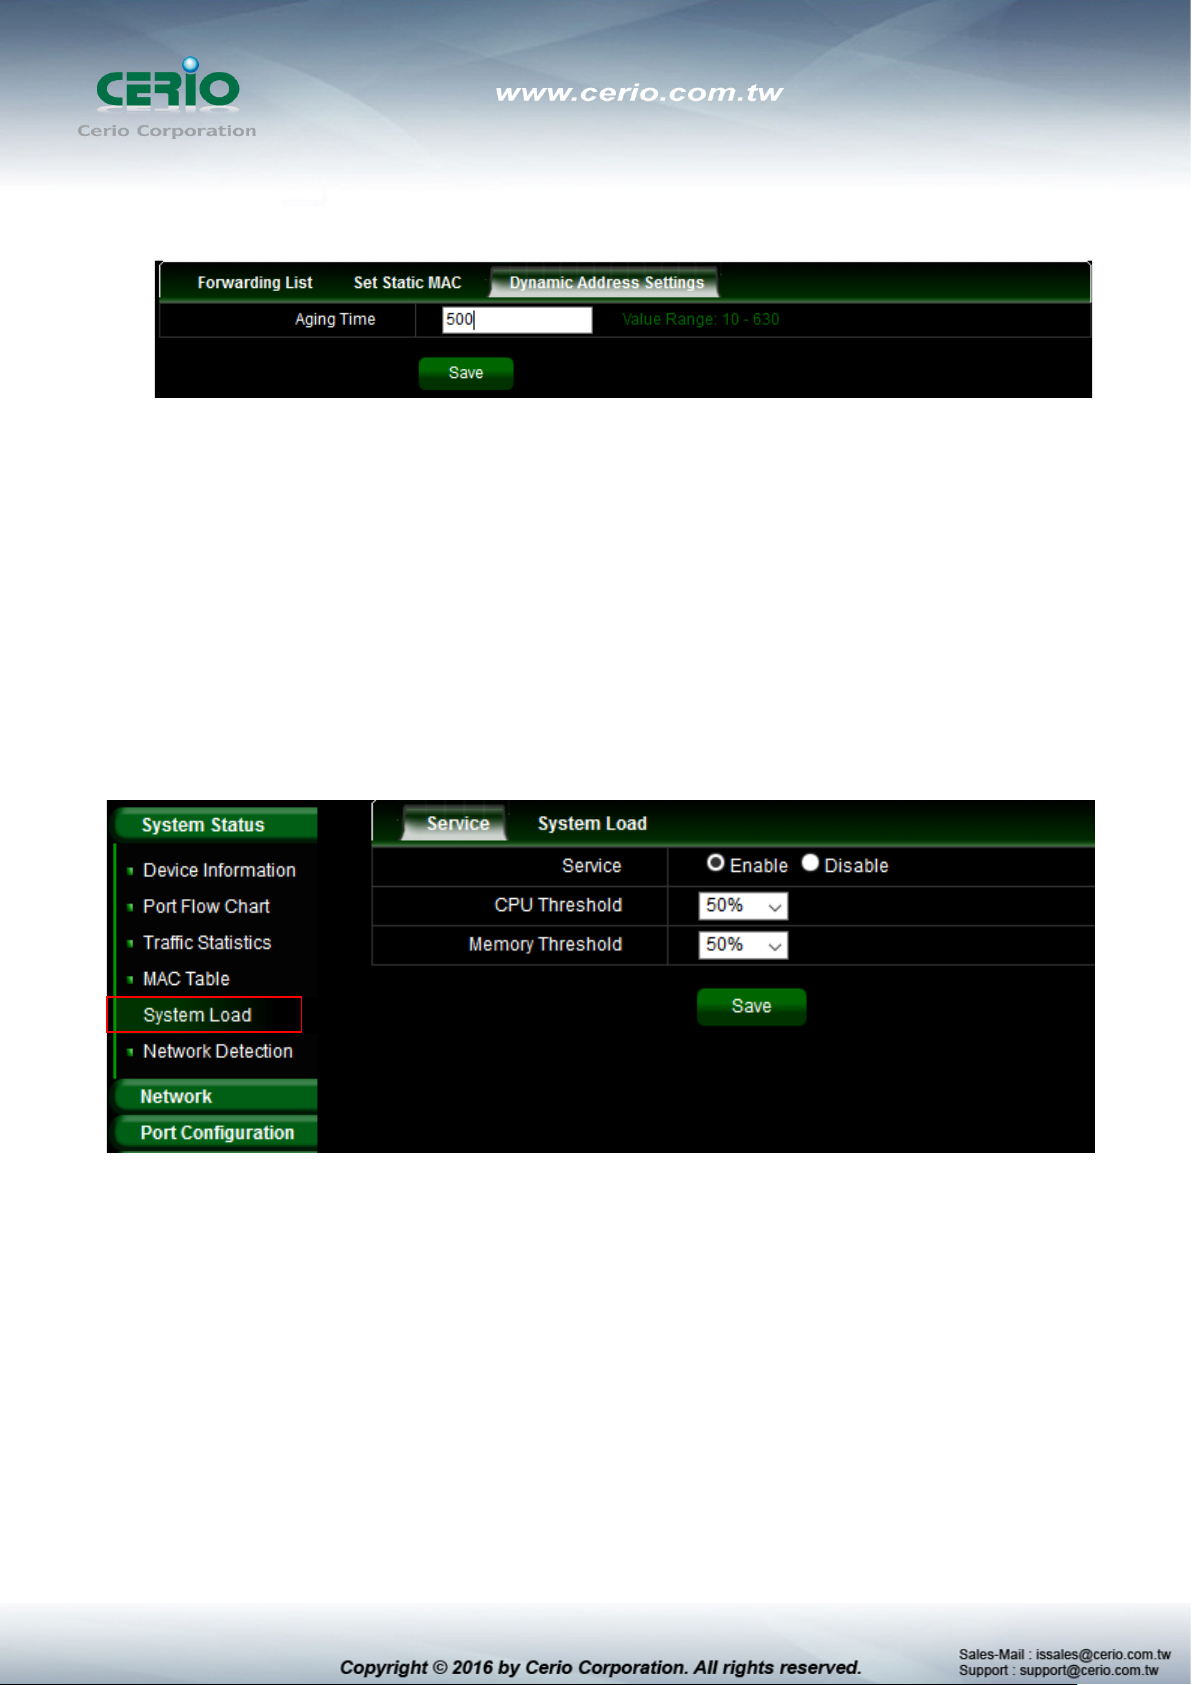
Dynamic Address settings: Administrator can set aging Time for Dynamic MAC
address.
Aging Time: Administrator can set a time for aging time. (Range 10~630 min)
3.5 System Load
System Load function to display the usage status of the memory and the CPU/ Memory of
switch via the data graph. If the CPU or Memory usage rate increases sharply, please check to
see if you network is secure from hackers or unknown users.
The System Load function is designed with a SNMP Trap function. Administrators can set CPU
or Memory Threshold to monitor Switch usage amount. If CPU or Memory Thresholds are
surpassed, the system will use SNMP Trap to notify the system administrator.
Service: Administrator can select Enable or disable for the service.
CUP/Memory Threshold: Administrator can set CPU or Memory Threshold for the usage
warning.
System Load
The Page can display the usage status of the memory and the CPU/ Memory of switch via the
data graph.
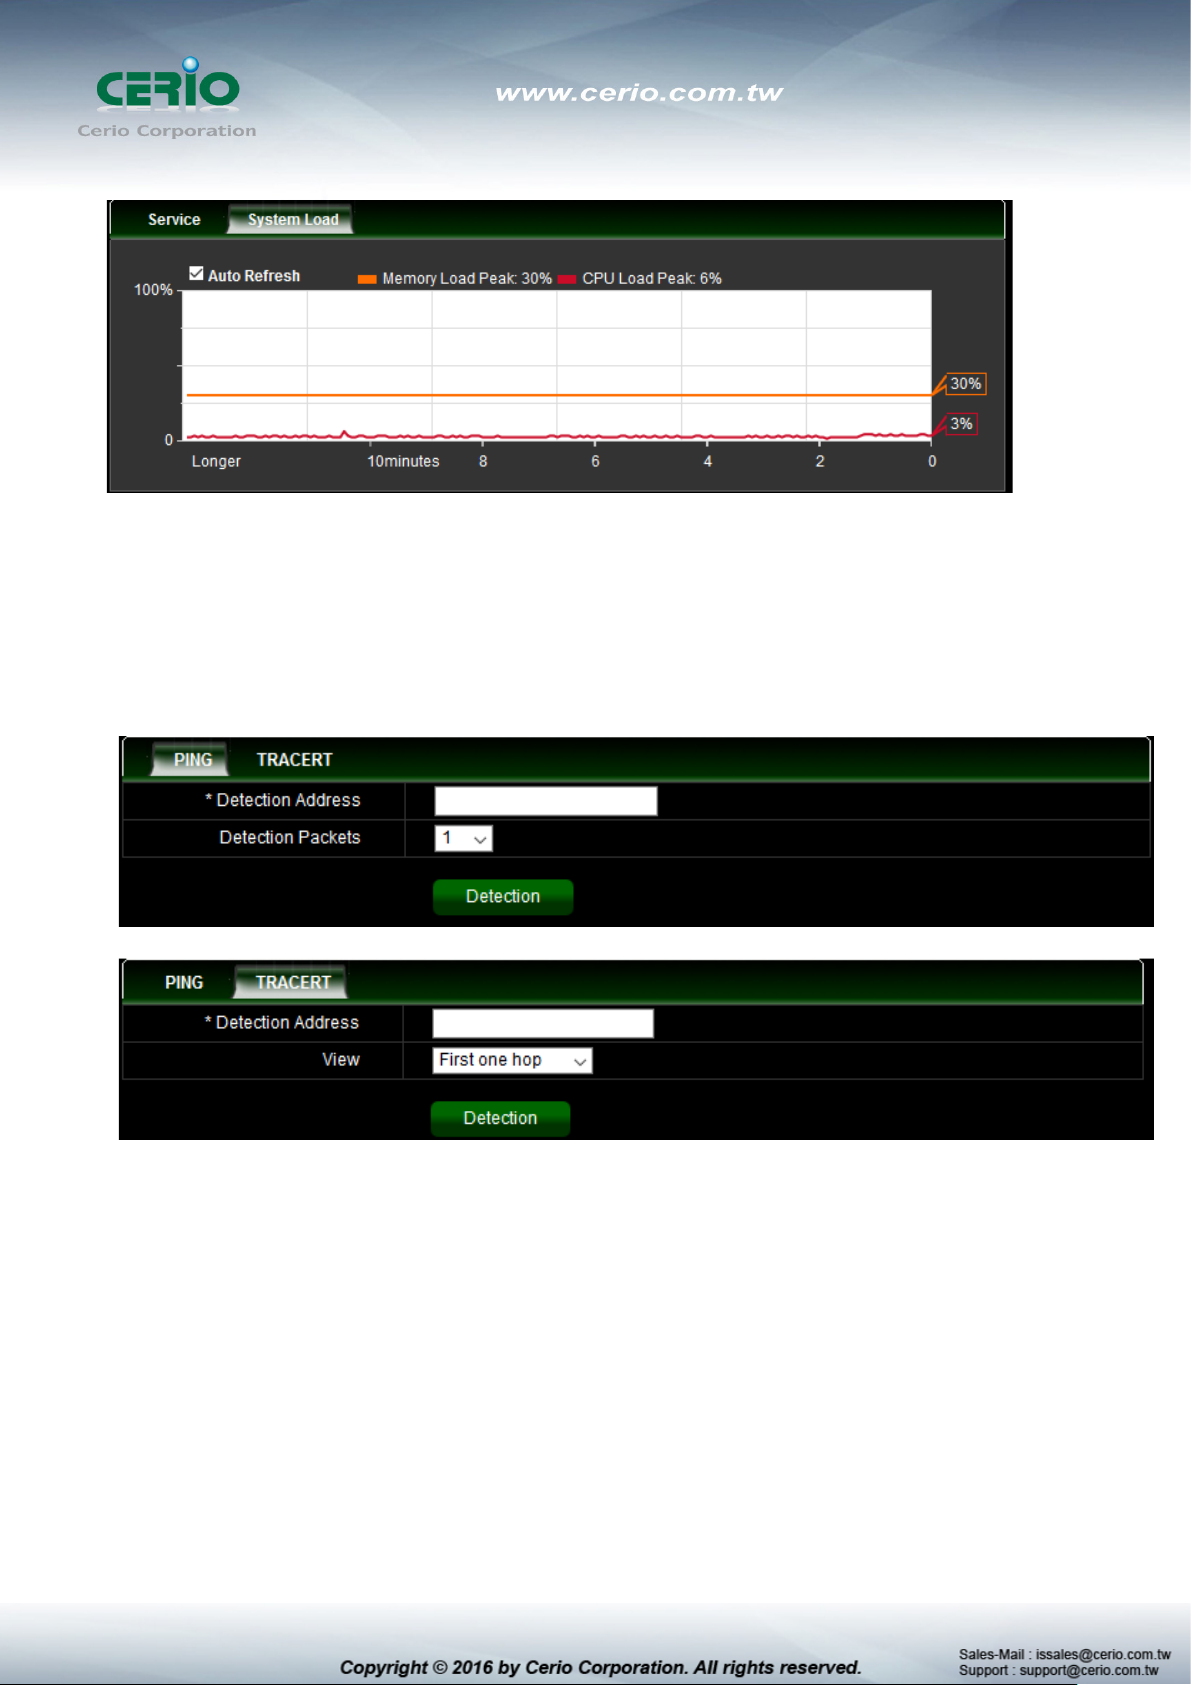
3.6 Network Detection
Administrators can diagnose network connectivity via the PING or TRACERT
Detection Address: Enter detection IP address.
Detection Packets: Select ping packets frequency.
View: Check device to destination will through hoe many gateway.
4. Network
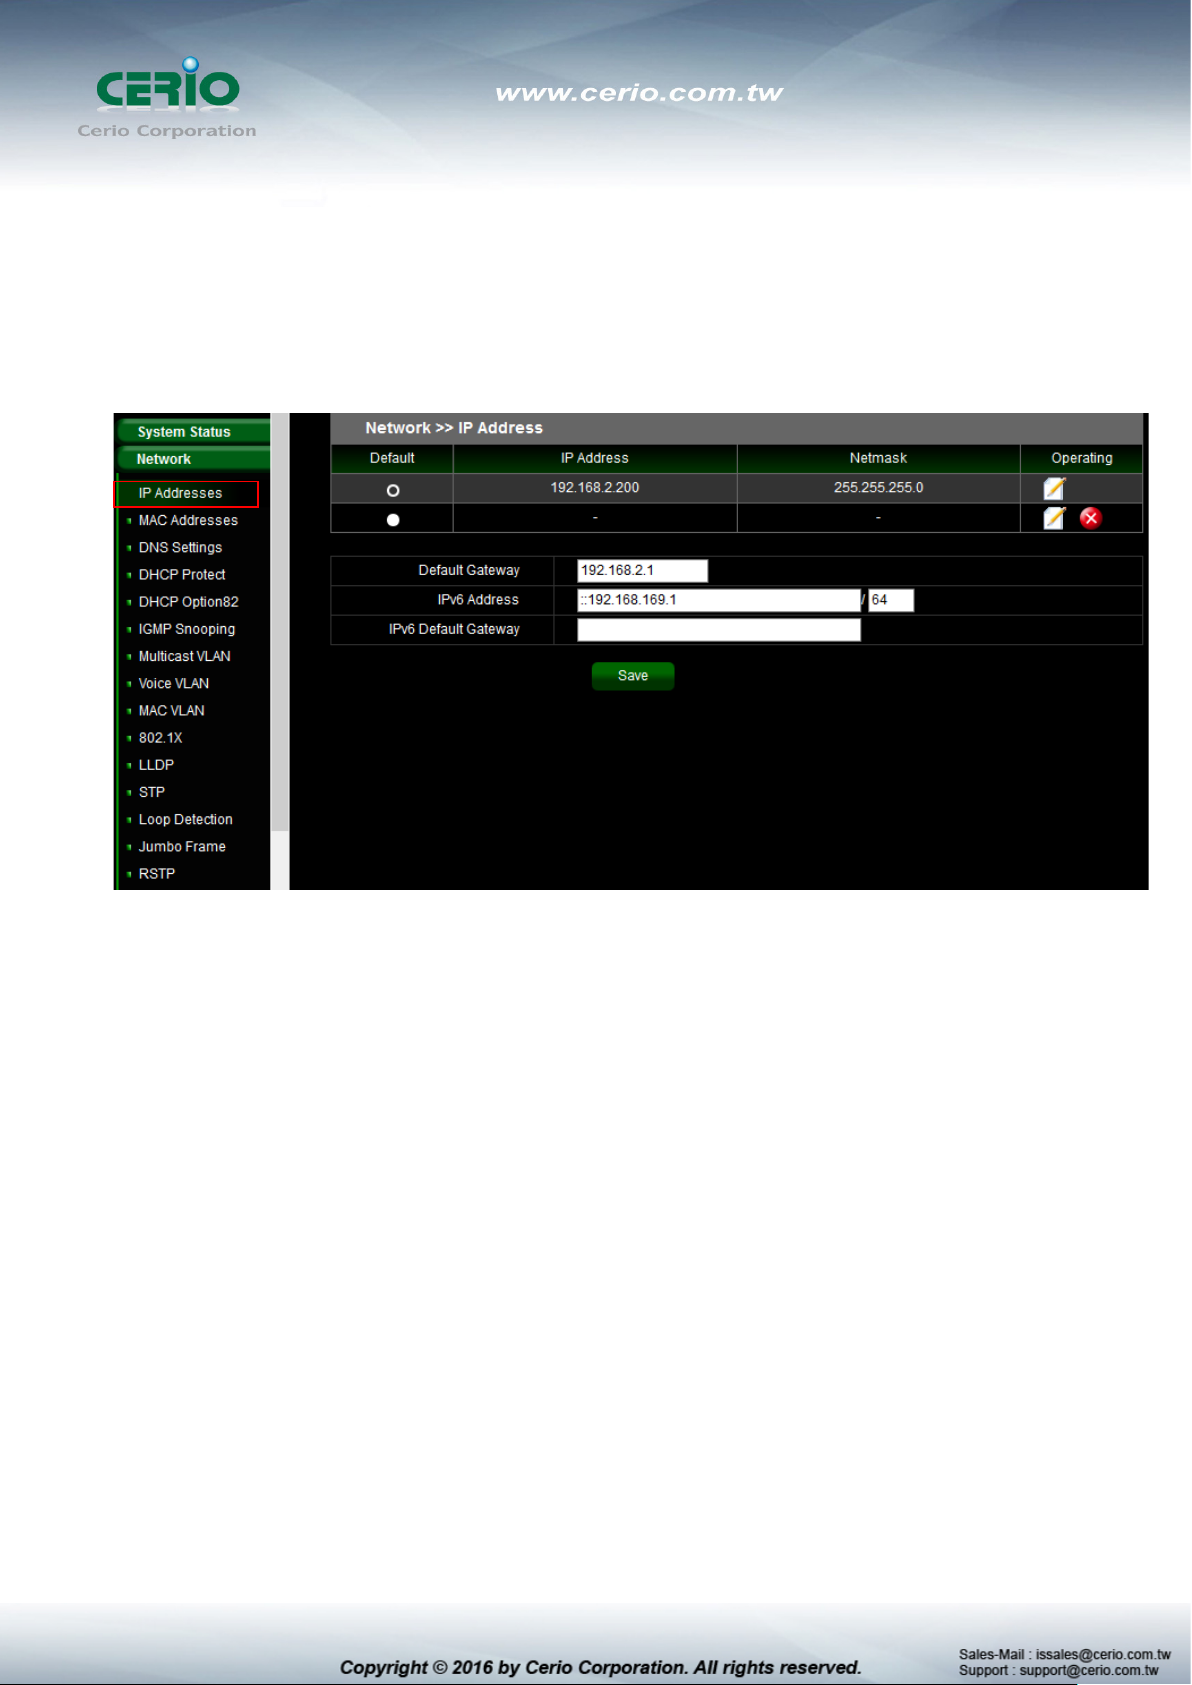
4.1 IP Address
Administrator can set IP address for the system. The IP address support IPv4 & IPv6 protocol,
if switch device must want to internet, administrator can set gateway IP address in the page.
List of the Default: Administrator can select default used IP address.
List of the IP address: Display system IP address.
List of the Netmask: Display Netmask.
List of the Operating: Administrator can click edit to modify system IP address or delete
system IP address.
Default Gateway: Administrator can set network gateway.
IPv6 Address: Administrator can set IPv6 address.
IPv6 default gateway: Administrator can set network gateway for IPv6 address.
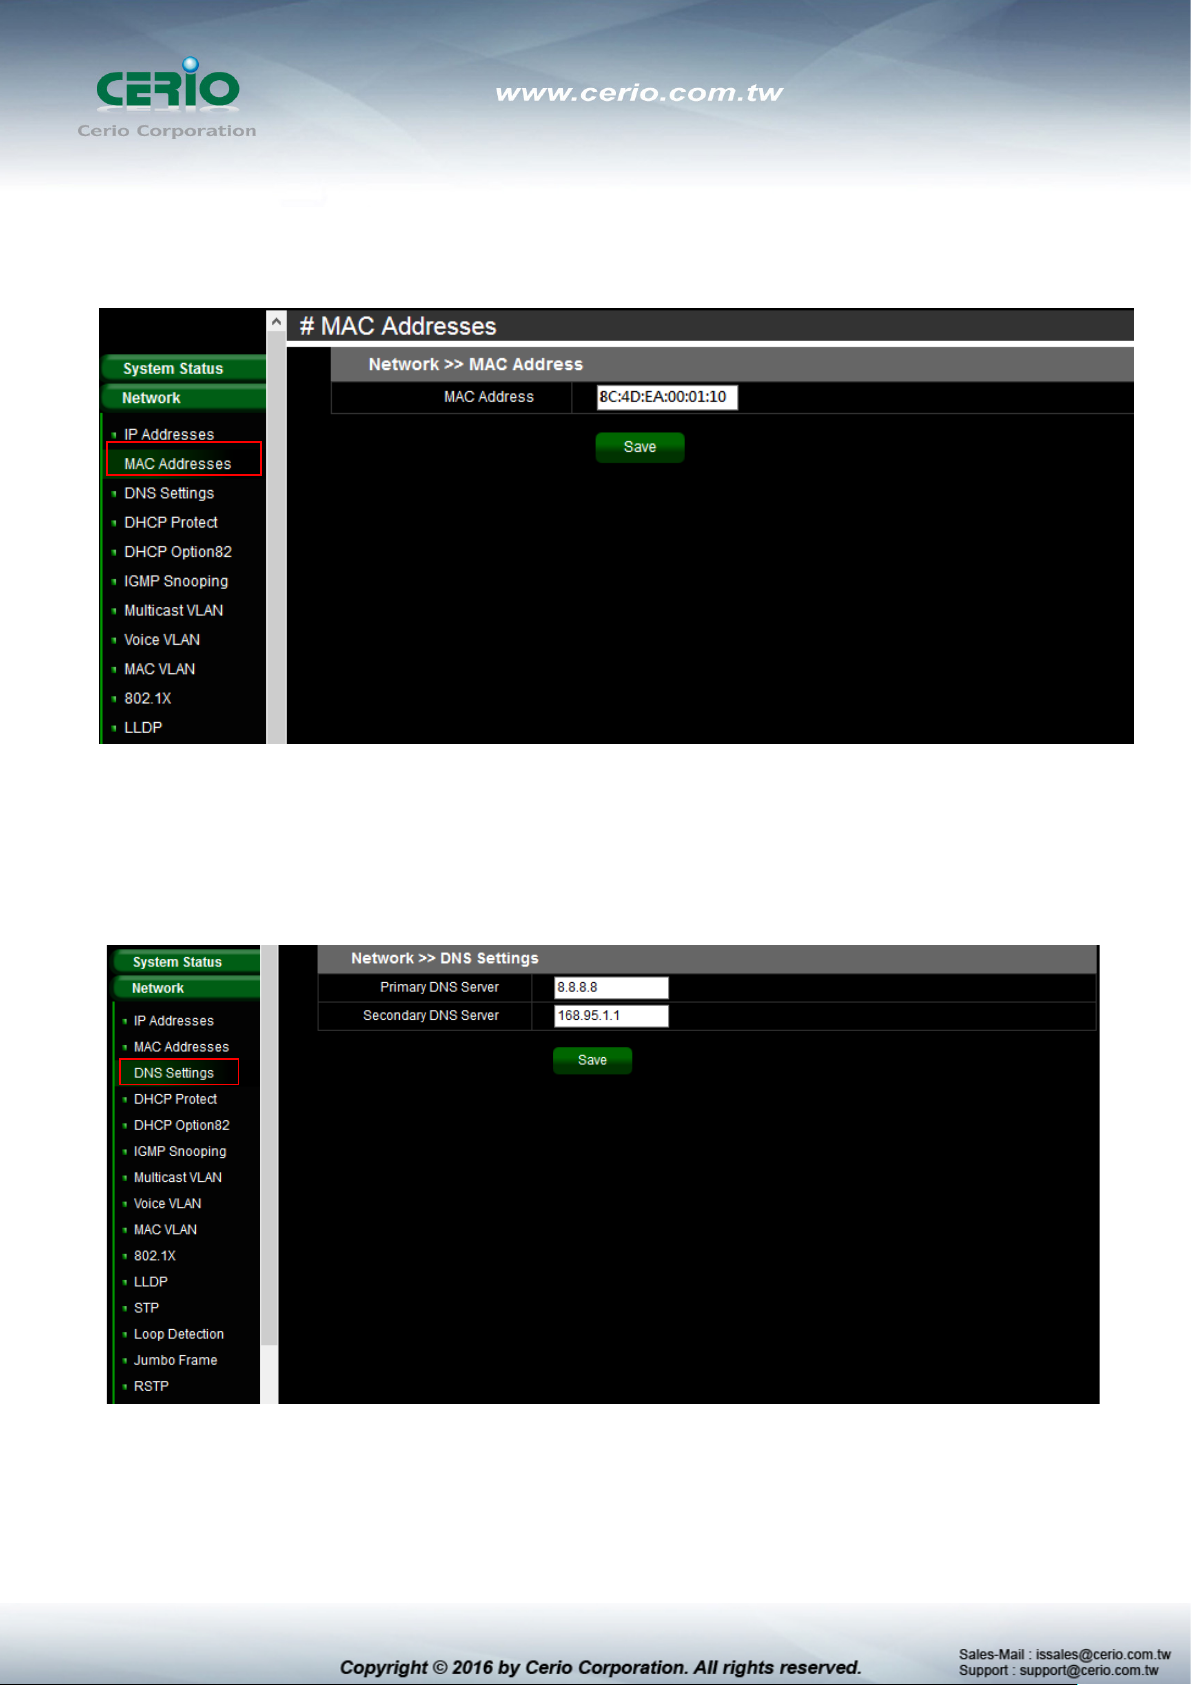
4.2 MAC Address
Administrator can view and modify MAC address in the system.
4.3 DNS Settings
Administrator can set IP Address for the DNS Server.
Primary DNS Server: Enter IP address for Primary DNS Server.
Secondary DNS server: Enter IP address for Secondary DNS server.
 Loading...