

Page 1
NEULOG ELECTROCARDIOGRAM SENSOR GUIDE
Neulog electrocardiogram Sensor
NUL-218 Carolina # 369647
The NeuLog electrocardiogram sensor can be used for any science experiment or
activity that can utilize heartbeat data such as in the fields of: Biology, Physiology,
Human medicine, Psychology, etc.
An electrocardiogram is a very commonly used medical device which measures and
graphs the heart’s electrical activity. Every single heartbeat is a very complex event
which involves many anatomical locations undergoing changes in their electrical
charges. A depolarizing cascade event originates in the Sinoatrial Node, which is
often referred to as the natural pacemaker, and travels throughout the rest of the
heart.
The sensor comes pre-calibrated so you can start experimentation right out of the box
using any of the following guides.
Just a few of the thousands of possible experimental subjects that can be done with
the NUL-218 sensors are: electrical impulses, heart rate monitoring, human
physiology, muscle physiology, heart rate changes to stimuli, and many more.
The ECG sensor uses the following unit of measure:
Arbitrary analog units (Arb): An arbitrary unit to demonstrate waves,
frequencies, and periods. Therefore what you will see on the Y-axis is
signal intensity, while the X-axis shows time.
Electrocardiograms:
The heart undergoes a very complex process of electrical activity; this is the basis for
how electrocardiograms work. As the heart’s muscles contract, the cells are
electrically depolarized which causes a cascade of depolarization to flow across the
heart – contracting the heart’s muscle fibers.
During a heartbeat a very complex series of events happens which begins with the
cells resting potential at roughly -90mV (millivolts). The hearts Sinoatrial Node begins
the cascade by depolarizing – creating an electrical current. The electrical signal
travels to the right atrium and almost immediately to the left atrium. Because the atria
and the ventricles are insulated from each other by a special type of cell which acts as
an electrical insulator, the signal is picked up in another cluster of cells called the
Atrioventricular Node located in the right atria. The signal is carried by a special type
of fibers - the Bundle of His into the ventricles. Purkinje Fibers rapidly spread the
electrical depolarization cascade throughout the ventricles. The entire event takes
some time to complete. The graph is a visual demonstration of the heart’s relative
charge at any given point during heartbeats.
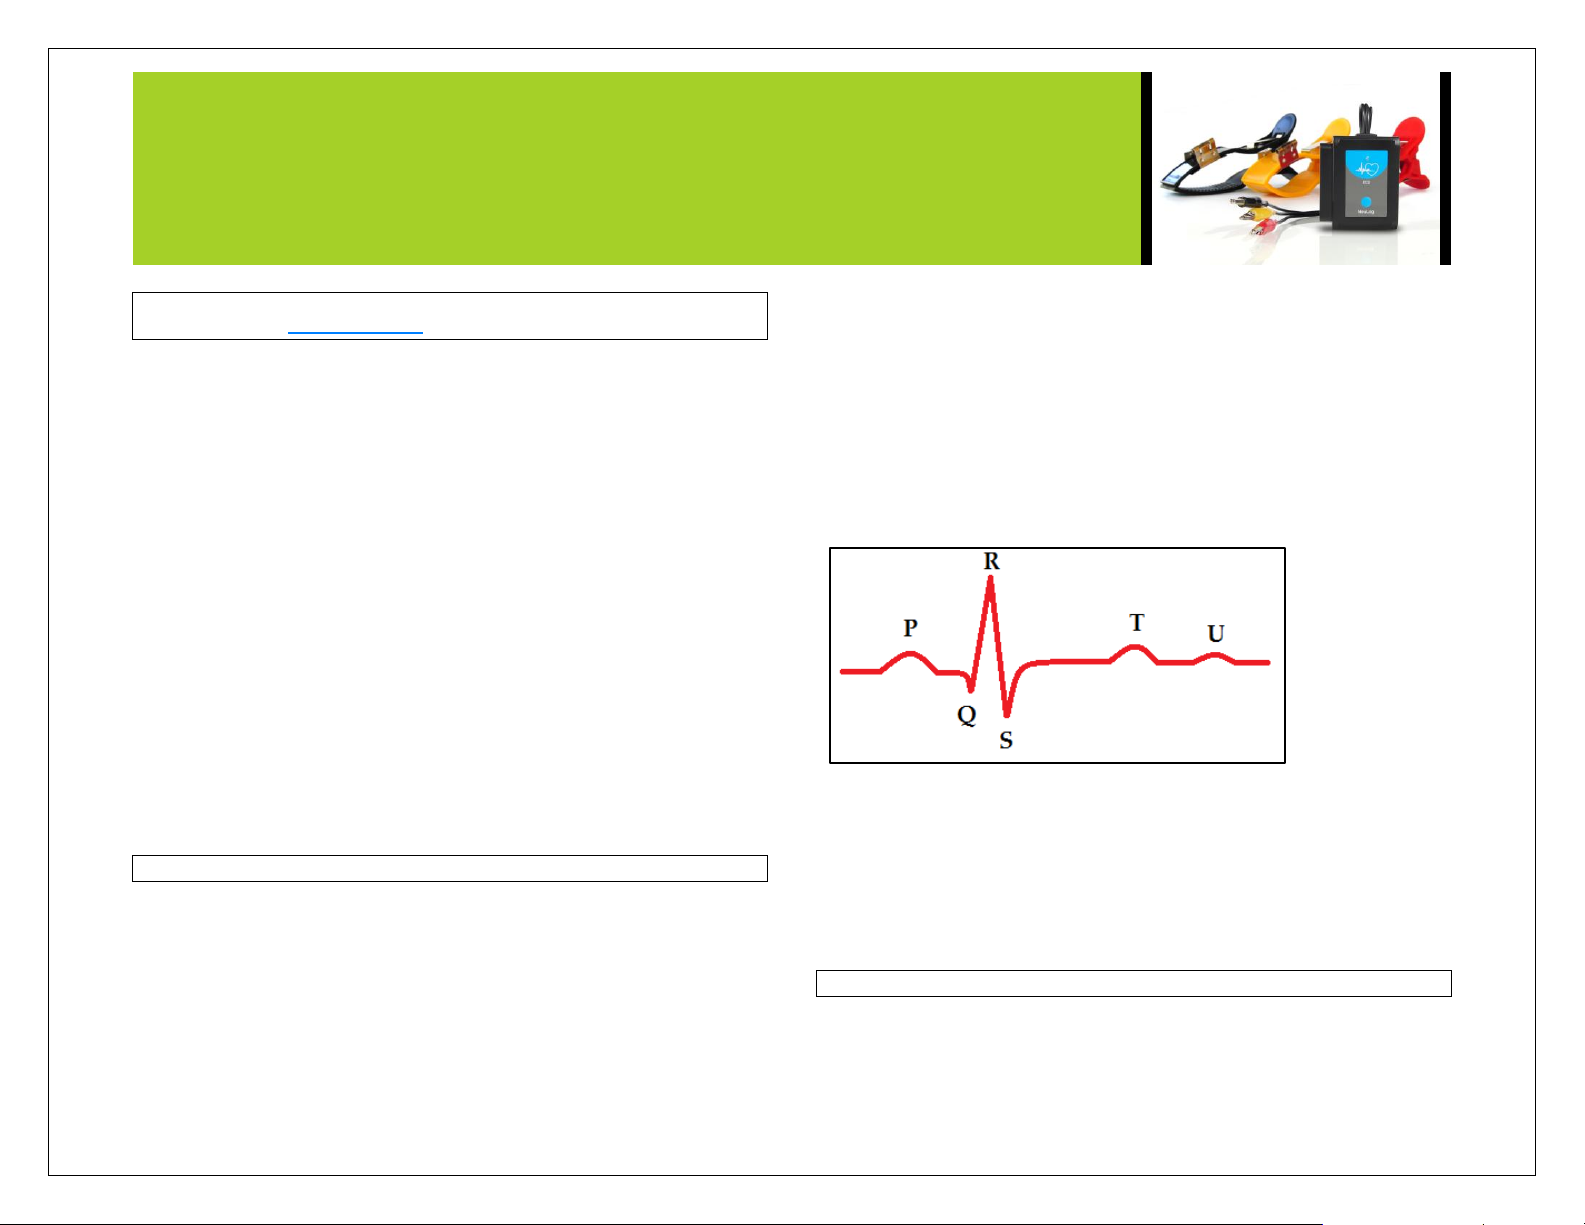
The electrical current is measured on the skin using conducting leads and converted
into a graphic that is very standard and reproducible.
P: Contraction of atria
Q: Initial depolarization of the ventricle
R: Early depolarization of the ventricles
S: Late depolarization of the ventricles
T: Repolarization of the ventricles
U: Often hidden by the T wave – this wave has anunknown origin
This graph represents one complete heart beat from depolarization of the Sinoatrial
Node to repolarization of the ventricles.
Connecting to the ECG sensor:
The NeuLog electrocardiogram sensor uses three reusable clip leads for easy
connection to the arms. Each pair of leads (red + yellow, red + black, black + yellow)
measure the heart’s electrical fluctuations and are all compared against one another.
Page 2

NEULOG ELECTROCARDIOGRAM SENSOR GUIDE
Leads:
Black: Ground
Red: Positive
Yellow: Negative
How to connect:
1. Connect the NeuLog ECG sensor to a smart device using one of the
following guides. (PC or Mac/Tablet/Viewer)
2. Place the red clip on the subject’s left wrist with the metal connector on the
underside (palm side) of the arm.
3. Place the yellow clip on the subject’s right wrist with the metal connector on
the underside (palm side) of the arm.
4. Place the black clip on the subject’s left forearm or elbow.
5. Connect the three alligator clips (red, yellow, black) directly to their
corresponding arm clip’s (red, yellow, black) metal piece that forms a loop.
6. You are now connected.
Note: There are other configurations possible, this is just one possibility. If the R
wave shows a downward slope instead of upward, your connection’s polarization is
reversed though the absolute results are still the same.
Quick start procedure:
PC or Mac Computer
Materials needed:
NUL-218 ECG Sensor
3 Neulog Reusable Clamp Leads
USB-200 USB Module
A USB to mini USB cable (which comes with the USB-200)
Your ECG sensor needs to be connected to a USB-200 module. The USB-200
module then connects to a computer via a USB to mini-USB cable. Please note that
you cannot plug the ECG sensor directly into the computer.
Resident PC software and browser based software can be downloaded for free at
www.NeuLog.com/dowload as well as a full software user guide. Note: Make sure not
to download and install both types of software, they will conflict on the computer.
Procedure:
1. Install the NeuLog software
2. Connect the USB-200 module to the PC or Mac
3. Connect the ECG sensor to the USB-200 module (they directly plug
together). Please note there is no calibration required for this sensor.
4. Open the NeuLog software.
5. Once an ECG sensor logo appears on the left side of the screen the probe
has been automatically identified and you can begin experimentation.
6. If the ECG sensor is not automatically identified then click the “Search for
sensors” icon to find the sensor.
7. Select the “On-line experiment” button; this will open a graph below.
8. Click on the “Module setup” button located on the ECG sensor icon in the
module window to change the sensor settings if need be.
9. Click on the experiment set up button to change the experiment settings if
need be (experiment duration for example).
10. The ECG sensor will give a live reading in the box to the left of the screen
while plugged in.
11. To run an experiment and collect data click “Run experiment”.
12. To end data collection early, click “Stop experiment”.
Tablet, smart phone device
Materials needed:
NUL-218 ECG Sensor
3 Neulog Reusable Clamp Leads
WIFI-201 WIFI module
BAT-200 Battery
Your ECG sensor needs to be connected to a WIFI-201 module. The WIFI-201
module will create a closed NeuLog wifi network which will stream the NeuLog data to
a device of your choosing. Once your device is wirelessly connected to the NeuLog
network you can run experiments and collect data through a browser of your choosing.
Page 3

NEULOG ELECTROCARDIOGRAM SENSOR GUIDE
Procedure:
1. Connect the ECG sensor directly to the left side of a WIFI-201 module (no
wires required).
2. Connect a BAT-200 module to the right side of the WIFI-201 module.
3. Although not required, we recommend plugging the BAT-200 to an outlet
using a USB to micro USB charger (such as a typical cell phone charger).
The WIFI-201 module will run for 15-75 minutes (depending on the sensor)
without being plugged in.
4. For further WIFI-201 instructions or the WIFI-201 quick start guide please
visit www.NeuLog.com/download.
5. The WIFI-201 indicator lights will flash; take no action until the LED to the
far left turns blue.
6. Take your tablet or smart phone and go to the Wi-Fi settings and select the
NeuLog network which matches the WIFI module ID found on the back of
the WIFI-201 device. (NeuLogXXXX for example)
7. Give your device 1-2 minutes to connect to the WIFI-201 network.
8. Once the device is connected go to your browser and type in the website
wifi201.com into the URL bar, then wait for 30-60 seconds.
9. You will see a “Control mode” icon in the browser, click on this icon.
10. The browser will then load a new screen and begin to auto detect the
sensors, this can take a few minutes.
11. If the browser does not auto detect, select “Search for sensors”
12. Once the sensor is found you will see an icon on the left side of the screen
for the ECG sensor. The icon will display data in real time.
13. To set the ECG sensor’s settings click on “Module setup” button located on
the ECG sensor icon on the left side of your screen.
14. To change the experimental settings click the “Experiment setup” button
(experiment duration for example).
15. To run an experiment and collect data click “Run experiment”.
Operation with NeuLog viewer
Materials needed:
NUL-218 ECG Sensor
3 Neulog Reusable Clamp Leads
VIEW-101 Viewing Module
BAT-200 Battery
Procedure:
1. Connect the ECG sensor to the left side of the viewer.
2. Connect the BAT-200 module to the right side of the viewer.
3. The VIEW-101 will auto detect the sensor and you will see it appear on the
left side of the screen.
4. Once the sensor appears it will be monitoring data in real time.
5. To run an experiment and collect data click the run button (little green
person).
Off-line experiments
(Off-line experiments are for when you do not have a sensor connected directly to a
computer, tablet, smartphone, or NeuLog viewer).\
Materials needed:
NUL-218 ECG Sensor
3 Neulog Reusable Clamp Leads
BAT-200 Battery
Materials needed to configure your offline experiment:
USB-200 USB Module or WIFI-201 WIFI module or VIEW-101 Viewing Module
A USB to mini USB cable (which comes with the USB-200)
Procedure:
1. Connect the ECG sensor directly to the left side of a charged BAT-200
module.
2. When ready to collect data press the “Start/Stop” button on the ECG sensor,
a red light will turn on for the duration of the experiment.
3. To change the experiment settings first connect to your chosen device (PC,
Mac, tablet, smart device) and select the “Module setup” button. (For more
information on how to change the experiment settings view quick start
procedure section for your chosen device in this document.)
4. After the experiment has concluded (when the “Start/Stop” button is pressed
again or the data collection period ends) connect the sensor to your chosen
device. (full instructions in each device’s quick start procedure section)
Page 4

NEULOG ELECTROCARDIOGRAM SENSOR GUIDE
Sensor specifications
Range and operation modes
0 to 4092 Arbitrary units
ADC resolution
12 bit
Resolution
1
Max sample rate (S/sec)
100
5. Open NeuLog software.
6. Click the “Off-line experiment” button.
7. Click the “Load data from sensors” button.
8. Select which experimental data to upload. (5 experimental runs can be
stored at one time on the NUL-218 ECG sensor)
Restoring sensor’s factory default settings:
Procedure:
1. Connect the USB-200 to a PC, Mac, tablet, or smart device.
2. Connect the ECG sensor to a USB-200 module (they directly plug together).
Please note there is no calibration required for this sensor.
3. Open the NeuLog software.
4. Click the “Tools” icon.
5. Click “Restore sensor’s factory defaults” icon.
6. If prompted to clear the graph, click either the “Off-line either” or “On-line
experiment” (whichever you are using).
7. Click “Clear experiment results”.
8. Resume from step 4.
Included with sensor:
NeuLog NUL-218 ECG Sensor Guide (this document).
Neulog ECG probe with three alligator clips for easy connection to clamp leads.
3 ECG clamp leads (red, yellow, black).
Sensor features:
Fully digital data.
Rugged plastic ergonomic case.
Push button switch for Start/Stop experiments in off line mode.
LED indicator of experiment status (blinks while collecting data).
ECG probe attached to sensor body by a durable rubber-coated wire with
three alligator clip ends.
Pre-calibrated sensing equipment.
Note: NeuLog products are intended for educational use.
Videos and experiment examples:
Videos, literature and other probes can be found at www.NeuLog.com
http://www.NeuLog.com/Products/ECGloggerSensor.aspx
Electrocardiogram Measurement –
http://www.neulog.com/Portals/3/Users/Experiment B-40 Electrocardiogram
Measurment Ver 3.0.2.pdf
Technical background:
The philosophy behind NeuLog’s plug and play technology is based on each sensor’s
ability to store its own data due to an internal flash memory chip and micro-controller
in each plastic NeuLog body. This technology allows the sensor to collect and then
store the digital data in the correct scientific units (oC, oF, Lux, %, ppm, for example).
The sensor is pre-calibrated at the factory. The built-in software in the logger can be
upgraded for free at any time using the provided firmware update.
ECG sensors detect minor changes in electrical voltage which originate in the heart
and spread out across the body over a very short amount of time. Cells have a resting
potential of about 0.9 mV. A heart beat originates from an electrical impulse in the
Sinoatrial Node, often called the natural pacemaker. The electrical potential cascade
spreads across the heart. Using three leads, a positive, a negative, and a ground the
heart’s electrical charge (which originated in the heart) is measured.
Page 5

NEULOG ELECTROCARDIOGRAM SENSOR GUIDE
Maintenance and storage:
Never submerge the NeuLog plastic body in any liquid.
Do not allow liquid into the ECG sensor’s body.
After use, gently wipe away any foreign material from the ECG sensor.
Store in a box at room temperature out of direct sunlight.
Warranty:
We promise to deliver our sensor free of defects in materials and workmanship for a
period of 3 years from the date of purchase. Our warranty does not cover damage of
the product caused by improper use, abuse, or incorrect storage. Sensors with a shelf
life such as ion selective proves have a warranty of 1 year. Should you need to act
upon the warranty please contact your distributor. Your sensor will be repaired or
replaced.
Thank you for using NeuLog!
Flexible, simple, fast, forward thinking.
W: www.neulog.com
E: info@neulog.com
A: 850 St Paul Street, Suite 15, Rochester, NY 14605
P: 1.866.553.8536
V04302013
 Loading...