

Carbolite nanodac User Manual
The contents of section 4 onward are extracted from Eurotherm
nanodac manual HA030554/8 February 2014
for nanodac versions 5.00 and later
Sections not relevant to use in Carbolite products have been removed.
There is a possibility of references to notes that are not included.
For full operating instructions the nanodac manual is available on the
product tools DVD
Operating Instructions
nanodac™ recorder/controller/programmer
MC27 v1.04


Contents
1. NANODAC PASSWORD SECURITY ......................................................................................... 3
2. LOGIN ................................................................................................................................... 3
3. CASCADE ............................................................................................................................... 5
4. OPERATION ........................................................................................................................... 7
4.1 INTRODUCTION ................................................................................................................................................ 7
4.1.1 Display Screen ....................................................................................................................................................................... 7
4.1.2 Navigation Pushbuttons ........................................................................................................................................................ 7
4.1.3 On Screen Help...................................................................................................................................................................... 8
4.2 PROCESS VARIABLE DISPLAY .......................................................................................................................... 9
4.2.1 Alarm Icons ........................................................................................................................................................................... 9
4.2.2 Status Bar Icons ................................................................................................................................................................... 10
4.2.3 Breaks in recording .............................................................................................................................................................. 12
4.3 TOP LEVEL MENU ........................................................................................................................................... 13
4.3.1 Home .................................................................................................................................................................................. 13
4.3.2 Configuration ...................................................................................................................................................................... 13
4.3.3 Go to View .......................................................................................................................................................................... 14
4.3.4 History ................................................................................................................................................................................ 17
4.3.5 Faceplate Cycling on/off ...................................................................................................................................................... 17
4.3.6 Operator Notes ................................................................................................................................................................... 17
4.3.7 Demand Archiving ............................................................................................................................................................... 17
4.3.8 Login ................................................................................................................................................................................... 19
4.4 DISPLAY MODES ............................................................................................................................................. 21
4.4.1 Vertical Trend ...................................................................................................................................................................... 21
4.4.2 Horizontal Trend mode ........................................................................................................................................................ 22
4.4.3 Vertical Bargraph mode ....................................................................................................................................................... 22
4.4.4 Horizontal Bargraph mode .................................................................................................................................................. 23
4.4.5 Numeric mode .................................................................................................................................................................... 23
4.4.6 Alarm panel ......................................................................................................................................................................... 24
4.4.7 Control Loop1/Loop2 ........................................................................................................................................................... 25
4.4.8 Cascade Display Mode ......................................................................................................................................................... 26
4.4.9 Programmer Display Mode .................................................................................................................................................. 27
4.4.10 Promote List .................................................................................................................................................................. 38
4.4.11 Modbus Master display mode ......................................................................................................................................... 39
4.4.12 EtherNet/IP display mode ............................................................................................................................................... 42
4.5 TREND HISTORY ............................................................................................................................................. 48
4.5.1 Navigation .......................................................................................................................................................................... 48
4.5.2 History Options Menu .......................................................................................................................................................... 49
4.6 TEXT ENTRY .................................................................................................................................................... 50
4.6.1 Numeric keyboard ............................................................................................................................................................... 50
4.6.2 USB keyboard ..................................................................................................................................................................... 50
5. CONFIGURATION ................................................................................................................. 51
5.1 NETWORK MENU ............................................................................................................................................ 51
5.1.1 Interface .............................................................................................................................................................................. 52
5.1.2 Archiving ............................................................................................................................................................................. 53
5.1.3 FTP Server ........................................................................................................................................................................... 55
5.1.4 Modbus TCP ........................................................................................................................................................................ 56
5.2 GROUP CONFIGURATION ............................................................................................................................... 57
5.2.1 Group Trend configuration .................................................................................................................................................. 57
5.2.2 Group Recording configuration ............................................................................................................................................ 58
6. ITOOLS ................................................................................................................................ 59
6.1 iTools CONNECTION ....................................................................................................................................... 60
6.1.1 Ethernet (Modbus TCP) communications ............................................................................................................................. 60
6.1.2 Direct Connection ................................................................................................................................................................ 62
6.2 SCANNING FOR INSTRUMENTS ...................................................................................................................... 63
6.3 PARAMETER EXPLORER ................................................................................................................................. 64
6.3.1 Parameter explorer detail .................................................................................................................................................... 65
6.3.2 Explorer tools ...................................................................................................................................................................... 66
1 MC27 –EN–1.04

nanodac™
6.3.3 Context Menu ..................................................................................................................................................................... 66
6.4 WATCH/RECIPE EDITOR ...................................................................................................... 67
6.4.1 Creating a Watch List ........................................................................................................................................................... 67
6.4.2 Watch Recipe toolbar icons ................................................................................................................................................. 68
6.4.3 Watch/Recipe Context Menu ............................................................................................................................................... 68
6.5 PROGRAMMER OPTION ..................................................................................................... 69
6.5.1 Segment parameter editing ................................................................................................................................................ 69
6.5.2 Digital Event display ............................................................................................................................................................ 71
6.5.3 Program parameters ............................................................................................................................................................ 71
6.5.4 Adding and deleting segments. ............................................................................................................................................ 72
6.5.5 Loading and Saving programs ............................................................................................................ 73
6.5.6 Toolbar icons ................................. 73
6.5.7 Context menus ..................................................................................................................................................................... 74
6.5.8 Programmer menu ............................................................................................................................................................... 75
6.5.9 Two channel programs ......................................................................................................................................................... 76
6.5.10 To Set Up OEM Security .................................................................................................................................................. 77
7. USER WIRING ...................................................................................................................... 80
7.1 COUNTER EXAMPLE ....................................................................................................................................... 81
8. USB DEVICES ....................................................................................................................... 84
8.1 MEMORY STICK .............................................................................................................................................. 84
8.2 BAR CODE READER ........................................................................................................................................ 84
8.3 USB KEYBOARD ............................................................................................................................................. 84
9. APPENDIX A: TECHNICAL SPECIFICATION ........................................................................... 85
9.1 RECORDER SPECIFICATION............................................................................................................................. 85
9.2 ANALOGUE INPUT SPECIFICATION................................................................................................................ 86
10. APPENDIX B TUNING CONSIDERATIONS ........................................................................... 88
10.1 Autotune ......................................................................................................................................................... 88
10.1.1 Relative Cool Gain in Well Lagged Processes .................................................................................................................. 94
11. APPENDIX C: REFERENCE .................................................................................................... 97
12. APPENDIX E: WEB SERVER ................................................................................................ 103
12.1 Browsers ........................................................................................................................................................ 103
12.2 Connecting to the Internet.............................................................................................................................. 103
12.3 Denied Page ................................................................................................................................................... 103
12.4 Error Message ................................................................................................................................................ 103
12.5 Home Page .................................................................................................................................................... 104
12.6 About Page .................................................................................................................................................... 104
12.7 Contact Page .................................................................................................................................................. 104
12.8 Bar Graph Page .............................................................................................................................................. 105
12.9 Line Graph Page ............................................................................................................................................. 106
12.10 Numeric Page ............................................................................................................................................ 107
12.11 Alarm Summary Page ................................................................................................................................ 107
12.12 Message Summary Page ............................................................................................................................ 108
12.13 Promote Page ............................................................................................................................................ 108
12.14 Historical Line Page ................................................................................................................................... 109
12.15 Status Icons ............................................................................................................................................... 110
12.16 DHCP Support ........................................................................................................................................... 110
12.17 Network Protocols ..................................................................................................................................... 110
12.18 Languages ................................................................................................................................................. 110
13. APPENDIX F: LABVIEW DRIVER .......................................................................................... 111
13.1 Application Example 1 - Heat/Cool Control ..................................................................................................... 111
13.2 Application Example 2 - Program Load by Program Number ........................................................................... 114
13.3 Full driver capabilities list ................................................................................................................................ 115
MC27 –EN– 1.04 2

nanodac™
1. Nanodac password security
While in Logged out mode the control loop can be viewed but no alterations can be made. The
program page can be viewed but no change in status or editing of the program can be made.
Various chart pages can be viewed along with said history for charts. Operator notes can be
viewed and written to charts and message log.
Password codes: Operator level: 9
Password codes: Supervisor level: 5
Password codes: Engineer level: 95
While in Operator mode all of the above is available plus you can change the set point of the
control loop. Change the status of the program (i.e. Run, Hold or Reset).Edit, store, and load or
delete a program. Carry out a demand archive to a device and choose what device said archive
should be sent to (USB or FTP server). See main manual for details.
While in Engineer mode the following can be change: Time; Date; Communication setting.
2. Login
LOG IN Procedure for the Eurotherm Nanodac Controller/Programmer
Switch on the Instrument. Also refer to section 4.3.8.
To run a program you must ‘log in’. To log in follow the instructions below.
Press the Home button (Left hand button) to bring up the LOG IN screen as shown below.
Highlight the Log in by using the Up/Down arrows (right hand buttons).
Press the Scroll button (2nd button from the LHS) to move to the access screen as shown below.
3 MC27 –EN–1.04

nanodac™
Use the arrow UP/DOWN buttons to select the operator mode as shown below.
Press the Scroll button to accept the operator mode as shown below.
A password is now required for the Operator mode. The password to be used “9”. Press the
Scroll key to bring up the keyboard and use the UP/DOWN arrows to select the numeric tab and
then number “9”.
Press the scroll button to accept the password number “9”.
Press the Home page (Left hand button).
“CANCEL – NO – YES” will appear and select “YES” using the arrow UP/DOWN buttons.
Press the Scroll key.
Note that LOGIN has now changed to LOG OUT as shown below. This is normal and correct.
Press any button to return to the home page (default page). It will now be possible to select and
highlight the boxes in the program page and select “RUN” to run a program.
MC27 –EN– 1.04 4

nanodac™
3. Cascade
3.1. PRINCIPLE OF CASCADE CONTROL
When cascade control is fitted, the Load Loop in the Nanodac senses the temperature of the
workload, and the Element Loop in the Nanodac senses the element temperature. Depending on
the oven or furnace model, the Load Thermocouple may be in a fixed position, or may be movable.
The Element Thermocouple is fixed in a predetermined position near the heating elements
If movable, the Load Thermocouple should be placed as near as possible to the work to be heated.
The Load Loop communicates with the Element Loop, calling for heat according to the load
temperature and the current program or setpoint. The Element Loop regulates the heat according
to element temperature and the requests from the Load Loop.
The element temperature could, in principle, vary between the furnace or oven maximum and
minimum, regardless of the working temperature of the load. In practice, the cascade control
system is configured to limit the element temperature to a band around the load temperature,
typically of ±500 C of the setpoint temperature.
The Load Loop is always accessible to the operator. The Element Loop may or may not be located
out of sight inside the control compartment. If the Element Loop is visible to the operator, the
display may be disregarded.
In a three-zone furnace for which the “three zone cascade” option has been ordered there are
three Element Controllers, all receiving the same control instructions from the Load Controller
3.2. OPERATION
The operator may ignore all the complications of the system, and program the Load Loop
according to the standard instructions for that controller. Home display is top view (Load Loop)
bottom view (Element loop). By pressing page, separate views of load and element loops will
show.
The Element Loop should never be adjusted. Note that the elements usually run at a higher
temperature than the load.
Because the details of the customer’s cascade application (in particular the nature of the load) are
generally not known, the feed forward parameter (Cascade Trim) is made easily accessible on the
cascade trim page. (Refer to instrument operating instructions). Its default setting is ±500 C. If
overshoot of the load temperature occurs – often a problem at low temperatures – then Cascade
Trim can be reduced in order to limit the amount of overshoot. If Cascade Trim is reduced too
much, however, the load may not reach the desired temperature. If the load does not reach the
desired temperature or is slow in the final stages, Cascade Trim can be increased: a maximum of
750 C is suggested.
When attempting to control at very low temperatures it can become a problem to achieve stable
control because of excessive power being supplied during heating. The available power can be
limited using the power limit parameter OP.Hi, and make a note of the original settings before
adjusting. The manual for the furnace or oven may also list standard settings for this parameter.
The parameter is normally set to 100% and contact Carbolite Engineering if this value needs to be
amended.
3.3. CAUTION
If the Load Thermocouple is removable, leave it in the furnace or oven chamber
whenever possible.
Operating with the Cascade Control active and with the Load Thermocouple in
an unheated position (such as lying on the work bench) may cause the furnace
or oven to heat up to its maximum temperature, wasting power and possibly
shortening element life.
5 MC27 –EN–1.04

nanodac™
3.4. OVER-TEMPERATURE CONTROL
Where over-temperature control is fitted, it normally protects against failure of the control system or
of a component such as a power control relay. The over-temperature controller must be set at a level
higher than the greatest element temperature, typically 15°C above maximum.
If the working temperature is less than the maximum temperature, then it may be possible to set the
over-temperature limit as follows:
Working Temperature + Cascade trim high (eg 50) +15°C
Example: for working at 800°C in a 1200°C furnace, the over-temperature limit could be set to
800+50+15=865°C.
MC27 –EN– 1.04 6
nanodac™
Faceplate
Main display
screen
Status area
Home
Configuration
Go to View
History
Faceplate Cycling (On)
Operator Notes
Demand Archiving
Log Out
4. OPERATION
On power up a default or custom splash screen appears and remains visible whilst the
unit is initialising. If during this process a network broadcast storm is detected, the
unit stops, displaying a network failure icon until the broadcast storm has cleared,
after which the initialisation process resumes.
4.1 INTRODUCTION
The operator interface consists of a display screen and four push buttons.
4.1.1 Display Screen
The display screen is used both to display channel information (in one of a number of display modes), and
to display the various configuration screens which allow the user to setup the recorder to display the
required channels, to set up alarms and so on. Display modes are described in Section 4.4 below;
configuration is described in Section 5
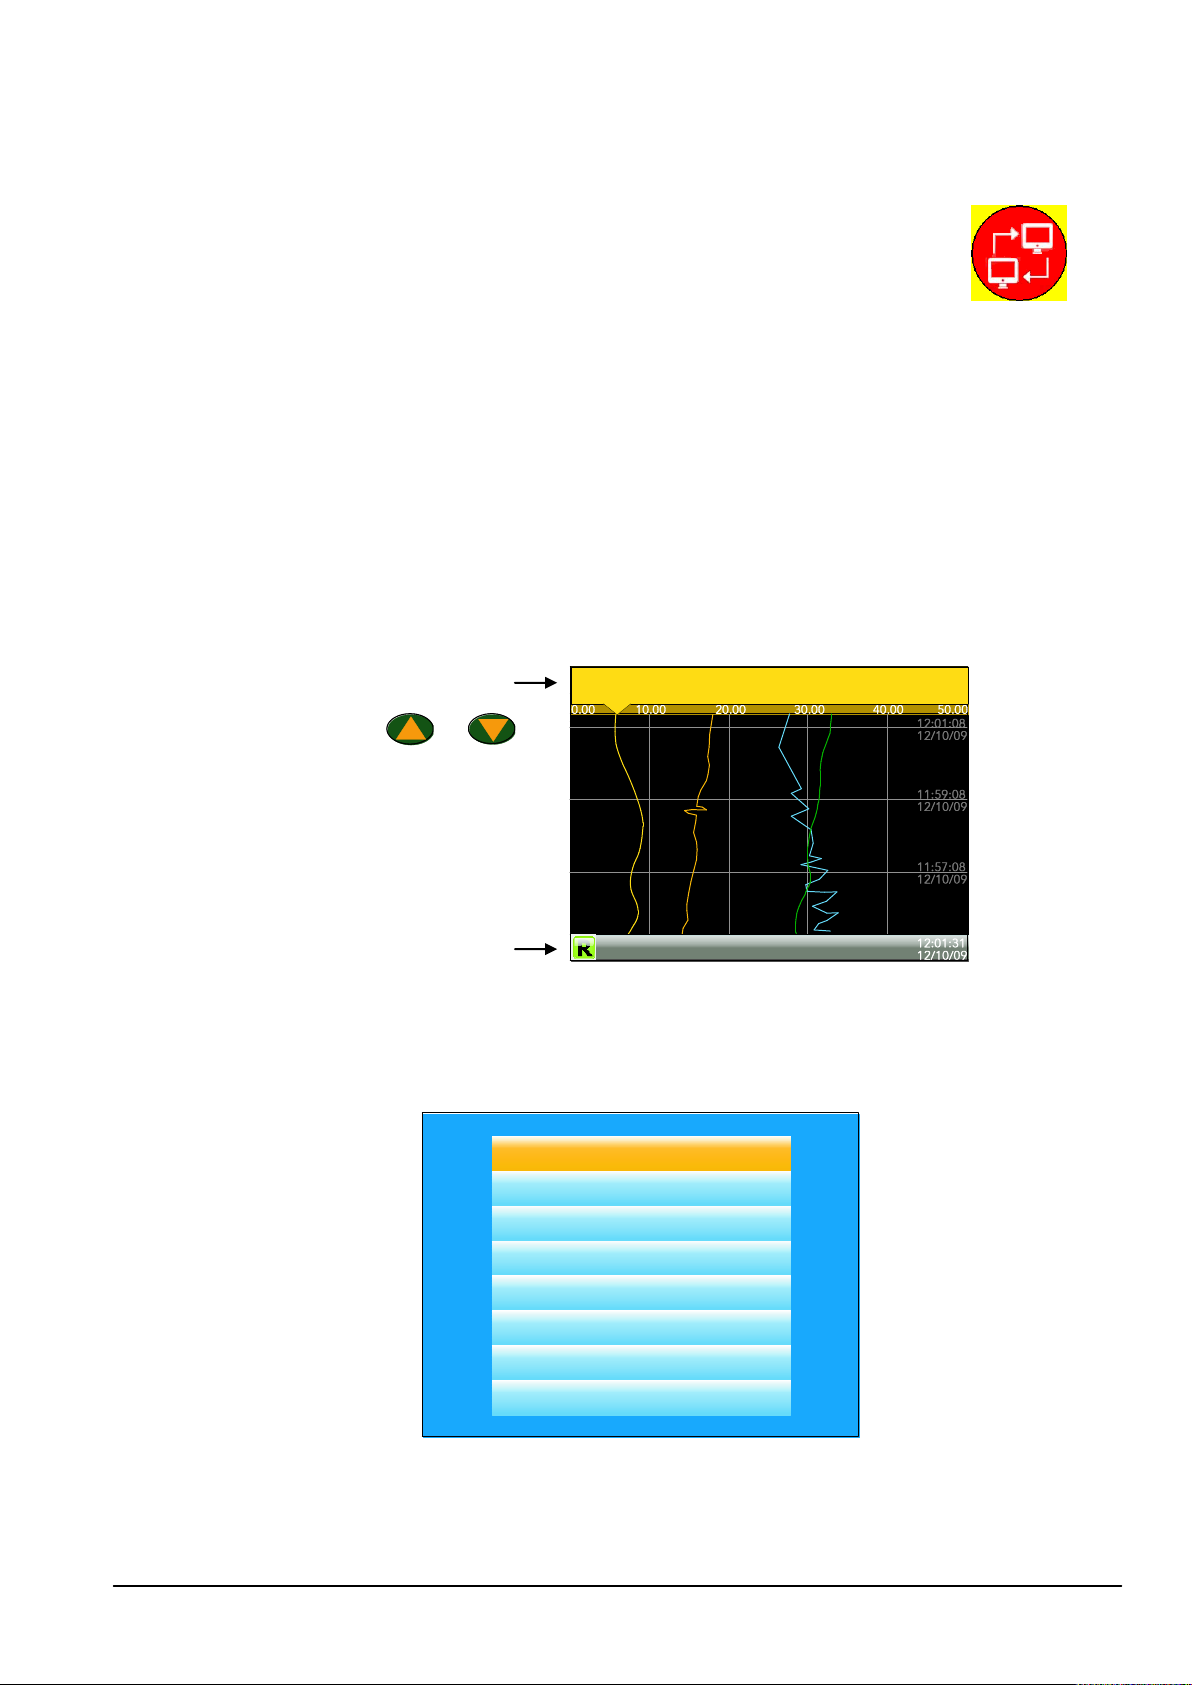
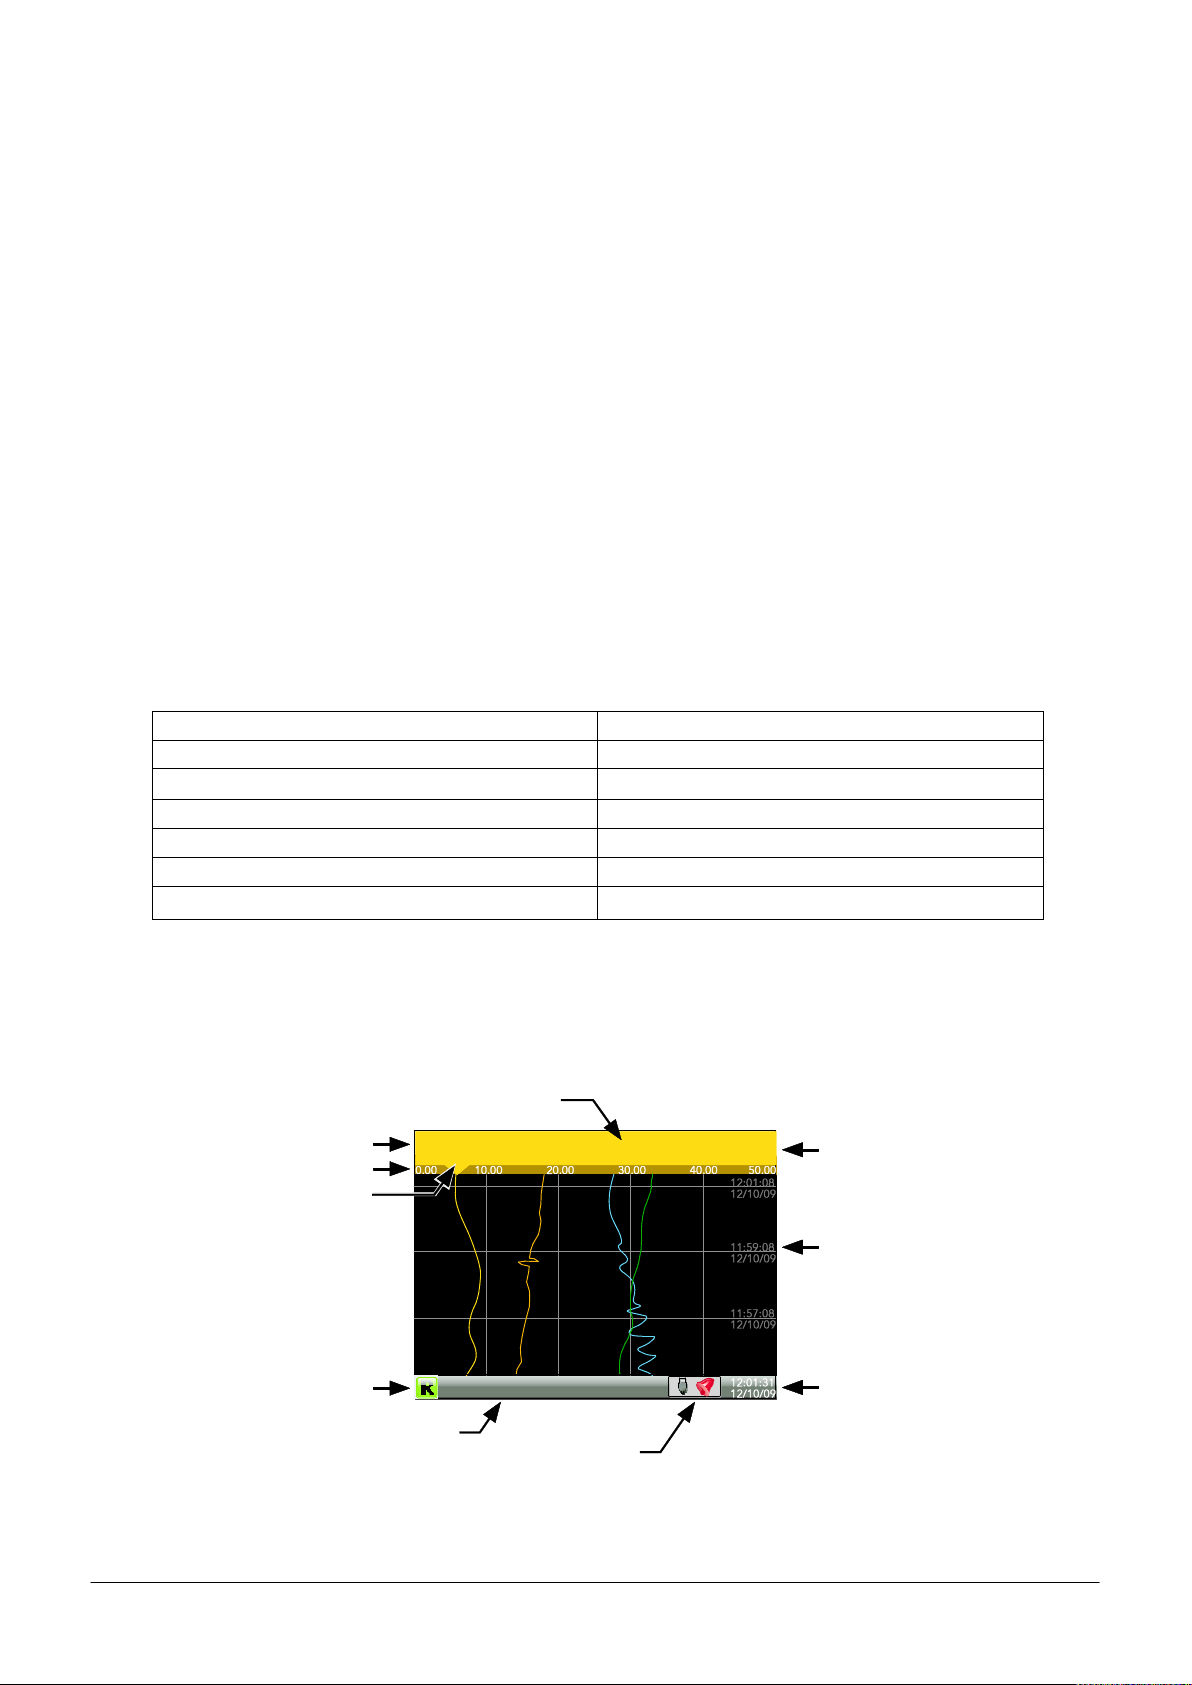
In display mode, the screen is split horizontally into three areas (figure 1.1.1)
1. a faceplate giving channel details.
2. the main display screen showing channel traces etc.
3. the status area, displaying instrument name, the current time and date and any system icons.
Figure 1.1.1 Display mode screen (vertical trend)
In configuration mode, the entire display screen is devoted to the selected configuration menu.
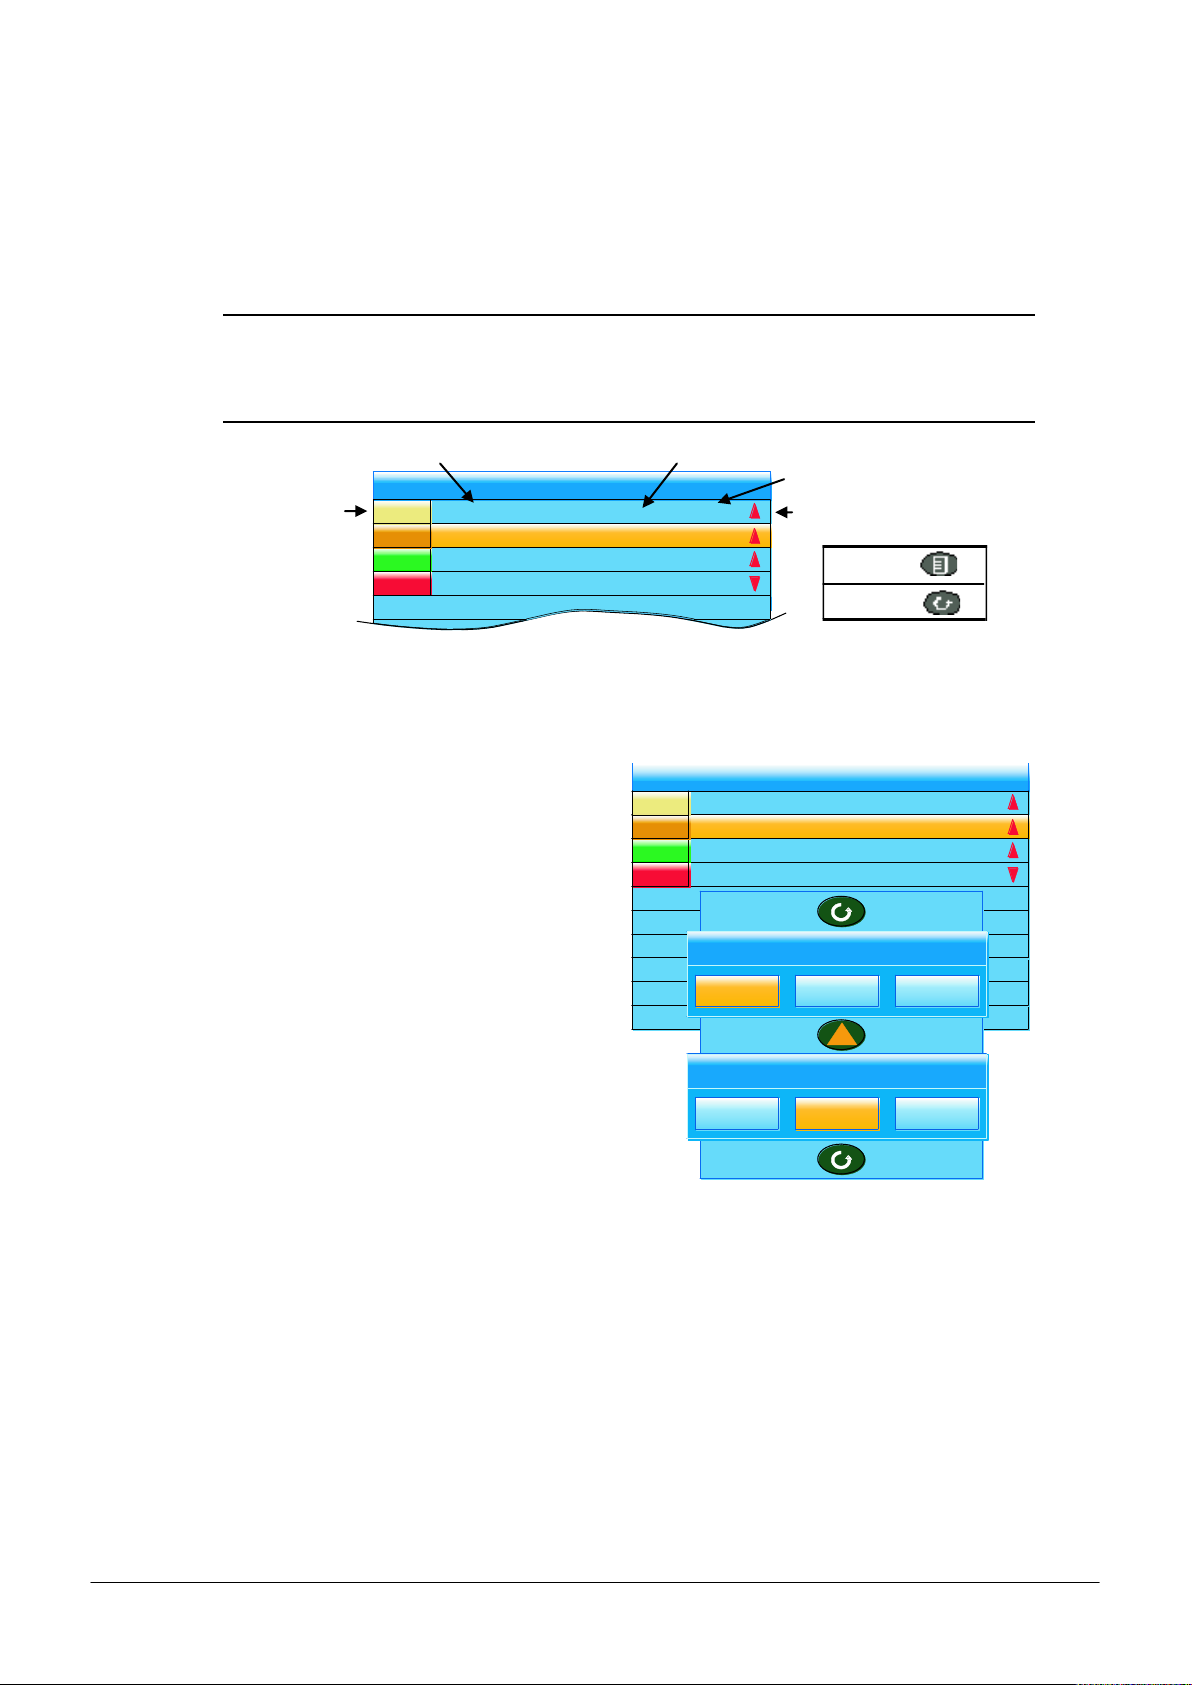
4.1.2 Navigation Pushbuttons
7 MC27 –EN–1.04
There are four navigation buttons, called ‘Page’, ‘Scroll’, ‘Lower’ and ‘Raise’ located below the screen. The
general properties of these buttons are described in the remainder of this section, but some have
additional, context sensitive functions, which, for the sake of clarity are not described here but in the
relevant sections (e.g. ‘Message summary’) of the manual.
Figure 1.1.2 Top level menu (Engineer level access)

nanodac™
On-screen help.
(Use the Page button with
the down arrow to access
hidden text at the bottom of
the screen)
Logic (2 Input(
Logic (8 Input)
Multiplexor
Math (2 Input)
Timer
User Values
Alram Summary
The timer function block
offers a universal timer
which may be
re-configured between
single pulse outputs and
re-triggering
outputs. Timer types are:
On pulse on-timer.
+
Select confiuguration menu
Navigation Pushbuttons (Cont.)
PAGE BUTTON
From any non-configuration page, pressing this push button causes the top level menu (figure 1.1.2) to
appear. The figure shows the menu for a user logged in with ‘Engineer’ level access. Other access levels
may have fewer menu items.
Within configuration pages, the Scroll button can be used as an enter key to select lower menu levels. In
such cases the page button is used to reverse this action, moving the user up one menu level per
operation.
SCROLL BUTTON
From trending pages, operation of the scroll push-button scrolls through the channels enabled in the
group. The Faceplate cycling ‘Off’ selection can be used to keep a particular channel permanently
displayed, and the scroll pushbuttons can then be used to select channels manually.
In configuration pages, the scroll key operates as an ‘enter’ key to enter the next menu level associated
with the highlighted item. Once the lowest menu level is reached, operation of the scroll key allows the
value of the selected item to be edited by the relevant means (for example, the raise/lower keys, or a
keyboard entry).
The ‘Page’ key is used to move the user back up the menu structure, until the top level menu is reached,
when the scroll key can be used again to return to the Home page.
The scroll button is also used to initiate user wiring as described in Section 7
RAISE/LOWER BUTTONS
Within trending displays, the Raise and Lower keys can be used to scroll through the enabled display
modes in the sequence: vertical trend, horizontal trend, vertical bargraph, horizontal bargraph, numeric,
vertical trend... and so on.
Within configuration pages, these pushbuttons act as cursor keys, allowing, for example, the user to
highlight menu items for selection using the scroll button, and in many cases allowing the user to select
one from a number of alternative values within menu items. These keys are also used to navigate through
the virtual keyboards and number pads used to enter text or numeric strings.
4.1.3 On Screen Help
The top level configuration menu includes contextual help text on the right-hand half of the screen.
Mostly this text fits within on screen height. Where this is not the case, the text can be moved up or down
the screen by holding the Page button operated whilst using the up and down arrows to move the text.
The down arrow moves the text upwards on the screen; the up arrow moves it downwards.
MC27 –EN– 1.04 8
Figure 1.1.3 On-screen help (typical)
nanodac™
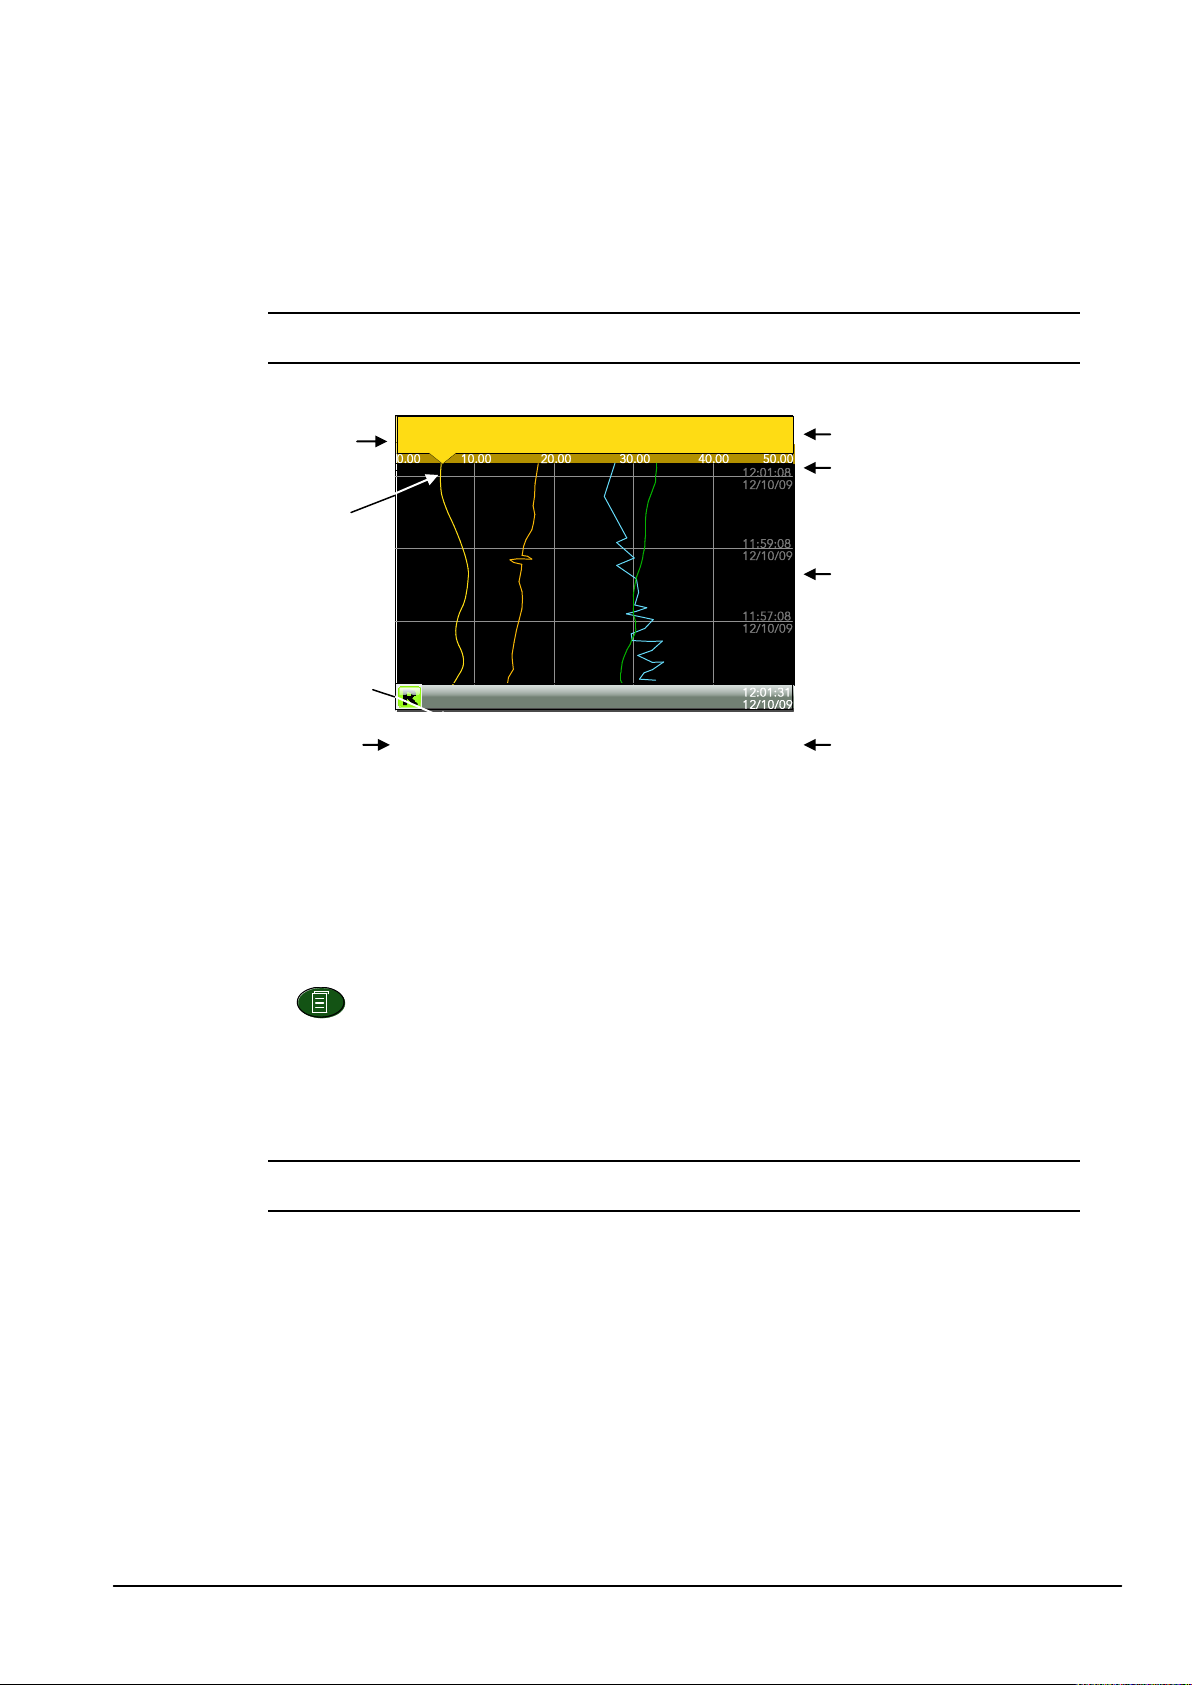
Current point value and units
Current point scale
Time/date stamps
Current time/date
Current point
name
Current point
‘pen’
Instrument name
Recording status
Channel 1
6.
23
Inst name
4.2 PROCESS VARIABLE DISPLAY
As discussed above, the operator interface consists of a display screen and associated push buttons. The
display screen shows process variables in one of a number of formats, or operational details (notes or
alarm history for example), or configuration details for use in setting up the recorder to produce the
required displays and history formats. The remainder of section four discusses the process variable
displays, alarm displays and so on; configuration details are to be found in Section 5.
Note: Some of the items below can be selected for use only by users with a suitable permission
level as set up in the ‘Instrument’ ‘Security’.
Figure 1.2 below, depicts a typical trend display and gives details of the various areas of the display page.
Figure 1.2 Typical display screen (Vertical trend)
Figure 1.2 shows a vertical trend page. Operating the Raise/Lower push-buttons allows the user to scroll
through the other display modes: Horizontal trend, Vertical bargraph, horizontal bargraph, numeric,
vertical trend... and so on. All these display modes are described in Section 4.4, below.
A display mode can also be selected from the Top level menu ‘Go To View’ item which appears when the
‘Page’ key is operated.
The scroll button can be used to scroll through the points in the group, overriding the ‘Faceplate Cycling’
on or off selection
4.2.1 Alarm Icons
Note:
Trigger alarms do not display threshold marks or bars, or faceplate symbols
The alarm icons shown below appear in some display modes. The icons on a channel faceplate show the
status of that channel’s alarm(s), as follows:
Icon is flashing alarm is active but unacknowledged or it is an Auto alarm which is no longer
active but which has not been acknowledged
Icon steadily illuminated the alarm is active and has been acknowledged.
Alarm thresholds and deviation alarm bars appear for horizontal and vertical trend modes. For deviation
bars, the bar stretches from (Reference - Deviation) to (Reference + Deviation). Vertical and Horizontal
bargraph modes display only absolute alarm symbols.
9 MC27 –EN–1.04

nanodac™
Absolute High
Absolute Low
Deviation High
Deviation Low
Deviation Band
Rising Rate of change
Falling Rate of change
Digital High
Digital Low
Alarm Icons (Cont.)
4.2.2 Status Bar Icons
The following items can appear in a dedicated window immediately to the left of the time and date, at the
bottom right-hand corner of the display. The width of this window expands as the number of icons
increases, and the instrument name is truncated, as necessary, to make room.
SYSTEM ALARMS
This indicator appears, flashing, if any one or more of the alarms listed below is active. The System
Alarms summary page (accessed from ‘Go to View in the top level menu) allows the user to view such
system alarms as are active. It is not possible to ‘acknowledge’ system alarms
Archive Disabled An unattended archiving strategy has temporarily been
Archiving Failed An unattended archiving strategy has failed to complete.
Archiving Timeout A configured archiving strategy has timed out.
Battery failure Indicates that the battery is approaching the end of its useful
Broadcast Storm detected Networking is limited until the storm has passed.
Clock failure The internal clock was found to be corrupt at power up, or that
Channel error Indicates a hardware failure in the channel circuit or in the
Database failure Corrupted EEPROM or flash memory.
DHCP Server failure For units with ‘IP Type’ set to ‘DHCP’ (Network.Interface
FTP Archiving file lost A file has been deleted that had not yet been archived. Possible
FTP Archiving to slow The archive rate is too slow to prevent the internal memory
MC27 –EN– 1.04 10
Table 1.2.1 Alarm icons
disabled.
life, or that it is missing or is completely exhausted. Immediate
battery replacement is recommended (Appendix C; section C1).
the time has never been set. Time is forced to 00:00 1/1/1900.
Can be caused by battery failure, in which case a battery failure
message appears. The error is cleared by setting the time and
date.
internal cold junction temperature measurement.
configuration) this alarm occurs if the instrument is unable to
obtain an IP address from the server.
causes: Communications with the server could not be
established,; archive is disabled; archive rate too slow.
from overflowing. The recorder effectively switches to
‘Automatic’ (Section 5.1.2) to ensure that data is not lost.

nanodac™
Memory
stick fitted
Transfer in
progress
Status Bar Icons (Cont.)
FTP Primary Server Failure This error occurs if the recorder fails to establish connection
with the primary server, after two attempts. After the second
attempt fails, the recorder attempts to establish connection
with the secondary server instead. Primary and secondary
server details are entered in the Network. Archiving area of
configuration (Section 5.1.2).
FTP Secondary Server Failure This error occurs if the recorder fails to establish connection
with the secondary server, after two attempts. Primary and
secondary server details are entered in the Network.Archiving
area of configuration (Section 5.1.2).
Maths channel failure Appears if, for example, the divisor of a divide function is zero.
Media archiving file lost A file has been deleted that had not yet been archived. Possible
causes: Memory stick missing, full or write protected; archiving
has been disabled; archiving rate too slow.
Media archiving to slow The archive rate is too slow to prevent the internal memory
from overflowing. The recorder effectively switches to
‘Automatic’ (Section 5.1.2) to ensure that data is not lost.
Media full Archive storage device is full. The alarm becomes active only
when an archive is in progress.
Media missing No archive storage device present when archive attempted.
Non-volatile memory failure RAM copy of non-volatile parameters is corrupted.
Non-volatile Write Frequency warning
Recording failure (message) Message explains reason for failure.
USB overcurrent USB power fault - too much current (i.e. >100mA) is being
Wiring failure The user wiring has failed to verify, i.e. one or more wires has
One or more parameters are being written frequently to non-
volatile memory. If this continues, it may lead to ‘memory
depletion’ (i.e. the memory will no longer be able to store
values correctly). A common cause of this problem is frequent
writes over Modbus comms.
drawn by a USB device.
been detected that does not have both a source and a
destination defined. This may be the result, for example, of
power loss during a download from iTools.
11 MC27 –EN–1.04
CHANNEL ALARM
This indicator appears if any channel (including channels not in the display group) is in an alarm state. The
symbol is illuminated continuously if all alarms are acknowledged or flashes if any one or more alarms is
unacknowledged. Alarms are acknowledged from the Root menu ‘Alarm summary’ item as described in
Error! Reference source not found. or in the Channel configuration area if the user’s access permission is
appropriate.
USB
This icon appears whenever a memory stick (max. capacity 8GB) or other supported USB device (section
8) is plugged into the USB port at the rear of the recorder.
When data transfer is in progress between the instrument and the memory stick, the icon changes to a
‘busy’ version.
CAUTION
The Memory stick must not be removed while archiving (demand or automatic)
is in progress, as to do so may irreparably damage the file system of the
memory stick, rendering it unusable. It is recommended that all archiving be
suspended before the memory stick is removed.
FTP ICON

nanodac™
The FTP icon appears whenever transfer activity is taking place.
MC27 –EN– 1.04 12

nanodac™
Status Bar Icons (Cont.)
RECORD ICON
One of four icons appears at the bottom left corner of the display to indicate recording status.
Record
This indicates that the recorder is recording the items selected in the Group Recording area of
configuration (Section 5.2.2).
Stopped
This means that ‘Enable’ has been set to ‘no’ in the Group Recording area of configuration (Section 5.2.2).
Trending is not affected.
Paused (Suspended)
This means that recording has been paused by a wire to the Suspend parameter (Group Recording area of
configuration going true (high). Trending is not affected.
In Configuration
The recorder has been placed in configuration mode either at the user interface, or via iTools. Recording
is stopped until the recorder is no longer in configuration mode. For each non-recording state (Stopped,
Paused or In Configuration). A new history file is created when the unit comes out of configuration mode.
Note: For recording to be enabled, configuration status must be ‘logged out’ both at the
instrument and at iTools.
MESSAGE ICON
This ‘envelope’ icon appears when a message is generated and it remains on display until the Message
Summary is accessed, when it is removed from the display until the next new message is generated.
AUTOTUNE ICON
For instruments fitted with the Loop option, this symbol appears during the Autotune process.
4.2.3 Breaks in recording
Breaks in recording can be caused by the unit being powered down, by the user entering configuration
mode or when the recorder time is changed manually. In vertical and horizontal trend modes, a line is
drawn across the width/height of the chart to indicate that recording has been interrupted.
On power up, a red line is drawn across the chart. In ‘History’, if messages are enabled the message:
Date Time System power up
is printed on the chart, together with the configuration and security revisions.
On exiting configuration mode, a blue line is drawn on the chart and in ‘History’, if messages are enabled,
the messages:
Date Time Logged out.
Date Time Config Revision: N was N-1 (assuming a configuration change was made)
Date Time Logged in as: Engineer
appear on the chart.
When the instrument time is changed (manually - not through daylight saving action) a green line is
drawn on the chart and in ‘History’, if messages are enabled, the message:
Date Time Time/Date changed
appears on the chart.
13 MC27 –EN–1.04
nanodac™
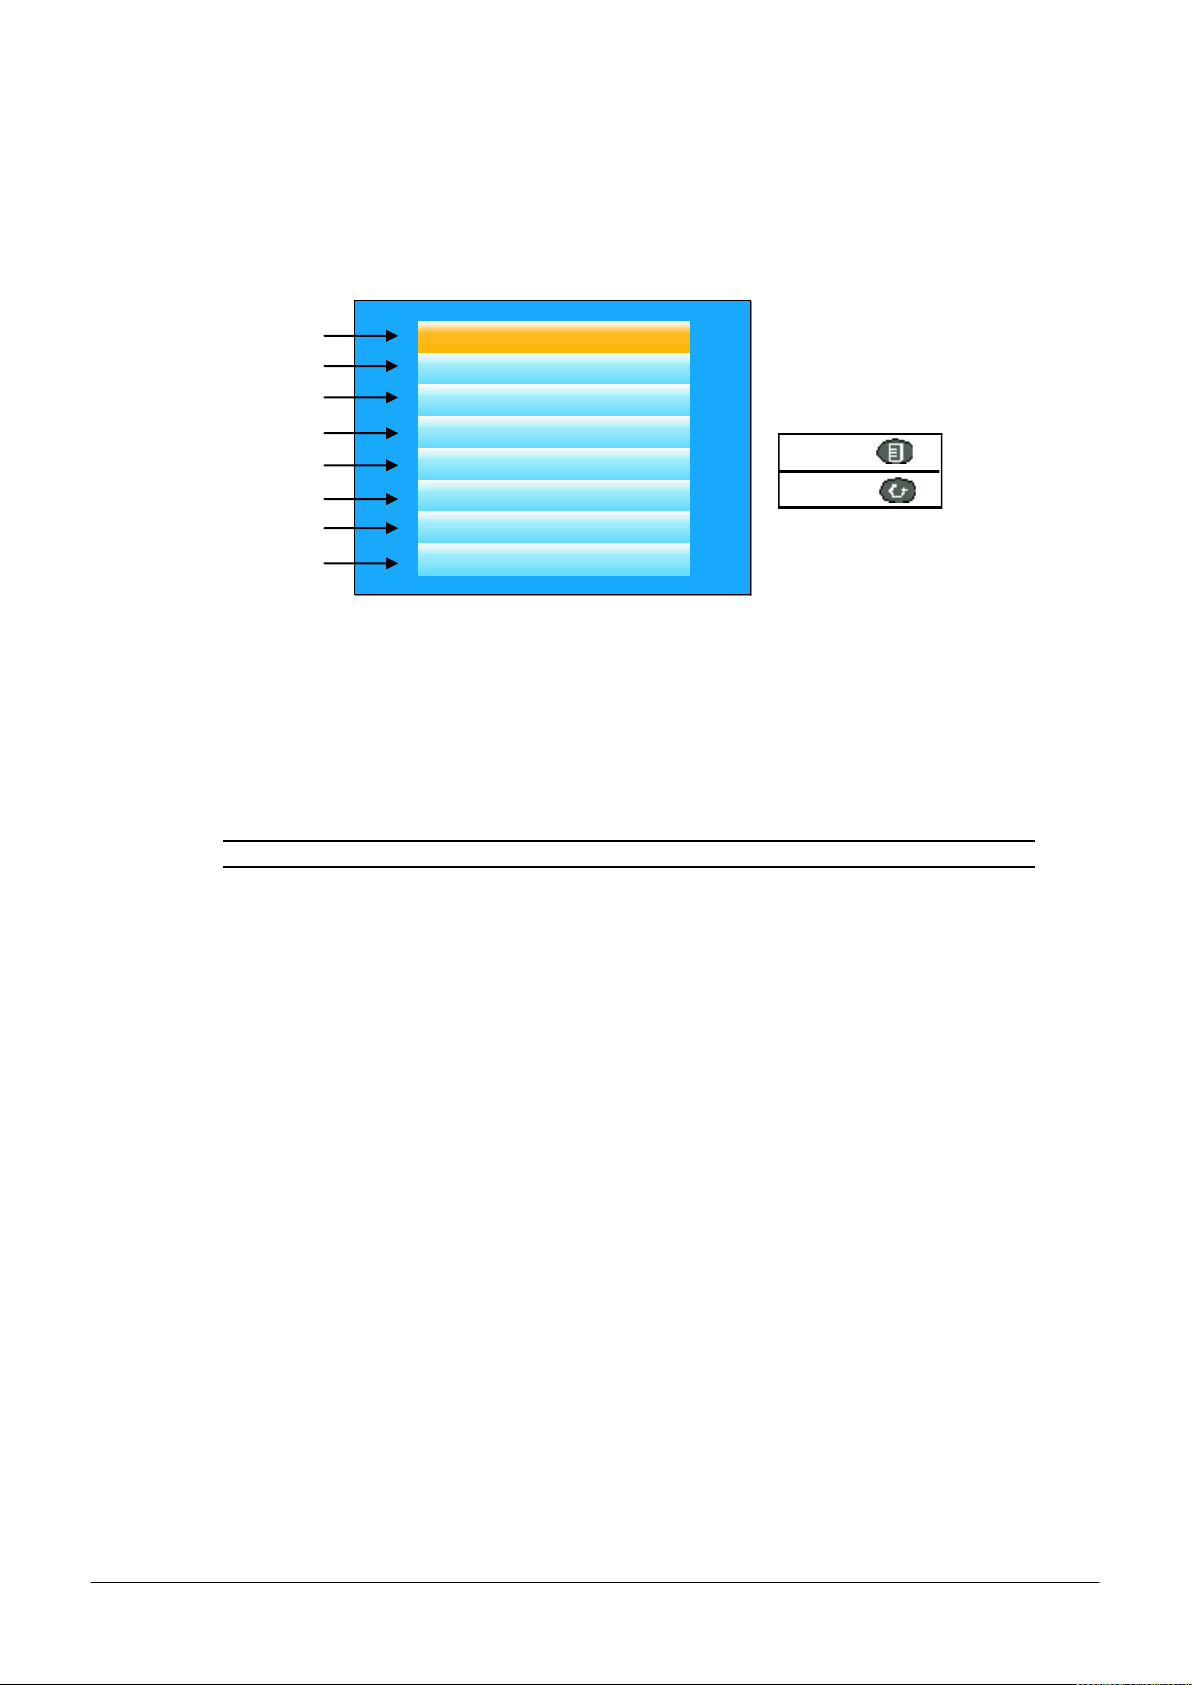
Page key
Scroll key
Home
Configuration
Go to View
History
Faceplate Cycling (On)
Operator Nores
Demand Archiving
Log Out
Section 4.3.1
Section 4.3.2
Section 4.3.3
Section 4.3.4
Section 4.3.5
Section 4.3.6
Section 4.3.7
Section 4.3.8
4.3 TOP LEVEL MENU
This menu appears when the page key is operated from any non-configuration page. The menu items
displayed depend on the access permission of the user. One of the menu items is highlighted, and if the
scroll key is operated, then it is the highlighted item that is ‘entered’.
Figure 1.3 shows the top level menu for Engineer level access.
Figure 1.3 Top level menu
4.3.1 Home
Operating the scroll key whilst ‘Home’ is highlighted causes a return to the ‘Home’ page.
4.3.2 Configuration
Operating the down arrow key highlights the ‘Configuration’ item. Operating the Scroll key enters the
configuration submenu described in Section 5 of this manual.
Note: ‘Configuration’ appears only if the user has an appropriate access level.
MC27 –EN– 1.04 14

4.3.3 Go to View
Alarm Summary
System Alarms
Message Summary
Vertical Trend
Horizontal Trend
Vertical Bargraph
Horizontal
Bargraph
Alarm Summary
System Alarms
Message Summary
Vertical Trend
Horizontal Trend
Vertical Bargraph
Horizontal Bargraph
Numeric
Alarm Panel
Control
Control (Dual Loop)
Cascde
Programmer
Steriliser
Promote List
Modbus Master
EtherNet/IP
Alarm Panel
Control
Dual Loop
Cascade
Programmer
Steriliser
Promote List
Modbus Master
EtherNet/IP
Operating the scroll key whilst the ‘Go to view’ item is highlighted, calls the Go to view submenu (figure
1.3.3a). This allows the user to view channel alarms, system alarms, messages or to select a different
display mode.
Figure 1.3.3a Go to view submenu
Notes:
1. If an option (e.g. ‘Steriliser’) is not fitted, its display mode does not appear in the list.
2. Some display modes must be enabled in Instrument. View configuration before they become
available.
nanodac™
15 MC27 –EN–1.04
nanodac™
Page key
Scroll key
Alarm Summary
Furnace 1 temp 1 750.00 798.39
Furnace 1 temp 3 750.00 763.39
Furnace 1 temp 2 590.00 603.39
Furnace 2 temp 1 750.00 630.71
Channel descriptor
Channel ID (Alarm
number)
Alarm threshold
Channel current process value
Alarm type indicator
C
1(
2
)
C
N
C
ANC
A
Alarm Summary
Furnace 1 temp 1 750.00 798.39
Furnace 1 temp 3 750.00 763.39
Furnace 1 temp 2 590.00 603.39
Furnace 2 temp 1 750.00 630.71
C
1(
2
)
C
Acknowledge alarm?
Acknowledge alarm?
Go To View (Cont.)
ALARM SUMMARY
For each active alarm, this page displays the channel identifier with alarm number (e.g. C1(2) = channel 1;
alarm 2), the channel descriptor, the alarm threshold the current process value and an alarm type symbol.
To return to the top level menu, operate the Page key.
ALARM ACKNOWLEDGEMENT
To acknowledge an alarm from this view:
1. Use the up and down arrows to highlight the
2. Operate the scroll button. The ‘Acknowledge
3. Use the up arrow to highlight the relevant field
4. Operate the scroll key to confirm. If the alarm
SYSTEM ALARMS
Operating the scroll button whilst the ‘System Alarms’ field is highlighted displays a list of all currently
active system alarms. Status Bar Icons contains a list of system alarms and their interpretations. To
return to the top level menu, operate the Page key.
A further operation of the scroll button displays a ‘Help Information’ page, giving the reason for the
highlighted alarm.
Operate the scroll button again to return to the system alarm display.
MC27 –EN– 1.04 16
Notes:
1. The background colour to the channel ID is the same as that chosen for the channel.
2. A prefix ‘C’ in the channel ID means that this is a measuring channel; A prefix ‘V’ means that
this is a virtual channel (i.e. a totaliser, counter or maths channel)
Figure 1.3.3b Alarm summary page with acknowledge confirmation display
required alarm
alarm’ window appears.
(C2(1) in this example), or ‘All’ if all alarms are
to be acknowledged.
fails to respond, this may be due to the fact that it has been configured as a ‘Manual’ alarm, and the
trigger has not yet returned to a ‘safe’ (non-alarm) state, or it could be that the instrument is in a
logged out state.

Go To View (Cont.)
Alarm Summary
Furnace 1 temp 1 750.00 798.39
Furnace 1 temp 3 750.00 763.39
Furnace 1 temp 2 590.00 603.39
Furnace 2 temp 1 750.00 630.71
C
1(
2
)
C
AC1(2)
Acknowledge alarm?
Alarm Summary
Furnace 1 temp 1 750.00 798.39
Furnace 1 temp 3 750.00 763.39
Furnace 1 temp 2 590.00 603.39
Furnace 2 temp 1 750.00 630.71
C
1(
2
)
C
AC1(2)
Acknowledge alarm?
Message Summary
20/11/09 08:06:37 Inactive: Ch1(Al1)
20/11/09 08:06:29 Active: Ch2(Al1)
20/11/09 08:06:22 Active: Ch1(Al1)
20/11/09 08:06:19 Inactive: Ch2(Al2)
20/11/09 08:06:18 Inactive: Ch1(Al2)
20/11/09 08:06:09 Inactive: Ch2(Al1)
20/11/09 08:06:01 Active: Ch1(Al2)
20/11/09 08:05:59 Active: Ch2(Al1)
20/11/09 08:05:22 Battery flat less than 5% re
20/11/09 08:05:22 Power up
All Messages
Refresh
Exit Messages
Go to?
Summary
History
20/11/14
08:05:22
Battery flat less than 5%
remaining
To Trend History
display (Section 4.5)
Use scroll button to scroll through ‘All Messages’,
‘System’, ‘Alarm’ and ‘Power Up’. Use page
button to confirm selection
Use scroll button to return to refreshed Message
Summary page.
Use the scroll or page button to return to the top
level menu.
MESSAGE SUMMARY
Operating the scroll key whilst the ‘Message summary’ field is highlighted displays the10 most recent
messages.
Operating the scroll key whilst a message is highlighted shows the selected message in more detail (and
using the up/down keys allows the other messages to be scrolled through). Whilst in this mode, operating
the scroll key again, allows the user to choose to jump to the message’s location in trend history mode
(Section 4.5) or to return to the summary page.
By default, the interface is set up such that:
1. all message types are included
2. the up and down arrow keys cause the highlighted selection to move up or down by one message at a
time.
MESSAGE FILTERS
All Messages Causes all messages to be displayed on the screen.
System Shows only system alarms
17 MC27 –EN–1.04
Alarm Shows only channel alarms
Power up Shows only power up messages
Login/out Limits the display to Log in and Log out events.
nanodac™
Figure 1.3.3c Message summary features

nanodac™
Alarm Summary
System Alarms
Message Summary
Vertical Trend
Horizontal Trend
Vertical Bargraph
Horizontal
Bargraph
Alarm Panel
Control
Control (Dual Loop)
Cascde
Programmer
Steriliser
Promote List
Modbus Master
EtherNet/IP
Go To View (Cont.)
DISPLAY MODE SELECTION
Use the up/down arrow buttons to highlight the required display
mode. Once the required display mode is highlighted, operation of
the scroll button causes the recorder to leave the ‘Go to View’ menu
and to display channel values in the selected mode. See Section 4.4
for a description of the various display modes.
Alternatively the up and down arrow buttons can be used from any of
the display modes to cycle through the available modes in the order
listed in the figure.
Notes:
1. If an option (e.g. ‘Steriliser’) is not fitted, its display mode
is not available for selection.
2. Some display modes must be enabled in Instrument.
Display configuration before they become available.
4.3.4 History
This top level menu item allows the user to switch from real-time
trending to review mode, where channel values, messages, alarm
triggers etc. can be viewed back as far as the last significant
con.figuration change. History mode is discussed in Section 4.5
4.3.5 Faceplate Cycling on/off
For the purposes of this document the channel whose faceplate is currently displayed and whose ‘pen’
symbol is visible is called the ‘Active’ channel.
By default, the recorder scrolls through all the channels in the display group, with each channel becoming
the active channel in turn. This top level menu ‘Faceplate Cycling’ item allows the user to inhibit this
scrolling action such that the currently active channel remains active permanently, or until a manual scroll
is performed using the scroll button (or until Faceplate Cycling is re-enabled).
‘Faceplate Cycling’ is highlighted by using the up/down arrow buttons. Once highlighted, the status can
be changed from ‘On’ to ‘Off’ or vice-versa using the scroll button. Operation of the ‘Page’ button returns
the user to the trend display.
4.3.6 Operator Notes
This area allows up to 10 notes to be created when logged in as Engineer, using either the text entry
techniques described in Section 4.6, or ‘iTools’ described in Section 6. Once logged out, operating the
scroll button whilst a note is highlighted calls a selection box allowing the user either to send that note to
the chart, or to write a Custom Note.
CUSTOM NOTE
The Custom Note is written using the text entry techniques described in Section 4.6. Once the note is
complete, operation of the page button calls a confirmation display. The down arrow is used to highlight
‘Yes’, and when the scroll key is then operated, the message is sent to the chart. This custom message is
not retained for further use, so if it is required on a regular basis, it is suggested that one of the Operator
Notes 1 to 10 be configured (Engineer access level required) so that it may be used instead.
Note: Each note can contain up to 100 characters.
4.3.7 Demand Archiving
This allows a user, with a high enough access level, to archive a selected portion of the recorder history,
either to a ‘memory stick’ plugged into the USB port at the rear of the recorder (Local Archiving), or to a
pc, by means of the FTP protocol (Remote Archiving). The archived data remains in the flash memory of
the instrument. When the flash memory is full, new data causes the oldest file(s) to be discarded.
The up and down arrow keys are used to navigate to the required field.
MC27 –EN– 1.04 18

Archive To
Archive
Suspend Schedule
Cancel All
Status
Last Archive
USB
None
No
No
Complete
02/11/2011 11:37:09
Demand Archiving
Archive To
Archive
Suspend Schedule
Cancel All
Status
Last Archive
FTP Server
None
No
Complete
Connecting
02/11/2011 11:37:09
Demand Archiving
19 MC27 –EN–1.04
Demand Archiving (Cont.)
ARCHIVE MENU
Figure 1.3.7 Demand Archiving menu (Local Archiving on left; Remote Archiving on right)
Archive To With this item highlighted, the scroll button and the up/down arrows can be used
Archive In a similar way, select the archive period:
Last Day: Archive all files created in the last 24 hours.
Last Week: Archives all files created in the past seven days.
Last Month: Archives all files created in the past 31 days.
Archive All: Archives all the files in the recorder’s history.
Bring To Date: Archives all files created or updated since the ‘Last Archive’ date
Suspend Schedule When set to ‘Yes’, automatic (scheduled) archiving is stopped, once the transfer of
Cancel All When set to ‘Yes’, this cancels USB archiving activity immediately, or cancels FTP
Last Archive Shows the date and time at which the last archive (demand or automatic) was
Status For Archive to USB only
PriStatus For Archive to FTP Server only, this shows the transfer status between the
SecStatus For Archive to FTP Server only, this shows the transfer status between the
nanodac™
to select ‘USB’ or ‘FTP Server’.
For ‘USB’, the archive will be made to the rear USB memory stick. For ‘FTP Server’
the archive will be made to the Primary or Secondary server (configured in the
Network.Archive area of configuration described in Section 5.1.2. For more details
about remote archiving, see ‘Remote archiving’, below.
None: No archiving to take place. (Not editable when logged out)
Last Hour: Archives all files created within the last 60 minutes.
and time.
the current file is complete. Suspend Schedule must be set to ‘No’ again, to restart
the suspended archive. Suspend can be used to allow the memory stick to be
removed and re-fitted safely.
archiving once transfer of the current file (if any) is complete.
attempted. If a demand archive is requested, or is in operation when an automatic
archive is triggered, the automatic archive takes precedence.
‘Complete’ means that no archiving is currently taking place.
‘Transferring’ indicates that an archiving is in progress. Accompanied by an
animated circular display.
‘Suspended’ means that archiving has been suspended as requested.
instrument and the primary host computer.
instrument and the secondary host computer.

nanodac™
Demand Archiving (Cont.)
FTP SERVER ARCHIVING
This allows the archiving of recorder files to a remote computer via the RJ45 type connector at the rear of
the recorder, either directly or via a network.
In order to carry out a successful transfer:
1. Details of the remote host must be entered in the Network.Archive area of configuration (Section
5.1.2).
2. The remote computer must be set up as an FTP server. Help from the user’s IT department may be
necessary in order to achieve this. Appendix C, Section C2 to this manual suggests one way, using
Filezilla.
3. The remote computer must also be set up to respond to ‘pings’. This is because the instrument pings
the host whilst establishing connection, and if it does not receive a response the archive attempt
fails.
When accessing files using Microsoft® Internet Explorer, the address (URL) field can be in one of two
formats:
1. ftp://<instrument IP address>. This allows a user to log in as the anonymous user (if the recorder has
any account with the user name set to ‘anonymous’ with a blank password.
2. ftp://<user name>:<password>@<instrument IP address> to log in as a specific user.
For IE5 users, Microsoft® Internet Explorer displays, by default, history files only. To quit the history
folder, either uncheck the Tools/Internet Options/Advanced/Browsing/’Enable folder view for FTP sites’
option, or check the Tools/Internet Options/Advanced/Browsing/’Use Web based FTP’ option.
REVIEW SOFTWARE
‘Review’ is a proprietary software package which allows the user to extract ‘archive’ data from one or
more suitable instruments* and to present this data on a host computer, as if on a chart, or as a
spreadsheet. The host computer must be set up as an ftp server (see Appendix C section C2 for a
description of one way of doing this).
As described in the Review help system, ‘Review’ allows the user to set up a regular transfer of data (using
ftp) from connected instruments into a database on the pc, and then from this database to the chart or
spreadsheet. The chart/spreadsheet can be configured to include one or more ‘points’ from one or all
connected instruments (where a ‘point’ is an umbrella term for channel, totaliser, counter etc.).
It is also possible to archive instrument history files to a memory stick, Compact Flash card etc.
(depending on instrument type) and to use this to transfer the data to the pc.
Each type of instrument has its own remote user name and password configuration - for this instrument,
the user name and password are both ‘history.
*Suitable instruments are connected instruments, the archive files of which have the suffix ‘.uhh’.
4.3.8 Login
Login allows the user to enter a password in order to gain access to areas of the unit’s configuration which
are not available when the user is logged out.
LOGGED OUT ACCESS LEVEL
Logged out mode allows the user to select viewing mode, to view history, to view alarms, to toggle
faceplate cycling on and off, to send notes, to suspend/resume USB archiving and to access the login
process.
OPERATOR ACCESS LEVEL
In addition to the logged out features, Operator access level allows the user to acknowledge alarms, to
edit notes and to perform demand archive operations.
By default, no password is required in order to enter Operator level, but a password can be set either at
Supervisor level or at Engineer level. (See section 1)
MC27 –EN– 1.04 20
nanodac™
Record icon
Configuration
icon
Logged out
Operator
Supervisor
Engineer
Engineer Access
Access
Access
Access
Access
Password
Password
Password
Accept changes
Cancel
No
Yes
Login (Cont.)
SUPERVISOR ACCESS LEVEL
In addition to the logged out level function, this access level allows the user to view the recorder’s
configuration, and to edit some values (such as alarm thresholds). By default, there is no password
required to enter Supervisor level, but a password can be set in the Instrument area of configuration,
either at Supervisor level or at Engineer level. (See section 1)
ENGINEER ACCESS LEVEL
This allows full access to all areas of the recorder configuration. The default password is 100, but this can
be edited in the Instrument area of configuration (See section 1).
Note: recording is stopped for as long as the user is logged in at Engineer level,
even if the recorder is not being configured. This is indicated by the Record icon
at the bottom left corner of the process value display screen being replaced by
the Configuration (wrench) icon.
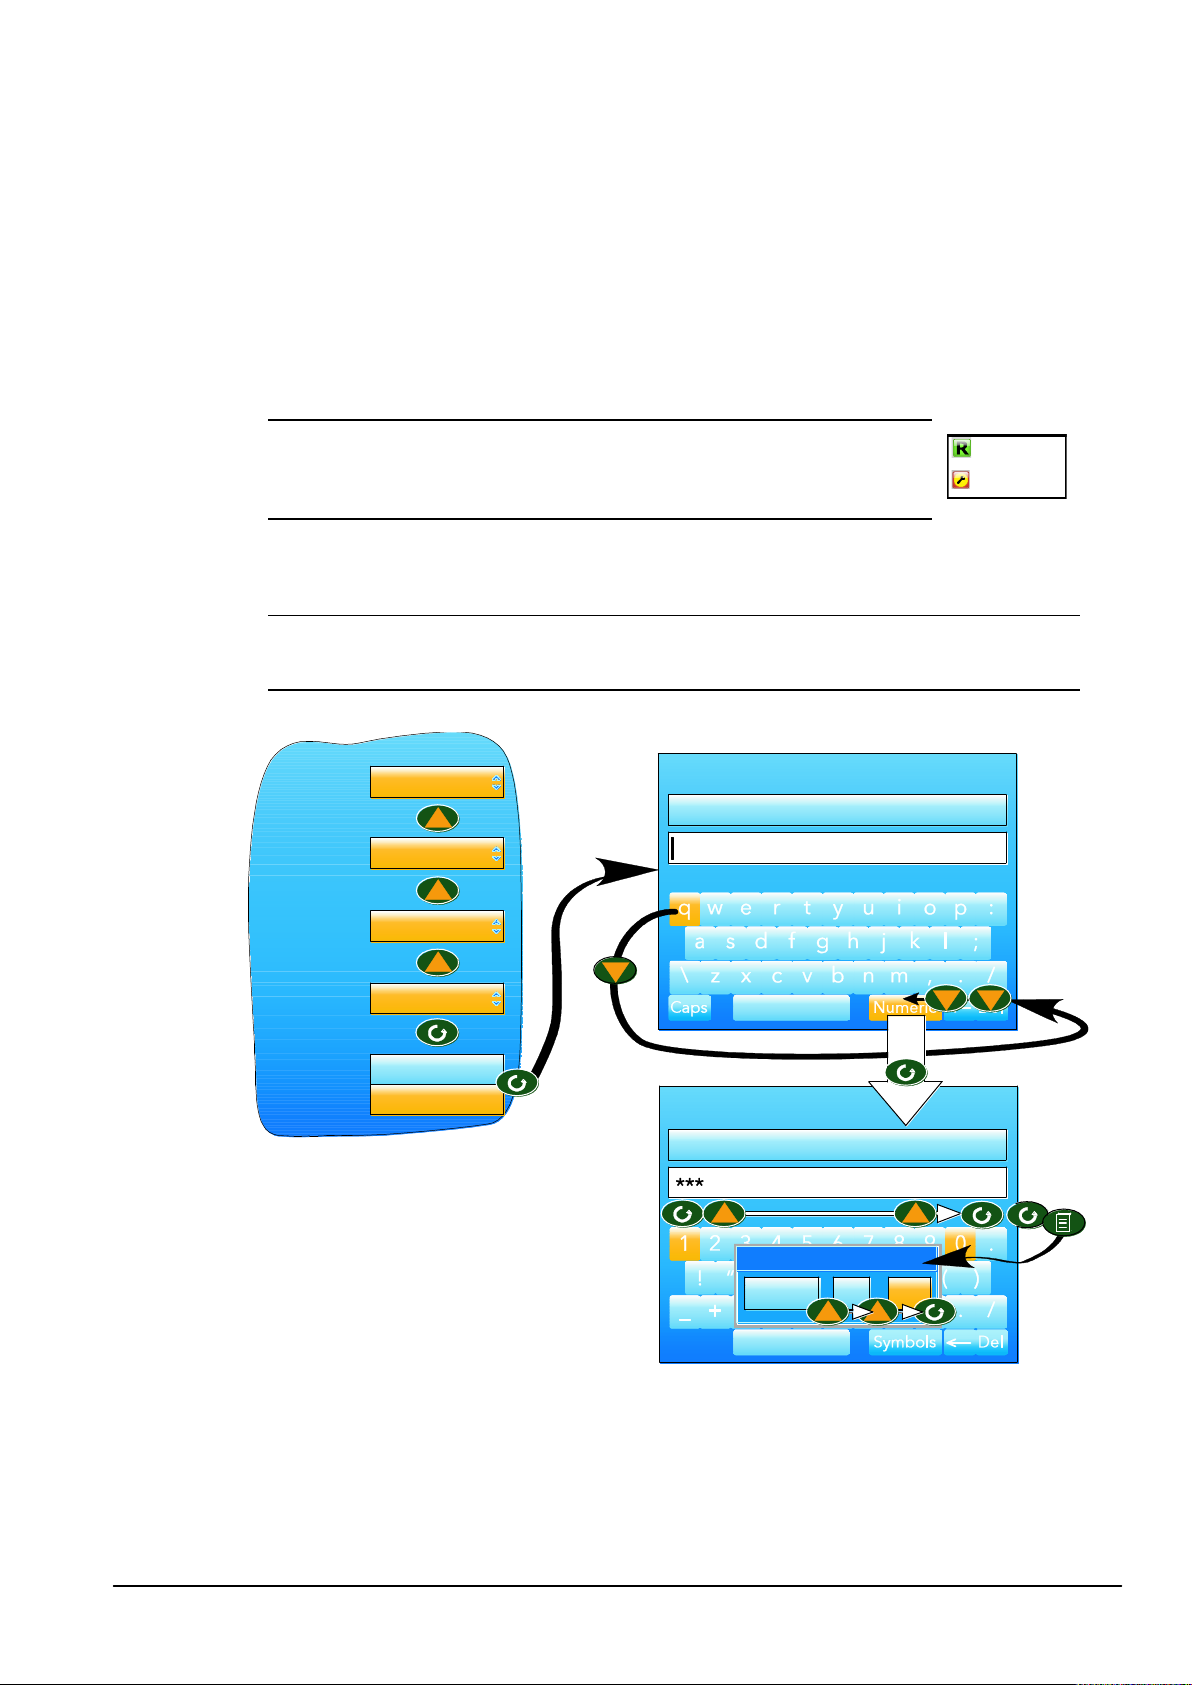
LOGIN PROCEDURE
From the top level menu, use the up or down arrow keys as often as necessary in order to highlight
‘Login’, and then operate the Scroll key to produce the ‘Access Logged out’ display.
Note: this procedure describes how to login to an access level with a password associated with it.
For non-password protected logins, the user needs only to select the required access level, and
press the scroll key.
21 MC27 –EN–1.04
nanodac™
Vertical trend Section 4.4.1
Cascade Section 4.4.8
Horizontal trend Section 4.4.2
Programmer (inc. future trend) Section 4.4.9
Vertical bargraph Section 4.4.3
Horizontal bargraph Section 4.4.4
Promote list Section 4.4.10
Numeric Section 4.4.5
Modbus Master Section 4.4.11
Alarm panel Section 4.4.6
EtherNet/IP Section 4.4.12
Control loop 1/2 Section 4.4.7
Faceplate
Current point name
Current point scale
Current trace ‘pen’
Recording symbol
Current point value
Time/date stamp
Current time/date
Instrument name
Status icons
To log in as Engineer (See section 1):
1. Operate the up arrow key three times, to display ‘Engineer’.
2. Press the scroll key to call the ‘alpha’ keyboard, with the letter ‘q’ highlighted.
3. Use the down arrow key three times to highlight ‘Numeric’.
4. Operate the scroll key to display the numeric keyboard (numeral ‘1’ highlighted.)
5. Use the up and down arrow keys to select the numbers and use the scroll key to enter them.
6. Use the Page key to call the confirmation display.
7. If the password entry is as required, use the up arrow twice (or the down arrow once) to highlight the
word ‘Yes’ and operate the scroll key to confirm. The top level configuration menu appears.
Otherwise, ‘Cancel’ can be used to clear the entry in order to start again, or ‘No’ can be used to quit
login.
4.4 DISPLAY MODES
The following subsections describe the various display modes available to the user. By default, the ‘Home’
display mode is ‘Vertical Trend’, but this can be edited as a part of ‘Instrument.Display’ configuration. This
configuration area also allows the user to disable one or more display modes should they not be required.
The current display mode can be chosen either by using the top level menu ‘Go to View’ item or, from any
display mode, by scrolling through the enabled modes using the up or down arrow button.
Details of the various display modes are to be found in the following subsections:
4.4.1 Vertical Trend
In this mode, channel values are traced as though on a chart rolling downwards (i.e with the latest data at
the top). The chart speed, and the number of major divisions are configured in the ‘Group.Trend’ area of
configuration (5.2.1).
Figure 1.4 Vertical trend mode display elements
MC27 –EN– 1.04 22
nanodac™
By default, after a few seconds, the
‘chart’ expands leftwards to hide the
scale.
One of the channels is said to be the ‘current’ or ‘scale’ channel. This channel is identified by its pen icon
being displayed, and by the channel descriptor, dynamic value and its scale being displayed on a
‘faceplate’ across the width of the display, above the chart.
Each channel in the Group becomes the ‘current’ channel in turn, for approximately five seconds -i.e. the
channels are cycled through, starting with the lowest numbered channel. Once the final channel in the
Group has been displayed for five seconds, the first channel is returned-to and the process repeats. This
scrolling behaviour can be enabled/disabled from the top level menu ‘Faceplate Cycling (Off)’ item
described in Section 4.3.5
.
The scroll button can be used to cycle through the channels manually in both Faceplate cycle on and off
modes.
Use of the up arrow button causes the next enabled display mode to be entered (default = horizontal
trend).
The page key calls the top level menu.
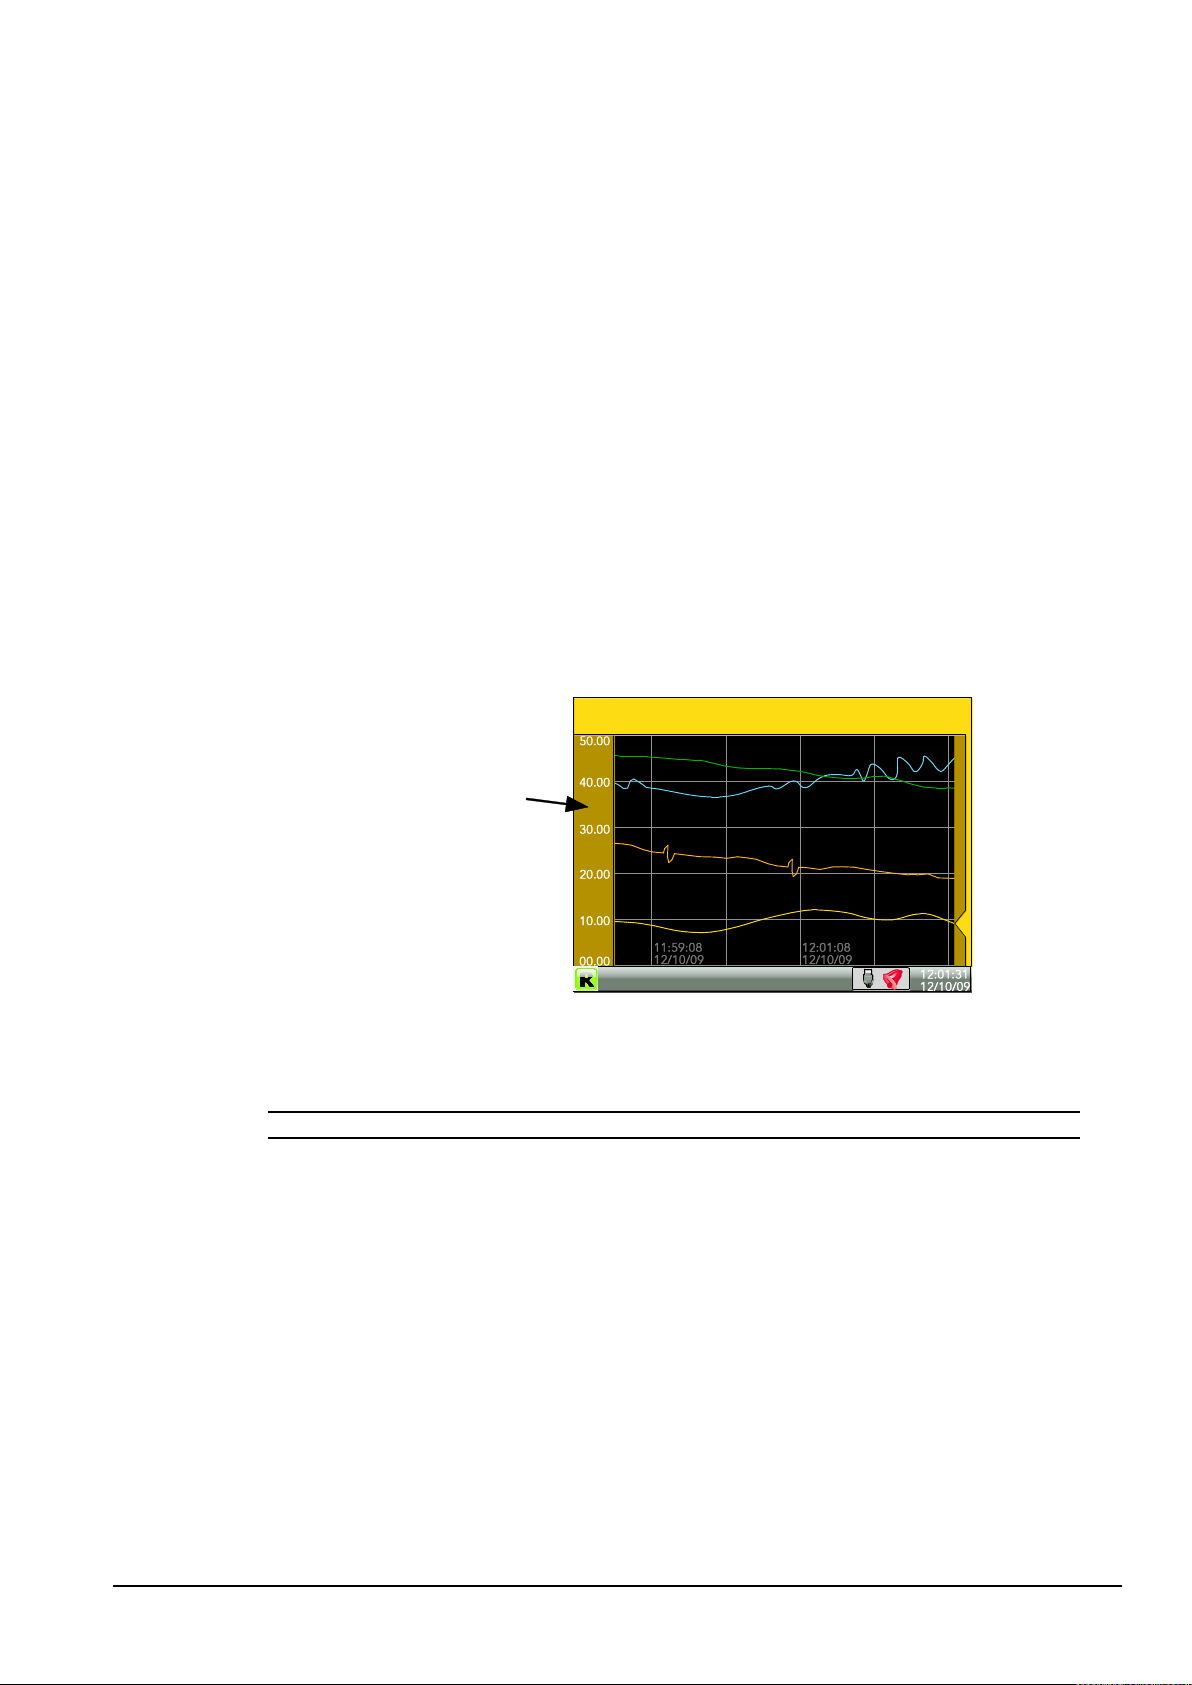
4.4.2 Horizontal Trend mode
This view is similar to the vertical trend mode described in section 3.4.1 above, except that the traces are
produced horizontally rather than vertically. Initially, as each channel appears, its scale appears at the left
edge of the display (as shown below), but in order to show the maximum amount of trend data, the scale
is overwritten after a few seconds.
Figure 1.4.2 Horizontal trend display mode
Use of the up arrow button causes the next enabled display mode to be entered (default = vertical
bargraph). Use of the page key calls the top level menu.
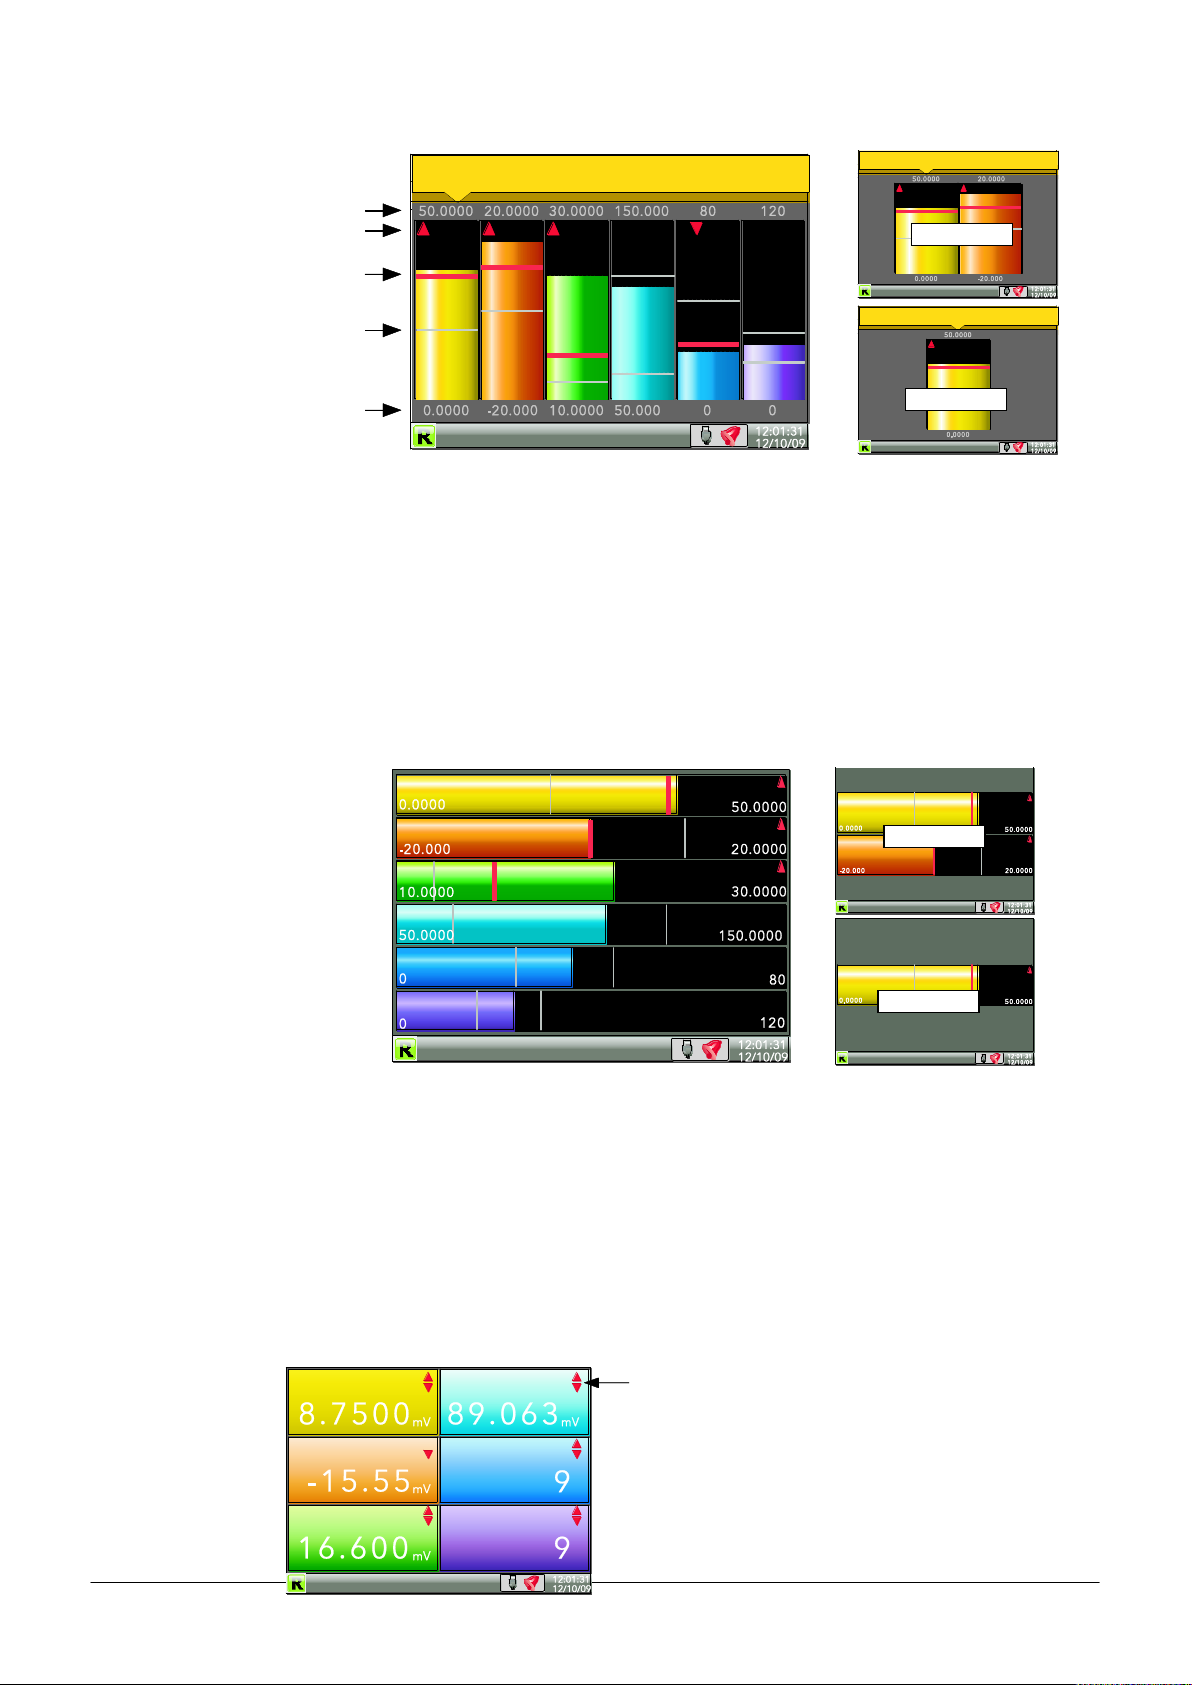
4.4.3 Vertical Bargraph mode
This display mode shows the channel values as a histogram. Absolute alarm threshold values appear as
lines across the bars, grey if the alarm is not triggered; red if the alarm is triggered. Alarm symbols appear
for active alarms.
Bargraph widths for four to six channels divide the width of the display screen equally between them. For
one and two channels, the width is fixed, and the bars are centred on the screen. Figure1.4.3 shows some
examples (not to the same scale).
23 MC27 –EN–1.04
Note: Timestamps appear to the right of the gridline to which they relate
nanodac™
Full scale value
Active alarm symbol
Alarm threshold (active)
Alarm threshold (non-active)
Zero value
2 channels
1 channel
Inst name
Furnace 1 temp 12
Channel 2
Channel 3
Channel 4
Virtual Chan 1
The scroll button
toggles the text
between point
descriptor (as shown)
and point value.
2 channels
1 channel
Alarm type indication
(table 1.2.1)
Figure 1.4.3 Vertical bargraph display mode
Use of the up arrow button causes the next enabled display mode to be entered (default = horizontal
bargraph). Use of the page key calls the top level menu.
4.4.4 Horizontal Bargraph mode
Similar to the Vertical bargraph mode described in Vertical Bargraph mode above, but includes channel
descriptors.
Figure 1.4.4 Horizontal bargraph mode
Use of the up arrow button causes the next enabled display mode to be entered (default = numeric).
Use of the page key calls the top level menu.
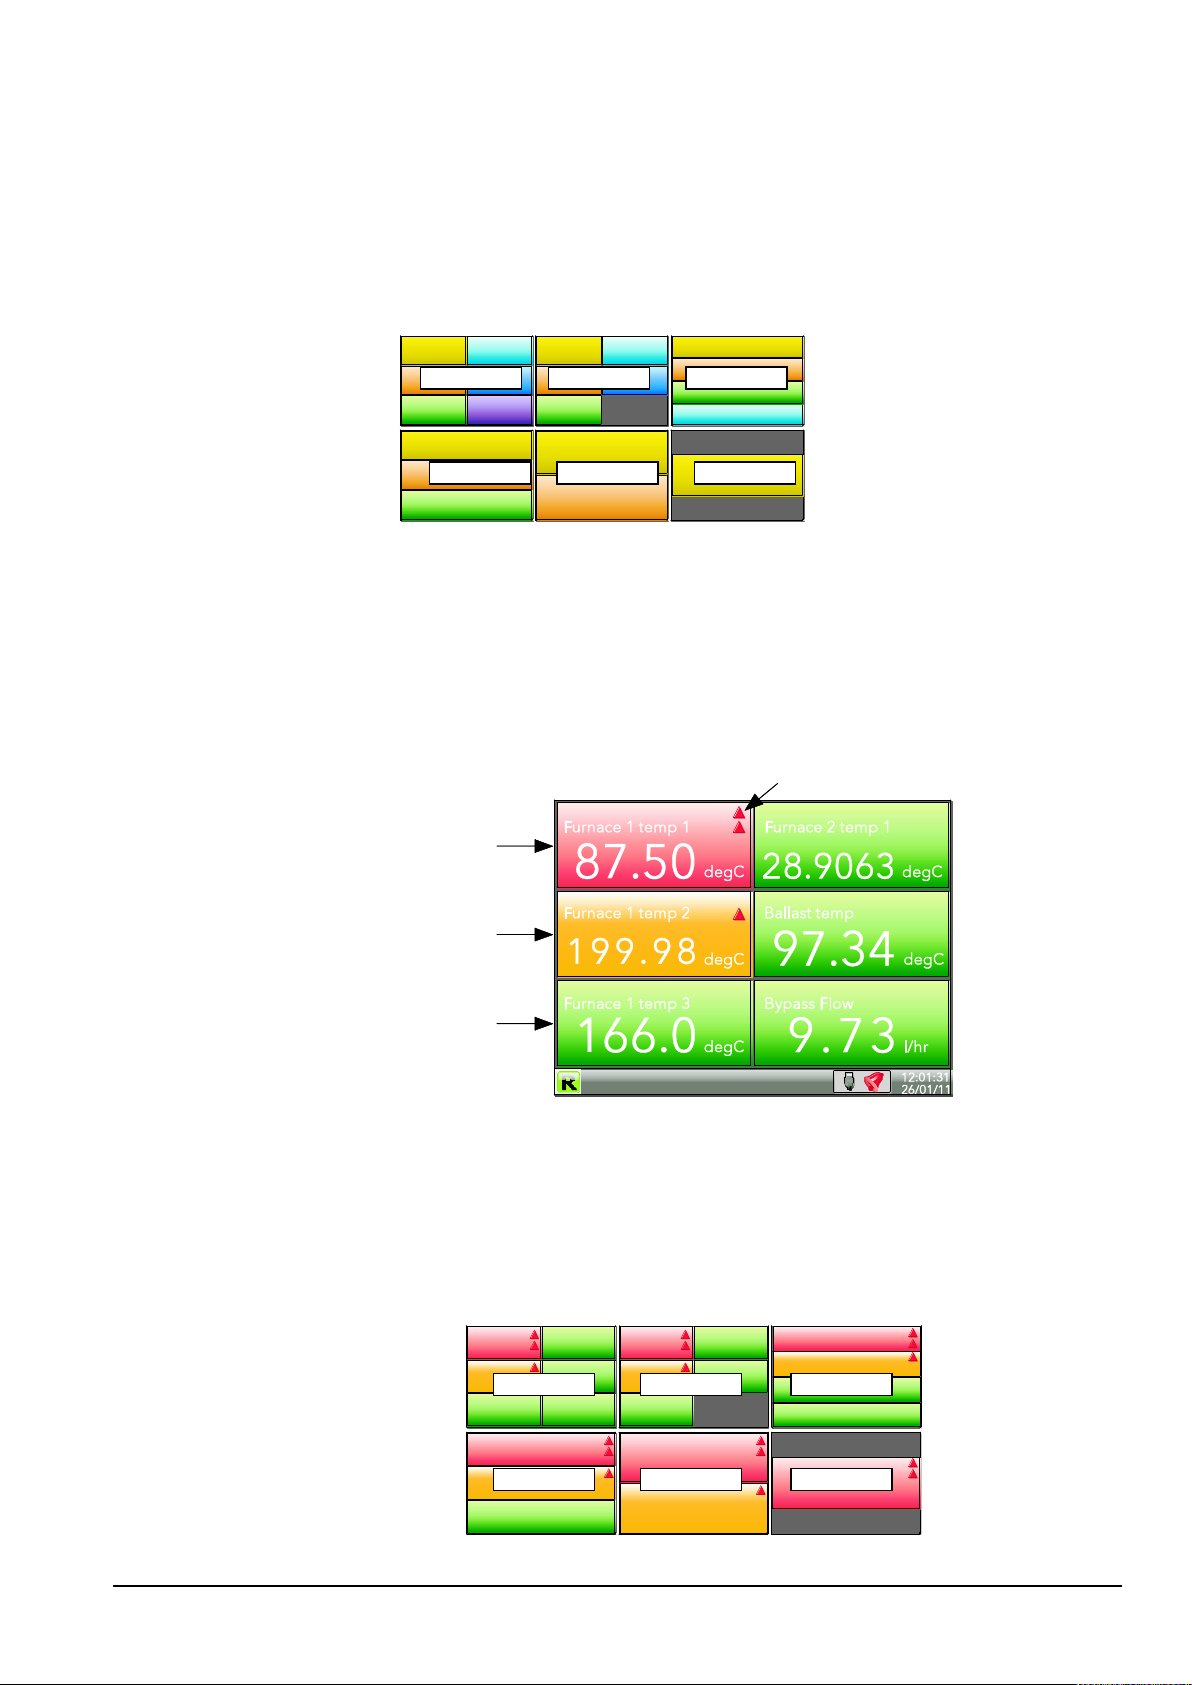
4.4.5 Numeric mode
Shows the enabled channels’ values along with their descriptors and with indications of the type(s) of
alarm configured for each channel.
MC27 –EN– 1.04 24
nanodac™
6 channels
5 channels
4 channels
3 channels
2 channels
1 channel
6 channels
5 channels
4 channels
3 channels
2 channels
1 channel
Red bar
Alarm 2 is active, or alarm 1 and
alarm 2 are both active.
Amber bar
Alarm 1 is active for this
channel, but not alarm 2
Green bar
Neither alarm 1 nor alarm two
active for this channel.
Alarm type indication (table 3.2.1)
Figure 1.4.5a Numeric display mode (six enabled channels)
The figure above shows an example where the Trend group contains six channels. Figure 1.4.5b shows
how the display appears for trend groups with fewer than six channels configured.
Figure 1.4.5b Display layout for different numbers of channels
The up arrow button returns to the vertical trend display mode; the page key calls the top level menu.
4.4.6 Alarm panel
This display appears only if enabled in the Instrument Display configuration. Alarm panel mode shows
current value and alarm status for each channel enabled in the Trend Group. The status is shown in two
ways, by the colour of the relevant bar, and by the alarm status indicators.
Figure 1.4.6a Alarm panel display (six channels)
The figure above shows an example where the Trend group contains six channels. Figure 1.4.6b shows
how the display appears for trend groups with fewer than six channels configured.
25 MC27 –EN–1.04

nanodac™
PV
wSP
Working Output
SP
SP1
Mode
PV
wSP
SP1
Mode
Man OP
SP1
Mode
Man OP
Loop 1
O
C
Loop 1
Manual
PV
wSP
Manual
Inst name
Inst name
SP1
Mode
Man OP
SP1
Mode
Man OP
SP1
Mode
Man OP
SP1
Mode
Man OP
SP1
Mode
Man OP
Figure 1.4.6b Alarm panel display layouts for trend groups with fewer than six channels
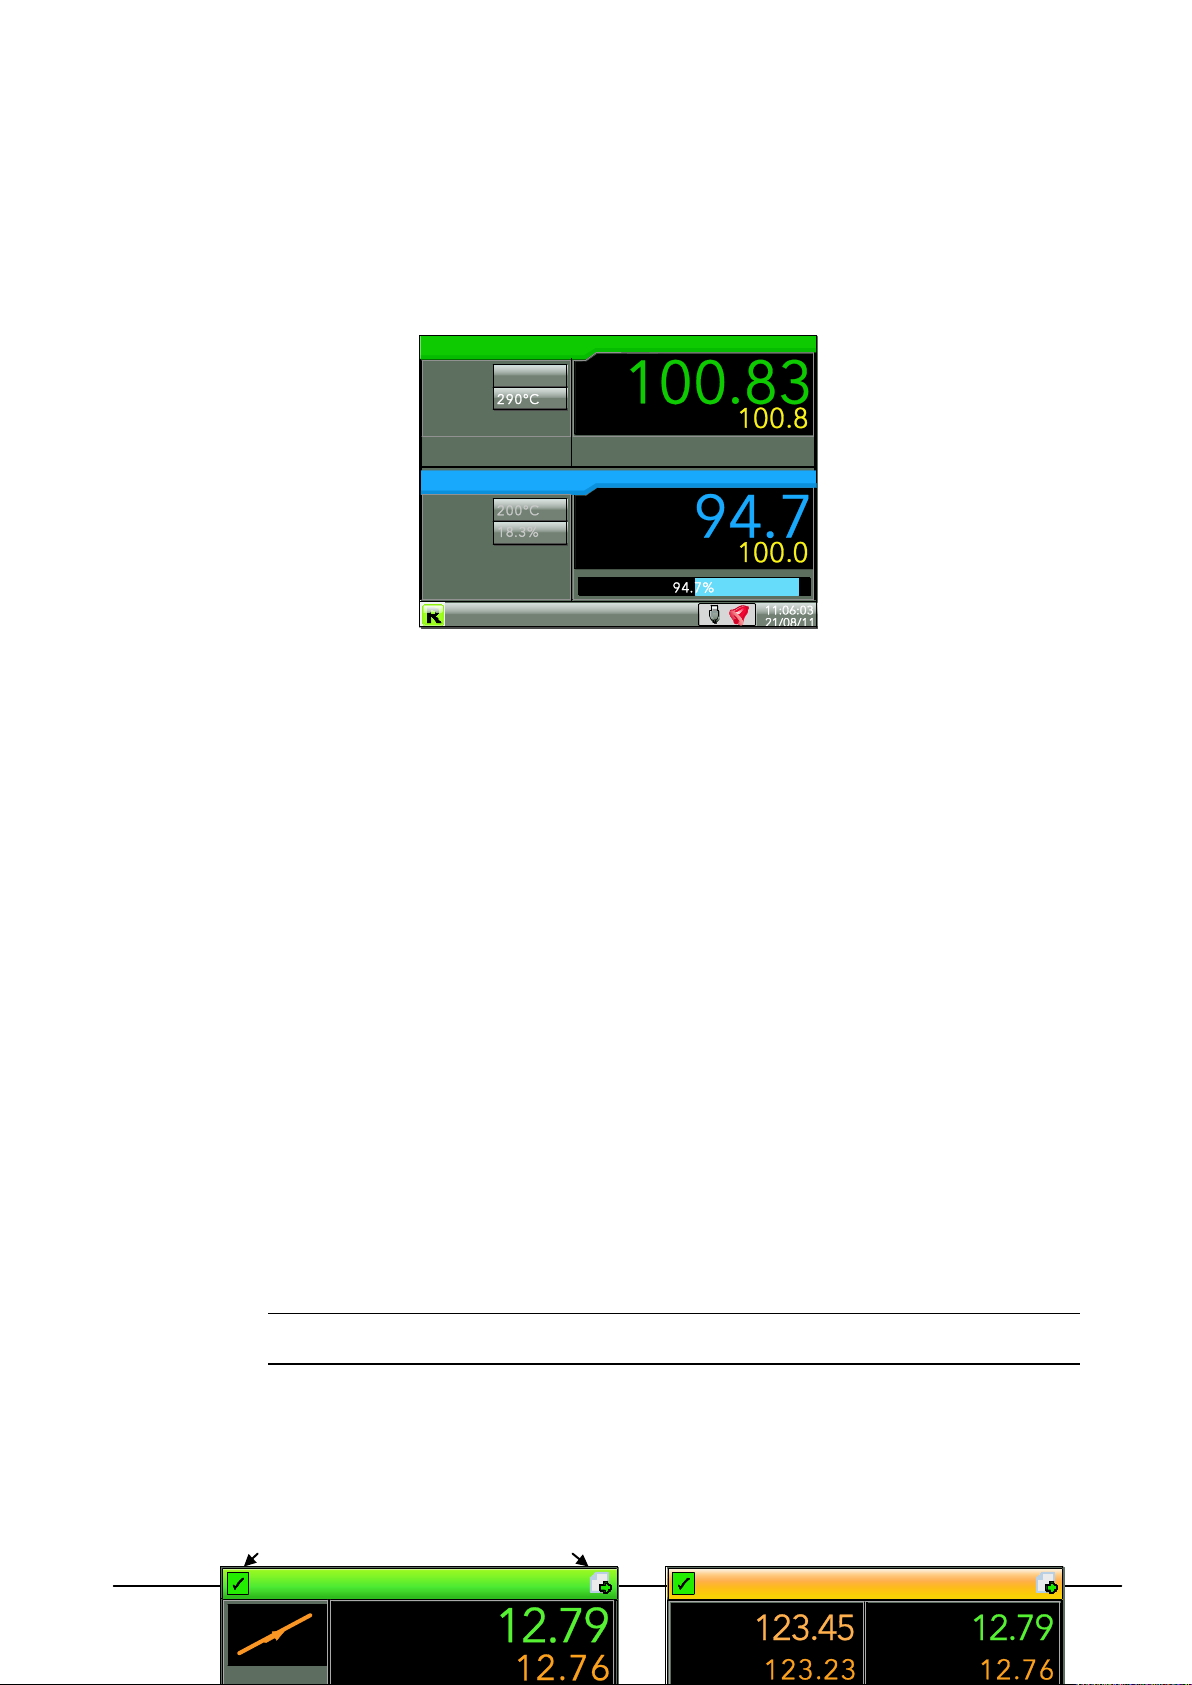
4.4.7 Control Loop1/Loop2
These displays appear only if the controller option is enabled.
The loop display modes are interactive, in that the setpoint, the Auto/Manual mode and the Manual
Output value can be edited from the user interface. Full configuration is carried out in the Loop setup
menus and a fuller description of control loops is to be found as Appendix B to this manual.
Figure 1.4.7 depicts a single loop display and the dual loop display. The up and down arrow keys are used
as normal to scroll through Loop1, Loop2 and Dual loop pages.
Figure 1.4.7 Loop displays
Note: The colours associated with the loops are those of the channels to which they are wired.
EDITING TECHNIQUES
1. With the loop page on display, operate the Scroll key. This highlights the
first editable item (SP1). The scroll order includes both loop1 and loop 2
parameters in the dual loop display.
2. Use the up and down arrow keys to select the required field for editing.
When the required field is highlighted, operate the scroll key again, to
enter edit mode.
3. Use the up/down arrows to edit the current setting.
4. Operate the scroll key to confirm the edit.
5. Select a further parameter for editing, or operate the page key to return
to normal operation.
Note: Edit permissions for Setpoint, Auto/Manual and Manual Output Access are set in the Loop
Setup configuration menu.
MC27 –EN– 1.04 26
nanodac™
Mode
Sp1
SP
Man.OP
Inst name
PV
wSP
Master
PV
Program Name (Segment name)
Program Name (Segment name)
Ramp
PV PV
Program status
Program edit
4.4.8 Cascade Display Mode
This display mode appears only if ’Cascade’ has been enabled in the Instrument.Display area of
configuration. See also Advanced Loop configuration.
Figure 1.4.8a Cascade display mode
Operating the scroll button highlights the Master ‘Mode’ field. Operating the scroll button again, enters
edit mode allowing the user to use the up/down arrow buttons to scroll through the available modes.
Once the required mode appears, a further operation of the scroll button confirms the entry and quits edit
mode.
Once out of edit mode, the down arrow key can be used to select Master ‘SP1’, Slave ‘SP’ and Slave ‘Man
OP’. The Mode selected determines how many of these items are editable by the operator.
Mode Cascade: The master loop is in auto mode and provides the slave setpoint.
Changing modes causes the slave to switch to the local slave setpoint.
Slave: A simple single loop controlling with a local setpoint.
Manual: Provides a single manual % power output.
SP1 Setpoint 1 is the primary setpoint of the controller. If the controller is in automatic
control mode, then the difference between the setpoint and the process variable
(PV) is continuously monitored by the control algorithm. The difference between
the two is used to produce an output calculated to bring the PV to the setpoint as
quickly as possible without causing overshoot.
SP The slave setpoint, either local (Manual or Slave mode) in which case it can be
edited, or supplied by the master loop (Cascade mode), in which case it is not
editable.
Man.OP The percentage output power to be applied when in Manual mode (100% = full on;
0% = off).
4.4.9 Programmer Display Mode
27 MC27 –EN–1.04
Note: The default loop names (‘Master’ and ‘Slave’) can be replaced by user-entered strings of up
to 10 characters in Advanced Loop Setup configuration.
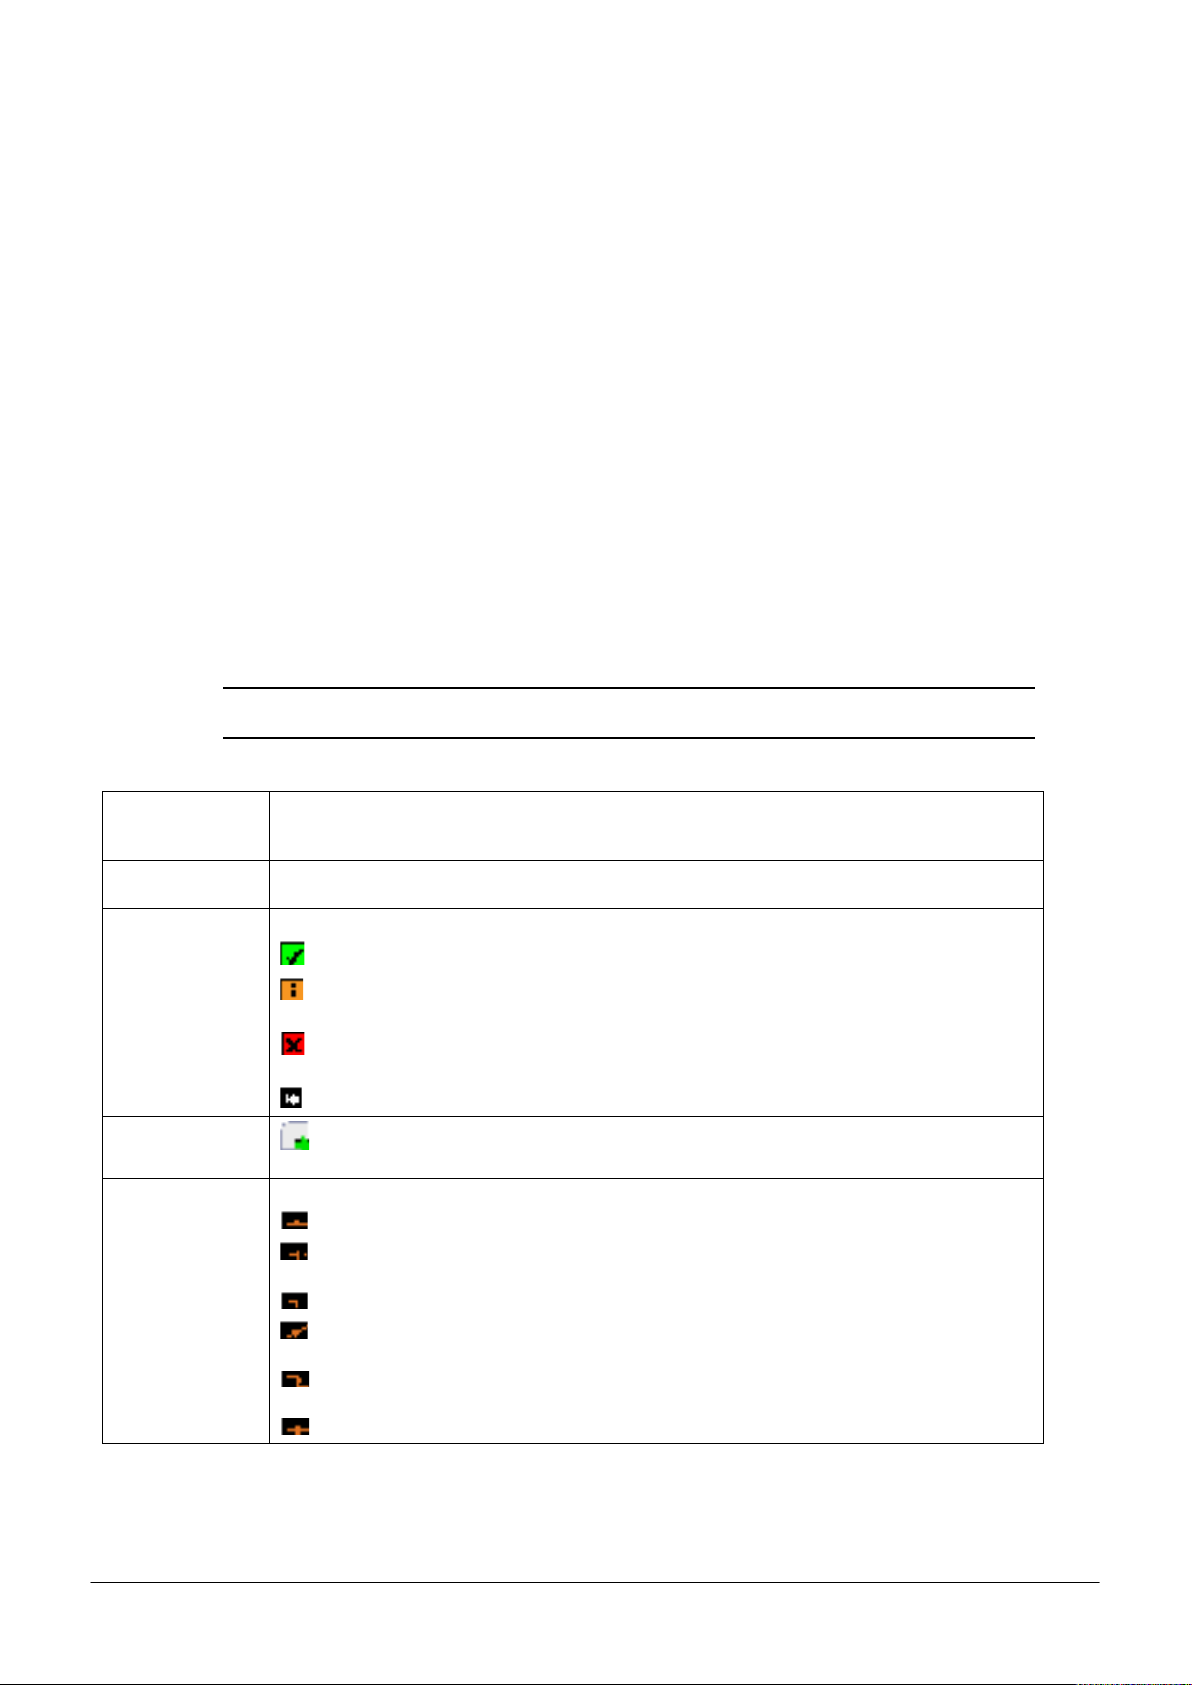
nanodac™
Program name
This is the name of the loaded program. If the program has been modified since being saved, an asterisk (*)
appears after the name. Default background colour shown. This colour changes to that assigned to the input
channel when this is configured.
Segment name
This is the name of the current segment. If not named in Segment configuration, then the segment number
appears instead.
Program status
At the top right hand corner of the display, this can be any one of the following:
The program is running (or ran last time) without any PV ‘Alarm’ events or user intervention.
The user has intervened in the running of the program, by placing it in ‘hold’ or ‘reset’, or by advancing a
segment, or by adjusting a duration, target setpoint, ramp rate or time-to-target value.
A PV ‘Alarm’ Event has activated. A PV ‘Alarm’ Event is an absolute high/low or a deviation alarm on the PV
input.
There is no program loaded, or if a program is loaded, it has not yet run.
Program edit
This icon appears for users with appropriate access permissions, to indicate that setpoint programs can be
configured (as described in Program edit, below).
Segment type
For single channel displays, this indicates the type of segment currently being run:
Dwell. The segment value remains constant for the duration of the dwell period.
End (dwell). Displayed on completion of the program. The segment value remains at the final value until
rese
End (reset). Displayed on completion of the program. The program resets.
Ramp. The segment value ramps at a fixed rate or over a fixed period to the Target setpoint. Ramp up icon
shown; ramp down is similar but inverted.
Step. The segment value switches immediately to the new Target setpoint. Step down shown; step up
similar but inverted.
Wait. The segment value remains constant until the wait criteria are satisfied
Figure 3.4.9a Programmer displays (typical)
This display mode (if enabled - see Error! Reference source not found. allows the user to monitor the
progress of a single or dual-channel setpoint program, and if logged-in as ‘Operator*’, to reset or run the
program. The program itself is created in the Program edit page (described below) and in Programmer
configuration (Error! Reference source not found. or ‘iTools’).
*Note: Operator is the default access level - to edit, see ‘ Prog Mode Access’ in Error! Reference
source not found.)
The displays contain the following features:
MC27 –EN– 1.04 28
 Loading...