

Page 1

RTMC Pro
Revision: 7/13
Copyright © 2006-2013
Campbell Scientific, Inc.
Page 2

Page 3

License for Use
This software is protected by United States copyright law and international
copyright treaty provisions. The installation and use of this software constitutes
an agreement to abide by the provisions of this license agreement.
Campbell Scientific grants you a non-exclusive license to use this software in
accordance with the following:
(1) The purchase of this software allows you to install and use the software on
one computer only.
(2) This software cannot be loaded on a network server for the purposes of
distribution or for access to the software by multiple operators. If the
software can be used from any computer other than the computer on which
it is installed, you must license a copy of the software for each additional
computer from which the software may be accessed.
(3) If this copy of the software is an upgrade from a previous version, you
must possess a valid license for the earlier version of software. You may
continue to use the earlier copy of software only if the upgrade copy and
earlier version are installed and used on the same computer. The earlier
version of software may not be installed and used on a separate computer
or transferred to another party.
(4) This software package is licensed as a single product. Its component parts
may not be separated for use on more than one computer.
(5) You may make one (1) backup copy of this software onto media similar to
the original distribution, to protect your investment in the software in case
of damage or loss. This backup copy can be used only to replace an
unusable copy of the original installation media.
This software may not be sold, included or redistributed in any other software,
or altered in any way without prior written permission from Campbell
Scientific. All copyright notices and labeling must be left intact.
Page 4

Limited Warranty
The following warranties are in effect for ninety (90) days from the date of
shipment of the original purchase. These warranties are not extended by the
installation of upgrades or patches offered free of charge.
Campbell Scientific warrants that the installation media on which the software
is recorded and the documentation provided with it are free from physical
defects in materials and workmanship under normal use. The warranty does not
cover any installation media that has been damaged, lost, or abused. You are
urged to make a backup copy (as set forth above) to protect your investment.
Damaged or lost media is the sole responsibility of the licensee and will not be
replaced by Campbell Scientific.
Campbell Scientific warrants that the software itself will perform substantially
in accordance with the specifications set forth in the instruction manual when
properly installed and used in a manner consistent with the published
recommendations, including recommended system requirements. Campbell
Scientific does not warrant that the software will meet licensee’s requirements
for use, or that the software or documentation are error free, or that the
operation of the software will be uninterrupted.
Campbell Scientific will either replace or correct any software that does not
perform substantially according to the specifications set forth in the instruction
manual with a corrected copy of the software or corrective code. In the case of
significant error in the installation media or documentation, Campbell
Scientific will correct errors without charge by providing new media, addenda,
or substitute pages. If Campbell Scientific is unable to replace defective media
or documentation, or if it is unable to provide corrected software or corrected
documentation within a reasonable time, it will either replace the software with
a functionally similar program or refund the purchase price paid for the
software.
All warranties of merchantability and fitness for a particular purpose are
disclaimed and excluded. Campbell Scientific shall not in any case be liable for
special, incidental, consequential, indirect, or other similar damages even if
Campbell Scientific has been advised of the possibility of such damages.
Campbell Scientific is not responsible for any costs incurred as a result of lost
profits or revenue, loss of use of the software, loss of data, cost of re-creating
lost data, the cost of any substitute program, telecommunication access costs,
claims by any party other than licensee, or for other similar costs.
This warranty does not cover any software that has been altered or changed in
any way by anyone other than Campbell Scientific. Campbell Scientific is not
responsible for problems caused by computer hardware, computer operating
systems, or the use of Campbell Scientific’s software with non-Campbell
Scientific software.
Licensee’s sole and exclusive remedy is set forth in this limited warranty.
Campbell Scientific’s aggregate liability arising from or relating to this
agreement or the software or documentation (regardless of the form of action;
e.g., contract, tort, computer malpractice, fraud and/or otherwise) is limited to
the purchase price paid by the licensee.
Page 5

Table of Contents
PDF viewers: These page numbers refer to the printed version of this document. Use the
PDF reader bookmarks tab for links to specific sections.
1. Introduction.................................................................1
1.1 What’s New in RTMC Pro 4.1?...........................................................2
2. Development Mode.....................................................3
2.1 The RTMC Pro Workspace..................................................................4
2.2 Display Components............................................................................4
2.3 Functions Available from the RTMC Pro Menus ..............................13
2.4 Expressions ........................................................................................19
2.4.1 Operators.....................................................................................22
2.4.2 Order of Precedence....................................................................22
2.4.3 Predefined Constants...................................................................23
2.4.4 Predefined Time Constants.........................................................23
2.4.5 Functions.....................................................................................23
2.4.6 Logical Functions........................................................................24
2.4.7 String Functions..........................................................................25
2.4.8 Conversion Functions .................................................................26
2.4.9 Time Functions ...........................................................................26
2.4.10 Start Option Functions ................................................................26
2.4.11 Statistical Functions ....................................................................27
2.4.12 Expression Builder......................................................................28
2.5 Managing Data Sources .....................................................................31
2.5.1 Server Data Source......................................................................32
2.5.2 File Data Source..........................................................................33
2.5.3 Database Data Source .................................................................34
2.5.4 HTTP Datalogger Source............................................................38
2.5.5 Virtual Data Source Properties....................................................38
2.6 Reports in RTMC...............................................................................39
3. RTMC Run-time.........................................................42
4. CSI Web Server .........................................................43
4.1 CSI Web Server Administrator ..........................................................44
4.1.1 Status...........................................................................................44
4.1.2 Configuration ..............................................................................45
4.1.2.1 Edit Root Permissions......................................................45
4.1.2.2 HTTP................................................................................45
4.1.2.3 HTTPS..............................................................................45
4.1.2.4 Log Control ......................................................................46
4.2 Web Publisher....................................................................................47
4.2.1 Creating Websites .......................................................................48
4.2.2 Managing Websites.....................................................................51
4.3 Web Security......................................................................................51
4.3.1 PC Websites ................................................................................51
4.3.1.1 Using the CSI Web Server Administrator........................52
i
Page 6

Table of Contents
4.3.1.2
Using the Web Publisher ................................................. 54
4.3.2 Datalogger Websites .................................................................. 54
4.4 API Commands ................................................................................. 55
4.4.1 Command Syntax ....................................................................... 55
4.4.2 Data Access Commands............................................................. 55
4.4.3 Control Commands .................................................................... 60
4.4.4 File Management Commands..................................................... 63
ii
Page 7

RTMC Pro
1. Introduction
The RTMC (Real-Time Monitor and Control) Pro software provides the ability
to create and run graphical screens to display real-time data as LoggerNet or
RTDAQ collects it from the dataloggers. Controls are also provided to view
and set datalogger ports and flags, as well as input locations or variables. In
LoggerNet, RTMC Pro can combine data from multiple dataloggers on a single
display. In RTDAQ, RTMC Pro projects are limited to a single datalogger. As
LoggerNet or RTDAQ collects data from the dataloggers, the displays in
RTMC Pro are automatically updated.
RTMC Pro is used to create and edit a real-time graphic display screen to
display the data collected from the dataloggers. Once the screen is built and
saved as a project, *.rtmc2, the screen can be displayed using RTMC Run-time.
This allows graphic display screens to run on other computers with just the
RTMC Run-time program.
RTMC Pro is an enhanced version of the standard RTMC Development that
ships with LoggerNet and RTDAQ. RTMC Pro contains more graphical
components than RTMC. For example, more alarms (multi-state), alarm
events (email, FTP, run/open), switches (lever, rocker, rotary), charts (XY and
scope), gauges (rotary, compass), and layout components (group box, bevel,
panel) are available. For components that exist in both versions, more
properties have been exposed in RTMC Pro resulting in more design control.
RTMC Pro also includes run/open button, hotspot, snapshot, and alarm log
capabilities. In LoggerNet, you also have the ability to add data files,
databases, HTTP dataloggers, virtual data sources, and additional LoggerNet
servers as data sources for RTMC Pro projects. See Section 2.5, Managing
Data Sources, for more information.
NOTE
A project that is created with the standard RTMC Development
version can be converted to RTMC Pro format. However, once a
project is converted to RTMC Pro format, it cannot be opened in
standard RTMC.
For help in getting started with RTMC, there is a tutorial provided on the
Downloads page of our website, www.campbellsci.com/downloads. The
tutorial is done using standard RTMC development, but the same concepts
apply to RTMC Pro.
The same RTMC Run-time is used to run projects developed in either RTMC
Pro or the standard RTMC Development.
One copy of RTMC Run-time is provided with LoggerNet and RTDAQ. For
LoggerNet, additional copies to run on remote machines can be purchased
separately.
Also included with RTMC Pro is the CSI Web Server. This allows you to view
your RTMC projects using a web browser. See Section 4, CSI Web Server, for
more information.
1
Page 8

RTMC Pro
NOTE
In LoggerNet, data must be collected from the datalogger for
RTMC’s displays to be updated. Typically this is done by
setting up a schedule in LoggerNet’s Setup Window. It can also
be done from RTMC’s Project | Configure Override Scheduled
Collection menu item.
In RTDAQ, RTMC performs a manual poll to update project
data when RTDAQ is connected to the datalogger. Therefore,
RTDAQ must be connected to the datalogger for RTMC’s
display to be updated. You can override the default one-second
interval from the Project | Configure Override Scheduled
Collection menu item.
1.1 What’s New in RTMC Pro 4.1?
RTMC Pro 4.1 includes the following enhancements from 4.0:
• Added an Expression Builder to simplify creating expressions.
• Added a Rainflow Chart component that displays rainflow data created by
a CRBasic Rainflow or RainflowSample instruction.
• Added Email Profiles that allow you to easily use the same SMTP Server,
Username, Password, From, To, Cc and Bcc fields for multiple alarms
and/or Report Export components.
• A Backed/Veered tab has been added to the Compass that allows you to
display backed/veered wind direction as a bar on the compass.
• In multi-screen projects, a red flag now appears on the tab for any screen
with an active alarm. This allows you to see when an alarm occurs on a
screen that you are not currently viewing.
• In CSI Web Server, when an alarm is acknowledged by one web client, all
others web clients viewing the page will now see the acknowledgement.
• Alarm emails now work in CSI Web Server.
• The Value Forwarder now works in CSI Web Server.
• Added the functions SelectSwitch, AvgSpa, MaxSpa, and MinSpa to be
used in expressions.
• You can now select what columns to view on a Table Display in RTMC
Run-time.
• A Time Series Chart, XY Chart, Scope, or Rainflow Chart can now be
customized in RTMC Run-time if that option has been enabled in RTMC
Pro.
• RTMC Pro now supports IPv6 addresses. IPv6 addresses are written as
eight two-byte address blocks separated by colons and surrounded by
brackets (e.g., [2620:24:8080:8600:85a1:fcf2:2172:11bf]). Prior to RTMC
2
Page 9
Pro 4.1, only IPv4 addresses were supported. IPv4 addresses are written in
dotted decimal notation (e.g., 192.168.11.197). Leading zeroes are
stripped for both IPv4 and IPv6 addresses. Note that while RTMC Pro
now supports IPv6 addresses and they can be used to specify servers,
CR1000/CR3000/CR800 dataloggers will not support IPv6 until a future
OS release. Check the OS revision history on our website to determine
when IPv6 support is added to the OS.
• Miscellaneous other changes.
2. Development Mode
RTMC Pro is a graphic display editor that allows the user to easily place
graphical components on the display screen and associate them with data
values.
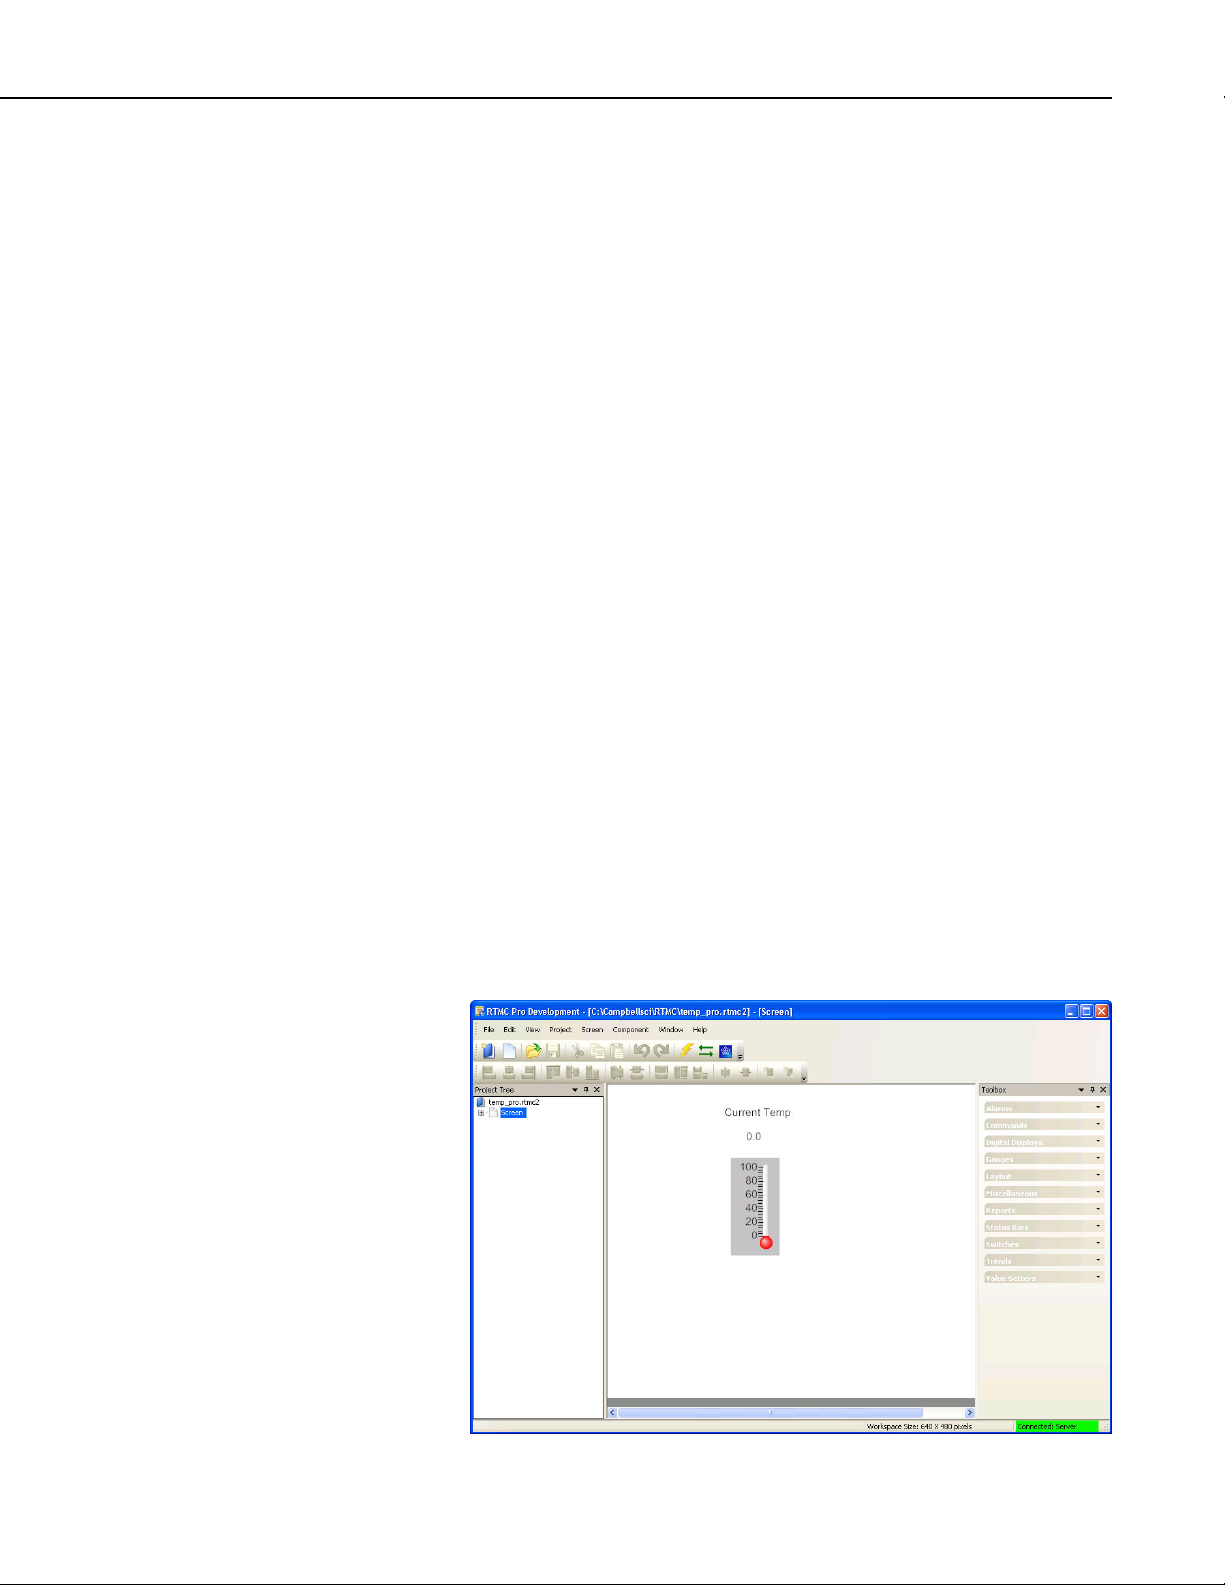
The RTMC Pro window, as shown below, has three sections.
Project Tree - The panel on the left shows the hierarchy of the display
components and how they are associated with each other. Every component of
the display screen is shown in this list and it provides a shortcut to get to any
graphical component.
RTMC Pro
Project Workspace - The middle panel is the display screen workspace. The
graphic components are placed in the workspace, as they should appear on the
final display.
Component Toolbox - The toolbox on the right contains the display screen
components that can be placed in the workspace. Selecting a component and
clicking in the workspace places the component and brings up the Properties
window for that component.
RTMC Pro was designed to be easy and straightforward to use. Experiment
with different combinations and options to get the display results you are
looking for.
3
Page 10

RTMC Pro
2.1 The RTMC Pro Workspace
2.2 Display Components
As seen in the example screen above, different types of graphical components
can be combined to create an attractive real-time display. Company logos,
maps, or any image stored in a standard graphic file format can be placed on
the screen.
Many images have been included with RTMC Pro. The default directory in
which these files are stored is C:\Campbellsci\Lib\RTMCMediaLib. Custom
images can be used as well; these should be placed in the media library
directory to make them available for RTMC Pro’s use.
The RTMC Pro workspace is a container for holding one or more display
screens. As new display screens are added (Project | Add New Screen) they
appear in the project tree. In RTMC Run-time, each screen will be displayed
as a tab. The size of the workspace and the run-time window can be changed
by selecting Project | Configure WorkSpace. Refer to Project Menu in Section
2.3, Functions Available from the RTMC Pro Menus, for additional
information on sizing options.
NOTE
Display components are the objects that are used to display data. Available
components for each component type can be displayed by clicking the arrow
on each tab in the Component Toolbox. To add a component to the workspace,
click an item on the Component Toolbox and then click anywhere in the
workspace or click and drag to the desired size. The component’s Properties
window is automatically displayed when the object is first placed in the
workspace. The Properties window is used to customize colors, scale values,
text, etc., and to assign the data value to be displayed by the component.
When a display component is linked to a data value, if Use Live
Data is active, the value will be automatically updated on the
display if data is available. (Refer to View Menu in Section 2.3,
Functions Available from the RTMC Pro Menus, for more
information on Use Live Data.)
In LoggerNet, if data collection is not set up for the station, the
values will not update and an exclamation point will appear in
the upper right corner of the component. Data collection can be
set-up through the LoggerNet Setup window or with RTMC’s
Project | Configure Override Scheduled Collection menu item.
Input locations, ports and flags for mixed-array dataloggers are
collected at the scheduled collection interval or any time a
manual collection is done. The Public table must be enabled for
scheduled collection to display these values for table-data
dataloggers.
4
In RTDAQ, if RTDAQ is not connected to the station, the values
will not update and an exclamation point will appear in the upper
right corner of the component.
As changes are made to component properties, they appear on the screen in
real-time. After a component’s properties have been set, select OK to keep the
Page 11
RTMC Pro
changes and close the Properties window. Once the link to the data value has
been applied, if there is data available from LoggerNet or RTDAQ for the
component, the value on the display will update, if Use Live Data is active.
To make changes in display component settings, the Properties window can be
opened by double-clicking the component or right-clicking the component and
then choosing Properties from the drop-down menu. If you make changes to a
component’s properties but then decide to reject those changes, press the
Cancel button to return the properties to the last applied state. If Cancel is
selected when a component is first placed in the work area (and OK has not
been pressed), the display component will be removed from the screen.
Available Components
The following is an overview of the display components available. The online
help has detailed information about each of the components and their
properties.
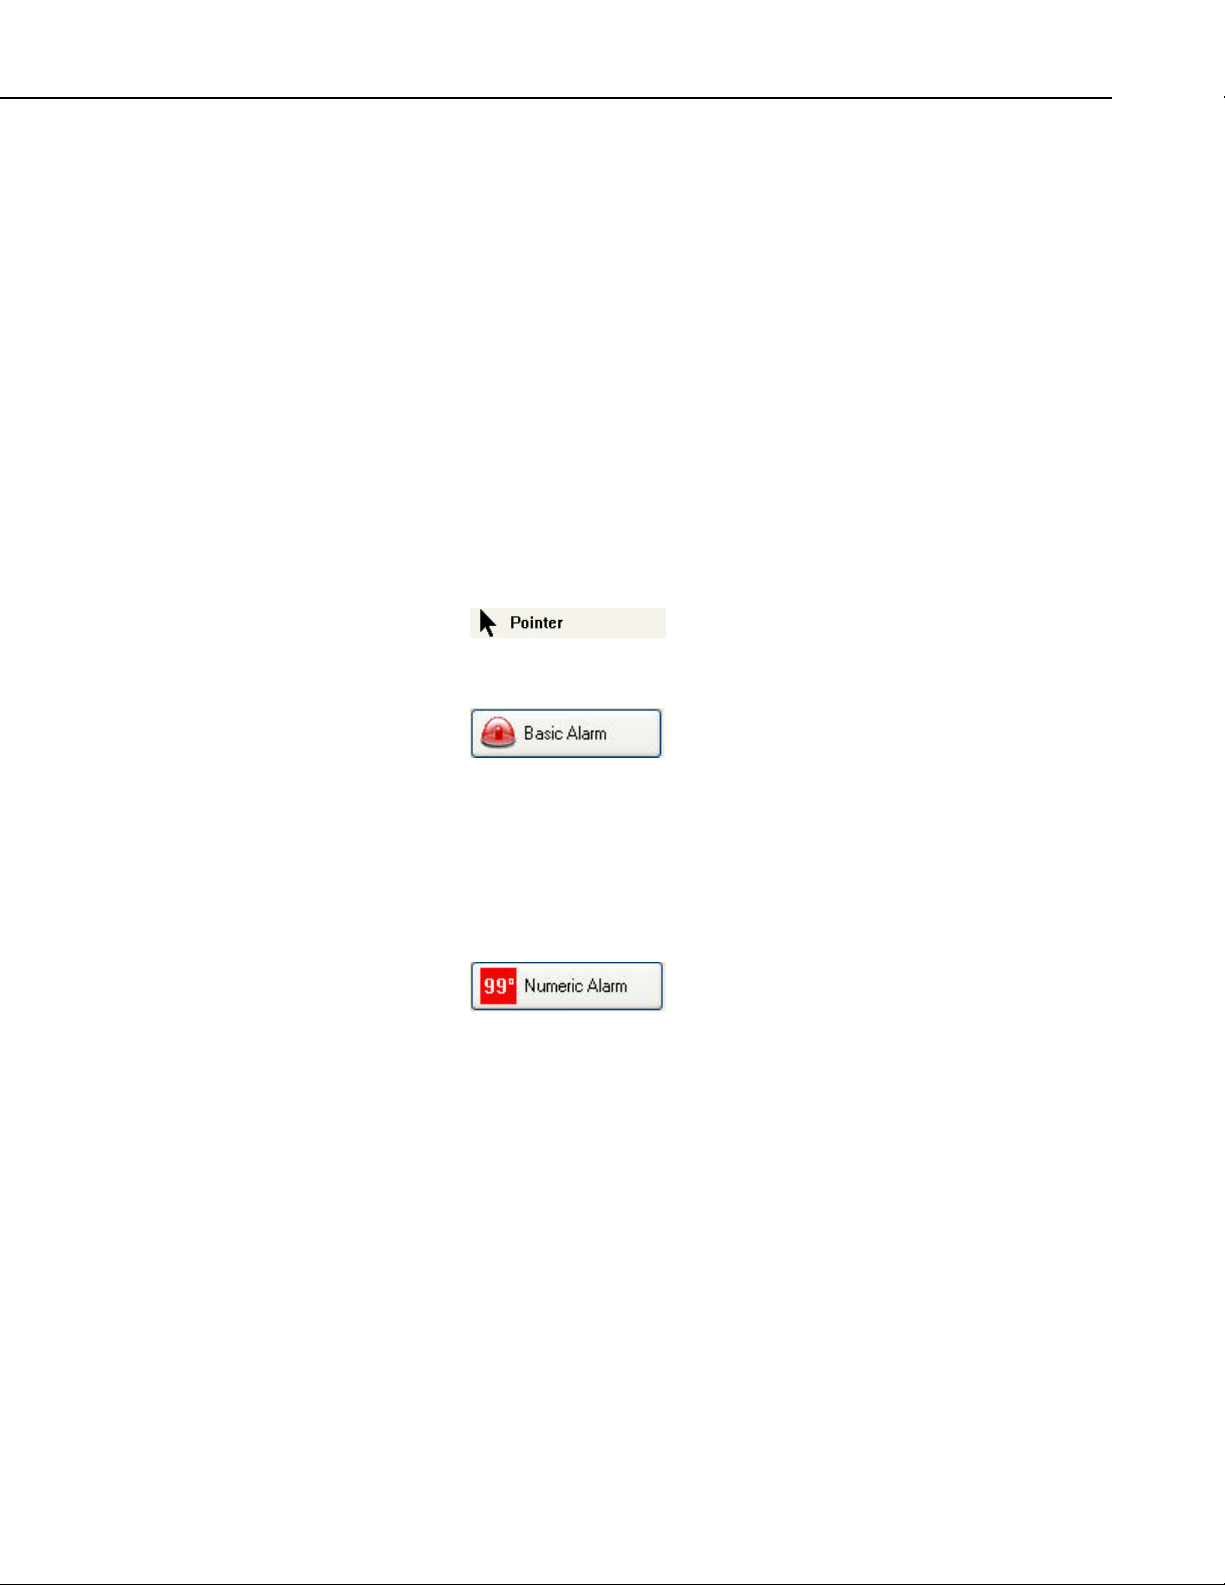
All Tabs
Returns the cursor to a normal selection tool.
Alarms Tab
Provides visual and/or audible notification that a
data value has exceeded a defined limit. An
audible alarm can be disabled by right-clicking the
component with your mouse and selecting
Acknowledge Alarm. An alarm can also cause an
email to be sent to a specified email address and/or
a specified file to be opened. All events (audio,
email, run/open) and alarm acknowledgement
occur only when running the project in RTMC
Run-time or CSI Web Server.
Provides visual and/or audible notification that a
data value has exceeded a defined limit. An
audible alarm can be silenced by right-clicking the
component with your mouse and selecting
Acknowledge Alarm. An alarm can also cause an
email to be sent to a specified email address and/or
a specified file to be run or opened. All events
(audio, email, run/open) and alarm
acknowledgement occur only when running the
project in RTMC Run-Time or CSI Web Server.
5
Page 12
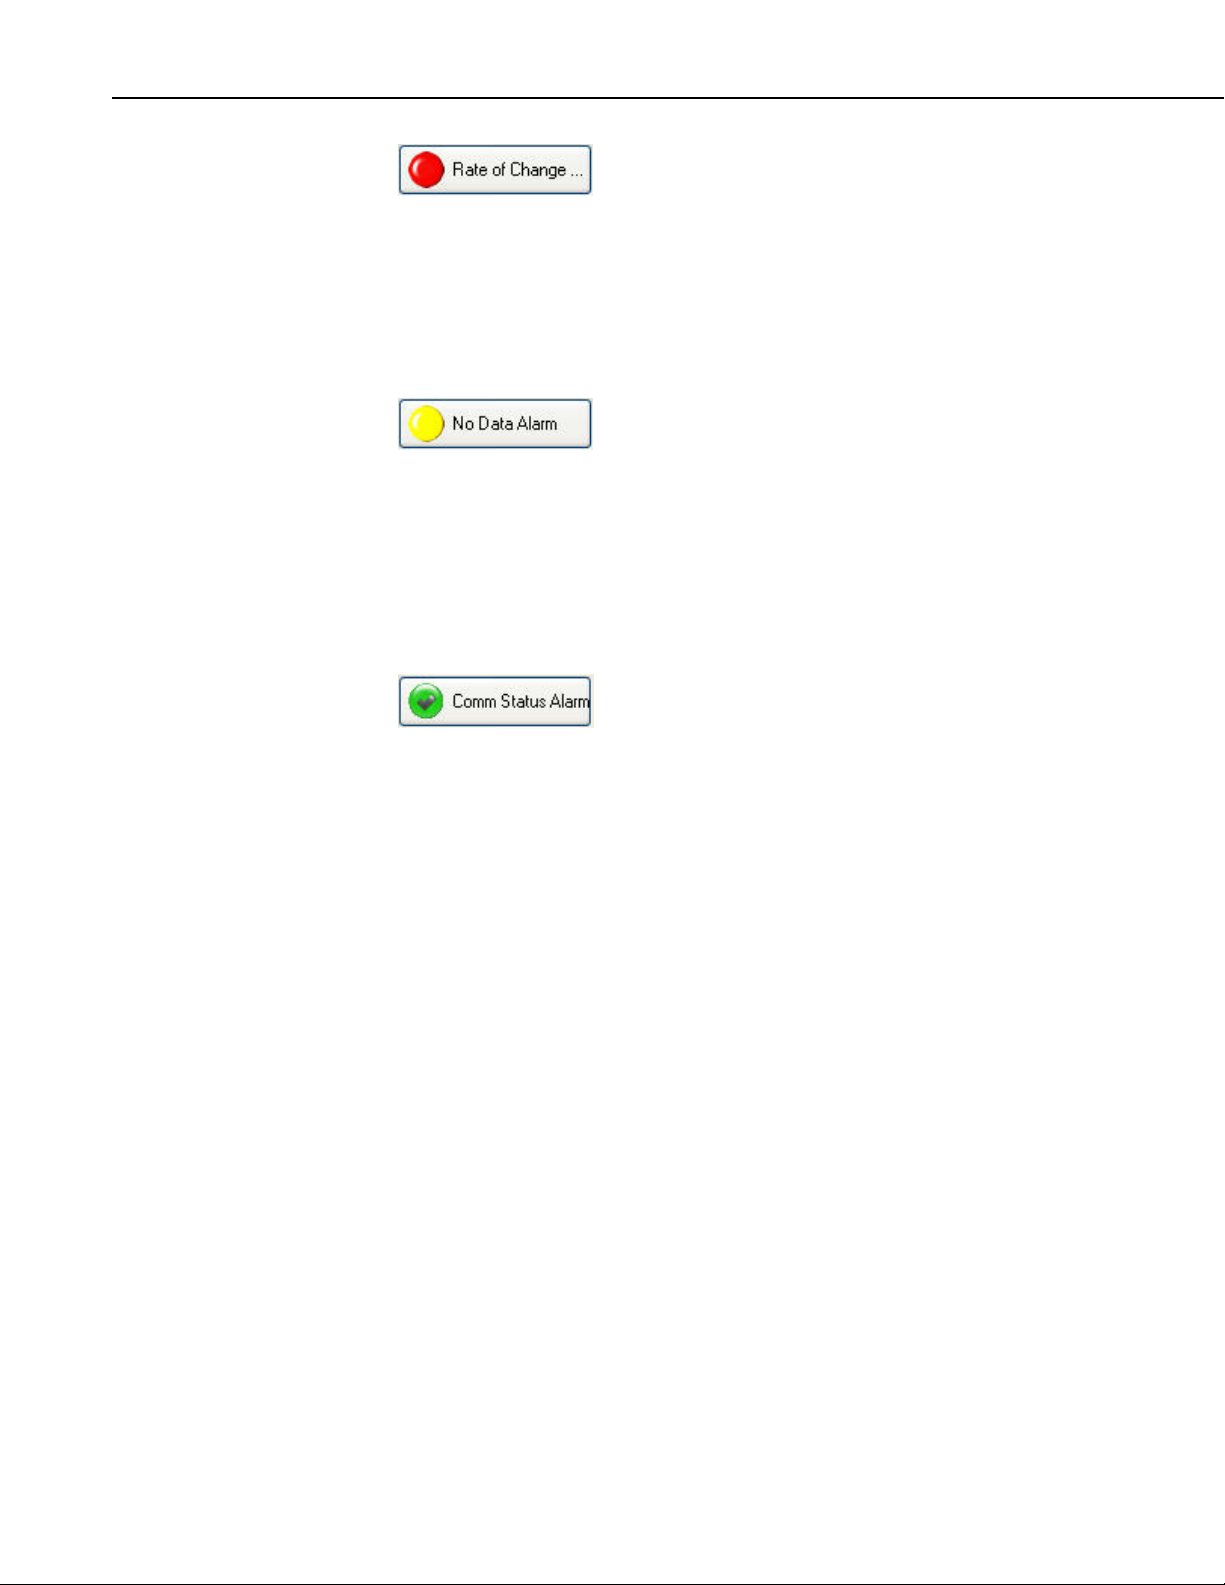
RTMC Pro
Provides visual and/or audible notification that the
rate of change of a data value has exceeded a
defined limit. An audible alarm can be disabled by
right-clicking the component with your mouse and
selecting Acknowledge Alarm. An alarm can
also cause an email to be sent to a specified email
address and/or a specified file to be opened. All
events (audio, email, run/open) and alarm
acknowledgement occur only when running the
project in RTMC Run-time or CSI Web Server.
Provides visual and/or audible notification that no
data has been received from a selected table for a
specified period of time. An audible alarm can be
disabled by right-clicking the component with
your mouse and selecting Acknowledge Alarm.
An alarm can also cause an email to be sent to a
specified email address and/or a specified file to be
opened. All events (audio, email, run/open) and
alarm acknowledgement occur only when running
the project in RTMC Run-time or CSI Web
Server.
Provides visual and/or audible notification when
scheduled collection is disabled in the Setup
Screen, the schedule is paused from the Status
Monitor, or communication has failed a sufficient
number of times to put the datalogger into a
Primary or Secondary Retry mode (the retry mode
used is based on the Condition property for the
component). An audible alarm can be disabled by
right-clicking the component with your mouse and
selecting Acknowledge Alarm. An alarm can
also cause an email to be sent to a specified email
address and/or a specified file to be opened. All
events (audio, email, run/open) and alarm
acknowledgement occur only when running the
project in RTMC Run-time or CSI Web Server.
Note that if RTMC is launched from RTDAQ, a
Comm Status Alarm will only be triggered when
an RTDAQ real-time display is started or stopped.
This is because RTDAQ uses scheduled collection
to temporarily collect areas in order to update the
real-time displays.
6
Page 13
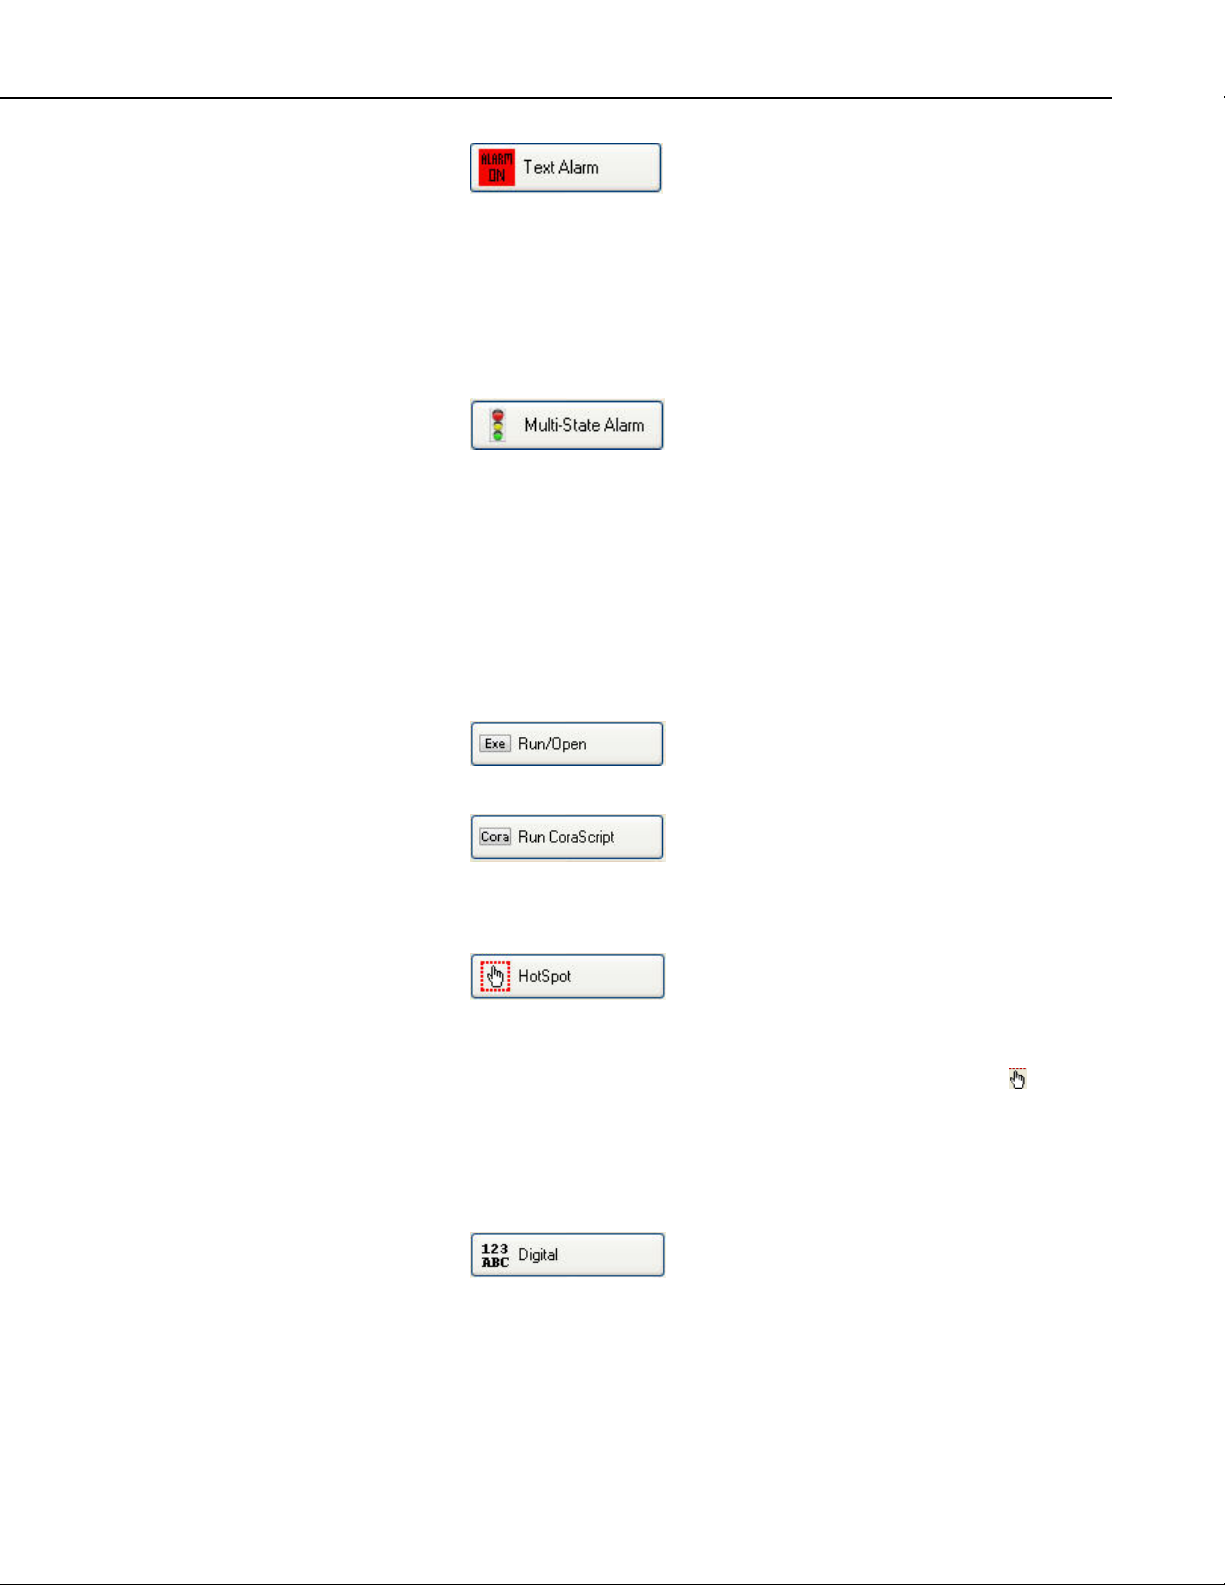
RTMC Pro
Provides visual and/or audible notification that a
data value has exceeded a defined limit. An
audible alarm can be disabled by right-clicking the
component with your mouse and selecting
Acknowledge Alarm. An alarm can also cause an
email to be sent to a specified email address and/or
a specified file to be opened. All events (audio,
email, run/open) and alarm acknowledgement
occur only when running the project in RTMC
Run-time or CSI Web Server.
Provides visual and/or audible notification of the
state of a data value. Default states include Off,
Warning and Critical. These can be changed and
additional states can be added. An image, sound
file, email, and/or run/open can be defined for each
state. An audible alarm can be disabled by rightclicking the component with your mouse and
selecting Acknowledge Alarm. All events (audio,
email, run/open) and alarm acknowledgement
occur only when running the project in RTMC
Run-time or CSI Web Server.
Commands Tab
Digital Displays Tab
Provides a button that will run/open a specified file
(*.exe, *.bat, *.doc, etc.) when pressed in run-time
mode.
Provides a button that will execute a specified
CoraScript command when pressed in run-time
mode. CoraScript is a set of commands that can
be used to interact with the LoggerNet server. For
more information, see RTMC Pro’s online help.
Provides a hotspot that will jump to a specified
RTMC screen or open a web browser to a
specified web address when clicked in the runtime mode. In RTMC Run-time the hotspot will
be invisible. The only indication of a hotspot will
be the changing of the cursor to a hand (
) when
over the hotspot. A label, button, or other
component can be used to indicate what the
hotspot will do when clicked.
Depicts the selected data value as a numeric value,
text string, or Boolean.
7
Page 14
RTMC Pro
Gauges Tab
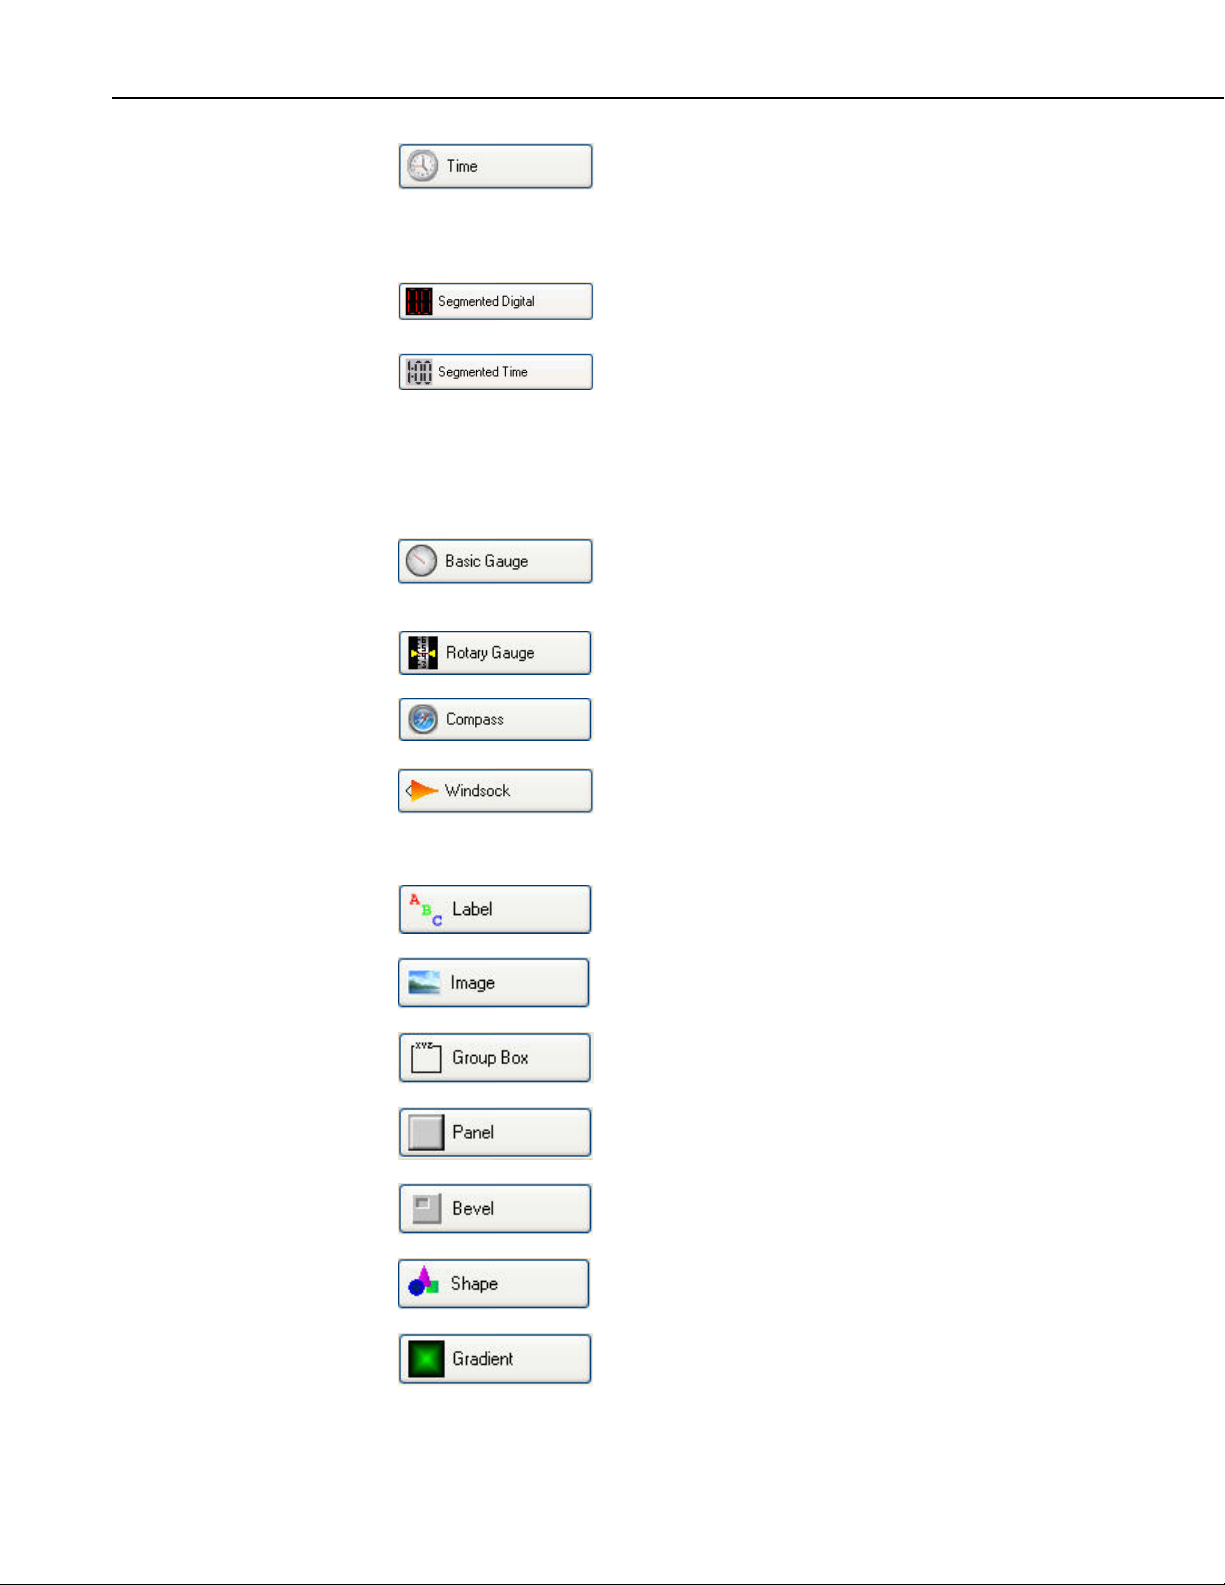
Depending upon the option chosen, displays the
server time, server time at last data collection,
station time, station time of last record stored, PC
time, or a time stored in the data table (such as
time of minimum or maximum).
Depicts the selected data value as a numeric value,
text string or Boolean.
Depending upon the option chosen, displays the
server time, server time at last data collection,
station time, station time of last record stored, PC
time, or a time stored in the data tables (such as
time of maximum or minimum).
Displays the selected data value on a gauge. In
run-time mode, max and min pointers can be reset
by right-clicking the component.
Displays the selected data value on a rotary gauge.
Layout Tab
Provides an eight-point compass on which to
display data.
Displays wind speed and wind direction from a
datalogger table in the form of a windsock.
Displays a static text string that can be used to
label other components.
Allows you to place a static image on the display.
Allows you to place a box on the display in order
to group components together.
Places a panel on the display that can be used to
group components together.
Places a beveled edge on the display that can be
used to bevel the edges of other components.
Allows you to place a circle, ellipse, square,
rectangle, or rounded rectangle on the display.
8
Allows you to place a gradient on the display.
Page 15
Miscellaneous Tab
Reports Tab
RTMC Pro
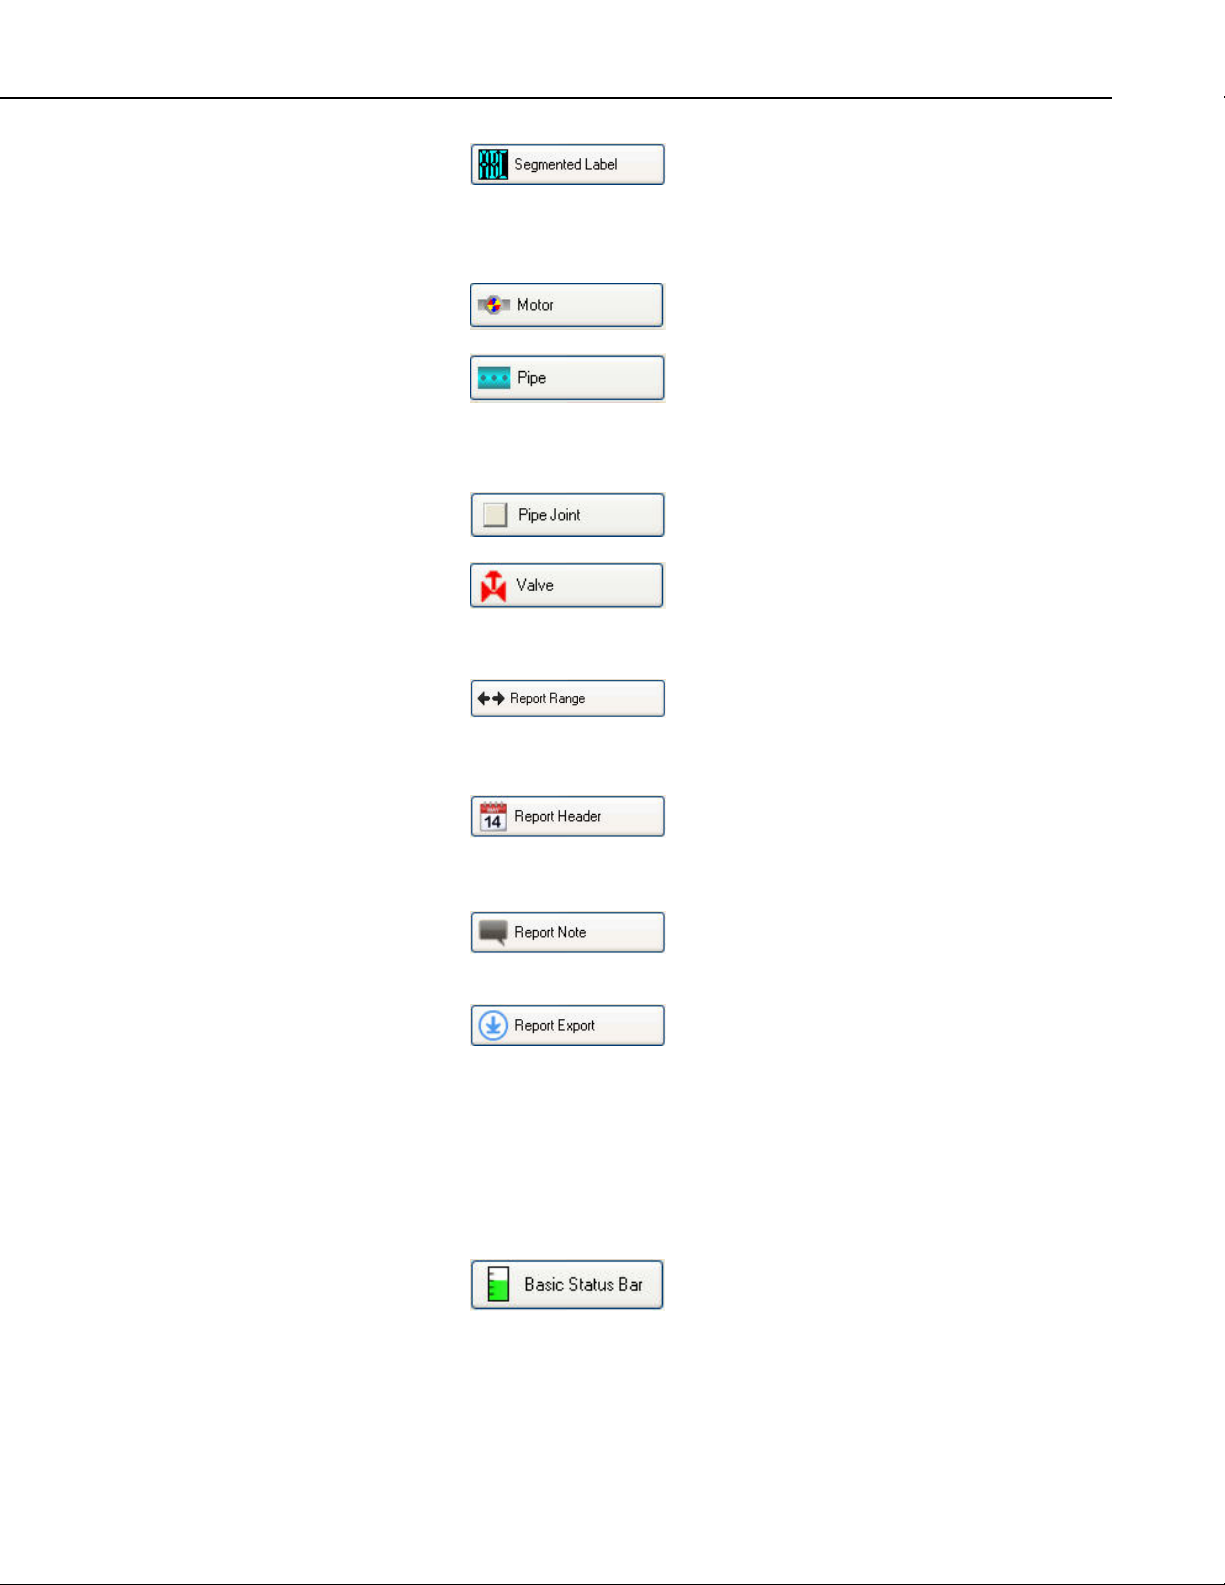
Displays a static text string that can be used to
label other components or simply add text to the
project.
Provides a motor that can be depicted as on or off
based on a data value.
Displays a pipe. The flow through the pipe can be
determined by a data value. A pipe is horizontal
by default. To make a vertical pipe, unlock the
aspect ratio and resize it so that it is taller than it is
wide.
Provides a pipe joint that can be used to connect
two pipes.
Provides a valve that can be depicted as opened or
closed based on a data value.
Status Bars Tab
Provides a button bar that allows the user to
customize the date range of their report. It also
provides buttons in run-time to step through data
or jump to a specific date.
Displays the report range. The user can customize
the dates shown and the format used. In run-time
mode, the header updates as the report date range
changes.
Allows the user to insert custom notes at run-time
before the report is exported. Notes are temporary
and are lost when the report is closed.
Provides options for controlling how reports get
exported. Export options include HTML, PDF,
PDF (Image), PNG, JPEG, GIF, and BMP. The
reports can also be setup so they are printed,
emailed, or FTP’d when the report is exported.
The component also allows you to specify which
of the above export options are available in RTMC
Run-time.
Depicts the selected data value as a single vertical
or horizontal bar. In run-time mode, max and min
pointers can be reset by right-clicking the
component.
9
Page 16
RTMC Pro
Switches Tab
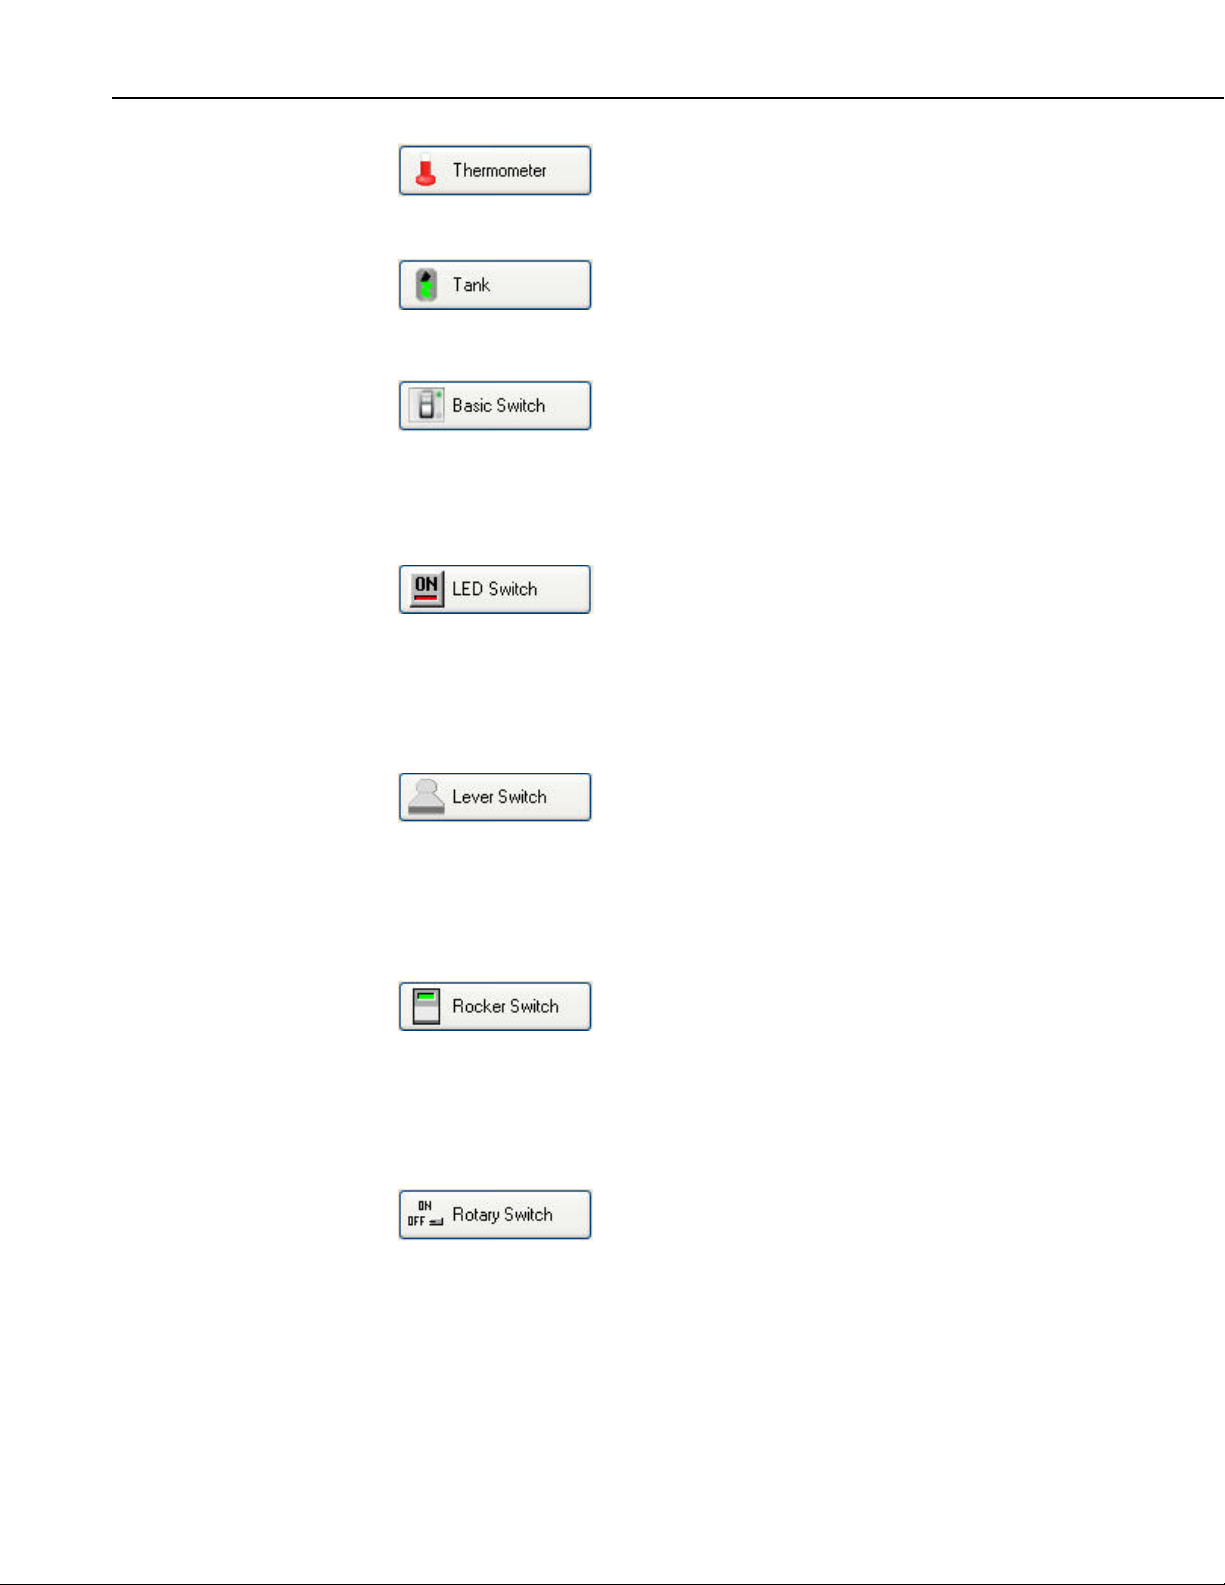
Displays the data value on the image of a
thermometer. In run-time mode, max and min
pointers can be reset by right-clicking the
component.
Displays the data value as the level in a tank.
Indicates the state of a port, flag, input location, or
public variable. A 0 is considered Off (false); any
non-zero number is considered On (True). In runtime mode, right-click a switch to change its state.
The option to change the state of a switch with a
double-click or a single-click can be enabled in the
Properties window.
Indicates the state of a port, flag, input location, or
public variable by the color of an LED. A 0 is
considered Off (false); any non-zero number is
considered On (True). In run-time mode, rightclick a switch to change its state. The option to
change the state of a switch with a double-click or
a single-click can be enabled in the Properties
window.
Indicates the state of a port, flag, input location, or
public variable by the position of a lever. A 0 is
considered Off (false); any non-zero number is
considered On (True). In run-time mode, rightclick a switch to change its state. The option to
change the state of a switch with a double-click or
a single-click can be enabled in the Properties
window.
Indicates the state of a port, flag, input location, or
public variable by the position of a rocker. A 0 is
considered Off (false); any non-zero number is
considered On (True). In run-time mode, rightclick a switch to change its state. The option to
change the state of a switch with a double-click or
a single-click can be enabled in the Properties
window.
Indicates the state of a port, flag, input location, or
public variable by the position of a rotary dial.
The default switch has two positions. A 0 is
considered Off (false); any non-zero number is
considered On (True). Other positions can be
added. In run-time mode, click on a position to
change to that state.
10
Page 17

Trends Tab
RTMC Pro
Indicates the state of a port, flag, input location, or
public variable by the position of a horizontal or
vertical bar. The default switch has two positions.
A 0 is considered Off (false); any non-zero number
is considered On (True). Other positions can be
added. In run-time mode, click on a position to
change to that state.
Indicates the state of a port, flag, input location, or
public variable by displaying an option from a list
designated by the user. The default drop list has
two options. A 0 is considered Off (false); -1 is
considered On (True). Other options can be added.
In run-time mode, click on the component to
display the list of options and change the value of
the variable.
Displays one or more time domain series on a
chart. The time stamp on the X axis reflects the
data timestamp. In run-time mode, it is possible to
zoom in by clicking and dragging a box around the
desired zoom area. Also, in run-time mode, rightclicking the chart will bring up a menu that allows
the chart to be printed, copied, or exported.
Displays one or more XY series on a chart. The
user specifies what will be used for both the X axis
data values and the Y axis data values. Each X
axis data value is plotted against the Y axis data
value with an identical timestamp. In run-time
mode, it is possible to zoom in by clicking and
dragging a box around the desired zoom area.
Also, in run-time mode, right-clicking the chart
will bring up a menu that allows the chart to be
printed, copied, or exported.
Displays one or more series on a chart. The time
stamp on the X axis reflects the data timestamp.
The Scope is similar to the Time Series Chart, but
has the appearance of an oscilloscope screen and
has the ability to display data at a faster rate. In
run-time mode, right-clicking the Scope will bring
up a menu that allows the Scope to be printed,
copied, or exported.
11
Page 18
RTMC Pro
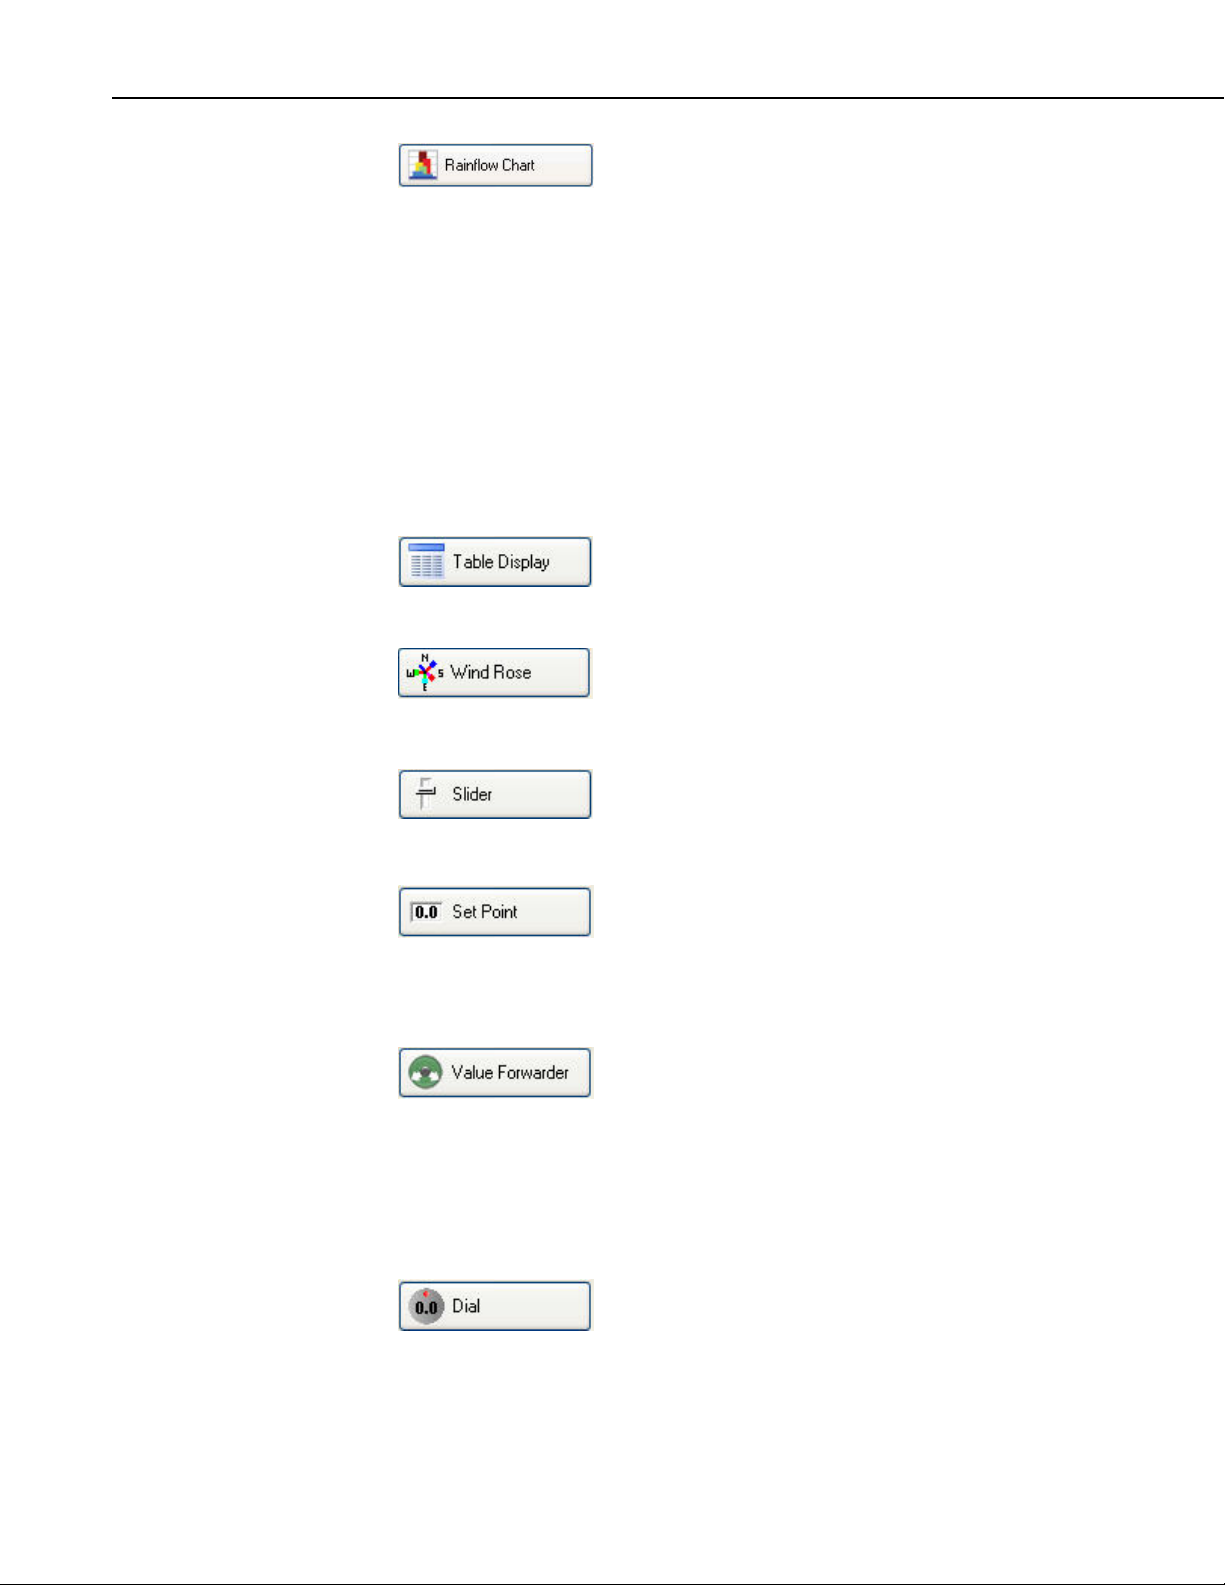
Displays Rainflow data on a chart. In run-time
mode, a portion of the chart can be “zoomed in
on” by dragging a frame around the area to be
viewed. Right-clicking the chart will bring up a
menu that allows the chart to be printed, copied,
saved, or zoomed to all data. If the Allow Runtime Customization check box is selected in
RTMC Pro, this menu will also include a
Customize item that allows the Run-time user to
change any of the Rainflow Chart’s properties.
Note: RTMC Pro does not create rainflow data
from time series information. It only displays
rainflow data. Rainflow data is created by using
the CRBasic Rainflow or RainflowSample
instruction in a CRBasic program Data Table.
Displays the data from a datalogger table in a row
and column format. In run-time mode, rightclicking the table will bring up a menu that allows
the table to be printed, copied, or exported.
Displays wind speed and wind direction from a
datalogger table in the form of a wind rose.
Value Setters Tab
Depicts the selected data value as a single
horizontal or vertical bar. In run-time mode, the
data value can also be set to a new value by
dragging the slider.
Like the Digital component, depicts the selected
data value as a numeric value, text string, or
Boolean. However, in run-time mode, a data value
can also be set to a new value by double-clicking
the component and entering a new value in the
resulting dialog box.
In run-time mode, reads a value in a datalogger
and writes to another value in that datalogger or a
different datalogger. The value that is written can
be the value read, a 0 or -1, or a specified constant.
Note that in RTDAQ, RTMC projects are limited
to a single station. Therefore, the value read can
only be forwarded to another value in the same
datalogger.
Depicts the selected data value as a pointer on a
dial. In run-time mode, the data value can also be
set to a new value by dragging the pointer.
12
Page 19

RTMC Pro
NOTE
A description of each field in a component’s Properties box can
be displayed by pressing F1 or clicking the help button (?) in the
top right-hand corner of the dialog box.
2.3 Functions Available from the RTMC Pro Menus
All of the RTMC Pro operations are available from the menus at the top of the
RTMC Pro window. Many of the options are also available as buttons on the
toolbar, or by right clicking the components or other parts of the window or
project tree.
File Menu
New Project starts a new RTMC Pro project. The currently opened project
will be closed. If there are changes that have not been saved, the user will be
prompted to save changes.
Open brings up the File Open dialog to open a previously saved project.
Save will save the changes in the current project to the RTMC Pro project file.
If this is the first time the project has been saved, a Save As dialog will open to
select the file name and directory for the project file.
Save As brings up the Save As dialog to save the current project with another
name or in a different directory.
NOTE
Run Project displays the current project in a run-time window.
Save and Run Project saves the changes in the current project and displays it
in the run-time window.
This option is not available when RTMC Pro is run from inside
RTDAQ.
Publish to Web opens the Web Publisher which allows you to publish your
project to the web. See Section 4, CSI Web Server, for more information.
Exit closes RTMC Pro. If there are unsaved changes, the user will be
prompted to save changes before exiting.
Edit Menu
Cut/Copy/Paste are standard editing operations to add selected objects to the
Windows clipboard and paste them into RTMC Pro or other applications.
Undo cancels the last change made to the project.
Redo repeats the change that was just undone.
Find and Replace allows you to find all occurrences of a designated string and
replace them with a different string. Some instances where this may be useful
are if a datalogger name in your network map has changed or a variable name
in the datalogger program has changed. The user determines if the find and
13
Page 20

RTMC Pro
replace applies to the entire project, only the current screen, or only the current
component.
Select All selects all of the components in the workspace. The components can
then be cut, copied, deleted, etc.
Clear Selection clears the selection of components currently highlighted on the
active screen.
The Preferences menu item is used to change some global settings that affect
all projects in RTMC Pro. The Visual Theme determines the look and feel of
the application (i.e., colors, button appearance, etc.). The Working Directory is
the directory in which to store RTMC Pro project files. By default, this is
C:\Campbellsci\RTMC. Press the Change Default Font button to set a new
font for components that have text (numeric value text, chart titles and axes
labels, etc.).
Component summaries (“tooltips”) are small boxes that are displayed on the
screen beside a component when your mouse cursor hovers over the
component for a few seconds. The box displays information on the type of
component, the data value linked to the component, images used, series
plotted, etc. Select the Show Component Summaries box to display these hint
boxes or clear the box to turn off the display of the information.
The Grid Options settings allow you to turn on or disable the display of a grid
in the project workspace and lets you set the size of the grid.
With the Graphics Options settings, you can control the maximum number of
times the RTMC screens will be updated per second, disable animation when a
data value changes, and specify whether high quality or high speed is more
important. (Disabling animation disables the smooth transition between values
on gauges, status bars, etc. When a data value changes, the component will
jump to the new value. This greatly enhances performance when dealing with
fast data or large, complex projects.)
The Customize menu item brings up a dialog box which allows you to
customize RTMC Pro’s toolbars and menus.
View Menu
All of the View menu items are toggles. When a check mark appears to the left
of the menu item, it is enabled. When the check mark is absent, the option is
disabled. These options are toggles—if an option is off (unchecked), select it
once to turn it on (checked) and vice versa.
Full Screen Mode
When selected, the RTMC workspace expands to fill the entire computer
screen. This provides more space to work with in designing your project. In
this mode, you must use the right-click menus to add components and perform
other functions available from RTMC’s toolbar. Press the Esc key to exit this
mode.
14
Page 21

RTMC Pro
Use Live Data
LoggerNet – When selected, RTMC Pro uses the data that has been collected
by LoggerNet and stored in LoggerNet’s data cache. Therefore, if LoggerNet is
running and data is being actively collected from the datalogger network, the
values displayed by the components will be updated as data is collected.
However, run-time events (audio, email, run/open, alarm acknowledgement,
switch state changing, value changing, value forwarder, etc.) will not be active.
When Use Live Data is not selected, RTMC Pro does not use the data stored in
LoggerNet’s data cache. Therefore, the values displayed by the components
will not be updated until RTMC-RT is launched.
RTDAQ – When selected, RTMC Pro performs a manual poll to update the
project data every second if RTDAQ is connected to the datalogger. Therefore,
if RTDAQ is connected to the datalogger, the values displayed by the
components will be updated every second. However, run-time events (audio,
email, run/open, alarm acknowledgement, switch state changing, value
changing, value forwarder, etc.) will not be active. When Use Live Data is not
selected, RTMC Pro does not perform manual polls to update project data.
Therefore, the values displayed by the components will not be updated until
RTMC-RT is launched.
This menu item can also be toggled off or on by selecting an icon on the tool
bar. The icon has a different appearance, depending on whether or not Use
Live Data is currently off or on. When Use Live Data is off, the icon will
appear as
. When Use Live Data icon is on, the icon will appear as .
Show Project Tree hides or displays the Project Tree (left pane of the default
window).
Show Toolbox hides or displays the Component Toolbox.
Show Layout Toolbar hides or displays the Layout Toolbar.
Show Tabs hides or displays the tabs at the top of the RTMC workspace which
allow the user to switch between screens. When tabs are not shown, you can
switch between screens by selecting a screen from the Project Tree. (Note this
menu item is disabled for projects with only one screen.)
Show Standard Toolbar hides or displays the Standard Toolbar.
Show Status Bar hides or displays the Status bar at the bottom of the screen.
The Status Bar provides hints on objects, window size, and the server
connection.
Show Grid hides or displays a grid background for the workspace.
Project Menu
Project Menu options work with the whole project or workspace.
Configure Workspace allows you to specify the size of both the development
workspace and the RTMC Run-time screen. For Development, the size of the
RTMC Pro workspace is set by choosing a size from the drop-down list. If you
choose custom, you will be asked to specify the width and height in
15
Page 22

RTMC Pro
millimeters, inches, or pixels. For Run-time, when Auto Size is selected, the
size of an RTMC display is set automatically by dragging the boundaries of the
screen to a new size. The components will resize to match the new screen size.
The aspect ratio of the components will be maintained only if Lock Aspect
Ratio is selected. When Fixed Size is selected, the screen size is fixed. It is
determined by the size set in the development mode.
Manage Data Sources opens a dialog box which allows you to manage the
data sources for your RTMC project. See Section 2.5, Managing Data
Sources, for additional information.
Configure Alarm Log opens a dialog box that allows an alarm log to be
configured for all alarms that are generated. Options include enabling alarm
logging, log directory, base file name, number of alarm log files kept, size or
time interval of alarm log files, and whether a text entry is required for alarm
acknowledgement. The text entry will be included in the log file. It can be
used to log information about who acknowledged the alarm and other
comments. The alarm log will be an XML document. See Alarm Log
Structure in the online help file for more information about the XML structure
of the alarm log.
Configure Auto Tabbing lets you enable or disable the automatic switching
between project tabs when an RTMC form is run, and set the rate at which a
new tab will be displayed. When RTMC is in AutoTab mode, it will display a
tab for a set amount of time and then display the next tab. If a screen is
interacted with or a different tab is selected, auto tabbing stops and a button
appears by the menu,
, that can be clicked to resume tabbing.
Configure Snapshot & FTP opens a dialog box that allows the configuration
of a snapshot of the current RTMC Pro state. A snapshot is a *.png file of the
current state. It can be configured to include selected screens or only selected
components. For a snapshot of selected screens, a file will be saved for each
screen with a filename of screenname.png. For a snapshot of only select
components, a file will be saved for each component with a filename of
componentname.png. A snapshot will be saved in Run-time to the designated
directory at the specified interval. It can also be transferred to a designated
FTP server on the same interval. Only the most current snapshot will be kept.
It will be overwritten each time a new snapshot is saved.
Configure Override Scheduled Collection opens a dialog box that allows the
collection interval to be specified. In LoggerNet, this data collection will be in
addition to the scheduled collection specified in LoggerNet’s Setup window. In
RTDAQ, this will override RTDAQ’s automatic one second polling to update
the project data.
Configure Email Profiles opens a dialog box that allows you to configure
email profiles that allow you to easily use the same SMTP Server, Username,
Password, From, To, Cc and Bcc fields for multiple alarms and/or Report
Export components.
16
Page 23
RTMC Pro
Load as Template enables you to easily use the same project for multiple
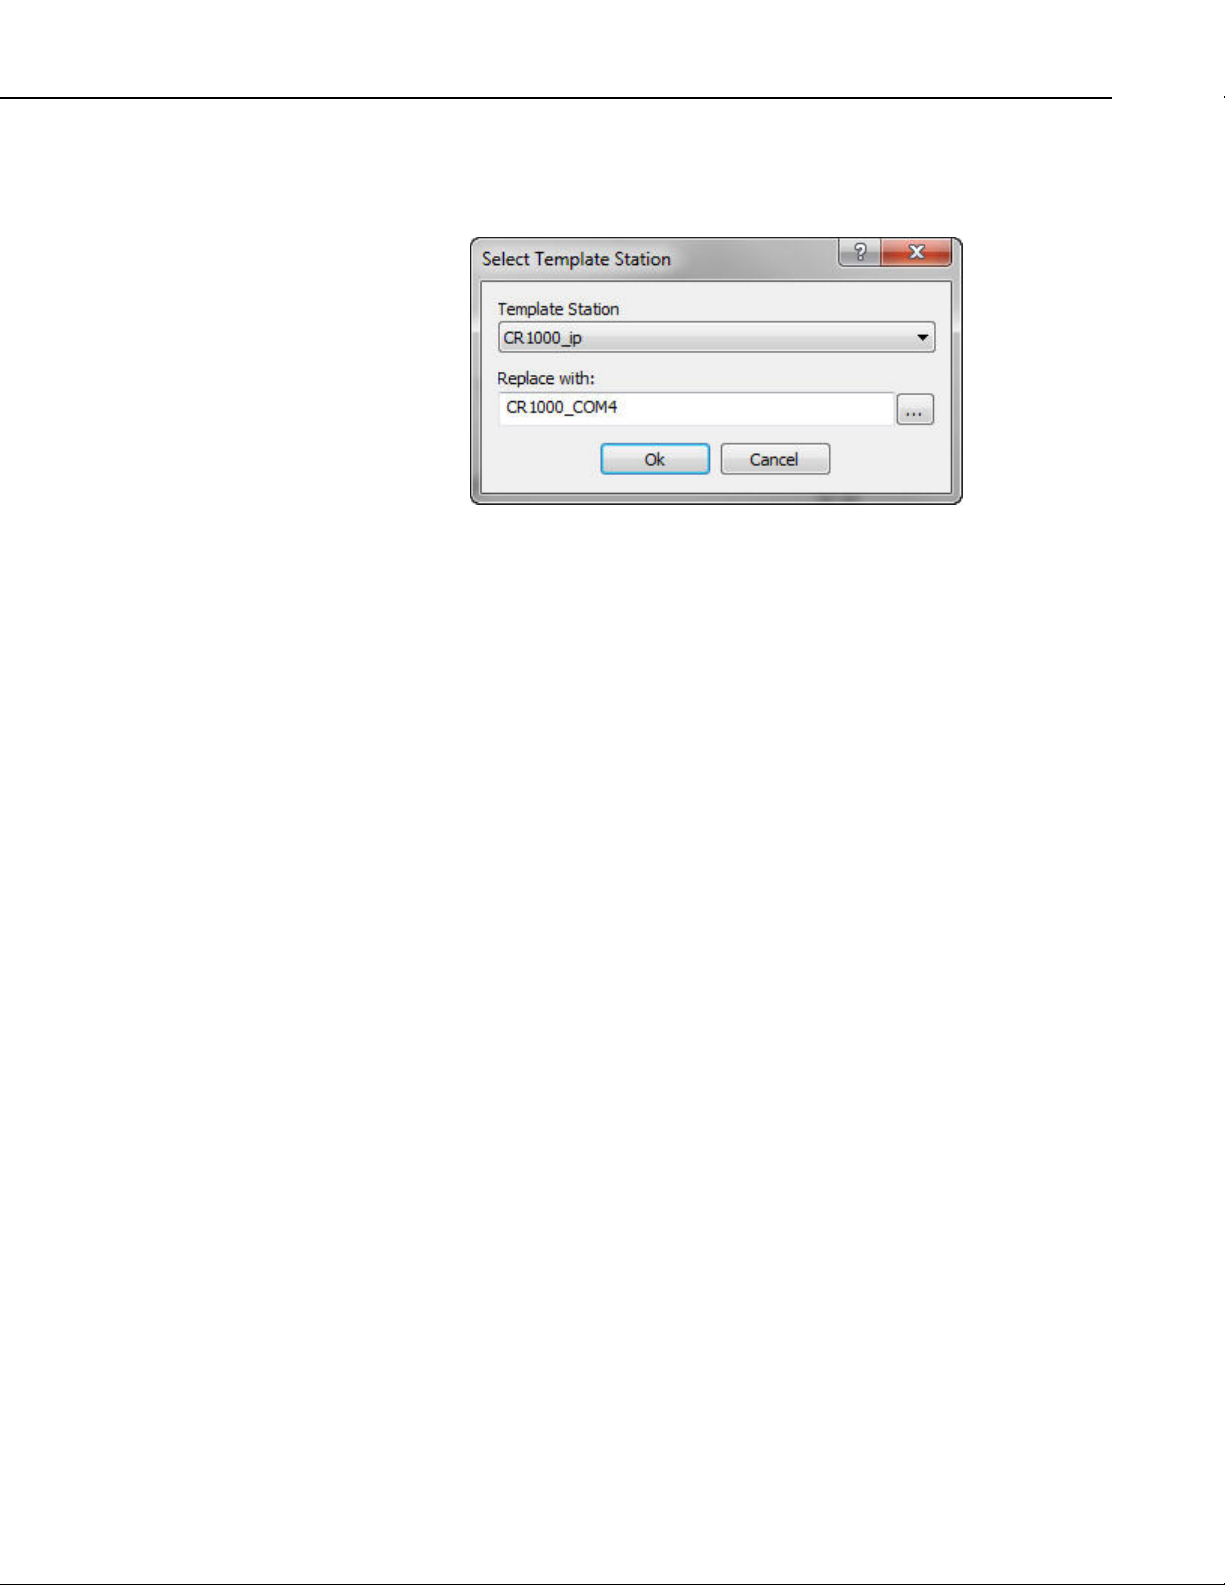
stations. When a project designated as “Load as Template” is loaded in RTMCRT, the following dialog box will appear:
The Template Station drop-down list will contain all of the stations used in
your template project. After selecting a station from the drop-down list, you
can open the Data Source Browser by pressing the button to the right of the
Replace with field. From the Data Source Browser, you can select a station to
replace the template station. Each reference to the template station in the
project will be replaced by the designated station.
Add New Screen adds a new screen to the project. Each screen appears in the
project tree. In run-time mode, each screen appears as a tabbed page on the
display. When the project is run the user can click the tab to bring each screen
to the front.
Change Screen Order allows you to change the order that the screens will
appear. In development mode, this is the project tree order. In run-time mode,
it is the order of tabs, left to right.
Screen Menu
Screen Menu options work with the tabbed screens in the project. The Screen
Menu is also available by right clicking any blank area of the workspace.
Screen Properties brings up the dialog to choose the background image and
color for the current screen.
Delete Screen removes the current screen from the project. If there are
components on the screen, they will also be removed.
Rename Screen brings up a dialog to change the name of the current screen.
This is the name that appears on the screen tab in run-time mode.
Duplicate Screen duplicates the current screen and all of its components on a
new screen.
Paste is a standard editing operation to paste an object from the Windows
clipboard into RTMC Pro.
Insert New brings up a submenu allowing you select one of the components to
insert on the screen. When the component is added to the screen the Properties
window for the new component will come up.
17
Page 24

RTMC Pro
Component Menu
The Component Menu is used to set the component properties, placement and
alignment. The Component Menu is also available by right clicking any of the
components in the workspace. Many of the Component Menu’s items (Align,
Space Evenly, Make Same Width, Center, and Order) are also available from
the Layout Toolbar.
Properties brings up the Properties window for the selected component.
Delete Selection removes the selected component(s) from the workspace.
Lock Aspect Ratio allows you to drag the object to a new size without
distorting the look of the component. If the height of a component is changed,
the width will automatically be changed as well. By default, Lock Aspect
Ratio is off for all components.
Rename Component lets you change the name of the component in the list
tree. If snapshots are configured, this will affect the name of the snapshot.
Manual Resize allows the user to set the size and position of the selected
component.
NOTE
Cut/Copy are standard editing operations to add selected objects to the
Windows clipboard.
Align provides some options for lining up a group of components with the first
component selected. Select two or more components by using the cursor to
click and drag a box around the desired components. Components can also be
selected by selecting the first component and then selecting the other
components while holding down the <ctrl> key. With the components selected
choose one of the alignment options. The components will be aligned based on
the last component selected. The last component is identified by the dark blue
handles. The other selected components have handles with blue outlines.
Be careful about the alignment you choose. Selecting Top Align
for a group of components that are arranged vertically will cause
all the components to end up on top of each other. This can be
fixed by choosing Undo from the Edit menu.
Space Evenly will evenly distribute the selected components horizontally
across or vertically down the page.
Make Same Size allows you to set two or more objects to the same overall
size, width or height as the first object selected. Select one or more
components by using the cursor to click and drag a box around the desired
components. The components can also be selected by selecting the first
component and then selecting the other components while holding down the
<ctrl> key. The last component selected will be the basis on which the other
components are sized. The last component is identified by the dark blue
handles. The other selected components have handles with blue outlines.
18
Center will center the selected component(s) either vertically or horizontally
on the page.
Page 25

RTMC Pro
Order is used to manage the position of graphic objects on the workspace.
This is often referred to as Z order. Displays are often a combination of a
background graphic and data display objects in front. Objects added to the
workspace are, by default, placed on top of any existing objects. These
operations are used to determine the order in which objects are displayed. This
is important when layering transparent objects.
Group Components allows you to group components together. They can then
be moved, copied, ordered, etc. as a single object. Select the components to be
grouped by holding the Ctrl key and clicking the components with the primary
mouse button. Then choose the Group Components item from the Component
menu or the Component right-click menu. You must have at least two
components selected for this menu item to be enabled.
When a component group is selected, the menu item will change to Ungroup
Components. You can undo the grouping by selecting this menu item.
When components are grouped, the properties for each component will show
up as an item in the right-click menu. These menu items can be used to modify
the properties for each component.
Window Menu
If there are multiple screens in the project, Window will allow you to change
between the screens using the menu.
Help Menu
RTMC Pro Development Help provides access to help for all of the features
of RTMC Pro.
Keyboard Map opens a dialog box from which you can print RTMC Pro’s
keyboard shortcuts or copy them to the Windows clipboard.
About RTMC Pro Development provides version and copyright information.
2.4 Expressions
RTMC Pro has a built-in expression interpreter that allows the user to scale the
data or create displays based on calculations of a data point.
Components that display data values either numerically or graphically can be
processed using expressions. These expressions can include simple
mathematical expressions, functions to manipulate strings, or more complex
functions that deal with the state of a data value over time.
For instance, a temperature reading in degrees Celsius can be processed to
display in degrees Fahrenheit using a simple mathematical expression. This is
done by first selecting the data value in the Select Data field, and then entering
the mathematical expression after the defined data value. Using the above
example, if the data value is defined as “Server:CR5000.TempData.Temp1”
(“Source:datalogger.table.variable”), you would enter
“Server:CR5000.TempData.Temp1” * 1.8 + 32
to convert the temperature reading from degrees Celsius to degrees Fahrenheit.
19
Page 26

RTMC Pro
Instead of typing the expression directly into the Select Data field, you can
press the calculator button next to that field to bring up the Expression Builder.
See Section 2.4.12, Expression Builder.
Strings
As shown above, double quotes are used in RTMC to enclose the name of a
data value (or source, datalogger, or table depending on the component).
Therefore, when defining a literal string, a dollar sign is used as a prefix. This
indicates to RTMC that you are defining a literal string rather than a data value.
For example, to search for the position of the sequence abc in the data value
mystring, you would use the following expression:
InStr( 1, “Server:CR1000.hourly.mystring”, $”abc”)
Statistical Functions and Start Options
Expressions can also use Statistical Functions, some of which involve the state
of a data value over a period of time. For instance, you can return the
maximum value of a data value over the past 24 hours using the expression:
MaxRunOverTime(“Server:CR1000.QtrHour.Temp”,Timestamp(“Server:
CR1000.QtrHour.Temp”),nsecPerDay)
When RTMC-RT is launched it begins processing with the newest record by
default. Therefore, using the above expression, a component will not
immediately display the maximum value over the past 24 hours. Rather, it will
display the maximum value since RTMC-RT was launched. The 24-hour
maximum will only be displayed after it has been running for 24 hours. In
order to get a 24 hour maximum immediately, you can use a “Start Option
Function” to cause RTMC to begin processing data at an earlier point. For
example,
StartRelativeToNewest(nsecPerDay,ordercollected);
MaxRunOverTime(“Server:CR1000.QtrHour.Temp”,Timestamp(“Server:
CR1000.QtrHour.Temp”),nsecPerDay)
would begin displaying a 24 hour maximum immediately, provided that the
data is available in the communications server’s data cache.
Aliases
If a data value is used multiple times in an expression, the expression can be
simplified by declaring an alias for the data value at the first of the expression,
in the form:
Alias(alias_name, data_value)
20
Page 27

RTMC Pro
For example,
StartAtOffsetFromNewest(5,OrderCollected);IIF(ABS(("Server:CR1000.MyTa
ble.Value"ValueAtTime("Server:CR1000.MyTable.Value",TimeStamp("Server:CR1000.
MyTable.Value"),30*nsecPerSec,0))>10 AND
ABS(ValueAtTime("Server:CR1000.MyTable.Value",TimeStamp("Server:CR
1000.MyTable.Value"),30*nsecPerSec,0)ValueAtTime("Server:CR1000.MyTable.Value",TimeStamp("Server:CR1000.
MyTable.Value"),60*nsecPerSec,0)))>10,1,0)
can be replaced by:
Alias(X,"Server:CR1000.MyTable.Value");StartAtOffsetFromNewest(5,Order
Collected);IIF((ABS(X-ValueAtTime(X,TimeStamp(X),30*nsecPerSec,0))>10
AND ABS(ValueAtTime(X,TimeStamp(X),30*nsecPerSec,0)ValueAtTime(X,TimeStamp(X),60*nsecPerSec,0)))>10,1,0)
Synchronizing Variables
The ValueSynch function can be used to synchronize data values coming from
multiple data sources so that you can display the results of a calculation on
those data values in a single component. The Value Synch function takes the
form:
NOTE
ValueSynch(synchronized_name, data_value)
Where synchronized_name is the name of a new variable that will be used in a
calculation at the end of the expression and data_value is the name used within
RTMC to access the data value, i.e., Source:datalogger.table.variable.
For example, if you wish to display the average air temperature of two stations
on a chart, the following expression can be used to synchronize the timestamps
of the stations and then calculate the average air temperature:
ValueSynch(air_temp_1,"Server:CR1000_1.SECOND.air_temp");ValueS
ynch(air_temp_2,"Server:CR1000_2.SECOND.air_temp"); (air_temp_1 +
air_temp_2) / 2
Timestamps are truncated to seconds prior to synchronization.
Therefore, synchronizing sub-second data is not recommended as
the results will be unpredictable.
If the timestamps of the stations are not the same (for example, if
one datalogger is a few minutes behind the other), the component
will display the exclamation point indicating no data, until the
data sources have common timestamps and, therefore, can be
synchronized.
RTMC will buffer up to 100,000 points of a data value while
waiting for a common timestamp from the other datalogger(s).
Once the buffer reaches 100,000 data points the oldest data value
will be removed from the buffer, each time a new data value is
collected.
21
Page 28

RTMC Pro
All of the functions available in RTMC are described below. For details on a
function, see RTMC’s online help.
NOTE
NOTE
NOTE
2.4.1 Operators
Spaces must be used to delimit the predefined constants and
functions. Operators allow but do not require spaces.
An expression can include data values from multiple dataloggers.
An expression must include a data value from a data source (i.e.,
LoggerNet server, database, data file, HTTP datalogger, or
virtual data source).
Operator Description
( ) Prioritizes an expression
* Multiply by
/ Divide by
^ Raised to the power of
+ Add
- Subtract/Unary negation
= Equal
<> Not equal
> Greater than
< Less than
>= Greater than or equal to
<= Less than or equal to
22
2.4.2 Order of Precedence
Anything inside parentheses ( )
Exponentiation ^
Negation (unary) -
Multiplication *, division /
Modulo (remainder) MOD
Addition +, subtraction -
When consecutive operators have the same priority, the expression evaluates
from left to right. This means that an expression such as a-b-c is evaluated as
(a-b)-c.
Page 29

2.4.3 Predefined Constants
Constant Description
e 2.718282
PI 3.141593
True -1
False 0
NOPLOT NAN
NAN NAN (not a number)
INF INF (non-finite number)
2.4.4 Predefined Time Constants
These predefined time constants can be useful as a parameter for the Functions
with State, where the interval parameter must be specified in nanoseconds.
RTMC Pro
2.4.5 Functions
Constant
nsecPerUSec Number of nanoseconds in a microsecond
nsecPerMSec Number of nanoseconds in a millisecond
nsecPerSec Number of nanoseconds in a second
nsecPerMin Number of nanoseconds in a minute
nsecPerHour Number of nanoseconds in an hour
nsecPerDay Number of nanoseconds in a day
nsecPerWeek Number of nanoseconds in a week
The following functions show the use and placement of the numbers the
function operates on. The parentheses are not required unless there are two or
more parameter values (e.g., ATN2(y,x)).
Function
ABS(x) Returns the absolute value of a number.
ACOS(x) Returns the arc cosine of a number.
ASIN(x) Returns the arc sine of a number.
ATN(x) Returns the arc tangent of a number.
Description
Description
ATN2(y,x) Returns the arctangent of y/x.
CEILING(x) Rounds a number up to an integer value.
COS(x) Returns the cosine of a number.
COSH(x) Returns the hyperbolic cosine of a number.
CSGN(x) Changes the sign of a number by multiplying by -
1.0.
EXP(x) Returns e raised to a power.
23
Page 30

RTMC Pro
FIX(x) Returns the integer portion of a number. If the
number is a negative, the first negative integer
greater than or equal to the number is returned.
FLOOR(x) Rounds a number down to an integer value.
FRAC(x) Returns the fraction part of a number.
FormatFloat(x,s) Converts a floating point value, x, into a string
with format defined by the format string, s.
FormatFloatL(x,s) Converts a floating point value, x, into a string
with format defined by the format string, s.
Applies any rules associated with the locale of
the computer running RTMC.
INT(x) Returns the integer portion of a number. If the
number is a negative, the first negative integer
less than or equal to the number is returned.
IsFinite(x) Determines if a value is finite.
LN(x) Returns the natural log of a number.
LOG(x) Returns the natural log of a number.
LOG10(x) Returns the logarithm base 10 of a number.
(x)MOD(y) Performs a modulo divide of two numbers.
(x)PWR(y) Raises constant x to the power of y.
RND Generates a random number.
ROUND(x) Rounds a number to a higher or lower integer
ROUND(x,y) Rounds a number to a higher or lower number.
SGN(x) Used to find the sign value of a number (-1, 0, or
SIN(x) Returns the sine of an angle.
SINH(x) Returns the hyperbolic sine of a number.
SQR(x) Returns the square root of a number.
TAN(x) Returns the tangent of an angle.
TANH(x) Returns the hyperbolic tangent of a number.
2.4.6 Logical Functions
The following functions perform logical operations.
(x)AND(y) Performs a logical conjunction on two numbers.
(x)EQV(y) Performs a logical equivalence on two numbers.
value.
1).
24
IIF(x,y,z) Evaluates an expression (x) and returns one value
if true (y), a different value if false (z).
(x)IMP(y) Performs a logical implication on two numbers.
NOT(x) Performs a logical negation on a number.
(x)OR(y) Performs a logical disjunction on two numbers.
Page 31

SelectSwitch Iterates through the set of predicates and values
XOR(x) Performs a logical exclusion on two numbers.
2.4.7 String Functions
The following functions can be used to manipulate strings. See the online help
for information about the parameters required for each function.
RTMC Pro
in the order in which these are specified in its
arguments list. It will return the value associated
with the first predicate that specifies a non-zero
integer value. If no asserting predicate can be
found, the function will return the default_value.
Function
Hex Returns a hexadecimal string representation of an
HexToDec Converts a hexadecimal string to a float or
InStr Finds the location of a string within a string.
InStrRev Finds the location of a string within a string.
Left Returns a substring that is a defined number of
Len Returns the number of bytes in a string.
LTrim Returns a copy of a string with no leading spaces.
Mid Returns a substring that is within a string.
Replace Used to search a string for a substring, and
Right Returns a substring that is a defined number of
Description
expression.
integer.
(Differs from InStr in that it searches from the
end of the string rather than from the start of the
string.)
characters from the left side of the original string.
replace that substring with a different string.
characters from the right side of the original
string.
RTrim Returns a copy of a string with no trailing spaces.
Space Returns a string value that is filled with a defined
number of spaces
StrComp Compares two strings by subtracting the
characters in one string from the characters in
another.
StrReverse Returns a copy of a string with the characters in
reverse order.
Trim Returns a copy of a string with no leading or
trailing spaces.
25
Page 32

RTMC Pro
2.4.8 Conversion Functions
The following functions perform a type conversion on a value. See the online
help for more information.
Function
ToDate Converts a value to a date.
ToFloat Converts a value to a floating point number.
ToInt Converts a value to an integer.
2.4.9 Time Functions
The following functions involve a timestamp or the system time. See the online
help for information about the parameters required for each function.
Function
FormatTime Produces a string that formats a timestamp in the
SetTimestamp Returns the value specified and sets its timestamp
SystemTime Returns the current computer time.
SystemTimeGMT Returns the current GMT (Greenwich Mean
Timestamp Returns the timestamp associated with the record
Description
Description
manner specified.
to the timestamp specified.
Time) system time.
from which a value is derived.
2.4.10 Start Option Functions
The following functions determine when RTMC begins processing data. See
the online help for information about the parameters required for each function.
Function
StartAfterNewest No records are processed until a new record has
StartAtNewest Attempts to start processing at the newest record
StartAtOffsetFromNewest Attempts to start processing with the record at the
StartAtRecord Attempts to start processing at the specified file
StartAtTime Attempts to start processing at the record that is
StartRelativeToNewest Attempts to start processing with the first record
Description
been collected.
in the table.
specified offset back from the newest record in
the table.
mark and record number. If the specified record
cannot be located, it starts processing at the
oldest record in the source table.
closest to the specified timestamp.
whose timestamp is greater than or equal to the
newest record’s timestamp minus the specified
interval.
26
Page 33

Report Offset For RTMC project pages where a Report Range
2.4.11 Statistical Functions
The following functions involve the state of a data value over a period of time.
See the online help for information about the parameters required for each
function.
RTMC Pro
component is present, this function will specify
an offset, in nanoseconds, that will be subtracted
from the report’s start time. This function will
not have an effect in any other context. This
function is useful for a report that contains a
statistical function that requires data from before
the reports start time.
Function
AvgRun Returns a running average of up to the last
AvgRunOverTime Returns the running average of the specified
AvgRunOverTimeWithReset Returns the running average of the specified
AvgSpa Returns the average of the specified values.
Last Stores the specified value and returns the
MaxRun Returns the maximum of all values that it has
MaxRunOverTime Returns the maximum of all values whose
MaxRunOverTimeWithReset Returns the maximum of all values since the
MaxSpa Returns the maximum of the specified values.
MedianRun Returns the median value of up to the last
Description
specified number of values.
value over time.
value since the function was reset.
previous value.
considered.
timestamps are greater than the newest timestamp
minus the specified interval.
function was reset.
specified number of values.
MedianRunOverTime Returns the median value in the set of values
whose timestamps are greater than the newest
timestamp minus the specified interval.
MinRun Returns the minimum of all values that it has
considered.
MinRunOverTime Returns the minimum of all values whose
timestamps are greater than the newest timestamp
minus the specified interval.
MinRunOverTimeWithReset Returns the minimum of all values since the
function was reset.
MinSpa Returns the minimum of the specified values.
27
Page 34
RTMC Pro
2.4.12 Expression Builder
StdDev Returns the standard deviation of up to the last
specified number of values.
StdDevOverTime Returns the standard deviation of the specified
value over time.
StdDevOverTimeWithReset Returns the standard deviation of the specified
value since the function was reset.
Total Returns the total of all values that it has
considered.
TotalOverTime Returns the total of all values whose timestamps
are greater than the newest timestamp minus the
specified interval.
TotalOverTimewithReset Returns the total of all values since the function
was reset.
ValueAtTime Returns the oldest value in a set of values from a
specified time interval.
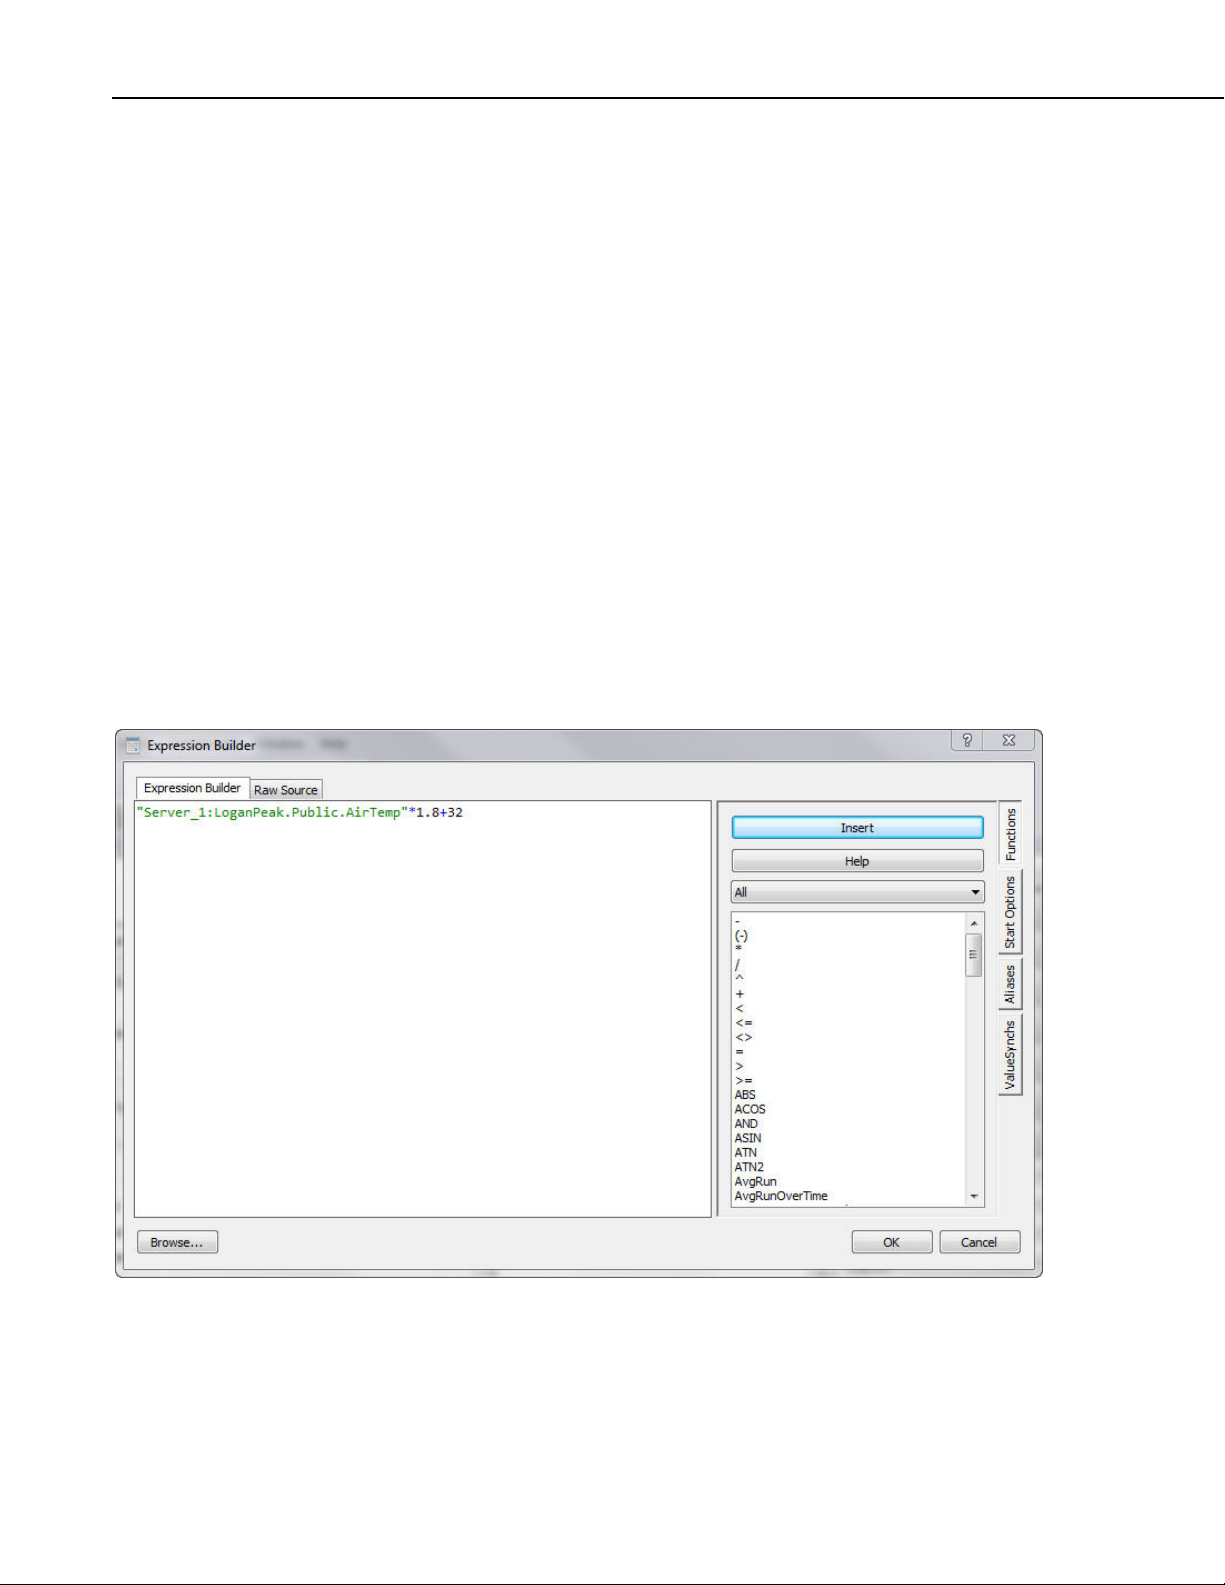
The Expression Builder is opened by pressing the calculator button next to a
Select Data field. It can be used to create complex expressions containing
functions, start options, aliases, and/or valuesynchs.
28
The Expresssion Builder tab is used to build the expression. You can type in
this window directly, press the Browse button at the bottom to browse your
data sources for a data value to be added to the expression, and use the
Functions side tab to add function(s) to the expression. Any errors (i.e.,
undeclared variables, mismatched parenthesis, missing function parameters) in
the Expression Builder tab will be indicated in red.
Page 35
RTMC Pro
The Raw Source tab can be used to view the raw source including the
expression, start option, aliases, and valuesynchs.
NOTE
Edits can be made on either the Expression Builder tab or the Raw Sou
Ctrl-Z or right-click | Undo can be used to undo an
edit.
rce tab.
Functions
Use the Functions side tab to add functions to the expression. Place your
cursor wher
e you want to the function to be added. Then double-click on the
function in the list, select the function and press the Insert button, or select the
function, right-click, and select Insert. The parameters needed by the func
tion
will be shown. You will need to edit these to the desired values.
The predefined time constants (useful as a parameter for the
statistical functions where the interval parameter must be
specified in nanoseconds) and the reset options (used in
statistical functions with a reset) are contained in the function list
for easy insertion into a function.
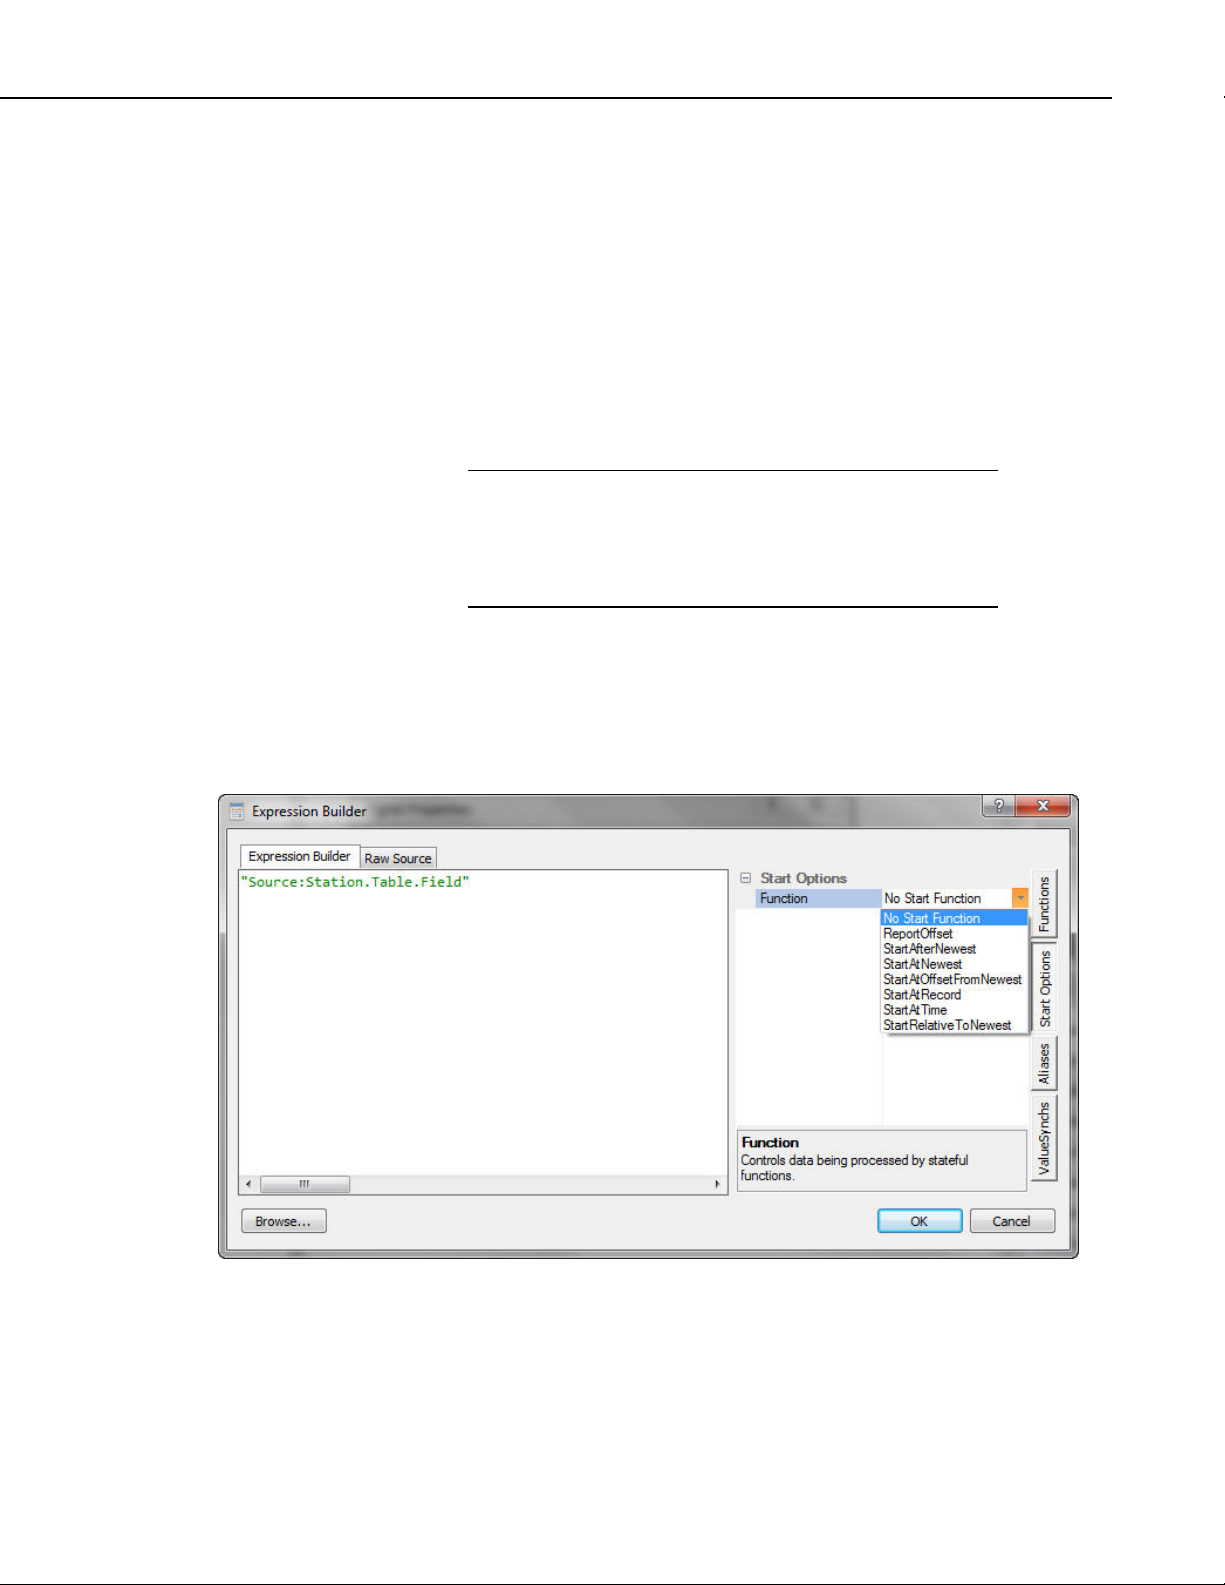
Start Options
Use the Start Options side tab to select a start option function to be used in the
expression. On
ce the Start Options tab has been selected, click on Function
under Start Options. A drop-down arrow will appear that can be used to select
one of the start option functions.
After a start option has been selected, the required parameters will be shown.
Clicking on an order_option parameter provides a drop-down arrow that can be
used to select the desired order option.
29
Page 36

RTMC Pro
Clicking on an interval parameter provides a drop-down arrow that can be used
to select one of the predefined time constants. After selecting one of the
predefined time constants, you can click in the edit box and modify the value.
For example, you can choose nsecPerMin, and then click in the box to modify
this to 30*nsecPerMin. Note that one of the predefined time constants do
es not
have to be used. You can type in an interval directly.
All other parameters must be typed in directly.
Aliases
If a data value is used multiple times in an expression, the expression can be
simplifie
d by declaring an alias for the data value. Use the Aliases tab to
declare aliase(s) to be used in the expression.
On the Aliases side tab, select the New button (
alias and press the Delete button (
) to delete an alias. Use the arrow buttons
) to add an alias. Selec
t an
to move an alias up or down in the list. Selecting an alias and then clicking on
the alias name will allow you to edit the alias nam . Selecting an alias,
clicking on the data value field, rig t-clicking, and choosing Browse… will
h
e
bring up a Data Source Browser window that can be used to browse to the data
value to be aliased.
Once a data value has been aliased, the alias can be used in place of the data
value in the expressi
on as shown below. The alias is inserted into the
expression by typing it directly, double-clicking on the alias, or right-clicking
on the alias and selecting Insert alias_name into expression.
30
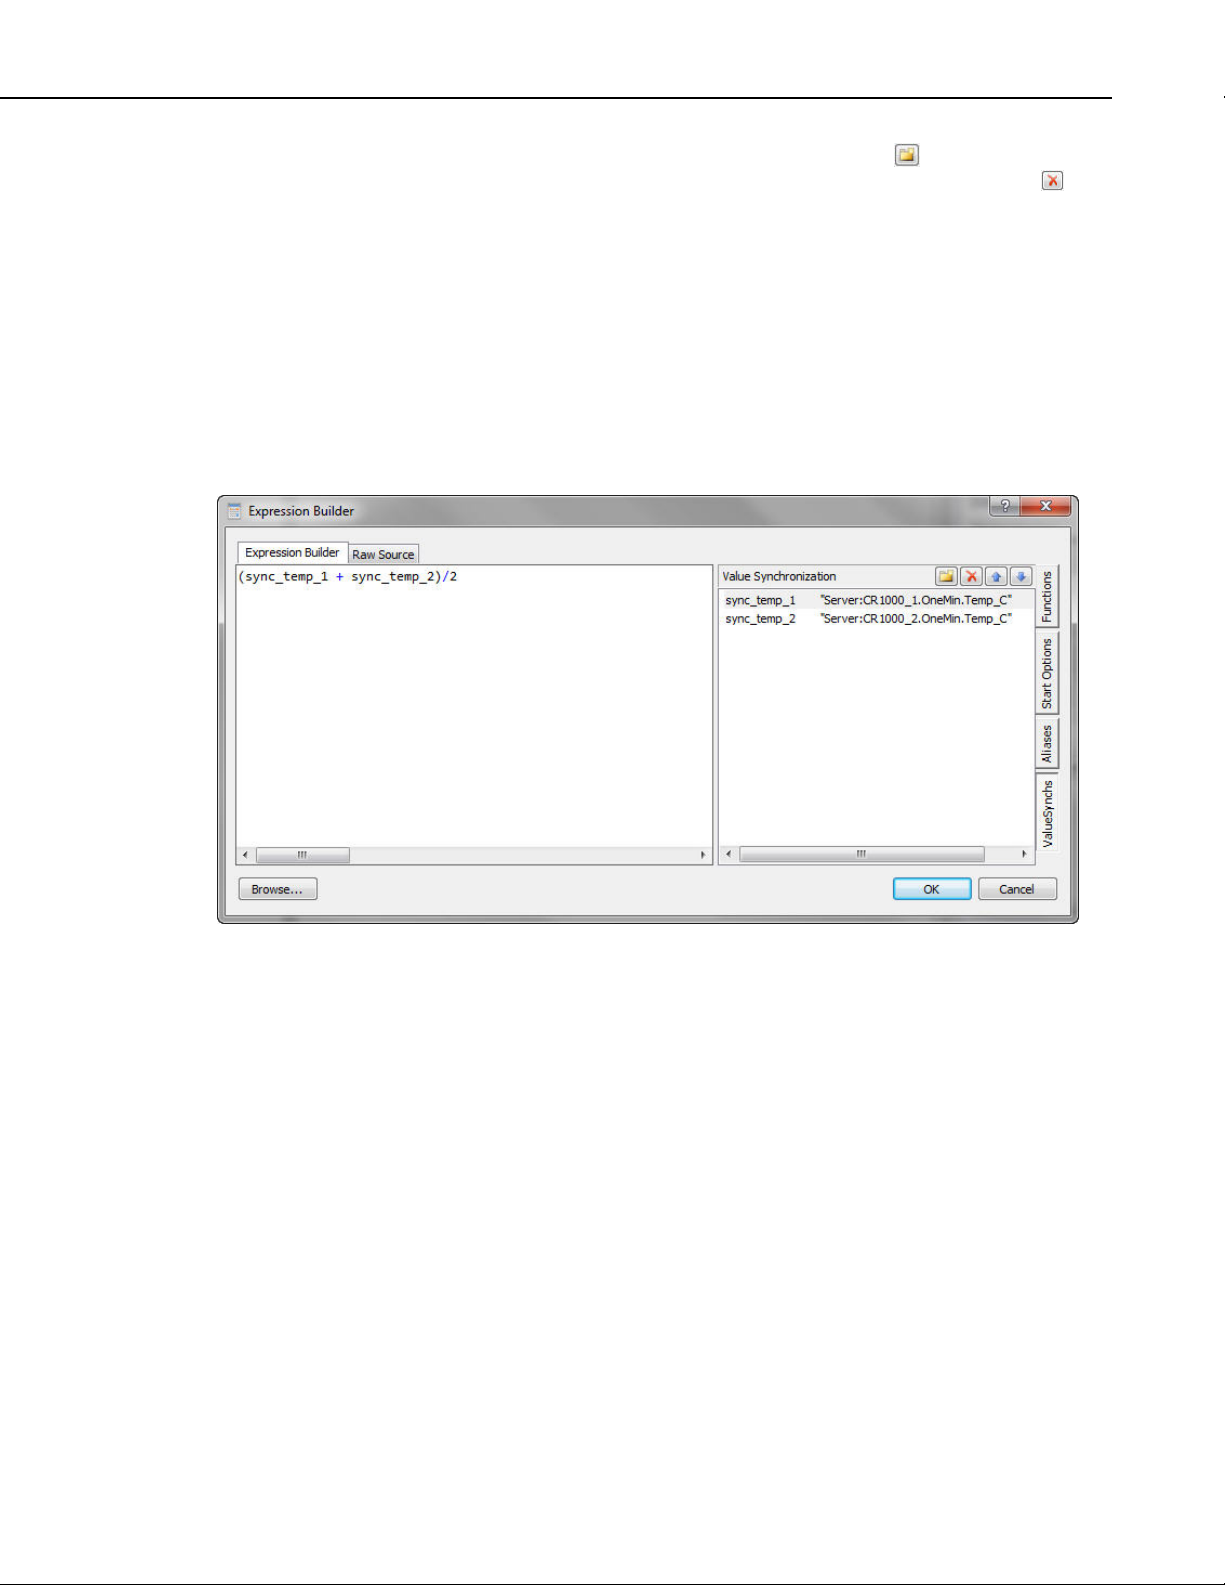
ValueSynch
The ValueSynch function can be used to synchronize data values coming from
multiple data
sources so that you can display the results of a calculation on
those data values in a single component.
Page 37
RTMC Pro
On the ValueSynch side tab, select the New button (
be synchronized. Select a value in the list and press the Delete button (
delete a data value from the ValueSynch. Use to he arrow buttons to move a
value up or down in the list. Selecting a value and then clicking on the variable
name will allow you to edit the variable name. Select g a value, clicking on
the data value field, right-clicking, and choosing Browse… will bring u a
Data Source Browser window that can be used to browse to the data value to
be synchronized.
Once a data value has been added to the ValueSynch, the synchronized
variable name is used in the place of the data value in the expression as shown
below. The synch
typing it directly, double-clicking on the variable, or right-clicking on the
variable and selecting Insert value_sync_name into expression.
ronized variable name is inserted into the expression by
) to add a data value to
) t
in
p
2.5 Managing Data Sources
When RTMC is run from LoggerNet, the Project | Manage Data Sources menu
item allows the user to specify additional communications server(s), data
file(s), databases, HTTP
data sources in RTMC.
datalogger, and virtual data source specified will be added to the Data Source
Browser that is used to select data for RTMC components.
A server, data file, database, HTTP datalogger, or virtual data source can be
added by pressing the Add button, selecting the appropriate option and filling
out the resulting dialog box as described below.
A server, data file, database, HTTP datalogger, or virtual data source can be
removed by selecting it and then pressing the Remove button. The Edit button
can be used to bring up the Server Data Source, F
Data Source, HTTP Datalogger Source, or Virtual Data Source Properties
dialog box and make modifications. Note that if you change the name of a
server, the change will be made to all references to that server in the project.
dataloggers, and/or virtual data sources to be used as
Each communications server, data file, database, HTTP
ile Data Source, Database
31
Page 38

RTMC Pro
If a project contains only one data source, the status bar at the bottom right
the RTMC window will indicate the data source and connection state
(connected or disconnected). If a project contains multiple data sources, the
Status Bar will say Data Source Status. The background will be green if
RTMC is able to connect to all of the data sources and red if there is a problem
with at least one of the data sources. Double-clicking on Data Source
will bring up the Manage Data Sources dialog box. The data source(s) to which
RTMC is having trouble connecting will be indicated with a red X as show
below. You can select the data source from the list, press the Edit button, and
modify the settings so that RTMC is able to connect to the data source.
of
Status
n
32
NOTE
2.5.1 Server Data
When run from RTDAQ, RTMC Pro does not allow you to
specify additional data sources. The only data source is
LocalHost. Therefore, the Project | Manage Data Sources menu
item is not available.
Source
To add a server press the
dialog box will open requiring you to specify the following:
Name
Source
Designates the name that will be used for the communic
the Data Source Browser and on the status bar.
Add button and select Add Server Data Source. A
ations server in
Page 39

RTMC Pro
Server Address
This is the hostname or TCP/IP address of the computer running the
communications server. This must be the valid name of an existing
computer or a TCP/IP address in the form XXX.XXX.XXX.XXX for an
IPv4 add r e s s o r [XXXX:XXXX:XXXX:XXXX:XXXX:XXXX:XXXX:XXXX]
for an IPv6 address. If the software server resides on the same computer
as RTMC, you can simply type in LocalHost for the server address. By
default, LoggerNet’s port number is 6789. If this default port number is
used, it does not need to be specified in RTMC Pro. Otherwise, it is
specified after Server Address, separated by a colon. An example would
be 192.168.4.32:3000, where 3000 is LoggerNet’s port number. Note that
a remote LoggerNet server must have Remote Connection enabled (Tools |
Options | Allow Remote Connections) for RTMC Pro to be able to display
the remote data.
Username
Your username on the communications server.
Password
NOTE
NOTE
NOTE
The Username and Password fields are required only if your
server administrator has enabled security on your system. You
can save the login information by selecting the Remember
username and password check box.
When running RTMC from RTDAQ, the server connection is
always to LocalHost. You cannot change the server address.
If LoggerNet Security is enabled and your project will be
published to the Web using CSI Web Server, you must select the
Remember username and password checkbox. You will not
be prompted for the LoggerNet Security password when viewing
your project from the web. Therefore, if the username and
password have not been saved with the project, you will not be
able to perform any functions that require the username and
password.
2.5.2 File Data Source
Your password for the communications server.
To add a data file press the Add button and select Add File Data Source. A
dialog box will open requiring you to specify the following:
Source Name
Designates the name that will be used for the data file in the Data Source
Browser. By default, the filename is used.
33
Page 40

RTMC Pro
Data File
The data file to be used. Type in the name directly or press the button
the right of the field to browse to the data file.
Label File
This field is used only for data files from array-based dataloggers. The
label file (*.FSL or *.DLD) to be used to provide labels for the data
values. (The *.FSL and *.DLD files are created when a datalogger
program is compiled in Edlog or Short Cut.) Type in the name directly or
press the button to the right of the field to browse to the label file.
Query Interval
Specifies how often RTMC will query the data file for new data. Use the
arrows or ty
Seconds, Minutes, Hours, or Days from the drop-down list.
Back Fill Entire File
When this box is selected, the entire data file will be brought in when
initially queried by RTMC. When this box is no
data to be brought in is specified in the Back Fill Offset field.
Back Fill Offset
pe in a number directly and then choose Milliseconds,
t selected, the amount of
to
Indicates how much data, in KB, will be brought in when the
initially queried by RTMC.
2.5.3 Database Data Sour
To add a database press the Add button and select Add Databa
dialog box will open requiring you to specify the following:
Source Name
Designates the name that will be used for the database in the D
Browser.
Type
The type of database. Choose a type from the drop-down list.
The following database types are supported in RTMC:
L Server Compact
SQ
SQL Server
MySQL
data file is
ce
se Source. A
ata Source
34
Page 41

RTMC Pro
Query Interval
Specifies how often RTMC will query the database for new data. Use the
arrows or type in a number directly and then ch
oose Milliseconds,
Seconds, Minutes, Hours, or Days from the drop-down list.
The remain
ing information changes depending on the database type as
described below:
SQL Server Compact
The only a
database so
dditional information needed for a SQL Server Compact
urce is the database file to be used. Type in the name directly
or press the button to the right of the field to browse to the database file.
SQL Server
35
Page 42

RTMC Pro
To select a SQL Server database source you must select a SQL Server
instance. The list of published SQL Server instances is shown in the Data
Source combo box. You can also type into the Data Source combo box,
because the desired server might not be published. Windows
Authentication or SQL Server Authentication can be selected
. Windows
Authentication does not require a username and password, but rather uses
Windows user accounts to authenticate valid users. SQL Server
Authentication requi
Windows user accounts. You
specific database from th
res a login ID and Password and is independent of
can select the <default> database or select a
e Database combo box.
The Remember username and password checkbox can be selected to
save the username and password. If this check box is not selected and you
are using SQL Server Authentication, you will be required to enter the
username and password each time a project is opened that uses this
database source.
NOTE
NOTE
If you are using Windows Authentication and your project will
be published to the Web using CSI Web Server, you will need to
run the CSI Web Server under a Windows user account that has
rights to access the database. This can be done from the
Windows Control Panel | Administrative Tools | Services. Rightclick on the CSI Web Server item in the list and select
Properties. On the Log On tab, select This account and enter an
account (domain\user) and password for a user with rights to
access the database.
If you are using SQL Server Authentication and your project will
be p
ublished to the Web using CSI Web Server, you must select
the R
emember username and password checkbox. You will
not
be prompted for the SQL Server username and password
when viewing your project from the web. Therefore, if the
user sword have not been saved with the project,
name and pas
you will not be able to perform any functions that require the
username and password.
36
Page 43

MySQL
RTMC Pro
NOTE
The MySQL connection is an ODBC connection. You must use the
Windows ODBC Data Source Administrator to configure the database
connection. Currently only system data sources are supported and show in
the Data Source combo box. The Username and Password may be
optional. They will be set to blank in the connection string. It
found that when set to blank, the login id and password config
ODBC Data Source Administrator are used. You can select th
has been
ured in the
e <default>
database (default as configured in the data source) or select a d
database.
The Remember username and password checkbox can be se
save the username an
d password. If this check box is not selected and the
username and password were not configured in the ODBC Data Source
Administrator, you will be required to enter the username and password
each time a project is opened that uses this database source.
If your project will be published to the Web using CSI Web
Server, you must select the Remember username and
password checkbox. You will not be prompted for the username
and password when viewing your project from the web.
Therefore, if the username and password have not been saved
with the project, you will not be able to perform any functions
that require the username and password.
ifferent
lected to
37
Page 44

RTMC Pro
2.5.4 HTTP Datalogger Source
To add an HTTP datalogger press the Add button and select Add HTTP
Datalogger Source. A dialog box will open requiring you to specify the
following:
Source Name
Designates the name that will be used for the HTTP datalogger in the Data
Source Browser.
Datalogger Web Address
Specifies the IP address of the HTTP datalogger.
Datalogger Web Username
This is the username that should be used when accessing the HTTP
datalogger.
NOTE
Usernames and passwords are controlled by the .csipasswd file
on the datalogger. Device Configuration Utility (DevConfig)
must be used to create a .csipasswd file for a datalogger. The
.csipasswd file is created by connecting to the datalogger in
DevConfig and then pressing the Edit .csipasswd File button on
the Net Services tab.
2.5.5 Virtual Data Sou
The virtual read from
and write to. This is especially useful if you have only database and/or data file
data sources in your project, but you need a place to write variables
in your project. (In server data sources and HTTP datalogger data so
can accomplish the same thing by writing to values in the Public ta
virtual data source table you create is a single record table much like
table. It does not store historic data.
Datalogger Web Password
This is the password for the specified username.
Query Interval
Specifies how often RTMC will query the HTTP datalogger for new data.
Use the arrows or type in a number directly and then choose Milliseconds
Seconds, Minutes, Hours, or Days from the drop-down list.
rce Properties
data source lets you create a custom table that you can
to be used
urces, you
ble.) The
the Public
,
38
Page 45

NOTE
RTMC Pro
The state of virtual variables is saved between RTMC Run-time
sessions. The state of virtual variables is also saved between
sessions, when viewing your project using CSI Web Server. The
state of virtual variables is tracked separately for RTMC Runtime and b Server (i.e., a change made to a virtual
varia Run-time will not affect the value of the
variab
To ad ource press the Add button and select Add Virtual Data
Sour iring you to specify the following:
for CSI We
ble in RTMC
le in CSI Web Server).
d a virtual data s
ce. A dialog box will open requ
Source Name
Designates the name that will
Data Source Browser and on
be used for the virtual data source in the
the status bar.
Output Interval
Specifies how often the virtual data source will report a new record. The
virtual data source will stay on an even interval. When a virtua
source value is set by RTMC, a new record will also be genera
Therefore, if you have an output interval of 1 minute, you will
at 12:00:00, 12:01:00, 12:02:00, etc. However, if you then set
12:02:37, you will have records at 12:00:00, 12:01:00, 12:02:00
12:02:37, 12:03:0
0, 12:04:00, etc.
l data
ted.
get records
a value at
,
Column Name
Clicking on an empty cell in the column name list
will allow you to add
new columns. You can also add a new column by pressing the ‘+’ button
at the bottom of t
he dialog box. To delete a column, select the column and
then press the ‘-‘ button at the bottom of the dialog box. Each column
represents a value in each record generated by the virtual data source.
Default Value
Each column defaults
value to be a fixed val
to a value of 0. You can also initialize the column
ue (e.g., 1234), a string (e.g., $"This is a string"), a
predefined constant (e.g., PI), or a simple expression that does not use
variables (e.g., EXP(5)).
Examples
See RTMC Pro’s online help for examples of using virtual data sources in your
project.
2.6 Reports in RTMC
RTMC supports report generation. In order to designate a screen in your
RTMC project as a report, you must place a Report Range component on it.
The Report Range component lets you configure the data that will be displayed
in the report. It also gives you RTMC Run-time options for stepping through
data as described below. Once you place the Report Range component and
39
Page 46
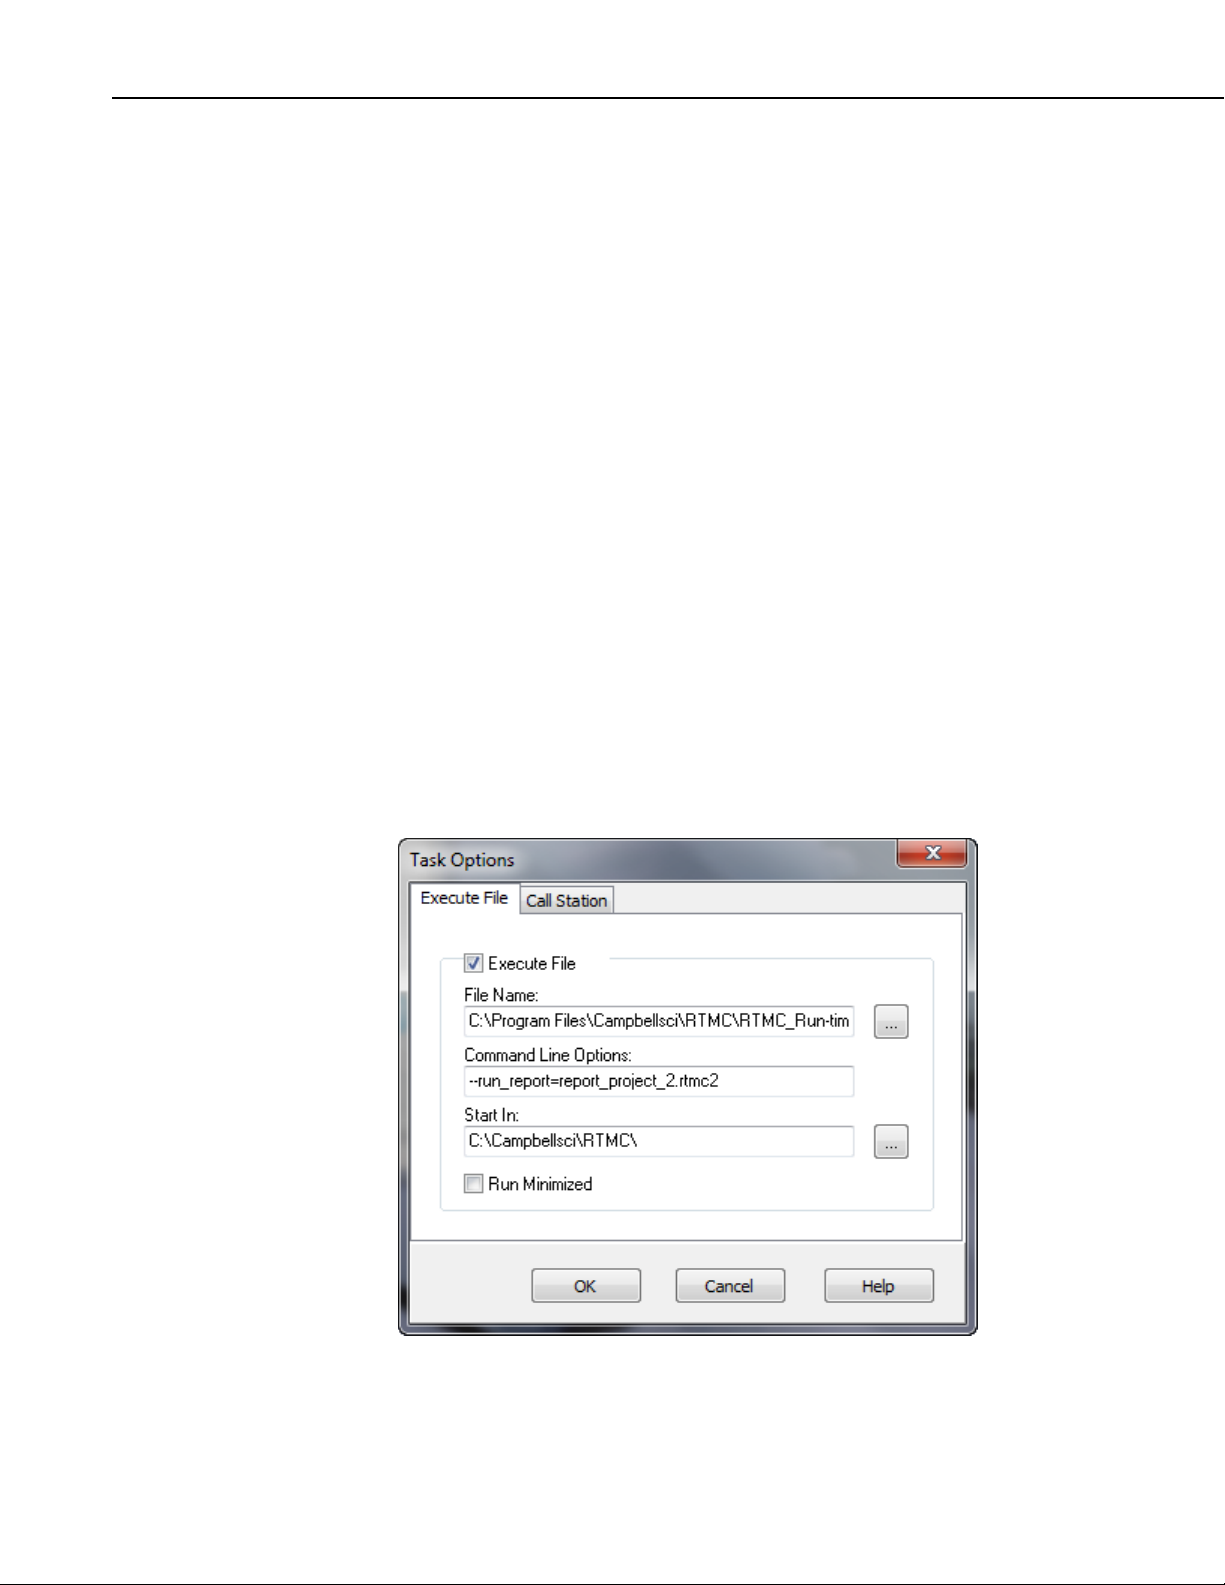
RTMC Pro
specify the range of data for your report, you can start placing the display
components you want in the report.
When you have finished designing your report, you need to specify
want to export it. The Report Export component lets you configure how
report screen will be exported. You can choose to have the report e
running a batch file and/or on demand from RTMC Run-time. For b
export and RTMC Run-time, y
ou can choose from a variety of file formats in
how you
the
xported by
oth batch
which to export the report. You can also select events (Email, FTP, Print) to be
triggered when the report is exported. In a batch export, all of the selected file
formats will be exported and all of the selected events will be triggered when
the batch export is executed as described below. In RTMC Run-time, al
selec and events will be available by clicking on the Report
ted file formats
Expo
rt component.
Onc
e you have your report range defined and export options set up, you are
read bled, you will need to set up a
y to run your report. If batch exporting is ena
batc task that runs the project. In the LoggerNet Task
h file or scheduled
Mas eduled task to execute the file C:\Program
ter, you can set up a sch
Files
\Campbellsci\RTMC\RTMC_Run-time.exe with the command line option
--run
_report="C:\Campbellsci\RTMC\YourProjectFile.rtmc2". When this task
is ru
n, YourProjectFile.rtmc2 will be loaded into RTMC Run-time in the
back
ground. Any report screens set up for batch export will collect data from
the l
ast full interval and the report will be exported in the specified format(s).
For e t
xample, if your report was from midnight to midnight and your task ran a
8:00
am, the report would contain yesterday’s full set of data.
An exam up a report task in the LoggerNet Task Master is shown
belo
ple of setting
w:
l of the
40
Page 47

RTMC Pro
Below is an example of running the same report from a command line:
“C:\Program Files\Campbellsci\RTMC\RTMC_Run-time.exe”
--run_report=“C:\CampbellSci\RTMC\report_project_2.rtmc2”
In addition to setting the range of your report, the Report Range component
also has run-time options for interactive reports. There is a Jump button
(
custom range. There are also Step Forward (
) that will allow you to jump to a specific begin date, end date, or
) and Step Backward ( )
buttons that allow you to step through the data. The step size is determined by
the interval specified in the Report Range component. The Current Interval
) button is also available to jump to the current interval. For example, if
(
you are looking at data from a few days ago in your midnight to midnight
report, and it is currently 8 a.m., clicking the Current Interval button will
display the current data collected from midnight until 8 a.m. and will update as
data becomes available. As soon as midnight is crossed, the report will start
over displaying data from midnight to the current time.
There are two additional report components in RTMC: the Report Note and the
Report Header. The Report Note component allows the user to insert custom
notes at run-time before the report is exported. Notes are temporary and are los
when the report is closed. The Report Header component displays the report
range. The user can customize the dates shown and the format used. In RTMC
Run-time, the header updates as the report range changes.
t
NOTE
NOTE
RTMC projects can mix real-time and reporting screens. For example, you can
have a real-time data screen, a daily report screen, a monthly report screen, and
a real-time control screen all in the same project. The Report Range component
on a screen onl
y affects the data being displayed on that screen. Your real-time
screens (i.e. those without a Report Range component) won't be affected by
stepping through historic data on a report screen.
See RTMC Pro’s online help for an example of a report.
When viewing a report in RTMC Run-time, some components
behave differently than on a normal RTMC screen. If you are
looking at historical data, alarms cannot be acknowledged and
you will not be able to toggle variables or set values with sliders
or setpoints. These functions can only be performed when you
are viewing live data in the current interval. Also, alarm events
(i.e., audio, run/open, send email) are always disabled on a report
screen.
When viewing a report using the CSI Web Server, all report
components will function as described above, except for the
Report Export component. You will only be able to export PNG
files, and export events (Email, FTP, Print) are not supported.
41
Page 48

RTMC Pro
NOTE
When viewing a report using the RTMC WebServer, you will
only be able to look at data for the specified custom range or the
current interval depending on the Report Type chosen in th e
Report Range component. The RTMC WebServer does not
support user interaction. Therefore, you will not be able to
navigate forward and backward through time, insert notes into
e repor
th t, or export the report.
3. RTMC Run-time
RTMC Run-time allows you to run the real-time graphic display screen that
was created in RTMC Pro. In LoggerNet, you can test the operation of the
display screen from the RTMC Pro window using the File | Save and Run
Project menu or clicking the lightning bolt (
the project window with RTMC Run-time as shown in the window below.
) on the toolbar. This will start
42
In RTDAQ, you must launch RTMC Run-time from the RTDAQ tool
then open th
hen the run-time display screen is started, the display components will have
W
n exclamation point in a red box at the upper right until data is received from
a
LoggerNet or RTDAQ. In LoggerNet, if data is not displayed, chec
that the data is being collected. This can be done in the LoggerNet
screen. Click on the appropriate station and then choose the Sched
Also check the Data Files tab to verify the desired table is enab
scheduled collection. Data Collection can also be set up when the project is
developed in RTMC Pro with the Project | Configure Override Scheduled
Collection menu item. In RTDAQ, check to see that RTDAQ is connected to
the datalogger.
e project you have developed in RTMC Pro.
bar, and
k to see
Setup
ule tab.
led for
Page 49

RTMC Pro
Once a project file has been created, the display screen can be run without
starting RTMC Pro. From the Windows Start Menu under Program
Campbell Scientific | RTMC click RTMC Run-time. In the run-tim
select File | Open Project to select the RTMC Pro project screen to
Remember Username and Password was not selected in RTMC Pro
necessary to enter them each time the project is run in RTMC Run-
s |
e window
run. If
, it will be
time.
In run-time mode, you can print a
selecting File | Print Screen. A new form to be run is selected under File |
Open Project.
A copy o
LoggerNet, if you want to run RTMC Pro projects on remote computers,
additional copies of RTMC Run-time can be purchased separately. One copy
is required for each computer on which RTMC Run-time will be used. As
noted above, when running RTMC Run-time on a remote computer, the host
computer must have Remote Connections enabled (LoggerNet Toolbar, Tools |
Options | Allow Remote Connections).
4. CSI Web Server
The CSI Web Server allows you to view your RTMC projects using a web
browser. Included with the CSI Web Server are the CSI Web Server
Administrator and the Web Publisher. The CSI Web Server Administrator
allows you to configure the web server, check the status of the web server, set
up user accounts and passwords, and easily browse to sites running on the web
server. The Web Publisher allows you to publish your RTMC project to either
a PC website using the CSI Web Server or to an HTTP-enabled datalogger.
The diagram below shows the basic steps in creating your web content.
n image of the RTMC display screen by
f RTMC Run-time comes with LoggerNet and RTDAQ. For
Lay Out and Design
Web Pages in
RTMC
Publish Web Files
Datalogger
Web Server
Web Browser Displays
Interactive Web Pages
Using
Web Publisher
CSI
Web Server
43
Page 50

RTMC Pro
NOTE
You first use RTMC to create a project containing the display and/or contro
components that you want to be available from your website. Next, the
Publisher is used to publish the web files. From RTMC Pro, you can press the
Publish to Web button (
project. (The Web Publisher can also be opened from the Windows Start Menu
by selecting Programs | Campbell Scientific | CSI Web Server | Web
Publisher.) From the Web Publisher, you can choose to add a PC Website o
Datalogger Website. After filling in the desired settings, press the Publish
Website button to publish the content.
The CSI Web Server supports the following target browsers at the indic
version or later:
Chrome 10
Firefox 4
Internet Explorer 9
Opera 11
Safari 5
If firewalls ex
Web Server or a web-enabled datalogger) and the target audience
of your website(s), the firewalls will need to be configured to
allow incoming traffic on the port being used by the web server.
(The port used by the CSI Web Server is configured through the
CSI Web Server Administrator. The port used by a web-enabled
datalogger is configured through DevConfig. The default port is
80 for both the CSI Web Server and a web-enabled datalogger.)
See your network administrator for help in configuring the
firewalls.
ist between your web server (i.e., a PC running CSI
) to bring up the Web Publisher and publish your
l
Web
r a
ated
4.1 CSI Web Server Administrator
The CSI Web Server Administrator allows you to configure the web server,
check the status of the web server, set up user accounts and passwords, and
easily browse to sites running on the web server. It can be opened from the
Windows Start Menu by selecting Programs | Campbell Scientific | CSI Web
Server | CsiWebAdmin.)
4.1.1 Status
The Status tab shows the status of the web server and allows you to browse to
sites running on the web server.
If the web server is not running, click on the image to start the web server.
When the web server is running, the version of the web server running will be
displayed. The protocol, port, and status (e.g., Protocol HTTP, port 80, status
Listening) will also be displayed.
A list of sites provided by the web server will be shown. You can click on any
site to browse to that site.
44
Page 51

RTMC Pro
NOTE
4.1.2 Co atio
4.1.2.1 Edit Root Perm
nfigur n
The keys icon (
.csipasswd file for that site. See Section 4.3, Web Security, for more
information about .csipasswd files and how they control users and their website
access rights.
The plus icon (
use the keys icon next to the new remote folder to create the .csipasswd file for
that remote folder before publishing a website to the folder. See Section 4.2
Web Publisher, for information on publi
The trash can icon (
website.
Only sites published to the web server’s root directory and
imm of the root directory will be shown.
ediate subdirectories
Sites blished to deeper subdirectories.
cannot be pu
issions
The Edit Root Permissions button is used to create or edit the root .csi
file. It performs the same function as the keys icon next to Root on
tab, but can be used to edit the root permissions even when the CSI
is not running. See Section 4.3, Web Security, for more informatio
function of the root .csipasswd file.
) next to each site can be used to create or edit the
) next to “Root” creates a new remote folder. You c
shing a website to the remote folder.
) next to each website can be used to remove the
the Status
Web Server
n on the
an then
,
passwd
4.1.2.2 HTTP
4.1.2.3 HTTPS
The HTTP tab controls the root di
used by the CSI Web Server.
HTML Root Directory – The directory that the web server will use to
store/serve web pages, scripts, password files, and source description files.
HTTP Server Port – The TCP Port on which the HTTP server will listen for
unencrypted connections.
web server running on this machine or if your firewall does not allow service
on TCP port 80.
The HTTPS tab can be used to set up the CSI Web Server for encrypted
service. This requires a Private Key File and Certificate File obtained from a
third party Certificate Authority.
HTTPS Enabled – Specifies whether the web server will attempt to offer an
HTTPS (encrypted) service.
Server Name – Specifies the domain name that the server will report when it
redirects requests from an u
if the HTTPS protocol is enabled and the private key and certificate have valid
content. This value should be the Fully Qualified Domain Name (FQDN) for
You may need to change this port if there is already a
rectory and HTTP server port that will be
nsecure link to a secure one. This will only happen
45
Page 52

RTMC Pro
4.1.2.4 Log Control
your web server nd, depending upon firewalls, proxies, and port-forw
a arding
configurations, may be different from the host machine name.
HTTP Server
Port – Specifies the TCP port on which the HTTP server will
listen for unencrypted connections. You may need to change this port if there
is already a web erver running on this machine or if your network or personal
s
firewall do not allow service on TCP port 80.
Private Key File – Specifies the name of the PEM encoded file that contains
the HTTPS private key. The TLS/SSL stack used by the web server supports
only AES128 or AES256 encryption for the private key file.
Private K
ey Password – Specifies the password used to decrypt the TLS/SSL
private key. It will be ignored if a private key is specified that is not encrypted.
Certificate File – Specifies the name of the PEM-encoded file that
contains the
x509 HTTPS certificate.
Log Control tab allows you to configure how log files are maintained by
The
the CSI W
eb Server.
Log File Mode – Controls the way that the web server will write its log files.
Select Disabled to disable log files, New Log on Time Intervals to specify
that a new log file will be started on the time interval specified by the Baling
Interval, or New Log after Max Size to specify that a new log file will be
started after the current log file exceeds the size specified by the Maximum
Log File Size.
Log Files Directory – Specifies the directory in which the web server will
write its log files.
Baling Interval – Specifies th
any one log file when the Log File Mode is set to New Log on Time Inte
e maximum time interval that will be recorded in
rvals.
Maximum Log File Size – Specifies the maximum size (in bytes) that will be
recorded in any one log file when the Log File Mode is set to New Log after
Max Size.
Maximum Log F
will be kept by th
iles Count – Specifies the maximum number of log files that
e web server before the oldest is overwritten.
Log HTTP Headers – Controls whether the web server will write the headers
of HTTP requests and HTTP responses in its log file.
46
Page 53
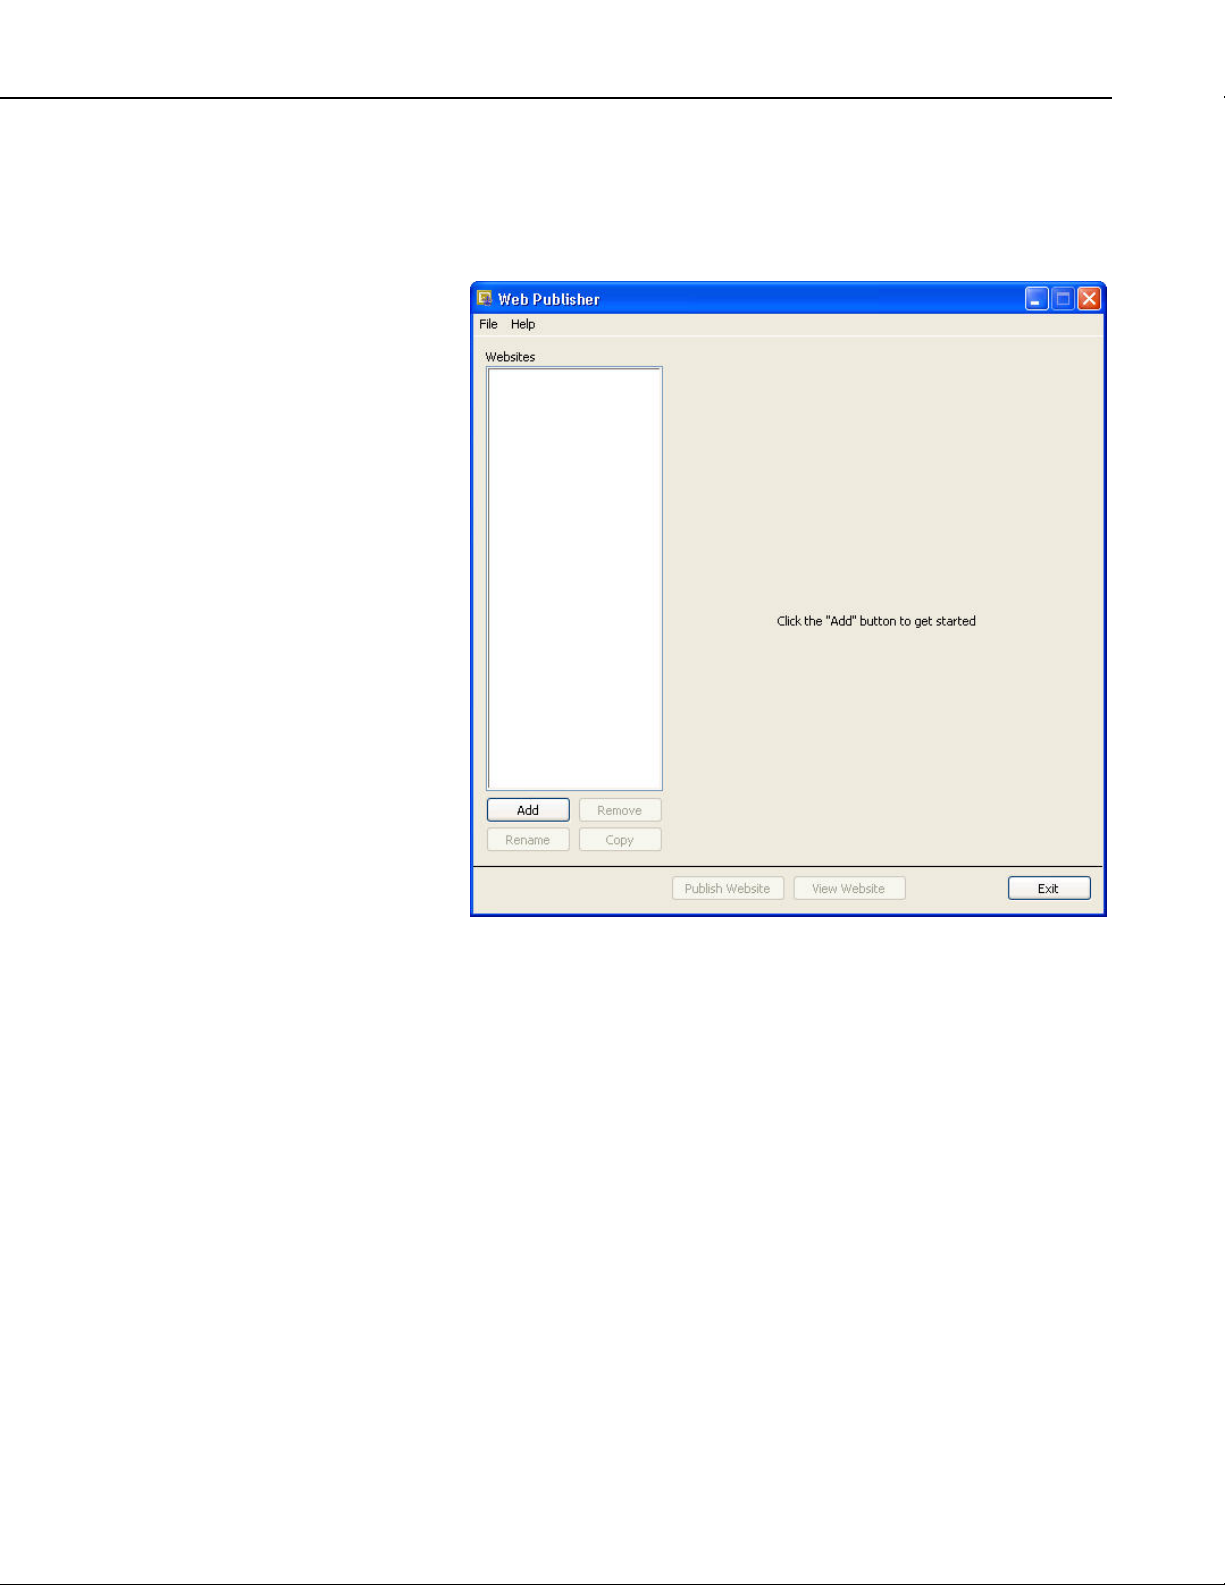
RTMC Pro
4.2 Web Publi
sher
The Web Publisher allows you to publish your RTMC project to the web. In
addition, the Web Publisher has display settings that allow you to show other
tabs such as data browsing and network status.
The Web Publisher supports two kinds of websites: PC websites and
Datalogger websites.
PC Website - PC websites run on the CSI Web Server. The CSI Web Server
supports any number of websites and lets you control user access rights for
each website. PC websites support all of the different data sources supported
by RTMC (LoggerNet, Data File, Database, HTTP Datalogger, and Virtual
Data Sources).
Datalogger Website - Datalogger websites are websites being run on a
compatible datalogger like the CR800, CR1000, and CR
websites must be designed by RTMC Pro and can only have one data source.
The data source must be an HTTP Datalogger Source.
3000. Datalogger
47
Page 54

RTMC Pro
4.2.1 Creating Websites
To create a website, press the Add button and select either Add PC Website o
Add Datalogger Website. Fill in the settings as described below. After filling in
the desired settings, press the Publish Website but
ton to publish the content.
r
Web Server Settings
Host Address - Specifies the address where you will be publishing your
website. The address can be a domain name or IP address in the form
XXX.XXX.XXX.XXX for an IPv4 address or
[XXXX:XXXX:XXXX:XXXX:XXXX:XXXX:XXXX:XXXX] for an IPv6
address. If you are using a port other than the default port 80, you need to
specify it using a
campbellsci.com:8080, 192.168.1.1:1234, or
[2620:24:8080:8600:85a1:fcf2:2172:11bf]:8080. (Note that IPv6 address
not be supported in dataloggers, until a future OS release for the
CR1000/CR3000/CR800 series dataloggers. Therefore, they cannot be used
for datalogger websites until that time. Check the OS re
website to determine when IPv6 support is added to the OS.)
Root User ID - In order to publish a website, a root-level user must be created.
The CSI Web Server Administrator is used to do this for the CSI Web Server.
Device Configuration Utility (DevConfig) is used to do this for a datalogger
web server. The .csipasswd file that is created controls user accounts and
passwords that will be able to publish projects to the web server. In order to
publish, a user account needs to be assigned an access level of “all”. This user
colon followed by the port. For example,
es will
vision history on our
48
Page 55

RTMC Pro
account with “all” access is called the Root User ID. For more information on
security, see Section 4.3, Web Security.
Root Password – The root password is the password associated with the root
user ID that has been given “all” access to publish websites to the web server.
Remote Folder – The remote folder controls where a website will be published
relative to the web server’s root directory. By default, the CSI Web Server’s
root directory is C:\Campbellsci\CsiWebServer. It can be changed from the
CSI Web Server Administrator. On the CSI Web Server, you can create as
many websites and folders as you want. Each remote folder must be directly
below the web server’s root directory (i.e., you cannot publish to
remote_folder\subdirectory). On a datalogger web server, you are limited on
which folders you have available. Currently you can specify /CPU/, /USR/, or
/CRD/, if these directories are available. Clicking on the Remote Folder dropdown list will show you which folders are currently available.
Website Settings
Send new password file – If a website has been previously created and user
rights set up, you may or may not want to overwrite the existing password file
for that website.
Edit Password File - Brings up the website .csipasswd file editor. This file is
used by the web server to manage user access to the website. On datalogger
websites, the .csipasswd file is always placed in the /CPU/ drive automatically.
Hide the password file – (This check box only applies to datalogger websites.)
The .csipasswd file can optionally be hidden on datalogger web servers. Hiding
the .csipasswd file is a security measure that will help protect access to user
names and passwords. Once the .csipasswd file is hidden, it will no longer
show up in the file system. Republishing the website with this option disabled
will cause the .csipasswd file to show up again.
Edit Tracker Code - T
access. All tracker codes a
racker codes can optionally be inserted to track website
re inserted into a <script> </script> block and are
automatically inserted in each page of your website. Google Analytics™ web
analytics service
and many other tracking services are available for free. T
available services range from simple hit counters to enterprise-class web
he
analytic solutions.
RTMC Settings
Project File - The RTMC project file (*.RTMC2) that will be used to generate
the website. PC websites support all of the available data sources. Datalogger
websites require an RTMC project that only contains one HTTP datalogger
source. When publishing a website, all of the screens, images, and required
files are compiled together and automatically copied to the web server.
Note that when publishing to a datalogger website, the HTTP datalogger source
in your RTMC project does not need to be specific to the datalogger that the
website is published to (e.g., an RTMC project with an HTTP datalogger
source at 192.168.4.14 can be published to a datalogger with an IP address of
192.168.9.99). This allows you to create one RTMC project that can be
published to multiple datalogger websites.
49
Page 56

RTMC Pro
Default Poll Interval - When accessing a website from an Internet browser,
data is polled. This means that we have to ask the web server if it has any new
data to be displayed. The default poll interval is set to 10 seconds. If you are
displaying slower data, you should change this setting to match your data
interval. If you have really fast data, you will have to do some testing to find an
acceptable poll interval. There are many factors that affect how fast data will
be able to be polled, including the number of users viewing the page, the
number of dataloggers being polled, the size of data tables in the dataloggers,
the resources available to the web server, the internet browser resources,
connection bandwidth, etc.
Display Settings
Hide Navigation Tabs - By default, websites will be displayed with navigation
tabs at the top of the web page. These tabs allow users to navigate your
website. You can disable these tabs and implement your own na
vigation
system using Hot Spots in RTMC Pro.
Show data browse tab - The show data browse tab option will display a
Browse Data tab on your website. This tab allows you to view data from all o
f
your data sources.
It also provides a mechanism to do custom data queries. Custom data queries
let you download data files or view data directly in the browser. Each table in
the Browse Data tab will have a Custom link next to the table name. Click o
n
the link to open the Custom Data Query window and perform a custom data
query. (See the DataQuery command in Section 4.4, API Commands, for
information on the Date Query Modes available on the Custom Data Query
screen.)
Show file browse tab – (This check box only applies to datalogger website
s.)
The show file browse tab option will display a Browse Files tab on a
datalogger web server. The file browser allows yo
u to traverse the file system
of the datalogger. Each folder is displayed with a link as well as some
information about the size of the folder and when the folder was last written to.
When clicking on a folder, you will see a list of all the visible files in the
directory. Each file is a link, so you can click on the file and view it or
download it. The size of the file and last-write time are also displayed. Clicking
on the [..] link will take you back to the root directory list of the datalogger file
system.
Show datalogger
status tab - (This check box only applies to datalogger
websites.) The show datalogger status tab option will display a Datalogger
Status tab on your website that allows you to view the datalogger status. This
includes datalogger information, program information, battery information, and
card information.
Show network status tab - (This check box only applies to PC websites
.) The
show network status tab option will display a Network Status tab on your
website that allows you to see all of your data sources used by the current
website. Databases and Data File sources don't currently display any status
information. LoggerNet data sources and HTTP Datalogger Sources displa
y a
link. When LoggerNet data sources are clicked, all of the stations in the
LoggerNet network are displayed with their collection statistics. When an
HTTP Datalogger Source is clicked, you se
e the datalogger status information.
50
Page 57

RTMC Pro
4.2.2 Managing W
4.3 Web Secu
ebsites
To remove a website, select the website in the Websites list and press the
Remove button.
To rename a website, select the website in the Websites list and press the
Rename button.
The settings from the website that is currently selected in the Websites lis
be copied to a new website by pressing the Copy button. This can be useful
when multiple websites will have similar settings, such as when you want to
publish the same R
The website that is currently selected in the Websites list can be viewed in a
web browser by pressing the View Website button.
TMC project to multiple dataloggers.
t can
rity
Users and their website access rights are controlled through .csipasswd file
Note that .csipasswd files control access to websites as well as direct access to
data sources and dat
4.4, API Commands.
Each user can be given one of the following access levels:
aloggers using the API commands described in Section
s.
4.3.1 PC Websites
None – No access is allowed. The account is disabled.
Read Only – Allowed to view data. No values can be changed.
Read/Write – Allowed to view data, make changes to writeable values in
a datalogger’s Public or Status table or a virtual data source, and set a
datalogger’s clock.
All – Allowed to view data, make changes to writeable values in a
datalogger’s Public or Status table or a virtual data source, set a
datalogger’s clock, use the API FileControl command, and publish
websites.
In order to publish a website to the CSI Web Server, a .csipasswd file must
created. The root directory and each remote folder under the root directory c
have its own .csipasswd file. This .csipasswd file controls the user accounts
and passwords that will be able to publish projects to that directory and
controls user access to websites in that directory. In order to publish, a user
account needs to be
If a remote folder does not have its own .csipasswd file, the root .csipasswd file
will be used.
assigned an access level of “all”.
be
an
51
Page 58

RTMC Pro
For PC Websites, there is a default .csipasswd file which includes two users:
Username: admin
Password: a
dmin
Access Level: All
4.3.1.1 Using the CSI
Username: a
nonymous
Password:
Access Level: Read Only
If a root .csipasswd file has not been created, this default .csipasswd file will b
used for the root directory and any remote folder that does
not include its own
.csipasswd file,
The CSI Web Server Administrator is the preferred m
ethod of creating and
editing .csipasswd files. They can also be created and edited from the Web
her. Both methods are described below.
Publis
Web Server Administrator
e
52
To create the .csipasswd file in the root directory, press the keys icon next to
“Root”. To create a .csipasswd file for a new remote folder press the + icon
next to “Root”, enter a name for the site, and press Add Subdirectory. Once the
new subdirectory appears under “Root”, press the keys icon next to the
subdirectory t
o create the .csipasswd file for that subdirectory. The key icons
can also be used later to edit the .csipasswd files.
Page 59

RTMC Pro
The .csipasswd File Editor dialog box that is opened when the keys icon is
pressed has the following fields:
Realm - The name given to this realm. (A realm is a collection of user names
and their access levels.) The name will be used in the prompt the browser
displays when asking the user for a user name and password.
User Names - Shows the users that are currently defined in this realm. Press
Add User to add a new user. Select a user name in the list and press Delete
User to remove that user.
Password – The password for the selected user.
Access Level – Sets the access level for the selected user.
None – No access is allowed. The account is disabled.
Read Only – Allowed to view data. No values
can be changed.
Read/Write – Allowed to view data, make changes to writeable values in
a datalogger’s Public or Status table or a virtual data source, and set a
datalogger’s clock.
53
Page 60

RTMC Pro
4.3.1.2 Using the Web Publisher
All – Allowed to view data, make changes to writeable values in a
datalogger’s Public or Status table or a virtual data source, set a
datalogger’s clock, use the API FileControl command, and publish
websites.
After defining the desired user names and access levels, press Apply to apply
the changes. You can also press Cancel to discard the changes. Press Read
file to read a .csipasswd file into the Website .csipasswd File Editor. Press
Save File to save the contents of the Website .csipasswd File Editor to a
.csipasswd file.
To create or edit a .csipasswd file from the Web Publisher, select a website
from the Websites list. You will be creating or editing the .csipasswd file for
the subdirectory shown in Remote Folder. If the Remote Folder field is blank,
the website is being published to the root directory and you will be editing or
creating the root .csipasswd file. Select the Send new password file check box
and then press the Edit Password File button to bring up the Website
.csipasswd File Editor. Define the user names and access levels you want to
be available for this website and press the OK button. Press the Publish
Website button to publish the website and send the new password file.
NOTE
4.3.2 Datalogger W
If you are creating a root .csipasswd file from the Web Publisher,
you will need to enter the default admin user ID and password
described above in the User ID and Password field to publish the
website and send the new password file. When the website is
published again in the future, you will use an “all” access level
user ID and password from the root .csipasswd file to publish to
the root directory.
If you are creating a .csipasswd file for a remote folder from the
Web Publisher, you will need to enter an “all” access level user
ID and password from the root .csipasswd file (or the default
admin user ID and password des
.csipasswd file) to publish the website and send the new
password file. When the website is published again in the future,
you will use an “all” access level user ID and password from the
remote folder’s .csipasswd file to publish to the remote folder.
cribed above if there is no root
ebsites
Device Configuration Utili
.csipasswd file for a datalogger. The .csipasswd f
the datalogger in DevConfig and then pressing th
on the Net Services tab. Define the user names and access l
be available and press the Apply button. Pressing the Apply
file t
o the datalogger.
ty (DevConfig) must be used to create the initial
ile is created by connecting to
e Edit .csipasswd File button
evels you want to
button sends the
54
Onc from the
e a .csipasswd file resides on the datalogger, it can be overwritten
Web Select
Publisher. Select the datalogger website from the Websites list.
the S
end new password file check box and then press the Edit Password File
butto
n to bring up the Website .csipasswd File Editor. Define the user names
Page 61

RTMC Pro
access levels you want to be available and press the OK button. Pres
and s the
lish Website button to publish the website and send the new passwo
Pub rd file.
n you press
Whe the OK button on the Website .csipasswd File Editor dialog
box in Web Publisher, this file is stored to your computer. When you press the
Publish Website button, this file will be sent to the datalogger and will
overwrite the current .csipasswd file. Note that when you press the Edit
Password File button, you are editing the file stored on your computer, not th
one stored on the datalogger. This file does not contain any changes made
using DevConfig. T
from DevConfig, they will be overwritten when you press the Publish Website
button.
herefore, if you have made changes to the .csipasswd file
e
4.4 API Comm
ands
The CSI Web Server supports an HTTP API interface for accessing data from
data sources defined in the RTMC projects running on the web server. These
commands can also be used to access data from CR800, CR1000, and CR3000
dataloggers directly. The CGI-style request syntax is designed to be flexible
and easy to use.
4.4.1 Command Syntax
Syntax for the commands sent to the web server generally follows
URL?command=CommandName&uri=DataSource&argumen
The DataSource = source_name:station_name.table_name.field_na
For example, S
The station_name applies only to LoggerNet Server data sources. If t
field_name is not specified, all of the fields in the table will be outp
field_name refers to an array without a subscript, all of the values a
with that array will be output.
Arguments are appended to the command string using an ampersan
commands have optional arguments, where omitting the argument resul
default being used. When applicable, optional arguments and the
noted in the descriptions below.
the form of:
ts
me
erver:CR1000:onemin.TempF
he
ut. If the
ssociated
d (&). Some
ts in a
ir defaults are
4.4.2 Data Access
Some comma
These are described below where applicable.
nds return a response code indicating the result of the command.
Commands
DataQuery
DataQuery allows a web client to poll a data source or datalogger for data. The
command returns one or more fields, or one or more records, from a table in
the data source or datalogger. DataQuery has the following parts:
URI The URI specifies the data source for the query.
55
Page 62

RTMC Pro
When querying through the CSI Web Server, that data source
is specified as
source_name:station_name.table_name.field_name. (Note the
station_name applies only to LoggerNet Server data sources.)
For example, the data source for the PTemp field in a
CR1000's Public table in a LoggerNet Server data source
would be:
Uri=Server:CR1000.Public.PTemp
When querying the datalogger directly, the data source is
specified as table_name.field_name. For example, the data
source for the PTemp field in a datalogger's Public table would
be:
Uri=Public.PTemp
Note that field_name is optional. If omitted, all values in the
table will be returned.
Mode T
he Mode specifies the timeframe for the data to be returned.
Valid options are:
most-recent – Returns the data from the most recent number of
records. The number of records is specified by P1.
since-time – Returns all the data since a certain time. T
he time
is specified by P1.
since-record – Returns all the records since a certain record
number. The record number is spec
ified using P1.
data-range – Returns the data in a certain date range. The
range is specified using P1 and P2.
Backfill – Retu
rns all the data that has been stored since a
certain time interval (for instance, all the data since 1 hour
ago). The interval is specified using P1.
P1/P2 P1 and P2 are used to set the time parameters for Mode:
most-recent – The maximum number of records to return.
since-time – The start time for
the data. Format = YYYY-MM-
DD T:HH:MM:SS.MS. Time (T) is optional; if only the date is
cified, Time is assumed as midnight. When specifying time,
spe
is optional.
MS
since-record – The starting record number.
data-range – The start time (P1) and end time (P2) for the data.
Format = YYYY-MM-DD THH:MM:SS.MS. Time (T) is
optional. If only the date is specified, Time is assu
med as
midnight. When specifying time, MS is optional.
date
56
Page 63

RTMC Pro
Backfill – The interval, in seconds, for the backfill (e.g., 3600
would be 1 hou
r).
NOTE
Format
The Format is the format in which to return the data. Options
are HTML, JSON, TOA5, TOB1, XML.
If a value of js ied for the format parameter and the
web server has server may
choose to break ecifying a
value of true fo
set to true, the
on is specif
a large data set to send, the web
the data into multiple requests by sp
r the more flag in the JSON output. If this flag is
user will need to send another request to get the
additional data.
Examples
CSI Web Server
es, you are accessing data tIn these exampl hrough the CSI Web Server at
address 192.168.4.14. The RTMC project is published to the remote folder
Weathe
• To return the t
r.
OneMin tab
hree most recent values from the PTemp variable in the
le of the CR1000 in the LoggerNet server data source:
http://192.1
nemin.ptem
68.4.14/weather/?command=dataquery&uri=Server:CR1000.o
p&format=html&mode=most-recent&p1=3
• To return all valu
CR1000_O
es since Oct 1, 2011, of the TempF variable in the
neMin table of the Database data source:
http://192.1
_OneMin.T
• To return a pF
variable in t
68.4.14/weather/?command=dataquery&uri=Database:CR1000
empF&format=html&mode=since-time&p1=2011-10-01
ll values between Sept 1, 2011, and Oct 1, 2011, of the Tem
he OneMin table of the DataFile data source:
http://192.1 ri=DataFile:OneMin.
Tem rmat=html&mode= date-range&p1=2011-09-01&p2=2011
68.4.14/weather/?command=dataquery&u
pF&fo -10-
01
• To return al
variable in t
l values since Oct 1, 2011, at 10:00 a.m. from the PTemp
he OneMin table of the CR1000 in the LoggerNet server data
source:
http://192.1
nemin.ptem &mode=since-time&p1=2011-1001T10:00:0
Datalogger
In these exampl 5.
68.4.14/weahter/?command=dataquery&uri=Server:CR1000.o
p &format=html
0
es, you are directly accessing the datalogger at 192.168.12.5
• To return all re table of
the datalogg at 192.168.12.55:
cords since record 14400 of TempF in the OneMin
er
57
Page 64

RTMC Pro
http://192.1 =dataquery&uri=OneMin.TempF&format
68.12.55/?command
=html&mode=since-record&p1=14400
• To return a
ll records since one hour ago:
http://192.168.12.55/?command=dataquery&uri=OneMin.Tem
pF&format
=html&mode=backfill&p1=3600
BrowseSymbols
The BrowseSymbols command is used to return all the sources in an
project, all the st
ations in a server data source, all the tables in a datalogger or
RTMC
database, all the fields in a table, or all the elements of an array. It has the
following p
URI T
arts:
he URI specifies the name of the parent element for which to
return the BrowseSymbol information. The format is
source_name:station_name.table_name.field_name.
Format
The Format is the file format for the result of the command.
Options are: HTML, JSON, or XML. The following
information is returned:
Return Description
Name The name of the child element in the
datalogger.
URI The URI of the child elem
ent.
Type The type of the element. 1 = LoggerNet Data
Source, 2 = Data File Data Source, 3 =
Database Data Source, 9 = HTTP Data Source,
4 = LoggerNet Station, 5 = LoggerNet
Statistics Broker, 6 = Table, 7 =
Array, 8 =
Scalar
Is_enabled Boolean value which indicates whether the
element is enabled for scheduled data
collection (relevant only to LoggerNet data
sources).
Is_read_only Boolean value which indicates whether the
element is read-only. If not read-only, the
element can be changed using SetValueEx.
n_expand Boolean value that indicates whether the
Ca
element has child elements.
58
Page 65

Examples
RTMC Pro
CSI Web Server
In these examples, you are accessing data thro
addre
ss 192.168.4.14. The RTMC project is published to the remote folder
ugh the CSI Web Server at
Weather.
• To return all data sources in a project:
http://192.168.4.14/weather/?command=browsesymbols&format=html
• To return all stations in the LoggerNet server data source:
http://192.16
8.4.14/weather/?command=browsesymbols&uri=Server&for
mat=html
• To return a data
ll tables of the CR1000 station in the LoggerNet server
source:
://192.1 1
http 68.4.14/weather/?command=browsesymbols&uri=Server:CR
000&forma
• To return all fi 000 station in the
LoggerNet
t=html
elds of the Public table of the CR1
server data source:
http://192.1 /weathe ver:CR1
68.4.14 r/?command=browsesymbols&uri=Ser
000.Public&format=html
• To return a ents in th f the CR1000
ll elem e Flag array in the Public table o
station in the LoggerNet server data source:
http://192.168.4.14/weathe
000.Public.Flag&format=h
• To return all tables of the D
r/?command=browsesymbols&uri=Server:CR1
tml
atabase data source:
http://192.168.4.14/weather/?command=browsesymbols&uri=Database&f
ormat=htm
• To return all fields of the C
l
R1000_OneMin table of the Database data
source:
http://192.1 C
R1000_OneMin&format=h
• To return all fi On
68.4.14/weather/?command=browsesymbols&uri=Database:
tml
elds of the eMin table of the DataFile data source:
http://192.168.4.14/weathe uri=DataFile:On
r/?command=browsesymbols&
eMin&format=html
59
Page 66

RTMC Pro
Datalogger
In these examples, you are directly accessing the datalogger at 192.168.12.55.
• To return all tables in a datalogger:
92.168.12.55/?command=browsesymbols&format=html
http://1
• To return all fields in the Public table:
http://192.168.4.14/?command=browsesymbols&uri=Public&format=ht
ml
• To return all the elements in the Flag array, which is part of
ble:
ta
http://192.1
html
4.4.3 Control Commands
SetValueEx
The SetValueEx command is used to set a value in the datalogger. For the CSI
Web Server, a user name and password that has at least read/write rights
be entered (or previously entered in
Likewise, for direct datalogger access, if a .csipasswd file has been sent to the
datalogger, a user name and password must be entered (or previously entered
in the same session) or the com
parts:
URI The URI specifies the value that
Value The new value to w
Format The Format is the file format for the res
the Public
68.4.14/?command=browsesymbols&uri=Public.flag&format=
must
the same session) or the command will fail.
mand will fail. SetValueEx has the following
should be set in the format of
source_name:station_name.table_name.field_name.
hich the URI should be set.
ult of the command.
Options are HTML, JSON, or XML. A result code and
description are returned.
60
Code Description
0 An unrecognized failure occurred
1 Success
2 The data-source connection failed (Logge
data sources only)
3 LoggerNet logon failed (LoggerNet data
sources only)
4 Blocked by LoggerNet security (LoggerNet
data sources only)
5 Read only
rNet
Page 67

6 Invalid table name
7 Invalid fieldname
RTMC Pro
Example
8 Invalid fi
eldname subscript
9 Invalid field data type
10 Datalogger c
ommunication failed
11 Datalogger communication disabled
(LoggerNet data sources only)
12 Blocked by datalogger security
13 Invalid table definitions (LoggerNet data
sources only)
14 Invalid device name (LoggerNet data sources
only)
15 Invalid web client authorization
Results codes marked as (LoggerNet data sources only) are
applicable only when the API is being used with the CSI web
server.
In this example, you are accessing data through the CSI Web Server at address
192.1 he RTMC project is published to the remote folder Weather.
68.4.14. T
• To set the Boolean variable called Flag(1) in the Public table of the
CR a LoggerNet server data source to True (-1):
1000 of
http 68.4.14/weather/?command=setvalueex&uri=Server:CR1000
://192.1 .P
ublic.flag )&value=-1&format=html
(1
ClockCheck
Returns the current time of the CSI Web Server or a station specified by the
URI.
URI e_name:station_name
The URI can be specified as URI=sourc
or URI can be omitted.
Examples
CSI Web Server
data througIn these examples, you are accessing h the CSI Web Server at
address 192.168 4. The RTM
.4.1 C project is published to the remote folder
Weather.
61
Page 68

RTMC Pro
• To check th lock of the C
e c SI Web Server:
http://192.1 tml
• To check th :
68.4.14/weather/?command=clockcheck&format=h
e clock of the CR1000 in the LoggerNet server data source
http://192.1 .14/weathe &URI=Server:CR1000
68.4 r/?command=clockcheck
_ip&format=html
Datalogger
In this example, you are directly .168.12.55.
• To check th ck of the d
accessing the datalogger at 192
e clo atalogger:
http://192.1 2.55/?comm
68.1 and=clockcheck&format=html
ClockSet
Sets the time for the station specified by the URI. For the CSI Web Server, a
user name and password that has at least read/write rights must be entered (or
previously entered in the same Likewise,
session) or the command will fail.
for direct datalogger access, if a .csipasswd file has been sent to the datalogger,
a user name and
session) or the c
password must be entered (or previously entered in the same
ommand will fail. ClockSet has the following parameters:
URI The URI can be specified as URI=source_name:station_name.
For direct datalogger access, the URI can be omitted.
Time The time to set the clock to, in the format of YYYY-MM-DD
T:HH:MM:SS.MS. MS is optional.
Format The Format is the file format for the result of the comma
nd.
Options are HTML, JSON, or XML.
A result code, time, and description are returned for
ClockCheck and ClockSet.
With ClockSet, the time returned is
the time before the clock was set.
Code Description
1 The clock was checked (successful)
2 The clock was set
3 The LoggerNet session failed (LoggerNet data
sources only)
Invalid LoggerNet logon (LoggerNet data
4
sources only)
62
5 Blocked by LoggerNet security (LoggerNet
data sources only)
Page 69

Examples
RTMC Pro
6 Communication with the station failed
(LoggerNet data sources only)
7 Communication with the station disabled
(LoggerNet data sources only)
8 Blocked by datalogger security
9 Invalid station name (LoggerNet data sources
only)
10 LoggerNet device is busy (LoggerNet data
sources only)
11 Specified URI does not reference a LoggerNet
station (LoggerNet data sources o
Results codes marked as (LoggerNet data sources only) are
applicable only when the API is being used with a CSI web
server.
nly)
CSI Web Server
In this example, you are accessing data through the CSI Web Server at address
68.4.14. T
192.1 he RTMC project is published to the remote folder Weather.
• To set the clock of the CR1000 in the LoggerNet server data source to
vember
No 1, 2011, 12:26:00:
http://192.168.4.14/weather/?command=clockset&uri=Server:CR1000&fo
t=html&
rma time=2011-11-01T12:26:00
Datalogger
In this example
• To set the clock of the datalogger to November 1, 2011, 12:26:00:
http://192.168.12.55/?command=clockcheck&format=html&time=201111-01T12:2 0
, you are directly accessing the datalogger at 192.168.12.55.
6:0
4.4.4 File Management Commands
NewestFile
The NewestFile command will return the most recent file that matches a given
expression, as d by the ex
display the most recent image s alogger by a camera. The
command will return other files, as well, and the file will be processed based
on the settings i e web client e
and the command is entered int wser may prompt for the
file to be saved or for selection of the program to open the file).
efined pr argument. This command can be used to
n th (for instance, if the specified file is a CR1 fil
tored to the dat
o a browser, the bro
63
Page 70

RTMC Pro
URI e URI can be _name.
Expr ecifies the pa
Th specified as URI=source_name:station
For direct datal itted.
ogger access, the URI can be om
Sp th and file pattern for the desired file to be
returned. Path d ogger, i.e.,
etermines the drive on the datal
CPU:, USR:, or CRD:. The file pattern can incorporate the use
cards. If a file
of wild the path is omitted or invalid, or
matching the pattern does not exist, an Unrecognized Request
res e returned.
ponse will b
NewestFile requires a minimum access level of Read Only.
Examples
CSI Web Server
In these examples, you are accessing data through the CSI Web Server at
address 192.168
.4.14. The RTMC project is published to the remote folder
Weather.
• To return the newest file with a *.jpg extension from the USR drive of the
0 in the LoggerNet server data source:
CR100
http://192.168
.4.14/weather/?command=newestfile&uri=Server:CR1000&
expr=USR:*.jpg
• To return the newest *.cr1 file from the CPU drive of the CR1000 in the
LoggerNet server data source:
http://192.168.4.14/weather/?c
xpr=CPU:*.cr1
e
Datalogger
ommand=newestfile&uri=Server:CR1000&
In these examples, you are directly accessing the datalogger at 192.168.12.55.
• To retrieve the newest *.jpg file on the datalogger’s USR drive:
http://192.168.12.55/?command= NewestFile&expr=USR:*.jpg
• To retrieve the newest *.cr1 file on the datalogger’s CPU drive:
http://192.168.12.55/?command= NewestFile&expr= CPU:*.cr1
ListFiles
When accessing
data through the CSI Web Server, the ListFiles command
returns a list of all files stored on the specified station. When accessing a
datalogger directly, the ListFiles command returns a list of files stored in the
specified directory (/CPU, /USR, /CRD, /USB) of the datalogger. The Lis
tFiles
command requires a minimum security level of Read Only.
64
URI The URI can be specified as URI=source_name:station_nam
For direct datalogger access, the URI is omitted.
e.
Page 71

RTMC Pro
Format The Format is the format in which to return the list of files.
Options are HTML, JSON, and XML.
ListFi the following, formatted in a table:
les returns
Path
Is Directory
The path of the file or directory, relative to the URL.
A Boolean value that indicates whether or not the returned
object is a directory.
Size An integer that provides the size of a file in bytes, or the
number of bytes free in a directory.
Last Write A string that specifies the date and time a file was last written
eturned for files only).
(r
Run Now A Boolean value that indicates whether or not the file (a
datalogger program) is marked by the datalogger file system
currently running.
Run On
Power Up A Boolean value that indicates whet
her or not the file (a
datalogger program) is marked by the datalogger file system as
run on power up.
Read Only A Boolean value that indicates whether or not the file is
marked by the datalogger file system as read-only.
d A Boolean value that indicates whether or not the file (a
Pause
datalogger program) is marked by the datalogger file system as
d.
pause
as
Examples
CSI Web Server
In this example, you are accessing data through the CSI Web Server a
192.1
68.4.14. The RTMC project is published to the remote folder Weather.
t address
• To see all files on the CR1000 in the LoggerNet server data source:
ttp://192.168.4.14/weather/?command=ListFiles&uri=Server:CR1000&fo
h
rmat=html
Datalogge
r
In this example, you are directly accessing the datalogger at 192.168.12.55.
• To return all files on the datalogger’s USR: drive:
http://192.168.12.55/USR/?command= ListFiles&format
=html
65
Page 72

RTMC Pro
FileControl
The FileControl command allows you to perform actions on files that are
located on one of the datalogger's drives. Note that Fi
leControl can only be
used when accessing a datalogger directly and not through the CSI Web
r. The com
Serve mand has the following parts:
File The name of the file on which to perform the file control
operation. This comm
and is optional for Actions 7, 8, 9, 11,
and 12.
File2 or the command. This
The name of the second file required f
command is used for options 15, 16, 17, 18, 19, and 20.
Action supported:
The following actions are
Code Description
1 Compile and run the file specified by File and
mark it as the program to be run on power up.
2 Mark the file specified by File as the prog
ram
to be run on power up.
3 Mark the file specified by File as hidden.
4 Delete the file specified by File.
5 Format the device specified by File.
6
Compile and run the file specified by File
without deleting existing data tables.
7 Stop the currently running program.
8 Stop the currently running program and delete
associated data tables.
66
9 Install the operating system (*.obj) specified by
File. The file must reside on the datalogg
er's
CPU drive (sent to the datalogger using
HTTPPut)
10 Compile and run the program specified by File
but do not change the program currently
marked to run on power up.
11 Pause execution of the currently running
program.
12 Resume execution of the currently pa
used
program.
13 Stop the currently running program, delete its
associated data tables, run the program
Page 73

RTMC Pro
specified by File, and mark the same file as the
program to be run on power up.
14 Stop the currently running program, delete it
associated data tables, and run the progra
specified by Fil
e without affecting the program
m
to be run on power up.
15 Move the file specified by File2 to the name
specified by File.
16 Move the file specified by File2 to the name
specified by File, stop the currently runnin
g
program, delete its associated data tables, and
run the program now s
pecified by File while
marking it to run on power up.
17 Move the file specified by File2 to the name
specified by File, stop the currently running
program, delete its associated data tables, and
run the program now specified by File without
affecting the program that will run on power
up.
e
18 Copy the file specified by File2 to the nam
specified by File.
o the name
19 Copy the file specified by File2 t
specified by File, stop the currently r
program, delete its associated data tab
unning
les, and
run the program now specified by File whil
marking it to run on power up.
s
e
name
20 Copy the file specified by File2 to the
specified by File, stop the currently ru
nning
program, delete its associated data tables, and
run the program now specified by File without
affecting the program th
at will run on power
up.
Format The Format is t
Options are HT
FileControl retu he followin
rns t g:
Outcome If 0 is returned,
indicates a failure
Time number of seconds that fore
The the web client should wait be
attempting more com cation with the station. A value of 0
ns commun
mea ication can resume immediately.
Description Provides details abou FileControl attempt.
he file format for the result of the command.
ML, JSON, or XML.
the command succeeded. Any non-zero value
.
muni
t the
67
Page 74

RTMC Pro
Example
Datalogger
In this example, you are directly
• To set a program named tc r's CPU drive to run
accessing the datalogger at 192.168.12.55.
-fast.cr1 on the datalogge
on power up:
http://192.168.12.55/?comm ile=CPU:tc-
and=filecontrol&f
fast.cr1&action=2
68
Page 75

Page 76

Campbell Scientific Companies
Campbell Scientific, Inc. (CSI)
815 West 1800 North
Logan, Utah 84321
UNITED STATES
www.campbellsci.com • info@campbellsci.com
Campbell Scientific Africa Pty. Ltd. (CSAf)
PO Box 2450
Somerset West 7129
SOUTH AFRICA
www.csafrica.co.za • cleroux@csafrica.co.za
Campbell Scientific Australia Pty. Ltd. (CSA)
PO Box 8108
Garbutt Post Shop QLD 4814
AUSTRALIA
www.campbellsci.com.au • info@campbellsci.com.au
Campbell Scientific do Brasil Ltda. (CSB)
Rua Apinagés, nbr. 2018 ─ Perdizes
CEP: 01258-00 ─ São Paulo ─ SP
BRASIL
www.campbellsci.com.br • vendas@campbellsci.com.br
Campbell Scientific Canada Corp. (CSC)
11564 - 149th Street NW
Edmonton, Alberta T5M 1W7
CANADA
www.campbellsci.ca • dataloggers@campbellsci.ca
Campbell Scientific Centro Caribe S.A. (CSCC)
300 N Cementerio, Edificio Breller
Santo Domingo, Heredia 40305
COSTA RICA
www.campbellsci.cc • info@campbellsci.cc
Campbell Scientific Ltd. (CSL)
Campbell Park
80 Hathern Road
Shepshed, Loughborough LE12 9GX
UNITED KINGDOM
www.campbellsci.co.uk • sales@campbellsci.co.uk
Campbell Scientific Ltd. (France)
3 Avenue de la Division Leclerc
92160 ANTONY
FRANCE
www.campbellsci.fr • info@campbellsci.fr
Campbell Scientific Spain, S. L.
Avda. Pompeu Fabra 7-9, local 1
08024 Barcelona
SPAIN
www.campbellsci.es • info@campbellsci.es
Please visit www.campbellsci.com to obtain contact information for your local US or international representative.
 Loading...