

Page 1

INSTRUCTION MANUAL
CS650 and CS655 Water
Copyright © 2011- 2014
mpbell Scientific, Inc.
Content Reflectometers
Revision: 2/14
Ca
Page 2

Page 3

Warranty
“PRODUCTS MANUFACTURED BY CAMPBELL SCIENTIFIC, INC. are
warranted by Campbell Scientific, Inc. (“Campbell”) to be free from defects in
materials and workmanship under normal use and service for twelve (12)
months from date of shipment unless otherwise specified in the corresponding
Campbell pricelist or product manual. Products not manufactured, but that are
re-sold by Campbell, are warranted only to the limits extended by the original
manufacturer. Batteries, fine-wire thermocouples, desiccant, and other
consumables have no warranty. Campbell’s obligation under this warranty is
limited to repairing or replacing (at Campbell’s option) defective products,
which shall be the sole and exclusive remedy under this warranty. The
customer shall assume all costs of removing, reinstalling, and shipping
defective products to Campbell. Campbell will return such products by surface
carrier prepaid within the continental United States of America. To all other
locations, Campbell will return such products best way CIP (Port of Entry)
INCOTERM® 2010, prepaid. This warranty shall not apply to any products
which have been subjected to modification, misuse, neglect, improper service,
accidents of nature, or shipping damage. This warranty is in lieu of all other
warranties, expressed or implied. The warranty for installation services
performed by Campbell such as programming to customer specifications,
electrical connections to products manufactured by Campbell, and product
specific training, is part of Campbell’s product warranty. CAMPBELL
EXPRESSLY DISCLAIMS AND EXCLUDES ANY IMPLIED
WARRANTIES OF MERCHANTABILITY OR FITNESS FOR A
PARTICULAR PURPOSE. Campbell is not liable for any special, indirect,
incidental, and/or consequential damages.”
Page 4

Assistance
Products may not be returned without prior authorization. The following
contact information is for US and international customers residing in countries
served by Campbell Scientific, Inc. directly. Affiliate companies handle
repairs for customers within their territories. Please visit
www.campbellsci.com to determine which Campbell Scientific company serves
your country.
To obtain a Returned Materials Authorization (RMA), contact CAMPBELL
SCIENTIFIC, INC., phone (435) 227-9000. After an application engineer
determines the nature of the problem, an RMA number will be issued. Please
write this number clearly on the outside of the shipping container. Campbell
Scientific’s shipping address is:
CAMPBELL SCIENTIFIC, INC.
RMA#_____
815 West 1800 North
Logan, Utah 84321-1784
For all returns, the customer must fill out a “Statement of Product Cleanliness
and Decontamination” form and comply with the requirements specified in it.
The form is available from our web site at www.campbellsci.com/repair. A
completed form must be either emailed to repair@campbellsci.com or faxed to
(435) 227-9106. Campbell Scientific is unable to process any returns until we
receive this form. If the form is not received within three days of product
receipt or is incomplete, the product will be returned to the customer at the
customer’s expense. Campbell Scientific reserves the right to refuse service on
products that were exposed to contaminants that may cause health or safety
concerns for our employees.
Page 5

Table of Contents
PDF viewers: These page numbers refer to the printed version of this document. Use the
PDF reader bookmarks tab for links to specific sections.
1. Introduction ................................................................. 1
2. Cautionary Statements ............................................... 1
3. Initial Inspection ......................................................... 1
4. Overview ...................................................................... 1
5. Specifications ............................................................. 3
5.1 Dimensions/Weight .............................................................................. 3
5.2 Electrical Specifications ....................................................................... 4
5.2.1 Current .......................................................................................... 4
5.3 Operational Specifications ................................................................... 5
6. Installation ................................................................... 7
6.1 Orientation and Placement ................................................................... 7
6.2 Proper Insertion .................................................................................... 7
6.3 Wiring .................................................................................................. 8
6.3.1 SDI-12 Wiring .............................................................................. 8
6.3.2 RS-232 Wiring .............................................................................. 9
6.4 A200 and Device Configuration Utility ............................................... 9
6.4.1 Using the A200 ............................................................................. 9
6.4.1.1 Driver Installation .............................................................. 9
6.4.1.2 Cabling ............................................................................. 10
6.4.1.3 Powering the Sensor ......................................................... 10
6.4.1.4 Determining which COM Port the A200 has been
Assigned ....................................................................... 10
6.4.2 Device Configuration Utility (DevConfig) ................................. 11
6.4.2.1 Settings Editor Tab ........................................................... 13
6.4.2.2 Send OS Tab .................................................................... 15
6.4.2.3 Terminal Tab .................................................................... 16
6.5 SDI-12 Measurements ........................................................................ 17
6.5.1 Use of Multiplexers ..................................................................... 18
6.6 Program Examples ............................................................................. 19
6.6.1 CR1000 With a Single CS650 Probe .......................................... 19
6.6.2 CR1000 With 2 CS650 Probes on Same Control Port ................ 20
6.6.3 CR1000 With 12 CS650 Probes on Multiplexer ......................... 20
6.6.4 CR10X With a Single CS650 Probe ........................................... 21
6.6.5 CR10X With 2 CS650 Probes on Same Control Port ................. 22
6.6.6 CR200X With 3 CS650 Probes ................................................... 24
7. The Water Content Reflectometer Method for
Measuring Volumetric Water Content .................. 25
7.1 Description of Measurement Method ................................................. 25
i
Page 6

Table of Contents
7.2 The Topp Equation ............................................................................ 25
7.3 Electrical Conductivity ...................................................................... 25
7.3.1 Soil Electrical Conductivity ....................................................... 25
7.3.2 Temperature Correction of Soil Electrical Conductivity ............ 26
7.4 Error Sources in Water Content Reflectometer Measurement .......... 27
7.4.1 Probe-to-Probe Variability Error ................................................ 27
7.4.2 Insertion Error ............................................................................ 27
7.5 Temperature Dependence and Correction ......................................... 27
7.5.1 Accurate Soil Temperature Measurement .................................. 28
8. Water Content Reflectometer User-Calibration ...... 28
8.1 Need for Soil Specific Calibration Equation ..................................... 28
8.2 The User-Derived Calibration Equation ............................................ 28
8.3 Collecting Laboratory Data for Calibration ....................................... 29
8.4 Collecting Field Data for Calibration ................................................ 31
8.5 Calculations ....................................................................................... 33
9. Maintenance .............................................................. 33
10. Troubleshooting ........................................................ 34
11. References ................................................................. 35
Appendices
Discussion of Soil Water Content ......................... A-1
A.
B. SDI-12 Sensor Support ........................................... B-1
B.1 SDI-12 Command Basics ................................................................ B-1
B.2 Changing the SDI-12 Address Using Terminal Emulator and a
Datalogger .................................................................................... B-3
B.2.1 SDI-12 Transparent Mode ........................................................ B-3
B.2.2 CR200(X) Series Datalogger Example .................................... B-4
B.2.3 CR1000 Datalogger Example ................................................... B-5
B.2.4 CR10X Datalogger Example .................................................... B-6
B.2.5 CR10X-PB Table-Based Datalogger Example ......................... B-7
Figures
4-1. CS650 Water Content Reflectometer .................................................. 2
5-1. CS650 and CS655 average current drain ............................................. 5
6-1. CS650G Insertion Guide Tool ............................................................. 8
6-2. A200 Sensor-to-PC Interface ............................................................. 11
B-1. SDI-12 transparent mode on CR200(X)-series datalogger using
control port C1/SDI12 and changing SDI-12 address from 0
to 1 ............................................................................................... B-4
B-2. SDI-12 transparent mode on CR1000 datalogger using control
port 1 and changing SD1-12 address from 3 to 1 ......................... B-5
B-3. SDI-12 transparent mode on CR10X datalogger using control
port 1 and changing SDI-12 address from 0 to 1 ......................... B-7
B-4. SDI-12 transparent mode on CR10X-PB table-based datalogger
using control port 1 and changing SDI-12 address from 0 to 1 ... B-8
ii
Page 7

Tables
Table of Contents
6-1. CS650 Wiring Code for SDI-12 ........................................................... 8
6-2. CS650 Wiring Code for RS-232 and A200 .......................................... 9
6-3. CS650 Terminal Commands .............................................................. 17
6-4. CS650 SDI-12 Commands ................................................................. 18
6-5. Wiring For Program Example 1 ......................................................... 19
6-6. Wiring For Program Example 2 ......................................................... 20
6-7. Wiring For Program Example 3 ......................................................... 21
6-8. Wiring For Program Example 4 ......................................................... 22
6-9. Wiring For Program Example 5 ......................................................... 23
6-10. Wiring For Program Example 6 ......................................................... 24
B-1. CS650 SDI-12 Command and Response Set .................................... B-1
iii
Page 8

Table of Contents
iv
Page 9

NOTE
CS650 and CS655 Water Content
Reflectometers
1. Introduction
The CS650 and CS655 are multiparameter smart sensors that use innovative
techniques to monitor soil volumetric water content, bulk electrical
conductivity, and temperature. They output an SDI-12 signal that many of our
dataloggers can measure.
The CS650 has 30 cm length rods, whereas the CS655 has 12 cm length rods.
This manual uses CS650 to reference model numbers CS650 and
CS655. Unless specifically stated otherwise, information in the
manual applies equally to both models.
Before installing the sensor, please study
• Section 2, Cautionary Statements
• Section 3, Initial Inspection
2. Cautionary Statements
• Although the CS650 is rugged, it should be handled as precision scientific
instrument.
• External RF sources can affect the probe’s operation. Therefore, the probe
should be located away from significant sources of RF such as ac power
lines and motors.
3. Initial Inspection
• Upon receipt of the CS650, inspect the packaging and contents for
damage. File damage claims with the shipping company.
• The model number and cable length are printed on a label at the
connection end of the cable. Check this information against the shipping
documents to ensure the expected product and cable length are received.
4. Overview
The CS650 measures volumetric water content, electrical conductivity,
dielectric permittivity, and temperature of soils or other porous media. These
values are reported through SDI-12 communication.
1
Page 10

CS650 and CS655 Water Content Reflectometers
FIGURE 4-1. CS650 Water Content Reflectometer
Volumetric water content information is derived from the probe’s sensitivity to
the dielectric permittivity of the medium surrounding the probe stainless-steel
rods. The CS650 is configured as a water content reflectometer, with the two
parallel rods forming an open-ended transmission line. A differential oscillator
circuit is connected to the rods, with an oscillator state change triggered by the
return of a reflected signal from one of the rods. The two-way travel time of the
electromagnetic waves that are induced by the oscillator on the rod varies with
changing dielectric permittivity. Water is the main contributor to the bulk
dielectric permittivity of the soil or porous media, so the travel time of the
reflected wave increases with increasing water content and decreases with
decreasing water content, hence the name water content reflectometer.
2
Electrical conductivity is determined by exciting the rods with a known nonpolarizing waveform and measuring the signal attenuation.
Temperature is measured with a thermistor in contact with one of the rods.
It is well known that transmission line oscillators used for water content
measurements suffer from unwanted increases in oscillation period as
increasing electrical conductivity causes transmission line signal attenuation.
The CS650 handles this problem by making an electrical conductivity
measurement and then correcting the oscillator period accordingly. On-board
processing within the sensor head calculates electrical conductivity from the
signal attenuation measurement and combines the result with the oscillation
period measurement to calculate the dielectric permittivity of the media and
finally applies the Topp equation (Topp et al. 1980) to estimate volumetric
water content.
Probe electronics are encapsulated in the rugged epoxy probe head.
A five conductor cable including the drain or shield wire is used to provide
power and ground as well as serial communication with the CS650. The CS650
is intended to communicate with SDI-12 recorders, including Campbell
Scientific dataloggers. The orange Rx wire can be used to communicate by
Page 11

means of RS-232 Tx/Rx. The A200 USB-to-Serial Module allows RS-232
serial communication between a computer and the CS650 by means of
Campbell Scientific’s Device Configuration Utility software, DevConfig.
The CS650's cable can terminate in:
Campbell Scientific also offers the CS650-LC, CS655-LC, and CWS655. The
CS650-LC and CS655-LC include a connector for attaching the sensor to an
ET107 weather station. The CWS655 is a wireless version of our CS655; refer
to theWireless Sensor Manual for more information.
5. Specifications
Features:
CS650 and CS655 Water Content Reflectometers
• Pigtails that connect directly to a Campbell Scientific datalogger
(option –PT).
• Connector that attaches to a prewired enclosure (option –PW). Refer
to www.campbellsci.com/prewired-enclosures for more information.
• Larger sample volume reduces error
• Measurement corrected for effects of soil texture and electrical
conductivity
• Estimates soil-water content for a wide range of mineral soils
• Versatile sensor—measures dielectric permittivity, bulk electrical
conductivity (EC), and soil temperature
Compatibility
Dataloggers: CR200(X) series
CR800 series
CR1000
CR3000
CR5000
CR510
CR10(X)
CR23X
5.1 Dimensions/Weight
Rods:
CS650 CS655
300 mm long
3.2 mm diameter
32 mm spacing
120 mm long
3.2 mm diameter
32 mm spacing
Probe Head:
Probe Weight:
Cable Weight:
L 85 mm
W 63 mm
D 18 mm
280 g 240 g
-1
35 g m
35 g m-1
L 85 mm
W 63 mm
D 18 mm
3
Page 12

CS650 and CS655 Water Content Reflectometers
Sensor Output:
SDI-12
Warmup Time:
3 s
Measurement Time:
3 ms to measure
Power Supply
Maximum Cable Length:
610 m (2000 ft) combined length for 1 – 10
Electromagnetic
Active (3 ms):
45 mA typical @ 12 Vdc
Quiescent:
135 µA @ 12 Vdc
Average Current Drain:
I = 0.09n + [3.5 + 0.024(n-1)]n/s
5.2 Electrical Specifications
Serial RS-232
600 ms to complete SDI-12 command
5.2.1 Current
Requirements:
Compatibility:
6 Vdc to 18 Vdc
Must be able to supply 45 mA @ 12 Vdc
sensors connected to the same datalogger
control port
Πcompliant (EMC compliant performance
criteria available upon request)
Meets EN61326 requirements for protection
against electrostatic discharge and surge
External RF sources can affect CS650
measurements. CS650 circuitry should be
located away from radio transmitter aerials
and cables, or measurements ignored during
RF transmissions.
(80 mA @ 6 Vdc, 35 mA @ 18 Vdc)
4
I = average current in milliamps
n = number of CS650’s
s = number of seconds between
measurements
FIGURE 5-1)
(see
Page 13
CS650 and CS655 Water Content Reflectometers
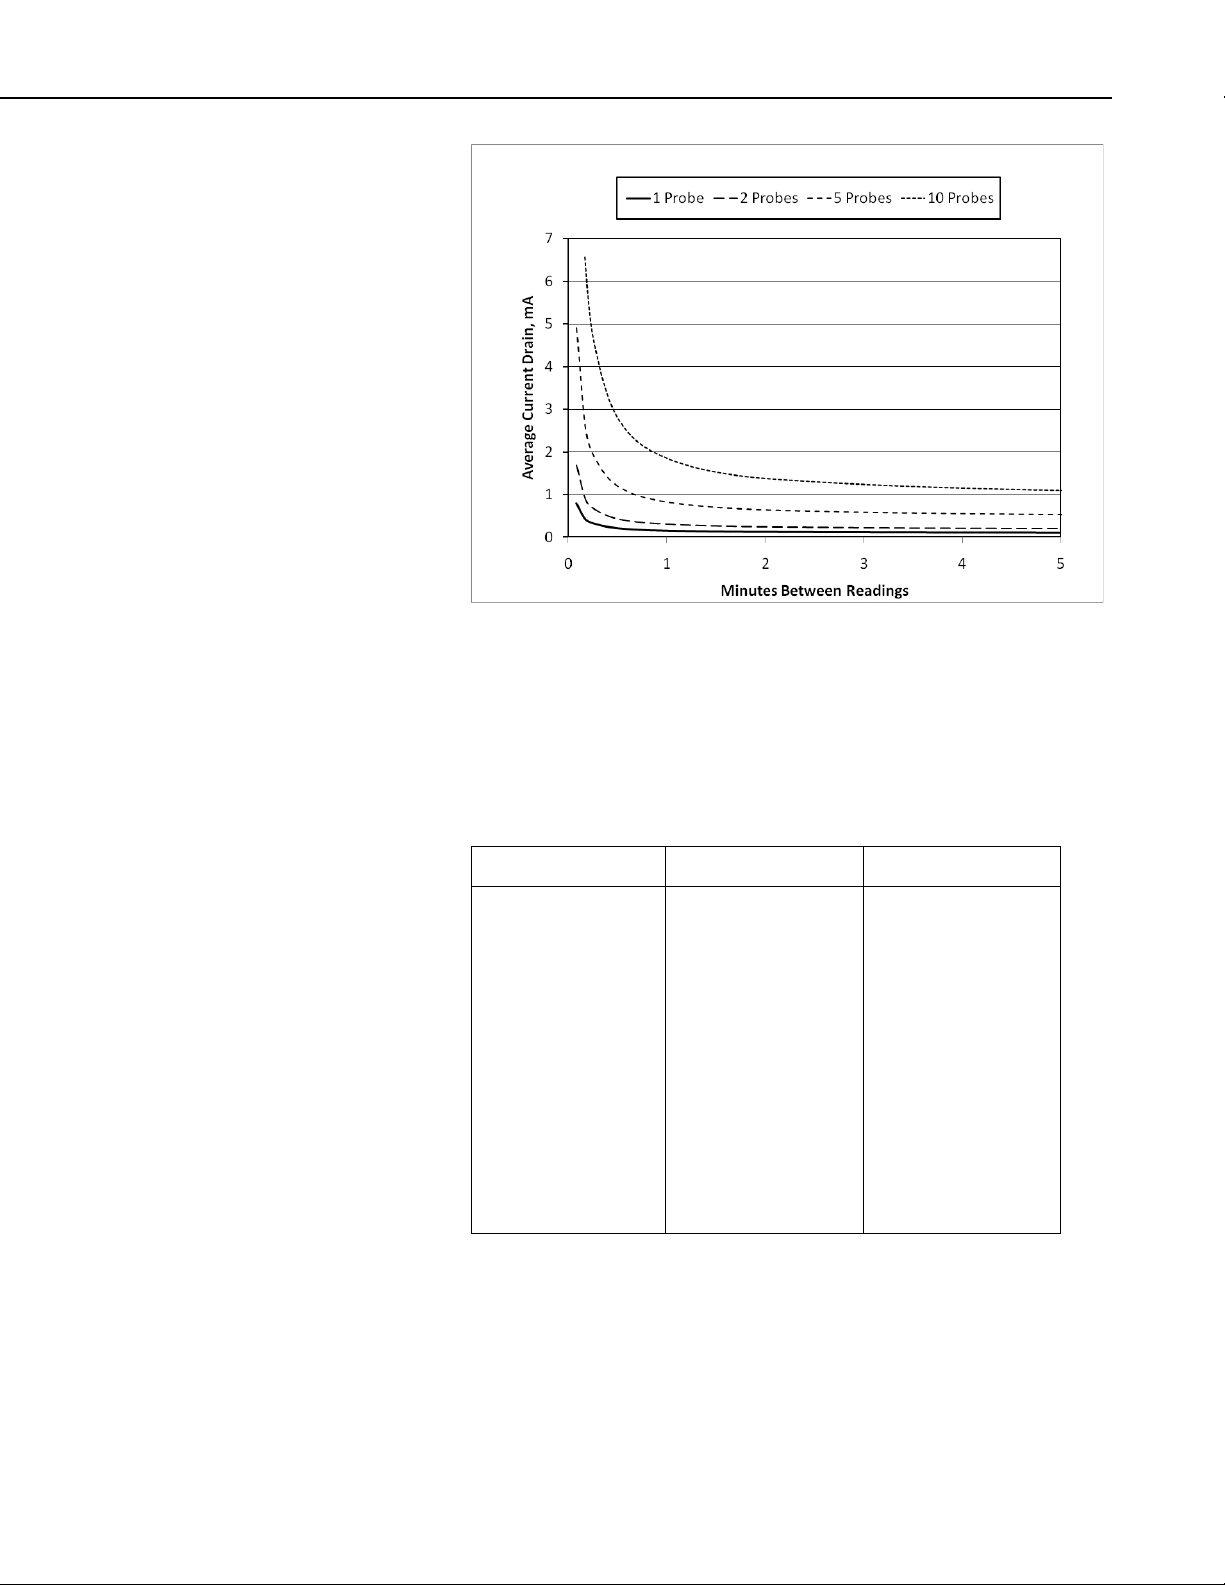
FIGURE 5-1. CS650 and CS655 average current drain
FIGURE 5-1 shows average current drain for different measurement rates and
quantities of CS650 probes. If the time between measurements is five minutes
or longer, average current drain may be approximated at 0.15 milliamps per
sensor.
5.3 Operational Specifications
CS650 CS655
Relative Dielectric
Permittivity
Range:
Accuracy†:
1 to 40:
40 to 80:
Precision‡:
1 to 81 1 to 81
±(2% of reading +
0.6) for solution EC
≤3 dS/m
±1.4 for solution EC
≤3 dS/m
<0.02 <0.02
±(3% of reading +
0.8) for solution EC
≤8 dS/m
±2 for solution EC
≤2.8 dS/m
5
Page 14

CS650 and CS655 Water Content Reflectometers
CS650 CS655
Volumetric Water
Content using Topp
3/m3
Equation (m
)
Range:
Accuracy†:
Precision‡:
Electrical
Conductivity
Range Solution
EC:
Range Bulk EC:
Accuracy†:
Precision‡:
Temperature
Soil
Measurement
Range:
5% to 50% 5% to 50%
±3% VWC typical in
mineral soils where
solution EC ≤3 dS/m
±3% VWC typical in
mineral soils where
solution EC ≤10 dS/m
<0.05% <0.05%
0 to 3 dS/m
0 to 8 dS/m
0 to 3 dS/m 0 to 8 dS/m
±(5% of reading +
0.05 dS/m)
±(5% of reading +
0.05 dS/m)
0.5% of BEC 0.5% of BEC
-10 to + 70°C
-10 to + 70°C
Operational
Range:
Accuracy†:
Precision‡:
Sensing Volume*:
0 to + 70°C
±0.5°C for probe
body buried in soil
±0.02°C ±0.02°C
7800 cm
3
3600 cm3
0 to + 70°C
±0.5°C for probe
body buried in soil
*Sensing Volume approximately 7.5 cm radius around each probe rod
and 4.5 cm beyond the end of the rods
†Accuracy specifications are based on laboratory measurements in a
series of solutions with dielectric permittivities ranging from 1 to 81
and solution electrical conductivities ranging from 0 to 3 dS/m.
‡Precision describes the repeatability of a measurement. It is
determined for the CS650 by taking repeated measurements in the
same material. The precision of the CS650 is better than 0.05 %
volumetric water content and 0.01 dS/m electrical conductivity.
6
Page 15

6. Installation
6.1 Orientation and Placement
CS650 and CS655 Water Content Reflectometers
The CS650 measures the bulk dielectric permittivity, average volumetric water
content, and bulk EC along the length of the rods, which is 30 cm for the
CS650 and 12 cm for the CS655. The probe rods may be inserted vertically
into the soil surface or buried at any orientation to the surface. The probe may
be installed horizontal to the surface to detect the passing of wetting fronts or
other vertical water fluxes.
The sensitive volume depends on the surrounding media. In soil, the sensitive
volume extends approximately 7.5 cm (3 in) from the rods along their length
and 4.5 cm (1.8 in) beyond the end of the rods. Consequently, if the probe is
buried horizontally closer than 7.5 cm from the soil surface, it will include air
above the surface in its measurements and underestimate soil water content.
The thermistor used to measure temperature is in contact with one of the
stainless steel rods at the base of the epoxy probe body. Because of the low
thermal conductivity of stainless steel, the thermistor does not measure the
average temperature along the rod, but instead provides a point measurement of
the temperature within the epoxy. For a valid soil temperature reading, the
probe body must be in thermal equilibrium with the soil. If the probe is
installed vertically with the epoxy probe body above the surface, then the probe
body must be shielded from solar radiation and in direct contact with the soil or
media of interest.
6.2 Proper Insertion
The method used for probe installation can affect the accuracy of the
measurement. The probe rods should be kept as close to parallel as possible
when installed to maintain the design wave guide geometry. The probe is more
sensitive to permittivity close to the rods so probes inserted in a manner which
generates air voids around the rods will have reduced measurement accuracy.
In most soils, the soil structure will recover from the disturbance during probe
insertion.
In some applications, installation can be improved by using the CS650G
insertion guide tool. The CS650G is inserted into the soil and then removed.
This makes proper installation of the water content reflectometer easier in
dense or rocky soils.
7
Page 16

CS650 and CS655 Water Content Reflectometers
TABLE 6-1. CS650 Wiring Code for SDI-12
FIGURE 6-1. CS650G Insertion Guide Tool
6.3 Wiring
CS650 connections to a datalogger are shown below. Dataloggers are divided
into those which are programmed with the CRBasic programming language
and those that are programmed with Edlog. CRBasic dataloggers include the
CR1000, CR3000, CR5000, CR800-series, and CR200X-series. Compatible
Edlog dataloggers include the CR10X, CR23X, and CR510.
6.3.1 SDI-12 Wiring
TABLE 6-1 shows the SDI-12 wiring code for the CS650 water content
reflectometer. SDI-12 data is transmitted to a CRBasic datalogger odd
numbered control port or to any control port of an Edlog datalogger that is
capable of SDI-12 communication. See Section 6.6, Program Examples, for
SDI-12 programming examples.
Color Function Datalogger Connection
Green SDI-12 Data SDI-12 Input or Control Port
Red SDI-12 Power 12 Vdc
Black SDI-12 Reference G
Clear Shield G
Orange Not Used G
8
Page 17

SDI-12 communication has the advantage that up to ten probes may be given
TABLE 6-2. CS650 Wiring Code
NOTE
different addresses and share a single control port. Another advantage is that
the datalogger programming is much simpler for SDI-12 communication than
RS-232.
The orange Rx wire is only used for RS-232 Tx/Rx
communication, and should be grounded when using SDI-12.
6.3.2 RS-232 Wiring
TABLE 6-2 shows the wiring code for communicating with a CS650 using
RS-232 serial protocol. Device Configuration Utility software uses RS-232 to
communicate with a CS650 through the A200 USB-to-Serial Module. See
Section 6.4, A200 and Device Configuration Utility, for details.
RS-232 communication is not recommended for use with Campbell Scientific
dataloggers because it requires two control ports per CS650 and the
programming is more complicated than for SDI-12 communication.
For RS-232 serial communication with devices other than Campbell Scientific
dataloggers, use the wiring information in TABLE 6-2. Factory default
communication settings are 9600 baud, no parity, 1 stop bit, 8 data bits, and no
error checking.
CS650 and CS655 Water Content Reflectometers
See TABLE 6-3 for a list of serial commands for the CS650.
for RS-232 and A200
Color Function A200 Terminal
Orange RxD Rx
Green TxD Tx
Red Power +12 Vdc
Black Reference G
Clear Shield G
6.4 A200 and Device Configuration Utility
The A200 Sensor-to-PC Interface allows communication between a CS650 and
a PC, allowing sensor settings to be changed through Device Configuration
Utility (DevConfig) software.
6.4.1 Using the A200
6.4.1.1 Driver Installation
If the A200 has not been previously plugged into your PC and your PC
operating system is not Windows 7, the A200 driver needs to be loaded onto
your PC.
9
Page 18

CS650 and CS655 Water Content Reflectometers
NOTE
Drivers should be loaded before plugging the A200 into the PC.
The A200 drivers can be downloaded, at no charge, from:
www.campbellsci.com/downloads.
6.4.1.2 Cabling
One end of the A200 has a terminal block while the other end has a type B
female USB port. The terminal block provides 12V, G, TX, and RX terminals
for connecting the sensor (see FIGURE 6-2 and TABLE 6-2).
A data cable, part number 17648, ships with the A200. This cable has a USB
type-A male connector that attaches to a PC’s USB port, and a type B male
connector that attaches to the A200’s USB port.
6.4.1.3 Powering the Sensor
The A200 provides power to the sensor when it is connected to a PC’s USB
port. An internal DC/DC converter boosts the 5 Vdc supply from the USB
connection to a 12 Vdc output that is required to power the sensor.
6.4.1.4 Determining which COM Port the A200 has been Assigned
When the A200 driver is loaded, the A200 is assigned a COM port number.
This COM port number is needed when using the Device Configuration Utility.
Often, the assigned COM port will be the next port number that is free.
However, if other devices have been installed in the past (some of which may
no longer be plugged in), the A200 may be assigned a higher COM port
number.
To check which COM port has been assigned to the A200, you can monitor the
appearance of a new COM port in the list of COM ports offered in your
software package (e.g., LoggerNet) before and after the installation, or look in
the Windows Device Manager list under the ports section (access via the
control panel).
10
Page 19

CS650 and CS655 Water Content Reflectometers
FIGURE 6-2. A200 Sensor-to-PC Interface
6.4.2 Device Configuration Utility (DevConfig)
DevConfig may be downloaded from the Campbell Scientific website,
www.campbellsci.com/downloads.
Connect the CS650 to the A200 as shown in TABLE 6-2. Connect the PC to
the A200 USB port with the supplied USB cable.
Launch DevConfig and select “CS650 Series” from the Device Type menu on
the left. Select 9600 from the Baud Rate drop-down menu.
11
Page 20

CS650 and CS655 Water Content Reflectometers
Select the appropriate PC Serial Port from the list of available COM ports
shown when the browse button on the lower left is selected (see Section
6.4.1.4, Determining which COM Port the A200 has been Assigned).
12
Select Ok and then Connect to begin communication with the CS650.
Page 21

6.4.2.1 Settings Editor Tab
The Settings Editor tab shows settings stored in the CS650 firmware. Settings
that may be modified include User Name, SDI-12 Address, and RS-232 Baud
Rate. Attempts to change any of the other settings will result in a “Commit
failed. Unrecognized error condition” error message. DevConfig polls the
CS650 every two seconds while connected and the results are displayed in the
Real-Time Measurements field. This is useful for verifying probe
performance.
CS650 and CS655 Water Content Reflectometers
After any changes to CS650 settings, select Apply to write the changes to the
CS650 firmware. A configuration summary is then shown. The summary may
be printed or saved electronically for future reference.
13
Page 22

CS650 and CS655 Water Content Reflectometers
14
Real-Time Measurements
Measurement Field Name Meaning
VWC Volumetric Water Content
EC (dS/m) Bulk Electrical Conductivity
TS (°C) Soil Temperature
Ka Bulk Dielectric Permittivity
PA (µS)
VR Voltage Ratio
Period Average
Page 23

6.4.2.2 Send OS Tab
CS650 and CS655 Water Content Reflectometers
The Send OS tab is used to update the firmware in the CS650. The firmware is
available at www.campbellsci.com/downloads. The file to send will have a
filename extension of .a43, such as CS65X.Std.00.36.a43. Sending a new
operating system will not affect any of the user-modified settings or probe
specific multiplier and offset settings.
To download a new operating system, follow the Operating System Download
Procedure listed on the Send OS tab.
15
Page 24

CS650 and CS655 Water Content Reflectometers
6.4.2.3 Terminal Tab
The Terminal tab may be used to send serial commands directly to the CS650.
See TABLE 6-3 for a list of serial interface commands. To send a command
from the Terminal tab, left click in the field to get a flashing black cursor, then
press <Enter> several times until the CS650> prompt is shown. At the prompt,
type in the command then <Enter>.
16
Page 25

CS650 and CS655 Water Content Reflectometers
TABLE 6-3. CS650 Terminal Commands
Command
Values Returned
Units
0
1) Volumetric Water Content, θ
3) Temperature
m3/m3
1
1) Permittivity, ε
3) Temperature
2
1) Period, τ
3) Temperature
µSec
°C
3
1) Volumetric Water Content, θ
6) Voltage Ratio, α
m3/m3
5
1) Copyright information
5) SDI-12 Address
H or h
Help Menu
2) Electrical Conductivity, σ
dS/m
°C
2) Electrical Conductivity, σ
dS/m
°C
2) Voltage Ratio, α
2) Electrical Conductivity, σ
3) Temperature
4) Permittivity, ε
5) Period, τ
dS/m
°C
µSec
2) OS version and Date
3) Product Serial Number
4) Product User Name
6.5 SDI-12 Measurements
The CS650 responds to SDI-12 commands M!, M1!, M2!, M3!, ?!, and I!.
TABLE 6-4 shows the values returned for each of these commands. The ?!
and I! commands are not used with Edlog dataloggers.
See Section 6.3.1, SDI-12 Wiring, for SDI-12 wiring details.
See Appendix B for additional detail concerning SDI-12 sensors, including
changing the SDI-12 address in SDI-12 transparent mode.
17
Page 26

CS650 and CS655 Water Content Reflectometers
TABLE 6-4. CS650 SDI-12 Commands
SDI-12 command
address)
Values Returned
Units
aM!
1) Volumetric Water Content, θ
3) Temperature
m3/m3
aM1!
1) Permittivity, ε
3) Temperature
aM2!
1) Period, τ
3) Temperature
µSec
°C
aM3!
1) Volumetric Water Content, θ
6) Voltage Ratio, α
m3/m3
aM4! .. aM9!
No Values Returned
?!
Returns the SDI-12 Address
aI!
CampbellSci, OS version, Product
Serial Number
CAUTION
(“a” is the sensor
Up to 10 CS650’s may be connected to the same datalogger control port as
long as each one has a unique SDI-12 address. The CS650 ships with a default
SDI-12 address of 0 unless otherwise specified at the time of ordering. The
SDI-12 address may be changed through DevConfig software (see Section 6.4,
A200 and Device Configuration Utility) or with a terminal emulator in SDI-12
transparent mode (see Appendix B).
2) Electrical Conductivity, σ
2) Electrical Conductivity, σ
2) Voltage Ratio, α
2) Electrical Conductivity, σ
3) Temperature
4) Permittivity, ε
5) Period, τ
dS/m
°C
dS/m
°C
dS/m
°C
µSec
6.5.1 Use of Multiplexers
18
SDI-12 communication is established using the CRBasic instruction
SDI12Recorder for CRBasic dataloggers or the Edlog program instruction
P105 SDI-12 Recorder. See Appendix B for more detail on SDI-12
communication.
Multiplexers such as Campbell Scientific’s AM16/32B may be used to connect
up to 32 CS650 probes to a single control port. When using multiplexers, the
simplest configuration is for all probes to have the same SDI-12 address.
When multiplexing CS650 probes, the switched 12V channel should be used so
that power to the sensor may be turned off under program control before the
multiplexer switches to the next channel.
Failure to turn off the switched 12 volt channel before
clocking the multiplexer will result in damage to the
multiplexer relays.
Page 27

CS650 and CS655 Water Content Reflectometers
TABLE 6-5. Wiring For Program Example 1
The proper sequence in the datalogger program for measuring CS650 probes
on a multiplexer is:
1. Set RES control port high to enable multiplexer
2. Pulse CLK control port to advance to next multiplexer channel
3. Set switched 12 volt channel high to supply power to CS650
4. Send SDI-12 command(s) to CS650
5. Set switched 12 volt channel low to remove power from CS650
6. Repeat steps 2 – 5 for each CS650 connected to the multiplexer
7. Set RES control port low to disable multiplexer
Program examples in Section 6.6, Program Examples, show the commands
used in CRBasic and Edlog for this sequence.
6.6 Program Examples
6.6.1 CR1000 With a Single CS650 Probe
This CRBasic example program measures one CS650 probe on a CR1000
every 15 minutes, storing hourly averages of volumetric water content,
electrical conductivity, and soil temperature and samples of permittivity, period
average and voltage ratio. The CS650 has a SDI-12 address of 0. Wiring for
the example is shown in TABLE 6-5.
CR1000 CS650
12V Red
C1 Green
G Black, Orange, Clear
Code Example 1. CRBASIC Code: CR1000 Program to Measure a Single
CS650 Probe
Public CS650(6)
'Assign aliases to the public array
Alias CS650(1)=VWC: Alias CS650(2)=EC: Alias CS650(3)=TSoil
Alias CS650(4)=Perm: Alias CS650(5)=PerAvg: Alias CS650(6)=VoltR
Units VWC = m^3/m^3: Units EC = dS/m: Units TSoil = deg C
DataTable (DatoutCS650,1,-1)
DataInterval (0,60,Min,2)
Average (3,CS650(1),FP2,False)
Sample(3,CS650(4),IEEE4)
EndTable
BeginProg
Scan (15,Min,0,0)
SDI12Recorder (CS650(1),1,0,"M3!",1.0,0)
CallTable DatoutCS650 'Call Data Table
NextScan
EndProg
19
Page 28

CS650 and CS655 Water Content Reflectometers
TABLE 6-6. Wiring For Program Example 2
6.6.2 CR1000 With 2 CS650 Probes on Same Control Port
This CRBasic example program measures two CS650 probes on a CR1000
every 15 minutes, storing hourly averages of volumetric water content,
electrical conductivity, and soil temperature and samples of permittivity, period
average and voltage ratio. The first CS650 has a SDI-12 address of 0 and the
second an address of 1. Wiring for the example is shown in TABLE 6-6.
Assignment of aliases and units is not shown in this example but may be used
following Program Example 1 above.
CR1000 CS650’s (wiring same for both)
12V Red
C1 Green
G Black, Orange, Clear
Code Example 2. CRBASIC Code: CR1000 Program to Measure 2 CS650
Probes on the Same Control Port
Public CS650(6)
Public CS650_2(6)
DataTable (DatoutCS650,1,-1)
DataInterval (0,60,Min,2)
Average (3,CS650(1),FP2,False)
Sample(3,CS650(4),IEEE4)
Average (3,CS650_2(1),FP2,False)
Sample(3,CS650_2(4),IEEE4)
EndTable
BeginProg
Scan (15,Min,0,0)
SDI12Recorder (CS650(1),1,0,"M3!",1.0,0)
SDI12Recorder (CS650_2(1),1,1,"M3!",1.0,0)
CallTable DatoutCS650 'Call Data Table
NextScan
EndProg
6.6.3 CR1000 With 12 CS650 Probes on Multiplexer
This CRBasic example program measures 12 CS650 probes on a AM16/32B
multiplexer every 15 minutes, storing hourly averages of volumetric water
content, electrical conductivity, soil temperature, permittivity, period average,
and voltage ratio. All probes are addressed with SDI-12 address of 0. In this
example the probes are powered through the switched 12V channel and require
3 seconds warm-up time per probe. Total time to measure all 12 probes is
more than 36 seconds. Alternately, all of the red wires for the probes could be
connected to a bus separate from the multiplexer with the bus connected to
12V for continuous power. This would decrease measurement time. Wiring
for the example is shown in TABLE 6-7. Assignment of aliases and units is not
shown in this example but may be used following Program Example 1 above.
20
Page 29

CS650 and CS655 Water Content Reflectometers
TABLE 6-7. Wiring For Program Example 3
CR1000 AM16/32B (2x32 mode) CS650
12V 12V
G GND
C2 RES
C3 CLK
SW12 COM ODD H
C1 COM ODD L
G COM Ground
High Channels 1H – 12H Red
Low Channels 1L – 12L Green
Ground Channels to Left of Low
Channels
Black, Orange,
Clear
Code Example 3. CRBASIC Code: CR1000 Program to Measure 12
CS650 Probes on a AM16/32 Multiplexer
Dim LCount
Public CS650(12,6)
DataTable (DatoutCS650,1,-1)
DataInterval (0,60,Min,2)
Average (72,CS650(),IEEE4,False)
EndTable
BeginProg
Scan (15,Min,0,0)
PortSet(2,1) 'Turn AM16/32 Multiplexer On
Delay(0,150,mSec)
LCount=1
SubScan(0,uSec,12)
PulsePort(3,10000) 'Switch to next AM16/32 channel
SW12 (1 ) 'Apply power to CS650
Delay (0,3,Sec) 'Wait three seconds for probe to warm up
SDI12Recorder (CS650(LCount,1),1,0,"M!",1.0,0)
LCount=LCount+1
SW12 (0) 'Remove power from CS650
NextSubScan
PortSet(2,0) 'Turn AM16/32 Multiplexer Off
Delay(0,150,mSec)
CallTable DatoutCS650 'Call Data Table
NextScan
EndProg
6.6.4 CR10X With a Single CS650 Probe
This Edlog example program measures one CS650 probe on a CR10X every 15
minutes, storing hourly averages of volumetric water content, electrical
conductivity, soil temperature, permittivity, period average, and voltage ratio.
The CS650 has a SDI-12 address of 0. Wiring for the example is shown in
TABLE 6-8.
21
Page 30

CS650 and CS655 Water Content Reflectometers
TABLE 6-8. Wiring For Program Example 4
CR10X CS650
12V Red
C1 Green
G Black, Orange, Clear
Code Example 4. Edlog Code: CR10X Program to Measure a Single
CS650 Probe
;{CR10X}
;Inloc labels
;1 VWC
;2 EC
;3 Tsoil_C
;4 Ka
;5 PerAvg
;6 VR
*Table 1 Program
01: 900 Execution Interval (seconds)
1: SDI-12 Recorder (P105)
1: 0 SDI-12 Address
2: 3 Start Measurement (aM3!)
3: 1 Port
4: 1 Loc [ VWC ]
5: 1.0 Multiplier
6: 0.0 Offset
;Save data hourly
2: If time is (P92)
1: 0 Minutes (Seconds --) into a
2: 60 Interval (same units as above)
3: 10 Set Output Flag High (Flag 0)
3: Set Active Storage Area (P80)
1: 1 Final Storage Area 1
2: 60 Array ID
4: Real Time (P77)
1: 1220 Year,Day,Hour/Minute (midnight = 2400)
5: Average (P71)
1: 6 Reps
2: 1 Loc [ VWC ]
6.6.5 CR10X With 2 CS650 Probes on Same Control Port
22
This Edlog example program measures one CS650 probe on a CR10X every 15
minutes, storing hourly averages of volumetric water content, electrical
conductivity, soil temperature, permittivity, period average, and voltage ratio.
The first CS650 has a SDI-12 address of 0 and the second has address of 1.
Wiring for the example is shown in TABLE 6-9.
Page 31

CS650 and CS655 Water Content Reflectometers
TABLE 6-9. Wiring For Program Example 5
CR10X CS650’s (wiring same for both)
12V Red
C1 Green
G Black, Orange, Clear
Code Example 5. Edlog Code: CR10X Program to Measure a Two CS650
Probes on Same Control Port
;{CR10X}
;Inloc labels
;1 VWC ;7 VWC_2
;2 EC ;8 EC_2
;3 Tsoil ;9 Tsoil_2
;4 Ka ;10 Ka_2
;5 PerAvg ;11 PerAvg_2
;6 VR ;12 VR_2
*Table 1 Program
01: 900 Execution Interval (seconds)
1: SDI-12 Recorder (P105)
1: 0 SDI-12 Address
2: 3 Start Measurement (aM3!)
3: 1 Port
4: 1 Loc [ VWC ]
5: 1.0 Multiplier
6: 0.0 Offset
2: SDI-12 Recorder (P105)
1: 1 SDI-12 Address
2: 3 Start Measurement (aM3!)
3: 1 Port
4: 7 Loc [ VWC_2 ]
5: 1.0 Multiplier
6: 0.0 Offset
;Save data hourly
3: If time is (P92)
1: 0 Minutes (Seconds --) into a
2: 60 Interval (same units as above)
3: 10 Set Output Flag High (Flag 0)
4: Set Active Storage Area (P80)
1: 1 Final Storage Area 1
2: 60 Array ID
5: Real Time (P77)
1: 1220 Year,Day,Hour/Minute (midnight = 2400)
6: Average (P71)
1: 12 Reps
2: 1 Loc [ VWC ]
23
Page 32

CS650 and CS655 Water Content Reflectometers
TABLE 6-10. Wiring For Program Example 6
6.6.6 CR200X With 3 CS650 Probes
This CRBasic example program measures 3 CS650 probe on a CR200X every
15 minutes, storing hourly averages of volumetric water content, electrical
conductivity, soil temperature, permittivity, period average, and voltage ratio.
The CS650’s have SDI-12 addresses of 0, 1, and 2. Sensors are powered with
the SWBatt channel which requires a 3 second warm-up time. Alternately, the
red wires may be connected to Battery + for continuous power which would
reduce measurement time. Wiring for the example is shown in TABLE 6-10.
Assignment of aliases and units is not shown in this example but may be used
following Program Example 1 above.
CR200X CS650’s (Wiring same for all)
SW Battery Red
C1/SDI-12 Green
G channels Black, Orange, Clear
Code Example 6. CRBasic Code: CR200X Program to Measure 3 CS650
Probes
Public CS650(18)
DataTable (CS650,1,-1)
DataInterval (0,60,Min)
Average (18,CS650(),False)
EndTable
BeginProg
Scan (15,Min)
SWBatt (1 ) 'Apply power to CS650's
Delay (3,sec) 'Warm-up time of 3 seconds
'CS650 #1
SDI12Recorder (CS650(1),"0M3!",1,0)
'CS650 #2
SDI12Recorder (CS650(4),"1M3!",1,0)
'CS650 #3
SDI12Recorder (CS650(7),"2M3!",1,0)
SWBatt (0 ) 'Remove power from CS650's
CallTable CS650 'Call Data Table
NextScan
EndProg
24
Page 33

CS650 and CS655 Water Content Reflectometers
7. The Water Content Reflectometer Method for Measuring Volumetric Water Content
7.1 Description of Measurement Method
For the water content measurement, a differential emitter-coupled logic (ECL)
oscillator on the circuit board is connected to the two parallel stainless steel
rods. The differentially driven rods form an open-ended transmission line in
which the wave propagation velocity is dependent upon the dielectric
permittivity of the media surrounding the rods. An ECL oscillator state change
is triggered by the return of a reflected signal from the end of one of the rods.
The fundamental principle for CS650 water content measurement is that the
velocity of electromagnetic wave propagation along the probe rods is
dependent on the dielectric permittivity of the material surrounding the rods.
As water content increases, the propagation velocity decreases because of
increasing dielectric permittivity. Therefore, the two-way travel time of the
rod signal is dependent upon water content, hence the name water content
reflectometer. Digital circuitry scales the high-speed oscillator output to an
appropriate frequency for measurement by an onboard microprocessor.
Increases in oscillation period resulting from signal attenuation are corrected
using an electrical conductivity measurement. A calibration equation converts
period and electrical conductivity to bulk dielectric permittivity. The Topp
equation is used to convert from permittivity to volumetric water content.
7.2 The Topp Equation
The relationship between dielectric permittivity and volumetric water content
in mineral soils has been described by Topp et al. (1980) in an empirical
fashion using a 3
the bulk dielectric permittivity of the soil, the equation presented by
and K
a
Topp et al. is
It has been shown in numerous research efforts that this equation works well in
most mineral soils, so a soil specific calibration of the CS650 probe is usually
not necessary. If a soil specific calibration is desired, the user can generate an
equation relating K
Content Reflectomer User-Calibration.
rd
degree polynomial. With θv the volumetric water content
= -5.3*10-2 + 2.92*10-2Ka – 5.5*10-4K
θ
v
to θv following the methods described in Section 8, Water
a
7.3 Electrical Conductivity
7.3.1 Soil Electrical Conductivity
The quality of soil water measurements which apply electromagnetic fields to
wave guides is affected by soil electrical conductivity. The propagation of
electromagnetic fields in the configuration of the CS650 is predominantly
affected by changing dielectric permittivity due to changing water content, but
it is also affected by electrical conductivity. Free ions in soil solution provide
electrical conduction paths which result in attenuation of the signal applied to
the waveguides. This attenuation both reduces the amplitude of the highfrequency signal on the probe rods and reduces the bandwidth. The attenuation
reduces oscillation frequency at a given water content because it takes a longer
time to reach the oscillator trip threshold.
2
+ 4.3*10-6K
a
3
a
25
Page 34

CS650 and CS655 Water Content Reflectometers
σ
σ θ
σ
bulk solution
=
+
v solid
Τ
It is important to distinguish between soil bulk electrical conductivity and soil
solution electrical conductivity. Soil solution electrical conductivity refers to
the conductivity of the solution phase of soil. Soil solution electrical
conductivity, σ
solution
methods to separate the solution from the solid and then measuring the
electrical conductivity of the extracted solution.
The relationship between solution and bulk electrical conductivity can be
described by (Rhoades et al., 1976)
can be determined in the laboratory using extraction
with σ
bulk
solution; σ
being the electrical conductivity of the bulk soil; σ
, the solid constituents; θv, the volumetric water content; andΤ, a
solid
solution
, the soil
soil-specific transmission coefficient intended to account for the tortuosity of
the flow path as water content changes. See Rhoades et al., 1989 for a form of
this equation which accounts for mobile and immobile water. This publication
also discusses soil properties related to CS650 operation such as clay content
and compaction. The above equation is presented here to show the relationship
between soil solution electrical conductivity and soil bulk electrical
conductivity.
Most expressions of soil electrical conductivity are given in terms of solution
conductivity or electrical conductivity from extract since it is constant for a
soil. Bulk electrical conductivity increases with water content so comparison
of the electrical conductivity of different soils must be at the same water
content.
The calibration equation in the CS650 firmware corrects the oscillation
frequency for the effects of σ
10 dS m
0.8 dS m
-1
for the CS655. This is equivalent to σ
-1
and 2.7 dS m-1 respectively. If σ
up to 3 dS m-1 for the CS650 and up to
solution
values of approximately
bulk
exceeds these limits, the
bulk
CS650 probe will return 99999 for dielectric permittivity and volumetric water
content. The measured period average and voltage ratio values will continue to
be reported even if the bulk EC is outside the operational range of the probe.
26
7.3.2 Temperature Correction of Soil Electrical Conductivity
The EC value reported by the CS650 is bulk electrical conductivity. This value
is temperature dependent, changing by 2% per degree Celsius. To compensate
for the effect of temperature, EC readings may be converted to a standard
temperature, such as 25 °C using the following equation:
= ECT / (1 + 0.02*(T
EC
25
where EC
temperature T
is the σ
25
soil
value at 25 °C and ECT is the σ
bulk
(°C).
soil
-25)
value at soil
bulk
Page 35

CS650 and CS655 Water Content Reflectometers
7.4 Error Sources in Water Content Reflectometer Measurement
7.4.1 Probe-to-Probe Variability Error
All manufactured CS650s/CS655s are checked in standard media to develop a
probe specific span and offset value for electrical conductivity and dielectric
permittivity measurements. These probe specific values are written to the
probe’s firmware and minimize probe-to-probe variability.
7.4.2 Insertion Error
The method used for probe insertion can affect the accuracy of the
measurement. The probe rods should be kept as close to parallel as possible
when inserted to maintain the design wave guide geometry. The sensitivity of
this measurement is greater in the regions closest to the rod surface than at
distances away from the surface. Probes inserted in a manner that generates air
voids around the rods will indicate lower water content than actual. In some
applications, installation can be improved by using insertion guides or a pilot
tool. Campbell Scientific offers the CS650G insertion tool.
7.5 Temperature Dependence and Correction
The two temperature dependent sources of error in CS650 water content
measurements are the effect of temperature on the operation of the probe
electronics and the effect of temperature on the dielectric permittivity of the
soil.
The effect of temperature on probe electronics is minimal with period average
readings varying by less than 0.5% of the 20 °C reading over the range of 10°
to 30°C and less than 2% of the 20°C reading over the range of -10° to 70°C.
The larger error is caused by the change in dielectric permittivity of soil with
temperature. This is mostly due to the high temperature dependence of the
permittivity of water, which varies from a value of 88 at 0°C to 64 at 70°C.
Since water is the major contributor to bulk dielectric permittivity of soil,
temperature related changes to the permittivity of water will lead to
overestimation of volumetric water content at temperatures below 20°C and
underestimation of volumetric water content at temperatures above 20°C.
The Topp equation does not account for soil temperature. The effect of
temperature on the soil permittivity is related to soil specific properties such as
porosity and the permittivity of the soil solid phase with temperature.
Consequently, a general equation that corrects volumetric water content for
temperature for all soils is not available.
A temperature correction equation that works well in quartz sand is given by:
= θ - 0.0044*Tθ3 + 0.0014*Tθ2 + 0.0029*Tθ – 0.0002*T + 2.4*θ3 –
θ
Corr
where θ
temperature in °C, and θ is the volumetric water content value at soil
temperature T.
is the temperature corrected volumetric water content, T is soil
Corr
2
+ 0.32*θ – 0.046
1.6*θ
27
Page 36

CS650 and CS655 Water Content Reflectometers
7.5.1 Accurate Soil Temperature Measurement
The thermistor used for measuring soil temperature is located in the probe head
and is in contact with one of the stainless steel rods. In order to make an
accurate soil temperature measurement, the probe head should be buried in the
soil so that it is insulated from diurnal temperature fluctuations.
8. Water Content Reflectometer User-Calibration
8.1 Need for Soil Specific Calibration Equation
While the Topp equation has been determined to work well in a wide range of
mineral soils, there are soils for which a user-derived calibration will optimize
accuracy of the volumetric water content measurement. The Topp equation
underestimates the water content of some organic, volcanic, and fine textured
soils. Additionally, porous media with porosity greater than 0.5 or bulk density
greater than 1.55 g cm
In these cases, the user may develop a calibration equation to convert CS650
permittivity to volumetric water content over the range of water contents the
probe is expected to measure.
-3
may require a media-specific calibration equation.
8.2 The User-Derived Calibration Equation
The relationship between soil permittivity and volumetric water content may be
described by a quadratic equation or a 3
applications, a linear equation similar to Ledieu et al (1986) gives required
accuracy.
Quadratic form:
) = C0 + C1*Ka + C2*K
θ
v(Ka
with θ
the volumetric water content, Ka the bulk dielectric permittivity of the
v
soil, and C
rd
degree polynomial form:
3
with θ
soil, and C
, the calibration coefficient.
n
θ
) = C0 + C1*Ka + C2*K
v(Ka
the volumetric water content, Ka the bulk dielectric permittivity of the
v
, the calibration coefficient.
n
Linear form:
θ
v(Ka
rd
order polynomial. In many
) = C0 + C1*K
a
2
+ C3*K
a
0.5
a
2
3
a
28
with θ
the volumetric water content, Ka the bulk dielectric permittivity of the
v
soil, and C
, the calibration coefficient.
n
Two data points from careful measurements can be enough to derive a linear
calibration. A minimum of three data points are needed for a quadratic
calibration. With three evenly spaced water contents covering the expected
range, the middle water content data point will indicate whether a linear or
polynomial calibration equation is needed.
Page 37

CS650 and CS655 Water Content Reflectometers
A minimum of four data points are required for derivation of a 3rd degree
polynomial. Data points should be spaced as evenly as practical over the
expected range of water content and include the wettest and driest expected
values.
8.3 Collecting Laboratory Data for Calibration
Water content reflectometer data needed for CS650 calibration are the CS650
permittivity reading and an independently determined volumetric water
content. From this data, the probe response to changing water content can be
described by a linear or polynomial function as described in Section 8.2, The
User-Derived Calibration Equation.
Required equipment:
1. CS650 connected to datalogger programmed to measure permittivity
2. Cylindrical sampling devices to determine sample volume for bulk
density, e.g. copper tubing of diameter ≥ 1” and length about 2”
3. Containers and scale to measure soil sample mass
4. Oven to dry samples (microwave oven can also be used)
The calibration coefficients are derived from a curve fit of known water
content and probe permittivity output. The number of data sets needed to
derive a calibration depends on the form of the calibration equation. At least
three data sets should be generated to determine whether the linear form is
valid. If a polynomial is to be used, four data sets will determine whether the
rd
function is a quadratic or 3
order polynomial. Accuracy requirements may
require additional data sets. Consider the expected range of soil water content
and include data sets from the highest and lowest expected water contents.
The measurement sensitive volume around the probe rods must be completely
occupied by the calibration soil. Only soil should be in the region within
10 cm (4 inches) of the rod surface. The probe rods can be buried in a tray of
soil that is dry or nearly dry. The soil will be homogeneous around the probe
rods if it is poured around the rods while dry. Also, a 20 cm diameter PVC
pipe with length about 35 cm can be closed at one end and used as the
container.
It is important that the bulk density of the soil used for calibration be similar to
the bulk density of the undisturbed soil. Using dry soil without compaction will
-3
give a typical bulk density, 1.1 - 1.4 g cm
bulk density is greater than 1.55 g cm
. This is especially important when
-3
. Compaction of the calibration soil to
similar bulk density at the field site is necessary for an accurate calibration.
The typically used method for packing a container of soil to uniform bulk
density is to roughly separate the soil into three or more equal portions and add
one portion to the container with compaction. Evenly place the first loose soil
layer in the bottom of the container. Compact by tamping the surface to a level
in the container that is correct for the target bulk density. Repeat for the
remaining layers. Prior to placing successive layers, scarify (loosen) the top of
the existing compacted layer.
29
Page 38

CS650 and CS655 Water Content Reflectometers
The container to hold the soil during calibration should be non-metal and large
enough that the rods of the probe are no closer than about 10 cm from any
container surface.
Pack the container as uniformly as possible in bulk density with relatively dry
soil (volumetric water content <10%).
Probe rods can be buried in a tray or inserted into a column. When using a
column, insert the rods carefully through surface until rods are completely
surrounded by soil. Movement of rods from side-to-side during insertion can
form air voids around rod surface and lead to measurement error.
Collect the probe permittivity output. Repeat previous step and this step 3 or 4
times.
Determine volumetric water content by subsampling soil column after
removing probe or using mass of column. If subsampling is used, remove soil
from column and remix with samples used for water content measurement.
Repack column.
Water can then be added to the top of the container. It must be allowed to
equilibrate. Cover the container during equilibration to prevent evaporation.
The time required for equilibration depends on the amount of water added and
the hydraulic properties of the soil. Equilibration can be verified by frequently
observing the CS650 permittivity output. When permittivity is constant,
equilibration is achieved. Collect a set of calibration data values and repeat
the water addition procedure again if needed.
With soil at equilibrium, record the CS650 permittivity.
Take subsamples of the soil using containers of known volume. This is
necessary for measurement of bulk density. Copper tubing of diameter ≥ 1”
and length about 2” works well. The tubes can be pressed into the soil surface.
It is good to take replicate samples. Three carefully handled samples will
provide good results.
The sample tubes should be pushed evenly into the soil. Remove the tube and
sample and gently trim the ends of excess soil. Remove excess soil from
outside of tube.
Remove all the soil from tube to a tray or container of known mass that can be
put in oven or microwave. Weigh and record the wet soil mass.
Water is removed from the sample by heating with oven or microwave. Oven
drying requires 24 hours at 105°C. Microwave drying typically takes 20
minutes depending on microwave power and sample water content. ASTM
Method D4643-93 requires heating in microwave for 3 minutes, cooling in
desiccator then weighing and repeating this process until measured mass is
constant.
30
Page 39

CS650 and CS655 Water Content Reflectometers
θ
g
wet dry
dry
m m
m
=
−
ρ
bulk
dry
cylinder
m
volume
=
θ θ ρ
v g
bulk
= *
Gravimetric water content is calculated after the container mass is accounted
for.
For the bulk density
the dry mass of the sample is divided by the sample tube volume.
The volumetric water content is the product of the gravimetric water content
and the bulk density
The average water content for the replicates and the recorded CS650
permittivity are one datum pair to be used for the calibration curve fit.
8.4 Collecting Field Data for Calibration
Required equipment
1. CS650 connected to datalogger programmed to measure probe permittivity
2. Cylindrical sampling devices to determine sample volume for bulk density,
e.g. copper tubing of diameter ≥ 1” and length about 2”
3. Containers and scale to measure soil sample mass
4. Oven to dry samples (microwave oven can also be used)
Data needed for CS650 calibration are the CS650 permittivity output and an
independently determined volumetric water content. From this data, the probe
response to changing water content can be described by a function as described
in Section 8.2, The User-Derived Calibration Equation.
The calibration coefficients are derived from a curve fit of known water
content and probe permittivity output. The number of data sets needed to
derive a calibration depends on the form of the calibration equation. At least
three data sets should be generated to determine whether the linear form is
valid. If a polynomial is to be used, four data sets will determine whether the
function is a quadratic or 3
require additional data sets. Consider the expected range of soil water content
and include data sets from the highest and lowest expected water contents.
rd
order polynomial. Accuracy requirements may
Collecting measurements of CS650 permittivity and core samples from the
location where the probe is to be used will provide the best on-site soil-specific
calibration. However, intentionally changing water content in soil profiles can
be difficult.
31
Page 40

CS650 and CS655 Water Content Reflectometers
θ
g
wet dry
dry
m m
m
=
−
ρ
bulk
dry
cylinder
m
volume
=
A vertical face of soil can be formed with a shovel. If the CS650 is to be used
within about 0.5 meters of the surface, the probe can be inserted into the face
and water added to the surface with percolation. After adding water, monitor
the CS650 permittivity to determine if the soil around the rods is at
equilibrium.
With soil at equilibrium, record the CS650 permittivity.
Soil hydraulic properties are spatially variable. Obtaining measurements that
are representative of the soil on a large scale requires multiple readings and
sampling. The average of several core samples should be used to calculate
volumetric water content. Likewise, the CS650 should be inserted at least 3
times into the soil recording the permittivitys following each insertion and
using the average.
Remove the CS650 and take core samples of the soil where the probe rods
were inserted. This is necessary for measurement of bulk density. Copper
tubing of diameter ≥ 1 inch and length about 2 inch works well. The tubes can
be pressed into the soil surface.
It is good to take replicate samples at locations around the soil surface. Three
carefully handled samples will provide good results.
The sample tubes should be pushed evenly into the soil surface. Remove the
tube and sample and gently trim the ends of excess soil. Remove excess soil
from outside of tube.
Remove all the soil from tube to a tray or container of known mass that can be
put in oven or microwave. Weigh and record the wet soil mass. If samples
must be stored prior to weighing, seal the container with tape or inside a plastic
bag to prevent water loss and store away from direct sunlight.
Water is removed from the sample by heating with oven or microwave. Oven
drying requires 24 hours at 105°C. Microwave drying typically takes 20
minutes depending on microwave power and sample water content. ASTM
Method D4643-93 requires heating in microwave for 3 minutes, cooling in
desiccator then weighing and repeating this process until mass is constant.
Gravimetric water content is calculated after the container mass is accounted
for.
For the bulk density,
32
the dry mass of the sample is divided by the sample tube volume.
Page 41

The volumetric water content is the product of the gravimetric water content
θ θ ρ
v g bulk
= *
volume
d
h=
π*
*
2
2
θ
g
wet dry
dry
m m
m
=
−
ρ
bulk
dry
cylinder
m
volume
=
θ θ ρ
v g bulk
= *
and the bulk density
The average water content for the replicates and the recorded CS650 period are
one datum pair to be used for the calibration curve fit.
8.5 Calculations
The empty cylinders used for core sampling should be clean and both empty
mass and volume are measured and recorded. For a cylinder, the volume is
where d is the inside diameter of the cylinder and h is the height of the
cylinder.
During soil sampling it is important that the cores be completely filled with soil
but not extend beyond the ends of the cylinder.
CS650 and CS655 Water Content Reflectometers
Once soil core samples are obtained, place the soil-filled cylinder in a small
tray of known empty mass. This tray will hold the core sample during drying in
an oven.
To obtain m
, subtract the cylinder empty mass and the container empty mass
wet
from the mass of the soil filled cylinder in the tray. Remove all the soil from
the cylinder and place this soil in the tray. Dry the samples using oven or
microwave methods as described above.
To obtain m
mass for m
, weigh the tray containing the soil after drying. Subtract tray
dry
. Calculate gravimetric water content, θg, using
dry
.
To obtain soil bulk density, use
Volumetric water content is calculated using
.
9. Maintenance
The CS650 does not require periodic maintenance.
33
Page 42

CS650 and CS655 Water Content Reflectometers
10. Troubleshooting
Symptom Possible Cause Solution
All CS650 output
values read 0
First value reads
NAN and all other
values read 0* or
never change from
one measurement to
another
(*or all values read
NAN if the program
examples in this
manual are followed)
No SDI12Recorder
instruction in
datalogger program
Conditional
statement that
triggers reading is not
evaluating as true
CS650 SDI-12
address does not
match address
specified in
datalogger program
CS650 green wire not
attached to SDI port
specified in
datalogger program
CS650 not being
powered
SW12V channel not
turning on
Add SDI12Recorder
instruction (P105 for Edlog
dataloggers) to datalogger
program
Check logic of conditional
statement that triggers
readings
Change probe address or
modify program so that
they match
Connect wire to correct
control port or modify
program to match wiring
Make sure red wire is
connected to 12V or
SW12V and black wire to
G.
If using SW12 to power
sensor, make sure red wire
is connected and
datalogger program
switches SW12 on.
If using SW 12V on a
CR10X, ensure that a wire
connects a control port to
SW12V CTRL and the
program sets that control
port high.
34
VWC reading is
9999999
EC reading is
9999999
Readings erratic,
including NAN’s and
9999999’s
Soil bulk permittivity
is outside probe’s
operational range
Soil bulk electrical
conductivity is
outside probe’s
operational range
Multiple probes with
same SDI-12 address
sharing same control
port
Modify program to collect
permittivity value and try
soil specific calibration
If using CS650, try CS655
Give probes unique
addresses or put on
separate control ports
Page 43

11. References
CS650 and CS655 Water Content Reflectometers
Ledieu, J., P. De Ridder, P. De Clerck, and S. Dautrebande. 1986. “A method
of measuring soil moisture by time-domain reflectometry,” J. Hydrol.
88:319-328.
Rhoades, J.D., P.A.C. Raats, and R.J. Prather. 1976. Effects of liquid-phase
electrical conductivity, water content and surface conductivity on bulk soil
electrical conductivity. Soil Sci. Soc. Am. J., 40: 651-653.
Rhoades, J.D., N.A. Manteghi, P.J. Shouse, W.J. Alves. 1989. Soil electrical
conductivity and soil salinity: New formulations and calibrations. Soil
Sci. Soc. Am. J., 53:433-439.
Topp, G.C., J.L. Davis & A.P. Annan. 1980. “Electromagnetic determination
of soil water content: measurements in coaxial transmission lines,” Water
Resources Research, v. 16, No. 3:574-582.
35
Page 44

CS650 and CS655 Water Content Reflectometers
36
Page 45

θ
g
water
soil
wet dry
dry
m
m
m m
m
= =
−
θ
ρ
ρ
θ ρ
ρ
v
water
soil
water
water
soil
soil
g soil
water
volume
volume
m
m
= = =
*
ρ
bulk
dry
sample
m
volume
=
ε
ρ
ρ
= −1
bulk
solid
Appendix A. Discussion of Soil Water Content
The water content reflectometer measures volumetric water content. Soil water
content is expressed on a gravimetric and a volumetric basis. To obtain the
independently determined volumetric water content, gravimetric water content
must first be measured. Gravimetric water content (θg) is the mass of water
per mass of dry soil. It is measured by weighing a soil sample (m
the sample to remove the water, then weighing the dried soil (m
wet
dry
), drying
).
Volumetric water content (θ
Volume is the ratio of mass to density (ρ
) is the volume of liquid water per volume of soil.
v
) which gives:
b
The density of water is close to 1 and often ignored.
Soil bulk density (ρ
) is used for ρ
bulk
and is the ratio of soil dry mass to
soil
sample volume.
Another useful property, soil porosity (ε), is related to soil bulk density as
shown by the following expression.
The term ρ
2.65 g cm
is the density of the soil solid fraction and is approximately
solid
-3
.
A-1
Page 46

Page 47

TABLE B-1. CS650 SDI-12 Command and Response Set
Appendix B. SDI-12 Sensor Support
B.1 SDI-12 Command Basics
SDI-12 commands have three components:
Sensor address (a) – a single character, and is the first character of the
command. CS650 sensors are usually assigned a default address of zero unless
option –VS is selected at the time of ordering. Sensors with the –VS option are
addressed with the last digit of the probe’s serial number. This allows for
multiple CS650’s to be connected to a single control port without requiring the
user to change the SDI-12 addresses from zero.
Command body (e.g., M1) – an upper case letter (the “command”) followed by
alphanumeric qualifiers.
Command termination (!) – an exclamation mark.
An active sensor responds to each command. Responses have several standard
forms and terminate with <CR><LF> (carriage return – line feed).
SDI-12 commands supported by the CS650 are listed in TABLE B-1.
Continuous and concurrent measurements are not supported.
Name Command Response
Acknowledge
Active
Send Identification aI! allccccccccmmmmmmvvvxxx...xx<CR>
Change Address aAb! b<CR><LF>
Address Query ?! a<CR><LF>
Start Measurement aM! atttn<CR><LF>
Send Data aD0!
Additional
Measurements
a! a<CR><LF>
<LF>
a<values><CR><LF>
aD1!
aM1!
aM2!
aM3!
a<values><CR><LF>
atttn<CR><LF>
atttn<CR><LF>
atttn<CR><LF>
Address Query Command (?!)
Command ?! requests the address of the connected sensor. The sensor replies
to the query with the address, a.
B-1
Page 48

Appendix B. SDI-12 Sensor Support
Change Address Command (aAb!)
Sensor address is changed with command aAb!, where a is the current address
and b is the new address. For example, to change an address from 0 to 2, the
command is 0A2! The sensor responds with the new address b, which in this
case is 2.
Send Identification Command (aI!)
Sensor identifiers are requested by issuing command aI!. The reply is defined
by the sensor manufacturer, but usually includes the sensor address, SDI-12
version, manufacturer's name, and sensor model information. Serial number or
other sensor specific information may also be included.
An example of a response from the aI! command is:
313CampbellCS65X 000Std.00.35=2196405 <CR><LF>
where:
Address = 3
SDI-12 version =1.3
Manufacturer = Campbell
Sensor model = CS65X
OS version = 000Std.00.35
Sensor serial number = 2196405
Start Measurement Commands (aM! )
A measurement is initiated with M! commands. The response to each
command has the form atttnn, where
a = sensor address
ttt = time, in seconds, until measurement data are available
nn = the number of values to be returned when one or more subsequent D!
commands are issued.
Start Measurement Command (aMv!)
Qualifier v is a variable between 1 and 3 that requests variant data. Variants
include different subsets of the CS650 probe output:
M0! Volumetric Water Content (θ), Bulk Electrical Conductivity
(σ), Temperature (°C)
B-2
M1! Permittivity (ε), Bulk Electrical Conductivity (σ), Temperature (°C)
M2! Period (τ), Voltage Ratio (α), Temperature (°C)
M3! Volumetric Water Content (θ), Bulk Electrical Conductivity
(σ), Temperature (°C), Permittivity (ε), Period (τ), Voltage Ratio (α)
Page 49

Appendix B. SDI-12 Sensor Support
Aborting a Measurement Command
A measurement command (M!) is aborted when any other valid command is
sent to the sensor.
Send Data Command (aDv!)
This command requests data from the sensor. It is normally issued
automatically by the datalogger after measurement commands aMv! In
transparent mode, the user asserts this command to obtain data. If the expected
number of data values are not returned in response to a aD0! command, the
data logger issues aD1! The limiting constraint is that the total number of
characters that can be returned to a aD0! command is 35 characters. If the
number of characters exceed the limit, the remainder of the response are
obtained with the subsequent aD1! command.
B.2 Changing the SDI-12 Address Using Terminal
Emulator and a Datalogger
Up to ten CS650’s or other SDI-12 sensors can be connected to a single
datalogger control port. Each SDI-12 device on the same control port must
have a unique SDI-12 address. The CS650 supports addresses of 0-9, a-z, and
A-Z.
The factory-set SDI-12 address for the CS650 is 0 when the probe is ordered
with the –DS option or the last digit of its serial number when ordered with the
–VS option. The CS650 SDI-12 address is changed by issuing the aAb!
command where a is the current address and b is the new address. The current
address can be found by issuing the ?! command.
The easiest way to change the address on a CS650 sensor is with the Device
Configuration Utility and a A200 Sensor to PC Interface as described in
Section 6.4, A200 and Device Configuration Utility. However if a A200 is not
available, it is possible to change the address by connecting a single CS650 to a
SDI-12 compatible control port on a datalogger and utilizing SDI-12
transparent mode to send commands directly to the sensor.
B.2.1 SDI-12 Transparent Mode
System operators can manually interrogate and enter settings in probes using
transparent mode. Transparent mode is useful in troubleshooting SDI-12
systems because it allows direct communication with probes. Datalogger
security may need to be unlocked before transparent mode can be activated.
Transparent mode is entered while the PC is in telecommunications with the
datalogger through a terminal emulator program. It is easily accessed through
Campbell Scientific datalogger support software, but is also accessible with
terminal emulator programs such as Windows HyperTerminal. Datalogger
keyboards and displays cannot be used.
The terminal emulator is accessed by navigating to the Datalogger menu in
PC200W, the Tools menu in PC400, or the Datalogger menu in the Connect
screen of LoggerNet.
B-3
Page 50

Appendix B. SDI-12 Sensor Support
The following examples show how to use LoggerNet software to enter
transparent mode and change the SDI-12 address of a CS650 sensor. The same
steps are used to enter transparent mode with PC200W and PC400 software
after accessing the terminal emulator as previously described.
B.2.2 CR200(X) Series Datalogger Example
1. Connect a single CS650 to the datalogger as follows:
2. In the LoggerNet Connect screen navigate to the Datalogger menu and
3. Click on the Open Terminal button.
4. Press the <enter> key until the datalogger responds with the “CR2XX>”
• Green to Control Port C1/SDI12
• Black, Orange, Clear to G
• Red to Battery +
select Terminal Emulator. The “Terminal Emulator” window will open.
In the Select Device menu, located in the lower left-hand side of the
window, select the CR200Series station.
prompt. At the “CR2XX>” prompt, make sure the All Caps Mode box is
checked and enter the command SDI12 <enter>. The response
“SDI12>” indicates that the CS650 is ready to accept SDI-12 commands.
5. To query the CS650 for its current SDI-12 address, key in ?! <enter> and
the CS650 will respond with its SDI-12 address. If no characters are typed
within 60 seconds, then the mode is exited. In that case, simply enter the
command SDI12 again and press <enter>.
FIGURE B-1. SDI-12 transparent mode on CR200(X)-series datalogger
using control port C1/SDI12 and changing SDI-12 address from 0 to
1
6. To change the SDI-12 address, key in aAb!<enter> where a is the
current address from the above step and b is the new address. The CS650
will change its address and the datalogger will respond with the new
B-4
Page 51

address. To exit SDI-12 transparent mode select the Close Terminal
button.
B.2.3 CR1000 Datalogger Example
1. Connect a single CS650 to the datalogger as follows:
• Green to Control Port C1
• Black, Orange, Clear to G
• Red to 12V
2. In the LoggerNet Connect screen navigate to the Datalogger menu and
select Terminal Emulator. The “Terminal Emulator” window will open.
In the Select Device menu, located in the lower left-hand side of the
window, select the CR1000 station.
3. Click on the Open Terminal button.
4. Press the <enter> key until the datalogger responds with the “CR1000>”
prompt. At the “CR1000>” prompt, make sure the All Caps Mode box is
checked and enter the command SDI12 <enter>. At the “Enter Cx Port 1,
3, 5, or 7” prompt, key in the control port number where the CS650 green
lead is connected and <enter>. The response “Entering SDI12 Terminal”
indicates that the CS650 is ready to accept SDI-12 commands.
Appendix B. SDI-12 Sensor Support
5. To query the CS650 for its current SDI-12 address, key in ?! <enter> and
the CS650 will respond with its SDI-12 address. If no characters are typed
within 60 seconds, then the mode is exited. In that case, simply enter the
command SDI12 again, press <enter>, and key in the correct control port
number when prompted.
FIGURE B-2. SDI-12 transparent mode on CR1000 datalogger using
control port 1 and changing SD1-12 address from 3 to 1
B-5
Page 52

Appendix B. SDI-12 Sensor Support
6. To change the SDI-12 address, key in aAb!<enter> where a is the
B.2.4 CR10X Datalogger Example
1. Connect a single CS650 to the datalogger as follows:
2. Download a datalogger program that contains the SDI-12 Recorder (P105)
3. In the LoggerNet Connect screen navigate to the Datalogger menu and
current address from the above step and b is the new address. The CS650
will change its address and the datalogger will respond with the new
address. To exit SDI-12 transparent mode, press the Esc key or wait for
the 60 second timeout, then select the Close Terminal button.
• Green to Control Port C1
• Black, Orange, Clear to G
• Red to 12V
instruction with valid entries for each parameter. Make sure that
parameter 3 of the P105 instruction matches the control port number where
the green wire is connected.
select Terminal Emulator. The “Terminal Emulator” window will open.
In the Select Device menu, located in the lower left-hand side of the
window, select the CR10X station.
4. Click on the Open Terminal button.
5. Press the <enter> key until the datalogger responds with the “*” prompt.
6. To activate the SDI-12 Transparent Mode on Control Port p, enter pX
<enter>. For this example key in 1X <enter>. The datalogger will respond
with “entering SDI-12”. If any invalid SDI-12 command is issued,
the datalogger will exit the SDI-12 Transparent Mode.
7. To query the CS650 for its current SDI-12 address, enter the command ?!.
The CS650 will respond with the current SDI-12 address.
8. To change the SDI-12 address, enter the command aAb!; where a is the
current address from the above step and b is the new address. The CS650
will change its address and the datalogger will exit the SDI-12 Transparent
Mode.
9. Activate the SDI-12 Transparent Mode on Control Port 1 again by entering
1X <enter>. Verify the new SDI-12 address by entering the ?! command.
The CS650 will respond with the new address.
10. To exit the SDI-12 Transparent Mode, enter *.
B-6
Page 53

Appendix B. SDI-12 Sensor Support
FIGURE B-3. SDI-12 transparent mode on CR10X datalogger using
control port 1 and changing SDI-12 address from 0 to 1
B.2.5 CR10X-PB Table-Based Datalogger Example
1. Connect a single CS650 to the datalogger as follows:
• Green to Control Port C1
• Black, Orange, Clear to G
• Red to 12V
2. Download a datalogger program that contains the SDI-12 Recorder (P105)
instruction with valid entries for each parameter. Make sure that
parameter 3 of the P105 instruction matches the control port number where
the green wire is connected.
3. In the LoggerNet Connect screen navigate to the Datalogger menu and
select Terminal Emulator. The “Terminal Emulator” window will open.
In the Select Device menu, located in the lower left-hand side of the
window, select the CR10XTD or CR10XPB station.
4. Click on the Open Terminal button.
5. Press the <enter> key until the datalogger responds with the “>” prompt.
6. To activate the SDI-12 Transparent Mode on Control Port p, enter *8. The
TD datalogger will respond with a “.” prompt. At the “.” prompt enter #.
The TD datalogger will respond with 150000. Finally, enter p (Control
Port p) and press the <enter> key. For this example, p = 1. The TD
datalogger will respond with “entering SDI-12”. If any invalid
SDI-12 command is issued, the datalogger will exit the SDI-12
Transparent Mode.
7. To query the CS650 for its current SDI-12 address, enter the command ?!.
The CS650 will respond with the current SDI-12 address.
B-7
Page 54

Appendix B. SDI-12 Sensor Support
8. To change the SDI-12 address, enter the command aAb!; where a is the
9. Activate the SDI-12 Transparent Mode on Control Port 1 again by entering
10. To exit the SDI-12 Transparent Mode, type in *0.
current address from the above step and b is the new address. The CS650
will change its address and the datalogger will exit the SDI-12 Transparent
Mode.
*8#1 <enter>. Verify the new SDI-12 address by entering the ?! command.
The CS650 will respond with the new address.
FIGURE B-4. SDI-12 transparent mode on CR10X-PB table-based
datalogger using control port 1 and changing SDI-12 address from
0 to 1
B-8
Page 55

Page 56

Campbell Scientific Companies
Campbell Scientific, Inc. (CSI)
815 West 1800 North
Logan, Utah 84321
UNITED STATES
www.campbellsci.com • info@campbellsci.com
Campbell Scientific Africa Pty. Ltd. (CSAf)
PO Box 2450
Somerset West 7129
SOUTH AFRICA
www.csafrica.co.za • cleroux@csafrica.co.za
Campbell Scientific Australia Pty. Ltd. (CSA)
PO Box 8108
Garbutt Post Shop QLD 4814
AUSTRALIA
www.campbellsci.com.au • info@campbellsci.com.au
Campbell Scientific do Brasil Ltda. (CSB)
Rua Apinagés, nbr. 2018 ─ Perdizes
CEP: 01258-00 ─ São Paulo ─ SP
BRASIL
www.campbellsci.com.br • vendas@campbellsci.com.br
Campbell Scientific Canada Corp. (CSC)
14532 – 131 Avenue NW
Edmonton AB T5L 4X4
CANADA
www.campbellsci.ca • dataloggers@campbellsci.ca
Campbell Scientific Centro Caribe S.A. (CSCC)
300 N Cementerio, Edificio Breller
Santo Domingo, Heredia 40305
COSTA RICA
www.campbellsci.cc • info@campbellsci.cc
Campbell Scientific Ltd. (CSL)
Campbell Park
80 Hathern Road
Shepshed, Loughborough LE12 9GX
UNITED KINGDOM
www.campbellsci.co.uk • sales@campbellsci.co.uk
Campbell Scientific Ltd. (CSL France)
3 Avenue de la Division Leclerc
92160 ANTONY
FRANCE
www.campbellsci.fr • info@campbellsci.fr
Campbell Scientific Ltd. (CSL Germany)
Fahrenheitstraße 13
28359 Bremen
GERMANY
www.campbellsci.de • info@campbellsci.de
Campbell Scientific Spain, S. L. (CSL Spain)
Avda. Pompeu Fabra 7-9, local 1
08024 Barcelona
SPAIN
www.campbellsci.es • info@campbellsci.es
Please visit www.campbellsci.com to obtain contact information for your local US or international representative.
 Loading...