

Page 1
CS616 and
CS625
Water Content
Reflectometers
Revision: 05/2020
Copyright © 2002 – 2020
Campbell Scientific
CSL I.D - 467
Page 2

Page 3

Guarantee
This equipment is guaranteed against defects in materials and workmanship.
We will repair or replace products which prove to be defective during the
guarantee period as detailed on your invoice, provided they are returned to us
prepaid. The guarantee will not apply to:
Equipment which has been modified or altered in any way without the
written permission of Campbell Scientific
Batteries
Any product which has been subjected to misuse, neglect, acts of God or
damage in transit.
Campbell Scientific will return guaranteed equipment by surface carrier
prepaid. Campbell Scientific will not reimburse the claimant for costs incurred
in removing and/or reinstalling equipment. This guarantee and the Company’s
obligation thereunder is in lieu of all other guarantees, expressed or implied,
including those of suitability and fitness for a particular purpose. Campbell
Scientific is not liable for consequential damage.
Please inform us before returning equipment and obtain a Repair Reference
Number whether the repair is under guarantee or not. Please state the faults as
clearly as possible, and if the product is out of the guarantee period it should
be accompanied by a purchase order. Quotations for repairs can be given on
request. It is the policy of Campbell Scientific to protect the health of its
employees and provide a safe working environment, in support of this policy a
“Declaration of Hazardous Material and Decontamination” form will be
issued for completion.
When returning equipment, the Repair Reference Number must be clearly
marked on the outside of the package. Complete the “Declaration of
Hazardous Material and Decontamination” form and ensure a completed copy
is returned with your goods. Please note your Repair may not be processed if
you do not include a copy of this form and Campbell Scientific Ltd reserves
the right to return goods at the customers’ expense.
Note that goods sent air freight are subject to Customs clearance fees which
Campbell Scientific will charge to customers. In many cases, these charges are
greater than the cost of the repair.
Campbell Scientific Ltd,
80 Hathern Road,
Shepshed, Loughborough, LE12 9GX, UK
Tel: +44 (0) 1509 601141
Fax: +44 (0) 1509 270924
Email: support@campbellsci.co.uk
www.campbellsci.co.uk
Page 4

Page 5

PLEASE READ FIRST
About this manual
Please note that this manual was originally produced by Campbell Scientific Inc. primarily for the North
American market. Some spellings, weights and measures may reflect this origin.
Some useful conversion factors:
Area: 1 in2 (square inch) = 645 mm2
Length: 1 in. (inch) = 25.4 mm
1 ft (foot) = 304.8 mm
1 yard = 0.914 m
1 mile = 1.609 km
In addition, while most of the information in the manual is correct for all countries, certain information
is specific to the North American market and so may not be applicable to European users.
Differences include the U.S standard external power supply details where some information (for
example the AC transformer input voltage) will not be applicable for British/European use. Please note,
however, that when a power supply adapter is ordered it will be suitable for use in your country.
Reference to some radio transmitters, digital cell phones and aerials may also not be applicable
according to your locality.
Some brackets, shields and enclosure options, including wiring, are not sold as standard items in the
European market; in some cases alternatives are offered. Details of the alternatives will be covered in
separate manuals.
Part numbers prefixed with a “#” symbol are special order parts for use with non-EU variants or for
special installations. Please quote the full part number with the # when ordering.
Mass: 1 oz. (ounce) = 28.35 g
1 lb (pound weight) = 0.454 kg
Pressure: 1 psi (lb/in2) = 68.95 mb
Volume: 1 UK pint = 568.3 ml
1 UK gallon = 4.546 litres
1 US gallon = 3.785 litres
Recycling information
At the end of this product’s life it should not be put in commercial or domestic refuse but
sent for recycling. Any batteries contained within the product or used during the
products life should be removed from the product and also be sent to an appropriate
recycling facility.
Campbell Scientific Ltd can advise on the recycling of the equipment and in some cases
arrange collection and the correct disposal of it, although charges may apply for some
items or territories.
For further advice or support, please contact Campbell Scientific Ltd, or your local agent.
Campbell Scientific Ltd, 80 Hathern Road, Shepshed, Loughborough, LE12 9GX,
UK Tel: +44 (0) 1509 601141 Fax: +44 (0) 1509 270924
Email: support@campbellsci.co.uk
www.campbellsci.co.uk
Page 6

Page 7

Safety
DANGER — MANY HAZARD S ARE ASSOCIATED WITH INSTALLING, USING, M AINTAINING, AND WORKING ON
OR AROUND TRIPODS, TOWERS, AND ANY ATTACHMENTS TO TRIPODS AND TOWERS SUCH AS SENSORS,
CROSSARMS, ENCLOSURES, ANTENNAS, ETC. FAILURE TO PROPERLY AND COM P LE TE LY ASS E M BLE ,
INSTALL, OPERATE, USE, AND MAINTAIN TRIPODS, TOWERS, AND ATTACHMENTS, AND FAILURE TO HEED
WARNINGS, INCREASES THE RISK OF DEATH, ACCIDENT, SERIOUS INJURY, PROPERTY DAMAGE, AND
PRODUCT FAILURE. TAKE ALL REASONABLE PRECAUTIONS TO AVOID THESE HAZARDS. CHECK WITH YOUR
ORGANIZATION'S SAFETY COORDINATOR (OR POLICY) FOR PROCEDURES AND REQUIRED PROTECTIVE
EQUIPMENT PRIOR TO PERFORMING ANY WORK.
Use tripods, towers, and attachments to tripods and towers only for purposes for which they are designed. Do not
exceed design limits. Be familiar and comply with all instructions provided in product manuals. Manuals are
available at www.campbellsci.eu or by telephoning +44(0) 1509 828 888 (UK). You are responsible for conformance
with governing codes and regulati ons, including safety regulati ons, and the integrity and locati on of structures or land
to which towers, tripods, and any attachments are attached. Installation sites should be evaluated and approved by a
qualified engineer. If questions or co ncerns arise regarding installation, use, or maintenance of tripods, towers,
attachments, or electrical connections, consult with a licensed and qualified engineer or electrician.
General
• Prior to performing site or installation work, obtain required approvals and permits. Comply with all
governing structure-height regulations, such as those of the FAA in the USA.
• Use only qualified personnel for installation, use, and maintenance of tripods and towers, and any
attachments to tripods and towers. The use of licensed and qualified contractors is highly recommended.
• Read all applicable instructions carefully and understand procedures thoroughly before beginning work.
• Wear a hardhat and eye protection, and take other appropriate safety precautions while working on or
around tripods and towers.
• Do not climb tripods or towers at any time, and prohibit climbing by other persons. Take reasonable
precautions to secure tripod and tower sites from trespassers.
• Use only manufacturer recommended parts, materials, and tools.
Utility and Electrical
• You can be killed or sustain serious bodily injury if the tripod, tower, or attachments you are installing,
constructing, using, or maintaining, or a tool, stake, or anchor, come in contact with overhead o
nderground utility lines.
u
• Maintain a distance of at least one-and-one-half times structure height, or 20 feet, or the distance
r
equired by applicable law, whichever is greater, between overhead utility lines and the structure (tripod,
tower, attachments, or tools).
• Prior to performing site or installation work, inform all utility companies and have all underground utilities
marked.
• Comply with all electrical codes. Electrical equipment and related grounding devices should be installed
by a licensed and qualified electrician.
r
Elevated Work and Weather
• Exercise extreme caution when performing elevated work.
• Use appropriate equipment and safety practices.
• During installation and maintenance, keep tower and tripod sites clear of un-trained or non-essential
personnel. Take precautions to prevent elevated tools and objects from dropping.
• Do not perform any work in inclement weather, including wind, rain, snow, lightning, etc.
Maintenance
• Periodically (at least yearly) check for wear and damage, including corrosion, stress cracks, frayed cables,
loose cable clamps, cable tightness, etc. and take necessary corrective actions.
• Periodically (at least yearly) check electrical ground connections.
WHILE EVERY ATTEMPT IS MADE TO EMBODY THE HIGHEST DEGREE OF SAFETY IN ALL CAMPBELL
SCIENTIFIC PRODUCTS, THE CUSTOMER ASSUMES ALL RISK FROM ANY INJURY RESULTING FROM IMPROPER
INSTALLATION, USE, OR MAINTENANCE OF TRIPODS, TOWERS, OR ATTACHMENTS TO TRIPODS AND TOWERS
SUCH AS SENSORS, CROSSARMS, ENCLOSURES, ANTENNAS, ETC.
Page 8

Page 9

Table of Contents
PDF viewers: These page numbers refer to the printed version of this document.
Use the PDF reader bookmarks tab for links to specific sections.
1. Introduction ........................................................ 1
2. Precautions ......................................................... 1
3. Initial Inspection ................................................. 1
4. QuickStart ........................................................... 2
5. Overview ............................................................. 4
6. Specifications ..................................................... 5
6.1 Dimensions .............................................................................. 5
6.2 Weight ...................................................................................... 5
6.3 Electrical Specifications ........................................................... 5
6.4 Operational Details .................................................................. 6
7. Installation .......................................................... 6
7.1 Orientation ............................................................................... 6
7.2 Potential Problems with Improper Insertion ............................ 6
7.3 Wiring ...................................................................................... 7
7.4 Data Logger Programming ...................................................... 7
7.4.1 CS616 CRBasic Programming ......................................... 8
7.4.2 CS625 CRBasic Programming ......................................... 8
8. Operation ............................................................ 9
8.1 Water Content Reflectometer Method for Measuring
Volumetric Water Content ................................................... 9
8.1.1 Response Curves ............................................................. 10
8.1.2 Calibration Equations ..................................................... 11
8.1.3 Operating Range ............................................................. 13
8.1.3.1 Soil Electrical Conductivity ................................. 13
8.1.3.2 Soil Organic Matter, Clay Content, and Soil
Bulk Density ..................................................... 14
8.1.4 Error Sources in Water Content Reflectometer
Measurement ............................................................... 14
8.1.4.1 Probe-to-Probe Variability Error .......................... 14
8.1.4.2 Insertion Error ...................................................... 14
8.1.4.3 Signal Attenuation Error ...................................... 15
8.1.5 Temperature Dependence and Correction ....................... 15
9. Maintenance ...................................................... 16
10. References ........................................................ 16
i
Page 10

Table of Contents
Appendices
A. Discussion of Soil Water Content ................. A-1
B. Importing Short Cut Code Into CRBasic
Editor ............................................................. B-1
C. Example Programs ......................................... C-1
C.1 CS616 Programs .................................................................. C-1
C.1.1 CR1000X Program for Measuring Eight CS616
P
robes ........................................................................ C-1
C.1.2 CR1000X/Multiplexer Program for Measuring 48
C
S616 Probes ............................................................ C-3
C.2 CS625 Programs .................................................................. C-5
C.2.1 CR200(X) Program for Measuring Four CS625
Probes ........................................................................ C-5
C.2.2 CR200(X) Program with Temperature Correction ....... C-6
D. Water Content Reflectometer User-
Calibration .................................................... D-1
Figures
Tables
D.1 Signal Attenuation in Conductive Soils and Need for
Site-Specific Calibration .................................................. D-1
D.2 User-Derived Calibration Equation ..................................... D-1
D.3 Collecting Laboratory Data for Calibration ......................... D-2
D.3.1 Equipment needed ........................................................ D-2
D.3.2 Soil Preparation ............................................................ D-2
D.4 Collecting Field Data for Calibration ................................... D-6
D.5 Calculations ......................................................................... D-8
7-1. Water content reflectometer wires ........................................... 7
8-1. CS616 and CS625 linear and quadratic calibrations
derived from loam soil ........................................................ 10
8-2. CS616 response for different soil types ................................. 11
8-3. Linear versus quadratic calibration differences ..................... 12
8-4. Percent volumetric water content error adjusted with
temperature correction equation ......................................... 16
7-1. Data Logger/Reflectometer Wiring.......................................... 7
8-1. Standard calibration coefficients for linear and quadratic
fo
rms ................................................................................... 12
8-2. Calibration coefficients for sandy clay loam with bulk
density 1.6 g/cm
0.4 dS/m for both linear and quadratic forms. .................... 13
8-3. Calibration coefficients for sandy clay loam with bulk
density 1.6 g/cm
0.75 dS/m
C-1. Data Logger Connection for Eight CS616s Example
Program ............................................................................ C-1
3
and electrical conductivity at saturation
3
and electrical conductivity at saturation
for both linear and quadratic forms. .................. 13
ii
Page 11

Table of Contents
C-2. Wiring for CR1000X/Multiplexer Example ........................ C-3
C-3. Wiring for CR200(X) Program Measuring Four CS625
Probes ............................................................................... C-5
C-4. CS625 Wiring for CR200X Program with Temperature
Correction ......................................................................... C-6
C-5. 109 Wiring for CR200X Program with Temperature
Correction ......................................................................... C-6
D-1. Standard calibration coefficients for quadratic and
logarithmic forms ............................................................. D-2
CRBasic Examples
C-1. CR1000X Program for Measuring Eight CS616 Probes ...... C-2
C-2. CR1000X/Multiplexer Program for Measuring 48 CS616
P
robes ............................................................................... C-4
C-3. CR200(X) Program for Measuring Four CS625 Probes ...... C-5
C-4. CR200(X) Program with Temperature Correction ............... C-7
iii
Page 12

Page 13

CS616 and CS625 Water Content
NOTE
Reflectometers
1. Introduction
The CS616 Water Content Reflectometer is an improved version of the CS615
Water Content Reflectometer. The CS625 is a modified CS616 for use with the
CR200(X)-series data loggers. The difference between the CS616 and the
CS625 is the output voltage level.
Both water content reflectometers are designed to measure volumetric water
content (VWC) of soils or other porous media. The water content information
is derived from the probe sensitivity to the dielectric constant of the medium
surrounding the probe rods.
This manual provides information only for CRBasic data loggers.
For retired Edlog data logger support, see an older manual at
www.campbellsci.com/old-manuals.
2. Precautions
• READ AND UNDERSTAND the Safety section at the front of this
manual.
• Although the CS616/CS625 is rugged, it should be handled as precision
scientific instrument.
• External RF sources can affect CS616/CS625 measurements.
Consequently, the CS616/CS625 circuitry should be located away from
significant sources of RF such as AC power lines and motors.
• CS616/CS625 probes enabled simultaneously and within approximately
23 cm (9 in) of each other can cause erratic measurements. If probes must
be close to each other, configure the enable lines to the data logger control
terminals so that the probes are not enabled simultaneously.
3. Initial Inspection
• Upon receipt of the CS616/CS625, inspect the packaging and contents for
damage. File damage claims with the shipping company.
• The model number and cable length are printed on a label at the
connection end of the cable. Check this information against the shipping
documents to ensure the expected product and cable length are received.
1
Page 14
4. QuickStart
CS616 and CS625 Water Content Reflectometers
A video that describes data logger programming using Short Cut is available
at: www.campbellsci.eu/videos/cr1000x-datalogger-getting-started-program-
part-3. Short Cut is an easy way to program your data logger to measure the
CS616 or CS625 probe and assign data logger wiring terminals. Short Cut is
available as a download on www.campbellsci.eu. It is included in installations
of LoggerNet, RTDAQ, PC400, or PC200W.
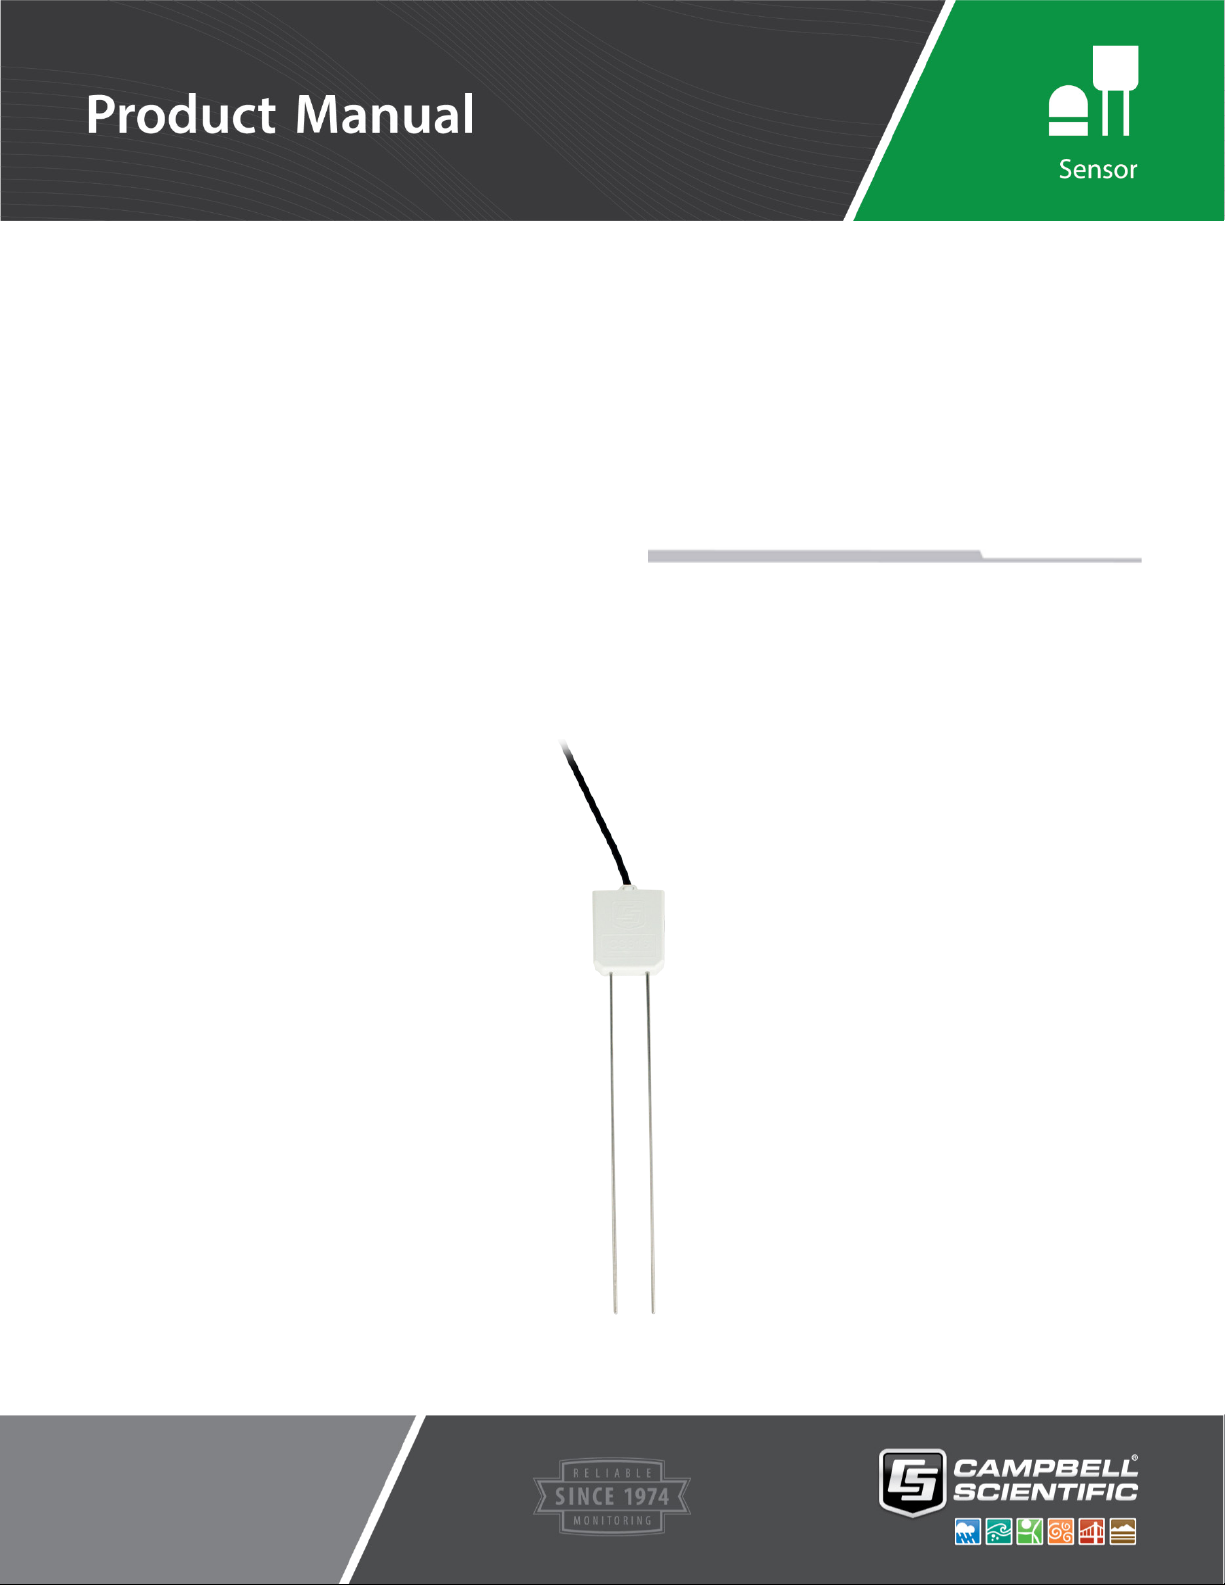
The following procedure also shows using Short Cut to program the CS616.
The procedure for the CS625 is similar.
1. Op
2. Double-click the data logger model.
3. In the Available Sensors and Devices box, type CS616 or locate th
en Short Cut and click Create New Program.
se
nsor in the Sensors > Soil Moisture folder. Double-click CS616 Water
Content Reflectometer. It defaults to measuring the sensor hourly. Thi
an be changed by clicking the Measure Sensor box and selecting Every
c
Scan.
e
s
2
Page 15
CS616 and CS625 Water Content Reflectometers
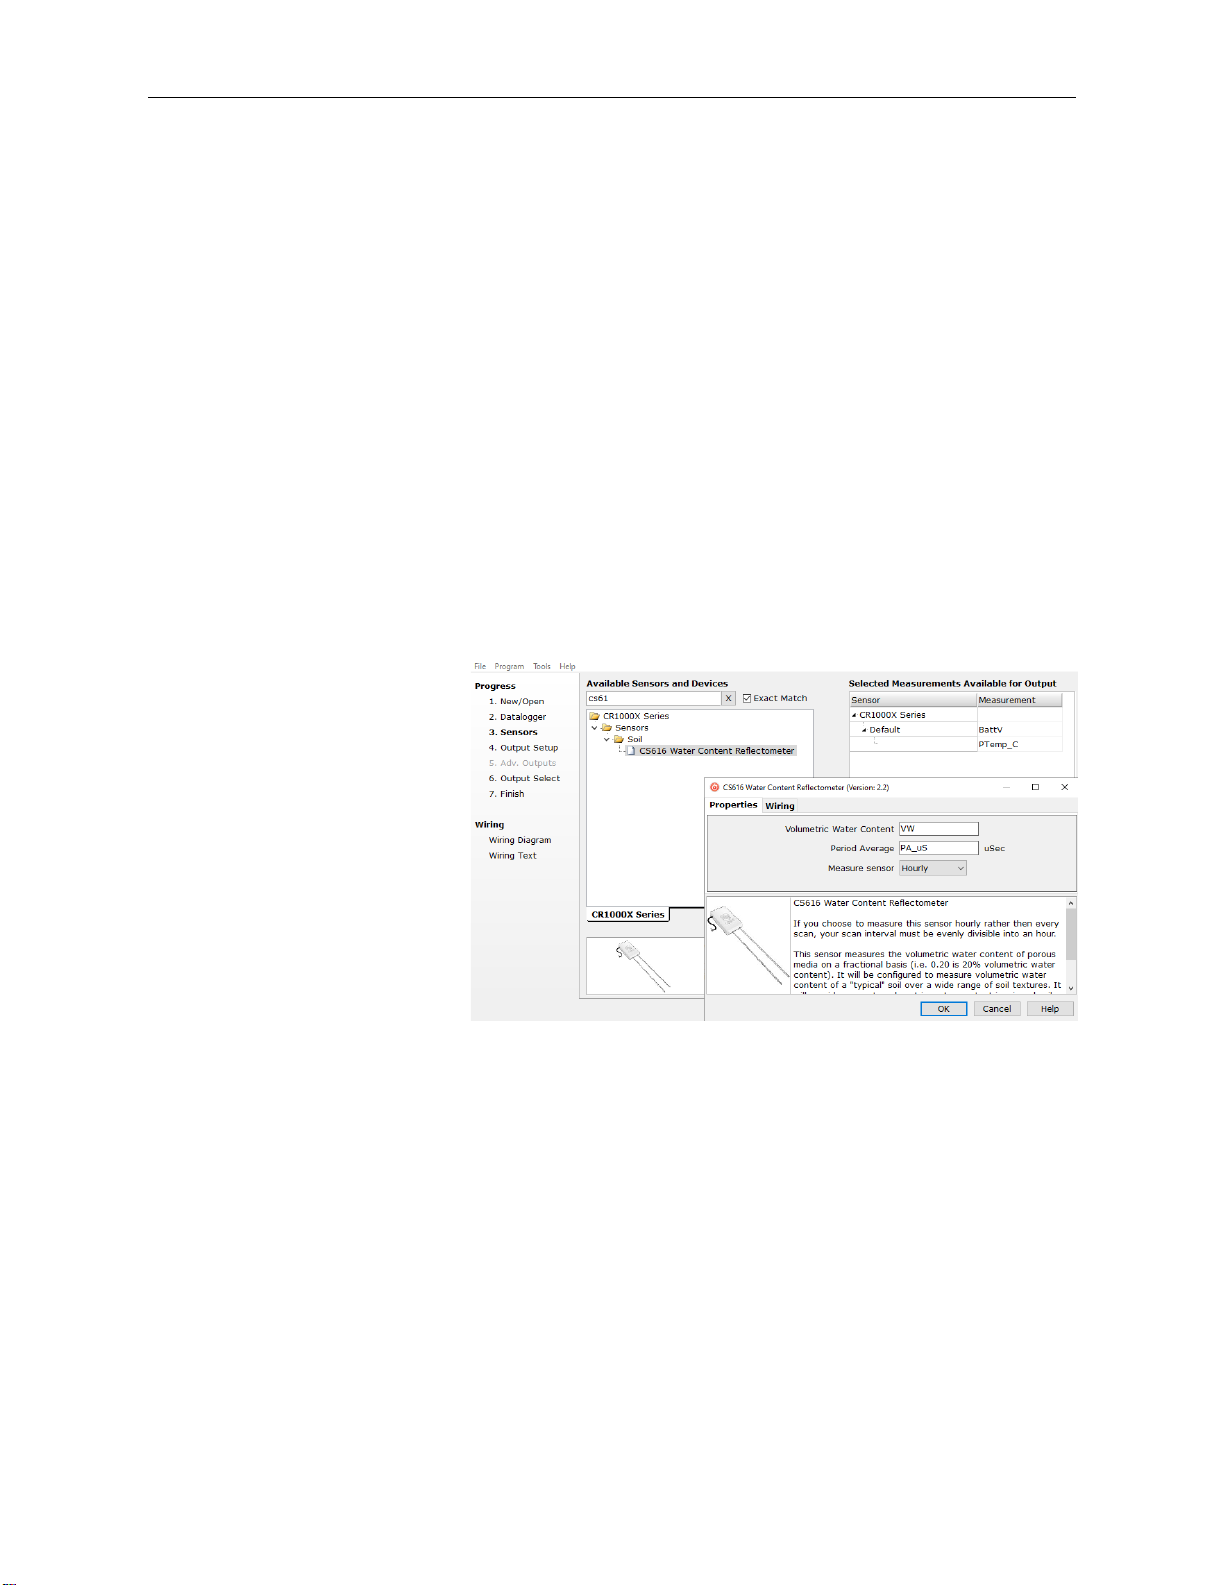
4. Click the Wiring tab to see how the sensor is to be wired to the data
logger. Click OK after wiring the sensor.
5. Repeat steps 3 and 4 for other sensors.
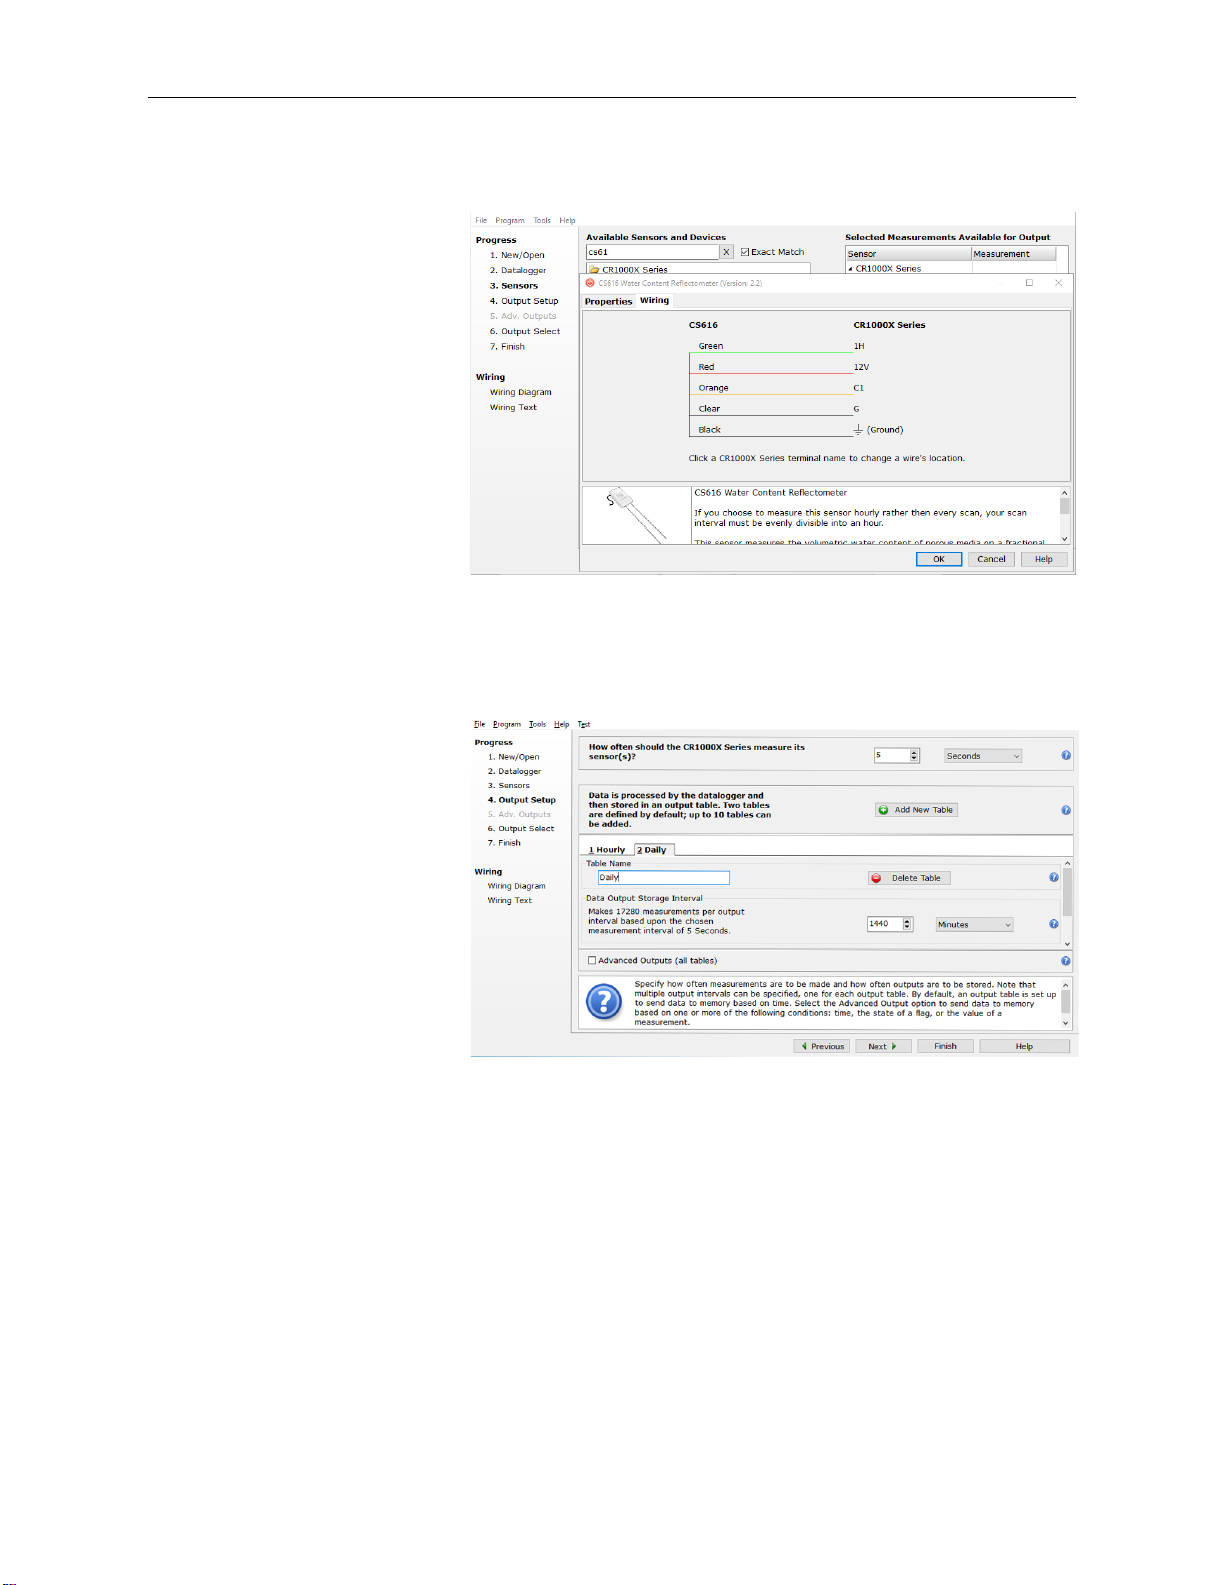
6. In Output Setup, type the scan rate, meaningful table names, and Dat
utput Storage Interval
O
.
a
3
Page 16

CS616 and CS625 Water Content Reflectometers
7. Select the measurement and its associated output option.
8. Click Finish and save the program. Send the program to the data logger if
the data logger is connected to the computer.
9. If the sensor is connected to the data logger, check the output of the sensor
in data display in LoggerNet, RTDAQ, PC400, or PC200W to make sure it
is making reasonable measurements.
5. Overview
The water content reflectometer consists of two stainless steel rods connected
to a printed circuit board. A shielded four-conductor cable is connected to the
circuit board to supply power, enable the probe, and monitor the pulse output.
The circuit board is encapsulated in epoxy.
High-speed electronic components on the circuit board are configured as a
bistable multivibrator. The output of the multivibrator is connected to the probe
rods which act as a wave guide. The travel time of the signal on the probe rods
depends on the dielectric permittivity of the material surrounding the rods, and
the dielectric permittivity depends on the water content. Therefore, the
oscillation frequency of the multivibrator is dependent on the water content of
the media being measured. Digital circuitry scales the multivibrator output to
an appropriate frequency for measurement with a data logger. The water
content reflectometer output is essentially a square wave. The probe output
period ranges from about 14 microseconds with rods in air to about 42
microseconds with the rods completely immersed in typical tap water. A
calibration equation converts period to volumetric water content.
Features:
• High accuracy and high precision
• Fast response time
• Designed for long-term, unattended water content monitoring
• Probe rods can be inserted from the surface or buried at a
orientation to the surface
ny
4
Page 17

CS616 and CS625 Water Content Reflectometers
6. Specifications
Probe-to-Probe Variability: ±0.5% VWC in dry soil, ±1.5% VWC in
Resolution:
Water Content Accuracy:
P
recision:
Compliance documents:
6.1 Dimensions
• CS616 compatible with Campbell Scientific CRBasic data loggers
, CR3000, CR1000X, CR800 series, and CR1000
CR6
• CS625 compatible with Campbell Scientific CRBasic data loggers:
C
R200X series and CR200 series
typical saturated soil
better than 0.1% VWC
2.5% VWC using standard calibration with
±
bulk electrical conductivity
≤0.5 deciSiemen per metre (dS/m) and bulk
density ≤1.55 g/cm
to 50% VWC
better than 0.1% VWC
View at www.campbellsci.eu/cs616-
reflectometer
3
in measurement range 0%
:
Rods:
Probe Head:
6.2 Weight
Probe (without cable):
Cable:
6.3 Electrical Specifications
Output
CS616:
CS625:
Power:
P
ower Supply Requirements: 5 VDC minimum, 18 VDC maximum
Enable Voltage: 4 VDC minimum, 18 VDC maximum
300 mm (11.8 in) long, 3.2 mm (0.13 in)
diameter, 32 mm (1.3 in) spacing
85 x 63 x 18 mm (3.3 x 2.5 x 0.7 in)
280 g (9.9 oz)
–1
35 g m
±0.7 volt square wave with frequency
dependent on water content
0 to 3.3 volt square wave with frequency
dependent on water content
65 mA @ 12 VDC when enabled, 45 µA
quiescent
(0.38 oz per ft)
Maximum Cable Length: 305 m (1000 ft)
5
Page 18

Electromagnetic
Compatibility: The CS616/CS625 is Πcompliant with
6.4 Operational Details
The accuracy specification for the volumetric water content measurement
using the CS616/CS625 probes is based on laboratory measurements in a
variety of soils and over the water content range air dry to saturated. The soils
were typically sandy loam and coarser. Silt and clay were present in some of
the soils used to characterize accuracy.
Resolution is the minimum change in the dielectric permittivity that can
reliably be detected by the water content reflectometer. The CS616 or CS625 is
typically used to measure soil volumetric water content.
CS616 and CS625 Water Content Reflectometers
performance criteria available upon request.
RF emissions are below EN55022 limits if the
CS616/CS625 is enabled less than 0.6 ms and
measurements are made at a 1 Hz (1 per
second) or slower frequency. The
CS616/CS625 meets EN61326 requirements
for protection against electrostatic discharge
and surge.
7. Installation
7.1 Orientation
Precision describes the repeatability of a measurement. It is determined for the
CS616 and CS625 by taking repeated measurements in the same material. The
precision of the CS616/CS625 is better than 0.1 % volumetric water content.
Soil Properties
The water content reflectometer operation can be affected when the signal
applied to the probe rods is attenuated. The probe will respond to changing
water content, even in attenuating soils or other media, but the response may be
different than described by the standard calibration. Consequently, a unique
calibration is required. Change in probe response can occur when soil bulk
electrical conductivity is greater than 0.5 dS/m. The major contributor to soil
electrical conductivity is the presence of free ions in solution from dissolution
of soil salts. Soil organic matter and some clays can also attenuate the signal.
The probe rods can be inserted vertically into the soil surface or buried at any
orientation to the surface. A probe inserted vertically into a soil surface will
give an indication of the water content in the upper 30 cm of soil. The probe
can be installed horizontal to the surface to detect the passing of wetting fronts
or other vertical water fluxes. A probe installed at an angle of 30 degrees with
the surface will give an indication of the water content of the upper 15 cm of
soil.
7.2 Potential Problems with Improper Insertion
The method used for probe installation can affect the accuracy of the
measurement. The probe rods should be kept as close to parallel as possible
when installed to maintain the design wave guide geometry. The sensitivity of
6
Page 19

7.3 Wiring
TABLE 7-1. Data Logger/Reflectometer Wiring.
⏚
NOTE
power Red
CS616 and CS625 Water Content Reflectometers
this measurement is greater in the regions closest to the rod surface than at
distances away from the surface. Probes inserted in a manner which generates
air voids around the rods will reduce the measurement accuracy. In most soils,
the soil structure will recover from the disturbance during probe insertion.
In some applications, installation can be improved by using the CS650G
insertion guide tool. The CS650G is inserted into the soil and then removed.
This makes proper installation of the water content reflectometer easier in
dense or rocky soils.
Colour Function Data Logger Connection
red +12 V +12 V
green output SE analogue or universal terminal
orange enable control terminal
black signal ground
clear power ground G
Both the black and clear wires must be grounded as shown in
TABLE 7-1.
signal ground Black
output Green
enable O
power ground C
FIGURE 7-1. Water content reflectometer wires
range
lear
7.4 Data Logger Programming
Short Cut is the best source for up-to-date data logger programming code.
If your data acquisition requirements are simple, you can probably create and
maintain a data logger program exclusively with Short Cut. If your data
acquisition needs are more complex, the files that Short Cut creates are a great
7
Page 20

source for programming code to start a new program or add to an existing
NOTE
custom program.
Short Cut cannot edit programs after they are imported and edited
in CRBasic Editor.
A Short Cut tutorial is available in Section 4, QuickStart (p. 2). If you wish to
import Short Cut code into CRBasic Editor to create or add to a customized
program, follow the procedure in Appendix B, Importing Short Cut Code Into
CRBasic Editor
(p. B-1). Programming basics for CRBasic data loggers are
provided here. Complete program examples for select CRBasic data loggers
can be found in Appendix C, Example Programs
and programming examples for Edlog data loggers are provided at
www.campbellsci.com\old-manuals.
7.4.1 CS616 CRBasic Programming
The output of the CS616 is a square wave with amplitude of ±0.7 VDC and a
frequency that is dependent on the dielectric constant of the material
surrounding the probe rods. The CRBasic instruction CS616() is used to
measure the CS616 output period.
CS616 and CS625 Water Content Reflectometers
(p. C-1). Programming basics
The CS616() CRBasic instruction has the following form.
CS616(Dest, Reps, SE, Control, MeasPerTerm, Mult, Offset)
Dest: The variable or variable array that stores the measurement results. Dest
must be dimensioned to at least the number of Reps.
Reps: The number of measurements made using this instruction. If Reps is
greater than 1, Dest must be an array dimensioned to the size of Reps.
SE: The single-ended terminal used to make the first measurement. If the Reps
is greater than 1, additional measurements are made on sequential terminals.
Control: The control terminal used to enable the CS616 sensor.
MeasPerTerm: The number of control terminals used to control the CS616
sensor(s). If both Reps and MeasPerTerm are set to 4, the same control
terminal will be used for all measurements. If Reps is set to 4 and
MeasPerTerm is set to 1, four sequential terminals will be used for the
measurements. If Reps is set to 4 and MeasPerTerm is set to 2, one control
terminal will be used for the first two measurements, and the next terminal will
be used for the next two measurements.
Mult, Offset: The Mult and Offset parameters are each a constant, variable,
array, or expression by which to scale the results of the measurement.
7.4.2 CS625 CRBasic Programming
The output of the CS625 is a square wave with amplitude of 0 to 3.3 VDC and
a frequency that is dependent on the dielectric constant of the material
surrounding the probe rods. The CRBasic instruction PeriodAvg() is used by
the CR200(X) series data loggers to measure the CS625 output period. The
period value is used in the calibration for water content. The period in air is
8
Page 21

CS616 and CS625 Water Content Reflectometers
approximately 14.7 microseconds, and the period in saturated soil with porosity
0.4 is ap
The PeriodAvg() instruction has the following form.
PeriodAvg(Dest, SE, Option, Cycles, Timeout, Control, Mult, Offset)
Dest: The variable used to store the results of the measurement.
SE: The single-ended terminal to make the measurement. Valid options are
analogue terminals 1 through 4.
Option: Specifies whether to output the frequency or the period of the signal.
Code 0 returns the period of the signal in milliseconds.
Cycles: Specifies the number of cycles to average each scan.
Timeout: The maximum time duration, in milliseconds, that the data logger
will wait for the number of Cycles to be measured for the average calculation.
An over range value will be stored if the Timeout period is exceeded. A value
of 1 is recommended if 10 is used for cycles parameter.
Control: The control terminal or analogue terminal used to switch power to the
CS625 Water Content Reflectometer.
proximately 31 microseconds.
8. Operation
8.1 Water Content Reflectometer Method for Measuring Volumetric Water Content
Mult, Offset: The Mult and Offset parameters are each a constant, variable,
array, or expression by which to scale the results of the raw measurement. A
multiplier value of 1 is recommended.
The water content reflectometer method for measuring soil water content is an
indirect measurement that is sensitive to the dielectric permittivity of the
material surrounding the probe rods. Since water is the only soil constituent
that has a high value for dielectric permittivity and is the only component other
than air that changes in concentration, a device sensitive to dielectric
permittivity can be used to estimate volumetric water content
The fundamental principle for CS616/CS625 operation is that an
electromagnetic pulse will propagate along the probe rods at a velocity that is
dependent on the dielectric permittivity of the material surrounding the line. As
water content increases, the propagation velocity decreases because
polarization of water molecules takes time. The travel time of the applied
signal along two times the rod length is essentially measured.
The applied signal travels the length of the probe rods and is reflected from
the rod ends travelling back to the probe head. A part of the circuit detects the
reflection and triggers the next pulse.
The frequency of pulsing with the probe rods in free air is about 70 MHz. This
frequency is scaled down in the water content reflectometer circuit output
stages to a frequency easily measured by a data logger. The probe output
9
Page 22

frequency or period is empirically related to water content using a calibration
16 18 20 22 24 26 28 30 32
0
0.1
0.2
0.3
0.4
calibration data
linear fit
quadratic fit
Output period (microseconds)
Volumetric Water Content (fractional)
equation.
8.1.1 Response Curves
CS616 and CS625 Water Content Reflectometers
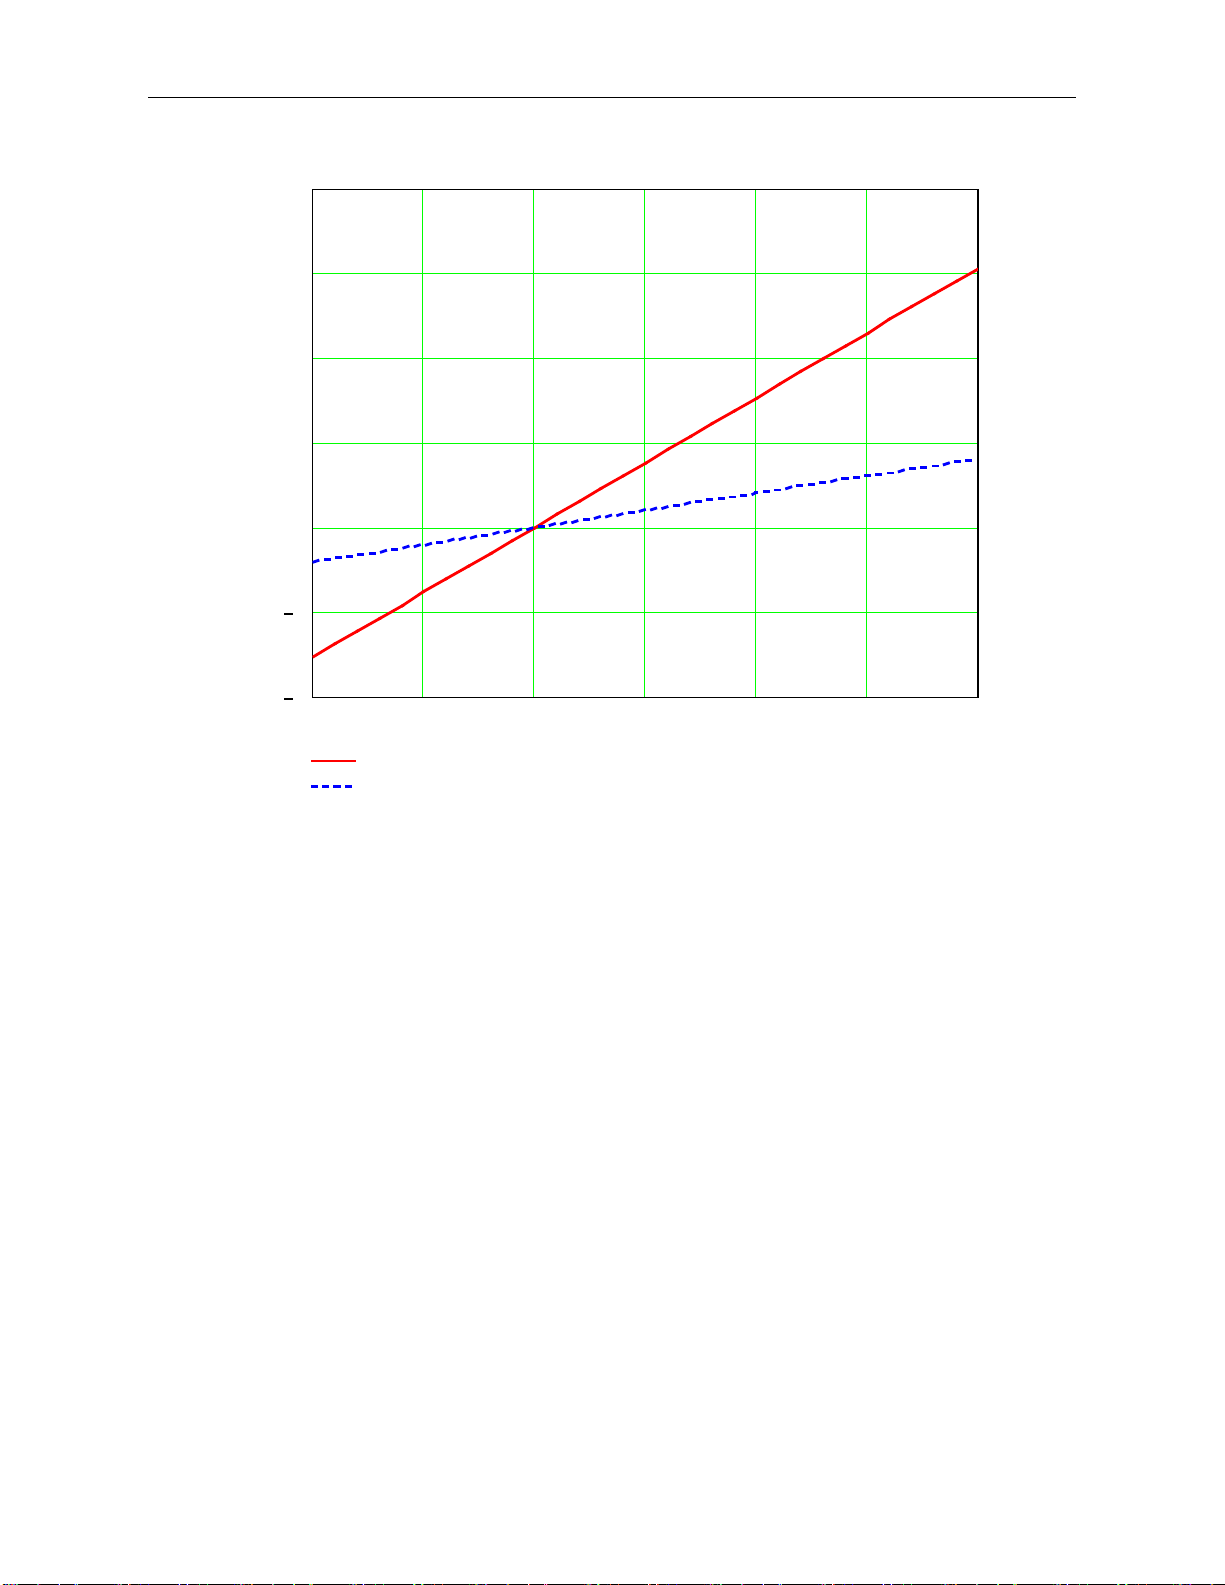
FIGURE 8-1 shows calibration data collected during laboratory measurements
3
in a loam soil with bulk density 1.4 g/cm
and bulk electrical conductivity at
saturation of 0.4 dS/m. For this soil, the saturation bulk electrical conductivity
of 0.4 dS/m corresponds to laboratory electrical conductivity using extraction
methods of about 2 dS/m.
The response is accurately described over the entire water content range by a
quadratic equation. However, in the typical water content range of about 10%
to about 35% volumetric water content, the response can be described with
slightly less accuracy by a linear calibration equation. The manufacturer
supplied quadratic provides accuracy of ±2.5% volumetric water content for
3
soil electrical conductivity ≤ 0.5 dS/m and bulk density ≤ 1.55 g/cm
in a
measurement range of 0% to 50% VWC.
FIGURE 8-1. CS616 and CS625 linear and quadratic calibrations
derived from loam soil
FIGURE 8-2 compares the CS616 response in the FIGURE 8-1 loam soil to a
higher density sandy clay loam for two different electrical conductivities. The
10
Page 23

CS616 and CS625 Water Content Reflectometers
bulk density for both sandy clay loam soils is 1.6 g/cm3. The electrical
conductivity at saturation for the sandy clay loam labelled compacted soil is
0.4 dS/m. The compacted soil, high EC had an electrical conductivity at
saturation of 0.75 dS/m. The CS625 response is similar.
FIGURE 8-2. CS616 response for different soil types
The compacted soil response shows the effect of compaction and high clay
content. The signal attenuation caused by compaction or high clay content
causes an offset in the response as shown by the near-parallel curves at water
contents above 10%. This is the effect of attenuation by the solid phase.
The effect of increased electrical conductivity for the same soil is shown by the
response curve high EC, compacted soil. Higher electrical conductivity causes
a decrease in the slope of the response curve. This is the effect of attenuation
by the solution phase.
8.1.2 Calibration Equations
TABLE 8-1 lists the calibration coefficients derived in the Campbell Scientific
soils laboratory. Both linear and quadratic forms are presented. The choice of
linear or quadratic forms depends on the expected range of water content and
accuracy requirements. These coefficients should provide accurate volumetric
water content in mineral soils with bulk electrical conductivity less than
0.5 dS/m, bulk density less than 1.55 g/cm
3
, and clay content less than 30%.
11
Page 24

CS616 and CS625 Water Content Reflectometers
TABLE 8-1. Standard calibration coefficients for
linear and quadratic forms
Linear Quadratic
C0 C1 C0 C1 C2
–0.4677 0.0283 –0.0663 –0.0063 0.0007
T
he linear equation is
VWC = -0.4677 + 0.0283 x period
The quadratic equation is
VWC = –0.0663 – 0.0063 x period + 0.0007 x period
2
Period is in microseconds. The result of both calibration equations is
volumetric water content on a fractional basis. Multiply by 100 to express in
percent volumetric water content.
FIGURE 8-3 shows the difference between the linear and the quadratic
calibration forms over the typical range. A CS616/CS625 output period of 16
microseconds is about 1.2% VWC and 32 microseconds is 44.9%. The linear
calibration is within ± 2.7% VWC of the quadratic. The linear calibration
underestimates water content at the wet and dry ends of the range and
overestimates it by up to about 2.6 % VWC at about 20% VWC.
FIGURE 8-3. Linear versus quadratic calibration differences
12
Page 25

CS616 and CS625 Water Content Reflectometers
TABLE 8-2. Calibration coefficients for sandy clay loam with bulk
TABLE 8-3. Calibration coefficients for sandy clay loam with bulk
σ σ θ σ
bulk solution
= +
v solid
Τ
The linear and quadratic coefficients for the sandy clay loam data in FIGURE
8-3 follow and can be used in similar soils.
density 1.6 g/cm3 and electrical conductivity at saturation 0.4 dS/m
for both linear and quadratic forms.
Linear Quadratic
C0 C1 C0 C1 C2
–0.6200 0.0329 0.0950 –0.0211 0.0010
density 1.6 g/cm3 and electrical conductivity at saturation 0.75 dS/m
Linear Quadratic
C0 C1 C0 C1 C2
–0.4470 0.0254 –0.0180 –0.0070 0.0006
8.1.3 Operating Range
8.1.3.1 Soil Electrical Conductivity
Electric conductivity can affect the propagation of electromagnetic fields used
to configure the CS616/CS625. Free ions in soil solution provide electrical
conduction paths that cause attenuation of the signal applied to the waveguides.
This attenuation both reduces the amplitude of the high-frequency signal on the
probe rods and reduces the bandwidth. The attenuation reduces oscillation
frequency at a given water content because it takes a longer time to reach the
oscillator trip threshold.
It is important to distinguish between soil bulk electrical conductivity and soil
solution electrical conductivity. Soil solution electrical conductivity refers to
the conductivity of the solution phase of soil. Soil solution electrical
conductivity, σ
methods to separate the solution from the solid and then measuring the
electrical conductivity of the extracted solution.
for both linear and quadratic forms.
can be determined in the laboratory using extraction
solution
The following equation describes the relationship between soil solution and
soil bulk electrical conductivity (Rhoades et al., 1976)
here, σ
W
solution; σ
bulk
solid
a soil-specific transmission coefficient that accounts for the tortuosity of the
flow path as water content changes. See Rhoades et al., 1989 for a form of this
equation that accounts for mobile and immobile water. This publication also
discusses soil properties related to CS616/CS625 operation such as clay
content and compaction.
is the electrical conductivity of the bulk soil; σ
solution
, the soil
, the solid constituents; θv , the volumetric water content; and Τ,
13
Page 26

CS616 and CS625 Water Content Reflectometers
Most expressions of soil electrical conductivity are given in terms of solution
conductivity or electrical conductivity from extract since it is constant for a
soil. Bulk electrical conductivity increases with water content, so comparison
of the electrical conductivity of different soils must be at the same water
content. Discussion of the effects of soil electrical conductivity on
CS616/CS625 performance will be on a soil solution or extract basis unless
stated otherwise.
When soil solution electrical conductivity values exceed 2 dS/m, the response of
the CS616/CS625 output begins to change. The slope decreases with increasing
electrical conductivity. Because of this, the calibration needs to be modified; see
Appendix D, Water Content Reflectometer User-Calibration
conductivity values greater than 5 dS/m, the probe output can become unstable.
8.1.3.2 Soil Organic Matter, Clay Content, and Soil Bulk Density
The amount of organic matter and clay in a soil can alter the response of
dielectric-dependent methods to changes in water content. This is apparent
when mechanistic models are used to describe this measurement methodology.
The electromagnetic energy introduced by the probe re-orientate or polarize the
water molecules. If other forces are acting on the polar water molecules, the
force exerted by the applied signal are less likely to polarize the molecules.
This causes the probe to under report water content. Additionally, some clays
absorb water interstitially and thus inhibit polarization by the applied field.
(p. D-1). At electrical
Organic matter and some clays are highly polar. These solid constituents can
affect CS616/CS625 response to water content change and require specific
calibration. This affect can cause the probe to over report water content. It
would be convenient if the calibration of water content to CS616/CS625 output
period could be adjusted according to some soil parameter that reflects the
character of the signal attenuation. However, such a parameter has not been
identified.
3
For some soils with bulk densities exceeding 1.5 g/cm
, the slope of the
CS616/CS625 response decreases with increasing bulk density.
8.1.4 Error Sources in Water Content Reflectometer Measurement
8.1.4.1 Probe-to-Probe Variability Error
All manufactured CS616s/CS625s are checked in standard media. The limits
for probe response in the standard media ensure accuracy of ±2% volumetric
water content.
8.1.4.2 Insertion Error
The method used for probe insertion can affect the accuracy of the
measurement. Keep the probe rods as close to parallel as possible when
inserted to maintain the design wave guide geometry. The sensitivity of this
measurement is greater in the regions closest to the rod surface than at
distances away from the surface. Probes inserted in a manner that generates air
voids around the rods will indicate lower water content than actual. In some
applications, installation can be improved by using insertion guides or a pilot
tool. Campbell Scientific offers the CS650G insertion tool.
14
Page 27

8.1.4.3 Signal Attenuation Error
τ
uncorrected
T
soil
( ) ( )
( )
2
00136.0052.0526.020
duncorrecteduncorrectesoilduncorrectesoilcorrected
TT
ττττ
×+×−×−+=
Section 8.1, Water Content Reflectometer Method for Measuring Volumetric
Water Content
In summary, the CS616/CS625 is primarily sensitive to the dielectric
permittivity of the material surrounding the probe rods. The propagation of
electromagnetic energy along the probe rods depends on the dielectric
properties of the medium. When the reflection of the applied signal from the
end of the rods is detected by the CS616/CS625 circuit, another pulse is
applied. The time between pulses depends on the propagation time, and the
associated period is empirically related to volumetric water content.
The applied signal is subject to attenuation from losses in the medium being
measured. While this does not directly affect propagation time, it causes delays
in detection of the reflected signal. Attenuation of the signal will occur if there
are free ions in soil solution, polar solid constituents such as organic matter or
some clay, or conductive mineral constituents.
The general calibration equation for the CS616/CS625 will provide good
results with attenuation equivalent to about 0.5 dS/m bulk electrical
conductivity. Between 0.5 dS/m and 5 dS/m, the CS616/CS625 will continue to
give a well-behaved response to changes in water content but a soil specific
calibration is required. See Appendix D, Water Content Reflectometer User-
Calibration
CS616 and CS625 Water Content Reflectometers
(p. 9), presents a detailed description of CS616/CS625 operation.
(p. D-1), for calibration information.
8.1.5 Temperature Dependence and Correction
FIGURE 8-4 shows the error in measured volumetric water content caused by
the temperature dependence of the CS616/CS625. The magnitude of the
temperature sensitivity changes with water content. Laboratory measurements
were performed at various water contents and over the temperature range from
10 to 40 °C to derive a temperature correction for probe output period. The
following equation can be used to correct the CS616/CS625 output period,
, to 20 °C knowing the soil temperature,
CR200(X) Program with Temperature Correction
correction assumes that both the water content and temperature do not vary
over the length of the probes rods.
. See Appendix C.2.2,
(p. C-6). The temperature
15
Page 28
CS616 and CS625 Water Content Reflectometers
10 15 20 25 30 35 40
4
2
0
2
4
6
8
Wa ter C o ntent = 30 %
Wa ter C o ntent = 12 %
Water Content Error with Temperature
Soi l Temperatur e (C)
Water Content Error (%VWC)
FIGURE 8-4. Percent volumetric water content error adjusted with
temperature correction equation
9. Maintenance
The CS616/CS625 does not require periodic maintenance.
10. References
Rhoades, J.D., P.A.C. Raats, and R.J. Prather. 1976. Effects of liquid-phase
electrical conductivity, water content and surface conductivity on bulk soil
electrical conductivity. Soil Sci. Soc. Am. J., 40: 651-653.
Rhoades, J.D., N.A. Manteghi, P.J. Shouse, W.J. Alves. 1989. Soil electrical
conductivity and soil salinity: New formulations and calibrations. Soil Sci.
Soc. Am. J., 53:433-439.
16
Page 29

Appendix A. Discussion of Soil Water
θ
g
water
soil
wet dry
dry
m
m
m m
m
= =
−
water
soilg
soil
soil
water
water
soil
water
v
m
m
volume
volume
ρ
ρθ
ρ
ρ
θ
×
===
ρ
bulk
dry
sample
m
volume
=
ε
ρ
ρ
= −1
bulk
solid
Content
The water content reflectometer measures volumetric water content. Soil water
content is expressed on a gravimetric and a volumetric basis. To obtain the
independently determined volumetric water content, gravimetric water content
must first be measured. Gravimetric water content (θg) is the mass of water per
mass of dry soil. It is measured by weighing a soil sample (m
sample to remove the water, then weighing the dried soil (m
), drying the
wet
).
dry
V
olumetric water content (θ
Volume is the ratio of mass to density (ρ
) is the volume of liquid water per volume of soil.
v
) which gives:
b
The density of water is close to 1 and often ignored.
Soil bulk density (ρ
) is used for ρ
bulk
and is the ratio of soil dry mass to
soil
sample volume.
A
nother useful property, soil porosity (ε), is related to soil bulk density as
shown by the following expression.
he term ρ
T
2.65 g/cm
is the density of the soil solid fraction and is approximately
solid
3
.
A-1
Page 30

Page 31

Appendix B. Importing Short Cut Code
NOTE
Into CRBasic Editor
Short Cut creates a .DEF file that contains wiring information and a program
file that can be imported into the CRBasic Editor. By default, these files reside
in the C:\campbellsci\SCWin folder.
Import Short Cut program file and wiring information into CRBasic Editor:
1. Create the Short Cut program. After saving the Short Cut program, click
the Advanced tab then the CRBasic Editor button. A program file with a
generic name will open in CRBasic. Provide a meaningful name and sav
e CRBasic program. This program can now be edited for additional
th
refinement.
Once the file is edited with CRBasic Editor, Short Cut can no
longer be used to edit the program it created.
2. To add the Short Cut wiring information into the new CRBasic program,
open the .DEF file located in the C:\campbellsci\SCWin folder, and copy
the wiring information, which is at the beginning of the .DEF file.
3. Go into the CRBasic program and paste the wiring information into it.
e
4. In the CRBasic program, highlight the wiring information, right-click, and
select Comment Block. This adds an apostrophe (') to the beginning of
each of the highlighted lines, which instructs the data logger compiler t
gnore those lines when compiling. The Comment Block feature is
i
demonstrated at about 5:10 in the CRBasic | Features video .
o
B-1
Page 32

Page 33

Appendix C. Example Programs
TABLE C-1. Data Logger Connection for Eight CS616s
⏚
⏚
⏚
⏚
⏚
⏚
⏚
⏚
C.1 CS616 Programs
C.1.1 CR1000X Program for Measuring Eight CS616 Probes
The following CR1000X program uses the CS616() instruction to measure
eight CS616 probes connected to the CR1000X data logger (TABLE C-1).
Although this example is for the CR1000X, other CRBasic data loggers are
programmed similarly.
Example Program
Probe Number Green Orange Red Black Clear
CS616 #1 5H C7 12V
CS616 #2 5L C7 12V
CS616 #3 6H C7 12V
CS616 #4 6L C7 12V
CS616 #5 7H C8 12V
CS616 #6 7L C8 12V
CS616 #7 8H C8 12V
CS616 #8 8L C8 12V
Note: The red wire for all eight CS616s connect to the 12V terminal. A usersupplied common tie post may be required.
G
G
G
G
G
G
G
G
C-1
Page 34

CRBasic Example C-1. CR1000X Program for Measuring Eight CS616 Probes
'Declare Public and Dim Variables
Public batt_volt
EndProg
Public Panel_temp
Public Period (8)
Public VWC (8)
Public Flag (1)
Dim I
'
Declare Constants
'CS616 Default Calibration Constants
const a0= -0.0663
const a1= -0.0063
const a2= 0.0007
'Flag logic constants
const high = true
const low = false
Define Data Tables
'
DataTable (Dat30min,1,-1)
DataInterval (0,30,Min,10)
Minimum (1,batt_volt,IEEE4,0,False)
Average (1,Panel_temp,IEEE4,0)
Sample (8,Period(),FP2)
Sample (8,VWC(),FP2)
EndTable
Appendix C. Example Programs
'Main Program
BeginProg
Scan (5,Sec,0,0) 'scan instructions every 5 sec
Battery (Batt_volt)
PanelTemp (Panel_temp,250)
'
'Set flag 1 High every 30 min (Note: User can manually set flag 1 high/low)
If IfTime (0,30,min) Then flag (1) = high '+++++++++++++++++++++++++++
If Flag (1) = high Then
'measure 8ea CS616 probes on CR1000X
CS616 (Period(1),4,9,C7,4,1.0,0) 'measure 4ea CS616 probes, enable w/ C7
CS616 (Period(5),4,13,C8,4,1.0,0) 'measure 4ea CS616 probes, enable w/ C8
'
For I=1 to 8 'convert CS616 period to Volumetric Water Content
VWC(I)=a0 + a1*Period(I) + a2*Period(I)^2
Next
'
flag(1)= low 'set Flag 1 = Low
'
EndIf '+++++++++++++++++++++++++++++++
'
CallTable Dat30min 'Call Output Tables
NextScan
C-2
Page 35

Appendix C. Example Programs
TABLE C-2. Wiring for CR1000X/Multiplexer Example
C.1.2 CR1000X/Multiplexer Program for Measuring 48 CS616
Probes
The following program uses the AM16/32-series multiplexer to measure 48
CS616 probes connected in the 4x16 configuration; wiring is provided in
TABLE C-2). The program also measures data logger battery voltage and
temperature.
CR1000X AM16/32-series (4x16) CS6161
Control/Common
C4 RES Odd H CS616#1_Green
C5 CLK Odd L CS616#2_Green
12 V 12 V G #1,2,3_Blk & Clear
Gnd Gnd Even H CS616#3_Green
1H COM Odd H Even L
1L COM Odd L
Gnd Gnd
2H COM Even H
C6 COM Even L
1
Three sensors to each set of AM16/32 terminals.
Sensor
Terminals
CS616
#1,2,3_Orange
C-3
Page 36

CRBasic Example C-2. CR1000X/Multiplexer Program for Measuring 48 CS616 Probes
'Declare Public and Dim Variables
Public batt_volt
EndProg
Public Panel_temp
Public Period (48)
Public VWC (48)
Public Flag (1)
Dim I
'
Declare Constants
'CS616 Default Calibration Constants
const a0= -0.0663
const a1= -0.0063
const a2= 0.0007
'Flag logic constants
const high = true
const low = false
Define Data Tables
'
DataTable (Dat30min,1,-1)
DataInterval (0,30,Min,10)
Minimum (1,batt_volt,FP2,0,False)
Average (1,Panel_temp,FP2,0)
Sample (48,Period(),FP2)
Sample (48,VWC(),FP2)
EndTable
Appendix C. Example Programs
'Main Program
BeginProg
Scan (5,Sec,0,0) 'scan instructions every 5 sec
Battery (Batt_volt)
PanelTemp (Panel_temp,250)
'
'Set flag 1 High every 30 min (Note: User can manually set flag 1 high/low)
If IfTime (0,30,min) Then flag (1) = high '+++++++++++++++++++++++++++
If Flag (1) = high Then
'measure 48ea CS616 probes on AM16/32 in (4x16) mode
PortSet (C4,1) 'Set Mux Reset line High
'
I=1 'Set sub scan loop counter
SubScan (0,mSec,16)
PulsePort (C5,10000) 'Clock Mux
CS616 (Period(I),3,1,C6,3,1.0,0) 'Measure 3ea CS616 probes
I=I+3
NextSubScan
'
For I=1 to 48 'convert CS616 period to Volumetric Water Content
VWC(I)=a0 + a1*Period(I) + a2*Period(I)^2
Next
'
PortSet (C4,0) 'Set Mux Reset line Low
flag (1) = low
'
EndIf '+++++++++++++++++++++++++++++++
'
CallTable Dat30min 'Call Output Tables
NextScan
C-4
Page 37

C.2 CS625 Programs
TABLE C-3. Wiring for CR200(X) Program Measuring
CRBasic Example C-3. CR200(X) Program for Measuring Four CS625 Probes
'CR200(X) program to read 4 CS625s
EndProg
C.2.1 CR200(X) Program for Measuring Four CS625 Probes
This CR200X program measures volumetric water content with four CS625
probes; TABLE C-3 provides wiring. The average hourly readings are saved in
final storage every 4 hours.
Wire Colour CR200(X)
Appendix C. Example Programs
Four CS625 Probes
Green SE1 through SE4
Black G
Orange C1
Red SW Battery
Clear G
'Standard calibration is used to convert CS625 output
'period to volumetric water content.
'Sensors are read hourly and average water content are written to storage every 4 hours.
'
Declare Variables
Public period(4),vwc(4)
Dim i
Declare Constants
'
Const a0=-0.0663
Const a1=-0.0063
Const a2=0.0007
Define Data Tables
'
DataTable (ofile,1,10)
DataInterval (0,4,hr)
Average (4,vwc,0)
EndTable
'
Main Program
eginProg
B
Scan (1,hr)
SWBatt (1)
PeriodAvg (period(1),1,0,10,10,C1,1,0)
PeriodAvg (period(2),2,0,10,10,C1,1,0)
PeriodAvg (period(3),3,0,10,10,C1,1,0)
PeriodAvg (period(4),4,0,10,10,C1,1,0)
For i=1 To 4
vwc(i) = a0 + a1*period(i) + a2*period(i)^2
Next i
C
allTable ofile
NextScan
C-5
Page 38

Appendix C. Example Programs
TABLE C-4. CS625 Wiring for CR200X Program with
TABLE C-5. 109 Wiring for CR200X Program with
C.2.2 CR200(X) Program with Temperature Correction
This CR200X program measures temperature with 109 probe and uses the 109
temperature to correct the period for one CS625. The standard calibration
equation is used to convert temperature-corrected period to volumetric water
content. Sensors are read hourly and average water content and temperature are
written to storage every 4 hours. Wiring for the CS625 is provided in TABLE
C-4 and wiring for the 109 is provided in TABLE C-5.
Temperature Correction
CS625 CR200(X)
Green SE1
Black G
Orange C1
Red SW Battery
Clear G
Temperature Correction
109 CR200(X)
Black EX1
Red SE5
Purple G
Clear G
C-6
Page 39

Appendix C. Example Programs
CRBasic Example C-4. CR200(X) Program with Temperature Correction
'CR200(X) program to read one 109 temperature probe and 1 CS625.
EndProg
'Use temperature to correct CS625 period.
'Standard calibration is used to convert CS625 output
'period to volumetric water content.
'Sensors are read hourly and average water content and
'temperature are written to storage every 4 hours.
Declare Variables
'
Public Tsoil
Public uncorrected,corrected
Public vwc
Declare Constants
'
'Water content calibration constants
Const a0=-0.0663
Const a1=-0.0063
Const a2=0.0007
'Temperature correction constants
Const t0=0.526
Const t1=-0.052
Const t2=0.00136
'Reference temperature
Const Tref=20
Define Data Tables
'
DataTable (ofile,1,10)
DataInterval (0,4,hr)
Average(1,Tsoil,0)
Average (1,vwc,0)
EndTable
'Main Program
BeginProg
Scan (1,hr)
Therm109 (Tsoil,1,5,Ex1,1.0,0)
SWBatt (1)
PeriodAvg (uncorrected,1,0,10,10,C1,1,0)
SWBatt (0)
corrected=uncorrected+(Tref-Tsoil)*(t0+t1*uncorrected+t2*uncorrected^2)
vwc = a0 + a1*corrected + a2*corrected^2
CallTable ofile
NextScan
C-7
Page 40

Page 41

Appendix D. Water Content Reflectometer User-Calibration
D.1 Signal Attenuation in Conductive Soils and Need
for Site-Specific Calibration
The calibration equations in Section 8.1.2, Calibration Equations (p. 11), provide
accurate volumetric water content over a wide range of mineral soils. For soils
with higher electrical conductivity or higher bulk density, however, those
equations overestimate volumetric water content and a soil specific usercalibration is recommended. Perform a soil specific calibration if the soil where
the CS616 is to be buried has one or more of the following characteristics:
• Saturated bulk electrical conductivity is greater than 0.5 dS/m
• Smectite clay content is greater than 25%
• Non-smectite clay content is greater than 30%
• Organic matter content is greater than 5%
• Bulk density is greater than 1.55 g/cm
he precision and the resolution of the water content reflectometer
T
measurement are not affected by attenuating media. Both precision and
resolution are better than 0.1% volumetric water content.
3
D.2 User-Derived Calibration Equation
The probe output response to changing water content is nonlinear. It is well
described by a quadratic or a logarithmic form.
Quadratic form:
(τ) = C0 + C1 x τ + C2 x τ2
θ
v
Logarithmic form:
θ
(τ) = C0 + C1 x τ2 x ln (τ)
v
Where: θ
The standard calibration coefficients were derived from factory laboratory
measurements using curve fitting of known volumetric water content to probe
output period. TABLE D-1 shows the calibration coefficients for the standard
quadratic equation and its equivalent logarithmic equation.
= volumetric water content (m3 m-3)
v
τ = CS616 period (microseconds)
, = calibration coefficient (n = 0, 1, or 2)
C
n
D-1
Page 42

Appendix D. Water Content Reflectometer User-Calibration
TABLE D-1. Standard calibration coefficients for quadratic and
logarithmic forms
Quadratic Logarithmic
C0 C1 C2 C0 C1
–0.0663 –0.0063 0.0007 –0.0957 0.000153
T
he purpose of the user-derived calibration procedure is to determine better
values for C
Two data points from careful measurements can be enough to derive the
logarithmic calibration. A minimum of three data points, gathered at
approximately evenly spaced water contents covering the expected range, is
needed for a quadratic calibration.
The calibration function describing the CS616 response to changing water
content is always concave up. Calibration data that suggests a different shape
indicates a problem with the data or method.
Collect the calibration data using either a laboratory method or a field method.
Use the laboratory method if the sensors are not installed in the soil of interest.
If the sensors are installed and the volumetric water content readings seem too
high, use the field method to avoid removing the sensors.
for the soil where the CS616 is buried.
n
D.3 Collecting Laboratory Data for Calibration
D.3.1 Equipment needed
Soil Collection:
• Shovel
• Bucket or bag large enough to hold at least 2.7 kg (6 lb) of soil
• Volumetric soil sampler
• Plastic bags
• Marker
• Insulated container for holding soil samples
Soil Preparation:
• Plastic sheet for air drying soil
D.3.2 Soil Preparation
From pp 468 – 469 Methods of Soil Analysis, section 3.1.3.6 “Capacitance
Devices” Starr & Paltineanu:
1. Choose a container size and shape to accommodate the sensor’s primary
zone of influence.
2. Screen the required mass of soil through a 5-mm sieve.
3. Air-dry and thoroughly mix the soil.
D-2
Page 43

Appendix D. Water Content Reflectometer User-Calibration
4. Choose the volumetric soil water content range and at least four water
content increments for the calibration curve.
5. Weigh the desired mass of soil for a 2-cm soil depth to be packed to the
chosen soil density.
6. Carefully pack the soil to the desired bulk density.
7. Repeat steps 5-6 until container is filled with soil.
8. Push the probe rods into the soil without creating air-gaps along the rods.
9. Record probe reading in the container.
10. Remove the probe and record total soil mass in the container.
11. Subsample the soil for wet and dry weights and calculate wet and dr
nsities and VWC. Collect samples from around and close to the rods for
de
y
oven drying.
12. Prepare the soil for the next calibration point by spreading the soil out in a
thin layer on a plastic sheet; then mist-spray the measured volume of water
on the soil in several increments, mixing the soil between each increment
by pulling first one corner of the plastic sheet toward the opposite corner
and then the other corners.
13. Repeat steps 5 to 12 for each calibration point.
14. Determine calibration equation by regression analysis with appropriate
functional relationship.
CS616/CS625 calibration uses the CS616/CS625 output period (microseconds)
and an independently determined volumetric water content. From this data, the
probe response to changing water content can be described by the following
quadratic calibration equation:
(τ) = C0 + C1 x τ + C2 x τ2
θ
v
Where: θ
= volumetric water content (m3 m-3)
v
τ = CS616 period (microseconds)
, = calibration coefficient (n = 0, 1, or 2)
C
n
The linear calibration equation is:
θv (τ) = C0 + C1 *τ
Where: θ
= volumetric water content (m3 m-3)
V
τ = CS616 period (microseconds)
= intercept
C
0
= slope
C
1
D-3
Page 44

Appendix D. Water Content Reflectometer User-Calibration
Required equipment:
• CS616/CS625 connected to data logger programmed to measure
output period
• Cylindrical sampling devices to determine sample volume for bul
nsity; for example, copper tubing with diameter ≥ 2.5 cm (1 in) a
de
ength about 5 cm (2 in)
l
k
nd
• Containers and scale to measure soil sample weight
• Oven to dry samples (microwave oven can also be used)
The calibration coefficients are derived from a curve fit of known water
content and probe output period. The number of data sets needed to derive a
calibration depends on whether using the linear or quadratic form and the
accuracy requirement. Consider the expected range of soil water content while
viewing FIGURE 8-1 and FIGURE 8-2. If the expected response is nearly
linear, fewer laboratory measurements are needed to derive the calibration. A
linear response is best described by data taken near the driest and wettest
expected water contents.
The measurement sensitive volume around the probe rods must be completely
occupied by the calibration soil. Ensure only soil is in the region within 5 cm of
the rod surface. Bury the probe rods in a tray of soil that is dry or nearly dry.
The soil will be homogeneous around the probe rods if it is poured around the
rods while dry. Also, a 10 cm diameter PVC pipe with length about 35 cm can
be closed at one end and used as the container. It is important that the bulk
density of the soil used for calibration be similar to the bulk density of the
undisturbed soil. Using dry soil without compaction will give a typical bulk
density, 1.1 to 1.4 g/cm
greater than 1.55 g/cm
3
. This is especially important when bulk density is
3
. Compaction of the calibration soil to similar bulk
density may be necessary.
The typically used method for packing a container of soil to uniform bulk
density is to roughly separate the soil into three or more equal portions and add
one portion to the container with compaction. Evenly place the first loose soil
layer in the bottom of the container. Compact by tamping the surface to a level
in the container that is correct for the target bulk density. Repeat for the
remaining layers. Prior to placing successive layers, scarify the top of the
existing compacted layer.
Use a container that is large enough to allow the probe rods to be at least at
least 10 cm (4 in) away from the container surface.
Pack the container as uniformly as possible in bulk density with relatively dry
soil (volumetric water content <10%).
Either bury the probe rods in a tray or insert them into a column. When using a
column, carefully insert the rods until the rods are completely surrounded by
soil. Avoid moving rods from side-to-side because this can form air voids
around rod surface, a source of measurement errors.
Collect the probe output period. Repeat the previous step and this step three to
four times.
D-4
Page 45

Appendix D. Water Content Reflectometer User-Calibration
θ
g
wet dry
dry
m m
m
=
−
ρ
bulk
dry
cylinder
m
volume
=
bulkgv
ρθθ
×=
Determine the volumetric water content by subsampling soil column after
removing the probe or by using the column weight. If subsampling is used,
remove soil from column and remix with samples used for water content
measurement. Repack column then add water to the top of the container.
Allow the column to equilibrate. Cover the container during equilibration to
prevent evaporation. The time required for equilibration depends on the
amount of water added and the hydraulic properties of the soil. Verify
equilibration by frequently observing the CS616/CS625 period output. When
the period is constant, equilibration is achieved. Collect a set of calibration data
values and repeat the water addition procedure again if needed.
With soil at equilibrium, record the CS616/CS625 period value.
Take subsamples of the soil using containers of known volume. This is
necessary for measurement of bulk density. Use copper tubing with a diameter
≥ 2.5 cm (1 in) and length about 5 cm (2 in). The tubes can be pressed into the
soil surface.
Take multiple samples. Three carefully handled samples will provide good
results.
Evenly push the sample tubes into the soil. Remove the tube and sample and
gently trim the ends of excess soil. Remove excess soil from outside of tube.
Remove all the soil from the tube to a tray or container of known weight that
can be put in oven or microwave. Weigh and record the wet soil weight.
Remove water from the sample by heating in an oven or microwave. Oven
drying requires 24 hours at 105 °C. Microwave drying typically takes 20
minutes depending on microwave power and sample water content. ASTM
Method D4643-93 requires heating in microwave for 3 minutes, cooling in
desiccator, then weighing and repeating this process until weight is constant.
Gravimetric water content is calculated after the container weight is accounted
for.
F
or the bulk density, the dry weigh of the sample is divided by the sample tube
volume.
T
he volumetric water content is the product of the gravimetric water content
and the bulk density
D-5
Page 46

Appendix D. Water Content Reflectometer User-Calibration
The average water content for the replicates and the recorded CS616/CS625
period are one datum pair to be used for the calibration curve fit.
D.4 Collecting Field Data for Calibration
Required equipment:
• CS616/CS625 connected to data logger programmed to measure probe
output period
• Cylindrical sampling devices to determine sample volume for bul
de
nsity such as copper tubing with diameter ≥ 2.5 cm (1 in) and lengt
bout 2.5 cm (1 in)
a
k
• Containers and scale to measure soil sample weight
• Oven or microwave to dry samples
Data needed for CS616/CS625 calibration are the CS616/CS625 output period
(microseconds) and an independently determined volumetric water content.
From this data, the probe response to changing water content can be described
by a quadratic calibration equation of the form
(τ) = C0 + C1 x τ + C2 x τ2
θ
v
Where: θ
= volumetric water content (m3 m-3)
v
τ = CS616 period (microseconds)
, = calibration coefficient (n = 0, 1, or 2)
C
n
The linear form is:
θv (τ) = C0 + C1 *τ
Where: θ
= volumetric water content (m3 m-3)
V
τ = CS616 period (microseconds)
= intercept
C
0
= slope
C
1
h
The calibration coefficients are derived from a curve fit of known water
content and CS616/CS625 period.
The number of data sets needed to derive a calibration depends on whether the
linear or quadratic form is being used and the accuracy requirement. Consider
the expected range of soil water content while viewing FIGURE 8-1 and
FIGURE 8-2. If the expected response is nearly linear, fewer laboratory
measurements are needed to derive the calibration. A linear response is best
described by data taken near the driest and wettest expected water contents.
Collecting measurements of CS616/CS625 period and core samples from the
location where the probe is to be used will provide the best soil-specific
calibration. However, intentionally changing water content in soil profiles can
be difficult.
Use a shovel to form a vertical face of soil. If the CS616/CS625 is to be used
within about 0.5 m (1.5 ft) of the surface, the probe can be inserted into the
face and water added to the surface with percolation. After adding water,
D-6
Page 47

Appendix D. Water Content Reflectometer User-Calibration
θ
g
wet dry
dry
m m
m
=
−
ρ
bulk
dry
cylinder
m
volume
=
bulkgv
ρθθ
×=
monitor th
e CS616/CS625 output period to determine when the soil around the
rods is at equilibrium.
With soil at equilibrium, record the CS616/CS625 period value.
Soil hydraulic properties are spatially variable. Obtaining measurements that
are representative of the soil on a large scale requires multiple readings and
sampling. Use the average of several core samples to calculate volumetric
water content. Likewise, the CS616/CS625 should be inserted at least 3 times
into the soil recording the period values following each insertion and using the
average.
Remove the CS616/CS625 and take core samples of the soil where the probe
rods were inserted. This is necessary for measurement of bulk density. Use
copper tubing with a diameter ≥ 2.5 cm (1 in) and length about 5 cm (2 in). The
tubes can be pressed into the soil surface. It is good to take replicate samples at
locations around the tray surface.
Take three carefully handled samples at locations around the tray surface.
Evenly push the sample tubes into the soil surface. Remove the tube and
sample and gently trim the ends of excess soil. Remove excess soil from the
outside of the tube.
Remove all the soil from tube to a tray or container of known weight that can
be put in oven or microwave. Weigh and record the wet soil weight.
Remove water from the sample by heating in an oven or microwave. Oven
drying requires 24 hours at 105 °C. Microwave drying typically takes 20
minutes depending on microwave power and sample water content. ASTM
Method D4643-93 requires heating in microwave for 3 minutes, cooling in
desiccator, then weighing and repeating this process until weight is constant.
Calculate gravimetric water content after accounting for the container weight.
F
or the bulk density, the dry weight of the sample is divided by the sample tube
volume.
T
he volumetric water content is the product of the gravimetric water content
and the bulk density:
e average water content for the replicates and the recorded CS616 period are
Th
one datum pair to be used for the calibration curve fit.
D-7
Page 48

D.5 Calculations
h
d
volume ×
×=
2
2
π
θ
g
wet dry
dry
m m
m
=
−
ρ
bulk
dry
cylinder
m
volume
=
bulkgv
ρθθ
×=
Appendix D. Water Content Reflectometer User-Calibration
Clean the empty cylinders used for core sampling. Measure and record the
empty weight and volume. For a cylinder, the volume is:
w
here d is the inside diameter of the cylinder and h is the height of the
cylinder.
During soil sampling it is important that the cores be completely filled with soil
but not extend beyond the ends of the cylinder.
After obtaining soil core samples, place the soil-filled cylinder in a small tray
of known empty weight. This tray will hold the core sample during oven
drying.
To obtain m
, subtract the cylinder empty weight and the container empty
wet
weight from the weight of the soil filled cylinder in the tray. Remove all the
soil from the cylinder and place this soil in the tray. Dry the samples using
oven or microwave methods as described in Appendix D.4, Collecting Field
Data for Calibration
To obtain m
weight for m
T
o obtain soil bulk density, use
U
se the following to calculate volumetric water content:
dry
dry
(p. D-6).
, weigh the tray containing the soil after drying. Subtract tray
. Calculate gravimetric water content, θg, using
D-8
Page 49

Page 50

Campbell Scientific regional offices
Australia
Location:
Phone:
Email:
Website:
Brazil
Location:
Phone:
Email:
Website:
Canada
Location:
Phone:
Email:
Website:
China
Location:
Phone:
Email:
Website:
Garbutt, QLD Australia
61.7.4401.7700
info@campbellsci.com.au
www.campbellsci.com.au
São Paulo, SP Brazil
11.3732.3399
vendas@campbellsci.com.br
www.campbellsci.com.br
Edmonton, AB Canada
780.454.2505
dataloggers@campbellsci.ca
www.campbellsci.ca
Beijing, P. R. China
86.10.6561.0080
info@campbellsci.com.cn
www.campbellsci.com.cn
France
Location:
Phone:
Email:
Website:
Vincennes, France
0033.0.1.56.45.15.20
info@campbellsci.fr
www.campbellsci.fr
Germany
Location:
Phone:
Email:
Website:
Bremen, Germany
49.0.421.460974.0
info@campbellsci.de
www.campbellsci.de
India
Location:
Phone:
Email:
Website:
New Delhi, DL India
91.11.46500481.482
info@campbellsci.in
www.campbellsci.in
South Africa
Location:
Phone:
Email:
Website:
Stellenbosch, South Africa
27.21.8809960
sales@campbellsci.co.za
www.campbellsci.co.za
Thailand
Location:
Phone:
Email:
Website:
UK
Location:
Phone:
Email:
Website:
USA
Location:
Phone:
Email:
Website:
Bangkok, Thailand
66.2.719.3399
info@campbellsci.asia
www.campbellsci.asia
Shepshed, Loughborough, UK
44.0.1509.601141
sales@campbellsci.co.uk
www.campbellsci.co.uk
Logan, UT USA
435.227.9120
info@campbellsci.com
www.campbellsci.com
Costa Rica
Location:
Phone:
Email:
Website:
San Pedro, Costa Rica
506.2280.1564
info@campbellsci.cc
www.campbellsci.cc
Spain
Location:
Phone:
Email:
Website:
Barcelona, Spain
34.93.2323938
info@campbellsci.es
www.campbellsci.es
 Loading...