

Page 1

INSTRUCTION MANUAL
CS615
Water Content Reflectometer
version 8221-07
Revision: 10/96
Copyright (c) 1995-1996
Campbell Scientific, Inc.
Page 2

Warranty and Assistance
The CS615 WATER CONTENT REFLECTOMETER is warranted by
CAMPBELL SCIENTIFIC, INC. to be free from defects in materials and
workmanship under nor mal use and service for twelve (12) months from date of
shipment unless specifi ed otherwise. Batteries have no warranty. CAMPBELL
SCIENTIFIC, INC.'s obligation under this warranty is limited to repairing or
replacing (at CAMPBELL SCIENTIFIC, INC.'s option) defective products.
The customer shall assume all costs of removing, reinstalling, and shipping
defective products to CAMPBELL SCIENTIFIC, INC. CAMPBELL
SCIENTIFIC, INC. will return such products by surface carrier prepaid. This
warranty shall not apply to any CAMPBELL SCIENTIFIC, INC. products
which have been subjected to modification, misuse, neglect, accidents of
nature, or shipping damage. This warranty is in lieu of all other warranties,
expressed or implied, including warranties of merchantability or fitness for a
particular purpose. CAMPBELL SCIENTIFIC, INC. is not liable for special,
indirect, incidental, or consequential damages.
Products may not be returned without prior authorization. The following
contact information is for US and International customers residing in countries
served by Campbell Scientific, Inc. directly. Affiliate companies handle repairs
for customers wi thin their territories. Please visi t www.campbellsci.com to
determine which Campbell Scientific company serves your country. To obtain
a Returned Materials Authorization (RMA), contact CAMPBELL
SCIENTIFIC, INC., phone (435) 753-2342. After an applications engineer
determines the nature of the problem, an RMA number will be issued. Please
write this number clearly on the outside of the shipping container.
CAMPBELL SCIENTIFIC's shipping address is:
CAMPBELL SCIENTIFIC, INC.
RMA#_____
815 West 1800 North
Logan, Utah 84321-1784
CAMPBELL SCIENTIFIC, INC. does not accept collect calls.
Page 3

CS615 WATER CONTENT REFLECTOMETER
INSTRUCTION MANUAL
TABLE OF CONTENTS
PDF viewers note: These page numbers refer to the printed version of this document. Use
the Adobe Acrobat® bookmarks tab for links to specific sections.
PAGE
1. INTRODUCTION.........................................................................................................................1
2. DESCRIPTION............................................................................................................................1
3. SPECIFICATIONS
3.1 Dimensions ................................................................................................................................2
3.2 Weight........................................................................................................................................2
3.3 Electrical.....................................................................................................................................2
4. PERFORMANCE SPECIFICATIONS
4.1 Accuracy.....................................................................................................................................2
4.2 Resolution ..................................................................................................................................2
4.3 Operating Range........................................................................................................................2
5. INSTALLATION
5.1 Orientation..................................................................................................................................3
5.2 Potential Problems with Improper Insertion ...............................................................................3
6. WIRING..........................................................................................................................................4
7. DATALOGGER INSTRUCTIONS
7.1 Introduction ................................................................................................................................4
7.2 Pulse Count................................................................................................................................4
7.3 Period Measurement..................................................................................................................5
8. MAINTENANCE..........................................................................................................................5
9. CALIBRATION
9.1 General ......................................................................................................................................5
10. SAMPLE PROGRAMS.............................................................................................................6
10.1 Sample Program 1.....................................................................................................................7
10.2 Sample Program 2.....................................................................................................................7
10.3 Sample Program 3.....................................................................................................................8
10.4 Sample Program 4.....................................................................................................................9
I
Page 4

This is a blank page.
Page 5

CS615 WATER CONTENT REFLECTOMETER
1. INTRODUCTION
NOTE: There is more than one version of
the CS615. This manual is written for
version 8221-07. The version number is
listed on a cable label near the end of the
probe cable. All CS615s are similar in
measurement method but the calibration
varies with version.
The CS615 Water Content Reflectometer
provides a measure of the volumetric water
content of porous media. The water content
information is derived from the effect of
changing dielectric constant on electromagnetic
waves propagating along a wave guide.
The reflectometer output is a square wave and
can be connected to Campbell Scientific
dataloggers CR10X, CR10, CR500, 21X, or
CR7. The measured period can be converted
to volumetric water content using calibration
values.
2. DESCRIPTION
The Water Content Reflectometer consists of
two stainless steel rods connected to a printed
circuit board. A shielded four-conductor cable is
connected to the circuit board to supply power,
enable the probe, and monitor the pulse output.
The circuit board is encapsulated in epoxy.
High speed electronic components on the circuit
board are configured as a bistable multivibrator.
The output of the multivibrator is connected to
the probe rods which act as a wave guide. The
oscillation frequency of the multivibrator is
dependent on the dielectric constant of the
media being measured. The dielectric constant
is predominantly dependent on the water
content. Digital circuitry scales the multivibrator
output to an appropriate frequency for
measurement with a datalogger. The CS615
output is essentially a square wave with an
amplitude swing of ±2.5VDC. The period of the
square wave output ranges from 0.7 to 1.6
milliseconds and is used for the calibration to
water content.
+12 V Red
ground Black
output Green
enable Orange
shield Clear
FIGURE 1. CS615 Water Content Reflectometer
1
Page 6

CS615 WATER CONTENT REFLECTOMETER
3. SPECIFICATIONS
3.1 DIMENSIONS
Rods: 30.0 cm long
3.2 mm diameter
3.2 cm spacing
Head: 11.0 cm x 6.3 cm x 2.0 cm
3.2 WEIGHT
Probe: 280 g
Cable: 35 g m
3.3 ELECTRICAL Power
70 milliamps @ 12VDC when enabled
less than 10 microamps quiescent
Power Supply Voltage
9VDC minimum, 18VDC maximum
Enable Voltage
-1
4.3 OPERATING RANGE
4.3.1 Soil Electrical Conductivity
The quality of soil moisture measurements
which apply electromagnetic fields to wave
guides is affected by soil electrical conductivity.
The propagation of electromagnetic fields in the
configuration of the CS615 is predominantly
affected by changing dielectric constant due to
changing water content, but it is also affected by
electrical conductivity. Free ions in soil solution
provide electrical conduction paths which result
in attenuation of the signal applied to the
waveguides. This attenuation both reduces the
amplitude of the high-frequency signal on the
probe rods and affects the shape of the
oscillating signal. The attenuation reduces
oscillation frequency at a given water content
because it takes a longer time to reach the
oscillator trip threshold.
Soil electrical conductivity can be described by
(Rhoades et al., 1976)
=+
σσθσ
bulk solution
Τ
v solid
minimum voltage to enable probe is 1.3VDC
4. PERFORMANCE SPECIFICATIONS
4.1 ACCURACY
See the Calibration section for a discussion of
accuracy. The accuracy is ±2% when using
calibration for specific soil. The accuracy when
using the general calibrations depends on soil
texture and mineral composition.
4.2 RESOLUTION
The resolution of the volumetric water content
measurement depends on which datalogger
instruction is used. When the CR10X, CR10 or
CR500 Instruction 27, Period Measurement, is
used, the resolution is on the order of 10
Period Measurement is not available on the CR7
or 21X.
When Instruction 3, Pulse Count, is used, the
resolution with an execution interval of 1.0
second is 10
-4 m3 m-3
when pulse period is 1.3
milliseconds. The resolution improves as the
water content decreases and as the execution
interval increases. A shorter execution interval
of 0.1 seconds yields a resolution of 10
at the same water content.
-6 m3 m-3
-2 m3 m-3
with σ the electrical conductivities of the bulk
soil, the soil solution, and the solid constituents,
θ
the volumetric water content and Τ a soil-
v
specific transmission coefficient intended to
account for the tortuosity of the flow path as
water content changes. See Rhoades et al.,
1989 for a form of this equation which accounts
for mobile and immobile water. The above
equation is presented here the show the
relationship between soil solution electrical
conductivity and soil bulk electrical conductivity.
Soil solution electrical conductivity, σ
solution
can
be determined in the laboratory using extraction
methods. Soil bulk electrical conductivity can
be measured using time domain reflectometry
(TDR) methods. Most expressions of soil
.
electrical conductivity are given in terms of
solution conductivity. Discussion of the effects
of soil electrical conductivity on CS615
performance will be on a soil solution basis
unless stated otherwise.
When soil solution electrical conductivity values
exceed 1 dS m
-1
, the slope of the calibration
begins to change. The slope decreases with
increasing electrical conductivity. The probe will
still respond to water content changes with good
stability, but the calibration will have to be
modified. (See the Calibration section.) At
2
Page 7

CS615 WATER CONTENT REFLECTOMETER
electrical conductivity values greater than
5 dS m
-1
the probe output can become unstable.
4.3.2 Soil Organic Matter and Clay Content
The amount of organic matter and clay in a soil
can alter the response of dielectric-dependent
methods to changes in water content. This is
apparent when mechanistic models are used to
describe this measurement methodology.
The electromagnetic energy introduced by the
probe acts to re-orientate or polarize the water
molecules which are polar. If other forces are
acting on the polar water molecules, the force
exerted by the applied signal will be less likely to
polarize it. This has the net effect of ‘hiding’
some of the water from the probe.
Organic matter and most clays are highly polar.
Additionally, some clays sorb water interstitially
and thus inhibit polarization by the applied field.
It would be convenient if the calibration of water
content to CS615 output period could be
adjusted according to some parameter of the
soil which reflects the affect of the intrinsic
forces. However, identification of such a
parameter has not been done, and it is likely
that measurement of the correlation parameter
would be more difficult than calibrating the
CS615 for a given soil.
4.3.3 Cable Length
Probe cable length is not a limitation under
typical applications. Laboratory measurements
show no degradation in measurement quality
with cable lengths up to 100 meters. Cable
lengths greater than 50 m may increase the
potential for damage from electrostatic
discharge (lightning). The performance may be
degraded if a cable type other than that
provided with the probe is used.
temperature coefficient for a range of volumetric
water content (θ
Coef
temperature v v
) values.
v
−
=− + −
3 46 10 0019 0045
.* . .
42
θθ
To apply this correction, the following equation
can be used.
θθ
vcorrected vuncorrected temperature
=−−
T Coef
()*20
Application of this correction yields a maximum
difference between corrected and uncorrected
water content of approximately 1.6%.
Considering the accuracy of the measurement
and the potential spatial variability of soil
temperature along the length of the probe rods,
the correction is not necessary in most cases.
An example for using the temperature correction is a
measurement taken on a soil at a water content of
about 0.23 and a temperature of 25°C. The
temperature coefficient value is 0.00164 m
which means that the measured water content is
5°C *(0.00164 m
3 m-3
°C-1) or 0.8% high.
5. INSTALLATION
5.1 ORIENTATION
The probe rods can be inserted vertically into
the soil surface or buried at any orientation to
the surface. A probe inserted vertically into a
soil surface will give an indication of the water
content in the upper 30 cm of soil. The probe
can be installed horizontal to the surface to
detect the passing of wetting fronts or other
vertical water fluxes. A probe installed at an
angle of 30 degrees with the surface will give an
indication of the water content of the upper 15
cm of soil.
3 m-3
°C
-1
4.3.4 Temperature Dependence
The CS615 output is sensitive to temperature,
and compensation can be applied to enhance
accuracy. The magnitude of the temperature
coefficient varies with water content.
Laboratory measurements were performed at
various water contents and over the
temperature range from 10°C to 30°C. The
calibration information presented in Section 9 is
for a temperature of 20°C. The following
equation can be used to interpolate the
5.2 POTENTIAL PROBLEMS WITH IMPROPER INSERTION
The method used for probe installation can
affect the accuracy of the measurement. The
probe rods should be kept as close to parallel
as possible when installed to maintain the
design wave guide geometry. The sensitivity of
this measurement is greater in the regions
closest to the rod surface than at distances
away from the surface. Probes inserted in a
manner which generates air voids around the
rods will reduce the measurement accuracy. In
3
Page 8
CS615 WATER CONTENT REFLECTOMETER
some applications, installation can be improved
by using insertion guides or a pilot tool.
Campbell Scientific offers the CS615G and
CS615P insertion tools. The CS615G is a
probe insertion guide which holds the rods
parallel during rod insertion. The CS615P pilot
tool is essentially the CS615 rods which are
inserted into the soil then removed. This makes
proper installation of the CS615 easier in soils
which are difficult to insert probes into.
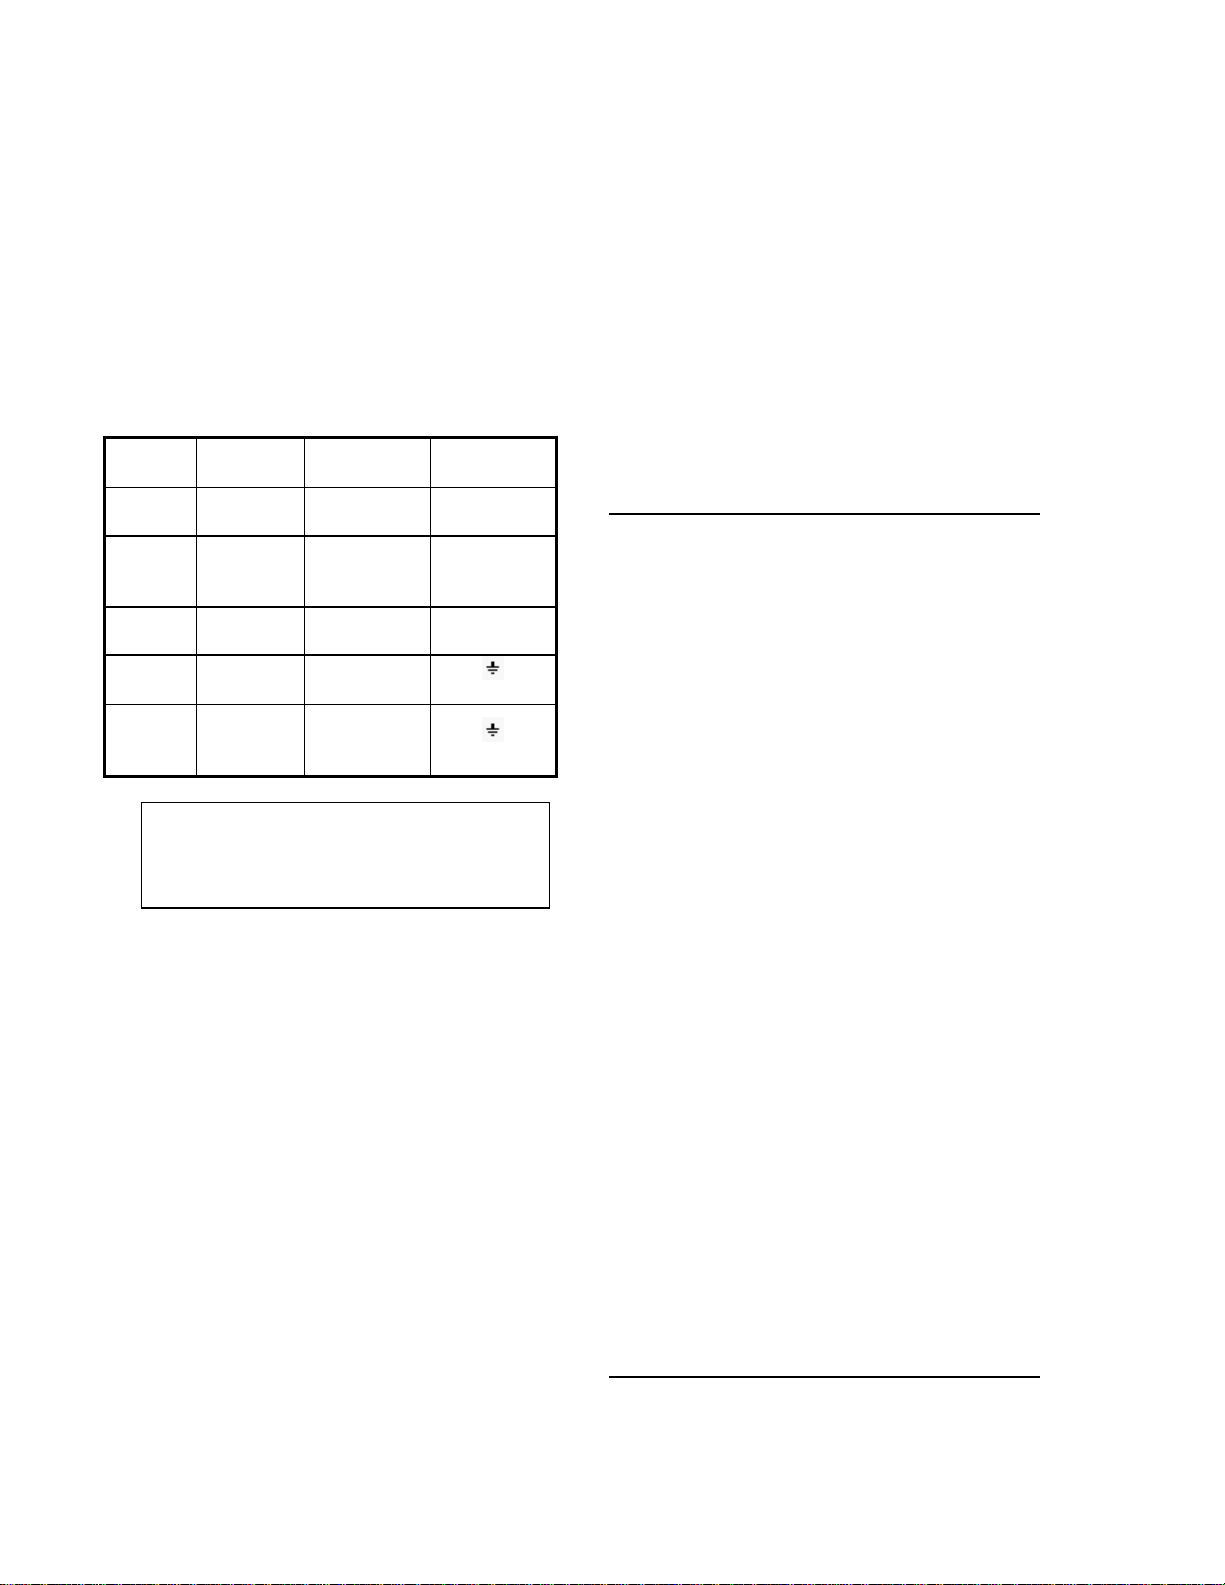
6. WIRING
color function CR10(X) 21X/CR7
red +12 V +12 V +12 V
green output
orange enable control port control port
black ground G
clear shield
(ground)
NOTE: CS615s manufactured before
12/95 have the green and black leads
reversed. Consult the wiring label near the
end of the cable.
SE analog
channel
G
pulse
channel
7.2 PULSE COUNT
It is important to understand the event
sequence during the Instruction 3 Pulse Count
Measurement when using it with the CS615.
See the Instructions section of the datalogger
manual for a detailed explanation of the Pulse
Count instruction.
A brief explanation of pulse count use in a
CS615 application is presented here. The LOW
LEVEL AC option for the configuration code is
used, and the output is selected for frequency
(Hz). Period (msec) is easily obtained with the
Inverse instruction (42).
TABLE 1. Instruction 3 Pulse Count
Measurement Sample Program
;{21X}
;Simple program to demonstrate use of
;pulse count instruction with CS615
;
*Table 1 Program
01: 2.0 Execution Interval (seconds)
1: If time is (P92)
1: 0000 Minutes into a
2: 15 Minute Interval
3: 30 Then Do
2: Do (P86) ;set CS615 enable high
1: 41 Set Port 1 High
The enable line is set high to put the probe in
the measuring mode.
7. DATALOGGER INSTRUCTIONS
7.1 INTRODUCTION
The output of the CS615 is essentially a square
wave with amplitude ±2.5 volts and a frequency
which is dependent on the dielectric constant of
the material surrounding the probe rods. The
frequency range is approximately 600 to 1500
Hz. The period (0.7 to 1.6 milliseconds) is used
in the calibration for water content.
The Pulse Count instruction of a CR10, CR500,
21X or CR7 dataloggers can be used with the
CS615 output connected to a pulse count
channel. The Period Measurement instruction
of the CR10 or CR500 can be used with the
CS615 output connected to a single-ended
analog channel.
4
3: Beginning of Loop (P87)
1: 1 Delay
2: 2 Loop Count
4: End (P95)
5: Pulse (P3)
1: 1 Reps
2: 1 Pulse Input Channel
3: 21 Low Level AC, Output Hz
4: 1 Loc [ kHz ]
5: .001 Mult ;convert Hz to kHz
6: 0.0 Offset
6: Do (P86) ;set CS615 enable low
1: 51 Set Port 1 Low
7: End (P95)
End Program
Page 9

CS615 WATER CONTENT REFLECTOMETER
The Pulse Count instruction uses accumulators
to monitor pulses on the datalogger Pulse
Count Channels. At the beginning of each
execution interval for the table containing the
Pulse Count instruction, the accumulator count
is dumped to a section in datalogger RAM, the
accumulator is then reset to zero and begins
accumulating counts again. When the Pulse
Count instruction is reached, the value in RAM
is modified by the multiplier and offset in the
Pulse Count instruction and the result written to
input storage. The RAM is then reset to zero.
Consider the simple 21X program in Table 1.
Additional instructions which might be needed for
multiplexer control or other functions have been
omitted for simplicity. This program is written to
obtain a CS615 reading every 15 minutes.
When the program is compiled by the
datalogger, the accumulators begin monitoring
the Pulse Count Channels. Immediately
following compilation by the datalogger, there is
no signal on the input channels because the
CS615 is not enabled until the 15 minute interval
specified in the Instruction 92 is reached. When
the 15 minute interval is reached, Instruction 86
is executed which sets the enable of the CS615
high and the probe outputs a signal which is
detected by the pulse counters.
The Loop Instruction in this application uses a
Delay of 1 and a Loop Count of 2. Program
execution pauses during the first loop count
until the execution interval of 2 seconds is
complete. This delay is necessary because the
probe has not been enabled for the entire
execution interval which means a complete
count is not obtained. More complex programs
will contain additional instructions prior to the
instruction to enable the CS615, and these
instructions can take a significant amount of
time to execute. During the second time
through the Loop Instruction the pulse counters
see the CS615 output for the full execution
interval. At the end of this interval the
accumulators transfer to RAM and are reset.
When the program execution then moves to the
Pulse Count Instruction (P3) the value in RAM
is converted to kHz and written to input storage.
7.3 PERIOD MEASUREMENT
Instruction 27, Period Measurement is available
only on the CR10, CR10X, or CR500. For
convenience, the following tables from the
datalogger manual are presented here. See the
datalogger manual for detailed description of
the instruction and the example programs for
typical values.
8. MAINTENANCE
The CS615 does not require periodic
maintenance.
9. CALIBRATION
9.1 GENERAL
The information in this calibration section
applies only to CS615 version 8221-07. The
version number is listed on a cable label near
the end of the probe cable.
The CS615 provides an indirect measurement
of soil water content by using the effect of
changing dielectric constant on applied
electromagnetic waves. The probe rods act as
a wave guide and the material surrounding the
rods (soil) varies in dielectric constant with the
amount of water in the material.
The dielectric constant of the soil is a weighted
summation of the dielectric constants of the soil
constituents. The dielectric constant for water
is significantly higher than that of other
constituents. Changes in the dielectric constant
of the soil system can be attributed to changes
in water content. This is the basis for the
measurement technique.
There are two soil properties which affect the
response of the CS615 to changes in water
content. High clay contents (greater than 30%)
or high electrical conductivity (greater than
1 dS m
adjusted or generated for the specific soil.
-1
) may require that the calibration be
5
Page 10
CS615 WATER CONTENT REFLECTOMETER
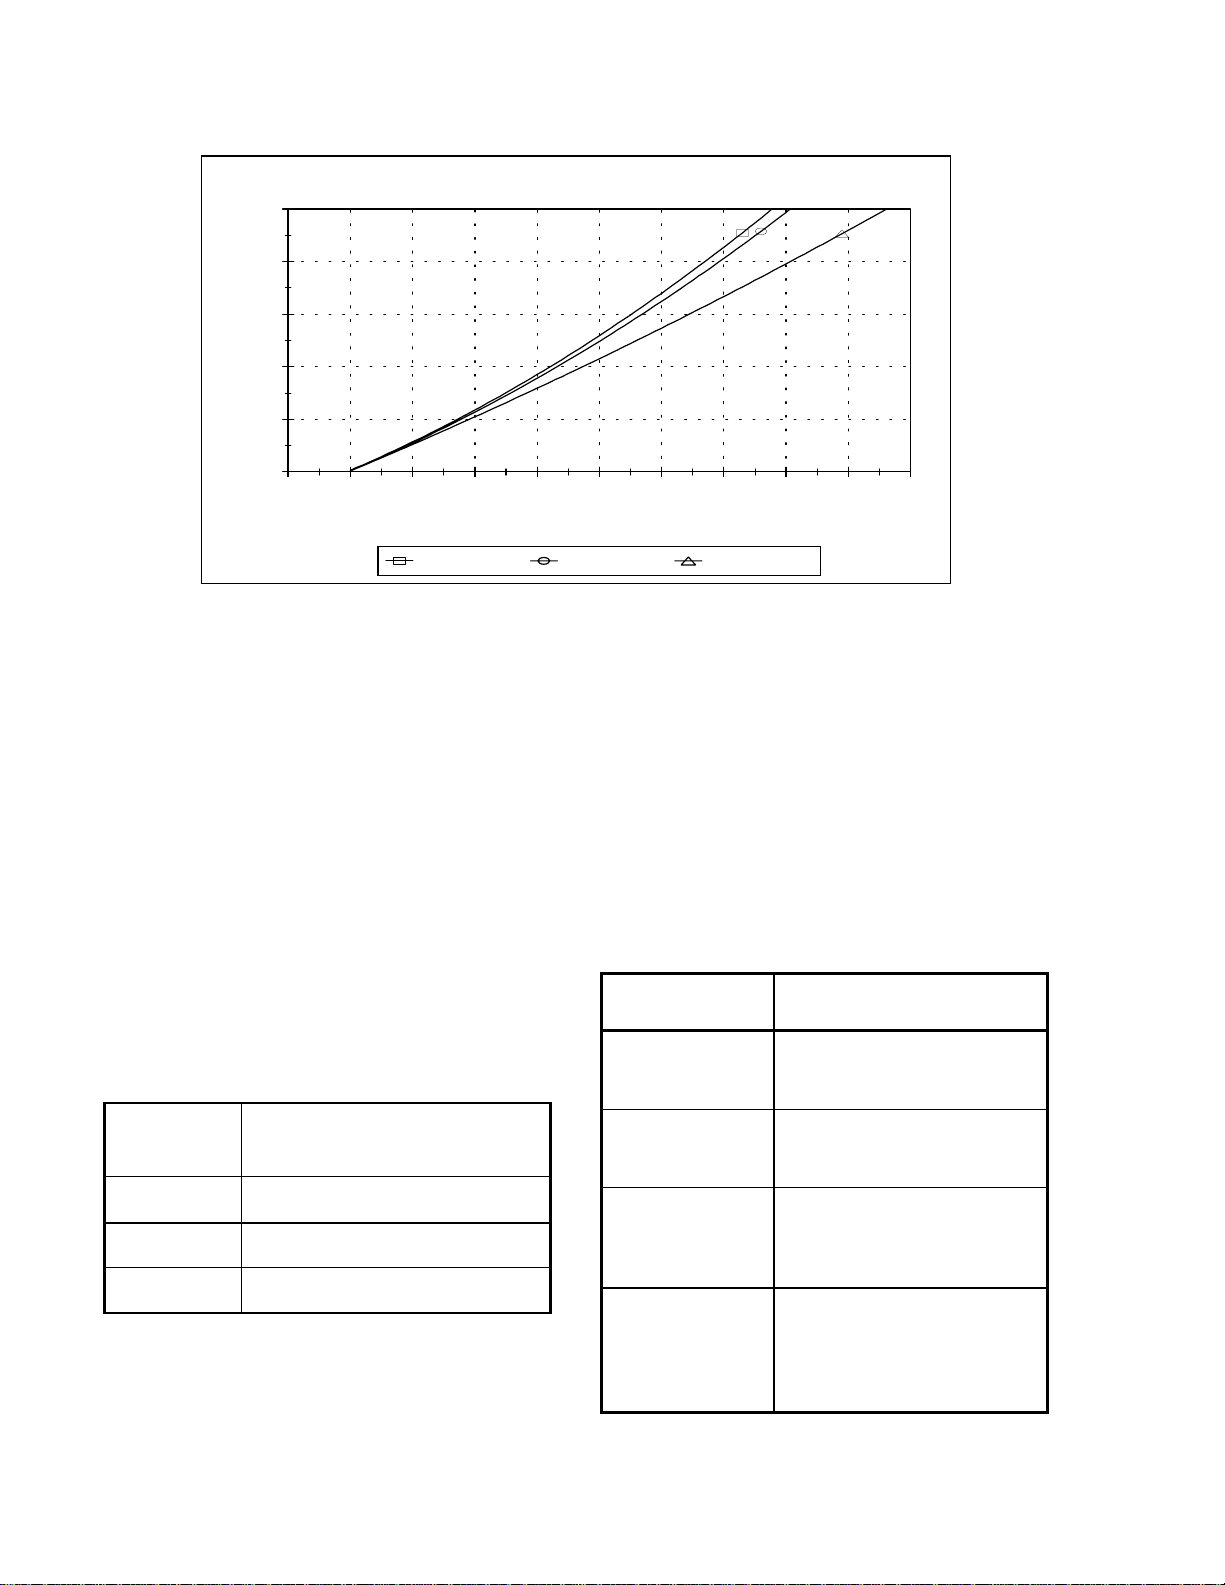
CS615 calibration for version 8221-07
0.5
0.4
0.3
0.2
volumetric water content
0.1
0
0.6 0.7 0.8 0.9 1 1.1 1.2 1.3 1.4 1.5 1.6
ec = 0.8 dS/m ec = 1.8 dS/m ec = 3.0 dS/m
CS615 output period (msec)
FIGURE 2. CS615 Calibration Curves
Figure 2 demonstrates the effect of electrical
conductivity on the calibration. At electrical
conductivity values of 1 dS m
calibration shown for 0.8 dS m
-1
and below, the
-1
works well for a
wide range of soil textures. The calibration
curves for the higher electrical conductivities
show that the slope decreases with increasing
conductivity. The response of the CS615 to
changes in water content at higher electrical
conductivity values is well-behaved up to
approximately 5 dS m
-1
. The calibration can be
approximated from figure 2 if the soil solution
electrical conductivity is known or if soil
measurements are made with the CS615 and
the actual water content is independently
determined. High clay content has a similar
affect on the calibration but the magnitude is
dependent on the clay type.
electrical
conductivity
θ
is the volumetric water content on a fraction
v
(dS m
≤
1.0
1.8
3.0
-1
)
θτ τ τ
() . . * . *
v
θτ τ τ
() . . * . *
v
θτ τ τ
() . . * . *
v
calibration
=− + +
0187 0 037 0 335
=− + +
0 207 0 097 0 288
=− + +
0 298 0361 0 096
basis i.e. 0.20 is 20% volumetric water content.
τ
is the CS615 output period in milliseconds.
9.2 CALIBRATION FOR A SPECIFIC SOIL
The calibration relationship between volumetric
water content and CS615 output period for a
specific soil may need to be established if
increased accuracy is needed or if the
composition of the soil deviates from what might
be considered typical. High electrical
conductivity, high clay content, high quartz
content and high organic matter content are
conditions which will affect probe response.
10. SAMPLE PROGRAMS
Sample Program
number
1 Monitor 1 CS615 with CR10
datalogger using Period
Averaging Instruction (P27)
2 Monitor 1 CS615 with 21X
datalogger using Pulse
2
2
2
3 Monitor 48 CS615s with 21X
4 Monitor 48 CS615s with
Count Instruction (P3)
datalogger and AM416
multiplexer using Pulse
Count Instruction (P3)
CR10 datalogger and
AM416 multiplexer using
Period Averaging Instruction
(P27)
Description
6
Page 11

CS615 WATER CONTENT REFLECTOMETER
The calibration coefficients in the example
programs are demonstrative only. See Section
9 for information on calibration.
10.1 SAMPLE PROGRAM 1
Simple program using the Period Averaging
Instruction (P27) of a CR10 datalogger to read a
single CS615. The measurement is taken
hourly and the period and water content are
written to output storage.
CR10 CS615
Single-Ended
Channel 1 (SE1)
Control Port 5 (C5) orange
The red lead is connected to 12VDC and the
black and shield are connected to ground.
;{CR10}
;
*Table 1 Program
01: 5.0 Execution Interval (seconds)
1: If time is (P92) ;take reading hourly
1: 0000 Minutes (Seconds --) into a
2: 60 Interval (same units as above)
3: 30 Then Do
2: Do (P86)
1: 45 Set Port 5 High;enable CS615
3: Period Average (SE) (P27)
1: 1 Reps
2: 4 2 V Peak to Peak/200 kHz
Max. Freq.
3: 1 SE Channel
4: 10 No. of Cycles
5: 5 Timeout (units = 0.01 seconds)
6: 1 Loc [ 615period ]
7: .001 Mult
8: 0.0 Offset
4: Do (P86) ;disable CS615
1: 55 Set Port 5 Low
5: Polynomial (P55) ;convert period to water content
1: 1 Reps
2: 1 X Loc [ 615period ]
3: 2 F(X) Loc [ 615water ]
4: -0.187 C0
5: 0.037 C1
6: 0.335 C2
7: 0.0 C3
8: 0.0 C4
green
9: 0.0 C5
6: Do (P86)
1: 10 Set Output Flag High
7: Real Time (P77)
1: 0220 Day,Hour/Minute
8: Sample (P70)
1: 2 Reps
2: 1 Loc [615period]
9: End (P95)
End Program
10.2 SAMPLE PROGRAM 2
Simple program using the Pulse Count Instruction
(P3) of a CR10, CR500 or 21X datalogger to read
a single CS615. The Water Content
Reflectometer is queried when Flag 1 is set high.
The measurement is made and the period and
water content values are written to output storage.
CR10 or 21X CS615
Pulse Count
Channel 1 (P1)
Control Port 5 (C5) orange
The red lead is connected to 12VDC and the
black and shield are connected to ground.
;{CR10, CR500 or 21X}
;
*Table 1 Program
01: 1.0 Execution Interval (seconds)
1: If Flag/Port (P91) ;set flag1 high to initiate
reading
1: 11 Do if Flag 1 is High
2: 30 Then Do
2: Do (P86) ;enable CS615
1: 45 Set Port 5 High
3: Beginning of Loop (P87) ;delay for complete
count interval
1: 1 Delay
2: 2 Loop Count
4: End (P95)
5: Pulse (P3) ;determine CS615 output frequency
1: 1 Reps
2: 1 Pulse Input Channel
3: 21 Low Level AC, Output Hz
4: 1 Loc [ 615kHz ]
5: .001 Mult ;convert to kHz
6: 0.0 Offset
green
7
Page 12

CS615 WATER CONTENT REFLECTOMETER
6: Do (P86) ;disable CS615
1: 55 Set Port 5 Low
7: Z=1/X (P42) ;convert kHz to milliseconds
1: 1 X Loc [ 615kHz ]
2: 2 Z Loc [ 615msec ]
8: Polynomial (P55) ;convert period to water content
1: 1 Reps
2: 2 X Loc [ 615msec ]
3: 3 F(X) Loc [ 615water ]
4: -0.187 C0
5: 0.037 C1
6: 0.335 C2
7: 0.0 C3
8: 0.0 C4
9: 0.0 C5
9: Do (P86)
1: 10 Set Output Flag High
10: Real Time (P77)
1: 0220 Day,Hour/Minute
11: Sample (P70)
1: 2 Reps
2: 2 Loc [615msec]
9: Do (P86)
1: 21 Set Flag 1 low
12: End (P95)
End Program
Attention to program structure when using the
Pulse Count Instruction with sensors that are
periodically enabled is necessary to ensure
accurate results. See Section 7.2 for a detailed
description of the Pulse Count Instruction.
CAUTION:
1. The probe rods of the CS615 are
essentially antennae which transmit and
receive radio waves. Interference can
occur when enabled probes are in close
proximity and electrical conductivity of
the measured medium is high.
Generally, interference is not a problem
when the distance between enabled
probes is greater than 20 cm. It may be
necessary to configure probe
placement and multiplexer connection
to alleviate probe interaction.
2. Reading 48 CS615s using the Pulse
Count Instruction will take
approximately 32 seconds. This may
conflict with other measurements.
;{21X}
;
*Table 1 Program
01: 1.0 Execution Interval (seconds)
10.3 SAMPLE PROGRAM 3
Program using the Pulse Count Instruction (P3)
of 21X datalogger and AM416 multiplexer to
read 48 CS615 probes.
.
below
This program is written to read 48 CS615s
every hour and write the water content value to
output storage. The AM416 multiplexer is a 16
channel multiplexer with 4 lines per channel.
See figure 3 for wiring schematic. Three CS615
outputs and a common enable for all 3 probes
are attached to each AM416 channel. Three
CS615s connected to a AM416 channel are
enabled simultaneously while the Pulse Count
Instruction uses a repetition value of 3 to
sequentially read the probe outputs. The
frequency value of the Pulse Count Instruction
is converted to period by the Z=1/X Instruction
(P42) and the calibration to volumetric water
content is invoked using the Polynomial
Instruction. The water content values are
written to output storage.
See the cautions listed
1: If time is (P92) ;take CS615 readings hourly
1: 0000 Minutes into a
2: 60 Minute Interval
3: 30 Then Do
2: Do (P86) ;enable AM416
1: 41 Set Port 1 High
3: Do (P86) ;set CS615 enable high
1: 43 Set Port 3 High
4: Beginning of Loop (P87) ;multiplexing loop
1: 0000 Delay
2: 16 Loop Count
;loop index of 3 so 3 readings measured
;by pulse instruction are advanced 3
;locations each pass through measurement
loop.
5: Step Loop Index (P90)
1: 3 Step
6: Do (P86) ;clock AM416
1: 72 Pulse Port 2
8
Page 13

CS615 WATER CONTENT REFLECTOMETER
;delay loop to wait remainder of execution
;interval once AM416 is clocked, and one
;complete execution interval for precise
;pulse count interval.
7: Beginning of Loop (P87)
1: 1 Delay
2: 2 Loop Count
8: End (P95) ;end of delay loop
9: Pulse (P3) ;read CS615s
1: 3 Reps
2: 1 Pulse Input Channel
3: 21 Low Level AC, Output Hz
4: 1 Loc [ kHz#1 ]
5: .001 Mult
6: 0.0 Offset
;convert frequencies to period. 0.001 multiplier
;converts kHz to milliseconds.
10: Z=1/X (P42)
1: 1 X Loc [ kHz#1 ]
2: 4 Z Loc [ period#1 ]
11: Z=1/X (P42)
1: 2 X Loc [ kHz#2 ]
2: 5 Z Loc [ period#2 ]
12: Z=1/X (P42)
1: 3 X Loc [ kHz#3 ]
2: 6 Z Loc [ period#3 ]
13: Polynomial (P55) ;apply calibration
1: 3 Reps
2: 4 X Loc [ period#1 ]
3: 7-- F(X) Loc [ water#1 ]
4: -.187 C0
5: .037 C1
6: .335 C2
7: 0.0 C3
8: 0.0 C4
9: 0.0 C5
14: End (P95)
10.4 SAMPLE PROGRAM 4
Program using the Period Averaging Instruction
(P27) of CR10 datalogger and AM416
multiplexer to read 48 CS615 probes
CAUTION:
1. The probe rods of the CS615 are
essentially antennae which transmit and
receive radio waves. Interference can
occur when enabled probes are in close
proximity and electrical conductivity of
the measured medium is high.
Generally, interference is not a problem
when the distance between enabled
probes is greater than 20 cm. It may be
necessary to configure probe
placement and multiplexer connection
to alleviate probe interaction.
;{CR10}
;
*Table 1 Program
01: 1.0 Execution Interval (seconds)
;Once an Hour, Read Probes
1: If time is (P92)
1: 0 Minutes into a
2: 60 Minute Interval
3: 30 Then Do
; enable multiplexer
2: Do (P86)
1: 41 Set Port 1 High
; turn on port that enables 615s
3: Do (P86)
1: 43 Set Port 3 High
15: Do (P86) ;set CS615 enable low
1: 53 Set Port 3 Low
16: Do (P86) ;set AM416 reset low
1: 51 Set Port 1 Low
17: Do (P86)
1: 10 Set Output Flag High
18: Sample (P70)
1: 48 Reps
2: 7 Loc [ water#1 ]
19: End (P95)
End Program
;Multiplexer loop
4: Beginning of Loop (P87)
1: 0 Delay
2: 16 Loop Count
; clock multiplexer
5: Do (P86)
1: 72 Pulse Port 2
9
Page 14

CS615 WATER CONTENT REFLECTOMETER
; loop index multiplied by 3 so that 3 readings
measured by pulse
; instruction are advanced 3 locations each pass
through measurement loop
6: Step Loop Index (P90)
1: 3 Step
7: Period Average (SE) (P27)
1: 3 Reps
2: 4 2 V Peak to Peak/200 kHz
Max. Freq.
3: 1 SE Channel
4: 10 No. of Cycles
5: 5 Timeout (units = 0.01 seconds)
6: 1-- Loc [ msec#1 ]
7: .001 Mult
8: 0.0 Offset
8: End (P95)
; set ports enabling mux and probes low
9: Do (P86)
1: 51 Set Port 1 Low
11: Polynomial (P55)
1: 48 Reps
2: 1 X Loc [ Period#1 ]
3: 49 F(X) Loc [ WatCont#1 ]
4: -0.187 C0
5: 0.037 C1
6: 0.335 C2
7: 0.0 C3
8: 0.0 C4
9: 0.0 C5
12: Do (P86)
1: 10 Set Output Flag High
13: Real Time (P77)
1: 10 Hour/Minute
14: Sample (P70)
1: 48 Reps
2: 49 Loc [ WatCont#1 ]
15: End (P95)
End Program
10: Do (P86)
1: 53 Set Port 3 Low
; apply calibration
10
Page 15

CS615 WATER CONTENT REFLECTOMETER
CR10 or 21X AM416 CS615
enable
signal
enable
signal
enable
signal
enable
signal
SE1
SE2
SE3
CR10
Using
Period
Measurement
C1
C2
C3
P1
P2
P3
21x
Using
Pulse
Count
Reset
Clock
H1
L1
H2
L2
H1
L1
1
H2
L2
H1
L1
2
H2
L2
enable
signal
enable
signal
#1
#2
#3
#4
#5
#6
(SE = Single
Ended Input
Channel)
H1
16
L1
H2
L2
signal #46
signal #47
signal #48
FIGURE 3. Wiring configuration for multiplexing 48 CS615s
with AM416 and CR10 or 21X datalogger.
#48
enable
signal
11
Page 16

Page 17

This is a bla nk page.
Page 18

Campbell Scientific Companies
Campbell Scientific, Inc. (CSI)
815 West 1800 North
Logan, Utah 84321
UNITED STATES
www.campbellsci.com
info@campbellsci.com
Campbell Scientific Africa Pty. Ltd. (CSAf)
PO Box 2450
Somerset West 7129
SOUTH AFRICA
www.csafrica.co.za
sales@csafrica.co.za
Campbell Scientific Australia Pty. Ltd. (CSA)
PO Box 444
Thuringo wa Cent ra l
QLD 4812 AUSTRALIA
www.campbellsci.com.au
info@campbellsci.com.au
Campbell Scientific do Brazil Ltda . (CSB)
Rua Luisa Crapsi Orsi, 15 Butantã
CEP: 005543-000 São Paulo SP BRAZIL
www.campbellsci.com.br
suporte@campbellsci.com.br
Campbell Scientific Canada Corp. (CSC)
11564 - 149th Street NW
Edmonton, Alberta T5M 1W7
CANADA
www.campbellsci.ca
dataloggers@campbellsci.ca
Campbell Scientific Ltd. (CSL)
Campbell Park
80 Hathern Road
Shepshed, Loughborough LE12 9GX
UNITED KINGDOM
www.campbellsci.co.uk
sales@campbellsci.co.uk
Campbell Scientific Ltd. (France)
Miniparc du Verger - Bat. H
1, rue de Terre Neuve - Les Ulis
91967 COURTABOEUF CEDEX
FRANCE
www.campbellsci.fr
campbell.scientific@wanadoo.fr
Campbell Scientific Spain, S. L.
Psg. Font 14, local 8
08013 Barcelona
SPAIN
www.campbellsci.es
info@campbellsci.es
Please visit www.campbellsci.com to obtain contact information for your local US or International representative.
 Loading...