


INSTRUCTION MANUAL
Use of the AVW1 and AVW4 with
Geokon Model 4500 Vibrating Wire
Piezometers and Pressure Transducers
Revision: 1/92
Copyright (c) 1987-1992
Campbell Scientific, Inc.

Warranty and Assistance
The AVW1 AND AVW4 are warranted by CAMPBELL SCIENTIFIC, INC.
to be free from defects in materials and workmanship under normal use and
service for twelve (12) months from date of shipment unless spec ified
otherwise. Batteries have no warranty. CAMPBELL SCIENTIFIC, INC.'s
obligation under this warranty is limited to repairing or replacing (at
CAMPBELL SCIENTIFIC, INC.'s option) defective products. The customer
shall assume all costs of removing, reinstalling, and shipping defective products
to CAMPBELL SCIENTIFIC, INC. CAMPBELL SCIENTIFIC, INC. will
return such products by surface carrier prepaid. This warranty shall not apply
to any CAMPBELL SCIENTIFIC, INC. products which have been subjected to
modification, misuse, neglect, accidents of nature, or shipping damage. This
warranty is in lieu of all other warranties, expressed or implied, including
warranties of merchantability or fitness for a particular purpose. CAMPBELL
SCIENTIFIC, INC. is not liable for special, indirect, incidental, or
consequential damages.
Products may not be returned without prior authorization. The following
contact information is for US and International customers residing in countries
served by Campbell Scientific, Inc. directly. Affiliate companies handle repairs
for custome rs within their territorie s. P lease visit www.ca m pbells ci.com to
determine which Campbell Scientific company serves your country. To obtain
a Returned Materials Authorization (RMA), contact CAMPBELL
SCIENTIFIC, INC., phone (435) 753-2342. After an applications engineer
determines the nature of the problem, an RMA number will be issued. Please
write this number clearly on the outside of the shipping container.
CAMPBELL SCIENTIFIC's shipping address is:
CAMPBELL SCIENTIFIC, INC.
RMA#_____
815 West 1800 North
Logan, Utah 84321-1784
CAMPBELL SCIENTIFIC, INC. does not accept collect calls.

TABLE OF CONTENTS
PDF viewers note: These page numbers refer to the printed version of this document. Use
the Adobe Acrobat® bookmarks tab for links to specific sections.
PAGE
WARRANTY AND ASSISTANCE
1. GENERAL INFORMATION
1.1 Sensor Selection ..............................................................................................................................1-1
1.2 Sensor Care and Installation.............................................................................................. ..............1-1
2. TEMPERATURE MEASUREMENT
2.1 General.............................................................................................................................................2-1
2.2 Accuracy and Resolution..................................................................................................................2-1
2.3 Programming and Sensor Hook-up..................................................................................................2-6
3. VIBRATING WIRE MEASUREMENT
3.1 General.............................................................................................................................................3-1
3.2 Multiplier and Offset..........................................................................................................................3-1
3.3 Swept Frequency, Start and End......................................................................................................3-2
3.4 Resolution vs. "# of cycles" ..............................................................................................................3-3
3.5 Temperature Correction ...................................................................................................................3-3
3.6 Delay Between Measurements.........................................................................................................3-4
4. THE AVW1
4.1 General.............................................................................................................................................4-1
4.2 Sensor Hook Up...............................................................................................................................4-1
4.3 Well Monitoring Example..................................................................................................................4-1
5. THE AVW4
5.1 General.............................................................................................................................................5-1
5.2 Sensor Hook Up...............................................................................................................................5-2
5.3 Datalogger Programming .................................................................................................................5-2
6. THE AVW1 AND A MULTIPLEXER
Not yet available
APPENDIX A. PRESSURE CONVERSION CHART............................................... A-1
APPENDIX B. SCHEMATICS AND STUFFING CHARTS ......................................B-1
APPENDIX C. THEORY AND ADDITIONAL DETAILS
C.1 Swept Frequency Theory................................................................................................................C-1
C.2 Additional Theory on Multiplier and Offset......................................................................................C-1
I

TABLE OF CONTENTS
TABLES
2.2-1 Temperature vs. Thermistor Resistance, V, oC, and Linearization Error................................... 2-1
3.2-1 Calibration Data for Sensor 3998................................................................................................ 3-2
FIGURES
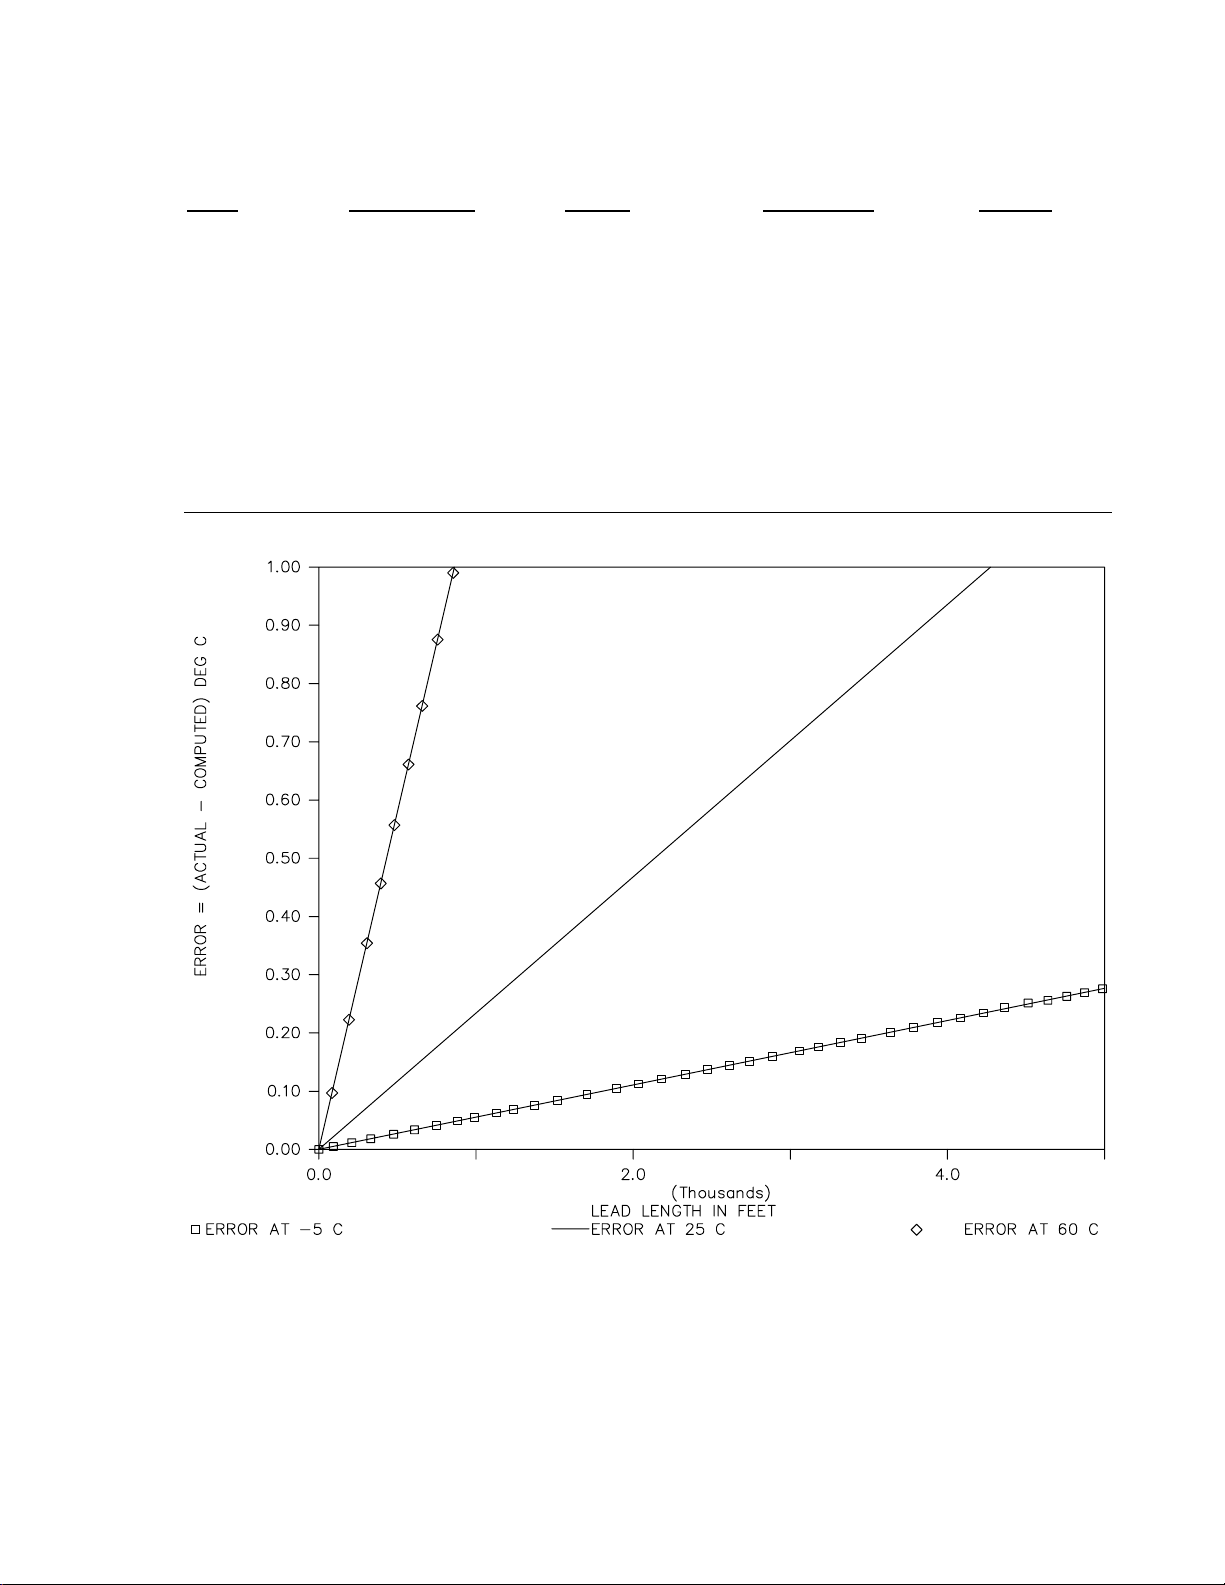
2.2-1 Temperature Measurement Error at Three Temperatures as a Function of Lead Length ......... 2-3
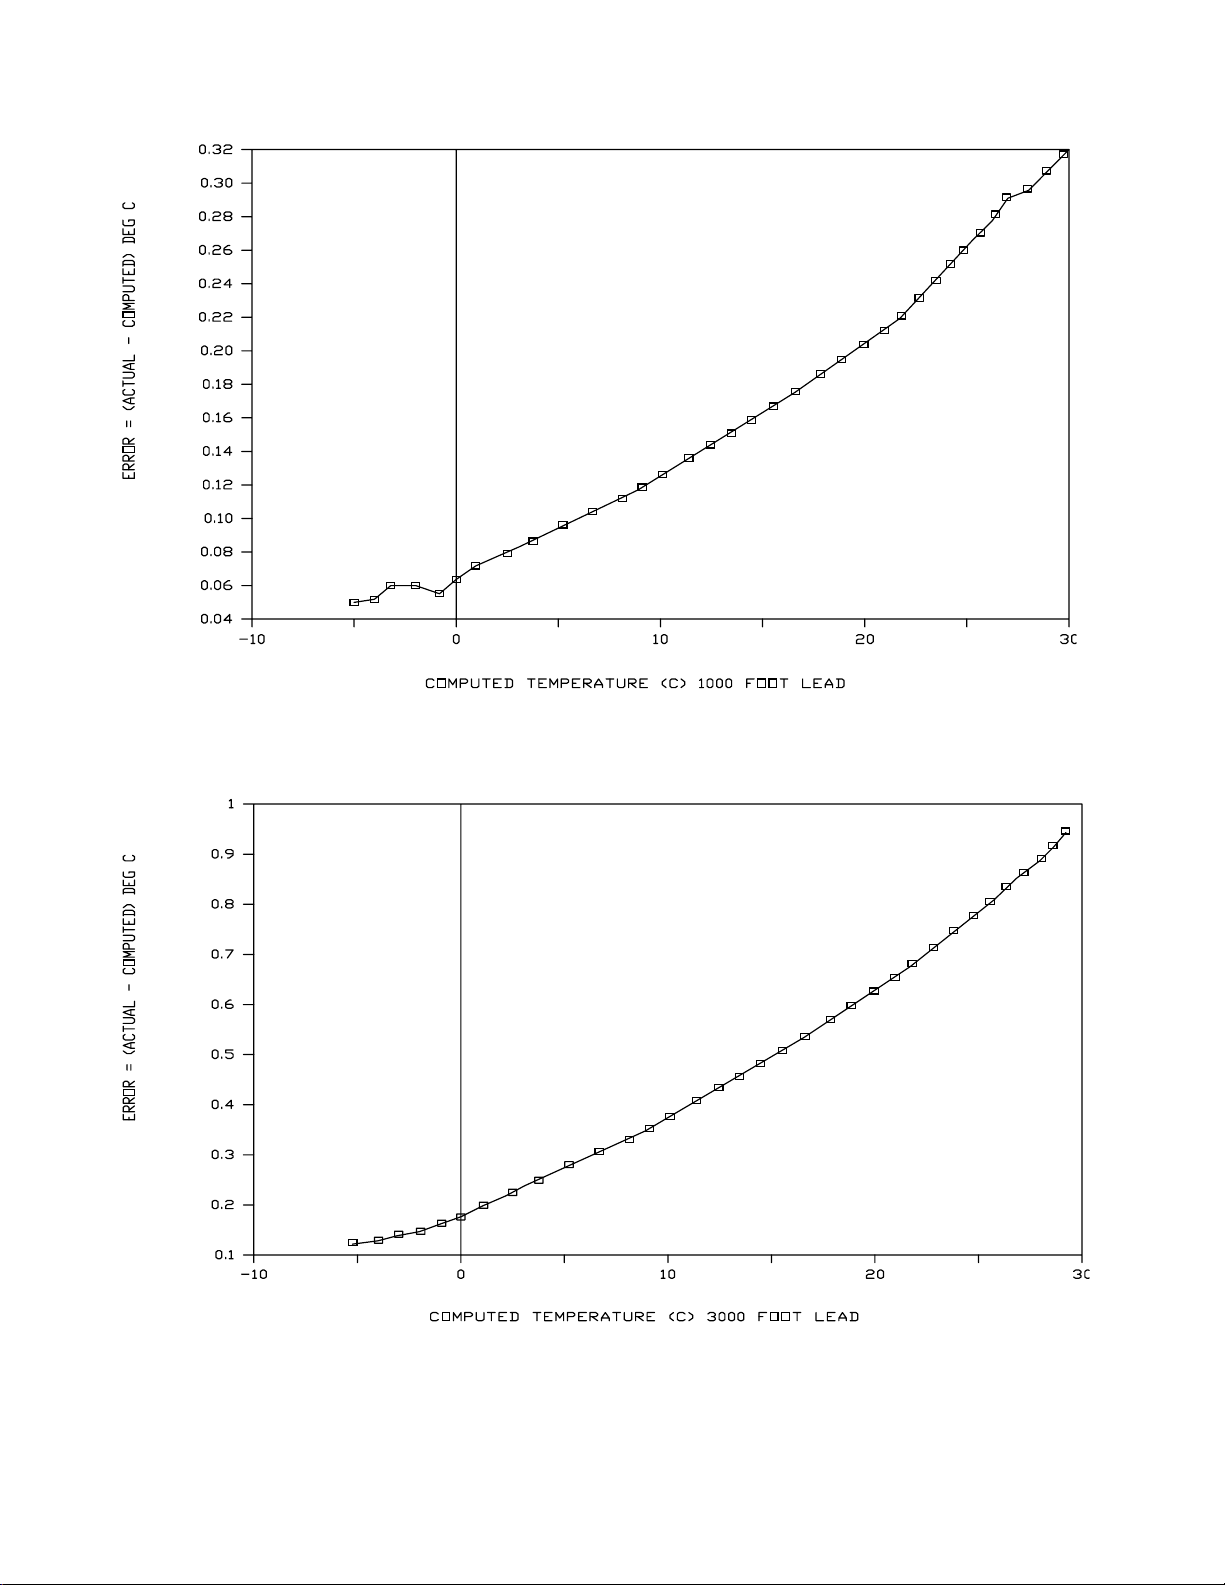
2.2-2 Temperature Measurement Error on a 1000 Foot Lead............................................................. 2-4
2.2-3 Temperature Measurement Error on a 3000 Foot Lead............................................................. 2-4
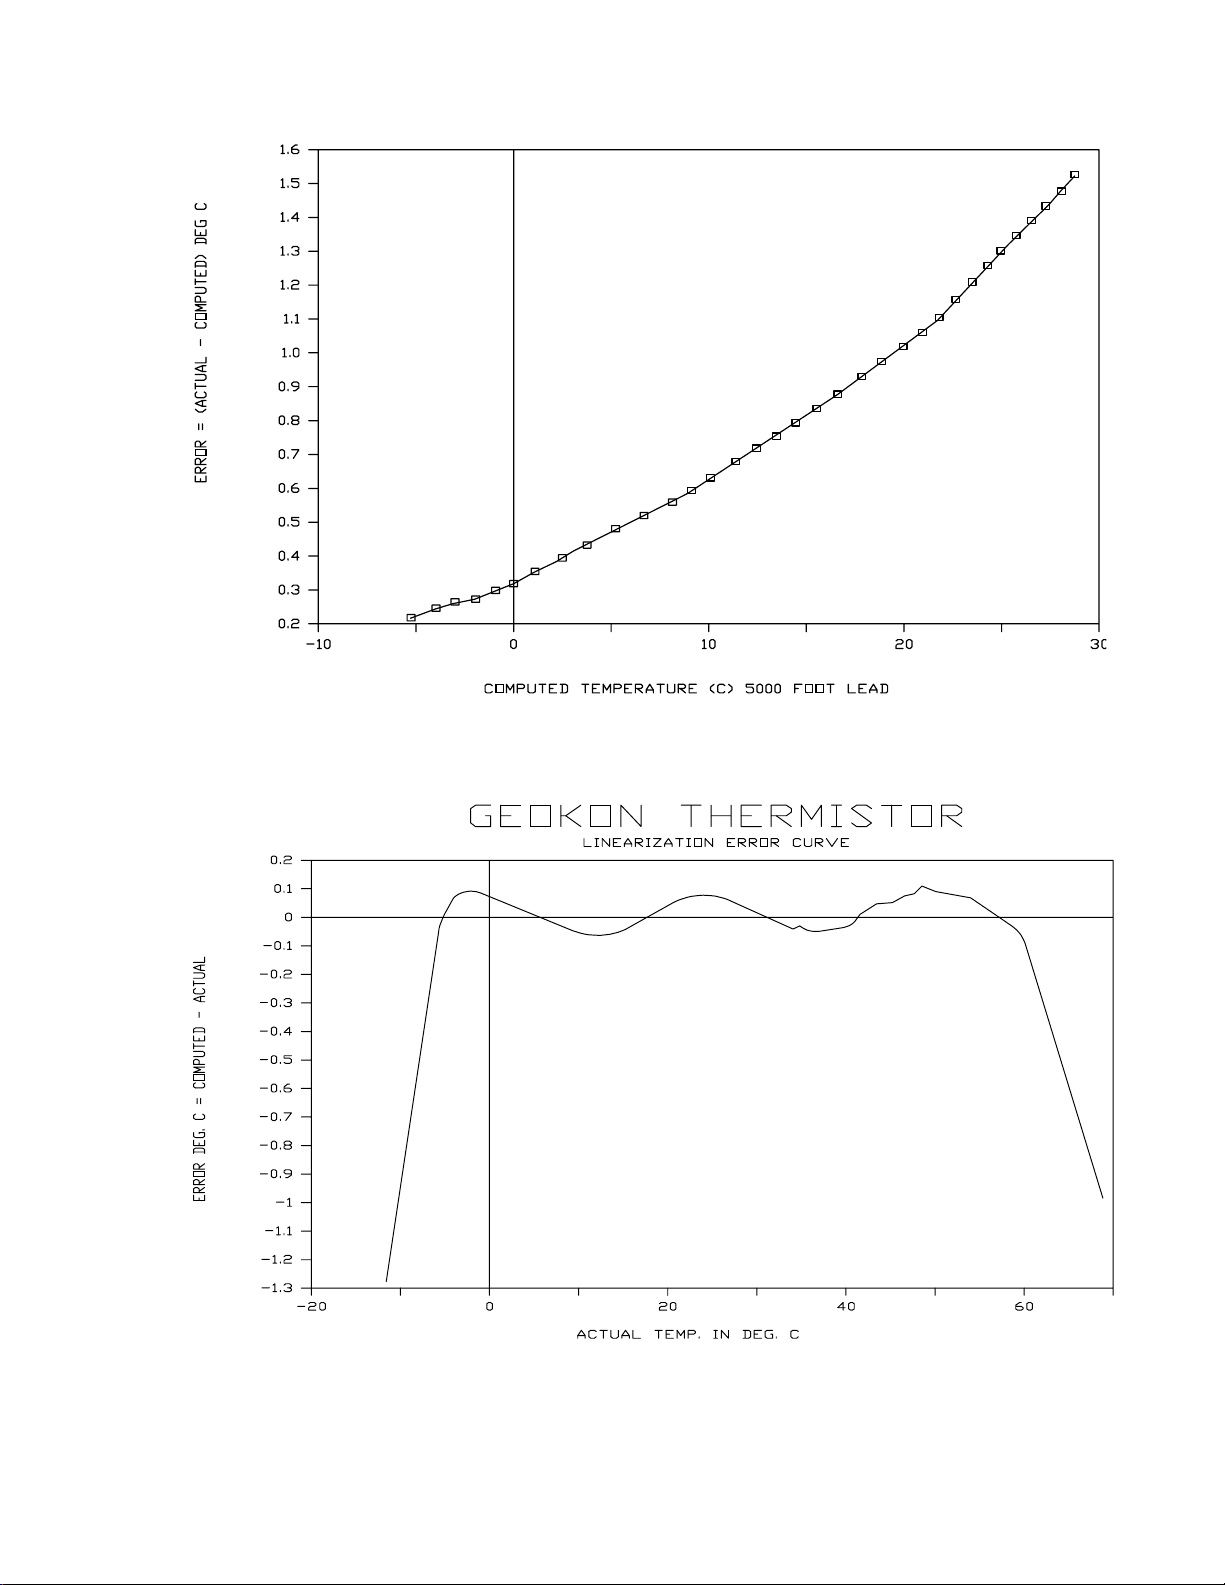
2.2-4 Temperature Measurement Error on a 5000 Foot Lead............................................................. 2-5
2.2-5 Thermistor Linearization Error .................................................................................................... 2-5
2.3-1 Direct Measurement of the Geokon Thermistor.......................................................................... 2-6
3.1-1 A Vibrating Wire Sensor.............................................................................................................. 3-1
4.1-1 The AVW1................................................................................................................................... 4-1
4.2-1 Hook up to AVW1 ....................................................................................................................... 4-1
4.3-1 Well Monitoring Example............................................................................................................ 4-2
5.1-1 The AVW4................................................................................................................................... 5-1
5.2-1 Hook up for AVW4...................................................................................................................... 5-2
A.1 Pressure Conversion Chart.........................................................................................................A-1
B.1-1 AVW1 Schematic........................................................................................................................B-1
B.1-2 AVW1 Stuffing Chart...................................................................................................................B-2
B.1-3 AVW4 Schematic........................................................................................................................B-3
B.1-4 AVW4 Schematic........................................................................................................................B-4
B.1-5 AVW4 Stuffing Chart...................................................................................................................B-5
II

USE OF THE AVW1 AND AVW4 WITH GEOKON MODEL 4500
VIBRATING WIRE PI EZOMETERS AND PRESSURE TRANSDUCERS
1. GENERAL INFORMATION
The CR10 is the only CSI datalogger that has
the capability of measuring the vibrating wire
pressure sensor in addition to the piezoresistive
type of strain gage sensor. The CR10 can
measure vibrating wire sensors with short leads
without the AVW1 or AVW4. However, the
AVW1 and AVW4 provide important signal
conditioning that 1) completes the thermistor
bridge for the measurement of the sensor's
temperature, 2) converts the swept frequency
excitation from 2.5 volts peak to peak to 12
volts peak to peak, 3) provides transformer
isolation and consequent noise reduction for the
vibrating wire signal, and 4) provides additional
transient protection for both the temperature
and vibrating wire circuits.
The AVW1 and AVW4 are designed and tested
over the environmental range from -25°C to
+50°C. CSI recommends that special
temperature testing be done at the factory if the
AVW's are to operate at temperatures outside
this range.
1.1 SENSOR SELECTION
The vibrating wire sensors may be purchased
as either vented or sealed sensors. The vented
sensors have a small hollow "vent tube" that
connects the hollow chamber behind the
diaphragm to the atmosphere. The vent tube
allows the barometric pressure to act on both
sides of the diaphragm equally which removes
the barometric pressure from the reading. A
pressure reading with out a barometric pressure
component is referred to as "gage" pressure. A
pressure reading with a barometric pressure
component is referred to as "absolute"
pressure. One disadvantage of the vented
sensor is that the cable, which contains the vent
tube, is more expensive than the cable for the
unvented sensor. For this reason, it may be
more economical to buy unvented sensors and
use an extra one as a barometer to remove the
barometric pressure. A second small
disadvantage of the vented sensors is that they
require the use of desiccant, which must be
changed periodically, to dry the air entering the
vent tube.
The vibrating wire pressure sensor has a good
reputation for long term stability. The sensor
utilizes a change in the frequency of a vibrating
wire to sense pressure. Two measurements
are usually made on a vibrating wire sensor.
The first is the measurement of the temperature
of the probe to compensate for changes in its
temperature. The second is the measurement
of the frequency of the vibrating wire.
This manual covers the use of the CR10 and
AVW1 or AVW4 with Geokon's Model 4500
vibrating wire sensor series. Sections 2 and 3
of this manual cover the temperature and
vibrating wire measurements respectively.
Sections 4 and 5 give detail concerning the use
of the AVW1 and AVW4.
Geokon includes a calibration sheet and
instruction manual with each sensor or group of
sensors they sell. Geokon's manual should be
consulted for information on sensor selection
and installation. Geokon's address and phone
number are: 48 Spencer Street, Lebanon, NH
03766, (603) 448-1562.
1.2 SENSOR CARE AND INSTALLATION
The moisture trap of the vented models should
be kept closed until readings are to be taken.
DO NOT FORGET to remove the screw that
plugs the moisture trap when readings are to be
taken.
The large diameter diaphragm used in the low
pressure sensor requires special care when
handling. Avoid bumping or jarring the sensor.
Orientation of the 4500 series sensors will affect
the zero reading. Readings should be taken
with the sensor in the same orientation at all
times. When installing the 4500 series sensors,
certain steps should be followed to obtain
proper zero readings.
The cavity between the sintered filter cap and
the diaphragm should be filled with clean water
without any air bubbles.
In most cases the sensor is made to output
water height or pressure relative to a measured
level. In this case the pressure sensor should
1-1

AVW1/AVW4
be placed at the desired level and allowed to
come to temperature equilibrium with its
surroundings (5 minutes or more). The
multiplier determined in equation 3.2-2 should
be entered and 0.0 should be entered for the
offset. After the temperature and the reading
has stabilized, determine the value that would
have to be added to the reading to obtain the
measured level. Enter this value as the offset.
In some cases there is no measured reference.
In order to obtain the correct offset under these
conditions, lower the sensor to a point just
above the water level and wait 5 minutes. Use
the multiplier, an offset of 0.0, and the
temperature correction function determined in
Sections 3.2 and 3.5 to obtain a reading.
Record the reading. Solve equation 3.2-3 for
the new offset by plugging in the "reading" in the
place of the "[Gage Factor * Zero Reading]" and
the "Barometric Pressure" from an accurate
barometer or a reference sensor in the place of
"Po" unless it is a vented sensor then use 0 in
the place of "Po". Enter the new offset.
1-2

SECTION 2. TEMPERATURE MEASUREMENT
2.1 GENERAL
The vibrating wire probe includes a thermistor
which is used to measure the temperature of
the probe. Probe temperature is used to correct
errors in the vibrating wire measurement
caused by changes in the temperature of the
probe. The temperature correction is most
important when the temperature of the medium
the probe is measuring is changing (e.g. water
temperature in a river or shallow lake). When
concerned with the absolute reading, it is also
important to make the temperature correction if
the medium temperature differs from the
calibration temperature. In a deep well where
the water temperature does not change, the
error due to temperature can be removed by
allowing the sensor to come to thermal
equilibrium and adjusting the sensor reading to
read the correct depth by means of an offset.
2.2 ACCURACY AND RESOLUTION
The accuracy of the temperature measurement
is a function of the following factors listed in
decreasing importance: 1) the thermistor's
interchangeability, 2) the resistance of the wire,
3) the linearization error, 4) the precision of the
bridge resistors, 5) the accuracy of the
datalogger's voltage measurement, and 6) the
temperature coefficient of the bridge resistors.
The interchangeability of the thermistor is
o
C although a thermistor with ±0.2oC
±0.5
interchangeability is an option. The error due to
wire resistance is normally less than ±0.5
(see Figure 2.2-1 through 2.2-4). The
linearization error is ±0.15
over the range from -5 to +60
ο
C (see Figure 2.2-5)
o
C. The precision
of the bridge resistors (±0.1%) results in a
o
tolerance of ±0.03
C. The accuracy of the
datalogger's voltage measurement (±0.015%)
o
results in a tolerance of ±0.01
C. The
temperature coefficient of the bridge resistors
o
(10 ppm/
±0.0003
C) results in a tolerance of
oC/o
C.
Errors four, five, and six mentioned above are
o
all less than ±0.03
C each and can probably be
ignored. The wire resistance is primarily an
offset error and its affect on the pressure
measurement is removed by the initial
calibration. Errors caused by the change in wire
resistance due to temperature, thermistor
interchangeability, and the linearization error are
not removed by the initial calibration.
Ignoring the offset errors, the remaining
temperature accuracy is expected to be about
o
C. The temperature correction for the
±0.7
vibrating wire measurement is typically less than
o
0.05 psi/
C. A ±0.7oC temperature error would
result in a 0.035 psi (±1.0 inch H2O) error on a
50 psi Full Scale range.
The thermistor, Dale Electronics part number
1C3001-B3 is the standard with an
o
interchangeability of ±0.5
C. The optional
thermistor, Dale Electronics part number
1C3001-C3 has an inter-changeability of
o
C. Both of the above thermistors have the
±0.2
same resistance vs. temperature relationship as
o
C
the YSI thermistor number 44005.
The following table shows the relationship
between temperature and resistance, volts,
CR10 output, and linearization error.
o
TABLE 2.2-1. Temperature vs. Thermistor Resistance, V,
C, and Linearization Error
SENSOR
TEMP RESISTANCE, VOLTS CR10 ERROR
o
C OHMS OUT OUTPUT,oC
o
C
-5 12700 0.668449 -5.09136 -0.09136
-4 12050 0.692520 -4.02248 -0.02248
-3 11440 0.716743 -2.98315 0.016846
-2 10860 0.741399 -1.95557 0.044427
-1 10310 0.766400 -0.93843 0.061560
2-1

AVW1/AVW4
SENSOR
TEMP RESISTANCE, VOLTS CR10 ERROR
o
C OHMS OUT OUTPUT,oC
o
C
0 9796 0.791339 0.057084 0.057084
1 9310 0.816459 1.045822 0.045822
2 8851 0.841694 2.029469 0.029469
3 8417 0.867031 3.011520 0.011520
4 8006 0.892474 3.995450 -0.00454
5 7618 0.917902 4.979594 -0.02040
6 7252 0.943253 5.963992 -0.03600
7 6905 0.968616 6.954119 -0.04588
8 6576 0.993956 7.950259 -0.04974
9 6265 1.019160 8.949209 -0.05079
10 5971 1.044190 9.950388 -0.04961
11 5692 1.069107 10.95688 -0.04311
12 5427 1.093900 11.96879 -0.03120
13 5177 1.118368 12.97814 -0.02185
14 4939 1.142700 13.99297 -0.00702
15 4714 1.166697 15.00510 0.005100
16 4500 1.190476 16.01954 0.019545
17 4297 1.213945 17.03265 0.032652
18 4105 1.237011 18.04042 0.040421
19 3922 1.259826 19.04982 0.049822
20 3748 1.282314 20.05785 0.057855
21 3583 1.304393 21.06127 0.061275
22 3426 1.326119 22.06310 0.063105
23 3277 1.347418 23.06048 0.060484
24 3135 1.368363 24.05747 0.057474
25 3000 1.388888 25.05167 0.051679
26 287 1.408926 26.04042 0.040428
27 2750 1.428571 27.02901 0.029014
28 2633 1.447932 28.02396 0.023968
29 2523 1.466619 29.00577 0.005777
30 2417 1.485089 29.99901 -0.00098
31 2317 1.502945 30.98300 -0.01699
32 2221 1.520496 31.97513 -0.02486
33 2130 1.537515 32.96311 -0.03688
34 2042 1.554339 33.96711 -0.03288
35 1959 1.570549 34.96239 -0.03760
36 1880 1.586294 35.95767 -0.04232
37 1805 1.601537 36.95011 -0.04988
38 1733 1.616448 37.95060 -0.04939
39 1664 1.631002 38.95742 -0.04257
40 1598 1.645169 39.96844 -0.03155
41 1535 1.658925 40.98115 -0.01884
42 1475 1.672240 41.99263 -0.00736
43 1418 1.685090 42.99951 -0.00048
44 1363 1.697677 44.01695 0.016954
45 1310 1.709986 45.04335 0.043350
46 1260 1.721763 46.05610 0.056109
47 1212 1.733222 47.07191 0.071918
48 1167 1.744104 48.06568 0.065681
2-2
AVW1/AVW4
SENSOR
TEMP RESISTANCE, VOLTS CR10 ERROR
o
C OHMS OUT OUTPUT,oC
o
C
49 1123 1.754878 49.07873 0.078734
50 1081 1.765287 50.08636 0.086361
51 1040 1.775568 51.11067 0.110677
52 1002 1.785204 52.09809 0.098095
53 965 1.794687 53.09674 0.096746
54 929.6 1.803855 54.08849 0.088499
55 895.8 1.812697 55.07032 0.070322
56 863.3 1.821281 56.04819 0.048193
57 832.2 1.829571 57.01651 0.016519
58 802.3 1.837613 57.97896 -0.02103
59 773.7 1.845372 58.92977 -0.07022
60 746.3 1.852867 59.86962 -0.13037
FIGURE 2.2-1. Temperature Measurement Error at Three Temperatures as a Function of Lead
Length. Wire is 22 AWG with 16 ohms per 1000 feet.
2-3
AVW1/AVW4
FIGURE 2.2-2. Temperature Measurement Error on a 1000 foot Lead. Wire is 22 AWG with 16
ohms per 1000 feet.
FIGURE 2.2-3. Temperature Measurement Error on a 3000 foot Lead. Wire is 22 AWG with 16
ohms per 1000 feet.
2-4
AVW1/AVW4
FIGURE 2.2-4. Temperature Measurement Error on a 5000 foot Lead. Wire is 22 AWG with 16
ohms per 1000 feet.
FIGURE 2.2-5. Thermistor Linearization Error
2-5

AVW1/AVW4
2.3 PROGRAMMING AND SENSOR HOOK-UP
Measure the thermistor with Instruction 4 using
a measurement range of 2500 mV fast, an
excitation voltage of 2500 mV, a delay of 1, and
a multiplier of 0.001. The resulting value is
linearized with Instruction 55 using the following
coefficients: C0 = -104.78, C1 = 378.11, C2 = -
611.59, C3 = 544.27, C4 = -240.91, C5 =
43.089. The output is in degrees Celsius and
o
covers the range from -5
C to +60oC. Due to
the small current requirement, up to 118
thermistors could theoretically be powered by
one excitation channel.
When measuring the Geokon temperature
through CSI's AVW1 or AVW4, see Sections 4
or 5 respectively for hook up information.
NOTE: This manual covers AVW1's with
serial number 1093 and up plus serial
numbers 1002, 1034, 1040A, 1041, 1042,
1051, 1052, 1055, 1057, 1058, 1059, 1069,
1071, 1073, 1076, 1080, 1084, 1086, 1087,
1088, 1088A, 1089A, 1090A, 1091A, and
1092A. This manual also covers AVW4s
with serial number 1045 and up plus serial
numbers 1034 and 1038. These serial
numbers mark a change in circuitry that
changes the excitation voltage for the
temperature measurement from -2500 mV
(before) to +2500 mV (after). The multiplier
also changed from -.001 (before) to +.001
(after). The values of the resistors in
locations B4 and C4 for the AVW1 and
locations D4 and E4 for the AVW4 were
changed to the values shown in the current
schematics.
When measuring the Geokon temperature
directly with the CR10, connect the leads and
bridge completion resistors as shown in Figure
2.3-1.
FIGURE 2.3-1. Direct Measurement of the
Geokon Thermistor
2-6

SECTION 3. VIBRATI NG WIRE MEASUREMENT
FIGURE 3.1-1. A Vibrating Wire Sensor
3.1 GENERAL
Figure 3.1-1 illustrates how an increase in
pressure on the diaphragm decreases the
tension on the wire attached to the diaphragm.
A decrease in the wire tension decreases the
resonant frequency in the same way that
loosening a string on a guitar decreases it's
frequency. Therefore, the resonant frequency
of the vibrating wire sensor decreases with
increasing pressure.
The Vibrating Wire Measurement Instruction
excites the "plucking" and "pickup" coils shown
in the above figure with a "swept" frequency. A
"swept" frequency is a group of different
frequencies that are sent one right after another
starting with the lowest frequency and ending
with the highest. The lowest and highest
frequencies are entered by the user in units of
hundreds of Hz. The CR10 requires 150 ms to
"sweep" through all of the frequencies. This
"swept" frequency causes the wire to vibrate at
each of the individual frequencies. Ideally, all of
the frequencies except the one matching the
resonant frequency of the wire will die out in a
very short time. The wire will vibrate with the
resonant frequency for a relatively long period of
time and as it does so it will cut the lines of flux
in the "plucking" and "pickup" coils inducing the
same frequency on the lines to the CR10. After
waiting for the non resonant frequencies to die
out (20 ms) the CR10 accurately measures how
much time it takes to receive a user specified
number of cycles. Knowing the length of time
and the number of cycles, the CR10 then
computes the square of the frequency
2
expressed in units of kHz
(= 1/T2 where T is the
period in milliseconds).
3.2 MULTIPLIER & OFFSET
The 50 psi vibrating wire pressure sensor used
in this example is the Geokon Model 4500SV-
50. It is vented to the atmosphere so it will not
be affected by changes in barometric pressure.
Each sensor is individually calibrated and has a
unique set of calibration coefficients. A
calibration sheet contains the Model Number,
Serial Number, Gage Factor (psi/digit),
Temperature Coefficient (psi/
(digits), zero Period (microseconds), calibration
o
Temperature (
C) and calibration Barometric
Pressure (inches Hg). A Geokon "digit" is
defined as the square of the frequency in kHz
multiplied by 1000 (1 digit = 0.001 kHz
2)
. The calibration coefficients for the sensor
Hz
with serial number 3998 are given below:
o
C), Zero Reading
2
= 1000
3-1

AVW1/AVW4
TABLE 3.2-1. Calibration Data for Sensor 3998
Gage Factor Temp. Coeff. Zero Rdg. Period Temp. Baro.
(psi/digit) (psi/oC)
(digit) (usecond) (oC) (in Hg)
0.0151 -0.0698 9431 325.6 24 29.51
The equation to change the CR10's output into
pressure (psi) exerted on the sensor is given
below:
3.3 SWEPT FREQUENCY, START AND END
The AVW1 and AVW4 were not designed for
P = [M * X] + B 3.2-1
where P is the pressure in psi and X is the
2
result of measurement Instruction 28 in kHz
2
where T is the period in milliseconds). The
1/T
( =
multiplier (M) and offset (B) are determined by
equations 3.2-2 and 3.2-3.
use below 1000 Hz.
In general, the starting frequency of the swept
frequency for this sensor should be just a bit
lower than the frequency at the Full Scale
pressure of the sensor. A rough rule of thumb
would put the starting frequency at two thirds
that of the ending frequency. Almost always the
M = -1000(digits/kHz
2
) * Gage Factor 3.2-2
starting frequency should not be lower than half
of the ending frequency.
where M is the multiplier in psi/(kHz
Gage Factor is found on the Calibration Sheet
in psi/digit.
B = Po + [Gage Factor * Zero Reading] 3.2-3
where B is the offset in psi and Po is the
pressure in psi at the time of calibration. For
2
) and the
Start Freq. < ([Full Scale Pressure - (Gage
Factor * Zero
Reading)]/M)0.5 * 1000 Hz/kHz 3.3-1
Start Freq. < ([50psi - (0.0151psi/digit *
9431digits)]/
vibrating wire sensors not vented to the
atmosphere, Po is the barometric pressure
[-15.1psi/kHz
2])0.5
* 1000 Hz/kHz
["Baro."(in Hg) * 0.49116 (psi/in Hg)] at the time
of calibration. For the vented sensors, Po is 0
Start Freq. < 2474 Hz or 24 hundred Hz
psi. The Gage Factor (psi/digit) and Zero
Reading (digits) are found on the Calibration
Sheet.
In general, the ending frequency of the swept
frequency for this sensor should be just a bit
higher than the frequency at Zero Pressure.
Example: Using sensor number 3998, the
multiplier, offset, and equation for pressure
would be:
End Freq. > ([Zero Pressure - (Gage Factor *
Zero Reading)]/M)
0.5
2
M = (-1000 digits/kHz
M = -15.1 psi/(kHz
) * 0.0151 psi/digit
2
)
B = 0.0 psi + (0.0151 psi/digit * 9431 digits)
B = 142.4 psi
P = [-15.1 psi/(kHz
2
) * X (kHz2)] + 142.4 psi
3-2
* 1000 Hz/kHz 3.3-2
End Freq. > ([0.0psi - (0.0151psi/digit *
9431digits)]/
[-15.1psi/kHz
2])0.5
* 1000 Hz/kHz
End Freq. > 3071 Hz or 31 hundred Hz

AVW1/AVW4
Some additional information concerning the
swept frequency may be found in Appendix C.
NOTE: Please remember that sealed (or
absolute) sensors calibrated near sea level
will read negative at higher elevations due
to the decrease in barometric pressure with
increasing elevation. In most cases the
solution is to load the sensor with extra
external pressure to cause it to operate in
its calibrated range. For example, a sealed
0 to 5 psi sensor used at 10,000 feet
elevation would have to be placed under
10.6 feet of water (4.6 psi) in order to read 0
psi. This is because the barometric
pressure at 10,000 feet is about 4.6 psi
lower than at sea level.
3.4 RESOLUTION VS. "# OF CYCLES"
CSI and Geokon recommend that the number
of cycles measured be between 200 and 500.
Five hundred cycles would probably be the
optimum for most applications. The
measurement of more than 500 cycles is not
recommended without testing. Some sensors,
for example, will not vibrate a full 1000 cycles at
all pressures in their pressure range.
For the sake of this discussion we will define the
resolution of the vibrating wire measurement as
plus or minus three standard deviations (±3 SD)
of the vibrating wire measurement. The
standard deviation of the measurement in psi is
given by the following equation:
3
SD = (2*M*C)/(N*T
where M is the multiplier computed in 3.2-2. "C"
is 0.00015 ms which is the typical standard
deviation of a time interval measurement on the
CR10 using a 4 mV peak to peak signal with no
external noise. "N" is the number of cycles
timed to determine the period (T) in ms of the
signal being measured.
The standard deviation is greater when the
period is shorter. The period is shortest at zero
pressure so the "Period" at zero pressure given
in Table 3.2-1 is used for the example below:
)3.4-1
2
SD = (2*-15.1psi/(kHz
(500 * (325.6us/1000us/ms)
) * 0.00015ms)
3
SD = 0.00026246 psi
RESOLUTION = ±
0.00078738
psi
Resolution improves as the number of cycles
measured increases but it worsens as the
signal level decreases and as the noise
increases. The optimum resolution is obtained
when the number of cycles measured covers
one time constant (τ) of the decay of the signal.
Number of cycles = (τ/T)
where T is the period of the signal in
milliseconds and τ is the time in milliseconds
required for the signal to decay from its initial
peak to peak value to (0.368 * initial peak to
peak value). An oscilloscope is required to
measure the time constant. The time constants
of the Geokon sensors we have measured are
typically between one third second and one
second.
The amount of time required to make one
repetition of the vibrating wire measurement is
given below:
150. ms to sweep the frequency
20. ms delay
(1.5cycles + #cycles measured) * period of the
signal in ms
3.5 TEMPERATURE CORRECTION
The equation used to remove errors caused by
changes in the sensor's temperature is found
below:
Pt = P + (TEMP. COEFF.)*(T - To) 3.5-1
where Pt(psi) is the temperature corrected
pressure. P(psi) is the uncorrected pressure
from equation 1. T(
temperature of the sensor. To(
"Temp." on the Calibration Sheet which is the
temperature of the sensor at the time of
calibration. TEMP. COEFF.(psi/
found on the Calibration Sheet. It is important
to note that the "TEMP. COEFF." can be either
positive or negative.
o
C) is the current
o
C) is the
o
C) is also
3-3

AVW1/AVW4
Example: Using sensor number 3998 and
assuming a sensor temperature of 15
corrected pressure would be:
o
Pt = P psi + (-0.0698 psi/
= P psi + 0.6282 psi
C)*(15oC - 24oC)
3.6 DELAY BETWEEN MEASUREMENTS
The vibrating wire sensor should not be excited
more often than once every five time constants
if high resolution is important. If more than one
repetition is specified the "delay before
excitation applied" parameter can be used to
ensure the proper amount of delay between
excitations. Excitation of the sensor while the
wire is still vibrating can cause the signals to
add or subtract (in phase or out of phase)
causing the wire to vibrate excessively hard or
almost not at all.
o
C, the
If two back to back measurements are required
they can be done one of two ways. With the
AVW4 the repetitions parameter must be set to
2--. The "--" instructs the CR10 to excite both
sensors, delay 20 ms, measure the first sensor,
and then measure the second sensor. There is
no delay or re-application of the excitation
between the measurements. Back to back
measurements require that the sum of the
number of cycles measured on each sensor not
exceed the time constant of the last sensor or
the signal may have become too week to be
measured. (e.g., two sensors measured
separately, each having a time constant equal
to 700 cycles would have to be measured back
to back with a maximum of 350 cycles.) Back
to back measurements with two AVW1s and
two excitation channels can be done simply by
entering Instruction 28 twice, once for the first
sensor and once for the second. In this case
the second AVW1 measurement will begin 170
milliseconds after the first one ended.
3-4

SECTION 4. THE AVW1
4.1 GENERAL
The AVW1 contains circuitry needed to
interface Geokon's 4500 series vibrating wire
sensor to the CR10. The AVW1 is designed to
interface one vibrating wire sensor (temperature
and pressure) to two single ended CR10
channels. The AVW1 has no quiescent current
drain. The current drain during the very short
(2.4 ms) temperature measurement is .4 mA or
lower. The current drain during the vibrating
wire measurement (170 ms to 500 ms) is 32
mA. The AVW1 is 2.5 inches long by 2.5
inches wide by 1.4 inches high. The silk
screening for the AVW1 is shown below.
4.2 SENSOR HOOK UP
FIGURE 4.1-1. The AVW1
FIGURE 4.2-1. Hook up to AVW1
4.3 WELL MONITORING EXAMPLE
In this example the vibrating wire sensor is used
to monitor the Distance from the lip of the well
to the water surface in a 150 foot well. The
water level is expected to stay within 40 to 80
feet of the lip so the 50 psi pressure sensor is
placed approximately 100 feet below the lip of
the well. The same sensor used in Section 3.2
for the computation of the multiplier etc. (serial
number 3998) will be used again in this
example.
In the example program that follows the depth
of water above the vibrating wire sensor is
measured in psi and then converted into feet of
4-1

AVW1/AVW4
water. The water depth above the sensor is
referred to as the "Reading" in the following
equation. The Reading decreases with
increasing "Distance" from lip of well to water
surface so the Distance is computed by
subtracting the Reading from the Offset as
shown in the above figure and the following
equation.
Distance = Offset - Reading
feet (of head above the sensor). Solving the
above equation for the Offset, one obtains:
Offset = Initial Distance + Initial Reading
= 47.23 feet + 54.832 feet
= 102.062 feet
The following is a sample program that
measures the temperature and frequency of the
vibrating wire sensor and stores the
o
temperature (
C), pressure (psi), temperature
corrected pressure (psi), correction factor (psi),
temperature corrected pressure (feet of H2O),
and Distance from the lip to the water surface
(feet) in Input Locations 1-6 respectively. This
example assumes the sensor has been
connected as shown in Figure 4.2-1.
Program: AVW & CR10 USED TO MEASURE
1 GEOKON VIBRATING WIRE SENSOR.
* 1 Table 1 Programs
01: 10 Sec. Execution Interval
01: P4 Excite,Delay,Volt(SE)
01: 1 Rep
02: 15 2500 mV fast Range
03: 1 IN Chan
04: 1 Excite all reps w/EXchan 1
05: 1 Delay (units .01sec)
06: 2500 mV Excitation
07: 1 Loc [:TEMP C]
08: .001 Mult
09: 0.0000 Offset
02: P55 Polynomial
01: 1 Rep
02: 1 X Loc TEMP C
03: 1 F(X) Loc [:TEMP C]
04: -104.78 C0
05: 378.11 C1
06: -611.59 C2
07: 544.27 C3
08: -240.91 C4
09: 43.089 C5
FIGURE 4.3-1. Well Monitoring Example
The "Initial Distance" to the water surface is
measured with a chalked line to be 47.23 feet
below the lip. The "Initial Reading" is 54.832
4-2

AVW1/AVW4
03: P28 Vibrating Wire (SE)
01: 1 Rep
02: 2 IN Chan
03: 1 Excite all reps w/EXchan 1
04: 24 Starting Freq. (units=100 Hz)
05: 31 End Freq. (units=100 Hz)
06: 500 No. of Cycles
07: 0000 Rep delay (units=.01sec)
08: 2 Loc [:PRESS psi]
09: -15.1 Mult
10: 142.4 Offset
04: P34 Z=X+F
01: 1 X Loc TEMP C
02: -24 F calibration "Temp." in C
03: 4 Z Loc [:(T-To)*C]
05: P37 Z=X*F
01: 4 X Loc (T-To)*C
02: -.0698 F "Temp. Coeff."
03: 4 Z Loc [:(T-To)*C]
06: P33 Z=X+Y
01: 2 X Loc PRESS psi
02: 4 Y Loc (T-To)*C]
03: 3 Z Loc [:Pt psi]
07: P37 Z=X*F Converts psi to
negative ft H20
01: 3 X Loc Pt psi
02: -2.3067 F
03: 5 Z Loc [:-Pt FEET H20]
08: P34 Z=X+F Adds the Offset to the
negative of the Reading to
obtain the Distance from lip of
the well to water surface.
01: 5 X Loc -Pt FEET H20
02: 102.06 F OFFSET
03: 6 Z Loc [:DISTANCE FEET]
09: P End Table 1
First 99 Input Location Labels:
1:TEMP C
2:PRESS psi
3:Pt psi
4:(T-To)*C
5:Pt Ft H20
6:DISTAN FT
4-3

AVW1/AVW4
This is a blank page.
4-4

SECTION 5. THE AVW4
5.1 GENERAL
The AVW4 contains circuitry needed to
interface Geokon's 4500 series vibrating wire
sensor to the CR10. The AVW4 is designed to
interface four vibrating wire sensors
(temperature and pressure) to eight single
ended CR10 channels. The AVW4 has no
quiescent current drain. The current drain
during the very short (2.4 ms) temperature
measurement is .4 mA per channel or lower.
The current drain during each vibrating wire
measurement (170 ms to 500 ms) is 32 mA.
The AVW4 is 6.7 inches long by 2.9 inches wide
by 1.4 inches high.
FIGURE 5.1-1. The AVW4
5-1

AVW1/AVW4
5.2 SENSOR HOOK UP
FIGURE 5.2-1. Hook up for AVW4
5.3 DATALOGGER PROGRAMMING
The following is a sample program that
measures four sealed Geokon sensors and
stores the temperature, pressure, pressure
corrected for temperature, and barometric
corrected pressure in psi in Input Locations 1..4,
5..8, 9..12, and 10..12 respectively. The
example utilizes the calibration data given
previously from sensor number 3998. The first
sensor measures barometric pressure only and
is used to remove atmospheric pressure
changes from the readings on the other three
sensors. This example assumes the sensors
have been connected as shown in the sensor
hookup diagram.
5-2
Program: AVW4 & CR10 USED TO MEASURE
4 GEOKON SENSORS. THE FIRST SENSOR
SERVES AS A BAROMETER AND IS
SUBTRACTED FROM THE OTHER THREE
TO MEASURE THREE WATER PRESSURES
IN PSI EVERY FIVE MINUTES.
* 1 Table 1 Programs
01: 300 Sec. Execution Interval
01: P4 Excite,Delay,Volt(SE)
01: 4 Reps
02: 15 2500 mV fast Range
03: 1 IN Chan
04: 1 Excite all reps w/EXchan 1
05: 1 Delay (units .01sec)
06: 2500 mV Excitation
07: 1 Loc [:TEMP C #1]
08: .001 Mult
09: 0.0000 Offset

AVW1/AVW4
02: P55 Polynomial
01: 4 Reps
02: 1 X Loc TEMP C #1
03: 1 F(X) Loc [:TEMP C #1]
04: -104.78 C0
05: 378.11 C1
06: -611.59 C2
07: 544.27 C3
08: -240.91 C4
09: 43.089 C5
03: P28 Vibrating Wire (SE)
01: 4 Reps
02: 5 IN Chan
03: 1 Excite all reps w/EXchan 1
04: 24 Starting Freq. (units=100 Hz)
05: 31 End Freq. (units=100 Hz)
06: 500 No. of Cycles
07: 500 Rep delay (units=.01sec) 5
SEC DELAY BETWEEN
MEASUREMENTS
08: 5 Loc [:P psi #1]
09: 1 Mult
10: 0 Offset
04: P53 Scaling Array (A*loc +B)
APPLY MULT & OFFSET
01: 5 Start Loc [:P psi #1]
02: -15.1 A1
03: 142.4 B1
04: -15.1 A2
05: 142.4 B2
06: -15.1 A3
07: 142.4 B3
08: -15.1 A4
09: 142.4 B4
07: P34 Z=X+F ASSUMES
CALIBRATION TEMP. = 24
01: 1-- X Loc TEMP C #1
02: -24 F
03: 17-- Z Loc [:T-To*C #1]
08: P36 Z=X*Y
01: 13-- X Loc Cpsi/C #1
02: 17-- Y Loc T-To*C #1
03: 17-- Z Loc [:T-To*C #1]
09: P33 Z=X+Y
01: 5-- X Loc psi #1
02: 17-- Y Loc T-To*C #1
03: 9-- Z Loc [:Pt psi #1]
10: P95 End
FOLLOWING THREE INSTRUCTIONS
SUBTRACT THE BAROMETRIC PRESSURE
FROM THE THREE WATER PRESSURES
11: P35 Z=X-Y
01: 10 X Loc Ptb psi #2
02: 9 Y Loc Pt psi #1
03: 10 Z Loc [:Ptb psi #2]
12: P35 Z=X-Y
01: 11 X Loc Ptb psi #3
02: 9 Y Loc Pt psi #1
03: 11 Z Loc [:Ptb psi #3]
13: P35 Z=X-Y
01: 12 X Loc Ptb psi #4
02: 9 Y Loc Pt psi #1
03: 12 Z Loc [:Ptb psi #4]
o
C
05: P53 Scaling Array (A*loc +B)
LOADS TEMP. COEFF.
01: 13 Start Loc [:Cpsi/C #1]
02: 0 A1
03: -.0698 B1
04: 0 A2
05: -.0698 B2
06: 0 A3
07: -.0698 B3
08: 0 A4
09: -.0698 B4
06: P87 Beginning of Loop
TEMPERATURE
CORRECTION
01: 00 Delay
02: 4 Loop Count
First 99 Input Location Labels:
1:TEMP C #1 11:Ptbpsi #3
2:TEMP C #2 12:Ptbpsi #4
3:TEMP C #3 13:Cpsi/C #1
4:TEMP C #4 14:Cpsi/C #2
5:P psi #1 15:Cpsi/C #3
6:P psi #2 16:Cpsi/C #4
7:P psi #3 17:T-To*C #1
8:P psi #4 18:T-To*C #2
9:Pt psi #1 19:T-To*C #3
10:Ptbpsi #2 20:T-To*C #42
5-3

AVW1/AVW4
This is a blank page.
5-4

APPENDIX A. PRESSURE CONVERSION CHART
A-1

This is a blank page.

APPENDIX B. SCHEMATICS AND STUFFING CHARTS FOR
AVW1 AND AVW4
B-1

APPENDIX B. SCHEMATICS AND STUFFING CHARTS FOR AVW1 AND AVW4
B-2

APPENDIX B. SCHEMATICS AND STUFFING CHARTS FOR AVW1 AND AVW4
B-3

APPENDIX B. SCHEMATICS AND STUFFING CHARTS FOR AVW1 AND AVW4
B-4

APPENDIX B. SCHEMATICS AND STUFFING CHARTS FOR AVW1 AND AVW4
B-5

APPENDIX B. SCHEMATICS AND STUFFING CHARTS FOR AVW1 AND AVW4
This is a blank page.
B-6

APPENDIX C. THEORY AND ADDITIONAL DETAILS
C.1 SWEPT FREQUENCY THEORY
Example: f2 = 31 hundred Hz
f1 = 24 hundred Hz
X = (30*f1*f2)/(f2-f1)
= 3189
where f1 and a f2 are the starting and ending
frequencies in hundreds of Hz respectively.
One clock cycle (CC) occurs every 813.8 ns or
at a rate of 1.2288 mHz.
Rule #1: 65535 > X > 256
the 256 constraint is somehow due to an 8 bit
constraint. The 65535 constraint is some limit
where the swept frequency can no longer be
done in exactly 15 ms.
The minimum increment in frequency is 1 clock
cycle.
How many times do we have to change the half
period by 1 clock cycle to cover the frequency
range?
1/(F1 * 2) = 1/(2400 * 2) =
.208333 ms = half period
1/(F2 * 2) = 1/(3100 * 2) =
.161290 ms = half period
Change in half period =
.208333 - .161290 = .047043 ms
# of clock cycle increments to cover the
.047043 ms half period range is:
= (.047043 ms/.0008138 ms) =
57.81 freq. increments
How much time is there between frequency
increments to cover the frequency range in 15
ms?
time = 15 ms/58 frequency increments =
.2586 ms/freq. incr.
C.2 ADDITIONAL THEORY ON
MULTIPLIER AND OFFSET
The result (X) of Instruction #28 is:
X = 1/((t ms)2) =
1,000,000/((t s)2
where t is the period in milliseconds. Since
frequency (f) is the inverse of period, this can
also be expressed as:
X = (f kHz)2 =
[(f Hz)2]/1,000,000
C-1

This is a blank page.

This is a bla nk page.

Campbell Scientific Companies
Campbell Scientific, Inc. (CSI)
815 West 1800 North
Logan, Utah 84321
UNITED STATES
www.campbellsci.com
info@campbellsci.com
Campbell Scientific Africa Pty. Ltd. (CSAf)
PO Box 2450
Somerset West 7129
SOUTH AFRICA
www.csafrica.co.za
sales@csafrica.co.za
Campbell Scientific Australia Pty. Ltd. (CSA)
PO Box 444
Thuringo wa Cent ra l
QLD 4812 AUSTRALIA
www.campbellsci.com.au
info@campbellsci.com.au
Campbell Scientific do Brazil Ltda . (CSB)
Rua Luisa Crapsi Orsi, 15 Butantã
CEP: 005543-000 São Paulo SP BRAZIL
www.campbellsci.com.br
suporte@campbellsci.com.br
Campbell Scientific Canada Corp. (CSC)
11564 - 149th Street NW
Edmonton, Alberta T5M 1W7
CANADA
www.campbellsci.ca
dataloggers@campbellsci.ca
Campbell Scientific Ltd. (CSL)
Campbell Park
80 Hathern Road
Shepshed, Loughborough LE12 9GX
UNITED KINGDOM
www.campbellsci.co.uk
sales@campbellsci.co.uk
Campbell Scientific Ltd. (France)
Miniparc du Verger - Bat. H
1, rue de Terre Neuve - Les Ulis
91967 COURTABOEUF CEDEX
FRANCE
www.campbellsci.fr
campbell.scientific@wanadoo.fr
Campbell Scientific Spain, S. L.
Psg. Font 14, local 8
08013 Barcelona
SPAIN
www.campbellsci.es
info@campbellsci.es
Please visit www.campbellsci.com to obtain contact information for your local US or International representative.
 Loading...