

Page 1
Tips:
• Return to the Main Menu by pushing the left soft key several times.
• Carry spare batteries (5-AA) in the carrying case.
• A continuous measurement can display engineering units when linked to a Site/Sensor
with an engineering unit conversion applied.
• Leave 1–2 mm of exposed sensor wire on datalogger/multiplexer wiring for VWA
connection . Always disconnect automated system power prior to VWA connection.
Denitions:
Sensor: An individual vibrating wire sensor. A VWA can store up to 880
unique sensors (40 sites, 22 sensors/site).
Site: A project or geographic location containing up to 22 sensors.
User: Operator name and information.
Wiring Guide
VWA Cable Common Sensor Sensor
-RED -ONG Cable Colors
1
Description
Red
2
Orange2 Red or Orange VW Gage
Black2 Orange2 Black White w/Orange VW Gage
Green2 Blue2 G reen or Blue Therm/RTD
White2 Blue2 White White w/Blue Therm/RTD
Blue Yellow Bare/Clear Drain Wire
1
If sensor wiring does not match the table, refer to the sensor manufacturer manual to determine the VW gage
wire leads. Some sensors may not have a thermistor or RTD (temperature measurement).
2
Vibrating wire leads are interchangeable (black and red instead of red and black); thermistor leads are similarly
interchangeable.
Read & Record
There are three options to save data when using Read & Record.
• Single is used when sensors won’t be repeatedly measured in the future (installation
record, baseline reading, troubleshooting).
• Site/Sensor is used when sensors will be repeatedly measured and data needs to be
linked to a site. Site/Sensor data is viewable in the eld for historical comparison.
• Continuous measures a single sensor at a user dened interval ranging from 1 second
to 15 minutes. Used to document installations, live eld testing (push-in-piezometer,
well pump test, sensor response, etc.), and for troubleshooting.
Notes:
• Measurements are not pressure or temperature compensated.
• Users can view all data. Sites are not user specic.
• See Measurement Screens for an explanation of displayed measurement results.
• Sites, Sensors, and Users can be created and edited either on the VWA, or with a PC and
keyboard using VwProjects.
Meet the Vibrating Wire Analyzer
Meet the Vibrating Wire Analyzer (VWA), the best vibrating wire (vw) eld reader
available. Field ready to quickly measure a sensor, save data, and communicate
results with custom PDF reports and spreadsheet output. Measurements are
geo-located with the integrated GPS allowing the VWA to verify locations and
walk you to your sensors. The large color display and VSPECTTM technology1 create
condence that you are getting the best measurement possible both in the eld
and in the oce. , when your measurements matter.
1
Protected under U. S. Patent No. 7,779,690
Data Retrieval
Files are transferred to a PC from the VWA using the USB port . Measurement data collected
with the Read & Record option is saved as a PDF and/or CSV le. A printable report (PDF) communicates results quickly and professionally. Raw data les (CSV) can collect multiple sensors
(site) in a single le for additional spreadsheet analysis and reporting.
1 Expor t CSV les (optional)
• Navigate to the Main Menu. See Operation.
• Select Data. Choose and export CSV les.
2 Connec t VWA to a PC with USB
• Connect a PC to the VWA with a USB Mini-B cable.
• Power is supplied through the USB-PC connection.
3 Copy les to PC
• Find the USB ash memory device (VWA) on the PC.
• Data les are stored in either the PDF Reports or CSV Data folder.
• Copy les to the PC.
PDF • Ready to print PDF reports
Reports • Field documentation
CSV • Multiple measurements in one le
Data • Spreadsheet analysis
4 Ejec t VWA from PC
• Eject the VWA from the PC prior to disconnecting the USB cable.
VwProjects
VwProjects is a free software package for easier setup of Sites, Sensors, and Users with a PC.
VwProjects can be downloaded and installed from the VWA memory or from the internet, see
Downloads.
VwProjects is used to create and edit a project le that contains information about Sites, Sen-
sors, and Users. Project les can be used to back up or transfer information to other VWA devices.
See Using VwProjects for details about creating, editing, and transferring project les.
Notes:
• A project le contains information about Sites, Sensors, and Users. Measurement
data is saved in the PDF and CSV les, and is NOT saved or transferred in a project
le.
• You can preview a report title block when creating or editing a user in
VwProjects.
File Types
The following les are created or used with the VWA. Files are transferred with a USB connection
(see Data Retrieval).
PDF: Measurement Reports created using Read & Record.
CSV: Created by the VWA with Read & Record, use for further spreadsheet analysis; see
Data Retrieval.
VWA: A project le contains information about Users, Sites, and Sensors. Created in the
VWA or with VwProjects.
OBJ: Operating system le, created by Campbell Scientic. See Downloads.
MANUAL
Info
Link
9/2017
manual pn: 31913
Caution
• Avoid contact with water, see Precautions
• Transport/store in carrying case
• Measurements are not pressure or temperature corrected
!
Downloads
Visit www.campbellsci.com/vwanalyzer to download:
• VwProjects software
• Updated operating systems (updated Sensor Library)
• Manual (this document)
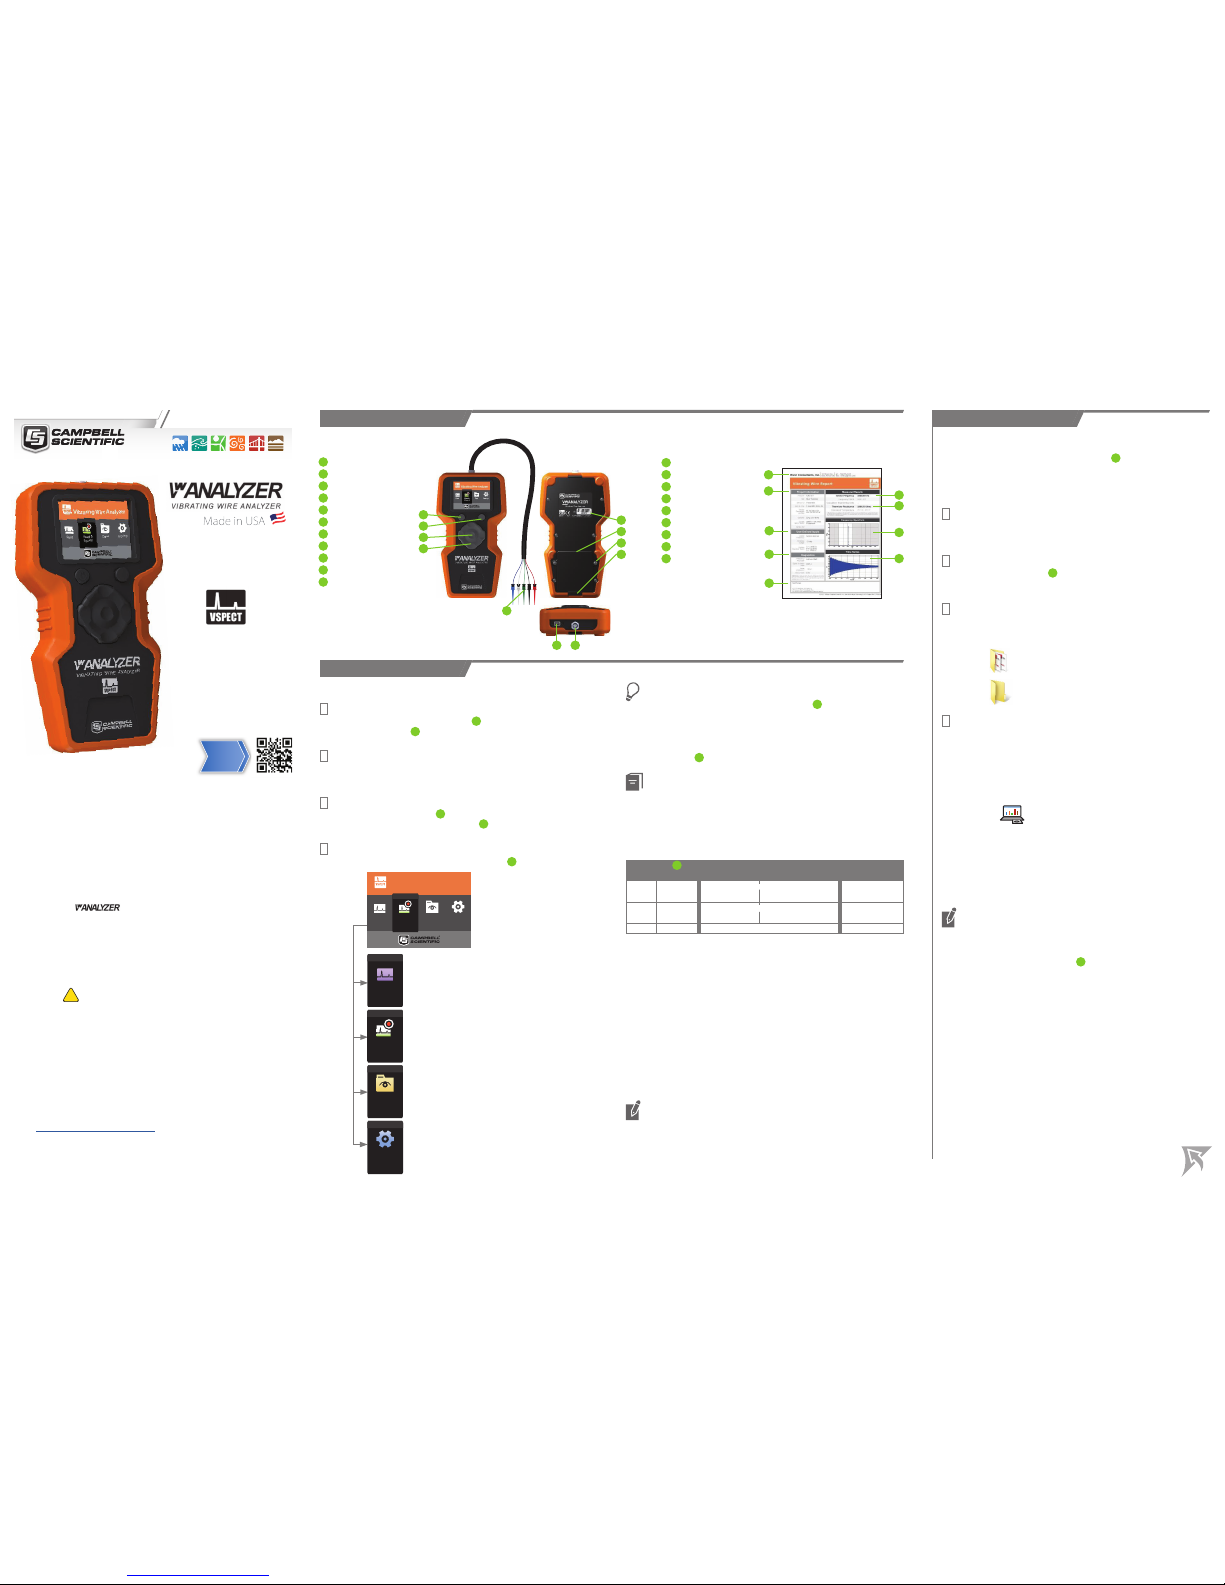
FIELD
QUICK TOUR
Vibrating Wire Analyzer
1 Power1, left soft key
2
2 Right soft key
2
3 Enter/select
3
4 Menu navigation arrows (4)
5 Serial number (SN)
6 Battery door
7 Battery door screws (2)
8 Elastic strap connection (2)
9 Measurement cable
10 USB por t (PC connection)
11 Measurement cable connection
1 Hold (2–3 s) to turn o
2
Soft keys select the displayed screen
option (when present)
3 Selects the highlighted option
1
2
3
4
5
6
7
8
9
10
11
OFFICE
PDF Reports
12 User specic title
1
13 Project Information
1
14 User-Dened Inputs
15 VSPECT D iagnostics
2
16 Field Notes
17 Sensor Frequency
18 Resistance (Thermistor/RTD)
19 Frequency Spectrum graph
2
20 9 Time Series graph
2
1 Entered manually or with a PC,
see VwProjects for details.
2
The VSPECT Measurement section
explains how to use and understand
VSPECT data.
12
13
14
15
16
17
18
19
20
Operation
1 Turn on the VWA
• Install/replace batteries as needed (5-AA)
• Push power button
2 Selec t/Create User
• Links user information to specic measurements
• User information is documented on PDF reports
3 Connec t Sensor (if measuring)
• Connect measurement cable . Keyed connector, do not force
• Match sensor and measurement cable colors . See Wiring Guide
4 Navigate the Main Menu
• Return to the Main Menu by pushing the left soft key several times.
1
11
9
Read:
Measure a sensor quickly,
Data is NOT saved
Read & Record:
Measure a sensor,
Data is saved
see Read & Record
Data:
Export data to CSV le, or view saved data
see Data Retrieval
Settings:
Change system, measurement, or power settings
1
9
10
10
12
• Quality
• PDF Reports
• Field Ready
9
Link
Read &
Record
Read
Data
Settings
Vibrating Wire Analyzer
Data SettingsRead Read &
Record
1
6
Page 2
MANUAL
Equipment Inspection
Upon arrival, and before each use, inspect for the following items:
• VwAnalyzer • USB cable
• Carrying case • Phillips screwdriver
• Manual (this document) • 5-AA batteries
• Measurement cable • Hand strap
Precautions
• WARNING: Disconnect power from active automated systems prior to connecting and
measuring a sensor with a VWA on the automated system
• CAUTION: Avoid direct contact with water (IP-62)
• CAUTION: Store and transport in the protective case
• CAUTION: Measurements are not pressure or temperature compensated
• CAUTION: Do not force measurement cable connection ; cable ts one way
• CAUTION: Hold the device properly, do not hang/carry from measurement cable
Warranty & Service
• Warranted for one (1) year, www.campbellsci.com/terms
• For repair, see www.campbellsci.com/repair
• For assistance, call (435) 227-9100
Overview
The VWA uses patented VSPECTTM technology for the most reliable vw measurement available. The
VWA converts measurements to engineering units, generates a printable PDF report, and saves a
CSV summary le. The graphical display allows you to conrm sensor output and operation. VSPECT
technology eliminates disruptive noise interference and provides sensor diagnostics for the best
measurement possible. VSPECT noise immunity allows gages that are otherwise unreadable to be
evaluated with condence.
A project le maintains Site/Sensor information for 40 unique sites with 22 sensors per site. Site/
Sensor locations are geolocated, allowing the internal GPS to walk a user directly to the sensor. Site/
Sensor and user information can be created or edited on the device or with a computer using the free
VwProjects software.
Specications
Vibrating wire measurement
Resolution: 0.001 Hz RMS
Speed: 1 second (fastest)
Excitation: 2V, 5V, 12V (user selectable)
Accuracy: ±0.005% of reading
Method: VSPECT (Vibrating Wire Spectral Analysis), U.S. Patent No. 7,779,690
Temperature (resistance) measurement
Resolution: 0.01 Ω RMS
Accuracy: ±0.15% of reading
General information
1
Memory: 1,700 site/sensor measurements (most recent2)
40 unique sites, 22 sensors per site
240 single measurements (most recent2)
16,500 continuous measurements (most recent2)
80 MB USB memory (PDF, CSV, VWA, and other les3)
GPS: ± 5m (16.4 ft) typical; ±1 ms time sync (WGS 84 Datum)
Battery type/life: 5-AA (1.5 V)/20 hours continuous use
Weight: 0.34 kg (0.75 lb)
Dimensions: 200 x 100 x 58 mm (7.9 x 3.9 x 2.3 in)
Compliance: CE, RoHS
Operating Temp: (-20 to 70 °C)
Enclosure: IP62
EU Declaration of Conformity: www.campbellsci.com/vwanalyzer
1
Non-volatile memory stores data, reports, and project les
2
When memory is full, new data will overwrite the oldest data
3
Memory managed by users, les will need to be deleted/transferred when full
Operating System
A new operating system (OS) may be installed to update features or the sensor library. Back up all
data and the project le prior to working with the OS. A factory reset is done from System Settings.
OS update procedure:
1. Back up project les/data
2. Download the .obj le; see Downloads
3. Save le to the VWA root directory
4. Cycle power
5. Verify OS version in System Settings
Temperature Measurement
Most vw sensors have a resistance (thermistor/RTD) measurement to calculate sensor temperature.
When a sensor is selected with the sensor library, the equation and conversion coecients are
automatically selected for the manufacturer specic vw sensor. Users can view or create custom
temperature calculations in Measurement Settings. When using Read, Options can be selected
to quickly choose a temperature conversion.
Measurement Screens
When a sensor is measured, four screens display the results, the right soft key is used to
advance to the next screen.
1st Screen – Measurement
Summary screen setup by the user
• User selectable summary boxes (frequency, digits,
B-units, temp, ohms)
• Spectrum graph (optional)
• Change settings in Measurement Settings
2nd Screen – Details
Metadata including diagnostics
Tip: On-screen side arrows allow historic data
comparison
3rd Screen – Frequency Spectrum
Frequency spectrum graph
• Sensor signal is dened as the largest signal within
the frequency sweep range
• Visually compare the sensor signal to noise signals
4th Screen – Time Series
Time series graph
• Visually see the raw input signal
Sensor Library
The sensor library contains preprogrammed sensors from common vw sensor manufacturers. The library can be
accessed on the VWA or with VwProjects when a new sensor is created or edited using Site/Sensor. Use of
the sensor library enables:
• Manufacturer-recommended sweep frequencies
• Field conversion from frequency to engineering units
• Sensor specic calibration inputs
Notes:
• Engineering units reported are NOT corrected for temperature or barometric pressure
• Temperature is calculated with manufacturer specic conversions, see Temperature Measurement
• A Continuous measurement can graph the sensor response in engineering units when linked to a sensor with
calibration values applied
• Calibration inputs are unit specic to match manufacturer calibration sheets. When the selected output units
are dierent than manufacturer calibration units, an automatic unit conversion will be applied
Measurement Reports
Printable PDF measurement reports are saved when using Read & Record. There are two
types of measurement reports:
Single Measurement Report
Created when a measurement is performed from Site/Sensor or Single read. Use as eld
documentation, baseline reading, or as installation record.
Continuous Measurement Report
Optionally created with Continuous read. Use for monitoring changing eld conditions, or
during installation (push-in piezometer, well pump test, sensor response, etc.).
Using VwProjects
Project Files
A project le contains site, sensor, and user information. Project les can be shared between VWAs.
A project le can be used to:
• Back up Site, Sensor, and User information
• Transfer project le data to another VWA device
• Create or edit a project le on a PC with VwProjects
• Import/export project le in System Settings (see steps below)
• Maintain up to 20 users per VWA
• Maintain up to 880 unique sensors (40 sites, 22 sensors/site per VWA)
Note: A project le contains information about Sites, Sensors, and Users. Measurement data is
saved in the PDF and CSV les, and is NOT saved or transferred in a project le.
VwProjects
VwProjects uses a keyboard and PC to easily create and edit project les. The software can create a
new project le or open an existing project le created from a VWA or a PC. The screenshot
below illustrates the various buttons and capabilities of the software:
30 Create a new project le 35 Create and edit Sensors
31 Open an existing project le 36 Site/Sensor Information
32 Save the current project le 37 Sensor Details
33 Create and edit Users
34 Create and edit Sites
Note: When saving a project le on the VWA or PC , there are 2 save le options:
• Append File: New or changed information will be added or updated on the
VWA.
• O verwrite/ Backup le: When loaded to a VWA, all the old information will be
erased and overwritten with the new project le information.
Loading project le to a VWA
1. Connect to a PC with USB cable (see Data Retrieval)
2. Copy the project le from PC to the USB memory of the VWA
3. Eject the USB connection from the PC, disconnect USB cable
4. Select Import in the project le option in System Settings
5. Select your project le, select Import
Exporting project le from a VWA
1. Select Export in the project le option in System Settings
2. Select the le type
3. Retrieve the project le with PC
4. Save or edit the project le as needed
GPS and Time Zone
The integrated, non-survey grade GPS is used to update the internal clock and provide approximate
location data for reports.
Select System Settings to adjust the GPS time to your location or turn o the GPS. The time can be
manually set when the GPS is turned o. Daylight Saving Time can be applied as needed.
!
11
VSPECT Measurement
VSPECTTM provides the best vibrating wire measurement available. Sensor frequency is easily identied while ltering out environmental and electrical noise that aects the quality of other vibrating wire readers.
VSPECTTM provides measurement diagnostics to understand sensor response, installation quality, and identify incorrect wiring or damaged sensors.
Output and Diagnostics
Sensor Frequency1 (Hz)
Frequency is the basic measurement from a vibrating wire sensor. The frequency can be
converted into engineering units (pressure, displacement, etc.) and is identied as the largest
measured amplitude signal within the frequency sweep.
Sensor Amplitude2 (mV RMS)
Signal strength from the vibrating wire sensor. Amplitude varies and is aected by the sensor
type, excitation strength (adjustable), and sensor cable length.
Signal-to-Noise Ratio
2
(unitless)
The signal-to-noise ratio is calculated as sensor signal amplitude divided by the largest noise
amplitude within the sweep frequency. A low signal-to-noise ratio indicates a weak sensor
signal or a noisy environment.
Noise Frequency
2
(Hz)
The largest amplitude noise signal within the frequency sweep.
Decay Ratio
2
(Hz)
Signal attenuation; how quickly the signal strength decreases.
Thermistor/RTD Resistance
1
(ohms)
Used to calculate sensor temperature and correct for thermal eects3.
1
Frequency and resistance are measured values
2
Diagnostic values used to describe the quality of the frequency measurement
3
The VWA measures the vw sensor temperature (when present); post processing is required for thermal and
barometric corrections. An automated data acquisition system (ex. CR6) with an integrated barometer can
apply temperature and pressure corrections.
Warning Thresholds
Measurement warning thresholds can be set in Measurement Settings. Thresholds provide a
warning for questionable measurements (incorrect wiring or damaged sensors). When a threshold is
triggered, the alarm can be selected to display a brief list of eld troubleshooting tips.
Amplitude
The default is 0.10 (mV RMS), intended to identify weak signals
for additional review.
Signal-to-Noise Ratio
The default is 5.0 (unitless), intended to identify extreme noise
environments for additional review.
Data records normally when a threshold is triggered. It is the responsibility of the user to exercise
engineering judgment with thresholds, graphs, and additional diagnostics to determine if the
measurement is acceptable.
Note: A frequency sweep excites frequencies within the expected frequency response
range of the sensor. See the sensor manual for an expected frequency operating range.
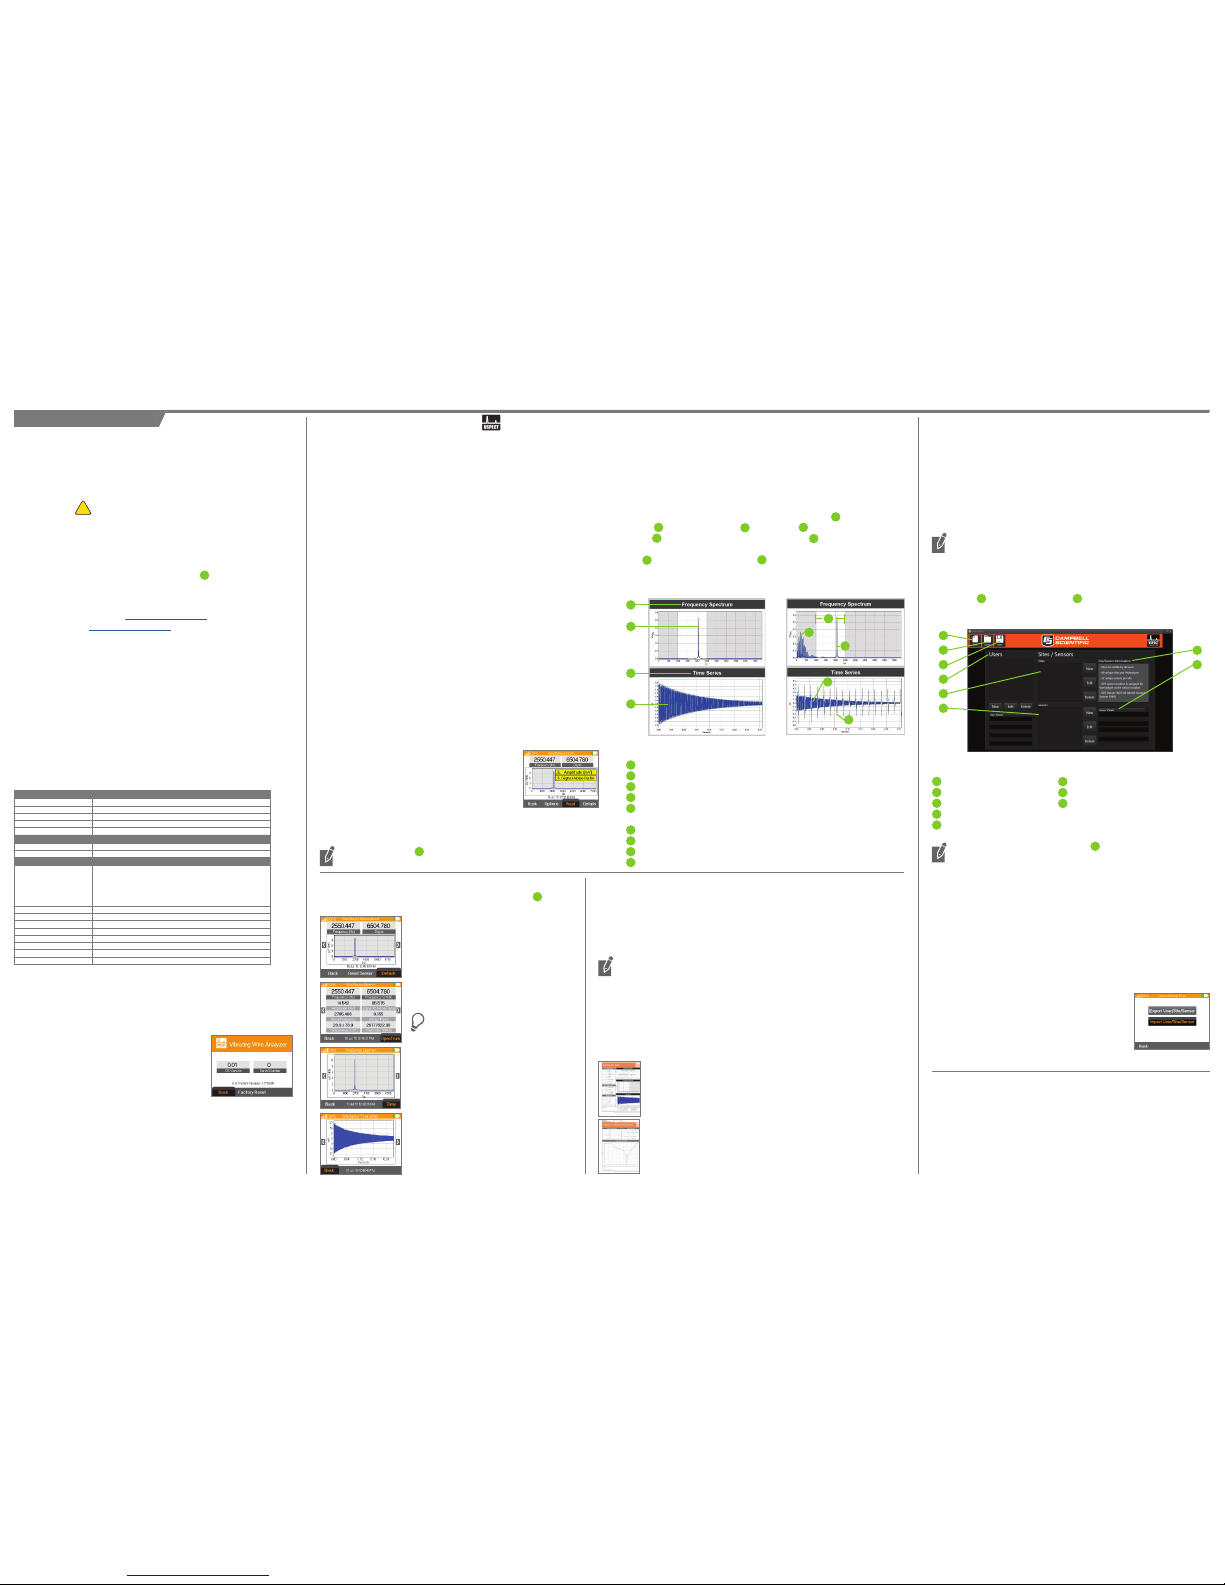
Measurement Graphs
The following two sets of graphs illustrate the use of VSPECT
TM
to identify a sensor signal in a quiet
and noisy environment. Both graphs were created from VWA reports using the same sensor. Fig. 1
was measured in an electrically quiet environment, while Fig. 2 was measured in an electrically noisy
environment (AC power) similar to what can be seen in a eld environment (power lines, motors,
radio signals, etc.). The time series on Fig. 1 shows a relatively clean signal that is more clearly
identied on the frequency spectrum . The time series on Fig. 2 shows the inuence of
the noise . Vibrating wire readers that only use the time series to determine the frequency
may report an incorrect frequency as a result of noise. The frequency spectrum (VSPECT
TM
) lters the
noise and easily identies the sensor signal . VSPECTTM provides noise immunity by correctly
identifying the sensor signal and ignoring the inuence of electrical noise that plagues
time-domain-based vibrating wire readers.
21 The Frequency Spectrum graph shows signals with respect to frequency (VSPECT
TM
)
22 The sensor signal is determined as the largest signal within the frequency sweep
23 The Time Series graph shows raw signals observed with respect to time
24 A time series with minimal noise inuence
25 The frequency sweep is shown as the white area on the graph, only signals within the
frequency sweep will be considered as a possible sensor signal
26 Noise is identied and ignored
27 A sensor signal is easily identied even when noise is present in the measurement
28 A time series with observable noise
29 Noise in the time series (this is what confuses non-VSPECT
TM
devices)
25
21
22
23
24
25
26
27
28
29
24
22
21
28
29
28
26
27
30
33
34
32
31
35
36
37
30 31
32
WARNING: A factory reset deletes
all data.
2
Figure 1: VW Signal Figure 2: VW Signal With Noise
 Loading...