

Page 1

l
Open Path Eddy Covariance System
Operator’s Manua
CSAT3, LI-7500, and KH20
9/06
Copyright © 2004-2006
Campbell Scientific, Inc.
Page 2

Warranty and Assistance
The OPEN PATH EDDY COVARIANCE (OPEC) SYTEM is warranted
by CAMPBELL SCIENTIFIC, INC. to be free from defects in materials and
workmanship under normal use and service for twelve (12) months from date
of shipment unless specified otherwise. Batteries have no warranty.
CAMPBELL SCIENTIFIC, INC.'s obligation under this warranty is limited to
repairing or replacing (at CAMPBELL SCIENTIFIC, INC.'s option) defective
products. The customer shall assume all costs of removing, reinstalling, and
shipping defective products to CAMPBELL SCIENTIFIC, INC. CAMPBELL
SCIENTIFIC, INC. will return such products by surface carrier prepaid. This
warranty shall not apply to any CAMPBELL SCIENTIFIC, INC. products
which have been subjected to modification, misuse, neglect, accidents of
nature, or shipping damage. This warranty is in lieu of all other warranties,
expressed or implied, including warranties of merchantability or fitness for a
particular purpose. CAMPBELL SCIENTIFIC, INC. is not liable for special,
indirect, incidental, or consequential damages.
Products may not be returned without prior authorization. The following
contact information is for US and International customers residing in countries
served by Campbell Scientific, Inc. directly. Affiliate companies handle
repairs for customers within their territories. Please visit
www.campbellsci.com to determine which Campbell Scientific company
serves your country. To obtain a Returned Materials Authorization (RMA),
contact CAMPBELL SCIENTIFIC, INC., phone (435) 753-2342. After an
applications engineer determines the nature of the problem, an RMA number
will be issued. Please write this number clearly on the outside of the shipping
container. CAMPBELL SCIENTIFIC's shipping address is:
CAMPBELL SCIENTIFIC, INC.
RMA#_____
815 West 1800 North
Logan, Utah 84321-1784
CAMPBELL SCIENTIFIC, INC. does not accept collect calls.
Page 3

Open Path Eddy Covariance System
Table of Contents
PDF viewers note: These page numbers refer to the printed version of this document. Use
the Adobe Acrobat® bookmarks tab for links to specific sections.
1. System Description .....................................................1
1.1 OPEC (CSAT3 Only) ...............................................................................1
1.2 Basic OPEC ..............................................................................................1
1.3 Extended OPEC........................................................................................1
1.4 Additional Fast Response Sensors............................................................2
2. Installation and Mounting ...........................................2
2.1 Fetch and Sensor Height...........................................................................3
2.2 Mounting ..................................................................................................4
2.2.1 Measure CSAT3 Azimuth...............................................................9
2.3 Wiring.......................................................................................................9
2.4 Power........................................................................................................9
3. System Datalogger Program ....................................10
3.1 Generic Program Flowchart....................................................................12
3.2 Program Configuration ...........................................................................13
3.2.1 CSAT3 Azimuth ...........................................................................14
3.2.2 Sensor Configuration ....................................................................15
3.3 Loading a Program to the Datalogger.....................................................16
3.3.1 Direct Connection via LoggerNet.................................................16
3.3.2 Remote via PC/CF Card................................................................16
3.4 System Operation....................................................................................17
3.4.1 Monitoring Data............................................................................17
3.4.2 Status Table...................................................................................18
4. Data.............................................................................18
4.1 Data Retrieval .........................................................................................19
4.1.1 Direct Connection Data Retrieval via LoggerNet.........................20
4.1.2 File Management with Baler.........................................................23
4.1.3 Remote Data Retrieval via a PC/CF Card.....................................24
4.1.4 File Management with CardConvert.............................................25
4.1.4.1 Collecting Data with One Card ...........................................29
4.1.4.2 Collecting Data with Two Cards .........................................30
4.2 Data Processing ......................................................................................31
4.2.1 Online Processing .........................................................................32
4.2.2 Off-line Processing with EdiRe ....................................................32
4.2.2.1 Creating Raw File Format and Processing Lists..................33
4.2.2.2 Example EdiRe Raw File Format and Processing Lists ......35
5. Eddy Covariance Theory 101....................................39
i
Page 4

Open Path Eddy Covariance System Table of Contents
A. CSAT3 Orientation ..................................................A-1
A.1 Determining True North and Sensor Orientation................................ A-1
A.2 Online Magnetic Declination Calculator............................................. A-3
B. Sensible Heat Flux without a FW05 .......................B-1
B.1 Speed of Sound and Sonic Temperature ............................................. B-1
B.2 Sonic Temperature, Temperature, and Humidity ................................ B-2
B.3 Sensible Heat and Specific Humidity Flux ......................................... B-3
B.4 Sensible and Latent Heat Flux............................................................. B-4
Appendix C. References..............................................C-1
Figures
1. Eddy Covariance Sensors Mounted on a CM10 Tripod ............................ 3
2. Side View of the CSAT3 and LI-7500 (mounted underneath CSAT3) ..... 5
3. Side View of the CSAT3 and LI-7500 (mounted beside CSAT3)............. 5
4. CM110 Enclosure Mounting Hardware Attached to the LI-7500
Electronics Box .......................................................................................... 6
5. Close Up View p/n 17716, configured for ENC 10/12, Locking
Mechanism ................................................................................................. 6
6. CSAT3 Electronics Box and p/n 17813 Enclosure Hanger Kit on
CM110 Tripod Body .................................................................................. 7
7. CSAT3 and LI-7500 Electronics Boxes Mounted on the CM110
Tripod Body ............................................................................................... 7
8. ENC12/14 Enclosure Mounted on the CM110 Tripod Base ..................... 8
9. HMP45C 10-plate Radiation Shield Mounted on the Body of the
CM110 and on the CM204 Horizontal Crossarm....................................... 8
10. Terminal Strip Adapters for Power Connection to External Battery ..... 10
11. CSAT3 Right Hand Coordinate System, Horizontal Wind Vector
Angle is 0 Degrees.................................................................................... 14
12. Compass Coordinate System, Compass Wind Direction is 140
Degrees..................................................................................................... 15
13. LoggerNet Station Setup for the “flux” table......................................... 21
14. LoggerNet Station Setup for the “ts_data” Table .................................. 21
15. LoggerNet Station Data Collection Schedule ........................................ 22
16. LoggerNet Station Status Monitor ......................................................... 22
17. Baler Station Setup for the “flux” Table................................................ 23
18. Baler Station Setup for the “ts_data” Table ........................................... 24
19. File Format Flow.................................................................................... 26
20. Destination File Option Screen .............................................................. 27
21. Fully Configured CardConvert Start Up Screen .................................... 28
22. List of Files Created by CardConvert .................................................... 28
23. List of Files Created by CardConvert with Duplicates .......................... 29
24. List of Files Where the Duplicate Files are Renamed to *.bak.............. 30
25. List of Files Collected the First Time Using Two Cards ....................... 31
26. List of Files Collected the Second time Using Two Cards .................... 31
27. Interpreter Settings to Read a Campbell Scientific, Inc. TOB1
Data File ................................................................................................... 34
28. Folder that Contains the Raw TOB1 Time Series Data Files................. 34
29. Competed Interpreter Screen ................................................................. 35
30. Estimated Sample Frequency and Correct Sample Frequency .............. 35
ii
Page 5

Tables
Open Path Eddy Covariance System Table of Contents
31. Default EdiRe Processing List Created by the Interpreter......................36
32. Output File Location as Part of the Processing List ...............................37
33. Output File Location as Part of the Processing List ...............................37
34. Processing U
35. Computing CO
and CO2 with 1 Chn Statistics Instruction........................38
z
Flux with 2 Chn Statistics and Graphing Uz Statistic
2
with Plot Value Instruction .......................................................................38
36. Ideal Vertical Profiles of Virtual Potential Temperature and Specific
Humidity Depicting All the Layers o the Atmospheric Boundary Layer..39
A-1. Magnetic Declination for the Conterminous United States (2004) ... A-1
A-2. A Declination Angle East of True North (Positive) is Subtracted
from 360 (0) degrees to Find True North............................................... A-2
A-3. A Declination Angle West of True North (Negative) is Subtracted
from 0( 360) degrees to Find True North............................................... A-2
A-4. Online Magnetic Declination Calculator with Inputs and Output
for Longmont, CO.................................................................................. A-3
1. Nominal Sensor Power Requirements ........................................................9
2. Nominal Datalogger Power Requirements with the Display Off and
No RS-232 Communications ......................................................................9
3. Nominal Datalogger Power Requirements with the Display and
Backlight On, and No RS-232 Communications ........................................9
iii
Page 6

Open Path Eddy Covariance System Table of Contents
This is a blank page.
iv
Page 7

Open Path Eddy Covariance System
This document will serve as a guide to properly install and operate a Campbell Scientific,
Inc. Open Path Eddy Covariance System (OPEC). The OPEC is composed of various
products, e.g. dataloggers, fast response turbulence sensors, slow response meteorological
sensors, and software. These products are manufactured by Campbell Scientific, Inc. and
other vendors. Manuals for each of these sensors shipped with the system. It is time well
spent reviewing these documents.
The literature contains information that spans 50 years on eddy covariance (correlation)
theory and measurements. Section 5ever so briefly touches eddy covariance theory. For
more details on eddy covariance measurements and data analysis, see the literature.
1. System Description
The Campbell Scientific, Inc. eddy covariance systems measure sonic sensible
heat flux, momentum flux, and the flux of other scalars between the
atmosphere and earth’s surface. The system consists of a datalogger, fast
response three-dimensional sonic anemometer, and fast response scalar
sensors. An independent measure of temperature and humidity from a slow
response sensor is also measured to calculate background meteorological
variables. Horizontal wind speed and direction are computed by the datalogger
from the three-dimensional measurements of wind made by the sonic
anemometer.
1.1 OPEC (CSAT3 Only)
The minimum components required for eddy covariance measurements are a
datalogger, a CSAT3 three-dimensional sonic anemometer, and a HMP45C
temperature and humidity probe. This system configuration measures sonic
sensible heat flux, momentum flux, temperature, humidity, horizontal wind
speed, and wind direction. This system configuration is used to compute eddy
diffusivity required to compute fluxes of trace gases measured with a gradient
system like the TGA100A (Warland, et al., 2001).
1.2 Basic OPEC
A more typical eddy covariance system consists of a datalogger, a CSAT3
three-dimensional sonic anemometer, a LI-7500 open path infrared gas
analyzer (IRGA), and a HMP45C temperature and humidity probe. With this
configuration, the system can measure carbon dioxide flux, latent heat flux,
sonic sensible heat flux, momentum flux, a computed sensible heat flux (see
Appendix B), temperature, humidity, horizontal wind speed, and wind
direction.
1.3 Extended OPEC
Energy balance sensors can be added to a basic OPEC system to also measure
the net radiation, soil heat flux, soil temperature, and soil water content. The
sensors required for these additional measurements are a Q7.1, NR-LITE, or
CNR1 net radiometer, two to four HFT3 or SHF01-SC soil heat flux plates,
1
Page 8

Open Path Eddy Covariance System
one or two TCAV averaging soil temperature probes, and one or two CS616
soil moisture reflectometers.
1.4 Additional Fast Response Sensors
If the application requires a direct measurement of sensible heat flux, a FW05
can be added to the system. In the absence of a FW05 or if the FW05 breaks,
the sensible heat flux can be found from the sonic sensible heat flux and the
latent heat flux (see Equation 36 in Appendix B).
A KH20 Krypton hygrometer, instead of the LI-7500, can be used to measure
the latent heat flux. The KH20 can not be used to measure an absolute
concentration of water vapor, because of scaling on the source tube windows
caused by disassociation of atmospheric continuants by the ultra violet photons
(Campbell and Tanner, 1985 and Buck, 1976). The rate of scaling is a function
of the atmospheric humidity. In high humidity environments, scaling can
occur within a few hours. That scaling attenuates the signal and can cause
shifts in the calibration curve. However, the scaling over a typical flux
averaging period is small. Thus, water vapor fluctuation measurements can
still be made with the hygrometer. The effects of the scaling can be easily
reversed by wiping the windows with a moist swab.
To measure other trace gases, a TGA100A Trace Gas Analyzer can be added to
the system. The TGA100A can measure methane, carbon dioxide isotope,
water vapor isotope, ammonia, and nitrous oxide flux.
2. Installation and Mounting
When making eddy covariance measurements near the surface (less than 3
meters), mount the datalogger enclosure between the legs of the CM11x tripod,
on a separate tripod, or user-supplied drive stake. Also, mount any sensor
electronics boxes as far from the fast response sensors as possible and always
use the tripod guy kit. This will minimize potential flow distortions and tower
sway caused by wind blowing against the fiberglass enclosure. See the tripod
manuals for detailed installation instructions.
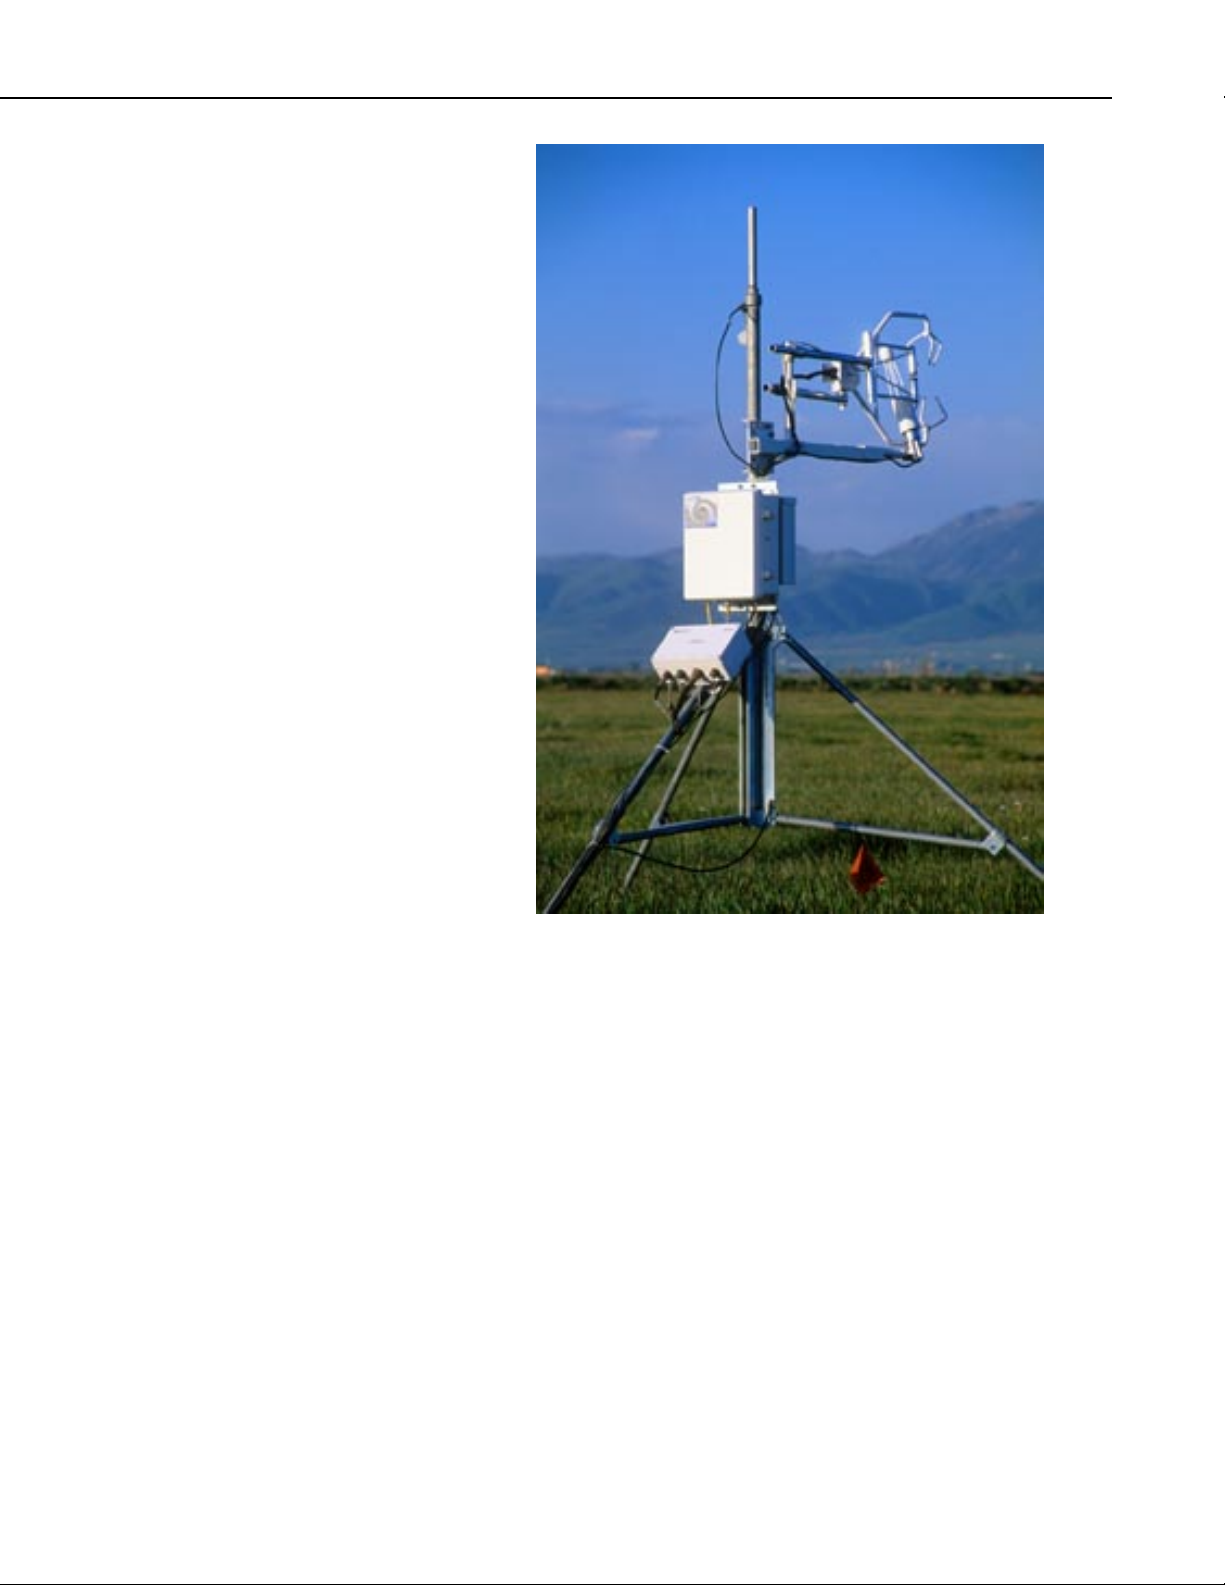
Figure 1 depicts a typical eddy covariance station. Point the eddy covariance
sensors into the prevailing wind to minimize the flow distortion from the
tower, mounting hardware, and other sensors.
TIP
Keep a log book for each station. Record the date and personnel
name for all site visits, as well as all maintenance and work that
is performed during the site visit.
2
Page 9
Open Path Eddy Covariance System
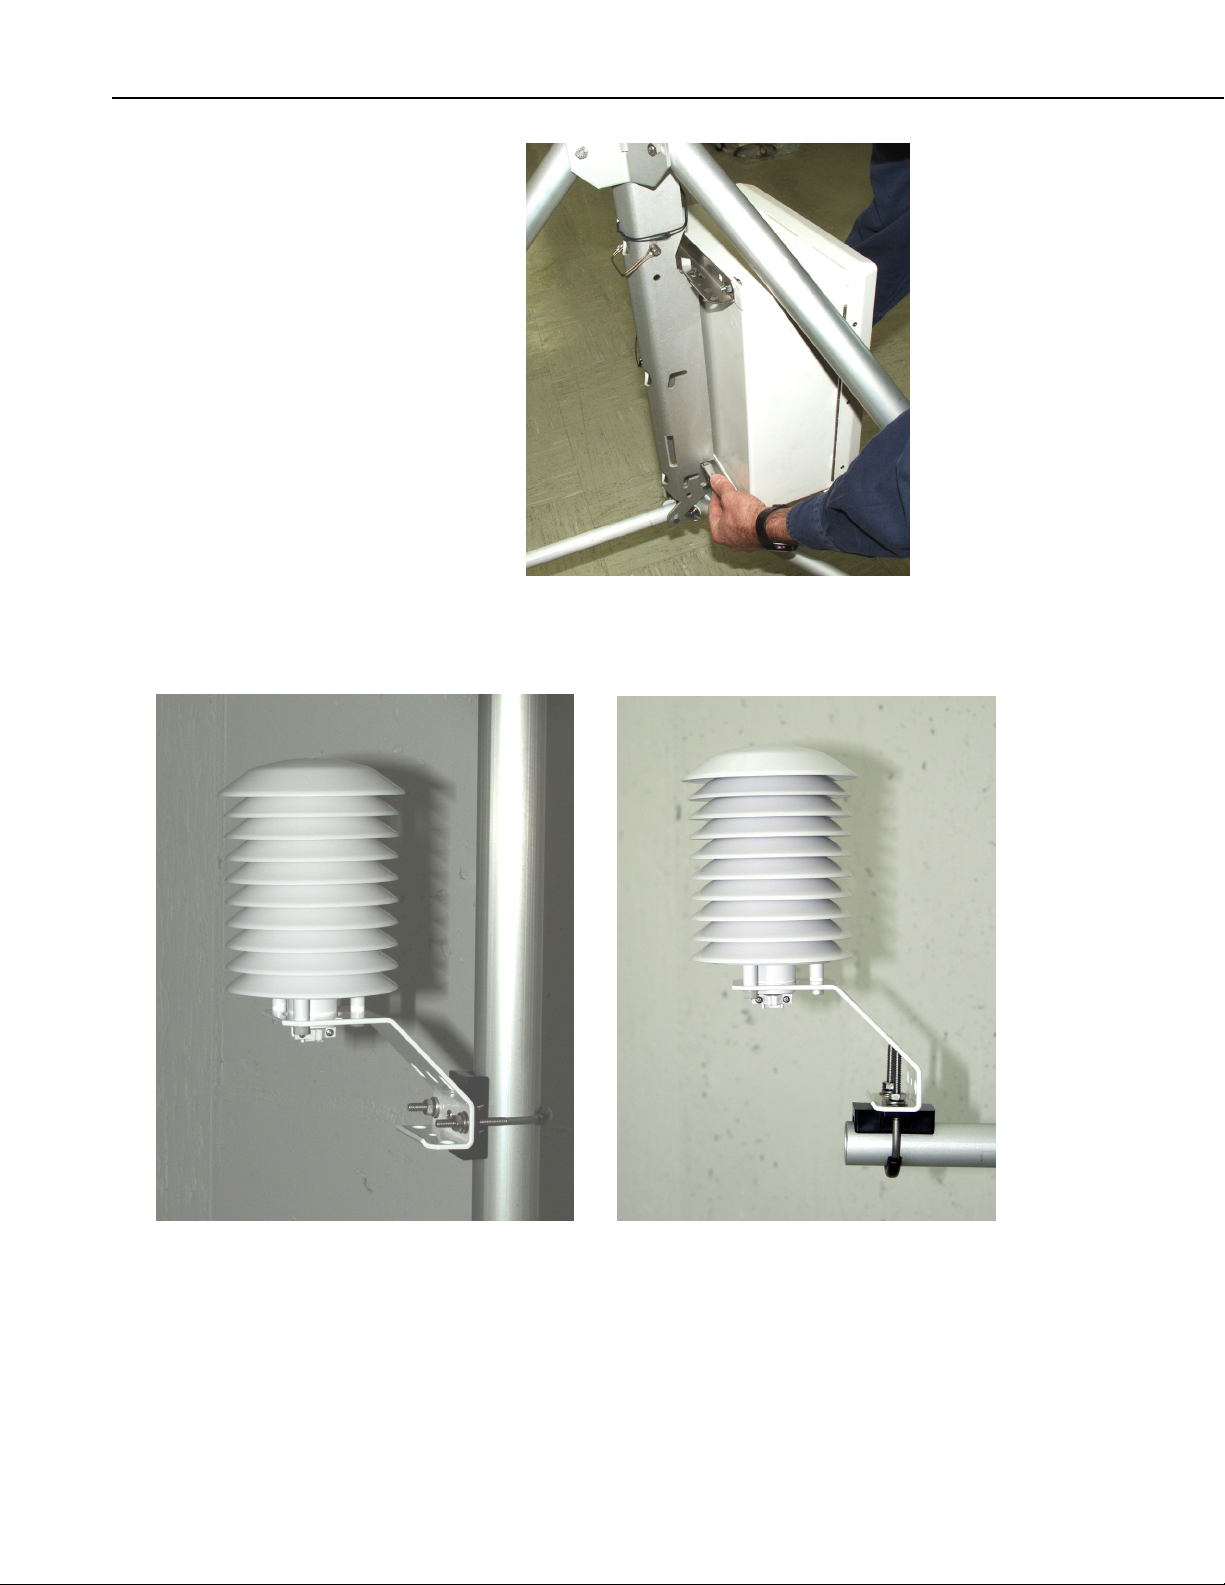
FIGURE 1. Eddy Covariance Sensors Mounted on a CM10 Tripod;
the Datalogger Enclosure is on a Separate Tripod (not pictured)
2.1 Fetch and Sensor Height
The eddy covariance sensors must be mounted at some height to ensure that the
measurements are made within the local surface layer. The local surface layer
grows at a rate of approximately 1 vertical meter per 100 horizontal meters.
Thus, a height to fetch (horizontal distance traveled) ratio of 1:100 may be used
as an absolute bare minimum rough rule of thumb for determining the
measurement height. The following references discuss fetch requirements in
detail: Brutsaert (1982); Dyer and Pruitt (1962); Gash (1986); Schuepp, et al.
(1990); and Shuttleworth (1992).
The fetch should be homogenous and flat, and no abrupt changes in vegetation
height should exist (Tanner, 1988). Consider two adjacent fields, the first
planted with 1 m tall corn and the second with 0.5 m soybean. Eddy
covariance sensors mounted at 2 m above the corn field should have a
minimum of 200 m of fetch in all the directions that the data is of interest,
3
Page 10

Open Path Eddy Covariance System
particularly between the eddy covariance sensors and the interface between the
corn and soybean field.
2.2 Mounting
The CSAT3, LI-7500, and HMP45C are mounted to a tripod or tower using a
horizontal mounting arm, several Nu-Rail crossover fittings, and short lengths
of pipe.
The CSAT3 is attached to the CM204 (OPEC standard), CM206, or CM208
horizontal mounting arm by a 0.75 inch by 0.75 inch crossover Nu-Rail (p/n
1017), a 1.0 inch by 0.75 inch crossover Nu-Rail (p/n 1049), and a 30.48 cm
(12 inch) length of 0.75 inch diameter pipe (p/n 18048) (Figures 2 and 3).
The LI-7500 can be mounted two ways, underneath the CSAT3 (Figure 2) or
slightly behind the CSAT3 measurement volume (Figure 3) with a separation
of about 15 to 20 cm. The IRGA should be set back from the anemometer to
minimize flow distortions. Tilt the IRGA sensor head about 60 degrees from
horizontal to minimize the amount of precipitation that accumulates on the
windows.
The LI-7500 is attached to the CM204 horizontal mounting arm by a 1.0 inch
by 0.75 inch crossover NU-Rail (p/n 1049), and the Head Mounting Kit
(LI-COR p/n 9975-010), or a 1.0 inch by 0.75 inch crossover NU-Rail
(p/n 1049), a 0.75 inch by 0.75 inch crossover Nu-Rail (p/n1017), a 25.4 cm
(10 inch) length of 0.75 inch diameter pipe (p/n 6332), and the Head Mounting
Kit (LI-COR p/n 9975-010) (Figure 2 and Figure 3).
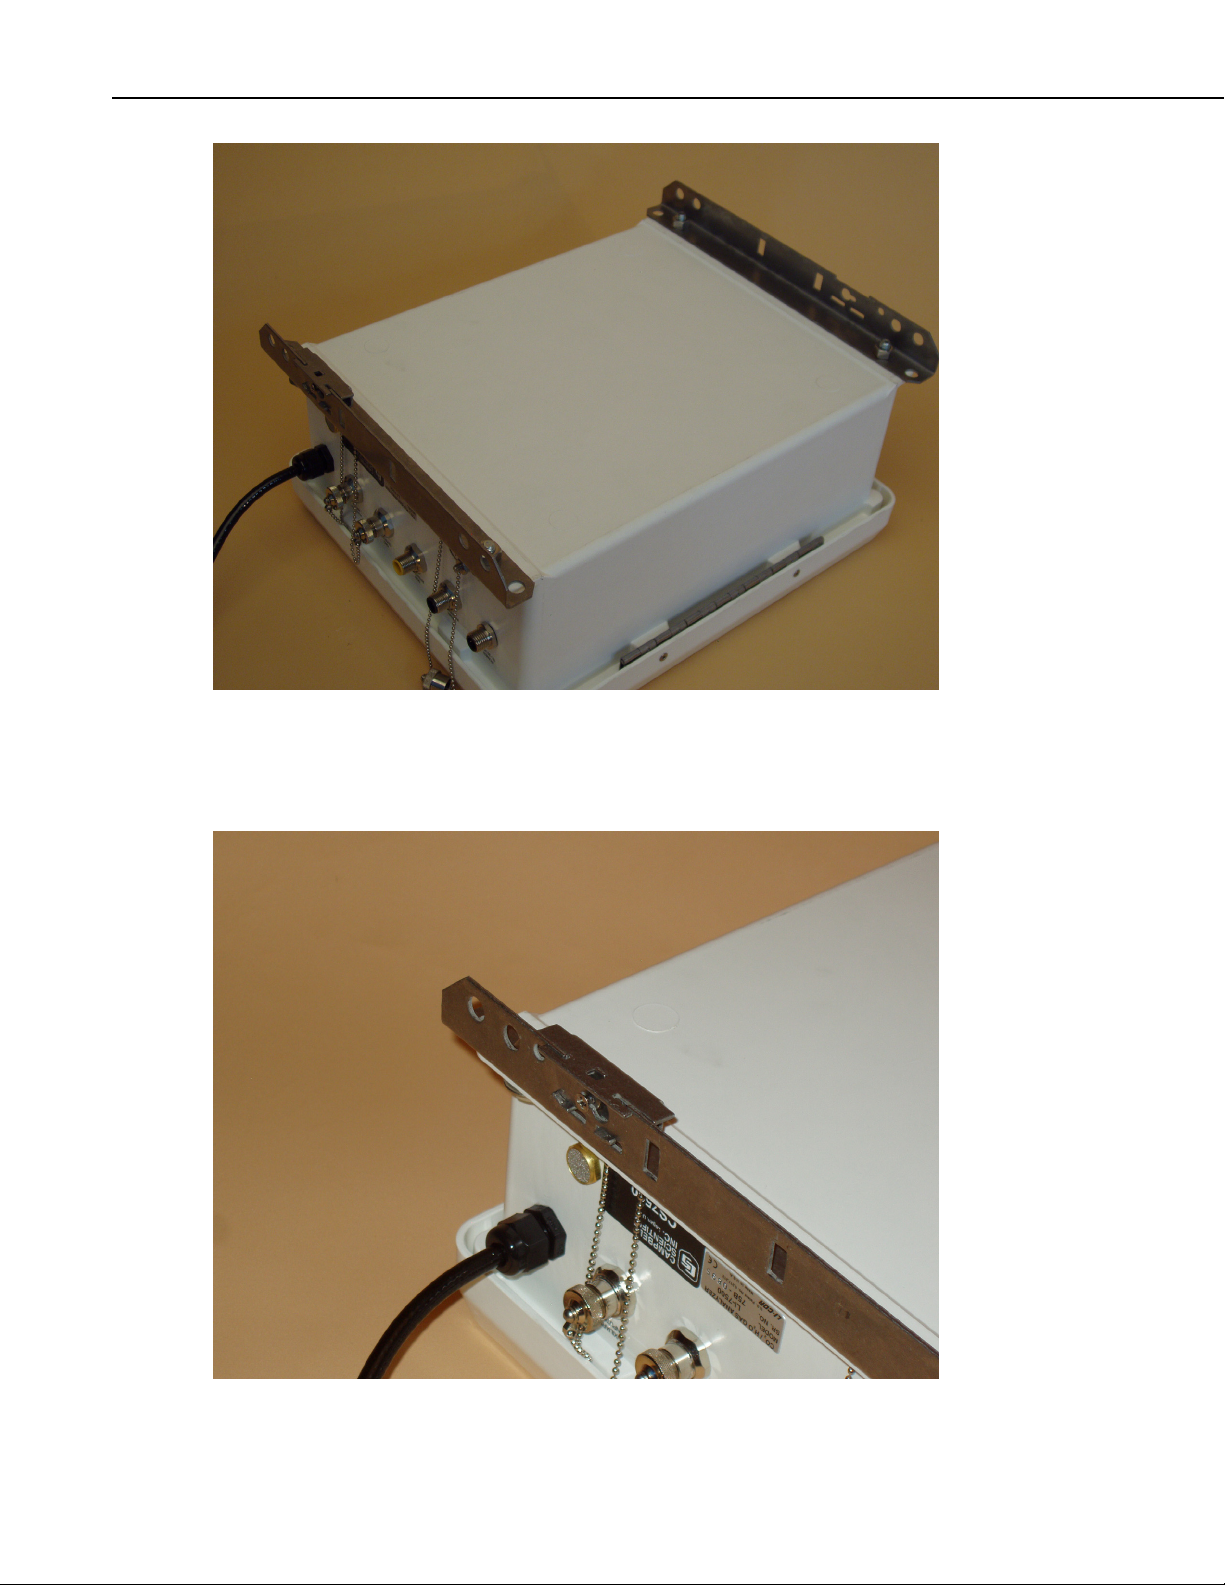
Attach the enclosure mounting hardware, p/n 17716, to the LI-7500 electronics
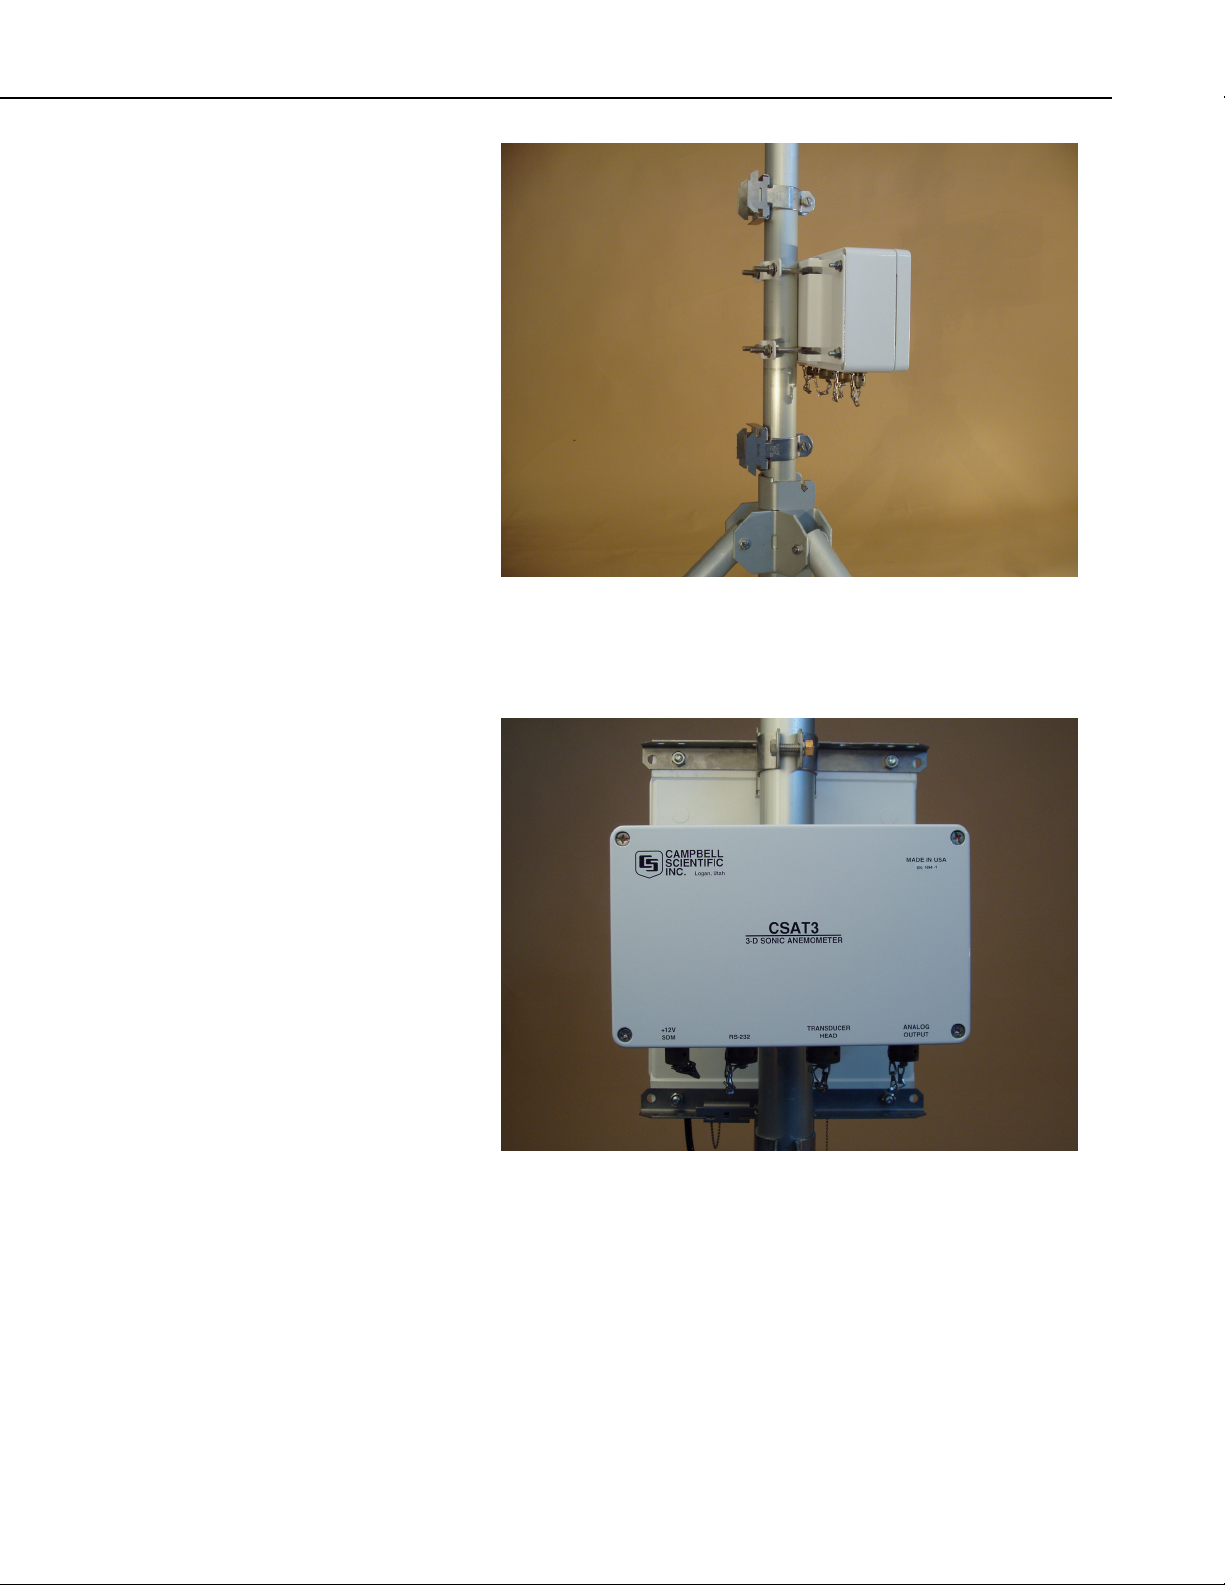
enclosure (Figures 4 and 5). Mount the enclosure hanger kit, p/n 17813, and
the CSAT3 electronics as shown in Figures 6 and 7. Finally, mount the
ENC12/14 enclosure on the tripod base as shown in Figure 8.
Mount the HMP45C radiation shield at the same height as the fast response
sensors. The HMP45C radiation shield is mounted to the either the tripod body
or the end of the horizontal cross arm (Figure 9).
4
Page 11
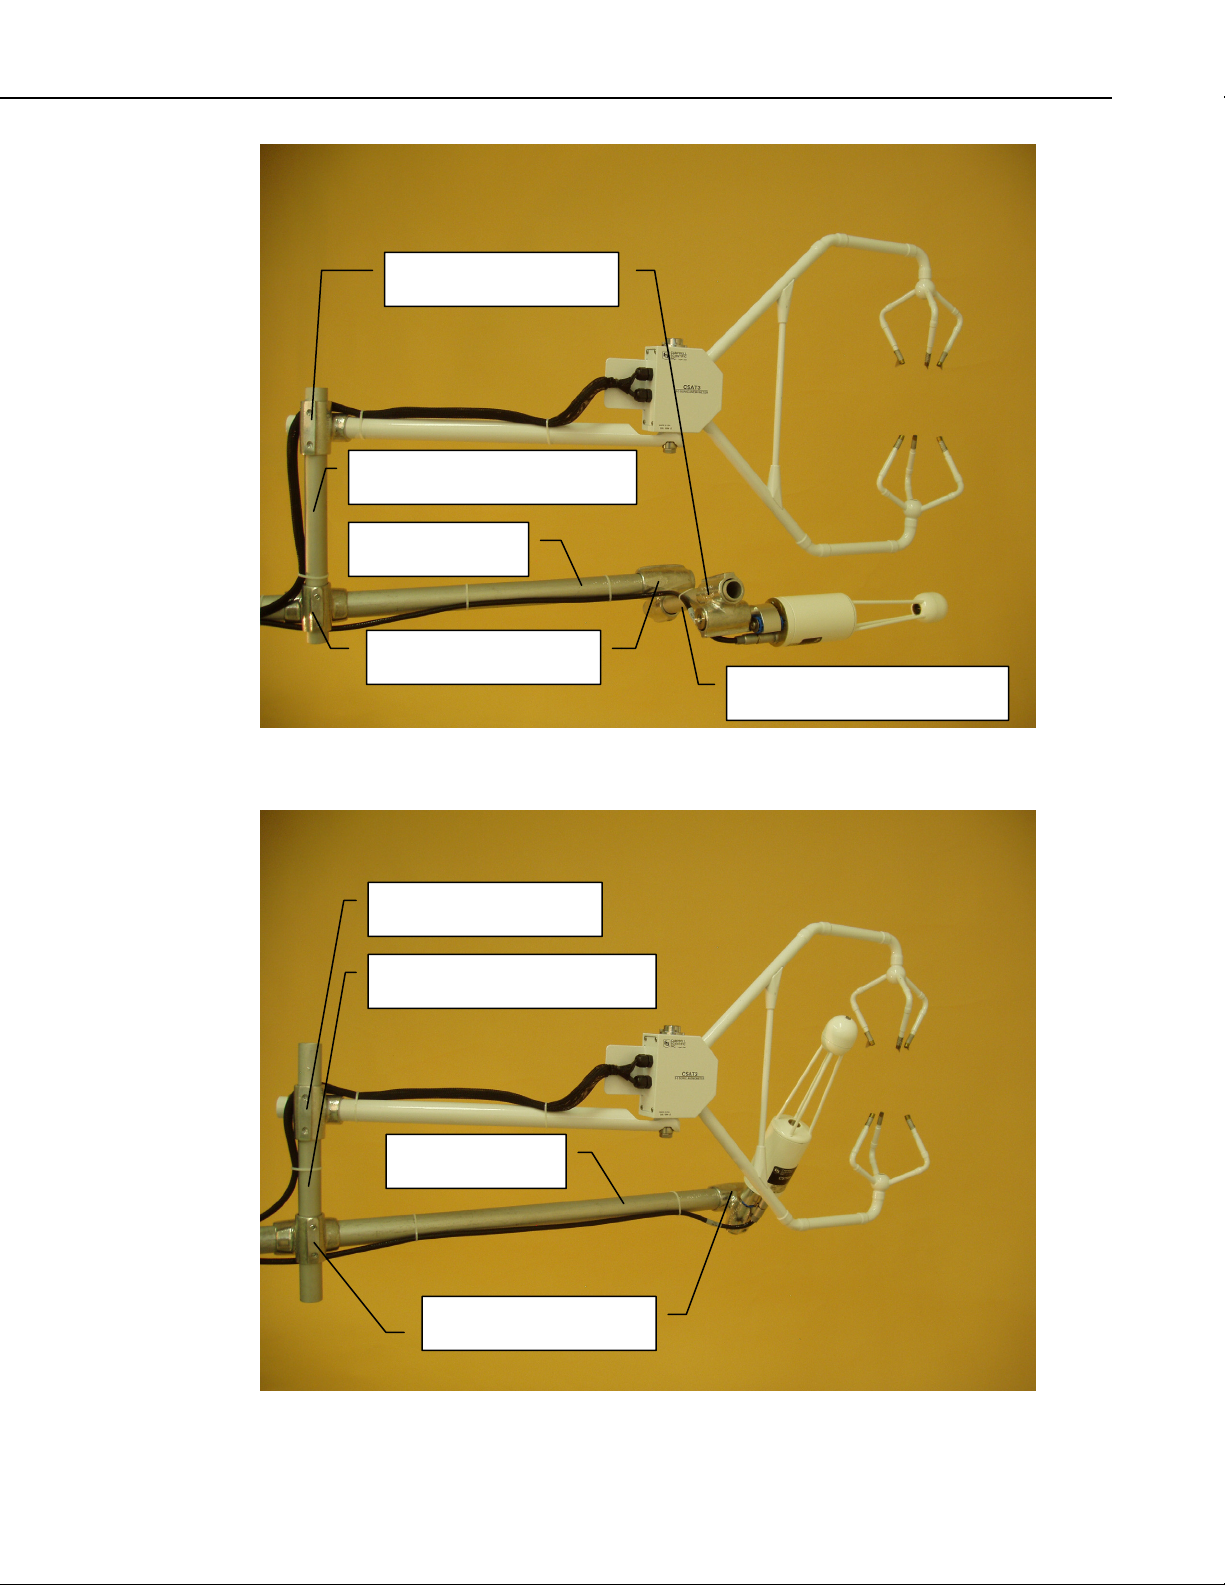
p/n 1017 0.75 inch by 0.75 inch
crossover Nu-Rail fitting
p/n 18048 0.75 inch diameter by 30.48
cm (12 inch) long aluminium pipe
CM204 Crossarm with
bracket, 1.3 m (4 ft)
p/n 1049 1.0 inch by 0.75 inch
crossover Nu-Rail fitting
Open Path Eddy Covariance System
p/n 6332 0.75 inch diameter by 25.4
cm (10 inch) long aluminium pipe
FIGURE 2. Side View of the CSAT3 and LI-7500 (mounted underneath CSAT3)
p/n 1017 0.75 inch by 0.75 inch
crossover Nu-Rail fitting
p/n 18048 0.75 inch diameter by 30.48
cm (12 inch) long aluminium pipe
CM204 Crossarm with
bracket,1.3 m (4 ft)
p/n 1049 1.0 inch by 0.75 inch
crossover Nu-Rail fitting
FIGURE 3. Side View of the CSAT3 and LI-7500 (mounted beside CSAT3)
5
Page 12
Open Path Eddy Covariance System
FIGURE 4. CM110 Enclosure Mounting Hardware (p/n 17716 configured for ENC 10/12)
Attached to the LI-7500 Electronics Box
6
FIGURE 5. Close Up View p/n 17716, configured for ENC 10/12, Locking Mechanism
Page 13
Open Path Eddy Covariance System
FIGURE 6. CSAT3 Electronics Box and p/n 17813
Enclosure Hanger Kit on CM110 Tripod Body
FIGURE 7. CSAT3 and LI-7500 Electronics Boxes Mounted on
the CM110 Tripod Body
7
Page 14
Open Path Eddy Covariance System
FIGURE 8. ENC12/14 Enclosure Mounted on the CM110 Tripod Base
8
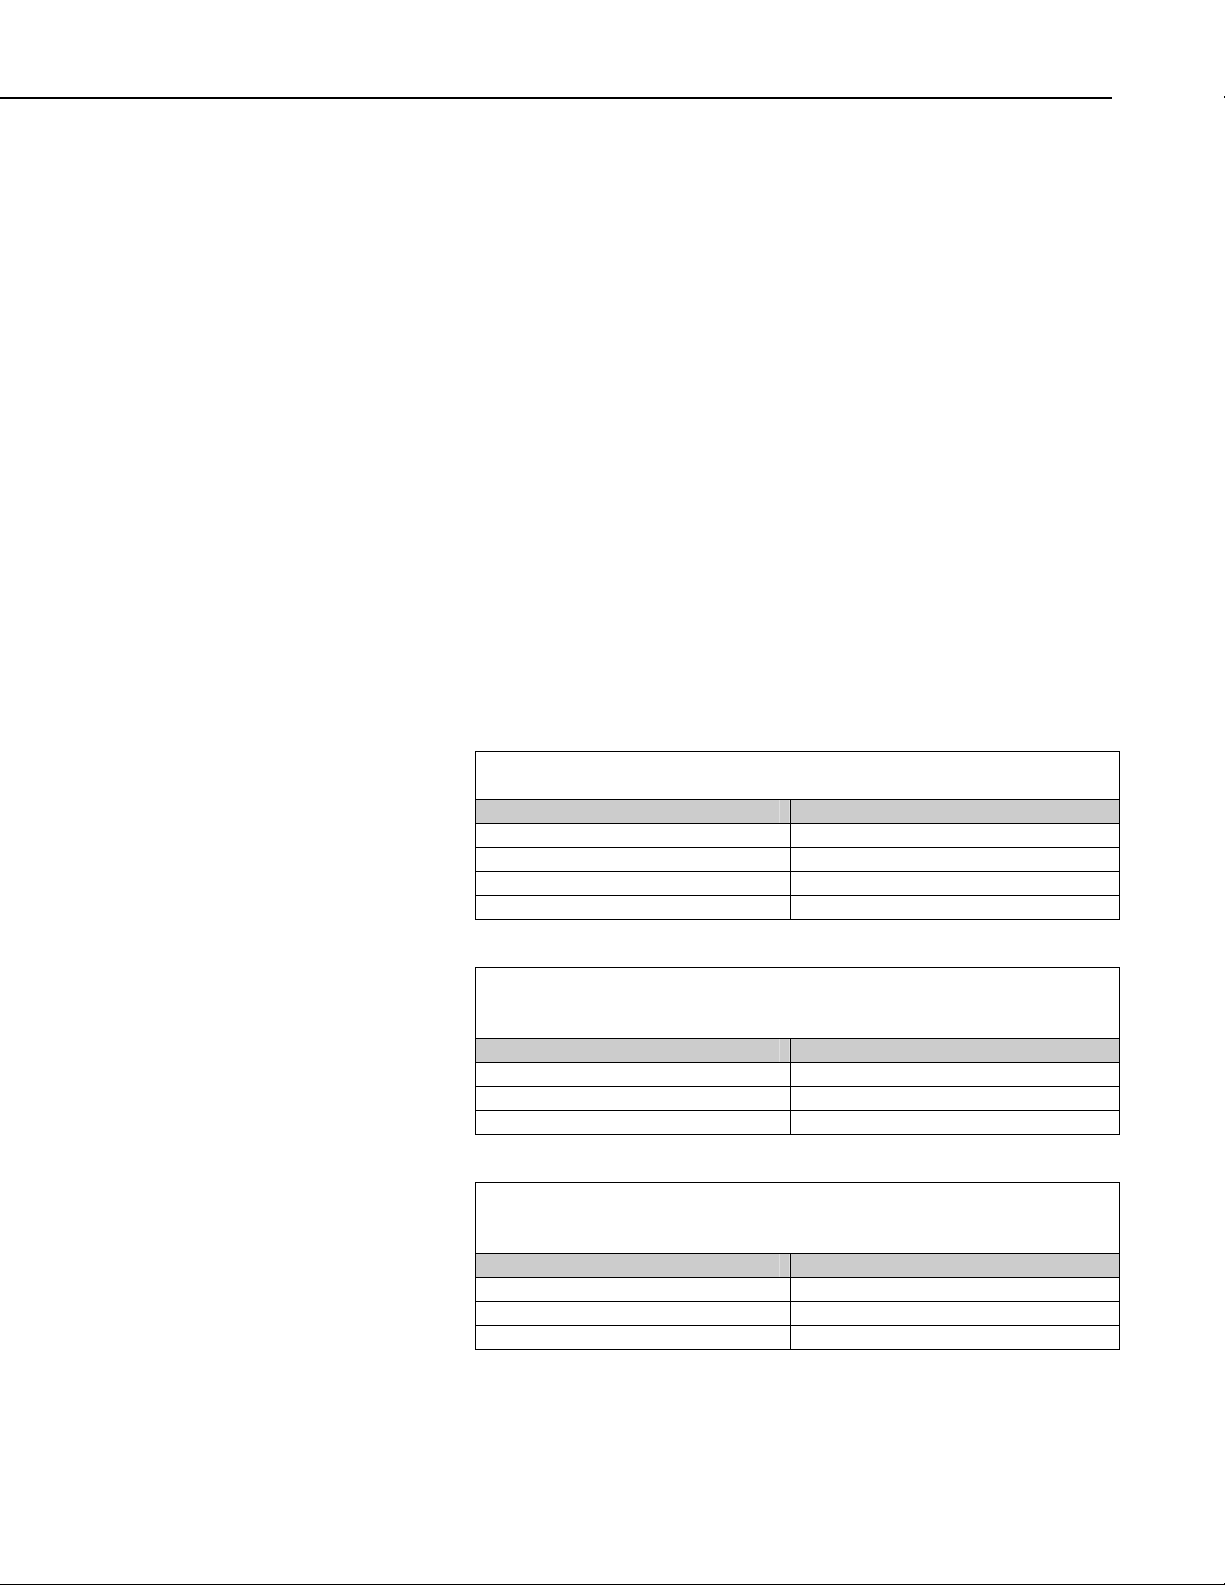
FIGURE 9. HMP45C 10-plate Radiation Shield Mounted on
the Body of the CM110 (left) and on the CM204 Horizontal Crossarm (right)
Page 15
2.2.1 Measure CSAT3 Azimuth
To compute the correct compass wind direction, the station operator must enter
the negative x-axis azimuth of the CSAT3 into the datalogger program. If the
CSAT3 is installed such that it points into the prevailing wind, the negative
x-axis is pointing into the prevailing wind. Take a compass azimuth of the
negative x-axis (prevailing wind) and record it into the station log book for
later use.
2.3 Wiring
A Campbell Scientific, Inc. eddy covariance system can take on several
configurations and utilize several different dataloggers. It is impractical to
document the different wiring schemes in this manual. However, do not
despair; each datalogger program (p/n 18442 or 18443) contains a complete
and detailed wiring diagram. See the datalogger program for wiring
instructions.
2.4 Power
The system requires about 1.5 to 14 W continuous power, depending on the
datalogger and sensor configuration. The approximate power requirements of
various key components, for a system running at 10 Hz, are listed in Tables 1,
2, and 3.
Open Path Eddy Covariance System
TABLE 1. Nominal Sensor Power Requirements
Sensor Power (mW)
CSAT3 67 mA @ 12.5 Vdc
LI-7500 850 mA @ 12.5 Vdc (after warmup)
KH20 10 - 20 mA @ 12.5 Vdc
HMP45C <3.8 mA @ 12.5 Vdc
TABLE 2. Nominal Datalogger Power Requirements with
the Display Off and No RS-232 Communications
Datalogger Power (mW)
CR1000 w/ CFM100 & CF card 8 mA @ 12.5 Vdc
CR3000 w/ CFM100 & CF card 39 mA @ 12.5 Vdc
CR5000 w/ PC/CF card 63 mA @ 12.5 Vdc
TABLE 3. Nominal Datalogger Power Requirements with
the Display and Backlight On, and No RS-232 Communications
Datalogger Power (mW)
CR1000 w/ CFM100 & CF card 109 mA @ 12.5 Vdc
CR3000 w/ CFM100 & CF card 75 mA @ 12.5 Vdc
CR5000 w/ PC/CF card 170 mA @ 12.5 Vdc
9
Page 16
Open Path Eddy Covariance System
The CSAT3 and LI-7500 are powered by an external battery. Typically, so is
the datalogger. If a CR3000/CR5000 is to be powered from a base with a
sealed rechargeable battery, connect the datalogger ground lug to the negative
post of the external battery. Ensure that the rechargeable battery is trickle
charged by a solar panel or mains power.
A user-supplied 70 Ahr deep cycle RV battery (degraded by 30%) will run the
system for approximately two days. The battery will have to be charged by a
trickle charger connected to mains power or solar panels. In some
environments, additional batteries or solar panels may be required (see the
Power Supply Application Note 5-F at http://www.campbellsci.com/
documents/apnotes/pow-sup.pdf and the solar panel manual at
http://www.campbellsci.com/documents/manuals/msx.pdf).
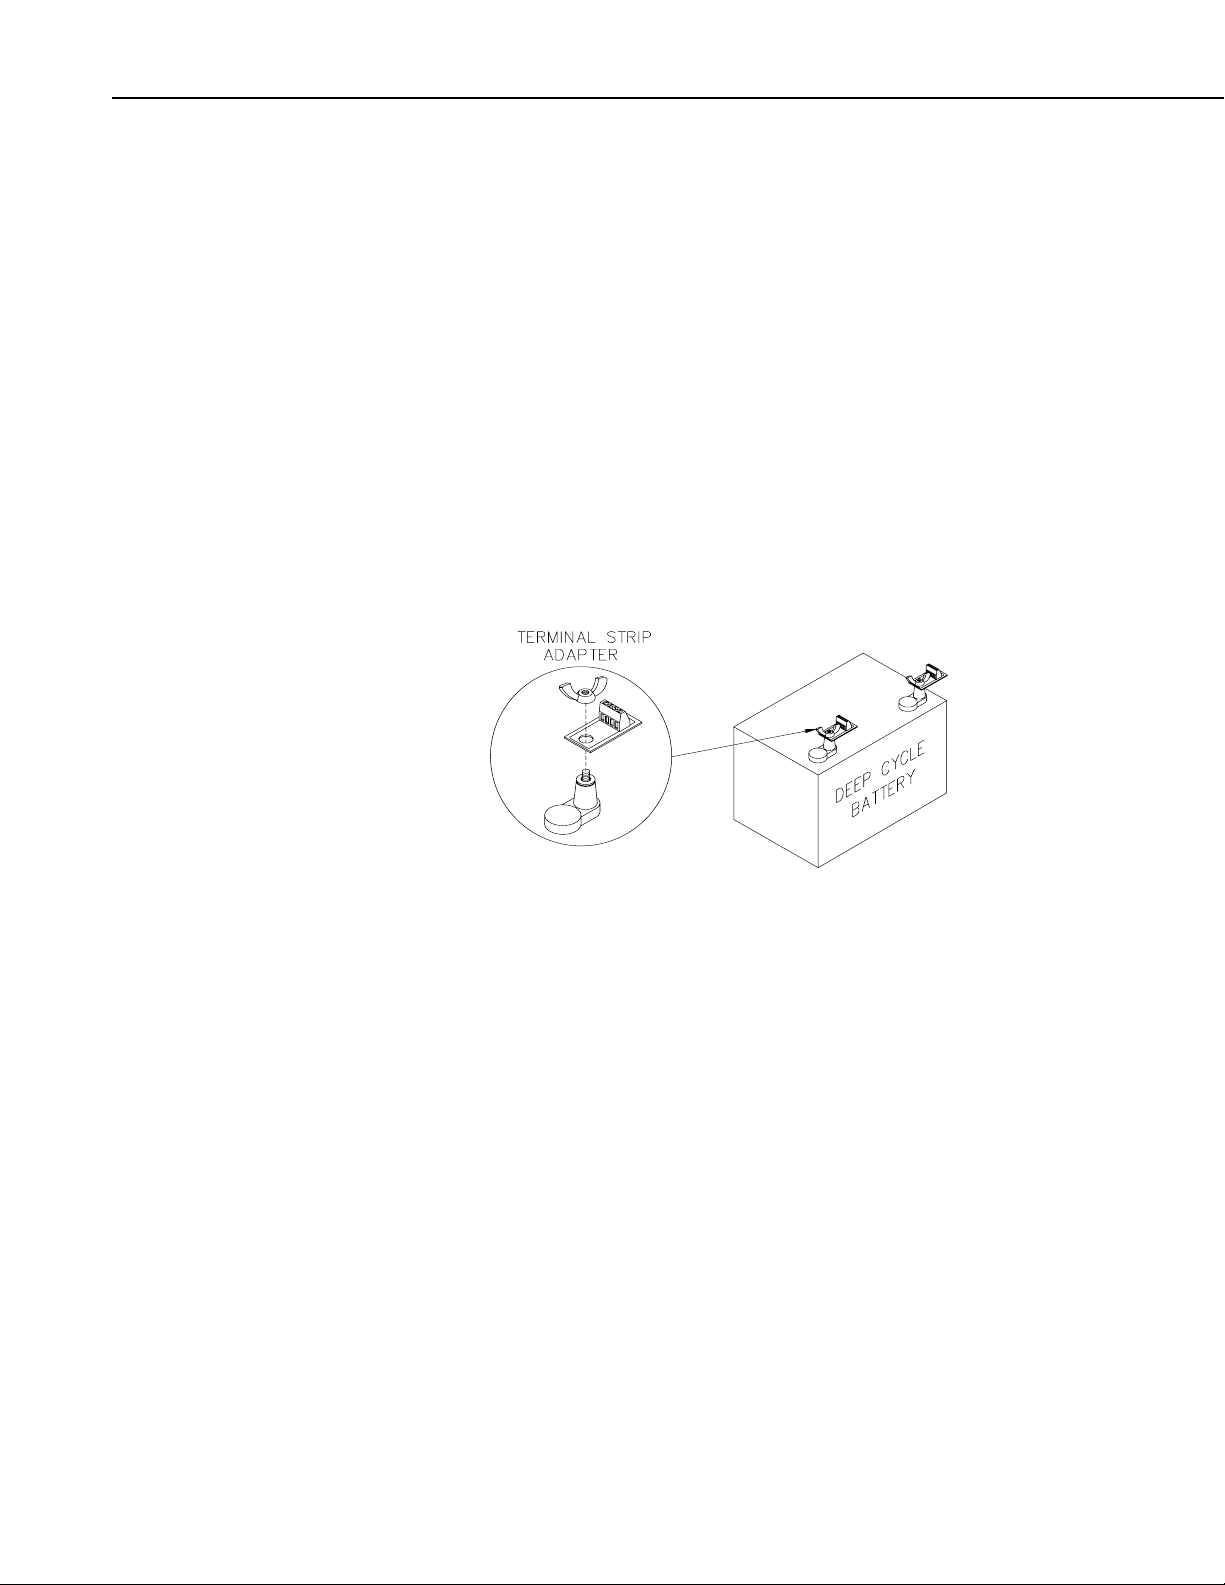
The CSAT3 and LI-7500 power cables are connected directly to the battery
terminals by means of two terminal strips (p/n 4386), one for the positive post
and the other the negative post (Figure 10).
FIGURE 10. Terminal Strip Adapters for Power Connection
to External Battery
Power connections are listed in the programs (p/n 18442 or 18443). Be sure
the datalogger has a good earth ground to protect against primary and
secondary lightning strikes. Campbell Scientific, Inc. recommends that all
dataloggers in the field be earth grounded. All components of the system
(datalogger, sensors, external power supplies, mounts, housing, etc.) must be
referenced to one common earth ground. When long cables are used or a site
has frequent lightning strikes, spark gaps may be required to protect the
datalogger from transient voltages.
3. System Datalogger Program
The eddy covariance datalogger program is the single component that
integrates all of the sensors in an eddy covariance station into a single system.
Part number 18442 is a program for a basic system and p/n 18443 is a program
for an extended system (with energy balance sensors). If your order did not
include either p/n 18442 or 18443 as a line item on the order, contact Campbell
Scientific, Inc. to purchase the appropriate datalogger program for your eddy
covariance system.
10
Page 17

Open Path Eddy Covariance System
The library of programs covers a variety of sensors and is continuously
growing. If your system has sensors that are not part of any program in the
library, simply add the appropriate measurement and processing instructions to
the program or contact Campbell Scientific, Inc. for assistance. Campbell
Scientific, Inc. charges for custom datalogger programming with a one hour
minimum and one hour resolution; call for current Application Engineering
time rates.
The datalogger programs align the measurements in time from the CSAT3,
LI-7500, KH20, and FW05. The CSAT3 has a fixed two scan delay and
LI-7500s shipped from Campbell Scientific, Inc. are programmed with a fixed
300 milliseconds (297.25 milliseconds) delay. These sensor delays are
removed before the time series data is saved to Final Storage and before they
are used to compute the online fluxes.
Depending on the system configuration, the datalogger programs compute
carbon dioxide flux, latent heat flux, sonic sensible heat flux, sensible heat
flux, momentum flux, and friction velocity, along with all the second moment
covariances, standard deviations, and means. The program will also compute a
sensible heat flux from the sonic sensible heat flux and latent heat flux (see
Appendix B). Each datalogger program is shipped with a Microsoft
®
Excel
workbook (tab) that describes the datalogger program outputs. There is one
worksheet (tab) per output data table.
11
Page 18
Open Path Eddy Covariance System
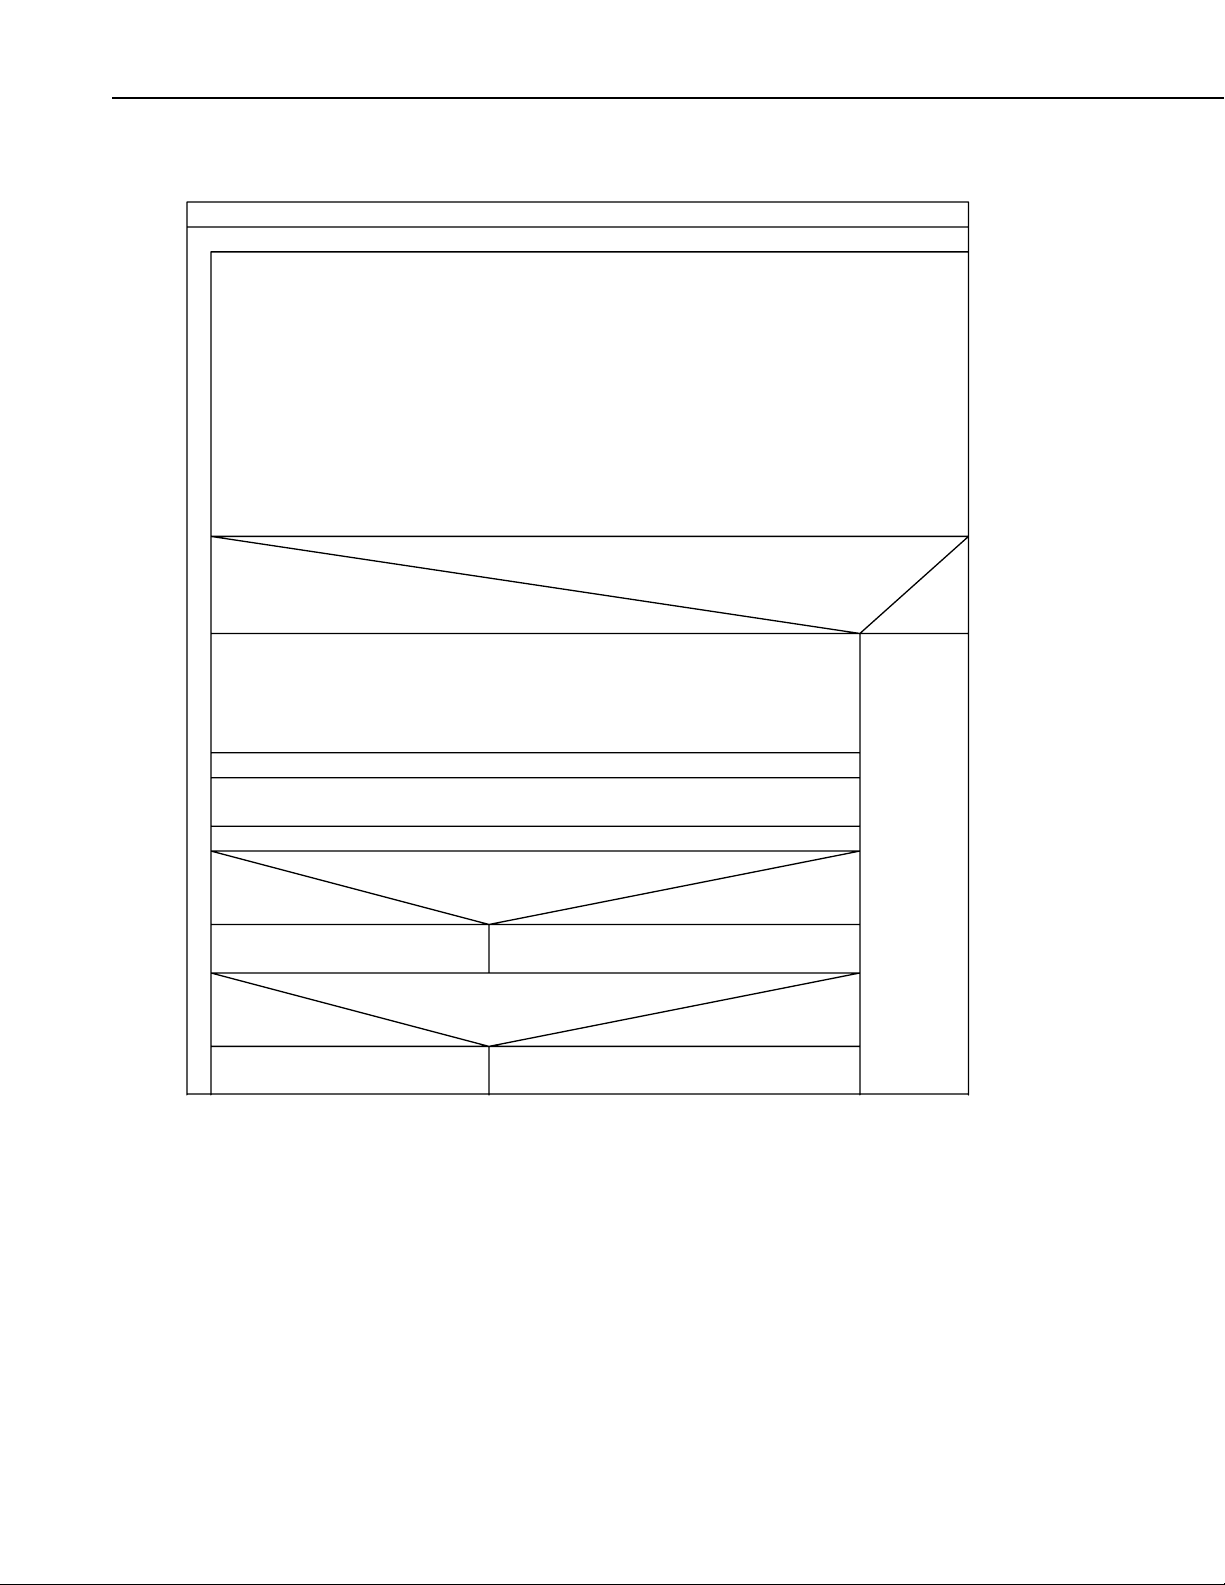
3.1 Generic Program Flowchart
Set default values for all variables:
Scan every 0.1 or 0.05 seconds
Measure Sensors:
- datalogger panel temperature
- FW05
- KH20
- CSAT3
- LI-7500
- HMP45C
- battery voltage
- Q7.1/NRLite/CNR1
- HFP01SC/HFT3
- TCAV
- CS616
Are enough data buffered to undo sensor lags? (scan_count
>= offset?)
TRUE
Retrieve buffered data and apply the appropriate lag:
- Load the CSAT3 data from (OFFSET - 2) scans back
- Load the LI-7500 data from (OFFSET - 1) scans back
- Load the KH20 data from (OFFSET - 0) scans back
- Load the FW05 data from (OFFSET - 0) scans back
Convert CSAT3 data for WindVector (): wind_east = -Uy, wind_north = Ux
Convert LI-7500 data from molar density to mass density
Convert LI-7500 data from molar density to molar fraction
Convert CSAT3 diagnostic word into seperate warning flags
Are any CSAT3 warning flags set?
TRUE
Disable covariance processing
(disable_flag_on(1) = TRUE)
Is the CSAT3 warning not a diagnostic code?
TRUE
Disable count of warning flags
(disable_flag_on(3) = TRUE)
Enable covariance processing
(disable_flag_on(1) = FALSE)
Enable count of warning flags
(disable_flag_on(3) = FALSE)
FALSE
FALSE
FALSE
12
Page 19
Open Path Eddy Covariance System
continuation of scan_count >= offset?
TRUE
Save the 4 most significant bits of the CSAT3 diagnostic word
Flip the diagnostic bits in the LI-7500 diagnostic
Compute LI-7500 AGC
Convert LI-7500 diagnostic word into seperate warning flags
Are any LI-7500 warning flags true?
TRUE
Disable covariance
processing
(disable_flag_on(2) =
TRUE)
LI-7500 CO2 = NAN or SDM error?
TRUE
Disable count of LI-7500
warning flags
(disable_flag_on(4) =
TRUE)
Save the 4 most significant bits of the LI-7500 diagnostic word
Is it even minute?
TRUE
Call time series data table (delay adjusted)
Call the online covariance calculation data table (comp_cov)
TRUE
Perform online processing:
- Load the calculated covariances
- Calculate the compass wind direction
- Calculate the CSAT3 wind direction
- Compute the fluxes from the covariance values
- Calculate Webb et al. term
- Calculate a computed sensible heat flux
- Calculate the oxygen correction
Call flux data table
Enable covariance processing
(disable_flag_on(2) = FALSE)
Enable count of LI-7500 warning
flags (disable_flag_on(4) = FALSE)
save_ts_flag_on = FALSEsave_ts_flag_on = TRUE
Have new covarianc es been
calculated?
FALSE
scan_count =
scan_count+1
FALSE
FALSE
FALSE
FALSE
3.2 Program Configuration
The site attendant must enter unique calibration coefficients or site-specific
information into the datalogger program. This information includes, but is not
limited to, the CSAT3 azimuth, calibration coefficients for the net radiometer
and soil heat flux plates, or site pressure. To find the section of the program
where these changes are made, search for the text “Unique value”.
13
Page 20

Open Path Eddy Covariance System
3.2.1 CSAT3 Azimuth
The example programs report the wind direction in both the CSAT3 coordinate
system (a right-handed coordinate system) and in the compass coordinate
system (a screwball left-handed coordinate system). The CSAT3 coordinate
system is relative to the CSAT3 itself and does not depend on the CSAT3’s
orientation (azimuth of the negative x-axis). The compass coordinate system is
fixed to the earth. In order for the programs to compute the correct compass
wind direction, the azimuth of the CSAT3 negative x-axis must be entered into
the program. The program default value for CSAT3_AZIMUTH is 0. This
assumes that the prevailing wind is from the North, e.g. the CSAT3 is mounted
such that the negative x-axis points to the North.
As described in Section 2 and 2.2.1, orient the CSAT3 so that it is pointing into
the prevailing wind direction. If you have done so, the CSAT3 negative
x-axis will point into the prevailing wind direction. Enter this prevailing wind
direction for the constant CSAT3_AZIMUTH (see the station log book for this
bearing).
NOTE
Don’t forget to account for the magnetic declination at the site;
see Appendix A for details.
Figures 11 and 12 show the orientation of a CSAT3 with a compass bearing of
140 degrees, e.g. the negative x-axis is pointing into 140 degrees. If the wind
is blowing into the CSAT3, from the negative x-axis to the positive x-axis
(from the transducers to the block), the horizontal wind vector angle
(wind_dir_csat3) is 0 degrees (wind vector) and the compass wind direction
(wnd_dir_compass) is 140 degrees (wind vane).
Y
X
14
Wind Vane
Wind Vector
North
FIGURE 11. CSAT3 Right Hand Coordinate System,
Horizontal Wind Vector Angle is 0 Degrees
Page 21

Open Path Eddy Covariance System
North
X
Y
FIGURE 12. Compass Coordinate System,
Compass Wind Direction is 140 Degrees
Wind Vane
Wind Vector
3.2.2 Sensor Configuration
The CSAT3 and LI-7500 communicate with Campbell Scientific, Inc.
dataloggers using a proprietary digital communication protocol called
Synchronous Device for Measurement (SDM). Each sensor connected to the
SDM bus has a unique address. A maximum of 15 addresses are allowed by
the protocol and each sensor must have a unique SDM address.
CAUTION
Do not use SDM address F (15) because it is reserved for
use with the Group Trigger instruction.
The CSAT3 is shipped from the factory with a default SDM address of 3. The
CSAT3 address is set by a 16 position thumb switch located on the CPU circuit
board (see the CSAT3 manual for details).
The LI-7500 shipped from Campbell Scientific, Inc. is set with an SDM
address of 7. This address is set in software and can be changed using the
LI-7500 PC support software and the LI-7500 serial cable and port. In addition
to the SDM address, Campbell Scientific, Inc. sets the LI-7500 delay to 300
milliseconds (297.25 milliseconds). At a measurement rate of 10 Hz, this
programmed delay is a 3 scan delay and at 20 Hz it is a 6 scan delay. Finally,
the LI-7500 bandwidth is set to 20 Hz to limit the amount of numeric filtering
of high frequency information.
If the LI-7500 delay and bandwidth are not set correctly, the carbon dioxide
and latent heat fluxes will be underestimated. LI-7500s purchased directly
through LI-COR may or may not have the correct settings for use in a
Campbell Scientific, Inc. eddy covariance system. The only way to know for
sure is to check the settings. Contact LI-COR for information on changing
these settings or see Section 3, Outputs Page - Setting DAC and SDM Outputs
of the LI-COR published LI-7500 manual.
15
Page 22

Open Path Eddy Covariance System
CAUTION
If you loan a CSAT3 or LI-7500 to a colleague, verify that
the addresses are 3 and 7, respectively, before deploying
the system into the field.
3.3 Loading a Program to the Datalogger
Before the datalogger can begin to make measurements, a program must be
transferred into its CPU. The program can be transferred using a PC and
LoggerNet or using PC/CF cards. Without a working datalogger program, the
collection of eddy covariance sensors is just that, a collection of sensors. It is
the datalogger program and this document that integrates the sensors and
makes them an Open Path Eddy Covariance Flux System.
3.3.1 Direct Connection via LoggerNet
The datalogger program can be transferred to a datalogger using a PC,
LoggerNet, and some sort of interface. In the eddy covariance application, the
most common interface is the RS-232 cable.
NOTE
CR3000 OS v3.0, CR1000 OS v10.0, and CR5000 OS v2.1 or
greater support a 32 bit File Allocation Table (FAT32). Before a
card is used for the first time with a CRBasic datalogger, format
it on a Windows XP computer using FAT32. If a Windows XP
computer is unavailable, the 16 bit File Allocation Table (FAT)
is also supported with the above CRBasic dataloggers.
TIP
To avoid potential problems (mixed data and connectivity
issues), configure LoggerNet with one station file per datalogger,
even if the data is retrieved using cards and the computer is
connected to multiple dataloggers for monitoring purposes only.
See the LoggerNet manual Section 4.2.
Set up a station in the LoggerNet network map; see Section 4.1 in the
LoggerNet manual for details. To transfer a program to the datalogger, start
LoggerNet. Click on the “Connect” button in the Toolbar. Select the station
and click on the “Connect” button. Check the datalogger time, it is located in
the upper right hand side of the Connect Screen. If the datalogger and PC time
differ by more than a few seconds, set the datalogger time by clicking on the
“Set Station’s Clock” button. To download a program, click on the “Send”
button. Navigate to the folder where the program is saved, select it, and click
on “OK”.
3.3.2 Remote via PC/CF Card
The datalogger program can be transferred to a datalogger using a PC/CF card.
The CRBasic dataloggers reserve 10% or 80 Kbytes of space, whichever is
smaller, on cards to store programs. Copy the program onto the card using
Windows Explorer.
16
Page 23

Open Path Eddy Covariance System
CAUTION
Use only SanDisk Industrial Grade or Silicon Systems
PC/CF Cards. Although consumer versions of PC/CF
cards will fit into the card slot and operate, for a short time,
only the SanDisk Industrial Grade or Silicon Systems
PC/CF cards have passed our temperature and ESD
testing.
The following instructions assume a basic familiarity in the operation of a
CRBasic datalogger keyboard; see the datalogger manual for details on using
the keyboard.
Insert the card into the datalogger card slot. Press the enter key. If necessary,
select the “System Menu” menu and press the <Enter> key. Select the “File”
menu and press the <Enter> key. Select the “Copy” menu and press the
<Enter> key. The cursor should be at the “From” line. Press the <Enter> key,
select “CRD:” and again press the <Enter> key. The datalogger will now
display a list of program files on the card.
Navigate to the eddy covariance program and press the <Enter> key. The
cursor will jump to the “To” line. Press the <Enter> key and then the right
arrow, select CPU:filename. Press the <Esc> key and down arrow. Finally,
press the <Enter> key to execute the copy from the card to the CPU.
To start the program, press the <Esc> key until the main menu appears and
Campbell Scientific, Inc. logo appear in the upper left hand side. Press the
<Enter> key, if necessary, select the “System Menu” and press the <Enter>
key. Select the “Run/Stop Program” menu and press the <Enter> key. Tag the
“Restart, Delete Data” option, navigate to “Execute” and press the <Enter>
key. Select “Yes” and press the <Enter> key.
CAUTION
Do not run a program from the PC/CF card if the card will
be removed and replaced with another.
3.4 System Operation
Once the program is downloaded to the datalogger, compiled, and the PC/CF
card has been formatted, the datalogger will begin to communicate with the
SDM sensors and measure the analog sensors. At the top of the next minute, it
will start writing the raw time series data to the PC/CF card (the LED will
begin to flash at a steady frequency). Verify that all the sensors are wired and
measured correctly by monitoring the Public data table. Check the Status data
table for compile and runtime errors (See Section 3.4.2).
3.4.1 Monitoring Data
Monitor the instantaneous measurements by viewing the Public table. The
“Public” table can be monitored using either LoggerNet (see the LoggerNet
manual for details) or via the keyboard and display (see the datalogger manual
for details). The online flux computations can be viewed by monitoring the
“Flux” table with either LoggerNet or the keyboard and display. The historical
online “Flux” data can be monitored in “Final Storage Data” menu.
17
Page 24

Open Path Eddy Covariance System
3.4.2 Status Table
The “Status” table contains useful information about the performance and
status of the system (see Appendix A in the datalogger manual). To view the
“Status” table with LoggerNet, go to the Connect Screen and select the
Tools|Status Table … menu (see Section 5.1.10 in the LoggerNet manual).
With the keyboard display, follow this menu path System Menu|Status. Useful
information in the “Status” table includes, but is not limited to:
OSVersion: Version and revision of the CRBasic datalogger operating
system. As of the printing of this document, Campbell Scientific, Inc.
recommends using, CR3000 OS v3.0, CR1000 OS v10.0, or CR5000 OS v2.1
or greater.
WatchdogErrors: Number of times the watch dog timer reset the datalogger.
Normally, this count should be 0.
CompileResults: Reports compile errors.
VarOutOfBound: An element of an array was referenced that does not exist,
e.g. a VarOutOfBound is reported if element wind(9) is referenced in the
program, but the array was defined with 5 elements.
SkippedScan: If the maximum number of buffered scans is exceeded (defined
in the third parameter of the Scan () instruction), the Processing and
Measurement tasks are resynchronized. The resynchronization results in a
number of SkippedScan equal to the buffer depth.
DataFillDays(): The number of days to fill a table in both the CPU and CRD
memory. The number of days to fill a table is reported in the same order they
are found in the “Status” table, e.g. the same order they are defined in the
program.
CardStatus: Indicates if a card is used by the program or not.
ProcessTime: Time, in microseconds, it takes the datalogger to complete all
the processing. In the Sequential mode, this value must always be less than the
Scan Interval. In the PipeLine mode, this value can occasionally be greater
than the Scan Interval, e.g. when the 30 minute fluxes are computed. With the
eddy covariance systems, always use the Pipeline mode.
BuffDepth: The current number of Scans that the datalogger Processing tasks
have fallen behind the Measurement tasks. In the Pipeline Mode, the
datalogger processing task can periodically fall behind the Scan Interval.
MaxBuffDepth: The maximum number of Scans that the Processing tasks
have fallen behind the Measurement tasks.
4. Data
18
Each system requires an eddy covariance program (p/n 18442 or 18443). The
data table outputs of the programs are described in a Microsoft
document (shipped with the program). The description includes the variable
name and units. There is one sheet (tab) per output.
®
Excel
Page 25

Open Path Eddy Covariance System
NOTE
CAUTION
The datalogger programs are protected under U.S. and
International copyright laws. Do not distribute the datalogger
programs. See the End User License Agreement (EULA) shipped
with the programs for more information on your rights and
obligations.
Data is saved on the PC/CF card as a binary file in a Campbell Scientific, Inc.
format called Table Oriented Binary Format 3 (TOB3). TOB3 incorporates
features to improve reliability of the card and allows for the accurate
determination of each record’s time without the space required for individual
time stamps.
Use only SanDisk Industrial Grade or Silicon Systems
PC/CF Cards. Although consumer versions of PC/CF card
will fit into the card slot and operate, for a short time, only
the SanDisk Industrial Grade or Silicon Systems PC/CF
cards have passed our temperature and ESD testing.
Before the data can be used, it must be converted to a Table Oriented Binary
Format 1 (TOB1), Table Oriented ASCII Format 5 (TOA5), or Array
Compatible CSV file. In all of these formats, the time stamp is written to each
record. In the TOB1 format, the time stamp is reported as the number of
seconds and nanoseconds since 0000 hrs, 1 Jan 1990. In the TOA5 format, the
time stamp is a quoted string, similar to that used in Microsoft
®
Excel. In the
Array Compatible CSV, time is reported as elements of the array, e.g. in the
same format as the Campbell Scientific, Inc. mixed array dataloggers.
NOTE
Campbell Scientific, Inc. recommends the use of TOB1 file
format. This file format can be readily read into third party post
processing software, e.g. EdiRe (“e-dE rE”), MatLab, or
DADiSP. If required, a TOB1 flux file can be converted into a
TOA5 flux file using CardConvert. A TOA5 file is comma
separated values and easily read into Microsoft
file.
Both the TOB1 and TOA5 formats contain an ASCII header. This header
contains information about the datalogger used to collect the data. The header
also describes the data with variable names and units. For more information on
the file formats, see Section 2.4 in the datalogger manual.
For backwards compatibility with mixed array dataloggers, comma separated
values, without header information, is also supported with LoggerNet and
CardConvert. Elements that contain an array ID, day of year, hour and
minutes, can be added to the first few columns of the data file. This format is
supported in LoggerNet version 3.3 and CardConvert version 1.2 or greater.
4.1 Data Retrieval
Data can be collected from a datalogger using both LoggerNet and a direct
connection, or by physically moving the card from the datalogger to the
computer. Using LoggerNet and a PC as a data retrieval option is only
®
Excel as a CSV
19
Page 26

Open Path Eddy Covariance System
practical if the PC will be located at the site and is continuously polling the
datalogger because the volume of data is such that it takes about 8% to 25% of
real time to download 10 Hz time series data.
Transferring data using the PC/CF card is relatively fast; however, it does
require manual intervention to manage the files. A 1024 Mbyte file (about 30
days of 10 Hz time series from a Basic Eddy Covariance system) will take
about 15 minutes to copy from the card to a PC hard drive.
A Basic Eddy Covariance system will collect about 40 Mbytes of 10 Hz time
series data per day. A strategy for maintaining manageable file sizes is to
break them up into smaller files that cover time periods ranging from 1 hour to
1 day. This can be achieved with LoggerNet and the Baler, or using
CardConvert. Both the Baler and CardConvert support naming these smaller
files using the time stamp of the first record in the file.
TIP
A group file renaming utility can be useful to manage files from
multiple stations. These utilities are commonly used in the
photography industry to manage image files and are readily
available on the web, ranging from freeware, shareware, and
commercial versions. Any one of these will meet the data file
management needs, as long as it can find and replace text within
a file name.
4.1.1 Direct Connection Data Retrieval via LoggerNet
LoggerNet can be used to automatically collect and organize data from an eddy
covariance system. This approach is some what limited because of the slow
throughput into the PC’s RS-232 port. For all practical purposes, the PC must
remain continuously connected to the datalogger. It will take about 8% to 25%
of real time to collect 10 Hz time series data, e.g. it will take between 5 to 15
minutes to download 60 minutes of 10 Hz time series data. Using a PC and
LoggerNet to “milk” data from remote sites is not practical.
For sites where a PC is continuously connected to the datalogger via RS-232,
MD-485 short haul modems, Freewave spread spectrum radios, Ethernet
connection, or other “direct connection”, LoggerNet and the Baler can be used
to collect and manage the data.
To create a new station file see Section 4.2 of the LoggerNet manual.
Configure the station’s “Data Files” tab as shown in Figures 13 and 14. Note
that the “File Output Option” is “No Output File”. LoggerNet will collect the
data from the data table and place it in the cache. The cache is where data
collected from the datalogger is stored and made available for use by client
software, e.g. the Baler. Client software is run on the host PC or a remote PC.
For more information, see Section 13.1 of the LoggerNet manual.
20
Page 27

Open Path Eddy Covariance System
FIGURE 13. LoggerNet Station Setup for the “flux” Table
FIGURE 14. LoggerNet Station Setup for the “ts_data” Table
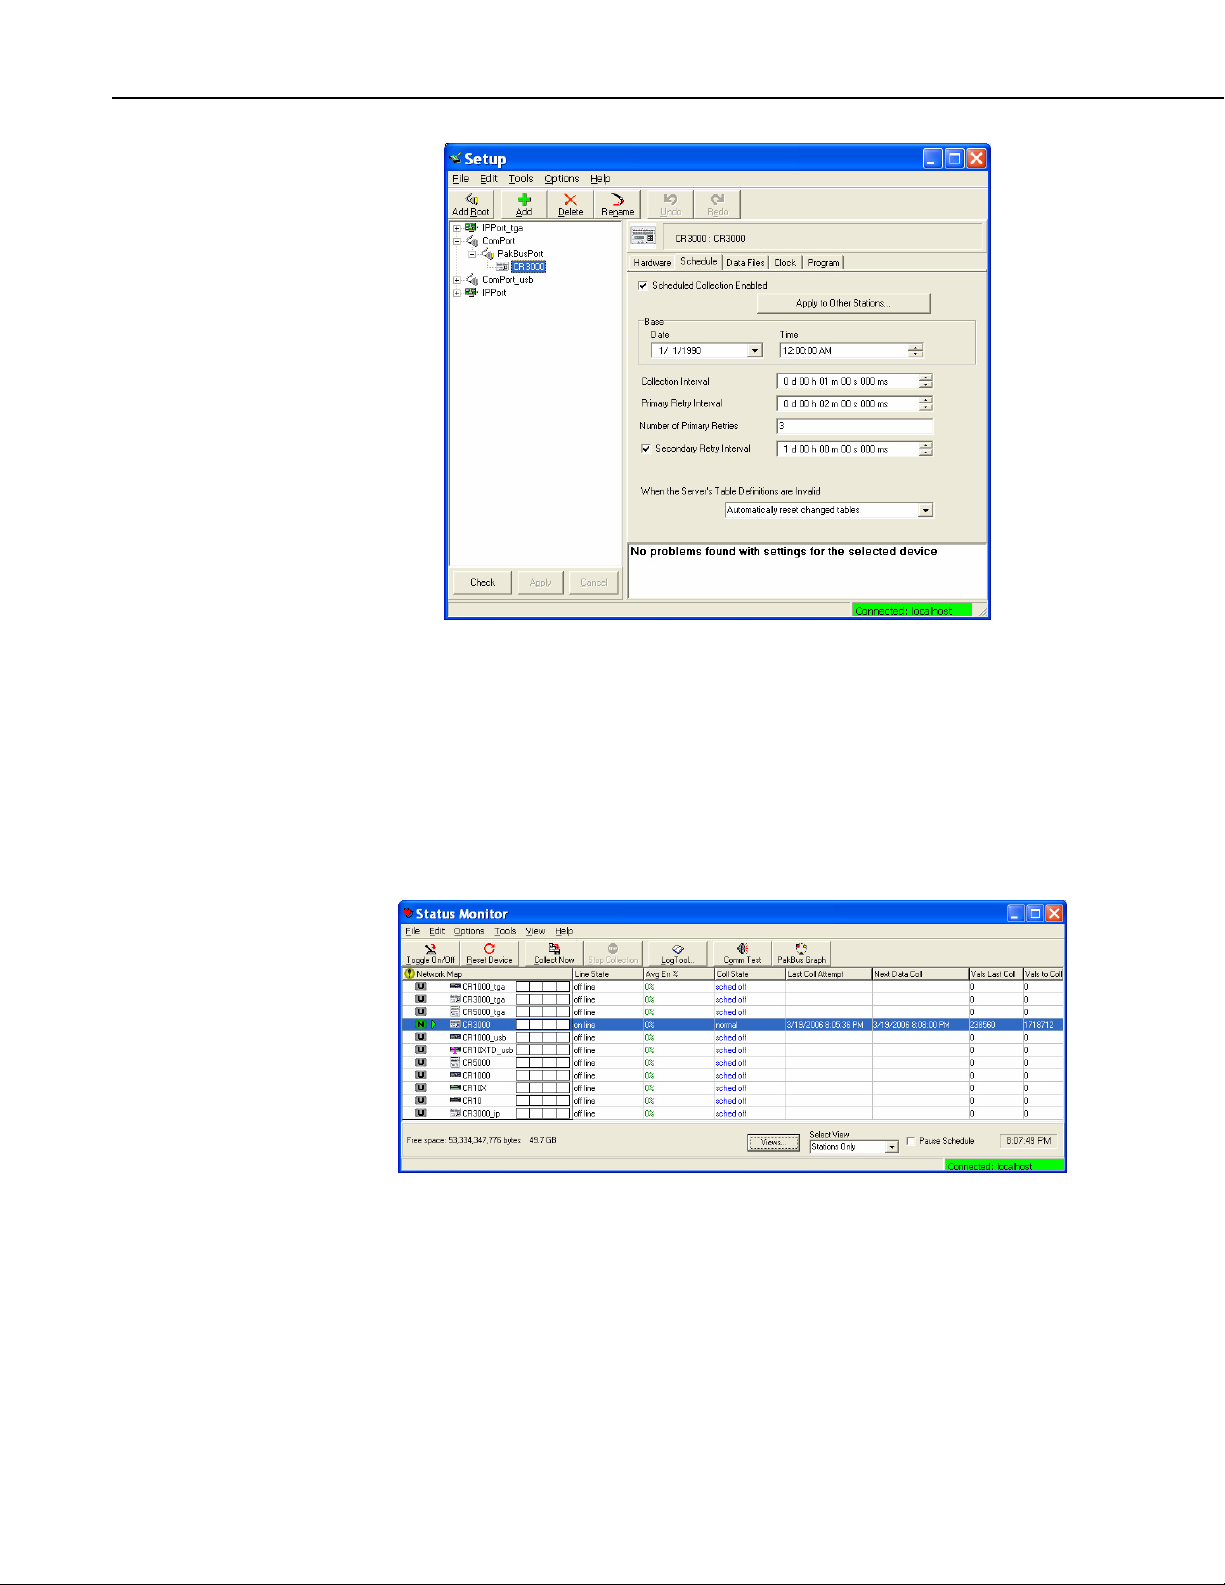
In the “Schedule” tab, configure the station’s data collection as shown in
Figure 15. Modify the Primary Retry Interval, Number of Primary Retries, and
the Secondary Retry interval as needed for the specific telecommunications
option used at the station. For example, a site using Freewave spread spectrum
radios or an Ethernet connection may require a long interval between retries or
more frequent retry attempts because of other background traffic.
21
Page 28
Open Path Eddy Covariance System
FIGURE 15. LoggerNet Station Data Collection Schedule
To enable LoggerNet’s data collection, click on the Status Monitor button in
the Toolbar. Select the station and click on the “Toggle On/Off” button. The
time of the next data collection will appear in the “Next Data Call” column (see
Figure 16). To display additional station information, right click on any
column header and then Select “Column…”. For more information, see
Section 6.1 Status in the LoggerNet manual.
FIGURE 16. LoggerNet Station Status Monitor
22
Page 29

4.1.2 File Management with Baler
The data is collected by LoggerNet and placed in the LoggerNet cache. Two
instances of the Baler, one for the time series data and the other for the flux
data, will pull the data from the cache and “bale” it into a user specified file
size (see Figures 17 and 18). Campbell Scientific, Inc. recommends using a
one hour bale size for time series data that will be post processed by EdiRe and
a 1 day bale size for the flux data. To run more than one instance of the Baler,
use the “/WorkDir=pathname” switch and two shortcuts, one for the time series
data and the other for the flux data (see Section 6.5 in the Baler manual).
Open Path Eddy Covariance System
TIP
While the system is set up in the lab or outside near the lab,
practice not only operating the system and data collection, but
also file management and data processing. Only through this
type of experimentation will you determine the file sizes and
procedures that work best for you.
FIGURE 17. Baler Station Setup for the “flux” Table
23
Page 30

Open Path Eddy Covariance System
FIGURE 18. Baler Station Setup for the “ts_data” Table
4.1.3 Remote Data Retrieval via a PC/CF Card
To transfer data manually from the PC/CF card to the PC, remove the card
from the datalogger following the proper card removal procedure (see the
appropriate datalogger manual for details). Insert a fresh card into the
datalogger or copy the data from the card to a working directory on the
computer. Transferring data using the PC/CF card is relatively fast. A 1024
Mbyte file (about 30 days of 10 Hz time series from a Basic Eddy Covariance
system) will take about 15 minutes to copy from the card to a PC hard drive.
While the PC/CF card is not in the datalogger, the datalogger will continue to
collect and save the data in the CPU. When the card is returned to the
datalogger, the data will be transferred automatically from the CPU to the card.
NOTE
When a card is inserted into a CRBasic datalogger, the
datalogger will transfer all the data that was collected since the
card was removed. It is good practice to avoid keyboard and
RS-232 activity during this time. After the datalogger is finished
transferring the data to the card, the LED will blink at a steady
frequency.
The amount of CPU storage, for time series data, varies from data logger to
datalogger. The Status Table reports the time it takes to fill the CPU and CRD
DataTables in the “DataFillDays” fields. The third DataFillDays field is the
fill time for the CPU time series data table. The fill time of the CPU time
series data table can be increased by decreasing the size of the CPU flux data
table, e.g. decrease the variable NUM_DAY_CPU from its default value.
24
Page 31

Open Path Eddy Covariance System
CAUTION
Never remove a PC/CF card from the datalogger or turn off
power to the datalogger without first shutting down the
card. With a CR3000 or CR1000, press the “Removal
Button” on the CFM100 Compact Flash/NL115
Ethernet/Compact Flash module. With a CR5000 select
the PCCard|Remove Card menu.
Data can be retrieved from a datalogger using one or two cards. If a single card
is used, and data on the card is not deleted after copying it to the PC, the data
from the CPU will be appended to the file on the card when it is returned to the
datalogger. Using a single card in this fashion allows the site attendant to
create files of uniform size.
The disadvantage of this approach, if the time between site visits is
significantly less than the DataTable file time, is that there will be redundant
data copied, along with the new data. This approach is not practical if the PC
can not be brought to the site or the time it takes to copy the data from the card
to the PC is greater than the time it takes to fill the CPU time series DataTable.
As an alternative, two cards can be used. The site attendant will remove the
card in the datalogger and replace it with a fresh one. This method is fast and
does not require a PC at the site. The disadvantage of this approach is that it
will create non-uniform file sizes around the time that the cards are exchanged.
If the time series data is processed by EdiRe, nonuniform file sizes are not an
issue. The files could be spliced together with a binary editor for TOB1 files or
a text editor TOA5 files.
4.1.4 File Management with CardConvert
CardConvert is an utility that is shipped with LoggerNet and is used to convert
the files on a card from the compact file format TOB3 to a TOB1, TOA5, or
Array Compatible CSV (see Figure 19). This utility is installed on the PC
under the Start menu in the LoggerNet|Utilities group. To take advantage of all
the functionality described in this section, use CardConvert version 1.2 or later.
Copy the data from the PC/CF card onto the computer using Windows
Explorer. Place the file in a temporary working directory, e.g C:\Temporary.
It will take about 15 minutes to copy a 1024 Mbyte file (about 30 days of
10 Hz time series from a Basic Eddy Covariance system).
TIP
It is good practice to archive the raw data as copied from the
PC/CF card. Use a zip utility to compress the file, before
archiving it to a CD. Compressing a 1024 Mbyte time series file
will take about 2 minutes using the built-in Windows XP zip
utility.
25
Page 32

Open Path Eddy Covariance System
TOB1
Binary File
TOB3
File from
PC/CF Card
TIP
TOA5
ASCII file
with header
Array
Compatible
ASCI
Arrays without
header
FIGURE 19. File Format Flow
Start the CardConvert utility. When CardConvert is started, a summary of its
current settings is displayed in the lower right hand screen. There are four
screens/parameters to setup and configure in CardConvert. Once configured,
CardConvert will save these settings in the Windows Registry. In subsequent
runs, only the default Output File name must be changed.
• Click on the “Select Card Drive” button and navigate to the temporary
directory that contains the raw time series and flux data files. Select
the drive and click on the “OK” button.
Since it is likely that the online flux and time series files will be
broken down into different sizes based on time, process the time
series and flux data with multiple passes through CardConvert.
26
• Click on the “Change Output Dir” button and navigate to the folder to
store the processed data. Select the drive and click on the “OK”
button.
• Click on the “Destination File Options” button, the Destination File
Option screen will appear. Configure the screen as shown in Figure
20 and then click on the “OK” button.
Page 33

Open Path Eddy Covariance System
FIGURE 20. Destination File Option Screen
TIP
TIP
NOTE
To create an EdiRe raw format file list using the Interpreter, save
the data in the TOB1 file format. If another format is needed at a
later date, convert the TOB1 files into the other file format (see
Figure 19).
• Set the file size (Bale size) in the “Time Settings” screen. For the
time series files, use a one hour file size and for the online flux data,
use a one day file size.
Practice converting the data from the card and processing it with
your off-line tools. Only through this type of experimentation
will you determine the file sizes that work best for you.
• Finally, change the output file name. The default output file name is
TOB1_stationname.ts_data.dat, where stationname is the datalogger’s
station name and can be set using DevConfig.exe (part of LoggerNet).
The factory default station name is the datalogger serial number.
Right click on the stationname.ts_data file and select “Change Output
File”.
If any other parameters are later changed, CardConvert will
return to the default output file name.
• Click on the “Start Conversion” to start the conversion process
(Figure 21).
27
Page 34

Open Path Eddy Covariance System
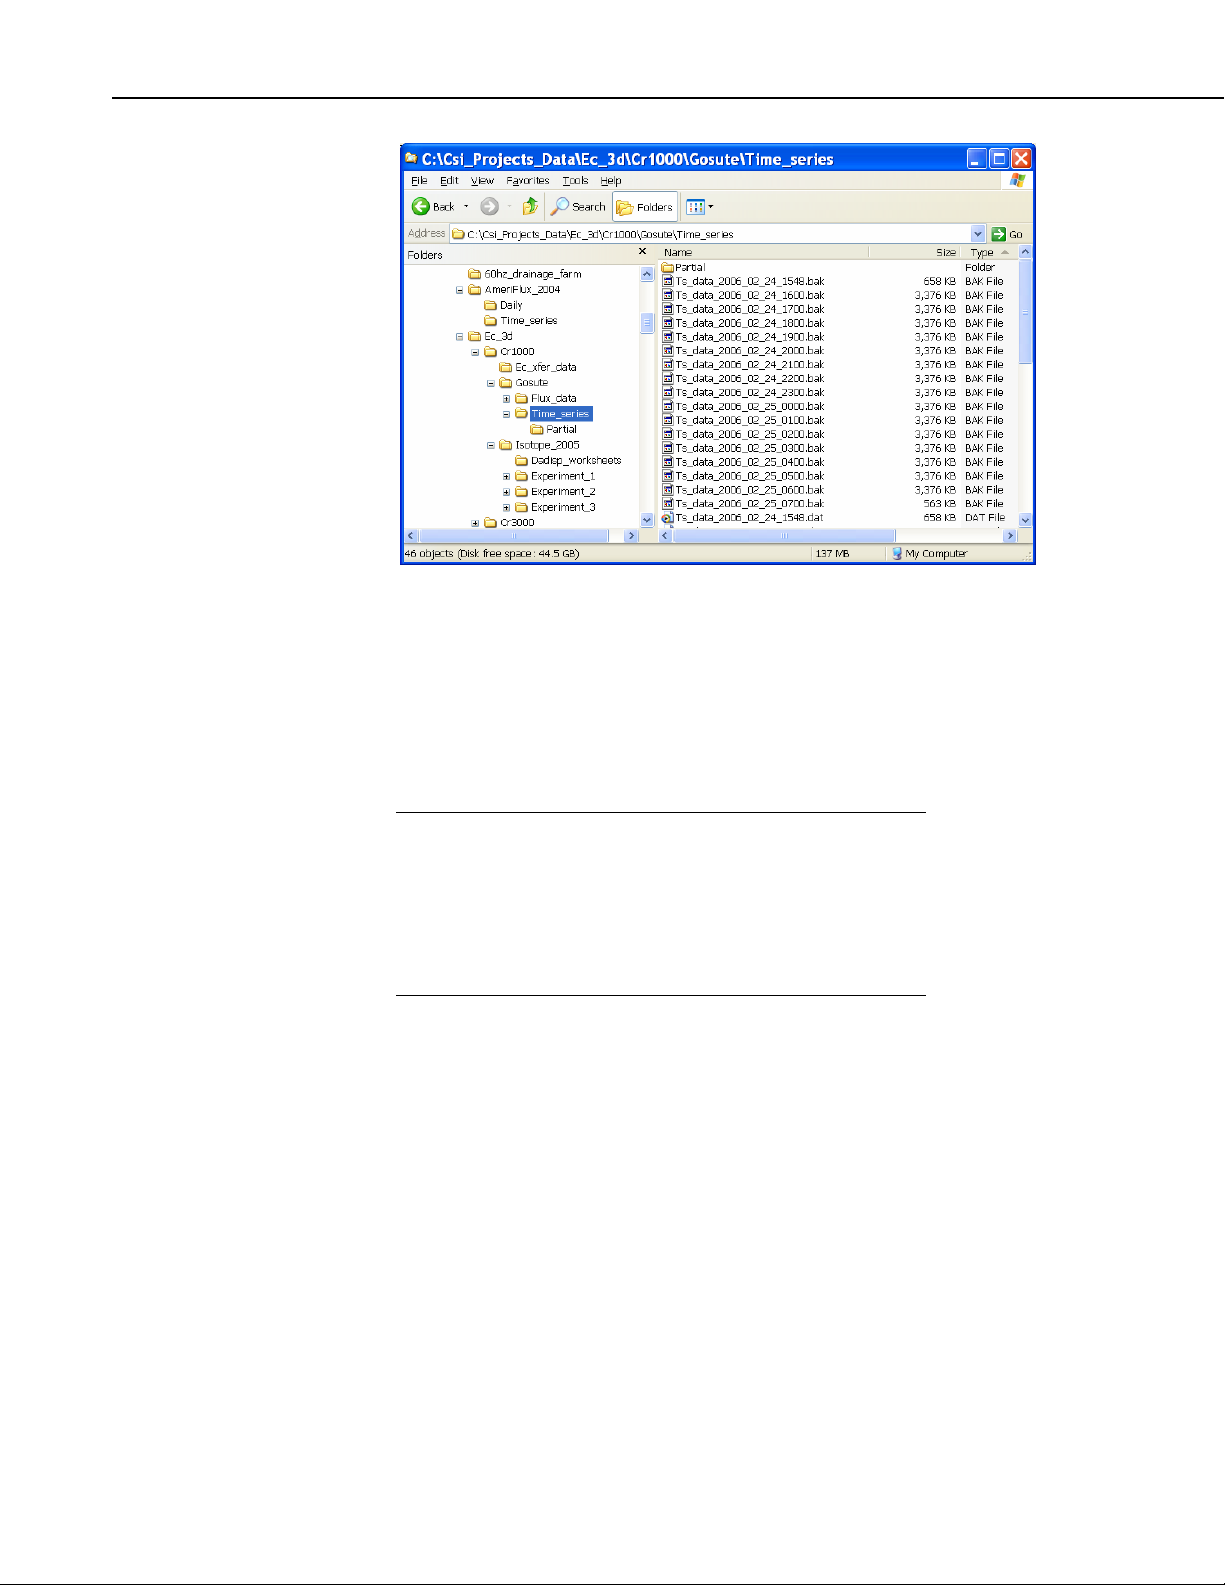
The converted files will look something like the 20 Hz files shown in Figure
22. Each file name with consist of a user specified file name and the time
stamp of the first record in each file with a one minute resolution. Note that
the first file and last file in the folder are smaller than the rest. This is because
they do not contain a complete hour of data.
FIGURE 21. Fully Configured CardConvert Start Up Screen
28
FIGURE 22. List of Files Created by CardConvert
Page 35

4.1.4.1 Collecting Data with One Card
If a single card is used to collect the data and the data on the card is not deleted
after copying it to the PC, the datalogger will append the data collected since
the card was removed to the data file on the card. This means that the next
time data is collected and converted from the PC/CF card, the last file in Figure
22 will contain a complete hour of data.
Before collecting data for the second and subsequent time, rename the last
partial file from …_0700.dat to …_0700_1.dat. This will ensure that the
complete version of this file is saved to the folder.
CardConvert will not overwrite existing files within a folder. Instead, it will
append a “_n” to the filename, where n is a numeral. Figure 23 shows the
name change to duplicate files. Note that the duplicate files get mixed in with
the original files within the folder. Rename the duplicate file using a group file
renaming utility. Specifically, find and replace the text “_1.dat” with “.bak”.
Sort the files in the folder by extension and delete the “bak” files (see Figure
24).
Open Path Eddy Covariance System
FIGURE 23. List of Files Created by CardConvert with Duplicates
29
Page 36
Open Path Eddy Covariance System
FIGURE 24. List of Files Where
the Duplicate Files are Renamed to *.bak
4.1.4.2 Collecting Data with Two Cards
Data can be collected using two cards. The card in the datalogger is removed
and replaced with an empty one. The data from the original card is copied to
the computer at some later time.
NOTE
Using two or more cards is a fast and efficient method of
collecting data. Only new data is collected; however, two partial
files within a “baling” period are created. Variable file lengths
are not an issue with EdiRe, but maybe for some other post
processing software. Two partial files can be appended to one
another using a hexadecimal editor for TOB1 files or a text
editor for TOA5 files.
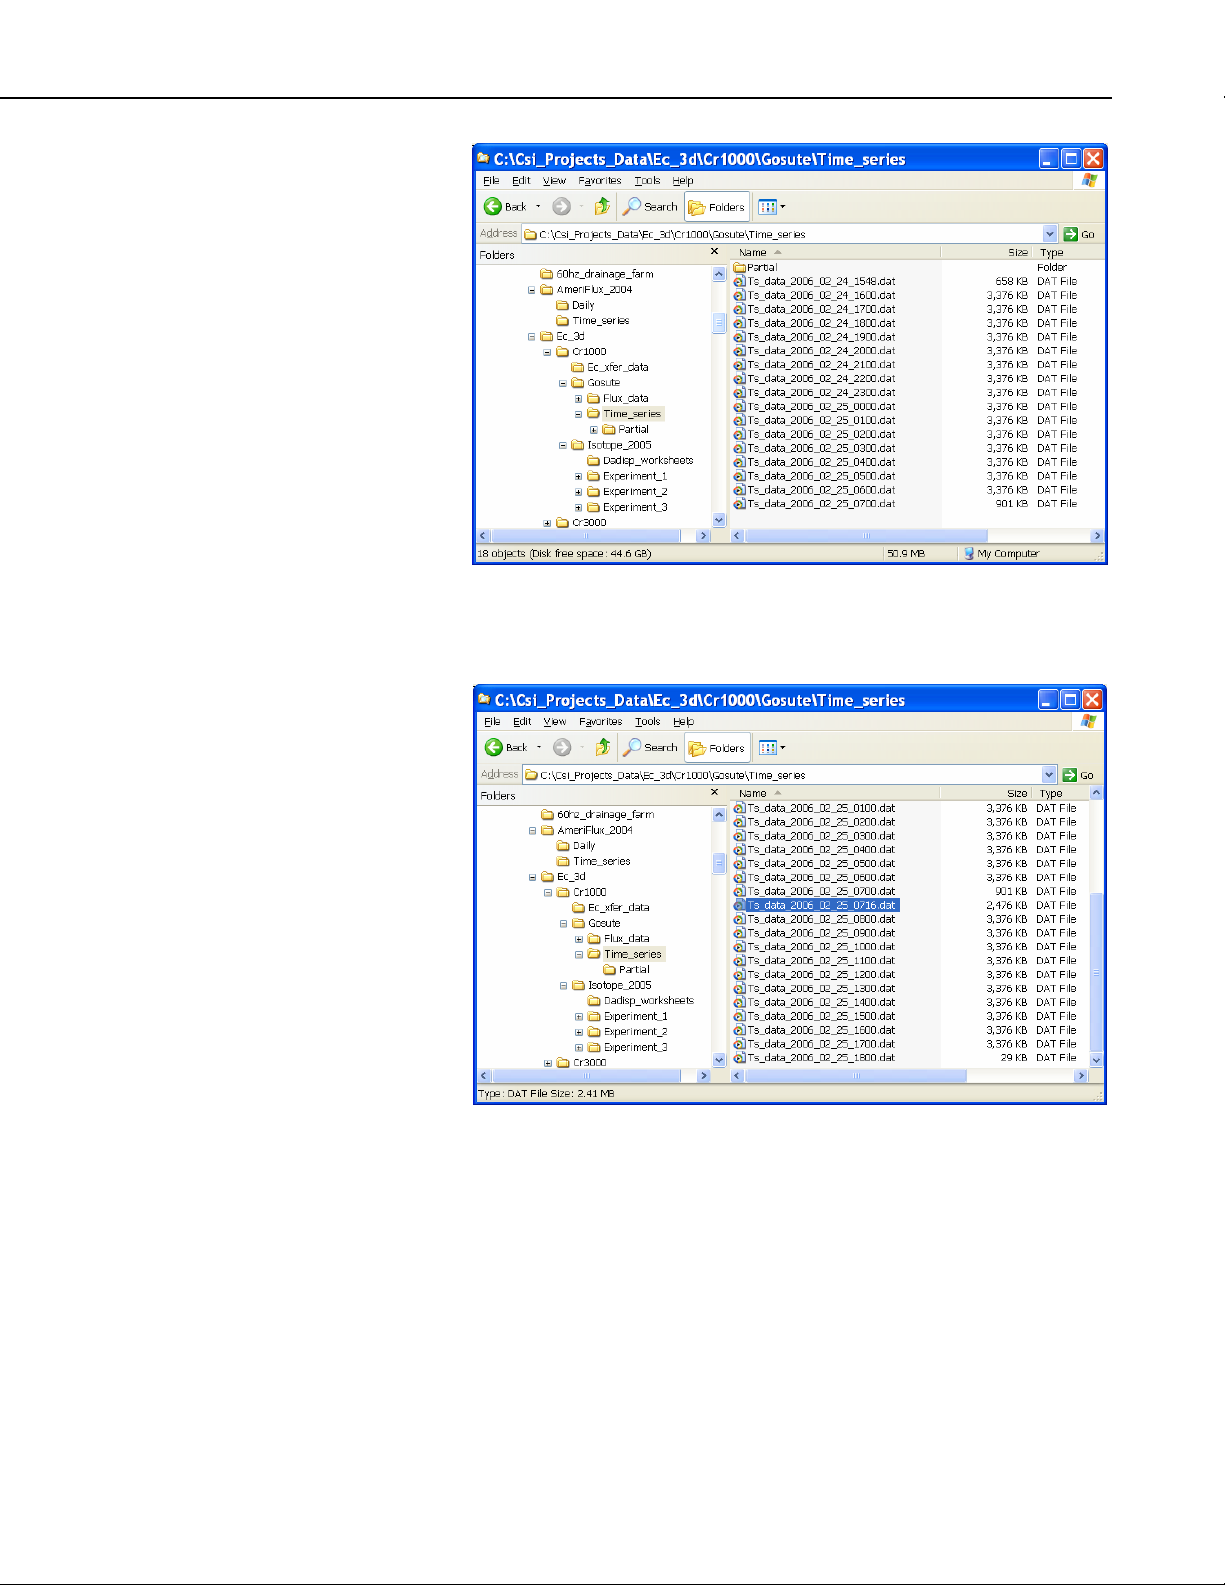
Again, note that the first and last files (Figure 25) are smaller than the rest of
the files. The next time data is retrieved from the datalogger, the file
Ts_data_2000_02_25_0700.dat will be continued in another file (see Figure
26).
30
Page 37
Open Path Eddy Covariance System
FIGURE 25. List of Files Collected the First Time Using Two Cards
FIGURE 26. List of Files Collected the Second Time Using Two Cards
4.2 Data Processing
There are several ways to process the raw time series data collected by the
system. Some of these are considered standard by the community and others
are subject to much debate. To gain a better understanding of the issues,
review the literature.
31
Page 38

Open Path Eddy Covariance System
4.2.1 Online Processing
The eddy covariance datalogger programs perform the processing listed below
online and in real time. In many cases, no further processing of the data is
required.
• Thirty minute statistics for the turbulence and meteorological
variables, these include fluxes, means, and standard deviations. The
output period can be changed by changing the Constant
OUTPUT_PERIOD.
• Compute the mean moist air density, temperature, and vapor pressure
from the HMP45C. Air density is used to compute the sensible heat
and momentum flux.
• Webb et al. (1980) term for latent heat flux and CO
separated into its two components, e.g. one term for temperature and
the other for vapor density.
• Wind direction and wind speed from the CSAT3.
• Compute the KH20 Krypton Hygrometer oxygen correction.
• Cross-products (second moments) required for an off-line coordinate
rotation following Kaimal and Finnigan (1994) and Tanner and
Thurtell (1969).
NOTE
The datalogger programs do not apply a coordinate rotation to
the data.
4.2.2 Off-line Processing with EdiRe
EdiRe is a powerful and flexible software package for processing eddy
covariance data collected by a Campbell Scientific, Inc. system. Best of all, it
is available at no charge from the University of Edinburgh’s ftp site
(http://www.geos.ed.ac.uk/abs/research/micromet/EdiRe/Downloads.html).
EdiRe can, using the Interpreter, read TOB1 data files. EdiRe will sort the
input data files by date and time, and can deal with files that are not the same
size, e.g. collected using two cards.
flux. This term is
2
32
Some of the available EdiRe processing functions are:
• Statistics for the turbulence and meteorological variables, these
include means, standard deviations, and covariances.
• Filtering the data (detrending, recursive, FIR, exponential).
• Spatial separation correction or maximum covariance.
• Coordinate rotation (mean vertical wind = 0 or planar fit).
• Spectral analysis.
Page 39

• Wavelet analysis.
Open Path Eddy Covariance System
NOTE
• Webb et al. (1980) term for latent heat flux and CO
flux. This term is
2
separated into its components due to temperature and to vapor density
fluctuations.
• Wind direction and wind speed from the CSAT3.
• KH20 Krypton Hygrometer oxygen correction.
There is a certain level of complexity inherent in any software package with
EdiRe’s flexibility. At the University of Edinburgh ftp site you will find an
online user forum (http://www.geos.ed.ac.uk/abs/research/micromet/
EdiRe/EdiReForum/), FAQ (http://www.geos.ed.ac.uk/abs/research/
micromet/EdiRe/Help_information.html), and tutorials (http://www.geos.ed.
ac.uk/abs/research/micromet/EdiRe/Tutorials/).
Along with the information on the University of Edinburgh’s ftp site, see the
EdiRe online help and the Campbell Scientific, Inc. Application Note on using
EdiRe. EdiRe lends itself to experimentation. The best way to learn how to
use EdiRe is to experiment with it.
EdiRe is not a Campbell Scientific, Inc. product. Campbell
Scientific, Inc. provides limited support of EdiRe, specifically in
reading in TOB1 data files. If further support is required, contact
the support personnel listed at http://www.geos.ed.ac.uk/
abs/research/micromet/edisol/edicontact.htm.
4.2.2.1 Creating Raw File Format and Processing Lists
Start EdiRe, select the Processing|Interpreter menu. Fill out the Interpreter
screen as shown in Figure 27. In the “Sample file” pull down menu, navigate
to the folder that contains the raw time series data and select one of the TOB1
files (Figure 28). Do the same for the “Format list file name” and “Processing
List file name”. After the Interpreter screen is filled out, it should look
something like Figure 29. Now click on the “Create” button.
EdiRe will estimate the data collection frequency and display this estimate in a
pop-up window. The estimate will be wrong because EdiRe includes the
header information as data records in the file. Enter the correct data collection
frequency (Figure 30). Now, click on “OK” and then “OK” again. EdiRe will
create and load the format and processing lists.
33
Page 40

Open Path Eddy Covariance System
FIGURE 27. Interpreter Settings to Read
a Campbell Scientific, Inc. TOB1 Data File
34
FIGURE 28. Folder that Contains the Raw TOB1
Time Series Data Files
Page 41

Open Path Eddy Covariance System
FIGURE 29. Competed Interpreter Screen
FIGURE 30. Estimated Sample Frequency and
Correct Sample Frequency
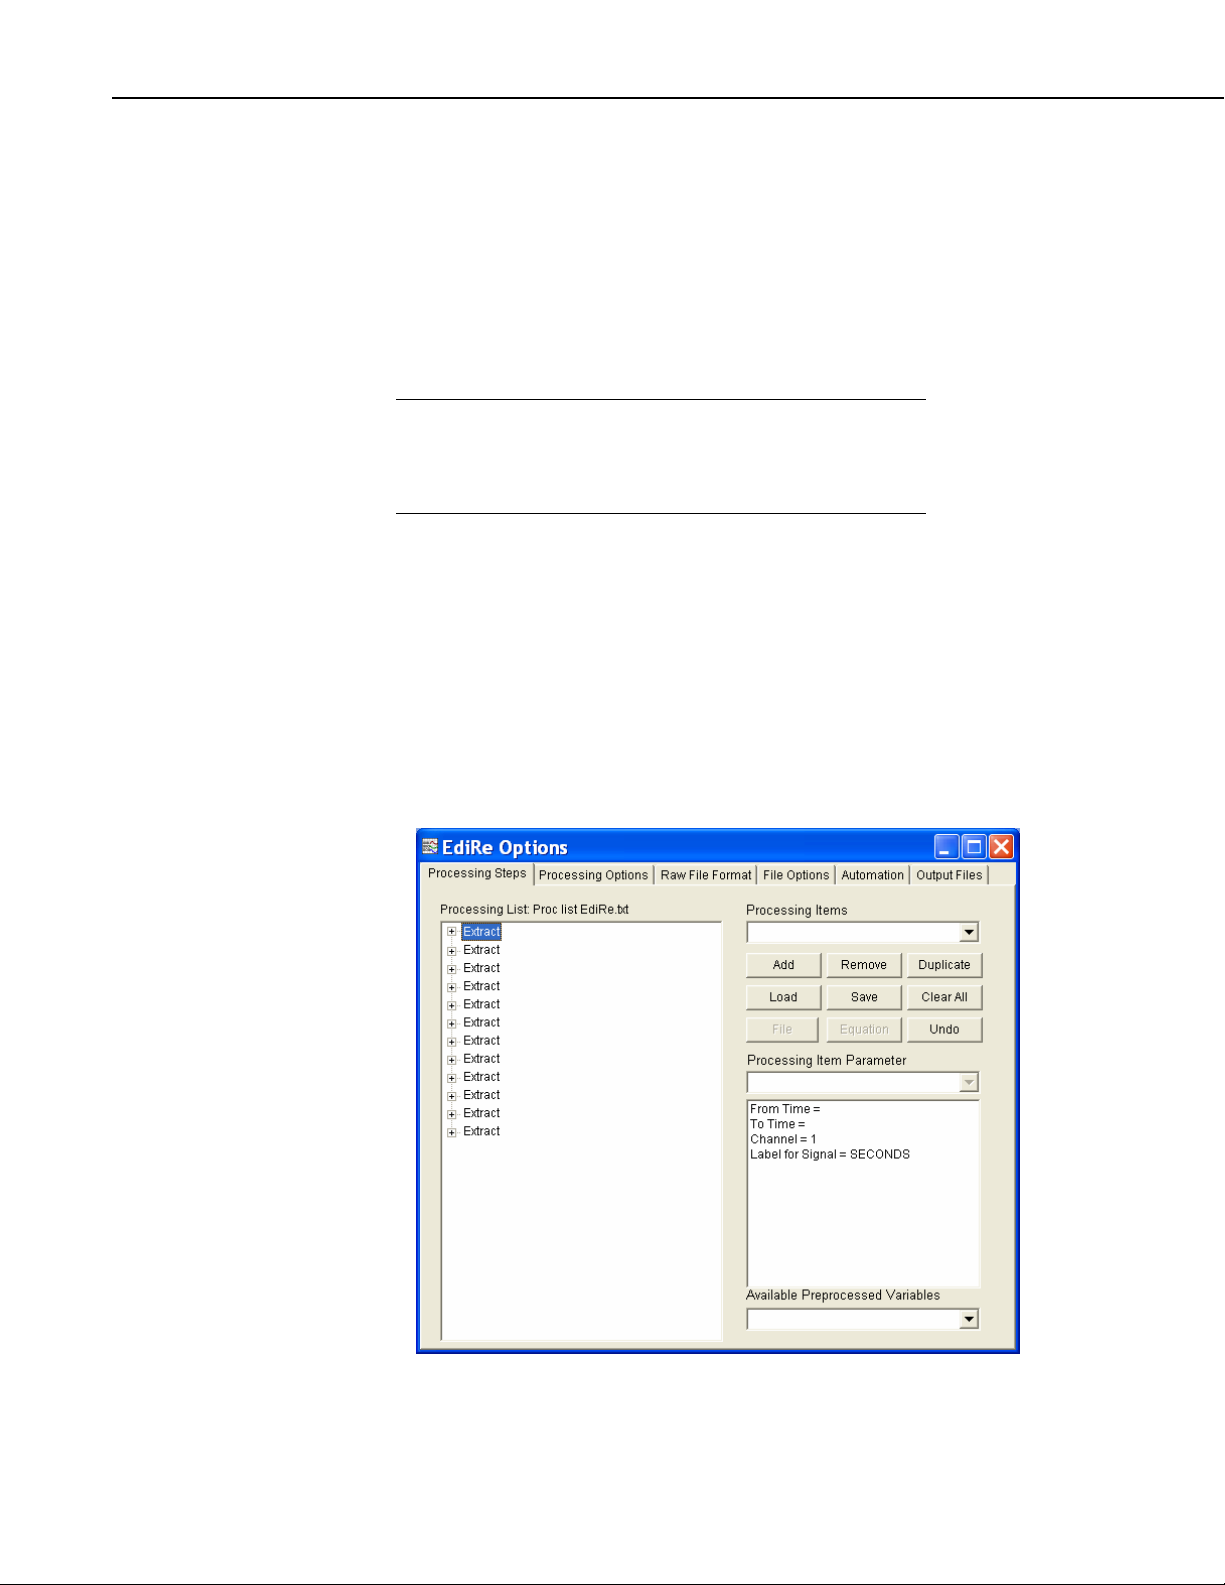
4.2.2.2 Example EdiRe Raw File Format and Processing Lists
To view the Lists in EdiRe, select the Processing|Options menu. The “Raw
File Format” list. The default “Processing Steps” list must be modified for
your specific application.
35
Page 42
Open Path Eddy Covariance System
The Processing Steps list has the default instructions needed to extract the data
from the TOB1 file (Figure 31). Additional instructions can be found in the
“Processing Items” list. To configure the instruction, select the instruction
parameter and enter values either from the “Processing Item Parameter” pull
down menu, or enter output variable names in the “Processing Item Parameter”
field using the keyboard.
The location of the output files, as comma separated values, can be specified in
the “Output Files” tab or as part of the processing list with the “Location
Output Files” instruction (Figure 32).
TIP
Campbell Scientific, Inc. recommends incorporating the output
file destination as part of the processing list rather than changing
the output file name in the “Output File” tab. This will prevent
the accidental merger of results from multiple stations.
The mean and standard deviation of a variable is found using the “1 Chn
Statistics” instruction, covariances and fluxes are found using the “2 Chn
Statistics” instruction. The results of the processing can be plotted with the
“Plot Value” instruction, see Figures 33 through 35.
Other useful instructions are: Rotation Coefficients, Rotation, Remove Lag,
Cross Correlate, Wind Direction, Raw Subset, Set Value, Comments, User
Defined, User Defined Fast, and Webb Correction. For additional information
on EdiRe and its use, see the online help and the EdiRe application note
published by Campbell Scientific, Inc.
36
FIGURE 31. Default EdiRe Processing List Created by the Interpreter
Page 43

Open Path Eddy Covariance System
FIGURE 32. Output File Location as Part of the Processing List
FIGURE 33. Output File Location as Part of the Processing List
37
Page 44

Open Path Eddy Covariance System
FIGURE 34. Processing U
and CO2 with 1 Chn Statistics Instruction
z
38
FIGURE 35. Computing CO
Graphing U
Statistic with Plot Value Instruction
z
Flux with 2 Chn Statistics and
2
Page 45
5. Eddy Covariance Theory 101
Open Path Eddy Covariance System
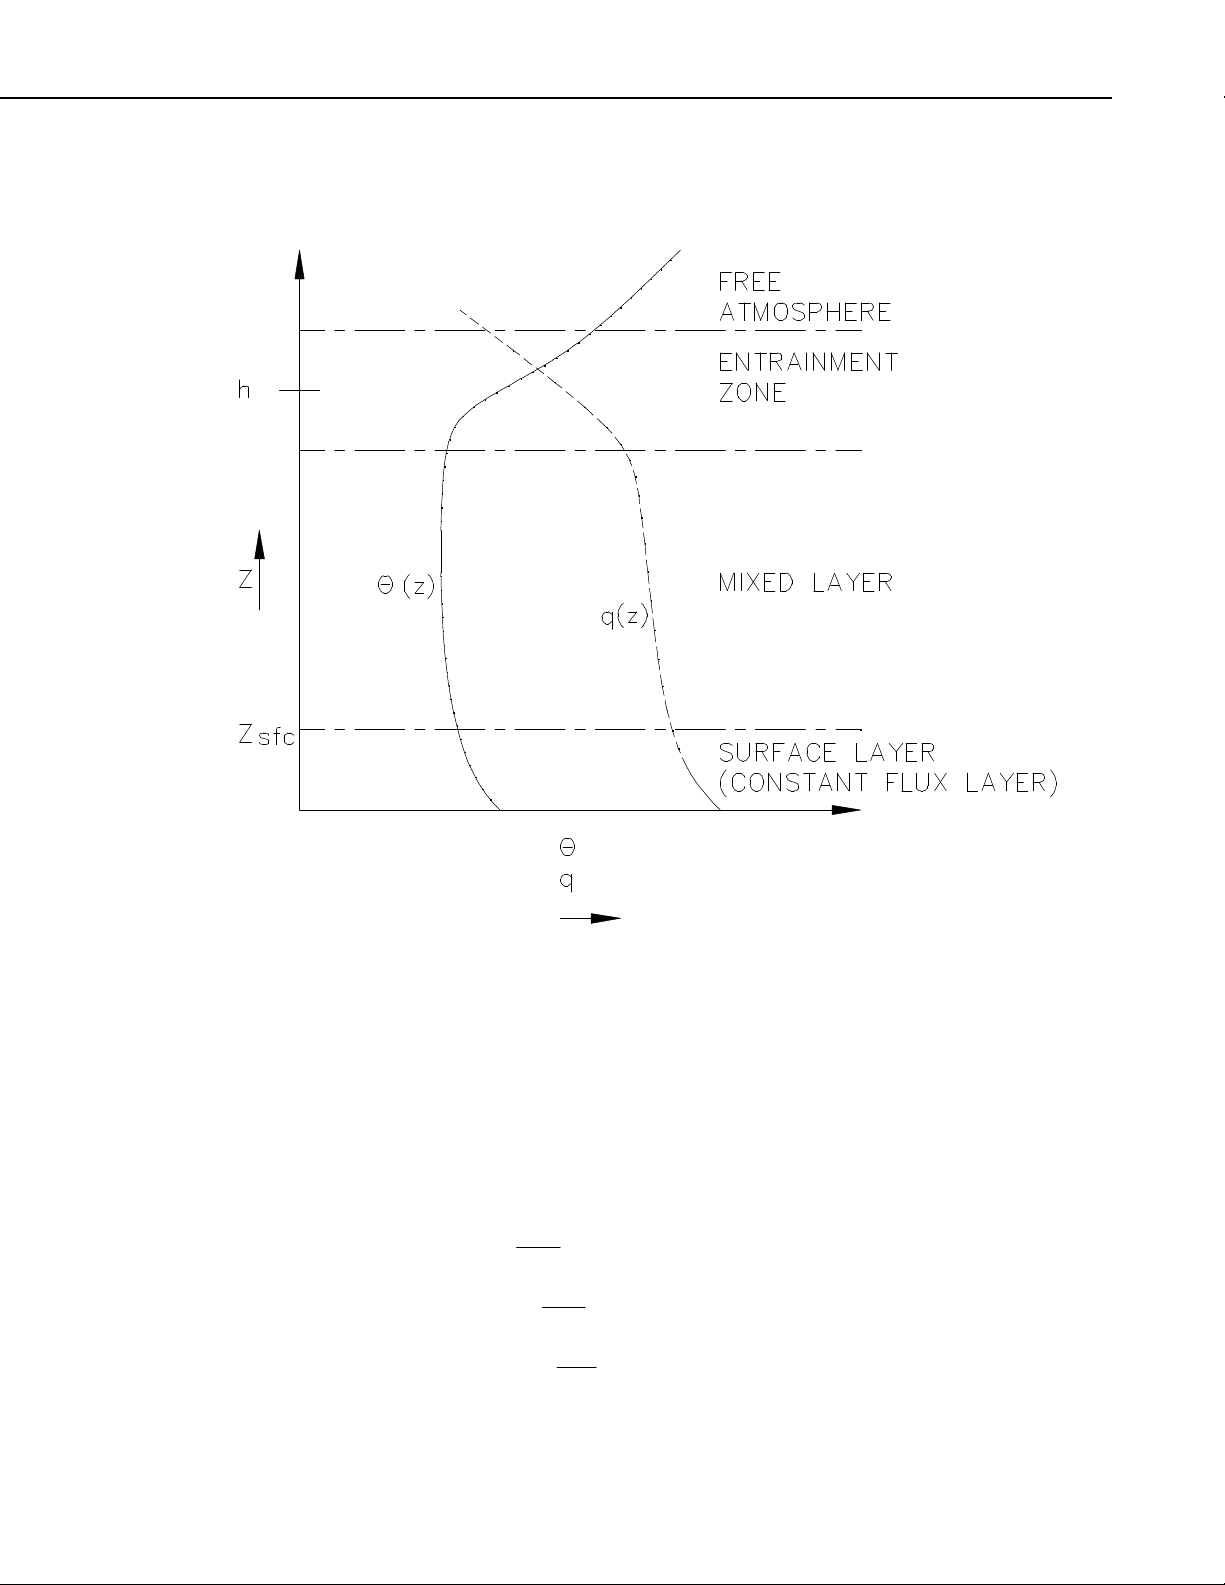
FIGURE 36. Ideal Vertical Profiles of Virtual Potential Temperature and Specific Humidity Depicting
All the Layers of the Atmospheric Boundary Layer.
The surface layer (Figure 36) is comprised of approximately the lower 10% of
the atmospheric boundary layer (ABL). The fluxes of water vapor and heat
within this layer are nearly constant with height when the following criteria are
met: the surface has approximate horizontal homogeneity; and the relationship
z/h << 1 << z/z
is true, where z
om
height of the ABL, and z
is the roughness length of momentum. When the
om
is the height of the surface layer, h is the
sfc
above conditions are met, the flux of carbon dioxide, water vapor and heat,
within the surface layer, may be written as:
UF′′=
ρ
(1)
zcc
ULLE′′=
ρ
(2)
zvv
UTCH′′=
ρ
(3)
zpa
39
Page 46

Open Path Eddy Covariance System
′
+
where F
is the carbon dioxide flux,
c
carbon dioxide density from the mean,
vertical wind speed from the mean, LE is the latent heat flux, L
heat of vaporization,
ρ′
is the instantaneous deviation of the water vapor
v
density from the mean, H is the sensible heat flux,
the heat capacity of air at a constant pressure, T
ρ′
is the instantaneous deviation of the
c
U
is the instantaneous deviation of
z
is the latent
v
ρ
is the density of air, Cp is
a
′
is the instantaneous deviation
of air temperature from the mean (Stull, 1988; Massman et al., 2004).
The quantities
′′
U
ρ
zc
′′
,
U
ρ
, and,
zv
′′
UT
are the covariances between vertical
z
wind speed and carbon dioxide density; vertical wind speed and vapor density;
and vertical wind speed and temperature. These quantities are computed online
by the CRBasic datalogger as are the cross products (second order moments)
required to apply a post processing coordinate rotation following Kaimal and
Finnigan (1994) and Tanner and Thurtell (1969).
The eddy covariance system directly measures latent and sensible heat flux. If
net radiation and soil heat flux are also measured, energy balance closure may
be examined using the surface energy balance equation:
LEHGR
=− (4)
n
where R
defined as positive away from the surface and R
F
is the net radiation and G is the total soil heat flux. H, LE, and G are
n
is positive toward the surface;
n
is defined, following the micrometeorological sign convention, as positive
c
away from the surface.
If a FW05 finewire thermocouple is not part of the system, the sensible heat
flux (H
) can be computed from the sonic sensible heat flux (Hs) and the latent
c
heat flux (LE) with equation (5). Appendix B gives a detailed derivation of
equation (5).
⎡
⎢
−=
CHH
ρ
⎢
⎣
psc
2
LE
L
⎤
T
⎥
(5)
⎥
T
v
s
⎦
TR
51.0
d
P
40
Page 47
Appendix A. CSAT3 Orientation
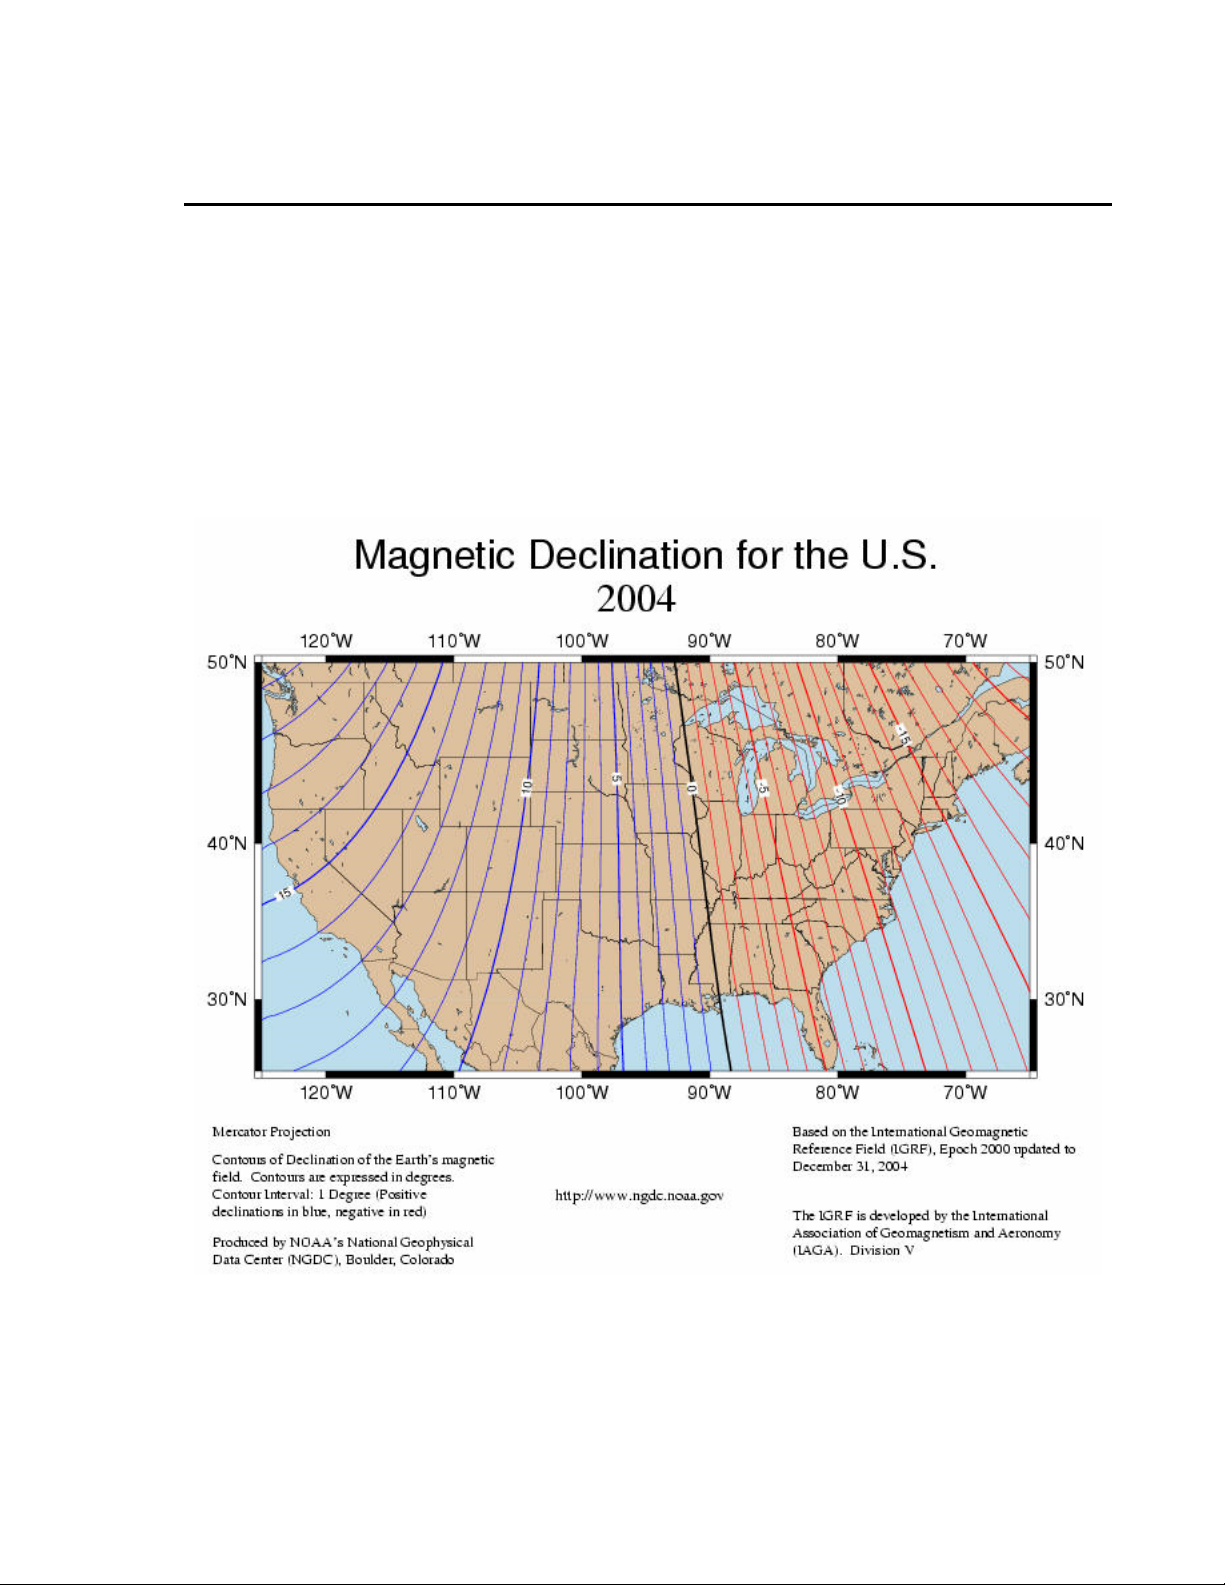
A.1 Determining True North and Sensor Orientation
The orientation of the CSAT3 negative x-axis is found by reading a magnetic
compass and applying the site-specific correction for magnetic declination;
where the magnetic declination is the number of degrees between True North
and Magnetic North. Magnetic declination for a specific site can be obtained
from a USGS map, local airport, or through a NOAA web calculator (Section
A.2). A general map showing magnetic declination for the Conterminous
United States in 2004 is shown in Figure A-1.
FIGURE A-1. Magnetic Declination for the Conterminous United States (2004)
A-1
Page 48

Appendix A. Sensor Orientation
Declination angles are always subtracted from the compass reading to find
True North. A declination angle East of True North is reported as positive a
value and is subtracted from 360 (0) degrees to find True North as shown
Figure A-2. A declination angle West of True North is reported as a negative
value and is also subtracted from 0 (360) degrees to find True North as shown
in Figure A-3. Note that when a negative number is subtracted from a positive
number, the resulting arithmetic operation is addition.
For example, the declination for Longmont, CO (10 June 2006) is 9.67°, thus
True North is 360° - 9.67°, or 350.33° as read on a compass. Likewise, the
declination for Mc Henry, IL (10 June 2006) is -2.68°, and True North is
0° - (-2.68°), or 2.68° as read on a compass.
FIGURE A-2. A Declination Angle East of True North (Positive) is
Subtracted from 360 (0) degrees to Find True North
FIGURE A-3. A Declination Angle West of True North (Negative) is
Subtracted from 0 (360) degrees to Find True North
A-2
Page 49
Appendix A. Sensor Orientation
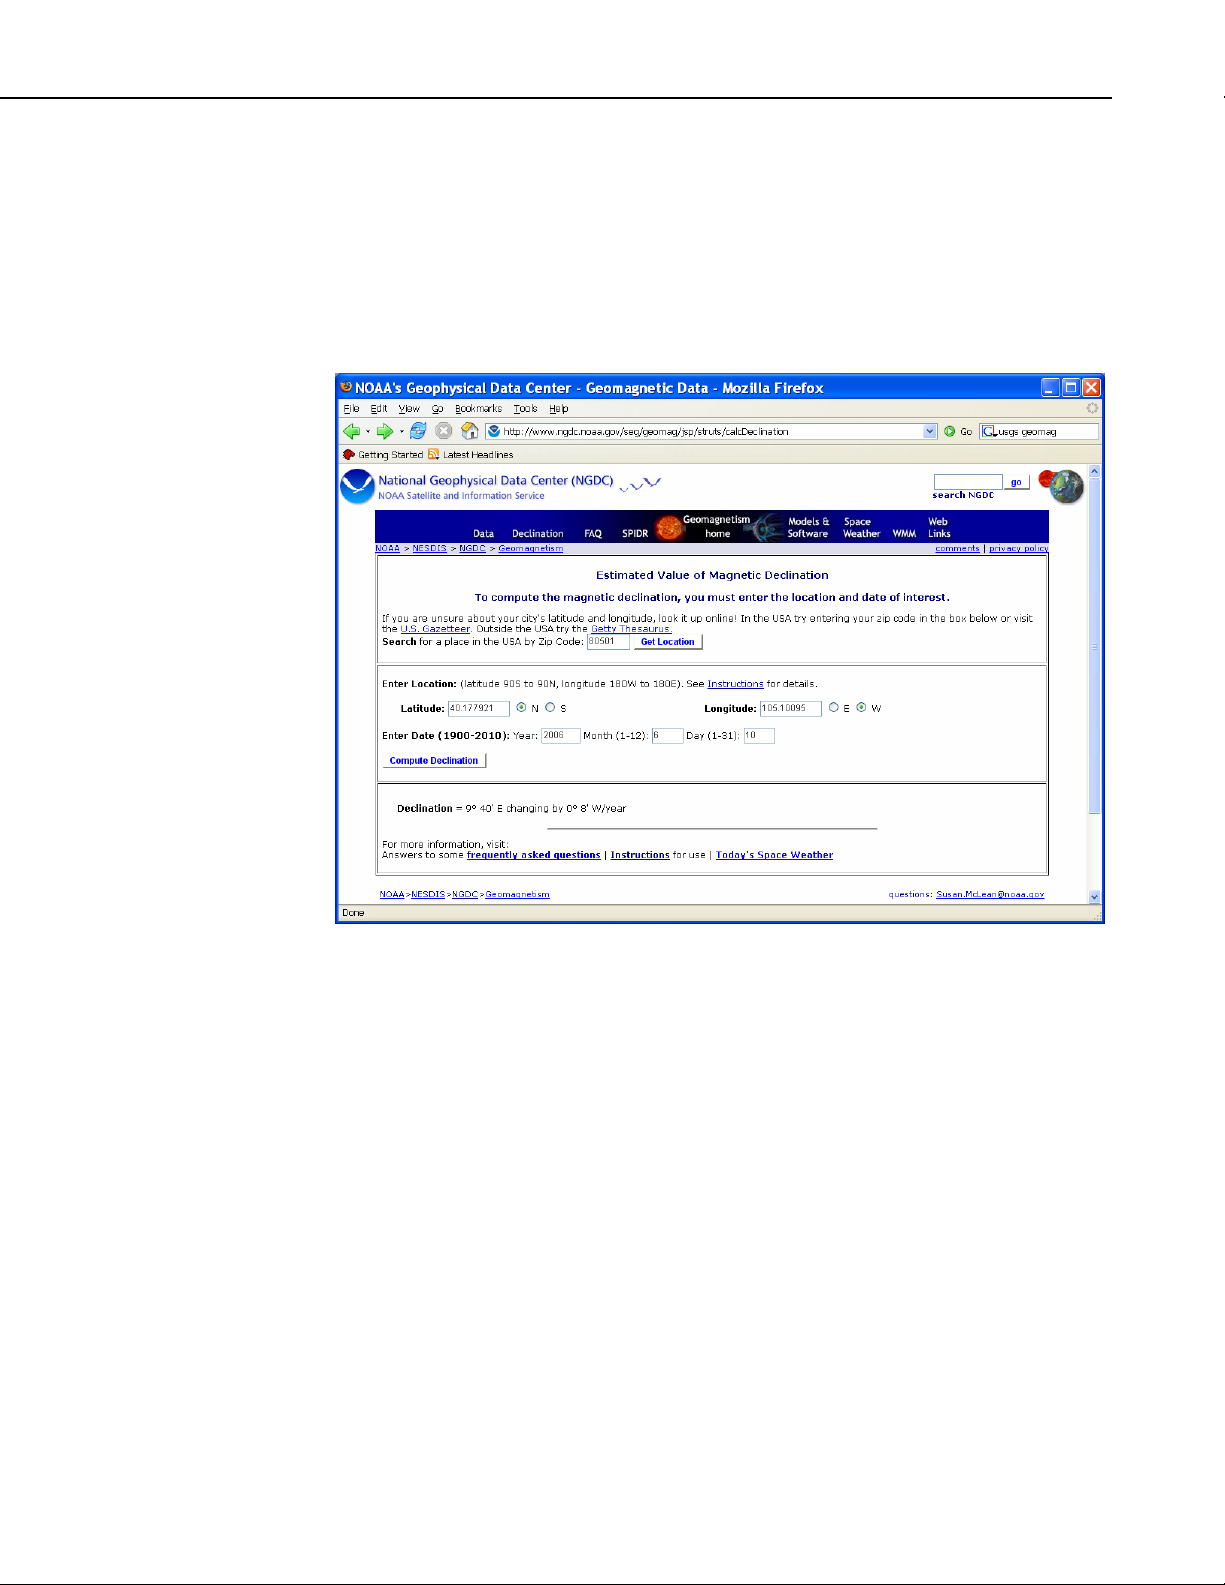
A.2 Online Magnetic Declination Calculator
The magnetic declination calculator web calculator published by NOAA’s
Geophysical Data Center is available at the following url
http://www.ngdc.noaa.gov/seg/geomag/jsp/struts/calcDeclination. After the
web page loads, enter the site zip code, or longitude and latitude, then click on
the “Compute Declination” button (Figure A-4).
FIGURE A-4. Online Magnetic Declination Calculator with Inputs and
Output for Longmont, CO.
The declination for Longmont, CO is 9.67 degrees (10 June 2006). As shown
in Figure A-4, the declination for Colorado is positive (east of north), so true
north for this site is 360 - 9.67, or 350.33 degrees. The annual change is -8
minutes/year or 8 minutes west per year.
A-3
Page 50

Appendix A. Sensor Orientation
This is a blank page.
A-4
Page 51

Appendix B. Sensible Heat Flux without
v
()(
()(
(
dvd
v
a FW05
B.1 Speed of Sound and Sonic Temperature
In the following section the speed of sound will be expressed as a sonically
measured temperature. The effects of humidity, on the speed of sound, will be
combined into this temperature.
This temperature, T
sonic temperature and is related to the speed of sound by two well known
constants.
The speed of sound (c) is defined by:
P
2
c
=
γ
(B-1)
, is defined as the sonic virtual temperature or simply the
s
ρ
C
where P is atmospheric pressure,
the ratio of the specific heats of moist air. The specific heats of moist air can
be written as:
CqC qC C q
=+− =+11084. (B-2)
pp pp
CqC qC C q
vv vv
where q is the specific humidity of air, the subscript p means constant pressure,
v means constant volume, w means water vapor, and d means dry air.
The ideal gas law can be written as:
wdd
=+− =+11094. (B-3)
wdd
ρ
is the density of moist air, and
)
)
p
γ
=
is
C
PRT RT q
== +
ρρ
where R
temperature in Kelvin, and T is the air temperature in Kelvin.
Substitute Equation (B-4) into Equation (B-1) to write the speed of sound as a
function of temperature and humidity.
c
The term, γ, is a function of specific humidity. To move humidity into a single
term, substitute Equations (B-2) and (B-3) into (B-5).
is the gas constant for dry air (287.04 J K-1 kg-1), Tv is the virtual air
d
C
p
2
C
()
RT q
d
1061. (B-4)
1061=+. (B-5)
)
B-1
Page 52

Appendix B. Sensible Heat Flux without a FW05
(
(
s
(
′
=
sss
()(
(
C
()
1084
+
p
2
c
d
C
v
d
.
()
1094
+
.
Expand and collect terms.
q
q
()
1061=
RT q
d
+
.
(B-6)
C
p
2
c
d
=
C
v
d
1 145 0 5124
++
RT
d
..
()
Multiply the above by
qq
1094
+
.
1094
−−..q
()
1094
2
)
(B-7)
q
)
and ignore the second and third order
q
terms.
C
p
2
d
c
C
TT q
=+1051.
C
γ
==14. (B-8c)
d
C
()
1051=+=.
RT q RT
ddds
v
d
()
p
d
v
d
(B-8b)
γ
(B-8a)
B.2 Sonic Temperature, Temperature, and Humidity
In the following section define T, q, Ts, and w in terms of an instantaneous
value, a mean, and a deviation from the mean, where w is the vertical wind in
the natural wind coordinates.
Recall the rules of Reynolds averaging.
AAA AAAA=+′=+′=+
()
)
The only way the Equation (B-9) is true is if
Write the instantaneous T, q, w and T
TTT=+
qqq=+
www=+
TTT
′
(B-10)
′
(B-11)
′
(B-12)
=+
′
(B-13)
′
(B-9)
A 0 .
in terms of a mean and a fluctuation.
s
Substitute Equations (B-10), (B-11), and (B-12) into (B-8b) to write the sonic
temperature in terms of temperature and specific humidity.
TTT TT qq
=+′=+′++
sss
1051. (B-14)
′
)
)
B-2
Page 53

Expand Equation (B-14).
()(
()(
(
Appendix B. Sensible Heat Flux without a FW05
TTTT Tq TqT Tq Tq
=+′=+ +
sss
0 51 0 51 0 51 0 51.. ..
′+′
+
′
+
′′
B.3 Sensible Heat and Specific Humidity Flux
In the following section write the sonic sensible heat flux as a function of
sensible and latent heat flux.
Multiply the instantaneous vertical wind by the instantaneous sonic
temperature.
′
wT w w T T
=+′+
sss
Substitute Equation (B-15) into Equation (B-16).
wT w w T T q Tq T T q T q
=+′++′+′+
s
Expand and take the time average.
s
′
+
+
Note that the following are true.
(B-16)
)
′
0 51 0 51 0 51 0 51.. .. (B-17)
′
′
+
++=
′
+
+
′′
′′
+
+
+
′
+
51.051.0 51.0 51.0
′′
+
51.051.051.0 51.0
(B-15)
′′
)
′′
qTwqTwTwqTwqTwTwwT
(B-18)
′′′
qTwqTwTwqTwqTwTw
wT wT q wT wTq
=+ =+1051 051.. (B-19)
s
′′
=−wT wT wT
ss s
Substitute Equations (B-18) and (B-19) into (B-20).
′′
wT wT wTq wTq wT wT q
s
Those terms marked with the open circle and open diamond add to zero. The
terms marked with the infinity symbol are zero by definition. Finally, assume
that the term marked with the inverted triangle is small compared to the other
terms. Thus, Equation (B-21) simplifies into Equation (B-22).
′′
wT wTq Twq wT q wT
s
Near the surface of the earth the mean vertical wind is zero (
that z-axis of the anemometer was perpendicular to the mean flow.
°◊ ∞∞ ∞
=+ +
+
051 051 051
...
+
051 051 051
.. .
=
051 051 051.. . (B-22)
)
(B-20)
051 051 051
.. .
′′+′
wTq w T w Tq wq T wT
′′
wT q wTq wT wTq
′′
+
∞∞
+
+
′′′
′′+′′
′
′
∇° ◊
−−
+
′
+
+
+
′′
′
′′
(B-21)
+
′′
w = 0), assuming
B-3
Page 54
Appendix B. Sensible Heat Flux without a FW05
s
R
R
⎛
⎞
d
v
∗
′′=′′
wT wT qwT Twq
s
+
051 051
′′
=
++
1051 051
wT q T wq
()
′′
..
+
..
′′
′′
Multiply the first term on the right hand side by
()
TT q
=+1051. .
T
′′=′′
wT wT
s
s
+
T
Twq
051.
′′
(B-24)
B.4 Sensible and Latent Heat Flux
In the following section write Equation (B-24) in terms of a water vapor
density instead of specific humidity.
The specific humidity is defined as the ratio of the mass of water vapor in a
volume of air to that of the total mass of the volume and is written as:
Me
v
m
q
v
=
mm
+
dvvdv
ρ
=
ρρ
+
=
MPe
*
RT
()
−
dv
**
T
(B-23)
T
and recall that
T
Me
v
−+
ddv
(B-25)
+
Me
=
MP Me Me
T
where m
ρ
v
is the molecular weight of water vapor, M
vapor pressure, and R
is the mass of the water vapor in the air, md is the mass of the dry air,
v
is the density of the water vapor in the air,
*
is the universal gas constant.
ρ
is the density of the dry air, Mv
d
is the molecular weight of air, e is
d
To write the specific humidity in terms of partial pressures, multiply Equation
M
d
⎜
(B-24) by
q
=
Pe eePe
−+
Since
eP<< , the specific humidity can be approximated by Equation (B-27)
ερρ
ePMMRT
q
≈= =
⎟
and note that
⎜
⎟
M
⎝
⎠
d
ε
e
ε
vdv
PM
ε
=
1 0 378.
ε
−−
()
RT
vd
P
M
v
ε
=
.
M
ε
=
e
Pe
−
(B-26)
(B-27)
Assume that any fluctuation in specific humidity is caused by a fluctuation in
vapor density. Substitute Equation (B-27) in Equation (B-24).
2
T
d
′′
w
ρ
(B-28)
P
v
′′=′′
wT wT
s
T
s
+
T
051.R
B-4
Page 55

Appendix B. Sensible Heat Flux without a FW05
v
v
ρ
Multiply Equation (B-28) by
L
v
. Where Lv is the latent heat of vaporization (Lv = 2.45 × 10⁶ J kg-1 @ 20°C).
Cp and the second term on the right hand side by
L
T
HH
s
=+
s
T
C
ρ
p
0512.
RTPLE
d
L
(B-29)
Solve Equation (B-29) for latent heat flux.
LE
=
PL
051
.
v
RT
d
⎛
⎜
′′−′′
wT wT
2
s
⎜
⎝
⎞
⎛
⎞
T
s
⎟
⎜
⎟
(B-30)
⎟
T
⎝
⎠
⎠
Assume that the system is not using a FW05 to measure temperature
fluctuations. Find the calculated sensible heat flux (H
) by solving (B-29) for
c
H.
2
⎡
⎢
−==
⎢
⎣
51.0
ρ
CHHH
psc
d
P
⎤
TR
LE
L
T
⎥
(B-31)
⎥
T
v
s
⎦
The following references were used in the above derivation: Fleagle and
Businger (1980), Kaimal and Businger (1963), Kaimal and Gaynor (1991),
Mortensen (1994), Schotanus et al. (1983), and Wallace and Hobbs (1977).
B-5
Page 56

Appendix B. Sensible Heat Flux without a FW05
This is a blank page.
B-6
Page 57

Appendix C. References
Brutsaert, W.: 1982, Evaporation into the Atmosphere, D. Reidel Publishing
Co., Dordrecht, Holland, 300.
Buck, A. L.: 1976, “The Variable-Path Lyman-Alpha Hygrometer and its
Operating Characteristics”, Bull. Amer. Meteorol. Soc., 57, 1113-1118.
Campbell, G. S., and Tanner, B. D.: 1985, “A Krypton Hygrometer for
Measurement of Atmospheric Water Vapor Concentration” Moisture and
Humidity, ISA, Research Triangle Park, North Carolina.
Dyer, A. J. and Pruitt, W. O.: 1962, “Eddy Flux Measurements Over a Small
Irrigated Area”, J. Applied Meteorol., 1, 471-473.
Fleagle, R. G. and J. A. Businger, 1980: An Introduction to Atmospheric
Physics. Academic Press, 432 pp.
Gash, J. H. C.: 1986, “A Note on Estimating the Effect of a Limited Fetch On
Micrometeorological Evaporation Measurements”, Boundary-Layer
Meteorol., 35, 409-413.
Kaimal, J. C. and J. A. Businger, 1963: A continuous wave sonic anemometer-
thermometer, J. Appl. Meteorol., 2, 156-164.
Kaimal, J. C. and Finnigan, J. J.: 1994, Atmospheric Boundary Layer Flows,
Their Structure and Measurement, Oxford University Press, New York,
289 pages.
Kaimal, J. C. and J. E. Gaynor, 1991: Another look at sonic thermometry,
Bound.-Layer Meteorol., 56, 401-410.
Massman, W., Lee, X., and Law, B. E. (eds.), 2004: Handbook of
Micrometeorology. A Guide for Surface Flux Measurements and Analysis,
Kluwer Academic Publishers, Boston, 250 pp.
Mortensen, N. G., 1994: Flow-response characteristic of the Kaijo Denki
omni-direction sonic anemometer (TR-61V), Riso-R-704(EN), Riso
National Laboratory, Roskilde, Denmark.
Schotanus, P., F. T. M. Nieuwstadt, and H. A. R. de Bruin, 1983: Temperature
measurement with a sonic anemometer and its application to heat and
moisture fluxes, Bound.-Layer Meteorol., 26, 81-93.
Schuepp, P. H., Leclerc, M. Y., MacPherson, J. I., and Desjardins, R. L.: 1990,
“Footprint Prediction of Scalar Fluxes from Analytical Solutions of the
Diffusion Equation”, Bound.-Layer Meteorol., 50, 355-373.
Shuttleworth, W. J.: 1992, “Evaporation” (Chapter 4), in Maidment (ed),
Handbook of Hydrology, Mc Graw-Hill, New York, 4.1-4.53.
Stull, R. B.: 1988, An Introduction to Boundary Layer Meteorology, Kluwer
Academic Publishers, Boston.
C-1
Page 58

Appendix C. References
Tanner, C. B. and Thurtell, G. W.: 1969, Anemoclinometer measurements of
Reynolds stress and heat transport in the atmospheric surface layer, Final
Report, United States Army Electronics Command, Atmospheric Sciences
Laboratory, Fort Huachuca, Arizona.
Tanner, B. D.: 1988, “Use Requirements for Bowen Ratio and Eddy
Correlation Determination of Evapotranspiration”, Proceedings of the 1988
Specialty Conference of the Irrigation and Drainage Division, ASCE,
Lincoln, Nebraska, 19-21 July 1988.
Wallace, J. M. and P. V. Hobbs, 1977: Atmospheric Science: An Introductory
Survey. Academic Press, 350 pp.
Warland, J. S., Dias, G. M., and Thurtell, G. W.: 2001, “A Tunable Diode
Laser System for Ammonia Flux Measurements over Multiple Plots”
Environ. Pollut., 114, 215-221.
Webb, E.K., Pearman, G. I., and Leuning, R.: 1980, “Correction of Flux
Measurement for Density Effects due to Heat and Water Vapor Transfer”,
Quart. J. Roy. Meteor. Soc., 106, 85-100.
C-2
Page 59

This is a blank page.
Page 60

Campbell Scientific Companies
Campbell Scientific, Inc. (CSI)
815 West 1800 North
Logan, Utah 84321
UNITED STATES
www.campbellsci.com
info@campbellsci.com
Campbell Scientific Africa Pty. Ltd. (CSAf)
PO Box 2450
Somerset West 7129
SOUTH AFRICA
www.csafrica.co.za
cleroux@csafrica.co.za
Campbell Scientific Australia Pty. Ltd. (CSA)
PO Box 444
Thuringowa Central
QLD 4812 AUSTRALIA
www.campbellsci.com.au
info@campbellsci.com.au
Campbell Scientific do Brazil Ltda. (CSB)
Rua Luisa Crapsi Orsi, 15 Butantã
CEP: 005543-000 São Paulo SP BRAZIL
www.campbellsci.com.br
suporte@campbellsci.com.br
Campbell Scientific Canada Corp. (CSC)
11564 - 149th Street NW
Edmonton, Alberta T5M 1W7
CANADA
www.campbellsci.ca
dataloggers@campbellsci.ca
Campbell Scientific Ltd. (CSL)
Campbell Park
80 Hathern Road
Shepshed, Loughborough LE12 9GX
UNITED KINGDOM
www.campbellsci.co.uk
sales@campbellsci.co.uk
Campbell Scientific Ltd. (France)
Miniparc du Verger - Bat. H
1, rue de Terre Neuve - Les Ulis
91967 COURTABOEUF CEDEX
FRANCE
www.campbellsci.fr
campbell.scientific@wanadoo.fr
Campbell Scientific Spain, S. L.
Psg. Font 14, local 8
08013 Barcelona
SPAIN
www.campbellsci.es
info@campbellsci.es
Please visit www.campbellsci.com to obtain contact information for your local US or International representative.
 Loading...