

Page 1
w
® ET2000 (500 SERIES) PROGRAMMING GUIDE
ET2000 (500 SERIES)
IRRIGATION CONTROLLER
PROGRAMMING GUIDE
making
ater work
since 1986
Page 2
w
TABLE OF CONTENTS
TABLE OF CONTENTS
SECTION 1: CONTROLLER DESCRIPTION
I. ET2000 KEY PAD DESCRIPTION
II. WHAT CAN BE PROGRAMMED AT EACH
SCREEN
III. USING THIS GUIDE WITH THE ET2000
CONTROLLER
SECTION 2: SETUP
A. COMMUNICATIONS
1. CONTROLLER(S) WITH CENTRAL
COMMUNICATION
B. PART & SERIAL NUMBER
C. DATE & TIME
D. STATIONS IN USE
E. 12-MONTH MODE
F. ACCESS CONTROL
SECTION 3: PROGRAMS & STATIONS
A. START TIMES AND WATER DAYS
B. STATIONS (STATION PROGRAMMING)
1. CYCLE AND SOAK EXAMPLES
2. TEST A STATION AT THE STATION
PROGRAMMING SCREEN
3. SET NO WATER DAYS AT THE
STATION PROGRAMMING SCREEN
C. STATION TO STATION COPY
1. COPY A STATION TO ANOTHER
STATION
2. COPY A STATION TO ALL STATIONS
ON A PROGRAM, OR ALL STATIONS
ON THE CONTROLLER
D. STATIONS BY PROGRAM
SECTION 4: FLOW
A. FLOW METER SETUP
1. ESTIMATED WATER USAGE
2. FMBX FLOW METER SETUP
3. REGULAR FLOW METER SETUP
4. LEARN EXPECTEDS (FLOW RATE)
B. LINE FILL & VALVE CLOSE TIMES
C. MASTER VALVE
D. PUMP
E. MAIN LINE CAPACITY
F. ON-AT-A-TIME
G. FLOW CHECKING
H. ALERT ACTIONS
SECTION 5: WEATHER
A. ET GAGE (-G OPTION)
1. ET GAGE SETUP
B. RAIN BUCKET (-RB OPTION)
1. RAIN SETUP (WITH RAIN BUCKET
INSTALLED)
2. RAIN SETUP (WITHOUT
BUCKET INSTALLED) AND YOU ARE
SHARING RAIN TO CONTROLLER
C. WIND GAGE (-WG OPTION)
1. WIND GAGE SETUP
2. RESPOND TO WIND BY PROGRAM
D. RAIN SWITCH
1. RAIN SWITCH SETUP
E. ET
1. IRRIGATE USING ET TABLE
2. USE ET AVERAGING
3. ALLOWABLE % OF HISTORICAL ET
4. CROP COEFFICIENTS
5. STATION FLOW RATES WITHOUT A
FLOW METER PRESENT
6. STATION FLOW RATES & AREA WITH
FLOW METER INSTALLED
F. BUDGET
1. DIRECTLY ENTER THE MONTHLY
BUDGETS
2. CONTROLLER WILL
AUTOMATICALLY CALCULATE THE
BUDGET AMOUNT USING THE
TOTAL SQUARE FOOTAGE AND
YOUR CITY ET
3. ENTER A YEARLY BUDGET AND
HAVE THE CONTROLLER DIVIDE IT
AMONG THE MONTHS USING YOUR
CITY ET
®
RAIN
making
ater work
since 1986
Page 3

w
® TABLE OF CONTENTS
G. MOISTURE
1. MOISTURE SENSOR SETUP
2. MOISTURE SENSOR ASSIGNMENT
3. TEST MOISTURE SENSOR
H. ET COUNTY / CITY
1. ET COUNTY / CITY SETUP
SECTION 6: REPORTS
A. THIS MONTH / LAST MONTH
B. 24 MONTH
C. HOLD-OVER
D. ET AND RAI N TABLES
1. REPORTS / ET & RAIN TABLE (ET)
2. REPORTS / ET & RAIN TABLE (RAIN)
E. ALERTS
F. STATION HISTORY
G. USE VS. BUDGET
H. LIVE SCREENS
1. IRRIGATION ACTIVITY
2. IRRIGATION DETAILS
3. REAL-TIME FLOW
SECTION 7: LIGHTS (-L OPTION)
A. PROGRAMMING A LIGHTS SCHEDULE
B. TESTING A LIGHTS CIRCUIT
SECTION 8: RADIO REMOTE (-RR OPTION)
A. ENABLE RADIO REMOTE
SECTION 9: NO WATER KEY
A. NO WATER KEY DESCRIPTION
1. TURN CONTROLLER OFF
2. APPLY NO WATER DAYS TO
PROGRAM
3. NO WATER DAYS BY STATION
SECTION 10: MANUAL KEY
A. MANUAL WATERING
1. MANUAL WATER A STATION
2. MANUAL WATER A PROGRAM
3. CYCLE AND SOAK DURING
MANUAL
B. TEST
1. LEARN THE EXPECTED (FLOW
RATE) AT A STATION
2. TEST A STATION
3. TEST A STATION MOISTURE
SENSOR (see SECTION 5
MOISTURE)
C. MV (MASTER VALVE) OVERRIDE
1. OPEN MASTER VALVE FOR
SPECIFIED TIME
2. WEEKLY SCHEDULE FOR
OPENING MASTER VALVE
D. LEARN EXPECTEDS (FLOW RATE)
E. MANUAL PROGRAM 1
F. MANUAL PROGRAM 2 (see MANUAL
PROGRAM 1)
G. WALK THRU
H. USE HOLD OVER
SECTION 11: FLOWSENSE® (-FL OPTION)
A. MULTIPLE CONTROLLER COMMUNICATION
SETUP
B. MULTIPLE CONTROLLER FLOW SETUP
1. MAINLINE CAPACITY
2. FLOW CHECKING
3. ON-AT-A-TIME
SECTION 12: (-F OPTION)
A. MULTIPLE FLOW METER SETUP
1. FMBX FLOW METER SETUP
2. REGULAR FLOW METER SETUP
3. LEARN EXPECTEDS (FLOW
RATES)
ENCLOSURES
1. ET2000 IRRIGATION CONTROLLER SCREEN
MAP
2. FLAG LETTER DEFINITION SHEET
making
ater work
since 1986
Page 4
w
SECTION 1 / I. ET2000 KEY PAD DESCRIPTION ®
SECTION 1 CONTROLLER DESCRIPTION
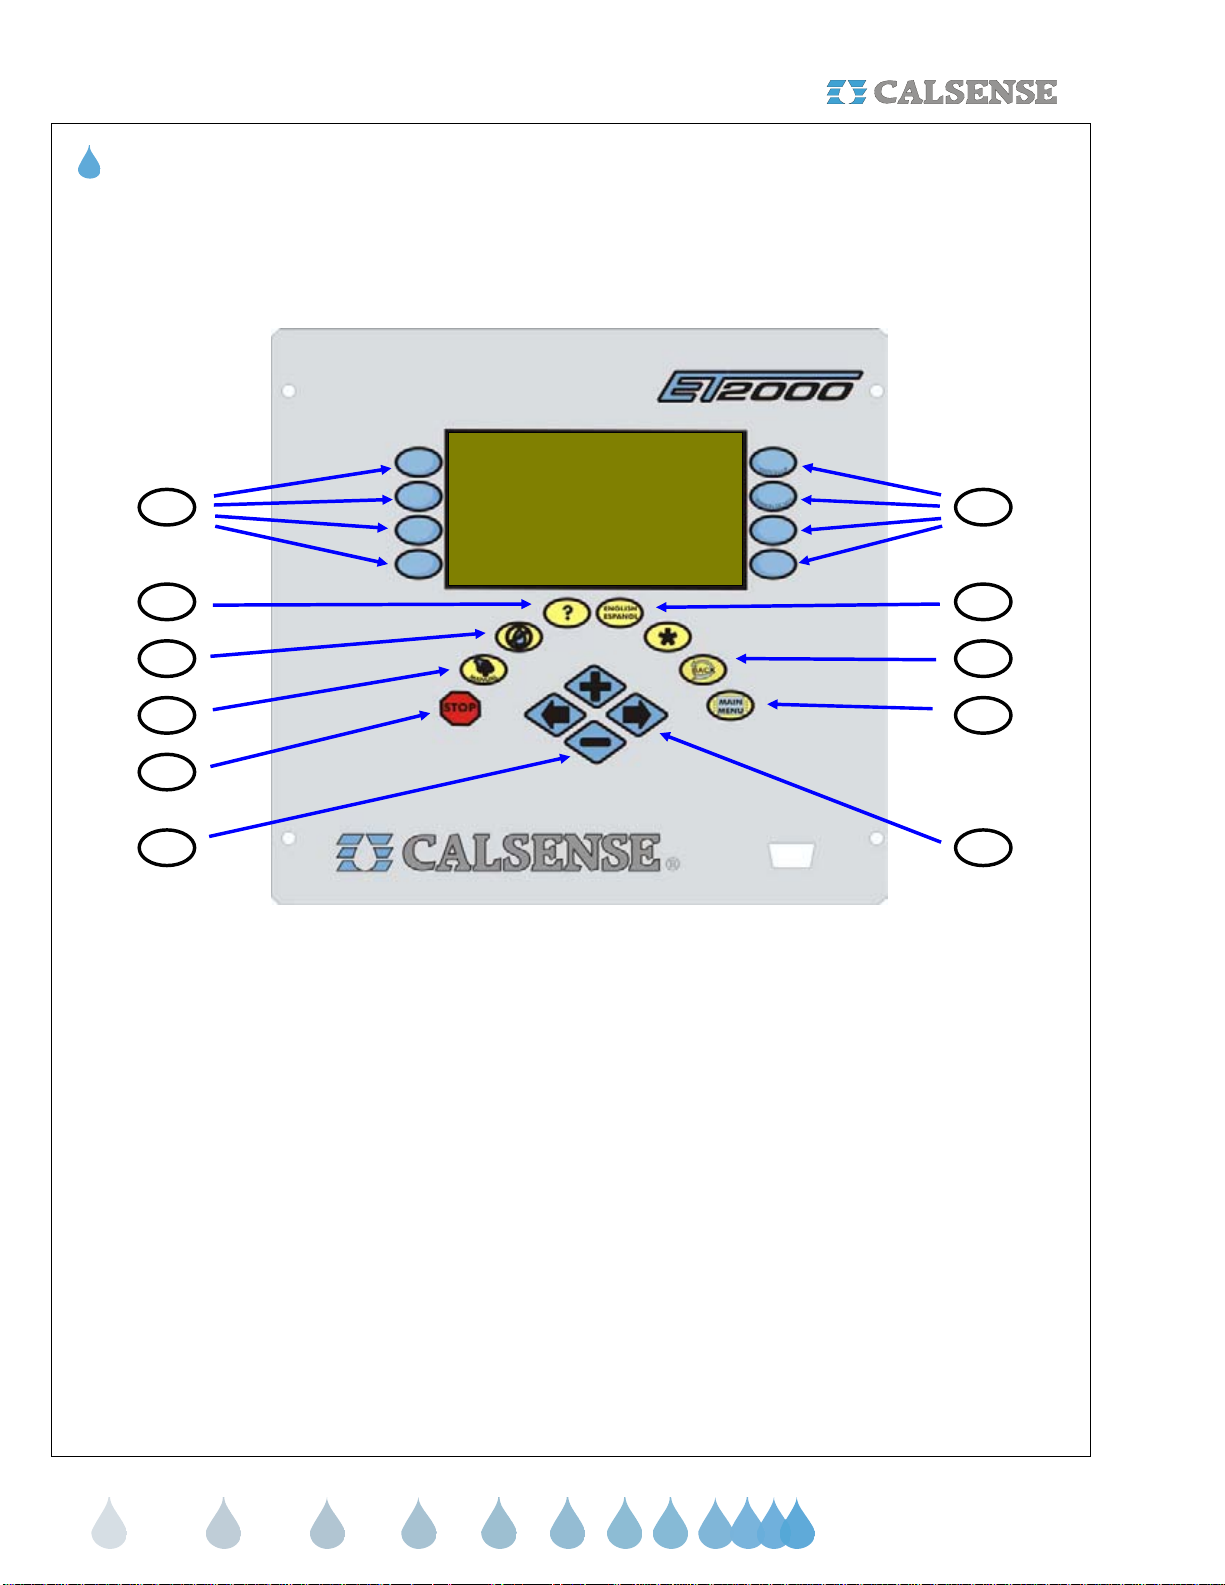
I. ET2000 KEY PAD DESCRIPTION
8
4
3
2
1
10 9
1 STOP – The STOP key will stop any currently
running Scheduled watering Cycle, Manual
Cycle, Test Cycle, Manual Programs.
2 MANUAL – The MANUAL key will perform
Manual Water, Test, Master Valve Override,
Manual Program 1 & 2, Walk-thru, and
Use Hold-over.
3 NO WATER – The NO WATER key is used for
turning the controller Off and to set No Water
Days.
4 ? – The ? key is used to access the controller
Help screens.
5 ENGLISH / ESPANOL – The ENGLISH /
ESPANOL key allows you to toggle
the displayed
text between English and Spanish.
6 BACK – The BACK key will go back to the
previous screen.
8
5
6
7
7 MAIN MENU – The MAIN MENU key is used to
access the different program features of the
controller.
8 MENU KEYS – MENU keys are used to select
the different features of commands in the
various screens. The text in the screen will point
towards the MENU key that needs to be
pressed.
9 LEFT / RIGHT ARROW KEYS – The LEFT /
RIGHT ARROW keys move the highlighted
cursor around the different screens when
setting up or editing the controller’s
features and options.
10 PLUS / MINUS KEYS – The PLUS / MINUS
keys are used to increase or decrease values
or answer Yes or No questions in the different
screens.
making
ater work
since 1986
Page 5

w
® SECTION 1 / II. WHAT CAN BE PROGRAMMED AT EACH SCREEN
Programs & Stations
Select Program
Set Program Start Time
Programs & Stations
Start Times & Water
Days
Station
Programming
Station-To-Station
Copy
Station-By-Program
Weather
ET Gage
Rain Bucket
Select Program Description (optional)
Set Number Of Water Day s in Schedule
Set Water Days
Set Program Stop Time (optional)
If 12 Month Schedule Is Enabled:
Set All The Above For Each Month Of The Year
Select Stop Time
If Not In Daily ET Mode:
Set Station Program Assignment
Set Total Minutes
Set M i n utes Per Cycle
Set Soak-In-Time
Set No Water Days
Test Station
If In Daily ET Mode:
Set Station Program Assignment
Set % ET
Set M i n utes Per Cycle
Set Area (Sq . F t. )
Set No Water Days
Test Station
Copy Statio n-To-Station
Copy Station-To-Program
View Station By Program
Move Station From Program To Program
Select Irrigation Day Window
Select To Use ET Gage
Select To Log Et Pulses
Reset Full ET Gage
Manually Set Gage Amount In Inches
Set Skip Tonight
Set Minimum Rai n
Set Maximum Hourly Rain
Set Maximum 24 Hour Rain
Set Maximum Total Rain
Set Use Of Rain By Program
Flow
Line Fill & Valve
Close Times
Alert Actions
Master Valve
Pump
Flow Meter
Mainline Capacity
On-At-A-Time
Manual Programs
Manual Water
Test
Master Valve
Override
Flow
Line Fill By Program
Valve Close By Program
Set High Flow Alert Actions By Program
Set Low Flow Alert Actions By Program
Select Type Of Master Valve
Select Use Of Pump (By Program)
Select To Use A Flow Meter
Select To Use List Or Enter Own Parameters
Set Flow Meter Size / Set Own parameters
Learn Expecteds By Program
Set Mainline Break Numbers
Set System Maximum Flow Rates
Set Valves On At A Time Within Program
Set Valves On At A Time Within
Controller / System (IF More Than One Controller)
Manual Water A Station
Manual Water A Program
Cycle And Soak During Manual
Learn The Expected At A Station
Test Station
Test Station Moisture Sensor
Open Master Valve For Hours
Weekly Schedule For Opening Master Valve
Weather
Select The Use Of Wind Gage
Wind Gage
Rain Switch
ET
Budget Select Budget By City ET
Moisture
ET County / City
Set Wind Speed For Pausing Irrigation
Set Wind Speed to Resume Irrigation
Respond To Wind By Program
Select To Use A Rain Switch Device
Select To Use Daily ET (By Program)
Select To Use ET Averaging (By Program)
Crop Coefficients In Use Setting
Select To Use A Budget
Select Budget By Square Footage
Select Budget By Monthly Direct Enter
Calculate Budget
Select To Use Moisture Sensors
Assign Sensor Slaving To Valves
Select County And City For ET
Enter Your Own ET Numbers
View Historical ET Totals
Manual Programs
Learn Expected
Manual Program 1
Manual Program 2
Walk-Thru
Use Hold-Over
Learn The Expected By Program
Schedule Water Days For Manual Program 1
Set Up To 6 Start Times For Manual Program 1
Set Run Duration From / To
Set Station Times
Schedule Water Days For Manual Program 2
Set Up To 6 Start Times For Manual Program 2
Set Run Duration From / To
Set Station Times
Set Walk Thru Count Down
Set Station Run Times
Set Walk-Thru Station Order
Begin Countdown
Select Use Hold-Over
Set Start Times For Hold-Over Use
Set Stop Time For Hold-Over Use
Select Water Days For Hold-Over
making
ater work
since 1986
Page 6
w
SECTION 1 / II. WHAT CAN BE PROGRAMMED AT EACH SCREEN
®
Setup
Select If Part Of FLOWSENSE® Chain
Communications
Part & Serial
Number
Setup
Date & Time Change Date & Time
Stations In Use
12 Month Mode Turn On Twelve Month Mode
Access Control
Select Number Of Controllers In Chain
Set Communication s Address
View Controller Information
View R.O.M. Version
View Controller Baud Rate
View Part Number
View Serial Number
View CC4 Version Required
View Expected Communication Signal Levels
View Current Date & Time
Use Day Light Savings Time
Select To Activate A Station
Select To Deactivate A Station
View Current Access Level
Enter Your Access C ode
Miscellaneous
This Month / Last
ET & Rain Tables
Reports
Station History
Use Vs. Budget
Live Screens
Month
24 Month
Hold-Over
Alerts
Reports
View Water Usage And Irrigation Time
View Yearly Water Usage & Budget Totals
View Station Hold-Over
Clear All Hold-Over
Clear Station Hold-Over
View Or Edit ET Tables
View Rain Table
View Controller Alerts
View Station History
View Actual & Expected Water Usage
Compared To Budget
View Irrigation Activity
View Irrigation Details
View Real-Time Flow
No Water
Miscellaneous
Lights
Radio Remote
Station Alerts
Controller Alerts
Status
Set Up Four Separate Lights Schedules
Manually Start Lights For 4 hours
Enable Radio Remote
View And Clear Station Alerts
View And Clear Controller Alerts
View Current Status Of Controller
View Next Scheduled Irrigation
Turn Controller ON (If It Has Been Turned OFF)
No Water
Turn Controller OFF
Apply No Water Days To Program
No Water Days By Station
No Water
making
ater work
since 1986
Page 7

w
® SECTION 1 / III. USING THIS GUIDE WITH THE ET2000 CONTROLLER
III. USING THIS GUIDE WITH THE ET2000 CONTROLLER
This guide will explain the operation and programming of the ET2000 Controller. The following describes the
conventions used throughout this guide. When instructed to press a key, the name of the key will be
CAPITALIZED AND BOLD. The illustration below shows the name and location of keys used for operating and
programming the ET2000 Controller.
MENU KEYS:
indicates the choice available and will change with each screen. The arrow will point to the Menu key that is to be
pressed, and the name of the key will be CAPITALIZED AND BOLD.
HOT KEYS:
MANUAL, NO WATER, HELP, ENGLISH / SPANISH, BACK, and MAIN MENU key.
PLUS / MINUS & ARROW KEYS:
keys. When a screen is accessed, certain information on the screen can be changed. There will be a highlighted
cursor on the screen, which you can move with either ARROW key. A change can only be made to a setting while
it is highlighted by the cursor. Once a setting is highlighted, use the PLUS or MINUS key to make the change. If
the setting is a number, you can quickly scroll to the desired setting by holding down the PLUS or MINUS key.
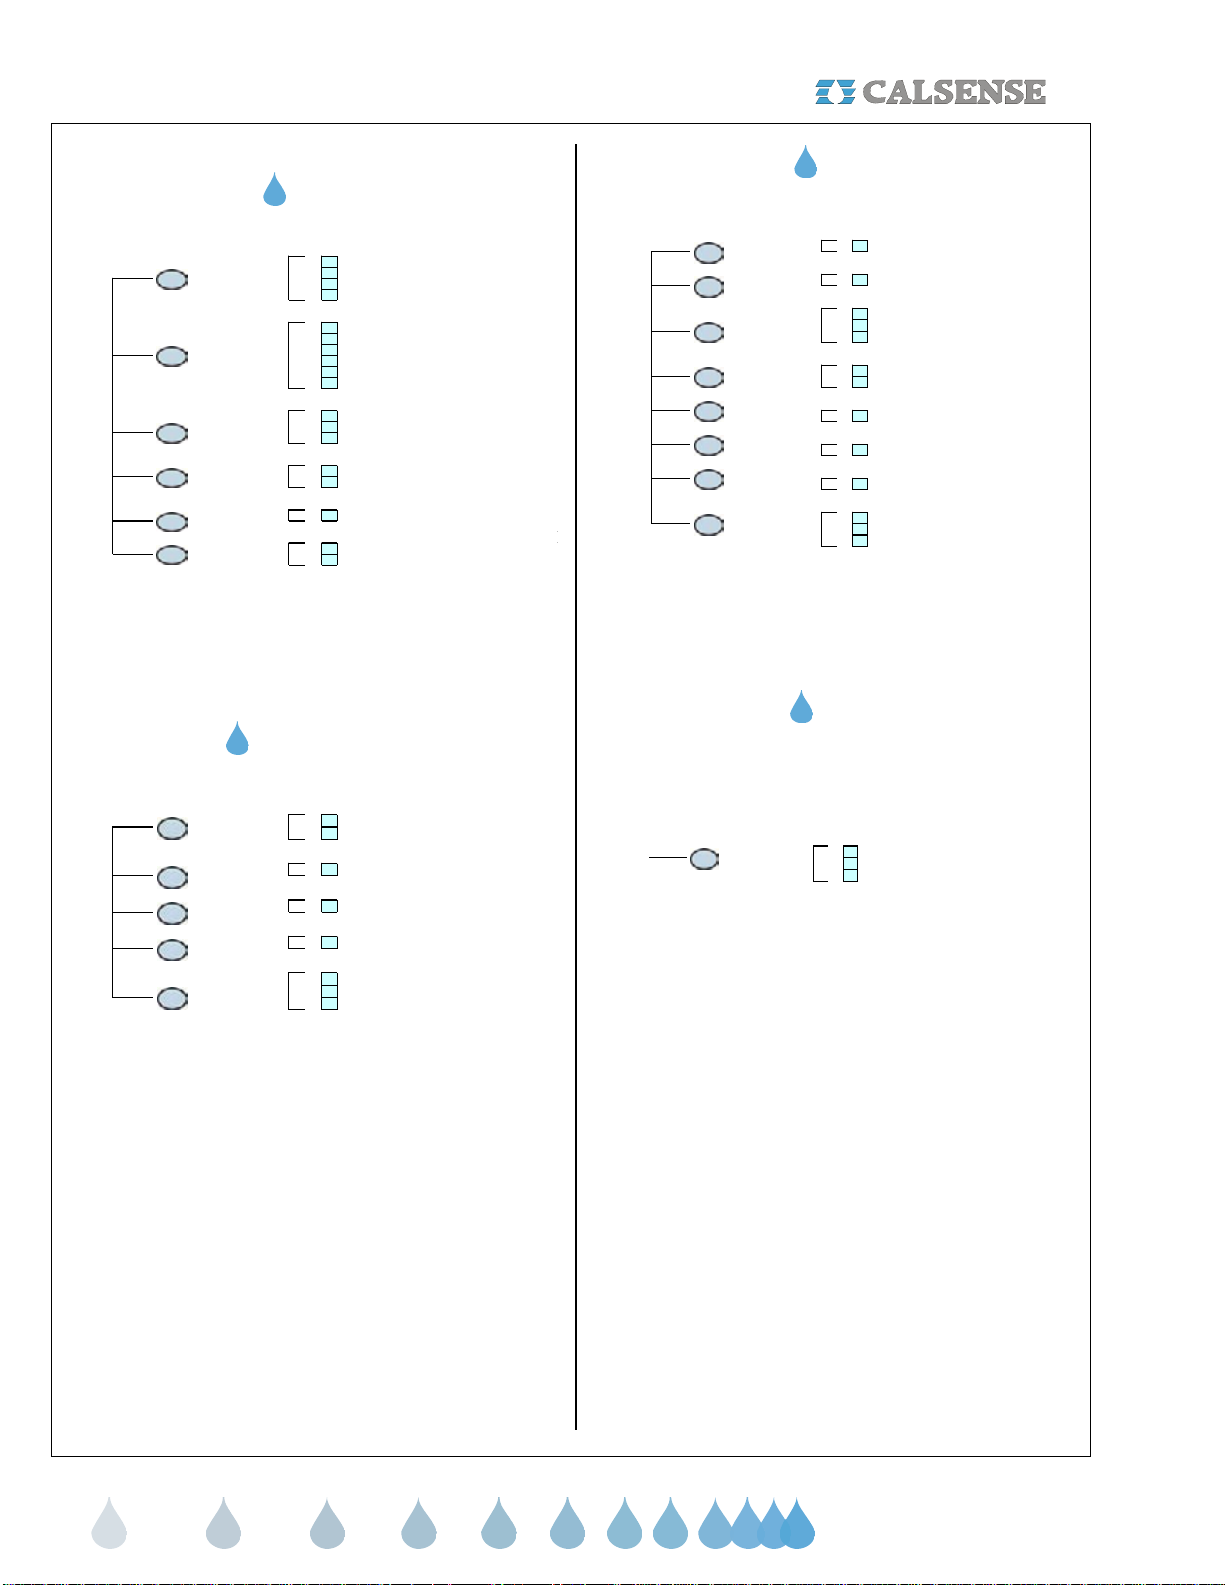
The Controller’s screen in the illustration below shows the Main Menu, which can be accessed at any time by
pressing the MAIN MENU key. The description on the screen with the arrows, point to the Menu keys which can
be pressed to access the various parts of the controller’s programming (See Enclosure 1 ET2000 IRRIGATION
CONTROLLER SCREEN MAP). You can always return to a previous screen by pressing the BACK key.
The eight (8) blue keys located on either side of the controller screen. The text next to the key
The eight (8) keys in a horseshoe shape directly below the display screen. They are the STOP,
The last four (4) keys are the PLUS key, MINUS key and the two (2) ARROW
Month UP key
Month DOW N key
Menu keys
Help key
No Wate r k ey
Manual key
Stop key
Menu Key Name Controller Screen Showing M ain Menu
CALSENSE WATER MAN A G EMENT SYSTEM
Programs & Stations Lights
W eather Reports
Flow Radio Remote
Setup Status
Arrow key
ET2000 Irrigatio n C o ntroll er K ey Pl acement and D escription
Plus or Mi nus k ey
Station UP key
Station DOWN key
Menu Keys
English /
Spanish key
Star key
Back key
Main Menu key
making
ater work
since 1986
Page 8

w
)
(
)
A
SECTION 2 SETUP
®
SECTION 2: SETUP
The Setup section of the controller is used for
programming the following:
• Communication addresses
• Accessing the controller’s Part & Serial
number information
• Setting Time & Date
• Activating stations in use
• Utilizing a 12 month schedule
• Inputting access codes
A. COMMUNICATIONS
Skip communication setup section if controlle r(s) has
no communications option installed.
The Communications screen can be used to set the
communications address in the controller. This
address is used for communicating back to a central
computer, and is also used to differentiate one
controller from another in a communications chain.
From the MAIN MENU screen.
1.
Press the SETUP Menu key.
The GENERAL SETUP screen is displayed
(Figure 2.1).
ET2000-40 -MSR-RR (576.i
Communication 12 Month Mode
Part & Serial Numbers
ET-40-MSR-RR
This is not a -FL controller.
FLOWSENSE irrigation between multiple
controllers is not availible.
Communications Addr ess: ! ! A
Controller Info
576.i
Figure 2.2
1.
Press the blue ARROW keys to
highlight the Communications address.
2.
Press the PLUS or MINUS keys to
set the first character.
3.
Press the blue ARROW keys to move
the cursor to the next character.
Repeat the process described above until all three
characters are set (The character furthest to the right
must be a letter).
Note: With multiple controllers one of the controllers
must be the Master with an address ending in a
Capitol “A”. All other controllers will have addresses
ending in B, C, D, etc. No two controllers can have
the same exact address when communicating to the
same central computer. The Master controller must
be the controller communicating back to the central.
To view the controller’s communications
information:
Date & Time
Stations In Use Access Control
Figure 2.1
2. Press the COMMUNICATION Menu
key, the COMMUNICATION screen
will appear.
1. Controller(s) with central communication:
Note:
If FLOWSENSE® option is installed (This can
be verified by looking for a (-FL) in the part number
of the controller section 1B) See Section 11 for
detailed instructions.
The communication screen should look like the one
in Figure 2.2 if your controller does not
FLOWSENSE
® option.
have the
4.
Press the CONTROLLER INFO
Menu key.
The PART & SERIAL NUMBERS screen is
displayed (Figure 2.3).
576.i s=6 c=6 A=14400 B=14 400
ET2000-40-MSR-RR
Serial Num: 0 0000 CC4 Ver: 4.0.11.26
(the normally expected signal levels)
RTS CTS DTR DSR CD RI
: L L L L L L
B: L L L L L L
Copyright Calsense Inc. 1987-20 05
All Rights Reserved
(use * Key for special menu)
PART & SERIAL NUMBERS
Figure 2.3
THIS CONCLUDES THE COMMUNICATIONS
SECTION
making
ater work
since 1986
Page 9

w
® SECTION 2 SETUP
B. PART & SERIAL NUMBER
This screen contains part & serial number
information along with communication information for
the controller.
From the MAIN MENU screen.
1.
Press the SETUP Menu key.
2.
Press the PART & SERIAL NUMBERS
Menu key.
The PART & SERIAL NUMBERS screen is
displayed (Figure 2.4).
576.i s=6 c= 6 A=14400 B=14400
ET2000-40-MSR-RR
Serial Num: 12345 CC4 V er: 4.0. 11.26
(the normally expected signal levels)
RTS CTS DT R DSR CD RI
A: L L L L L L
B: L L L L L L
Copyright Calsense I n c. 1987- 2005
All Rights Reserved
(use * Key for spe cial menu)
PART & SERIAL NUMBERS
Figure 2.4
THIS CONCLUDES THE PART A& SERIAL
NUMBER SECTION
C. DATE & TIME
The Date & Time setting on a new controller will be
set to Pacific Standard Time and will need to be
changed to the local time by the customer upon
receipt.
From the MAIN MENU screen.
1. Press the SETUP Menu key.
2. Press the DATE & TIME Menu key.
The DATE AND TIME screen is displayed
(Figure 2.5).
DATE & TIME
Current Da te & Time :
Oct 28 2005, Fri 10:49:49AM
Date & Time to S et:
Oct 28 2005, Fri 10:49:49AM
PUSH here to SET IT
Use Day Light Savings? YES
3.
Press the PLUS or MINUS keys to
change the Month setting.
4.
Press the blue ARROW keys to move
the cursor to the next entry.
5. Press the PLUS or MINUS keys to
change the next entry. Continue on
until the correct date and time are
displayed.
Use this same method to highlight the “Use Day
Light Savings?” entry and change it to the desired
setting. If you select YES the controller will
automatically change time for Day Light Savings.
6. Once you have completed this press
the PUSH HERE TO SET IT Menu
key.
IMPORTANT:
The changes do not take effect until this button is
pressed.
THIS CONCLUDES THE DATE AND TIME
SECTION
D. STATIONS IN USE
At this screen you can turn-off non-required station
outputs. These stations will no longer be visible for
programming in any other screen.
From the MAIN MENU screen.
1. Press the SETUP Menu key.
2. Press the STATIONS IN USE Menu
key.
The STATIONS IN USE screen is displayed
(Figure 2.6)
1 2 3 4 5 6 7 8 9 10
11 12 13 - - - - 16 17 18 - - 20
21 22 23 24 25 26 27 28 29 30
31 32 33 34 35 36 37 38 39 40
STAT IONS IN USE
Figure 2.5
Figure 2.6
making
ater work
since 1986
Page 10

w
A
SECTION 2 SETUP
®
3. To turn a station off press the blue
ARROW keys to move the cursor to
the desired station.
4.
Press the PLUS or MINUS keys to
turn off the station, two dashed lines
will appear instead of the station
number. In figure 2.6 station 14, 15,
and 19 are turned off. To turn them
back on,
5.
Press the blue ARROW key
to highlight the station.
6.
Then press the PLUS or MINUS key,
the station number will reappear.
THIS CONCLUDES THE STATIONS IN USE
SECTION
E. 12 MONTH MODE
The 12 Month Mode feature allows you to preprogram an irrigation schedule for each month of the
year. Each month can be programmed with different
Start Times, Water Days, Number of Days in
Schedule, Total Minutes, Minutes Per Cycle and
Soak in Time.
Note:
A 12 month schedule is not required to water
all year around.
Note:
As soon as 12-Month Schedule is enabled,
the controller will copy the current irrigation schedule
to all twelve months of the year. All of the months
will keep this schedule until you re-program each
month’s schedule. If you enable 12-Month schedule
before the controller has been programmed with an
irrigation schedule, there will be no Start Times,
water Days or Run Times on all twelve months of the
year. Be sure an irrigation schedule has been
programmed for all twelve months of the year.
From the MAIN MENU screen.
1.
Press the SETUP Menu key.
2.
Press the 12-MONTH MODE Menu
key.
The USE OF 12 MONTH MODE screen is displayed
(Figure 2.7)
Using 12-Month mode in addition to
"Daily ET" may not be necessary.
To Use 12-Month mode requires support
from you as a user. Y ou m ust understand
the mode and be prepar ed to enter water
days, start ti m es, and irrigation amount
f or each month of the year.
Use 12 Month Schedling ? NO
USE OF 12 MONTH MODE
Figure 2.7
3.
Press the PLUS or MINUS key to
change the setting.
If you select YES you will have to return to the
START TIMES & WATER DAYS and STATIONS
screens and enter the information for each month
accordingly. This can be accomplished by using the
two upper most blue Menu keys to the left of the
display screen.
THIS CONCLUDES THE 12 MONTH MODE
SECTION
F. ACCESS CONTROL
Using the Calsense Command Center software, a
three character password can be sent to the
controller, once a password has been sent, the user
will only be able to make changes to screens the
operator has given him access to via the password
entered by the user at the ACCESS CONTROL
screen.
From the MAIN MENU screen.
1. Press the SETUP Menu key,
the GENERAL SETUP screen will
appear.
2.
Press the ACCESS Menu key.
The ACCESS CONTROL screen is displayed
(Figure 2.8).
You may be blocked from making changes
in areas of the con troller. If you
have an access code you may be able
to make those changes.
Current Access is Level 0
Enter Your Access Code: 0 0 0
and Push To Log In
CCESS CONTROL
Figure 2.8
making
ater work
since 1986
Page 11

w
® SECTION 2 SETUP / SECTION 3 PROGRAMS & STATIONS
3. Enter the first character of the
password by pressing the PLUS or
MINUS key until the character
appears.
4.
the cursor to the next character, repeat
the process described above until all
three password characters appear.
5.
Menu key, a message will appear
confirming that the log in was
successful and the LOG OUT prompt
will appear.
THIS CONCLUDES THE ACCESS CONTROL
Press the blue ARROW Keys to move
Press the PUSH TO LOG IN
SECTION
SECTION 3: PROGRAMS & STATIONS
The Programs & Stations section of the controller is
used for programming or viewing the following:
• Start Times & Water days
• Individual station programming
• Station to station copying
• Viewing stations by program
A. START TIMES & WATER DAYS
The Start Times & Water Days section of the
controller is used to setup individual program start
times, program name (optional),number of days in a
schedule, schedule days, and stop times.
From the Main MENU screen.
1.
Menu key.
2.
WATER DAYS Menu key.
The START TIMES & WATER DAYS screen is
displayed (Figure 3.1).
3.
the cursor to the setting you wish to
change.
4.
change the highlighted setting.
Press the PROGRAMS & STATIONS
Press the START TIMES &
Program : PROG A Sart Time : 11:30PM
Number of Days in Schedule : 07
WEEK 1 on -- on -- on on on
STOP T IME : OFF
START TIMES & WATER DA Y S
Name : . . . . . . . . . . . . . . . . . .
Sun Mon Tue Wed Thu Fri SAT
Figure 3.1
Press the blue ARROW keys to move
Press the PLUS or MINUS keys to
making
ater work
since 1986
Page 12
w
A
SECTION 3 PROGRAMS & STATIONS
®
5. When at the START TIMES & WATER
DAYS screen the two (2) top right
Menu keys can be used to scroll to the
different programs. The following
explains each setting on the START
TIMES & WATER DAYS screen.
• PROG: Indicates the current program.
Program A is being programmed in the
example figure 3.1. The ET2000 Controller
has seven (7) programs A, B, C, D, E,
Drip1, and Drip 2.
• START TIME: The Start Time for
scheduled irrigation on the current
program. Program A has a 11:30 PM Start
Time.
• NAME:
A program description can be
selected which describes the type of plant
material and irrigation heads assigned to
that program (this setting is optional).
• DAYS IN SCHEDULE:
The ET2000 can
be set with a 7-Day schedule (shown in
figure 3.1), 14-Day Schedule, 21-Day
Schedule or 28-Day Schedule.
• WATER DAYS:
The days of the week in
the schedule to irrigate. “on” represents a
water day, “- -“ represents an off day.
• STOP TIME:
A time at which irrigation is
forced to end, even if the scheduled
irrigation cycle is not finished.
THIS CONCLUDES THE START TIMES & WATER
DAYS SECTION
B. STATIONS (STATION PROGRAMMING)
The stations section of the controller is used to setup
the following:
• Individual station program assignments
• Total minutes
• Minutes per cycle
• Soak-In Times
• No water days
• % of ET (If in Daily ET mode)
• Expected Flow Rates (If in Daily ET mode, or
in Budgets mode)
• Area square footages (If in Daily ET mode)
• Precipitation rates (If in Daily ET mode)
Station description’s can be entered via the
Note:
Command Center software.
From the MAIN MENU screen.
1.
Press the PROGRAMS & STATIONS
Menu key.
2.
Press the STATIONS Menu key.
The STATION PROGRAMMING screen is displayed
(Figure 3.2).
Station 1 . . . . . . . . . . . . . . PR OG
Total Mins : 15.0
Mins per Cycle : 5
Soak-in Time : 60 No Water Day 0
Test
STATION PROGRAM MING
Figure 3.2
3.
Press the blue ARROW keys to
move the cursor to the setting you
want to change.
4.
Press the PLUS or MINUS keys to
change the highlighted setting.
5. When at the Station Programming
screen, the two (2) top right Menu keys
are used for STATION UP and
STATION DOWN . The following
explains each setting on the STATION
PROGRAMMING screen.
• STATION:
Indicates the current station
number (Station 1 is the example in figure
3.2).
• PROG:
Indicates the program that the
current station is assigned to (Program A
is the example in figure 3.2).
• TOTAL MINS:
The total amount of
irrigation time that will be applied in each
24 our watering period.
making
ater work
since 1986
Page 13

w
® SECTION 3 PROGRAMS & STATIONS
• MINS PER CYCLE: The amount of
irrigation time applied in each cycle of a 24
hour watering period.
• SOAK-IN TIME:
The amount of time (In
Minutes) between multiple cycle starts.
1. Cycle and soak examples:
In the example shown in figure 3.2, station 1 will
irrigate for 5.0 minutes (the Mins per Cycle setting)
then wait 60 minutes (the Soak-in Time setting), it will
repeat the process two (2) more times until the total
irrigation applied is 15 minutes ( the Total Mins
setting), this feature is called Cycle and Soak. Each
station’s Cycle and Soak setting can be set
independent of any other station’s settings. The
following shows some examples of Cycle and Soak
settings:
Example 1
Total Mins: 10.0
Mins per Cycle: 2.0
Soak-in Time: 15
In this example the controller will irrigate 5 cycles of 2 minutes, for a
total of 10 minutes with a soak in time of 15 minutes between cycles.
Example 2
Total Mins: 10.0
Mins per Cycle: 10.0
Soak-in Time: 5.0
In this example the total minutes and the minutes per cycle are the
same, therefore the controller will irrigate one cycle of ten minutes.
The soak in time will be ignored
.
Example 3
Total Mins: 10.0
Mins per Cycle: 20.0
Soak-in Time: 10
In this example the controller will irrigate 1 cycle of 10 minutes. The
Mins per Cycle Time and Soak-In Time will be ignored.
2. Test a Station at the Station Programming
Screen
1. Press the TEST Menu key to turn the
current station on. The run time will be
the time set at the Valve Testing
screen.
3. Set NO Water Days at the Station
Programming Screen
No Water Days gives you the ability to turn a specific
station off for a certain amount of days consecutively
starting from today’s date. This setting will only affect
the station involved.
1. To turn the current station off for 1 to
31 days, press the blue ARROW keys
to highlight the NO Water day setting.
2.
Press the PLUS or MINUS keys to set
the number of NO Water Days
desired.
THIS CONCLUDES THE STATION PROGRAMMING
SECTION
C. STATION-TO-STATION COPY
The Station to Station Copy feature allows you to copy
programming from one station to another, copy the
programming from one station to all stations, or any
program.
The settings that are copied are:
• Total Minutes (except in Daily ET mode)
• Minutes Per Cycle
• Soak-In Time
From the MAIN MENU screen.
1.
Press the PROGRAMS & STATIONS
Menu key.
2.
Press the STATION – TO –
STATION COPY Menu key.
The STATION TO STATION COPY screen is
displayed (Figure 3.3).
Items copied from Station to Station:
Total M ins*
Mins per Cycle
Soak-in T ime
* except to Daily ET stations
Copy from Station 6 to Station 7
Copy Station 6 to PROG A Station s
STAT ION T O ST ATION COP Y
2.
Pressing the STOP key at anytime will
end the test.
Figure 3.3
making
ater work
since 1986
Page 14

w
SECTION 3 PROGRAMS & STATIONS
®
1. Copy a Station to another Station
1.
At the Station To Station Copy screen
press the PLUS or MINUS key until
the station you want to copy is
highlighted. (station 6 was
selected in figure 3.3).
2.
Press the blue ARROW keys to
highlight the station you want to copy
to.
3.
Press the PLUS or MINUS keys to
change the station to copy to.( station
7 was selected in the example above).
4.
Press the COPY FROM STATION
TO STATION Menu key, the station
will be copied and you will be
asked to press any key to continue.
2. Copy a Station to All Stations on a Program,
or All Stations on the Controller:
1. At the STATION TO STATION COPY
screen press the Blue ARROW keys
to move the cursor.
2.
Press the PLUS or MINUS key to
select all stations or a specific
program.
The PROGRAM ASSIGNMENT SUMMARY screen is
displayed (Figure 3.4).
PROGRAM ASSIGNMENT SUMMARY
PROG A: . . . . . . . . . . . . . . . . . . . . . . . . . . . . . . . .
1
PROG B: . . . . . . . . . . . . . . . . . . . . . . . . . . . . . . . .
2, 3, 4, 5, 6, 7, 8
PROG C: . . . . . . . . . . . . . . . . . . . . . . . . . . . . . . . .
PROG D: . . . . . . . . . . . . . . . . . . . . . . . . . . . . . . . .
Move Station
(move cursor to see more)
Figure 3.4
2.
Press the PLUS or MINUS keys to
scroll through the programs.
3.
Press the blue ARROW keys to
highlight the station that you want to
move.
4.
Press the MOVE STATION Menu
key.
The CHANGE STATION PROGRAM ASSIGNMENT
screen is displayed (Figure 3.5)
CHANGE S TAT ION PROGRAM ASSIGNMENT
Change Station 1:
FROM: PROG A: . . . . . . . . . . . . . . . . . . . . . . . . . . .
TO: PROG B: . . . . . . . . . . . . . . . . . . . . . . . . . . .
Make the Change
Press ANY key except the one above
to leave screen WITHOUT maki ng
the change.
3.
Press the COPY STATION TO
PROG Menu key, the station will
copy and you will be asked to press
any key to continue.
THIS CONCLUDES THE STATION TO STATION
COPY SECTION
D. STATIONS-BY-PROGRAM
This section of the controller allows you to view each
station, by program, that it is currently assigned to.
You can also move individual stations from one
program to another.
1. At the PROGRAMS & STATION
screen press the STATIONS-BY-
PROGRAM Menu key.
Figure 3.5
5.
Press the PLUS or MINUS keys to
change the program.
6.
Press the MAKE THE CHANGE
Menu key to change the station to
It’s new program.
THIS CONCLUDES THE STATION BY PROGRAM
SECTION
making
ater work
since 1986
Page 15

w
R
® SECTION 4 FLOW
SECTION 4: FLOW
The Flow section of the controller is used for setting up
the following:
• Line Fill & Valve close times
• Alert Action settings
• Master Valve type
• Use of Pump by program
• Flow Meter size and K & Offset values
• Flow Checking parameters
• Mainline Capacity parameters
• Valve On-at-a Time settings
From the MAIN MENU screen.
1.
Press the FLOW Menu key.
The FLOW METER, MASTER VALVE & PUMP screen
is displayed (Figure 4.1).
FLOW METER, MASTER VALVE & PUMP
Flow Meter
1. Estimated Water Usage
The Estimated Water Use setting is set to YES only if
there is NO flow meter installed, and the following
items are turned off:
• System Capacity
• Daily ET
• Budgets
If none of these items are in use, and you want to track
estimated water usage, change the DO YOU WANT
TO TRACK ESTIMATED WATER USE FOR
REPORTS? setting to YES, return to the Station
Programming screen and set the flow rate for each
station (the flow rate setting appears on the station
programming screen only when the estimated water
use setting is set to YES).
The FLOW METER screen is displayed (Figure 4.2).
Is a Flow Meter in use ? NO
Do you want to track estimated
water use for Reports? NO
FLOW METER
Master Valve Mainline Capacity
Pump On-at-a-Time
Figure 4.1
A. FLOW METER SETUP
The flow meter setup is used to enter the type and size
of a single, or multiple flow meters assigned to this
controller. You can also enter the K & Offset values for
FMBX style flow meters.
Note:
The multiple flow meter option will only be
available if the (-F) option is installed in the controller.
See section 12 for more information.
From the FLOW METER, MASTER VALVE & PUMP
screen (Figure 4.1).
1. Press the FLOW METER Menu key.
Figure 4.2
If Using a Flow Meter use the following directions:
1.
Press the PLUS or MINUS keys to
change the IS A FLOW METER IN
USE ? to YES.
The Flow Meter screen will appear (It will appear as
shown in Figure 4.3 only after the Flow Meter In Use
setting is set to YES).
Is a Flow Meter in use ? YES
Use your own K & Offset ? NO
METER 1
SIZE: FM-1
(Expected Flow Rates can be
automatically learned.)
Learn Expecteds
FLOW METE
Figure 4.3
making
ater work
since 1986
Page 16

w
SECTION 4 FLOW
®
2. Press the blue ARROW keys to
move the cursor to the USE YOUR
OWN K & OFFSET setting, which is
set to NO as the default.
If using a FMBX flow meter see:
2. FMBX flow meter setup
If using a regular flow meter see:
3. Regular flow meter setup
2. FMBX flow meter setup
If the flow meter installed on the system is a Calsense
FMBX, change the “Use your own K & Offset” to YES,
(The screen will appear as shown in Figure 4.4).
Is a Flow Meter in use ? YES
Use your own K & Offset ? YES
METER 1
K: 10.000
OFFSET: 0.200
(Expected Fl ow Rates can be
automatically learned.)
Learn Expecteds
FLOW METER
Figure 4.4
3. Regular flow meter setup
If the answer to Use your own K & Offset is NO.
1.
Press the blue ARROW keys to move
the cursor to the SIZE setting.
2.
Press the PLUS or MINUS keys to
change the flow meter type.
Refer to the chart (Figure 4.5), to choose the correct
flow meter type.
MODEL NUMBER SIZE
FM-1
FM-1B
FM-1.25B
FM-1.5
FM-2
FM-3
1” PLASTIC FLOW METER
1” BRASS FLOW METER
1 ¼” BRASS FLOW METER
1 ½” PLASTIC FLOW METER
2” PLASTIC FLOW METER
3” PLASTIC FLOW METER
Figure 4.5
4. Learn Expecteds (Flow rate)
The Learn Expecteds option on the controller will learn
the expected flow rate for each station on each
program selected.
1.
Press the blue ARROW keys to
move the cursor to the K: setting.
2.
Press the PLUS or MINUS keys to
change the number.
3.
Press the blue ARROW keys to
move the cursor to the OFFSET:
setting.
4.
Press the PLUS or MINUS keys to
change the number.
Note:
The two settings that must be set are the K
value and the Offset. If you know these values enter
them now. If not, Call Calsense at 1-(800)-572-8608
for assistance.
1.
After you have entered the appropriate
Flow Meter(s) select the LEARN
EXPECTEDS Menu key (Figure 4.6).
Is a Flow Meter in use ? YES
Use your own K & Offset ? NO
METER 1
SIZE: FM-1
(Expected Flow Rates can be
automatically learned.)
Learn Expecteds
FLOW METER
Figure 4.6
making
ater work
since 1986
Page 17
w
® SECTION 4 FLOW
The LEARN THE EXPECTED FLOW RATES screen
is displayed (Figure 4.7).
LEARN THE EXPECTED FLOW RATES
At the next program start , turn on
each station and use the measured flow
to set the expected flo w rate.
Learn The Expected Flow Rates for:
PROG A . . . . . . . . . . . . . . . . . . . . . . . NO
PROG B . . . . . . . . . . . . . . . . . . . . . . . NO
PROG C . . . . . . . . . . . . . . . . . . . . . . . NO
PROG D . . . . . . . . . . . . . . . . . . . . . . . NO
PROG E . . . . . . . . . . . . . . . . . . . . . . . NO
DRIP 1 . . . . . . . . . . . . . . . . . . . . . . . NO
DRIP 2 . . . . . . . . . . . . . . . . . . . . . . . NO
Figure 4.7
• LEARN EXPECTEDS:
This allows you to
learn the expected flow rate for each station at
the next program start. Once the flow rate has
been recorded the entry on the screen will
default back to NO.
2.
Press the PLUS or MINUS keys to
select the program.
The LINE FILL & VALVE CLOSE TIMES screen is
displayed (Figure 4.8).
LINE FILL & VALVE CLOSE TIMES
Line Valve
Fill Close
PROG A . . . . . . . . . . . . . . 60 60
PROG B . . . . . . . . . . . . . . 60 60
PROG C . . . . . . . . . . . . . . 60 60
PROG D . . . . . . . . . . . . . . 60 60
PROG E . . . . . . . . . . . . . . 60 60
DRIP 1 . . . . . . . . . . . . . 60 60
DRIP 2 . . . . . . . . . . . . . 60 60
( times are in seconds )
Figure 4.8
• LINE FILL TIMES: The delay time in seconds
that the controller will wait to check flow rates
on a station allowing the flow to stabilize.
• VALVE CLOSE TIMES: The delay time in
seconds that the controller will wait to check
flow on the very next valve allowing time for
the previous valve to close.
3.
Press the blue ARROW keys to
change the setting.
THIS CONCLUDES THE FLOW METER
SECTION
B. LINE FILL & VALVE CLOSE TIMES
The Line Fill & Valve Close times are used to allow
each valve time to stabilize before checking flow.
After you have enabled the flow meter on the FLOW
METER screen as described on the previous page:
1.
Press the BACK key twice to return
to the FLOW METER, MASTER
VALVE, & PUMP screen (Figure 4.1).
2. Press the LINE FILL & VALVE
CLOSE TIMES Menu key.
3.
Press the blue ARROW keys to move
the cursor to the PROG A LINE
FILL TIME.
4.
Press the PLUS or MINUS keys to
set the desired seconds.
Note:
Use this same method to change the VALVE
CLOSE TIME for program A and then repeat these
steps for each program on the list.
5.
Press the BACK key to return to
the FLOW METER, MASTER
VALVE, & PUMP SETUP screen
(Figure 4.9).
THIS CONCLUDES THE LINE FILL & VALVE
CLOSE TIMES SECTION
making
ater work
since 1986
Page 18
w
SECTION 4 FLOW
®
C. MASTER VALVE
This section of the controller allows you to select from
two types of master valves available:
• Normally Open
• Normally Closed
From the FLOW METER, MASTER VALVE & PUMP
SETUP screen (Figure 4.1).
1.
Press the MASTER VALVE Menu
key.
The TYPE OF MASTER VALVE screen is displayed
(Figure 4.9).
TYPE OF MASTER VALVE
The MASTER VALVE is NORMALLY CLOSED
Figure 4.9
The Master Valve default setting is for a normally
closed Master Valve. There are two (2) settings,
• NORMALLY CLOSED:
A normally closed
master Valve is in the closed position until
voltage is applied to open it.
• NORMALLY OPEN:
A normally open Master
Valve is in the open position until voltage is
applied to close it.
Note:
Be sure to select the correct type of Master
Valve installed, if it is incorrect the Master Valve will
close whenever a station is irrigated and no water will
flow when a valve is turned on
.
D. PUMP
If you are using a pump for any one of your valves you
will have to set the controller to recognize that there is
a pump in use and on which program it will be used
on.
From the FLOW METER, MASTER VALVE & PUMP
screen (Figure 4.1).
1.
Press the PUMP Menu key.
The WHICH PROGRAMS USE THE PUMP screen is
displayed (Figure 4.10).
WHIC H PROGRAMS USE THE PUMP
For each program, select YES
if you would like to use the pump
PROG A . . . . . . . . . . . . . . . . . . . . . . . YES
PROG B . . . . . . . . . . . . . . . . . . . . . . . YES
PROG C . . . . . . . . . . . . . . . . . . . . . . . YES
PROG D . . . . . . . . . . . . . . . . . . . . . . . YES
PROG E . . . . . . . . . . . . . . . . . . . . . . . YES
DRIP 1 . . . . . . . . . . . . . . . . . . . . . . . YES
DRIP 2 . . . . . . . . . . . . . . . . . . . . . . . YES
Figure 4.10
2.
Press the blue ARROW keys to
move the cursor to the Program
desired.
The default setting is set to YES on all programs. This
means that the controller’s pump output will be
activated whenever a station on any program is
activated.
3.
Press the PLUS or MINUS keys to
change any Program.
Note:
If the Pump Output Enabled setting is set to NO
on a program, the pump output will not activate when a
station on that program is activated.
2.
Press the BACK key to return to the
FLOW METER, MASTER VALVE, &
PUMP SETUP screen (shown Figure
4.1).
THIS CONCLUDES THE MASTER VALVE
SECTION
4.
Press the BACK key to return to the
Flow Meter, Master Valve & Pump
screen (See figure 4.1).
THIS CONCLUDES THE PUMP
SECTION
making
ater work
since 1986
Page 19

w
® SECTION 4 FLOW
E. MAINLINE CAPACITY
System capacity is defined by the max flow rate of
water that your system can operate at during irrigation.
From the FLOW METER, MASTER VALVE & PUMP
screen (Figure 4.1).
4.
Press the MAINLINE CAPACITY
Menu key.
The MAINLINE BREAK SETTINGS screen is
displayed (Figure 4.11).
Dur ing Irr igation 400 gpm
ALL Other T imes 150 gpm
----------------------SYSTEM CAPACITY SETTINGS---------------------- Use capacity to limit the
number of stations on? NO
MAINLIN E BR EAK SETT INGS
Figure 4.11
5.
move the cursor to the DURING
IRRIGATION gpm.
6.
change the number.
Use the same method to change the ALL OTHER
TIMES number.
• DURING IRRIGATION:
• ALL OTHER TIMES:
• USE CAPACITY TO LIMIT THE NUMBER OF
This will open up the portion of the screen dealing with
Capacity with or without Pump (Figure 4.12).
Press the blue ARROW keys to
Press the PLUS or MINUS keys to
The during irrigation
number is the mainline break number used
while the controller is irrigating.
The all other times
number is the mainline break number used
when the controller is not irrigating.
STATIONS ON ?: If you want to use capacity
to limit the number of stations on change to
YES.
7.
Press the PLUS or MINUS key to
change the capacity numbers.
During Irrigation 400 gpm
ALL Other Times 150 gpm
----------------------SYSTEM CAPACITY SETT INGS---------------------- Use capacity to limit the
number of stations on? YES
Capacity with Pump 200 gpm
Capacity without Pump 100 gpm
(set which programs use the p ump )
MAINLINE BREA K SETTINGS
Figure 4.12
Capacity with pump: When a program irrigates by
use of pump the GPM limit set will not be exceeded.
Capacity without pump: When a program irrigates
without the use of a pump the GPM limit will not be
exceeded.
Note:
Pump and non-pump programs will not run
simultaneously on the same controller / system.
8.
If you did not select SET WHICH
PROGRAMS TO USE PUMP in the
pump section of this manual then
press the SET WHICH PROGRAMS
TO USE THE PUMP Menu key
(Figure 4.12).
See Part D of this section for instructions.
THIS CONCLUDES THE MAINLINE CAPACITY
SECTION
F. ON – AT – A – TIME
The On-at-a-Time section of the controller is used to
set up the number of valves that you want to come on
simultaneously within a program, and also within a
controller.
From the FLOW METER, MASTER VALVE & PUMP
screen (Figure 4.1).
1.
Press the ON-AT-A-TIME Menu key.
making
ater work
since 1986
Page 20

w
SECTION 4 FLOW
®
The STATIONS ON-AT-A-TIME screen is displayed
(Figure 4.13).
STATION S ON-AT-A-TIME
W ithin W ithin
Program Controller
PROG A . . . . . . . . . . . . . . 1 1
PROG B . . . . . . . . . . . . . . 1 1
PROG C . . . . . . . . . . . . . . 1 1
PROG D . . . . . . . . . . . . . . 1 1
PROG E . . . . . . . . . . . . . . 1 1
DRIP 1 . . . . . . . . . . . . . 1 1
DRIP 2 . . . . . . . . . . . . . 1 1
An "X" means don't use this
On-At-A-Time as a limit
Figure 4.13
2.
Press the blue ARROW keys to move
the cursor to the Program and Within
Program setting desired.
Note: The default setting is set to 1 on all programs.
3. To change the settings press the
PLUS or MINUS keys for any number
to change the setting.
• WITHIN PROGRAM:
This section allows you
to choose the amount of valves that you want
to set as a limit to come on at a time within a
program.
• WITHIN CONTROLLER:
This section allows
you to choose the amount of valves that you
want to set as a limit to come on at a time
within the controller.
Example:
Within Program
Program A 1 2
Program B 1 2
Within Controller
This example allows the user to set up one (1) valve
on at a time for Programs A and B. The controller will
allow both Programs to have one (1) valve each run
simultaneously for a total of two (2) on within
controller.
Example:
Within Program
Program A 1 1
Program B 3 3
Within Controller
This example allows the user to set up one (1) valve
on at a time for Programs A. The controller will only
allow one valve to operate while program A is running.
Program B is set up to operate 3 valves on at a time,
and will only operate up to three valves when Program
B is running.
4. Press the BACK key to return to the
FLOW METER, MASTER VALVE, &
PUMP screen (See figure 4.9).
THIS CONCLUDES THE ON AT A TIME SECTION
G. FLOW CHECKING
Flow checking allows you to have the controller
compare the flow of each station during irrigation to
the learned expected flow and alert you of any
problems.
From the FLOW METER, MASTER VALVE & PUMP
SETUP screen (Figure 4.1).
1.
Press the FLOW CHECKING Menu
key
The FLOW CHECKING screen is displayed
(Figure 4.14).
FLOW CHECKING
When Irrigating COMPARE the
flow rate to the expected? NO
Figure 4.14
This will open up the ALLOWABLE portion of the
screen when you select YES to the WHEN
IRRIGATING COMPARE THE FLOW TO THE
EXPECTED ? question (Figure 4.15).
making
ater work
since 1986
Page 21

w
® SECTION 4 FLOW
FLOW CH EC KI NG
When Irrigating COMPARE the
flow rate to the expected? YES
A LLOWA BLE
Below 30 gpm -5 / +5
From 30 gpm to 100 gpm -10 / +10
Above 100 gpm -15 / +15
(-gpm / +gpm)
Figure 4.15
2.
Press the blue ARROW keys to
change the Allowable settings.
The default settings are:
BELOW: -5 / +5
FROM / TO: -10 / +10
ABOVE: -15 / +15
Note:
The above settings are defaulted in the
controller and can be changed by the user.
3.
To change the settings press the
PLUS or MINUS keys for any number
to change the setting.
Below:
This section allows you to enter the fluctuation
range for the low end of your normal operating flow.
Use the (-) and (+) entries to set the range.
Example:
If you set the below limit at 30 gallons per minute.
Then set your (-) limit at 5, and your (+) limit at 5.
You will be alerted if the flow at the low end of the
scale fluctuates by more than five gallons per minute
in either direction.
That is less than 25 gpm or more than 35 gpm
From / to:
This section allows you to set the
fluctuation limits for the full range of flow. In this box
you want to enter the normal operating range of water
flow. Then in the (-) and (+) blocks enter the range of
fluctuation that you deem normal.
Example:
If you set the limit at 30 gpm to 100 gpm.
Then set your (-) limit at 10, and your (+) limit at 10.
You will be alerted if the flow at the middle of the scale
fluctuates by more than ten gallons per minute in
either direction.
That is less than 20 gpm or more than 110 gpm
Above: This section allows you to enter the fluctuation
range for the high end of your normal operating flow.
Use the (-) and (+) entries to set the range.
Note:
You will want to set this allowable range up a
little wider due to the amount of water flow.
Example:
If you set the above limit at 100 gallons per minute.
Then set your (-) limit at 15, and your (+) limit at 15.
You will be alerted if the flow at the high end of the
scale fluctuates by more than fifteen gallons per
minute in either direction.
That is less than 85 gpm or more than 115 gpm
4. Press the BACK key to return to the
FLOW METER, MASTER VALVE, &
PUMP screen (Figure 4.1).
Note:
Notice that the Alert Actions option has now
been added to this screen (See figure 4.16).
FLOW METER, MASTER VALVE & PUMP
Line Fill Flow Meter
& Valve Close Times
Alert Acti ons Flow Checking
Master Valve Mainline Capacity
Pump On-at-a-Time
Figure 4.16
THIS CONCLUDES THE FLOW CHECKING
SECTION
making
ater work
since 1986
Page 22

w
W
SECTION 4 FLOW / SECTION 5 WEATHER
®
H. ALERT ACTIONS
The Alert Actions section of the controller allows you
to setup the way in which you want the controller to
inform you of any problems. The Alert Actions
setting defaults with Alert / No Action set for all
programs. There are three possible settings:
• Alert / No Action:
An alert is displayed on
the screen but the valve continues to
irrigate.
• Alert / Shut-Off:
An alert is displayed on the
screen and the value is shut off.
• No Alerts:
No alert is displayed and the
valve continues to irrigate.
From the FLOW METER, MASTER VALVE & PUMP
screen (Figure 4.1).
1.
Press the ALERT ACTIONS Menu
key.
The ALERT ACTIONS screen is displayed
(Figure 4.17).
SECTION 5: WEATHER
The weather section of the controller is used to set
up the ET Gage, Rain bucket, Wind Gage, Rain
switch, budgets, and Moisture sensors.
A. ET GAGE
The ET Gage setting in the controller is used for:
• Setting ET irrigation day
• *Selecting ET gage Usage
• *Logging ET Gage Pulses
• *Setting Gage fill percentage
• **Manually entering pulses
• **Skipping tonight’s entries
* Only if (-G) option installed in controller and an ET
Gage is connected.
** Used for troubleshooting, or servicing ET Gage.
1. ET Gage setup
From the MAIN MENU screen (Figure 5.1).
1.
Press the WEATHER Menu key.
ALERT ACTION S
HIGH FLOW LOW FLO
PROG A . . . . . . . . . . . . . . Alert / No Action Alert / No Action
PROG B . . . . . . . . . . . . . . Alert / No Action Alert / No Action
PROG C . . . . . . . . . . . . . . Alert / No Action Alert / No Action
PROG D . . . . . . . . . . . . . . Alert / No Action Alert / No Action
PROG E . . . . . . . . . . . . . . Alert / No Action Alert / No Action
DRIP 1 . . . . . . . . . . . . . . Alert / No Action Alert / No Action
DRIP 2 . . . . . . . . . . . . . . Alert / No Action Alert / No Action
Figure 4.17
2.
Press the blue ARROW keys to move
the cursor to the Program HIGH
FLOW and LOW FLOW settings.
3.
Press the PLUS or MINUS keys to
change the settings.
4.
Press the MAIN MENU key to return
to the MAIN MENU screen.
THIS CONCLUDES THE ALERTS / ACTIONS
SECTION
CALSENSE WAT ER M ANAGEM ENT SYSTEM
Programs & Stations Lights
Weather Reports
Flow Radio Remote
Setup Status
Figure 5.1
The WEATHER SETUP screen is displayed
(Figure 5.2).
ET Gage ET
Rain Bucket Budget
Wind Gage Moisture
Rain Switch
WEATHER SETUP
Figure 5.2
2.
Press the ET GAGE Menu key.
making
ater work
since 1986
Page 23

w
® SECTION 5 WEATHER
The ET GAGE screen is displayed (Figure 5.3).
ET GAGE
Irrigation Day is from 8:00PM to 8:00PM
Is there an ET Gage? NO
If YES is selected the screen will change to read:
(Figure 5.5).
ET GAGE
Irrigation Day is from 8:00PM to 8:00PM
Is there an ET Gage? YES
Log Pulses? NO Gage is 99% full
GAGE=.00 inches Skip tonight? YES
Figure 5.3
• Irrigation Day is from 8:00PM to 8:00PM:
This setting is for the time period that you
want your ET information to be collected for
each day. Keep in mind that you want this
time to be before your first irrigation Start
Time for that day so that you are using the
most current ET information.
3.
Press the PLUS or MINUS keys to
change the setting.
Note:
Following steps are for (-G) option only.
4.
Press the blue ARROW keys to
move the cursor to the IS THERE AN
ET GAGE? (Figure 5.4).
Irrigation Day is from 8:00PM to 8:00PM
Is there an ET Gage? NO
ET GAGE
Figure 5.5
6.
Press the blue ARROW keys to
move the cursor to the LOG
PULSES? entry (Figure 5.6).
Irrigation Day is from 8:00PM to 8:00PM
Is there an ET Gage? YES
Log Pulses? NO Gage is 99% full
GAGE=.00 inches Skip tonight? YES
ET GAGE
Figure 5.6
• Log Each Pulse?:
The default is set to NO.
Changing to the YES setting gives you the
option of keeping a record of each ET Gage
pulse sent to the controller. This information
is located in the diagnostic log. This is
helpful when first setting up the ET Gage to
make sure that it is working properly, but
can be set to NO after you are sure the ET
Gage is working properly.
Figure 5.4
5.
Press the PLUS or MINUS keys to
change the setting.
7.
Press the PLUS or MINUS keys to
change the setting.
8. Press the blue ARROW keys to
move the cursor to the GAGE IS 99%
FULL setting (Figure 5.7).
making
ater work
since 1986
Page 24

w
SECTION 5 WEATHER
®
Irrigation Day is from 8:00PM to 8:00PM
Is there an ET Gage? YES
Log Pulses? NO Gage is 99% full
GAGE=.00 inches Skip tonight? YES
ET GAGE
Figure 5.7
• Gage is 99% full:
The percent full counter is
used to reset the counter after the ET Gage
has been refilled during periodic
maintenance.
9. Press the PLUS or MINUS keys to
change the setting.
10.
Press the blue ARROW keys to
move the cursor to the GAGE=.00
INCHES setting (Figure 5.8).
Irrigation Day is from 8:00PM to 8:00PM
Is there an ET Gage? YES
Log Pulses? NO Gage is 99% ful l
GAGE=.00 inches Skip tonight? YES
ET GAGE
Figure 5.8
• The “GAGE=.00 inches ”
: This option
allows you to edit the amount of inches.
Some of the reasons for editing this number:
o Servicing the ET gage and removing
erroneous logged pulses.
o Gage temporarily not working and a
need to log pulses for that day.
o Editing number up or down due to
specific circumstances.
Note:
Daily pulses show at this location.
11.
Press the PLUS or MINUS keys to
change the setting.
12.
Press the blue ARROW keys to
move the cursor to the SKIP
TONIGHT? (Figure 5.9).
Irrigation Day is from 8:00PM to 8:00PM
Is there an ET Gage? YES
Log Pulses? NO Gage is 99% full
GAGE=.00 inches Skip tonight? YES
ET GAGE
Figure 5.9
• SKIP TONIGHT?:
Selecting YES
causes the GAGE=inc hes nu mbe r to be
left out of the ET table for this twenty
four hour period, a historical value will
be entered instead.
Note:
The Skip Tonight option is used for
troubleshooting the ET gage. Pulses created during
troubleshooting will not be entered into the ET Table
if YES is selected.
13.
Press the BACK key to return to the
WEATHER SETUP screen
(Figure 5.2).
THIS CONCLUDES THE ET GAGE
SECTION
B. RAIN BUCKET
The Rain Bucket setting in the controller is used for
recording the amount and rate of rainfall, and
calculating station run times accordingly by use of
the following:
• Setting irrigation rain stop value
• Set Maximum rain in one hour value
• Set Maximum rain in 24 hour value
• Set rain build up value
• Set use of rain by program
Skip Rain Bucket setup section if controller has no
(-RB) option and you are not
sharing rain to
controller.
making
ater work
since 1986
Page 25

w
® SECTION 5 WEATHER
If the controller in use has a (-RB) option installed
and a Rain Bucket connected see:
1. Rain setup with Rain Bucket installed
.
If the controller in use does not
have the (-RB)
option installed see:
2. Rain setup (Without Rain Bucket installed) and
you are sharing rain to controller.
1. Rain setup with Rain Bucket installed
From the WEATHER SETUP screen (Figure 5.2).
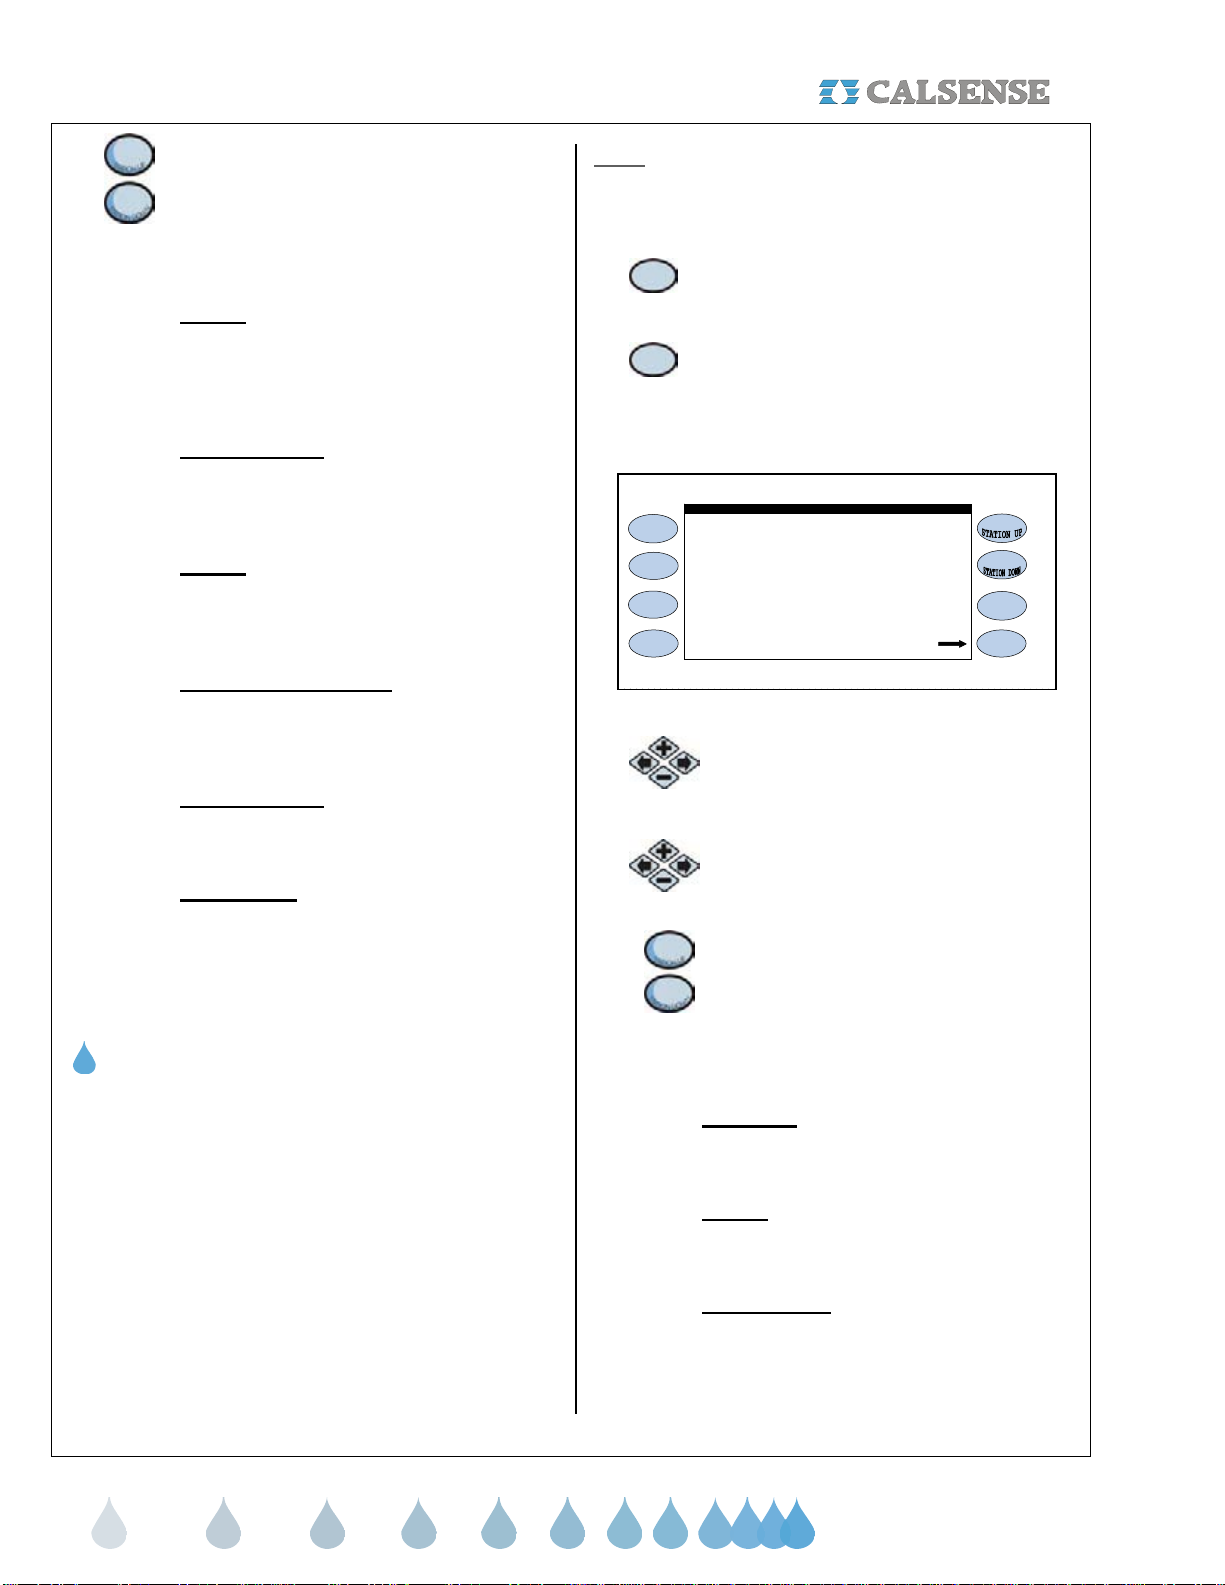
1.
Press the RAIN BUCKET Menu key.
The RAIN BUCKET SETUP screen is displayed
(Figure 5.10).
STOP Irrigation After 0.10 inches
MAXIMUM Rain in ONE Hour is 0.20 inches
MAXIMUM Rain in 24 Hours is 0.60 inches
Let Rain Only Build up to 1.50 inches
Set U se of Rain by Program
RAI N BUCKET SETUP
Figure 5.10
The four (4) settings on the screen determine how
much actual rainfall will be placed into the rain table,
which is used to offset irrigation run times. The
following is a description of each:
Note:
Each value in the following definitions denoted
in red is a default setting and can be adjusted by the
user.
• Stop irrigation after:
This setting determines
how much rain must fall, before the controller
will start accumulating rainfall values in the rain
table. It also determines when to halt any on
going irrigation. In figure 5.10, (0.10) inches of
rain will have to fall before any rain data starts to
accumulate in the rain table, or irrigation is
stopped.
• Maximum Hourly Rain:
This setting determines
the maximum amount of rain that will be put in
the rain table after a period of one (1) hour of
rain. In figure 5.10, a maximum of (0.20) inches
of rain will be put into the rain table, no matter
how much rain falls in a one (1) hour period. The
amount of rain from this setting put into the rain
table, will increase only until it reaches the 24
HOUR TOTAL setting.
• Maximum 24 Hour Total: This setting
determines the maximum amount of rain that will
be put into the rain table in a 24 hour period. In
figure 5.10, a maximum of (0.60) inches of rain
will be put into the table, no matter how much
rain falls in a 24 hour period. The amount of rain
from this setting put into the rain table, will
increase only until it reaches the LET RAIN
ONLY BUILD UP TO :setting.
• Let Rain Only Build Up to: This setting
determines the maximum amount of rain that will
be stored in the rain table. In figure 5.10, the
controller will stop storing rain data in the rain
table if the Maximum 24 Hour Total reaches
1.50 inches of rain.
2. Press the PLUS or MINUS keys to
change the settings.
3.
Press the blue ARROW key to
move the cursor to the next entry.
• Set Use of Rain by Program: This
section describes how to enable the use
of rain in the ET2000 controller. Each
Program can be set individually to either
use or not use rain to offset irrigation run
times.
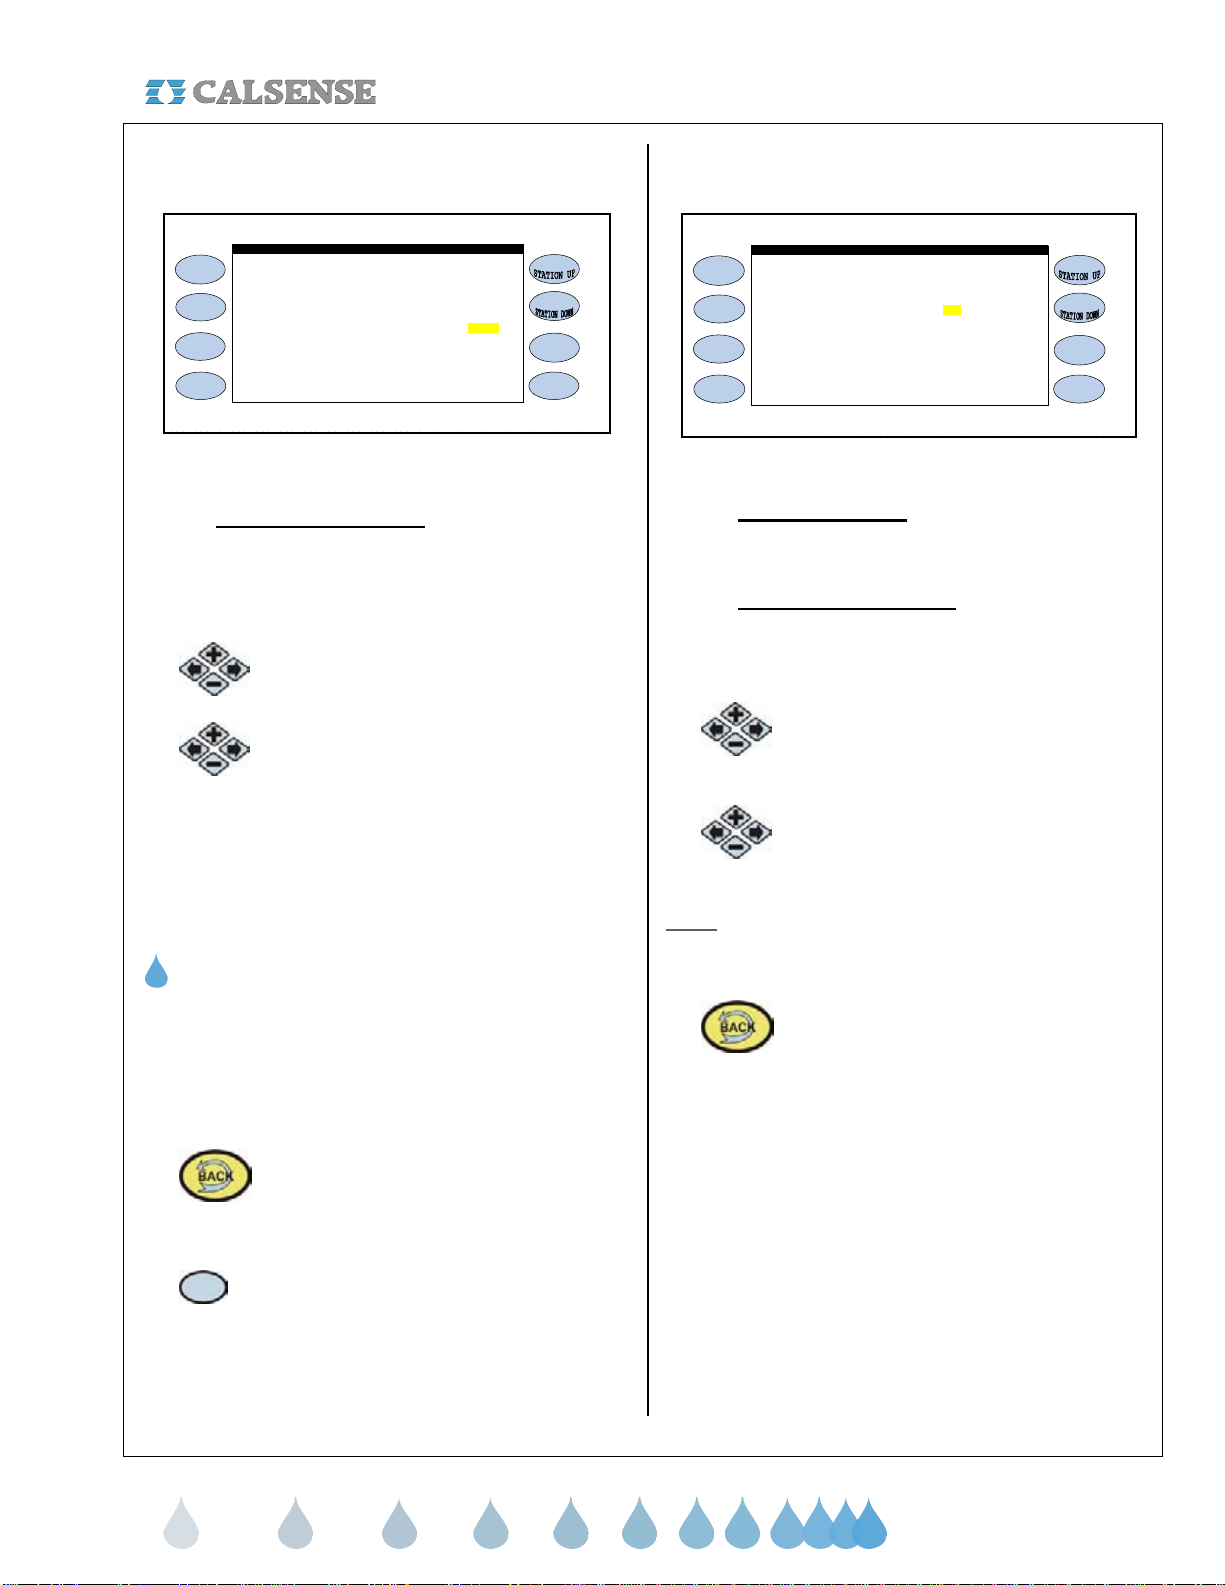
From the RAIN BUCKET SETUP screen
(Figure 5.10).
4.
Press the SET USE OF RAIN BY
PROGRAM Menu key.
The USE OF RAIN BY PROGRAM screen is
displayed (Figure 5.11
Rain causes negative hold-over to build
which acts to cancel irrigation.
Allow RAIN on the following:
PROG A . . . . . . . . . . . . . . . . . . . . . . . . . . . . . .YES
PROG B . . . . . . . . . . . . . . . . . . . . . . . . . . . . . .YES
PROG C . . . . . . . . . . . . . . . . . . . . . . . . . . . . . .YES
PROG D . . . . . . . . . . . . . . . . . . . . . . . . . . . . . .YES
PROG E . . . . . . . . . . . . . . . . . . . . . . . . . . . . . .YES
DRIP 1 . . . . . . . . . . . . . . . . . . . . . . . . . . . . . . . YES
DRIP 2 . . . . . . . . . . . . . . . . . . . . . . . . . . . . . . . YES
).
USE OF RAIN BY PROGRAM
Figure 5.11
making
ater work
since 1986
Page 26

w
SECTION 5 WEATHER
®
You have the option of enabling or disabling the use
of rain (negative hold over) for any of the controller’s
seven programs. If you select YES, rain (negative
hold over) will be used for that program to reduce
irrigation run times. If you select NO, rain will have
no effect on irrigation run times for that program.
If there is no rain bucket installed and you are not
sharing rain data through the Calsense Command
Center program, these settings will have no effect on
irrigation.
5.
Press the PLUS or MINUS keys to
change the setting.
6.
Press the blue ARROW keys to
move the cursor to the next entry.
7.
Press the MAIN MENU key to return
to the MAIN MENU screen
(Figure 5.1).
THIS CONCLUDES RAIN SETUP WITH RAIN
BUCKET INSTALLED
2. Rain setup ( Without Rain Bucket
installed ) and you are sharing rain to
controller.
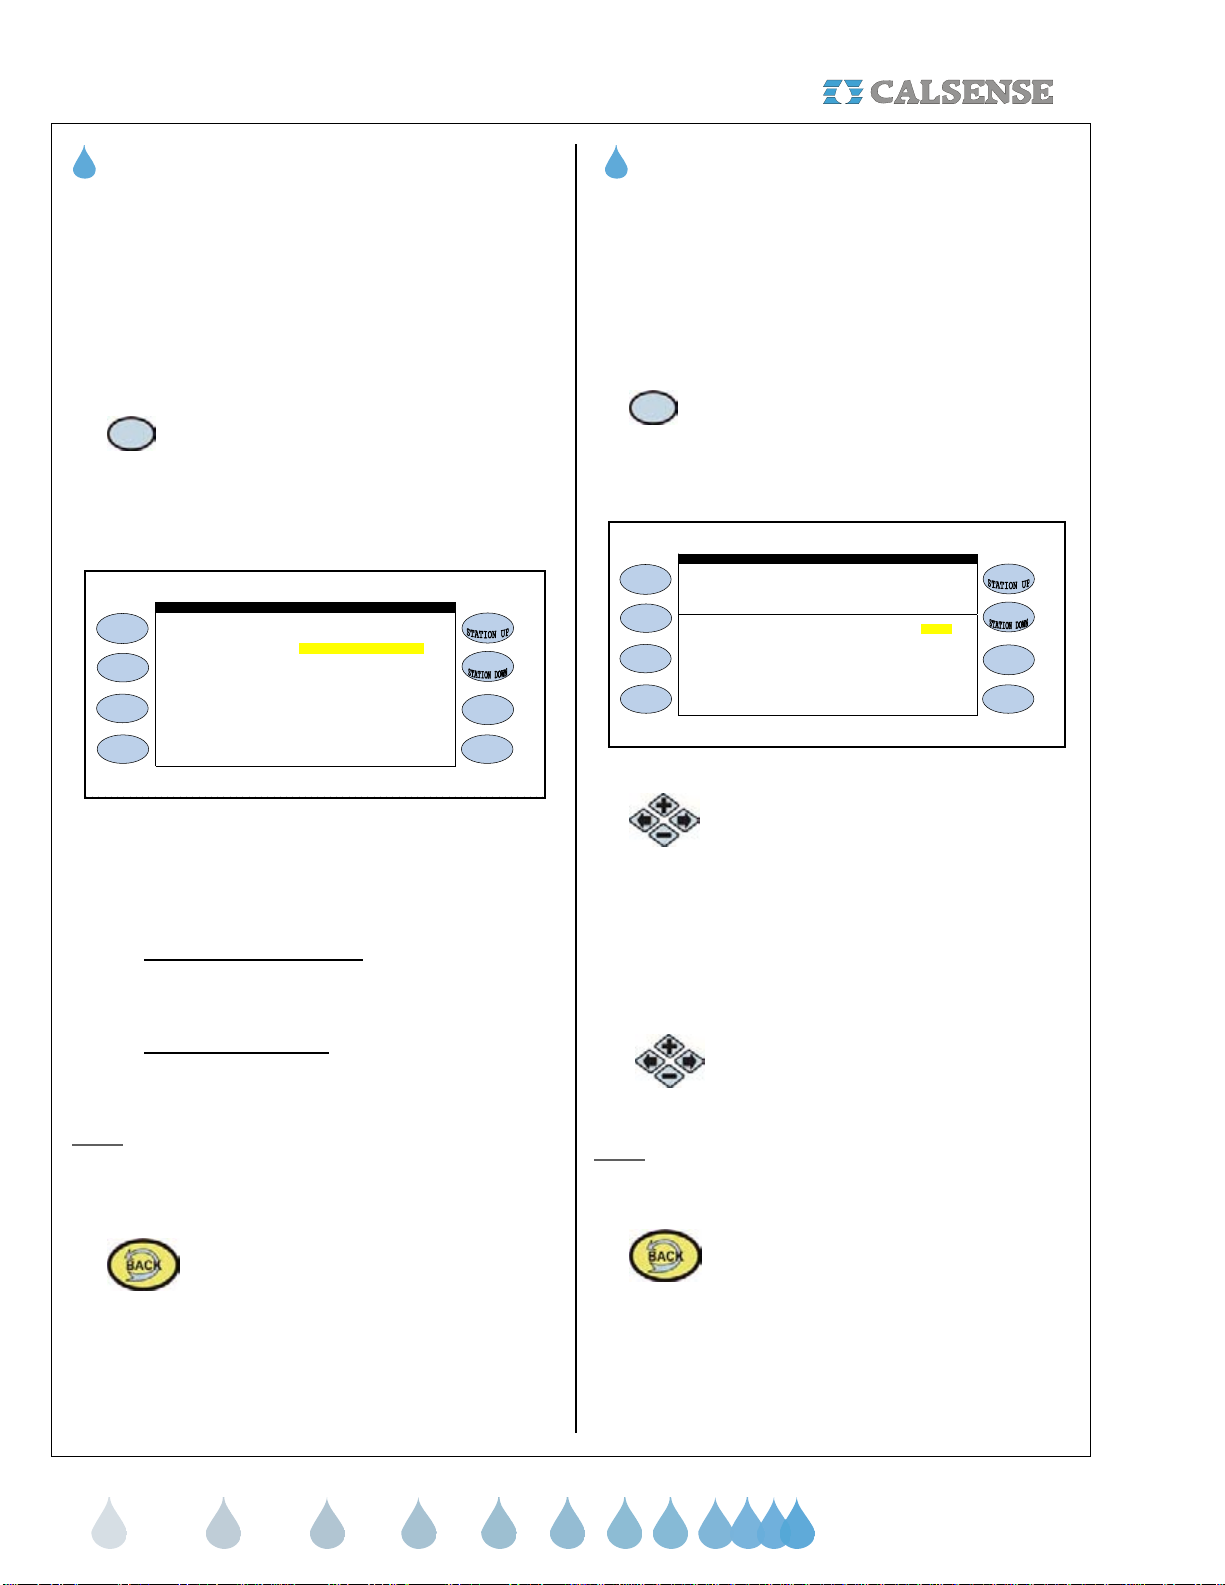
From the WEATHER SETUP screen (Figure 5.2).
1.
The RAIN BUCKET SETUP screen is displayed
(Figure 5.12).
Press the RAIN BUCKET Menu key.
Rain Bucket controllers have 3 more
setings. This controller does not
have a -RB interf ace.
Let Rain Only Build up to 1.50 inches
RAIN BUCKET SETUP
If a controller is not wired to a rain bucket, the RAIN
BUCKET SETUP screen will only have one setting
(Figure 5.12). This setting is described below:
• Let Rain Only Build Up to:
This setting
determines the maximum amount of rain
that can be stored in the rain table. In
figure 5.12 the controller will stop storing
rain data in the rain table if the
Maximum 24 Hour Total reaches 1.50
inches of rain.
If you are not sharing rain data using the Calsense
Command Center software, this setting will have no
effect on irrigation.
2.
Use the PLUS or MINUS key to
change the setting.
• Set Use of Rain by Program:
This
section describes how to enable the
use of rain in the ET2000 controller.
Each program can be set individually
to either use or not use rain to offset
irrigation run times.
From the RAIN BUCKET SETUP screen
(Figure 5.12).
3.
Press the SET USE OF RAIN BY
PROGRAM Menu key.
The USE OF RAIN BY PROGRAM screen is
displayed (Figure 5.13).
Rain causes negative hold-over to build
which acts to cancel irrigation.
Allow RAIN on the following:
PROG A . . . . . . . . . . . . . . . . . . . . . . . . . . . . . .YES
PROG B . . . . . . . . . . . . . . . . . . . . . . . . . . . . . .YES
PROG C . . . . . . . . . . . . . . . . . . . . . . . . . . . . . .YES
PROG D . . . . . . . . . . . . . . . . . . . . . . . . . . . . . .YES
PROG E . . . . . . . . . . . . . . . . . . . . . . . . . . . . . .YES
DRIP 1 . . . . . . . . . . . . . . . . . . . . . . . . . . . . . . . YES
DRIP 2 . . . . . . . . . . . . . . . . . . . . . . . . . . . . . . . YES
USE OF RAIN BY P ROGRAM
Set Use of Rain by Program
Figure 5.13
Figure 5.12
Here you will have the option of enabling or
disabling the use of negative hold-over (rain) for any
of the controller’s seven programs. If you select
YES, rain (negative hold over) will be used for that
program to reduce irrigation run times. If you select
NO, rain will have no effect on irrigation run times for
that program.
making
ater work
since 1986
Page 27

w
® SECTION 5 WEATHER
If there is no rain bucket installed and you are not
sharing rain data through the Calsense Command
Center program, these settings will have no effect on
irrigation.
The default setting is NO. If you are currently using a
wind gage on this controller then change the setting
to YES.
4.
Press the PLUS or MINUS keys to
change the setting.
5.
Press the blue ARROW keys to
move the cursor to the next entry.
6. Press the MAIN MENU key to return
to the MAIN MENU screen
(Figure 5.1).
THIS CONCLUDES RAIN SETUP WITHOUT
RAIN
BUCKET INSTALLED SECTION
C. WIND GAGE
The Wind Gage setting in the controller is used to
measure the current wind speed used to pause and
resume irrigation by use of the following:
:
• Selecting Wind Gage activation.
• Setting wind pause speed.
• Setting wind resume speed.
• Selecting use of wind by program.
1. Wind Gage setup
From the WEATHER SETUP screen (Figure 5.2).
2.
Press the PLUS or MINUS keys to
change the settings.
The WIND GAGE SETUP screen will change to
reveal the irrigation wind settings (Figure 5.15).
Is controller Wired to a
PAUSE IRRIGATION when wind is higher
t han 15 MPH
RESUME IRRIGATION when wind is less
t han 10 MPH
Response to wind by Program
WIND GAGE SET UP
WIND GA GE ? YES
Figure 5.15
Note:
The pause and resume irrigation default
settings are 15 MPH pause and 10 MPH resume.
3.
Press the blue ARROW keys to
move the cursor to the next entry
(Figure 5.16).
Is controller Wired to a
PAUSE IRRIGATION when wind is higher
t han 15 MPH
RESUME IRRIGATION when wind is less
t han 10 MPH
WIND GAGE SETUP
WIND GAGE ? YES
1.
Press the WIND GAGE Menu key.
The WIND GAGE SETUP screen is displayed
(Figure 5.14).
Is controller Wired to a
WIND GAGE SET UP
WIND GAGE ? NO
Figure 5.14
Response to wind by Program
Figure 5.16
To change the Miles Per Hour that you want the
irrigation to pause at,
4.
Press the PLUS or MINUS keys
(Figure 5.17).
5.
Press the blue ARROW keys to
move the cursor to the next entry.
To set the Miles Per Hour that you want the
controller to resume irrigation at, (Figure 5.17).
making
ater work
since 1986
Page 28

w
SECTION 5 WEATHER
®
Is controller Wired to a
PAUSE IRRIGATION when wind is higher
than 15 MPH
RESUME IRRIGATION when wind is less
than 10 MPH
Response to wind by Program
WIND GAGE SETUP
WIND GAGE ? YES
Figure 5.17
6.
Use the PLUS or MINUS keys to
change the speed (Figure 5.17).
2. Respond to wind by Program
1.
Press the RESPONSE TO WIND BY
PROGRAM Menu key.
The USE OF WIND BY PROGRAM screen
(Figure 5.18).
When the wind speed is higher
than 15 MPH irrigation will be PAUSED.
Allow WIND to pause the following:
USE OF WIND BY PROGRAM
PROG A . . . . . . . . . . . . . . . . . . . . . . . . .YES
PROG B . . . . . . . . . . . . . . . . . . . . . . . . .YES
PROG C . . . . . . . . . . . . . . . . . . . . . . . . .YES
PROG D . . . . . . . . . . . . . . . . . . . . . . . . .YES
PROG E . . . . . . . . . . . . . . . . . . . . . . . . .YES
DRIP 1 . . . . . . . . . . . . . . . . . . . . . . . . . .YES
DRIP 2 . . . . . . . . . . . . . . . . . . . . . . . . . .YES
Figure 5.18
You can select the programs that you want to be
affected by wind. The default setting is YES. If you
do not
change the setting to NO for the appropriate
program.
2. Press the PLUS or MINUS keys to
change the settings.
3.
move the cursor to the next entry.
4.
to the MAIN MENU screen
(Figure 5.1).
want programs to be effected by wind
Press the blue ARROW key to
Press the MAIN MENU key to return
THIS CONCLUDES THE WIND GAGE SETUP
SECTION
D. RAIN SWITCH
This section of the controller is used to activate the
use of a rain switch and have the controller turn
irrigation off due to rain detection.
1. Rain Switch setup
From the WEATHER SETUP screen (Figure 5.2).
1. Press the RAIN SWITCH Menu key if you want to activate a Rain Switch.
The RAIN SWITCH SETUP screen is displayed
(Figure 5.19).
Is the controller connected to
a Rain Switch Device? YES
Irrigation will be ST OPPED when the
rain switch detects rain.
A Rain Switch is a device like a
MINI-CLIC or RAIN GUARD.
There's a special way to wire them to
this controller to avoid NO CURRENT
and NO FLOW errors.
RAIN SWITCH SET UP
Figure 5.19
2.
Press the PLUS or MINUS keys to
change the setting.
If you select YES this will change the screen to read,
“Irrigation will be stopped when the rain switch
detects rain”. If you do not want irrigation to be
affected by the rain switch leave the setting at the
default setting of NO (Figure 5.20).
CAUTION:
If YES is selected, and the controller is not hooked
up to a rain switch irrigation will be halted
. This is
due to rain switch wiring requirements.
Is the controll er connected to
a Rain Switch Device? YES
Irrigation will be STOPPED when the
rain switch detects rain.
A Rain Switch is a device like a
MINI-CLIC or RAIN GUARD.
There is special way to wire them to
this controller to avoid NO CURRENT
and NO FLOW errors.
RAIN SWITCH SETUP
Figure 5.20
THIS CONCLUDES THE RAIN SWITCH SECTION
making
ater work
since 1986
Page 29

w
(
)
A
A
® SECTION 5 WEATHER
E. ET
The ET section of the controller can be programmed
to use evapotransperation data accessed from an
ET Gage, or controller pre-set values, to compute
irrigation run times using the following:
• Irrigate using ET table
• Irrigate using ET averaging
• Adjust allowable percentage of historical ET
• Use of crop coefficients
From the WEATHER SETUP screen (Figure 5.2).
1. Press the ET Menu key.
The DAILY ET SETUP screen is displayed
(Figure 5.21).
Note: The text line directly under the heading bar
will have each program tag if you are currently using
them. (See Section 3 Start Times & Water Days /
Name:). If you do not have any selected the default
(………………………..) will appear.
1. Irrigate using ET table
A NO next to a program indicates the program is
using minutes. Once YES is selected for a program,
any station assigned to that program will now use
daily ET to automatically adjust the amount of time
the station will run during it’s next irrigation.
1. Press the PLUS or MINUS keys to
change the setting.
Note: If the setting is changed to YES for a program,
the USE ET AVERAGING setting will automatically
change to YES for that particular program.
DAILY ET SETUP
(…………………………….)
IRRIGATE USING USE
ET TABLE ET AVERAGING
PROG A: NO --PROG B: NO --PROG C: NO --PROG D: NO --PROG E: NO --DRIP 1: NO --DRIP 2: NO ---
8:00PM TO 8:00PM
Figure 5.21
2. Use ET averaging
A YES next to a program indicates ET averaging is
enabled for that program, which is only available if
the program is in daily-ET mode. With ET averaging
ON the controller will not use a single ET valve to
calculate the next run times. Instead it will use the
average of the last 7 days of ET (Figure 5.22).
IRR IGA TE USING U SE
ET TABLE ET AVERAGING
PROG A: YES YES
PROG B: NO --PROG C: NO --PROG D: NO --PROG E: NO --DRIP 1: NO --DRIP 2: NO ---
llowable % of Historical ET: 150%
Crop Coefficients
DAILY ET SETUP
Figure 5.22
3. Allowable % of historical ET
This setting controls the maximum allowable
amount of ET that can be used to calculate station
run times. The default is 150%, which means that if
real-time ET measured by the gage, exceeds 150%
of historical ET, the controller will place an ET value
in the ET table equal to 150% of historical ET
instead of the actual real-time ET. This setting allows
the user to control the maximum amount of total
irrigation time for sites that have a limited water
window (Figure 5.23).
Note:
The water window is the time from when you
can start irrigating to when you have to end
irrigation.
IRRIGATE USING USE
ET TABLE ET AVERAGING
PROG A: YES YES
PROG B: NO -- PROG C: NO -- PROG D: NO -- PROG E: NO -- DRIP 1: NO -- DRIP 2: NO -- -
llowable % of Historical ET: 150%
Crop Coefficients
DAILY ET SETUP
Figure 5.23
2. Press the PLUS or MINUS
keys to change the setting.
making
ater work
since 1986
Page 30

w
SECTION 5 WEATHER
4. Crop Coefficients
This setting is used to adjust ET for a specific type of
crop at different periods throughout the year. If you
4.
Press the blue ARROW keys to
move the cursor.
do not want ET to be modified, leave the selection
set at NO (Figure 5.24)
From the WEATHER SETUP screen (Figure 5.2).
5.
return to the MAIN MENU screen
(Figure 5.1).
Press the MAIN MENU key to
THIS CONCLUDES THE CROP COEFFICIENTS
1.
Menu key.
2.
change the setting.
Press the CROP COEFFICIENTS
Press the PLUS or MINUS keys to
SECTION
CAUTION:
When using Daily ET mode you will have to set each
Stations flow rate, Precipitation rate, and square
footage area for every program using Daily ET. The
following instructions cover how to set up station
Crop Coefficients I n Use: NO
CROP COEFFICIENTS
flow rates whether or not you have a flow meter
installed.
NO FLOW METER INSTALLED D
5. Station flow rates without a flow meter
present:
Figure 5.24
• Crop Coefficients In Use:
The default
setting is set to NO. By changing it to
YES the Screen will open up the Month
and Program Columns (Figure 5.25).
Crop Coefficients In Use: YES
A B C D E D1 D2
JAN 1. 00 1.00 1.00 1.00 1.00 1.00 1.00
FEB 1.00 1.00 1. 00 1.00 1.00 1.00 1.00
MAR 1.00 1.00 1.00 1.00 1.00 1.00 1.00
APR 1. 0 0 1. 00 1.00 1.00 1.00 1.00 1.00
MAY 1.00 1.00 1. 00 1.00 1.00 1.00 1.00
JUN 1. 00 1.00 1.00 1.00 1.00 1.00 1.00
JUL 1.00 1.00 1.00 1.00 1.00 1.00 1.00
AUG 1.00 1.00 1.00 1.00 1.00 1.00 1.00
SEP 1.00 1.00 1. 00 1.00 1.00 1.00 1.00
OCT 1.00 1.00 1.00 1. 00 1. 00 1.00 1.00
NOV 1.00 1.00 1.00 1.00 1.00 1.00 1.00
DEC 1.00 1.00 1.00 1.00 1.00 1.00 1.00
CROP COEFFICI ENTS
Figure 5.25
This will allow you the option of entering Crop
Coefficient values for each month of the year, on
each program in the controller. You must be familiar
with crop coefficients to use this feature.
3.
Press the PLUS or MINUS keys to
change the setting.
There are two methods to determine station flow
rates if a Calsense flow meter is not installed on the
system. The following describes each method
• How to calculate Station Flow rates
Using Manufacturer’s Published data:
With the first method, you use a manufacturer’s
catalog which has the flow rates (gpm) listed for the
type heads, and nozzle sizes on the system you are
calculating. Simply total the flow rates for all of the
nozzles on the station.
A station has 8 half-circle pop-ups with a flow rate of
2 GPM each, 3 full circle pop-ups at 4 GPM each
and 4 quarter circle pop-up heads at 1 GPM each.
The station’s flow rate would be calculated as
follows.
8 heads x 2 GPM = 16 GPM
3 heads x 4 GPM = 12 GPM
2 heads x 1 GPM = 2 GPM
Total flow = 30 GPM
Example:
®
making
ater work
since 1986
Page 31

w
A
y
® SECTION 5 WEATHER
• How to calculate Station Flow rates by
Measuring Station Flow Rates:
The second method may provide more accurate
results, by using the irrigation system’s water meter
to calculate flow rates. Use the following procedure:
o Determine the units used by the water
meter (Gallons, cubic feet, etc.) Make
sure no other water will be flowing while
you are measuring flow rates. Also, if
there is more than one water meter
connected to the mainline, all of them
must be turned-off except the one you
are using to measure flow with.
o Before beginning, turn on each station
to make sure there are no broken heads
or pipes which will cause incorrect flow
readings.
o Begin by turning on a station long
enough to purge all of the air out of the
system. Then simultaneously, make
note of the meter reading and start
timing using a stopwatch. After 3
minutes has elapsed make note of the
water reading again. Subtract the
starting meter reading from the ending
meter reading, this will give you the
amount of water used by the valve in 3
minutes. Continue this procedure until
all stations have been measured.
o To calculate the flow rate, divide the
amount of water the station used
(measured in gallons) by 3 minutes, this
will give you the station’s flow rate
measured in GPM’s.
Example #1
(if water meter units are in gallons):
The starting meter reading is 312,121 After 3
minutes the ending meter reading is 312,378
gallons, the flow rate would be calculated as follows:
312,378 gallons – 312,121 gallons = 257 gallons
257 gallons ÷ 3 minutes = 85.6 GPM
Example #2
(If water meter units are in cubic feet or CF):
The starting meter reading is 9,975 CF after 3
minutes the ending meter reading is 10,003 CF the
flow rate would be calculated as follows:
10,003 CF-9,975 CF = 28 CF
28 CF x 7.48 gallons = 209.4 gallons
(1 CF = 7.48 gallons)
209.4 gallons ÷ 3 minutes = 69.8 GPM
Example #3
(if water meter units are in hundreds of cubic feet or
CCF):
The starting meter reading is 12,321 CCF after 3
minutes the ending meter reading is 12,321.25 CCF,
the flow rate would be calculated as follows:
12,321.25 CCF – 12,321.00 CCF = .25 CCF
.25 CCF x 748 gallons = 187 gallons
(1 CCF =748 gallons)
187 gallons ÷ 3 minutes= 62.3 GPM
FLOW METER INSTALLED D
6. Station flow rates & Area with flow meter
installed.
From the MAIN MENU screen.
1.
Press the PROGRAMS & STATIONS
Menu key.
2.
Press the STATIONS Menu key.
3. Press the STATION UP or STATION
DOWN keys to select the station
desired.
The STATION PROGRAMMING screen is displayed
(Figure 5.26).
Station 1 . . . . . . . . . . . . . . PROG
Last M in : 2.3
Estimated Mins : 3.2 % of ET : 100 %
Mins per Cycle : 4
Soak-in Time : 5 No Water Da
Expected Flow = 25 GPM
Area = 3826 sq / Ft
Precip = 0.63 In / Hr
Test
STAT ION PROGRAMMING
Figure 5.26
making
0
ater work
since 1986
Page 32

w
A
SECTION 5 WEATHER
®
Last Min: This is the amount of time
programmed on this station prior to selecting
the use of Daily ET.
Estimated Mins: This is the total estimated
minutes for this station using Daily ET, and
is calculated automatically.
% of ET: This value can be adjusted to
increase or decrease the amount of
estimated time on a station based on
percentage of ET.
Expected Flow: This is the station expected
flow rate. You can either learn the expected
flow rate (See section 4 Learn Expecteds),
or set the flow rate number yourself.
Area: This is the amount of area in square
feet that all of the heads assigned to the
valve / station encompass.
Precip: This entry is the precipitation rate
for all of the heads assigned to this valve /
station and is calculated automatically by
using the flow rate and area square footage.
4. Press the blue ARROW keys to
move the cursor to the setting.
5.
Press the PLUS or MINUS keys to
change the highlighted selection.
6.
Press the MAIN MENU key to
return to the MAIN MENU screen
(Figure 5.1).
THIS CONCLUDES THE ET SECTION
• Enter a yearly budget and have the
controller divide it among the months using
your City ET. (see Section 5 H. ET County /
City)
From the WEATHER SETUP screen (Figure 5.2).
1.
Press the BUDGET Menu key.
The WATER USE BUDGET screen is displayed
(Figure 5.27)
Compare Water Use to a BUDGET ? NO
WATER USE BUDGET
Figure 5.27
2.
Press the PLUS or MINUS keys to
select YES for budget use.
You will be able to choose between three different
types of budget settings.
1. Directly enter the monthly budgets
The first setting will be DIRECTLY ENTER THE
MONTHLY BUDGETS (Figure 5.28).
Compare Water U se to a BU DG ET? YES
Option: Directly Enter the M onthly
budgets.
WATER USE BUDG ET
F. BUDGET
The Budget feature of the controller allows you to
compare actual water usage with a water budget
that has been programmed into the controller by the
user. The user will be alerted whenever the actual
water usage exceeds the budget. Once the budget
feature has been enabled, there will be three budget
options to choose from:
• Directly enter the monthly budgets.
• Controller will automatically calculate the
budget amount using the total square
footage and your City ET.(see Section 5 H.
ET County / City)
( in Gallons )
JAN 4129 MAY 18252 SEP 14601
FEB 6383 JUN 20027 OCT 9734
MAR 10472 JUL 21902 NOV 5425
PR 15320 AUG 19469 DEC 3411
Figure 5.28
1.
select each individual months
amount.
2.
change each entry.
Press the blue ARROW keys to
Press the PLUS or MINUS keys to
making
ater work
since 1986
Page 33

w
A
® SECTION 5 WEATHER
Note: When you exit this screen your entry’s will be
saved.
2. Controller will automatically calculate the
budget amount using the total square
footage and your city ET.
1.
In the WATER USE BUDGET screen
(Figure 5.28). In the OPTIONS:
setting press the PLUS or MINUS
keys to change the setting to
CONTROLLER WILL
AUTOMATICALLY CALCULATE
THE BUDGET AMOUNT USING
THE TOTAL SQUARE FOOTAGE
AND YOUR CITY ET (Figure 5.29).
Compare Water Use to a BUDGET? YES
Option: Controller will automatically
calculate the budget am ount
using the total square footage
and your city ET .
Calculate budgets at 80% of ET
( in Gallons )
JAN 4129 MAY 1825 2 SEP 14601
FEB 6383 JUN 20027 O C T 9734
MAR 10472 JUL 2190 2 NOV 5425
APR 15320 AUG 19469 DEC 3411
WATER U SE BUDGET
Figure 5.29
2.
Press the blue ARROW keys to
select the CALCULATE BUDGETS
AT ## % OF ET setting.
3.
Press the PLUS or MINUS keys to
change the percentage entry, the
numbers for each months entries will
automatically adjust.
Note:
When you exit this screen your data will be
saved.
3. Enter a Yearly Budget and have the controller
divide it among the months using your city ET.
1.
In the WATER USE BUDGET screen
(Figure 5.28). In the OPTIONS:
setting press the PLUS or MINUS
keys to change the setting to ENTER
A YEARLY BUDGET AND HAVE
THE CONTROLLER DIVIDE IT
AMONG THE MONTHS USING
YOUR CITY ET setting (Figure 5.30).
Compare Water Use to a BUDGET? YES
Option: Enter a Yearly Bu dget and have
the controller divide it among
the months using your city ET.
Yearly budget is 149125 gal
( in Gallons )
JAN 4129 MAY 18252 SEP 14601
FEB 6383 JUN 20027 OCT 9734
MAR 10472 JUL 21902 NOV 5425
PR 15320 AUG 19469 DEC 3411
WATER USE BUDGET
Figure 5.30
2.
Press the blue ARROW keys to
select the YEARLY BUDGET IS
######## GAL setting.
3.
Press the PLUS or MINUS keys to
change the amount entry, the
numbers for each months entries will
automatically adjust.
Note:
When you exit this screen your data will be
saved.
THIS CONCLUDES THE BUDGET SECTION
G. MOISTURE
The Moisture section of the controller, along with the
use of 1000-S moisture sensors, allows you to:
• Set up moisture sensing use by program.
• Assign individual sensors to stations.
• Designate and share sensor data from
master stations to slave stations.
From the WEATHER SETUP screen (Figure 5.2).
1.
Press the MOISTURE Menu key.
The MOISTURE SENSING SETUP screen is
displayed (Figure 5.31).
Moisture Sensing in Use ? NO
MOISTURE SENSING SETUP
Figure 5.31
making
ater work
since 1986
Page 34

w
SECTION 5 WEATHER
®
If you are currently using Moisture sensors on this
controller then change the setting to YES.
2.
Press the PLUS or MINUS keys to
change the settings.
1. Moisture Sensor Setup
The MOISTURE SENSOR SETUP screen will
change to reveal the Use by Program settings
(Figure 5.32).
Moistur e Sensing in Use ? YES
USE BY PROGRAM
PROG A . . . . . . . . . . . . . . . . . . . . . . . . . . YES
PROG B . . . . . . . . . . . . . . . . . . . . . . . . . . YES
PROG C . . . . . . . . . . . . . . . . . . . . . . . . . . YES
PROG D . . . . . . . . . . . . . . . . . . . . . . . . . . YES
PROG E . . . . . . . . . . . . . . . . . . . . . . . . . . YES
DRIP 1 . . . . . . . . . . . . . . . . . . . . . . . . . . YES
DRIP 2 . . . . . . . . . . . . . . . . . . . . . . . . . . YES
Sensor Assignment
MOISTURE SENSING SETUP
Figure 5.32
1.
Press the blue ARROW keys to
move the cursor to the next entry
(Figure 5.33)
Moisture Sensing in Use ? YES
USE BY PROGRAM
PROG A . . . . . . . . . . . . . . . . . . . . . . . . . . YES
PROG B . . . . . . . . . . . . . . . . . . . . . . . . . . YES
PROG C . . . . . . . . . . . . . . . . . . . . . . . . . . YES
PROG D . . . . . . . . . . . . . . . . . . . . . . . . . . YES
PROG E . . . . . . . . . . . . . . . . . . . . . . . . . . YES
DRIP 1 . . . . . . . . . . . . . . . . . . . . . . . . . . YES
DRIP 2 . . . . . . . . . . . . . . . . . . . . . . . . . . YES
Sensor Assignment
MOISTURE SENSING SETUP
Figure 5.33
2.
Press the PLUS or MINUS keys
to change the Use by Program.
3.
Press the blue ARROW keys to
move the cursor to the next entry.
Note:
This will allow you to set up the programs that
you want to use Moisture Sensors on.
Note:
The controller may be set up for some
programs to use ET, other programs to use
moisture, or programs can be set up to use a
combination of the two.
2. Moisture Sensor Assignment
1.
Press the SENSOR ASSIGNMENT
Menu key.
The MOISTURE SENSOR ASSIGNMENT
SCREEN (Figure 5.34).
MOISTURE SENSOR ASSIGNMENT
Station 01 02 03 04 05 06 07 08 09 10
Sensor 01 02 03 04 05 06 07 08 09 10
Station 11 12 13 14 15 16 17 18 19 20
Sensor 11 12 13 14 15 16 17 18 19 20
Station 21 22 23 24 25 26 27 28 29 30
Sensor 21 22 23 24 25 26 27 28 29 30
Station 31 32 33 34 35 36 37 38 39 40
Sensor 31 32 33 34 35 36 37 38 39 40
Figure 5.34
Next, you will have to enter the settings for each
Moisture sensor assigned to a station.
A representative station for each different climatic
and plant material zone on the controller is given a
sensor and is known as a Master station. Slave
stations are stations without sensors and are
assigned to a master station which share similar
water requirements. The choice of groups of stations
controlled by the same sensor is done at the
controller within the MOISTURE SENSOR
ASSIGNMENT screen.
Example:
Station: 01 02 03 04 05 06 07 08 09 10
Sensor: 01 02 03 04 05 06 07 08 09 10
becomes
Station: 01 02 03 04 05 06 07 08 09 10
Sensor: 01 02 03 04 03 03 07 03 09 10
Note:
In the example above station 03 is the Master
station (the station with the moisture sensor) and
stations 05, 06, and 08 are now slaves stations to
station 03 (Highlighted in the example).
2.
Press the PLUS or MINUS keys to
change the entry.
making
ater work
since 1986
Page 35

w
R
A
R
A
® SECTION 5 WEATHER
3. Press the blue ARROW keys
to move the cursor to the next entry.
4.
have been set up properly, press
the MAIN MENU key to return to the
MAIN MENU screen (Figure 5.1).
Note: New settings will be available in the STATION
PROGRAMMING screen for each
using Moisture sensing and will have to be
programmed individually.
5. Press the PROGRAMS &
STATIONS Menu key (Figure 5.1).
The PROGRAMS & STATIONS screen is displayed
(Figure 5.35).
Once all of the Moisture Sensors
station that is
PROGRAMS & STAT IONS
Star t Times & Water Days
• MAX DAYS:
This entry is used to
automatically bypass the moisture
sensors of individual stations so they
will receive their maximum
programmed water time. The controller
will display the number of days
remaining and can be cleared at any
time. After the programmed Maximum
Water has elapsed, the system will
automatically return to moisture sensing
operation (Figure 5.37).
Station 1 . . . . . . . . . . . . . . . . . . . . . . . . . . . . PROG
Total Mins : 5.0
Mins per Cycle : 2.5
Soak-In T ime : 5 No Water Days 0
Max Days : 00
Moist Set : 99
Moist Read : - MASTE
Test
STATION PROGRAMM ING
Figure 5.37
Stations
Station-to-Station Copy
Figure 5.35
6. Press the STATIONS Menu key.
The STATION PROGRAMMING screen is displayed
(Figure 5.36).
Station 1 . . . . . . . . . . . . . . . . . . . . . . . . . . . . PROG
Total Mins : 5.0
Mins per Cycle : 2.5
Soak-In Time : 5 No Water Days 0
Max Days : 00
Moist Set : 99
Moist Read : - MASTE
Test
STATION PROGRAMMING
Figure 5.36
7.
Press the blue ARROW keys to
move the cursor to the MAX DAYS
entry.
8.
Press the PLUS or MINUS keys to
change the entry.
9.
Press the blue ARROW keys to
move the cursor to the MOIST SET
entry.
• MOIST SET: The Calsense
Moisture Sensor has it’s
own numerical system of moisture
readings. Typically it reads between
the range of 45 (dry) to 85 (wet). By
keeping moisture set points at 99,
the sensors are never allowed to
read above the set point value, and
the controller waters the full
programmed time. This occurs for
the Master station as well as all
slave stations assigned to the
Master Station. After a few weeks,
the slave areas should be checked
and readjusted if necessary. If the
slave area is to dry, adjust it’s
maximum time to 10% more. If the
area is to wet, decrease it by the
same percentage. In both cases,
the area should be rechecked after
another few weeks, with
readjustments made until
the proper siol moisture level is
achieved (Figure 5.38).
making
ater work
since 1986
Page 36

w
R
A
A
R
V
V
SECTION 5 WEATHER
®
Station 1 . . . . . . . . . . . . . . . . . . . . . . . . . . . . PROG
Tota l Mins : 5.0
Mins per Cycle : 2.5
Soak-In Time : 5 No Water Days 0
Max Days : 00
Moist Set : 99
Moist Read : - MAST E
Test
STATION PROGRAMMING
Figure 5.38
• MOIST READ:
This entry is non-
changeable. As a moisture sensor
reading goes above the determined
moisture set point, the controller
stops irrigation. When the moisture
level reading drops below the
moisture set point. The controller
automatically begins to irrigate more
of the programmed time to where it
may water the full programmed
amount (Figure 5.39).
Station 1 . . . . . . . . . . . . . . . . . . . . . . . . . . . . PROG
Total Mins : 5.0
Mins per Cycle : 2.5
Soak-In T ime : 5 No Water Days 0
Max Days : 00
Moist Set : 99
Moist Read : 45
MASTE
Test
STATION PROGRAMM ING
Figure 5.39
3. Test Moisture Sensor
1.
Press the TEST Menu key to test the
station that you are currently on.
2.
If you want to test a different station
press the STATION UP or STATION
DOWN keys to the right of the display
screen.
Note:
This will only test the station selected, but will
not get a reading from the moisture sensor.
If you want to retrieve a current reading from the
moisture sensor,
3.
Press the MANUAL Menu key.
The MANUAL IRRIGATION screen (Figure 5.40).
Manual Watering Manual Program 1
Test Manual Program 2
MV Override Walk-Thru
Use Hold-Over
MANUAL MENU
Figure 5.40
4. Press the TEST Menu key.
The VALVE TESTING screen is displayed
(Figure 5.41).
Learn the Expected at Station 1
Test Station 1 for 2.0 minutes
Test Station 1 for Moisture Sensor
( MASTER )
ALVE TESTING
Figure 5.41
5.
Press the blue ARROW keys to
move the cursor to the TEST
STATION # FOR MOISTURE
SENSOR Entry (Figure 5.42).
Learn the Expected at Station 1
Test Station 1 for 2.0 minutes
Test Station 1 for Moisture Sensor
( MASTER )
ALVE TEST ING
Figure 5.42
6.
Press the PLUS or MINUS key to
change the station entry.
making
ater work
since 1986
Page 37

w
A
R
® SECTION 5 WEATHER
Note: Only Master stations can test Moisture sensor
for readings.
The ET COUNTY / CITY screen is displayed
(Figure 5.44).
7.
Press the TEST STATION # FOR
MOISTURE SENSOR Menu key to
activate test. The screen will show
“READING SENSOR ON # please
wait (Less than 15 seconds)” for
which ever station you selected.
After a brief test the STATION
PROGRAMMING screen will appear
with the Moisture Sensor reading
displayed (Figure 5.43).
Station 1 . . . . . . . . . . . . . . . . . . . . . . . . . . . . PR OG
Total Mins : 5.0
Mins per Cycle : 2.5
Soak-In T ime : 5 No Water Days 0
Max Days : 00
Moist Set : 99
Moist Read : 45
MASTE
Test
STATION PROGRAMMING
Figure 5.43
THIS CONCLUDES THE MOISTURE
SECTION
H. ET COUNTY / CITY
This section of the controller is only available if using
budgets, or ET by program, and is used for:
• Selecting pre-programmed County
& City monthly ET values.
• Setting your own County & City
monthly ET values.
1. ET County / City setup
From the WEATHER SETUP screen (Figure 5.2).
1.
Press the ET COUNTY / CITY Menu
key.
Source: Enter Your Own Numbers Below
County: KERN
City: CHINA LAKE
JAN FEB MAR APR MAY JUN
2.1 3.2 5.3 7.7 9.1 10.0
JUL AUG SEP OCT NOV DEC
11.0 9.8 7.3 4.9 2.7 1.7
REFERENCE ET NUMBERS
Figure 5.44
2.
Press the PLUS or MINUS key to
change the County.
3.
Press the blue ARROW keys to
move the cursor to the City entry
(Figure 5.45).
4.
Press the PLUS or MINUS key to
change the City.
As explained in the (ET and Rain Tables) portion of
this guide, historical ET is used as a back-up to realtime daily-ET, or it can be used as the source data
to drive the program if real time ET is not used. In
either case, you would want to use historical ET for
the area you are located in. The ET2000 controller
stores historical ET information for counties in
California, and numerous cities within each of those
counties. Select the area that most closely
represents your location (Figure 5.45)
Source: Enter Your Own Numbers Below
County: KERN
City: CHINA LAKE
JAN FEB MAR APR MAY JUN
2.1 3.2 5.3 7.7 9.1 10.0
JUL AUG SEP OCT NOV DEC
11.0 9.8 7.3 4.9 2.7 1.7
REFERENCE ET NUMBERS
Figure 5.45
making
ater work
since 1986
Page 38

w
SECTION 5 WEATHER / SECTION 6 REPORTS
®
You can also choose to enter your own ET numbers.
If you have selected to enter your own numbers, you
will be allowed to edit the numbers under each
month (Figure 5.46).
Source: Enter Your Own Numbers Below
JAN FEB MAR APR MAY JUN
2.1 3.2 5.3 7.7 9.1 10.0
JUL AUG SEP OCT NOV DEC
11.0 9.8 7.3 4.9 2.7 1.7
REFERENCE ET NUMBERS
Figure 5.46
2.
Press the blue ARROW keys to
select a setting.
3.
change the setting.
4.
Press the PLUS or MINUS keys to
Press the MAIN MENU key to return
to the MAIN MENU screen (Figure
5.1).
THIS CONCLUDES THE ET COUNTY / CITY
SECTION
SECTION 6: REPORTS
The reports section of the controller is used to view
the following report information:
• This Month / last Month.
• 24 Month.
• Hold-Over.
• ET & Rain Tables.
• Alerts.
• Station History.
• Use verses Budget.
• Live screens.
A. THIS MONTH / LAST MONTH
The This Month / Last Month report allows you to
view water usage in Gallons, Hundreds of Cubic
Feet, or by time used on each station for the current
month, to the previous month, in the following
categories:
• Irrigation.
• Test and Manual.
• Non-Controller usage.
1.
The MAIN MENU screen (Figure 6.1).
Press the MAIN MENU key.
CALSENSE WATER MANAGEMENT SYST EM
Programs & Stations Lights
Weather Reports
Flow Radio Remote
Setup Status
Figure 6.1
2.
Press the REPORTS Menu key.
making
ater work
since 1986
Page 39

w
y
r
A
A
® SECTION 6 REPORTS
The REPORTS menu screen is displayed
(Figure 6.2).
This Month / Last Month Alerts
24 Month Station Histor
Hold Ove
ET & Rain Tables Live Screens
REPORTS
Figure 6.2
3.
Press the THIS MONTH / LAST
MONTH Menu key.
The THIS MONTH / LAST MONTH TOTALS screen
is displayed (Figure 6.3)
THIS MONTH / LAST MONTH TOTALS
(gallons) This Month Last Month
Irrigated: 6169.3 0.0
Test & Manual: 2009.0 0.0
Non Controller: 240873.4 0.0
STAT ION 1
Irrigated: 2181.6 0.0
HCF Show Time
Figure 6.3
4.
Press the PLUS or MINUS keys to
select the desired station.
5.
Press the HFC Menu key to
change the information to
Hundreds of Cubic Feet.
6.
Press the GALLONS Menu key to
change information back to
Gallons.
7.
You can also view Time in Minutes
for each station by pressing the
SHOW TIME Menu key.
8.
To change the information back to
Water Usage press the SHOW
WATER USE Menu key.
THIS CONCLUDES THE THIS MONTH / LAST
MONTH SECTION
B. 24 MONTH
The 24 month report shows the amount of water
used, budgeted (if budget enabled), and ET (if ET
enabled) for the last 24 months.
From the REPORTS menu screen (Figure 6.2).
1.
Press the 24 MONTH Menu key.
The 24 MONTH screen is displayed (Figure 6.4)
Last Year USE BUDGET ET
Jan 2005 0 0 0.00
Feb 2005 0 0 0.00
Mar 2005 0 0 0.00
pr 2005 26380 25309 3.62
May 2005 32283 31288 4.83
Jun 2005 48282 49223 5.32
Jul 2005 53929 51283 6.01
ug 2005 64833 51283 6.98
Sep 2005 53222 50392 5.51
Oct 2005 41892 40299 4.32
Nov 2005 31223 32438 3.11
Dec 2005 22983 21343 2.01
24 M ONT H HIST ORY
Figure 6.4
The report is listed in three columns:
• USE: The amount of water used (gallons)
• BUDGET: The amount set in the budget
(gallons)
• ET: The amount of ET for the month
(inches)
2.
Press the LAST YEAR Menu key
to access last year’s information.
3.
Press the THIS YEAR Menu key to
go back to this year’s information
THIS CONCLUDES THE 24 MONTH SECTION
C. HOLD-OVER
Hold over occurs if the controllers irrigation cycle is
forced to end before it has finished, any unfinished
irrigation will be saved as hold-over time, the
controller will then try to use up this hold over time
during subsequent irrigation cycles when
programmed to do so.
making
ater work
since 1986
Page 40

w
SECTION 6 REPORTS
®
The Hold-Over section of the controller allows you
to:
• Set positive or negative individual hold over
time per station.
• Clear an individual stations hold-over time.
• Clear all station hold over times on
controller.
From the REPORTS menu screen (Figure 6.2).
1. Press the HOLD-OVER Menu key.
The HOLD-OVER screen is displayed (Figure 6.5).
STN HOLD-OVER(mins)
1 0.0
2 0.3
3 1.6
4 2.0
5 0.0
6 0.0
7 2.0
8 3.0
Clear ALL Clear Station
HOLD-OVER MINUTES
Figure 6.5
2.
Press the STATION UP /
STATION DOWN Menu key to
view each station assigned.
3.
Press the PLUS or MINUS keys to
change station values.
4.
Press the CLEAR STATION Menu
key to clear all hold over for that
particular station.
5.
Press the CLEAR ALL menu key
to clear all stations at one time.
THIS CONCLUDES THE HOLD-OVER SECTION
D. ET & RAIN TABLES
The ET & Rain Table section of the controller allows
you to look at the last consecutive 28 days of ET
and Rain data.
From the REPORTS menu screen (Figure 6.2).
1.
Press the ET & RAIN TABLES
Menu key.
The ET & RAIN TABLE screen is displayed
(Figure 6.6).
ET T able: (from 08/25/2005 back) 3
Thu Wed Tue Mo n Sun Sat Fri
g.30 g.29 e.28 g.30 c.28 g.29 h.3 1
h.31 h .31 h.31 h.31 h.31 h.31 h.31
h.31 h .31 h.31 h.31 h.31 h.31 h.31
h.31 h .31 h.31 h.31 h.31 h.31 h.31
Rain Tab le: (ta ble: 4 repor t: 14 )
Thu Wed Tue Mo n Sun Sat Fri
o.00 m.05 r.12 s m.02 o.00
o.00 o .00 o.00 o.00 o.00 o.00 o.00
o.00 o .00 o.00 o.00 o.00 o.00 o.00
o.00 o .00 o.00 o.00 o.00 o.00 o.00
ET & RAIN TABLE
Figure 6.6
1. Reports / ET & Rain table (ET)
The ET Table (Figure 6.6) is where the controller
stores daily ET numbers (measured in inches). The
numbers in the table are used to determine the
amount of irrigation to be applied by each station
and can be generated from the following sources:
o Automatically generated from an ET
Gage wired to the controller.
o Automatically generated from Campbell
Scientific weather station.
o Automatically shared from another
controller connected to an ET Gage
using Calsense Command Center
software. (Controllers must have
communication capabilities to share
ET).
o Historical ET which is automatically
entered into the ET Table when Daily
ET is enabled, and remains in the table
until it is replaced by real time ET from
an ET gage or manually edited by the
user.
o Manually edit the ET Table.
The ET table stores the last 28 days of ET numbers.
In the example in Figure 6.6 the ET table has a
combination of Historical ET, actual real-time ET and
user edited ET. The letter next to each number
indicates how the number got into the ET Table:
h – historical This means the (ET) number was
retrieved from the historical (ET) table.
g – ET Gage This means the (ET) number was
retrieved from an actual real-time (ET) gage.
e – edited This means the (ET) number was edited
at the controller by a user.
c – Central This means the central created the (ET)
value due to the real-time (ET) value being below
the minimum (ET) set by the user.
Prior to irrigation, the controller will read the number
in the ET table and use it to recalculate the irrigation
run times for each station.
making
ater work
since 1986
Page 41

w
(
)
*
® SECTION 6 REPORTS
2. Reports / ET & Rain table (Rain)
The Rain Table (Figure 6.6) is where the controller
stores rainfall numbers (measured in inches). The
numbers in this table can be generated from the
following sources:
o Automatically generated from a Rain
Bucket wired to the controller.
o Automatically generated from Campbell
Scientific weather station.
o Automatically shared from another
controller connected to a Rain Bucket
using Calsense Command Center
software. (Controllers must have
communication capabilities to share
rain).
o – Original This value is zero (no usable rain), it
has no effect on irrigation run times.
m – Below minimum The below minimum value is
measured rain but it is not enough to offset irrigation
run times.
r – usable rain This value is rain that is used to
offset irrigation run times.
s – Shutdown This means that irrigation was
stopped due to rain polling being shared with this
controller.
The usable rain in the Rain Table is used to reduce
each stations irrigation run times determined by the
precipitation rate. Usable rain in the Rain Table is
determined by settings programmed at the Rain
Bucket setup screen at the controller. When
scheduled irrigation is set to occur, the controller will
use up the usable rain first by the amount of time
scheduled to irrigate for each station. Until the
usable rain is used up, there will be no irrigation.
This will continue until all of the rain is used up at
which time the irrigation will start again.
(Table: 0 Reports: 0): These two values appear in
(Figure 6.6) and are defined as follows:
• Table: Shows the amount of usable rain
pulses recorded during a one hour period, in
the controller, that will be applied to
irrigation.
• Reports: Shows the amount of total rain,
recorded by the controller, during a one hour
period.
Note: The number in the upper right hand corner of
the screen (Represented by a 3 in Figure 6.6) is the
total recorded ET gage pulses in the last 24 hours.
THIS CONCLUDES THE ET & RAIN TABLES
SECTION
E. ALERTS
Alerts are a chronological listing of each individual
event that has taken place, or changes that have
been made to the controller. They can be viewed at
the controller physically or obtained from the
controller via communication. The Alerts section of
the controller allows you to view the controller alerts
in the following arrangements:
• All Alerts.
• Change (alterations made by use of
Command Center software, or by controller
keypad).
• Irrigation.
• Status View.
• Go To Top (Returns the highlight cursor to
the top of the current list of alerts being
viewed).
From the REPORTS menu screen (Figure 6.2).
1.
key.
Note:
If the “ALERTS TO SEE” menu key is
available on the STATUS screen when the ALERTS
MENU key is pressed it will cause the MOST
RECENT ALERTS screen to come up, if not the
ALERTS screen will appear as in figure 6.7.
The ALERTS screen is displayed (Figure 6.7).
2.
to scroll up and down the list.
Press the ALERTS Menu
4 Total Alerts - on 1 of 4
11/18 9: 52AM Radio Remote Finished (**
11/18 9: 51AM Radio Remote Enabled (norm)
11/18 1: 10AM END: Programmed Irrigation
11/18 12:10AM START: Programmed Irrigation
(Use "*" key for other views)
ALL
Figure 6.7
Press the PLUS or MINUS keys
making
ater work
since 1986
Page 42

w
g
SECTION 6 REPORTS
• Inches applied.
Note: Press the STAR key to access the
WHICH ALERTS TO SEE screen which will give you
a presorted view of the alerts based on alert type.
(Figure 6.8).
Communic ations
Status View Change
Irr igation
Go T o To p All
WHICH A LER TS TO SEE
Figure 6.8
• High flow limit.
• Low flow limit.
• Actual flow.
• Minutes of Hold-Over.
• Applicable Flag letter alerts. (See Enclosure
2).
From the REPORTS menu screen (Figure 6.2).
1.
Press the STATION HISTORY
Menu key.
The STATION HISTORY screen is displayed
(Figure 6.10).
®
3.
Press the appropriate Menu
key to access the alerts that
you want to see.
Note:
Alerts can also be accessed when the
“ALERTS TO SEE” menu key appears on the
STATUS screen (Figure 6.9).
Note:
From the STATUS screen pressing the
ALERTS TO SEE menu key will allow you to view
the alerts listed under the STATUS VIEW
arrangement (Figure 6.9).
(live screens ) ( adjust s tations )
PROGRAMED IRRIGATION WILL RUN
ALERTS TO SEE
0 GPM 0.03 AMPS
STATUS
No Statio ns are Watering
12:00AM on Sunday Apr 2, 2006
Tue 10:50:25AM
Mar 28 2006
Figure 6.9
THIS CONCLUDES THE ALERTS SECTION
PROG APPLIED
Date & T ime PRG CYC MIN MIN GAL
11/21 2 :20PM A 1 4.0 4.0 96
11/20 2 :20PM A 1 4.0 4.0 96
11/18 2 :20PM A 1 4.0 4.0 96
11/14 2 :20PM A 1 4.0 4.0 96
11/13 2 :20PM A 1 4.0 4.0 96
11/11 2 :20PM A 1 4.0 4.0 96
11/07 2 :20PM A 1 4.0 4.0 96
11/07 2 :20PM A 1 4.0 4.0 96
Pa
STATION 1 HIST ORY
e Right
Figure 6.10
2.
Press the PLUS or MINUS keys
to scroll up and down the screen
to view additional information.
3.
Press the PAGE LEFT Menu key
to view the next screen
(Figure 6.11).
:- - FLOW- - - : MOISTURE
Date & T ime HI GPM LO SET READ FLAG
11/21 2:20PM 19 24 29 99 41
11/20 2:20PM 19 24 29 99 41
11/19 2:20PM 19 24 29 99 41
11/17 2:20PM 19 24 29 99 41
11/16 2:20PM 19 24 29 99 41
11/10 2:20PM 19 24 29 99 41
11/09 2:20PM 19 24 29 99 41
11/08 2:20PM 19 24 29 99 41
Page Left
STAT ION 1 HIS TORY
F. STATION HISTORY
The Station History report section of the controller
allows you to view individual station irrigation
information which include the following:
• Date and time irrigated.
• Program station assigned to.
• Number of cycles.
• Programmed minutes.
• Minutes applied.
Figure 6.11
4.
key to view the previous screen
(Figure 6.10).
THIS CONCLUDES THE STATION HISTORY
Press the PAGE RIGHT Menu
SECTION
making
ater work
since 1986
Page 43

w
g
® SECTION 6 REPORTS
G. USE VS. BUDGET
The Use Vs. Budgets option is only available if
budgets are turned on in the controller under the
weather menu.
This section of the controller allows you to view the
predicted outcome for the month based on your
current controller settings.
From the REPORTS menu screen (Figure 6.2)
1. Press the USE VS. BUDGET
Menu key.
The PERFORMANCE TO BUDGET screen is
displayed (Figure 6.12)
November Budget : 74684 gal
Use From S tart of Month : 9866 gal
Expected for November : 12851 gal
NOTES:
1) Use & Expected are Scheduled plus Test
plus Manual.
2) The Expected use takes into account
the irrigation schedule along with
your Test and Manual usage pattern.
PERFORMA NCE TO BUDGET
Figure 6.12
Irrigation Activity
Irri
Real-T ime Flow
REAL-TIME DISPLAYS
ation Details
Figure 6.13
1. Irrigation Activity
1. Press the IRRIGATION
ACTIVITY Menu key.
The IRRIGATION ACTIVITY screen is displayed
(Figure 6.14).
IRRIGATION ACTIVITY
Manually Watering (mv open-pump off)
3.4 Min of 4.0 Min Cycle
24 is the Expected Flow
Details
24 GPM 0.03 AMPS 0 MPH
Figure 6.14
Note: You can press the STAR key to
change the view on the screen from Gallons
to Hundreds of Cubic Feet and back again.
THIS CONCLUDES THE USE VS. BUDGET
SECTION
H. LIVE SCREENS
This section of the controller allows you to view:
• Current Irrigation activity.
• Current Irrigation Details.
• Current Real-Time flow.
From the REPORTS menu screen (Figure 6.2).
1.
key.
The REAL-TIME DISPLAYS screen is displayed
(Figure 6.13)
Press the LIVE SCREENS Menu
2. Press the DETAILS Menu key
to access the IRRIGATION
DETAILS screen
(Figure 6.15).
2. Irrigation Details
From the REPORTS menu screen (Figure 6.2).
1. Press the LIVE SCREENS Menu
key to access the REAL-TIME
DISPLAYS screen (Figure 6.13)
2. Press the DETAILS Menu key
to access the IRRIGATION
DETAILS screen
(Figure 6.15).
Note:
From here you can view the irrigation details
for each station currently irrigating, testing, manually
watering, waiting, or soaking.
making
ater work
since 1986
Page 44

w
SECTION 6 REPORTS / SECTION 7 LIGHTS
®
IRRIGATION DETAILS
STN REASON HOLD T OTAL SOAK CYCLE
1 MAN 0.0 0.0 0 .0 3.6 O N
Clear Station
Figure 6.15
3.
Press the PLUS or MINUS keys
to highlight the station that you
want to clear.
4.
Press the CLEAR Menu key to clear
the highlighted station (Figure 6.16).
Note: Clearing a station will cease the operation for
that station delegated on that particular line entry.
3. Real-Time Flow
Real time flow allows the user to view the following:
• System flow rate
• Average flow rates
• Expected flow rate
• Flow meter attached to which controller and
the rate at which it is currently flowing
• Whether the system is stable or unstable
• Master valve open or closed
• The number of valves that are currently on.
• Number of controllers in the chain.
From the REPORTS menu screen (Figure 6.2).
1. Press the LIVE SCREENS Menu
key to access the REAL-TIME
DISPLAYS screen (Figure 6.13)
2.
Press the REAL TIME FLOW Menu
key.
The REAL-TIME FLOW screen is displayed
(Figure 6.16)
22.9 system flow
22 avg flow
0 exp ected flow S
Valve s
F1 F2 F3 ON MV
A 23 X X 0 Closed
REAL-T IME FLO W
SECTION 7: LIGHTS
A. PROGRAMMING A LIGHTS SCHEDULE
You can program up to four (4) individual light
programs, with two (2) different start and stop times,
each and a rolling two (2) week schedule.
From the MAIN MENU screen.
1.
The LIGHTS SCHEDULING & MANUAL
OPERATION screen is displayed (Figure 7.1)
2.
scroll through the four (4) light
program screens. They are
designated as L1:, L2:, L3: and L4:
Note:
The lights program names can be changed by
the user via Command Center software.
Once you have selected the lights program that you
want to use.
3.
highlight the date entry. You can
select any date between now and
two weeks from today’s date.
4.
highlight the ON TIMES (Two per
program), and OFF TIMES (two
per program).
Press the LIGHTS Menu key.
LIGHT S SCHEDULING & MANUAL OPERAT ION
L1:
Schedle for : Fri, O ct 28 2005
ON TIMES: OFF OFF
OFF TIMES: OFF OFF
Status: OFF
currently: Manually Start
Fri 10/28/05 1:24:52PM
Figure 7.1
Press the PLUS or MINUS keys to
Press the blue ARROW keys to
Press the blue ARROW keys to
Figure 6.16
5.
Adjust the times by using the PLUS
or MINUS keys.
making
ater work
since 1986
Page 45

w
® SECTION 7 LIGHTS / SECTION 8 RADIO REMOTE
B. TESTING A LIGHTS CIRCUIT
1.
You can also test a light circuit by
pressing the MANUALLY START
Menu key.
This will activate the program selected for four hours
from the time you pressed the button (Figure 7.2).
LIGHT S SCHEDUL ING & MANUAL O PERAT ION
L1:
Schedle for : Fri, Oct 28 2005
ON TIMES: OFF OFF
OFF TIM ES: OFF OFF
Status: MANUALLY T URNED ON
Will turn OFF at 5:24PM on Fri (10/28)
currently: ST OP
Fri 10/28/05 1:24:52PM
Figure 7.2
2.
To end the light program test,
press the STOP key.
Note:
The STOP Menu key can also be pressed
to end the lights program in progress.
THIS CONCLUDES THE LIGHTS SECTION
SECTION 8: RADIO REMOTE
A. ENABLE RADIO REMOTE
If the Radio Remote Control option is installed on a
controller (-RR), the RADIO REMOTE Menu key will
be available at the MAIN MENU screen.
From the MAIN MENU screen.
1.
Menu key.
The RADIO REMOTE ACTIVATION screen will
appear (Figure 8.1).
2.
REMOTE NOW Menu key to
activate the controller Radio
Remote. You can also set
Normal Command Codes,
addressed Command Codes
and the receiver frequency at this
screen. (see the instruction sheet
that is shipped with the Calsense
Radio Remote for more
information).
3. Press the blue ARROW keys to
highlight the different areas on
the screen.
4.
to change the individual entries.
THIS CONCLUDES THE RADIO REMOTE
Press the RADIO REMOTE
Press the ENABLE RADIO
Enable Radio Remote NOW
Code for NORMAL COMMANDS is: * 1 1 1
Code for ADDRESSED COMMANDS is: * -
Receive Chanel : 5 (160. 150Mhz)
RADIO REM OT E ACT IVAT ION
Figure 8.1
Press the PLUS or MINUS keys
SECTION
making
ater work
since 1986
Page 46

w
SECTION 9 NO WATER KEY
SECTION 9: NO WATER KEY
A. NO WATER KEY DESCRIPTION
From this screen you can turn the controller off, set
No water Days by all stations, program, or individual
stations. At the end of the No Water Days setting,
the station(s) will start to irrigate according to their
irrigation schedule. The No water setting can be
from 1 to 31 days.
1. Press the NO WATER key.
The TURN Controller OFF & NO WATER screen is
displayed (Figure 9.1).
CONTROLLER OFF & NO WATER
Turn Controller OFF
Apply 3 No Water Day(s) to: PROG B
No Water Days by Station
2.
Press the PLUS or MINUS keys
to set the desired number of No
Water Days.
3. Press the blue ARROW keys to
highlight which program to set
the No Water Days for.
4.
Press the PLUS or MINUS keys
to select the desired program (or
all stations).
5.
Press the APPLY NO WATER
DAYS Menu key. In figure 9.1, all
stations on Program B will be
turned off for three consecutive
days.
6.
To turn Program B back on at
anytime, return to the TURN
CONTROLLER OFF & NO
WATER screen and set the No
Water Days to zero (0).
®
Figure 9.1
1. Turn controller OFF
1.
Press the TURN CONTROLLER
OFF Menu key. The controller will
be turned off and will immediately
return to the STATUS screen.
2.
To turn the controller back on,
press the PUSH TO TURN ON
Menu key located at the STATUS
screen.
2. Apply no water days to program
From the CONTROLLER OFF & NO WATER DAYS
screen (Figure 9.1).
1.
Press the blue ARROW keys to
move the highlight to the number
of No Water days setting.
7.
Press the APPLY NO
WATER DAYS Menu key.
3. No water days by station
1.
Press the NO WATER DAYS BY
STATION Menu key.
The NO WATER DAYS BY STATION screen
(Figure 9.2).
Station: 1 2 3 4 5 6 7 8 9 10
NOW Days: 0 0 4 0 0 0 0 0 0 0
Station: 11 12 13 14 15 16 17 18 19 20
NOW Days: 0 0 0 0 0 0 0 0 0 0
Station: 21 22 23 24 25 26 27 28 29 30
NOW Days: 0 0 0 0 0 0 0 0 0 0
Station: 31 32 33 34 35 36 37 38 39 40
NOW Days: 0 0 0 0 0 0 0 0 0 0
NO WATER DAYS BY STATION
Figure 9.2
2.
Press the blue ARROW keys to
highlight which station to set the
No Water Days on.
making
ater work
since 1986
Page 47

w
® SECTION 9 NO WATER KEY / SECTION 10 MANUAL KEY
3. Press the PLUS or MINUS keys
to select the desired amount of
no water days per station.
Note:
In figure 9.2 station three has been selected
for 4 consecutive no water days.
Note:
When No Water Days are set in the controller,
they take effect based on the Start Time for which
program the station is assigned to.
THIS CONCLUDES THE NO WATER SECTION
SECTION 10: MANUAL KEY
The Manual section of the controller is used for:
• Manual Watering stations.
• Testing individual stations.
• Master Valve Override.
• Learning station expected flow rates.
• Manual Programs.
• Walk-Thru.
• Use Hold Over.
1.
Press the MANUAL key.
The MANUAL MENU screen is displayed
(Figure 10.1).
Manual Watering Manual Program 1
Test Manual Program 2
MV Override Walk-Thru
Learn Expected Use Hold-Over
MANUAL M ENU
Figure 10.1
A. MANUAL WATERING
The Manual Watering section of the controller is
used to manually water individual stations, or all
stations within a program using total timed irrigation
or cycle and soak.
1.
Press the MANUAL WATERING
Menu key.
The MANUAL IRRIGATION screen is displayed
(Figure 10.2).
MANUAL IRRIGATION
Manual Water Station 1 for 4.0 mins
Manual Water PROG A Stations
Cycle & Soak During manual ? NO
Figure 10.2
making
ater work
since 1986
Page 48

w
V
SECTION 10 MANUAL KEY
®
1. Manual Water a Station
From the MANUAL IRRIGATION screen (Figure
10.2).
1.
Press the PLUS or MINUS keys
to change the station number.
2.
Press the MANUAL WATER
STATION # FOR #.## MINS
Menu key.
The IRRIGATION FOR STATION # screen is
displayed (Figure 10.3).
IRRIGATION for STATION 1
Manually Watering ( mv open-pump off )
1.9 Min of 4.0 Min Cycle
Details
Figure 10.3
Note: Pressing the DETAILS Menu key will
take you to the IRRIGATION DETAILS screen
where you can view, or clear the station.
(See Section 6 REPORTS / IRRIGATION
DETAILS).
2. Manual Water a Program
From the MANUAL IRRIGATION screen
(Figure 10.2).
1.
Press the PLUS or MINUS keys
to change the program selection.
2. Press the MANUAL WATER
PROG # STATIONS Menu key
to activate watering of all stations
for selected program.
The IRRIGATION FOR STATION # screen will
appear for each station as it irrigates (Figure 10.3).
3. Cycle and Soak during Manual
From the MANUAL IRRIGATION screen
(Figure 10.2).
1.
Press the PLUS or MINUS
keys to change the CYCLE &
SOAK DURING MANUAL
setting (Figure 10.2).
Note:
This will use the Soak-in-Time and minutes
per cycle setting for each station individually. IF “NO”
then it will water the Total Minutes without soaking.
THIS CONCLUDES THE MANUAL WATERING
SECTION
B. TEST
The Test section of the controller is used to:
• Learn expected flow rates at a station.
• Test an individual station.
• Test station moisture sensors (If enabled).
From the MANUAL MENU screen (Figure 10.1).
1.
Press the TEST Menu key.
The VALVE TESTING screen is displayed
(Figure 10.4)
Learn the Expected at Station 1
Test Station 1 for 2.0 minutes
Test Station 1 for Moisture Sensor
( MASTER )
ALVE TESTING
Figure 10.4
1. Learn the Expected at a Station
The Learn expected option on the controller will
learn the expected flow rate for each station on each
program selected.
From the VALVE TESTING screen (Figure 10.4)
making
ater work
since 1986
Page 49

w
y
V
® SECTION 10 MANUAL KEY
1. Press the PLUS or MINUS
keys to change the station
number.
2.
Station selected.
Note: The IRRIGATION FOR STATION # screen
will come on for the station selected while it learns
the expected flow (Figure 10.3)
Note:
The valve will physically come on at this time
3. Press the DETAILS Menu key to
view, or clear the selected
station.
2. Test a Station
From the VALVE TESTING screen (Figure 10.4).
Press the LEARN THE
EXPECTED AT STATION #
Menu key to Learn The
Expected flow rate for the
The MASTER VALVE OVERRIDE screen is
displayed (Figure 10.5).
MASTER VALVE OVERRIDE
OPEN the MASTER VALVE f or 4.0 HOURS
( Master Valve Override may onl
be used to OPEN the Master Valve. )
WEEKLY SCHEDULE FOR OPENING M
Figure 10.5
1. Open Master Valve for Specified Time
From the MASTER VALVE OVERRIDE screen
(Figure 10.5).
1.
Press the PLUS or MINUS
keys to change the Open
Master Valve time.
1.
Press the PLUS or MINUS keys
to change the Station number.
2.
Press the TEST STATION #
FOR X.X MINUTES Menu
key to test the selected
station. The time is adjustable
from 0.1 to 20.0 minutes.
3. Test a Station Moisture Sensor (See Section 5
Moisture)
THIS CONCLUDES THE TEST SECTION
C. MV OVERRIDE
The Master Valve Override section of the controller
is used for:
• Opening the Master Valve for a specific
amount of time.
• Setting up a weekly schedule for the Master
Valve to be opened.
From the Manual Menu screen (Figure 10.1).
1. Press the MASTER VALVE
OVERRIDE Menu key.
2.
Press the OPEN MASTER
VALVE FOR #.## HOURS
Menu key to activate the time
period.
2. Weekly Schedule for Opening Master Valve
From the MASTER VALVE OVERRIDE screen
(Figure 10.5).
1.
Press the WEEKLY
SCHEDULE FOR OPENING
MV Menu key.
The SCHEDULE OPENING THE MASTER VALVE
screen is displayed (Figure 10.6).
SCHEDULE OPEN I NG THE MASTER VALVE
MON TUE WED T HU FRI
Open OFF OFF OFF OFF OFF
Close OFF OFF OFF OFF OFF
SAT SUN
Open OFF OFF
Close OFF OFF
Figure 10.6
making
ater work
since 1986
Page 50

w
SECTION 10 MANUAL KEY
®
2. Press the PLUS or MINUS keys
to change the “Open master
valve time”.
3.
Press the blue ARROW keys to
change from the open and close
entry and to change from one day
to the next.
Note: This is a rolling schedule that will repeat every
week.
Note: All daily settings will have to be set to OFF to
terminate the weekly schedule.
THIS CONCLUDES THE MASTER VALVE
OVERRIDE SECTION
D. LEARN EXPECTEDS
Learn expecteds allows you to learn the expected
flow rate for each station. This will occur at the next
scheduled irrigation for that station.
From the MANUAL MENU screen (Figure 10.1).
1. Press the LEARN EXPECTED
Menu key to access the LEARN
THE EXPECTED FLOW RATES
screen (Figure 10.7).
E. MANUAL PROGRAM 1
The Manual Program section of the controller
provides an alternative to regularly scheduled
irrigation that performs the day to day requirements
for watering landscapes. Typical use of manual
programs might include over seeding, and
fertilizing.
From the MANUAL MENU screen (Figure 10.1).
1.
Press the MANUAL PROGRAM 1
Menu key to access the MANUAL
PROGRAM 1 screen (Figure 10.8).
NOTHING TO RUN
(check the start times)
Schedule: --- --- --- --- --- --- ---
Start Times: OFF OFF OFF
OFF OFF OFF
Run: (1 days )
Mon Nov 07 2005 - Mon Nov 07 2005
currently: STATIONS TIMES
Fri 11/11/05 4:29:18PM
Manual Program 1
Figure 10.8
2.
Press the PLUS or MINUS keys to
turn a specific day of the week ON,
or OFF.
LEARN T HE EXPECTED FLOW RATES
At the next program start, turn on
each station and use the measured flow
to set the expected flow rate.
Learn The Expected Flow Rates for:
PROG A . . . . . . . . . . . . . . . . . . . . . . . .NO
PROG B . . . . . . . . . . . . . . . . . . . . . . . .NO
PROG C . . . . . . . . . . . . . . . . . . . . . . . .NO
PROG D . . . . . . . . . . . . . . . . . . . . . . . .NO
PROG E . . . . . . . . . . . . . . . . . . . . . . . .NO
DRIP 1 . . . . . . . . . . . . . . . . . . . . . . . .NO
DRIP 2 . . . . . . . . . . . . . . . . . . . . . . . .NO
Figure 10.7
2. Press the PLUS or MINUS keys to
change the program setting.
3.
Press the blue ARROW keys to
change from one program to the
next.
THIS CONCLUDES THE LEARN EXPECTEDS
SECTION
3.
Press the blue ARROW keys to
change from one day to the next.
4.
Press the PLUS or MINUS keys to
set a specific Start Time.
Note:
You can set up to six different Start Times per
Manual Program.
5.
Press the blue ARROW keys to
change from one Start time to the
next.
Now select the amount of days that you want the
program to run.
making
ater work
since 1986
Page 51

w
® SECTION 10 MANUAL KEY
6. Press the blue ARROW keys to
highlight the Run setting.
7.
Press the PLUS or MINUS keys to
set the amount of days that you
want the program to run. (The End
date will change automatically).
Note:
If you want the schedule to begin on a later
date you will have to adjust the number of run days
to accommodate the change, and then change the
Start date.
F. MANUAL PROGRAM 2 (See MANUAL
PROGRAM 1)
THIS CONCLUDES THE MANUAL PROGRAMS
SECTION
G. WALK-THRU
The Manual Walk-Thru program is used to perform a
user orchestrated wellness check on selected
stations in the controller by selecting:
• The countdown time to activation (5 seconds
to 15.0 minutes).
• The order in which the stations activate.
• The run time limit for each station (0.1
seconds to 15.0 minutes).
From the MANUAL MENU screen (Figure 10.1).
1.
Press the WALK-THRU Menu key.
The WALK-THRU screen is displayed (Figure 10.9).
Start your Walk-T hru in 0 seconds
Run Each Station For 3.0 minute(s)
Set the Walk-Thru Order:
_ _ _ _ _ _ _ _ _ _ _ _ _ _ _ _ _ _ _ _
_ _ _ _ _ _ _ _ _ _ _ _ _ _ _ _ _ _ _ _
_ _ _ _ _ _ _ _ _ _ _ _ _ _ _ _ _ _ _ _
_ _ _ _ _ _ _ _ _ _ _ _ _ _ _ _ _ _ _ _
WALK-THRU SET -UP
2.
Press the PLUS or MINUS keys
to set the time in seconds that
you want the Walk-Thru to begin
in.
Note:
Time must be set from 0.1 seconds to 15.0
minutes.
3.
Press the blue ARROW keys to
highlight the RUN EACH
STATION FOR ##.# Minute(s).
4.
Press the PLUS or MINUS keys
to set the amount of time that you
want each station to run for. The
same time will be set for each
station selected.
5. Press the blue ARROW keys to
highlight the individual station
slots.
6.
Press the PLUS or MINUS keys
to enter the number for the station
that you want to come on in that
slot.
Note:
A single station cannot be entered into
multiple slots.
7.
Press the BEGIN COUNTDOWN
Menu Key (Figure 10.10).
Start your Walk-Thru in 15 seconds
Run Each Station For 3.0 minute(s)
Set the Walk-Thru Order:
20 13 12 11 10 5 4 6 7 8
_ _ _ _ _ _ _ _ _ _ _ _ _ _ _ _ _ _ _ _
_ _ _ _ _ _ _ _ _ _ _ _ _ _ _ _ _ _ _ _
_ _ _ _ _ _ _ _ _ _ _ _ _ _ _ _ _ _ _ _
Begin Countdown
WALK-T HRU SET-UP
Figure 10.10
Press the STOP TIMER Menu
Figure 10.9
8.
key to halt the countdown.
THIS CONCLUDES THE WALK-THRU SECTION
making
ater work
since 1986
Page 52

w
SECTION 10 MANUAL KEY
®
H. USE HOLD-OVER
Hold-Over time is generated whenever scheduled
irrigation has hit the Stop time. The controller will
first try and use up any hold-over in the table after
scheduled irrigation has finished, but before the Stop
Time has been reached. The Use Hold-Over feature
allows the user to schedule a specific time and
day(s) to try and use up any hold-over in the table.
From the MANUAL MENU screen (Figure 10.1).
1. Press the USE HOLD-OVER
Menu key.
The MANUAL USE OF HOLD-OVER screen is
displayed (Figure 10.11).
In ADDITION to the normally scheduled
irrigation, do you want a special
time to run Hold-Over?
NO
MANUAL USE o f HOL D-OVER
Figure 10.11
2.
Press the PLUS or MINUS keys to
select whether or not you want to
use Hold-Over. If YES is selected,
the screen will change to reveal the
set up parameters (Figure 10.12).
In ADDITION to the normally scheduled
irrigation, do you want a special
time to run Hold-Over?
YES
Start Time: 10:00PM
Stop Time: OFF
Schedule: - - - - - - - - - - - - - - - - - - - - -
(No Wat er prevents thi s f rom runni ng.)
MANUAL USE of HOLD-OVER
Figure 10.12
3.
Press the blue ARROW keys to
highlight the Start Time.
4.
Press the PLUS or MINUS keys
to set the time that you want the
Hold-Over irrigation to begin.
5.
Press the blue ARROW keys to
highlight the Stop Time.
6.
Press the PLUS or MINUS keys
to set the Stop Time.
7.
Press the blue ARROW keys to
highlight the Schedule days.
8. Press the PLUS or MINUS keys
to turn on the days that you want
the Hold-Over to be used on.
9.
Press the MAIN MENU key to
return to the MAIN MENU
screen.
CAUTION:
No Water Days prevents the Manual HOLD-Over
program from Running.
THIS CONCLUDES THE USE HOLD-OVER
SECTION
making
ater work
since 1986
Page 53

w
A
R
(
)
g
gy
(
)
® SECTION 11 (-FL) FLOWSENSE®
SECTION 11: (-FL) FLOWSENSE
®
The Calsense FLOWSENSE
® option allows the user
to manage an irrigation system that has one or more
points of connection and one or more controllers
sharing these points of connection. FLOWSENSE
®
affords the user the following:
• No more scheduling conflicts between
multiple controllers
• Eliminates relays when sharing pumps or
master valves with several controllers
• Manage the number of valves ON based
upon flow capacities
• Water management capabilities with or
without a flow meter
• Pump performance managed for electrical
savings
• Setup in the field without a central computer
The above listed items are only feasible with
Note:
two or more controllers in a communications chain.
A. MULTIPLE CONTROLLER
COMMUNICATION SETUP
Note: A chain is defined as a set of controllers
connected together via the same communications
type and / or frequency.
Note:
All of the controllers in the chain must be able
to communicate with each other via (-SR) Spread
Spectrum Radio, or (-M) Hardwired.
From the MAIN MENU screen.
1. Press the SETUP Menu key.
2.
Press the COMMUNICATIONS
Menu key.
The COMMUNICATION ADDRESS screen
(Figure 11.1).
ET2000-40-MSR-FL
U sin
does this controller coordinate with
other controller s to share MASTE
VALVES, FLOW METERS, or PUMPS?
NO
Communications Address: ! !
Controller Info
FLOWSENSE Technolo
576.i
Figure 11.1
3.
Press the PLUS or MINUS keys to
change the NO to a YES setting.
Note:
Each controller in the communications chain
must have the (-FL) option and will have to be set to
YES.
4.
Press the blue ARROW keys to
move the cursor to the next question.
NUMBER OF CONTROLLERS IN
SYSTEM ?.
5.
Press the PLUS or MINUS keys to
change the amount of controllers in
the system (Figure 11.2).
ET2000-40-MSR-FL
Using FLOWSENSE Technology
does this con troller coordinate with
other contr ollers to sh are MAST ER
VALVES, FLOW MET ERS, or PUMPS?
YES
Number of controllers in system ? 2
Communications Address: ! ! A
Scan Results Contr oller Info
576.i
Figure 11.2
Repeat the process described above until all three
characters are set (The character furthest to the right
must be a letter).
Note: With multiple controllers one of the controllers
must be the Master with an address ending in a
Capitol “A”. All other controllers will have addresses
ending in B, C, D, etc. No two controllers can have
the same exact address when communicating to the
same central computer. The Master controller must
be the controller communicating back to the central.
If you desire to look at the controller’s
communications information:
6.
Press the CONTROLLER INFO
Menu key to go to the PART &
SERIAL NUMBERS screen
(Figure 11.3).
Note: This will allow you to look at the controller’s
ROM version, Baud Rates, Part number, and
Command center software version required to
communicate with this controller.
making
ater work
since 1986
Page 54

w
(
)
SECTION 11 (-FL) FLOWSENSE
576.i s=6 c= 6 A=14400 B=14400
ET2000-40-MSR-RR
Serial Num: 12345 CC4 Ver: 4.0.11.26
(the normal l y ex pec t ed signal levels)
RTS CTS DTR DSR CD RI
A: L L L L L L
B: L L L L L L
Copyright Cal s ens e Inc. 1987-2005
All Rights Reserved
(use * Key for special menu)
You will have to perform a Controller Scan:
7.
Press the BACK key.
8.
Press the SCAN RESULTS Menu key.
The COMMUNICATIONS SCAN RESULTS screen
is displayed (Figure 11.4).
COMMUNIC ATIONS SCAN RESULTS
Start scan
CHAIN DOWN A / A ok
B - C - D - E - F - Found 1 of 2 in chain G - H - I - J - K - L - -
9.
Press the START SCAN Menu key to
begin the scan.
Note:
The controller will scan each controller in the
chain.
• B “ - - “ symbol indicates that the
controller in the chain was unsuccessful
at communicating (The Master did not
find the “B” controller).
• B “ ok “ symbol indicates that the
controller was found and is currently
communicating with the master
controller (the “A” controller).
The scan can only be performed at the Master
Note:
controller in the FLOWSENSE® chain. Also the
“Number of controllers in chain.” can only be
adjusted at the master controller.
PART & SERI AL NUMBERS
Figure 11.3
Figure 11.4
® ®
CHAIN DOWN!
Example:
Number of controllers in chain 5
Controller position in chain communications address
Master controller A !!A
Slave controller B !!B
Slave controller C !!C
Slave controller D !!D
Slave controller E !!E
THIS CONCLUDES MULTIPLE CONTROLLER
COMMUNICATIONS SETUP
B. MULTIPLE CONTROLLER FLOW SETUP
Setting up a FLOWSENSE
® chain involves making
adjustment entries to the Master controller and every
controller that a flow meter or master valve is
physically installed on. Make sure you are familiar
with the following subsections of Section 4 FLOW:
• A. Flow Meter setup.
• B. Line Fill & Valve close times.
• C. Master Valve.
• D. Pump.
• H. Alert Actions.
in addition to the following instructions:
1. Mainline Capacity
System capacity is defined by the max flow rate of
water that your system can operate at during
irrigation.
Note: This setting will have to be adjusted at the
Master Controller (The controller with the letter “A”
as the right most character in its communications
address).
From the FLOW METER, MASTER VALVE & PUMP
screen is displayed.
1. Press the MAINLINE CAPACITY
Menu key (Figure 11.5).
FLOW METER, MASTER VALVE & PUMP
Line Fill Flow Meter
& Valve Close T imes
Alert Actions Flow Checking
Master Valve Mainline Capacity
Pump On-at-a-Time
Figure 11.5
making
ater work
since 1986
Page 55

w
® SECTION 11 (-FL) FLOWSENSE®
The MAINLINE BREAK SETTINGS screen is
displayed (Figure 11.6).
During Ir rigation 400 gpm
ALL Other Times 150 gpm
----------------------SYST EM CAPACIT Y SET TINGS---------------------- Use c apacity to limit the
number of stations on? NO
MAINLINE BREAK SETTINGS
Figure 11.6
2.
Press the blue ARROW keys to
move the cursor to the DURING
IRRIGATION gpm.
3.
Press the PLUS or MINUS keys to
change the number.
Use the same method to change the ALL OTHER
TIMES number.
• DURING IRRIGATION: The during-irrigation
number is the mainline break number used
while the controller is irrigating.
• ALL OTHER TIMES: The all other times
number is the mainline break number used
when the controller is not irrigating.
• USE CAPACITY TO LIMIT THE NUMBER
OF STATIONS ON ?: If you want to use
capacity to limit the number of stations on in
the system change to YES.
This will open up the portion of the screen dealing
with Capacity with or without Pump (Figure 11.7).
4.
Press the PLUS or MINUS key to
change the capacity numbers.
During Irrigation 400 gpm
ALL Other T imes 150 gpm
----------------------SYSTEM CAPACITY SETT INGS---------------------- Use capacity to limit the
number of stations on? YES
Capacity with Pump 200 gpm
Capacity without Pump 100 gpm
(set which programs use the pump )
MAINLINE BREAK SETTINGS
Figure 11.7
Capacity with pump: When a program irrigates by
use of pump the GPM limit set will not be exceeded.
Capacity without pump: When a program irrigates
without the use of a pump the GPM limit will not be
exceeded.
Note: Pump and non-pump programs will not run
simultaneously on the same controller / system.
5.
If you are using a pump and did not
select SET WHICH PROGRAMS TO
USE PUMP in the pump section of this
manual then press the SET WHICH
PROGRAMS TO USE THE PUMP
Menu key (Figure 11.7).
The WHICH PROGRAMS USE THE PUMP screen
is displayed (Figure 11.8).
WHICH PROGRAMS USE THE PUMP
For each program, select YES
if you would like to use the pump
PROG A . . . . . . . . . . . . . . . . . . . . . . . YES
PROG B . . . . . . . . . . . . . . . . . . . . . . . YES
PROG C . . . . . . . . . . . . . . . . . . . . . . . YES
PROG D . . . . . . . . . . . . . . . . . . . . . . . YES
PROG E . . . . . . . . . . . . . . . . . . . . . . . YES
DRIP 1 . . . . . . . . . . . . . . . . . . . . . . . YES
DRIP 2 . . . . . . . . . . . . . . . . . . . . . . . YES
Figure 11.8
6.
Press the blue ARROW keys to move
the cursor to the program desired.
Note:
The default setting is set to YES on all
programs, which means that the controller’s pump
output will be activated whenever a station on any
program is activated.
Set the Pump Output Enabled setting to NO. If the
Pump Output Enabled setting is set to NO on a
program, the pump output will not activate when a
station on that program is activated.
7.
Press the PLUS or MINUS keys to
change any program setting.
making
ater work
since 1986
Page 56

w
SECTION 11 (-FL) FLOWSENSE
2. Flow Checking
Flow checking allows you to have the controller
compare the flow of each station during irrigation to
the learned expected flow and alert you of any
problems.
Note:
You must have a flow meter turned on in the
controller, or in the chain / system.
Note:
This setting will have to be adjusted at the
Master Controller (The controller with the letter “A”
as the right most character in its communications
address). Once set, all of the controllers in the chain
will conform to this setting.
From the FLOW METER, MASTER VALVE & PUMP
screen.
1.
key.
The FLOW CHECKING screen is displayed
(Figure 11.9).
Press the FLOW CHECKING Menu
FLOW CH ECKING
When Irrigating COMPARE the
flow rate to the expected? NO
Figure 11.9
® ®
This will open up the ALLOWABLE portion of the
screen if you select YES to the WHEN IRRIGATING
COMPARE THE FLOW TO THE EXPECTED ?
question (Figure 11.10).
FLOW CH EC KI NG
When Irrigating COMPARE the
flow rate to the expected? YES
A LLOWA BLE
Below 30 gpm -5 / +5
From 30 gpm to 100 gpm -10 / +10
Above 100 gpm -15 / +15
(-gpm / +gpm)
Figure 11.10
2. Press the blue ARROW keys to
change the Allowable settings.
The default settings are:
BELOW: -5 / +5
FROM / TO: -10 / +10
ABOVE: -15 / +15
Note:
The above settings are defaulted in the
controller and can be changed by the user.
3.
To change the settings press the
PLUS or MINUS keys for any number
to change the setting.
Below:
This section allows you to enter the
fluctuation range for the low end of your normal
operating flow. Use the (-) and (+) entries to set the
range.
Example:
If you set the below limit at 30 gallons per minute.
Then set your (-) limit at 5, and your (+) limit at 5.
You will be alerted if the flow at the low end of the
scale fluctuates by more than five gallons per minute
in either direction.
That is less than 25 gpm or more than 35 gpm
From / to:
This section allows you to set the
fluctuation limits for the full range of flow. In this box
you want to enter the normal operating range of
water flow. Then in the (-) and (+) blocks enter the
range of fluctuation that you deem normal.
Example:
If you set the limit at 30 gpm to 100 gpm.
Then set your (-) limit at 10, and your (+) limit at 10.
You will be alerted if the flow at the middle of the
scale fluctuates by more than ten gallons per minute
in either direction.
That is less than 20 gpm or more than 110 gpm
making
ater work
since 1986
Page 57

w
® SECTION 11 (-FL) FLOWSENSE®
Above: This section allows you to enter the
fluctuation range for the high end of your normal
operating flow. Use the (-) and (+) entries to set the
range.
Note: You will want to set this allowable range up a
little wider due to the amount of water flow.
Example:
If you set the above limit at 100 gallons per minute.
Then set your (-) limit at 15, and your (+) limit at 15.
You will be alerted if the flow at the high end of the
scale fluctuates by more than fifteen gallons per
minute in either direction.
That is less than 85 gpm or more than 115 gpm
4. Press the BACK key to return to the
FLOW METER, MASTER VALVE, &
PUMP screen (Figure 11.5).
3. On – At - a - Time
The On-At-a-Time section of the controller is used to
set up the number of valves that you want to come
on simultaneously within a program, and also within
the system.
Note: These settings need to be entered at each
controller in the chain.
From the FLOW METER, MASTER VALVE & PUMP
screen (Figure 11.5).
1. Press the ON-AT-A-TIME Menu key.
The STATIONS ON-AT-A-TIME screen is displayed
(Figure 11.11).
STATIONS ON-AT-A-TIME
Within Within
Program System
PROG A . . . . . . . . . . . . . . 1 1
PROG B . . . . . . . . . . . . . . 1 1
PROG C . . . . . . . . . . . . . . 1 1
PROG D . . . . . . . . . . . . . . 1 1
PROG E . . . . . . . . . . . . . . 1 1
DRIP 1 . . . . . . . . . . . . . 1 1
DRIP 2 . . . . . . . . . . . . . 1 1
An "X" means don't use this
On-At-A-Time as a limit
Figure 11.11
2.
Press the blue ARROW keys to move
the cursor to the Program and Within
Program setting desired.
Note: The default setting is set to 1 on all programs
and within system.
3. Press the PLUS or MINUS keys for any
number to change the setting.
• WITHIN PROGRAM:
This section allows
you to choose the amount of valves that you
want to set as a limit to come on at a time
within a program.
• WITHIN CONTROLLER: This section
allows you to choose the amount of valves
that you want to set as a limit to come on at
a time within the controller.
Example:
Within Program
Program A 1 2
Program B 1 2
Within Controller
This example allows the user to set up one (1) valve
on at a time for Programs A and B. The controller
will allow both Programs to have one (1) valve each
run simultaneously for a total of two (2) on within
controller.
Example:
Within Program
Program A 1 1
Program B 3 3
Within Controller
This example allows the user to set up one (1) valve
on at a time for Programs A. The controller will only
allow one valve to operate while program A is
running. Program B is set up to operate 3 valves on
at a time, and will only operate up to three valves
when Program B is running.
4. Press the BACK key to return to the
FLOW METER, MASTER VALVE, &
PUMP screen (Figure 11.5).
THIS CONCLUDES THE FLOWSENSE®
SECTION
making
ater work
since 1986
Page 58

w
R
SECTION 12 (-F) OPTION
®
SECTION 12: (-F) OPTION:
All models of Calsense controllers that have a (-F)
option can receive up to three (3) separate flow
meter inputs. The first flow meter is wired to the
irrigation controller using the standard Calsense red
and black flow meter wires. The second and third
flow meters are wired to the irrigation controller
using an additional wire harness supplied when a (F) option is specified.
A. MULTIPLE FLOW METER SETUP
1.
The MAIN MENU screen is displayed(Figure 12.1).
2.
The FLOW METER, MASTER VALVE & PUMP
screen is displayed (Figure 12.2).
Press the MAIN MENU key.
CALSENSE WATER M ANAGEM ENT SYSTEM
Programs & Stations Lights
Weather Reports
Flow Radio Remote
Setup Status
Figure 12.1
Press the FLOW Menu key.
FLOW METER, MASTER VALVE & PUMP
Line Fill Flow Meter
& Valve Close Times
Alert Acti ons Flow Checking
Master Valve Mainline Capacity
Pump On-at-a-Time
Figure 12.2
The Flow Meter screen will appear (It will appear as
shown in Figure 12.3 only after the Flow Meter In
Use setting is set to YES).
Is a Flow Meter in use ? YES
Use your own K & Offset ? NO
METER 1 METER 2 METER 3
SIZE: NOT USED NOT USED NOT USED
(Expected Flow Rates can be
automatically learned.)
Learn Expecteds
FLOW METE
Figure 12.3
4.
Press the blue ARROW keys to
move the cursor to the USE YOUR
OWN K & OFFSET setting, this is
set to NO as the default.
If using a FMBX flow meter see:
1. FMBX flow meter setup
If using a regular flow meter see:
2. Regular flow meter setup
If using a combination of FMBX along with regular
style flow meters you will have to select “USE YOUR
OWN K & OFFSET NUMBERS” for all three flow
meter entries.
1. FMBX flow meter setup
If the flow meter installed on the system is a
Calsense FMBX, change the “Use your own K &
Offset” to YES, (The screen will appear as shown in
Figure 12.4).
Is a Flow Meter in use ? YES
Use your own K & Offset ? YES
METER 1
K: 10.000 10.000 10.000
OFFSET: 0.200 0.200 0.200
(Expected Flow Rat es can be
automaticall y l earned.)
Learn Expecteds
FLOW METER
Figure 12.4
3.
Press the FLOW METER Menu key.
1.
Press the blue ARROW keys to
move the cursor to the K: setting.
making
ater work
since 1986
Page 59

w
® SECTION 12 (-F) OPTION
2. Press the PLUS or MINUS keys to
change the number.
3.
Press the blue ARROW keys to move
the cursor to the OFFSET: setting.
4.
Press the PLUS or MINUS keys to
change the number.
Note:
The two settings that must be set are the K
value and the Offset. If you know these values enter
them now. If not Call Calsense at 1-(800)-572-8608
for assistance.
2. Regular flow meter setup
If the answer to Use your own K & Offset is NO.
1.
Press the blue ARROW keys to move
the cursor to the SIZE setting.
2.
Press the PLUS or MINUS keys to
change the flow meter type.
Refer to the chart (Figure 12.5), to choose the
correct flow meter type.
MODEL NUMBER SIZE
FM-1
FM-1B
FM-1.25B
FM-1.5
FM-2
FM-3
1” PLASTIC FLOW METER
1” BRASS FLOW METER
1 ¼” BRASS FLOW METER
1 ½” PLASTIC FLOW METER
2” PLASTIC FLOW METER
3” PLASTIC FLOW METER
Figure 12.5
3. Learn Expecteds (Flow rate)
This allows you to learn the expected flow rate for
each station at the next program start. Once the flow
rate has been recorded, the entry on the screen will
default back to NO.
1.
After you have entered the appropriate
Flow Meter(s) select the LEARN
EXPECTEDS Menu key (Figure 12.6).
Is a Flow Meter in use ? YES
Use your own K & Offset ? NO
METER 1 METER 2 METER 3
SIZE: FM-1.5 FM-2 FM-1.5
(Expected Flow Rates can be
automatically learned.)
Learn Expecteds
FLOW METER
Figure 12.6
This will bring you to the LEARN THE EXPECTED
FLOW RATES screen (Figure 12.7).
LEARN T HE EXPECTED FLOW RATES
At the next program start , turn on
each station and use t he measured flow
to set the expect ed flow rate.
Learn The Expected Flow Rates for:
PROG A . . . . . . . . . . . . . . . . . . . . . . . NO
PROG B . . . . . . . . . . . . . . . . . . . . . . . NO
PROG C . . . . . . . . . . . . . . . . . . . . . . . NO
PROG D . . . . . . . . . . . . . . . . . . . . . . . NO
PROG E . . . . . . . . . . . . . . . . . . . . . . . NO
DRIP 1 . . . . . . . . . . . . . . . . . . . . . . . NO
DRIP 2 . . . . . . . . . . . . . . . . . . . . . . . NO
Figure 12.7
• LEARN EXPECTEDS: This allows you to
learn the expected flow rate for each station
at the next program start. Once the flow rate
has been recorded the entry on the screen
will default back to NO.
2.
Press the PLUS or MINUS keys to
select the program.
3.
Press the blue ARROW keys to
change the setting.
THIS CONCLUDES THE (-F) OPTION
SECTION
making
ater work
since 1986
Page 60

w
NOTES
®
NOTES
__________________________________________
__________________________________________
__________________________________________
__________________________________________
__________________________________________
__________________________________________
__________________________________________
__________________________________________
__________________________________________
__________________________________________
__________________________________________
__________________________________________
__________________________________________
__________________________________________
__________________________________________
__________________________________________
__________________________________________
__________________________________________
__________________________________________
__________________________________________
__________________________________________
__________________________________________
__________________________________________
__________________________________________
__________________________________________
__________________________________________
__________________________________________
__________________________________________
__________________________________________
__________________________________________
__________________________________________
__________________________________________
__________________________________________
__________________________________________
__________________________________________
__________________________________________
__________________________________________
__________________________________________
__________________________________________
__________________________________________
__________________________________________
__________________________________________
__________________________________________
__________________________________________
__________________________________________
__________________________________________
__________________________________________
__________________________________________
__________________________________________
__________________________________________
__________________________________________
__________________________________________
__________________________________________
__________________________________________
__________________________________________
__________________________________________
__________________________________________
__________________________________________
__________________________________________
__________________________________________
__________________________________________
__________________________________________
__________________________________________
__________________________________________
__________________________________________
__________________________________________
__________________________________________
__________________________________________
__________________________________________
__________________________________________
__________________________________________
__________________________________________
__________________________________________
__________________________________________
__________________________________________
__________________________________________
__________________________________________
__________________________________________
__________________________________________
__________________________________________
__________________________________________
__________________________________________
__________________________________________
__________________________________________
making
ater work
since 1986
Page 61

w
ENCLOSURE 2 FLAG LETTER DEFINITIONS
Flag Letter Definitions
For Controller
LETTER DESCRIPTION DEFINITION
During normally scheduled irrigation or during scheduled
S Short Circuit
O No Current
C Low Current
I High Current
A
L Low Flow
H High Flow
U Flow Not Checked
W No water
R Rain switch
B Main Line Break
Tail Ends
Adjustment
manual hold over a short circuit was detected. The valve is
turned off and the remaining irrigation time is thrown away.
At the next scheduled irrigation the valve will try again.
During normally scheduled irrigation or during scheduled
manual hold-over, an open circuit was detected. This is a
passive alert. The valve stayed on and completed its irrigation.
A low current situation was detected. Not yet implemented or
used.
A high current situation was detected. Not yet implemented or
used.
During normally scheduled irrigation or during scheduled
manual hold-over, the Tail-Ends adjustment caused a portion
of the scheduled time not to run. The time to irrigate was less
than 5% of the cycle time. (FYI: When the residual time is
between 5% & 20% of the cycle time it is evenly divided up
among the cycles that do run.)
During normally scheduled irrigation or during scheduled
manual hold-over, flow was tested and this valve failed the
LOW FLOW test. The action taken is controlled by the Alert
Actions settings.
During normally scheduled irrigation or during scheduled
manual hold-over, flow was tested and this valve failed the
HIGH FLOW test. The action taken is controlled by the Alert
Actions settings.
For one reason or another flow could not be checked during
one of the cycles that this station ran during normally
scheduled irrigation or during scheduled manual hold-over. In
field service mode you will get an elaborate alert detailing the
conditions that could prevent flow from being checked.
The scheduled programmed irrigation did not apply any time
for this station because NO WATER days were set.
The RAIN SWITCH caused the programmed irrigation to cut
short or to not be applied at all. In addition whenever a RAIN
BUCKET causes programmed irrigation to be affected (either
through polling or sharing) this flag is set. So it’s a dual use
flag: used to indicate Rain Switch and Rain Bucket activities.
This flag will be set if the above rain events occur during
scheduled manual hold-over.
A MAINLINE BREAK affected the programmed irrigation.
Either it did not start or it was cut short when the mainline
break occurred. This flag will be set if the mainline break
occurs during scheduled manual hold-over.
making
ater work
since 1986
Page 62

w
ENCLOSURE 2 FLAG LETTER DEFINITIONS
During normally scheduled programmed irrigation, we
crossed the HOLD OVER time. The irrigation was
T Normal Stop Time
F Controller Off
M
X
V
Moisture Sensor
Caused Cycle Skip
Moisture Sensor
Max water Days Set
Master Valve
Override
terminated and the remaining time was added to the hold-over
for that station. This flag is set during manually scheduled
hold-over if during that activity we hit the manual hold-over
STOP TIME.
The normally scheduled programmed irrigation did not apply
any time for this station because the controller was set to
OFF. This flag will be set if the controller is turned OFF in
the middle of applying normally scheduled irrigation or
scheduled manual hold-over.
The MOISTURE SENSOR caused he programmed irrigation
or scheduled hold-over time to be cut short. A number of
cycles did not irrigate because the moisture sensor reading
was equal to or above the set point. Anywhere from one cycle
to all of the scheduled cycles may be curtailed. This flag is set
in the master station as well as all of his slaves.
While using moisture sensing, MAX WATER was set
causing this station to irrigate all of its normally scheduled
irrigation- regardless of what the moisture sensor said to do.
The master valve was closed using MASTER VALVE
OVERRIDE. This master valve closure either prohibited the
normally scheduled irrigation from occurring or it interrupted
it. This flag will be set if the master valve is closed using
master valve override during scheduled manual hold-over.
®
Flag Letter Definitions
For Moisture sensors
LETTER DESCRIPTION DEFINITION
This means the “Moisture sensor in use block” in Program Data is
--- Reading Never Taken
R** Reading Out Of Range
F** No Filtered Reading
S** Signal Never went Away
O--
Reading Not Put In Line
Yet
checked but the program in the “Use Moisture Sensor in the
following program” block using this station is not checked for
moisture sensor usage.
This means the reading the controller received from the Moisture
Sensor was out of the realm of 0-100 therefore out of range.
Hardware problem with the controller / moisture sensor / or field
wiring
Hardware problem with the controller.
This means that there is a Moisture Sensor assigned to this station
via a program, but has not yet taken a reading.
making
ater work
since 1986
Page 63

w
ENCLOSURE 2 FLAG LETTER DEFINITIONS
ET Table Codes
LETTER DESCRIPTION DEFINITION
e Edited
g ET Gage
h Historical
c Central
This means the (ET) number was edited at the
controller by a user.
This means the (ET) number was retrieved from
actual real-time (ET).
This means the (ET) number was retrieved from the
historical (ET).
This means the central created the (ET) number due to
the real-time (ET) being below the minimum (ET)
allowed by the user.
Rain Table Codes
LETTER DESCRIPTION DEFINITION
o Original
m Below Minimum
r Usable Rain
s Shutdown
p Polling
This value is zero (no usable rain), it has no effect on
irrigation run times.
The below minimum value is measured rain but not enough
to offset irrigation run times.
This means that the number was usable rain. This value is
rain that is used to offset irrigation run times.
This means that irrigation was stopped due to rain polling
being shared with this controller.
This means weather sharing has either failed or has not
occurred yet since polling shutdown occurred.
making
ater work
since 1986
Page 64

w
ET2000 (500 SERIES) PROGRAMMING GUIDE
®
®
2075 Corte del Nogal, Suite P, Carlsbad CA 92011
1-(800)-572-8608 FAX: 1-(760)-438-2619
www.calsense.com
Stock Number: PG2-IC-D2 Rev. 05/06
making
ater work
since 1986
Page 65

w
® ENCLOSURE 1. ET2000 IRRIGATION CONTROLLER SCREEN MAP
Programs & Stations
Weather
Flow
Start Times & Water Days
Stations
Stations-By-Program
Stati on-To-Station Copy
(A) ET Gage
(A) Rain Bucket
(A) Wind Gage
Rain Switch
ET
Budget
Moisture
(B) Et Count y / City
(C) Line Fill & Valve Close Times
(C) Alert Action
Master Valve
Pump
(C) Flow Meter
Flow Check i ng
(H) Set Valve Run Times
Stati o n P rogram m i n g
Move Station
Copy Station-To-Stati on
Copy Station-To-Program
Stations
(A) Use Of Rain By Program
(B) Crop Coefficients
Moist ure Sensing Setup
Learn Expect eds
Test
(G) Sensor Assignment
Mainline Capacity
Communications
Date & Time Push Here to Set It
Setup
Stations In Use
12 Month Mode
Access Control Push To Log In
(D) Lights
Reports
(F) Radio Remote (F) Enable Radio Remote Now
Status
(D) Lights S cheduling
& Manual Operation
This Month / Las t Month (K) HCF / Gall ons
24 Month This Year / Last Year St at us
Hold-Over Clear All
Et & Rain Tables Communications
Station History Page Right / P age Left Irrigation
(H) Use Vs. B ud get (K) Changes GALLONS / HCF All
Live Screens Irrigation Detai l s Details
Set Which Programs Us e The
Pump
Controller InfoOn-At-A-Time
(H) Scan Result s
Part & Serial Number
(D) Manually S t art
Show Time / Show Water Use
Clear Station Go To Top
Alerts Change
Irrigation Ac tivity Detai ls
Real Time Flow Clear Station
(J) Live Screens (E) Alerts To See
(H) Start S can
Status View
(J) Adjust S tation
Manual Wat e r Manual Wat er A Station Details Clear Station
Manual Wat er Program Stat ions Details Clear Station
Cycle A nd Soak During Manual
Learn The Expect ed At A Station Details Clear Stat i o n
Test Test A Stat i on Details Clear Station
Test Stat ion For Mois ture Sens or Test Details Clear Stat i on
MV Override
Learn Expext eds
Manual Program 1 Station Times Schedule
Open Master Valve For Hours Clear
Weekly Schedule For M as ter
Valve
Menu Key Availability
(A) Available only if option is installed.
(B) Only In Daily ET Mode.
(C) Available if Flow Meter is enabled.
Manual Program 1 Station Times Schedule
Walk-Thru Begin Coundown
Use Hold -O ver
Turn C o nt r oll er Off (L) Pu sh To Turn O n
Apply No Water Days to Program (L) Push To Turn On
No Wat e r Da y s Are Set
No Wat er Da y s By Sta tion
Summary
(D) If Lights option enabled.
(E) If any to view.
(F) If Radio Remote is enabled.
(G) If in moisture sensing mode.
(H) If Budgets turned on.
(I) Only If SR Radio Installed.
(J) If currently irrigation.
(K) Will change both screens. (Shaded in green)
(L) If controller is turned OFF.
(M) Available when controller first turned on.
Note: Yellow shading denotes only when option
installed / turned on.
making
ater work
since 1986
Page 66

w
SECTION 1 ADMINISTRATOR / USER SETUP
®
making
ater work
since 1986
 Loading...