

Page 1

®
Portable Management Application
for the
TSX-1620
User’s Guide
The Complete Networking Solution
Page 2

Page 3

Notice
Cabletron Systems reserves the right to make changes in specifications and other information
contained in this document without prior notice. The reader should in all cases consult Cabletron
Systems to determine whether any such changes have been made.
The hardware, firmware, or software described in this manual is subject to change without notice.
IN NO EVENT SHALL CABLETRON SYSTEMS BE LIABLE FOR ANY INCIDENTAL, INDIRECT,
SPECIAL, OR CONSEQUENTIAL DAMAGES WHATSOEVER (INCLUDING BUT NOT LIMITED
TO LOST PROFITS) ARISING OUT OF OR RELATED TO THIS MANUAL OR THE INFORMATION
CONTAINED IN IT, EVEN IF CABLETRON SYSTEMS HAS BEEN ADVISED OF, KNOWN, OR
SHOULD HAVE KNOWN, THE POSSIBILITY OF SUCH DAMAGES.
Virus Disclaimer
Cabletron has tested its software with current virus checking technologies. However, because no antivirus system is 100% reliable, we strongly caution you to write protect and then verify that the
Licensed Software, prior to installing it, is virus-free with an anti-virus system in which you have
confidence.
Cabletron Systems makes no representations or warranties to the effect that the Licensed Software is
virus-free.
Copyright © 1996 by Cabletron Systems, Inc. All rights reserved.
Printed in the United States of America.
Order Number: 9031978-E1 October 1996
Cabletron Systems, Inc.
35 Industrial Way, P.O. Box 5005
Rochester, NH 03867-0505
SPECTRUM , MiniMMAC , FNB , Multi Media Access Center , and DNI are registered trademarks,
and Portable Management Application , IRM , IRM2 , IRM3 , IRBM , ETSMIM , EFDMIM , EMME ,
ETWMIM , FDMMIM , FDCMIM , MRXI , MRXI-24 , NB20E , NB25E , NB30 , NB35E , SEHI , TRBMIM ,
TRMM , TRMMIM , TRXI , Media Interface Module , MIM , and Flexible Network Bus are
trademarks of Cabletron Systems, Inc.
UNIX and OPENLOOK is a trademark of Unix System Laboratories, Inc. OSF/Motif and Motif are
trademarks of the Open Software Foundation, Inc. X Window System is a trademark of Massachusetts
Institute of Technology. Ethernet and XNS are trademarks of Xerox Corporation. Apple and
AppleTalk are registered trademarks of Apple Computer, Inc. Banyan is a registered trademark of
Banyan Systems, Inc. DEC net is a registered trademark of Digital Equipment Corporation. Novell is a
registered trademark of Novell, Inc. CompuServe is a registered trademark of CompuServe. Sun
Microsystems is a registered trademark, and Sun , SunNet , and OpenWindows are trademarks of Sun
Microsystems, Inc.
i
Page 4

Restricted Rights Notice
(Applicable to licenses to the United States Government only.)
1. Use, duplication, or disclosure by the Government is subject to restrictions as set forth in subparagraph (c) (1)
(ii) of the Rights in Technical Data and Computer Software clause at DFARS 252.227-7013.
Cabletron Systems, Inc., 35 Industrial Way, Rochester, New Hampshire 03867-0505.
2. (a) This computer software is submitted with restricted rights. It may not be used, reproduced, or disclosed
by the Government except as provided in paragraph (b) of this Notice or as otherwise expressly stated
in the contract.
(b) This computer software may be:
(1) Used or copied for use in or with the computer or computers for which it was acquired, including
use at any Government installation to which such computer or computers may be transferred;
(2) Used or copied for use in a backup computer if any computer for which it was acquired is
inoperative;
(3) Reproduced for safekeeping (archives) or backup purposes;
(4) Modified, adapted, or combined with other computer software, provided that the modified,
combined, or adapted portions of the derivative software incorporating restricted computer
software are made subject to the same restricted rights;
(5) Disclosed to and reproduced for use by support service contractors in accordance with
subparagraphs (b) (1) through (4) of this clause, provided the Government makes such disclosure
or reproduction subject to these restricted rights; and
(6) Used or copied for use in or transferred to a replacement computer.
(c) Notwithstanding the foregoing, if this computer software is published copyrighted computer software,
it is licensed to the Government, without disclosure prohibitions, with the minimum rights set forth in
paragraph (b) of this clause.
(d) Any other rights or limitations regarding the use, duplication, or disclosure of this computer software
are to be expressly stated in, or incorporated in, the contract.
(e) This Notice shall be marked on any reproduction of this computer software, in whole or in part.
ii
Page 5

Chapter 1 Introduction to SPMA for the TSX-1620
Using the TSX-1620 User’s Guide .............................................................................. 1-1
What’s NOT in the TSX-1620 User’s Guide. . ................................................... 1-2
Conventions................................................................................................................... 1-3
Screen Displays ......................................................................................................1-3
Using the Mouse ....................................................................................................1-5
Getting Help ..................................................................................................................1-6
TSX-1620 Firmware....................................................................................................... 1-7
Contents
Chapter 2 Using the TSX-1620 Hub View
Using the Hub View ..................................................................................................... 2-1
Navigating Through the Hub View ....................................................................2-2
Hub View Front Panel........................................................................................... 2-3
Using the Mouse in the TSX-1620 Hub View.....................................................2-5
The TSX-1620 Application Displays.................................................................... 2-6
The Interface Application Display ............................................................... 2-7
The Bridge Application Display................................................................... 2-8
Monitoring Device Performance................................................................................. 2-9
Port Display Form.................................................................................................. 2-9
Interface Port Display Form Options........................................................... 2-9
Port Color Codes for the Interface Application Display......................... 2-12
Bridge Port Display Form Options ............................................................2-13
Port Color Codes for the Bridge Application Display............................. 2-14
Clearing Statistical Information......................................................................... 2-14
Managing the Device.................................................................................................. 2-15
Setting the Polling Intervals ............................................................................... 2-15
Using the Bridge Config Utility......................................................................... 2-17
Defining Community Names............................................................................. 2-18
Configuring Your TSX-1620’s Serial Port .........................................................2-19
Performing IF Configuration.............................................................................. 2-21
Changing the Displayed Interface.............................................................. 2-22
Performing Interface Configuration ..........................................................2-22
Viewing NetBios Information............................................................................ 2-23
Viewing and Changing System Information................................................... 2-24
Setting the Device Date, Time, and Daylight Savings Mode..................2-25
Configuring Port Security................................................................................... 2-25
Viewing Your Port Security Settings.......................................................... 2-26
Configuring Your Port Security Settings................................................... 2-28
Viewing the Interface List................................................................................... 2-29
iii
Page 6

Contents
Accessing the MIB I, II Tool................................................................................ 2-30
Accessing Bridge Management.......................................................................... 2-30
Performing Source Routing Configuration for a Port.....................................2-30
Viewing a Bridge Port’s Source Address List ..................................................2-31
Enabling/Disabling Bridging for TSX-1620 Ports...........................................2-32
Enabling and Disabling Bridge Ports......................................................... 2-32
Chapter 3 Using the TSX-1620 Bridge View
Bridging Basics ..............................................................................................................3-1
Transparent Bridging............................................................................................. 3-2
Source Route Bridging...........................................................................................3-2
Source Route Transparent Bridges.......................................................................3-3
Accessing the Bridge Traffic View Window ..............................................................3-3
Navigating Through the Bridge Traffic View.....................................................3-4
Bridge Traffic View Front Panel........................................................................... 3-6
The Bridge Port Display........................................................................................3-7
Choosing Bridge Traffic Information: Bridge Traffic View Buttons................ 3-8
Using the Detail View Window................................................................................. 3-11
The Bridge Status Window........................................................................................ 3-12
The Bridge Statistics Window....................................................................................3-13
The Filtering Database Window ...............................................................................3-15
Viewing the Filtering Database.......................................................................... 3-16
Changing the Filtering Database Dynamic Ageing Time ..............................3-19
Changing Forwarding and Static Database Entries........................................ 3-20
Deleting a Static Table Entry .......................................................................3-22
Finding a Filtering Database MAC Address.................................................... 3-22
The Spanning Tree Protocol Window.......................................................................3-22
Changing Spanning Tree Parameters................................................................ 3-27
The Spanning Tree Port Parameters Window......................................................... 3-27
Changing a Port’s STA Parameters....................................................................3-29
The Source Routing Configuration Window........................................................... 3-29
Changing Source Routing Port Parameters .....................................................3-32
Creating Bridge Traffic Charts, Graphs and Meters...............................................3-33
Configuring Forwarding Thresholds .......................................................................3-34
Viewing the Forwarding Log.....................................................................................3-37
Changing Polling Intervals........................................................................................ 3-39
Enabling and Disabling Ports....................................................................................3-40
Enabling and Disabling a Transparent Bridge Port ........................................3-40
Enabling and Disabling a Source Routing Bridge Port ..................................3-41
Enabling and Disabling Both Transparent and Source Routing
on a Bridge Port.............................................................................................3-42
iv
Page 7

Chapter 1
Introduction to SPMA for the TSX-1620
How to use the TSX-1620 User’s Guide; manual conventions; contacting Cabletron Technical Support;
TSX-1620 firmware versions supported by SPMA
The TSX-1620 is a high-speed stand-alone Token Ring switch with the ability to
transparently switch packets among its various attached ring networks at full line
rate (4 or 16 Mbps) and with minimal latency. The TSX-1620 provides source
routing functions while using store and forward switching technology. The TSX-
1620 also provides virtual networking capability, allowing you to configure
logical rings that include multiple physical rings attached to the front panel ports
(e.g., physical rings inserted in ports 1, 2, 5, and 8 could all be assigned to a single
virtual ring network, and would communicate as if they actually were on the
same physical ring). Using this capability, 4 and 16 Mbps devices can be placed on
separate physical rings (each port automatically determines the speed of the ring
to which it is connected), allowing the 16 Mbps devices to operate at full speed,
and the switch can treat both rings as a single logical ring network. Broadcast
discovery packets can be confined to a virtual subset of the attached rings, thereby
reducing overall traffic on the switch.
The TSX-1620 is an 8 port switch which is expandable to 16 ports, with STP/UTP
and 4 or 16 Mbps on each port via front panel RJ-45 connectors. The device is
IEEE 802.5 compliant with support for IEEE 802.1d spanning tree, and supports
SNMP, including MIB II.
Using the TSX-1620 User’s Guide
Your SPECTRUM Portable Management Application (SPMA) for the TSX-1620
consists of a number of different applications, each of which provides a portion of
the overall management functionality. Each of these applications can be accessed
from the icon menu (if you are using a management platform) and from the
Stand-alone Launcher or the command line (if you are running in stand-alone
1-1
Page 8

Introduction to SPMA for the TSX-1620
mode); in addition, several applications can also be accessed from within the Hub
View, a graphical display of the TSX-1620 and its ports.
The TSX-1620 User’s Guide describes how to use many of the applications
included with the module; note that the instructions provided in this guide apply
to the TSX-1620 module regardless of the operating system or management
platform you are using. Instructions for launching each individual function from
the command line (stand-alone mode) are also included in each chapter.
Following is a description of the applications documented in this guide; while we
provide as much background information as we can, we do assume that you’re
familiar with Ethernet networks and general bridging and network management
concepts:
• Chapter 1, Introduction to SPMA for the TSX-1620 , describes the TSX-1620
User’s Guide and the conventions used in this and other SPMA manuals,
explains where to find information about the TSX-1620, and tells you how to
contact Cabletron Systems Technical Support.
• Chapter 2, Using the TSX-1620 Hub View , describes the visual display of the
Hub and explains how to use the mouse within the Hub View; the operation
of some basic functions (changing the Hub View display, opening menus and
windows, enabling and disabling ports, checking device status, and so on)
available only from within the Hub View is also described. You can access the
Hub View application from the icon menu or the command line.
• Chapter 3, Using the TSX-1620 Bridge View , provides detailed instructions
for configuring and managing the TSX-1620’s powerful bridging capabilities,
including monitoring bridge operation, using the filtering database, and
setting forwarding thresholds and notification options. You can access the
Bridge View from the Hub View, the icon menu or the command line.
What’s NOT in the TSX-1620 User’s Guide. . .
The following standard SPMA tools are available through the TSX-1620 module
and are explained in the SPECTRUM Portable Management Application Tools
Guide :
• MIB I, II
• MIBTree
The MIB I, II application is available from the Hub View, the platform console
window Tools menu, the Stand-alone Launcher window, or the command line.
The MIBTree application is available from the platform console window Tools
menu, the Stand-alone Launcher window, or the command line.
Instructions on discovering Cabletron devices, creating icons, and accessing the
icon menus within your management platform are included in your Installing
and Using SPECTRUM for... guide. If you are using SPMA for the TSX-1620 in
stand-alone mode — that is, without benefit of a specific network management
1-2 Using the TSX-1620 User’s Guide
Page 9

system — instructions for starting each application from the command line are
included in each chapter, both in this guide and in the SPMA Tools Guide .
Conventions
SPECTRUM Portable Management Applications — including the TSX-1620
module — can work with a number of different network management systems
running on several different operating systems and graphical user interfaces. This
versatility presents two documentation problems: first, there is no standard
terminology; and second, the appearance of the windows will differ based on the
graphical interface in use. For the sake of consistency, the following conventions
will be followed throughout this and other SPMA guides.
Screen Displays
Introduction to SPMA for the TSX-1620
SPMA runs under a variety of different operating systems and graphical user
interfaces. To maintain a consistent presentation, screen displays in this and other
SPMA guides show an OSF/Motif (X Windows) environment. If you’re used to a
different GUI, don’t worry; the differences are minor. Buttons, boxes, borders, and
menus displayed on your screen may look a bit different from what you see in the
guide, but they’re organized and labelled the same, located in the same places,
and perform the same functions in all screen environments.
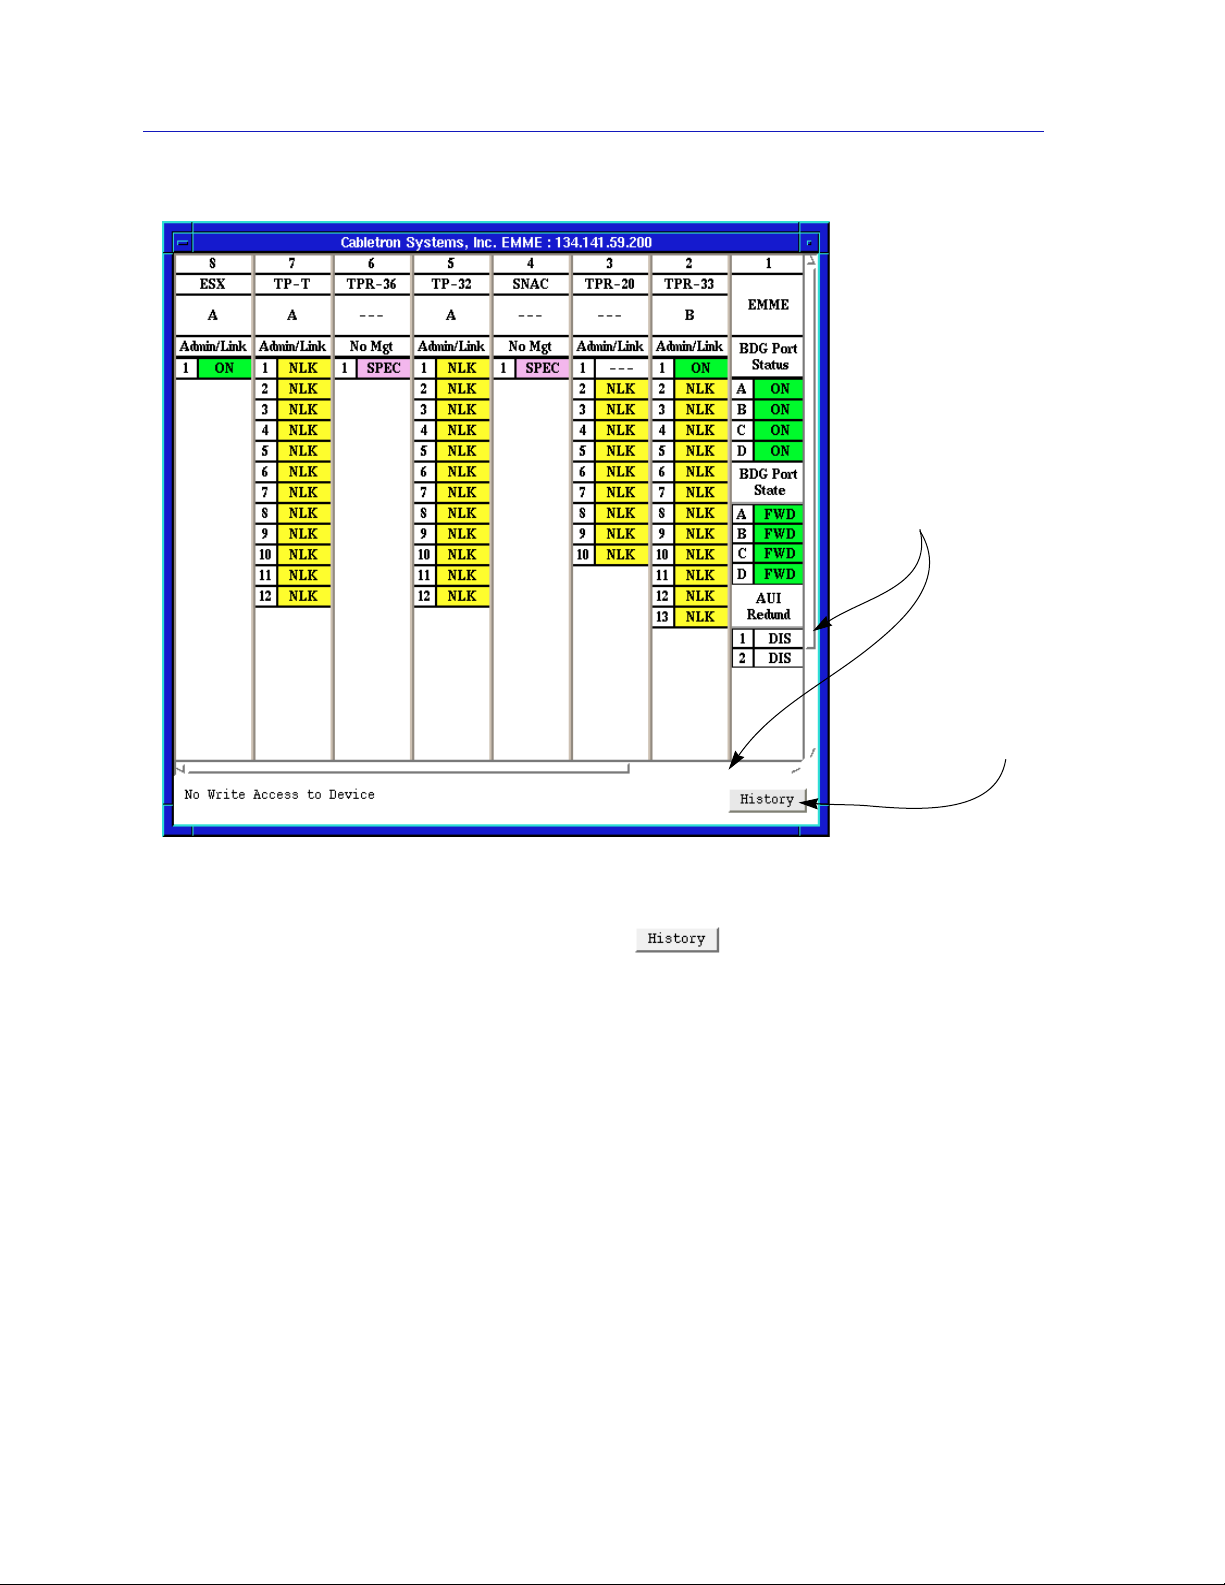
Some windows within SPMA applications can be re-sized; those windows will
display the standard window resizing handles employed by your windowing
system. Re-sizing a window doesn’t re-size the information in the window; it just
changes the amount of information that can be displayed (see Figure 1-1). When
you shrink a window, scroll bars will appear as necessary so that you can scroll to
view all the information that is available.
Conventions 1-3
Page 10
Introduction to SPMA for the TSX-1620
Use the scroll bars
provided to choose
what to display in a
window that’s been
resized
Click here to
display footer
message history
Figure 1-1. Window Conventions
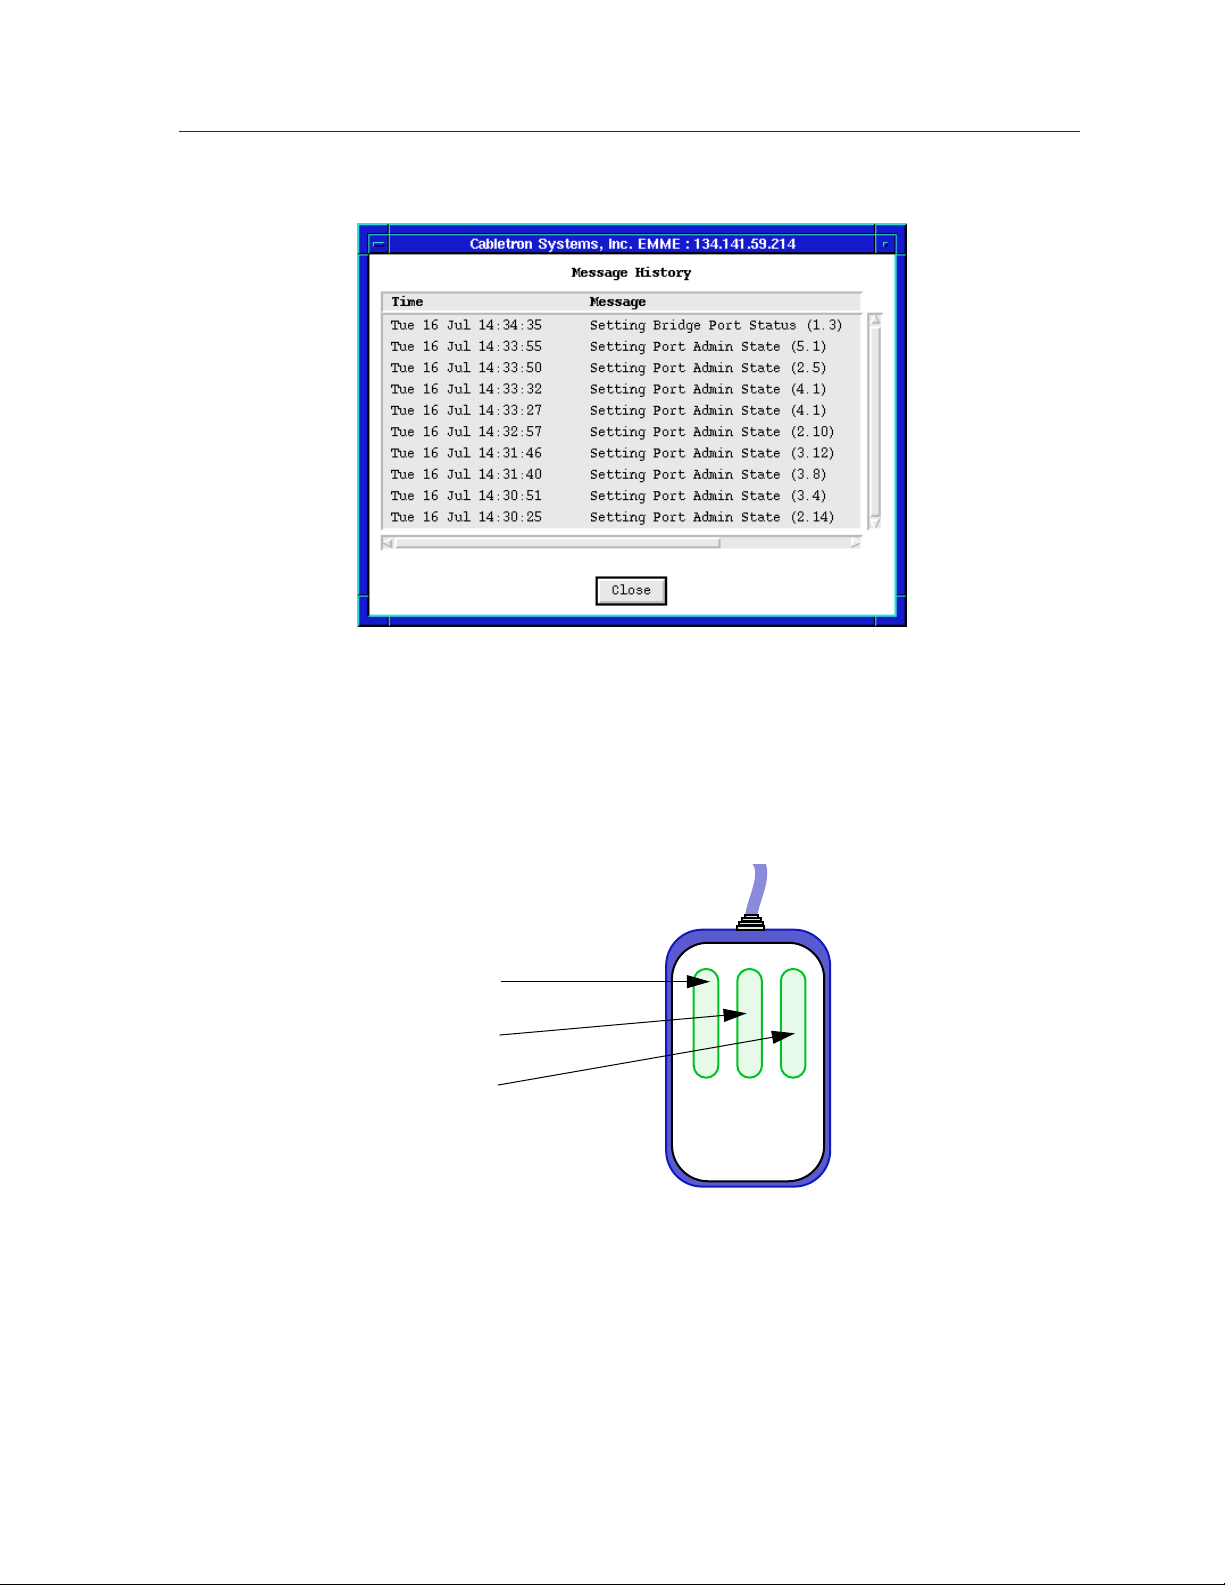
Some windows will also contain a button; selecting this button
launches a History window (Figure 1-2) which lists all footer messages that have
been displayed since the window was first invoked. This window can help you
keep track of management actions you have taken since launching a management
application.
1-4 Conventions
Page 11
Introduction to SPMA for the TSX-1620
Using the Mouse
The UNIX mouse has three buttons. Procedures within the SPMA document set
refer to these buttons as follows:
Figure 1-2. The History Window
Button 1
Button 2
Button 3
Figure 1-3. Mouse Buttons
If you’re using a two-button mouse, don’t worry. SPMA doesn’t make use of
mouse button 2. Just click the left button for button 1 and the right mouse button
when instructed to use mouse button 3.
Conventions 1-5
Page 12

Introduction to SPMA for the TSX-1620
Whenever possible, we will instruct you on which mouse button to employ;
however, menu buttons within SPMA applications will operate according to the
convention employed by the active windowing system. By convention, menu
buttons under the Motif windowing environment are activated by clicking the left
mouse button (referred to as mouse button 1 in SPMA documentation), and there
is no response to clicking the right button (mouse button 3). Under
OpenWindows, menu buttons can be activated by clicking the right button, and
convention dictates that the left button activates a default menu option; within
SPMA, that default option will also display the entire menu. Because of this
difference, references to activating a menu button will not include instructions
about which mouse button to use. All other panels from which menus can be
accessed, and all buttons which do not provide access to menus, will operate
according to SPMA convention, as documented.
Getting Help
If you need additional support related to SPMA, or if you have any questions,
comments, or suggestions related to this manual, contact Cabletron Systems
Technical Support. Before calling, please have the following information ready:
• The product name and part number
• The version number of the program that you need help with. SPMA is
modular, which means each application will have a specific revision number.
Where applicable, an INFO button provides the version number; you can also
view the version number for any application by typing the command to start
the application followed by a -v .
You can contact Cabletron Systems Technical Support by any of the following
methods:
By phone: Monday through Friday between 8 AM and 8 PM
Eastern Standard Time at (603) 332-9400.
By mail: Cabletron Systems, Inc.
PO Box 5005
Rochester, NH 03866-5005
By CompuServe
By Internet mail: support@ctron.com
FTP ctron.com (134.141.197.25)
®
: GO CTRON from any ! prompt
Login
Password
By BBS: (603) 335-3358
Modem Setting 8N1: 8 data bits, 1 stop bit, No parity
1-6 Getting Help
anonymous
your email address
Page 13

For additional information about Cabletron Systems products, visit our World
Wide Web site: http://www.cabletron.com/
TSX-1620 Firmware
SPMA for the TSX-1620 has been tested against firmware versions 1.3.6 and 1.4.5;
if you have an earlier version of firmware and experience problems running
SPMA contact Cabletron Systems Technical Support for upgrade information.
Introduction to SPMA for the TSX-1620
TSX-1620 Firmware 1-7
Page 14

Introduction to SPMA for the TSX-1620
1-8 TSX-1620 Firmware
Page 15

Using the TSX-1620 Hub View
Navigating through the Hub View, monitoring hub performance; managing the hub
Chapter 2
The heart of the SPECTRUM Portable Management Application (SPMA) for the
TSX-1620 is the Hub View, a graphical interface that gives you access to many of
the functions that provide control over the TSX-1620.
Using the Hub View
There are two ways to open the Hub View: if you are working within a network
management system, you can select the Hub View option from the icon menu;
specific directions for creating a TSX-1620 icon and accessing the icon menu can
be found in the appropriate Installing and Using SPECTRUM for... guide. If you
are running the TSX-1620 module in a stand-alone mode, type the following at the
command line:
spmarun tsxmod <IP address> <community name>
The community name you use to start the module must have at least Read access;
for full management functionality, you should use a community name that
provides Read/Write or Superuser access. For more information on community
names, consult the appropriate Installing and Using SPECTRUM for... guide,
and/or the Community Names chapter in the SPMA Tools Guide .
2-1
Page 16

Using the TSX-1620 Hub View
The spmarun script invoked first in the above command temporarily sets the environment
NOTES
variables SPMA needs to operate; be sure to use this command any time you launch an
application from the command line. This script is automatically invoked when you launch
an application from the icon menu or from within the Hub View.
If you wish to configure your TSX-1620 in any way, be sure to use a community name
with at least Read/Write access. If you only wish to view current settings, a community
name with Read access will be sufficient.
If there is a hostname mapped to your TSX-1620’s IP address, you can use <hostname> in
place of <IP address> to launch this application. Please note, however, that the hostname
is not the same as the device name which can be assigned via Local Management and/or
SPMA; you cannot use the device name in place of the IP address.
Navigating Through the Hub View
Within the Hub View, you can click mouse buttons in different areas of the
window to access various menus and initiate certain management tasks. The
following diagrams describe the information displayed in the Hub View and
show you how to use the mouse to display the TSX-1620’s menus.
2-2 Using the Hub View
Page 17
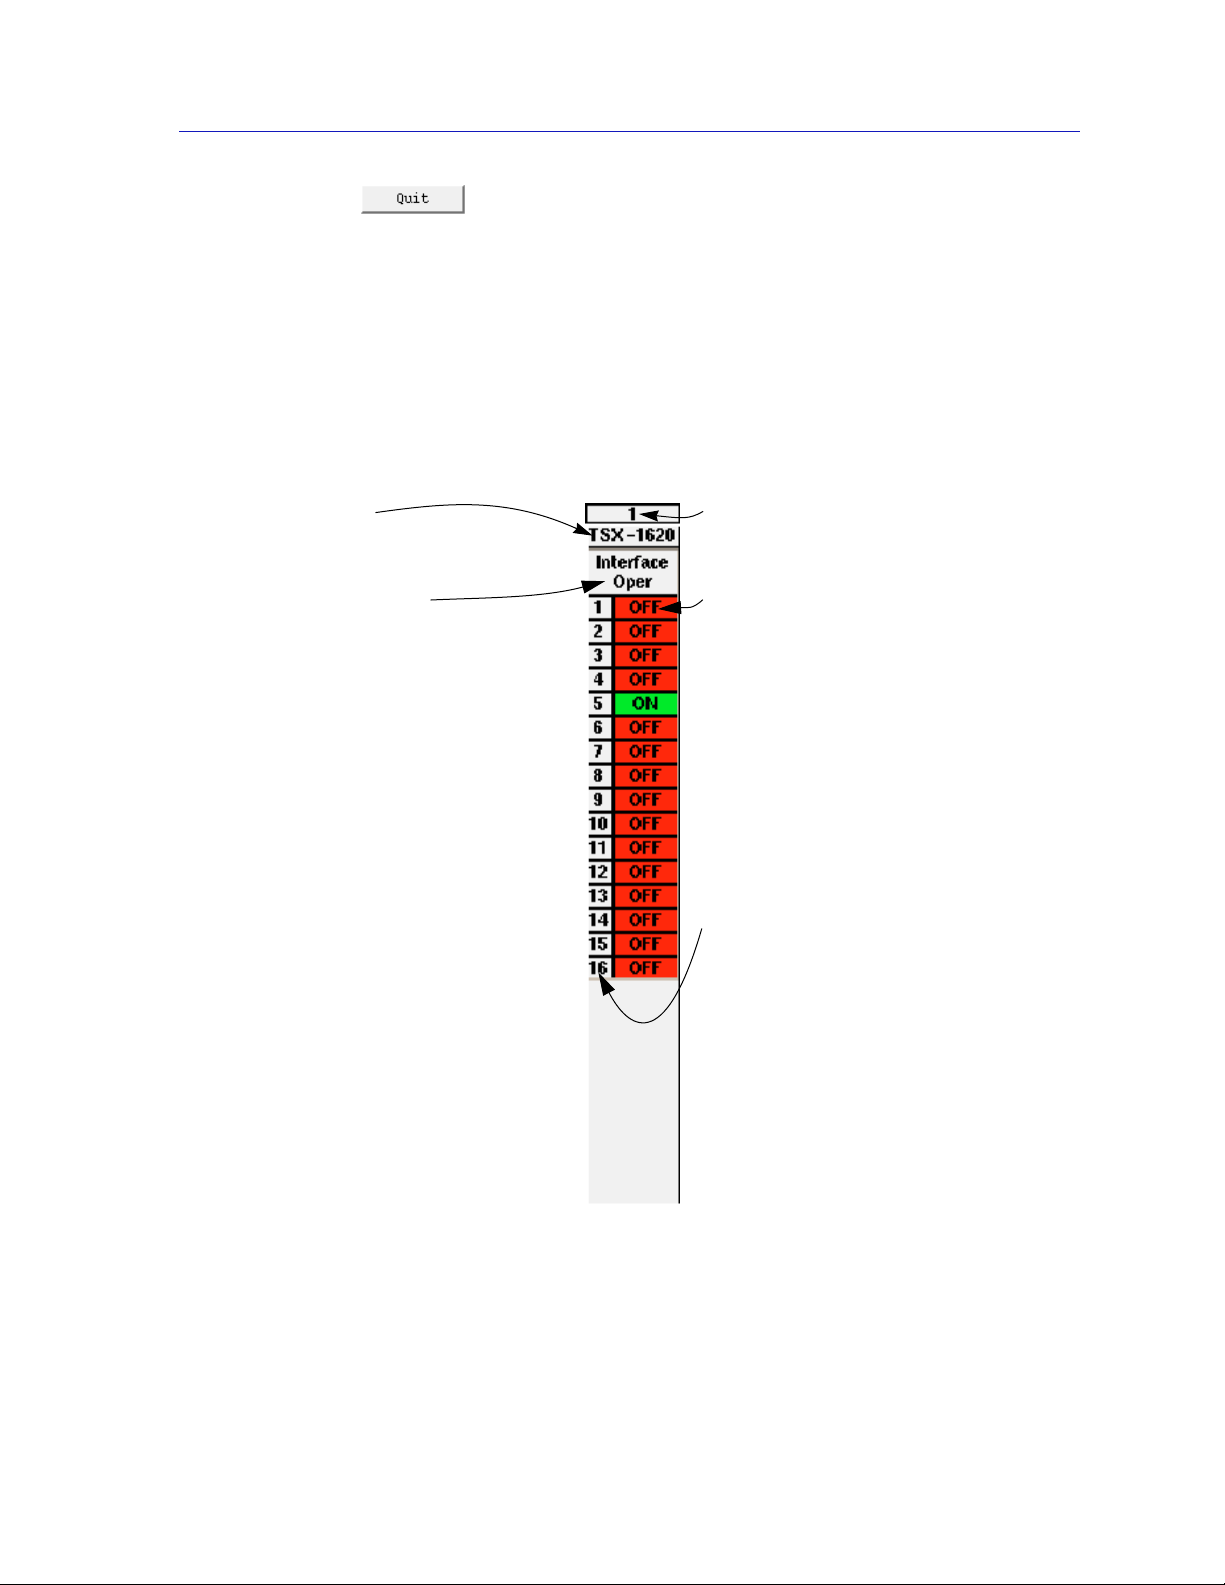
Using the TSX-1620 Hub View
Front Panel
Device summary
information
Hub View Front Panel
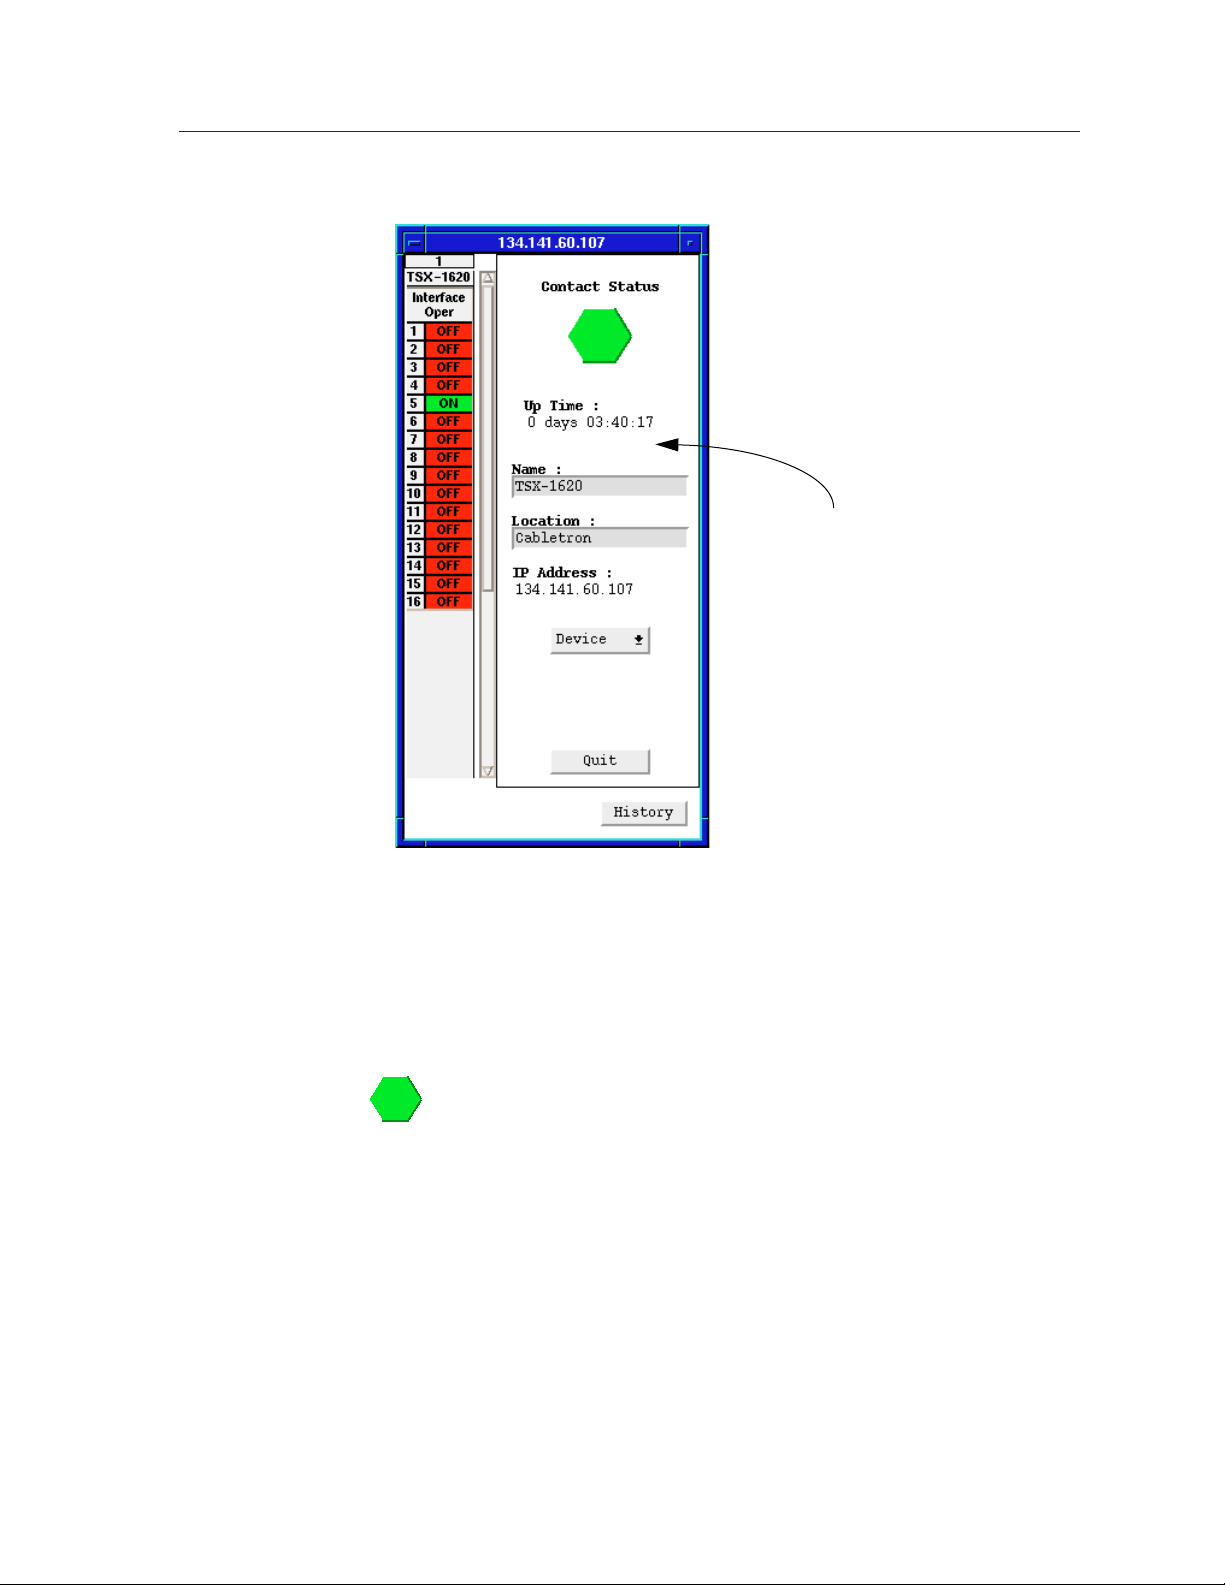
In addition to the graphical display of the TSX-1620’s ports, the Hub View gives
you device level summary information. The following Front Panel information
appears to the right of the port display in the Hub View:
Contact Status is a color code that shows the status of the connection between
SPMA and the device:
• Green indicates a valid connection.
• Blue means that SPMA is trying to reach the device but doesn’t yet know if the
connection will be successful.
• Red means that SPMA is unable to contact or has lost contact with the device.
Figure 2-1. TSX-1620 Hub View
Using the Hub View 2-3
Page 18

Using the TSX-1620 Hub View
Uptime
The time that the device has been running without interruption. The counter
resets to 0 days 00:00:00 (days:HH:MM:SS) when one of the following occurs:
• Power to the device is cycled.
• The device is reset manually.
Device Name
This field displays the device’s MIB II ifName value. You can set this value using
the SNMP MIB2 System Group window, available from the Interface menu.
Consult your SPMA Tools Guide for detailed information about the System
Group window and its use.
Device Location
This field displays the device’s MIB II ifLocation value. You can set this value
using the SNMP MIB2 System Group window, available from the Interface menu.
Consult your SPMA Tools Guide for detailed information about the System
Group window and its use.
IP Address
The device’s Internet Protocol address; this field will display the IP address you
have used to create the TSX-1620 icon (if you are running the Hub View from a
management platform) or the IP address you used to launch the Hub View
program (if you are running in stand-alone mode). You cannot change the TSX1620’s IP address from SPMA.
Clicking the Device button displays the Device menu, Figure 2-2, which lets you
open the Polling Intervals window.
Figure 2-2. TSX-1620 Hub View Device Menu
See Setting the Polling Intervals on page 2-15 for details about the Polling
Intervals window.
Note that the Device menu does not provide access to every application which is
available to the TSX-1620; some information is only available from the Module,
Interface, Bridge, and/or Bridge Port menus, and several applications can only be
accessed either from the icon menu (if you are running under a network
management platform) or from the command line (if you are running in standalone mode). See Chapter 1, Introduction to SPMA for the TSX-1620, for a
complete list of applications available to the TSX-1620 and how to access each
one.
2-4 Using the Hub View
Page 19
Clicking mouse button 1 on the Quit button closes all Hub View application
windows; any open applications which can also be accessed from the command
line or from the icon menu will remain open.
Using the Mouse in the TSX-1620 Hub View
Each of the TSX-1620’s ports will be displayed in the hub view; use the mouse as
indicated in the illustration in the following diagram (Figure 2-3) to access
Module, Interface/Bridge, and Bridge Port menus and functions.
Using the TSX-1620 Hub View
Module Type
Click button 3 to display the Module
menu.
Port Display Form
Click button 3 to display either the
Interface or Bridge menu, depending
on the application display mode
currently in effect. See The TSX-1620
Application Displays, on page 2-6,
for details on the application display
modes.
Using the Interface or Bridge menus,
you can change the port display form
shown in the Port Status boxes to any
one of the following:
- Oper Status
- Type
- Speed
- Interface Number
- MIB-II Statistics
- Admin (Bridge)
- Tp Frames Forwarded
- Tp Frames Filtered
- Sr Frames Forwarded
- Bridge Port Number.
Module Index
Click button 3 to display the Module
menu.
Port Status
The Port Status display changes with
the type of port display format
selected. Statistical selections display
values in a statistic/ second format.
Load displays traffic as a percentage
of theoretical maximum capacity. Clic k
button 3 to display the Bridge Port
menu when you are viewing the
Bridge application display mode. See
The TSX-1620 Application Displays ,
on page 2-6, for details on the
application display modes.
Port Index
Click button 3 to display the Bridge
Port menu when you are viewing the
Bridge application display mode. See
The TSX-1620 Application Displays ,
on page 2-6, for details on the
application display modes.
When you change the port display
form, the text in this box will change to
reflect the chosen form. See Port
Display Form, later in this chapter , f or
details.
Figure 2-3. Mousing Around the TSX-1620 Hub View
Using the Hub View 2-5
Page 20
Using the TSX-1620 Hub View
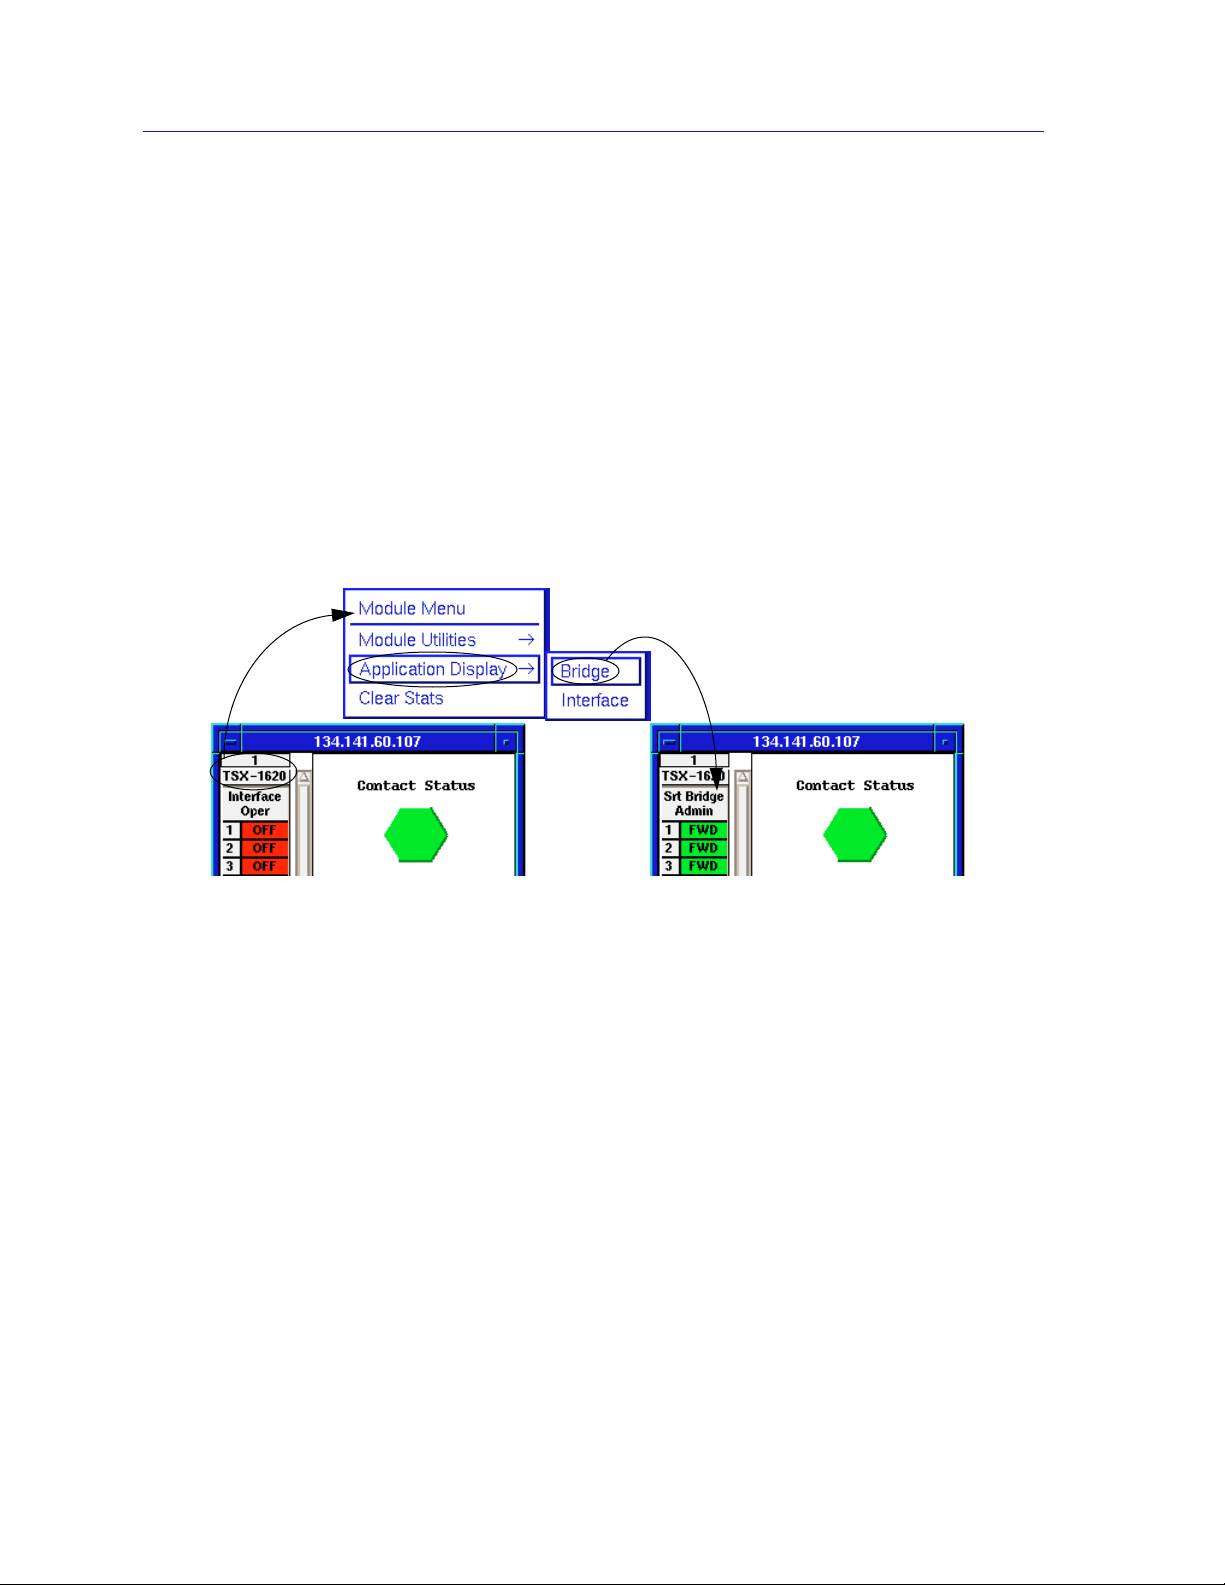
The TSX-1620 Application Displays
The TSX-1620 Hub View has two different application display modes: Interface
and Bridge. Each mode features different port display forms and offers different
menus. The Interface application display is shown by default when the TSX-1620
Hub View is launched. To switch between the Interface and Bridge application
displays:
1. Click on the module index or module type, at the top of the TSX-1620 port
display column in the Hub View (see Figure 2-4, below). The Module menu
will appear.
2. Drag down to Application Display, then right to Interface or Bridge,
depending on your intended selection. The Hub View will change to reflect
your selection.
Figure 2-4. Changing the TSX-1620 Application Display
When you change the application display mode, the port display form will
change to the default form for the chosen mode. For the Interface application
display, the default port display form is Oper Status. For the Bridge application
display, the default port display form is Admin. You can change the port display
form from either application display mode using the Port Display Form selection
from the Interface or Bridge menus. For details on the port display form selections
available for each application display, see Port Display Form, later in this chapter.
Each application display mode offers some different menus and menu selections,
as illustrated in Figure 2-5 and Figure 2-6, below.
2-6 Using the Hub View
Page 21
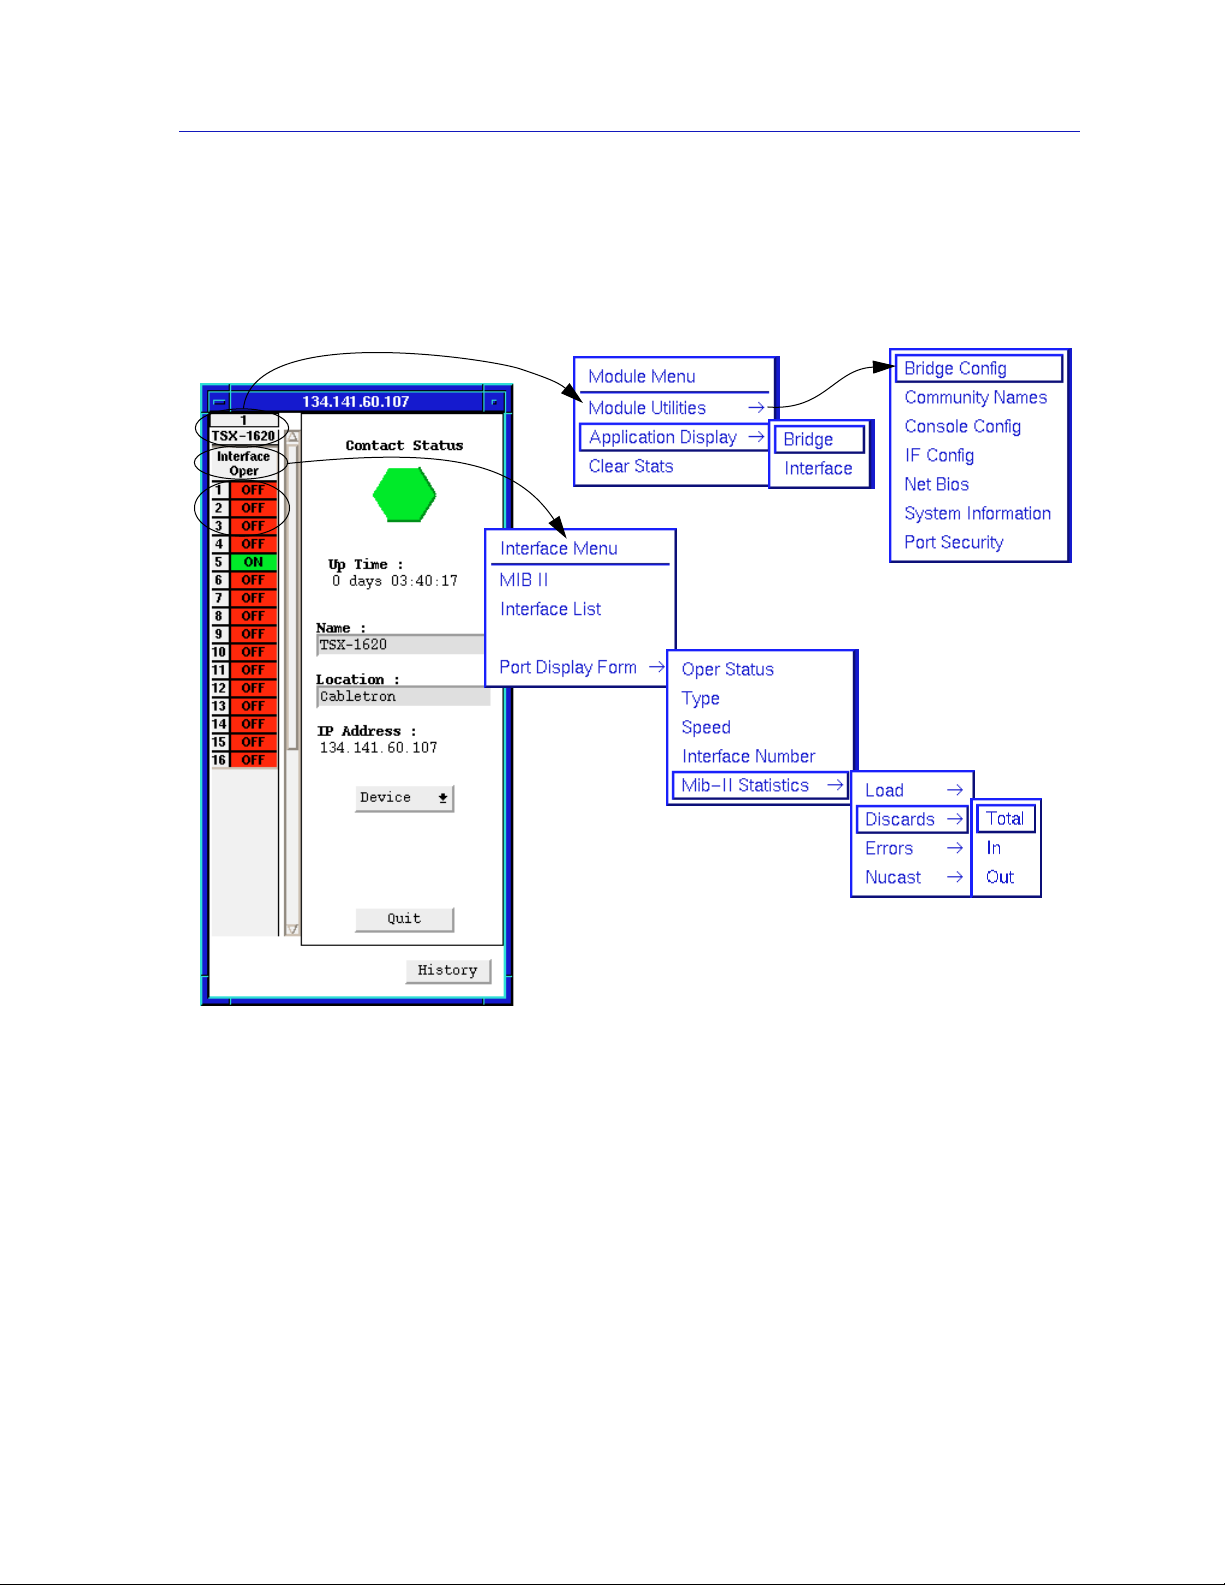
The Interface Application Display
The Interface application display allows you to view the interfaces according to
MIB II status and statistics. The default port display form for the Interface
application display is operational status (OperStatus).
Using the TSX-1620 Hub View
The Module Menu
The Interface
Menu
Figure 2-5. The Interface Application Display Menu Structure
Using the Hub View 2-7
Page 22
Using the TSX-1620 Hub View
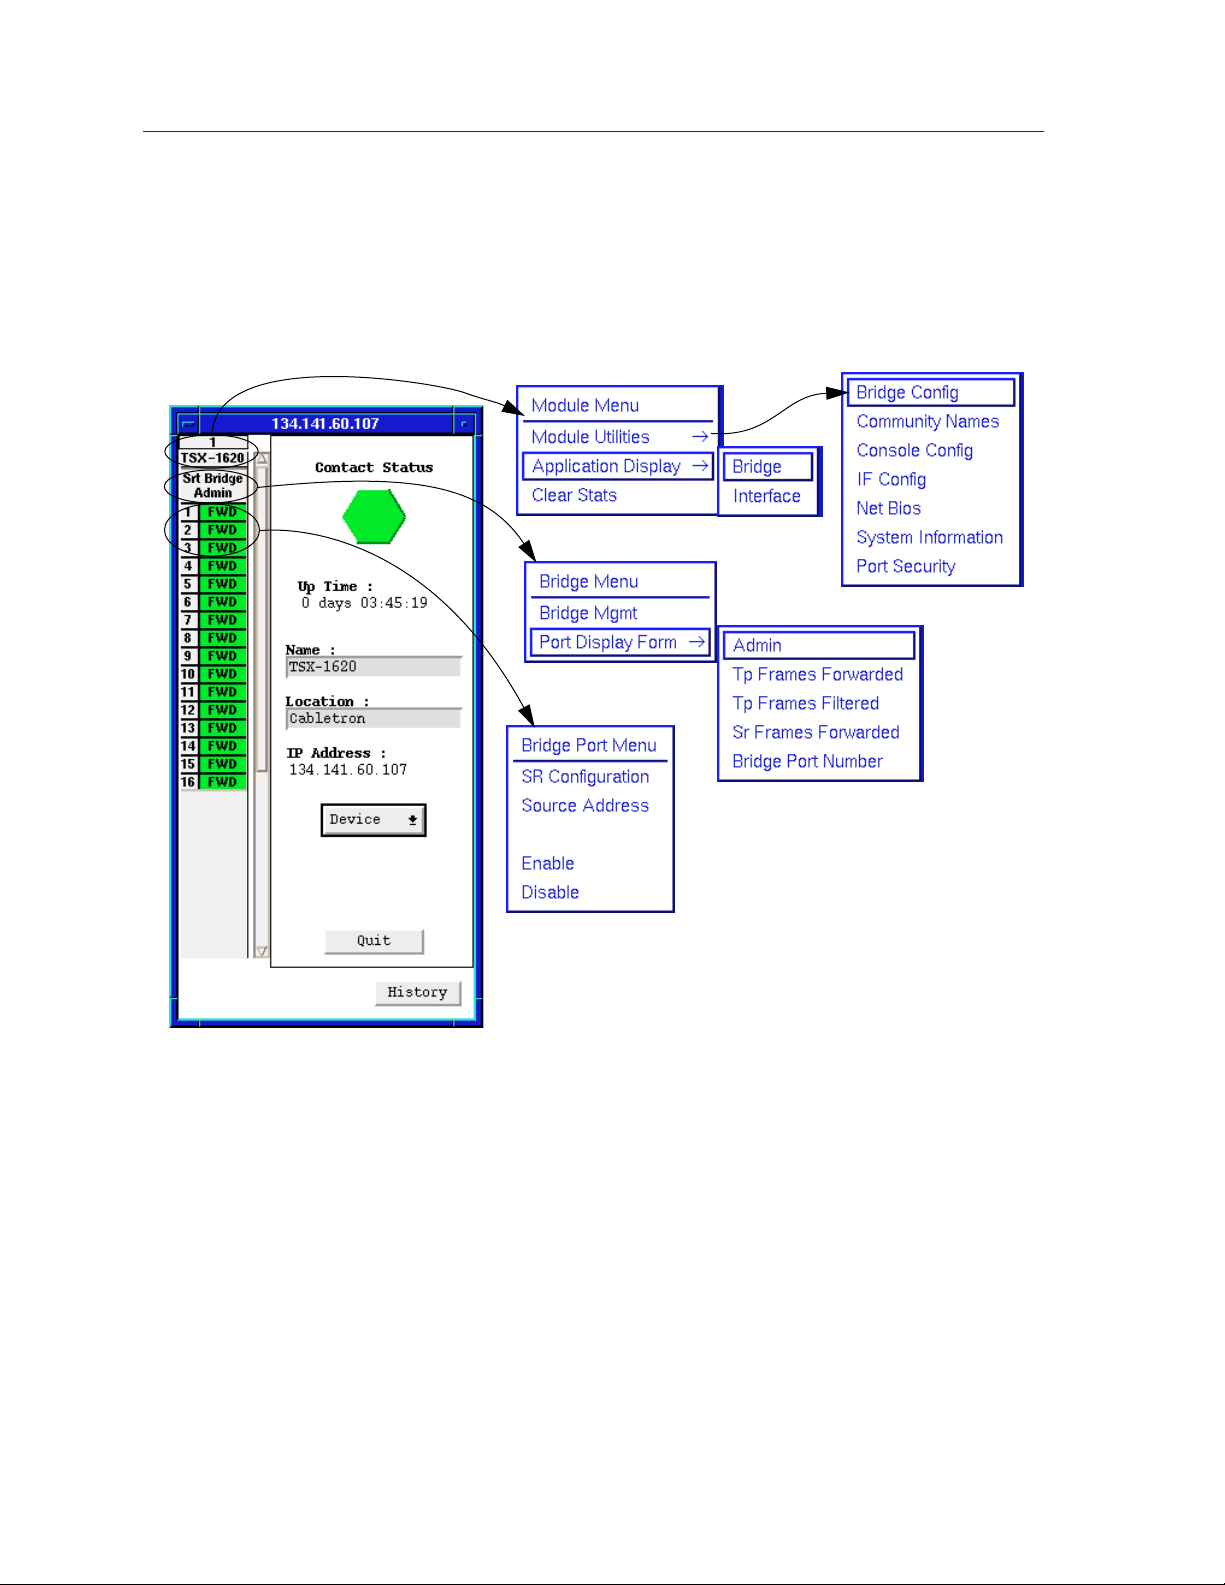
The Bridge Application Display
The Bridge application display allows you to view the bridging interfaces
according to Bridge statistics; it also gives you access to the Bridge View and
functions, as well as the Bridge Port menu. The default port display form for the
Bridge application display is Admin.
The Module Menu
The Bridge Menu
The Bridge Port
Menu
Figure 2-6. The Bridge Application Display Menu Structure
Note that the Module menu offers the same selections for both application display
modes.
The Bridge menu, available only from the Bridge application display mode,
allows you to launch the TSX-1620 Bridge View, which provides bridge
monitoring and management functions for the TSX-1620 (see Chapter 3, TSX-1620
Bridging, for details).
2-8 Using the Hub View
Page 23

Monitoring Device Performance
The information displayed in the Hub View can give you a quick summary of
device activity, status, and configuration. SPMA can also provide further details
about hub performance via its four-level menu structure. The Device, Module,
Interface/Bridge and Bridge Port menus give you control over the device at four
levels for both the Interface and Bridge application displays and give you access
to the tools, menus, and windows that let you monitor specific aspects of device
performance, change display options, and set TSX-1620 operating and notification
parameters. See Figure 2-5 and Figure 2-6 to view the different menus and their
contents.
Port Display Form
You can change the type of information displayed for each port by using the Port
Display Form option on the Interface or Bridge menus. Remember that you need
to change the application display to the proper mode to access the desired menu
(see The TSX-1620 Application Displays for details).
To change the port display form:
Using the TSX-1620 Hub View
1. Click in the appropriate area to display the Interface or Bridge menu (refer to
Figure 2-3 on page 2-5).
2. Dr ag down to P ort Display Form, then right as necessary to select one of the
port display options. The current selection will be displa y ed in the Port Display
Form text box, just above the ports.
Interface Port Display Form Options
Oper Status
The Oper Status port display form displays the current status of the port — ON,
OFF, NLK (no link), Test, or --- (unknown). Oper Status is determined by a
combination of MIB-II interface operational status (ifOperStatus), administrative
status (ifAdminStatus), and the interface’s physical link status (if applicable).
• The ON status indicates that the interface’s operational status is determined as
“UP”, that it has been administratively enabled, and that a physical link has
been detected at the port. A status of ON indicates that the port can send and
receive NMS packets, but does not indicate whether the port’s bridging
functions are enabled.
To determine whether a port’s bridging functions are enabled, change the application
NOTE
display mode to Bridge, and then select the Admin port display form. For more
information, see the definition of the Admin port display form, below.
Monitoring Device Performance 2-9
Page 24

Using the TSX-1620 Hub View
• A status of OFF indicates that the port has been physically disabled, or is
broken.
• NLK (no link) indicates that the interface’s operational status is determined as
“UP”, and it has been administratively enabled, but no physical link state to
the port has been detected.
• A status of Test indicates that the interface is in some operational or
administrative test status, and is unable to pass packets.
• The --- (unknown) status indicates that the state of the port’s operational, link,
and administrative states were not returned from the device.
Type
Displays the MIB-II ifType. As defined by the MIB “the type of interface,
distinguished according to the physical/link protocol(s) immediately below the
network layer in the protocol stack.”
Speed
Displays the operating speed of the interface; as defined by the MIB-II ifSpeed,
“An estimate of the interface’s current bandwidth in bits per second. For
interfaces which do not vary in bandwidth or for those where no accurate
estimation can be made, this object should contain the nominal bandwidth.”
Interface Number
Displays each port’s interface number, including the network management port.
Statistics
From the Interface or Bridge menu, you can display any one of the statistics
detailed below:
• Load will display the percentage of total, inbound, or outbound network load
processed by each port during the last polling interval.
- Total will display the percentage of total, inbound, and outbound network
load processed by each port during the last polling interval. This
percentage reflects the network load generated per polling interval by
devices connected to the port (determined by adding the change in the
port’s MIB-II ifInOctets and ifOutOctets values during the last polling
interval and multiplying by 800) compared to the port’s ifSpeed value.
- In shows the percentage of packets received during the last polling
interval from devices connected to the port. This percentage reflects the
packets received (determined by the change in the port’s MIB-II ifInOctets
value during the last polling interval, multiplied by 800) compared to the
port’s ifSpeed value.
2-10 Monitoring Device Performance
Page 25

Using the TSX-1620 Hub View
- Out shows the percentage of packets transmitted during the last polling
interval to devices connected to the port. This percentage reflects the
packets transmitted (determined by the change in the port’s MIB-II
ifOutOctets value during the last polling interval, multiplied by 800)
compared to the port’s ifSpeed value.
• Discards shows the percentage of total, inbound, or outbound packets that
were discarded by the port during the last polling interval due to congestion
or filtering.
- Total shows the percentage of packets that were discarded by the port
(determined by adding the port’s MIB-II ifInDiscards and ifOutDiscards)
during the last polling interval due to congestion or filtering. This
percentage reflects the packets discarded compared to the total number of
packets detected at the port:
(ifInDiscards+ifOutDiscards)/(ifInUcastPkts+
ifOutUcastPkts+ifInNUcastPkts+ifOutNUcastPkts).
- In shows the percentage of packets received by the port that were
discarded (determined by the port’s MIB-II ifInDiscards value) during the
last polling interval due to congestion. This percentage reflects the packets
discarded compared to the total number of packets detected at the port:
ifInDiscards/(ifInUcastPkts+ifOutUcastPkts+ifInNUcastPkts+
ifOutNUcastPkts).
- Out shows the percentage of packets filtered (not forwarded) by the port
(determined by the port’s MIB-II ifOutDiscards value) during the last
polling interval. This percentage reflects the packets discarded compared
to the total number of packets detected at the port:
ifOutDiscards/(ifInUcastPkts+ifOutUcastPkts+ifInNUcastPkts+
ifOutNUcastPkts).
• Errors shows the percentage of total, inbound, or outbound packets that were
discarded by the port during the last polling interval due to hardware
reception or transmission errors.
- Total shows the percentage of packets that were discarded by the port
(determined by adding the port’s MIB-II ifInErrors and ifOutErrors
values) during the last polling interval due to hardware reception or
transmission errors. This percentage reflects the packets discarded
compared to the total number of packets detected at the port:
(ifInErrors+ifOutErrors)/
(ifInUcastPkts+ifOutUcastPkts+ifInNUcastPkts+ifOutNUcastPkts).
- In shows the percentage of packets that were discarded by the port
(determined by the port’s MIB-II ifInErrors value) during the last polling
interval due to hardware reception errors. This percentage reflects the
packets discarded compared to the total number of packets detected at the
port: ifInErrors/(ifInUcastPkts+ifOutUcastPkts+ifInNUcastPkts+
ifOutNUcastPkts).
Monitoring Device Performance 2-11
Page 26

Using the TSX-1620 Hub View
- Out shows the percentage of packets that were discarded by the port
(determined by the port’s MIB-II ifOutErrors value) during the last
polling interval due to hardware transmission errors. This percentage
reflects the packets discarded compared to the total number of packets
detected at the port:
ifOutErrors/(ifInUcastPkts+ifOutUcastPkts+ifInNUcastPkts+
ifOutNUcastPkts).
• Non-Unicast (Nucast) shows the percentage of packets transmitted or
received by the port during the last polling interval that were multicast
packets.
- Total shows the percentage of packets transmitted or received by the port
during the last polling interval that were multicast packets. This
percentage reflects the multicast packets detected (determined by adding
the port’s MIB-II ifInNUcastPkts and ifOutNUcastPkts values) compared
to the total number of packets detected at the port: (ifInNUcastPkts+
ifOutNUcastPkts)/(ifInUcastPkts+ifOutUcastPkts+ifInNUcastPkts+
ifOutNUcastPkts).
- In shows the percentage of packets received by the port during the last
polling interval that were multicast packets. This percentage reflects the
multicast packets detected (determined by the port’s MIB-II
ifInNUcastPkts value) compared to the total number of packets detected
at the port:
ifInNUcastPkts/(ifInUcastPkts+ifOutUcastPkts+ifInNUcastPkts+
ifOutNUcastPkts).
- Out shows the percentage of packets transmitted by the port during the
last polling interval that were multicast packets. This percentage reflects
the multicast packets detected (determined by the port’s MIB-II
ifOutNUcastPkts value) compared to the total number of packets
detected at the port:
ifOutNUcastPkts/(ifInUcastPkts+ifOutUcastPkts+ifInNUcastPkts
+ifOutNUcastPkts).
For the statistical port display form options listed above, three dashes (---) will display for
NOTE
all inactive ports; any active (green) port will display a numeric value, even if it’s 0 (zero).
Port Color Codes for the Interface Application Display
For each port display form, the color-coding of each interface reflects a
combination of MIB-II interface operational status (ifOperStatus), administrative
status (ifAdminStatus), and the interface’s physical link status (if it applies).
Green On — The interface’s operational status is returned as “UP” —
and it has been administratively enabled; if the interface
supports link state, a physical link has been detected at the port.
2-12 Monitoring Device Performance
Page 27

Yellow No Link — The interface’s operational status is returned as “UP”
Blue Off — The interface is physically disabled (its operational status
Red Off — The interface is physically disabled (its operational status
(Magenta UNKnown — The interface cannot return the requested
Gray (---) Unknown — The port’s ifOperStatus was not returned from the
Bridge Port Display Form Options
Using the TSX-1620 Hub View
and it has been administratively enabled, but no physical link
state to the port has been detected. This will not appear for
interfaces that do not support link state.
is returned as “DOWN”), and it had also been administratively
disabled prior to entering the physically disabled state.
is returned as “DOWN”); however, prior to being physically
disabled, the port had been in an administratively enabled state.
information.
device; the state of the port cannot been determined.
Admin
Display’s the port’s current bridging status — FWD (forwarding), DIS (disabled),
LIS (listening), LRN (learning), BLK (blocking), BRK (broken), or UNK
(unknown). These bridge port status conditions are defined as follows:
• FWD (forwarding) when the interface is on-line and forwarding packets from
one network segment to another.
• DIS (disabled) when bridging at the interface has been disabled by
management, and no traffic can be received or forwarded on this interface.
• LIS (listening) when the interface is not adding information to the filtering
database. It is monitoring Bridge Protocol Data Unit (BPDU) traffic while
preparing to move to the forwarding state.
• LRN (learning) when the Forwarding database is being created, or the
Spanning Tree Algorithm is being executed because of a network topology
change.
• BLK (blocking) when the interface is on-line, but filtering traffic from going
across the TSX-1620 from one network segment to another.
• BRK (broken) when the physical interface has malfunctioned.
• UNK (unknown) if the interface’s status cannot be determined.
Tp Frames Forwarded
Displays the percentage of Transparent bridging frames that have been
transmitted to or received from the port’s attached segment that have been
forwarded to their destination.
Monitoring Device Performance 2-13
Page 28

Using the TSX-1620 Hub View
Tp Frames Filtered
Displays the percentage of valid frames received by this port that were discarded
by the forwarding process.
Sr Frames Forwarded
Displays the percentage of Source Route bridging frames that have been
transmitted to or received from the port’s attached segment that have been
forwarded to their destination.
Bridge Port Number
Displays the port’s bridge port number.
Port Color Codes for the Bridge Application Display
No matter which Bridge Port Status display form is selected, each bridge interface
is color-coded to reflect the Bridge Port state, as follows:
• Blue — The bridge port is administratively Disabled.
• Magenta — The bridge port is in the Listening or Learning state.
• Green — The bridge port is on line and Forwarding.
• Orange — The bridge port is currently Blocking.
• Red — The bridge port is malfunctioning.
• Gray — No information is being returned from the interface; its ifOperStatus
is not being returned.
Clearing Statistical Information
The Clear Stats selection in the TSX-1620 Module menu will reset the device’s
statistical counters to zero. To reset the TSX-1620’s statistical counters:
1. Click on the module index or module type to display the Module menu (see
Figure 2-3 on page 2-5).
2. Drag down to Clear Stats, and release. The TSX-1620’s statistical counters
will reset to 0, and begin updating at the rate determined by the Statistics
polling interval.
2-14 Monitoring Device Performance
Page 29

Managing the Device
In addition to the performance information described in the preceding section,
the Hub View also provides you with the tools you need to configure your TSX1620 and keep it operating properly. Device management functions include
setting polling intervals, performing bridge configuration, setting community
names, performing console configuration, performing If configuration,
performing NetBIOS configuration, viewing and changing system information,
configuring port security, viewing the interface list, accessing the MIB I, II Tool,
accessing bridge management, performing source routing configuration for TSX1620 ports, viewing a bridge port’s source address list, and enabling and disabling
bridging for the ports.
Setting the Polling Intervals
To set the polling intervals used by SPMA and the TSX-1620:
1. Click on to display the Device menu.
2. Drag down to Polling Intervals, and release.
Using the TSX-1620 Hub View
Figure 2-7. TSX-1620 Polling Intervals
3. To activate the desired polling, click mouse button 1 on the selection box to
the right of each polling type field.
4. To change a polling interval, highlight the value you would like to change, and
enter a new value in seconds. Note that the Use Defaults option must
selected, or values will revert back to default levels when you click on
, and your changes will be ignored.
Managing the Device 2-15
not
be
Page 30

Using the TSX-1620 Hub View
5. If you wish to use your new polling interval settings as the default values that
SPMA will use for each TSX-1620 you are managing, use mouse button 1 to
select the Save As Defaults option.
6. If y ou wish to replace e xisting values with the current set of def ault v alues, use
mouse button 1 to select the Use Defaults option.
7. Click mouse button 1 on once your changes are complete.
Changes take effect after the current polling cycle is complete.
You can set the update intervals for the following:
Contact Status
This polling interval controls how often the TSX-1620 is “pinged” to check
SPMA’s ability to maintain a connection with the device.
Device General Status
This polling interval controls how often the Hub View Front Panel Information —
such as Uptime, Device Name, and so forth — and some port status information
is updated.
NOTE
Device Configuration
This polling interval controls how often a survey is conducted of the TSX-1620’s
physical configuration; information from this poll would change the Hub View to
reflect any changes in the device’s physical configuration.
Port Operational State
This polling interval controls the update of the information displayed in the Port
Status boxes for each of the TSX-1620’s ports. Port state information includes the
selected Port Display Form information and the associated color codes.
Statistics
This polling interval controls how often the information displayed in the Port
Status boxes is updated when the Port Display Form is set to a statistical selection.
SPMA generates network traffic when it retrieves the above-described information; keep
in mind that shorter intervals mean increased network traffic. Range limits for these
polling times are 0-999,999 seconds; however, an entry of 0 will be treated as a 1.
2-16 Managing the Device
Page 31

Using the Bridge Config Utility
The Bridge Config utility allows you to enable or disable Spanning Tree for your
TSX-1620, as well as define a group destination (multicast) MAC address to be
used in implementing the source routing function. To access the Bridge Config
window:
1. Click on the module index or module type to display the Module menu (see
Figure 2-3 on page 2-5).
2. Drag down to Module Utilities, then right to Bridge Config, and release.
Using the TSX-1620 Hub View
Figure 2-8. The Bridge Config Window
To enable or disable Spanning Tree using the Bridge Config window:
1. Click on the Spanning T ree: Enable or Disable option, as desired. Spanning
Tree will be enabled or disabled for the TSX-1620, depending on your
selection. The default selection is Disable.
The Destination MAC address must be one of two group destination MAC
addresses, as defined by the Source Routing specification. A frame containing the
destination group address value c0:00:00:00:01:00 will be received by all stations
on the sending station’s ring. A frame containing the destination group address
value 80:41:00:00:00:00 will be received by all stations on all rings in a multi-ring
network. To define or change the group destination (multicast) MAC address to
be used in implementing the source routing function:
1. Highlight the contents of the Destination MAC field. Type the desired group
destination MAC address in Canonical (Token Ring) format, and then press
Enter or Return on your keyboard.
Managing the Device 2-17
Page 32

Using the TSX-1620 Hub View
Defining Community Names
The Community Names utility allows you to configure up to eight different
community names that determine read-only or read-write privileges for the
device. This window also allows you to establish an IP address to which SNMP
traps will be sent. To invoke the Community Name window from the TSX-1620
Hub View:
1. Click on the module index or module type to display the Module menu (see
Figure 2-3 on page 2-5).
2. Drag down to Module Utilities, then right to Community Names, and
release.
Figure 2-9. The TSX-1620 Community Name Window
The list at the top of the window contains entries for each of the eight available
community name slots. Using this window, you can modify the names,
permissions, and trap IP addresses for any of these eight available entries. To
define or modify a community name entry:
1. In the window’s Community Name list, click on the entry that you wish to
define or modify. The list entry will be highlighted to show that it is selected. If
you are modifying an existing community name entry, its index, name,
permission setting, and trap IP address will display in the fields below the list.
2. Highlight the contents of the Name field (if any), type the desired community
name, and press Enter or Return on your keyboard. The selected list entry
will change to reflect the new name.
2-18 Managing the Device
Page 33

3. To define permissions for the selected entry, click on the Read Only or Read
Write option, as desired. The selected permission will be reflected in the list
entry.
4. To establish an IP address to which SNMP traps will be sent, highlight the
contents of the Trap IP field, type the desired IP address, and press Enter or
Return on your keyboard. The selected list entry will change to reflect the new
trap IP address. The default value for this field is 0.0.0.0; if this field is left at
the default value, no traps will be sent.
The Refresh button initiates a new request for Community Name information.
When this button is clicked, the TSX-1620 will be queried for its community name
configuration, and any changes that have occurred since the window was opened
(or since the Refresh button was last clicked) will be reflected in the Community
Name window.
Configuring Your TSX-1620’s Serial Port
The Console Config utility allows you to configure your TSX-1620’s serial (local
management) port. Using the Console Config window you can view the port’s
hardware type, select its speed, define the number of bits per character and stop
bits, configure the parity and flow control, and enable or disable ANSI graphics
for the port. To launch the Console Config window from the TSX-1620 Hub View:
Using the TSX-1620 Hub View
1. Click on the module index or module type to display the Module menu (see
Figure 2-3 on page 2-5).
2. Drag down to Module Utilities, then right to Console Config, and release.
Managing the Device 2-19
Page 34

Using the TSX-1620 Hub View
Figure 2-10. The Console Config Window
The Hardware field at the top of the window displays your serial port’s hardware
type. To configure your serial port:
1. Select your serial port’s speed by clicking on the menu button in the Speed
field to display the Speed selection menu. Select the desired port speed from
the menu. The menu will disappear , and y our selection will be displa y ed in the
menu button. Available speed selections are 1200, 2400, 4800, 9600, 19200,
or 38400 bits per second.
2. Select the number of bits in a character for the port by clicking on the menu
button in the Bits Per Char field to display the Bits Per Character selection
menu. Select the desired number of bits per char acter (7 or 8) from the menu.
The menu will disappear, and your selection will be displayed in the menu
button.
3. Select the number of stop bits (one, one and a half, or two) for the port by
clicking on the menu button in the Stop Bits field to display the Stop Bits
selection menu. Select the desired number of stop bits from the menu. The
menu will disappear, and your selection will be displayed in the menu button.
4. Select the parity of the port by clicking on the menu button in the Parity field
to display the P arity selection menu. Select the desired sense of parity (none,
odd, even, mark, or space) from the menu. The menu will disappear , and y our
selection will be displayed in the menu button.
2-20 Managing the Device
Page 35

5. Designate the port’s flow control parameter by clicking on the menu button in
the Flow Control field to display the Flow Control selection menu. Select the
desired type of flow control (none, Rts-cts, or Xoff) from the menu. The menu
will disappear, and your selection will be displayed in the menu button.
6. Enable or disable the ANSI Graphics option for the port by clicking either the
Enable or Disable option in the Graphics Mode field.
Performing IF Configuration
The IF Config utility allows you to establish Bridge and IP parameters for each
port on your TSX-1620. Using the IF Configuration window, you can establish the
bridge type, enable or disable NetBIOS and Spanning Tree, assign a priority level,
and define or change the IP address, subnet mask, gateway address, and MAC
address for each interface (port) on your device. To launch the IF Configuration
window:
1. Click on the module index or module type to display the Module menu (see
Figure 2-3 on page 2-5).
2. Drag down to Module Utilities, then right to IF Config, and release.
Using the TSX-1620 Hub View
Figure 2-11. The IF Configuration Window
Managing the Device 2-21
Page 36

Using the TSX-1620 Hub View
Changing the Displayed Interface
The values and settings shown in the various fields in the window reflect the
current configuration of the TSX-1620 port (interface) index displayed in the
Interface field at the top of the window. If you change the interface number in the
Interface field to a different valid ifIndex, the values and settings in the other
fields will change to reflect the configuration of the new interface, allowing you to
change the configuration if desired. To change the displayed interface:
1. Highlight the contents of the Interface field, and type the ifIndex (interface
number) of the port that you wish to view. Press Enter or Return on your
keyboard, and the values and settings in the other fields in this window will
change to reflect the configuration of the specified interface.
Performing Interface Configuration
With the desired interface’s configuration displayed in the IF Configuration
window, you can change any of the settings for that interface, if desired. To do so:
1. Change the type of bridging to be used for the interface by clicking on the
menu button in the Bridge T ype field to display the Bridge Type selection
menu. Select the desired bridging type (unknown, transparent only, source
route transparent, or source route only) from the menu. The menu will
disappear, and your selection will be displayed in the menu button.
2. Enab le or disab le NetBIOS Broadcast Reduction f or the interface by selecting
the Enable or Disable option in the Net BIOS field.
3. Enable or disable Spanning Tree for the interface by selecting the Enable or
Disable option in the Spanning T ree field.
4. Assign a Token Ring priority level for the interf ace b y highlighting the contents
of the Priority field, typing the desired priority value, and pressing Enter or
Return on your keyboard. You may assign any priority from 1 to 16.
5. Assign an IP address to the interface by highlighting the contents of the IP
Address field, typing the desired valid IP address in dotted decimal notation,
and pressing Enter or Return on your keyboard. All of the TSX-1620’s
interfaces should use the same address.
6. Define a subnet mask to be used on the interface’ s IP address b y highlighting
the contents of the Subnet Mask field, typing the desired valid subnet mask in
dotted decimal notation, and pressing Enter or Return on your ke yboard. The
subnet mask defines the network and host portions of the IP address.
7. Define a gateway address to be used by the interface by highlighting the
contents of the Gateway Address field, typing the desired valid gateway
address in dotted decimal notation, and pressing Enter or Return on your
keyboard. The gateway address is used by SNMP/UDP when attempting to
traverse routed IP networks.
2-22 Managing the Device
Page 37

8. Change the interface’s MAC address by highlighting the contents of the
Physical Address field, typing the desired MAC address , and pressing Enter
or Return on your keyboard.
Viewing NetBios Information
The NetBIOS utility allows you to view information about specific NetBIOS MAC
addresses for which the TSX-1620 has forwarding and/or filtering information.
Such information is used by the transparent bridging function when determining
how to propagate a received frame. The NetBIOS Configuration window displays
each detected NetBIOS MAC address and its corresponding name, port, and RIF
field. To display the NetBIOS Configuration window:
1. Click on the module index or module type to display the Module menu (see
Figure 2-3 on page 2-5).
2. Drag down to Module Utilities, then right to Net Bios, and release.
Using the TSX-1620 Hub View
Figure 2-12. The NetBIOS Configuration Window
Each NetBIOS MAC address for which the TSX-1620 has forwarding and/or
filtering information is displayed in the list at the top of the window. This
window will only display information about a MAC address after the device has
received a frame from that address. When you highlight an entry in the list, its
corresponding information is displayed in the fields beneath the list.
Managing the Device 2-23
Page 38

Using the TSX-1620 Hub View
The NetBIOS Configuration window offers the following information about each
NetBIOS MAC address:
Name
The NetBIOS name corresponding to the MAC address from which the TSX-1620
has received a frame.
Address
The NetBIOS MAC address from which the TSX-1620 has received traffic.
Port
The port number on which a frame from its associated NetBIOS MAC address has
been received.
RIF
The routing information field (RIF) of the frame which has been received from the
associated NetBIOS MAC address.
Viewing and Changing System Information
The System Information utility allows you to view the TSX-1620’s firmware
revision, view and change the system date and time, and enable or disable the
daylight savings time setting which affects the system date and time. To invoke
the System Information window:
1. Click on the module index or module type to display the Module menu (see
Figure 2-3 on page 2-5).
2. Drag down to Module Utilities, then right to System Information, and
release.
Figure 2-13. The System Information Window
2-24 Managing the Device
Page 39

The Software Revision field displays the device’s current revision of firmware. If
you have an expansion module installed, this field will display the firmware
revision for each module, separated by five ASCII spaces. The expansion
module’s firmware revision will be displayed last.
The Date and Time fields display the current system date and time. These fields
may be edited. The Daylight Savings field shows the current daylight savings
mode, and allow you to enable or disable the daylight savings setting.
Setting the Device Date, Time, and Daylight Savings Mode
To alter the TSX-1620’s system date and time, and enable or disable the daylight
savings mode:
1. Highlight the contents of the Date field, type the desired system date in
MM/DD/YY format, and press Enter or Return on your keyboard.
2. Highlight the contents of the Time field, type the desired system time in
HH:MM:SS format, and press Enter or Return on your keyboard.
3. To enable or disable daylight savings mode, click on the Enable or Disable
option in the Daylight Savings field. When daylight savings mode is enabled,
the system time will automatically be adjusted when daylight savings or
standard time is in effect.
Using the TSX-1620 Hub View
Configuring Port Security
The Port Security utility allows you to automatically enable or disable to any of
the TSX-1620’s ports during specified days of the week and/or during specified
times of the day. The main Port Security window displays security settings
according to parameters specified in the Configure View window. The Configure
Restrictions window allows you to restrict access to a port or a range of ports
during a specified date and time or range of dates and times. To launch the Port
Security utility:
1. Click on the module index or module type to display the Module menu (see
Figure 2-3 on page 2-5).
2. Drag down to Module Utilities, then right to Port Security, and release.
Managing the Device 2-25
Page 40

Using the TSX-1620 Hub View
Figure 2-14. The Main Port Security Window
The Port Security window will not list any security restrictions until you specify
the parameters that you wish to view. These parameters are specified using the
Configure View window, which is launched from the Port Security window.
When you click on the Update button, the TSX-1620 will be queried for its port
security configuration (according to the view parameters specified in the
Configure View window), and any changes that have occurred since the window
was opened (or since the Update button was last clicked) will be reflected in the
main Port Security window.
Viewing Your Port Security Settings
To display the Configure View window:
1. Click on at the bottom of the Port Security window . The Configure
View window will appear.
2-26 Managing the Device
Page 41

Using the TSX-1620 Hub View
Figure 2-15. The Configure View Window
The Viewing Sort Priority buttons at the top of this window allow you to change
the order in which your security information is displayed in the Port Security
window. Each button allows you to choose from among Day, Port, Hour, and
Status. To change the Viewing Sort Priority:
1. Click on the First, Second, Third, and/or Fourth buttons to display the
selection menu. Drag down to the par ameter (Day, Port, Hour, or Status) that
you wish to be displayed in the corresponding order in the Port Security
window, and release. The selected parameter will appear in the button, and
the parameter column order will change in the Port Security window.
Using the Viewing Selection Criteria lists in the Configure View window, you can
choose the information to be displayed in the Port Security window. You can
choose to view all security configurations for a selected day of the week, for a
certain hour of the day, for a certain port, and/or for enabled or disabled ports.
You may also choose to display security information for a range of days, hours,
and/or ports, as well as for both enabled and disabled ports. It is not necessary to
choose from among
selection criteria:
1. In the Day selection list, select one or more days of the week for which you
wish to view your security configuration.
all
possible selection criteria. To configure your viewing
2. In the Port selection list, select one or more of the TSX-1620’s ports for which
you wish to view your security configuration.
Managing the Device 2-27
Page 42

Using the TSX-1620 Hub View
3. In the Hour selection list, select one or more hours of the day for which you
wish to view your security configuration. Hour number 0 represents 12:00 am.
4. In the Status selection list, select one or both status conditions (Enable or
Disable) for which you wish to view your security configuration.
5. Clic k on . All port security information matching the selected criteria
will be displayed in the Port Security window.
Clicking on the Clear button will deselect any selections you have made in the
Configure View window.
Configuring Your Port Security Settings
The Configure Restrictions window allows you to configure your TSX-1620’s port
security settings. Using this window, you can automatically enable or disable to
any of the TSX-1620’s ports during specified days of the week and/or during
specified times of the day. To display the Configure Restrictions window:
1. Click on at the bottom of the Port Security window. The
Configure Restrictions window will appear.
Figure 2-16. The Configure Restrictions Window
To configure the TSX-1620’s port security settings:
1. In the Day selection list, select one or more days of the week for which you
wish to enable or disable one or more TSX-1620 ports.
2. In the Port selection list, select one or more of the TSX-1620’s ports that you
wish to enable or disable during the specified time period(s).
2-28 Managing the Device
Page 43

3. In the Hour selection list, select one or more hours of the day for which you
wish to enable or disable one or more TSX-1620 ports. Hour number 0
represents 12:00 am.
4. In the Status selection list, select Enable to enab le the specified port or ports
during the specified time period(s). Select Disable to disable the specified
port or ports during the specified time period(s).
5. Clic k on . Your TSX-1620 port security settings will be applied to the
device, and the specified restrictions will be enacted during the appropriate
time period(s).
Clicking on the Clear button will deselect any selections you have made in the
Configure Restrictions window.
Viewing the Interface List
The Interface List option in the Interface menu displays a list of each of the TSX1620’s interface (port) numbers and their associated MAC addresses. Remember,
to use the Interface menu, the TSX-1620 application display must be in the
Interface mode. To display the Interface List window from the Hub View:
Using the TSX-1620 Hub View
1. Click in the Port Display Form text box to display the Interface menu (refer to
Figure 2-3).
2. Drag down to Interface List, and release.
Figure 2-17. The Interface List Window
Managing the Device 2-29
Page 44

Using the TSX-1620 Hub View
The Interface List window can display about a dozen interfaces at once; use the
scroll bar to the right of the list to view additional interfaces, if necessary.
Accessing the MIB I, II Tool
You can access the MIB I, II Tool directly from the Hub View. You can view MIB II
statistics for your TSX-1620 via this window.
1. Clic k in the appropriate area to display the Interf ace menu (ref er to Figure 2-3,
on page page 2-5).
2. Dr ag down to MIB II and release . The SNMP MIB2 System Group window will
appear. For more information on the MIB I, II tool, see Chapter 2, Using the
MIB I, MIB II Tool in the
You must be viewing the Interface application display mode in order to have access to the
NOTE
Interface menu and this option.
SPMA T ools Guide
.
Accessing Bridge Management
You can access the Bridge View and associated bridge applications from the
Bridge menu in the Hub View.
1. Click in the appropriate area to display the Bridge menu (refer to Figure 2-3,
on page page 2-5).
2. Drag down to Bridge Mgmt and release. The Bridge View will be displayed.
For more information on the Bridge View and the bridge applications, see
Chapter 3, Using the TSX-1620 Bridge View.
You must be viewing the Bridge application display mode in order to have access to the
NOTE
Bridge menu and this option.
Performing Source Routing Configuration for a Port
The TSX-1620 also provides virtual networking capability, allowing you to
configure logical rings that include multiple physical rings attached to the front
panel ports (e.g., physical rings inserted in ports 1, 2, 5, and 8 could all be
assigned to a single virtual ring network, and would communicate as if they
actually were on the same physical ring). These logical rings are achieved by
assigning the same local segment value to each port that you wish to include in
2-30 Managing the Device
Page 45

the logical ring. The local segment value can be assigned using the Source
Routing Configuration window, available from the Bridge Port menus in the Hub
View and the Bridge View. To access the Source Routing Configuration window
from the Hub View:
1. Click button 3 on the Port Index or Port Status box of the desired port to
display the Bridge Port menu.
2. Drag down to SR Configuration, and release. The Source Routing
Configuration window will appear. For more information on the Source
Routing Configuration window and other bridge applications, see Chapter 3,
Using the TSX-1620 Bridge View.
You must be viewing the Bridge application display mode in order to have access to the
NOTE
Bridge Port menu and this option.
Viewing a Bridge Port’s Source Address List
Using the TSX-1620 Hub View
You can use the Source Address option from the Bridge Port menu to view a
bridge port’s source address list. The list in the Source Address window displays
a MAC Address for each device communicating through a specific bridge port.
Remember, to use the Bridge Port menu, the TSX-1620 application display must
be in the Bridge mode. To invoke a bridge port’s Source Address window from
the Hub View:
1. Click button 3 on the Port Index or Port Status box of the desired port to
display the Bridge Port menu.
2. Drag down to Source Address, and release.
Managing the Device 2-31
Page 46

Using the TSX-1620 Hub View
Figure 2-18. The Bridge Port Source Address Window
The Interface field at the top of the window displays the interface number of the
selected port.
The Bridge Port Source Address window displays addresses of all devices that
have transmitted packets that were detected by the selected bridge port within a
time period less than the Filtering Database’s defined ageing time (addresses that
have not transmitted a packet during one complete cycle of the ageing timer will
be purged). The Filtering Database’s ageing timer is user-configurable; see
Chapter 3, Using the TSX-1620 Bridge View, for details. The Bridge Port Source
Address window can display about ten addresses at once; use the scroll bar to the
right of the list to view additional addresses, if necessary.
Enabling/Disabling Bridging for TSX-1620 Ports
You can enable or disable bridging for individual TSX-1620 ports using the Bridge
Port menus.
Enabling and Disabling Bridge Ports
When you disable a bridge port, you disconnect that port’s network from the
bridge entirely. The port does not forward any packets, nor does it participate in
Spanning Tree operations. Nodes connected to the network can still communicate
with each other, but they can’t communicate with the bridge or with other
networks connected to the TSX-1620. When you enable a port, the port moves
from the Disabled state through the Learning and Listening states to the
Forwarding state; bridge port state color codes will change accordingly.
2-32 Managing the Device
Page 47

NOTE
Using the TSX-1620 Hub View
You can enable and disable bridging for the TSX-1620’s ports from each port’s
Bridge Port menu. Remember, to use the Bridge Port menu, the TSX-1620
application display must be in the Bridge mode.
To enable or disable an bridging across an individual port:
1. Click button 3 on the Port Index or Port Status box to display the Bridge Port
menu.
2. Drag down to Enable or Disable, as appropriate, and release.
For more information about bridging functions and how to determine the current state of
each bridge port, see Chapter 3, Using the TSX-1620 Bridge View.
Managing the Device 2-33
Page 48

Using the TSX-1620 Hub View
2-34 Managing the Device
Page 49

Chapter 3
Using the TSX-1620 Bridge View
A brief explanation of bridging methods; a tour of the Bridge Traffic View; using the Detail View;
monitoring bridge operation; using the Filtering Database; configuring bridge operating parameters;
setting forwarding thresholds and notification options; setting polling parameters; enabling and
disabling bridges
The SPECTRUM Portable Management Application (SPMA) Bridge View
presents a series of windows that describe the TSX-1620 bridge and its bridge
interfaces. The Bridge View is available for devices that support the dot1dBridge
MIB. You can monitor bridge activity and performance and manage bridge
configuration for both Transparent and Source Routing bridging through the
Bridge Traffic View and other related windows. The SPMA bridge application
provides separate windows for configuring Source Route and Transparent
bridging.
Bridging Basics
Bridges are used in local area networks to connect two or more network segments
and to control the flow of packets between the segments. Ideally, bridges forward
packets to another network segment only when necessary. Bridges are also used
to increase the fault tolerance in a local area network by creating redundant
bridge paths between network segments. This is so that in the event of a bridge or
bridge segment failure, an alternate bridge path will be available to network
traffic, without significant interruption to its flow.
The method a bridge uses to forward packets, choose a bridge path, and ensure
that a sending station’s messages take only one bridge path depends on the
bridge’s type: Transparent or Source Routing. A third type of bridge — a Source
Route Transparent (SRT) bridge —has both Source Routing and Transparent
bridging capabilities.
3-1
Page 50

Using the TSX-1620 Bridge View
Transparent Bridging
Transparent bridges are most common in Ethernet networks. Individual
Transparent bridges monitor packet traffic on attached network segments to learn
their network segment location in terms of which bridge port receives packets
originated from a particular station (determined via the packet’s Source Address
field). This information gets stored in the bridge’s Filtering Database. When in the
Forwarding state, the bridge compares a packet’s destination address to the
information in the Filtering Database to determine if the packet should be
forwarded to another network segment or filtered (i.e., not forwarded). A bridge
filters a packet if it determines that the packet’s destination address exists on the
same side of the bridge as the source address.
Transparent bridges in a network communicate with one another by exchanging
Bridge Protocol Data Units, or BPDUs, and collectively implement a Spanning
Tree Algorithm (STA) to determine the network topology, to ensure that only a
single data route exists between any two end stations, and to ensure that the
topology information remains current.
Source Route Bridging
Source Routing is typically used to connect two or more Token Ring network
segments. Source Route bridges differ from Transparent bridges in that they do
not build and then use a physical address database to make forwarding decisions.
Instead, Source Route bridges read routing information included by the source
station and added by other bridges in a packet’s header to determine where to
forward the packet.
In Source Routing, sending and receiving devices employ broadcast packets —
otherwise known as explorer packets — to determine the most efficient route for a
message to travel. Generally, before a station sends a message, it will first send a
test packet to all stations on the same ring; if the sending station receives a
response to this packet, it knows that it does not need to include routing
information in the Routing Information Field (RIF) of this packet and all
subsequent packets it sends to the same station (i.e., the packets are not source
routed and will appear as transparent-style packets). If the sending station does
not receive a response to the test packet, it will send an explorer packet to the
destination; the explorer packet will be propagated by the network’s bridges as
either All Paths Explorer (APE) packets or as one Spanning Tree Explorer (STE)
packet. The task of both packet types is to get the destination station to return
specific route information to the sending station.
APE packets are sent to the destination station over every possible bridge path
when multiple bridge paths are available between any two local area network
stations. (Because of the method used by bridges to forward SR packets, the
presence of data loops in a network is not an issue for SR packets as it is for
packets that must be Transparently bridged.) The original APE frame contains no
routing information (e.g., bridge numbers and ring numbers); it is propagated
along all available paths to the destination station. Each bridge along the way
adds its own bridge and ring numbers to the packet’s RIF before forwarding it,
3-2 Bridging Basics
Page 51

thereby providing route information. The destination station directs replies to
each APE packet to the sending station, which, ideally, considers the route
traveled by the first reply received to be the most efficient route. The sending
station then stores the route information and uses it to send subsequent
transmissions to the same station.
Alternatively, a sending station may send an STE frame. On receipt of an STE
packet, a bridge can use the single bridge path as determined by the Spanning
Tree Algorithm to forward one Spanning Tree Explorer (STE) frame instead of
APE frames. In response to an STE packet, the destination station sends out one
APE packet, which returns to the sending station information on all possible
bridge paths. An STE packet is the only type of Source Route packet whose route
is determined by the Spanning Tree Algorithm. Although the Spanning Tree
Algorithm determines the bridge path an STE takes to the destination station, the
bridge still uses Source Routing to forward the packet (i.e., for specifically-routed
frames, the bridge will read and add information to the Routing Information Field
in the packet’s header).
Source Route Transparent Bridges
Using the TSX-1620 Bridge View
A Source Route Transparent (SRT) bridge—otherwise known as a translational
bridge—functions as both a Source Route bridge and a Transparent bridge,
providing all the functionality of both bridging types. Only one method, however,
is used to forward any single packet.
On receipt of a packet, an SRT bridge will read a packet header’s routing
information indicator (RII) bit to determine how to forward the packet. An RII set
to 1 indicates that a Routing Information Field (RIF) is present in the packet; the
bridge implements Source Routing accordingly. An RII value of 0 indicates that no
RIF is present in the packet; in this case, the bridge will forward the packet using
Transparent bridging. A translational bridge builds its Filtering Database from
information it obtains from both source routed and transparently bridged
packets.
Accessing the Bridge Traffic View Window
There are three ways to open the Bridge View: if you are working within a
network management system, you can select the Bridge View option from the
icon menu; specific directions for creating a TSX-1620 icon and accessing the icon
menu can be found in the appropriate Installing and Using SPECTRUM for...
guide. If you are working within the TSX-1620 Hub View, you can select the
Bridge Mgmt option from the Bridge menu. If you are running in a stand-alone
mode, type the following at the command line:
spmarun bridge <IP address> <community name>
Accessing the Bridge Traffic View Window 3-3
Page 52

Using the TSX-1620 Bridge View
The spmarun script invoked first in the above command temporarily sets the environment
NOTES
variables SPMA needs to operate; be sure to use this command any time you launch an
application from the command line. This script is automatically invoked when you launch
an application from the icon menu or from within the Bridge TrafficView.
If there is a hostname mapped to your bridging device’s IP address, you can use
<hostname> in place of <IP address> to launch the Bridge View. Please note, however,
that the hostname is not the same as the device name which can be assigned via Local
Management and/or SPMA; you cannot use the device name in place of the IP address.
The community name you use to start the Bridge application must have at least
Read access; for full management functionality, you should use a community
name that provides Read/Write or Superuser access. For more information on
community names, see Defining Community Names in Chapter 2, Using the
TSX-1620 Hub View, the appropriate Installing and Using SPECTRUM for...
guide, and/or the Community Names chapter in the SPMA Tools Guide.
The Bridge Traffic View is the heart of the Bridge application. The first window to
appear when you start the Bridge application, it contains a status display of the
device’s bridge interfaces and contains the buttons and menus that provide access
to all bridge monitoring and management functions.
Navigating Through the Bridge Traffic View
Within the Bridge Traffic View, you can click mouse buttons in different areas of
the window to initiate management tasks. The following diagram shows you how
to display the Bridge Traffic View Device and Port menus.
3-4 Accessing the Bridge Traffic View Window
Page 53

Using the TSX-1620 Bridge View
Each box represents a bridge
interface. Click button 3 anywhere
within a Bridge Port box to display the
Port menu. Click button 1 on a bridge
interface to select it for display in the
Detail View (at least two must be
selected to activate the Detail View
button).
Figure 3-1. Mousing Around the Bridge Traffic View
To display the Device menu:
1. Click on in the Bridge Traffic View front panel.
To display a Port menu:
1. Click mouse button 3 in a Bridge Port box.
Click on the Device button
to display the Device menu
The Front Panel shows device-level
summary information.
Accessing the Bridge Traffic View Window 3-5
Page 54

Using the TSX-1620 Bridge View
Bridge Traffic View Front Panel
The right side of the Bridge Traffic View displays device summary information:
Contact Status
Contact Status is a color code that shows the status of the connection between
SPMA and the device:
• Green means a valid connection.
• Blue means that SPMA is trying to reach the device but doesn’t yet know if the
connection will be successful.
• Red means that SPMA has lost contact with the device.
Uptime
The time that the device has been running without interruption. The counter
resets to 0 days 00:00:00 (X days HH:MM:SS) when one of the following occurs:
• Power to the device is cycled.
• The device is reset manually.
NOTE
Time and Date
The date and time are taken from the device’s internal 24-hour clock, which you
can set in the Bridge Status window; see The Bridge Status Window, page 3-12.
Device Name
This field displays the name you’ve assigned to this device in the Bridge Status
window; see The Bridge Status Window, page 3-12.
Device Location
This field displays the location you’ve assigned to this device in the Bridge Status
window; see The Bridge Status Window, page 3-12.
If you have assigned a device name or location that contains more than 18 characters, only
the first 18 will be displayed in the Bridge Traffic View. Check the Device Status window
for the complete name and/or location, if necessary.
IP Address
The device’s Internet Protocol address. You cannot change the IP address from
SPMA. For multi-interface devices, this will be the IP used to define the device
icon (if you are using a management platform) or the IP used to launch the
application (if you are running in stand-alone mode).
MAC Address
The device’s factory-set MAC hardware address.
3-6 Accessing the Bridge Traffic View Window
Page 55

Using the TSX-1620 Bridge View
Clicking on the Device button displays the Device menu. The Device menu lets
you perform the following:
• Open the Bridge Status window.
• Display a summary of bridge statistics.
• Open the Source Routing Configuration window.
• Open the Filtering Database window.
• Open the Find MAC Address window.
• Open the Spanning Tree Protocol window.
• Open the Polling Intervals window.
If you need to call Cabletron’s Technical Support about a problem with the Bridge
View, you’ll need the information provided in the Information window:
Figure 3-2. Bridge Information Window
Clicking mouse button 1 on the Bridge Traffic View Quit button closes all Bridge
View windows.
The Bridge Port Display
Each Bridge Port box in the Bridge Traffic View displays information about its
corresponding bridge interface.
System
Description
SPMA Bridge
View version
Accessing the Bridge Traffic View Window 3-7
Page 56

Using the TSX-1620 Bridge View
The number of bridge interfaces appearing in the Bridge Traffic View depends on the
NOTE
number of different local segment numbers assigned to the TSX-1620’s physical ports.
For example, if all of the TSX-1620’s physical ports have the same local segment identifier,
the Bridge Traffic View will display a single bridge interface (port). If physical ports 1-5
are assigned the same local segment identifier, and ports 6-16 are assigned another local
segment identifier, the Bridge Traffic View will display two bridge interfaces, and so on. A
port’s local segment identifier is assigned using the Source Routing Configuration
window. See The Source Routing Configuration Window on page 3-29 for details.
The Bridge Port boxes are color-coded, reflecting their current status. Bridge Port
boxes for disabled bridge ports are colored blue. Enabled bridge ports are colored
green, yellow, or red, depending on the range in which the traffic volume through
that interface falls. See Configuring Forwarding Thresholds, page 3-34, for
complete instructions on assigning traffic ranges and their corresponding Bridge
Port box colors.
Bridge Port box fields are as follows:
Port #
The index number assigned to the bridge interface.
Type
The bridge port’s physical interface type (e.g. ethernet-csmacd, fddi, ppp, token
ring, etc.).
MAC
The MAC address of the TSX-1620 port associated with the bridge interface.
For the TSX-1620, the MAC address displayed for each bridge interface will be that of the
NOTE
first detected physical port assigned to each interface (e.g., if physical ports 6-16 are
assigned to the same bridge interface, the MAC address displayed for that bridge interface
will be that of port 6). The MAC address displayed for bridge interface 1 will always be
that of port 1.
The remaining information displayed in the Bridge Port boxes depends on
selections made using the buttons located at the bottom of the Bridge Traffic View.
See the next section, Choosing Bridge Traffic Information: Bridge Traffic View
Buttons, for instructions on using these buttons.
Choosing Bridge Traffic Information: Bridge Traffic View Buttons
The four buttons at the bottom of the Bridge Traffic View control the type of
information that appears in some of the Bridge Port box fields. (The Port number,
Type, and MAC address fields are not affected by any of these buttons.)
3-8 Accessing the Bridge Traffic View Window
Page 57

Using the TSX-1620 Bridge View
The Frames/Admin, Source Routing/Transparent, and Delta/Percentage buttons
each let you choose one of the two display modes for the Bridge Port boxes. The
display mode visible on a button is the one not currently selected. Clicking on a
button when the button displays the desired mode type chooses that mode type
for the Bridge Port boxes. For example, the Frames/Admin button will display
Frames when the Admin display mode is in effect and Admin when the Frames
display mode is in effect.
The Frames/Admin button allows you to change the information displayed in the
Bridge Port boxes between traffic statistics (when Frames is selected) and port
state/status (when Admin is selected).
The Frames display mode shows the following Bridge Port information:
• Frms In—Displays the total number of frames, including BPDU frames,
received at this bridge port from its attached network segment during the last
polling interval.
• Frms Out—Displays the total number of frames, including BPDU frames,
transmitted or forwarded through this port to its attached network segment
during the last polling interval.
• Forwarded—Displays frames forwarded by this bridge port to another bridge
port on the device during the last polling interval. You can change this display
using the Delta/Percentage button (described in this section). When Delta is
selected, this field displays the total number of frames forwarded by this
bridge port to another port on the bridge during the last polling interval. When
Percentage is selected, this field displays the percentage of all frames received
by the port from its network segment that were forwarded to another port on
the bridge during the last polling interval.
When the Admin option is selected, the Bridge Port boxes display port Status —
whether the port is enabled or disabled — and port State.
Enabled The port is able to participate in bridging and the
Spanning Tree Algorithm.
Disabled The port cannot participate in bridging or Spanning Tree
operations.
Enabling and disabling a port changes its Port Status, not its Port State.
A port’s State indicates whether or not the port is forwarding packets and
participating in the exchange of BPDUs. The Spanning Tree Algorithm determines
the state of each port in order to maintain an active topology with no data loops.
As a port moves from the blocking to the forwarding state, it will remain in each
state for the duration of the Forward Delay in order to prevent data loops while
the active topology is changing. Possible port states are as follows:
Disabled The port has been disabled by management; it cannot
receive or forward traffic, and is not participating in the
exchange of BPDUs.
Accessing the Bridge Traffic View Window 3-9
Page 58

Using the TSX-1620 Bridge View
Blocking This port is not forwarding or receiving traffic (and
Listening This state is entered from the blocking state when the
Learning The port is processing BPDUs, but is not yet relaying
Forwarding A port enters this state from the Learning state. The port
therefore no physical address information is added to the
Filtering Database) nor is it sending or receiving BPDUs.
A port will enter the blocking state for two reasons: if it
receives information that another bridge is the
designated bridge to the network segment to which this
port is attached, or immediately after it has been enabled
by management.
STA determines that this port should participate in frame
relay. The port is processing BPDUs, but is not yet
forwarding or receiving traffic or adding information to
the Filtering Database.
packets. The port is adding address information to the
Filtering Database.
is relaying frames and processing BPDUs. A port in this
state can enter the Disabled state by management.
Broken If the port is malfunctioning, this value will display in
the State field.
On the TSX-1620, you can use this button to change the Bridge Port display
between Source Routing and Transparent bridging frame information. The title
bar at the top of the Bridge Port display area indicates the frame type described in
the bridge ports.
This two-state button is active when you have bridge statistics displayed in the
Bridge Port boxes (i.e., when Frames is selected); otherwise, it is grayed. When
you click on Delta, the Forward field in the Bridge Port boxes displays the total
number of frames forwarded by this bridge port to another port on the bridge
during the last polling interval. When you click on Percentage, the Forward field
in the Bridge Port boxes displays the percentage of all frames received by the port
from its network segment that were also forwarded to another port on the bridge
during the last polling interval.
The Detail View button lets you take a closer look at traffic between two bridge
ports. The Detail View button is grayed unless you have two bridge ports
selected. For complete instructions on how to use the Detail View, see the next
section.
3-10 Accessing the Bridge Traffic View Window
Page 59

Using the Detail View Window
The Detail View provides port-level information on two bridge ports.
For the TSX-1620, the Detail View can only be used if you have only two bridge ports
NOTE
configured (i.e., if you have more than two different local segment numbers assigned
among all of your physical ports). If three or more bridge ports have been configured, you
will be unable to select any bridge ports to view in the Detail View.
To open the Detail View:
1. In the Bridge Traffic View, select two bridge ports by clicking mouse button 1
on both ports; the selected Port boxes will be outlined, and the top part of
each selected box will be grayed. The Detail View button becomes active
once you select both bridge ports.
2. Click on the Detail View button. The Detail View window appears.
Using the TSX-1620 Bridge View
Figure 3-3. Detail View Showing Two Ports
Using the Detail View Window 3-11
Page 60

Using the TSX-1620 Bridge View
Each port shows the total frames transmitted and
received by the port.
Port summary information includes Port Index (at
the top of the Bridge Port box), Port Status,
Bridge Port State, and Frames Forwarded. You
can display Frames Forwarded as a delta value
(the total number of frames forwarded by this
bridge port to any other port on the bridge during
the last polling interval) or as a percentage value
(showing the percentage of all frames received b y
the port from its attached network segment during
the last polling interval that were forwarded to
another port on the bridge) by clicking the
Delta/Percentage button at the bottom of the
window (see Figure 3-3).
Each corner of the bridge port summarizes
activity to another bridge port. You can display
Forwarded To as a delta value (the total number
of frames forwarded by this bridge port to the
specified port on the bridge during the last polling
interval) or as a percentage value (showing the
percentage of all frames received by the port
during the last polling interval that were forwarded
to the specified port on the bridge) by clicking the
Delta/Percentage button at the bottom of the
window (see Figure 3-3).
Figure 3-4. Port Boxes in the Detail View
The diagram in Figure 3-4 explains the Detail View bridge port information.
The Bridge Status Window
You can set or change the device name or location— which display in the Bridge
Traffic View Front Panel—in the Bridge Status window.
The Contact field is the only Bridge Status window field not displayed in the
Bridge Traffic View Front Panel. Use the Contact box to record the name and
phone number of the person responsible for the device.
To set or change information for any of the Bridge Status window fields:
1. Display the Device menu by clicking on the Front Panel button.
2. In the Device menu, drag down to Status and release.
3-12 The Bridge Status Window
Page 61

Using the TSX-1620 Bridge View
3. In the Status window, highlight a text box, type in the new information; press
Enter or Return on the keyboard to set your changes before selecting a new
field.
Figure 3-5. Bridge Status Window
Although Date and Time fields are present in the TSX-1620’s Bridge Status window,
NOTE
these values are not supported for the TSX-1620. Any attempt to set a device date or time
using this window will result in an error message.
The Bridge Statistics Window
The Bridge Statistics window displays generic information about all ports
associated with the device.
To open the Bridge Statistics window:
1. In the Bridge Traffic View window, click on to display the Device
menu.
2. Drag down to Bridge Statistics and release. The Bridge Statistics window
appears.
The Bridge Statistics Window 3-13
Page 62

Using the TSX-1620 Bridge View
The Bridge Statistics window displays the following information:
Figure 3-6. Bridge Statistics Window
Bridging Type
Type refers to the type of bridging supported by the bridge.
• unknown
• transparent-only
• sourceroute-only
• srt (Source Route Transparent)
Total Ports
Shows the total number of bridge ports supported by this device.
Port
Displays each port’s index number.
IfIndex
Interface index; a unique value for each network (interface) to which this port
connects. Only a WAN port will connect to more than one interface
simultaneously.
PortCircuit
When dealing with X.25 virtual circuits, it’s possible for two Port Indexes to have
the same IfIndex. In such a case, Port Circuit contains the value of a MIB object
instance unique to the port; otherwise, Port Circuit is equal to 0.0. For example, if
Port 1 maps to IfIndex 1 and Port 2 maps to Ifindex 1, then the Port Circuits are 1.1
and 1.2 respectively.
DelayExceedDiscard
The number of frames a port has discarded due to an excessive transit time
through the bridge.
3-14 The Bridge Statistics Window
Page 63

MtuExceedDiscard
Mtu stands for “maximum transfer unit”; it is the largest frame size that can be
processed by the TSX-1620. A port discards any received frames that are larger
than the Mtu; this field lists how many such frames were discarded.
The information in the Bridge Statistics window is a snapshot of the data. When
you open the Bridge Statistics window, the application polls the devices for
information. Devices are not polled again until you click mouse button 1 on the
Update button, or close, then re-open the Statistics window.
When a device is reset, statistics windows and/or statistics displays in the Bridge View
NOTE
windows may display very large numbers for one polling interval. This is due to the
resetting of counters.
The Filtering Database Window
Using the TSX-1620 Bridge View
In Transparent bridging, each bridge port uses the device’s Filtering Database to
determine a packet’s route through the bridge. The Filtering Database is created
from permanent entries made via management, and from entries learned as the
bridge collects and stores the source address and port association from each
packet it receives.
When in the Forwarding state, the bridge examines each received packet and
compares the destination address to the contents of the Filtering Database. If the
destination address is located on the network from which the packet was
received, the bridge filters (does not forward) the packet. If the destination
address is located on a different network, the bridge forwards the packet to the
appropriate network. If the destination address isn’t found in the Filtering
Database, the bridge forwards the packet to all networks. To keep Filtering
Database entries current, older entries are purged after a period of time, which is
called the Dynamic Ageing Time.
The Filtering Database has two types of entries: Forwarding and Static. The
Forwarding view of the Filtering Database contain addresses that the bridge
learns from network traffic (also known as dynamic entries) as well as all the
static entries. Learned entries are subject to the bridge’s Dynamic Ageing Timer;
entries that aren’t accessed within the time specified by the ageing timer are
purged. Static entries may be subject to the ageing timer, depending on how the
entries were added. Static entries enter the Filtering Database in two ways: either
automatically, when permanent database entries are copied to the Filtering
Database, or manually when you move a Forwarding entry to the Static Table.
The Filtering Database Window 3-15
Page 64

Using the TSX-1620 Bridge View
Cabletron has extended the functionality of the Ethernet port on translational bridges, so
NOTES
the port can be set to Source Route mode.
When an Ethernet port is in Source Route mode, on receipt of an SR packet from the Token
Ring port, it will save the Source Routing information and send out the packet
transparently. When the response comes back, the source routing information will be
restored and sent to the Token Ring port.
Viewing the Filtering Database
To open the Filtering Database window:
1. Display the Device menu by clicking on the Front Panel button.
2. Drag down to Filtering Database, and release.
3. At the top of the Filtering Database window, click mouse button 1 on the
appropriate selection box to view either the Forwarding or Static database.
Click mouse button 1 on
the type of entry you want
to display, either
Forwarding
or
Static.
Figure 3-7. Filtering Database Window
3-16 The Filtering Database Window
Page 65

Using the TSX-1620 Bridge View
Two fields at the top of the Filtering Database window provide information about
the Filtering Database:
Ageing Time (secs)
The current setting of the bridge’s Dynamic Ageing Timer, used to purge
Forwarding entries from the Filtering Database, or to purge static entries subject
to the ageing timer.
Learned Entry Discards
The number of database entries that never made it into the Filtering Database due
to a lack of buffer space. Ideally, this number should be 0. If this number grows, it
indicates a very busy network. A value other than 0 is acceptable as long as it isn’t
increasing, indicating that the lack of buffer space is sometimes causing problems,
but that the condition is not persistent.
For each entry in the Forwarding database, the window displays the following:
Source Address
Displays the MAC addresses of devices that have transmitted frames to the
bridge.
Port
Identifies the bridge port where frames from the noted source address are
received. A value of 0 indicates that the address exists within the Filtering
Database, but the database has not yet learned the corresponding port number.
Status
Indicates how the entry got into the database:
• learned—The address was copied into the database from the source address
field of a received frame.
• self—Identifies one of the bridge ports.
• management—Indicates an entry that was entered into the database manually.
The status field of all static entries in the Forwarding Table will display
management.
• invalid—The entry is a learned entry that has aged out, but has not yet been
flushed from the table.
• other—The bridge is unable to determine the entry’s status.
The information displayed for the Static database is somewhat different; for each
entry, the window displays the following:
Source Address
Displays the MAC addresses of devices that have transmitted frames to the
bridge.
The Filtering Database Window 3-17
Page 66

Using the TSX-1620 Bridge View
Receive Port
Displays the port on which a packet with the specified source address must be
received in order for the filtering actions specified in the Destination Port field to
take place. A setting of 0 will apply the filtering action anytime a packet with the
specified source address is received by any of the bridge ports.
Destination Port
Displays the port or ports to which frames that have the specified source address
and were received on the specified port or ports will be forwarded. Note that
packets with the specified source address received on the specified port or ports
will be blocked from any ports not listed in this field.
If the number of Destination Ports exceeds what the Destination Ports column is
able to display, Destination Ports for that filter appear as a hex string that maps to
actual port numbers.
For example, a Destination Port entry of B54180E0 represents ports 1, 3, 4, 6, 8, 10,
16, 17, 25, 26, and 27. Here’s how to translate the hex string to port numbers:
1. Translate each hex integer into a four-digit binary value:
B54180E 0
1011 0101 0100 0001 1000 0000 1110 0000
2. Each “1” in the binary bitmask represents a Destination Port number:
B54180E 0
1011 0101 0100 0001 1000 0000 1110 0000
1,X,3,4 X,6,X,8 X,10,X,X X,X,X,16 17,X,X,X X,X,X,X 25,26,27,X X,X,X,X
Status
Indicates the assigned permanence of the entry:
• permanent—The entry won’t be aged out or deleted on reset.
• deleteOnReset—The entry will be deleted when the bridge is reset.
• deleteOnTimeout—The entry is subject to the ageing timer.
The buttons at the bottom of the window provide the following functions:
The Delete button is only available when the Filtering Database window is
showing Static entries and one entry in the list is selected. Use the Delete button to
remove an entry from the Static Table; see Deleting a Static Table Entry,
page 3-22.
The Change button is only available when the Filtering Database window is
showing Static entries and one entry in the list is selected. Use the Change button
to change the selected port’s receive port/destination ports settings; see
Changing Forwarding and Static Database Entries, page 3-20.
3-18 The Filtering Database Window
Page 67

Using the TSX-1620 Bridge View
Since the Forwarding table cannot be edited, you must add an entry to the Static
Table in order to change or delete it, as desired. Use the Add to Static Table to add
a forwarding entry to the static database.
The Ageing Time determines how long a Forwarding entry (or a Static entry with
deleteOnTimeout status) is retained before being discarded due to inactivity. Use
the Change Ageing Time button to set a new Ageing Time; see the following
section for details.
Use the Find button to search the Filtering Database for a specific MAC address;
see Finding a Filtering Database MAC Address, page 3-22.
The Filtering Database window shows a snapshot of the database. Clicking
mouse button 1 on the Update button displays the current database.
Changing the Filtering Database Dynamic Ageing Time
The Dynamic Ageing Time determines how long an entry remains in the Filtering
Database before being purged due to inactivity. Purging older entries ensures that
the Filtering Database is always using current information to make filter/forward
decisions.
During a topology change, the Forward Delay is used as the Filtering Database Ageing
NOTE
Time, which ensures that the Filtering Database will contain current topology
information.
To change the Dynamic Ageing Time:
1. In the Filtering Database window, click mouse button 1 on the Change
Ageing Time button to open the Change Ageing Time window.
The Filtering Database Window 3-19
Page 68

Using the TSX-1620 Bridge View
As you change the ageing time,
SPMA converts seconds to
days:hours:minutes:seconds.
Figure 3-8. Changing the Filtering Database Ageing Time
2. Highlight and edit the Ageing Time
(in seconds), and then click mouse
button 1 on the Apply button.
or
3. Use mouse button 1 to drag the slide
bar, then click Apply.
or
4. Click mouse button 1 next to the slide
to increment the time in 100 second
jumps, then click Apply.
Changing Forwarding and Static Database Entries
The only entries that can be changed or deleted in the Filtering Database are static
entries. If the entry you wish to change or delete is a forwarding entry, you must
add it to the Static Table. The Static Table (Figure 3-9) is used to change a
forwarding entry to a static or permanent entry, or make changes to existing static
entries. To open the Static Table window:
1. Open the Filtering Database window by clicking on the Front Panel
button; drag down to Filtering Database to display the Filtering Database
window.
2. If the Filtering Database window displays Forwarding entries, highlight the
entry you want to change and click on the Add to Static Table button.
or
If the Filtering Database window displays Static entries, highlight an entry and
click on the Change button.
It is also possible to open the Static Table in either case without highlighting an entry, by
NOTE
clicking on the Add To Static Table button. The static address field will appear blank.
Enter the MAC address that you want to add to the Static Table.
3-20 The Filtering Database Window
Page 69

Figure 3-9. Static Table Window
Using the TSX-1620 Bridge View
Static Address
The Static Address field will display the MAC address of the entry you
highlighted in the Filtering Database window. If no entry was selected, the
address field will contain zeros, and a valid MAC address may be entered.
Receive Port
The Receive Port list box specifies the port on which packets from the specified
static address must be received in order for the static database entry to apply. If
All is selected, the entry will be applied to packets forwarded to any port.
Forward T o Ports
The Forward To Ports list box specifies the ports to which packets with the
specified source address received on the specified ports will be forwarded. The
port or ports selected in this list will be displayed in the Filtering Database
window as the Destination Port.
To change an entry:
1. Click mouse button 1 on the port in the Receive Port list box that you want to
specify as the receive port for the entry in the Static Address field (remember
that if All is selected, the entry will be applied to packets received on any
port).
2. Click mouse button 1 on any port or ports in the Forward T o Ports list that
you want to be displayed in the Filtering Database window as the destination
port.
3. Click mouse button 1 on the Status button and choose one of the following:
permanent—The entry won’t be aged out or deleted on reset.
The Filtering Database Window 3-21
Page 70

Using the TSX-1620 Bridge View
deleteOnReset—The entry will deleted when the bridge is reset.
deleteOnTimeout—The entry is subject to the ageing timer.
4. After you set the entry’s status, click mouse button 1 on the Apply button.
Deleting a Static Table Entry
To delete a Static Table entry:
1. In the Filtering Database window, click mouse button 1 in the appropriate
selection box to display the Static database.
2. Select the entry you want to delete by clicking it with mouse button 1.
3. Click on the Delete button.
Finding a Filtering Database MAC Address
To find a source address in the Filtering Database:
1. In the Filtering Database window, click on the button to open the
Find MAC Address window.
or
In the Bridge Traffic View, display the Device menu by clicking on the Front
Panel button. Drag down to Find MAC Address.
2. In the edit box, enter a valid MAC
address and then press the
Return key. If the address is found
in the Filtering Database, its port
location and status will appear in
the list box. If it is not found, a
separate window will appear with
a “Not Found” message.
Figure 3-10. Find MAC Address Window
The Spanning Tree Protocol Window
Bridges in a network collectively implement a Spanning Tree Algorithm (STA) to
detect and eliminate data loops in a network containing parallel bridges.
3-22 The Spanning Tree Protocol Window
Page 71

Using the TSX-1620 Bridge View
In a network designed with multiple bridges placed in parallel (i.e., attached to
the same network segment), Spanning Tree selects a controlling Root Bridge and
Port for the entire bridged local area network, and a Designated Bridge and Port
for each individual network segment. The Root bridge is the one that selects one
of two or more available bridge paths between two end stations, basing its
decision on factors associated with each of the bridges in the path. A Designated
Port/Bridge for a network segment relays frames toward the Root Bridge, or from
the Root Bridge onto the network segment. When data passes from one end
station to another across a bridged local area network, it is forwarded through the
Designated Bridge/Port for each network segment towards the Root Bridge,
which in turn forwards frames towards Designated Bridges/Ports on its opposite
side.
During the Root Bridge selection process, all bridges on the network
communicate STA information via Bridge Protocol Data Units (BPDUs). It is with
BPDUs that the bridges collectively determine the current network topology and
ensure that all bridges have current topology information.
The Spanning Tree Protocol window displays information used by the network
bridges to select the Root Bridge and parameters that affect the bridge’s
participation in Spanning Tree operations.
To open the Spanning Tree Protocol window:
1. Click on the Front Panel button.
2. Drag down to Spanning T ree and release.
Figure 3-11. Spanning Tree Protocol Window
The Spanning Tree Protocol Window 3-23
Page 72

Using the TSX-1620 Bridge View
The Spanning Tree Protocol window displays the following information:
Spanning T ree Version
The version shows the Spanning Tree Protocol type employed by this bridge:
• IEEE 802.1d
• DEC LAN 100
• None
You must use either 802.1d or DEC to interconnect all bridges in a network using
parallel bridges. By default, a Cabletron bridge turns on the 802.1d Spanning Tree.
All of Cabletron’s bridge products have the ability to use either the 802.1d or DEC
Spanning Tree version, or they can be set so that no version is in effect. (A bridge
should be set to None if there are no redundant loops incorporated within the
network.)
All bridges in a network must use the same Spanning Tree version. Mixing Spanning Tree
!
CAUTION
Algorithm protocols will cause an unstable network.
Designated Root
This value represents the bridge that is the current Root Bridge as determined by
the STA. The Designated Root value consists of the configurable portion of the
bridge ID (i.e., the first two octets of the eight-octet-long bridge ID) and the TSX1620’s MAC address (the last six octets of the bridge ID). This value is used as the
Root Identifier parameter in all configuration BPDUs originated from this node.
Num. T opology Chgs.
Indicates the number of times the bridge’s Topology Change flag has been
changed since the bridge was powered up or initialized. The Topology Change
flag increments each time any of the network’s bridges enters or leaves the
network or when the Root Bridge ID changes.
The values for the following three fields—Forward Delay, Max Age, and Hello
Time—represent the values that are currently being used by all bridges, as
dictated by the Root bridge. In the Spanning Tree Protocol window, you can view
and set the values—Root Forward Delay, Root Max Age, Root Hello Time—that
will be in effect when the bridge for which you are setting the parameters
becomes the Root Bridge.
Forward Delay
The length of time, in seconds, that controls how long a bridge port remains in
each state (Forwarding, Learning, Listening, etc.) when moving toward the
Forwarding state. During a topology change, the Forward Delay is also used as
the Filtering Database Ageing Time, which ensures that the Filtering Database
will contain current topology information. The Root Bridge sets the Forward
Delay.
3-24 The Spanning Tree Protocol Window
Page 73

Using the TSX-1620 Bridge View
Max Age
The current setting for the bridge’s BPDU ageing timer, in seconds. The ageing
timer defines the maximum number of seconds that a Configuration BPDU is
retained by the bridge before it is discarded. During normal operation, each
bridge in the network receives a new Configuration BPDU before the ageing timer
expires. If the timer expires before a new Configuration BPDU is received, it
indicates that the former Root is no longer active. The remaining bridges begin
Spanning Tree operation to select a new Root. The Root Bridge determines the
Max Age. The range for this field is from 6 to 40 seconds, with a default value of
20 seconds.
Hello Time
Indicates, in seconds, the length of time the Root Bridge, or bridge attempting to
become the Root, waits before resending a Configuration BPDU. The Root Bridge
determines the Hello Time.
Priority
The Spanning Tree Algorithm assigns each bridge a unique identifier, which is
derived from the individual port’s MAC address and its priority as determined
by the Spanning Tree Algorithm or your setting. The bridge with the lowest value
of bridge identifier is selected as the Root. A lower priority number indicates a
higher priority; a higher priority enhances a bridge’s chance of being selected as
the Root.
Acceptable values range from 0-FFFF and can be edited to change the network
topology, if needed. The default is 8000.
Root Port
The port identifier (i.e., the physical index number) for the port that provides the
lowest cost path to the Root Bridge. The Root Port field displays 0 if this bridging
device is the Root Bridge.
Root Cost
Indicates the cost of the data path from this bridge to the Root Bridge. Each port
on each bridge adds a “cost” to a particular path that a frame must travel. For
example, if each port in a particular path has a Path Cost of 1, the Root Cost
would be a count of the number of bridges along the path. This field will read 0 if
the TSX-1620 is the Root Bridge. See Changing a Port’s STA Parameters,
page 3-29, to find out how to set a port’s Path Cost.
Hold Time
The minimum time, in seconds, that can elapse between the transmission of
Configuration BPDUs. The Hold Time ensures that Configuration BPDUs are not
transmitted too frequently through any bridge port. Receipt of a Configuration
BPDU starts the Hold Time count at a device. If the Hold Time expires, the port
invokes the Transmit Configuration BPDU procedure, which sends configuration
change information to the Root. The Hold Time is a fixed value, as specified by
the IEEE 802.1d specification.
The Spanning Tree Protocol Window 3-25
Page 74

Using the TSX-1620 Bridge View
The values for the Forward Delay, Max Age, Hold Time, and Hello Time fields are stored
NOTE
within the MIB in units of hundredths of a second rather than seconds; your Cabletron
management application converts hundredths of a second to seconds for display purposes.
You can use any SNMP Set Request tool to edit the values for these three fields; just
remember that you must enter your values in hundredths of seconds, rather than in
seconds.
Root Forward Delay
The Forward Delay (in seconds) that will be implemented by this bridge if it is the
Root or becomes the Root. (The Root Bridge in the network sets the Forward
Delay for all bridges in the Spanning Tree network.)
The IEEE 802.1d specification recommends that Forward Delay = 15 seconds, with
an allowable range of 4 to 30 seconds.
To ensure proper operation of the Spanning Tree Algorithm, the IEEE 802.1d specification
TIP
recommends that you always observe the following relationship between Forward Delay
and Max Age:
2 x (Forward Delay - 1.0) > Max Age
Root Max Age
The Max Age value (in seconds) that will be implemented if this bridge is the Root
or becomes the Root. (The Root Bridge in the network sets the Max Age for all
bridges in the Spanning Tree network.)
The IEEE 802.1d specification recommends that Max Age = 20 seconds, with an
allowable range of 6 to 40 seconds.
Root Hello Time
The Hello Time that will be implemented if this bridge is the Root or becomes the
Root.
The IEEE 802.1d specification recommends that Hello Time = 2 seconds, with an
allowable range of 1 to 10 seconds.
The Spanning Tree Port Table button opens the window in which you set
Spanning Tree parameters for individual bridge ports; see The Spanning Tree
Port Parameters Window, page 3-27, for more information.
3-26 The Spanning Tree Protocol Window
Page 75

Using the TSX-1620 Bridge View
Changing Spanning Tree Parameters
To change the Bridge Priority, Root Forward Delay, Root Max Age, or Root Hello
Time:
1. In the Spanning Tree Protocol window, highlight the current value of the field
you want to change.
2. Type the new value in the appropriate text box and press Enter or Return on
the keyboard.
The Spanning Tree Port Parameters Window
The Spanning Tree Algorithm ensures that only a single bridge path exists
between any two end stations in a network designed with multiple bridges
placed in parallel; it also ensures that on any given bridge, only one port path
exists between the bridge and any one network segment. In the Spanning Tree
Port Table you can view and edit the Spanning Tree values for individual ports;
the Spanning Tree Port parameters affect a port’s participation in the Spanning
Tree.
NOTE
Setting Spanning Tree Port Parameters only affects port selection on a particular bridge;
settings do not affect the TSX-1620’s device-level priority in the network’s Spanning Tree.
To open the Spanning Tree Port Table window:
1. Display the Device menu by clicking on the Front Panel button.
2. Drag down to Spanning T ree to open the Spanning Tree Protocol window.
3. In the Spanning Tree Protocol window, click on the Spanning T ree Port T able
button.
or
1. In the Bridge Traffic View, click mouse button 3 on a port to display the Port
menu and drag down to Spanning T ree.
The scroll list at the top of the window lists each bridge port available on the
device and its current port priority. Below the Port List, the window includes the
following:
Priority (Port)
If two or more ports on the same bridge are connected to the same network
segment, each port will receive the same device-level values for Root ID, Root
Cost, and Bridge ID in Configuration BPDUs. In this case, the BPDU’s port-level
information—the transmitting port’s identifier and its manageable Priority
The Spanning Tree Port Parameters Window 3-27
Page 76

Using the TSX-1620 Bridge View
component— is used to determine which port on this bridge will be the
Designated Port for that segment. A lower number indicates a higher priority; the
default is 80. The allowable range is 0 to FF.
Path Cost
The portion of the total path cost associated with this port. Lowering a port’s Path
Cost makes a port more competitive in the selection of the Designated Port. The
default value is 100 for Cabletron bridges. The allowable range is from 1 to 65535.
Figure 3-12. Spanning Tree Port Parameters Window
Designated Cost
The cost of the path from this port to the Root Bridge on the network. If the
highlighted port is the Root Port, the Designated Cost is 0. If this bridge is the
Root Bridge, all its bridge ports have a Designated Cost of 0. This value is
compared to the Root Path Cost field in received configuration BPDUs.
Designated Root
The unique Bridge Identifier of the bridge that is assumed to be the Root Bridge
on the network; this information is contained in the Configuration BPDUs.
3-28 The Spanning Tree Port Parameters Window
Page 77

Designated Bridge
Displays the MAC address and priority component of the Bridge ID for the bridge
that is believed to be the Designated Bridge for the network segment associated
with this port.
The Designated Bridge ID, along with the Designated Port and Port Identifier
parameters for the port, is used to determine whether this port should be the
Designated Port for the network segment to which it is attached.
Designated Port
The Port ID of the port on the Designated Bridge for this port’s segment. The
Designated Port is the bridge port that offers the lowest path cost to the Root
Bridge.
Forward T ransitions
The number of times this port has moved from the Learning state to the
Forwarding state since the device was started or since it was last reset.
Changing a Port’s STA Parameters
Using the TSX-1620 Bridge View
To change a port’s Priority or Path Cost:
1. In the scroll list, click mouse button 1 on the port you want to change (use the
scroll bar if necessary to display the desired port). You can only select one
port at a time. The highlighted port’s Spanning Tree parameters appear in the
boxes below the list.
2. Highlight and edit the Priority and Path Cost boxes as required. After you
type in the new value in a box, press Enter or Return on the keyboard.
The Source Routing Configuration Window
The Source Routing Configuration window allows you to view, set, and change
Source Routing configuration options for ports on the TSX-1620. Using this
window, you can assign logical ring numbers to the TSX-1620’s physical ports via
the Local Segment field. If you assign the same local segment number to multiple
physical ports, the TSX-1620 will treat all segments attached to those ports as if
they were on the same physical ring.
To open the Source Routing Configuration window from the Bridge Traffic View:
1. Display the Device menu by clicking on the Front Panel button.
2. Drag down to SR Configuration.
or
1. In the Bridge Traffic View, click mouse button 3 on a port to display the Port
menu underage down to SR Configuration.
The Source Routing Configuration Window 3-29
Page 78

Using the TSX-1620 Bridge View
The scroll list at the top of the window lists each physical TSX-120 port and its
Spanning Tree Explorer (STE) Span Mode, which determines how this port will
behave when presented with an STE packet. Possible values are as follows:
auto-span This value can only be returned by a bridge that
disabled This value indicates that the port will not accept or send
forced This value indicates that the port will always accept and
implements the Spanning Tree Protocol. A port set to
auto-span will forward an STE packet when it is in the
Forwarding state; otherwise, it will discard the packet.
STE packets; any STE packets received will be discarded.
propagate STE packets, regardless of its port state.
Figure 3-13. Source Routing Configuration Window
Interface
The port number highlighted in the scroll list. The Interface number indicates the
port selected in the list box and described by the other fields in the window.
Hop Count
The Hop Count Limit (HCL) stops a frame from being forwarded over more than
the specified number of bridge hops; it sets the maximum number of routing
3-30 The Source Routing Configuration Window
Page 79

Using the TSX-1620 Bridge View
descriptors (bridge hops) allowed in a packet’s Routing Information Field. A
bridge port will discard any explorer packets whose RIF’s exceed the maximum
number of routing descriptors.
Local Segment Number
Normally, when assigning local segment numbers, you must assign a unique
number to each network segment in a network; this field represents the network
segment to which this port is attached physically. The bridge adds the Local
Segment number to the routing information field of source route discovery
frames. Valid entries range from 0 to 4095. A value of 65535 indicates that no
segment number is assigned to this port. For the TSX-1620, you can assign the
same local segment number to separate physical rings attached to multiple ports
on the TSX-1620, and the device will treat them as if they were a single ring. For
each separate local segment number defined for the TSX-1620’s ports, a separate
Bridge Port box will be displayed in the Bridge View.
Bridge Number
A Bridge Number uniquely identifies this bridge port when two bridge ports are
used to span the same two segments; otherwise unique Bridge Numbers are not
necessary for individual ports. The Bridge Number should be in the range of 0 to
15. The value 65535 indicates that no Bridge Number is assigned.
NOTE
Target Segment Number
The unique network number of the target network segment that the bridge
attaches to. Valid entries range from 0 to 4095. A value of 65535 indicates that no
target segment number is assigned to this port. Individual ports on a TSX-1620
should each be assigned unique values for this field.
The TSX-1620 does not use the Target Segment Number field because it has more than
two ports and therefore could have multiple target segments for each local segment.
Largest Frame
The maximum size of a frame’s INFO field that this port can send or receive. The
default value for this field is set in the TSX-1620’s firmware. When it receives an
explorer frame, the bridge uses its Largest Frame value to decide if it should
modify the Routing Control field of the Routing Information field. A Source Route
bridge has the ability to embed this information into the explorer packets so that
end stations can adjust their Mtu size accordingly.
Possible Largest Frame sizes as defined by the 802.5 source routing bridging
specification are 516, 1500, 2052, 4472, 8144, 11407, 17800, and 65535.
The Source Routing Configuration Window 3-31
Page 80

Using the TSX-1620 Bridge View
A Source Route-capable bridge has the ability to embed Largest Frame size information
NOTES
into the explorer packets. If there are multiple bridge hops from one end node to another,
this allows the end stations to realize the maximum frame size limits for any network
segment in the path between them, and adjust their Mtu size accordingly.
If there are multiple hops from one end node to another, consider the lowest Largest Frame
Size of all network segments and bridges in the path when setting the Largest Frame Size.
It is possible that an older bridge may support a lower maximum frame size; subsequently
the stations would have to reduce their Mtu size in order to communicate over it. Largest
Frame size is different for 4 and 16 Mbps Token Rings (4,500 bytes and 18,000 bytes,
respectively), and Ethernet network segments have a maximum frame size of 1,500 bytes.
STE Span Mode
The Spanning Tree Explorer Span Mode determines how a bridge port behaves
when it receives an STE packet (also known as Single Route Explorer packet).
Possible STE Span modes are disabled, forced, and auto-span, as described earlier
in this section.
Changing Source Routing Port Parameters
To change a port’s Hop Count, Local Segment, Bridge Number, or Target
Segment:
1. In the Source Routing Configuration window, use the scroll list to display the
physical TSX-1620 port for which you want to change values.
2. Select a port by clicking mouse button 1 on the port you want to change. You
can only select one port at a time. The port’s index number and Source
Routing parameters appear in the boxes below the list.
3. Highlight and edit the Hop Count, Local Segment, Bridge Number, and
Target Segment boxes as required.
4. Once you have made all of your edits, click on the Apply button.
To change a port’s Largest Frame or STE Span Mode:
1. In the Source Routing Configuration window, use the scroll list to display the
physical TSX-1620 port you want to change.
2. Clic k mouse b utton 1 on the port you want to change (you can only select one
port at a time). The port’s Source Routing parameters appear in the boxes
below the list.
3. Click on the Largest Frame or STE Span Mode button and then drag to the
appropriate menu choice. The selected value appears on the button.
4. Once you have made all of your choices, click on the Apply button.
3-32 The Source Routing Configuration Window
Page 81

Using the TSX-1620 Bridge View
Creating Bridge Traffic Charts, Graphs and Meters
The Bridge application uses the SPMA Charts, Graphs and Meters tools to depict
bridge statistics describing activity at the bridge-port level. Once running,
however, a pie chart, graph or meter is independent from the application where it
was started. Although the windows you open to create pie charts, graphs and
meters have unique variable lists, the procedures for creating a pie chart, a graph
or a meter are the same.
Graphing capabilities are provided by an application that is included in HP Network
NOTE
Node Manager and IBM NetView; therefore, graphs are only available when SPMA is
run in conjunction with one of these network management platforms. If you are running
SPMA in a stand-alone mode or in conjunction with SunNet Manager, no graphing
capabilities are available and no graph-related options will be displayed on buttons or
menus. Note that the screens displayed in this guide will include the graph-related
options where they are available; please disregard these references if they do not apply.
To access the Pie Chart, Graph and Meters tools from the Bridge Traffic View Port
menus:
1. Click mouse button 3 on a Bridge Port box to display the Bridge Port menu.
2. Dr ag do wn to select Pie Chart or Graphs/Meters—>Transparent or Source
Routing, as appropriate.
Figure 3-14. Pie Chart Window
Creating Bridge Traffic Charts, Graphs and Meters 3-33
Page 82

Using the TSX-1620 Bridge View
For complete descriptions of chart, graph and meter variables and details on how
to create and control a pie chart, graph or meter, see the chapter on charts, graphs
and meters in the SPMA Tools Guide.
Configuring Forwarding Thresholds
You can define notification thresholds for bridge port forwarding levels and then
have SPMA use those thresholds to do one or more of the following:
• Color code the Bridge Port display boxes
• Send Internet mail to a registered user
• Launch a program on your management workstation
To open the Forwarding Thresholds window:
1. Clic k button 3 anywhere within a Bridge Port display bo x in the Bridge View to
display the Port menu.
2. In the Port menu, click button 3 on Forwar ding Thresholds —>Transparent
or Source Routing to open the Forwarding Thresholds window.
Since the Transparent and Source Routing Threshold windows look and function
the same, the window is described only once.
3-34 Configuring Forwarding Thresholds
Page 83

Using the TSX-1620 Bridge View
A traffic level is the specified
value of forwarded frames as a
percentage of total received
frames.
You can specify traffic levels that
define the boundary between the
low and medium ranges and
between the medium and high
ranges.
When SPMA polls the device and
detects that the percentage of
forwarded frames has mo ved into
a new range, heading either up or
down, the notification options and
conditions in use for that port take
place.
Figure 3-15. Port Forwarding Thresholds Window
SPMA polls a bridge at preset intervals, as defined in the Polling Intervals window
NOTE
accessed from the Bridge View Device menu. A port’s traffic level can pass from one range
to the next and then back to the original level between polls from SPMA. When this
occurs, SPMA won’t record that the threshold has been passed because the event was
never observed.
To set bridge port thresholds, notification options, and notification conditions:
1. In the F orw arding Thresholds window, highlight the port where you want to set
thresholds. You can select multiple ports by clicking button 1 on each one. To
deselect a port, click it again. To apply the settings to all bridge ports, you can
use the options provided at the bottom of the screen rather than selecting all
ports in the scroll list.
Configuring Forwarding Thresholds 3-35
Page 84

Using the TSX-1620 Bridge View
2. In the Modify Range section of the Forwarding Thresholds window, you can
edit the line that displays the high end of the Low and Mid ranges, or you can
use the slide bars to specify the thresholds. You can also assign a color to
each of the three ranges. The Bridge P ort box es on the Bridge Traffic View will
be colored according to the settings made here (i.e., if you assign the color
red to the High traffic range, then a Bridge Port box will be colored red when
its traffic range is High). To set the high end of the Low and Mid ranges, and
assign color codes to all three ranges:
a. Change the upper limit of the Low and Mid traffic ranges by highlighting
the value, typing the new value, and pressing Enter or Return. You may
also change the value by moving the slide bar next to the value you wish
to change until the desired range is reached.
b. By default, bridge ports are color coded in the Bridge Traffic View
according to their traffic level: Low range is green; Mid range is yellow;
High range is red. To assign color codes to the three traffic ranges, click
on the Low, Mid, or High buttons to the left of the range fields, drag to
highlight the desired color, and release. The selected color will be
displayed on the button, and will be used in the Bridge Port boxes when
the color’s corresponding range is reached.
3. In the Notification Options section, you can enable/disable threshold event
logging, enable/disable the Bridge Port box colors, and assign threshold
events (send mail or execute a program) to the different (or to all) threshold
ranges. To do so:
a. To disable threshold event logging, deselect the Log Changes in State
checkbox. By default, all threshold events are logged. For more
information about the Forwarding Log, see Vie wing the Forwarding Log
on page 3-37.
b. To enable/disable the colors, clic k button 1 on the Color bo x. When colors
are disabled, the Bridge Port box colors in the Bridge Traffic View remain
as they were when the colors were last enabled.
c. To send mail or execute a program when a threshold range is reached,
first click the Threshold Range button to which you want to apply the
threshold event. To send mail for a threshold event, select the Send Mail
box and enter the name of a registered mail user. To have a threshold
event launch a program, select the Execute Program (Args) box and
enter the name of an executable file, including required arguments.
4. Notification Conditions make your Notification Options subject to defined
conditions:
a. If you check the In—Out—In box, notification takes place when the
threshold passes from one range to another and then back. The number
in the Delay box specifies the number of times this transition is to take
place before notification is launched. The Current box counts down the
transitions.
3-36 Configuring Forwarding Thresholds
Page 85

Using the TSX-1620 Bridge View
b. If you select the Remain—In box, notification takes place when the
threshold passes from one range to another, and stays in that range for
the number of polling cycles specified in the Delay box.
c. If you check the Once Only bo x, notification only tak es place the first time
the Delay count is reached.
5. The Save option gives y ou three choices as to how the options and conditions
you have selected will be saved.
a. If you choose Disabled, none of the options and conditions you have
chosen will be saved to the bridge database.
b. If you select As Default, the chosen options and conditions will be saved
as default values . The sav ed inf ormation will be used for an y IP not having
an entry in the bridge database.
c. If you select By IP, the options and conditions chosen for that IP will be
saved to the bridge database, and the next time the application is run for
this device the saved values will be used.
6. When y ou’re finished setting thresholds and notification options, clic k button 3
on the Apply button and choose either Selected Only or All. Selected Only
applies the selected Forwarding Thresholds settings to the ports that are
highlighted in the scroll list near the top of the Forwarding Thresholds window.
Viewing the Forwarding Log
The Forwarding Log records an entry each time a bridge port’s traffic passes a
preset traffic threshold. By default, logging is enabled for all bridge ports.
To open the Forwarding Log window:
1. In the Bridge Traffic View, click mouse button 3 in one of the bridge ports to
display the Port menu.
2. In the Port menu, click button 3 on Forwarding Log and then drag right to
Transparent or Source Routing.
Viewing the Forwarding Log 3-37
Page 86

Using the TSX-1620 Bridge View
NOTE
Figure 3-16. Sample Forwarding Log Window
The Transparent and Source Routing Forwarding Log windows look and function
the same.
To select a different Bridge Port log:
1. Use the slide bar at the top of the Forwarding Log window to select a diff erent
port.
To clear all logs or just the current log:
1. Click on the Clear button and then select the appropriate choice, either
Current Log or All Logs.
To change the number of entries retained by the log:
1. Highlight the Max Number line, type a new number and press Return on the
keyboard.
Log entries are stored in the SPMA software. When the maximum number of entries is
reached, the entries get aged out as necessary, starting with the oldest entry first.
3-38 Viewing the Forwarding Log
Page 87

Using the TSX-1620 Bridge View
To save log files:
1. Click on the Save button and select either Current Log or All Logs to open
the Save Log window.
2. In the Save Log window, enter a file name for the file to be saved and then
click on the OK button. The default directory for saved log files is the current
directory. To specify a different directory, include the path name with the log
file name.
To disable the Forwarding Log of all bridge ports or individual bridge ports:
1. Click button 3 on the appropriate Bridge Port box to display the Port menu.
2. In the Port menu, click button 3 on Forwar ding Thresholds and then drag
right to either Transparent or Source Routing.
3. In the Forwarding Thresholds window, deselect the Log Changes in State
box.
4. Click on the Apply button and then click on either Selected Only or All.
Changing Polling Intervals
Much of the information displayed in the Bridge Traffic View is gathered
periodically rather than continuously. You can edit the times between these
periodic polls.
To edit the polling times:
1. Display the Device menu by clicking on the Front Panel button.
2. Drag down to Polling Intervals and release. The Polling Intervals window
displays.
Figure 3-17. The Polling Intervals Window
3. Highlight and edit the Device Info and Bridge Port Display Info boxes and
then click on the Apply button to save changes.
Changing Polling Intervals 3-39
Page 88

You can change values for the following polling interval fields:
Device Info
Specifies the time, in seconds, that SPMA waits before updating the Front Panel
information (Uptime, Location, and so forth) in the Bridge Traffic View.
Bridge Port Display Info
Specifies the time, in seconds, that SPMA waits before updating statistical and
status information in the Bridge Traffic View port display boxes.
Enabling and Disabling Ports
When you disable a bridge port, you disconnect that port’s network from the
bridge entirely. Nodes connected to the network can still communicate with each
other, but they can’t communicate with the bridge and other networks connected
to the bridge.
In Transparent bridges, the disabled port does not forward any packets, nor does
it participate in Spanning Tree operations. When you enable a port on a
Transparent bridge, the port moves from the Disabled state through the Blocking,
Learning, and Listening states to the Forwarding state.
Using the TSX-1620 Bridge View
The procedures for enabling and disabling Source Routing bridge ports are
slightly different from the procedures used to enable and disable for Transparent
Bridge ports. The SPMA Bridge application also gives you the option of
simultaneously disabling both Source Route and Transparent ports on an SRT
bridge.
Enabling and disabling a port changes its Port Status, not its Port State. An enabled port
NOTE
is able to participate in bridging and Spanning Tree operations. A disabled port on a
Transparent bridge does not participate in bridging or Spanning Tree operations.
Enabling and Disabling a Transparent Bridge Port
To enable or disable a Transparent bridge port:
1. In the Bridge Traffic View, display the Port menu by clicking mouse button 3 in
a Bridge Port box. Select the port that connects to the network that you want
to enable or disable.
2. In the Port menu, click button 3 on Enable or Disable, drag right to
Transparent, and release.
When you disable a Transparent bridge port, the port’s display box turns blue.
When you enable a Transparent bridge port, the port’s color changes to indicate
Enabling and Disabling Ports 3-40
Page 89

Using the TSX-1620 Bridge View
the forwarding threshold range. (Port color codes are only active if the Color box
is selected in the Forwarding Thresholds window. Color codes are on by default.)
Enabling and Disabling a Source Routing Bridge Port
With Source Routing bridging, you can disable all traffic through a particular
bridge port, or only traffic that would otherwise be forwarded to a specific port.
For example, you can disable all traffic that would be forwarded from port 2 to
port 4, but allow traffic to be forwarded from port 2 to ports 1 and 3.
The Enable/Disable Source Routing window lets you enable or disable Source
Routing traffic between the selected port (the port you used to open the window)
and any other bridge port.
To enable or disable a Source Routing bridge port:
1. In the Bridge Traffic View, display the Port menu by clicking mouse button 3 in
the Bridge Port box that represents the network that you want to enable or
disable.
2. In the Port menu, click on Enable or Disable, drag right to Source Routing,
and release to open the Enable/Disable Source Routing window.
Figure 3-18. Port Enable/Disable Source Routing Window
3. Select one or more Destination Ports in the scroll list by clicking mouse button
1 to highlight selections in the list.
4. To enable or disable all Destination Ports, click on the Enable or Disable
button and choose All from the drop-down menu. To enable or disable the
ports you highlighed in the scroll list, click on the Enable or Disable button
and choose Selected from the drop-down menu.
Enabling and Disabling Ports 3-41
Page 90

Using the TSX-1620 Bridge View
Enabling and Disabling Both Transparent and Source Routing on a
Bridge Port
To enable or disable both Source Routing and Transparent bridging on a port:
1. In the Bridge Traffic View, display the Port menu by clicking mouse button 3 in
a Bridge Port box. Select the port that connects to the network that you want
to enable or disable.
2. With mouse button 3, drag down to Enable or Disable—>Both. Both Source
Route and Transparent bridging for the port will be enabled or disabled, as
selected.
3-42 Enabling and Disabling Ports
Page 91

Index
A
Add to Static Table button 3-20
Admin 2-13
Admin button 3-9
Ageing Time 3-17, 3-19
All Paths Explorer (APE) packet 3-2
application display menu structure 2-7, 2-8
application display mode
changing 2-6
auto-span mode 3-30
B
Bits Per Char 2-20
BLK (Blocking) 2-13
BPDU ageing timer 3-25
Bridge 2-6
Bridge application display 2-8
Bridge Application Display Menu Structure
2-8
Bridge Config utility 2-17
Bridge menu 2-8
Bridge Number 3-31
Bridge Port box 3-7
color coding 3-8
bridge port Color codes 3-36
Bridge Port Display Form
Options 2-13
Bridge Port Display Info 3-40
Bridge Port Number 2-14
bridge port state 3-9
blocking 3-10
broken 3-10
disabled 3-9
forwarding 3-10
learning 3-10
listening 3-10
bridge port status 3-9
disabled 3-9
enabled 3-9
bridge port Traffic levels 3-35
Bridge Ports, enabling/disabling 2-32
Bridge Protocol Data Units (BPDUs) 3-2, 3-23
Bridge Statistics window 3-13
accessing 3-13
Bridge Status window
setting and changing information 3-12
Bridge Traffic View buttons 3-8
Bridge Type 2-22
Bridge View 2-8
access levels 3-4
accessing 2-30
changing front panel information 3-12
launching 3-3
bridging type 3-14
sourceroute-only 3-14
srt 3-14
transparent-only 3-14
unknown 3-14
BRK 2-13
broadcast packet 3-2
C
change the Dynamic Ageing Time 3-19
clear network logs 3-38
Clear Stats 2-14
Color Codes
Bridge Application Display 2-14
Interface Application Display 2-12
color codes 2-3
Community Names utility 2-18
Configuration BPDU 3-25
Console Config utility 2-19
Contact Status 2-3, 2-16, 3-6
creating icons 1-2
Current box 3-36
D
daylight savings time 2-24
decLb100 3-24
Delay box 3-36
DelayExceedDiscard 3-14
deleteOnReset entry status 3-18, 3-22
deleteOnTimeout entry status 3-18, 3-22
Index-1
Page 92

Index
Delta button 3-9, 3-10
Designated Bridge 3-23, 3-29
Designated Cost 3-28
Designated Port 3-23, 3-29
Designated Root 3-24, 3-28
Destination MAC address 2-17
Destination Port 3-18
Destination Ports 3-18
Detail View 3-10
port summary information 3-12
Detail View bridge port info 3-12
Device button 2-4
bridge 3-7
Device Configuration 2-16
Device General Status 2-16
Device Info 3-40
Device Location 3-6
Device menu 2-4
bridge 3-7
Device Name 2-4, 3-6
Device Performance
monitoring 2-9
DIS (Disabled) 2-13
disable a bridge network 3-40
disable bridge ports 2-33
disable the Forwarding Log 3-39
disabled
STE Span Mode 3-30
Discards 2-11
discovering Cabletron devices 1-2
Dynamic Ageing Time 3-15, 3-19
E
enable bridge ports 2-33
Enabling/Disabling Ports 2-32
Errors 2-11
Execute Program 3-36
explorer packet 3-2
F
Filtering Database 3-2
accessing 3-16
firmware revision
viewing 2-24
firmware version 1-7
Flow Control 2-21
FN100 Bridge View 2-8
FN100 Hub View 2-5
forced
STE Span Mode 3-30
Forward 3-9
Forward Delay 3-9, 3-19, 3-24
Forward Transitions 3-29
forwarding entry 3-15
Forwarding Log 3-37
Forwarding state 3-15
Forwarding Threshold Log window
accessing 3-37
Forwarding Thresholds window
accessing 3-34
Frames button 3-9
Frms In 3-9
Frms Out 3-9
Front Panel 2-16, 3-5
front panel 2-3
FWD (Forwarding) 2-13
G
Gateway Address 2-22
Graphics Mode 2-21
H
Hardware 2-20
HCL 3-30
Hello Time 3-25
History window 1-4
Hold Time 3-25
Hop Count 3-30
hostname 2-2, 3-4
Hub View 2-1, 2-3
navigating 2-2
opening 2-1
Hub View Front Panel 2-16
I
icon menus, accessing 1-2
IF Config utility 2-21
IfIndex 3-14
In Discards 2-11
In Errors 2-11
In Load 2-10
In Non-Unicast 2-12
Info button
bridge 3-7
INFO field 3-31
In—Out—In box 3-36
Interface 2-6
Index-2
Page 93

Index
Interface application display 2-7
Interface Application Display Menu
Structure 2-7
Interface List 2-29
Interface Number 2-10
Interface port display form
options 2-9
invalid entry status 3-17
IP Address 2-4, 2-22, 3-6
L
Largest Frame 3-31
Learned Entry Discards 3-17
learned entry status 3-17
LIS (Listening) 2-13
Load 2-10
local management port 2-19
Local Segment Number 3-31
Location 2-4
log files
saving 3-39
LRN (Learning) 2-13
M
MAC Address 3-6
management entry status 3-17
manual conventions 1-3
Max Age 3-25
maximum log entries 3-38
maximum transfer unit 3-15
menu
Bridge Port 3-5
Device 3-5
Menu Structure 2-7, 2-8
Meters tool
accessing 3-33
MIB I, II 1-2
MIB I, II Tool 2-30
MIBTree 1-2
Module Index 2-5
Module Type 2-5
mouse, using in the Hub View 2-5
MtuExceedDiscard 3-15
N
NetBIOS Broadcast Reduction 2-22
NetBIOS MAC addresses 2-23
NetBIOS name 2-24
NetBIOS utility 2-23
NLK 2-13
Non-Unicast 2-12
notification conditions 3-35
notification options 3-35
Number of Topology Changes 3-24
O
OFF 2-13
ON 2-12
Once only 3-37
open the Filtering Database window 3-16
opening the Hub View 2-1
Oper Status 2-9
other entry status 3-17
Out Discards 2-11
Out Errors 2-12
Out Load 2-11
Out Non-Unicast 2-12
P
Parity 2-20
Path Cost 3-28
Percentage button 3-9, 3-10
permanent entry status 3-18, 3-21
Physical Address 2-23
Pie Chart tool
accessing 3-33
polling interval
editing 3-40
Polling Intervals 2-4
polling intervals 2-15
Port
Changing Path Cost 3-29
Changing Priority 3-29
Designated 3-29
Designated Cost 3-28
Path Cost 3-28
Port Color Codes
Bridge Application Display 2-14
Interface Application Display 2-12
Port Display Form 2-5, 2-9, 2-16
Port Display Form Options
Bridge 2-13
Interface 2-9
Port Index 2-5
Port Operational State 2-16
Port Security utility 2-25
Port Status 2-5
Index-3
Page 94

Index
PortCircuit 3-14
Priority 2-22, 3-25
Priority (Port) 3-27
Q
Quit button 2-5
bridge 3-7
R
Receive Port 3-18
Remain—In box 3-37
Re-sizing a window 1-3
RIF 2-24
Root
Cost 3-25
Forward Delay 3-26
Hello Time 3-26
Max Age 3-26
Port 3-25
Root Bridge
selection process 3-23
Root bridge 3-23
Routing Information Field (RIF) 3-2
and hop count 3-31
routing information indicator (RII) bit 3-3
S
Save As Defaults 2-16
screen displays 1-3
self entry status 3-17
Send Mail 3-36
serial port 2-19
set bridge port thresholds 3-35
SNMP MIB2 System Group window 2-30
Software Revision 2-25
Source Address 3-17
Source Address List
port 2-31
Source Route mode 3-16
Source Routing 3-2
Source Routing button 3-10
Source Routing Configuration
port 2-30
Source Routing Configuration window 2-31
accessing 3-29
Spanning Tree 2-17, 2-22
Spanning Tree Algorithm (STA) 3-2, 3-22
version 3-24
Spanning Tree Explorer (STE) packet 3-2, 3-3
Spanning Tree Explorer (STE) Span Mode
3-30, 3-32
Spanning Tree Port Table 3-28
accessing 3-27
Spanning Tree Port Table button 3-26
Spanning Tree Protocol window 3-23
accessing 3-23
Speed 2-10, 2-20
spmarun script 3-4
SR Configuration 2-31
Sr Frames Forwarded 2-14
stand-alone mode 1-2, 2-4
static entry 3-15
Statistics 2-10, 2-16
Clearing 2-14
Stop Bits 2-20
Subnet Mask 2-22
system date
viewing and changing 2-24
System Group window 2-30
System Information utility 2-24
system time
viewing and changing 2-24
T
Target Segment Number 3-31
Technical Support 1-6
Topology Change flag 3-24
Tp Frames Filtered 2-14
Tp Frames Forwarded 2-13
translational bridge 3-3
Transparent button 3-10
Trap IP 2-19
TSX-1620 firmware revision
viewing 2-24
TSX-1620 Hub View 2-3
tsxmod 2-1
Type 2-10
U
UNK 2-13
Unknown (---) 2-13
Uptime 2-4, 3-6
Use Defaults 2-15
V
version numbers 1-6
Index-4
Page 95

viewing and changing the system date and
time 2-24
Index
Index-5
Page 96

Index
Index-6
 Loading...