

Page 1
CyberMONITOR
User’s Guide
9032331-05
Page 2

Page 3

Only qualified personnel should perform installation
procedures.
NOTICE
Cabletron Systems reserves the right to make changes in specifications and other information
contained in this document without prior notice. The reader should in all cases consult Cabletron
Systems to determine whether any such changes have been made.
The hardware, firmware, or software described in this manual is subject to change without notice.
IN NO EVENT SHALL CABLETRON SYSTEMS BE LIABLE FOR ANY INCIDENTAL,
INDIRECT, SPECIAL, OR CONSEQUENTIAL DAMAGES WHATSOEVER (INCLUDING BUT
NOT LIMITED TO LOST PROFITS) ARISING OUT OF OR RELATED TO THIS MANUAL OR
THE INFORMATION CONTAINED IN IT, EVEN IF CABLETRON SYSTEMS HAS BEEN
ADVISED OF, KNOWN, OR SHOULD HAVE KNOWN, THE POSSIBILITY OF SUCH
DAMAGES.
1999 by Cabletron Systems, Inc., P.O. Box 5005, Rochester, NH 03866-5005
All Rights Reserved
Printed in the United States of America
Order Number: 9032331-05 March 1999
Cabletron Systems, SPECTRUM, LANVIEW
SmartSwitch
All other product names mentioned in this manual may be trademarks or registered trademarks of
their respective companies.
is a trademark of Cabletron Systems, Inc.
, and
MicroMMAC
are registered trademarks and
CyberMONITOR User’s Guide i
Page 4

Notice
FCC NOTICE
This device complies with Part 15 of the FCC rules. Operation is subject to the following two
conditions: (1) this device may not cause harmful interference, and (2) this device must accept any
interference received, including interference that may cause undesired operation.
NOTE:
device, pursuant to Part 15 of the FCC rules. These limits are designed to provide reasonable
protection against harmful interference when the equipment is operated in a commercial environment.
This equipment uses, generates, and can radiate radio frequency energy and if not installed in
accordance with the operator’s manual, may cause harmful interference to radio communications.
Operation of this equipment in a residential area is likely to cause interference in which case the user
will be required to correct the interference at his own expense.
WARNING:
party responsible for compliance could void the user’s authority to operate the equipment.
This equipment has been tested and found to comply with the limits for a Class A digital
Changes or modifications made to this device which are not expressly approv ed by the
INDUSTRY CANADA NOTICE
This digital apparatus does not exceed the Class A limits for radio noise emissions from digital
apparatus set out in the Radio Interference Regulations of the Canadian Department of
Communications.
Le présent appareil numérique n’émet pas de bruits radioélectriques dépassant les limites applicables
aux appareils numériques de la class A prescrites dans le Règlement sur le brouillage radioélectrique
édicté par le ministère des Communications du Canada.
VCCI NOTICE
This is a Class A product based on the standard of the Voluntary Control Council for Interference by
Information Technology Equipment (VCCI). If this equipment is used in a domestic environment,
radio disturbance may arise. When such trouble occurs, the user may be required to take corrective
actions.
ii CyberMONITOR User’s Guide
Page 5

Notice
CABLETRON SYSTEMS, INC.
PROGRAM LICENSE AGREEMENT
IMPORTANT: THIS LICENSE APPLIES FOR USE OF PRODUCT IN THE UNITED
STATES OF AMERICA AND BY UNITED STATES OF AMERICA
GOVERNMENT END USERS.
BEFORE OPENING OR UTILIZING THE ENCLOSED PRODUCT,
CAREFULLY READ THIS LICENSE AGREEMENT.
This document is an agreement (“Agreement”) between You, the end user, and Cabletron Systems,
Inc. (“Cabletron”) that sets forth your rights and obligations with respect to the Cabletron software
program (“Program”) in the package. The Program may be contained in firmware, chips or other
media. UTILIZING THE ENCLOSED PRODUCT, YOU ARE AGREEING TO BECOME BOUND
BY THE TERMS OF THIS AGREEMENT, WHICH INCLUDES THE LICENSE AND THE
LIMITATION OF WARRANTY AND DISCLAIMER OF LIABILITY. IF YOU DO NOT AGREE
TO THE TERMS OF THIS A GREEMENT, RETURN THE UNOPENED PRODUCT TO
CABLETRON OR Y OUR DEALER, IF ANY, WITHIN TEN (10) DAYS FOLLO WING THE D ATE
OF RECEIPT FOR A FULL REFUND.
IF YOU HAVE ANY QUESTIONS ABOUT THIS AGREEMENT, CONTACT CABLETRON
SYSTEMS (603) 332-9400. Attn: Legal Department.
1. LICENSE.
package subject to the terms and conditions of this License Agreement.
You may not copy, reproduce or transmit any part of the Program except as permitted by the
Copyright Act of the United States or as authorized in writing by Cabletron.
2. OTHER RESTRICTIONS.
Program.
3. APPLICABLE LAW.
laws and in the state and federal courts of New Hampshire. You accept the personal jurisdiction and
venue of the New Hampshire courts.
4. EXPORT REQUIREMENTS.
regulation by agencies of the U.S. Government, including the U.S. Department of Commerce, which
prohibit export or diversion of certain technical products to certain countries, unless a license to export
the product is obtained from the U.S. Government or an exception from obtaining such license may be
relied upon by the exporting party.
If the Program is exported from the United States pursuant to the License Exception CIV under
the U.S. Export Administration Regulations, You agree that You are a civil end user of the Program
and agree that You will use the Program for civil end uses only and not for military purposes.
If the Program is exported from the United States pursuant to the License Exception TSR under
the U.S. Export Administration Regulations, in addition to the restriction on transfer set forth in
Sections 1 or 2 of this Agreement, You agree not to (i) reexport or release the Program, the source
code for the Program or technology to a national of a country in Country Groups D:1 or E:2 (Albania,
Armenia, Azerbaijan, Belarus, Bulgaria, Cambodia, Cuba, Estonia, Georgia, Iraq, Kazakhstan,
Kyrgyzstan, Laos, Latvia, Libya, Lithuania, Moldova, North Korea, the People’s Republic of China,
Romania, Russia, Rwanda, Tajikistan, Turkmenistan, Ukraine, Uzbekistan, Vietnam, or such other
countries as may be designated by the United States Government), (ii) export to Country Groups D:1
or E:2 (as defined herein) the direct product of the Program or the technology, if such foreign
produced direct product is subject to national security controls as identified on the U.S. Commerce
Control List, or (iii) if the direct product of the technology is a complete plant o r any major
You have the right to use only the one (1) copy of the Program provided in this
You may not reverse engineer, decompile, or disassemble the
This License Agreement shall be interpreted and governed under the
You understand that Cabletron and its Affiliates are subject to
CyberMONITOR User’s Guide iii
Page 6

Notice
component of a plant, export to Country Groups D:1 or E:2 the direct product of the plant or a major
component thereof, if such foreign produced direct product is subject to national security controls as
identified on the U.S. Commerce Control List or is subject to State Department controls under the
U.S. Munitions List.
5. UNITED STATES GOVERNMENT RESTRICTED RIGHTS.
was developed solely at private expense; (ii) contains “restricted computer software” submitted with
restricted rights in accordance with section 52.227-19 (a) through (d) of the Commercial Computer
Software-Restricted Rights Clause and its successors, and (iii) in all respects is proprietary data
belonging to Cabletron and/or its suppliers. For Department of Defense units, the Product is considered
commercial computer software in accordance with DFARS section 227.7202-3 and its successors, and
use, duplication, or disclosure by the Government is subject to restrictions set forth herein.
6. EXCLUSION OF WARRANTY.
writing, Cabletron makes no warranty, expressed or implied, concerning the Program (including its
documentation and media).
CABLETRON DISCLAIMS ALL WARRANTIES, OTHER THAN THOSE SUPPLIED TO
YOU BY CABLETRON IN WRITING, EITHER EXPRESS OR IMPLIED, INCLUDING BUT
NOT LIMITED TO IMPLIED WARRANTIES OF MERCHANTABILITY AND FITNESS FOR A
PARTICULAR PURPOSE, WITH RESPECT TO THE PROGRAM, THE ACCOMPANYING
WRITTEN MATERIALS, AND ANY A CCOMPANYING HARDW ARE.
7. NO LIABILITY FOR CONSEQUENTIAL DAMAGES.
CABLETRON OR ITS SUPPLIERS BE LIABLE FOR ANY DAMAGES WHATSOEVER
(INCLUDING, WITHOUT LIMITATION, DAMAGES FOR LOSS OF BUSINESS, PROFITS,
BUSINESS INTERRUPTION, LOSS OF BUSINESS INFORMATION, SPECIAL, INCIDENTAL,
CONSEQUENTIAL, OR RELIANCE DAMAGES, OR OTHER LOSS) ARISING OUT OF THE
USE OR INABILITY TO USE THIS CABLETRON PRODUCT, EVEN IF CABLETRON HAS
BEEN ADVISED OF THE POSSIBILITY OF SUCH DAMAGES. BECAUSE SOME STATES DO
NOT ALLOW THE EXCLUSION OR LIMITATION OF LIABILITY FOR CONSEQUENTIAL OR
INCIDENTAL DAMAGES, OR IN THE DURATION OR LIMITATION OF IMPLIED
WARRANTIES IN SOME INSTANCES, THE ABOVE LIMITATION AND EXCLUSIONS MAY
NOT APPLY TO YOU.
Except as may be specifically provided by Cabletron in
The enclosed Product (i)
IN NO EVENT SHALL
iv CyberMONITOR User’s Guide
Page 7

Notice
CABLETRON SYSTEMS SALES AND SERVICE, INC.
PROGRAM LICENSE AGREEMENT
IMPORTANT: THIS LICENSE APPLIES FOR USE OF PRODUCT IN THE UNITED
STATES OF AMERICA AND BY UNITED STATES OF AMERICA
GOVERNMENT END USERS.
BEFORE OPENING OR UTILIZING THE ENCLOSED PRODUCT,
CAREFULLY READ THIS LICENSE AGREEMENT.
This document is an agreement (“Agreement”) between You, the end user, and Cabletron Systems
Sales and Service, Inc. (“Cabletron”) that sets forth your rights and obligations with respect to the
Cabletron software program (“Program”) in the package. The Program may be contained in firmware,
chips or other media. UTILIZING THE ENCLOSED PRODUCT, YOU ARE AGREEING TO
BECOME BOUND BY THE TERMS OF THIS AGREEMENT, WHICH INCLUDES THE
LICENSE AND THE LIMITATION OF WARRANTY AND DISCLAIMER OF LIABILITY. IF
YOU DO NOT AGREE TO THE TERMS OF THIS A GREEMENT, RETURN THE UNOPENED
PRODUCT TO CABLETRON OR YOUR DEALER, IF ANY, WITHIN TEN (10) DAYS
FOLLOWING THE DATE OF RECEIPT FOR A FULL REFUND.
IF YOU HAVE ANY QUESTIONS ABOUT THIS AGREEMENT, CONTACT CABLETRON
SYSTEMS (603) 332-9400. Attn: Legal Department.
1. LICENSE.
package subject to the terms and conditions of this License Agreement.
You may not copy, reproduce or transmit any part of the Program except as permitted by the
Copyright Act of the United States or as authorized in writing by Cabletron.
2. OTHER RESTRICTIONS.
Program.
3. APPLICABLE LAW.
laws and in the state and federal courts of New Hampshire. You accept the personal jurisdiction and
venue of the New Hampshire courts.
4. EXPORT REQUIREMENTS.
regulation by agencies of the U.S. Government, including the U.S. Department of Commerce, which
prohibit export or diversion of certain technical products to certain countries, unless a license to export
the product is obtained from the U.S. Government or an exception from obtaining such license may be
relied upon by the exporting party.
If the Program is exported from the United States pursuant to the License Exception CIV under
the U.S. Export Administration Regulations, You agree that You are a civil end user of the Program
and agree that You will use the Program for civil end uses only and not for military purposes.
If the Program is exported from the United States pursuant to the License Exception TSR under
the U.S. Export Administration Regulations, in addition to the restriction on transfer set forth in
Sections 1 or 2 of this Agreement, You agree not to (i) reexport or release the Program, the source
code for the Program or technology to a national of a country in Country Groups D:1 or E:2 (Albania,
Armenia, Azerbaijan, Belarus, Bulgaria, Cambodia, Cuba, Estonia, Georgia, Iraq, Kazakhstan,
Kyrgyzstan, Laos, Latvia, Libya, Lithuania, Moldova, North Korea, the People’s Republic of China,
Romania, Russia, Rwanda, Tajikistan, Turkmenistan, Ukraine, Uzbekistan, Vietnam, or such other
countries as may be designated by the United States Government), (ii) export to Country Groups D:1
or E:2 (as defined herein) the direct product of the Program or the technology, if such foreign
produced direct product is subject to national security controls as identified on the U.S. Commerce
Control List, or (iii) if the direct product of the technology is a complete plant o r any major
You have the right to use only the one (1) copy of the Program provided in this
You may not reverse engineer, decompile, or disassemble the
This License Agreement shall be interpreted and governed under the
You understand that Cabletron and its Affiliates are subject to
CyberMONITOR User’s Guide v
Page 8

Notice
component of a plant, export to Country Groups D:1 or E:2 the direct product of the plant or a major
component thereof, if such foreign produced direct product is subject to national security controls as
identified on the U.S. Commerce Control List or is subject to State Department controls under the
U.S. Munitions List.
5. UNITED STATES GOVERNMENT RESTRICTED RIGHTS.
was developed solely at private expense; (ii) contains “restricted computer software” submitted with
restricted rights in accordance with section 52.227-19 (a) through (d) of the Commercial Computer
Software-Restricted Rights Clause and its successors, and (iii) in all respects is proprietary data
belonging to Cabletron and/or its suppliers. For Department of Defense units, the Product is considered
commercial computer software in accordance with DFARS section 227.7202-3 and its successors, and
use, duplication, or disclosure by the Government is subject to restrictions set forth herein.
6. EXCLUSION OF WARRANTY.
writing, Cabletron makes no warranty, expressed or implied, concerning the Program (including its
documentation and media).
CABLETRON DISCLAIMS ALL WARRANTIES, OTHER THAN THOSE SUPPLIED TO
YOU BY CABLETRON IN WRITING, EITHER EXPRESS OR IMPLIED, INCLUDING BUT
NOT LIMITED TO IMPLIED WARRANTIES OF MERCHANTABILITY AND FITNESS FOR A
PARTICULAR PURPOSE, WITH RESPECT TO THE PROGRAM, THE ACCOMPANYING
WRITTEN MATERIALS, AND ANY A CCOMPANYING HARDW ARE.
7. NO LIABILITY FOR CONSEQUENTIAL DAMAGES.
CABLETRON OR ITS SUPPLIERS BE LIABLE FOR ANY DAMAGES WHATSOEVER
(INCLUDING, WITHOUT LIMITATION, DAMAGES FOR LOSS OF BUSINESS, PROFITS,
BUSINESS INTERRUPTION, LOSS OF BUSINESS INFORMATION, SPECIAL, INCIDENTAL,
CONSEQUENTIAL, OR RELIANCE DAMAGES, OR OTHER LOSS) ARISING OUT OF THE
USE OR INABILITY TO USE THIS CABLETRON PRODUCT, EVEN IF CABLETRON HAS
BEEN ADVISED OF THE POSSIBILITY OF SUCH DAMAGES. BECAUSE SOME STATES DO
NOT ALLOW THE EXCLUSION OR LIMITATION OF LIABILITY FOR CONSEQUENTIAL OR
INCIDENTAL DAMAGES, OR IN THE DURATION OR LIMITATION OF IMPLIED
WARRANTIES IN SOME INSTANCES, THE ABOVE LIMITATION AND EXCLUSIONS MAY
NOT APPLY TO YOU.
Except as may be specifically provided by Cabletron in
The enclosed Product (i)
IN NO EVENT SHALL
vi CyberMONITOR User’s Guide
Page 9

Notice
CABLETRON SYSTEMS LIMITED
PROGRAM LICENSE AGREEMENT
IMPORTANT: THIS LICENSE APPLIES FOR USE OF PRODUCT IN THE UNITED
STATES OF AMERICA AND BY UNITED STATES OF AMERICA
GOVERNMENT END USERS.
BEFORE OPENING OR UTILIZING THE ENCLOSED PRODUCT,
CAREFULLY READ THIS LICENSE AGREEMENT.
This document is an agreement (“Agreement”) between You, the end user, and Cabletron Systems
Limited (“Cabletron”) that sets forth your rights and obligations with respect to the Cabletron
software program (“Program”) in the package. The Program may be contained in firmware, chips or
other media. UTILIZING THE ENCLOSED PRODUCT, YOU ARE AGREEING TO BECOME
BOUND BY THE TERMS OF THIS AGREEMENT, WHICH INCLUDES THE LICENSE AND
THE LIMITATION OF WARRANTY AND DISCLAIMER OF LIABILITY. IF YOU DO NOT
AGREE TO THE TERMS OF THIS AGREEMENT , RETURN THE UNOPENED PRODUCT T O
CABLETRON OR Y OUR DEALER, IF ANY, WITHIN TEN (10) DAYS FOLLO WING THE D ATE
OF RECEIPT FOR A FULL REFUND.
IF YOU HAVE ANY QUESTIONS ABOUT THIS AGREEMENT, CONTACT CABLETRON
SYSTEMS (603) 332-9400. Attn: Legal Department.
1. LICENSE.
package subject to the terms and conditions of this License Agreement.
You may not copy, reproduce or transmit any part of the Program except as permitted by the
Copyright Act of the United States or as authorized in writing by Cabletron.
2. OTHER RESTRICTIONS.
Program.
3. APPLICABLE LAW.
law. The English courts shall have exclusive jurisdiction in the event of any disputes.
4. EXPORT REQUIREMENTS.
regulation by agencies of the U.S. Government, including the U.S. Department of Commerce, which
prohibit export or diversion of certain technical products to certain countries, unless a license to export
the product is obtained from the U.S. Government or an exception from obtaining such license may be
relied upon by the exporting party.
If the Program is exported from the United States pursuant to the License Exception CIV under
the U.S. Export Administration Regulations, You agree that You are a civil end user of the Program
and agree that You will use the Program for civil end uses only and not for military purposes.
If the Program is exported from the United States pursuant to the License Exception TSR under
the U.S. Export Administration Regulations, in addition to the restriction on transfer set forth in
Sections 1 or 2 of this Agreement, You agree not to (i) reexport or release the Program, the source
code for the Program or technology to a national of a country in Country Groups D:1 or E:2 (Albania,
Armenia, Azerbaijan, Belarus, Bulgaria, Cambodia, Cuba, Estonia, Georgia, Iraq, Kazakhstan,
Kyrgyzstan, Laos, Latvia, Libya, Lithuania, Moldova, North Korea, the People’s Republic of China,
Romania, Russia, Rwanda, Tajikistan, Turkmenistan, Ukraine, Uzbekistan, Vietnam, or such other
countries as may be designated by the United States Government), (ii) export to Country Groups D:1
or E:2 (as defined herein) the direct product of the Program or the technology, if such foreign
produced direct product is subject to national security controls as identified on the U.S. Commerce
Control List, or (iii) if the direct product of the technology is a complete plant o r any major
You have the right to use only the one (1) copy of the Program provided in this
You may not reverse engineer, decompile, or disassemble the
This License Agreement shall be governed in accordance with English
You understand that Cabletron and its Affiliates are subject to
CyberMONITOR User’s Guide vii
Page 10

Notice
component of a plant, export to Country Groups D:1 or E:2 the direct product of the plant or a major
component thereof, if such foreign produced direct product is subject to national security controls as
identified on the U.S. Commerce Control List or is subject to State Department controls under the
U.S. Munitions List.
5. UNITED STATES GOVERNMENT RESTRICTED RIGHTS.
was developed solely at private expense; (ii) contains “restricted computer software” submitted with
restricted rights in accordance with section 52.227-19 (a) through (d) of the Commercial Computer
Software-Restricted Rights Clause and its successors, and (iii) in all respects is proprietary data
belonging to Cabletron and/or its suppliers. For Department of Defense units, the Product is considered
commercial computer software in accordance with DFARS section 227.7202-3 and its successors, and
use, duplication, or disclosure by the Government is subject to restrictions set forth herein.
6. EXCLUSION OF WARRANTY.
writing, Cabletron makes no warranty, expressed or implied, concerning the Program (including its
documentation and media).
CABLETRON DISCLAIMS ALL WARRANTIES, OTHER THAN THOSE SUPPLIED TO
YOU BY CABLETRON IN WRITING, EITHER EXPRESS OR IMPLIED, INCLUDING BUT
NOT LIMITED TO IMPLIED WARRANTIES OF MERCHANTABILITY AND FITNESS FOR A
PARTICULAR PURPOSE, WITH RESPECT TO THE PROGRAM, THE ACCOMPANYING
WRITTEN MATERIALS, AND ANY A CCOMPANYING HARDW ARE.
7.
NO LIABILITY FOR CONSEQUENTIAL DAMAGES. IN NO EVENT SHALL
CABLETRON OR ITS SUPPLIERS BE LIABLE FOR ANY DAMAGES WHATSOEVER
(INCLUDING, WITHOUT LIMITATION, DAMAGES FOR LOSS OF BUSINESS, PROFITS,
BUSINESS INTERRUPTION, LOSS OF BUSINESS INFORMATION, SPECIAL, INCIDENTAL,
CONSEQUENTIAL, OR RELIANCE DAMAGES, OR OTHER LOSS) ARISING OUT OF THE
USE OR INABILITY TO USE THIS CABLETRON PRODUCT, EVEN IF CABLETRON HAS
BEEN ADVISED OF THE POSSIBILITY OF SUCH DAMAGES. BECAUSE SOME STATES DO
NOT ALLOW THE EXCLUSION OR LIMITATION OF LIABILITY FOR CONSEQUENTIAL OR
INCIDENTAL DAMAGES, OR IN THE DURATION OR LIMITATION OF IMPLIED
WARRANTIES IN SOME INSTANCES, THE ABOVE LIMITATION AND EXCLUSIONS MAY
NOT APPLY TO YOU.
Except as may be specifically provided by Cabletron in
The enclosed Product (i)
viii CyberMONITOR User’s Guide
Page 11

DECLARATION OF CONFORMITY
Notice
Application of Council Directive(s):
Manufacturer’s Name:
Manufacturer’ s Address:
European Representative Name:
European Representative Address:
Conformance to Directive(s)/Product Standards:
Equipment Type/Environment:
89/336/EEC
73/23/EEC
Cabletron Systems, Inc.
35 Industrial Way
PO Box 5005
Rochester, NH 03867
Mr. J. Solari
Cabletron Systems Limited
Nexus House, Newbury Business Park
London Road, Newbury
Berkshire RG13 2PZ, England
EC Directive 89/336/EEC
EC Directive 73/23/EEC
EN 55022
EN 50082-1
EN 60950
Networking Equipment, for use in a
Commercial or Light
Environment.
Industrial
We the undersigned, hereby declare, under our sole responsibility, that the equipment packaged
with this notice conforms to the above directives.
Manufacturer Legal Representative in Europe
Mr. Ronald Fotino Mr. J. Solari
___________________________________ ___________________________________
Full Name Full Name
Principal Compliance Engineer Managing Director - E.M.E.A.
___________________________________ ___________________________________
Title Title
Rochester, NH, USA Newbury, Berkshire, England
___________________________________ ___________________________________
Location Location
CyberMONITOR User’s Guide ix
Page 12

Notice
x CyberMONITOR User’s Guide
Page 13

Contents
CHAPTER 1 INTRODUCTION
Related Documentation ...................................................................................1-1
How to Use This Guide ....................................................................................1-1
Document Conventions...................................................................................1-2
Technical Support............................................................................................1-2
CHAPTER 2 CYBERMONITOR OVERVIEW
About The CyberMONITOR..............................................................................2-1
Graphical User Interface..................................................................................2-1
Port Interface Icons..........................................................................................2-2
Port Interface Stats Panels..............................................................................2-3
Primary Monitor Window Function Menu.......................................................2-3
Statistical Data Tables .....................................................................................2-6
Data Table Function Buttons...........................................................................2-6
Statistics Charts...............................................................................................2-6
Alarm Settings..................................................................................................2-9
CyberMONITOR Help System........................................................................2-12
Contents Page..........................................................................................2-12
Index..........................................................................................................2-12
Glossary....................................................................................................2-12
Getting Help..............................................................................................2-13
CHAPTER 3 USING CYBERMONITOR
Prerequisites.....................................................................................................3-1
Local User Networks........................................................................................3-2
Custom Interval ................................................................................................3-4
Start/Stop Times Window................................................................................3-4
Long-Term Monitoring Sessions..............................................................3-5
Primary Monitor Window.................................................................................3-5
Function Menus................................................................................................3-7
CyberMONITOR User’s Guide xi
Page 14

Contents
Statistical Data Tables .....................................................................................3-8
Statistic Table Menu Items........................................................................3-8
Statistical Table Scroll Bar........................................................................3-8
Secondary IP Addresses...........................................................................3-9
Statistical Data Charts ...................................................................................3-10
Autosizing.................................................................................................3-11
Movable Cursor........................................................................................3-11
Zooming....................................................................................................3-11
Data Statistics ..........................................................................................3-11
Interpreting Statistical Data Tables ..............................................................3-12
Ethernet Statistical Data..........................................................................3-13
Ethernet Packet Statistics.......................................................................3-14
Ethernet Data Table Function Menu.......................................................3-14
Wide Area Statistical Data Table...................................................................3-15
Wide Area Statistical Data.......................................................................3-16
Wide Area Packet Statistics....................................................................3-17
Wide Area Data Table Function Menu....................................................3-17
Other Tables....................................................................................................3-18
Bridging Tables........................................................................................3-18
Bridging Statistical Data..........................................................................3-19
Bridging Per Interface Table...................................................................3-20
Bridging Per Interface Data.....................................................................3-20
IP Per Interface.........................................................................................3-21
IP Per Interface Data................................................................................3-21
IP Routing Tables.....................................................................................3-22
IP Routing Statistics................................................................................3-23
IP Event Log .............................................................................................3-23
RIP Table...................................................................................................3-25
IPX Routing Table ....................................................................................3-26
IPX Routing Data......................................................................................3-26
IPX Per Interface Table............................................................................3-27
IPX Per Interface Data..............................................................................3-27
IPX Event Log...........................................................................................3-28
Inverse MUX Data Table ..........................................................................3-29
xii CyberMONITOR User’s Guide
Page 15

Inverse Multiplex Table Data...................................................................3-30
Frame Relay Statistics Table ..................................................................3-31
Frame Relay Statistical Data...................................................................3-31
Traps................................................................................................................3-32
ISDN Call History/Backup........................................................................3-38
ISDN Call History Panel...........................................................................3-38
ISDN/Backup Panel..................................................................................3-41
ISDN/Backup File Menu...........................................................................3-41
CHAPTER 4 TROUBLESHOOTING
SNMP Errors .....................................................................................................4-1
Connection Errors............................................................................................4-1
User Cannot Communicate with Remote Network Station....................4-1
APPENDIX A GLOSSARY
Contents
CyberMONITOR User’s Guide xiii
Page 16

Contents
xiv CyberMONITOR User’s Guide
Page 17

1
Introduction
Welcome to the Cabletron Systems
information on how to use this utility, plus software specifications and troubleshooting tips. This
guide also provides background information about Ethernet Port Interfaces, and Wide Area Port
Interfaces, and a discussion of routing and bridging over Wide Area Networks (WANs).
CyberMONITOR User’s Guide
. This guide provides
Related Documentation
Read the
understanding of the underlying technology and functionality. You should also read the Cabletron
Systems
Wide Area Network Port Interfaces.
Advanced User Information
WPIM Local Management Guides
for the various Cabletron WAN products to gain a better
to get a better understanding of the functionality of
How to Use This Guide
This guide provides all the information necessary to use the CyberMONITOR utility to monitor
and record the status conditions and data throughput of various Cabletron Systems LAN (Local
Area Networking) and WAN (Wide Area Networking) devices. We suggest that you read all of
these chapters before attempting to use the CyberMONITOR Utility.
This guide is organized as follows:
Chapter 1,
Chapter 2,
intended to monitor, and the kinds of information that can be collected by the monitor utility.
Chapter 3,
Chapter 4,
CyberMONITOR utility, and how to resolve these problems.
Appendix A,
this document and their definitions.
CyberMONITOR User’s Guide 1-1
Introduction
CyberMONITOR Overview
Using CyberMONITOR
Troubleshooting
Glossary
, details document conventions and information on getting help.
, shows how to use this software to collect statistical data.
, explains the possible error conditions that can occur while using the
, is a comprehensive glossary containing a list of technical terms used in
, describes the CyberMONITOR utility, the devices it is
Page 18

Chapter 1:
Introduction
Document Conventions
The following conventions are used throughout this guide:
Note
symbol. Calls the reader’ s attention to any item of inf ormation that may be
NOTE
TIP
of special importance.
Tip
symbol. Conveys helpful hint concerning procedures or actions.
!
CAUTION
Caution
result in incorrectly interpreting data, or collecting erroneous statistics.
symbol. Contains information essential to avoid errors that could
Technical Support
For additional support related to this device or document, contact Cabletron Systems using one of
the following methods:
World Wide Web http://www .cabletron.com/
Phone (603) 332-9400
Internet mail support@cabletron.com
FTP ftp://ftp.cabletron.com/
Login
Password
To send comments or suggestions concerning this document, contact
the Cabletron Systems Technical Writing Department via the following
email address:
Make sure to include the document P art Number in the email message.
TechWriting@cabletron.com
anonymous
your email address
Before you call Cabletron Systems, see the information list on the following page.
1-2 CyberMONITOR User’s Guide
Page 19

Introduction
Before calling Cabletron Systems, have the following information ready:
• Your Cabletron Systems service contract number
• A description of the problem
• A description of any action(s) already taken to resolve the problem.
• The serial and revision numbers of all involved Cabletron Systems products in the network
• A description of your network environment (layout, cable type, etc.)
• Network load and frame size at the time of trouble (if known)
CyberMONITOR User’s Guide 1-3
Page 20

Chapter 1:
Introduction
1-4 CyberMONITOR User’s Guide
Page 21

2
This chapter provides an overview of the functionality of the Cabletron Systems
CyberMONITOR.
CyberMONITOR Overview
About The CyberMONITOR
The Cabletron Systems CyberMONITOR is a Wide Area Network Monitoring system. The
CyberMONITOR polls status conditions, and monitors network traffic and bandwidth utilization
of WAN (Wide Area Network) devices. The CyberMONITOR compiles this data and status
information, and reports these statistics graphically. The data can be printed.
The CyberMONITOR has provision for adjusting the polling rates, and presetting start and stop
times of any monitoring session. The devices to be monitored are selected by entering their IP
(Internet Protocol) address and Community Name into a window prior to starting a monitoring
session. The CyberMONITOR then locates and accesses the device to be monitored.
An Alarms panel lets you set threshold conditions for aggregate percentages of bandwidth and
aggregate errors for each Network Port Interface. The two alarm levels, Warning, and Critical,
cause Network Port Interface monitoring panels on the Primary Monitor window to change color
to yellow and red if bandwidth or errors exceeds the alarm levels that you preset.
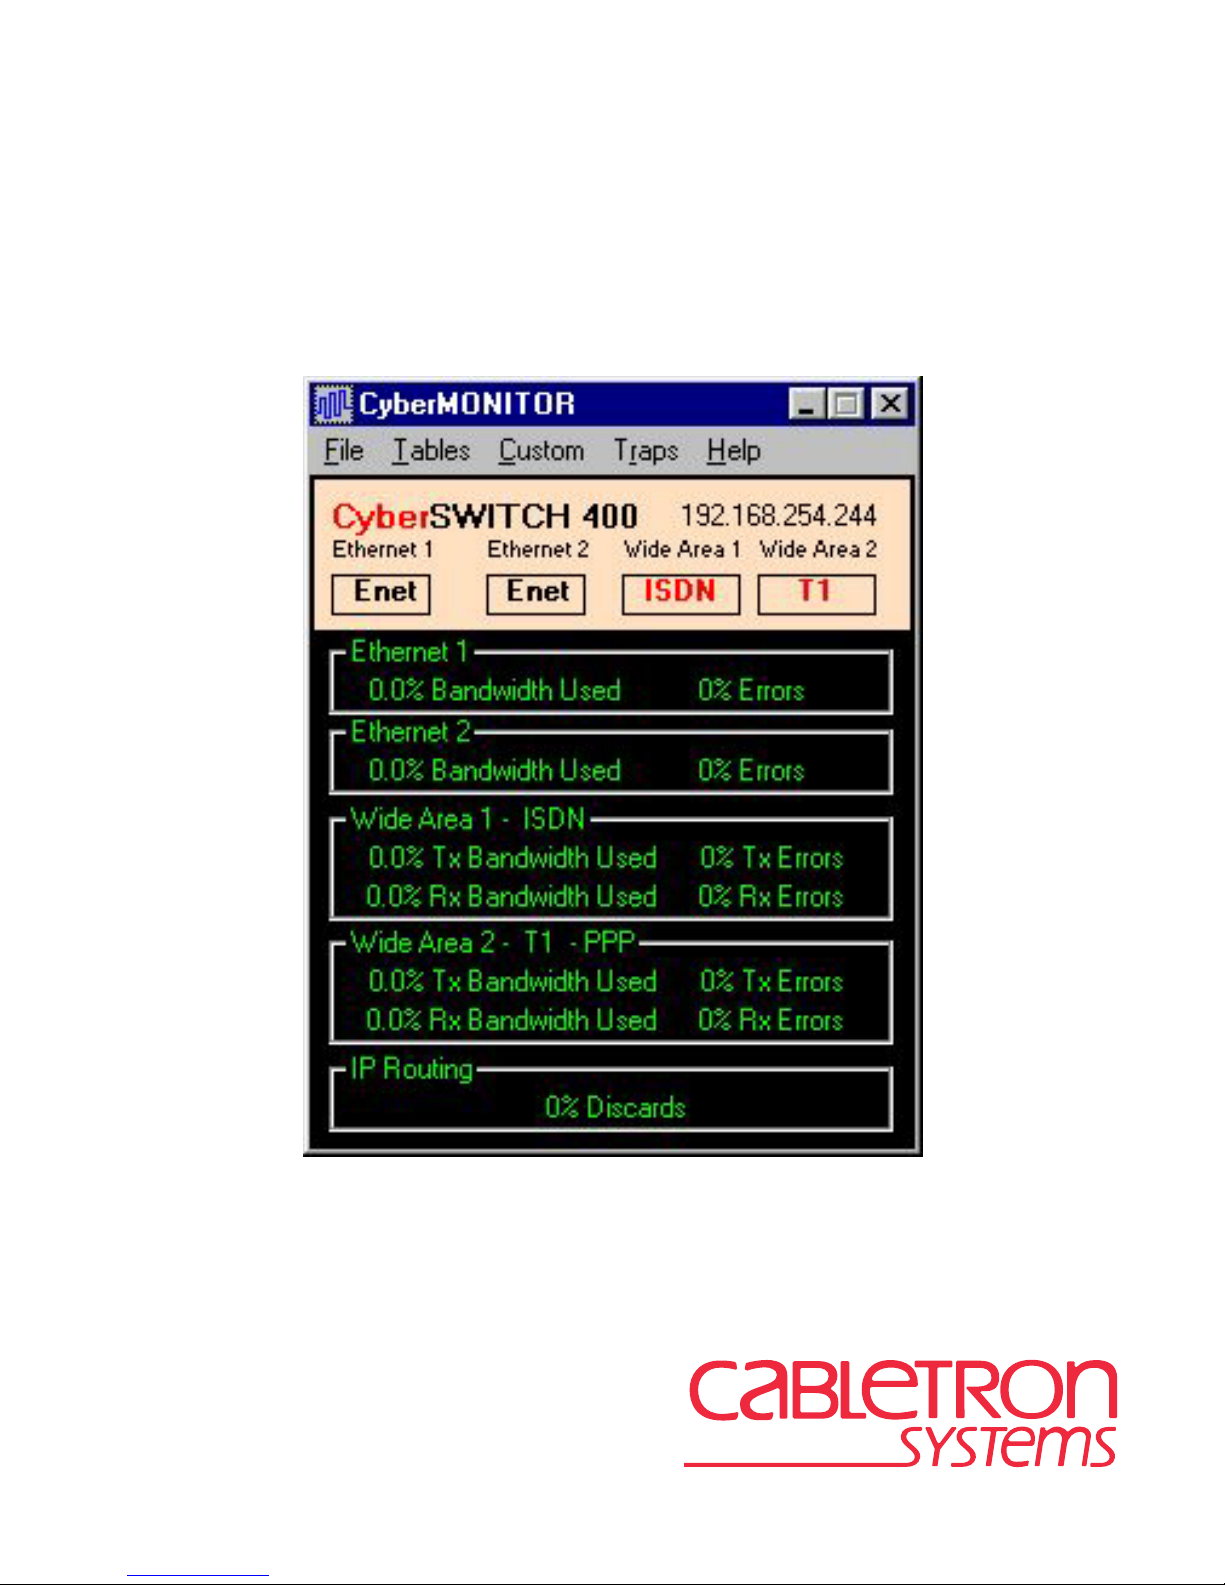
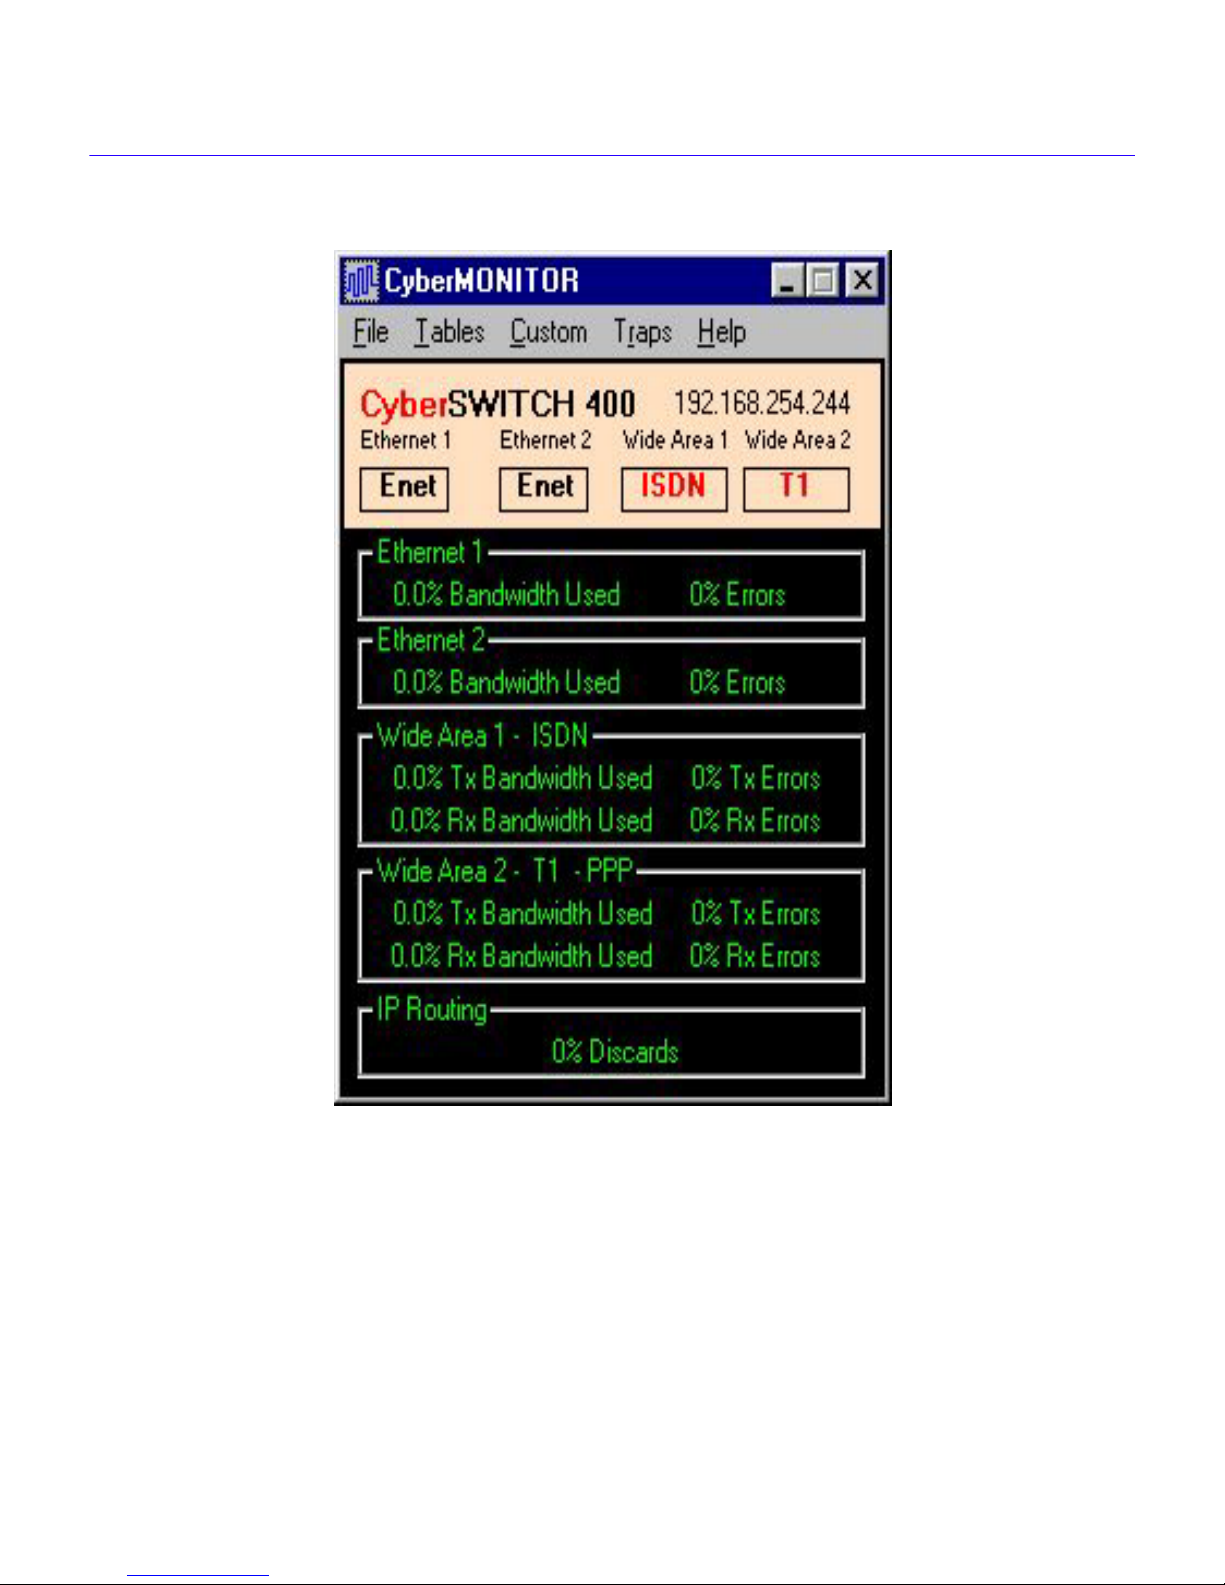
Graphical User Interface
The CyberMONITOR employs a graphical user interface, simplifying the process of selecting
devices, ports, etc., to monitor. The Primary Monitor Window (
Network Port Interfaces, and Wide Area Network port interfaces (Wide Area 1, 2 shown) in the
device that you are monitoring, as panels. The status conditions (i.e., bandwidth utilization and
error statistics) of each port are also shown in each panel.
Functions such as Inverse Multiplexing, Bridging, IP Routing, IPX Routing, etc. will be shown
(with relevant statistics) at the bottom of the Primary Monitor Window as separate panels, when
these functions are enabled.
CyberMONITOR User’s Guide 2-1
Figure 2-1
) shows the Ethernet
Page 22
Chapter 2:
CyberMONITOR Overview
Port Interface Icons
Figure 1 shows the Primary Monitor Window representing a CSX400 CyberSWITCH. The
Primary Monitor Window displays two Ethernet Port icons, and two Wide Area port icons under
the title bar. These icons represent Ethernet port 1, Ethernet port 2, and two Wide Area Port
Interfaces - designated Wide Area 1 ISDN, and Wide Area 2 DI.
2-2 CyberMONITOR User’s Guide
Figure 2-1 Primary Monitor Window
Page 23

CyberMONITOR Overview
Port Interface Stats Panels
The Ethernet Ports are represented by the Ethernet 1, and Ethernet 2 Port panels. The Wide Area 1,
and Wide Area 2 panels show ISDN transmission mode, and Drop and Insert (DI) mode, no
protocol set. Inside each panel are the statistics for Bandwidth Utilization for Transmit (Tx) and
Receive (Rx), and error statistics for these ports. The panels are typical of the Ethernet and Wide
Area interfaces installed in devices being monitored.
At the bottom of the Primary Monitor Window is a panel indicating any special functions being
employed by the device. In this instance, Bridging is being employed on the two Wide Area
network interfaces. Discards from the bridging function are shown as a percentage of the total
traffic. Other functions that might be employed such as IP Routing, and IPX Routing, etc., will
also be represented by a panel (bottom of the options window) similar to the one in
Figure 2-1
.
Primary Monitor Window Function Menu
There are five menu items at the top of the Primary Monitor Window. A brief description of the
function of each menu item follows:
• File
• Tables
• Custom menu - This menu displays the Bandwidth Thr esholds, or Errors Thr esholds
• Traps menu - This menu displays the Configure Traps, and View Traps menu items. The
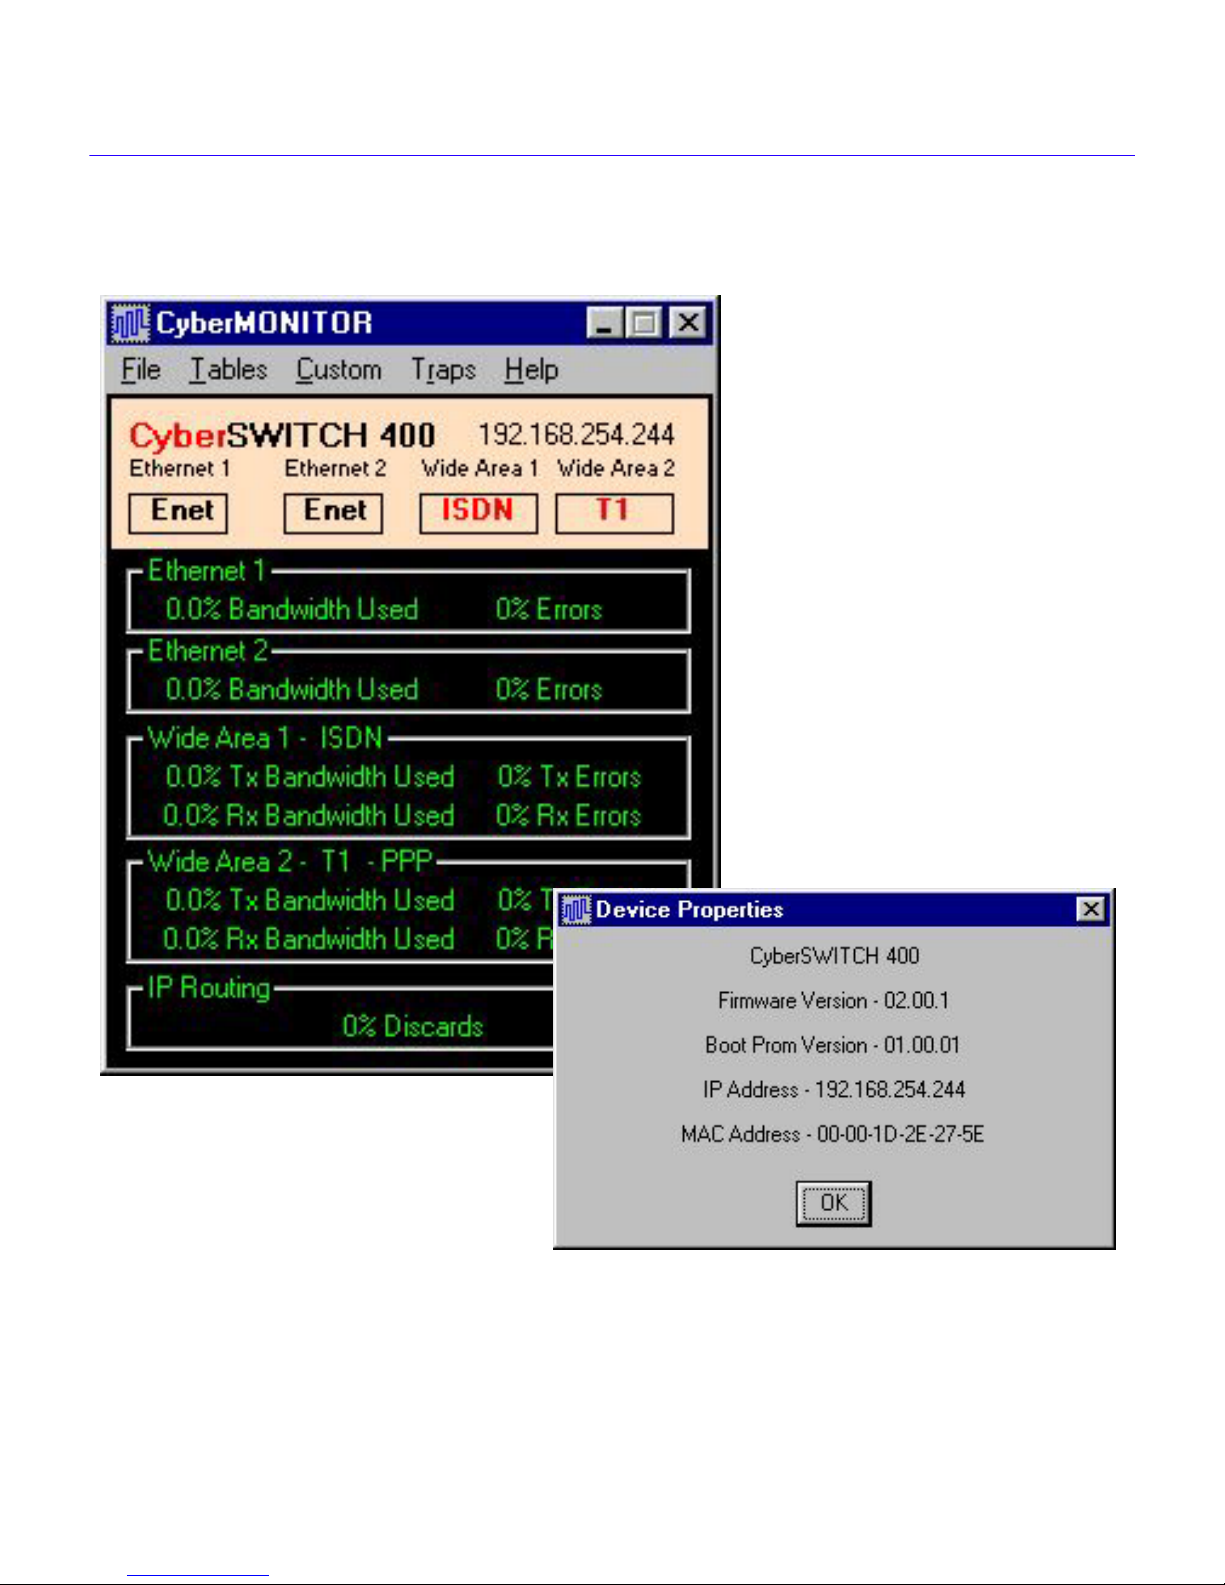
• Help menu- There are four items on this menu. Help on Help accesses the on line help
menu - selecting the File menu lets you access five more menu items that either select
configuration data, or access a New Device menu to select a new device to monitor, or
resume polling. They are:
menu - selecting the Tables menu lets you access the expanded data tables for each
enabled function that the device is configured for. The selections are:
Routing, IPX Routing, Frame Relay, and Inverse MUX.
alarm panels, used for setting aggregate bandwidth and aggregate error alarm levels.
Configure Traps item lets you configure a device, or devices, to send traps to your
designated IP Address. The View Traps menu item lets you monitor a device, or devices,
for traps generated by them.
system. Contents takes you to the main Help Window. Click on Help Topics to see the
contents. The About De vice menu item brings up a Device Pr operties Windo w (shown in
Figure 2-2) which lists the device type, firmware version, Boot Prom version, and the IP
Address and MAC Address of the device. The About CyberMONITOR menu item lists
the current revision of CyberMONITOR.
New Device, Resume Polling, Print, Preferences
Bridging, IP
, and
Exit
.
CyberMONITOR User’s Guide 2-3
Page 24
Chapter 2: CyberMONITOR Overview
Figure 2-2 Primary Monitor Window and Device Properties Window
2-4 CyberMONITOR User’s Guide
Page 25
CyberMONITOR Overview
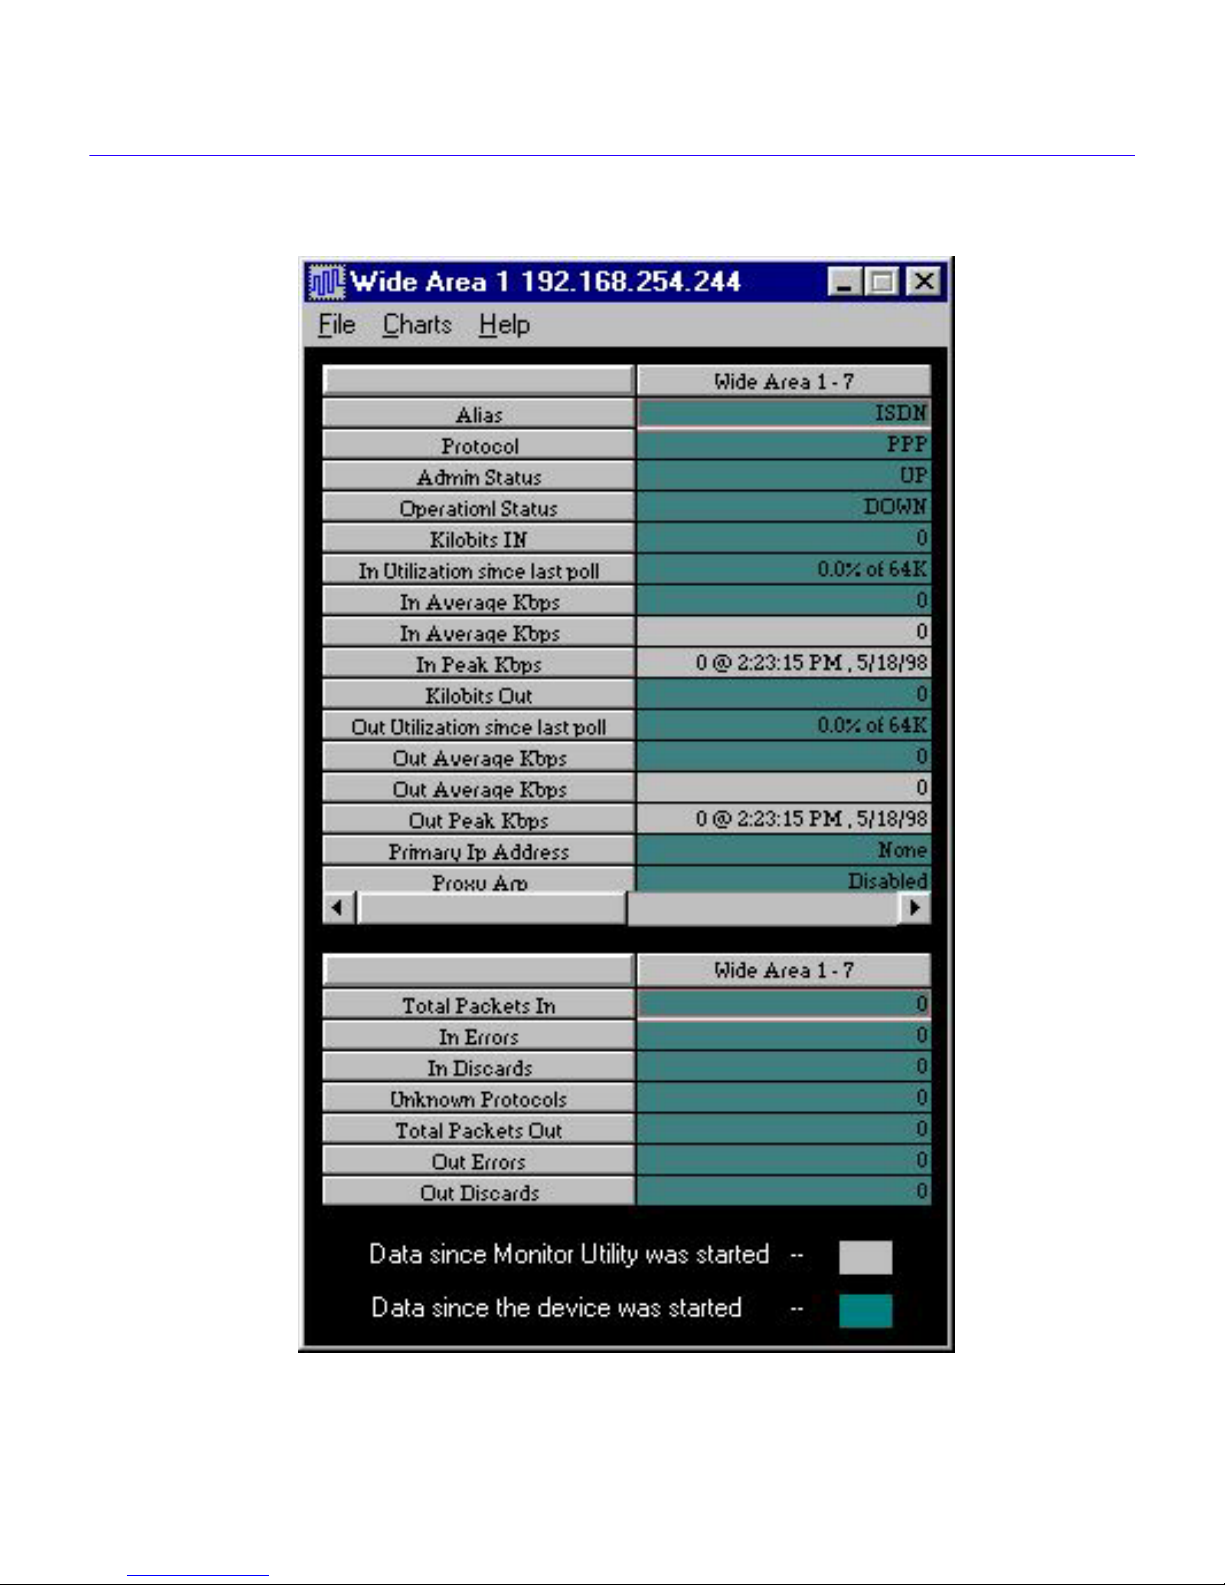
Figure 2-3 Statistical Data Table for Wide Area 1
CyberMONITOR User’s Guide 2-5
Page 26
Chapter 2: CyberMONITOR Overview
Statistical Data Tables
Statistical Data Tables (see Figure 2-3, on previous page) are expanded data tables for a selected
interface, or function within the device you are monitoring. Various status conditions and data
throughput are shown in each row in the table. The color of a ro w indicates the interv al of time that
the data was derived from (gray indicates time since start up of the CyberMONITOR Utility),
(green indicates the elapsed time since boot up of the monitored device).
Data Table Function Buttons
At the top of the Statistical Data Table are three menu items. A brief description of the function of
each menu item follows:
• File menu - selecting the File menu lets you access Print (which prints your data), or Close
which closes the table window.
• Charts menu - selecting the Charts menu lets you access a graphic representation of the
data statistics shown in the statistical data table. A chart is available for every table.
• Help menu - selecting Help takes you to the Help W indo w for the Statistic Table within the
CyberMONITOR interactive Help system.
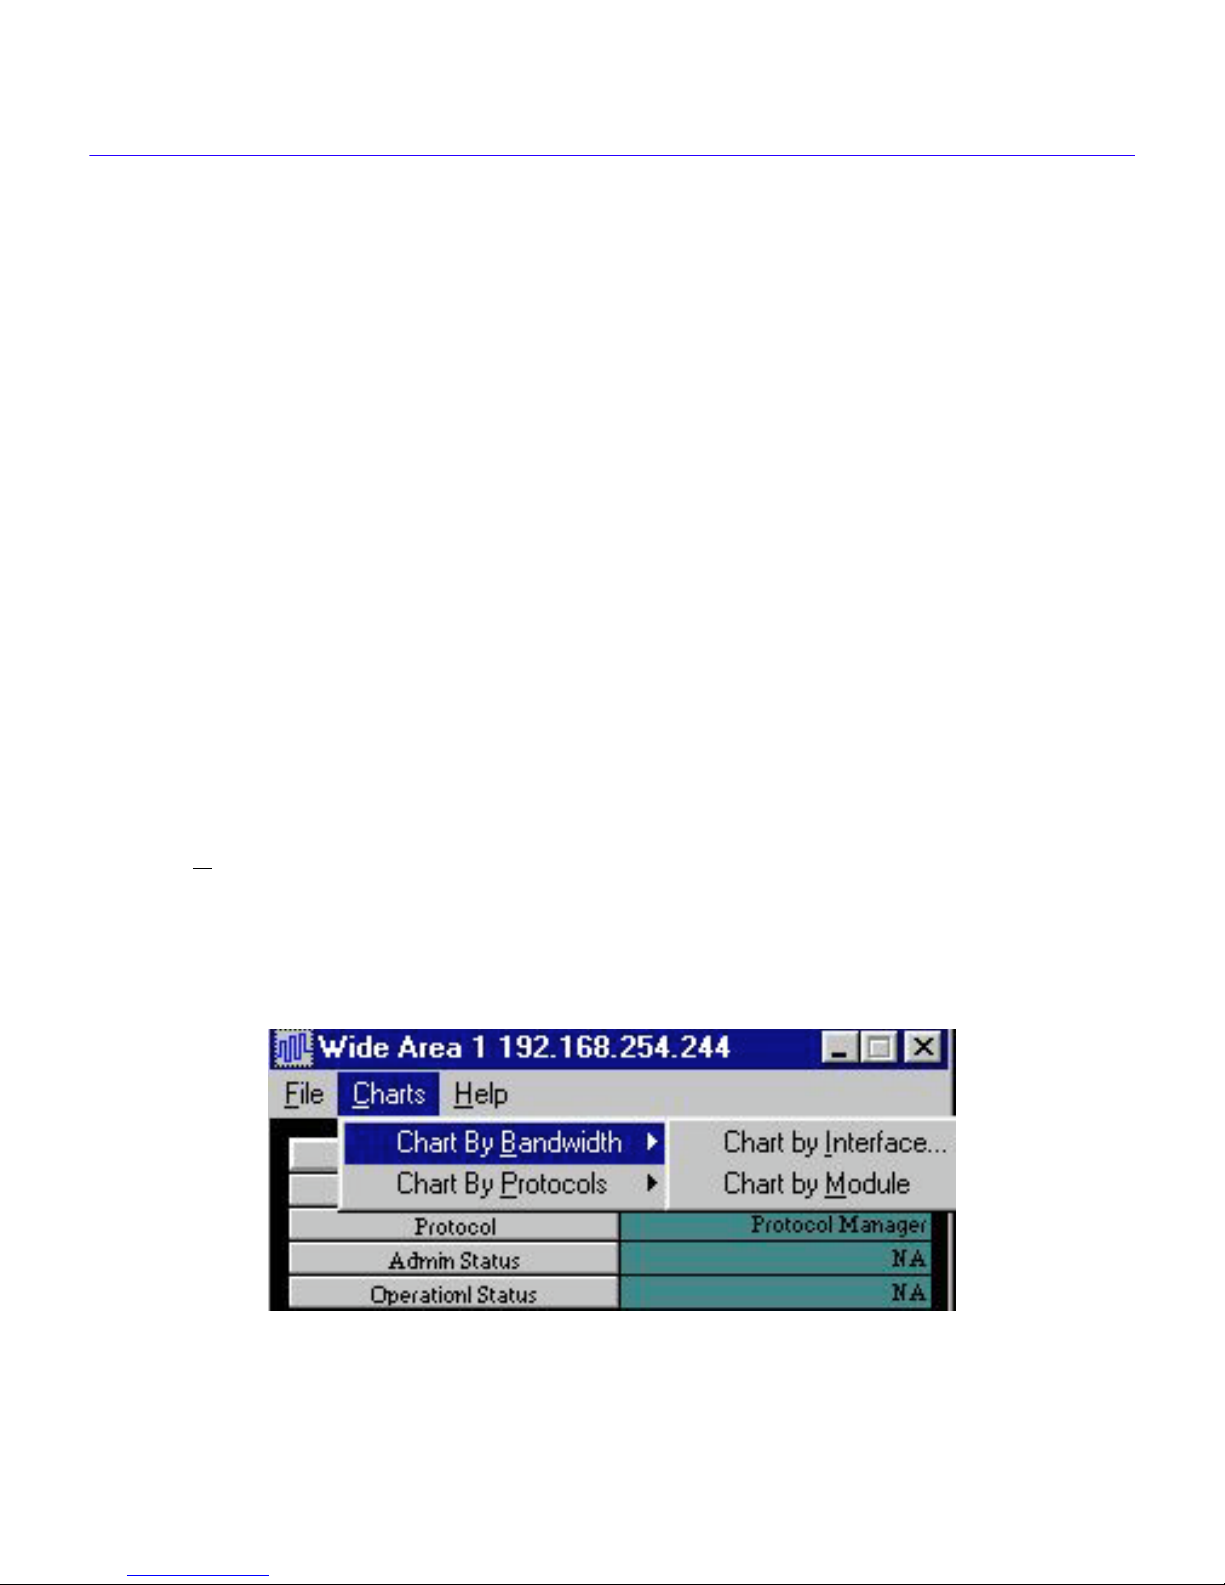
Statistics Charts
Click the Charts button on the Statistical Data Table to chart the data. The Charts Menus shown
below in Figure 2-4, and Figure 2-5, let you chart by Bandwidth or by Protocols.
The Bandwidth submenu lets you select either Chart by Interface (Interface Number), or Chart by
Module. The Protocols submenu lets you select either IP, or IPX Protocol.
Figure 2-4 Chart By Bandwidth Drop Down Menu
2-6 CyberMONITOR User’s Guide
Page 27

CyberMONITOR Overview
Figure 2-5 Chart by Protocols Drop Down Menu
A statistic chart for Wide Area network interface port number 1, is shown in Figure 2-6, on the
following page. The IP Address of the device being monitored is displayed in the upper border of
the chart. The interface statistic chart shows data vs. time (for transmit and receive) displayed
along the time axis.
The units of measurement (Kilobits/sec) are shown on the vertical axis at the left side of the chart.
The value of any point on the chart can be determined by moving the cursor (vertical red line)
along the trace and reading the value in the upper left corner of the top panel of the chart.
The date and time of the point of reference (cursor position) are shown in the upper left corner of
the top panel of the chart. The scale displayed on the left edge of the chart is autosizing - it will
change in magnitude in response to peaks and valleys of the trace. In other words, this scale will
change as the cursor is moved along the trace. No event should ever be off-scale.
The value shown in the upper right hand corner of the top panel of the chart, is the absolute
maximum value of the parameter being monitored. In the case of the chart in Figure 2-6, this v alue
(total bandwidth) is 1536 Kbps. You can zoom into an area for better resolution by setting the
cursor at the beginning of the area to be zoomed, clicking the left mouse button, and then dragging
the cursor to display the area to be zoomed. Releasing the mouse button will end the highlighted
zoom area, and cause the display to be zoomed.
Click the Reset Zoom button to return to the previous scale factor. Note that the time axis will
change in response to zooming an area.
CyberMONITOR User’s Guide 2-7
Page 28

Chapter 2: CyberMONITOR Overview
Figure 2-6 Interface Statistic Chart for Wide Area 1
There are two menu items at the top of the statistic chart; File, and Help. The File menu lets you
access either P
rint (which prints the chart), or Close, (which closes the window). The Help button
accesses the help page for this window. There is an Interface Statistic chart for every port interface
module monitored. There are also statistic charts for other functions which will be covered in
Chapter 3, Using CyberMONITOR.
2-8 CyberMONITOR User’s Guide
Page 29

CyberMONITOR Overview
Alarm Settings
Click the Custom Button in the menu bar of the Primary Monitor W indo w to access the drop down
menu shown in Figure 2-7, below. This menu lets you select either the Bandwidth Thresholds
panel, or the Errors Threshold panel. (see Figure 2-8, andFigure 2-9).
Figure 2-7 Custom Drop Down Menu
The alarm settings windows (Bandwidth Thresholds, and Error Thresholds) let you set alarm
levels which represent the aggre gate of all bandwidth parameters, and of all error conditions within
the device being monitored. There are two discrete levels; Warning, and Critical, represented by
yellow and red indicators.
If any of the parameters being monitored exceeds the levels that you preset for Warning, and
Critical, the panel representing this port interface on the primary monitor window will change
color to yellow, or red depending on the alarm level that has been exceeded.
Figure 2-8, on the following page, shows the Bandwidth alarm panel for the CSX400 device, and
the Ethernet 1 and Ethernet 2 ports, Wide Area 1 ISDN, and Wide Area 2 DI ports. The Warning
levels for bandwidth have been set for 40%, and the Critical levels have been set for 50% for the
Ethernet ports and the Wide Area ports.
CyberMONITOR User’s Guide 2-9
Page 30

Chapter 2: CyberMONITOR Overview
Figure 2-8 Alarm Panel for Bandwidth Parameter
2-10 CyberMONITOR User’s Guide
Page 31

CyberMONITOR Overview
Figure 2-9 Alarm Panel for Errors Parameter
Figure 2-9, above, shows Tx and Rx error lev els preset to 5% for Warning and 10% for Critical on
the Ethernet 1, and Ethernet 2 ports, and Wide Area 1, and Wide Area 2 ports. Error thresholds
have also been set for the functions IP Routing and IPX Routing. Note that the legend on Bridging
is red, indicating that the Critical error threshold of 50% discards has been exceeded.
There are statistic charts and statistic tables for monitored functions such as Bridging, IP Routing,
IPX Routing, etc. These will be covered in detail in the next chapter, Using CyberMONITOR.
CyberMONITOR User’s Guide 2-11
Page 32

Chapter 2: CyberMONITOR Overview
CyberMONITOR Help System
The CyberMONITOR employs an interactive help system with links to related topics. There are
four ways to access the help system from within the CyberMONITOR:
• Click on the HELP button on any window to access the Help Contents page.
• From any window within the CyberMONITOR you can obtain help by pressing the F1
Function key. A topic window containing information pertaining to the current
configuration function will appear. Click once on the window to restore the configuration
window.
• You can place the cursor on an object and click the right mouse button. A “What's This”
button will appear. Click on this button to see a pop up window with an associated help
topic.
• You can select a list of topics (a T able of Contents) from this HELP window by clicking on
the Contents button.
• Click on the FIND button on a Contents page HELP window and type a k eyword. The help
system will create a database of all the words within the help system and then search all of
the available help topics and display a list of those topics containing the keyword.
Contents Page
The Contents page is organized as a set of books, represented by book icons with a subject title.
Double click on any book shown on the Contents page to see the “pages” of topics within that
book. Double click on any page to open the topic. Within the topics are “Hot Spots” of text, sho wn
in green. Click on any hot spot to display a pop up window or jump to another related help topic.
Index
You can click the Help Contents INDEX button to see an index of topics and related keywords.
Click on any topic or keyword to see a list of related help topics.
Glossary
You can double click on the Contents Page book entitled “Glossary” to see a glossary of related
technical terms. You can scroll up and down the Glossary page to view the entries.
2-12 CyberMONITOR User’s Guide
Page 33

CyberMONITOR Overview
Getting Help
For additional support related to this device or document, contact Cabletron Systems using one of
the following methods:
World Wide Web http://www .cabletron.com/
Phone (603) 332-9400
Internet mail support@cabletron.com
FTP ftp://ftp.cabletron.com/
Login
Password
To send comments or suggestions concerning this document, contact
the Cabletron Systems Technical Writing Department via the following
email address: TechWriting@cabletron.com
Make sure to include the document P art Number in the email message.
anonymous
your email address
Before calling Cabletron Systems, have the following information ready:
• A description of the failure
• A description of any actions taken to resolve the problem
• A description of your network environment
CyberMONITOR User’s Guide 2-13
Page 34

Chapter 2: CyberMONITOR Overview
2-14 CyberMONITOR User’s Guide
Page 35

3
Using CyberMONITOR
Prerequisites
The following is a list of prerequisites to using the CyberMONITOR utility:
Virtual Memory Enabled (Windows 95)
You must have Virtual Memory enabled to run CyberMONITOR. To check if you have Virtual
Memory enabled for a Windows 95 Operating System, right click on the My Computer icon on
your desktop. A System Properties window will open. Click on the Performance window.
Click the button that reads “#2 Let Windows manage my virtual memory settings
(recommended)”. Click O
changed this setting.
Virtual Memory Enabled (Windows NT)
You must have Virtual Memory enabled to run CyberMONITOR. To check if you have Virtual
Memory enabled for a Windows NT Operating System, right click on the My Computer icon on
your desktop. A System Properties window will open. Click on the Performance window.
K. Then click Close. You must reboot your computer if you have
Check that there is a reasonable amount of virtual memory enabled (75 Mb shows in the small
window). The factory defaults should suffice for running CyberMONITOR. You must reboot
your computer if you have changed this setting.
Disk Space
You should have at least 5 Mb of free disk space. If you plan to store data from monitored sessions,
be aware that graphical data occupies more memory than textual data.
RAM Memory
You should have at least 16 Mb of RAM memory to run the monitor utility. The more RAM
memory you have, the more efficiently the monitor utility will run.
Processor/Speed
The monitor utility will run most efficiently on Pentium equipped computers of 100 M HZ speed
or better.
Screen Resolution
Your screen resolution must be at least 600 by 800 pixels in order to view the data presentation.
CyberMONITOR User’s Guide 3-1
Page 36

Chapter 3: Using CyberMONITOR
Local User Networks
If your system is connected to more than one network, you will see the Local User Networks
window shown below in Figure 3-1. Use the scroll button to select the network connection that
your CyberMONITOR-capable device is attached to.
Figure 3-1 Local User Networks Window
Click OK to select the network, and the Device IP Address window in Figure 3-2, displays:
Figure 3-2 Device IP Address Window
Enter the IP address of the device in the appropriate field and the password if applicable (the
default password is public). Click on the O
network and displays the Primary Monitor window shown in Figure 3-3 on the following page.
3-2 CyberMONITOR User’s Guide
K button and CyberMONITOR locates the de vice on the
Page 37

Using CyberMONITOR
Figure 3-3 Primary Monitor Window and File Menu
CyberMONITOR User’s Guide 3-3
Page 38

Chapter 3: Using CyberMONITOR
Custom Interval
The Custom (polling) Interval window shown in Figure 3-4, below displays when you click on
Polling Interval from Preferences in the File submenu (see Figure 3-3, on the previous page).
The Custom Interval window is used to change the polling interv al for the de vice being monitored.
Use the scroll button to select a polling interval from the list. Click O
Note: If you do not set up a polling interval, the default value of 15 seconds will be used.
K to accept your selection.
Figure 3-4 Custom Polling Interval Window
Start/Stop Times Window
The Start/Stop Times selection window shown in Figure 3-5, below, displays when you click on
Start/Stop Times from Preferences in the File submenu of the Primary Monitor window (see
Figure 3-3).
3-4 CyberMONITOR User’s Guide
Figure 3-5 Start/Stop Times Window
Page 39

Using CyberMONITOR
Enter the Start and Stop times for your monitoring session. Note the AM, and PM buttons. The
maximum interval that can be set for a monitoring session is twenty-four hours, minus one minute.
This interval is for a monitoring session that is automatically started, and automatically stopped.
For example, setting the Start Time for 10:00 AM, and the Stop T ime for 9:59 AM will produce the
maximum twenty-four hour (minus one minute) monitoring interval.
Long-Term Monitoring Sessions
A monitoring session can be made to run indefinitely by not setting a Stop time in the Stop time
window. Long term monitoring is useful for finding anomalies such as bandwidth overutilization
for instance, over a long monitoring period. These anomalies will be evident by their amplitude on
the chart, and their occurrence times can be isolated within the limits of screen resolution and
mouse sensitivity.
There is a practical limit to the length of monitoring sessions, and it is that the resolution of the
chart of the interface, or function, monitored will steadily change scale (autoscaling) as time
elapses. If the amount of detail available becomes blurred, use the Zoom function to expand any
selected segment. For added detail, you can successively zoom on a zoomed segment (see
Statistical Data Charts).
Primary Monitor Window
The Primary Monitor Window is shown in Figure 3-6 on the following page.
A typical Primary Monitor Window (for the HSIM-W6 device) shows the HSIM Port (Ethernet
interface) and its IP Address, Wide Area Network Port Interfaces, and protocols in use in the
device that you are monitoring, These show on the Primary Monitor window as panels. The status
conditions (i.e., bandwidth utilization and error statistics) of each port are also shown in each
panel.
Functions such as Inverse Multiplexing, Bridging, IP Routing, IPX Routing, etc. will be shown
(with relevant statistics) as panels at the bottom of the Primary Monitor window when they are
enabled. The color of the lettering of the title and border of the panels indicates the alarm status;
Green indicates no alarms, yellow indicates a Warning condition, and red indicates a Critical
condition for either bandwidth, or error alarms.
CyberMONITOR User’s Guide 3-5
Page 40

Chapter 3: Using CyberMONITOR
Figure 3-6 Monitor Window for HSIM-W6 Device
Inside each panel are the statistics for bandwidth utilization for Transmit (Tx) and Receive (Rx),
and error statistics for these ports. The panels will always represent the type of network modules
installed in the device being monitored, and the protocol or transmission mode being employed.
At the bottom of the primary monitor window is a panel indicating any special functions being
employed by the device. In this instance, Bridging and IP Routing are being employed on the two
Wide Area network modules. Other functions that might be employed such as Inverse
Multiplexing, IPX Routing, etc., would also be represented by a panel (at the bottom of the
primary monitor window) similar to the one shown in Figure 3-6, above.
3-6 CyberMONITOR User’s Guide
Page 41

Using CyberMONITOR
Function Menus
There are four function menu items at the top of the primary monitor window. A brief description
of the function of each menu item follows:
File Menu
• File menu item lets you access the four menus shown in Figure 3-6, and described below:
Use the New Device menu item to select a new device to monitor by presenting the IP
Address window to enter the new device’s IP Address and Community Name.
• Print lets you print the data to your local printer.
• Resume Polling causes the monitor utility to continue to collect data from the monitored
device after a Stop event has occurred.
• Preferences lets you set up Start/Stop Times Window, or set up the Custom Polling
Interval Window.
• Exit brings you to the Exit window to exit the monitor utility.
Tables Menu
The Tables menu item lets you access data tables for: Bridging, IPX Routing, IMUX, etc.
that are enabled on the device, and that you select on the primary monitor window.
Custom Menu
• The Custom menu item lets you access the bandwidth and error alarm settings panel to set
the Warning and Critical levels for aggregate bandwidth and aggregate errors.
Utilities Menu
• This menu displays the Configure Traps, and View Traps menu items. The Configure
Traps item lets you configure a device, or devices, to send traps to your designated IP
Address. The View Traps menu item lets you monitor a device, or devices, for traps
generated by them.
Help Menu
• The Help menu item takes you to the Help-on-Help page, which explains how to use the
on-line Help system built into the CyberMONITOR. The Contents button accesses the
Help contents page. The About Device and About Cyber MONITOR buttons report the
version of the device being monitored, or the version of the CyberMONITOR application.
CyberMONITOR User’s Guide 3-7
Page 42

Chapter 3: Using CyberMONITOR
Statistical Data Tables
Double clicking on any panel in the primary monitor window will produce a statistical data table
for that module, or function. Figure 3-7 shows the statistical data table for Wide Area network
module 1- logical interface number 3 (Wide Area 1-3). At the end of this chapter there is an
in-depth discussion of the data displayed in each type of table.
Statistic Table Menu Items
The statistical data tables employ the following menu items:
File Menu
• The File menu item gives you the options to Print the table data, or Close the statistical
data table.
Charts Menu
• The Charts menu item lets you select the mode that you would like to use to display the
data, i.e., by Chart-by-Bandwidth, Chart-by-Protocols,
Chart-by-Bandwidth - provides charting of all the Tx and Rx kilobits per second for an
interface number, or for the entire Wide Area module, or the combined Tx and Rx
throughput for Ethernet modules.
Chart-by-Protocols - provides charting of the Tx and Rx kilobits per second for the IP,
and IPX Protocol traffic through a Wide Area Module, or combined Tx and Rx kilobits per
second for an Ethernet Module.
Help Menu
• The Help menu item lets you access a Help page that will display information pertinent to
the table you are viewing.
Statistical Table Scroll Bar
In the center of the statistical data table is a horizontal scroll bar. This scroll bar is used to access
data for Interface Numbers that are not currently viewable in the statistical data table. Note the
Wide Area 1-3 heading in the panels of the statistical data table shown in Figure 3-7. The Wide
Area 1 designation describes the first Wide Area network interface in the device being monitored.
The -3 following Wide Area 1 designates the logical Interface Number represented in the window.
Use the scroll bar to scroll the data window across the table to access data pertinent to other
Interface Numbers. As the window for each Interface Number is accessed, the title bar will reflect
the Wide Area port number and the Interface Number separated by a dash, i.e., Wide Area 1-29
would represent logical Interface Number 29 for Wide Area network module number 1.
3-8 CyberMONITOR User’s Guide
Page 43

Using CyberMONITOR
Secondary IP Addresses
Beneath the Primary IP Address row in the Ethernet statistical data table is the Secondary IP
Address row. If an interface has more than one IP Address associated with it, the first Secondary IP
Address will appear in this row of the table. The click button at the end of the Secondary IP
Address row lets you access a table of Secondary IP Addresses if more than one exists.
Figure 3-7 Statistical Data Table for Wide Area 1
CyberMONITOR User’s Guide 3-9
Page 44

Chapter 3: Using CyberMONITOR
Statistical Data Charts
Clicking Charts at the top of the statistical data table will produce a chart (see Figure 3-8 below)
of the data in one of the charting modes mentioned previously (in this case bandwidth vs. time).
Figure 3-8 Statistical Data Chart for Wide Area 1
In the upper left corner of the chart is a File button that lets you access a menu for Print (printing
the chart), or Close (closing the chart window). Below the File button the date and your system
time are displayed. In the upper right corner of the chart are buttons that let you minimize, or close
the window. Below these buttons the Max = [value] or Be = [value] is displayed. The Max =
value is the absolute maximum possible for the parameter being monitored (bandwidth, in this
case). The Be = value represents the excess burst rate (Be) for a Wide Area network module
configured for Frame Relay. Any traffic that exceeds this value may be exceeding the guaranteed
information rate. The statistical data chart shows data (bandwidth utilization) displayed along the
time axis. The units of measurement (kilobits per second) are shown on the vertical axis at the left
side of the chart.
3-10 CyberMONITOR User’s Guide
Page 45

Using CyberMONITOR
Autosizing
The statistical data chart uses “autosizing”. If a sudden peak exceeds the current scale, the chart
will adjust the scale factor to include the peak. All events are alw ays visible on this chart - nothing
will ever be off-scale.The scale at the left of the chart reflects the units of measurement (Kilobits
per second, in this case). The scale at the bottom of the chart reflects the Start and Stop times of the
monitoring session, in convenient increments.
If a monitoring session has not been completed (hasn’t reached Stop T ime), the trace sho wn on the
chart will be incomplete. The right end of the trace will reflect the current time, and will be
continuously changing. If the monitoring session is set up for continuous monitoring (no Stop
Time specified), the left end of the chart will reflect the Start Time of the monitoring session, and
the right end of the chart will reflect the elapsing time for as long as the window is open.
Note: Charting for a number of days will accumulate an amount of data that may cause
performance degradation on some platforms with less memory, and slower processing
power.
Movable Cursor
The red vertical line shown on the chart is a mo vable cursor, controlled by your computer’ s mouse.
As you move the mouse pointer into the chart window, your mouse will be able to control the
cursor movement. The number shown directly below the date and system time is the peak v alue of
the trace at the point where the cursor intersects the trace. As you mov e the cursor across the chart,
this value will change, i.e., will display the value of the data under the cursor.
Zooming
If you place the cursor in front of an area of interest on the chart, depress the left mouse button and
hold it while you move the cursor, you will highlight an area that can be “zoomed”. When you
release the mouse button, you will zoom the area that was highlighted. The scale of the resultant
zoomed area will be changed so that the entire chart represents the zoomed portion of the data. It is
possible to successively zoom portions of the data by repeating the mouse procedure in the
“zoomed” window. Another zoomed window will appear for each zoom procedure, with a
correspondingly smaller time scale. The minimum amount of zoomed time that can be represented
is one second. You can return to the unzoomed chart by clicking the Reset Zoom button.
Data Statistics
You can chart various statistical data by using the Charts menu item on a statistical data table. The
possible options (depending upon the network interface being monitored) are; Chart-byBandwidth, Chart-by-Protocols (IP and IPX), Chart-by-Interface Number, and Chart-by-Module.
CyberMONITOR User’s Guide 3-11
Page 46

Chapter 3: Using CyberMONITOR
Interpreting Statistical Data Tables
The following figures and corresponding data will explain the entries within the statistical data
tables, and tables of functions such as IPX Routing, and Inverse Multiplexing. Figure 3-9,
Ethernet Network Interface Statistical Data Table, shown below, and Ethernet Statistical Data,
explain the interpretation of data displayed in Ethernet statistical data tables.
Figure 3-9 Ethernet Network Interface Statistical Data Table
3-12 CyberMONITOR User’s Guide
Page 47

Using CyberMONITOR
Ethernet Statistical Data
The following is a row-by-row breakdown of the Ethernet network interface statistics:
Protocol - Protocol of the interface being monitored.
Admin Status - Up, Down, or Testing - the “desired” state of the interface.
Operational Status - The “actual” state of the interface (Up, Down, or Testing).
Kilobits In - the total kilobits input to the interface since the device started.
Kilobits Out - the total kilobits output by the interface since the device started.
Utilization since last poll - bandwidth utilization stated as a percentage of the maximum
utilization - i.e., 10% of 10000 Kilobits.
Average Kbps - The number of kilobits per second (averaged over the polling interval), since
the device started.
Average Kbps - The number of kilobits per second, averaged over the polling interval, since
the monitor session started.
Peak Kilobits - absolute max rate during the monitoring session, stated as [peak Rate] @ [time]
and [date].
Primary IP Address - the primary IP Address for the interface being monitored.
Secondary IP Address - the Secondary IP Address for the interface being monitored. Clicking
the button at the end of this row will display a list of Secondary IP Addresses if there is more
than one Secondary IP Address.
Proxy ARP - When Proxy ARP is enabled, and an ARP request is received, for an IP Host
whose network address is listed in the IP Route Table, the IP Routing Services sends a Proxy
ARP response, with the physical address of the receiving router port in place of the requested
host's physical address.
Horizontal Scroll Bar - The horizontal scroll bar in the center of the table is used to scroll the
data table horizontally, to view data for other Interface Numbers. The Interface Number
appears in the Title panels (i.e., Ethernet1-1, indicates Ethernet network interface port 1,logical
Interface Number 1).
CyberMONITOR User’s Guide 3-13
Page 48

Chapter 3: Using CyberMONITOR
Ethernet Packet Statistics
The packet statistics for an Ethernet network interface port are shown below. These statistics
appear below the horizontal scroll bar in the Ethernet statistical data table.
Total Packets In - The total packets input to the interface (Interface Number displayed) since
the device was started.
In Errors - The total number of input errors since the monitored device was started.
In Discards - The total number of input packets discarded for any reason, since the monitored
device was started.
Unknown Protocols - Any protocol the interface (Interface Number displayed) has
encountered, that cannot be processed.
Total Packets Out - The total number of packets output by the interface (Interface Number
displayed), since the device was started.
Out Errors - The total number of output errors since the device was started.
Out Discards - The total number of output packets discarded (for any reason) since the device
was started
Ethernet Data Table Function Menu
The three menu items at the top of the Ethernet Interface Statistic Table are described below:
File - The File menu item lets you access Print, (prints the table), or Close, which closes the
table window.
Charts - Lets you access graphic representations of statistics shown in the Ethernet Data Table
(for the logical interface number selected for an Ethernet network interface port). You can chart
by; bandwidth, by protocols, by Interface Number, or by module.
Help - Accesses a Help page with information about the window you are viewing.
3-14 CyberMONITOR User’s Guide
Page 49

Using CyberMONITOR
Wide Area Statistical Data Table
Figure 3-10, shown below, and Wide Area Statistical Data, explain the interpretation of the
statistical data displayed in the Wide Area Statistical Data Table.
Figure 3-10 Wide Area Statistical Data Table
CyberMONITOR User’s Guide 3-15
Page 50

Chapter 3: Using CyberMONITOR
Wide Area Statistical Data
The Wide Area Data Tables contain all the pertinent information about the Wide Area network
interface port that you are monitoring. The following is a breakdown of these statistics:
Alias - This is an alias name that you give to the interface, for convenience.
Protocol - Protocol of the interface being monitored (Frame Relay, PPP, etc.). If Protocol
Manager is shown under Protocol, see Protocol Manager, below.
*Protocol Manager - The statistics for the Protocol Manager will be displayed if the
Protocol Manager is managing protocols on the physical WPIM module. The statistical
data units (Frame Relay or ISDN management packets and control information) that the
Protocol Manager reports are: Kilobits IN, In Average Kilobits, In Discards, and Unknown
Protocols (see definitions below, and on the following page).
Admin Status - Up, Down, or Testing - the “desired” state of the interface.
Operational Status - The “actual” state of the interface (Up, Down, or Testing).
Kilobits In - the total kilobits input to the interface since the device started.
In Utilization since last poll - the input bandwidth utilization (since the last poll) stated as a
percentage of the maximum utilization - i.e., 10% of 10000 Kilobits.
In Average Kbps - the average rate of kilobits input (averaged over the polling interval), since
the device started.
In Average Kbps - The number of kilobits per second input (averaged over the polling
interval), since the monitor session started.
In Peak Kilobits - the absolute maximum input rate during the monitoring session. The entry
is stated as [in peak Rate] @ [time] and [date].
Kilobits Out - Total kilobits output since the device was started.
Out Utilization since last poll - the output bandwidth utilization (since the last poll) stated as
a percentage of the maximum utilization - i.e., 10% of 10000 Kilobits.
Out Average Kbps - the average rate of kilobits output (averaged over the polling interval),
since the device started.
Out Average Kbps - the average kilobits per second output (averaged over the polling
interval), since the monitor session started.
Out Peak Kilobits - the absolute maximum output rate during the monitoring session. The
entry is stated as [out peak Rate] @ [time] and [date].
Primary IP Address - the primary IP Address for the interface being monitored.
3-16 CyberMONITOR User’s Guide
Page 51

Using CyberMONITOR
Proxy ARP - When Proxy ARP is enabled, and an ARP request is received, IP Routing
Services sends a Proxy ARP response, with the physical address of the receiving router port in
place of the requested host's physical address.
Horizontal Scroll Bar - The horizontal scroll bar in the center of the table is used to scroll the
data table horizontally, to view data for other Interface Numbers. The Interface Number
appears in the Title panels (i.e. Wide Area 1- 3, indicates Wide Area network interface port 1,
logical Interface Number 3).
Wide Area Packet Statistics
The packet statistics for a Wide Area network interface port are shown below. These statistics
appear below the horizontal scroll bar in the Wide Area statistical data table.
Total Packets In - The total packets input to the interface (Interface Number displayed) since
the device was started.
In Errors - The total number of input errors since the monitored device was started.
In Discards - The total number of input packets discarded for any reason, since the monitored
device was started.
Unknown Protocols - Any protocol the interface (Interface Number displayed) has
encountered, that cannot be processed.
Total Packets Out - The total number of packets output by the interface (Interface Number
displayed), since the device was started.
Out Errors - The total number of output errors since the device was started.
Out Discards - The total number of output packets discarded (for any reason) since the device
was started
Wide Area Data Table Function Menu
The three menu items at the top of the Wide Area Network Interface Statistic Table are described
below:
File - The File menu item lets you access Print, (prints the table to your selected printer), or
Close, which closes the table window.
Charts - Lets you access graphic representations of statistics shown in the Wide Area Data
Table (for the logical interface number selected for a Wide Area network interface). You can
chart by; Bandwidth, by Protocols, by Interface Number, or by Module.
Help - Accesses a Help page with information about the window you are viewing.
CyberMONITOR User’s Guide 3-17
Page 52

Chapter 3: Using CyberMONITOR
Other T ables
There is another class of data tables discussed in the following sections, that are displayed by the
CyberMONITOR utility. These are the data tables for the following functions; Bridging, IP
Routing, IP Event Log, RIP Table, IPX Routing, IPX Event Log, Inverse Multiplexing, Frame
Relay, Traps, and ISDN/Backup. You can access these tables by clicking on the Tables menu item
in the menu bar of the Primary Monitor window, and then clicking on the desired table in the
submenu.
Bridging T ables
Figure 3-11, shown below, is the Bridging Data Table.
3-18 CyberMONITOR User’s Guide
Figure 3-11 Bridging Data Table
Page 53

Using CyberMONITOR
Bridging Statistical Data
The Bridging Data Table shows the state of the Bridging interface. The text in the outer border
indicates the status of Spanning Tree (STP).
The Time frame shows the state of the following Spanning Tree parameters:
Hello Time - Time interval between generation of Bridge Protocol Data Units (BPDUs) by the
root bridge (bridge with the lowest bridge ID becomes the root of the Spanning Tree).
Max Age - Length of time a bridge will wait to receive a BPDU. Once this timer expires, a
Topology Change Notification BPDU will be transmitted.
Forward Delay - Length of time the bridge will remain in each port state.
Hold Time - The interval length during which no more than two Configuration BPDUs shall
be transmitted by this node, in units of hundredths of a second.
The Topology frame shows the number of times the topology has changed, and the time since the
last change.
The Port Information frame shows:
Port Number - logical port number.
Priority - value of the priority field.
State - Reports the following states: Disabled, Blocking, Listening, Learning, Forwarding, and
Broken.
Enabled - Port status, either Yes (Enabled), or No (Disabled).
Path Cost - Each bridge has a path cost associated with it representative of its “cost” to reach
the root bridge.
The File menu item lets you access either Print, (prints the table to your selected printer),
Refresh, that reloads the Bridging Table, or Close which closes the table window.
CyberMONITOR User’s Guide 3-19
Page 54

Chapter 3: Using CyberMONITOR
Bridging Per Interface Table
Figure 3-12, below, shows the Bridging Per Interface Table. To access the Bridging Per Interface
table, click on the Bridging panel on the Primary Monitor Window (see Figure 3-3).
Figure 3-12 Bridging Per Interface Table
Bridging Per Interface Data
The Bridging Per Interface table shows the following information:
Interface Numbers - logical interface number.
In Frames - total frames input for the life of the interface.
Out Frames - total frames output for the life of the interface.
In Discards - total input packets discarded for any reason, for the life of the interface.
3-20 CyberMONITOR User’s Guide
Page 55

Using CyberMONITOR
IP Per Interface
Figure 3-13, below sho ws the IP Per Interf ace Table. T o access the IP Per Interface Table, click on
the IP Routing panel on the Monitor Window for HSIM-W6 (see Figure 3-6).
Figure 3-13 IP Per Interface Table
IP Per Interface Data
The IP Per Interface Table shows IP Routing statistics sorted by Interface Number. The data
displayed is described below:
Interface Number - logical interface number.
Alias - an alias name that you assign to the Interface Number.
In Packets - Input to the interface for the lifetime of the interface.
Packets Forwarded - Total packets forwarded through the interface for the lifetime of the
interface (some packets are discarded for various reasons).
Packets Filtered -Total packets that are filtered by the interface for various reasons, for the
lifetime of the interface.
Packets Discarded - Total packets discarded for whatever reason, for the lifetime of the
interface.
Out Packets - Total packets out for the lifetime of the interface.
The File menu item lets you access either: Print, (prints the table to your selected printer),
Refresh, which reloads the statistics table, or Close, which closes the table window. The Table
menu item lets you access the IP Routing Statistics Table (Figure 3-14). The Help menu item
gets you the help page for this window.
CyberMONITOR User’s Guide 3-21
Page 56

Chapter 3: Using CyberMONITOR
IP Routing Tables
Figure 3-14, below, shows the IP Routing Statistics Table. To access the IP Routing Statistics
Table, click on the Table menu item on the IP Per Interface table menu bar (see Figure 3-13).
Figure 3-14 IP Routing Statistics Table
3-22 CyberMONITOR User’s Guide
Page 57

Using CyberMONITOR
IP Routing Statistics
The IP Routing Statistics Table (Figure 3-14, previous page) shows the following statistics:
Destination - IP Address of the route destination.
Interface - logical interface number of the route.
Alias - an alias name that you assign to the Interface Number.
Mask - The Subnet Mask of the destination IP Address.
Protocol - This window shows the method used to set the Protocol. The methods include:
Other, Local, Netmgmt, ICMP, EGP, GGP, Hello, RIP, is-is. es-is, bbnSpflgp, OSPF,
BGP, and IDPR.
The Sort by Interface button toggles between Sort by Interface, and Sort by Destination. When
this button is clicked (toggled), the table will sort the data accordingly. The File menu item lets
you access either Print, (prints the table), Refresh, which reloads the IP Routing table, or Close,
which closes the table window.
IP Event Log
The IP Event log (Figure 3-16 on the following page) is a record of IP Routing events, or device
status changes. The ev ents are listed in tab ular form, and can be sorted by Interface Number , Ev ent
Type, or Severity. Aliases and event times are listed, in addition to a description of the event. To
access the IP Event Log, click the IP Event Log menu item under IP, in the Tables menu as shown
in Figure 3-15 below.
CyberMONITOR User’s Guide 3-23
Figure 3-15 IP Tables Menu
Page 58

Chapter 3: Using CyberMONITOR
When IP Events are sorted by ev ent type, similar events will be grouped together. When IP Events
are sorted by severity, there are three levels: low, medium, and high, with high having the highest
priority. Sorting by Interface Numbers will be done lowest number first.
Clicking the Refresh Button refreshes the window with a new set of data. Before you can log IP
Events, you must enable IP Event Logging by clicking on the Enable IP Event Logging
checkbox. Click the Close button when you wish to end an IP Event Log session.
3-24 CyberMONITOR User’s Guide
Figure 3-16 IP Event Log Window
Page 59

Using CyberMONITOR
RIP T able
The RIP (Routing Information Protocol) Table, shown in Figure 3-17, below, displays the IP
Address, and Send and Receive RIP Protocols in use for the interface being monitored. To access
the RIP Table, click on the Tables menu on the primary monitor window, then click IP, and then
RIP Table. Click the Refresh button to poll for another set of data.
CyberMONITOR User’s Guide 3-25
Figure 3-17 RIP Table
Page 60

Chapter 3: Using CyberMONITOR
IPX Routing Table
The IPX RIP/SAP Routing Table is a RIP Table (Routing Information Protocol) and a SAP Table
(Service Advertising Protocol) combined in one window. Figure 3-18, below, shows the
IPX RIP/SAP Routing Table. To access the IPX Routing Table, click on the IPX Routing menu
item in the Tables menu on the Primary Monitor Window (see Figure 3-3).
IPX Routing Data
The left half of the window (RIP Table) shows NET ID, Interface Numbers, Alias, Src Node,
Hops, and Type for the corresponding servers shown in the SAP Table at the right of the window.
The SAP Table sho ws Netw ork ID Numbers for each Interface Number, and the Service Type, the
Server Name, and the server Source Node Number.
The Sort by Interface button lets you arrange the table by a list of Interf ace Numbers. This b utton
toggles between Sort by Interface, and Sort by NET ID. When the button is click ed (toggled) the
data table will sort the information accordingly.
3-26 CyberMONITOR User’s Guide
Figure 3-18 IPX Routing Table
Page 61

Using CyberMONITOR
The Find Server button will access the RIP Table information for a server that you select in the
SAP T able. Show All, in the IPX Service Types drop down list will display all of the serv ers in the
SAP Table with options allowing you to display only file servers, job servers, print servers, etc.
The File menu item lets you access either Print (prints the table), or Close, (closes window).
IPX Per Interface Table
Figure 3-19, below, shows the IPX Per Interface Table. To access the IPX Per Interface table, click
on the IPX Routing Panel on the Primary Monitor Window (see Figure 3-3).
IPX Per Interface Data
The IPX Per Interface table shows IPX Routing statistics sorted by Interface Number. The data
displayed is described below:
Interface Number - logical interface number.
Alias - an alias name that you assign to an interface.
In Packets - Input to the interface for the lifetime of the interface.
Packets Forwarded - Total packets forwarded through the interface for the lifetime of the
interface (some packets are discarded for various reasons).
Packets Filtered -Total packets that are filtered for any reasons, (lifetime of the interface).
Packets Discarded - Total packets discarded for any reason, for the lifetime of the interface.
Out Packets - Total packets out for the lifetime of the interface.
CyberMONITOR User’s Guide 3-27
Figure 3-19 IPX Per Interface Table
Page 62

Chapter 3: Using CyberMONITOR
IPX Event Log
The IPX Event Log Window (Figure 3-21 on the following page) is a record of IPX Routing
events, or device status changes. The events are listed in tabular form, and can be sorted by
Interface Number, Event Type, or Severity. Aliases and event times are listed, in addition to a
description of the event. To access the IP Event Log, click the IPX Event Log menu item under
IPX, in the Tables menu as shown in Figure 3-20 below.
When IPX Events are sorted by event type, similar events will be grouped together. When IPX
Events are sorted by severity, there are three levels: low, medium, and high, with high having the
highest priority. Sorting by Interface Numbers will be done lowest number first.
Clicking the Refresh Button refreshes the window with a new set of data. Before you can log IPX
Events, you must enable IPX Event Logging by clicking on the Enable IPX Event Logging
checkbox. Click the Close button when you wish to end an IPX Event Log session.
3-28 CyberMONITOR User’s Guide
Figure 3-20 IPX Tables Menu
Page 63

Using CyberMONITOR
Figure 3-21 IPX Event Log Window
Inverse MUX Data Table
Figure 3-22, on the following page, sho ws the Inverse MUX (Multiplexing) Data Table. To access
the Inverse MUX Data Table, click on the Inverse MUX menu item in the Tables menu on the
Primary Monitor Window (see Figure 3-3). Note that the Inverse MUX menu item will be grayed
out unless Inverse Multiplexing is enabled on the monitored device.
CyberMONITOR User’s Guide 3-29
Page 64

Chapter 3: Using CyberMONITOR
Figure 3-22 Inverse MUX Data Table
Inverse Multiplex Table Data
The Inverse Multiplex Table shows the interfaces selected to perform the inverse multiplex
function. Inverse Multiplexing combines two channels to share the bandwidth utilization load.
The BW Available column shows the available bandwidth of each interf ace. Ideally, each interface
should have the same available bandwidth, but this is not always the case.
The Byte Count column sho ws the total byte count for the lifetime of the device (for as long as the
Inverse Multiplex function has been active).
The File menu item lets you access either Print (prints the table), or Close, which closes the table
window.
3-30 CyberMONITOR User’s Guide
Page 65

Using CyberMONITOR
Frame Relay Statistics Table
Figure 3-23, below, shows the Frame Relay Statistics Table. The Frame Relay statistics table
shows Frame Relay statistics sorted by DLCIs (Data Link Connection Identifiers). DLCIs are the
indentifying numbers for switched virtual connections. To access the Frame Relay Statistics Table,
click on the Frame Relay menu item in the Tables menu of the Primary Monitor Window (See
Figure 3-3).
Figure 3-23 Frame Relay Statistics Table
Frame Relay Statistical Data
The Frame Relay Statistics Panel shows the following statistics on Data Link Connection
Identifiers (DLCIs):
DLCI - The Data Link Connection Identifier is a number identifying a particular switched
virtual connection. Each DLCI is given a unique number when the connection is created.
FECNs - Number of frames received from the network indicating forward congestion (since
the virtual circuit was created).
BECNs - Number of frames received from the network indicating a backward congestion
(since the virtual circuit was created).
Bytes Out -Total bytes out for the life of the virtual connection.
Bytes In - Total bytes in for the life of the virtual connection.
CyberMONITOR User’s Guide 3-31
Page 66

Chapter 3: Using CyberMONITOR
Committed Burst - The maximum amount of data on the network during a time interval,
without the network discarding any data.
Excess Burst - The maximum amount of data allowed to exceed the Committed Burst (there is
no guarantee that this data will be passed by the network - it may be discarded).
Throughput - A device's committed transfer rate.
The File menu item lets you access either Print, (prints the table to a file), Refresh, which reloads
the Frame Relay table, or Close, which closes the table window.
Traps
Figure 3-24, below, shows the Traps Menu, selected by clicking the Traps menu item from the
Menu Bar.
Figure 3-24 Traps Menu Item
The Traps Destination Configuration window shown in Figure 3-25, displays when you click on
the Con
figure Traps menu item in the Traps pull-down menu. This menu lets you set up your PC
(via its IP Address) as the destination for traps generated by the device you are monitoring. You
can set other additional IP Addresses (up to eight) as recipients of traps generated by the device
you are monitoring.
The Trap Destination Configuration window shows the IP Addresses of devices designated as
destinations to receive traps. The state of each designated trap receiver (Enabled or Disabled) is
shown in the right hand column.
The Add, Delete, and Modify buttons are used to add, delete, or modify existing entries in the
table of IP Addresses of trap destinations. The Add button displays the Add Trap Destination
window shown in Figure 3-26 on the following page. Enter the IP Address of the device that is to
receive traps, and click the Enable Trap checkbox to enable trapping. The Delete button deletes
the item that is highlighted in the Trap Destination Configuration window.
3-32 CyberMONITOR User’s Guide
Page 67

Using CyberMONITOR
Figure 3-25 Trap Destination Configuration Window
Figure 3-26 Add Trap and Modify Trap Windows
CyberMONITOR User’s Guide 3-33
Page 68

Chapter 3: Using CyberMONITOR
The Modify button (see Figure 3-25) lets you modify the IP Address or state (enabled, or
disabled) of the item highlighted in the Trap Destination Configuration window. The Modify
button displays the Modify Trap Destination window shown in Figure 3-26 on the previous page.
Click OK when you have finished with the Add, or Modify windows to save the changes.
The T rap Agent Window displays when you click on the V
iew T raps pull down menu item shown
in Figure 3-24.
The device (that you have configured to receive traps from) IP Address is shown in the table of
addresses. If you click the Any Device check box, you will be able to receive traps from any
device on the subnet that you have configured (to send you traps).
The Add button on the Trap Agent Window displays the Add Agent window (shown in
Figure 3-28). In the Add Agent window, enter the IP Address and Community Name (password)
of the trap agent you wish to receive traps from. Click OK when you have finished entering the
data to open the Trap Events window. The Exit button lets you exit the Trap Agent Window, and
return to the primary monitor window.
3-34 CyberMONITOR User’s Guide
Figure 3-27 Trap Agent Window
Page 69

Figure 3-28 Add Agent Window
Using CyberMONITOR
CyberMONITOR User’s Guide 3-35
Page 70

Chapter 3: Using CyberMONITOR
Figure 3-29 Trap Events Window (left side)
3-36 CyberMONITOR User’s Guide
Page 71

Using CyberMONITOR
Figure 3-30 Trap Events Window (right side)
The Trap Events Window shown in Figure 3-29 on the previous page, and Figure 3-30 above,
displays when you click OK on the Trap Agent Window. Traps received are displayed in
chronological sequence (most recent at the top) in the Trap Events Window. Traps are also
uniquely identified by a trap number, shown at the far right of the Trap Events Window. A scroll
bar at the bottom of the window lets you access the right half of the trap events data field. The
following information is displayed in the Trap Events window:
• Time and Date are recorded in the left-hand column of the trap events table.
• IP Address of the device generating the trap event.
• The trap description - including the mode such as IP Routing. More information about the trap
is displayed at the left of the bottom panel in the Trap Events window.
• Trap Number - the unique identifier of each trap event.
Clicking the Clear button clears all data from the Trap Events window. The Acknowledge Traps
button resets the flashing alert mode when the Trap Events window is minimized.
CyberMONITOR User’s Guide 3-37
Page 72

Chapter 3: Using CyberMONITOR
ISDN Call History/Backup
The ISDN Call History/Backup Window (Figure 3-32 on the following page) is a record of ISDN
calls and corresponding device status. To access the ISDN Call History/Backup Window , click the
ISDN/Backup menu item, in the Tables menu as shown in Figure 3-31 below.
Figure 3-31 ISDN/Backup Tables Menu Item
The ISDN Call History/Backup window is comprised of two panels: an ISDN Call History panel,
and the Current Interface Backups panel (see Figure 3-32, and Figure 3-33).
ISDN Call History Panel
The ISDN Call History panel displays the following statistics:
Interface Number — The logical interface number for the call statistics shown.
Assigned as Backup — Is this interface assigned as a backup interface, YES, or NO.
Setup Time hh.mm.ss — The amount of time required to set up, prior to the actual connection,
stated as; hours, minutes, and seconds. This is calculated from the transmission or receipt of a
setup message.
3-38 CyberMONITOR User’s Guide
Page 73

Using CyberMONITOR
Connect Time hh.mm.ss — The time that the connection was established, stated as; hour,
minute, and second.
Disconnect Time hh.mm.ss — The time that the connection was taken down, or disconnected
stated as; hour, minute, and second.
Figure 3-32 ISDN Call History/Backup Window (left side)
Call Length hh.mm.ss — The duration of the connection stated as; hours, minutes, and seconds.
Disconnect Cause — Cause of disconnect, i.e., type of error or type of intentional disconnect.
Call Number — The number you are connecting to, as originator, call back, or answer.
CyberMONITOR User’s Guide 3-39
Page 74

Chapter 3: Using CyberMONITOR
Call Origin — Originate, Call Back, or Answer.
Info T ype — Call data type; other, speech, digital, audio, video, etc.
Transmitted Bytes — The amount of data transmitted by your interface in bytes, kilobytes, or
megabytes over the duration of the call. (from connect time to disconnect time).
Received Bytes — The amount of data received by your interface in bytes, kilobytes, or
megabytes over the duration of the call. (from connect time to disconnect time).
Transmitted Packets — The amount of data (in packets) transmitted by your interface over the
duration of the call. (from connect time to disconnect time).
Received Packets — The amount of data (in packets) received by your interface over the
duration of the call. (from connect time to disconnect time).
Figure 3-33 ISDN Call History/Backup Window (right side)
3-40 CyberMONITOR User’s Guide
Page 75

Using CyberMONITOR
ISDN/Backup Panel
The ISDN/Backup panel (see Figure 3-33 on the previous page) is a list of ISDN interface
numbers, and aliases and whether they are used as backup ISDN interfaces. ISDN can be used as a
backup medium for any WAN WPIM interface. ISDN is the preferred medium for the purpose of
backup because of its comparatively low cost.
The ISDN/Backup Panel displays the following statistics:
Interface Number — The logical interface number of an ISDN interface which may or may not
be used as a backup for another WAN logical interface.
Alias — The Alias name of the interface number.
Interface in use as Backup — YES, if this interface is used as a backup, otherwise, NO.
Backup Interface Number — The logical interface number of the WAN interface being backed
up by the ISDN interface.
ISDN/Backup File Menu
The ISDN/Backup File Menu is shown below in Figure 3-34. Save ISDN Log to a File saves the
contents of the ISDN Log table to a file that you specify.
Load ISDN Log from a file loads the data in the file into the ISDN Log table for viewing.
Print Backups and Print ISDN Log will print the data to your designated printer. Close closes the
ISDN Call History/Backup window. Help displays the Help topic for the ISDN Call History/
Backup window.
CyberMONITOR User’s Guide 3-41
Figure 3-34 ISDN/Backup File Menu
Page 76

Chapter 3: Using CyberMONITOR
3-42 CyberMONITOR User’s Guide
Page 77

4
Troubleshooting
SNMP Errors
The following messages are representative of a large class of SNMP errors.
• “Unsupported Windo ws Version”
• “Unexpected error =. . . . . . ”
• “SNMP Error . . . . . . . ”
SNMP Errors are critical, and may cause program termination or at least erratic behavior.
Possible causes are incorrect firmware version, or packet errors to the monitored device.
Connection Errors
The following message indicates a possibility of a number of “connection errors” relating to the
connection to the monitored device.
• The device being monitored may be down, or e xcessi ve netw ork traf fic caused the query not to
reach its destination. Press Retry to retry the device, or Cancel to exit.
This error is self explanatory. Most of the time the connection to the device has been interrupted
for some reason such as network problems, or the device has been powered down, etc.
Recheck the IP Address and Community Name for the device that you are trying to connect to.
User Cannot Communicate with Remote Network Station
If Bridging,
• Check that the Bridging Default Destination is set.
• Check that bridging to/from the remote router is set on.
• Be sure to reboot if you have made any bridging destination or control changes.
CyberMONITOR User’s Guide 4-1
Page 78

Chapter 4: Troubleshooting
If TCP/IP routing,
• Check that TCP/IP Routing is set on and is enabled at the remote end.
• Check that the IP address of the LAN beyond the remote router is correct, as well as the
associated Subnet Mask.
• If the remote router WAN IP address and Subnet Mask are required, check that they have been
specified correctly.
• Check that, if required, the source and remote WAN IP addresses are on the subnetwork.
• Check that you have seeded the routing table, if RIP is not allowed to flow on the WAN link.
• Be sure to reboot if you have made any IP address, control or protocol option changes.
4-2 CyberMONITOR User’s Guide
Page 79

A
10BASE-T — IEEE 802.3 standard for the use of Ethernet LAN technology over Unshielded
Twisted Pair wiring, running at 10 Mbps.
AIS — DS-1 Line Status Error condition - The Alarm Indication Signal Failure is declared when
an AIS defect is detected at the input, and the AIS defect still exists after the Loss of Frame failure,
which is caused by the unframed nature of the “all-ones” signal. The AIS failure is cleared when
the Loss of Frame failure is cleared.
ARP — Address Resolution Protocol. An Internet protocol used to bind an IP address to Ethernet/
802.3 addresses.
ASCII — American Standard Code for Information Interchange. It is an 8-bit code for character
representation.
AUI — Attachment Unit Interface. An IEEE 802.3 transceiver cable connecting the network
device (such as a router) to the MAU (media access unit).
Glossary
Bandwidth on Demand — Feature providing the capability of adjusting the bandwidth (opening
or closing multiple B channels) when the load in traffic increases or decreases.
Bridge — A device that segments network traffic. A bridge maintains a list of each node on the
segment and only traffic destined for a node on the adjacent se gment is passed across the bridge. A
bridge operates at Layer 2 of the OSI reference model.
B Channel — In ISDN, a full-duplex, 64 Kbps channel used for sending user data. Also known
as a “Clear Channel”. Some B channels only achieve 56 Kbps due to in-band signaling which uses
some of the available bandwidth.
BESs — Bursty Errored Seconds - a DS-1 Line Status Error condition. A second with fe wer than
320 and more than one Path Coding Violation error events, no SEFSs (Severely Errored Framing
Seconds), and no detected incoming Alarm Indication Signal defects.
BRI — Basic Rate Interface. The ISDN interface providing two 64 Kbps B channels for voice,
data and video transmission and one 16 Kbps D channel for signaling and data transmission.
CyberMONITOR User’s Guide A-1
Page 80

Appendix A: Glossary
CHAP — Challenge Handshake Authentication Protocol. A security protocol supported under
point-to-point protocol (PPP) used to prevent unauthorized access to de vices and remote networks.
Uses encryption of password, device names and random number generation.
CSSs — Controlled Slip Seconds - a DS-1 Line Status Error condition. A one second interval
containing one or more Controlled Slips (replication or deletion of the payload bits of a DS-1
frame). A Controlled Slip may be performed when there is a timing difference between a
synchronous receiving terminal and the receiv ed signal. A Controlled Slip does not cause an Out of
Frame defect.
DCE — Data Communications Equipment. Equipment used within a network to transfer data
from source to destination such as modems.
D Channel — In ISDN, a full-duplex 16 Kbps channel used for link setup and signaling.
Data Compression — Techniques used to reduce the number of bits transferred across the
communication links that represent the actual data bits. Compression is used to optimize use of
WAN links and speed data transmission.
DHCP — Dynamic Host Configuration Protocol is a protocol for automatic TCP/IP configuration
that provides static and dynamic address allocation and management.
Dial on Demand — Dial up WAN resources are accessed only when remote access is required
and released as soon as the resource is no longer needed.
DTE — Data Terminating Equipment. DTE refers to equipment used in a network as the data
source and/or destination, such as computers.
DTMF — Dual Tone Multi-Frequency. TOUCHTONE as opposed to Dial Pulse (DP).
DTR — Data Terminal Ready. RS232 signal used for indicating to the DCE the readiness to
transmit and receive data.
ESs — Errored Seconds - DS-1 Line Status Error condition, indicating seconds with one or more
Path Code Violations, or one or more Out of Frame defects, or on or more Controlled Slip events,
or a detected AIS (Alarm Indication Signal Failure) defect.
EtherTalk — AppleTalk protocols running on Ethernet.
Filter — Feature to control the flow of data based on protocol or bridge information. Filters can
be specific to allow data through or prevent transmission.
A-2 CyberMONITOR User’s Guide
Page 81

Glossary
Firewall — A combination of techniques used to protect one network from unknown networks
and users on the outside. Firewalls can filter or block traf fic and act as a management and netw ork
security point where all traffic can be scrutinized.
DTE — Data Terminal Equipment. DTE refers to equipment used in a network as the data source
and/or destination, such as computers.
DTR — Data Terminal Ready. RS232 signal used for indicating to the DCE the readiness to
transmit and receive data.
DMs — Degraded Minutes - a DS-1 Line Status Error condition. Minutes in which estimated
error rate exceeds 1E-6, but not 1E-3.
EtherTalk — AppleTalk protocols running on Ethernet.
Filter — Feature to control the flow of data based on protocol or bridge information. Filters can
be specific to allow data through or prevent transmission.
Firewall — A combination of techniques used to protect one network from unknown networks
and users on the outside. Firewalls can filter or block traf fic and act as a management and netw ork
security point where all traffic can be scrutinized.
Frame — A group of data generated by Data Link Layer operation.
In-Band Signaling — Transmission within the frequency range used for data transmission; i.e.,
results in use of bandwidth normally reserved for data.
IP Address — Internet address. A 32-bit address assigned to de vices that participate in a network
using TCP/IP. An IP address consists of four octets separated with periods defining network,
optional subnet and host sections.
IPX (Internet Packet Exchange) — A proprietary Network layer protocol developed by Novell
and used in NetWare networks.
ISDN — Integrated Services Digital Network. Digital transmission standard defining
communication protocols permitting telephone networks to carry data, voice, fax and other
streams.
LCVs — Line Coding Violation error events - a DS-1 Line Status Error condition. The occurrence
of either a Bipolar Violation (BPV), or Excessive Zeroes (EXZ) error event.
CyberMONITOR User’s Guide A-3
Page 82

Appendix A: Glossary
Leased Line — A telecommunications line between two service points leased from a
communications carrier for private use, usually incurring a monthly service rate.
LEDs (Light Emitting Diodes) — Type of indicator lights on the panel of a device.
LESs — Line Errored Seconds - a DS-1 Line Status Error condition. Line Errored Seconds are
seconds with one or more Line Code Violation error events.
Local Area Network (LAN) — A network connecting computers over a relatively small
geographic area (usually within a single campus or building).
MAC Layer/Address — Media Access Control layer/address defined by the IEEE 802.3
specification which defines media access including framing and error detection. Part of the OSI
reference model Data Link layer.
Metric — An algorithm used by routers to determine the best path for transmitting packets to a
remote destination based on considerations such as time, delay, cost, etc.
Modem — Modulator/Demodulator . A de vice that converts digital signals to/from analog signals
for transmission over analog communications lines.
Multi-Link Protocol — A protocol, defined in RFC 1717, that defines a way to perform inverse
multiplexing on the TCP/IP point-to-point protocol (PPP); i.e., the ability to use multiple serial
WAN channels for transferring one datastream. With MLP, a user can send and receive data over
both B channels in an ISDN basic-rate interface connection
NAT — Network Address Translation uses a unique IP address for a WAN interface. This IP
Address is negotiated through PPP or assigned statically by the Internet Service Provider (ISP).
NAT reduces the number of unique IP addresses for all clients using a particular WAN interface to
one.
NetWare — A Network Operating System developed by Novell, Inc. providing shared access to
files and other network services.
Network Layer — Layer 3 of the OSI reference model that provides the protocol routing
function.
Node — Refers to a termination point for communication links; entity that can access a network.
OSI — Open System Interconnection. An international standard developed by ITU (formally
CCITT) and ISO (International Organization for Standardization) to facilitate data networking
A-4 CyberMONITOR User’s Guide
Page 83

Glossary
multi-vendor interoperability. The OSI Reference Model defines seven layers, each providing
specific network functions.
Packet — A group of data that includes a header and usually user data for transmission through a
network.
PCVs — Path Coding Violations - a DS-1 Line Status Error condition. Path Coding Violations are
caused by a Frame Synchronization Bit Error in the D4, and E1-no CRC formats, or a CRC error
in the ESF, and E1-CRC formats.
Ping (Packet Internet Groper) — An echo message, available within the TCP/IP protocol suite,
sent to a remote node and returned; used to test the accessibility of the remote node.
PPP (Point-to-Point Protocol) — A Data Link layer protocol that provides asynchronous and
synchronous connectivity between computer/network nodes. Includes standardization for security
and compression negotiation.
Q.921 — ISDN Data Link layer specification for the user-to-network interface.
Q.931 — ISDN specification for call set-up and signaling on ISDN connections.
RFC — Request for Comment. Documentation describing Internet communications
specifications (e.g., Telnet, TFTP). Often these RFCs are used to achieve multi-vendor
interoperability during implementation.
RJ11 — Standard 4-wire connectors for telephone lines.
RJ45 — Standard 8-wire connectors used for ISDN lines and 10 BASE-T connections.
RIP (Routing Information Protocol) — Protocols used in IP and IPX for broadcasting open path
information between routers to keep routing tables current.
Routing — A Network layer function that determines the path for transmitting packets through a
network from source to destination.
RS-232 — EIA standard specifying the physical layer interface used to connect a device to
communications media.
SEFs — Severely Errored Framing Seconds - a DS-1 Line Status Error condition. Severely
Errored Framing Seconds are seconds with one or more Out of Frame defects, or a detected AIS
(Alarm Indication Signal Defect).
CyberMONITOR User’s Guide A-5
Page 84

Appendix A: Glossary
Serialization Frames — Frames sent out by servers under IPX to check whether illegal copies of
NetWare are in use on the network.
Service Advertising Protocol — Protocol used in IPX for broadcasting information about
services available on the network, such as file servers, CD-ROM drives and modem pools.
SESs — Severely Errored Seconds - A DS-1 Line Status Error condition. Severely Errored
Seconds are seconds (for ESF signals) with 320 or more Path Code V iolation Error Events, or one
or more Out of Frame defects, or a detected AIS (Alarm Indication Signal failure) defect. For
E1-CRC signals, a Severely Errored Second contains 2048 LCVs (Line Coding Violation Error
Events) or more.
SNMP — Simple Network Management Protocol. A widely implemented Internet network
management protocol that allows status monitoring, getting/setting of parameters for configuration
and control of network devices, such as routers and bridges.
Split B Channels — Each 64 Kbps ISDN B-channel can be used individually for a separate data
connection.
Spoofing — Spoofing is a technique used to remove poll and update service frames from WAN
links while ensuring that the network continues to operate normally. Spoofing is employed to
minimize dial-up line connection time.
Subnet Address — An extension of the Internet 32-bit addressing scheme that allows the
separation of physical or logical networks within the single network number assigned to an
organization. TCP/IP entities outside this organization have no knowledge of the internal
“subnetting.”
Subnet Mask — A 32-bit internet protocol address mask used to identify a particular
subnetwork.
TCP/IP — Transmission Control Protocol/Internet Protocol. Refers to a set of internetworking
protocols developed by the U.S. Department of Defense that define a two level layered approach
for interoperability. TCP provides a connection-oriented Transport layer ensuring end-to-end
reliability in data transmission. IP provides for Network layer connectivity using connectionless
datagrams.
Telco Cloud — The “cloud” of switched virtual connections over a Wide Area Network (WAN).
A-6 CyberMONITOR User’s Guide
Page 85

Glossary
TELNET — Internet standard protocol for remote terminal emulation that allows a user to
remotely log in to another device and appear as if directly connected.
TFTP — Trivial File Transfer Protocol. A simplified version of the File Transfer Protocol (FTP)
allowing for file transfer between computers over a network.
Transparent Bridging — Bridging technique used in Ethernet networks that allows transfer of
frames across intermediate nodes using tables associating end nodes with bridging addresses.
Bridges are unknown to the end nodes.
UASs — Unavailable Seconds - a DS-1 Line Status Error condition. UASs are seconds that the
interface is unav ailable, from the onset of 10 contiguous Se v erely Errored Seconds, or the onset of
a condition leading to a failure. While the interface is unavailable, the only count incremented by
the SNMP Agent is UASs.
UDP — User Datagram Protocol. A connectionless protocol used to pass packets across an
internet network, requiring no handshaking between source and destination.
Watchdog Frames — Frames sent out by servers to clients, under IPX, to verify that clients are
still logged on.
Wide Area Network — A communications network that is geographically dispersed thus
requiring links provided by communications carriers.
Workstation — Computer or terminal used by the systems administration or user.
CyberMONITOR User’s Guide A-7
Page 86

Appendix A: Glossary
A-8 CyberMONITOR User’s Guide
 Loading...