

Page 1

BusinessObjects Set Analysis User
Guide
BusinessObjects Set Analysis 3.0
Windows
Page 2

Copyright
© 2008 Business Objects. All rights reserved. Business Objects owns the following
U.S. patents, which may cover products that are offered and licensed by Business
Objects: 5,555,403; 5,857,205; 6,289,352; 6,247,008; 6,490,593; 6,578,027;
6,831,668; 6,768,986; 6,772,409; 6,882,998; 7,139,766; 7,299,419; 7,194,465;
7,222,130; 7,181,440 and 7,181,435. Business Objects and the Business Objects
logo, BusinessObjects, Business Objects Crystal Vision, Business Process On
Demand, BusinessQuery, Crystal Analysis, Crystal Applications, Crystal Decisions,
Crystal Enterprise, Crystal Insider, Crystal Reports, Desktop Intelligence, Inxight,
the Inxight Logo, LinguistX, Star Tree, Table Lens, ThingFinder, Timewall, Let
there be light, Metify, NSite, Rapid Marts, RapidMarts, the Spectrum Design, Web
Intelligence, Workmail and Xcelsius are trademarks or registered trademarks in
the United States and/or other countries of Business Objects and/or affiliated
companies. All other names mentioned herein may be trademarks of their respective
owners.
Third-party
Contributors
Business Objects products in this release may contain redistributions of software
licensed from third-party contributors. Some of these individual components may
also be available under alternative licenses. A partial listing of third-party
contributors that have requested or permitted acknowledgments, as well as required
notices, can be found at: http://www.businessobjects.com/thirdparty
2008-02-19
Page 3

Contents
Set Analysis 7Chapter 1
Sets 9Chapter 2
When are sets useful?...............................................................................11
Viewing sets in Set Analysis......................................................................11
Creating a set in Set Analysis....................................................................15
Set membership in Set Analysis................................................................30
Creating a set folder in Set Analysis....................................................12
Creating a group in Set Analysis..........................................................12
Set group types....................................................................................13
Defining a set.......................................................................................15
Building a set........................................................................................18
Set-building options in Set Analysis.....................................................27
Emptying a set in Set Analysis.............................................................29
Removing a set....................................................................................29
Dependencies in Set Analysis sets......................................................29
Editing a set in Set Analysis.................................................................29
Export lists 31Chapter 3
Set Analysis List feature............................................................................32
Defining a set list in Set Analysis.........................................................32
Set analytics 35Chapter 4
Configuring a Membership, Migration or Multi-set Same Time Events
analytic.......................................................................................................36
BusinessObjects Set Analysis User Guide 3
Page 4

Contents
Choosing a set metric for the Metrics Overview, Membership, Migration or
Multi-Set Same Time Events analytic........................................................37
Membership...............................................................................................37
Migration....................................................................................................38
Multi-set Same Time Events......................................................................38
What are multi-set metrics?..................................................................38
Profiler.......................................................................................................40
Configuring the Profiler analytic...........................................................40
Visual Data Counts analytic.......................................................................41
Configuring the Visual Data Counts analytic........................................42
Set analytics in the Analytic Catalog.........................................................45
Membership breakdown.......................................................................46
Migrants compare.................................................................................46
Migration by tier....................................................................................46
Multi set scatter....................................................................................46
Percent of group total...........................................................................47
Percent of enterprise............................................................................47
Set compare.........................................................................................47
Set vs enterprise..................................................................................48
Set vs group average...........................................................................48
Set vs group total growth......................................................................48
Set vs group turnover...........................................................................48
Linking from goal, universe query and metric-based analytics..................49
Linking to multiple documents from an analytic based on a goal, metric
or universe query..................................................................................49
Linking from a goal, metric or universe query-based analytic to a document
or analytic.............................................................................................51
Using variables for dynamic links to documents..................................52
Sending information to the Viewer analytic in a dashboard using
openAnalytic.........................................................................................98
Individual Set Analysis analytics..............................................................100
Profiler................................................................................................100
4 BusinessObjects Set Analysis User Guide
Page 5

Contents
Individual portrait................................................................................101
Current membership...........................................................................101
Membership history............................................................................101
Membership summary........................................................................102
Sample metrics analytics for set analysis..........................................103
Set Analysis Terms..................................................................................105
What is a broken stayer?....................................................................105
What is a continuous stayer?.............................................................105
What is a fast count?..........................................................................105
What is a joiner?.................................................................................105
What is a leaver?................................................................................106
What is migration?..............................................................................106
What is an object tree?.......................................................................106
What is retention?..............................................................................107
What is a sampling?...........................................................................107
What is segmentation?.......................................................................107
What is a stayer?................................................................................107
What is a subject?..............................................................................108
What is turnover?...............................................................................108
Set Analysis Terms 109Chapter 5
What is a broken stayer?.........................................................................110
What is a continuous stayer?..................................................................110
What is a fast count?...............................................................................110
What is a joiner?......................................................................................110
What is a leaver?.....................................................................................111
What is migration?...................................................................................111
What is an object tree?............................................................................111
What is retention?....................................................................................111
What is a sampling?................................................................................112
What is segmentation?............................................................................112
BusinessObjects Set Analysis User Guide 5
Page 6

Contents
What is a stayer?.....................................................................................112
What is a subject?...................................................................................112
What is turnover?.....................................................................................113
Get More Help 115Appendix A
Index 119
6 BusinessObjects Set Analysis User Guide
Page 7

Set Analysis
1
Page 8

Set Analysis
1
In BusinessObjects Set Analysis you work sets and export lists.
8 BusinessObjects Set Analysis User Guide
Page 9

Sets
2
Page 10

Sets
2
When are sets useful?
Sets allow you to define complex selections and custom groupings of
customers, products or other individual items in a database.
Sets allow you to identify and target groups of clients based on criteria that
source data allow you to specify. For instance, you may want to select all
clients living in a particular geographic area who own homes, are below a
certain age, and have children.
Sets have the following attributes:
• Sets contain items based on a single subject that determines the primary
key.
• Sets are uniquely identified by name, folder and author.
• Sets can have a description.
• Sets have a last modified date.
• Sets are allocated to a folder.
• Sets contain a count of the members if the set has been built. Otherwise
it just has a definition.
• Sets contain members that can accumulate a score based on the
weightings you define.
• Sets can be processed from many steps, each step based on a single
table or view.
The subject defines the central theme for the sets which are based on it. A
set can contain data for only one subject; for example, customers, accounts
and products. In the context of a customer subject, you can define sets that
include conditions based on the various tables and views that describe the
customer entity.
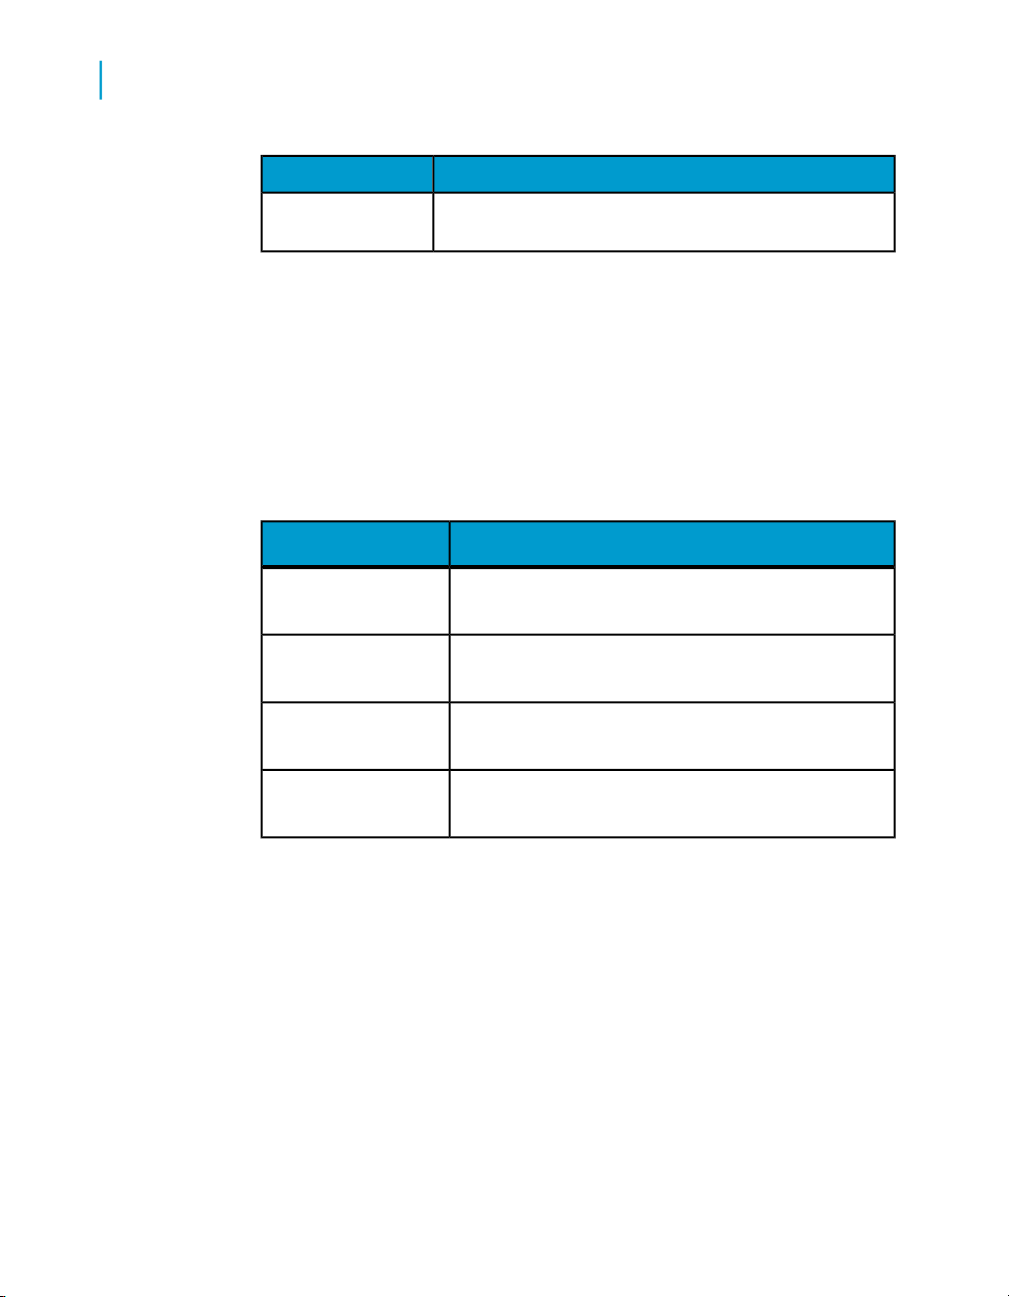
Customers can be classified, analyzed and treated in different ways using
set techniques. You can create broad or specific sets to categorize customers
in ways that are relevant. The following is an example of the link between
subject area, sets and subsets:
10 BusinessObjects Set Analysis User Guide
ExampleLevels
CustomerSubject Area
Single SetSet Group
CollectorSet
Member, Joiners, LeaversSubject
Page 11

Individual Sets and Set Groups reside in a Set Analyzer repository. Individual
Sets can belong to Set Groups, and Set Groups generally contain more than
one individual set. Grouping sets can be a useful way of classifying and
organizing sets into meaningful categories to facilitate analysis.
Sets can be scheduled. Refer to the Dashboard Builder documentation for
more details.
When are sets useful?
Sets help you understand how groups and segments contribute to overall
performance by simplifying and accelerating the data segmentation process.
Sets can help you address the following types of business questions:
• turnover
• cross-selling
• customer scoring (ranking)
• data sampling
• segment interaction
• list management
• marketing stratification
Sets
When are sets useful?
2
Viewing sets in Set Analysis
You can perform the following functions from the Sets tab of Set Analysis:
• View the list of existing sets
• Delete a set
• Name and describe sets
• Define the current set
• Create a set
• Create a folder
• Define set scope
• Access and create Groups
• Create taxonomic groups and rebuild (processing) groups
BusinessObjects Set Analysis User Guide 11
Page 12

Sets
2
Viewing sets in Set Analysis
Creating a set folder in Set Analysis
A folder contains sets and groups. Folders enable you to manage your sets
effectively.
Note: You cannot delete a folder if it contains sets. To delete a folder, you
must first delete the sets it contains.
1. In Set Analysis > Sets, click Add.
2. Select New Folder.
3. Enter the following information:
• Name
• Description
• Folder audience (indicates which user groups can access the folder
and the sets it contains)
4. Click Apply.
The new folder is displayed in the list of available sets, folders and groups.
Creating a group in Set Analysis
1. In Set Analysis > Sets, click Add.
2. Select New Group.
3. Designate the following attributes for the group:
• name
• the folder to which the group belongs
• type: distinct, taxonomic or rebuild
4. Click Apply.
The new group appears in the list of available sets, folders and groups.
Related Topics
• Set group types on page 13
12 BusinessObjects Set Analysis User Guide
Page 13

Set group types
The set group types are:
• Distinct
• Rebuild
• Taxonomic
Distinct groups in Set Analysis
Distinct Groups allow you to group sets and ensure that there is no overlap
between them. Set Analysis creates a list of members that removes any
duplication. If you create several mailing campaigns, you want to ensure that
no contact is mailed more than once. The distinct model allows you to define
a priority for each set and ensure that each member is allocated to only one
set.
Once the sets have been added to the group it is ready for processing. The
group is processed on creation, after one of the following events:
• a set is added to or subtracted from the group
• the build order is changed
• the display order is changed
• one of the sets within the group is refreshed. In this case, the group is
refreshed automatically.
Sets
Viewing sets in Set Analysis
2
Note: Refreshing a set that is part of a distinct model can be a lengthy
process, because the group is refreshed as a part of the refresh process.
The system displays a warning dialogue box before the group is
reprocessed.
Selecting a distinct group in Set Analysis
1. In Set Analysis > Sets do one of the following:
• Click Add > New Group to create a group . Select the new group and
click Edit.
• Select a group and click Edit.
2. Add sets to the group.
3. Optionally, reorder the sets according to:
BusinessObjects Set Analysis User Guide 13
Page 14

Sets
2
Viewing sets in Set Analysis
Build Order: changes the order in which the sets are built. The order
•
in which sets are listed as component items for a group determines
the priority order for the calculation of distinct items. The group is made
up of all the items from the first set, plus the items from subsequent
sets not already been allocated to the group. The first set has the
highest priority.
• Display Order: changes the display order for the sets.
Rebuild groups in Set Analysis
This is a group of sets with or without similar content that can be refreshed
at a defined time interval. At refresh time, the dependencies are taken into
account.
A rebuild group can be scheduled and all sets under it are taken into account.
For example, if set A is dependent on Set B before it is refreshed, rebuild
type group takes care of that.
Rebuild groups allow you to group sets to be processed and reprocessed
together. For example, if you have processed a final set which has been
processed from several other sets, you need to reprocess all the other sets
first, and ensure that each dependent set has finished processing, before
reprocessing the final set.
This can be a lengthy task. Building a processing group allows you to group
all the sets together and let Set Analysis decide which sets to process in
which order.
Note: If any sets within the group are rebuilt manually, outside of the context
of the group, the system reprocesses the whole group.
Building a rebuild group
1. In Set Analysis > Sets do one of the following:
• Click Add > New Group to create a group . Select the new group and
click Edit.
• Select a group and click Edit.
2. On the Add Set page, add and remove sets.
3. Click OK.
14 BusinessObjects Set Analysis User Guide
Page 15

Note: Child sets are automatically added to the group to which their
parent sets are assigned. Parent sets are placed above their child sets
in the processing order.
4. Click Process Group to process the group.
Taxonomic groups in Set Analysis
This is also a group of set for classification and analysis purpose. Taxonomic
groups cannot be scheduled but can be used as a way of classifying sets in
all places where sets can be selected in a tree list. These groups are also
used in group benchmark analytic. For example, if you want to group all sets
related to high income spenders then you can define the group as taxonomic
and add the relevant sets to the group.
Creating a set in Set Analysis
Creating a set involves two steps:
• Defining a set
• Building a set
Sets
Creating a set in Set Analysis
2
Defining a set
1. In Set Analysis > Sets, click Add.
2. Select New Set.
3. Enter the name of the new set.
Each set must have a name that identifies it for later operations. The
name must be unique in the folder. If you want to use the same name for
two sets, you must allocate them to different folders.
4. Select a folder.
5. Select a build strategy for the set:
• System default
• Stepwise only
• Combination (where possible)
6. Select the Scope of the set.
BusinessObjects Set Analysis User Guide 15
Page 16

Sets
2
Creating a set in Set Analysis
7. Add any descriptive notes about the set, and assign one of the following
Public sets are visible to all users and private sets are available only to
the person who created them. When you create a set and allocate it to a
public folder, the scope is defined as public. When you create a set and
allocate it to a private folder, the scope is defined as private.
descriptions if appropriate:
• Frozen
If you select Frozen, neither the set owner nor any other user can
change or reprocess the set. To change or reprocess the set in the
future, deactivate this field. This flag is useful when creating a snapshot
set that must not be reprocessed, for example, a specific mailing
campaign.
• External
Selecting External indicates that the set was created by an external
action. Use the option if set membership is calculated and managed
by some other application. The other application can create a set and
store it within the repository.
• Terminal
Select Terminal so that the set is not used as the starting point for any
other set.
Note: You cannot use a terminal set within the Visual sets view.
8. Specify whether the set is Dynamic or Static:
• Static sets are snapshots that store data of a given moment. Static
sets are built once, and their membership does not change over time.
• Choose Dynamic from the list to attach a calendar type to the set.
Dynamic sets permit the membership to change based on changes
in the source data. Dynamic sets are generated between two dates,
based on a specific period of time. The history of dynamic set
membership can also be preserved and used for time-based analysis.
9. If you are creating a Dynamic set, enter the following details:
• the time interval for set rebuild
• the type of dynamic set: Temporal, Limited Temporal, or Snapshot
• rebuild information
Dynamic sets are typically rebuilt according to the periods associated
with refresh time interval or calendar selected for the set. The default
16 BusinessObjects Set Analysis User Guide
Page 17

Sets
Creating a set in Set Analysis
is to prevent multiple processing in the current period as you may not
normally want to rebuild the set twice in the same period.
• Allow Auto-fill
For new sets, the period associated with the first build is called the
base period. For subsequent builds, the most recently ended period
is associated with the set. However, if you activate Allow Auto-fill, the
associated period comes after the period for the most recent build.
Thereafter, each build increments the active period for that set. If the
set is dynamic and Allow Auto-fill is activated, the AutoFill / Rollback
button in Sets view is enabled.
Selecting Stop at current period causes normal behavior to be adopted
once the auto increment rebuild period is equal to the current period.
10. Click Apply Changes to save the new set. Once you have created the set
definition, you must add data to it.
Related Topics
• AutoFill in Set Analysis on page 28
• Building a set on page 18
2
AutoFill in Set Analysis
The Allow Auto-fill option in the set Attributes panel is used to process a set
from a selected base date contained in predefined calendar to a specific end
date, or for n periods from the base date. AutoFill is enabled only if the set
is dynamic and if you activate Allow Auto-fill in the set's attributes properties.
AutoFill can back-fill the dynamic membership of a set.
For new sets, the period associated with the first build is called the base
period. For subsequent builds, the most recently ended period is associated
with the set. However, if you check Allow AutoFill, the associated period
comes after the period for the most recent build. Thereafter, each build
increments the active period for that set. If the set is dynamic and Allow
Auto-fill is activated, the AutoFill / Rollback option appears on the set Content
panel.
Once the AutoFill parameters have been defined, the set can be processed.
Note:
• AutoFill can only be used for dynamic sets.
BusinessObjects Set Analysis User Guide 17
Page 18

Sets
2
Creating a set in Set Analysis
• The dates you can choose to AutoFill to are determined by the selected
Building a set
Once you have defined a set, select it in the list of available sets. You can
now add data by building the set. Building the set involves:
• adding data
• building the set with the data
Related Topics
• Visual data views in Set Analysis on page 18
• Visual sets in Set Analysis on page 23
• Using Freehand SQL on page 25
• Defining an event analysis in Set Analysis on page 25
• Importing keys into sets from a csv file on page 27
base date and whether the Stop at Current Period option is activated in
the set's properties. AutoFill Summary This provides summary data such
as start and end periods and total number of periods.
Visual data views in Set Analysis
A new set is created empty. An empty set needs to have members added
to it before it can be used. You can fill the set in the Visual Data view. You
can perform the following functions from the Visual Data view:
• Navigate through the database using the list of universe objects to locate
the categories of data required to fill the current set.
• Create your own object lists for data navigation.
• View the contents of the database categories in the detail windows on
the right of the view. These detail windows provide information about the
content of the categories and how they relate to other categories.
• View the components of a category by moving it to the top detail window.
When you move a category to the top window, its sub-categories appear
in the lower window. Move a category to the upper window by
double-clicking it in the lower window.
• View the relationship between the upper and lower window categories
as indicated in the list of objects.
• View the number of members currently in the set.
18 BusinessObjects Set Analysis User Guide
Page 19

Using a Visual Data view
1. In the Set Building Steps pane of the Content tab click Add.
2. Select Visual Data.
Creating a visual data view
Once you have created and saved a set, you can add members to it in the
Visual Data view. The Visual Data view contains a hierarchy of segments
for members on which you can drill down.
1. Click Add under Set Building Steps and select Visual Data.
Once you have created and saved a set, you can add the data field to it.
When you select the Visual Data option, a list of object is displayed in the
left-hand pane. The list of objects displays dimensions and measures
available in the database for creating set content.
2. Select Visual Data.
3. Select and add a dimension or measure.
Note: Select a count for each dimension. This step is required before
performing an operation on your set.
Sets
Creating a set in Set Analysis
2
4. To remove the dimension or measure, click the left-facing arrow key.
When you select a measure, the Added Field Condition window opens.
If you select a dimension, you must check Yes/No Condition and click
OK for the window to appear.
The Added Field Condition window allows you to define the filter and
specific condition for the dimension. For example, use the field condition
to create a set of people with Age (dimension) that is greater than 45
(filter, condition).
Defining a condition is optional. If you do not want to define a condition,
check Yes/No Condition to deactivate all filters and view all values for the
selected dimension.
If the dimension is Date type, then the field condition window allows you
to enter calendar details.
5. Select Relative or Floating date:
• Select floating to specify the floating period.
• Select relative to enter a specific date.
BusinessObjects Set Analysis User Guide 19
Page 20

Sets
2
Creating a set in Set Analysis
6. If you selected dates with a Between condition, select an end period which
7. Select a filter option. The description is automatically displayed.
8. Click OK.
9. The filter condition is displayed on the selected dimension on the main
10. Select estimates only or exact count.
11. To filter a dimension with a numeric value, select the dimension in the
12. Click the filter function button, and enter all details for the set content.
13. Click Next.
14. Enter a description of the step to be processed, for reference purposes.
15. Allocate points for scorecarding using the + or - buttons, or by typing an
can be either relative or floating.
page.
set building area of the page. The filter function button appears.
integer value in the Additional Score box.
You can allocate a score to each step or process operation. For example,
select Tennis Players and award 1 point. Select Contacts in New York,
and award a score of 2, and select Contacts spending more than $200
and award a score of 4. Each member can exist only once in a set, but
if a member is selected for more than one reason, then the scores are
accumulated on a member-by-member basis. In this example, someone
who matches on all three conditions accumulates a score of 7.
The score must be an integer and can be positive or negative. Limits for
number size vary by database and installation. Typically, the score value
is not very large.
16. Optionally, define sampling parameters.
Related Topics
• Sampling in Set Analysis on page 20
Sampling in Set Analysis
Sampling allows you to refine a set selection by defining the exact
characteristics of the output. Selection focuses on defining the criteria that
defines the output. Normal selection, however, can produce too many
members.
If you select a set of customers of a certain age, gender, and income from
a database containing 3,000,000 customers, you may produce a set of
20 BusinessObjects Set Analysis User Guide
Page 21

Sets
Creating a set in Set Analysis
270,320 customers. If you want to target only 10,000 people, you can split
them into five cells of 2,000 people to test different treatments and use the
sampling module to create random sampling and ranked attributes.
You can stratify each selection into groups to produce skewed samples. For
example, base the data on a 60/40 male/female split and then use skewed
samples to target 25% male and 75% female.
Set Analysis provides four specific types of sampling scenario:
• Random sample creates a different result set each time it is created. For
example, use it to select 100 people randomly from the sample frame. If
you select Random, activate either Sample Size to show the numbers
used to process the sample, or Sample % of Total to count the sample
as a percentage of the total.
• Ranked takes the top n number of customers from the sample. For
example, use it to select the top 100 people from the sample frame. Sort
on the columns matching the field to be used for the ranking, then click
OK. You can sort the column in either ascending or descending order to
specify whether you choose the top n or bottom n. Descending order
produces the top n.
• Stratified Random sampling randomly selects customers from the sample
frame. For example, use it to select randomly 50 males and 50 females
from the set.
• Stratified Ranked sampling selects a ranked selection in each category.
You can use this sampling to list the top ten people in each town in the
sample frame.
2
Defining a sample grouping or strata
1. Click List available objects.
2. Select the objects by which you want to group the resulting sample.
3. Click OK.
The resulting table includes the following columns:
• the data corresponding to the objects you selected for the Group Fields
option
• Source Count: the breakdown of the original source, grouped by the
objects you selected
• Source %: grouped source count as a percentage of the total
• Sample Count: the numbers used to process the sample
BusinessObjects Set Analysis User Guide 21
Page 22

Sets
2
Creating a set in Set Analysis
• Sample % of Source: the sample count as a percentage of the source
count
• Sample % of Total: count as a percentage of the sample total
4. To change the Sample Count, click the value in the table and enter a new
value. Changing the values of the counts is useful when a sample is
irrelevant to the result.
5. If you selected a Ranked sample, select the ranking by clicking the button
next to the Ranked by field.
6. Sort on the columns matching the field use for the ranking, then select
OK. You can sort the column in either ascending or descending order to
specify whether you choose the top n or bottom n. Descending order
produces the top n.
7. Click OK.
The set built is displayed.
Visual data estimates in Set Analysis
Visual Data estimates allow Set Analysis to use estimates rather than getting
counts from source tables. Estimates are not as accurate as counts but can
be much quicker.
Visual Data estimates use aggregated objects to calculate subsequent counts
for objects at a lower level of an ad-hoc object tree.
Estimates on the aggregated objects differ from standard object trees because
you do not need to define them using the Object Tree creator in Set Architect.
The counts for the tree are predefined but are not calculated if you add an
object to the predefined tree.
Note: The accuracy on calculations for estimates improves if the object
being calculated follows a predefined Object Tree. For example, if a
geography hierarchy with fast counts has been defined as Country, State,
City and the Gender object is added to the bottom of the hierarchy, the
estimate is more accurate than for an ad-hoc assortment of objects.
Example: An ad-hoc object tree of Country, Bank and Gender all of which
have had Fast Counts calculated on an individual basis.
The country, bank and gender objects are not part of the Object Tree.
22 BusinessObjects Set Analysis User Guide
Page 23

Sets
Creating a set in Set Analysis
If England and Bank 1 are selected for the first two levels of the tree, when
Gender is expanded, the system finds a fast count for Gender and the
objects above it. A smart calculation is used to produce an estimate for
Gender. The estimates returned are:
Female= 4,356,808; Male = 4,218,497; Unknown = 69,156.
If the source table is queried to obtained exact counts, the result is:
Female= 4,456,448; Male = 4,128,768; Unknown = 65,536
Setting visual data estimate options
To access visual data estimate options, open the Visual Data view for edit
and click Options in the top right corner of the screen to change this option.
The following options affect the way in which estimates work:
DescriptionOption
2
Always use Source if required
Always use Estimates if available
Visual sets in Set Analysis
Once you have created a set, you can add or remove members to or from
it using the database navigation facilities of the Visual Data view. You can
also add or remove members to and from a current set from a previously
created set. You can perform the following functions from the Visual sets:
• construct sets that contain members that several sets have in common
• perform set mathematics on any combination of sets
• manage complex exclusions based on existing sets
• perform visual sets counts
Select the option to query the source table
without prompting the user.
Select the option to use estimates without
prompting the user.
BusinessObjects Set Analysis User Guide 23
Page 24

Sets
2
Creating a set in Set Analysis
The Collections list shows you the sets that have been selected for inclusion
in the Visual sets operation. You can combine sets for inclusion in the
universe by dropping them in the same collection. By dropping sets in
separate collections, they are displayed individually in the graphical universe
area. The color of each collection matches the color of the set in the universe.
Modifying visual sets
1. You add a set to a collection by selecting the set and clicking the arrow
2. Optionally, click a collection to rename it.
3. To select the collections you can either click the diagram or click Select.
4. The Count calculates the number of members (and percentage) currently
5. Enter the Description for the Visual Set.
6. Select the Set Operation to be performed. The operations are:
keys to move it to a particular collection.
selected from the available sets in the universe. Click Next to select the
operation you want to perform on the sets
• Add: adds the selected members in the sets in the universe to the
current set
• Subtract: subtracts the selected members in the sets in the universe
from the current set
• Keep: keeps the intersection of the current set and the selected
member in the sets in the universe
• Score: updates the scores for the selected members in the sets in the
universe
Note: The first time you create a set, the default choice in the set
operation is added automatically.
7. Optionally, enter a score in the Additional Score field.
With SQL tools and selection tools in general, all matching items are
returned as equal. This is not always the case in marketing, for example,
so you can score each selection. The scores for each selection are then
accumulated.
8. Click OK to execute the operation.
The set is added to the set list, and a graphical diagram of the operation
performed is displayed in the Step Detail pane.
24 BusinessObjects Set Analysis User Guide
Page 25

Using Freehand SQL
Freehand SQL allows you to write SQL to process sets. For example, you
can create a link to a fact table or include information necessary to create
the set that is not in the dimension table.
Note: Use the normal set operations (Start, Add, Subtract) to determine how
the results of the free hand SQL are applied to the current set. The SQL
statement can return as many columns as necessary, but one column must
be named ID. This column is used as the list of IDs with which to create the
set. It is not possible to create a set containing IDs that are not listed in the
dimension table. When you process a set from freehand SQL, any IDs that
are not in the dimension table are discarded.
1. In the Set Analysis Sets view, select an existing set or create a set.
2. Click Add, and select Free Hand SQL.
3. Type in the SQL to generate a list of keys to form the set.
4. Click Next.
5. Enter the description of the SQL process and define any additional points.
6. Click OK to process the SQL.
Sets
Creating a set in Set Analysis
2
Defining an event analysis in Set Analysis
Event Analysis analyzes the membership of a dynamic set (joiners, leavers,
stayers and visitors), specifies analysis periods and uses the activity within
the set for analysis. Select defined parameters to specify the event type to
analyze.
1. Click Add in the Set Building Steps.
2. On the Event Analysis page, select the folder and the set under it. Click
the arrow to select the folder.
3. Choose one of the following:
DescriptionOption
Activity
Select Activity to create an action based on activity
within the analysis period.
BusinessObjects Set Analysis User Guide 25
Page 26
Sets
2
Creating a set in Set Analysis
DescriptionOption
Summary
4. Specify the analysis period.
You can simply specify start and end dates, or you can use the calendar
associated with the set to specify the analysis period.
Note: You cannot proceed until you define the Analysis Period.
The event activity depends upon whether you have selected the Activity
or Summary button.
5. Click Activity, and choose an Activity type to analyze.
Joiner
Leavers
Stayers
Select Summary to create an action based on the
summary of activity within the analysis period.
DescriptionActivity Type
Analyzes the selected set for people who joined the
set in the analysis period.
Analyzes the selected set for people who left the set
in the analysis period.
Analyzes the selected set for people always present
within the set in the analysis period.
Visitors
6. Click Summary, and construct a summary action for the analysis.
• Cycle allows you to select members based on their type of presence
with respect to the calendar periods.
• Condition allows you to set a condition for inclusion.
• Number allows you to set the number of periods over which to perform
the selection.
• Time Interval allows you to select the time periods to use.
7. Click Next.
8. Define the Description and Set Operation for the event.
9. Click OK.
26 BusinessObjects Set Analysis User Guide
Analyzes the selected set for people at one time or
another in the set in the analysis period.
Page 27

Creating a set in Set Analysis
Importing keys into sets from a csv file
The Import option allows you to import lists of keys from a .csv file. The file
must contain a column based on the key. Before you can import keys, they
must exist in the primary source table of the current subject.
The import process imports keys that exist in the dimension table for the
current subject. If a customer file contains 100 items and only 99 of the
customer primary keys exist in the customer table, then 99 items are inserted
in the set.
1. In the Set Analysis Sets view, select the set into which you want to import
keys.
The Import view appears.
2. Click Select Import File.
3. From the Open dialog box, select the file from which you want to import
keys.
If you are not sure of the file format required to import into Set Analysis
1. In Set Analysis create a set with a small number of items.
2. Choose Export from the File menu.
Sets
2
Note: Do not change the default options for delimiters.
3. Create a set and import from the same file.
4. Confirm that you have imported the items into the set.
5. Open the comma separated .csv file.
Notice how the first row contains a column name. This is required for the
import to work successfully.
Set-building options in Set Analysis
This section describes set-building actions such as:
• AutoFill
• Build
• Checking for dependencies
BusinessObjects Set Analysis User Guide 27
Page 28

Sets
2
Creating a set in Set Analysis
Related Topics
• Dependencies in Set Analysis sets on page 29
Building sets in Set Analysis
The Build option in the set Content panel allows you to build the sets that
you define. It calculates based on the steps defined.
As you build the steps, the sets displaying -1 can be seen. The -1 signifies
that the step has been combined with other steps to form a single SQL
statement, which improves the set processing.
Note: Only one SQL block can be used per set, all Visual Data and Visual
Set steps can be combined into a block, all other steps cause individual
statements to be run, sampling within a step also causes the block to be
broken.
Completing the set build in Set Analysis
Click Finish to build individual steps.
This builds the last step defined and keeps the counts from previous steps
intact. This method provides a slight improvement in processing time.
AutoFill in Set Analysis
The Allow Auto-fill option in the set Attributes panel is used to process a set
from a selected base date contained in predefined calendar to a specific end
date, or for n periods from the base date. AutoFill is enabled only if the set
is dynamic and if you activate Allow Auto-fill in the set's attributes properties.
AutoFill can back-fill the dynamic membership of a set.
For new sets, the period associated with the first build is called the base
period. For subsequent builds, the most recently ended period is associated
with the set. However, if you check Allow AutoFill, the associated period
comes after the period for the most recent build. Thereafter, each build
increments the active period for that set. If the set is dynamic and Allow
Auto-fill is activated, the AutoFill / Rollback option appears on the set Content
panel.
28 BusinessObjects Set Analysis User Guide
Page 29

Once the AutoFill parameters have been defined, the set can be processed.
Note:
• AutoFill can only be used for dynamic sets.
• The dates you can choose to AutoFill to are determined by the selected
base date and whether the Stop at Current Period option is activated in
the set's properties. AutoFill Summary This provides summary data such
as start and end periods and total number of periods.
Emptying a set in Set Analysis
In the set Content panel, click Empty to empty the defined sets to be built
again.
Removing a set
1. In Set Analysis, Sets, select a set from a folder.
2. Click Remove.
3. Click OK.
Sets
Creating a set in Set Analysis
2
The selected set is deleted from the folder.
Dependencies in Set Analysis sets
In Set Analysis, to check whether the set has any dependent sets, click De
pendencies in the set Content panel.
The Dependencies panel appears, showing a list of all sets that are
dependent on the current set. This shows you whether changes to the current
set have any effect on any other sets.
Editing a set in Set Analysis
1. In Set Analysis > Sets > Content, select the set universe.
2. Select a set.
BusinessObjects Set Analysis User Guide 29
Page 30

Sets
2
Set membership in Set Analysis
3. Click Edit.
4. In the Content panel modify as necessary:
5. In the Attributes panel modify as necessary:
• To add an item selecting it in the left-hand list and click >.
• To remove an item from the list, select it and click <.
When you select an item the fast counts panel appears. Click Cancel
so that you can remove it from the list.
• To edit the fast counts properties for an item, select it in the selected
sets list.
The fast counts properties panel appears.
• Activate or deactivate Yes/No Condition.
• Select or deselect set members.
Click Next or Attributes.
• the set description
• the additional score
• the sampling type
6. Do one of the following:
• Click OK to save your modifications.
• Click Previous or Content to return to the Content panel.
• Click Cancel to cancel the modifications made in the edit mode and
return to the Sets panel.
Related Topics
• Configuring the Visual Data Counts analytic on page 42
• Creating a visual data view on page 19
• Creating a visual data view on page 19
• Sampling in Set Analysis on page 20
Set membership in Set Analysis
The Membership panel displays members for the selected set. It shows the
status of stayers, joiners and leavers.
To view the membership of a set, go to Set Analysis > Sets > Membership.
30 BusinessObjects Set Analysis User Guide
Page 31

Export lists
3
Page 32

Export lists
3
Set Analysis List feature
There are three major actions that you can take once you have gone through
your analysis.
• Rules: automate some of the analysis or to track exception when data
changes
• Lists: generate lists of people according to criteria.
• Schedule: schedule refresh of metrics and rules
Related Topics
• Set Analysis List feature on page 32
• Defining a set list in Set Analysis on page 32
Set Analysis List feature
The List feature enables the user to get a subset of individuals and products
from a given set. A list is a powerful way to get a clear picture of your analysis.
For example, a list of people in high profile subset or list of joiners in the
Collectors set.
A list is defined by the administrator through the System Configuration section
but once you access the list, you can customize it to your needs. For example,
a list of joiners may have their customer id, age marital status and income,
which is termed as the content of the list.
There are different ways of sending a list, for example, emails, URL, to allow
better integration with operational systems like Campaign Management.
A list can be based on single or two sets. For example, you can get a list of
leavers in High Spender set to Low Spender set.
A list can be linked to Individual Profiler. The Profiler Output enables you to
profile an individual of the list. Therefore based on your List template, the
Individual analytics generates the names corresponding to the content of
the list which further allows you to get into deeper analysis for each individual.
Defining a set list in Set Analysis
As the list is generated it is displayed on the screen. This list can also be
stored on the server as a Web Intelligence document, downloaded and saved
on the local hard drive, linked or published as a URL or sent through an
email.
32 BusinessObjects Set Analysis User Guide
Page 33

Export lists
Set Analysis List feature
You can also generate a metadata XML that was defined during the
Dashboard and Analytics setup.
1. Click Export List.
2. On the List Generation page select an output from the List.
Output is the type of file the information is saved to, and is defined by the
administrator in the Dashboard and Analytics configuration. Refer to the
Dashboard and Analytics Setup documentation for details.
3. If you select exporting to a URL, enter the URL string.
Note: The administrator can set a default subject name or selected objects
list, which the user cannot change. Only the administrator sets the email
addresses.
4. Select the List Composition.
Use the setting to indicate whether you want to see a list of one set or a
migration which is a movement from one set to another or measures for
two sets.
5. Click Next to define the Set for the List.
6. Based on the List Composition, the set lists are displayed. The set list is
based on the combination of subject area and list composition selected
in the previous section. You can view the set list either by group or set.
3
If you selected single set as the list composition then you have one set
list displayed.
If you selected migration as the list composition, two set lists appear.
These set lists are source and destination sets, and indicate the movement
from the source set to the destination set.
If you select any other list composition, two set lists are displayed for
comparison.
7. Click Next to define the content of the list.
8. A list of available information is displayed. Select as many and move it
to the List content column by clicking the right arrow key. You can move
only one content head at a time.
Once you have moved the content heads, you can move them in the
order you want them to appear in the list.
To remove any content heading, click the left arrow key.
BusinessObjects Set Analysis User Guide 33
Page 34

Export lists
3
Set Analysis List feature
9. Click Next to define the filters.
10. Select at least one filter which is a subset for the list. Use the arrow keys
to move the filter name to the Conditions applied column.
11. Optionally, choose size and ranking of the list.
You can have only the first twenty rows to see only information about
twenty customers each time you generate the list. You can also sort the
list by the content defined. Select ascending or descending from the Order
By drop-down list.
12. Click Generate to generate the list.
Note: The list can take a while to generate as the system reads the entire
database based on the list specifications.
34 BusinessObjects Set Analysis User Guide
Page 35
Set analytics
4
Page 36

Set analytics
4
Configuring a Membership, Migration or Multi-set Same Time Events analytic
Configuring a Membership, Migration
or Multi-set Same Time Events analytic
The Membership, Migration and Multi-set Same Time Events analytics in
Set Analysis study trends in set metrics, however they study different facets
of these trends. The configuration of these analytics is similar in many ways,
with the following differences:
• The Membership analytic works with a set that contains all members in
one or more sets.
• The Migration analytic works with one or more sets that show information
on cross set migrants, for example, joiners.
• The Multi-set Same Time Events analytic works with one or more sets
that track the multiple activities of joiners, leavers, and stayers.
1. In the analytic edit panel, select sets to list in this analytic.
2. In the "Navigation Options" section, to put a hyperlink on the set name
to an analytic on the Central Mangement Server, activate Use set name
as hyperlink to go to and click Browse to navigate to the analytic.
The hyperlink text window is populated with the hyperlink text in an
openAnalytic text string. You can edit this text string. For information on
openAnalytic, see the Linking from goal, universe query and metric-based
analytics section in the documentation.
3. To hide the trend chart, activate Do not display an automatic trend when
clicking on a chart component.
When this option is deactivated, you can select an item in the chart list,
and its metric trend chart appears. This option is useful if you want more
space in the list for columns.
4. To set a hyperlink on data points to an analytic on the Central Mangement
Server, expand the "DataPoint Navigation options" section, and activate
Use data point as hyperlink to go to and click Browse to navigate to the
analytic.
The hyperlink text window is populated with the hyperlink text in an
openAnalytic text string. You can edit this text string. For information on
openAnalytic, see the Linking from goal, universe query and metric-based
analytics section in the documentation.
5. In the "Display Mode" section, select a mode.
6. In the "Time Window" section, select a window from the drop-down list.
36 BusinessObjects Set Analysis User Guide
Page 37

Set analytics
Choosing a set metric for the Metrics Overview, Membership, Migration or Multi-Set Same Time Events
Related Topics
• Choosing a set metric for the Metrics Overview, Membership, Migration
or Multi-Set Same Time Events analytic on page 37
Choosing a set metric for the Metrics Overview, Membership, Migration or Multi-Set Same Time Events analytic
Note: If you are configuring a metrics overview analytic, you can also select
metrics without sets.
1. In the analytic edit panel, expand Choose the sets to list in this analytic.
2. Select the set you want to include:
• All available sets
• All sets in these subject areas
If you select this option, choose the subject areas from the pane on
the right.
4
analytic
• These specific sets
If you select this option, choose sets by selecting them in the left pane
and adding them to the right pane.
3. If you selected These specific sets, add a prompt by clicking Add under
the "Selected Sets" list box.
Related Topics
• Configuring a Membership, Migration or Multi-set Same Time Events
analytic on page 36
Membership
The Membership analytic, available with Set Analysis, finds trends for sets
and allows you to view a selected set for a specified period.
Set Members reside in the set as of the most recent set refresh. Set Stayers
have resided in the set through more than one refresh.
BusinessObjects Set Analysis User Guide 37
Page 38

Set analytics
4
Migration
For example, if the same customer purchases a case of premium wine during
the months of March and April, that customer is included in the Stayer and
Member counts of the Wine Collector set.
Related Topics
• What is a stayer? on page 112
Migration
The Migration analytic, available with Set Analysis, shows the movement of
members from one set to another in the form of a graph.
Note: Use set-based metrics containing cross-set migrants for the Migration
analytic. See the Set Analyis documentation for more information on sets.
For more information on set metrics, see the Performance Manager
documentation.
Multi-set Same Time Events
The Multi-set same time events analytic shows concurrent inflows and
outflows over time.
Note: Use set-based metrics containing the cross set joiner or leaver cross
sets. For more information on sets, see the Set Analysis documentation. For
more information on set metrics, see the Performance Manager
documentation.
Set Joiners reside in the set as of, but not prior to, the last refresh.
Related Topics
• What are multi-set metrics? on page 38
• What is a joiner? on page 110
What are multi-set metrics?
For a particular set, you can select multiple subsets or measures or
transformations to define multiple metrics. For a particular group, you can
define metrics for each set that belongs to the group.
38 BusinessObjects Set Analysis User Guide
Page 39

Set analytics
Multi-set Same Time Events
For a particular level of the tree list, you can refresh or purge all the metrics
under this level. You can use a view by measure, by set, by subset or by
group. Multi-set metrics enable you to track relationships between sets over
time.
Four types of multi-sets metrics are built into the product:
• "Migrants"
Migrants are individuals who left a given tier to join another given tier.
Migrants in a given period from Set A to Set B are: Set A leavers of the
period that joined Set B in that same period.
Migrant metrics are applicable to temporal sets only. Also they are not
commutative which means that Migrants from A to B are different from
Migrants from B to A.
• "Overlapping members"
Overlapping Members of Sets A and B are: Set A Members of the period
that are also Members of Set B in that same period.
Overlapping Members are applicable to temporal sets only. They are
commutative which means that Overlapping Members of A and B are
identical to Overlapping Members of B and A.
4
• "Same time Joiners"
Same time joiners in a given period of Sets A and B are: Set A Joiners
of the period that joined Set B in that same period.
Same time joiners are applicable to temporal sets only. They are
commutative which means that Same time joiners of A and B are identical
to Same time joiners of B and A.
• "Same time Leavers"
Same time leavers in a given period of Sets A and B are: Set A leavers
of the period that left Set B in that same period.
Same time leavers is applicable to temporal sets only. They are
commutative which means that Same time leavers of A and B are identical
to Same time leavers of B and A.
BusinessObjects Set Analysis User Guide 39
Page 40

Set analytics
4
Profiler
Profiler
The Profiler analytic, available in Set Analysis, analyzes the individual level
information at the membership and metric levels. Use Individual Profiler to
create sets to profile your customers in ways that answer your business
questions.
Individual customers can belong to more than one set, or interest group. For
example, individual customers can belong to a specific age group,
geographical location, or marital status.
Customers can be classified, analyzed and treated in different ways using
set techniques. You can create broad or specific sets to categorize your
customers in ways that are relevant to your business.
Configuring the Profiler analytic
Profiler analyzes the individual level information at the membership and
metric levels.
1. In the profiler edit panel, select the views that you want displayed in the
analytic.
To select or unselect all of the views under "Membership" or "Metrics",
activate or deactivate them at the root level.
2. Select the subjects that you want listed.
You can choose to view all subjects, or select from the list of available
subjects.
3. Enter the ID.
This ID corresponds to the column name in the set dimension table.
4. Click OK to save the configuration.
Related Topics
• What is a subject? on page 112
40 BusinessObjects Set Analysis User Guide
Page 41

Visual Data Counts analytic
The Visual Data Counts analytic, available in Set Analysis, counts dimension
objects in a set. You use this analytic to identify the set populations with
significant amounts of members on which you can create analysis scenarios.
Visual data counts help you with set sampling.
You can perform the following functions using visual data counts:
• Navigate through the database using the predefined object trees to locate
the categories of data required to fill the current set.
• Create your own object trees for data navigation.
• View the:
• contents of the database categories in the detail windows. These detail
windows provide information about the content of the categories and
how they relate to other categories.
• components of a category.
• relationship between the upper and lower window categories as
indicated in the object tree.
• number of members currently in the set, shown in the application view
bar.
Set analytics
Visual Data Counts analytic
4
Using Set Analyzer fast counts in visual data counts
A fast count is an pre-calculated, aggregate action created in Set Analyzer
that summarizes segment counts. Fast counts speed the navigation of object
trees which, in turn, speeds the process of selecting items in a set. If fast
count is defined,the data retrieval is much faster because the data is already
computed and store in set tables.
For more information on creating fast counts and object trees, see the Set
Analyzer Administrator’s Guide. For information on using object trees, see
the Set Analyzer User's Guide.
Related Topics
• What is an object tree? on page 111
• What is a fast count? on page 110
• What is a sampling? on page 112
BusinessObjects Set Analysis User Guide 41
Page 42

Set analytics
4
Visual Data Counts analytic
Configuring the Visual Data Counts analytic
1. In the visual data counts edit mode, expand the "Specify Visual Data
Definition" section.
2. Select a set subject from the "Subject" dropdown list.
3. Select the source table from the "Source" dropdown list.
The object tree appears in a dimension hierarchy list.
4. Select one or more dimensions and add them to the visual data count by
clicking >.
You can also select dimensions by double-clicking them.
When you add an dimension to the list:
• If you select a measure, the "Added Field Condition" panel appears,
where you can assign a "Yes/No Condition".
Note: This condition is optional and only available on dimensions that
have a fast count. The condition you set refines the list of counts. If
you want to see the counts for all of the dimension's items, deactivate
the Yes/No Condition and click OK.
When you add a dimension without a fast count, you cannot add a
field condition. Choose to view exact counts.
If the yes/no condition is the same for the measure, click Default to
avoid the necessity of creating the condition more than once.
• If you select a metric, a panel appears in which you select the type of
count to place on the dimension. If there is a fast count assigned to
the metric, choose Estimates only. If you, however prefer an exact
count or do not have a fast count assigned to the metric, choose Exact
Counts.
5. Click Options to configure the following analytic options:
• Activate Always use Source if required if you do not want estimates
and prefer the source fact tables always queried.
• Activate Always use Estimates if available if you always want available
fast counts used.
• Activate Default Yes/No conditions to Yes.
When you select a dimension for a data count, the dimension defaults
to no, and you select the members of the dimension that you want to
42 BusinessObjects Set Analysis User Guide
Page 43

use in the visual data count. Activating the option saves you time if
you want to use all members for all visual data counts, or have the
assumption of yes, and select the members that should not appear.
6. In the "Display Mode" section, select a mode.
Analytic display modes
The display formats are:
• SVG – Scalable Vector Graphics format. This format is less interactive
than the applet.
• Applet – The Java Applet allows interactive editing of the analytic.
• Flash – Macromedia Flash provides a more interactive interface, and a
zero footprint.
• HTML – The HTML display allows you to provide accessibility for
508-compliant analytics.
The display modes for the analytics are shown in the following table.
Set analytics
Visual Data Counts analytic
DHTMLHTMLFlashAppletSVGAnalytic
4
XAlerts
XBubble chart
XControl chart
XCurve fitting
XFrequency histogram
XXXGauge
XGoal
XGoal subscriptions
XGoal-based influencer detail
XIndividual list
BusinessObjects Set Analysis User Guide 43
Page 44

Set analytics
4
Visual Data Counts analytic
DHTMLHTMLFlashAppletSVGAnalytic
XInfluencer detail
XInfluencer gains chart
XXXInteractive metric trend
XKey influencers
XLag plot
XXMap
XXMembership
XMetric forecaster
XMetric list
XMetric tree
44 BusinessObjects Set Analysis User Guide
XXMetrics overview
XXMigration
XModel gains chart
XXMulti-set same time events
XNavigation list
XNormal probability
XPareto
XPie chart
XProfiler
XRadar chart
XScorecard
Page 45

Set analytics in the Analytic Catalog
XSmoothing
XStrategy Map
XText
XVariable profile box plot
XXVisual data counts
XWeb page
Set analytics in the Analytic Catalog
The Set Analytics samples are based on Web Intelligence queries are
organized in the following categories:
• Membership Analysis analytics:
• Membership breakdown
• Membership change
• Membership status
• Set Metrics analytics:
• Multi set scatter
• Percent of group total
• Percent of enterprise
• Set compare
• Set vs enterprise
• Set vs group average
• Set vs group total growth
• Set vs group turnover
• Migration analytics:
• Migrants compare
• Migration by tier
Set analytics
4
DHTMLHTMLFlashAppletSVGAnalytic
BusinessObjects Set Analysis User Guide 45
Page 46

Set analytics
4
Set analytics in the Analytic Catalog
Membership breakdown
Membership Breakdown is a sample Set Analysis analytic in the Dashboard
Builder Analytic Catalog that shows how the number of members is
decomposed into joiners and stayers rates (positive bars) over time. They
can be compared to the leavers rate represented as negative bars.
Migrants compare
Migrants compare is a sample Set Analytic in the Dashboard Builder Analytic
Catalog that compares metrics based on migrants. The standard net flow
enables the comparison of metrics that are measured in different units. For
this analysis to run, migrants metrics must be defined.
Migration by tier
Migration by Tier is a sample Set Analyic in the Dashboard Builder Analytic
Catalog that is useful for seeing general migration trends toward high-tier or
low-tier sets. Migration by Tier is a tabular analysis which shows the number
of migrants between sets representing different tiers as well as the amount
of overall up-migration and down-migration.
For this analysis to run, the names of the sets must have an alpha-numeric
ordering that represents their relative positions (for example, Tier 1, Tier 2,
Tier) and migrants metrics must be defined.
Multi set scatter
Multi-set scatter is a sample Set Analytic scatter plot in the Dashboard Builder
Analytic Catalog that compares joiners, leavers and stayers rates with respect
to the current values of the metrics simultaneously, for example, cost and
revenue.
Multi-set scatter shows a snapshot of two or more subsets of a set. Two
metrics define the scatter-plot X-Y axes.
46 BusinessObjects Set Analysis User Guide
Page 47

Tip: You can easily page through different periods.
Use this analysis to compare simultaneously current values for differing
subsets with respect to two measures. For example, if you want to know
whether a trend in revenue/cost ratios has emerged among Joiners and
Leavers, you can plot Revenue vs. Cost for Joiners and Leavers and compare
their relative positions.
Percent of group total
Percent of total group is a sample Set analytic in the Dashboard Builder
Analytic Catalog that shows how much a set contributes to the total of a
group. It is appropriate for use with mutually exclusive sets.
Percent of total group compares two metrics that are measured in different
units. Applied to a set of mutually exclusive tiers that covers all the individuals,
with a Count metric (for example, Number of individuals) and a Revenue
metric, this analysis is a 80:20 rule chart over time.
Set analytics
Set analytics in the Analytic Catalog
4
Percent of enterprise
Percent of Enterprise is a sample Set analytic in the Dashboard Builder
Analytic Catalog that shows how much a set contributes to the enterprise
total. The formula for Percent of Enterprise is:
Set Metric / Enterprise Metric
Set compare
Set compare is a sample Set analytic in the Dashboard Builder Analytic
Catalog that is useful for comparing sets at a point in time. Set compare
distinguishes the sets that are above the average (blue flat line) from those
that are below.
BusinessObjects Set Analysis User Guide 47
Page 48

Set analytics
4
Set analytics in the Analytic Catalog
Set vs enterprise
Set vs Enterprise is a sample Set analytic in the Dashboard Builder Analytic
Catalog that is useful for benchmarking a set metric against the enterprise.
Percent of origin makes the two lines start at the same value (100%) in order
to facilitate the comparison.
Set vs group average
Set vs Group average is a sample Set analytic in the Dashboard Builder
Analytic Catalog that is useful for benchmarking a set raw value against the
average value of a group.
Group average is calculated by averaging the values of the sets within the
group.
Set vs group total growth
Set vs total growth is a sample Set analytic in the Dashboard Builder Analytic
Catalog that is useful for benchmarking a set raw value against the group
total growth.
Total Growth solves the scale issue of set raw value versus group total. It
makes the group total trend relative to the starting value of the set trend, so
that the group total growth always starts with the same value as the set trend.
Set vs group turnover
Set vs Group turnover is a sample Set analytic in the Dashboard Builder
Analytic Catalog that is useful for benchmarking the turnover of a set against
the turnover of a group.
Set vs Group turnover reveals the amount of change, or churn, that has
occurred in a membership. The period of analysis here corresponds to the
set refresh period.
48 BusinessObjects Set Analysis User Guide
Page 49

Set analytics
Linking from goal, universe query and metric-based analytics
No metrics are required for this analysis to run.
Linking from goal, universe query and
metric-based analytics
Linking to multiple documents from an analytic based on a goal, metric or universe query
You can create links to multiple documents from a goal or metric-based
analytic. This is particularly useful for analytic drill down.
1. How you access the options for linking analytics to other documents,
depends on whether you are creating a new analytic or editing an existing
analytic.
• If you are creating an analytic, do one of the following in InfoView:
• Go to OpenDashboard BuilderCreate New Analytic.
• Go to Document ListNewAnalytic.
• If you are editing an analytic, select the analytic, then click Edit.
4
2. Expand Navigation.
3. The next step depends on whether you want:
• If you want to link the title of the analytic to multiple documents, click
Multiple Links below "Use Legend/Title as hyperlink to go to".
• If you want to provide data point navigation, so that users can click a
metric result and then view a filtered document that shows other results
for that specific time period, click Multiple Links below "Use data point
as hyperlink to go to".
The Edit Navigation Link dialog box appears.
4. Click Add, then click Browse to select the document or, if you want to link
to a web page, type the URL into the text box.
5. You can add several links to documents here.
6. Click Update, then click OK.
The link to the multiple documents appears.
BusinessObjects Set Analysis User Guide 49
Page 50

Set analytics
4
Linking from goal, universe query and metric-based analytics
For example:
Drill Down Group Level||openAnalytic.jsp?Document
Name=Drill+Down+Group+Level&RepositoryType=C&Repository
Name=Feature Examples&DocumentExt=rpt&DocumentId=AWbJO
JEYvvVMnbtXEQ2An0s&sContentType=OnDemand&mode=full||Total
Sales.rpt||openAnalytic.jsp?DocumentName=TotalSales.rpt&Repos
itoryType=C&RepositoryName=Feature Samples&Docu
mentExt=rpt&DocumentId=AdLEddSQNTlDhMiLiHoD7II&sContent
Type=OnDemand&mode=full||Business Objects||http://www.busi
nessobjects.com
In this example the multiple link is created to:
• Drill Down Group Level
• TotalSales report
• www.businessobjects.com
The syntax of the links is as follows:
name1||URL||name2||URL||name3||URL
7. To check the links, click OK.
The analytic appears.
8. Place your cursor on a data point or the title.
If the links are defined correctly, a popup menu appears with list of
destination documents.
9. Click the destination document of your choice.
Note: When linking from goal and predictive analytics you must enter
the link manually.
Related Topics
• OpenAnalytic variables used in goal, metric and universe query analytics
on page 52
• Using variables for dynamic links to documents on page 52
50 BusinessObjects Set Analysis User Guide
Page 51

Set analytics
Linking from goal, universe query and metric-based analytics
Linking from a goal, metric or universe query-based analytic to a document or analytic
Adding links to analytics allows end users navigate from an analytic to other
analytics or documents that provide information for further analysis.
You can include prompt parameters in links. Adding prompt parameters
means that the data displayed on the target analytic or document is
dynamically generated according to the values displayed on the first analytic.
1. How you access the options for linking analytics to other documents
depends on whether you are creating an analytic or editing an existing
analytic:
• If you are creating an analytic, do one of the following in InfoView:
• Go to OpenDashboard BuilderCreate New Analytic.
• Go to NewAnalytic.
• If you are editing an analytic, select the analytic, then click Edit.
2. Expand Navigation.
3. The next step depends on whether you want to link the title or data points
to a destination document:
• If you want to link the title of the analytic to multiple documents, click
Browse below "Use Legend/Title as hyperlink to go to".
• If you want to provide data point navigation, so that users can click a
metric result to view a filtered document that shows other results for
that specific time period, click the Browse below "Use data point as
hyperlink to go to".
4
The "Edit Navigation Link Menu" dialog box appears.
4. Click Add, then Browse to select the document or, if you want to link to
a web page, type the URL into the text box.
Note: When linking from goal and predictive analytics you must enter
the link manually.
5. Click Update, then click OK.
The URL to the document appears in the URL box. The URL reads as
follows:
openAnalytic.jsp?DocumentName=<FILE_NAME>
&RepositoryType= C&RepositoryName=<REPOSITORY_NAME>
BusinessObjects Set Analysis User Guide 51
Page 52

Set analytics
4
Linking from goal, universe query and metric-based analytics
&DocumentExt=<EXTN>& DocumentId=<DOCID>
&sContentType=OnDemand&mode=full
6. To check the links, click OK.
The analytic appears.
7. Place your cursor on a data point or the title.
8. When your cursor turns into a hand sign, click the data point or title.
The destination document appears.
Related Topics
• OpenAnalytic variables used in goal, metric and universe query analytics
on page 52
• Linking to multiple documents from an analytic based on a goal, metric
or universe query on page 49
• Using variables for dynamic links to documents on page 52
• Using variables for dynamic links to documents on page 52
Using variables for dynamic links to documents
You can include variables in the links to documents so that the destination
document is filtered by the values for a specific metric, dimension, goal or
set.
Related Topics
• OpenAnalytic variables used in goal, metric and universe query analytics
on page 52
OpenAnalytic variables used in goal, metric and universe query analytics
The following table gives a description of each variable you can use when
used in creating links between analytics.
Note: A universe query analytic where a prompt is defined can use all of the
OpenAnalytic variables.
52 BusinessObjects Set Analysis User Guide
Page 53

Set analytics
Linking from goal, universe query and metric-based analytics
DescriptionVariable
Metric ID$METRIC_ID$
Metric Name$METRIC_NAME$
Subject ID$SUBJECT_ID$
Subject name$SUBJECT_NAME$
Set ID$SET_ID$
Set Name$SET_NAME$
2nd Set ID (when metric based on two sets)$SET2_ID$
2nd Set Name (when metric based on two sets)$SET2_NAME$
Population ID$POPULATION_ID$
Population Name$POPULATION_NAME$
4
Dimension ID$DIM_ID$
Dimension Name$DIM_NAME$
2nd Dimension ID$DIM2_ID$
2nd Dimension Name$DIM2_NAME$
Name of goal associated with analytics$GOAL_NAME$
ID of goal associated with analytics$GOAL_ID$
Value of the slice (code)$SLICE_CODE$
Value of the slice (name)$SLICE_NAME$
Class Id from the source universe$CONDITION_ID$
Measure Name$MEASURE_NAME$
First slice of the dimension used for x-axis (QOU)$MIN_SLICE$
BusinessObjects Set Analysis User Guide 53
Page 54

Set analytics
4
Linking from goal, universe query and metric-based analytics
DescriptionVariable
Last slice of the dimension used for x-axis (QOU)$MAX_SLICE$
$CURRENT_SLICE$
$CURRENT_DATE$
Current slice of the dimension used for x-axis
(QOU)
Begin Date of the displayed period$BEGIN_DATE$
End Date of the displayed period$END_DATE$
Current period (corresponds to a data point in a
trend)
Code for the current region displayed$MAP_CODE$
Name of current region displayed$MAP_NAME$
Long name of current region displayed$MAP_LONGNAME$
Model ID$MODEL_ID$
Influencer ID$INFLUENCER_ID$
Influencer Name$INFLUENCER_NAME$
OpenAnalytic variables for Goal variance and Pareto analytics
Pareto analytic
You can only use the $METRIC_ID$ variable to link from a Pareto analytic.
Goal variance analytics
You can use the following variables to link from Goal Variance analytics:
• $CONDITION_ ID$
• $CONDITION_ NAME$
• $DIM_ID$
• $DIM_ NAME$
• $GOAL_ ID$
• $MEASURE_ NAME$
54 BusinessObjects Set Analysis User Guide
Page 55

Set analytics
Linking from goal, universe query and metric-based analytics
• $METRIC_ ID$
• $METRIC_ NAME$
• $POPULATION_ ID$
• $POPULATION_ NAME$
• $SET_ ID$
• $SET_ NAME$
• $SET2_ ID$
• $SET2_ NAME$
• $SLICE_ CODE$
• $SLICE_ NAME$
• $SUBJECT_ ID$
• $SUBJECT_ NAME$
• $USER$
Note: A universe query analytic where a prompt is defined can use all of the
OpenAnalytic variables.
Related Topics
• OpenAnalytic variables used in goal, metric and universe query analytics
on page 52
4
OpenAnalytic variables for Map analytics
This table shows which variables can be used to link from Map analytics that
use metrics or a universe query.
Note: A universe query analytic where a prompt is defined can use all of the
OpenAnalytic variables.
Map analytic using metrics
Variable
Title link
Map analytic using a universe query
Map item
link
BusinessObjects Set Analysis User Guide 55
Map item linkTitle link
XXXX$METRIC_ ID$
XXXX$METRIC_ NAME$
XXXX$SUBJECT_ ID$
Page 56

Set analytics
4
Linking from goal, universe query and metric-based analytics
Variable
$SUBJECT_
NAME$
$POPULATION_
ID$
$POPULATION_
NAME$
Map analytic using metrics
Title link
Map item
link
Map analytic using a universe query
Map item linkTitle link
XXXX
XXXX$SET_ID$
XXXX$SET_ NAME$
XXXX$SET2_ID$
XXXX$SET2_ NAME$
XXXX
XXXX
XXXX$DIM_ID$
XXXX$DIM_NAME$
$CONDITION_
NAME$
$MEASURE_
NAME$
56 BusinessObjects Set Analysis User Guide
X$GOAL_NAME$
XX$GOAL_ID$
XXX$SLICE_CODE$
XXX$SLICE_NAME$
XXXX$CONDITION_ ID$
XXXX
XXXX
Page 57

Set analytics
Linking from goal, universe query and metric-based analytics
4
Map analytic using a universe query
Variable
$MAP_ LONGNAME$
Related Topics
Map analytic using metrics
Title link
Map item
link
• OpenAnalytic variables used in goal, metric and universe query analytics
on page 52
OpenAnalytic variables for Metric List and Strategy Map analytics
Map item linkTitle link
XX$BEGIN_DATE$
XX$END_DATE$
XXX$MAP_CODE$
XXXX$MAP_NAME$
XX
XXXX$USER$
This table shows which variables can be used to link from Metric Lists and
Strategy Maps analytics (only when based on goals, metrics or universe
queries).
Strategy MapMetric List
Variable
Attached analyticTitle link
XX$METRIC_NAME$
XX$SUBJECT_ID$
XX$SUBJECT_ NAME$
XX$SET_ID$
BusinessObjects Set Analysis User Guide 57
Page 58

Set analytics
4
Linking from goal, universe query and metric-based analytics
Variable
Strategy MapMetric List
Attached analyticTitle link
XX$SET_NAME$
XX$SET2_ID$
XX$SET2_NAME$
XX$POPULATION_ ID$
XX$POPULATION_ NAME$
XX$DIM_ID$
XX$DIM_NAME$
XX$GOAL_NAME$
XX$SLICE_CODE$
Note: A universe query analytic where a prompt is defined can use all of the
OpenAnalytic variables.
Related Topics
• OpenAnalytic variables used in goal, metric and universe query analytics
on page 52
58 BusinessObjects Set Analysis User Guide
XX$SLICE_NAME$
XX$CONDITION_ID$
XX$CONDITION_ NAME$
XX$MEASURE_ NAME$
XX$USER$
Page 59

Linking from goal, universe query and metric-based analytics
OpenAnalytic variables for Metric Tree and Metrics Overview analytics
This table shows which variables can be used to link from Metric Trees and
Metrics Overview analytics.
Note: A universe query analytic where a prompt is defined can use all of the
OpenAnalytic variables.
Metrics OverviewMetric Tree
Set analytics
4
Variable
Attached Analytic
X$METRIC_ID$
X$GOAL_NAME$
X$GOAL_ID$
Set Name
Link
Datapoint
Link
XX$METRIC_NAME$
XX$SUBJECT_ ID$
XXX$SUBJECT_ NAME$
XXX$SET_ID$
XXX$SET_NAME$
XX$POPULATION _ID$
XX$POPULATION _NAME$
XX$DIM_ID$
XX$DIM_NAME$
XX$SLICE_ CODE$
XX$SLICE_ NAME$
XX$CONDITION _ID$
BusinessObjects Set Analysis User Guide 59
Page 60

Set analytics
4
Linking from goal, universe query and metric-based analytics
Metrics OverviewMetric Tree
Variable
Related Topics
Attached Analytic
Set Name
Link
Datapoint
Link
XX$CONDITION _NAME$
XX$MEASURE _NAME$
X$BEGIN_DATE$
X$END_DATE$
X$CURRENT _DATE$
XXX$USER$
• OpenAnalytic variables used in goal, metric and universe query analytics
on page 52
OpenAnalytic variables for most volatile metrics and Set Membership analytics
This table shows which variables can be used to link from most volatile
metrics and set membership analytics.
Variable
60 BusinessObjects Set Analysis User Guide
Set MembershipMost Volatile Metrics
DatapointDatapointAnalytic Link
XX$METRIC_ID$
XX$METRIC_NAME$
XXX$SUBJECT_ID$
XXX$SUBJECT_NAME$
XXX$SET_ID$
XXX$SET_NAME$
Page 61

Variable
Set analytics
Linking from goal, universe query and metric-based analytics
Set MembershipMost Volatile Metrics
DatapointDatapointAnalytic Link
XX$SET2_ID$
XX$SET2_NAME$
XX$POPULATION_ID$
XX$POPULATION_NAME$
XX$DIM_ID$
XX$DIM_NAME$
XX$SLICE_CODE$
XX$SLICE_NAME$
XX$CONDITION_ID$
4
XX$CONDITION_NAME$
XX$MEASURE_NAME$
XX$BEGIN_DATE$
XX$END_DATE$
XX$CURRENT_DATE$
XXX$USER$
Note: A universe query analytic where a prompt is defined can use all of the
OpenAnalytic variables.
Related Topics
• OpenAnalytic variables used in goal, metric and universe query analytics
on page 52
BusinessObjects Set Analysis User Guide 61
Page 62

Set analytics
4
Linking from goal, universe query and metric-based analytics
OpenAnalytic variables for Key Influencers analytics
The following variables can be used to link from Key Influencers analytics:
• $MODEL_ID$
• $INFLUENCER_ID$
• $INFLUENCER_NAME$
Note: A universe query analytic where a prompt is defined can use all of the
OpenAnalytic variables.
Related Topics
• OpenAnalytic variables used in goal, metric and universe query analytics
on page 52
OpenAnalytic variables for the Metric Forecaster analytic
The following variables can be used to link to Metric Forecaster analytic:
• $METRIC_ ID$
• $BEGIN_ DATE$
• $END_ DATE$
OpenAnalytic variables for the Interactive Metric Trend analytic
This table shows the variables can be used to link from Interactive Metric
Trends based on goals, metrics or universe queries.
DatapointLegendVariable
XX$METRIC_ID$
XX$METRIC_NAME$
XX$SUBJECT_ ID$
XX$SUBJECT_ NAME$
XX$SET_ID$
XX$SET_NAME$
XX$SET2_ID$
XX$SET2_NAME$
62 BusinessObjects Set Analysis User Guide
Page 63

Set analytics
Linking from goal, universe query and metric-based analytics
DatapointLegendVariable
XX$POPULATION_ ID$
XX$POPULATION_ NAME$
XX$DIM_ID$
XX$DIM_ NAME$
XX$SLICE_ CODE$
XX$SLICE_ NAME$
XX$CONDITION_ ID$
XX$CONDITION_ NAME$
XX$MEASURE_ NAME$
XX$MIN_ SLICE$
4
XX$MAX_ SLICE$
X$CURRENT_ SLICE$
XX$USER$
XX$BEGIN_DATE$
X$CURRENT_DATE$
XX$END_DATE$
Note: A universe query analytic where a prompt is defined can use all of the
OpenAnalytic variables.
Related Topics
• OpenAnalytic variables used in goal, metric and universe query analytics
on page 52
BusinessObjects Set Analysis User Guide 63
Page 64

Set analytics
4
Linking from goal, universe query and metric-based analytics
OpenAnalytic variables for a Migration analytic
The following variables can be used to link from a datapoint in the Migration
analytic for set analysis:
• $SUBJECT_ID$
• $SUBJECT_ NAME$
• $SET_ID$
• $SET_NAME$
• $USER$
Note: A universe query analytic where a prompt is defined can use all of the
OpenAnalytic variables.
Related Topics
• OpenAnalytic variables used in goal, metric and universe query analytics
on page 52
OpenAnalytic variables for Gauge analytics
This table shows which variables can be used to link from Gauges.
64 BusinessObjects Set Analysis User Guide
Universe queryMetricVariable
X$METRIC_ ID$
X$METRIC_ NAME$
X$SUBJECT_ ID$
X$SUBJECT_ NAME$
X$SET_ID$
X$SET_NAME$
X$SET2_ID$
X$SET2_NAME$
X$POPULATION _ID$
X$POPULATION _NAME$
Page 65

Set analytics
Linking from goal, universe query and metric-based analytics
Universe queryMetricVariable
XX$DIM_ID$
XX$DIM_NAME$
X$DIM2_ID$
X$DIM2_NAME$
X$GOAL_NAME$
X$GOAL_ID$
X$SLICE_ CODE$
XX$SLICE_ NAME$
X$CONDITION _ID$
X$CONDITION _NAME$
4
XX$MEASURE _NAME$
X$MIN_SLICE$
X$MAX_SLICE$
X$CURRENT _SLICE$
X$BEGIN_DATE$
X$END_DATE$
X$CURRENT _DATE$
X$USER$
OpenAnalytic variables for the Pie, Bubble and Radar Charts
The following table shows which variables can be used to link from the Pie,
Bubble and Radar charts:
BusinessObjects Set Analysis User Guide 65
Page 66

Set analytics
4
Linking from goal, universe query and metric-based analytics
X$GOAL_ ID$
X$GOAL_ NAME$
Radar ChartBubble ChartPie ChartVariable
XX$METRIC_ ID$
XX$METRIC_ NAME$
XXX$BEGIN_ DATE$
XXX$END_ DATE$
$CURRENT_
DATE$
Note: A universe query analytic where a prompt is defined can use all of the
OpenAnalytic variables.
Related Topics
• OpenAnalytic variables used in goal, metric and universe query analytics
on page 52
OpenAnalytic variables for Data Exploration analytics
The following variables can be used to link from the Data Exploration
analytics, which include Lag Plot, Frequency Histogram, Normal Probability
Plot, Smoothing and Curve Fitting :
• $METRIC_ID$
• $METRIC_NAME$
• $BEGIN_DATE$
• $END_DATE$
• $CURRENT_DATE$
Note: A universe query analytic where a prompt is defined can use all of the
OpenAnalytic variables.
XXX
66 BusinessObjects Set Analysis User Guide
Page 67

Linking from goal, universe query and metric-based analytics
Related Topics
• OpenAnalytic variables used in goal, metric and universe query analytics
on page 52
nbPrompts
nbPrompts is a parameter used in customized links between analytics and
documents stored on the Central Management Server in which prompts are
allowed, including analytics, Crystal Reports, Desktop Intelligence and Web
Intelligence documents. Using nbPrompts, you can fill the prompt(s) in the
target document with openAnalytic variables.
nbPrompts syntax in links from goal and metric-based analytics
The following are examples of nbPrompts syntax:
openanalytic.jsp?...&mode=full&nbPrompts=1
&[analytic_prompt_name]=$METRIC_NAME$
openanalytic.jsp?...&mode=full&nbPrompts=3
&[analytic_prompt1]=$METRIC_NAME$&[analytic_prompt2]=
$BEGIN_DATE$&[analytic_prompt3]=$END_DATE$
Set analytics
4
where openanalytic.jsp?...&mode=full is automatically included in the address
when you select the target document, and you add the remaining text using
the following syntax:
&nbPrompts=[#]&[analytic_prompt_name]=
$METRIC_NAME$
where you replace [#] with the number of prompts, and for each prompt you
add the string &[analytic_prompt_name]=$METRIC_NAME$, where
[analytic_prompt_name] is replaced with the name of the prompt in the
analytic or document.
Using openDocument in dashboards and analytics
The openDocument.jsp uses the "opendoc" context to open objects from a
document or dashboard in InfoView.
Use the following syntax:
/OpenDocument/opendoc/
openDocument.jsp?iDocID=vscmMCXk
&sIDType=CUID&sType=null&sInstance=Last
BusinessObjects Set Analysis User Guide 67
Page 68

Set analytics
4
Linking from goal, universe query and metric-based analytics
where vscmMCXk is the ID of the dashboard.
Note: Use relative instead of absolute links to documents in InfoView, in the
case where you plan to migrate servers.
To use openDocument to open a dashboard from a document or dashboard:
/OpenDocument/opendoc/openDocument.jsp?
iDocID=vscmMCXk&sIDType=CUID&sType=null
To use openDocument to open an analytic from a document or dashboard:
/OpenDocument/opendoc/openDocument.jsp?
iDocID=vscmMCXk&sIDType=CUID&sType=null
Example: sInstance in openDocument syntax
Use the parameter sInstance=Last with the OpenDocument function to
retrieve the last instance of a Web Intelligence or Desktop Intelligence
report. You must specify the fully-qualified URL of the target document for
the parameter to take effect.
Note: sInstance=Last has no effect in the OpenAnalytic function.
URL Reporting Using openDocument
URL reporting using openDocument provides URL access to multiple
document types by passing a URL string to a BusinessObjects Enterprise
server. openDocument provides commands to control how reports are
generated and displayed.
You can use openDocument in BusinessObjects Enterprise to create
cross-system links to and from the following document types:
• .wid: Web Intelligence version 6.x documents
• .rep: Desktop Intelligence documents
• .rpt: Crystal reports
• .car: OLAP Intelligence reports
Note: For more information about how to customize your Web Intelligence
documents, see the Web Intelligence Report Engine Developer Guide.
68 BusinessObjects Set Analysis User Guide
Page 69

Set analytics
Linking from goal, universe query and metric-based analytics
Structuring an openDocument URL
The next sections explain how to use the openDocument function, and how
to construct the URL.
An openDocument URL is generally structured as follows:
http://<servername>:<port>/OpenDocument/<platformSpecific>?<pa
rameter1>&<parameter2>&...&<parameterN>
The exact syntax of the <platformSpecific> parameter depends on your
implementation:
• For Java implementations, use opendoc/openDocument.jsp in place of
the <platformSpecific> parameter.
The URL is constructed using the parameters listed in OpenDocument
parameter overview on page 72
Joining parameters
Join parameters with the ampersand (&). Do not place spaces around the
ampersand. For example: sType=wid&sDocName=Sales2003
4
The ampersand is always required between parameters.
Spaces and special characters in parameter values
Because some browsers cannot interpret spaces, the parameters of the link
cannot contain spaces or other special characters that require URL encoding.
To avoid the misinterpretation of special characters, you can define a
URLEncoded string in the source database to replace the special character
with an escape sequence. This will allow the database to ignore the special
character and correctly interpret the parameter value. Note that certain
RDBMS have functions that allow you to replace one special character with
another.
By creating an escape sequence for the plus sign (+), you can instruct the
database to interpret the plus sign as a space. In this case, a document title
Sales Report for 2003 would be specified in the DocName parameter as:
&sDocName=Sales+Report+for+2003&
This syntax prevents the database from misinterpreting the spaces in the
title.
BusinessObjects Set Analysis User Guide 69
Page 70

Set analytics
4
Linking from goal, universe query and metric-based analytics
Trailing spaces in parameter values
Trim trailing spaces at the end of parameter values and prompt names. Do
not replace them with a plus sign (+). The viewer may not know whether to
interpret the plus sign (+) as part of the prompt name or as a space. For
example, if the prompt name displays:
Select a City:_
(where _ represents a space), enter the following text in the link:
lsSSelect+a+City:=Paris
where the spaces within the prompt name are replaced with the plus sign,
and the trailing space is trimmed off.
For details on prompt parameters of the link, refer to OpenDocument
parameter overview on page 72 .
Capitalization
All of the openDocument parameters are case sensitive.
Link length limit
The encoded URL cannot exceed 2083 total characters.
Parameter values in links to sub-reports
You cannot pass parameter values to a sub-report of a target Crystal report.
Using the lsS parameter with OLAP Intelligence reports
If the target document is an OLAP Intelligence report (.car) you can use the
IsS parameter to specify prompts. The parameters are passed in as a
URL-encoded string using the unique name of the parameter set up in the
OLAP Intelligence report.
Example: Opening a report to a specific page
If 23CAA3C1-8DBB-4CF3BA%2CB8%2CD7%2CF0%2C68%2CEF%2C9C%2C6F is the
URL-encoded unique name for the page parameter in the OLAP Intelligence
70 BusinessObjects Set Analysis User Guide
Page 71

Set analytics
Linking from goal, universe query and metric-based analytics
report, you would use the following URL to open the OLAP Intelligence
report to page 2:
http://<servername>:<port>/OpenDocument/<platformSpecif
ic>?sType=car&sIDType=InfoObject&iDocID=440&lsS23CAA3C1-8DBB4CF3-BA%2CB8%2CD7%2CF0%2C68%2CEF%2C9C%2C6F=2
Example: Opening a cube parameter
If 8401682C-9B1D-48508B%2C5E%2CD9%2C1F%2C20%2CF8%2C1%2C62 is the URL-encoded
unique name for the cube parameter opening the warehouse cube in the
catalogue FoodMart 2000 on MSAS, you would use the following URL to
open this cube parameter:
http://<servername>:<port>/OpenDocument/<platformSpecif
ic>?sType=car&sIDType=InfoObject&lsS8401682C-9B1D-48508B%2C5E%2CD9%2C1F%2C20%2CF8%2C1%2C62=CATALOG%3DFood
Mart%202000,CUBE%3Dwarehouse&iDocID=616
Using the lsM parameter with OLAP Intelligence reports
4
If the target document is an OLAP Intelligence report (.car) you can use the
IsM parameter to specify prompts. The parameters are passed in as a
URL-encoded string using the unique name of the parameter set up in the
OLAP Intelligence report.
As was the case for the lsS parameter, lsM parameters are also passed in
as a URL-encoded string using the unique name of the parameter set up in
the OLAP Intelligence report.
Example: Opening a report
http://<servername>:<port>/OpenDocument/<platformSpecif
ic>?sType=car&sIDType=InfoObject&lsMADC216EA-D9A5-42B5AE%2C21%2C84%2CA9%2CF9%2C6E%2C31%2C7=[%5BCustomers%5D.%5BCoun
try%5D.%26%5BMexico%5D],[%5BCustomers%5D.%5BCoun
try%5D.%26%5BCanada%5D]&iDocID=544
This is a memberset parameter opening up a report with Customers >
Country > Mexico and Customers > Country > Canada in the view.
BusinessObjects Set Analysis User Guide 71
Page 72

Set analytics
4
Linking from goal, universe query and metric-based analytics
OpenDocument parameter overview
This section provides a brief overview of openDocument and includes a list
of available commands. Details about the available commands, their specific
uses, and relevant examples are also provided.
The exact syntax of the <platformSpecific> parameter depends on your
implementation:
• For Java implementations, use opendoc/openDocument.jsp in place of
the <platformSpecific> parameter.
The first parameter of the link
http://<servername>:<port>/OpenDocument/<platformSpecific>?
The first parameter, as displayed in the example above, must precede all
other parameters. After this information, the parameters can appear in any
order. The parameters of the function are displayed in the following table.
The mandatory column indicates whether the parameter is required in the
link.
Note: The document containing the openDocument link is called the parent
document, and it resides on the parent system. The document to which the
link points is called the target document, and it resides on the target system.
Table 4-10: Platform Parameters
iDocID on page 75
sDocName on page 76
sIDType on page 77
sKind on page 77
72 BusinessObjects Set Analysis User Guide
DescriptionParameter
Document identifier.
Document name.
Crystal object type.
The file type of target Desktop Intelligence document.
Page 73

Set analytics
Linking from goal, universe query and metric-based analytics
DescriptionParameter
4
sPath on page 78
sType on page 78
token on page 79
Table 4-11: Input Parameters
lsC on page 80
lsM[NAME] on page 81
The name of the folder and subfolder
containing the target document.
The file type of target document or
report.
A valid logon token for the current
CMS session.
DescriptionParameter
Specifies a contextual prompt if there
is an ambiguity during SQL generation (Business Objects and Web Intelligence documents only).
Specifies a range of values for a
prompt. [NAME] is the text of the
prompt.
lsR[NAME] on page 84
lsS[NAME] on page 87
For Crystal targets only, indicates
whether the link should open the full
target report or just the report part
specified in sReportPart.
Specifies a value for a single prompt.
[NAME] is the text of the prompt.
BusinessObjects Set Analysis User Guide 73
Page 74

Set analytics
4
Linking from goal, universe query and metric-based analytics
DescriptionParameter
sInstance on page 89
sPartContext on page 90
sRefresh on page 90
sReportMode on page 91
sReportName on page 92
sReportPart on page 92
Indicates which specific instance of
the target report to open.
In Crystal Reports, a report part is
associated to a data context.
Indicates whether a refresh should
be forced when the target document
or report is opened.
For Crystal targets only, indicates
whether the link should open the full
target report or just the report part
specified in sReportPart.
Indicates which report to open if target document is multi-report.
Indicates which specific part of the
target report to open.
Table 4-12: Output Parameters
NAII on page 93
74 BusinessObjects Set Analysis User Guide
DescriptionParameter
Forces the display of the prompt selection page.
Page 75

Set analytics
Linking from goal, universe query and metric-based analytics
DescriptionParameter
4
sOutputFormat on page 94
sViewer on page 94
sWindow on page 95
Indicates the format in which the target document is opened.
Indicates the selected report viewer
(CR & CA only).
Indicates whether the target report
will open in the current browser window or whether a new window will be
launched.
OpenDocument Platform parameters
The following tables list the openDocument platform parameters:
Note: Variables are denoted with angle brackets. You must substitute the
proper value for these variables. For example, you must use the name of
your server in place of <servername> where it is contained in the code
samples below, and you must use your port number in place of <port>.
iDocID
Parameter syntax
iDocID
Description of
parameter
Document identifier.
BusinessObjects Set Analysis User Guide 75
Mandatory?
One of sDoc
Name or iDocID
is mandatory.
Values accepted
for parameter
Document identifier (InfoObjectID).
Page 76

Set analytics
4
Linking from goal, universe query and metric-based analytics
Example:
http://<servername>:<port>/OpenDocument/<platformSpecif
ic>?sType=wid&sDocName=SalesReport&iDocID=2010
Note: To obtain the document ID, navigate to the document in InfoView,
hover your mouse over the document name hyperlink, and look for the ID
number in the browser's status bar. You can also obtain the document ID
from the Central Management Console.
sDocName
Parameter syntax
sDocName
Example:
http://<servername>:<port>/OpenDocument/<platformSpecif
ic>?sPath=[Sales+Reports]&sDocName=Sales+in+200
Description of
parameter
Document name
without extension
If multiple documents have the
same name,
specify the correct document
with iDocID.
Mandatory?
One of sDoc
Name or iDocID
is mandatory.
Values accepted
for parameter
Document name.
76 BusinessObjects Set Analysis User Guide
Page 77

sIDType
Set analytics
Linking from goal, universe query and metric-based analytics
4
Parameter syntax
sIDType
Example:
http://<servername>:<port>/OpenDocument/<platformSpecific>?iDo
cID=2010&sIDType=CUID
Description of
parameter
Central Management Server
(CMS) object
identifier type.
Mandatory?
Yes if the target
is a Crystal report
or OLAP Intelligence report
(sType=rpt or
=car ) in an Object Package
(otherwise, use
sPath and sDoc
Name )
Values accepted
for parameter
• CUID
• GUID
• RUID
• ParentID
• InfoObjectID
(default)
sKind
Parameter syntax
Description of
parameter
Mandatory?
Values accepted
for parameter
sKind
The file type of
target Desktop Intelligence document.
BusinessObjects Set Analysis User Guide 77
Yes if the target
is a Desktop Intelligence document
(otherwise, use
sType )
• FullClient
Page 78

Set analytics
4
Linking from goal, universe query and metric-based analytics
Example:
http://<servername>:<port>/OpenDocument/<platformSpecif
ic>?sKind=FullClient
sPath
Parameter syntax
sPath
Example:
http://<servername>:<port>/OpenDocument/<platformSpecif
ic>?sPath=[Sales+Reports]&sDocName=Sales+in+2005
Description of
parameter
The name of the
folder and subfolder containing the
target document.
Mandatory?
Yes if sDocName
is specified and is
not unique.
Values accepted
for parameter
Folder and/or
subfolder:
[folder],[subfolder]
sType
Parameter syntax
sType
Description of
parameter
The file type of
target document
or report.
Mandatory?
Yes, but ignored
for agnostic documents
Values accepted
for parameter
•
wid
•
rpt
•
car
Example:
http://<servername>:<port>/OpenDocument/<platformSpecif
ic>?sType=wid
78 BusinessObjects Set Analysis User Guide
Page 79
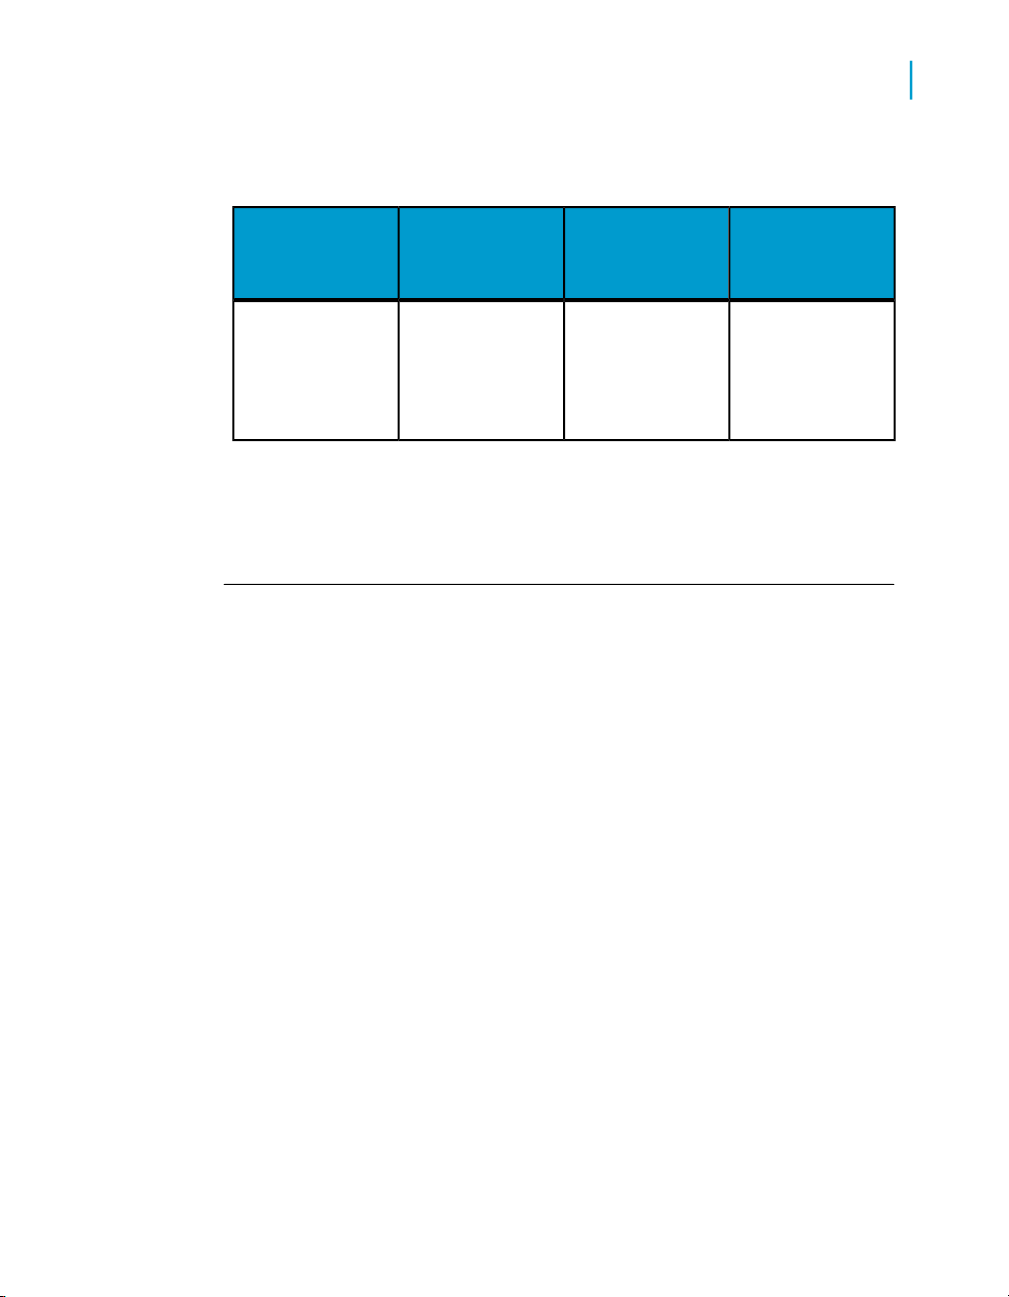
token
Set analytics
Linking from goal, universe query and metric-based analytics
4
Parameter syntax
token
Example:
http://<servername>:<port>/OpenDocument/<platformSpecif
ic>?sType=wid&sDocName=Sales+in+2003&token=<logonToken>
Description of
parameter
A valid logon token for the current CMS session.
Mandatory?
No
Values accepted
for parameter
The logon token
for the current
CMS session.
OpenDocument Input parameters
The following tables list the openDocument input parameters:
Note: Variables are denoted with angle brackets. You must substitute the
proper value for these variables. For example, you must use the name of
your server in place of <servername> where it is contained in the code
samples below, and you must use your port number in place of <port>.
BusinessObjects Set Analysis User Guide 79
Page 80

Set analytics
4
Linking from goal, universe query and metric-based analytics
lsC
Parameter syntax
lsC
Example:
http://<servername>:<port>/OpenDocument/<platformSpecif
ic>?sType=wid&sDocName=SalesReport&iDocID=2010&lsC=Sales
Description of
parameter
Specifies a contextual prompt if
there is an ambiguity during SQL
generation (Business Objects and
Web Intelligence
documents only).
Note: Not sup-
ported by OLAP
Intelligence
Mandatory?
No
Values accepted
for parameter
A prompt value
that resolves the
ambiguity in the
SQL generation.
80 BusinessObjects Set Analysis User Guide
Page 81

lsM[NAME]
Set analytics
Linking from goal, universe query and metric-based analytics
4
Parameter syntax
lsM[NAME]
Description of
parameter
Specifies multiple
values for a
prompt. [NAME]
is the text of the
prompt.
Mandatory?
No
Values accepted
for parameter
BusinessObjects Set Analysis User Guide 81
Page 82

Set analytics
4
Linking from goal, universe query and metric-based analytics
Parameter syntax
Description of
parameter
Mandatory?
Values accepted
for parameter
• Multiple
prompt values,
separated by
a comma. If
the target is a
Crystal report,
each value
must be enclosed in
square brackets. If the target is a OLAP
Intelligence report, use the
MDX WITH
clause (refer
to Using the
lsS parameter
with OLAP Intelligence reports on page
70 and Using
the lsM parameter with
OLAP Intelligence reports
on page 71).
82 BusinessObjects Set Analysis User Guide
• no_value (only
for optional
parameters)
Note: You
can remove
an optional
Page 83

Set analytics
Linking from goal, universe query and metric-based analytics
4
Parameter syntax
Example:
http://<servername>:<port>/OpenDocument/<platformSpecif
ic>?sType=rpt&sDocName=SalesReport&lsMSe
lect+Cities=[Paris],[London]
Description of
parameter
Mandatory?
Values accepted
for parameter
parameter
from the
prompt by setting it to
no_value in
the OpenDocument query
string. If you
leave an optional parameter out of the
OpenDocument query
string, a default parameter value will
be applied.
BusinessObjects Set Analysis User Guide 83
Page 84
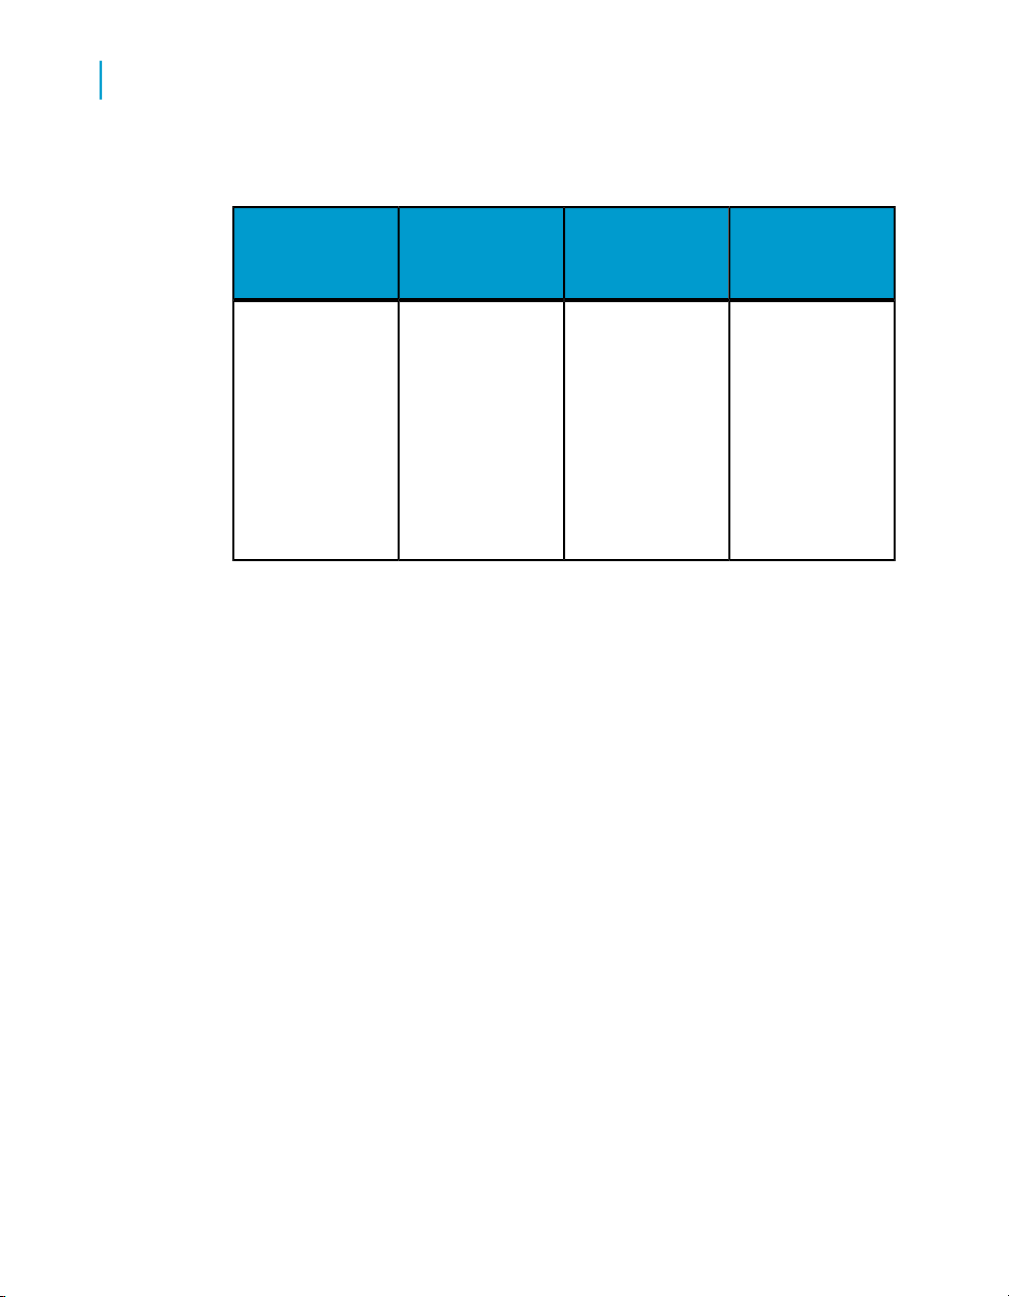
Set analytics
4
Linking from goal, universe query and metric-based analytics
lsR[NAME]
Parameter syntax
lsR[NAME]
Description of
parameter
Specifies a range
of values for a
prompt. [NAME]
is the text of the
prompt.
Note: Not sup-
ported by OLAP
Intelligence
Mandatory?
No
Values accepted
for parameter
84 BusinessObjects Set Analysis User Guide
Page 85

Set analytics
Linking from goal, universe query and metric-based analytics
4
Parameter syntax
Description of
parameter
Mandatory?
Values accepted
for parameter
• A range of val-
ues for the
prompt, separated by a
double period
(..). If the target is a Crystal report, the
range must be
enclosed in
square brackets and/or
parentheses
(use a square
bracket next to
a value to include it in the
range, and
parentheses
to exclude it).
• no_value (only
for optional
parameters)
Note: You
can remove
an optional
parameter
from the
prompt by setting it to
no_value in
the OpenDocument query
BusinessObjects Set Analysis User Guide 85
Page 86

Set analytics
4
Linking from goal, universe query and metric-based analytics
Parameter syntax
Example:
http://<servername>:<port>/OpenDocument/<platformSpecif
ic>?sType=rpt&sDocName=SalesReport&lsRTime+Period:=[2000..2004)
Description of
parameter
Mandatory?
Values accepted
for parameter
string. If you
leave an optional parameter out of the
OpenDocument query
string, a default parameter value will
be applied.
86 BusinessObjects Set Analysis User Guide
Page 87

lsS[NAME]
Set analytics
Linking from goal, universe query and metric-based analytics
4
Parameter syntax
lsS[NAME]
Description of
parameter
Specifies a value
for a single
prompt. [NAME]
is the text of the
prompt.
Mandatory?
No
Values accepted
for parameter
BusinessObjects Set Analysis User Guide 87
Page 88

Set analytics
4
Linking from goal, universe query and metric-based analytics
Parameter syntax
Description of
parameter
Mandatory?
Values accepted
for parameter
• A single
prompt value
(refer to Using
the lsS parameter with
OLAP Intelligence reports
on page 70
and Using the
lsM parameter
with OLAP Intelligence reports on
page 71).
• no_value (only
for optional
parameters)
Note: You
can remove
an optional
parameter
from the
prompt by setting it to
no_value in
the OpenDocument query
string. If you
leave an optional parameter out of the
OpenDocument query
88 BusinessObjects Set Analysis User Guide
Page 89

Set analytics
Linking from goal, universe query and metric-based analytics
4
Parameter syntax
Example:
http://<servername>:<port>/OpenDocument/<platformSpecif
ic>?sType=wid&sDocName=SalesReport&iDocID=2010&lsSSe
lect+a+City=Paris
Description of
parameter
Mandatory?
Values accepted
for parameter
string, a default parameter value will
be applied.
sInstance
Parameter syntax
Description of
parameter
Mandatory?
Values accepted
for parameter
•
User (Link to
latest instance
owned by current user)
sInstance
Indicates which
specific instance
of the target report to open.
BusinessObjects Set Analysis User Guide 89
No (use with
sDocName and
lsS[NAME])
•
Last (Link to
latest instance
for report)
•
Param (Link to
latest instance
of report with
matching parameter values)
Page 90

Set analytics
4
Linking from goal, universe query and metric-based analytics
Example:
http://<servername>:<port>/OpenDocument/<platformSpecif
ic>?sPath=[Sales+Reports]&sDocName=Sales+in+2003&sReport
Part=Part1&sInstance=User
sPartContext
Parameter syntax
sPartContext
Example:
http://<servername>:<port>/OpenDocument/<platformSpecif
ic>?sPath=[Sales+Reports]&sDocName=Sales+in+2005&sReport
Part=Part1&sPartContext=0-4-0
Description of
parameter
In Crystal Reports, a report
part is associated
to a data context.
Mandatory?
Yes if a value is
specified for sRe
portPart
Values accepted
for parameter
Data context of
the report part.
sRefresh
Parameter syntax
sRefresh
Description of
parameter
Indicates whether
a refresh should
be forced when
the target document or report is
opened.
Mandatory?
No
Values accepted
for parameter
•
Y (forces the
document’s
refresh)
•
N (note that
the refresh on
open feature
overrides this
value)
90 BusinessObjects Set Analysis User Guide
Page 91

Set analytics
Linking from goal, universe query and metric-based analytics
Example:
http://<servername>:<port>/OpenDocument/<platformSpecif
ic>?sType=wid&sDocName=SalesReport&iDocID=2010&sRefresh=Y
sReportMode
4
Parameter syntax
sReportMode
Example:
http://<servername>:<port>/OpenDocument/<platformSpecif
ic>?sPath=[Sales+Reports]&sDocName=Sales+in+2003&sReport
Part=Part1&sReportMode=Part
Description of
parameter
For Crystal targets only, indicates whether the
link should open
the full target report or just the report part specified
in sReportPart.
Mandatory?
No (default is
Full)
Only applies if a
value is specified
for sReportPart
Values accepted
for parameter
•
Full
•
Part
BusinessObjects Set Analysis User Guide 91
Page 92
Set analytics
4
Linking from goal, universe query and metric-based analytics
sReportName
Parameter syntax
sReportName
Example:
http://<servername>:<port>/OpenDocument/<platformSpecif
ic>?sType=wid&sDocName=Sales+in+2003&sReportName=First+Re
port+Tab
Description of
parameter
Indicates which
report to open if
target document
is multi-report.
Mandatory?
No (default is the
first report)
Values accepted
for parameter
Report name for
Web Intelligence
documents, subreport for Crystal
Reports, pages
for OLAP Intelligence reports.
sReportPart
Parameter syntax
Description of
parameter
Mandatory?
Values accepted
for parameter
Indicates which
sReportPart
Example:
http://<servername>:<port>/OpenDocument/<platformSpecif
ic>?sPath=[Sales+Reports]&sDocName=Sales+in+2003&sReport
Part=Part1
92 BusinessObjects Set Analysis User Guide
specific part of
the target report
to open.
No
Name of the report part.
Page 93

Set analytics
Linking from goal, universe query and metric-based analytics
OpenDocument Output parameters
The following tables list the openDocument output parameters:
Note: Variables are denoted with angle brackets. You must substitute the
proper value for these variables. For example, you must use the name of
your server in place of <servername> where it is contained in the code
samples below, and you must use your port number in place of <port>.
NAII
4
Parameter syntax
NAII
Example:
http://<servername>:<port>/OpenDocument/<platformSpecif
ic>?sType=wid&sDocName=SalesReport&iDocID=2010&NAII=Y
Description of
parameter
Forces the display of the
prompt selection
page.
Note: Not sup-
ported by OLAP
Intelligence
Mandatory?
No
Values accepted
for parameter
•
Y (all prompts
whose values
are passed
with lsS, lsM
or lsR are preselected)
•
N (displays
only the
prompts
whose values
passed with
lsS, lsM or
lsR)
BusinessObjects Set Analysis User Guide 93
Page 94

Set analytics
4
Linking from goal, universe query and metric-based analytics
sOutputFormat
Parameter syntax
sOutputFormat
Example:
http://<servername>:<port>/OpenDocument/<platformSpecif
ic>?sPath=[Sales+Reports]&sDocName=Sales+in+2003&sOutputFor
mat=E
Description of
parameter
Indicates the format in which the
target document
is opened.
Mandatory?
No (default is
HTML if the parameter is not
specified in the
link)
Values accepted
for parameter
• H (HTML)
• P (PDF)
• E (Excel)
• W (Word)
sViewer
Parameter syntax
sViewer
Description of
parameter
Indicates the
viewer that is
used to view the
document.
Mandatory?
No
Values accepted
for parameter
• html
• actx (Crystal
reports only)
• java (Crystal
reports only)
Example:
http://<servername>:<port>/OpenDocument/<platformSpecif
ic>?sPath=[Sales+Reports]&sDocName=Sales+in+2003&sViewer=html
94 BusinessObjects Set Analysis User Guide
Page 95

Set analytics
Linking from goal, universe query and metric-based analytics
Example:
Note: In order to use parameters in the URL with the ActiveX viewer, :connect
must be appended to the URL, followed by the parameters.
http://<servername>:<port>/OpenDocument/<platformSpecif
ic>?sPath=[Sales+Reports]&sDocName=Sales+in+2003&sViewer=ac
tx:connect&IsMCountry=[Thailand],[Norway]
sWindow
4
Parameter syntax
sWindow
Example:
http://<servername>:<port>/OpenDocument/<platformSpecif
ic>?sType=wid&sDocName=SalesReport&iDocID=2010&sWindow=New
Description of
parameter
Indicates whether
the target report
will open in the
current browser
window or
whether a new
window will be
launched.
Mandatory?
No
Values accepted
for parameter
•
Same (current
browser window)
•
New (new
browser window is
launched)
Contextual report linking
The openDocument feature allows you to create contextual links between
Crystal reports, OLAP Intelligence reports and Web Intelligence documents.
To do this, you construct a URL using the openDocument syntax and then
insert the URL into a Crystal report, OLAP Intelligence report or Web
Intelligence document.
Contextual report linking allows report designers to specify associations for
documents residing in either a Crystal Reports environment (unmanaged)
or a BusinessObjects Enterprise environment (managed). Once these
BusinessObjects Set Analysis User Guide 95
Page 96

Set analytics
4
Linking from goal, universe query and metric-based analytics
associations are created, users follow the resulting navigational paths
embedded in the linked documents.
This feature enables you to invoke Business Objects and Web Intelligence
documents from Crystal Reports and vice versa. This feature relies on
functionality that allows the user to do the following:
• Link Web Intelligence or Business Objects documents within the document
domain.
• Link report objects in Crystal Reports.
Click the appropriate link to jump to that section:
•
To insert a link into a Crystal report on page 96
•
To create a link to another report or document from an OLAP Intelligence
report on page 97
•
Creating links in Web Intelligence documents on page 97
To insert a link into a Crystal report
You can use openDocument to create hyperlinks in Crystal Reports. To
create a link to another report or document, use the Hyperlink Tab of the
field Format Editor.
1. Open the source report in Crystal Reports.
2. Right-click the field in which you want to insert the openDocument link
and select Format from the shortcut menu.
3. In the Format Editor, select the Hyperlink tab.
4. Select A website on the Internet.
5. In the “Hyperlink information” area, leave the Website Address field empty
and click the Format Formula Editor button.
6. Enter the openDocument link in the following format:
"http://[openDocument parameters]"+{Article_lookup.Fami
ly_name}
Where [openDocument parameters] are described in OpenDocument
parameter overview on page 72, and the {Article_lookup.Family_name}
enables the report to pass context-dependent data.
Note: Test your link in a browser window before inserting it into a report
or document.
96 BusinessObjects Set Analysis User Guide
Page 97

Set analytics
Linking from goal, universe query and metric-based analytics
7. Click Save and Close to leave the Formula Workshop.
8. Click OK in the Formula Editor to save the link.
To create a link to another report or document from an OLAP Intelligence report
You can use openDocument to create hyperlinks in OLAP Intelligence reports.
1. Open the source report in the OLAP Intelligence designer.
2. On the Tools menu, select Action Manager .
3. Click New to create a new action.
4. Enter an action name.
5. Select the area to which the action (the link) will apply.
6. Enter the openDocument link using the parameters and syntax described
in this document.
Tip: Test your link in a browser window before inserting it into a report
or document.
7. Click OK to save the link.
8. Close the Action Manager dialog box.
9. Create an Analysis Button on the source report.
10. Right-click the Analysis Button.
11. In the drop-down menu, select Properties and then Edit .
12. Select Launch an action .
13. Select the action that corresponds to the openDocument link created in
steps 3 through 6.
14. Click OK .
4
Creating links in Web Intelligence documents
You can define objects in a universe that allow Web Intelligence and
BusinessObjects users to create reports whose returned values include links
to other reports and documents.
When these reports are exported to the repository, users can click returned
values displayed as hyperlinks to open another related document stored in
the document domain of the repository.You create these links using the
openDocument function in the definition of an object in Designer.
BusinessObjects Set Analysis User Guide 97
Page 98

Set analytics
4
Linking from goal, universe query and metric-based analytics
More information
For full information on creating links in Web Intelligence reports, see the
Building Reports Using the WebIntelligence Java Report Panel guide.
You enable report linking in a universe by creating an object (the link object)
whose returned values are the same as the values used as input to a prompt
in an existing report (the target report).
The openDocument function allows the values for the link object to be
returned as hyperlinks. When the user clicks the hyperlink, its value is used
as the prompt input for the target report.
You can create documents using the link object as you would with any other
object. Users can then click the hyperlinks to access more detailed documents
related to the link object.
To create a link object, use the openDocument function in the object’s Select
statement. The Select statement for a link object follows this order:
'<a href="http://<servername>:<port>/OpenDocument/<platformSpe
cific>?sDocName=<document name>&sType=<document type>&iDo
cID=<document id>&lsS<prompt message>='+object SELECT+'">'+ob
ject SELECT+'</a>'
The concatenation operator (+) applies for Microsoft Access databases. Use
the operator appropriate to your target RDBMS.
For more details on the Select statement, creating link objects, and using
link objects in InfoView, refer to the Designer’s Guide.
Sending information to the Viewer analytic in a dashboard using openAnalytic
Using the openAnalytic syntax, you can send information from the following
documents saved on the Central Management Server (CMS) to a Viewer
analytic on a dashboard:
• Web Intelligence reports
• Crystal Reports
• Text analytic
• Desktop Intelligence reports
• Web page analytic
98 BusinessObjects Set Analysis User Guide
Page 99

Set analytics
Linking from goal, universe query and metric-based analytics
Sample syntax:
<a href='http://[WEB APPLICATION LOCATION]
aa-open-inlist.jsp?url=openAnalytic.jsp?
DocumentName=text+analytic&RepositoryType=C
&RepositoryName=PM&DocumentExt=afd
&DocumentId=AQ74dXHxW59HlHvZivNsypI&mode=full
' target='hiddenFrame'>[LINK NAME IN DASHBOARD]</a>
The key items in the sample are aa-open-inlist.jsp and target='hiddenframe'.
1. In a text editor, copy and paste the sample syntax.
2. Replace [WEB APPLICATION LOCATION] with the web application
location after http://.
For example: http://<server>:<port>/PerformanceManagement/jsp
3. Enter the correct information after the variables.
4. Replace [LINK NAME IN DASHBOARD] with the name of the link as you
want it to appear.
5. Copy and paste the text in the following location:
• For a Web Intelligence, Crystal Report or Desktop Intelligence report,
copy the text in the cell of the query and then run a report.
• For a Text analytic, go to the edit mode and paste the text in the "Enter
text or HTML to display" text box and select html. Save the analytic
in the public folders.
• For a Web page analytic, go to the edit mode and in the "Content"
tab paste the text in the "Enter the web page URL" text box and click
OK. In the "Layout" tab, select from the "Display as" section A link,
so only the name is visible.
4
6. In InfoView, go to DashboardsCreate Corporate Dashboard.
7. Enter the title, select a public folder, and click OK.
8. Click DashboardsOrganize Corporate Dashboards, and select your
dashboard.
9. Click Edit Dashboard.
10. From the "Analytic Toolbox", expand the "Corporate Analytics" list
to find your report, and drag it to the dashboard layout.
11. From the "Analytic Toolbox", expand the "New Analytic" list, and drag
the "Viewer" analytic from the list to the dashboard layout.
12. Click Save, then Exit Edit Mode.
Click on any linked item in the report and the destination appears in the
viewer.
BusinessObjects Set Analysis User Guide 99
Page 100

Set analytics
4
Individual Set Analysis analytics
Individual Set Analysis analytics
Individual analysis delivers detailed historical information describing the
evolution of an individual's relationship to the business. It can be used to
profile customers, products and partners. Individual analysis supports
discovery of pattern that occurs over a period of time, which can lead to new
ideas for segmentation. It delivers not only individual-level attribute data, but
also the information needed to understand relationship history.
For example, high value customer profiling can uncover patterns that foretell
high value behavior within a set. An individual behavior can be a benchmark
to a wider population within the set.
The "Individual" tab in Set Analysis shows samples of analytics that analyze
the behavior of the selected individual in relation with one or more sets:
• Profiler
• Individual portrait
• Membership
• Current membership
• Membership history
• Membership summary
• Sample metrics analytics for set analysis
• Metric trends
• Metrics summary
• Set vs individual
Profiler
The Profiler analytic, available in Set Analysis, analyzes the individual level
information at the membership and metric levels. Use Individual Profiler to
create sets to profile your customers in ways that answer your business
questions.
Individual customers can belong to more than one set, or interest group. For
example, individual customers can belong to a specific age group,
geographical location, or marital status.
100 BusinessObjects Set Analysis User Guide
 Loading...