


Dashboard Manager User’s Guide
Dashboard Manager 6.5.1

2 Dashboard Manager User’s Guide
Copyright
Trademarks
Use restrictions
Patents
Part Number
No part of the computer software or this document may be reproduced or transmitted in any form
or by any means, electronic or mechanical, including photocopying, recording, or by any
information storage and retrieval system, without permission in writing from Business
Objects S.A.
The information in this document is subject to change without notice. If you find any problems
with this documentation, please report them to Business Objects S.A. in writing at
documentation@businessobjects.com.
Business Objects S.A. does not warrant that this document is error free.
Copyright © Business Objects S.A. 2005. All rights reserved.
Printed in United States of America.
The Business Objects logo, WebIntelligence, BusinessQuery, the Business Objects tagline,
BusinessObjects, BusinessObjects Broadcast Agent, Rapid Mart, Set Analyzer, Personal
Trainer, and Rapid Deployment Template are trademarks or registered trademarks of Business
Objects S.A. in the United States and/or other countries.
All other company, product, or brand names mentioned herein, may be the trademarks of their
respective owners.
This software and documentation is commercial computer software under Federal Acquisition
regulations, and is provided only under the Restricted Rights of the Federal Acquisition
Regulations applicable to commercial computer software provided at private expense. The use,
duplication, or disclosure by the U.S. Government is subject to restrictions set forth in
subdivision (c)(1)(ii) of the Rights in Technical Data and Computer Software clause at 252.227-
7013.
U.S. Patent Numbers 5,555,403, 6,247,008 and 6,578,027.
3C1-50-600-01

Dashboard Manager User’s Guide 3
Contents
Preface Maximizing Your Information Resources 5
It’s in the documentation . . . . . . . . . . . . . . . . . . . . . . . . . . . . . . . . . . . . . . . .6
Reader’s comments form . . . . . . . . . . . . . . . . . . . . . . . . . . . . . . . . . . . . . . . . 8
Chapter 1 Understanding Dashboard Manager 9
What is Dashboard Manager? . . . . . . . . . . . . . . . . . . . . . . . . . . . . . . . . . . . 11
Important concepts . . . . . . . . . . . . . . . . . . . . . . . . . . . . . . . . . . . . . . . . . . . . 14
Login . . . . . . . . . . . . . . . . . . . . . . . . . . . . . . . . . . . . . . . . . . . . . . . . . . . . . . 15
Chapter 2 Navigation within Dashboard Manager 17
Site map for Dashboard Manager . . . . . . . . . . . . . . . . . . . . . . . . . . . . . . . . 19
Navigating in Dashboard Manager . . . . . . . . . . . . . . . . . . . . . . . . . . . . . . . . 20
Chapter 3 My Dashboard 23
Add/customizing a page . . . . . . . . . . . . . . . . . . . . . . . . . . . . . . . . . . . . . . . . 25
Customize an analytic layout . . . . . . . . . . . . . . . . . . . . . . . . . . . . . . . . . . . . 33
Retrieving analytic from inbox . . . . . . . . . . . . . . . . . . . . . . . . . . . . . . . . . . . 38
Chapter 4 Analytic Properties 41
Chapter 5 Options 51
Options . . . . . . . . . . . . . . . . . . . . . . . . . . . . . . . . . . . . . . . . . . . . . . . . . . . . . 53
Chapter 6 Application Builder 61
Create an application . . . . . . . . . . . . . . . . . . . . . . . . . . . . . . . . . . . . . . . . . .63
Copy an application . . . . . . . . . . . . . . . . . . . . . . . . . . . . . . . . . . . . . . . . . . . 67
Chapter 7 Metrics 73
Metrics . . . . . . . . . . . . . . . . . . . . . . . . . . . . . . . . . . . . . . . . . . . . . . . . . . . . . 74
Dimension . . . . . . . . . . . . . . . . . . . . . . . . . . . . . . . . . . . . . . . . . . . . . . . . . .97
Contents

4 Dashboard Manager User’s Guide
Chapter 8 Metric Tree 105
Overview . . . . . . . . . . . . . . . . . . . . . . . . . . . . . . . . . . . . . . . . . . . . . . . . . . 106
Metric tree analytic . . . . . . . . . . . . . . . . . . . . . . . . . . . . . . . . . . . . . . . . . . 114
Chapter 9 Rules 123
Add a new rule . . . . . . . . . . . . . . . . . . . . . . . . . . . . . . . . . . . . . . . . . . . . . 153
Named event . . . . . . . . . . . . . . . . . . . . . . . . . . . . . . . . . . . . . . . . . . . . . . . 167
Chapter 10 Scheduler 171
Edit/delete task . . . . . . . . . . . . . . . . . . . . . . . . . . . . . . . . . . . . . . . . . . . . . 176
Chapter 11 Metric Analytics 177
Trend analysis . . . . . . . . . . . . . . . . . . . . . . . . . . . . . . . . . . . . . . . . . . . . . . 178
Alerts and monitors . . . . . . . . . . . . . . . . . . . . . . . . . . . . . . . . . . . . . . . . . . 194
Comparison . . . . . . . . . . . . . . . . . . . . . . . . . . . . . . . . . . . . . . . . . . . . . . . . 226
Deviation . . . . . . . . . . . . . . . . . . . . . . . . . . . . . . . . . . . . . . . . . . . . . . . . . . 240
Chapter 12 Statistical Analytics 245
Forecasters . . . . . . . . . . . . . . . . . . . . . . . . . . . . . . . . . . . . . . . . . . . . . . . . 246
Correlation . . . . . . . . . . . . . . . . . . . . . . . . . . . . . . . . . . . . . . . . . . . . . . . . . 262
Projection and distribution . . . . . . . . . . . . . . . . . . . . . . . . . . . . . . . . . . . . . 266
Chapter 13 Other Analytics 269
Create new analytic . . . . . . . . . . . . . . . . . . . . . . . . . . . . . . . . . . . . . . . . . . 271
Create OLAP documents . . . . . . . . . . . . . . . . . . . . . . . . . . . . . . . . . . . . . 273
Text/HTML analytic . . . . . . . . . . . . . . . . . . . . . . . . . . . . . . . . . . . . . . . . . . 276
Navigation list . . . . . . . . . . . . . . . . . . . . . . . . . . . . . . . . . . . . . . . . . . . . . . 278
Web page analytic . . . . . . . . . . . . . . . . . . . . . . . . . . . . . . . . . . . . . . . . . . . 282
Viewer analytic . . . . . . . . . . . . . . . . . . . . . . . . . . . . . . . . . . . . . . . . . . . . . 284
Group analytic . . . . . . . . . . . . . . . . . . . . . . . . . . . . . . . . . . . . . . . . . . . . . . 287
Appendix A Glossary of Terms 289
Index 293
Contents
Maximizing Your Information Resources
preface

6 Dashboard Manager User’s Guide
It’s in the documentation
Dashboard Manager documentation strives to deliver product information that is
rich, convenient, and easy-to-use.
Whether you’re a novice or experienced user, Dashboard Manager
documentation is the place to go for discovering our products, exploring their
features, or locating precise information.
Product information has been substantially expanded to encompass not only
facts about product features but also tips, samples, and troubleshooting
instructions.
For your convenience, our documentation is available from all products in
Acrobat PDF, and print media.
Documentation has been designed first and foremost with speed and ease of
navigation in mind. All the information you require is readily available just a few
mouse clicks away.
The next sections highlight new and key features of our documentation.
About this guide
This guide describes the various concepts, tasks, and procedures required to use
the dashboard manager.
This guide covers everything you need to know about dashboard manager. It
may not be exactly what you see in the application. The reason being that your
system administrator may have created a new application from the start and with
a different look and feel. To search for anything specific use the index.
Audience
This guide is intended for anyone interested in performing simple to complex
customer-related segment analysis from any Java-enabled Web browser that is
connected to the Internet or a corporate intranet.
Online guides
User’s guides
All Dashboard Manager user’s guides are available as Acrobat Portable
Document Format (PDF) files. Designed for online reading, PDF files enable you
to view, navigate through, or print any of their contents.
Maximizing Your Information Resources

From a PDF file, you can search for specific occurrences of a word using the Find
command, or navigate to the exact location of a topic by clicking a crossreference or an entry in the Index or Table of Contents.
To open a document, you can select it from the Help menu provided that you
have installed the Adobe Reader, version 5.0 on your machine. You can
download it for free from Adobe Corporation’s web site at:
http://www.adobe.com/products/acrobat/readstep.html
What to do for more information
If you cannot find the information you are looking for, then we encourage you to
let us know as soon as you can. Feel free to send us any requests, tips,
suggestions, or comments you may have regarding this or other Application
Foundation documentation using the Reader’s Comment Form at the back of this
guide.
To search for anything specific use the index.
Below is a list of other Application Foundation guides:
• Set Analysis User Guide
• Predictive Analysis
• Process Analysis User Guide
• Performance Manager User Guide
• Application Foundation Installation Guide
• Application Foundation Configuration Guide
Dashboard Manager User’s Guide 7
It’s in the documentation

8 Dashboard Manager User’s Guide
Reader’s comments form
Dashboard Manager User’s Guide
Version 6.5.1
Part Number: 3C1-50-300-01
Your company’s name: _______________________________________
Company address: __________________________________________
Telephone/fax number: _____________ E-mail address: ____________
What is your job position? _____________________________________
How long have you been using Application Foundation? ________________
Business Objects welcomes your comments and suggestions on the qual ity and
usefulness of this publication. Your input is an important part of the information
used for revision.
If you find any errors or have any suggestions, please indi cate the topic, chapter
and page number below:
_______________________________________________________________
_______________________________________________________________
_______________________________________________________________
_______________________________________________________________
_______________________________________________________________
_______________________________________________________________
E-mail your comments to: documentationusa@businessobjects.com
Mail it to:
Technical Publications
Business Objects Americas
3030 Orchard Parkway,
San Jose, CA 95134
Maximizing Your Information Resources

Understanding Dashboard Manager
1
chapter

10 Dashboard Manager User Guide
Overview
This chapter helps you understand exactly what Dashboard Manager is, how it is
linked with Application Foundation and what you can do with the application. It
also highlights some important concepts that you may need to understand before
working on the application.
Understanding Dashboard Manager

What is Dashboard Manager?
Dashboard Manager is a rapid application development tool. It builds
applications without programming. It is very extensible and can be customized to
suit your needs. It also includes a catalog of predefined analytic techniques that
you can adapt as per your needs.
Dashboard Manager includes ready-to-use dashboard components that allow
easy development and deployment of management dashboards.
Dashboard Manager contains a set of powerful analytics which allows you to
create your own dashboard or view.
Dashboard Manager comes with powerful analytic engines that help customers
equip their business users with advanced analytics to make proactive de cisions,
based on constantly evolving business information.
With Dashboard Manager you can add analytics and customize their views to
provide personalized business insights. A business rules engine provides
automatic real time alerts and actions tha t operationalize analysis for closed-loop
optimization of any business process.
Since it has a web interface, Dashboard Manager can be deployed enterprisewide over an intranet or extranet. Using a standard Java-compliant web browser
from any internet connection, you can:
• analyze customer behavior over time to determine their lifetime value.
Analyzing customer behavior over time is often a better indicator of their value
than just measuring the value at a given time.
• respond in a very focused way to customer behavioral trends, resulting in
higher customer retention.
• distribute your analyses to those that need it as trend reports or as a list of
individual customers to target in a marketing campaign.
Dashboard Manager User Guide 11
What is Dashboard Manager?

12 Dashboard Manager User Guide
Customizing Dashboard Manager
You can maximize your efficiency by personalizing Dashboard Manager to
conform to and even enhance your working habits. Here are some ideas to get
you started.
Go straigh t to th e informatio n y ou need
Waste no time getting down to the vital tasks you perform most often. Here’s an
example of how to go straight to the information you need. You can set up My
Dashboard to instantly show the information you need by dividing the browser
window into several panels, each displaying different information.
Refer to, Navigation within Dashboard Manager on page 17.
Build ap p lications rapidly
Dashboard Manager provides a development environment that lets you build
applications quickly, without programming. Create new applications or extend
and customize existing ones with easy point and click assembly. You are allowed
to:
• develop without programming
The easy-to-use Dashboard guides you through structuring your web-based
application menus and hierarchy. After defining your structure, assembling
your application is as easy as selecting modular components and dropping
them onto the desired pages.
• select a template from a catalog of predefined analytic templates
With a varied and rich range of prebuilt analytic templates, Dashboard
Manager provides everything from overview analytics for management
dashboards to specialized forecasting algorithms. You can easily apply these
reusable analysis techniques to a broad range of business problems.
• extend and customize the application
Dashboard Manager provides a rich set of techniques for making applications
look and work the way you want. A simple web interface puts you in control of
XML power to define content, look, and feel. And you can easily incorporate
existing content, such as BusinessObjects reports. Users can even customize
their own application views, while you retain administrative control.
Unique analytic techniques
Dashboard Manager analytics package advanced techniques and metadata i nto
reusable components. Metrics, Rules, and Alerts are the bedrock upon which
applications operationalize analysis for end-to-end business solutions:
Understanding Dashboard Manager

Dashboard Manager User Guide 13
• Metrics represent a high performance aggregate for traversing key business
indicators through time.
• Rules and Alerts automate the process of change detection, interpret the
change and take appropriate strategic action by delivering relevant analysis
to key individuals or operational systems.
All of these unique technologies help your applications answer the difficult
questions about what is changing in your business, and why.
Customizing user views
Once the application has been customized, you can personalize your
dashboards to include existing analytics, or setting user-specific alerts and
metrics.
Sophisticated navigation techniques
To implement analysis work flows using the powerful set of analytics. Appl ication
designers can implement analysis workflows that use navigation to move from
summary analytics like Speedometer to detail analytics like Interactive Metric
Trends; to detail analytics passing context between them. Executive users can
use these powerful analysis workflows on their dashboards for making superior
business decisions.
Operationalize analysis into action
Analysis is valuable only when it drives action. Yet turning analysis into action is
often the "missing link". Dashboard Manager closes the gap with business rules
that drive alerts and automatic actions in response to changes in any key metric.
The Business Rules Engine lets your application monitor changes in your data,
interpret the results based on parameters you set, and trigger alerts to managers
or automatic action through operational systems.
What is Dashboard Manager?

14 Dashboard Manager User Guide
Important concepts
To get yourself off to a smooth start, you need to familiarize yourself with the
some principal concepts described below.
Page
The page contents occupy the largest frame in the browser window, and are the
part that most visibly changes as you navigate from page to page. You can
customize a page to your choice of colors and content.
Analytics
An analytic is a prebuilt analysis technique for extracting business insight from
data. Although an analytic may output to a report, analytics may also provide
such varied outputs as alerts, lists, interactive data visualization applets.
My Dashboard
My Dashboard refers to the component that is in essence the “management
dashboard” customized by individual users to contain analytics of importance to
them. This can be the first set of screens that you see when you log into. It is
where you take a quick look at what is important for you such as to see if there
are any alerts regarding important changes in the behavior of key customer s ets
that you need to follow up on.
My Dashboard can have several pages that allow you to see different levels of
information. The customizable interface enables you to build your own portfolio
of reports and categories.
Prompts
A prompt is a condition that lets you obtain the exact information you need for a
particular analytic filtered for that value. Based on the defined prompt you can
view the analytic document. A prompt is active when you refresh an analytic.
This feature is available for all analytics except SPC and Predictive Analytics.
Legends
A legend provides you with a guide for what you see when a analy tic is visualized.
Legend can also be used as a link that takes you straight to a report or analytic.
Understanding Dashboard Manager
Login
You log into Dashboard Manager to check the status of your portfolio, which
displays up-to-date information on your business. You log into Application
Foundation from where you can get into Dashboard Manager.
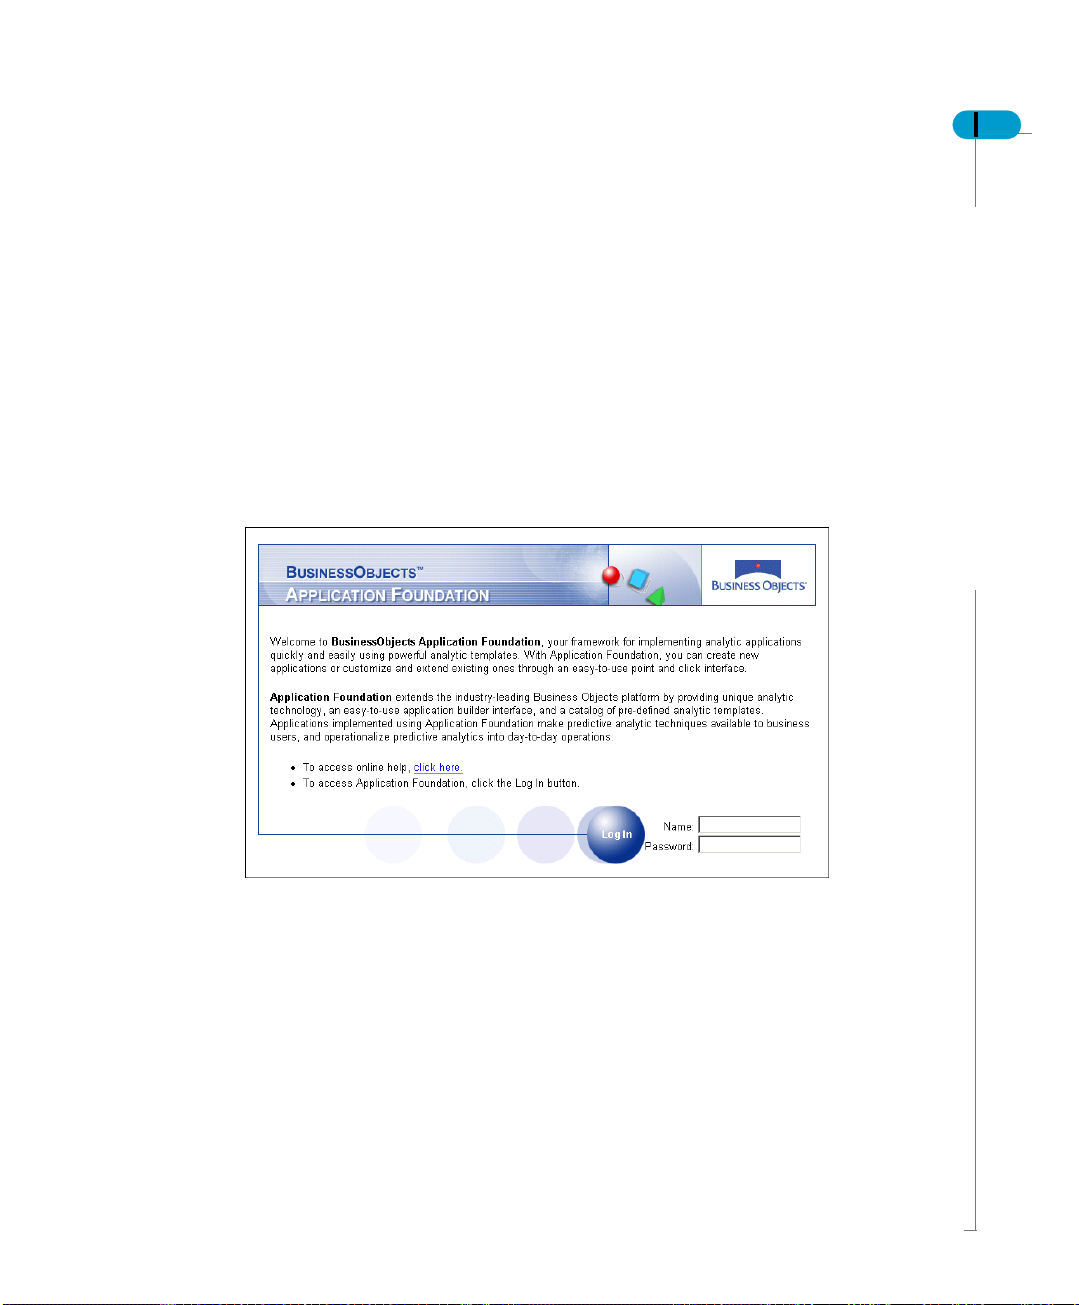
Logging into Application Foundation for the first time
If this is your first time logging into Application Foundation, do the following:
• Obtain a user name and password from your administrator.
• Obtain a URL to access Application Foundation from your administrator. It
has the following format but can be customized:
- http://{machine name}/apps:
Dashboard Manager User Guide 15
Logging out
To log into:
1. Click Log In.
2. Enter the User Name and Password, and click Enter.
When you have finished using Dashboard Manager, exit the application by
logging out of the product rather than by of closing your browser. This helps
system administrators keep track of which users are logged into the system and
active at any given time. This also allows the administrators to configure the
system to handle transaction loads most efficiently.
Login
16 Dashboard Manager User Guide
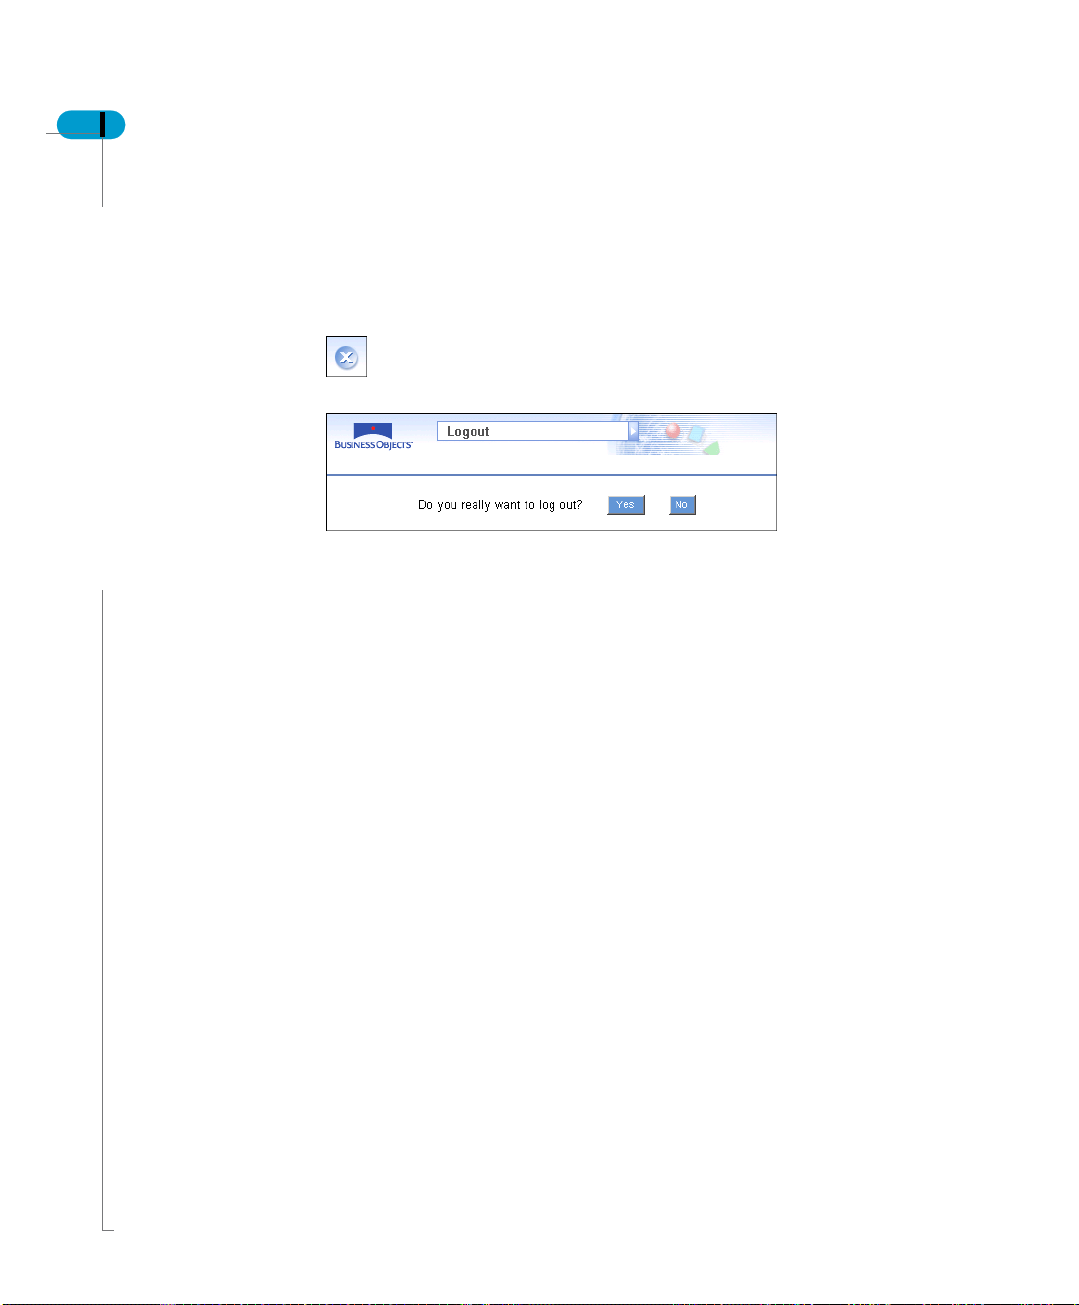
Logging out is easy. If you are inactive longer than the maximum time period
defined by your administrator, you are automatically logged out. You can also
actively log out at any time.
To log out:
1. Click Logout on the service bar.
The Logout page opens as shown below:
2. Click Yes.
If you decide you do not want to log out after all, do any of the following:
1. Click No.
2. Return to the previous HTML page you viewed by clicking the browser’s Back
button.
3. Go to any other part of Application Foundation by clicking a link in the
navigation bar.
Getting help
From the login page, familiarize yourself with the online help system by clicking
the button to the left. A PDF file opens the Adobe Reader window in your Web
browser that contains a table of contents, an index, and a search engine.
Understanding Dashboard Manager

Navigation within Dashboard Manager
2
chapter

18 Dashboard Manager User’s Guide
Overview
This chapter helps you understand exactly how Dashboard Manager works. It
highlights the navigation that is used throughout the application. You can learn
how to customize a page, analytic, and how to create you own dashboard.
Navigation within Dashboard Manager

Site map for Dashboard Manager
Below is a table that guides you through the entire application. The table gives
you an exact view of all the sub modules under each tab or page. The blue bar
represents the service bar within Application Foundation. As you click on each of
the links in the service bar, the respective options can be seen.
Dashboard Manager User’s Guide 19
Site map for Dashboard Manager

20 Dashboard Manager User’s Guide
Navigating in Dashbo ard Manag er
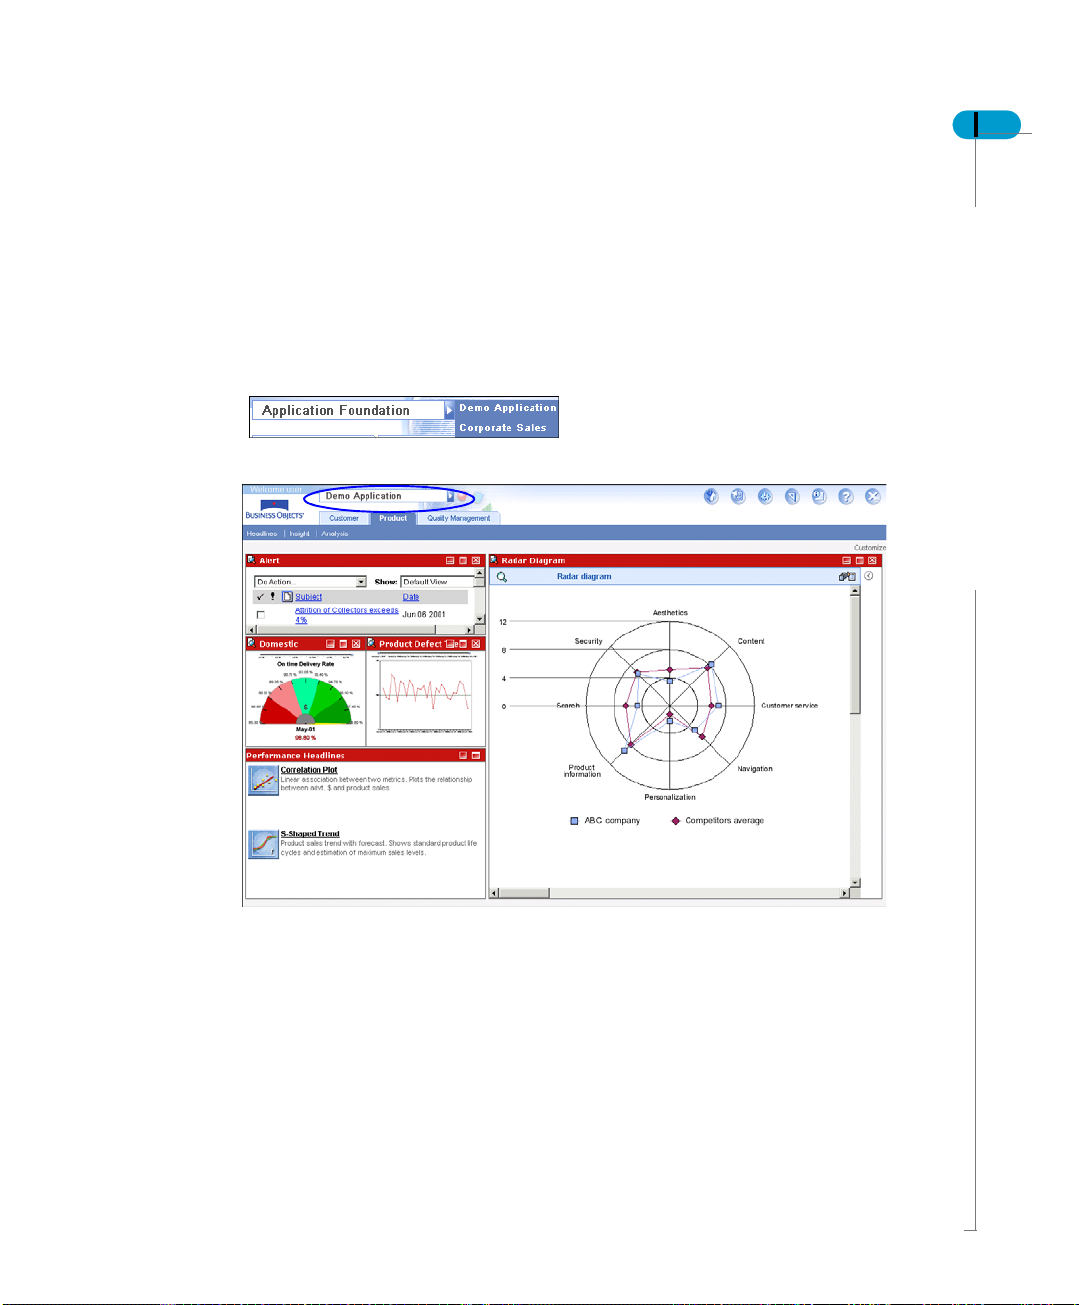
Once you get into Dashboard Manager, you can select the application you wish
to work in.
To get into Dashboard Manager, click the circled button on the image.
Once in the main page of Dashboard Manager, you can select the application.
There is also a Service Bar on the right side of every page, that allows you to
perform basic functions.
Home
My Dashboard
Those options are:
• Home - takes you back to the InfoView home page.
• My Dashboard- allows you to define your analytics page.
• Options - takes you to the set up user specified preferences that control the
user experience when interacting with Analytics provided by Application
Foundation.
• Set up - Setup assists the administrative user to configure and deploy
Navigation within Dashboard Manager
Setup
Application Foundation
Options
Help
Logout
Dashboard Manager User’s Guide 21
Application Foundation.
• Application Foundation - takes you to the page that allows you to build an
application and create documents.
• Help - connects you to the PDF format of the User Guides.
• Log out - allows you to logout of the application.
If you have more than one application, you can access these by clicking on the
Application Foundation drop down. Select the application you wish to change.
You will go into the selected application with its own tabs and sub tabs.
Navigating in Dashboard Manager

22 Dashboard Manager User’s Guide
Within an application there are modules or menus. As you select one application,
the respective modules or menus tabs are displayed. These menus are functions
within an application. If you click the menu within the application, there may or
may not be sub menus. Any associated sub-menus are displayed.
Selected application name
Menus under the selected applicat ion
Sub menus
Below are some of the icons that lead you to perform various functions:
Expand/Collapse - to expand or collapse the window frame.
Maximize/Restore
Expanded view
Remove
Link to document/analytic
Toggle to draft mode
Show prompts
Navigation within Dashboard Manager

My Dashboard
3
chapter

24 Dashboard Manager User’s Guide
Overview
This chapter takes you through the steps of laying out and configuring the
contents of your personalized portfolio. It gives you specific information for
customizing your analytic so that you can access all information you need quickly
and efficiently.
This chapter has two sections:
• Customizing My Dashboard
• Customizing any page in Dashboard Manager
Changes to My Dashboard affect your view only: other users are not able to see
the changes made. When you customize any page in the application, however,
you modify the view of all users. Everyone is able to view the changes being
made.
My Dashboard

Add/customizing a page
The My Dashboard component enables you to build a customized view. It also
provides an alerting feature that keeps you advised of important changes in the
behavior of key customer sets. My Dashboard is your space for building and
reviewing your personalized portfolio of Application Foundation.
In My Dashboard:
• The layout and content you configure for your analytics maximizes the
efficiency with which you gather information.
• My Dashboard enables you to configure your portfolio as per your choice of
content and layout.
• My Dashboard also enables you to browse important categories of
information, track specific reports, and monitor important web sites.
NOTE
To get to My Dashboard link on your service bar, please make sure that you go
into the Options and change the personalized version choice to My Dashboard.
Please refer to Display on page 53.
Dashboard Manager User’s Guide 25
Add a page
You add pages in My Dashboard. Three pages are created by default. You can
add as many pages as you need.
Add/customizing a page
26 Dashboard Manager User’s Guide
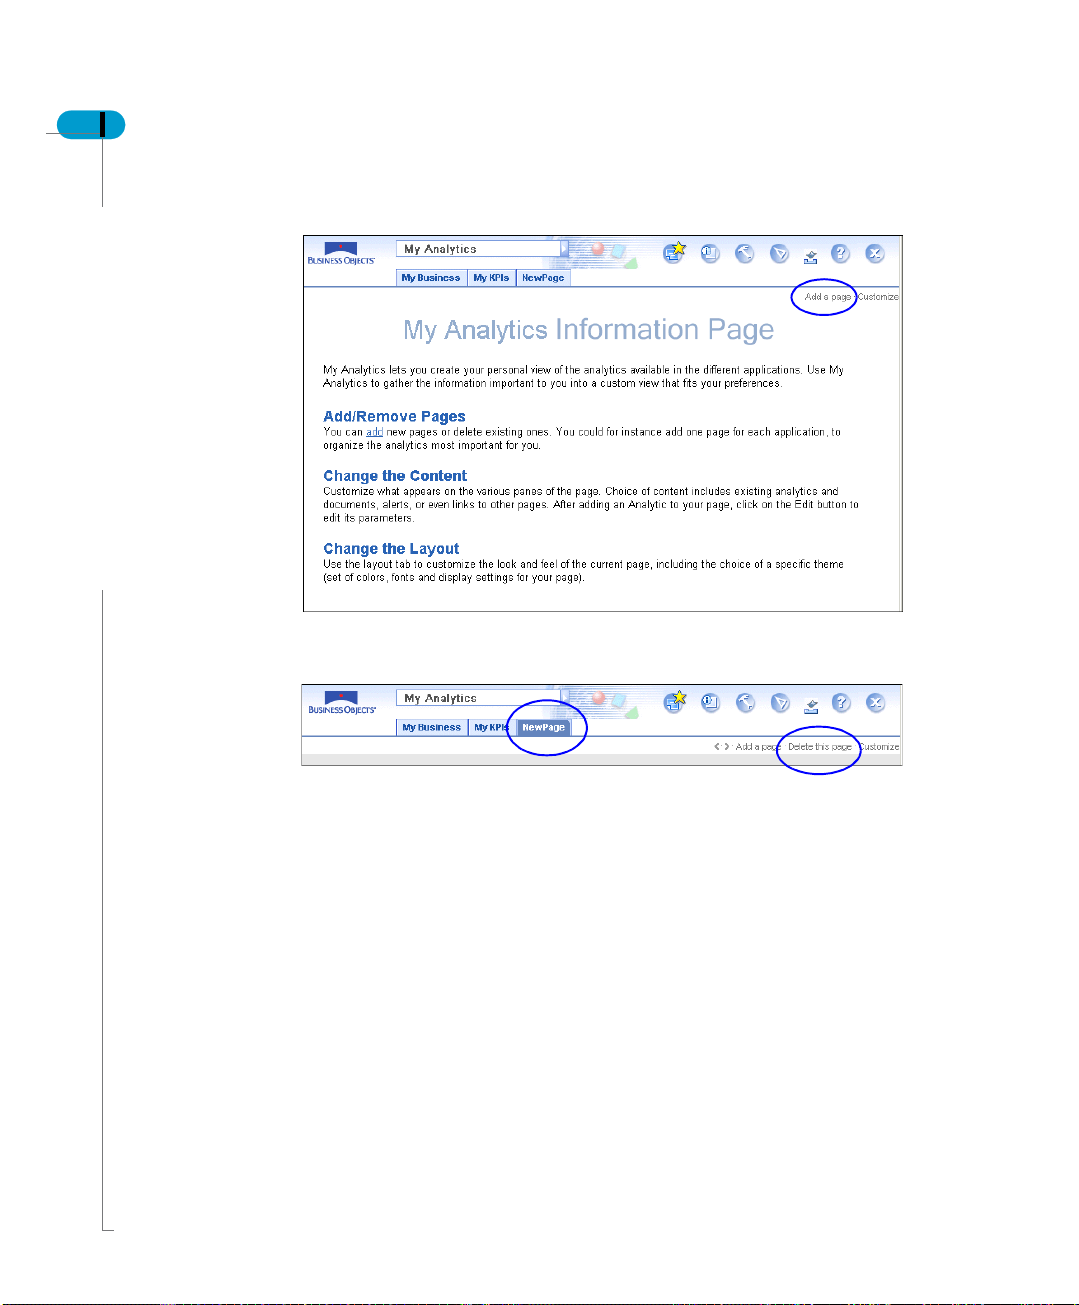
To add page click Add Page as shown in the image below.
A new page tab is added for each page that you add. You are free to customize
each new page.
Customize a new page
My Dashboard
You also have the option of deleting each page.
My Dashboard lets you create your personal view of the analytics available in the
different applications. Use My Dashboard to gather information important to you
into a view that supports your preferences.
When you customize a page, you define the content and layout for the new page
created. You also have the option of grouping various analytics in one.
Dashboard Manager User’s Guide 27
Customize page content
You can configure My Dashboard to display the following types of analytics:
• Analytic catalog
• Existing analytics
• Corporate analytics
• Personal analytics
• New analytic
• List of analytics
• Analytic services
To customize the contents of a page:
1. Click Customize.
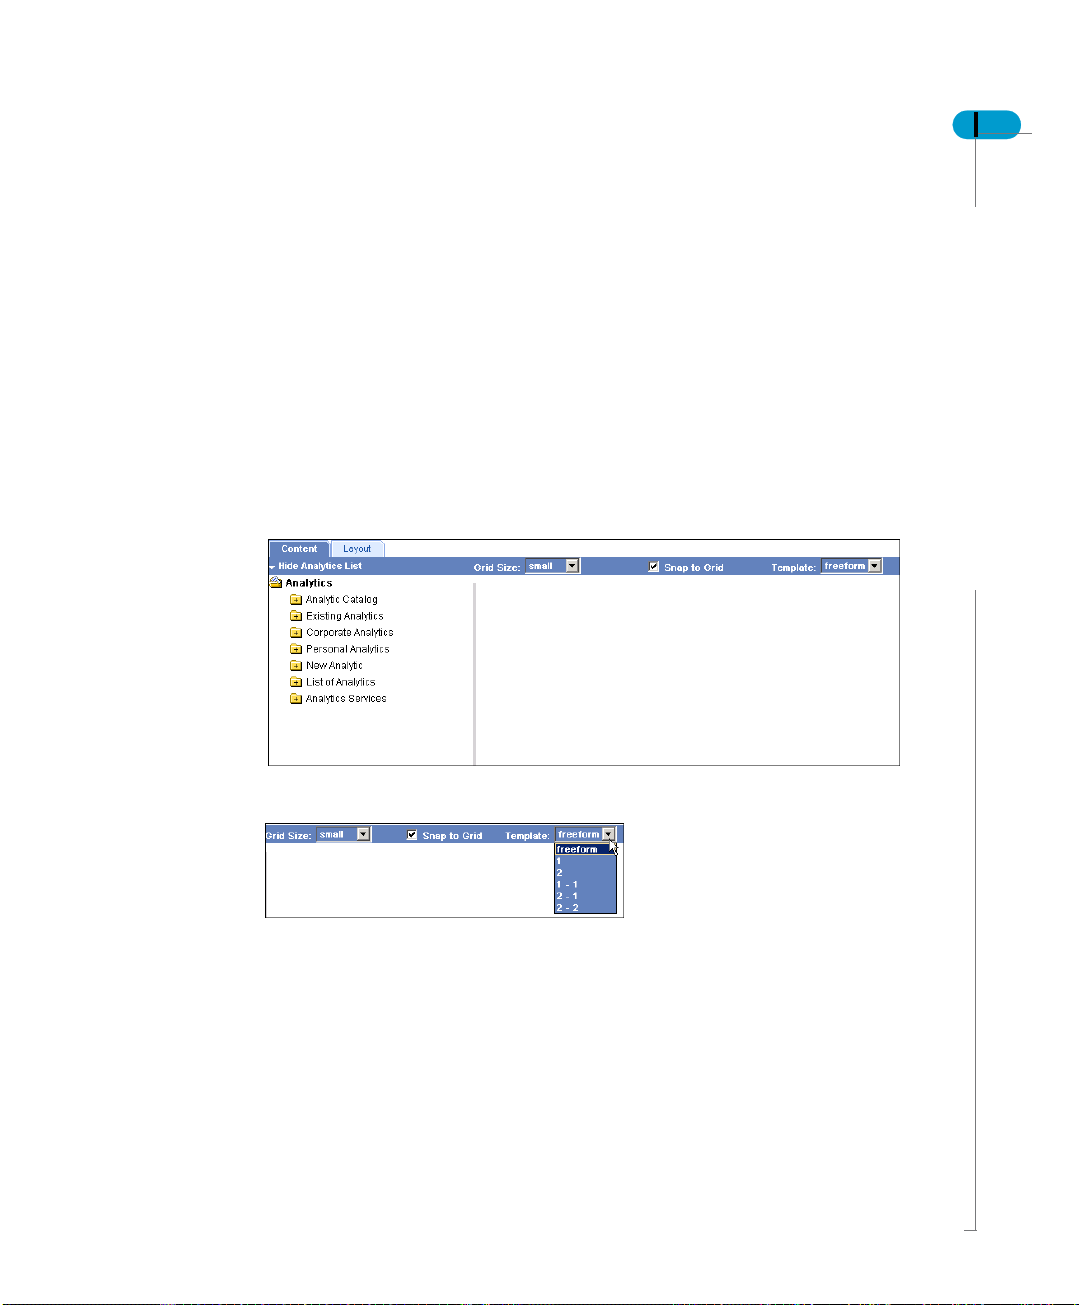
The Content and Layout page opens.
Before selecting the analytics for your dashboard, you can select existing
templates, define grid size and/or select if wish to activate snap to grid.
Add/customizing a page

28 Dashboard Manager User’s Guide
2. Click on the drop down and select the template name. Based on the template
definition the page displays the layout. An example is displayed below.
3. You can specify the grid size to either be small, medium or large. The grid
appears when you try to resize the analytic window.
My Dashboard
Dashboard Manager User’s Guide 29
4. Select the analytic folder, then browse until you locate the analytic that you
want to display.
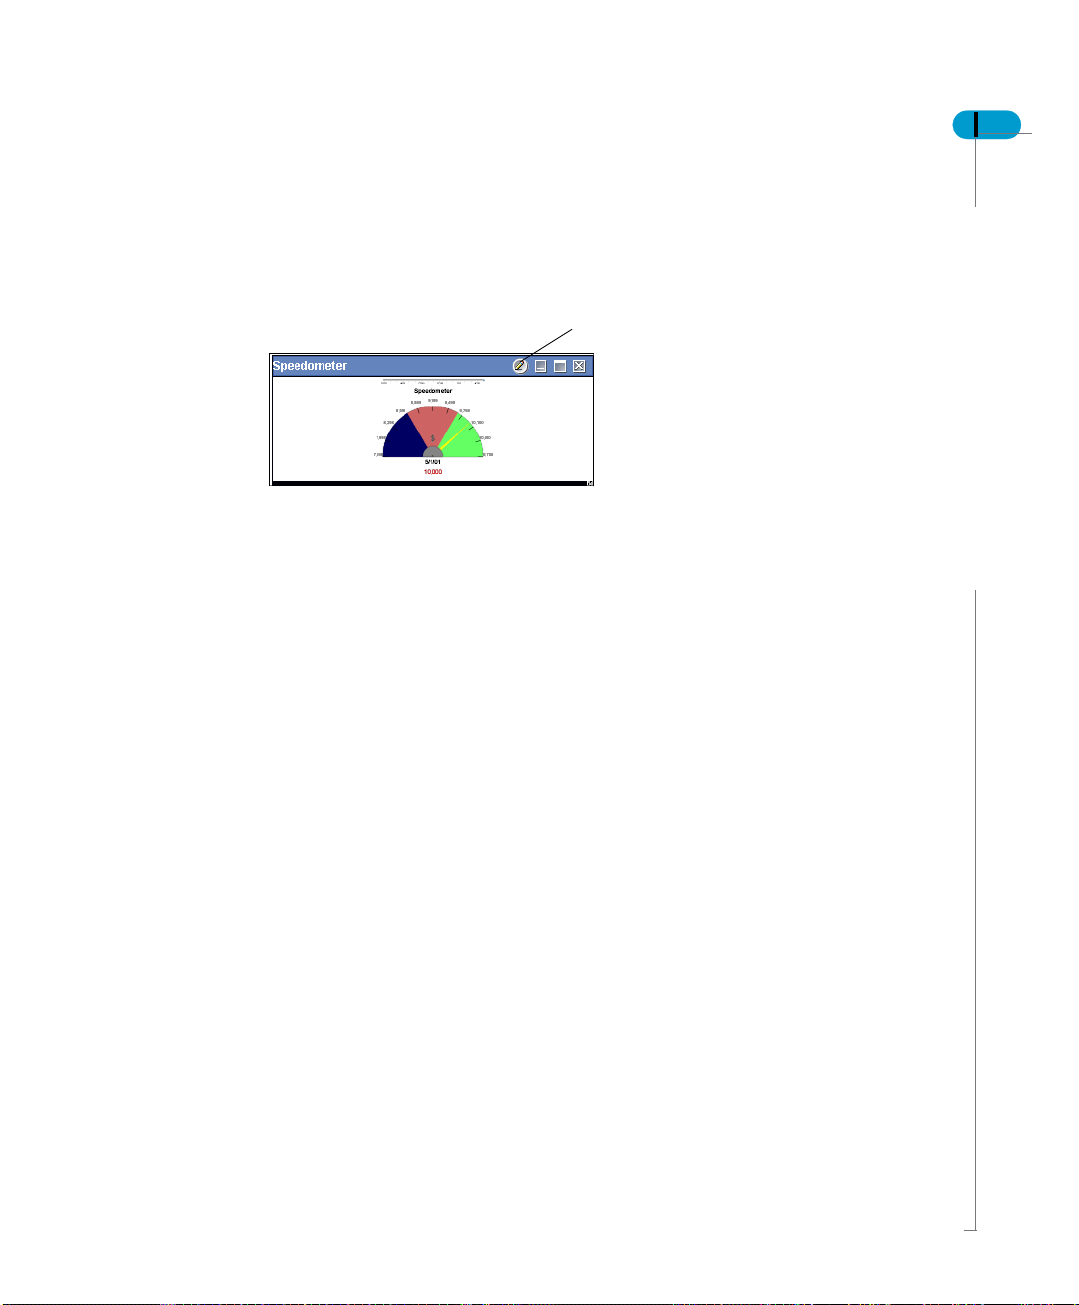
5. Drag the analytic to the empty part of the page.
A window is displayed.
Edit analytic
6. Click Edit on the title bar.
A new page opens where you can change or specify information for the
selected analytic.
7. You can apply the new definition or any changes made. To do so click any of
the following buttons:
• Apply - this applies the new definition or changes made in the application. The
changes are applied but you still remain on the same page.
- Cancel - this cancels any information entered on the page.
- Apply and Close - this takes and applies the new defini tion or changes made
in the application. The changes are applied and it closes the page.
- Cancel and Close - this cancels all the information entered and closes the
page to go back to the main My Dashboard page.
When you are done editing each pane’s content, you now have a personalized
page with the important information you want at your fingertips each time you log
into Dashboard Manager.
Below is a list of analytics that you can drag to your page.
• Analytic catalog
This lists all the analytics that are part of Application Foundation.
• Existing analytics
All existing analytics are listed for you to make a selection. These are the
analytics linked to all the applications created with Application Foundation.
• Corporate analytics
Corporate documents are a list of your business related documents. These
Add/customizing a page
30 Dashboard Manager User’s Guide
documents are created using WebIntelligence, BusinessObjects etc.
• Personal analytics
Personal documents are list of documents you may have created specific to
your requirements. Such documents can be listed on your page for easy
access.
• New analytics
You can view all analytics in this folder:
- Set Based Analytics - If you have Set Analyzer installed you can view the
analytics based on Sets. This displays all the single and multi set analytics.
- Enterprise Based Analytics - All the existing enterprise analytics are listed
which can be selected to be added in your portfolio.
- Predictive Analytics
• List of analytics
Predefined list of analytics include corporate, personal, in-box and schedule
and their sub categories.
• Analytical services
These services include - Rules, Export List, Scheduler and New Document.
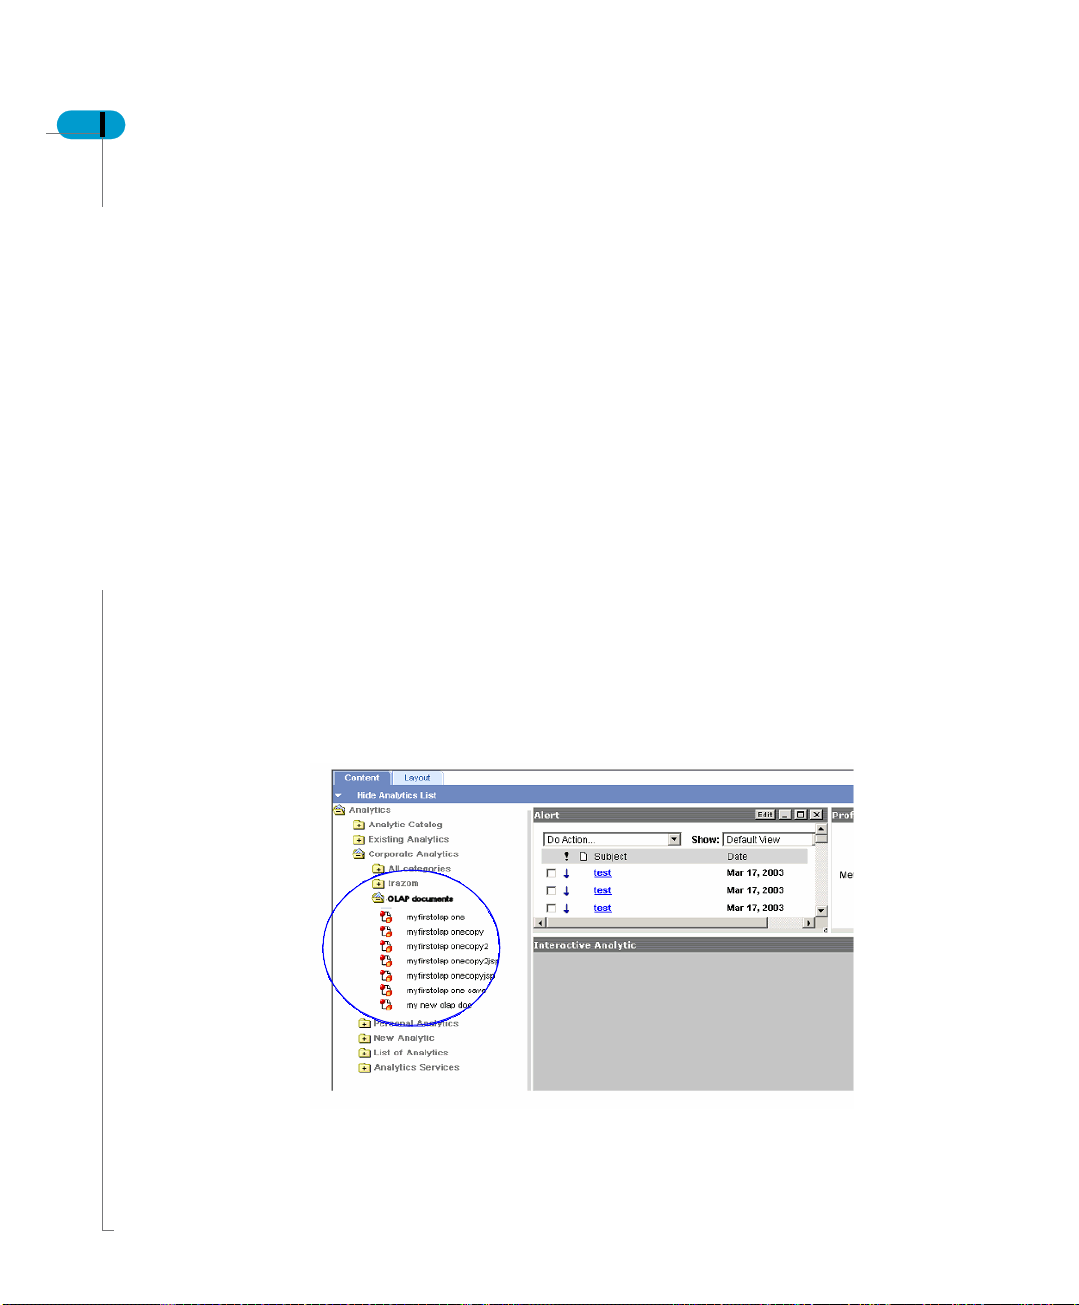
Like any other analytic you can also add an OLAP (Online Analytical Processing)
document in the dashboard. OLAP documents contain definition information
including the connection information to the OLAP server and the cube and
selected dimensions in the document. They do not contain data (like an AFD) and
the data is retrieved from the OLAP source when the page is opened for ac cess.
My Dashboard
Dashboard Manager User’s Guide 31
As you can see from the above picture, the OLAP documents are visible li ke
any other document and you can use the drag and drop function to add them
to the dashboard page.
Customize page layout
You can modify the layout of My Dashboard specifically for your user account by
choosing from the options presented in the My Dashboard’s layout page.
To customize a page:
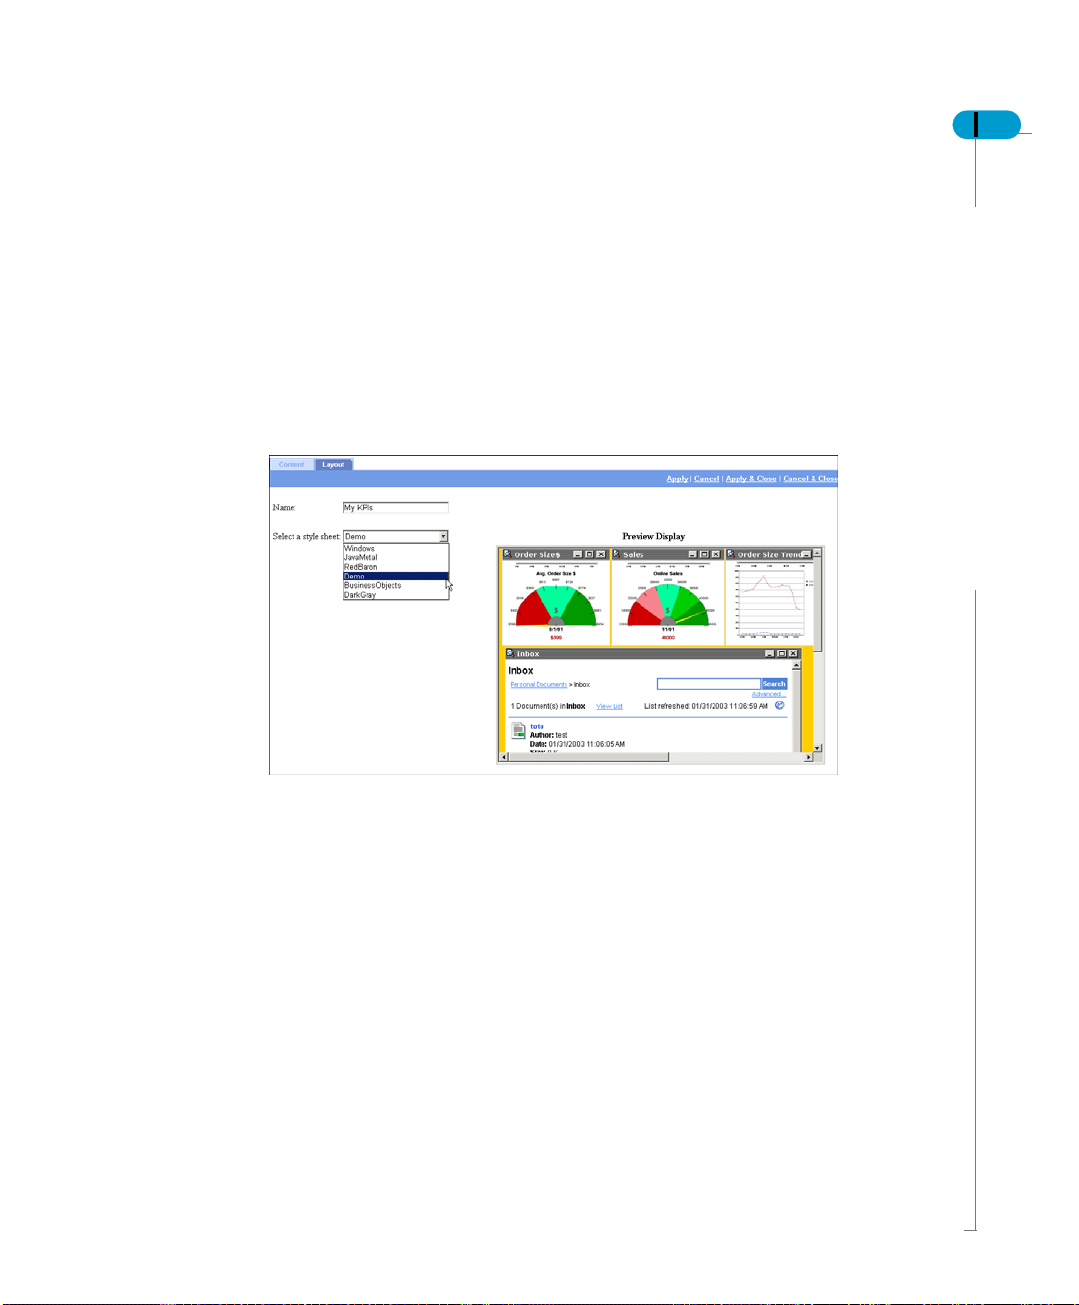
1. Click the New Page tab which is created when you added a page. As you click
the layout tab, the page allows you to define either the layout or the content.
2. Enter the Name of the page.
3. From the drop-down list select the style sheet for the page. The style sheet
defines how the page looks. By default style is Windows.
A preview of the selected sheet appears on the page.
Add/customizing a page
32 Dashboard Manager User’s Guide
4. Click Apply, then Close to save the changes made on the page.
5. If you do not want to save the changes, click Cancel.
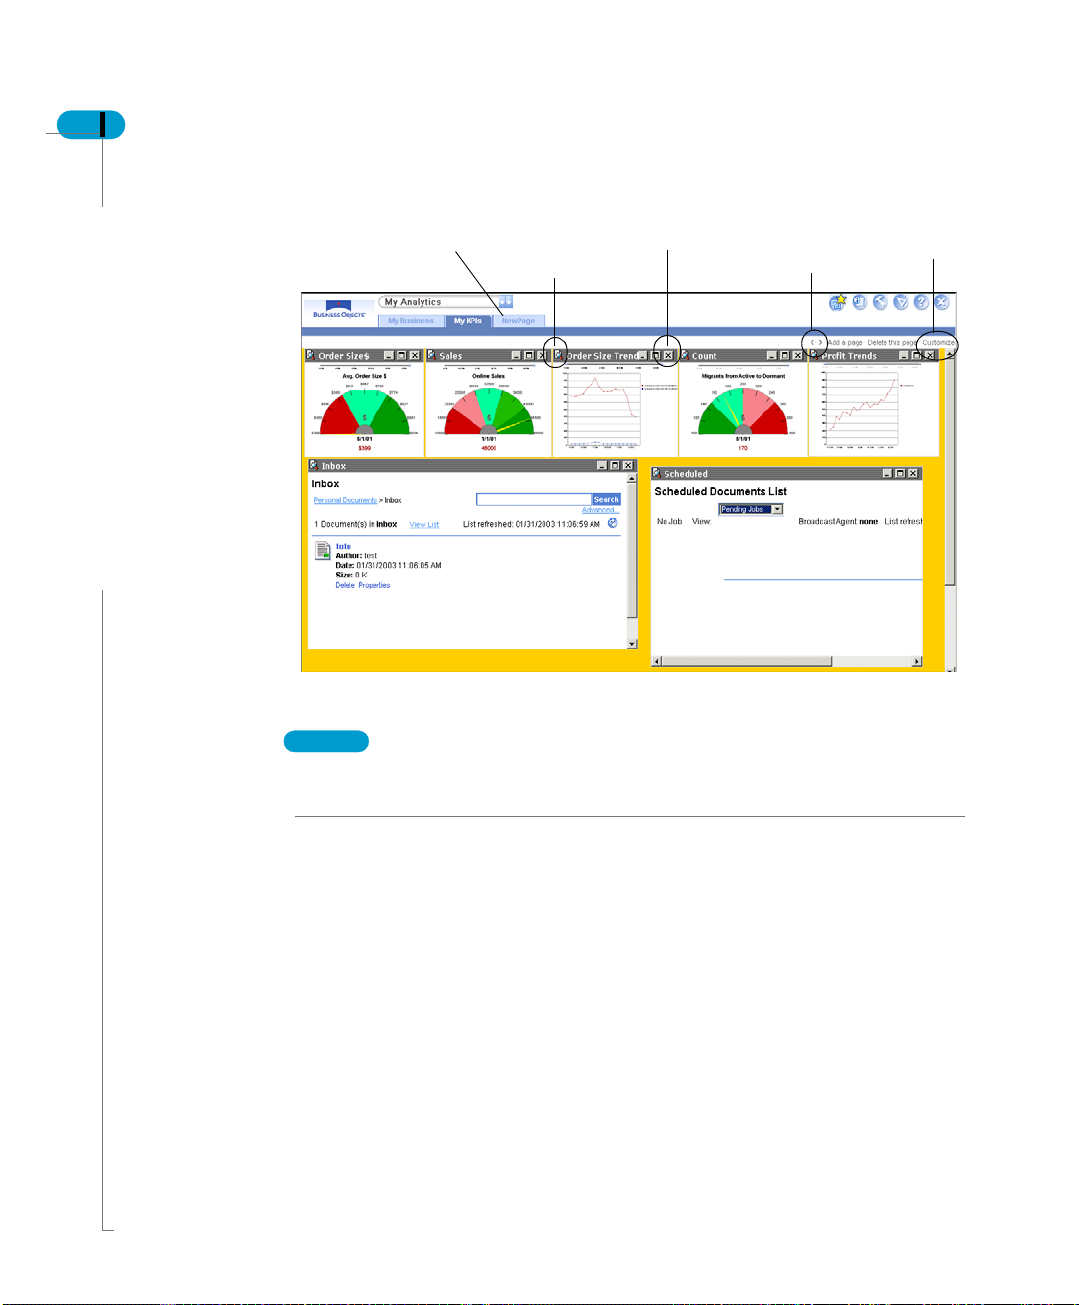
Page created
Delete analytic from page
Expanded view
Move pages -left/right
Customize the page
My Dashboard
NOTE
A WebIntelligence document allows you to make edits and takes you into the
WebIntelligence edit que ry pan el.

Customize an analytic layout
You can also customize the layout of a dashboard. To get in here, click on the
Edit icon once you have customized the page content:
To customize the layout of any analytic:
1. Click the Layout tab.
The Layout page is displayed as shown:
Dashboard Manager User’s Guide 33
1. In the Title box enter the title of the analytic. The title is a generic name that
Customize an analytic layout

34 Dashboard Manager User’s Guide
does not relate to the specific metric name. This name appears on the title bar
of the window.
2. In the Description box, enter a description of the analytic.
The security command allows you to secure viewing of the analytic:
3. Click on the Select link.
4. Select the application and the modules which you want secured fo r the page.
5. You can Display the analytic as a link or a window on a page. Click the
appropriate option button.
If you select the analytic as a link, it is displayed as follows:
My Dashboard

Dashboard Manager User’s Guide 35
6. If you wish to display the analytic as a window, you have three options. Select
one of the following options:
- Show window border, which displays as follows:
- Show only expanded bar, which displays as follows:
Customize an analytic layout

36 Dashboard Manager User’s Guide
- Show both, the expanded bar and window border, which displays as follows:
7. If you want to change the image of the analytic, click Change Image. The
images from which you can choose are displayed in a new window as shown
below:
My Dashboard
8. Select the image you want to use, then click OK.
9. Style Sheet allows you to define a particular look of the analytic. Click the

Dashboard Manager User’s Guide 37
drop-down list to select the style sheet you want.
A preview is displayed next to the list of styles.
10.Once you have entered all the details, click OK.
Your analytic is now defined with content and layout. The content and the
layout of various analytics define a page.
Customize an analytic layout

38 Dashboard Manager User’s Guide
Retrieving analytic from inbox
The new Application Foundation can now access your personal inbox to retrieve
documents. Your personal inbox contains documents that other users have sent
you. You can now retrieve documents from another users inbox to display in your
analytic list.
All users have the rights to access their own Personal, Corporate and Inbox
document pages; this depends on whether you have been granted the rights by
your system administrator.
When you use a personalized dashboard with inbox analytic, you can obtain
information based on your log in. For example, if John logs into the application,
he would get John specific data. If Mary logs in, she would get Mary specific data.
This would be obtained from their respective inbox document list.
Personal inbox analytic looks for the latest copy of a document by name in the
currently logged in user’s inbox. If it does not find one, it displays a warning
message.
Personalized inbox analytic are used in shared corporate dashboards but are
retrieved from personal inbox. Inbox analytic facilitates pre-scheduling refresh
from BCA.
There are a number of benefits of using the inbox analytic.
• It supports the supervisor row level security
• It does not require to be refreshed when opened
• It supports any type of documents, reports or analytic
• It does not require BCA to get personalized content
• It provides personalization capability that scales with core
For more information on how to create a document in your inbox, please refer to
the InfoView User’s Guide, version 6.5.1.
Add personalized document
To add a personalized document, you have to get into My Dashboard.
1. Click My Dashboard icon.
2. Click Add a Page.
3. Click Customize.
My Dashboard
Dashboard Manager User’s Guide 39
4. To add a document to your dashboard, drag and drop the document name
from the folder.
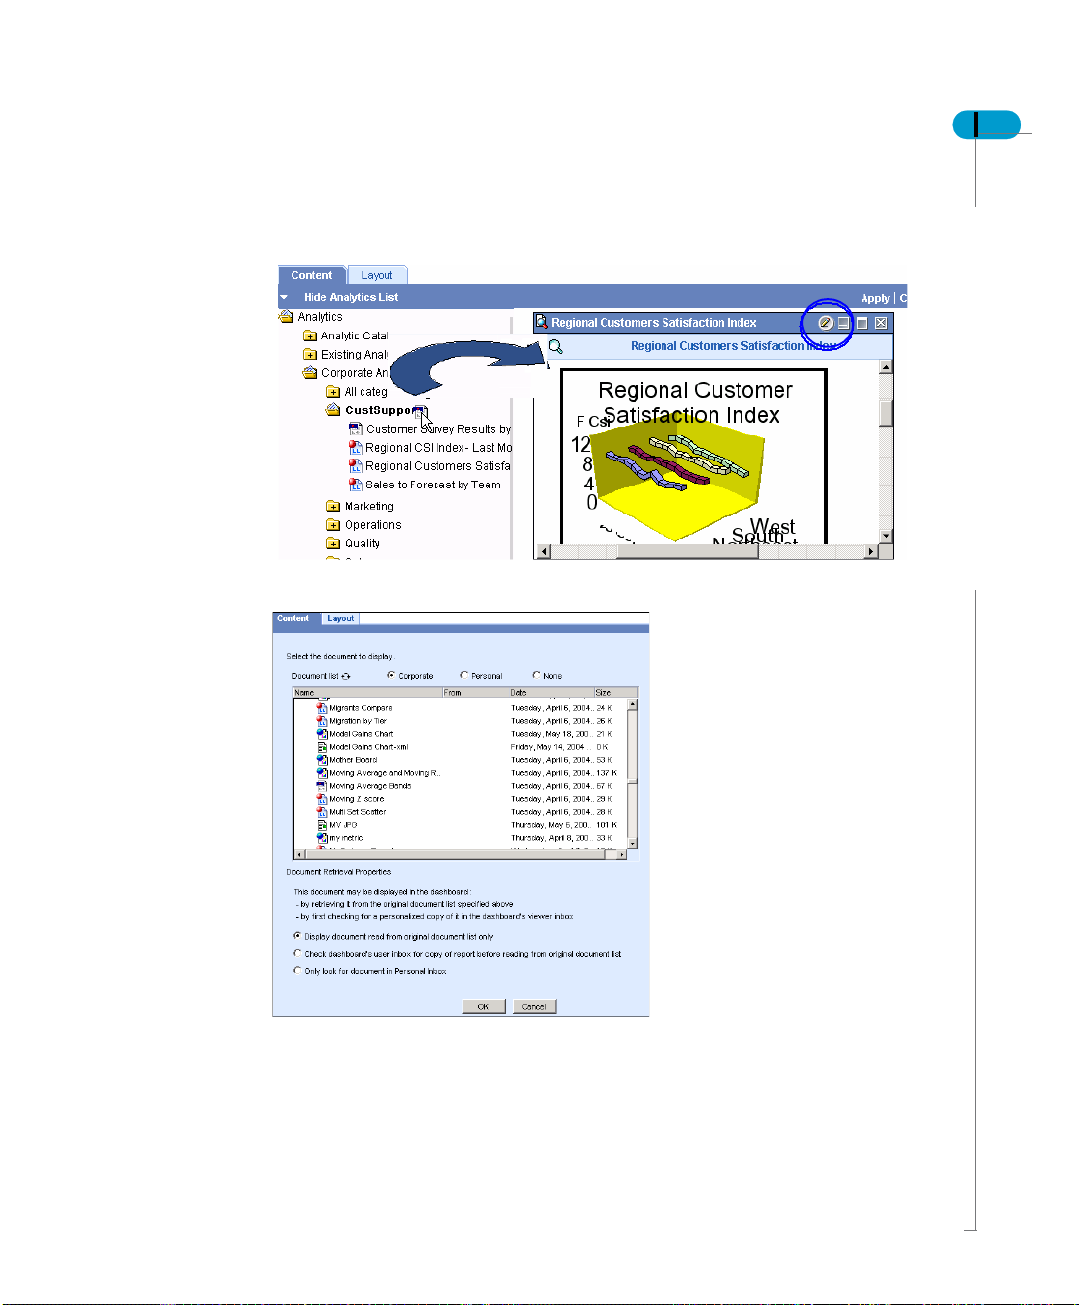
You can change the document display option by clicking the Edit icon.
5. You can select a corporate or a personal document. Click on the appropriate
radio button.
The list of documents is displayed.
6. Select the document to be displayed in your dashboard.
Retrieving analytic from inbox

40 Dashboard Manager User’s Guide
Once you select the document you can define the document retrieval properties.
The selected document can be displayed three ways.
• retrieving from the original document list above.
• checking for a personalized copy of the document and then displaying it on
the dashboard. This option checks for the selected document in the user
inbox. If the document is not available the document is searched in the
personal or corporate repositories.
• looking only in the personal inbox.
7. Click on the appropriate option check box.
8. Click OK.
My Dashboard

Analytic Properties
4
chapter

42 Dashboard Manager User’s Guide
Overview
This chapter helps you understand basic properties of any analytic within
Dashboard Manager.
For every Analytic you can perform the following functions:
• Add to My Dashboard or to another page
• Edit an analytic
• Email - an analytic
• Save as - an analytic
• Send - an analytic
• Refresh - an analytic on the screen
• Close - close the analytic
To access these options click the analytic.
Add to My Dashboard
You can add an analytic to the My Dashboard page or to any other page of your
choice.
1. Click Add to My Dashboard.
The add analytic dialog box appears, such as, the Add Control Chart to My
Dashboard dialog box in the example below.
Refresh
Close
Analytic Properties
2. Click the drop-down list to select the page where you want to add the analytic.
3. If you want to create a new page for this analytic, select the option and enter
Email
Dashboard Manager User’s Guide 43
the page name.
Depending on the choice selected the analytic appears in the chosen existing
personal dashboard page or a new page which is created by this workflow.
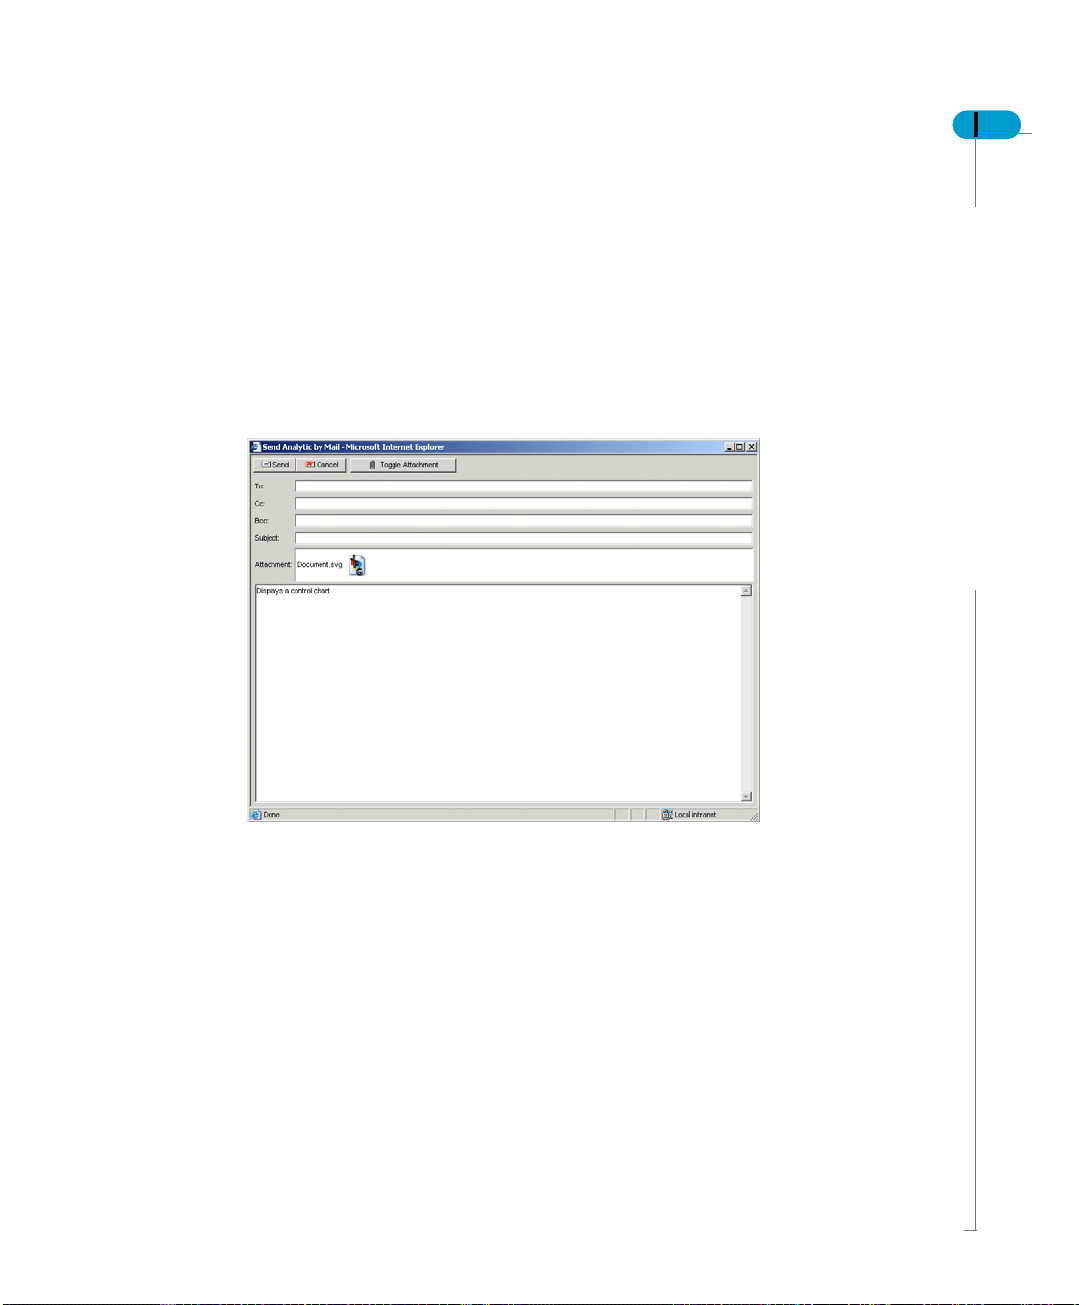
You can email the displayed analytic to someone by using this link.
Click Email and the email form opens. By default the analytic is attached as an
svg for the recipient. The Toggle Attachment button can be used to remove this
attachment or include in the email.
Save an analytic
You can save an analytic that is displayed on a page. An analytic can be saved
as a personal or corporate document. There are three formats in which you can
save an analytic.
• AFD: Application Foundation Document in SVG view stores all related
elements of the chosen analytic: the definition, data, and the rendering in its
AFD. Application Foundation analytics that are in applet view store the
definition in its AFD. BusinessObjects documents are saved in their original
format.
• XML: This format saves only the data using the XML format that allows you to
share information between various applications.
• SVG: Scalable Vector Graphics format is a snap shot capture of the analytic

44 Dashboard Manager User’s Guide
which can be viewed on any browser with a SVG plug-in from Adobe. The
SVG format can be resized without loosing resolution whi ch further allows to
display on your dashboard and for printing an analytic.
1. Click Save As.
2. Select one of two options:
- Save as a Corporate Document
- Save as a personal document
If you click Save as a Corporate Document, the following page is displayed:
Analytic Properties
3. Enter the following information in the appropriate boxes:
- Document Name.
- Document Description.
- Keyword you can use to search for this document. There are no restrictions
on keyword definition.
Click the Categories tab to assign a category to your document. Categories
are optional, however they help locate documents more quickly. Enter the

Dashboard Manager User’s Guide 45
Category Name in the box shown below:
Refresh List
4. Click Create. A message confirming the new category is displayed.
5. Click one of two options:
- create a brand new document
- overwrite an existing one.
6. Click a refresh option:
- when opened - every time the document is opened
- manually
7. Click OK to save the analytic.
A status is displayed to let you know that the document has been saved.
8. Click Back to Analytic to go back.
An analytic saved as a corporate document is stored in the Business Objects
repository. It is available from the list of corporate documents.
An analytic saved as a personal document is stored in the personal storage
space for the user in the Infoview storage space.
To save the document for personal use click Save as Personal Document.

46 Dashboard Manager User’s Guide
Enter the details, then click OK.
Send an analytic
You can send Application Foundation documents and other files that have been
uploaded to the system to other Business Objects users. Unlike an email,
documents sent this way go to the Business Objects users Infoview inbox.
To send a document:
1. Click Send tab.
2. The send page opens. At any point before you actually send the document,
you can return to where you were in Application Foundation by clicking the
Analytic Properties

Dashboard Manager User’s Guide 47
Back to Document or Back to Document List.
3. Enter the document name.
4. In the Description box, enter a Description.
Descriptions are displayed in the document list when it is in the expanded
mode.
5. Enter one or more Keywords to serve as search criteria for this document.
Keywords are optional.
6. Enter the Document Type. You have a choice of xml, afd and snapshot.
7. Define how you would like the analytic to be displayed. The choice is as an
applet or svg.
8. Every analytic can be refreshed manually or when every time the analytic is
opened.
48 Dashboard Manager User’s Guide
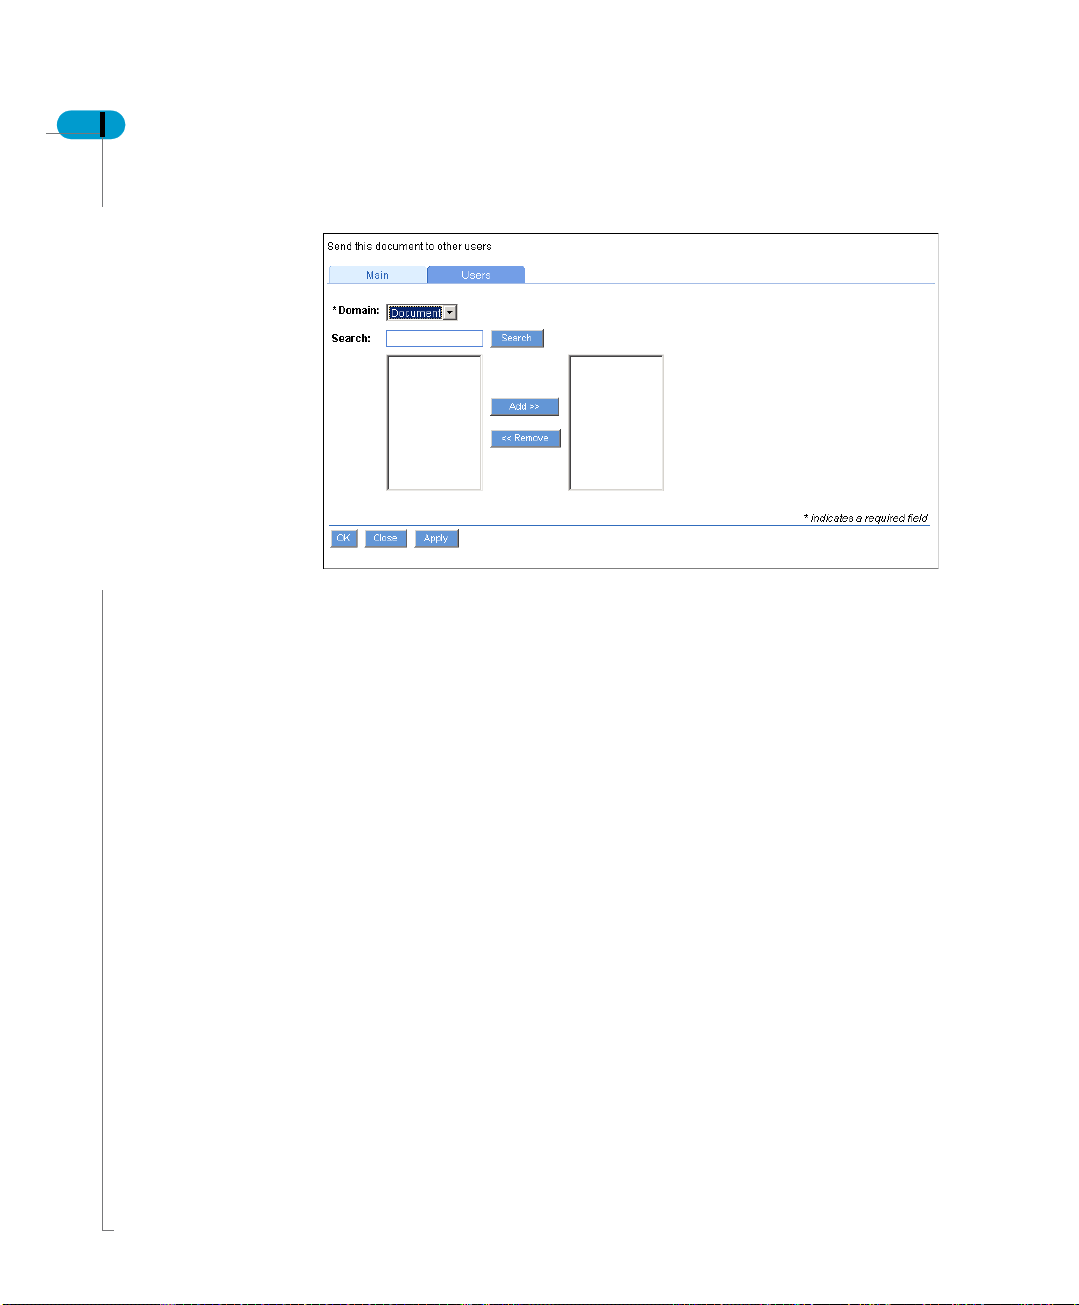
9. Click on the User tab.
10.Select the Domain in which you want to store the document.
11.Select the User(s) to whom you want to send this document.
12.Click OK.
A message appears to notify you that the document has been sent to the
selected user(s).
You can apply the same Generic Analytic framework to OLAP documents as
applicable to ensure consistency with these documents. OLAP documents
retrieve data from the OLAP data source when opened and hence there is no
concept of a refresh for OLAP documents. Application Foundation edits an OLAP
document by adding new dimensions or measures from the cube metadata on
the left and hence there is again no need for an edit action. The other actions are
available as follows
• Download - downloads the csv for the OLAP document into an excel
spreadsheet. It is available as the OLAP document interface you may be able
to reuse that in the top bar assuming the SDK supports this functionality.
• Add to My Dashboard - allows you to place the OLAP document on the My
Dashboard page in a workflow similar to what is used for other analytics.
• Email - can send the csv over to the email recipient
• Send - allows you to send the OLAP document to the user WebIntelligence
inbox
Save - allows you to save the OLAP document to the corporate repository or
personal storage area as an owr file.
Analytic Properties

Refresh an analytic
The Refresh link allows you to reload the current analytic if you have made edits,
or updates to display the latest data. Click on the Refresh button.
Close an analytic
To close the analytic click on the close button.
Dashboard Manager User’s Guide 49

50 Dashboard Manager User’s Guide
Analytic Properties

Options
4
chapter

52 Dashboard Manager User’s Guide
Overview
This chapter helps set up user specified preferences that control the user
experience when interacting with analytics provided by Dashboard Manager.
Options
Options
Display
Dashboard Manager User’s Guide 53
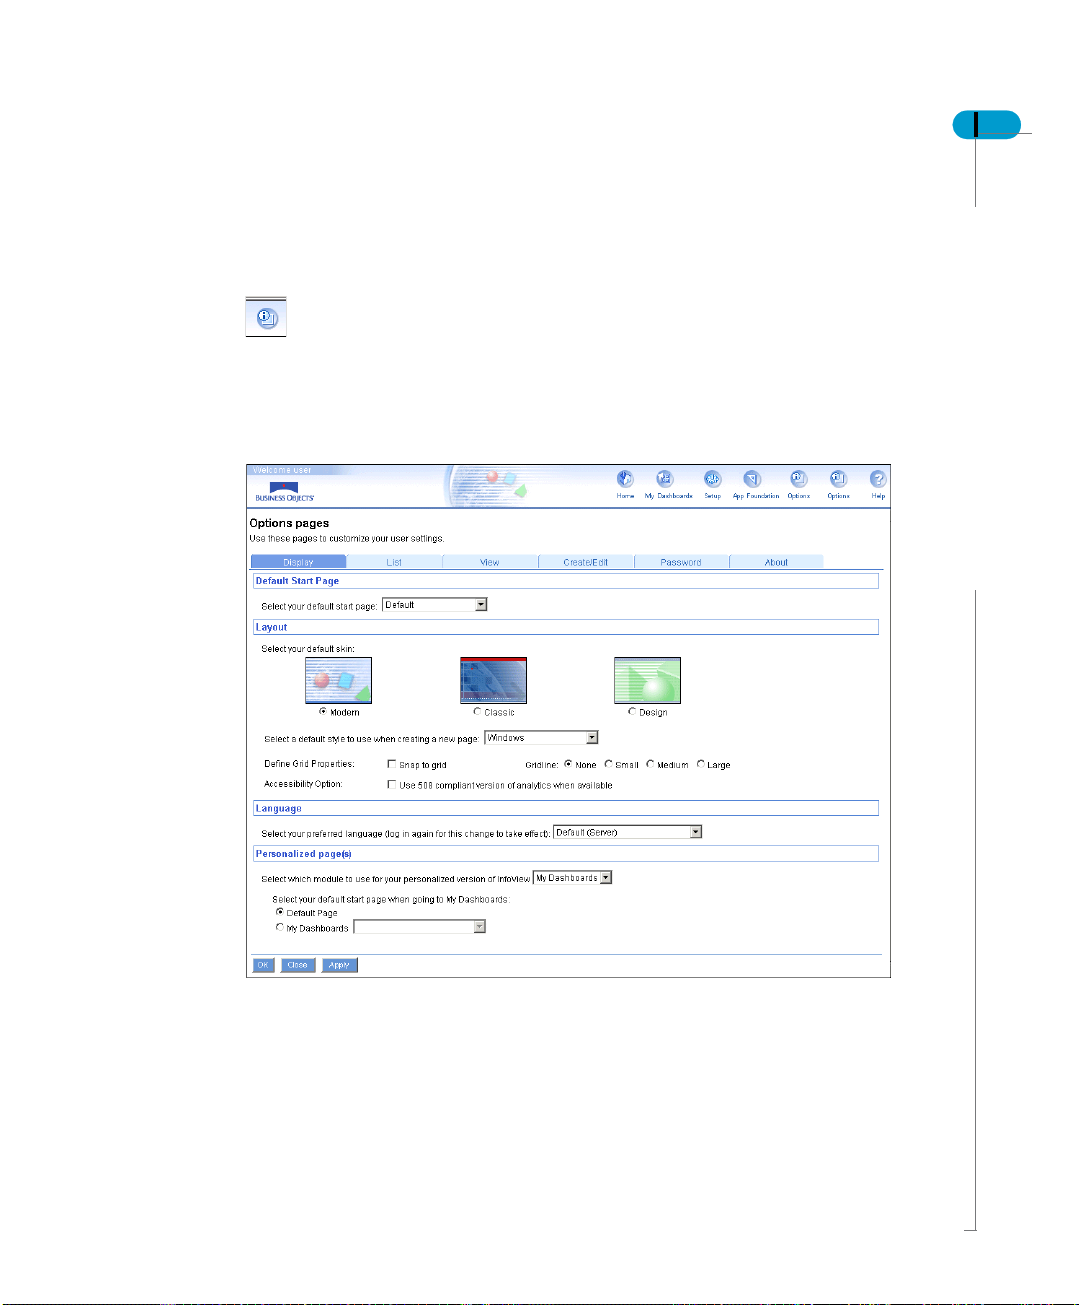
The options icon is located in the upper-right section of the service bar.
Use Display to define user preferences for Application and My Dashboard default
start page as well as customization options such as Default style and Grid
Settings for the page customization.
On this page, enter the following:
1. Select one of the any of the page as default start page that is di splayed when
Options

54 Dashboard Manager User’s Guide
you log into Dashboard Manager:
- Default main page
- My personalized page
- Corporate documents
- Personal documents
- Inbox
2. Select the layout of the page. You can choose from Modern, Classic or
Design.
3. From the drop-down list, select the style you want to use as the default page
when you create a new page. The choice is - windows, java metal, Redbaron,
demo, Business Objects, and Dark red.
4. Define the grid properties. Select one of the two grid options:
- Show grid - displays the grids in reports, graphs etc.
- Snap to grid - allows you to accurately position in a grid.
5. If you selected a grid option, select the size - small, medium or large.
6. Check the option if you wish to view analytics with 508 compliancy.
7. Application Foundation 6.5.1 allows analytics to be 508 complaint. The user
interface has been modified to comply with the Section 508 guidelines (a
federal ruling on Electronic and Information Technology Accessibility
Standards that went into effect on 21 December 2000). These guidelines are
aimed to make Federal websites and software accessible to people with
disabilities. Based on a user option, some analytics will appear in a format
more suitable for screen readers.
8. Define the language for the user interface. This defines the user locale for
setup like date format, numbers, etc.
9. Define the Personalized pages. This can either be My Infoview or My
Dashboard.
10.Specify the width of the left column to either small, medium or large. This is a
percentage increase.
11.Click Apply to execute the changes.
Options
List
Dashboard Manager User’s Guide 55
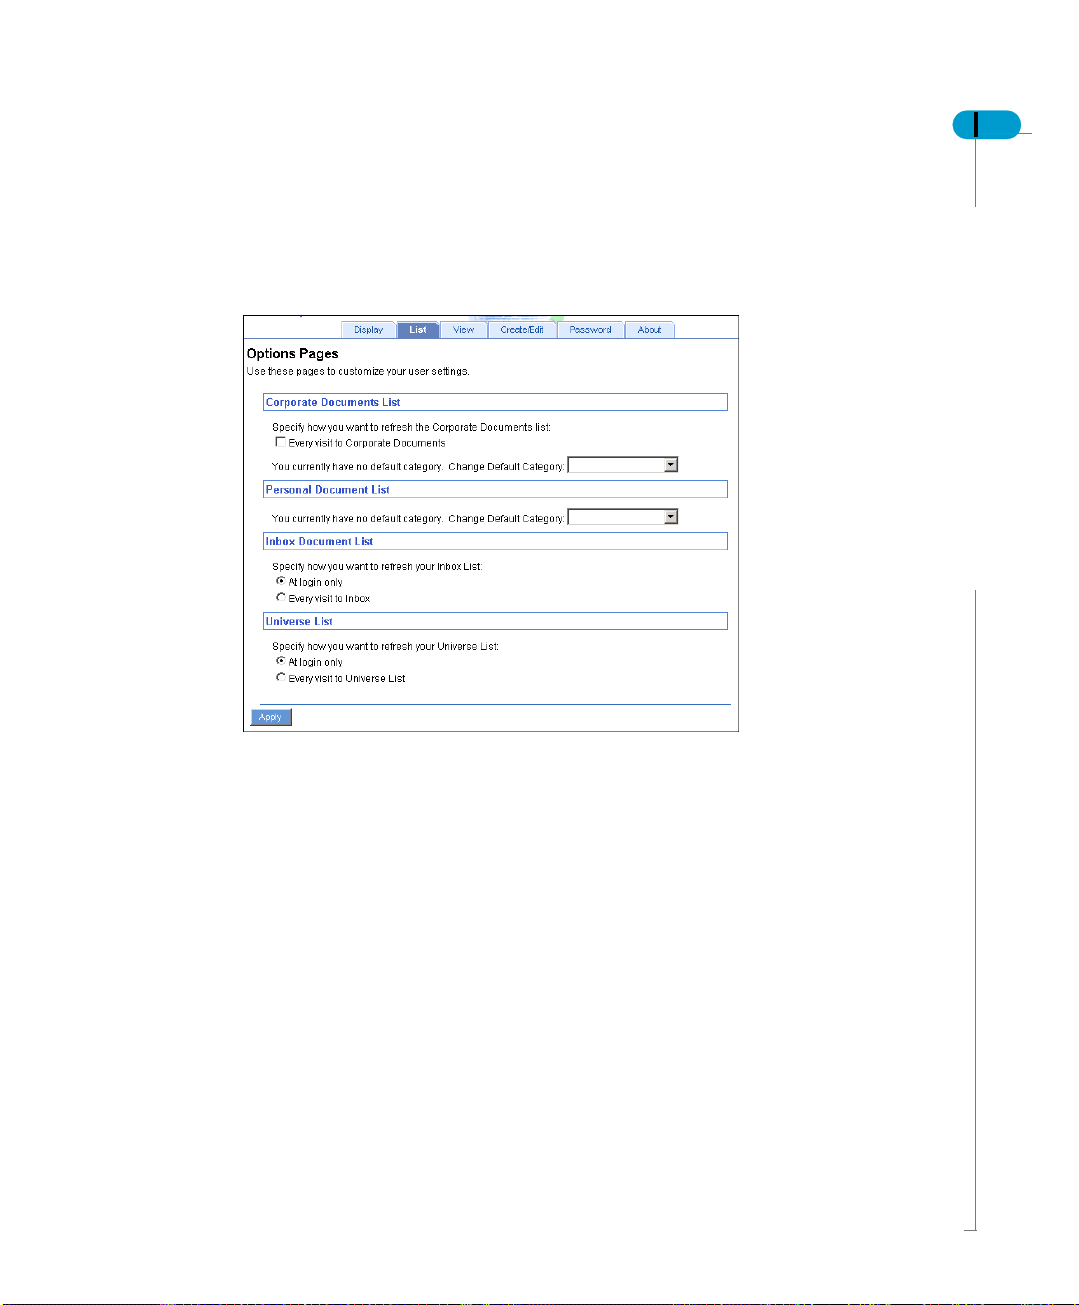
On the List page you define the refresh options at the user level for the Corporate
Documents list, Universe list and Inbox document list. Use List to set up these
preferences.
The list tab lets you specify how to refresh the:
• corporate documents list
• personal list
• inbox Document list - select how you would like to refresh the list.
• universe list - select how you would like to refresh the list.
Options

56 Dashboard Manager User’s Guide
View
On the View page you define how to view BusinessObjects documents. You can
view WebIntelligence or BusinessObject documents.
Options
To choosing a view format:
1. Click Options.
2. Click the View tab to open the View page.
3. Under Select a View format select the format in which you want to view
WebIntelligence documents:
-HTML
-HTML interactive
- Portable Document Format (PDF)
4. Under Drill options, select how you want to start each new drill session:
- duplicate report
- existing report
5. Select the general drill options
- Prompt if drill requires additional data
- Synchronize drill report blocks
- Hide drill toolbar

You can view BusinessObjects documents with BusinessObjects.
Choosing a view format:
6. Select the format in which you want to view BusinessObjects documents:
7. Click Apply to confirm your choice.
Create and Edit
The Create/Edit page lets you select the type of document to create when you
create a new document. By default the document type is WebIntelligence and the
report panel is Java.
Dashboard Manager User’s Guide 57
-HTML
-PDF
- Enhanced in InfoView
- BusinessObjects format
To set the Create/Edit options:
1. Select the Document type for your default document:
- WebIntelligence
- BusinessObjects.
2. For WebIntelligence documents select the report panel display:
- Java Report Panel
- HTML Report Panel
3. Click Apply.
Options
58 Dashboard Manager User’s Guide
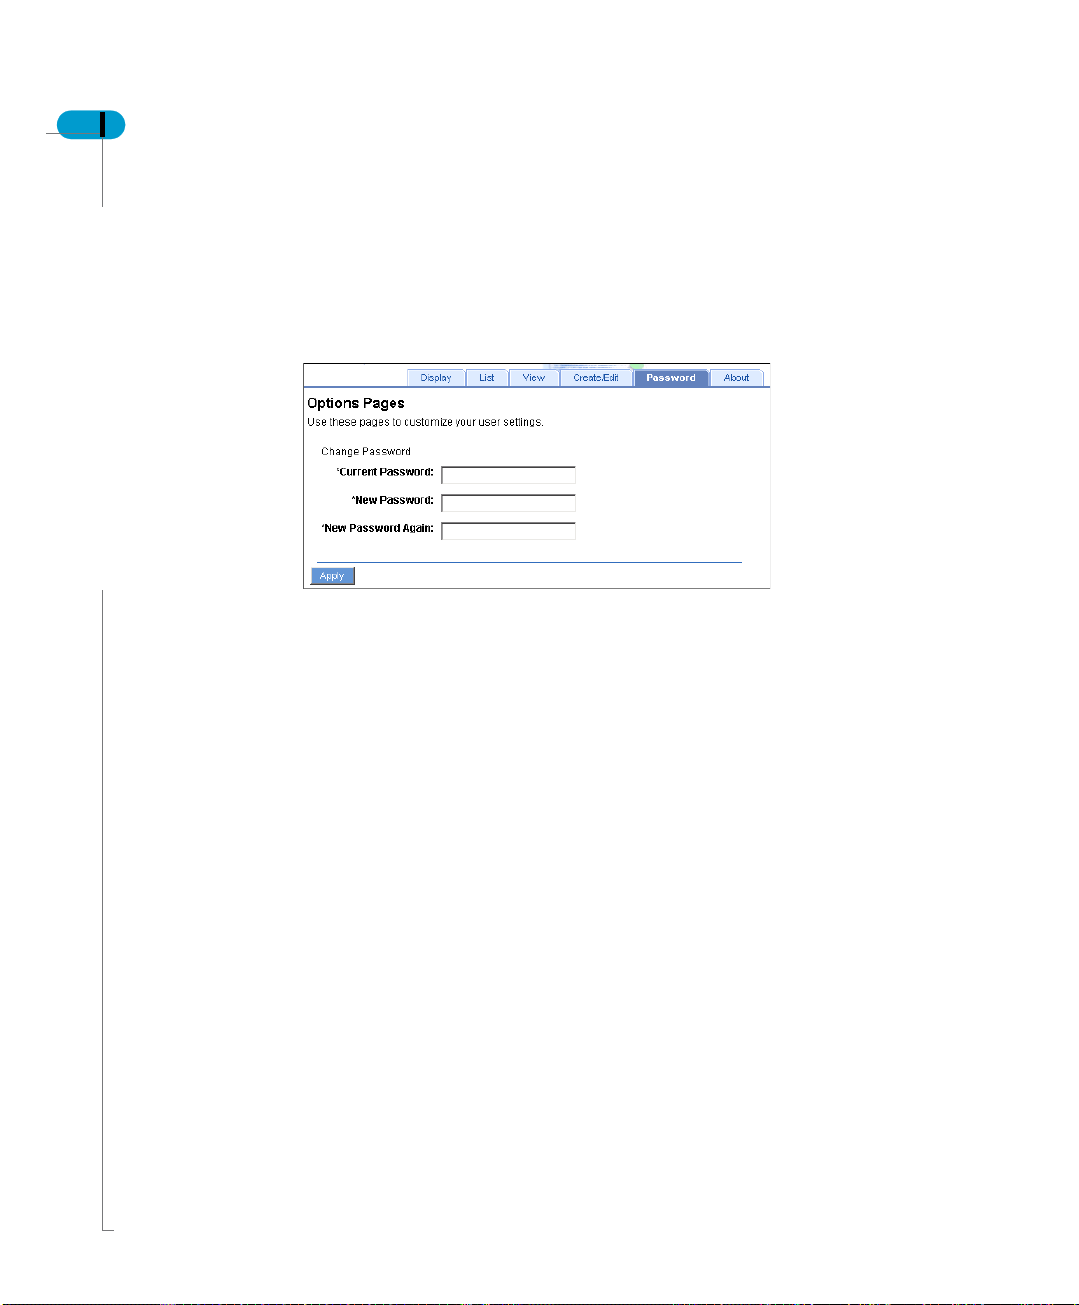
Password
Your initial Application Foundation password is created by the BusinessObjects
supervisor who defines your user profile. Once you have logged into Application
Foundation you can change your password to one of your choice i f you ha ve the
rights to do so. If your supervisor has not given you rights to change your
password the Password tab is not displayed in the Options page.
To change your password:
1. Click the Password tab.
2. Type your current password in the Current Password box.
3. Type your new password in the New Password box. This is case-sensitive.
4. Confirm the new password by typing it again in the New Password Again box.
5. Click Apply to confirm your choice.
Options
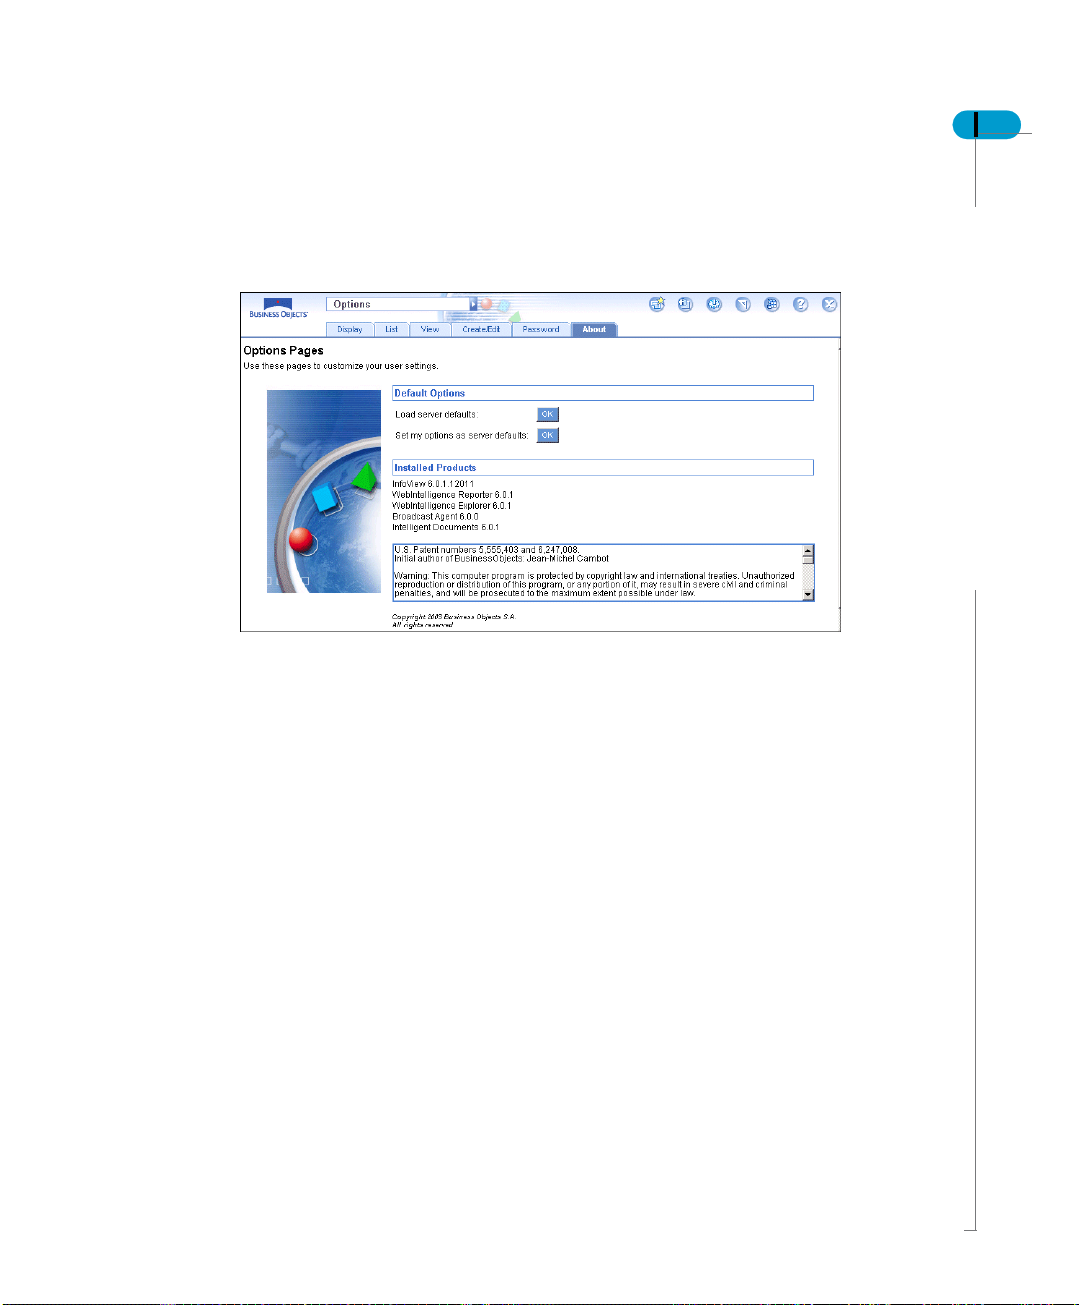
About
Dashboard Manager User’s Guide 59
This page gives details about Application Foundation version. You can also
define default options for the server and options here.
Options

60 Dashboard Manager User’s Guide
Options

Application Builder
5
chapter

62 Dashboard Manager User’s Guide
Overview
The goal of Application Builder is to let you rapidly design, build, and deploy
applications across the entire enterprise without any programming. Using the
Application Builder, you can customize the look and feel according to your
specific design goals. As you make the changes, they can be executed right
away. You can see the changes there and then. This ability to dynamically make
and view changes to the application design provides for active feedback from al l
stakeholders in the application thereby leading to a compressed application
development life cycle.
The builder provides a hierarchical view of the application’s designs.
Application Builder
Create an application
An application can consist of menus (tabs), sub menus (sub-tabs) and analytics
that together satisfy its functional requirement. You can add, modify or remove
one or several applications, menus or sub-menus in the Application Builder. The
item added or removed can be placed at different level in the Application
Structure.
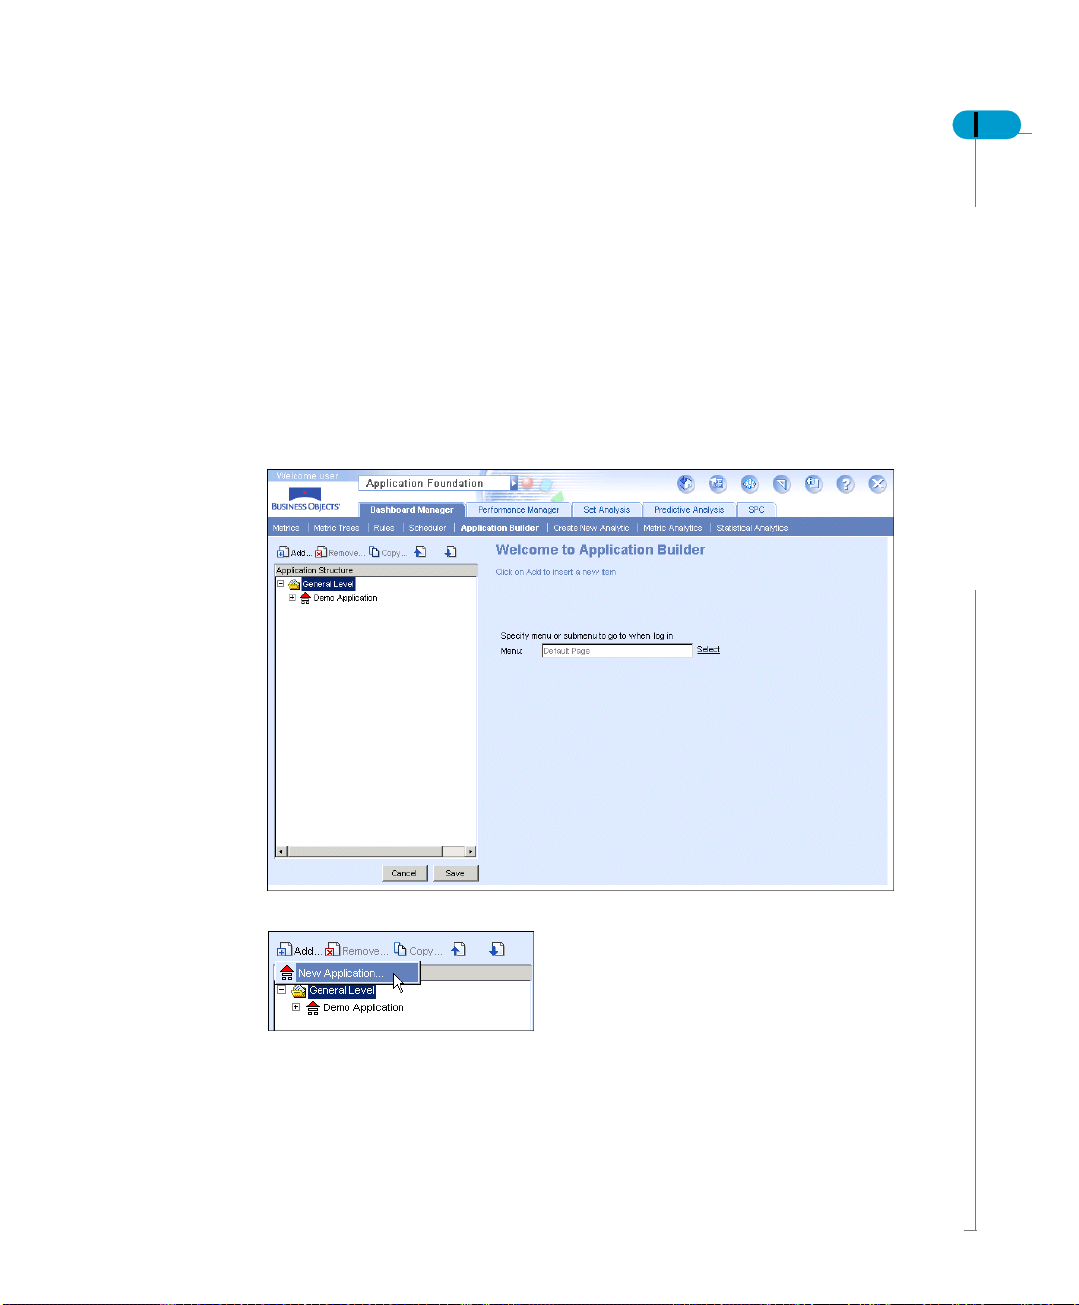
To build an application:
1. From the Dashboard tab, click on Application Builder.
The main Application Builder page opens.
Dashboard Manager User’s Guide 63
2. Click Add, then select New Application from the menu that appears.
When you select a new application, the appearance of the right side of the
Create an application
64 Dashboard Manager User’s Guide
page changes to allow you to enter basic details for the application.
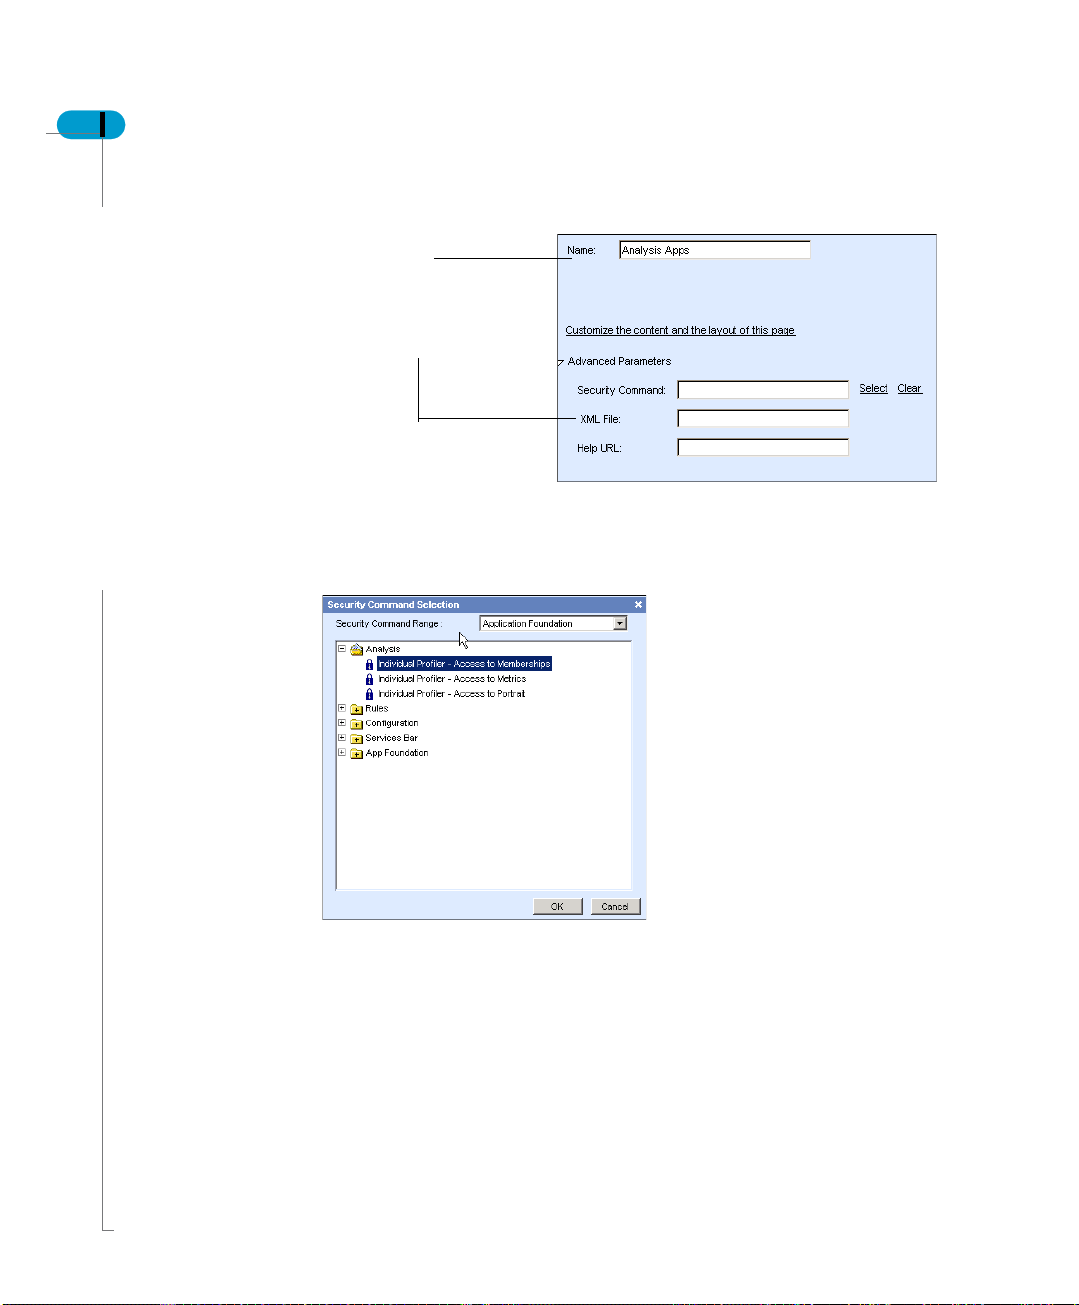
Enter name
Link the application
with a xml
3. Enter the Name you want to give the application
4. Click Advanced Parameters to enter more details.
5. To enter a security command, click Select and select the command from the
list.
Application Builder
6. Click OK to make the selection.
The selected security command is displayed in the field.
You can clear the command by clicking the Clear link.
7. Enter the XML file to which the application is to be linked.

Dashboard Manager User’s Guide 65
NOTE
You must link the new application to an XML file, otherwise a default file, corppage1 is used.
8. Enter the Help URL to which the application is to be linked.
9. Click Save to create and save the new application.
The name is added to the structure tree.
New application
added
You can customize the content and layout of the page by click on the link. Refer
to Customize an analytic layout on page 33 for more details.
The next step is to create a menu bar for the new application.
To create a menu bar:
1. Click Add, then select New Menu from menu that appears as shown below: t
2. Enter a name for the menu created.
3. Application Foundation automatically fills the XML details. The rest of the
advanced parameters are optional.
4. Click Save to add the new menu in the structure tree.
Create an application
66 Dashboard Manager User’s Guide
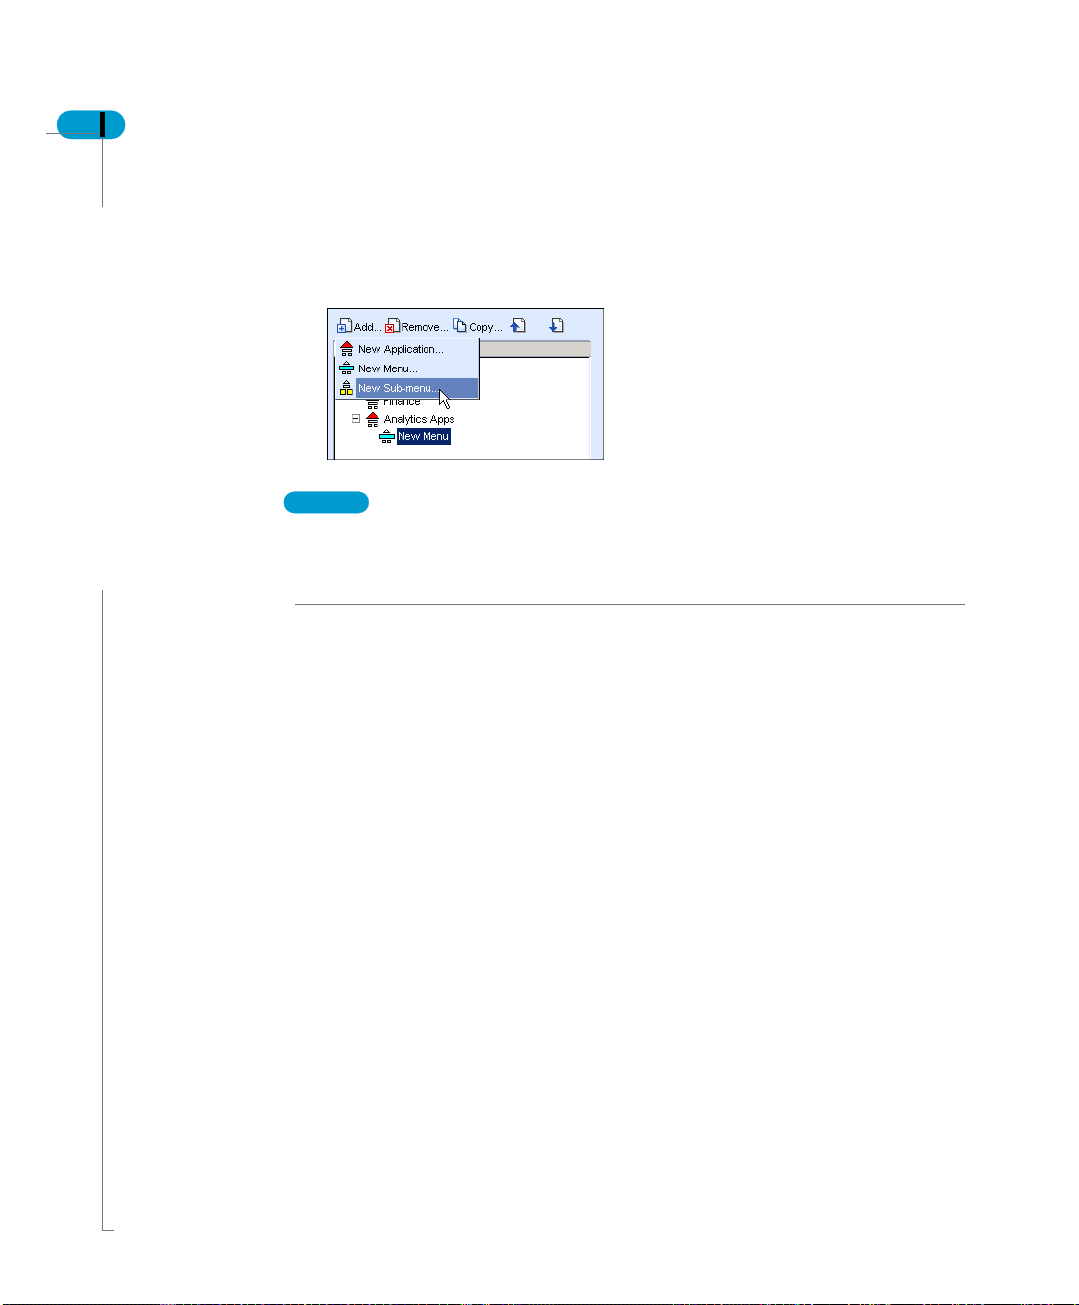
Once you have added a menu and linked it with a XML file, you are now ready to
add a sub menu. You create a new sub-menu in the same way as you created
the application and the menu bar.
5. Click Add, the select New Sub-Menu to begin:
NOTE
A sub-menu is not mandatory. It is acceptable to design applications that have
menus with analytics on their page. It is upto the designer of the application to
choose the structure.
To view the structure of this new application, select the name, in this case,
Analysis Apps, from the drop-down menu at the top of the page. The menu and
sub-menu are below the new application.
What you did was create a new application which has your custom tabs and sub
tabs.
To create groups and analytics, click Customize the Content and Layout of this
Page. In the new page that opens, you can define more aspects to the new
application that you just created.
Application Builder

Copy an application
You can copy an entire application with or without its sub-menus. This reduces
the steps required to recreate a similar application.
To copy an application:
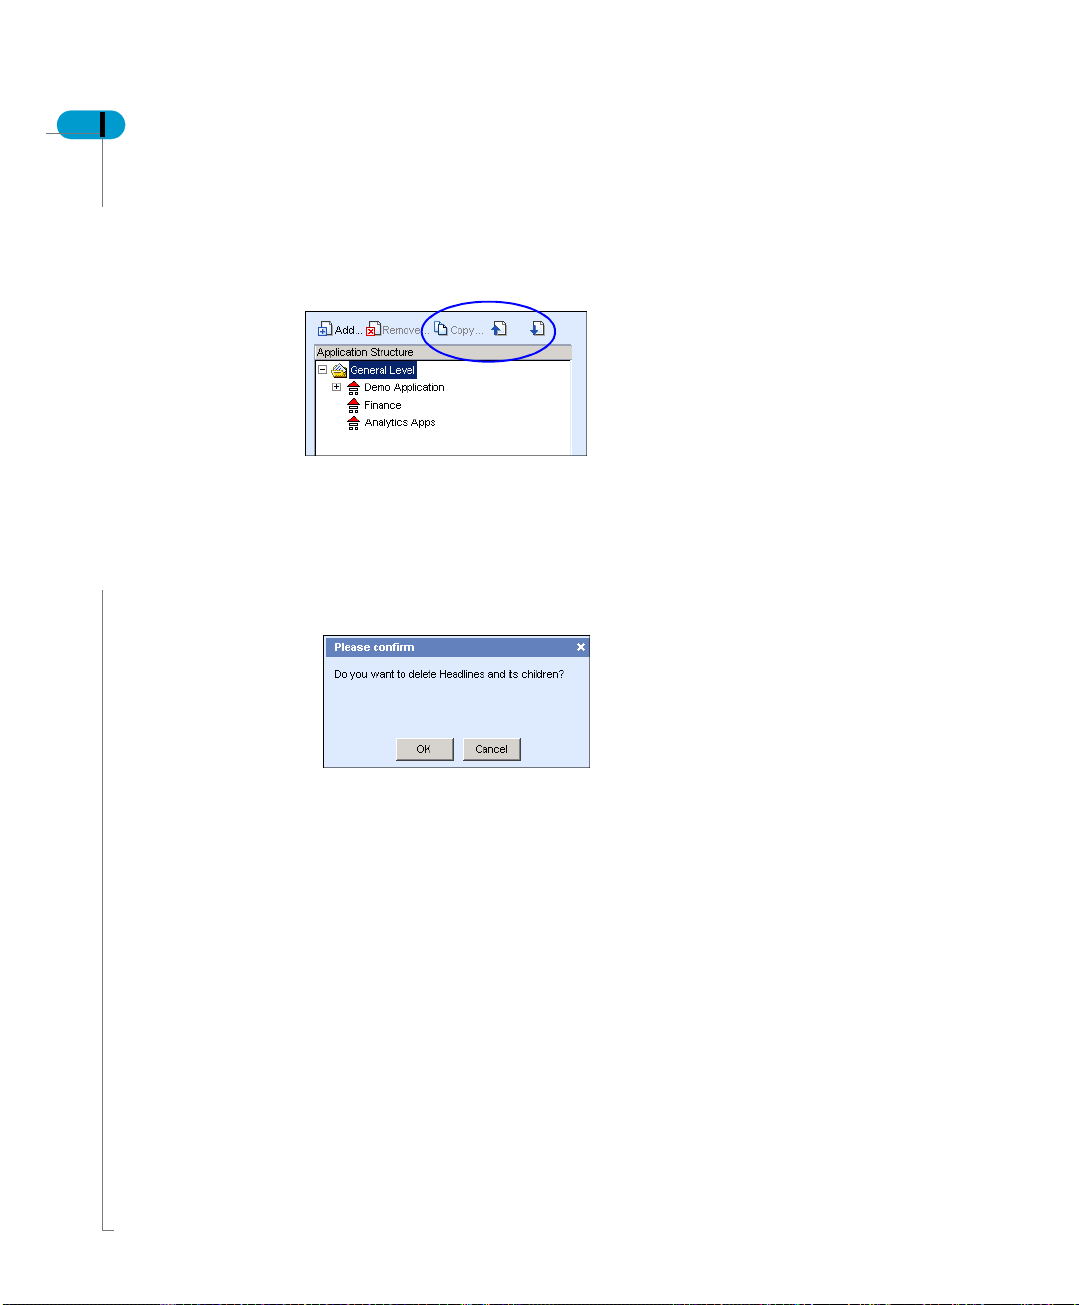
1. Select the application to be copied.
2. Click Copy.
The Copy Demo Application dialog box appears.
3. Select one of the following:
- Demo Application only - the main application is copied
- Demo Application and all its children - the entire application is copied
Dashboard Manager User’s Guide 67
4. Click OK.
The copied application appears in the Application Structure.
Copy an application

68 Dashboard Manager User’s Guide
You can copy just the menus and submenus from one application to another. To
do so:
1. Select the menus and submenus of the application to be copied.
2. Click Copy.
The Copy dialog box opens:
Application Builder
3. Select the option you want, then click OK.
Based on your selection the menu is copied to another application with or
without its submenus.
When you copy a menu it is copied in the same application. To move it to another
application click the Up or Down buttons.

Dashboard Manager User’s Guide 69
When you copy an application, menu or submenus, the XML files are also copied
but with a new name. You can see the same in the display below. The security
command and the help link are also copied.
Copy an application
70 Dashboard Manager User’s Guide
Reorganize tree
To move the menus and submenus up and down, c lick the Up and Down buttons.
This reorganizes the tree.
Remove an application
You can remove or delete an application menu or submenu wi thin an application
by clicking on the Remove icon.
1. Select a application or submenu.
2. Click Remove.
You can see a confirmation window before actually deleting.
Application Builder
3. Click OK to delete the selected application or submenu.
Default page
You can specify what page you want the application to open at login. By default
it opens the main page, but you can select another page, for example, My
Dashboard.

Dashboard Manager User’s Guide 71
To define a default page:
1. Click Application Builder to open the main Application Builder page.
2. Next to the Menu box click Select to browse the menu or submenu page.
3. In the Select a value dialog box, Click the page to be displayed after you log
in.
4. Click OK.
The selected menu name is displayed in the Menu box on the main page.
5. Click Save.
In addition, you can also define which page to open into when any enterp rise user
logs in. For example, all users log into see My Dashboard which is customized
for their view.
Copy an application

72 Dashboard Manager User’s Guide
Application Builder

Metrics
7
chapter
74 Dashboard Manager User’s Guide
Metrics
Metric definition and scheduling make it possible to quickly and easily glean
important details and trends from extremely large and complex data sources.
This section explains in detail the parameters and tools of the Metrics tab.
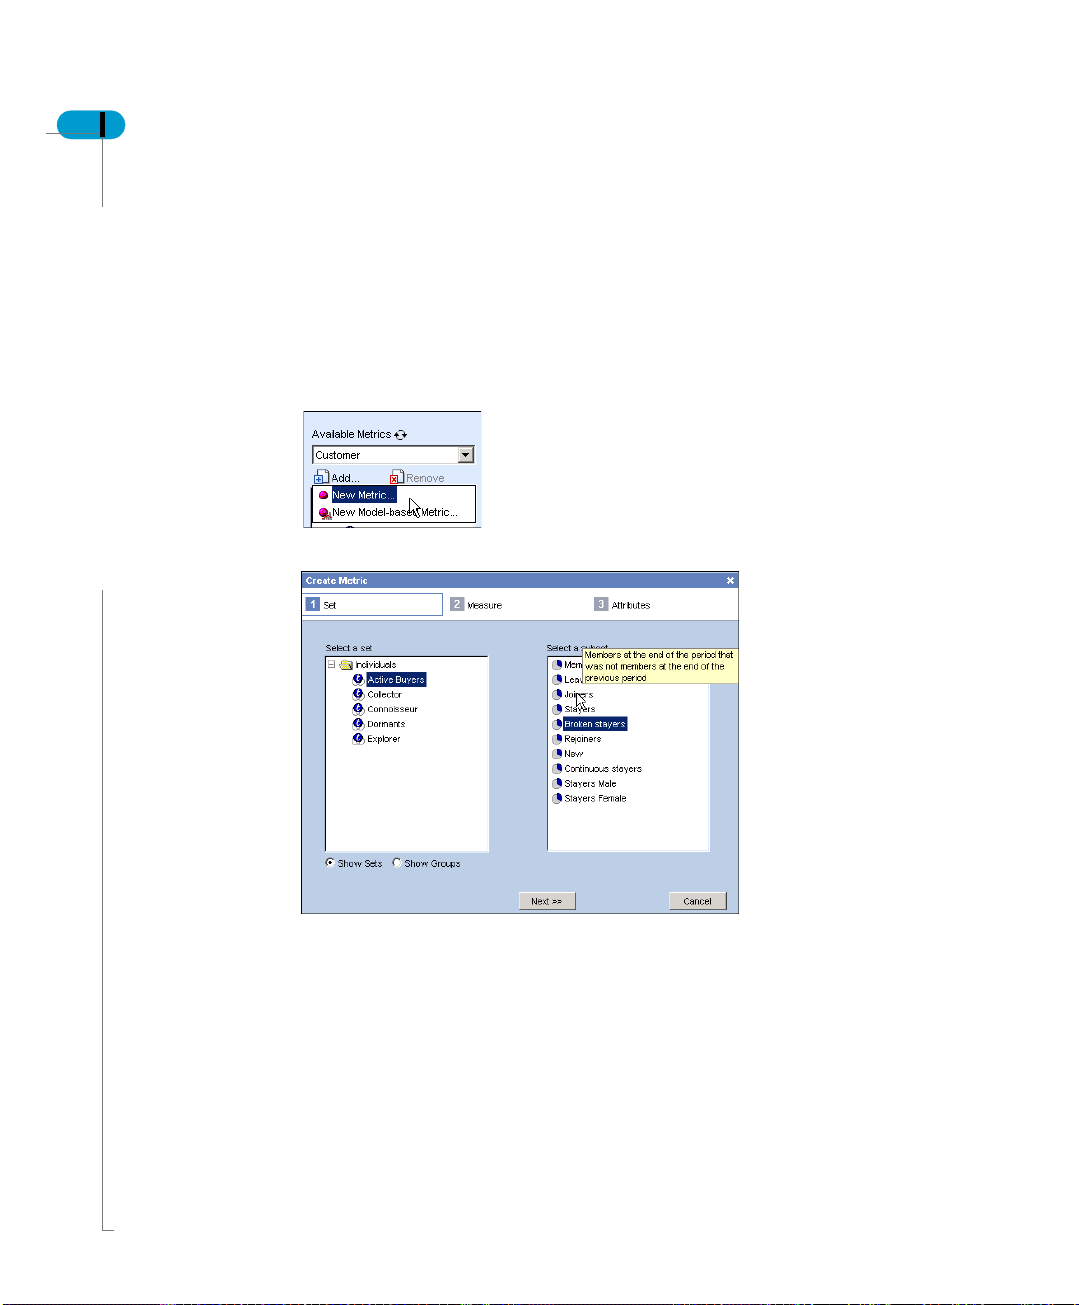
Create a new metric
Click Add to add a new metric.
The Create Metric screen appears.
Metrics
There are three sections to be completed to define a metric. To add a new metric
do the following:
1. On the page, you have to first select a set by clicking from the drop-down list.
For example, you want to take the Collectors set and define a metric for it. You
can view sets by sets or groups.
2. Click New tab. The Create Metric window appears. Based on the set and sub-
set you selected the metrics are displayed.
3. Select a subset for the set. For example, you want to know the number of
Dashboard Manager User’s Guide 75
female stayers in the Collectors sets.
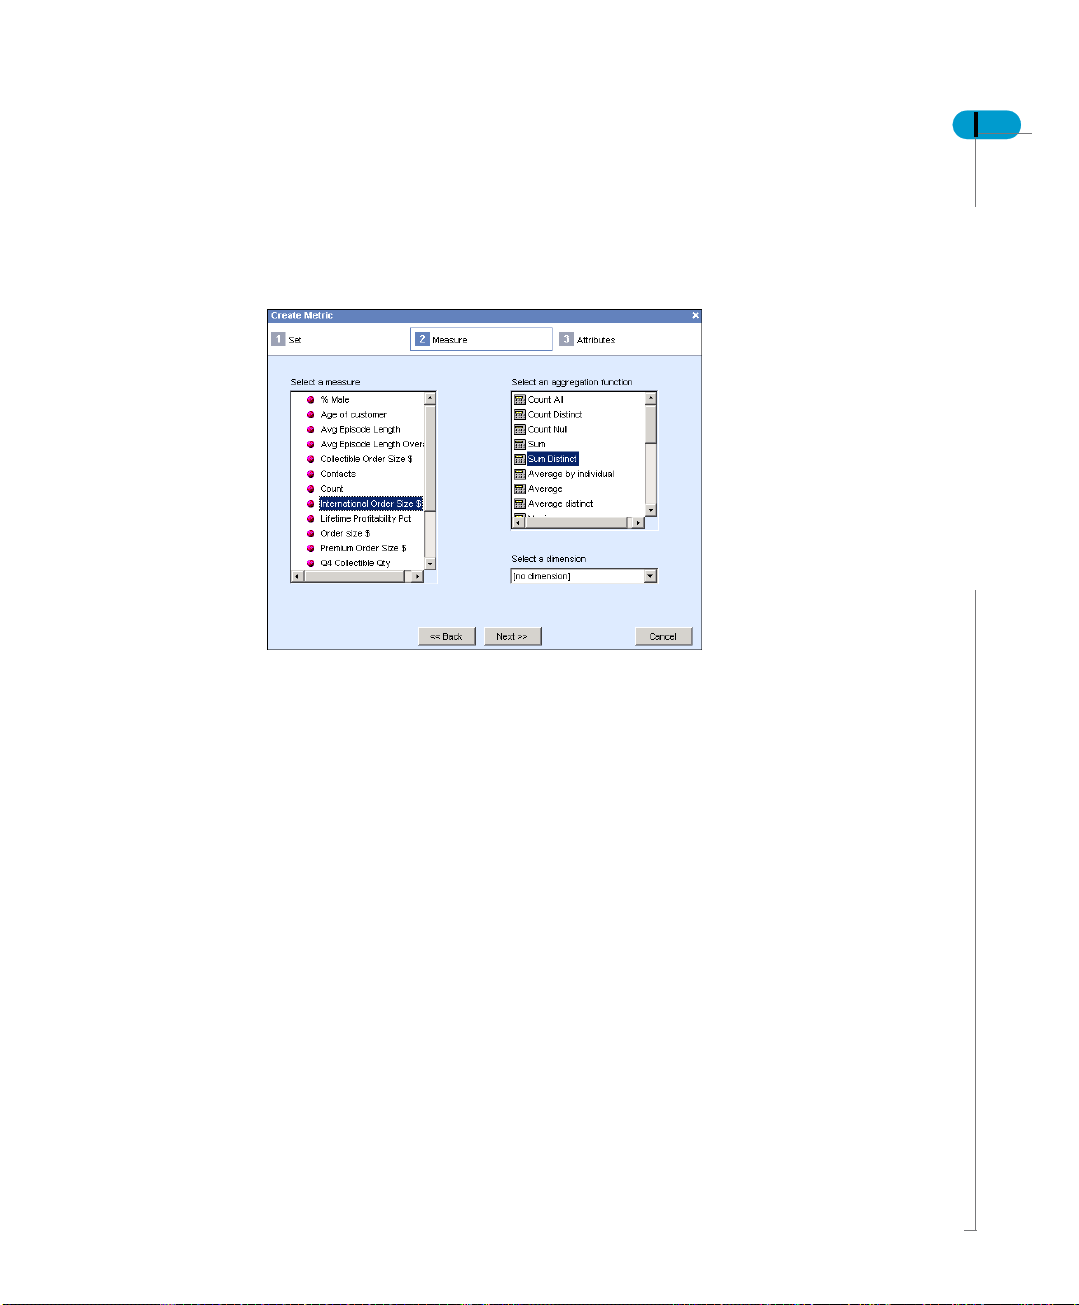
4. Click Next to move to the next section.
The next step is to define the measure for the selected set and the subset
combination.
5. Select the measure from the list. This measure is going to be for the selected
set and subset. For example, you wish to know the age of the female stayers
in the collectors set.
6. Select a dimension for the measure. For example if you select Age as a
measure, the dimension can be above 50 or below 35.
7. Select the aggregation function for the measure. For example, if you want to
find an average for the measure age of female stayers.
8. Click Next to move onto the Metric Attributes. This is the section where the
details of the metric are defined.
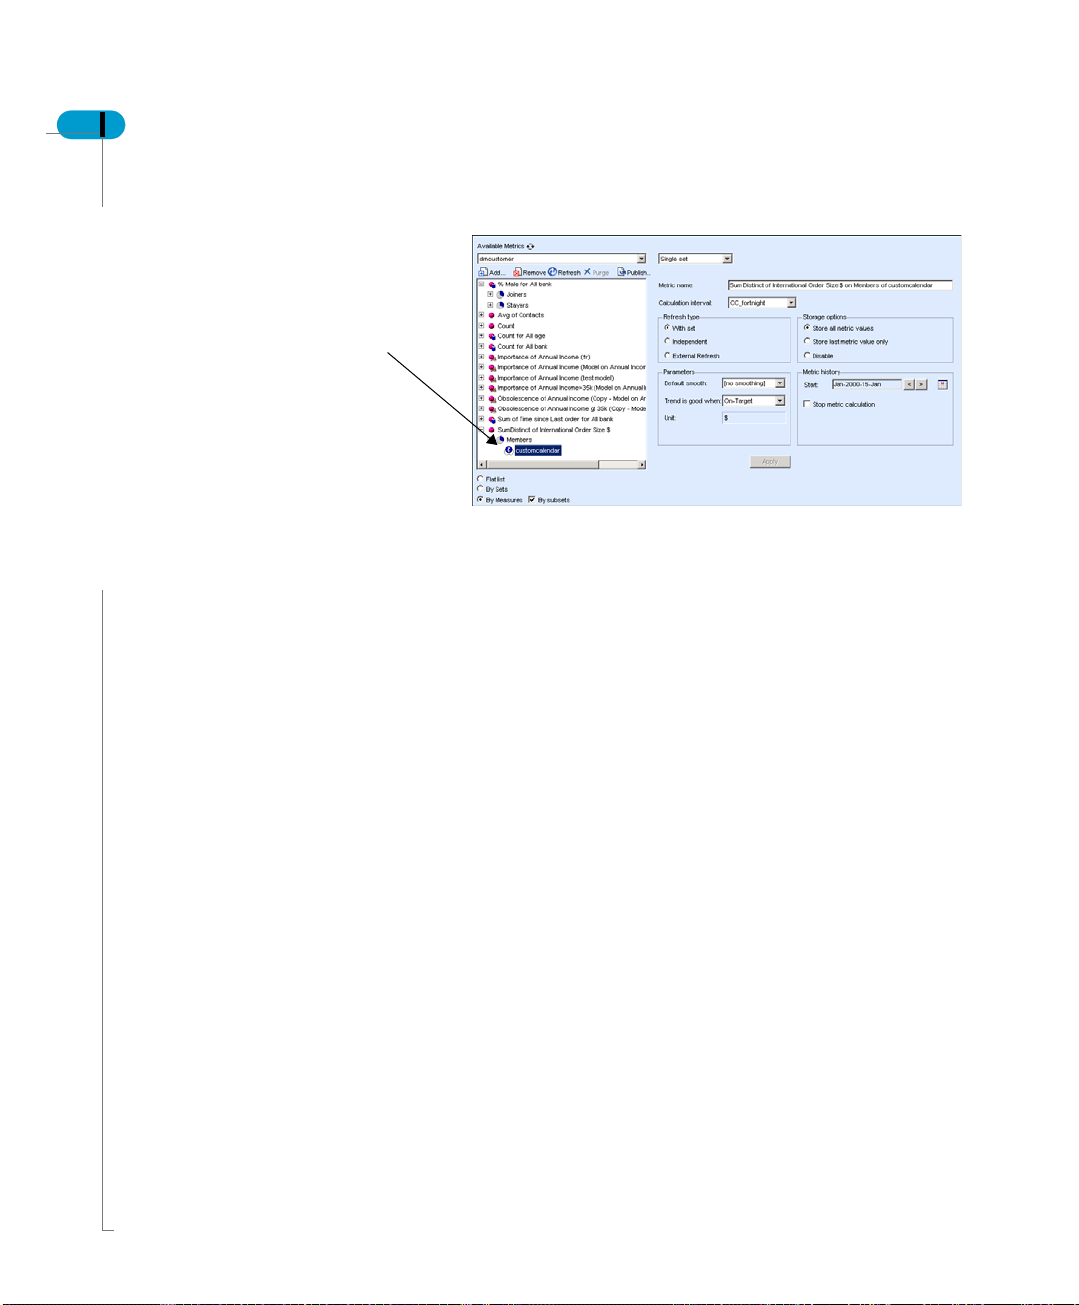
Metrics

76 Dashboard Manager User’s Guide
• Metric Description - The Metric Description field contains a description of the
metric compiled from the set, measure, subset and dimension. You have the
option to change the metric description.
• Calculation interval - The duration of the time periods or slices that make up
a metric is called the grain. The metric grain can vary from small spans of time
to longer and is dependent on the calendar — the finer the grain, the shorter
the time period between metric value calculations. The intervals can be daily,
weekly, monthly, quarterly or yearly.
• Refresh Type - You can specify the default refresh type to match that of the
Set Analyzer set that a set is based upon, or you can select a custom refresh
rate that differs from that of the Set Analyzer set. If you want to use an external
metric calculation, you can select External Refresh.
• Storage Options - Because metric values require very little s torage, it usually
makes sense to store the full metric history so that trending can be done. You
can, however, also choose only to store the most recent value or disable the
storage.
• Default Smoothing - The Default Smoothing list allows you to specify the
statistical transformation that is used in reporting on the metric when the user
accepts the Default Smoothing selection in the Smoothing list. The nature of
the data you are probing and which questions you hope to answer determine
the type of smoothing that is most suitable. Available transformations are
determined by your administrator during installation and configuration.
Metrics

Dashboard Manager User’s Guide 77
• Unit - The metric unit displays the default unit of measure for display and
reporting purposes.
• Trend color - The Trend Color chooser allows you to specify which direction
of change in metric values is interpreted as positive and which is interpreted
as negative. You can choose whether increases are shown in green and
decreases in red. Or the increase is in red and decrease in green, for
instance, company costs.
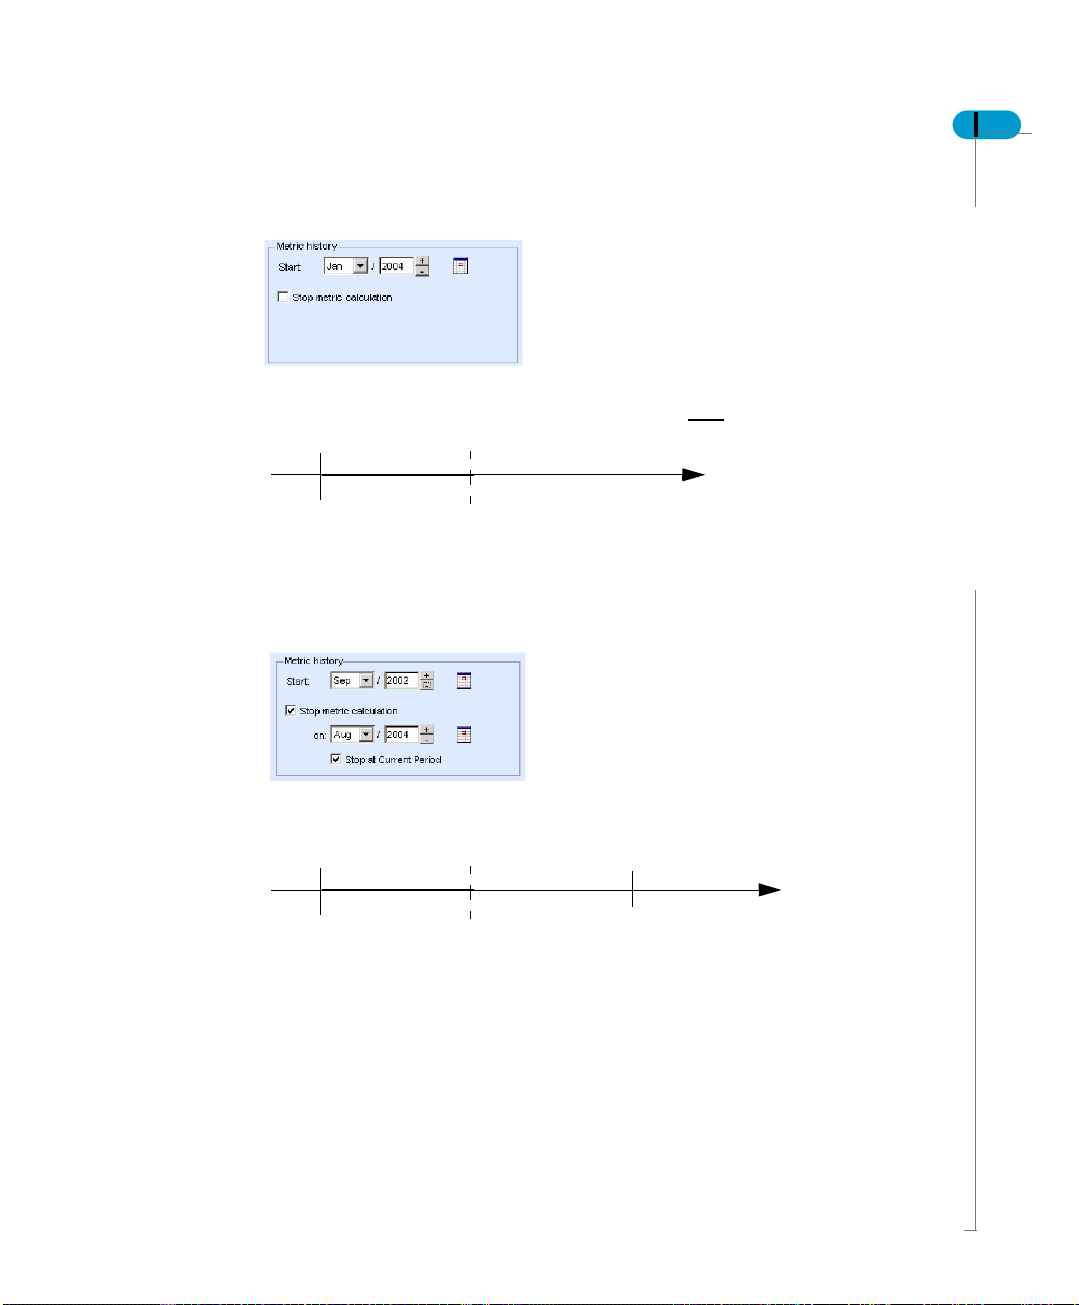
• Metric history - This field allows you to define how much back dated
information you want to be provided for this metric. Also it allows you to enter
start and stop dates for metric calculation.
- The start and stop periods must be included in the calendar span, but can
be before or after today's date. The stop period must be greater or equal to
the start period. By default the stop period is "undefined". Metrics created with
a previous version of Application Foundation has an undefined end period.
- Select the Start Date by clicking the calendar.
- You have a choice to stop the metric calculation. To do so, click the check
box to stop metric calculation. As you check the box, there is an option to
enter the stop date.
- Click the calendar to select a month and date to stop the calculation.
- Stop at Current Period allows you to stop calculating a metric on the current
date.
Edit a metric
- Regarding the metric history, if the metric has no value (has not been
refreshed yet or has been purged), the user can change the start period, the
stop period and the refresh option. It is like the creation mode.
- If the metric has some values, you cannot change the start or stop period.
You can also change the refresh type from recurrent to one-time.
- If a metric has reached its end (for example, last period same as stop
period), the Refresh button is inactive (for example, grayed).
9. Click Finish. The metric based on its sets, measures and attributes is created
and displayed on the main page. The metric is added in the Available metric
list under the appropriate set and subset.
If you make any changes on this page, the Apply button lets you change the
definition of the metric.
Metrics
78 Dashboard Manager User’s Guide
New Metric added to
the List
What determines a metric refresh?
Metric refresh occurs according to the refresh type of the metric. The following
cases describe the actual metric refresh process that occurs once a metric has
been defined.
When Set Analyzer's Set Agent module completes the refresh calculation for a
set, it invokes an after-refresh method on a server to enable metric refresh
processing.
• Case A: Based on a set refresh event
• Case B: Based on an independent metric refresh event. Case B means that
you need a scheduled task.
After performing the metric recalculation, the metric engine logs the metric ID,
date/time of the recalculation, and how long it took. System administrators use
this information for performance tuning and for managing machine resources.
Metrics
Metric refresh scenarios
When defining a metric, the user specifies a start period and can also specify
when the metric refresh must stop. The start date and stop date must fall within
the span of the calendar used by the metric. Following are the different scenarios
supported for metric refresh.
• Unlimited recurrent refresh
This is the most common case; no stop date is specified. The metric is
refreshed up to the current period on a regular basis and indefinitely.
Dashboard Manager User’s Guide 79
Start
Refresh Period
Metric history
• Limited recurrent refresh
This case is useful when you need to time-bound a metric. A date in the future
is defined as the stop date and the check-box "Stop at Current Period" is
checked. The metric is refreshed up to the current period on a regular basis.
When the metric has reached the stop date, it is not refreshed anymore.
Start
Refresh Period
Stop
• One-time refresh beyond current period
Application Foundation allows you to load future values such as plan, budget
or forecast. A date in the future is defined as the stop date and the chec k-box
"Stop at Current Period" is un-checked. The metric is refreshed up to the stop
Metrics

80 Dashboard Manager User’s Guide
date in one go, regardless of the current period.
Refresh period
Start
Stop
• Retrospective analysis
If you need to do analysis on past data, you can set up a metric which stop
date is before the refresh period. The metric values will be backfilled in one
shot. Note that the check-box "Stop at Current Period" has no effect in that
case.
Start
Stop
Refresh period
What are sliced metrics?
Application Foundation provides for “slicing” Metrics based on a dimension.
When a sliced metric is refreshed, a value is calculated for each distinct value of
the associated dimension. A metric can be sliced on one dimension for some
purposes and sliced on another dimension for others.
Some users—for example, business partners in an extranet environment—may
be restricted to viewing only certain slices of a Metric
EXAMPLE
Metrics
For example, a NewCo, Inc. employee may only be permitted to view the
“NewCo” slice of any sliced metric whose slice dimension is “Company”
He may also be permitted to view the “Northeast” slice of metrics sliced on
“Region”
These access restrictions are defined in System Configuration.

Dashboard Manager User’s Guide 81
“Sliced” Metrics can be viewed for benchmarking individuals to a sliced Metric.
You can choose which of the slices are available want to filter on (including
“unsliced”).
The metric comparison screens in Individual Analysis then filters out all Metrics
except for those with values for the user-selected slice within the user-selected
time interval. This greatly increases the potential value of Individual Analysis for
extranet users having restricted access to Metrics.
What are external metrics?
Metrics whose values are calculated independently of Application Foundation are
called external metrics. For example, you may want to devise a complex
customized metric calculation for a particular set that is difficult or inefficient to
express in SQL. By updating the metric tables directly, but still m aking the metric
known to the application, you can retain the benefits of Application Foundation’ s
analysis capabilities, document management, and personalized information
management.
NOTE
The Application Foundation Metric Engine does not attempt explicit refreshes for
external metrics; furthermore, this application does not permit you to uncheck an
external metric.
Multi-set me tr ics
• For a particular set, you can select multiple subsets or measures or
transformations to define multi Metrics.
• For a particular group, you can define Metrics for each set that belongs to the
group.
• For a particular level of the tree list, you can refresh or purge all the Metrics
under this level. You can use a view by measure, by set, by subset or by
group. Paired-set Metrics enable you to track relationships between sets over
time. Four types of paired-sets metrics are built into the product
• Migration
Migrants are individuals who left a given tier to join another given tier.
Migrants (p) from Set A to Set B are: Set A leavers of the period that joined
Metrics

82 Dashboard Manager User’s Guide
Set B in that same period
Leavers (p)
Set A
Joiners (p)
Set B
Migrant metrics are applicable to temporal sets only. Also they are not
commutative which means that Migrants from A to B are different from
Migrants from B to A
• Overlapping members
Overlapping Members of Sets A and B are: Set A Members of the period that
are also Members of Set B in that same period
Members B
Set A
Members
Set B
Overlapping Members are applicable to two temporal sets or two non
temporal sets or the combination of a temporal and a non temporal set. They
are commutative which means that Overlapping Members of A and B are
identical to Overlapping Members of B and A
• Same time joiners
Same time joiners(p) of Sets A and B are: Set A Joiners of the period that
joined Set B in that same period
Metrics
Joiners (p)
Set A
Joiners (p)
Set B
Same time joiners are applicable to temporal sets only. They are commutative
which means that Same time joiners of A and B are identical to Same time
joiners of B and A
• Same time leavers
Same time leavers(p) of Sets A and B are: Set A leavers of the period that left

Set B in that same period
Dashboard Manager User’s Guide 83
Same time leavers is applicable to temporal sets only . They are commutative
which means that Same time leavers of A and B are identical to Same time
leavers of B and A.
Manual entry metric
Dashboard Manager 6.5.1 enables you to define a metric and its time-based
values manually. Manual entry metrics can be used to define KPIs that do not
exist in any system like survey results for instance.
NOTE
Defining a manual-entry metric requires to use a non-set based subject area.
To add a manual entry metric entry follow the steps below.
1. Click on Add and select the manual entry metric option.
Leavers (p)
Set A
Leavers (p)
Set B
Metrics

84 Dashboard Manager User’s Guide
The Create Metric window appears.
2. Enter the metric Name.
3. Select a Calculation Interval.
Calculation interval - The duration of the time periods or slices that make up
a metric is called the grain. The metric grain can vary from small spans of time
to longer and is dependent on the calendar — the finer the grain, the shorter
the time period between metric value calculations. The intervals can be daily,
weekly, monthly, quarterly or yearly.
4. Enter the Refresh Type. There is only one type for this metric.
5. Select the Storage option.
Storage Options - Because metric values require very little s torage, it usually
makes sense to store the full metric history so that trending can be done. You
can, however, also choose only to store the most recent value or disable the
storage.
6. Select Default Smoothing which is default and optional.
The Default Smoothing can be used when reporting on the metric.
7. Enter Metric history.
Metric history allows you to define how much back dated inf ormation you want
to be provided for this metric. Also it allows you to enter start and stop dates
Metrics

Dashboard Manager User’s Guide 85
for metric calculation.
8. Enter metric Unit.
The metric unit displays the default unit of measure for display and reporting
purposes.
9. Specify the Metric history by entering a start date and a stop date.
10.Click Next.
11.Enter the values: one for each period within the span defined.
12.Click Finish to create a metric.
Metrics

86 Dashboard Manager User’s Guide
Metric publishing
Some metrics are a little more difficult to quantify a target for. For example, you
may have a Number of Customers metric that is obviously important to your
operational performance. However, for this metric, a target is unclear, and maybe
simply inappropriate. You want to have your executive team aware of the Number
of Customers, but they can draw their own conclusion with regards to whether to
pay attention to it or not. One person may care if it is going up, another may care
if it is going down. But a single target is unclear.
To facilitate this, we support the publishing of metrics.
The Publish button will behave as follows:
• It is only displayed when Performance Manager is installed, current Licensed,
and the associated user has the capability to Publish Goals defined in
Supervisor.
• If no metric is selected, the button is visible but disabled. When a metric is
highlighted, the button is enabled.
• The Publish button is not enabled when selecting a sliced metric.
Once you create a new goal it has to be distributed to the right people or group
of people. Goals are published for the following reasons:
• Publish goals to user by “Role”. This helps to get goals focused to the right
interested parties.
• Integrated goal portlet interface.
• Enable collaboration via discussion threads, previous actions, etc.
• Recommend actions that link to other reports or recommended business
actions.
To publish a metric:
1. Click on the Publish icon.
Metrics
The information flow wizard appears.

Dashboard Manager User’s Guide 87
2. Select a Strategy to which the metric should belong.
As you select, the new flow is added to the selected strategy folder.
3. Click on the "+" sign to expand the Strategy folders.
4. Click Next to specify the recipients of this goal.
Who receives the information?
On this page you select who you want to send this information to. Roles are
typically mapped to physical users or organizational units at implementation.
You can select people either by role or as individuals, using the following options:
• People in my team
• My manager
• Other people
If you have more than one role in the company, you can select that specific role.
Or if you are sending information on behalf of someone else, for example, the
CEO’s administrative assistant sending information to the entire company on
behalf of the CEO.
To do any of these, do the following:
Metrics

88 Dashboard Manager User’s Guide
If you have more than one role in the company, you can select that specific role
and then send information. For example, you are Director Engineering and also
handling Documentation group. To send information to the documentation team,
you can select yourself as a documentation manager and send the information to
the team concerned.
Or if you are sending information on behalf of someone else, for example, the
CEO’s administrative assistant sending information to the entire company on
behalf of the CEO.
If you have more than one role, as you log in all your roles are displayed in a drop
down. Before sending information, select the role from which you are sending the
information. To do, click on the drop down or the link, Select another role.
People in my team
Use this option when you want to send information to some or all of your team
members.
1. Select the People in my Team option:
Metrics
2. Use the radio buttons shown below to choose whether to select everybody in
your team, all your direct reports, or people in other teams:
Here you have three options:
- Everybody in my team: Lists all the people who are part of your team.

Dashboard Manager User’s Guide 89
- All direct reports: Lists all those who directly report to you.
- Specific people in the team: List e veryone and you can pick the people who
need to get this information. You can list by team or individuals.
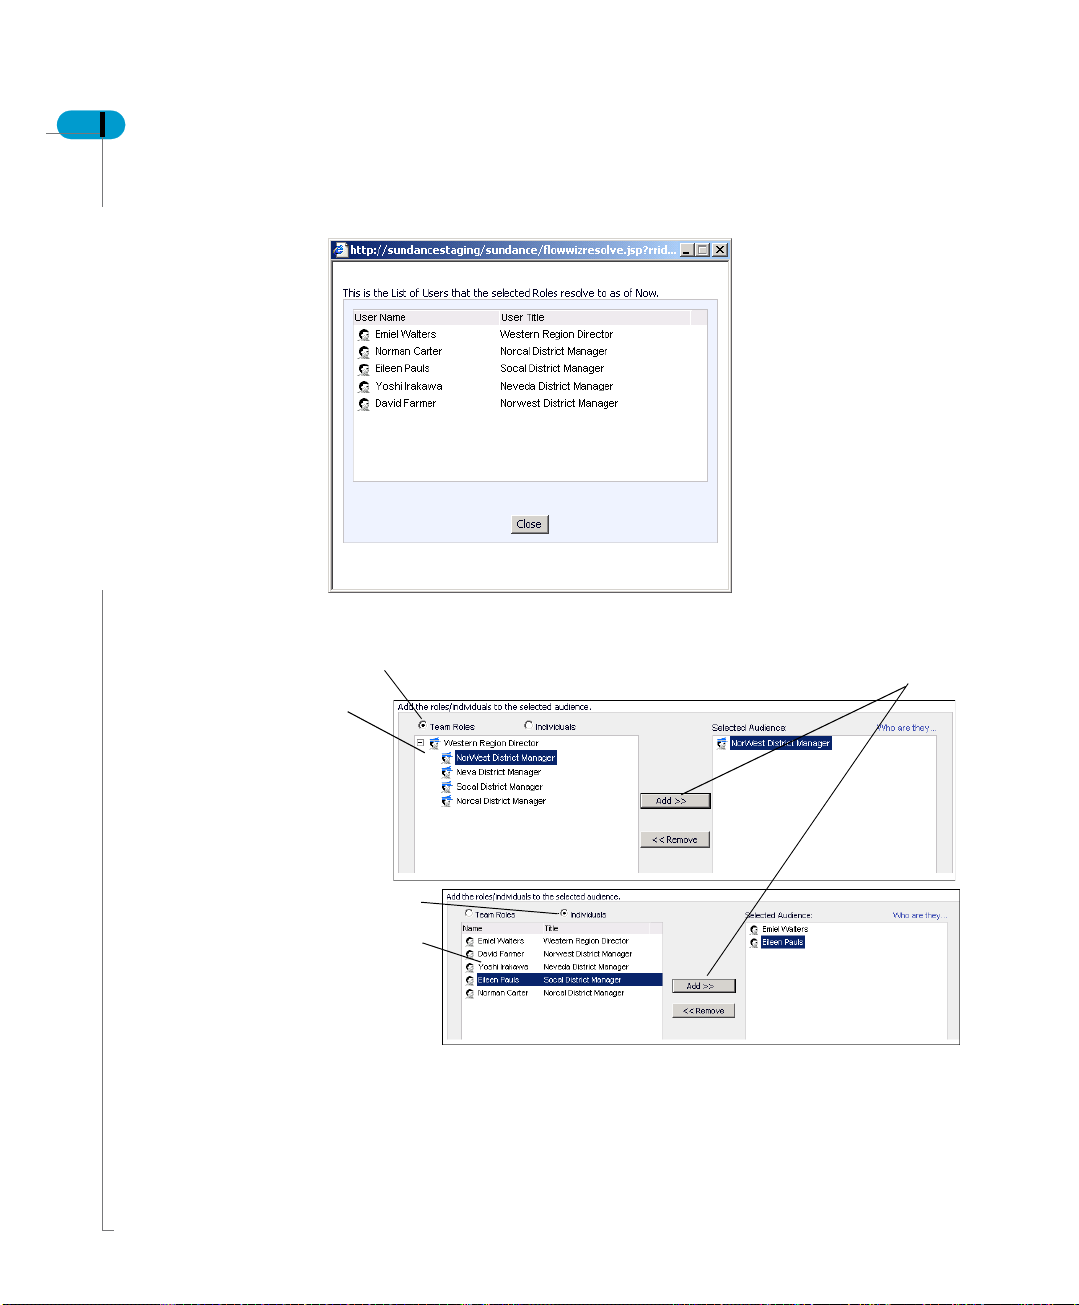
3. Click Who they are to display a list of users by roles/titles:
Metrics
90 Dashboard Manager User’s Guide
• If you select Specific People in the Team, the page below is displayed. You
can select the individual members of the team for distribution.
Team selection
Roles within the
team
To select role or
individual
Metrics
Individual selection
Names of individuals
4. Select either the role or an individual and click Add to select.
Dashboard Manager User’s Guide 91
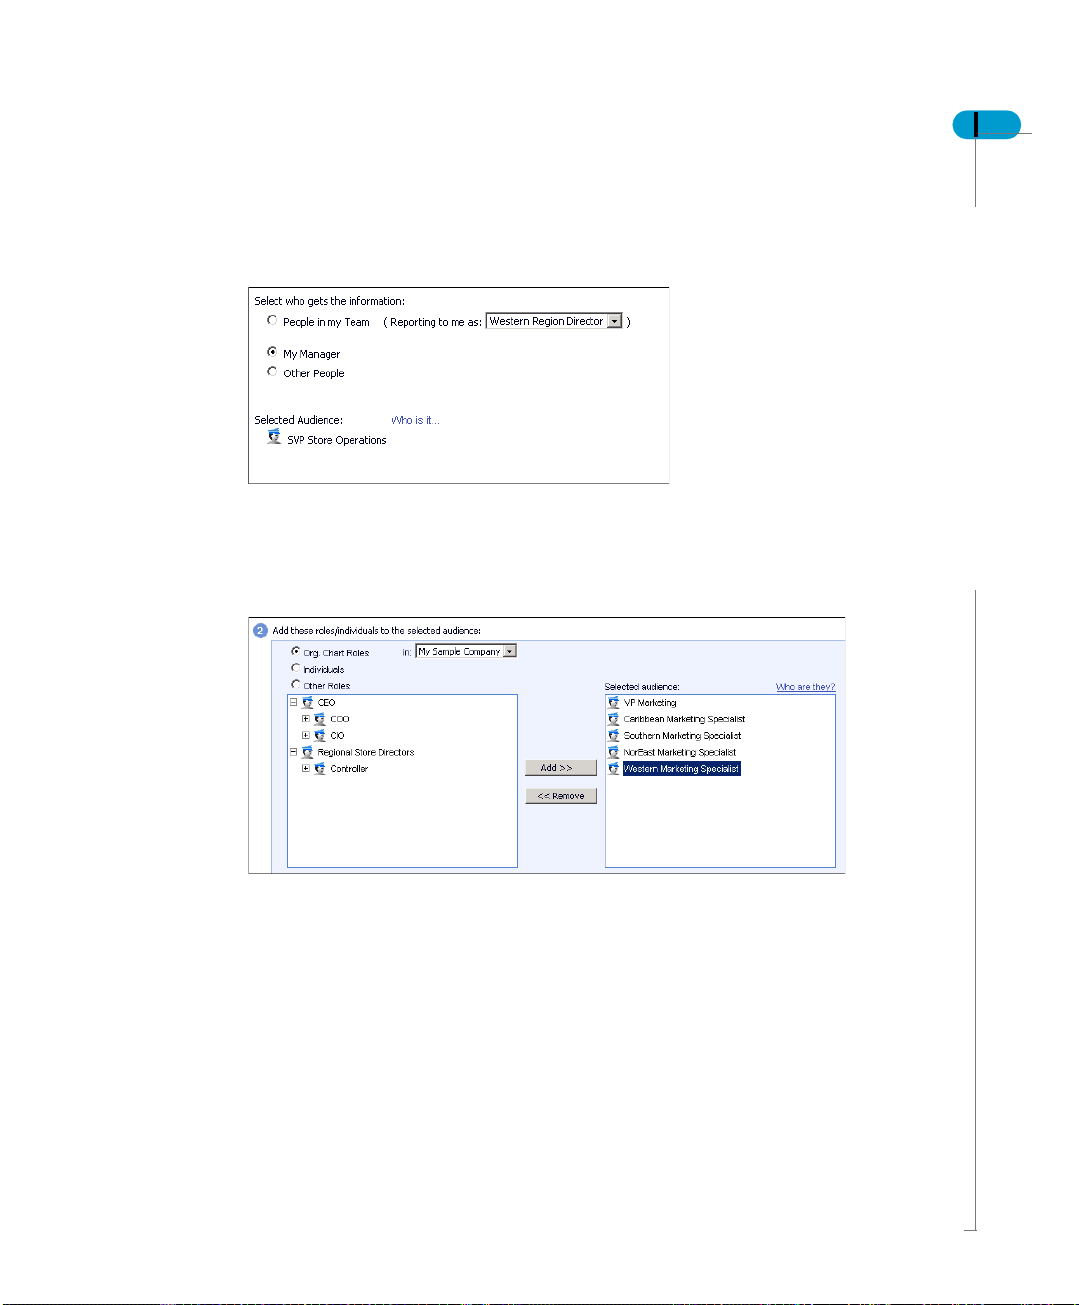
My manager
The second option is "My Manager". Use this option to send the information flow
to your direct manager:
Your manager's role is displayed.
Other people
Use this option “Other People" to select roles or individuals who are out of your
team but within the same organization.
You can select the organization chart (which lists all the roles within the
organization), roles within a category, or specific individuals.
1. Select the appropriate radio button which lists the names or roles.
2. Select a name or role and click Add which physically moves the name or role.
3. Click Next to define what information to send.
Metrics

92 Dashboard Manager User’s Guide
What metric to deliver?
The next step is to define what metric needs to be sent to the selected roles or
people.
1. Click on the metric radio button.
All the metrics are displayed.
2. Select the metric to be sent.
As you select a metric all details are displayed on the right side. You c an click
View Metric to view more details.
Metrics
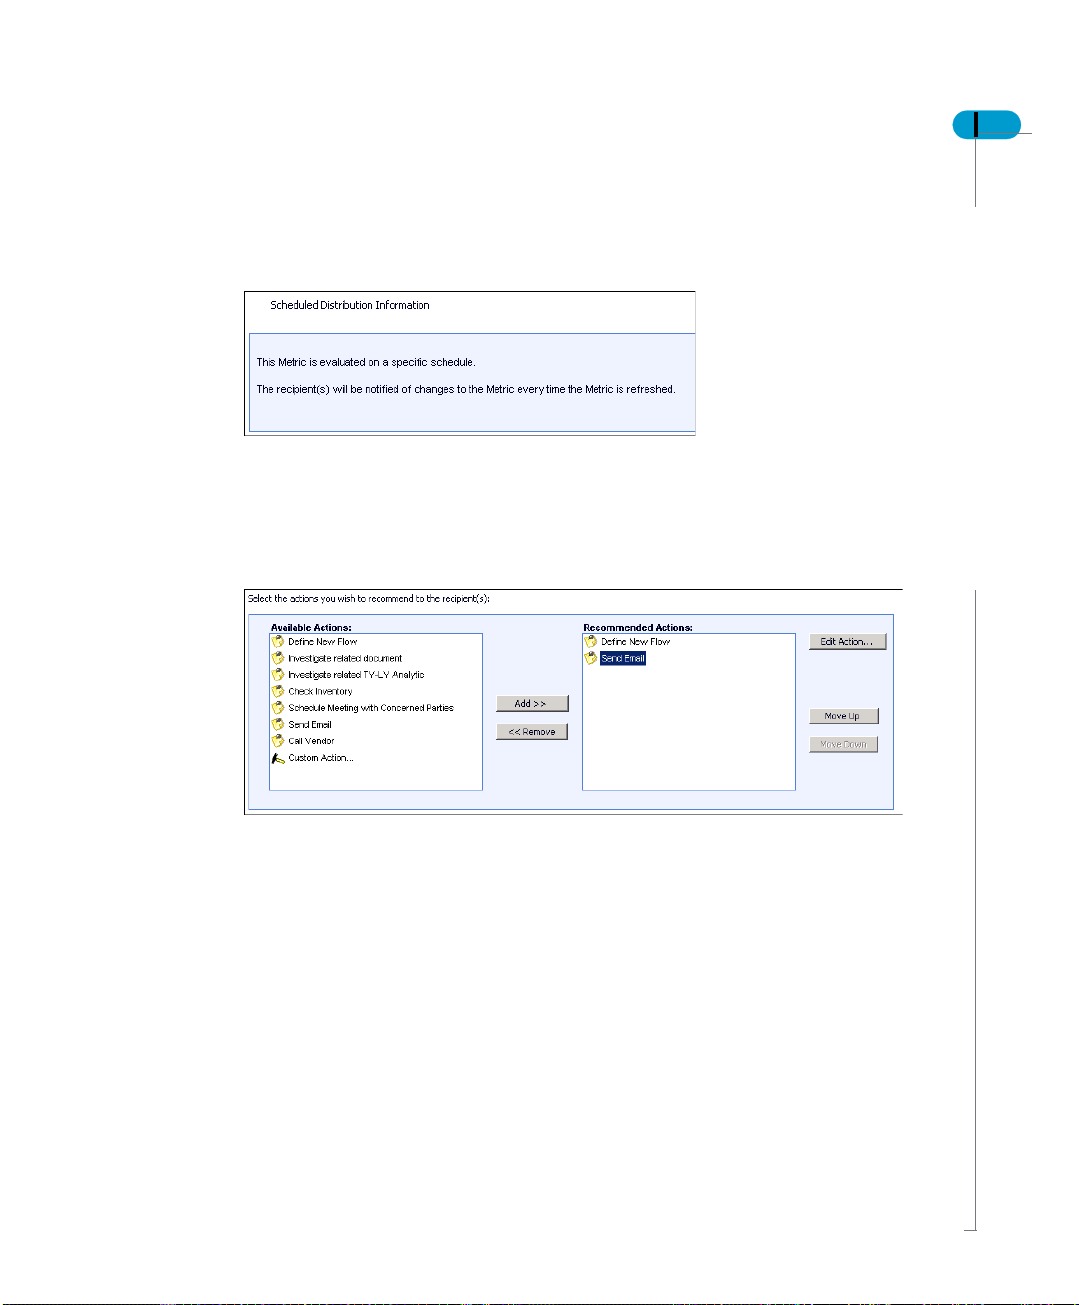
When the information needs to be sent?
When the goals is to be sent is predefined by metric scheduler. The recipient is
notified of updates.
What actions are recommended?
The next step is to define what action(s) need to be taken once the goal reaches
the specific individuals or roles. There may or may not be an action to an
information flow. This action is viewed as Recommended Action for the user.
These actions are defined by the System Administration.
Dashboard Manager User’s Guide 93
1. Click on an action that needs to be fulfilled for the information flow. Some of
the actions listed have a link when a user views on his/her home page. And
some do not.
There are four types of actions:
• Prescriptive - Prescribing an action
• Linked - Link to websites
• Strategy Actions - Flows and Goals
• Investigated - Link to other reports
2. Click Add to select the action.
3. If you have selected more than one action, you can re-shuffle them by using
the Move Down button.
4. You can edit a selected action by clicking Edit Action. This allows you to
change the definition of the action.
Metrics
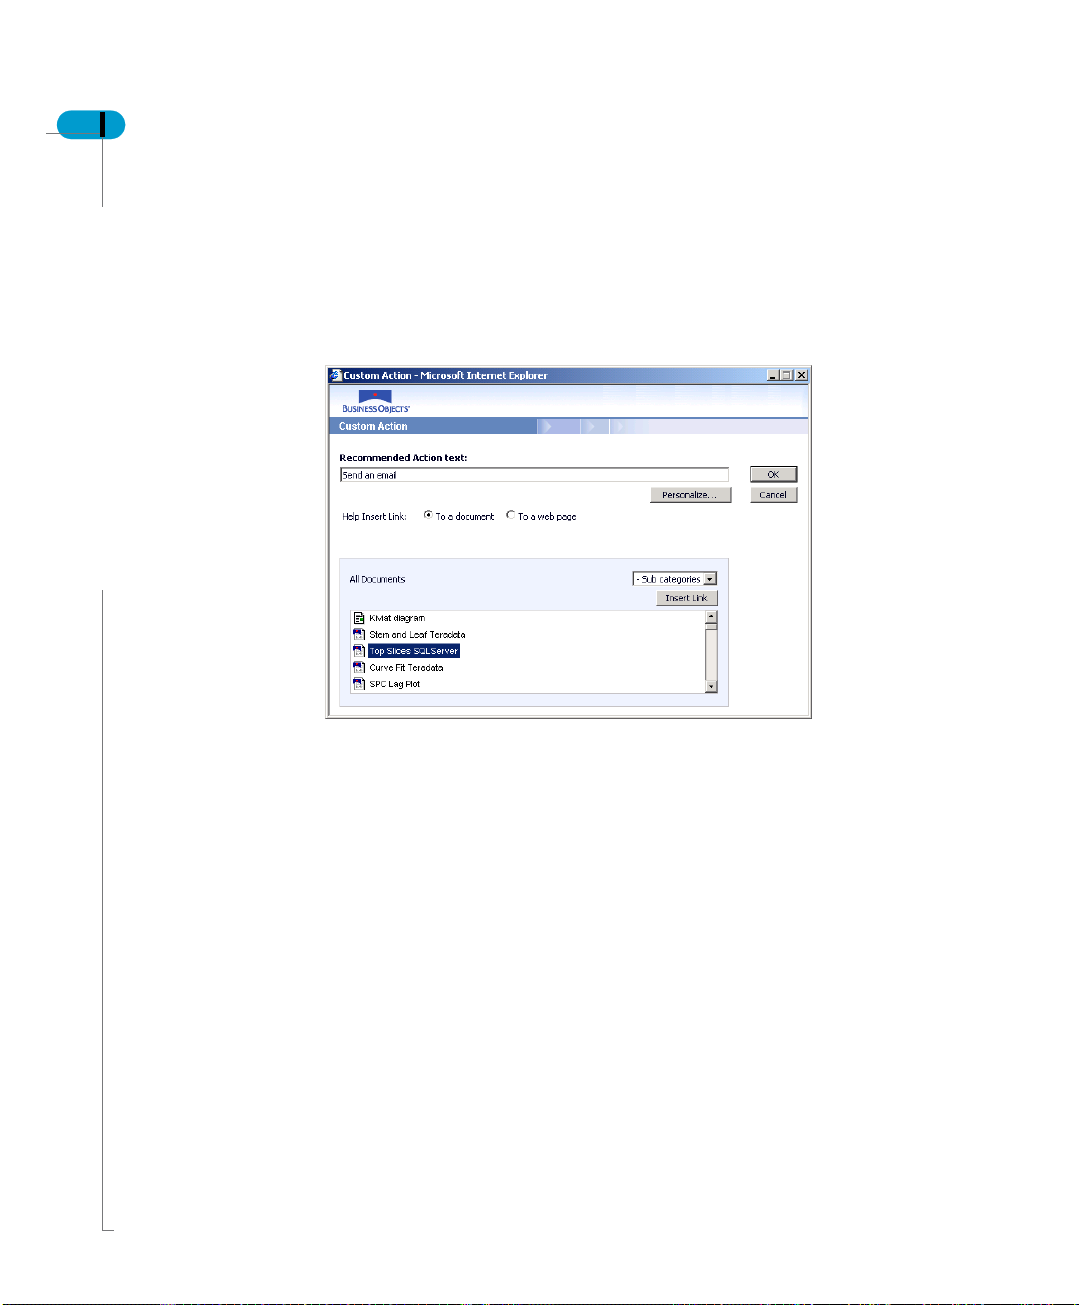
94 Dashboard Manager User’s Guide
Custom Action
1. You can customize an action by selecting Custom Action from the list. As you
do that a pop-up window appears which allows you to customize the action.
2. Enter the Name of the action.
The action that you define can be a link to an analytic or to a website.
3. If it is a link to an analytic, select the analytic from the list.
Metrics
4. Click Insert Link. As you do that you notice the link details are displayed next
to the name of the action.
5. If you select a link to a web page, you need to enter the URL for the link.
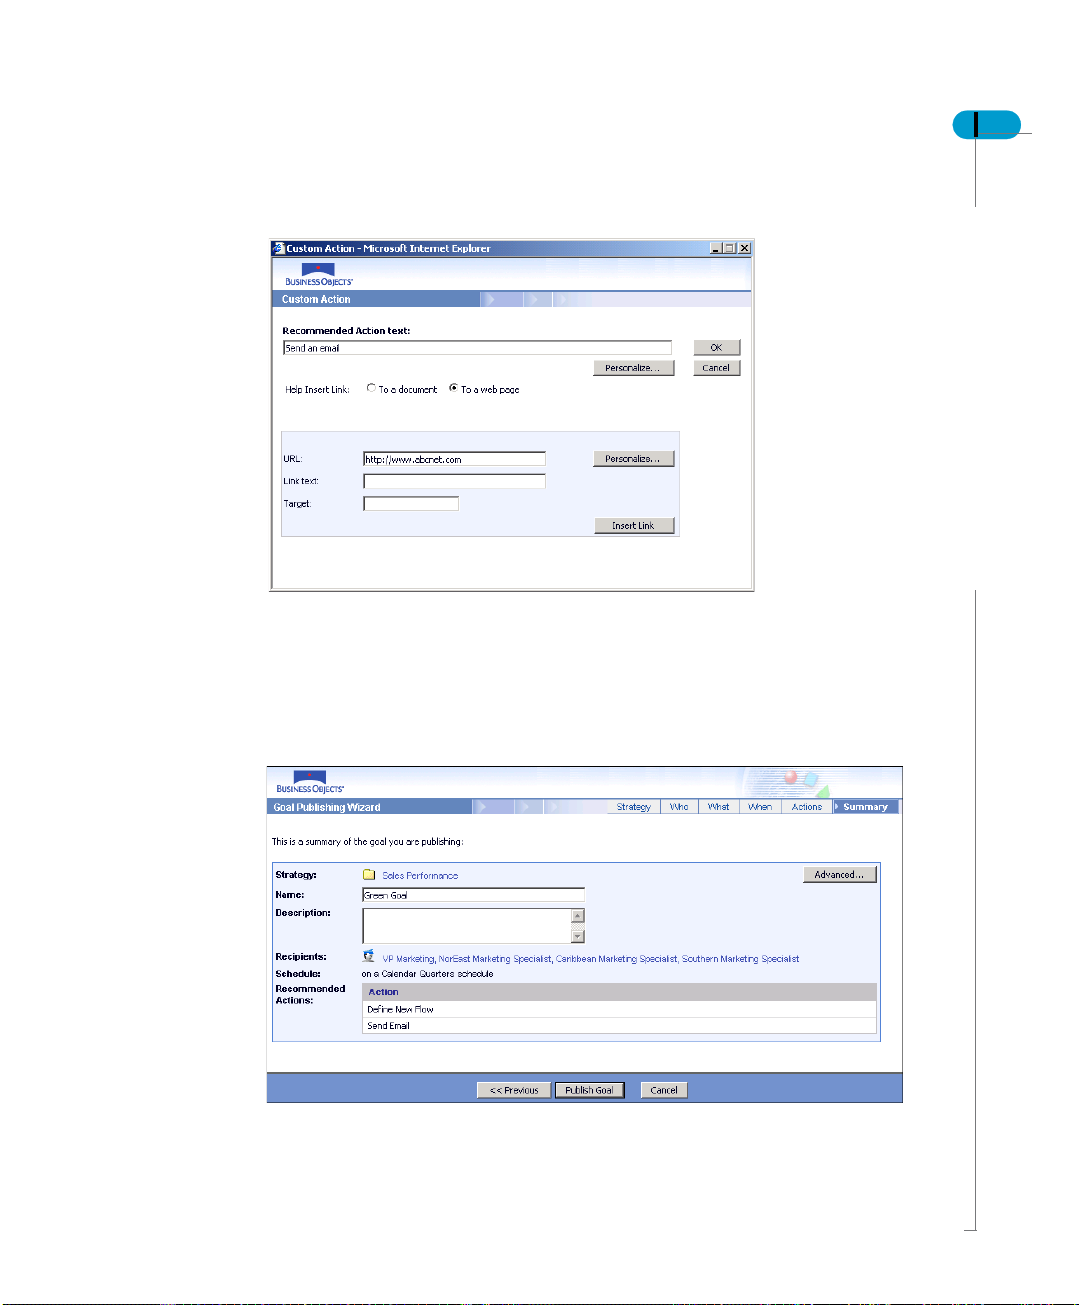
6. Click Insert Link. As you do that you notice the link details are displayed next
to the name of the action.
7. Click OK for the next steps.
Information Summary
1. The last step of the wizard gives a summary of all that you defined when
publishing a goal.
Dashboard Manager User’s Guide 95
Metrics

96 Dashboard Manager User’s Guide
On this page you can view and specify the following:
• Link to the strategy selected.
• Name of the goal. You can change the name.
• Enter the Description of the goal.
• Priority - How important is the goal. It can be Normal, Important or Critical.
This categorizes how recipients are going to receive the goal.
• Recipients targeted lists all the “who” you selected through the wizard.
• Schedule is based on the metric.
• Recommended next steps.
The Advanced Button allows you to specify a few more details regarding the goal.
Metrics
• Flow Activity - If you wish to keep an his tory on all the Intelligent Documents
that take place for this flow. Or you can expire it once it is completed.
• Include email - You can notify the arrival of the flow via email with a "hot link"
to the recipient.
• Next Steps Scope - This information can either be specific to an individual or
role or it can be shared among the team.

Dimension
A dimension can be used to personalize analytics by defining an association and
to create sliced metrics. The Dimension tab displays the list of existing
dimensions with their properties.
A dimension can have an "association". It defines which user can see which
value(s) or slice(s) of a dimension. This dimension association can be used to
filter analytic result set (based on query or metric). Additionally, it can be used to
filter the slices displayed in an analytic when based on secured sliced metrics.
For example, Bank is a dimension where John can see only Barclays and Bob
can only see Bank of America. This dimension can be used to create sliced
metrics and secured sliced metrics. A sliced metric is created, Revenue per
Bank. A dashboard is created that contains a speedometer, based on this sliced
metric. When John logs in, he can see only Barcl ays Revenue and Bob can only
see Bank of America Revenue.
To create sliced metrics, the administrator needs to define a dimension by
specifying its objects code and name. A dimension is identified by its name. To
create sliced metrics, the administrator has to specify the objects code and name.
He also needs to specify if the sliced metrics created on this dimension are
secured or not.
Dashboard Manager User’s Guide 97
Dimension

98 Dashboard Manager User’s Guide
Create a dimension
To add a dimension follow the steps below:
1. Click on Add.
2. Enter the Name of the dimension
3. To create sliced metrics for this dimension, check the box.
4. Select the Subject Area from the drop down.
You have to define two objects - one to retrieve the name, the other one the code,
and they can be the same.
5. Select the two objects from the drop down list.
6. Select the global slice name.
7. Click Next.
Metrics
NOTE
If the dimension is used only to personalize analytics and not sliced metric
creation, you do not need to specify them.

Define association
For any dimension, you can specify association between users and slices which
implies, who can see which slice. A user can have access to multiple slices. This
association can be used to filter the data displayed in an analytic, per user
This association can be defined in 2 different ways:
Dashboard Manager User’s Guide 99
• Manually, by explicitly selecting the list of slices accessible for a user, and
repeating this process for each user.
• Read from a database. In this case, it is assumed that the customer has
already defined their security information in a relational database and would
like to use it in Dashboard Manager.
• None implies no association is needed for this dimension or the association
is to be defined later.
8. Click Next.
Dimension
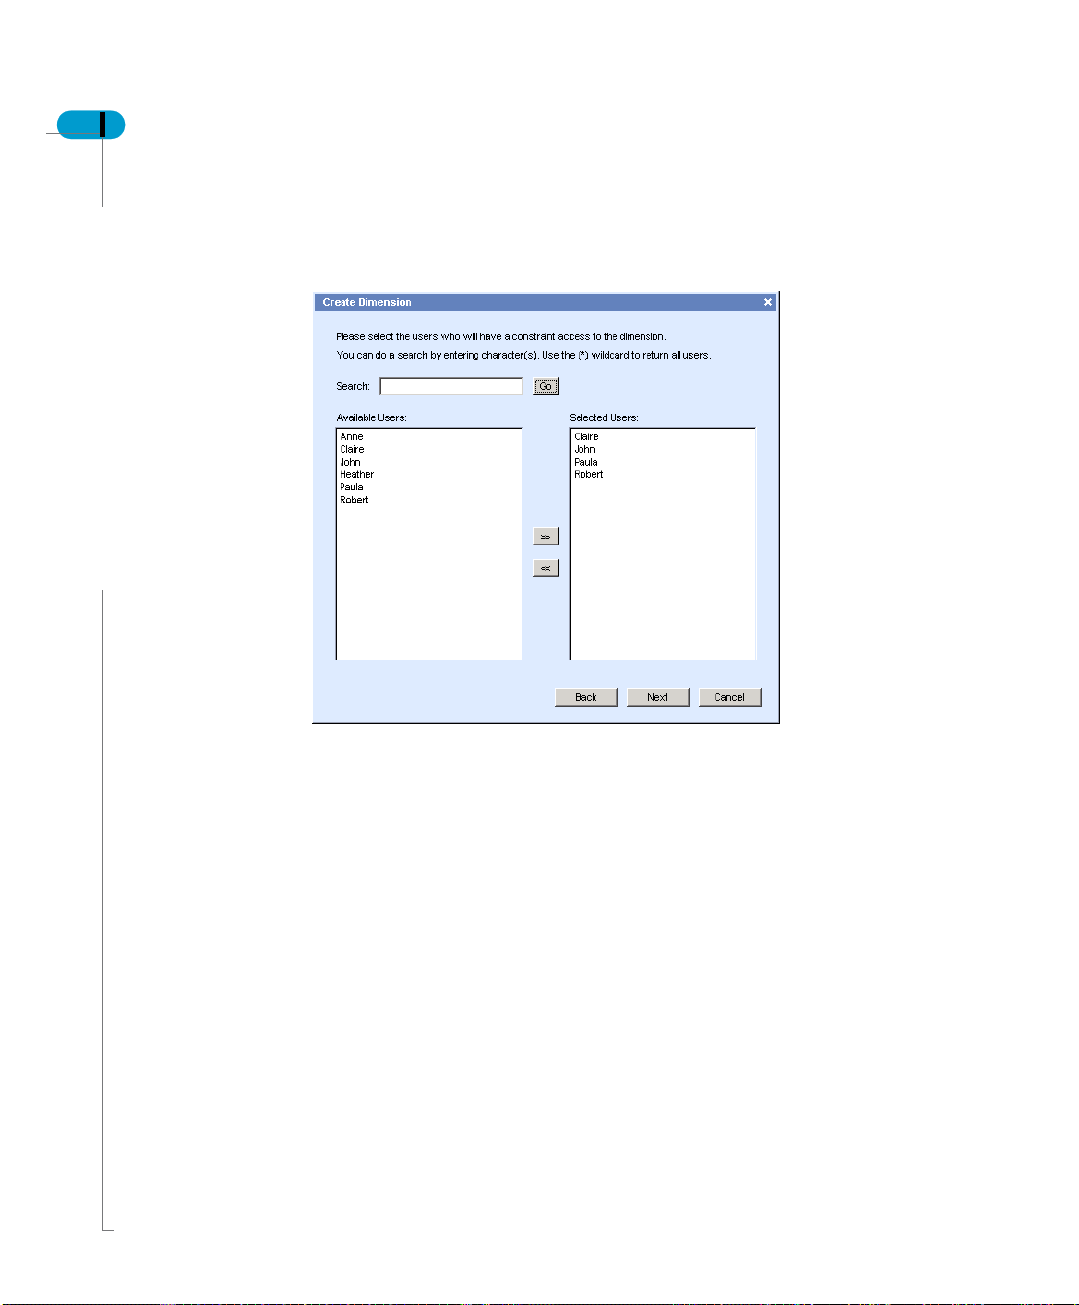
100 Dashboard Manager User’s Guide
Manual association
For manual association the users are imported from the BusinessObjects
repository. You have to specify for each user the list of accessible slices.
Metrics
1. Select the user name and click on the arrow to move it to the selected area.
2. Click Next.
 Loading...