


VBC Controller User’s Manual
Applies to software release v5.4
April 2018
Current documents are always found in the log-in area of the www.bridgetech.tv site.
Refer to section 1.3 of this document for more information.

VBC Controller User’s Manual
Revision 4a45156 (2018-04-26)
Copyright
All rights reserved.
This publication can contain confidential, proprietary, and confidential trade secret information. No part of this document
may be copied, photocopied, reproduced, translated, or reduced to any machine-readable or electronic format without prior
written permission from Bridge Technologies Co AS. CE-marked in accordance to low voltage directive (LVC) 73/23/EEC
and EMC directive 89/336/EEC. Compliant to requirements for US and Canada. Designed for CSA approval. Bridge
Technologies Co AS continuously improves on products and reserves the right to modify the specifications without prior
notice. Information in this document is subject to change without notice and Bridge Technologies assumes no responsibility
or liability for any errors or inaccuracies.
The BRIDGE, BRIDGE TECHNOLOGIES and BRIDGETECH name, logo and all other related logos are registered
trademarks of BRIDGE TECHNOLOGIES Co AS.
All other products or services mentioned in this document are identified by the trademarks, service marks, or product
names as designated by the companies who market those products. Inquiries should be made directly to those companies.
This document may also have links to third-party web pages that are beyond the control of Bridge Technologies. The
presence of such links does not imply that Bridge Technologies Co AS endorses or recommends the content on those
pages. Bridge Technologies acknowledges the use of third-party open source software and licenses in some products.
All trademarks and registered trademarks mentioned herein are the property of their respective owners.
c
Bridge Technologies Co AS. Bentsebrugata 20, NO-0476, Oslo, Norway.

Contents
Contents 3
1 INTRODUCTION 6
1.1 Sites and Blades . . . . . . . . . . . . . . . . . . . . . . . . . . . . . . . . . . . . . 6
1.2 Users and Access . . . . . . . . . . . . . . . . . . . . . . . . . . . . . . . . . . . . . 6
1.3 How to Use This Manual . . . . . . . . . . . . . . . . . . . . . . . . . . . . . . . . . 7
2 INSTALLATION AND INITIAL SETUP 9
2.1 System Requirements . . . . . . . . . . . . . . . . . . . . . . . . . . . . . . . . . . 9
2.2 First-time Installation . . . . . . . . . . . . . . . . . . . . . . . . . . . . . . . . . . . 10
2.3 Deploying in a Virtualized Environment . . . . . . . . . . . . . . . . . . . . . . . . . 11
2.4 Verifying Correct Initial Setup and Software Activation . . . . . . . . . . . . . . . . . 12
2.5 Initial Setup Troubleshooting . . . . . . . . . . . . . . . . . . . . . . . . . . . . . . . 14
2.6 Upgrading From a Previous Version . . . . . . . . . . . . . . . . . . . . . . . . . . . 14
2.6.1 Using an Installation Script . . . . . . . . . . . . . . . . . . . . . . . . . . . . 15
2.6.2 Using Software Activation . . . . . . . . . . . . . . . . . . . . . . . . . . . . 15
2.6.3 Using a full reinstall . . . . . . . . . . . . . . . . . . . . . . . . . . . . . . . . 16
2.7 Accessing the User Interface . . . . . . . . . . . . . . . . . . . . . . . . . . . . . . . 16
2.8 Firewall Configuration . . . . . . . . . . . . . . . . . . . . . . . . . . . . . . . . . . . 17
2.9 License Details . . . . . . . . . . . . . . . . . . . . . . . . . . . . . . . . . . . . . . 18
3 REMOTE DATA WALL 19
3.1 Introduction to the Remote Data Wall . . . . . . . . . . . . . . . . . . . . . . . . . . 19
3.2 Accessing the Remote Data Wall . . . . . . . . . . . . . . . . . . . . . . . . . . . . 19
4 THE VBC GRAPHICAL USER INTERFACE 21
4.1 Login . . . . . . . . . . . . . . . . . . . . . . . . . . . . . . . . . . . . . . . . . . . 22
4.2 Live . . . . . . . . . . . . . . . . . . . . . . . . . . . . . . . . . . . . . . . . . . . . 24
4.3 Monitoring . . . . . . . . . . . . . . . . . . . . . . . . . . . . . . . . . . . . . . . . . 25
4.3.1 Monitoring — Top Level . . . . . . . . . . . . . . . . . . . . . . . . . . . . . 25
4.3.2 XML Alarms . . . . . . . . . . . . . . . . . . . . . . . . . . . . . . . . . . . . 30
4.3.3 Monitoring — Site . . . . . . . . . . . . . . . . . . . . . . . . . . . . . . . . 30
4.3.4 Monitoring — Blade . . . . . . . . . . . . . . . . . . . . . . . . . . . . . . . 32
4.4 Blade alarms . . . . . . . . . . . . . . . . . . . . . . . . . . . . . . . . . . . . . . . 33
4.5 Graphics view (Graphics option) . . . . . . . . . . . . . . . . . . . . . . . . . . . . . 37
4.6 Stream view . . . . . . . . . . . . . . . . . . . . . . . . . . . . . . . . . . . . . . . . 39
4.6.1 Stream names, class and interface . . . . . . . . . . . . . . . . . . . . . . . 40
4.6.2 Stream view — Selected . . . . . . . . . . . . . . . . . . . . . . . . . . . . . 41
4.6.3 Selected Stream Compare MediaWindow . . . . . . . . . . . . . . . . . . . . 45
VBC Controller User’s Manual v5.4
c
BRIDGE Technologies Co AS 3

4.6.4 Selected Stream Compare ETR . . . . . . . . . . . . . . . . . . . . . . . . . 46
4.6.5 Selected Stream Compare Streamdata . . . . . . . . . . . . . . . . . . . . . 47
4.7 Thumbs view . . . . . . . . . . . . . . . . . . . . . . . . . . . . . . . . . . . . . . . 49
4.8 Service view (Transport Stream Service View option) . . . . . . . . . . . . . . . . . . 50
4.8.1 Service view — Thumbs . . . . . . . . . . . . . . . . . . . . . . . . . . . . . 51
4.8.2 Service view — Selected . . . . . . . . . . . . . . . . . . . . . . . . . . . . . 52
4.8.3 Selected TS Service Compare ETR . . . . . . . . . . . . . . . . . . . . . . . 53
4.9 Map . . . . . . . . . . . . . . . . . . . . . . . . . . . . . . . . . . . . . . . . . . . . 54
4.10 RDP . . . . . . . . . . . . . . . . . . . . . . . . . . . . . . . . . . . . . . . . . . . . 55
4.11 RDW . . . . . . . . . . . . . . . . . . . . . . . . . . . . . . . . . . . . . . . . . . . . 57
4.11.1 RDW — Canvases . . . . . . . . . . . . . . . . . . . . . . . . . . . . . . . . 57
4.11.2 RDW — Devices . . . . . . . . . . . . . . . . . . . . . . . . . . . . . . . . . 58
4.11.3 Canvas Configurator . . . . . . . . . . . . . . . . . . . . . . . . . . . . . . . 59
4.11.4 Web Widget . . . . . . . . . . . . . . . . . . . . . . . . . . . . . . . . . . . . 61
4.11.5 Textbox Widget . . . . . . . . . . . . . . . . . . . . . . . . . . . . . . . . . . 61
4.11.6 Thumbnail Widget . . . . . . . . . . . . . . . . . . . . . . . . . . . . . . . . 61
4.11.7 Loudness Widget . . . . . . . . . . . . . . . . . . . . . . . . . . . . . . . . . 62
4.11.8 Media Window Widget . . . . . . . . . . . . . . . . . . . . . . . . . . . . . . 62
4.11.9 Alarms Widget . . . . . . . . . . . . . . . . . . . . . . . . . . . . . . . . . . 62
4.11.10RF Graph Widget . . . . . . . . . . . . . . . . . . . . . . . . . . . . . . . . . 62
4.11.11Clock Widget . . . . . . . . . . . . . . . . . . . . . . . . . . . . . . . . . . . 63
4.12 Equipment . . . . . . . . . . . . . . . . . . . . . . . . . . . . . . . . . . . . . . . . . 64
4.12.1 Equipment — Device configuration management . . . . . . . . . . . . . . . . 67
4.12.2 Equipment — Manual configuration files . . . . . . . . . . . . . . . . . . . . 69
4.12.3 Equipment — Device software . . . . . . . . . . . . . . . . . . . . . . . . . . 70
4.12.4 Equipment — Manage files . . . . . . . . . . . . . . . . . . . . . . . . . . . 72
4.13 Alarm setup . . . . . . . . . . . . . . . . . . . . . . . . . . . . . . . . . . . . . . . . 73
4.13.1 Alarm setup — Message Fwd . . . . . . . . . . . . . . . . . . . . . . . . . . 74
4.13.2 Alarm setup — Scheduling . . . . . . . . . . . . . . . . . . . . . . . . . . . . 78
4.14 Timeline (requires Archive Server) . . . . . . . . . . . . . . . . . . . . . . . . . . . . 82
4.14.1 Choosing what to inspect . . . . . . . . . . . . . . . . . . . . . . . . . . . . 82
4.14.2 Navigating in time . . . . . . . . . . . . . . . . . . . . . . . . . . . . . . . . 82
4.15 Reports . . . . . . . . . . . . . . . . . . . . . . . . . . . . . . . . . . . . . . . . . . 84
4.15.1 Reports — Manual Report . . . . . . . . . . . . . . . . . . . . . . . . . . . . 85
4.15.2 Reports — Report list . . . . . . . . . . . . . . . . . . . . . . . . . . . . . . 86
4.15.3 Reports — Auto reports . . . . . . . . . . . . . . . . . . . . . . . . . . . . . 87
4.15.4 Reports — Import logo . . . . . . . . . . . . . . . . . . . . . . . . . . . . . . 88
4.15.5 Reports — The PDF Report . . . . . . . . . . . . . . . . . . . . . . . . . . . 88
4.16 Ext. Reports . . . . . . . . . . . . . . . . . . . . . . . . . . . . . . . . . . . . . . . . 93
4.16.1 Ext. Reports — Manual extended report . . . . . . . . . . . . . . . . . . . . 94
4.16.2 Ext. Reports — Extended report list . . . . . . . . . . . . . . . . . . . . . . . 96
4.16.3 Ext. Reports — Auto extended reports . . . . . . . . . . . . . . . . . . . . . 96
4.16.4 Ext. Reports — PDF Report . . . . . . . . . . . . . . . . . . . . . . . . . . . 98
4.16.5 Ext. Reports — Alarm poll and report status . . . . . . . . . . . . . . . . . . 100
4.16.6 Ext. Reports — Setup storage . . . . . . . . . . . . . . . . . . . . . . . . . . 101
4.17 Main — Sites and Users . . . . . . . . . . . . . . . . . . . . . . . . . . . . . . . . . 102
4.17.1 Sites and Users — Sites . . . . . . . . . . . . . . . . . . . . . . . . . . . . . 102
4.17.2 Sites and Users — Users . . . . . . . . . . . . . . . . . . . . . . . . . . . . 103
4.17.3 Sites and Users — User groups . . . . . . . . . . . . . . . . . . . . . . . . . 104
4 VBC Controller User’s Manual v5.4
c
BRIDGE Technologies Co AS

4.18 Main — Logs . . . . . . . . . . . . . . . . . . . . . . . . . . . . . . . . . . . . . . . 106
4.18.1 Logs — Logs . . . . . . . . . . . . . . . . . . . . . . . . . . . . . . . . . . . 106
4.18.2 Logs — Settings . . . . . . . . . . . . . . . . . . . . . . . . . . . . . . . . . 107
4.19 Main — Snapshots . . . . . . . . . . . . . . . . . . . . . . . . . . . . . . . . . . . . 108
4.20 Main — Alarm statistics . . . . . . . . . . . . . . . . . . . . . . . . . . . . . . . . . . 109
4.21 Main — Stream groups . . . . . . . . . . . . . . . . . . . . . . . . . . . . . . . . . . 110
4.22 Main — Service groups . . . . . . . . . . . . . . . . . . . . . . . . . . . . . . . . . . 111
4.23 Main — Archive Setup . . . . . . . . . . . . . . . . . . . . . . . . . . . . . . . . . . 112
4.23.1 Archive server . . . . . . . . . . . . . . . . . . . . . . . . . . . . . . . . . . 112
4.23.2 Enabling the Archive server . . . . . . . . . . . . . . . . . . . . . . . . . . . 112
4.23.3 Configuration . . . . . . . . . . . . . . . . . . . . . . . . . . . . . . . . . . . 112
4.23.4 System requirements . . . . . . . . . . . . . . . . . . . . . . . . . . . . . . . 113
4.23.5 Alarms . . . . . . . . . . . . . . . . . . . . . . . . . . . . . . . . . . . . . . 113
4.24 Main — Gfx. View Setup . . . . . . . . . . . . . . . . . . . . . . . . . . . . . . . . . 114
4.24.1 Configure diagrams . . . . . . . . . . . . . . . . . . . . . . . . . . . . . . . . 114
4.24.2 Setup and data mapping . . . . . . . . . . . . . . . . . . . . . . . . . . . . . 115
4.25 Main — General . . . . . . . . . . . . . . . . . . . . . . . . . . . . . . . . . . . . . 118
4.26 Main — About . . . . . . . . . . . . . . . . . . . . . . . . . . . . . . . . . . . . . . . 120
4.26.1 About — Release info . . . . . . . . . . . . . . . . . . . . . . . . . . . . . . 120
4.26.2 About — License . . . . . . . . . . . . . . . . . . . . . . . . . . . . . . . . . 121
4.26.3 About — Technologies . . . . . . . . . . . . . . . . . . . . . . . . . . . . . . 121
4.26.4 About — Credits . . . . . . . . . . . . . . . . . . . . . . . . . . . . . . . . . 122
4.26.5 About — System . . . . . . . . . . . . . . . . . . . . . . . . . . . . . . . . . 122
4.26.6 About — Data . . . . . . . . . . . . . . . . . . . . . . . . . . . . . . . . . . . 124
A Appendix: Separate Probe and Network Interfaces 125
B Appendix: The VBC Files 126
C Appendix: VBC Linux Processes 128
D Appendix: Example Site Configuration 129
E Appendix: Getting the Thresholds Right 131
F Appendix: Probe Versus VBC Alarms 134
G Appendix: Troubleshooting 136
H Appendix: Backing up the VBC 137
I Appendix: Software Maintenance 139
J Appendix: Network configuration 140
K Appendix: Enable NTP time synchronization 144
VBC Controller User’s Manual v5.4
c
BRIDGE Technologies Co AS 5

1 INTRODUCTION
The VBC Controller is a server-side software application that offers central management of Bridge
Technologies devices. Operating devices through the VBC is considerably more convenient and
powerful than operating each device independently.
When managing a large digital television system there is a need to easily monitor the overall system
status. Deploying a number of probes and a VBC enables the user to view the system status
at-a-glance, and if a problem arises the VBC’s drill-down functionality makes it easy to locate the
problem source.
Through the VBC the user can perform tasks such as building a hierarchical equipment view,
view aggregate alarm and status messages, get aggregate status per TV stream and compare
measurements across devices.
The VBC supports alarm export for integration into an NMS system.
The VBC server runs in a Linux environment. The VBC client is simply a web browser pointed towards
the VBC server.
1.1 Sites and Blades
The VBC Controller supports a hierarchical equipment view. At the top of the chain are sites. A site
is a number of devices that logically or physically belong together. These devices are also called a
blades. Each device has an IP address and its own web interface that can be reached directly or via
the VBC.
For systems deploying microVB units a Micro Device Controller (MDC) can be added to the VBC as a
device. MDC will then report monitoring statistics to the VBC on behalf of all the microVBs.
1.2 Users and Access
The VBC Controller supports a role based user interface where a user is given full or limited access
to a selection of the devices. Setup of system wide configurations, such as user setup, is performed
by the pre-configured user admin.
The admin user is hard-coded inside the VBC and is the only user defined when the VBC is installed.
The admin user is the only user that has access to the system-wide setup menus. Put another way,
the admin can do everything a regular user can do and more.
Beware!
to log in as admin to perform regular tasks.
6 VBC Controller User’s Manual v5.4
You can easily do a lot of damage by accident as the admin user, so it is not recommended
c
BRIDGE Technologies Co AS

When logging in, the user name for the admin user is always
admin
and the password is
elvis
by
default. Please change the password for this user after installing the system.
There is no limit to the number of active users or to the number of active users of the same account.
Each client will work independently of the others, only affected by changes to global settings usually
done by the admin user.
The VBC uses a standard web mechanism called cookies to identify users. A cookie is a piece
of data that the VBC returns to the browser when the user logs in. The browser will automatically
provide this cookie in all subsequent requests towards VBC. The cookie allows the VBC to remember
the state for all users who are logged in – so that it knows which sites the user has access to etc.
Generally all windows or tabs from the same browser application will appear to the VBC as the same
user – since they will all forward the same cookie.
The admin grants each user access to one or more sites. When logging in, the client’s access will
be limited to the sites associated with the login name. The client will only have access to devices
belonging to these sites.
Each user belongs to one user group. The access rights for the users is controlled in the user groups.
Here the user can be limited to read only access, allowed the TS service view, doing RDP etc.
The user interface provided by the VBC is dynamic in the sense that almost all pages are generated
differently for each user. The
Stream view
will, for instance, only list streams that are monitored by
probes that are included at the sites that the user has access to.
1.3 How to Use This Manual
This User’s Manual is valid for software version 5.4 of the VBC Controller.
Throughout this manual the term stream is often used rather than unicast or multicast. One stream
may consist of one or more services, and refers to one IP uni- or multicast (for Ethernet input) or one
transport stream (ASI, COFDM, QAM/VSB or QPSK/DVB-S2).
Chapter 2 INSTALLATION AND INITIAL SETUP explains how to install the software on a server.
Chapter 3 REMOTE DATA WALL describes the Remote Data Wall.
Chapter 4 THE VBC GRAPHICAL USER INTERFACE describes the graphical user interface (GUI)
as seen when pointing a web browser to the VBC Controller’s IP address.
A Appendix: Separate Probe and Network Interfaces describes how to set up the VBC as a bridge
between the probe and management networks.
B Appendix: The VBC Files summarizes the files that are installed and created by the VBC.
C Appendix: VBC Linux Processes lists the Linux processes used by the VBC.
D Appendix: Example Site Configuration contains an example on how to configure VBC sites.
E Appendix: Getting the Thresholds Right explains how to set up VBC thresholds.
F Appendix: Probe Versus VBC Alarms describes the alarm handling in the probes versus the VBC
Controller.
G Appendix: Troubleshooting lists some hints troubleshooting VBC Controller issues.
VBC Controller User’s Manual v5.4
c
BRIDGE Technologies Co AS 7

H Appendix: Backing up the VBC describes how to create a backup of the VBC and how to restore it
later.
I Appendix: Software Maintenance briefly describes software maintenance licenses and how they are
used.
J Appendix: Network configuration gives a brief introduction to the server OS network configuration.
K Appendix: Enable NTP time synchronization provides some basic information about setting up time
synchronization.
Note that current version of the User’s Manual can be found on the
website. Log in as end user:
customer
with password:
xmas4u
. Additional technical documentation
is also found at the same location.
http://www.bridgetech.tv/
8 VBC Controller User’s Manual v5.4
c
BRIDGE Technologies Co AS

2 INSTALLATION AND INITIAL SETUP
2.1 System Requirements
For VBC demonstration purposes the minimum hardware requirements are:
• Quad-core or multiple dual-core 1.6 GHz CPU
• 4 Gbyte RAM minimum (remember to fill up all memory channels)
• 20 Gbyte writable disk space
•
10/100/1000T Ethernet Network Interface card(s) with support for CentOS Linux 7 or Red Hat
Enterprise Linux 7
The recommended VBC server specifications for a medium sized system (20 blades or 8000
streams) are:
• Intel Quad-core 2.4 GHz CPU
• 16 Gbyte 1600 MHz DDR RAM (remember to fill up all memory channels)
• 250 Gbyte writable disk space
•
10/100/1000T Ethernet Network Interface card(s) with support for CentOS Linux 7 or Red Hat
Enterprise Linux 7
The recommended VBC server specifications for a large system (60 blades or 24000 streams)
are:
• Intel Xeon 1630 v4 (4 cores, 8 threads, 3.7 GHz) CPU
• 24 Gbyte 1600 MHz DDR 4 RAM (remember to fill up all memory channels)
• 500 Gbyte writable disk space
•
10/100/1000T Ethernet Network Interface card(s) with support for CentOS Linux 7 or Red Hat
Enterprise Linux 7
The recommended VBC server specifications for a very large system (100+ blades) are:
• Intel Xeon 1630 v4 (4 cores, 8 threads, 3.7 GHz)
• 24 Gbyte 2400 MHz DDR 4 RAM (remember to fill up all memory channels)
• 2×500 Gbyte SAS, 15000 RPM in a Hardware RAID 1 configuration
For even better performance SSD disks can be used instead, in a similar RAID 1 configuration
•
10/100/1000T Ethernet Network Interface card(s) with support for CentOS Linux 7 or Red Hat
Enterprise Linux 7
VBC Controller User’s Manual v5.4
c
BRIDGE Technologies Co AS 9

It is important that the number of RAM modules matches the number of memory channels
supported by CPU. For dual socket systems the number of required RAM modules doubles.
Example recommended CPU: Intel Xeon E5-2667 v41:
For this system there are 4 memory channels. So for single socket systems 4×16Gbyte RAM
modules could be fitted, and for a dual socket system 8×16Gbyte RAM modules could be used.
The load on the VBC server will increase for increasing number of concurrent users and with more
sites and blades, and the VBC’s responsiveness is dependent on server specifications. It may
therefore be a good investment to use high performance server hardware in order to handle future
system extensions.
Supported platforms:
• CentOS Linux release 7 (7.0–7.4) for x86_64
• Red Hat Enterprise Linux Server release 7 (7.0–7.4) for x86_64
2.2 First-time Installation
Make sure that the server hardware matches the requirements listed above. Download the appropriate
installation image from the end-user area on
http://www.bridgetech.tv/
and then follow the
procedure outlined below.
1. Obtain the latest installation kickstart image.
2. Insert the installation medium into the server:
•
For CD/DVD-based installations, burn the downloaded ISO image to a CD/DVD and insert
into the server.
•
For USB-based installation, transfer the downloaded image to a USB mass storage device
using a tool such as dd (Mac, Unix, Linux) or USBWriter2(Windows).
•
For installation in a virtualized environment, attach the downloaded ISO image to a virtual
DVD-ROM unit.
Note:
Please read the advice on how to configure the virtual machine in section 2.3 to
ensure optimal performance.
3.
Boot the server and make sure that the primary boot device is set appropriately. If the system
fails to boot from the medium, you may need to configure the boot loader for ‘legacy BIOS
mode’.
4.
The installer will run, please follow the on-screen prompts to install the system, taking note of
the following:
• IMPORTANT: Leave ‘Software selection’ at ‘Custom software selected’.
1
https://ark.intel.com/products/92979/Intel-Xeon-Processor-E5- 2667-v4-25M-Cache-3_20-GHz
2
http://sourceforge.net/projects/usbwriter/
10 VBC Controller User’s Manual v5.4
c
BRIDGE Technologies Co AS

• IMPORTANT:
/home
partition, which is unused. To avoid this, use the ‘I will configure partitioning’ option.
In the ‘Installation Destination’, the default partitioning will create a large
Then use the ‘Click here to create them automatically’ and manually reduce the size of (or
remove) the /home partition, instead giving that space to the / partition.
•
We recommend that you configure network settings (IP address, gateway, DNS) within
the installer. Post-installation network configuration can be performed using the
nmtui
utility, please refer to J Appendix: Network configuration for details.
•
The default installation does not provide any graphical user interface environment. This
can be installed later if desired, please refer to the CentOS Linux3or Red Hat Enterprise
Linux4documentation for more details.
5.
At the end of the installation procedure, the server is rebooted. Remove the installation media
and ensure that the system boots up properly.
6.
Enter the selected IP address in your web browser to access the Software Activation page. If
your host is using dynamic addressing, you can log in to the account created during installation
and issue the command ip addr to display the address assigned to the system.
Continue to chapter 2.4 for details on how to enable the VBC Controller system.
The kickstart will install CentOS Linux 7 or Red Hat Enterprise Linux 7 on the server. The disks
will be formatted and all contents lost. Make sure that any important data on the server has
been backed up before beginning the procedure.
Note that new installations of VBC must use the kickstart install procedure.
2.3 Deploying in a Virtualized Environment
It is also possible to deploy the software in a virtualized environment. For optimal performance, check
the processor configuration of
setting of cores per virtual sockets on the virtual machine.
Please follow the steps from chapter 2.2 when installing the software in the virtualized environment.
We recommended
disabling
operating system type when initially creating the new virtual machine instance in your virtualization
environment. These options may override the installation instructions included in the provided
installation image, causing an incomplete installation.
Pre-built images for VMware (vSphere/Workstation/Player) are provided in
Format Archive) format. These images contains a system already installed according to the steps
described in the previous chapter, with VMware Tools already installed and activated.
To deploy the image, you need to import it to the virtualization host, please refer to the documentation
of your virtualization environment for more details on how to do this.
3
http://wiki.centos.org/Manuals/ReleaseNotes/CentOS7
4
https://access.redhat.com/documentation/en-US/Red_Hat_Enterprise_Linux/7/index.html
cores per socket
on your host server and use the same configuration
any ‘Easy install’ or similarly worded option, and not selecting the
OVA
(Open Virtualization
VBC Controller User’s Manual v5.4
c
BRIDGE Technologies Co AS 11

Figure 2.1: Software Activation
If installed in a VMware vSphere environment, the machine should report back its network configuration to the host environment. Please allow some time for it to do so, and then continue with the
Software Activation procedure as described in the next chapter.
When logging in to the console of the pre-built images, the default password for the
The same password is also used for logging in remotely using Secure Shell (ssh).
the password for the root user after finishing the install
, log in and use the
root
user is
Please change
passwd
command to
elvis
do this.
2.4 Verifying Correct Initial Setup and Software Activation
Once the software has been installed and restarted all further configuration takes place through the
web interface.
1. Launch a web browser application on the management system.
12 VBC Controller User’s Manual v5.4
c
BRIDGE Technologies Co AS
.

Any web browser with support for JavaScript can be used to access the Software Activation
interface, one of the following are recommended:
• Google Chrome
• Mozilla Firefox
• Microsoft Edge
• Microsoft Internet Explorer 11 or higher
• Apple Safari
2. Type the IP address of the server in the browser URL field and press Enter .
The network settings should have been set when the operating system was installed. If the web
browser is unable to reach the web server, check the server’s network settings in the operating
system.
3.
The Software Activation view should be displayed inside the browser. Software Activation is
password-protected, the user name is admin and the default password is elvis.
This password should be changed under the More options heading5.
The page displayed should look similar to figure 2.1.
4.
If you already have an XML file with license keys for your system, click on the
heading and upload this file under the
Import license keys
option. If you have the license key
More options
written down or in an e-mail, instead use the product page described below.
5.
If this is a new server, and you need to obtain license keys for the purchased products, please
click the link labeled
export hardware keys as XML
and send the downloaded file to your
sales representative as an e-mail attachment.
6.
The VBC Controller is not enabled by default on the newly installed server. To enable it, use the
link labeled
Not activated
next to its name. This will take you to a page giving you the details
of the installed software, such as the installed version and the hardware key. If you have a
license key that you want to enable and have not yet done so, enter the key in the field labeled
Apply license key and click the Add license button.
7.
Click the button labeled
Activate software
and wait for it to finish. If successful, the VBC
Controller should now be activated, and you will be presented with a link to the user interface.
The next time you access the server using a web browser, you should be taken automatically
to the enabled software.
Please note that it may take some additional time before the user interface of the activated
product becomes available. If you receive an error trying to access it, please wait for a few
minutes before trying again.
To return to the Software Activation view to make changes, open the
About — License
tab in the
VBC Controller user interface and click the link labeled Manage installed software.
It is
strongly recommended
that the system time is configured to be synchronized against an
external NTP server. Please refer to K Appendix: Enable NTP time synchronization for more
information on configuring time synchronization.
5
If you forget the Software Activation password, you can reset it by logging in as root and issuing the command
/opt/btech/ssg/bin/reset_web_password
VBC Controller User’s Manual v5.4
c
BRIDGE Technologies Co AS 13
2.5 Initial Setup Troubleshooting
If you are having trouble bringing up the Software Activation interface, or the VBC Controller web
based management interface, verify the following:
•
Verify that the client machine and the VBC Controller are configured on the same subnet and
that they have different addresses, or, if you use different subnets, verify that the routing and
gateways are set correctly on both the client machine and the VBC Controller.
• Make sure that the IP address of the gateway and the network interface are not the same.
• Verify that the appropriate Ethernet link indicators of the PC and the VBC Controller are lit.
• Verify that web browser proxy settings are not interfering.
• Verify that local firewall settings on the PC are not interfering.
• Try rebooting the server and make sure all services start as expected.
• Clear the browser’s cache.
• Verify that the web server is running, by entering the command
systemctl status httpd
on the server’s command line. If it is not running properly, try issuing the command
echo "ServerName localhost" >> /etc/httpd/conf/httpd.conf
and then restart the server by issuing the command
systemctl restart httpd
•
If you can reach Software Activation but the VBC Controller GUI is not working, enter the
command
If services are not running, try re-installing the VBC.
Please refer to J Appendix: Network configuration for more information on server network configuration.
vbchello
on the server’s command line to verify that the VBC services are running.
2.6 Upgrading From a Previous Version
We strongly recommend backing up the VBC files before upgrading to a new version of the VBC
Controller, or when upgrading to a new release of the OS. The backup procedure is described
in H Appendix: Backing up the VBC of this manual.
14 VBC Controller User’s Manual v5.4
c
BRIDGE Technologies Co AS

To upgrade to this release of the VBC Controller, your system must meet the system requirements
described in chapter 2.1. If your system does not meet these requirements, the installation procedure
will stop with an error message.
VBC Controller version 5.4 will be able to upgrade VBC version 5.2 or later only. Only systems
running CentOS Linux or Red Hat Enterprise Linux 7.x can be upgraded. For systems running
older versions of VBC or older versions of the operating system you must first backup the system by
following the procedure described in H Appendix: Backing up the VBC. Install the new system using
the instructions for new installations as described in chapter 2.2 and then restore the backup on the
new system. This is described in section 2.6.3 Using a full reinstall.
VBC Controller version 5.3 was the last version with support for CentOS Linux or Red Hat
Enterprise Linux release 6.x, 5.4 only supports release 7. The current version of the operating
system can be found on the About — Release info tab in the user interface.
2.6.1 Using an Installation Script
Download the appropriate installation image from the end-user area on
tv/
and copy the installation script to the system. Log in as root and run the installation script by
http://www.bridgetech.
issuing the command
sh filename.run
(where filename.run is the name of the installation script). You will be presented with a menu with
options toInstall the software orDisplay the README file. Press the appropriate key and press
Enter to begin.
This will upgrade the required files in
/opt/btech/vbc
, and restart the VBC server processes if the
software was already activated.
If error messages appear while running the installer script, please check out the README file from
the installer for additional information (available from the installer menu).
If the installation fails, try re-installing the system as described above.
2.6.2 Using Software Activation
It is also possible to upload the VBC using the Software Activation interface. Access Software
Activation and expand the
software image file to be uploaded and click the
When the software has been transferred to the VBC, the
update.
More options
heading. Under the heading
Update
button. The image will have a
Update software
Update software
.tea
button to initiate the
, select the
extension.
If the VBC software was already activated, you will be transferred to a progress bar displaying the
update status.
If the software was not activated, the upgrade will run in the background and you will be forwarded to
the product page inside the Software Activation interface. Depending on how long the update takes,
you may need to reload the product page again to verify that the software has been updated.
VBC Controller User’s Manual v5.4
c
BRIDGE Technologies Co AS 15

If the software upgrade fails, you can find a log describing the upgrade procedure by logging in to the
VBC server and opening the file /opt/btech/vbc/log/upgrade.log
2.6.3 Using a full reinstall
Sometimes it is necessary to upgrade the system by doing a full reinstall. This must be done when:
• Upgrading from VBC before version 5.2
•
Upgrading from a system running CentOS Linux or Red Hat Enterprise Linux release 6.x or
older
• Moving the VBC to a new server
The procedure for upgrading by doing a full reinstall is as follows:
•
First back up the old machine by using the procedure described in H Appendix: Backing up the
VBC. Make sure to use the backup script from the new SW version when doing the backup and
store the backup in a safe location.
• Install the new system using the instructions for new installations as described in chapter 2.2.
• Restore the backup on the new system as described in H Appendix: Backing up the VBC.
Please note that the hardware key will change when the VBC is reinstalled on a new machine. Please
see section 2.9 License Details on how to obtain the current hardware key and contact your sales
representative to obtain a new license key.
2.7 Accessing the User Interface
Once the software has been installed and activated all further configuration takes place through the
web interface.
The following web browsers are supported for the management interface:
• Google Chrome
• Mozilla Firefox
• Microsoft Edge
• Microsoft Internet Explorer 11 or higher
• Apple Safari
The login view should be displayed inside the browser. This should look similar to figure 2.2. If you
have problems accessing the user interface, refer to chapter 2.5 for troubleshooting.
16 VBC Controller User’s Manual v5.4
c
BRIDGE Technologies Co AS

Figure 2.2: The VBC Controller Graphical User Interface
2.8 Firewall Configuration
If you have firewalls active, the following ports need to be enabled:
VBC Controller User’s Manual v5.4
c
BRIDGE Technologies Co AS 17

Web
(TCP port 80 and 8080)
Protocols and ports
Required. For serving clients. Port 8080 is only used if MDC is
part of the VBC configuration.
Web tunneling to probes
(TCP port 80 and 8080)
Probe polling
(XML over TCP port 80)
On-line license proxy
(TCP port 8443)
SNMP traps and consultation
(UDP ports 161 and 162)
NTP
(TCP port 123)
Device auto-detection
(UDP port 2011)
ftp
(TCP port 21)
Secure Shell and telnet
(TCP ports 22 and 23)
Required. The VBC will intercept and forward Web requests
from clients towards probes on port 80. Port 8080 is only used if
MDC is part of the VBC configuration.
Required. Every 60 seconds, the VBC server requests measurements from the probes. Also used to verify if probes are
alive.
Required unless the probes can access the licensing service
directly. When the probes are on a restricted network, they will
use the proxy serving on this port to connect to the licensing
service. The port needs only to be open towards the probe
network.
To be able to receive SNMP traps or consult the VBC MIB.
Used for time synchronization if the probes have been configured
with the VBC IP address.
It is strongly recommended that the server running the VBC
software, and the equipment controlled by it, be synchronized
against an external NTP server. Refer to K Appendix: Enable
NTP time synchronization for more details.
Used by the VBC to auto-detect devices.
Required if probes are to be software upgraded from the VBC
server.
Useful to perform health checks etc. towards probes.
For more details on how to configure the network, please refer to A Appendix: Separate Probe and
Network Interfaces.
2.9 License Details
After the unlicensed VBC Controller software is installed, it will run in a trial mode for 30 days with
unrestricted access to features. After this period, if a license key has not been obtained, the VBC will
revert to being an element manager with no access to licensed features and with no alarm features.
To obtain a license the
Technologies reseller, who will return a
The Hardware Key can also be seen in the Software Activation interface.
18 VBC Controller User’s Manual v5.4
Hardware key
displayed in the
About — License
Product License Key
c
BRIDGE Technologies Co AS
view is given to your Bridge
which is submitted from the same view.

3 REMOTE DATA WALL
This chapter gives a quick introduction on how to use the Remote Data Wall feature of the VBC
Controller.
3.1 Introduction to the Remote Data Wall
Remote Data Wall (RDW) gives the opportunity to quickly and easily create a visual representation of
network activity using a web browser window. Depending on the size or complexity of the network
being monitored, RDW can spread from a single screen to multiple screens in a videowall format –
but requires no specialist skills to install.
The Remote Data Wall can be configured to display mosaics from the selected streams, as well as
alarm lists and other important information from within the system. A configured mosaic is called a
canvas and is configured in the RDW – Canvases view.
3.2 Accessing the Remote Data Wall
The Remote Data Walls can be reached by entering
All connected browser windows are displayed as devices in the
<IP address>/rdw/
RDW — Devices
in a browser’s URL field.
view. By default,
VBC Controller User’s Manual v5.4
c
BRIDGE Technologies Co AS 19

the canvas named
Default
is used for new devices. It is possible to select which RDW canvas is to be
displayed on a specific device in this view. Each canvas can be displayed on any number of devices.
The RDW can also be reached through the Devices list clicking the link at the bottom of the screen,
as shown in the picture below.
Go to chapter 4.11 for details on how to configure the Remote Data Wall.
20 VBC Controller User’s Manual v5.4
c
BRIDGE Technologies Co AS

4 THE VBC GRAPHICAL USER INTERFACE
The VBC web interface is reached by pointing a web browser to the IP address of the VBC Controller
as shown in the screen shot above. The following web browsers are recommended:
• Google Chrome
• Mozilla Firefox
• Microsoft Edge
• Microsoft Internet Explorer 11 or higher
• Apple Safari
Note that different web browsers behave differently with respect to memory leaking, and if the VBC
GUI should be available at all times the browser should be selected carefully. A browser memory leak
VBC Controller User’s Manual v5.4
c
BRIDGE Technologies Co AS 21

manifests itself as the browser responding more and more slowly, and this is corrected by closing
down the application and restarting.
The interface is easy and intuitive to use. The tree menu is always located on the left hand side. The
menu contains more entries for the admin than the menu for regular users. Some menu items are
nested, in particular the site and blade sub-menu entries are provided to allow quick access to the
last visited site and blade.
The web interface has been designed to be resizable in both vertical and horizontal directions
with a minimum screen resolution of 1280×800 pixels. For operational use it is however highly
recommended that a higher screen resolution is used. The
view
pages will automatically adapt to the current area of the browser window after it has been
Stream view,Thumbs view
and
Service
resized and the screen is refreshed.
Tool-tips are available for most buttons and labels. To access tool-tip information simply navigate the
mouse pointer towards a button or a label and leave it hovering for a second or two.
4.1 Login
Users are required to log in to get access to the VBC Controller. Only the admin user can add new
users – this is explained in the chapter 1.2 of this manual.
22 VBC Controller User’s Manual v5.4
c
BRIDGE Technologies Co AS

After a user has logged in, the menu-tree changes to reflect the new options.
A status-line lists all the sites that the user can access and states his access-rights (full or read-only).
A login history for the user is also provided.
Users will stay logged in until they actively log out or their session times out (by navigating the browser
away from the VBC application).
VBC Controller User’s Manual v5.4
c
BRIDGE Technologies Co AS 23

4.2 Live
The alarm list in the
Live
identical to the list in the
are not aggregated.
view displays all currently un-aggregated active VBC alarms. The list is
Monitoring
view, except that cleared alarms are not included and alarms
24 VBC Controller User’s Manual v5.4
c
BRIDGE Technologies Co AS

4.3 Monitoring
The VBC provides monitoring at three different levels. Top-level monitoring allows the user to get an
overview picture of the complete system; site monitoring provides details about one selected site and
blade monitoring allows the user to monitor a specific device.
4.3.1 Monitoring — Top Level
The top level
Monitoring
page displays status for each site and a top level alarm list. The color of
the bulb indicates the severity of the most severe active alarm for a device that belongs to the site.
The layout of this page can be changed in the user setting described in the
Sites and Users —
Users menu.
The following color codes are used for bulbs:
Color codes in bulbs
Green No active alarms (or only alarms set to severity OK)
Yellow The most serious active alarm is a warning
Orange The most serious active alarm is an error
Red The most serious active alarm is a major error
(typically No Signal)
Black At least one device has a fatal error
(typically cannot be reached)
The same color codes are used for alarms.
The severity of different alarms can be customized globally by the admin user, in the
Alarm setup
menu.
The user can select which alarms to show and hide in the
VBC Controller User’s Manual v5.4
c
BRIDGE Technologies Co AS 25
Filter alarms
menu. The setting is reset to

the default when the user logs in the next time. Clicking
Clear alarms
will wipe all the cleared alarms
from the alarm list. The alarm list is reset the next time the user logs in.
To avoid reporting too many alarms, the alarm list in the
within a site. This is called
alarm aggregation
and is not performed for any other alarm list except
Monitoring
page merges similar alarms
the SNMP alarm list. Alarm aggregation is not performed across sites. Hence similar alarms in
different sites are never merged.
The following table shows examples of alarm aggregation:
Raw alarm Aggregated alarm
SiteA:BladeX No signal BBC
SiteA:2 TIMES No signal BBC
SiteA:BladeY No signal BBC
SiteB:BladeX No signal BBC
SiteB:3 TIMES No signal STREAMS:2
SiteB:BladeY No signal NRK
SiteB:BladeZ No signal BBC
The N TIMES aggregation indicates that N alarm messages were merged. The STREAMS:M
aggregation indicates that in total M different stream names were reported in the raw messages.
In the VBC, all probe alarms are based on error-seconds measurements reported by probes, compared against error thresholds defined for the same probe. Extractor alarms reflect the current device
status.
In order to view probe alarms that may possibly correspond to a VBC alarm, click the blue information
i
icon
associated with the VBC alarm. A pop-up view shows individual
Blade alarms
that match
the VBC alarm in time and type of alarm. Note that the time on the probes and the VBC should be
synchronized in order for this functionality to work correctly, refer to K Appendix: Enable NTP time
synchronization for more details. Also note that alarms must be enabled probe GUI, otherwise they
will not be displayed in the pop-up view. Please refer to the probe manual for more information. As
there is not a one-to-one relationship between probe and VBC alarms, there will often be a number
of probe alarms that can cause a VBC alarm to be raised. This means that the list of probe alarms
can have many entries compared to the VBC alarm text.
The table below lists all VBC alarm messages; note that this is the behavior when using default
thresholds (refer to E Appendix: Getting the Thresholds Right for a description on how to calibrate
thresholds):
26 VBC Controller User’s Manual v5.4
c
BRIDGE Technologies Co AS

Message Description
No contact
No signal
RTP drops
MLR error
IAT error
Bitrate overflow
Bitrate underflow
ETR pri one error
ETR pri two error
ETR pri tree error
ETR other error
ETR interface error
OTT transport error
OTT http error
OTT xml error
This alarm is raised if the VBC is unable to obtain status from a particular
probe. The probes are polled every 60 seconds, so if raised, this alarm
will stay active until poll contact is achieved.
This alarm indicates that during the last 60 seconds poll interval the
probe experienced at least 3 seconds of no signal.
This alarm indicates that during the last hour the number of error-seconds
experienced by probe exceeded the threshold (default 5 seconds).
These alarms indicate that during the last hour the number of errorseconds experienced by the probe exceeded the threshold (default 20
seconds).
These alarms indicate that during the last hour the number of ETR errorseconds experienced by the probe exceeded the threshold (default 250
seconds).
These alarms indicate that during the last hour the number of OTT errorseconds experienced by the probe exceeded the threshold (default 60
seconds).
Expected scrambling
Expected clear
Freeze-frame
Audio level
OTT alignment
Caption availability
Caption quality
Archive error
These alarms indicate that during the last poll period a VB288 Objective
QoE Content Extractor has detected that either the signal is scrambled
while expecting clear (Expected clear alarm) or vice versa (Expected
scrambling alarm). The VB288 allows the configuration of these alarms
per stream.
This alarm indicates that during the last poll period a VB288 Objective QoE Content Extractor detected a freeze-frame or a color-freeze
condition for a stream that has freeze frame detection enabled.
According to threshold settings on the VB288 a stream was either too
silent or too loud for too long.
Reported by the VB288 if the profiles for an OTT service are not aligned
wrt to the sequence number, suggesting that the picture is not synchronized between the profiles.
This alarm indicates that during the last poll period a VB288 has detected
that a service with closed caption monitoring had less caption services
than specified in its threshold.
This alarm indicates that during the last poll period a VB288 has detected
a quality issue with one or more of the caption services extracted from a
service with closed caption monitoring.
This alarm indicates the Archive server has active errors such as low
disk space or too many configured streams.
VBC Controller User’s Manual v5.4
c
BRIDGE Technologies Co AS 27

Archive warning
This alarm indicates the Archive server has active warnings such as disk
space less than 50%.
Please note that the alarm window can be changed from the default 1 hour as assumed in the
above explanations. For shorter alarm windows the number of error seconds required are scaled
accordingly.
Clicking one of the site-names will open the site status page.
The user may select what fields should be present in the alarm list by clicking the
Fields. ..
button.
Removing some fields may be convenient when using a screen with low resolution.
The user may select to remove some alarm types from the alarm list by clicking the
Filter alarms. ..
button. This affects the graphical user interface for the current user only. By re-enabling alarms that
have been previously filtered these alarm instances will re-appear in the alarm log.
28 VBC Controller User’s Manual v5.4
c
BRIDGE Technologies Co AS

The user may clear out the alarm list by clicking the
Clear alarms
button. This hides the cleared
alarms from the alarm list for the current user for this session, if the user logs out and in again the full
alarm list will be displayed.
The
Page
buttons allow the user to view the navigate the alarm list and go back and forth in the list of
alarms.
VBC Controller User’s Manual v5.4
c
BRIDGE Technologies Co AS 29

4.3.2 XML Alarms
The un-aggregated top level alarms are available as XML via a static URL. The URL is obtained by
replacing the /vbc part of the regular VBC URL with /vbc/static/alarms exp.xml – see example below.
In this example the two screenshots show the same alarms.
The XML alarm list provides integrators with an additional way of automating alarms export from the
VBC – now integrators can choose between SNMP and XML alarm integrations.
The release attribute in the XML document is updated every time the VBC refreshes the alarm list
and the crc attribute will only change when the alarm list changes.
Refer to
Alarm setup
for a description on how alarms are also available via the MIB and SNMP traps.
Please refer to the document Eii External Integration Interface for detailed information about Eii.
4.3.3 Monitoring — Site
The
Site
monitoring page provides information about the selected site. Each device is presented in a
list with indication about the device type and IP address. The status of each blade is indicated by the
color of a status bulb. For all non-green blade bulbs there should be corresponding entries in the
alarm list.
The alarm list will only show alarms for the selected site.
30 VBC Controller User’s Manual v5.4
c
BRIDGE Technologies Co AS

Clicking one of the device name links opens up the
device graphical user interface is accessed.
Blade
monitoring page through which the regular
VBC Controller User’s Manual v5.4
c
BRIDGE Technologies Co AS 31

4.3.4 Monitoring — Blade
The
Blade
device’s own web interface pages, similar to those that can be reached by accessing the device
directly. The bottom part of the page contains the VBC alarm list for the selected blade.
If the blade cannot be reached from the VBC server, the top half of the page will be empty and the
page will take approximately 10 seconds to load. In this situation the blade’s bulb status icon is
usually black in the
is used.
monitoring page provides information about one blade. The top part of the page is the
Site
monitoring page, provided that the default ‘No contact’ alarm severity Fatal
When accessing a probe through the VBC, the probe’s built-in access control feature is disabled and
the VBC decides if the user is going to have full access or simply read-only access.
Clicking one of the alarm entries will automatically select the corresponding page in the device.
If a Micro Device Controller (MDC) is part of the VBC configuration, the regular MDC user interface is
accessed in a similar way as other blades, by clicking the site device link associated with the blade.
32 VBC Controller User’s Manual v5.4
c
BRIDGE Technologies Co AS

4.4 Blade alarms
The
Blade alarms
view displays a list of active and cleared alarms present in devices’ individual
alarm lists. These alarms are not affected by VBC threshold settings, i.e. they reflect the current
device alarm status, only limited by the one minute alarm poll rate. Note that only alarms that are
enabled in devices will be present in the Blade alarms view.
Blade Alarms
i
Click the blue information icon to view a detailed alarm description
Sev A bulb indicating the alarm severity
Status The alarm status: Active, Cleared or Event
Time
The time the alarm was raised by the device. For cleared alarms the time span of
the alarm is shown, i.e. the time the alarm was raised and the time it was cleared.
Site The site(s) where this the device that raised the alarm is located
Blade
The name(s) of the device that raised the alarm. Can be multiple names if the same
device is added to multiple sites
Interface The interface receiving the stream causing the alarm
Stream The name of the stream having the alarm
VBC alarm The VBC alarm name
Description The device alarm description
VBC Controller User’s Manual v5.4
c
BRIDGE Technologies Co AS 33

By default all blade alarms from sites the user has access to are displayed in the Blade Alarms list.
However a number of filtering options makes it easy to search the list for specific alarms:
Blade Alarms Filtering
Site
Blade
Show only active alarms
VBC alarm:
Stream name
Service name
PID
Select a site from the drop-down menu to view alarms originating
from the selected site only.
Select a device from the drop-down menu to view alarms originating
from the selected device only. Please note that you need to select
the site before selecting the blade.
Check this box to view active alarms only. Events and cleared alarms
are not displayed.
Select a VBC alarm name from the drop-down menu to view that
alarm type only.
Type a text string + <Enter> to only view alarm list entries matching
the specified stream name. The search is case insensitive and
matching starts from the beginning of the string.
Type a text string + <Enter> to only view alarm list entries matching
the specified service names. The search is case insensitive and
matching starts from the beginning of the string. Only applicable for
streams that carry service names. It is common not to transmit this
information Single Program Transport Streams (SPTS) which often
used in IPTV systems. Service names are transmitted in tables in the
transport streams such as Service Description Table (SDT) for DVB
systems or Virtual Channel Tables (VCT) for ATSC systems.
Type a PID number + <Enter> to view alarm list entries with matching
PID number only. Note that this is only relevant for ETR alarms that
are associated with a specific PID.
Start time
Type a date and time (format example: Jun 21 14:31:17) + <Enter>
to specify a time window defined by the
Start time
and
End time
. All
alarms that were active during this time window will be displayed.
Define a
Start time
only to view all blade alarms raised after the
specified time plus alarms that were active at the specified time.
End time
Type a date and time (format example: Jun 21 14:31:17) + <Enter>
to specify a time window defined by the
Start time
and
End time
. All
alarms that were active during this time window will be displayed.
Define an
End time
only to view all blade alarms that were active
before the specified time.
Click on a element in the blade alarm list to seem more detailed information about that specific alarm.
34 VBC Controller User’s Manual v5.4
c
BRIDGE Technologies Co AS

Blade Alarm Details
Status The alarm status: Active, Cleared or Event
Severity The alarm severity as configured in the Alarm setup page on the device
Alarm Type The type of alarm such as ETH, ETR, OTT or SYS
VBC alarm name
The name corresponding to this alarm in the VBC. As an example, the ETR
alarm Continuity counter error corresponds to the VBC alarm ETR pri one
error
Blade IP The IP address of the device which have reported this alarm
Site(s)
The sites where this device have been registered. Normally a device is
registered to one site but in some situations it can also be useful to add it
to multiple sites
Blade name(s)
The name the device have been assigned in the Equipment view. If the
same device is registered to multiple sites then all the different names the
device have been assigned is shown here
Interface The interface receiving the stream causing the alarm
Stream The name of the stream having the alarm
Service name
The name of the service affected by the alarm. Only applicable for ETR
alarms and only when the stream contain service name information
PID
The Packet ID of the PID affected by the alarm. Only applicable for ETR
alarms
Raise time The time the alarm was raised by the device
Raise description The description of the alarm when it was raised
Raise sequence no
The sequence number of the alarm message as sent by the device when it
was raised
Raise trap
The trap alarm text sent by the device when raising the alarm. The format
of this text field is described in the document SNMP trap format
Clear time The time the alarm was cleared by the device
VBC Controller User’s Manual v5.4
c
BRIDGE Technologies Co AS 35

Clear description
The description of the alarm when it was cleared. For some alarms this may
be different from the raise description (updating the number of detected
MLR errors etc.)
Clear sequence no
Clear trap
The sequence number of the alarm message as sent by the device to clear
the alarm
The trap alarm text sent by the device when clearing the alarm. The format
of this text field is described in the document SNMP trap format
36 VBC Controller User’s Manual v5.4
c
BRIDGE Technologies Co AS

4.5 Graphics view (Graphics option)
Figure: Simulation of a network monitored by Bridge Technologies equipment.
Graphics view will display diagrams, where the diagram objects are used to show the current alarm
status of the VBC elements: Site, Blade, Stream or Stream group.
The operator designs diagrams and generate the diagram files in the Scalable Vector Graphics (.svg)
format, which is an open standard and is supported by all modern browsers. Graphics View currently
support importing of .svg files generated by Microsoft Visio
R
and InkScape.
When generating diagram files the objects can be hyperlinked to a VBC blade view, VBC selected
stream view, or to other uploaded diagram files. To navigate to these diagram click the relevant areas
of the diagram. This allows for instance to have a system overview diagram where you can see the
different sites and then click in to see details for the headend or the different regional sites, overview
of the channel status, list of transponders on the satellite etc.
In the example diagram above the box background colors are displaying the aggregated status of the
stream group, the stream arrow colors are showing status of the individual streams, and the probes
are showing the corresponding status color of the probe (Blade) in the VBC.
Use the following buttons to navigate the diagrams:
Click to view the diagram full screen, filling the entire browser window.
You can additionally use the browser menus to make the graphics view fill the entire
computer screen.
Click to return to the normal VBC GUI when in full screen mode
VBC Controller User’s Manual v5.4
c
BRIDGE Technologies Co AS 37

Click to go to the starting diagram (configured in the
Main — Gfx. View Setup
This is useful when you have multiple diagrams with hyperlinks for navigation.
Please refer to chapter 4.24 for details on how to configure the Graphics view.
page).
38 VBC Controller User’s Manual v5.4
c
BRIDGE Technologies Co AS

4.6 Stream view
In the
Stream view
shows the current status, and the 96-pixel MicroTimeline stream-bar shows the status for the last 96
hours (i.e. 4 days).
streams are by default presented in alphabetical order. For each stream the bulb
Each bulb-color corresponds to the aggregate status for all probes that belong to sites that the user
has access to. The bulbs are updated every 60 seconds – which corresponds to the probe poll
interval.
The stream bars reveal any VBC alarm that has been present during the last 4 days. The bars will
automatically scroll one pixel to the left each hour with the rightmost pixels showing the status for the
current hour. The bar color corresponds to the severity of alarms that have occurred. During periods
when VBC alarms are masked due to VBC schedule settings, the bar color is blue. Note that this
applies to VBC scheduling only, and not to probe or extractor scheduling. If scheduling applies part
time of a one hour MicroTimeline period, it will be colored blue if there have been no alarms during
the non-scheduled part of the period. Otherwise it will be colored according to alarm severity. Alarm
severity is configured in the Alarm setup page.
The user selects whether all streams or only one stream group should be represented in the view.
The selectable stream groups are available in the Stream-group drop-down menu. The stream groups
are configured in the Main — Stream groups page.
The Sort drop-down menu allows stream sorting based on name, interface or current stream status
severity.
The Filter field allows the user to specify a text string; only streams and sites with names matching
the specified string will be displayed. If an extractor is part of the system, the VBC will also check
against multicast addresses. This functionality is very useful to quickly locate a specific stream in a
large system.
The number of streams presented on a page is only limited by the size of the display screen.
Refreshing the screen after resizing the browser window will automatically fill up all of the available
screen area. If there are more streams in the selected stream group than can be displayed in a single
view the remaining streams may be monitored by clicking the numbered links at the bottom of the
page.
VBC Controller User’s Manual v5.4
c
BRIDGE Technologies Co AS 39

Clicking a stream name brings up the Selected stream view.
4.6.1 Stream names, class and interface
The stream name specified for Ethernet streams, OTT service and RF tuning setups are presented
in the Stream View in VBC. Since by definition all stream names need to be unique on a single
device we have added an optional class part to the stream name. This allows the same stream to
be monitored several times on the same device and still have all instances reported separately to
the VBC. For example, by naming three streams “BBC”, “BBC@main” and “BBC@backup”, all three
streams will be treated as if the name was BBC alone. The class part is displayed in the
view — Selected list.
In addition to the class, the interface on which the stream was received is listed here. Streams
received over RF or ASI are listed under their interface name. Multicasts are listed as IPTV when
received on probes and as E-IPTV when received on extractors. OTT streams are listed as OTT
when received on probes, or on extractors where OTT Active Testing has been enabled for the stream,
and as E-OTT for the extractor QoE measurements.
Stream
40 VBC Controller User’s Manual v5.4
c
BRIDGE Technologies Co AS

4.6.2 Stream view — Selected
The
Selected stream
view lists measurements for all probes that are monitoring the selected stream.
For each blade monitoring the stream, a 96-pixel MicroTimeline bar is displayed, showing the status
for the last 96 hours (i.e. 4 days) for the stream on that blade, along with the selected error-second
values, as described below. If one or more VB288 Objective QoE Content Extractors are part of the
VBC configuration and is monitoring the stream, a thumbnail picture and associated meta-data are
displayed at the top of the page.
By selecting between two and ten probes (clicking the check box at the beginning of each line)
and then clicking
displayed in the
Compare Media Windows for selected probes
Selected stream compare MediaWindow
view. Note that this is only relevant for
the graphs for the probes are
streams present on probe IPTV interfaces.
By selecting between one and five probes (clicking the check box at the beginning of each line) and
then clicking
the
Selected stream compare Streamdata
Compare Streamdata for selected probes
view. This comparision can be done for IPTV, OTT and
, the graphs for the probes are displayed in
RF streams. The data shown depends on the stream type.
By selecting between one and five probes (clicking the check box at the beginning of each line) and
VBC Controller User’s Manual v5.4
c
BRIDGE Technologies Co AS 41

then clicking Compare ETR measurements for selected probes selected ETR measurements for
the probes are displayed in the
for streams that are ETR analyzed. ETR analyzed streams will have an additional link
Selected stream compare ETR
view. Note that this is only relevant
ETR
in the
rightmost column that when clicked will open up the probe’s ETR page for the selected stream.
It is possible to jump between the streams by clicking the
Prev
and
Next
links at the top of the page.
The bulb displayed for each probe shows the probe’s status for the selected stream.
Thumbnail meta-data
Parameter Description
Bitrate: The total stream rate
Video: The video bitrate and whether the component is scrambled or not
Audio: The audio bitrate and whether the component is scrambled or not
Teletext: The teletext bitrate and whether the component is scrambled or not
Encoding: The video encoding format
Size: The video picture size (video resolution)
Aspect: The video aspect ratio
Service name: The name of the service in the stream
Address: The multicast IP address of the stream
Extractor:
The IP address of the extractor delivering thumbnail and metadata; can be
clicked
Each minute the VBC polls probes for information which is displayed in four categories selectable in
the drop-down list in the top right hand corner.
IPTV(Error-second)
Selecting
IPTV(Error-second)
displays all IPTV error second parameters measured by the probe
during the selected period1(last 4 days, 24 hours or 60 minutes). VBC alarms are based on the error
second parameters, and the severity of the corresponding alarm is indicated by the colored bulb by
the parameter name.
Parameter Description
ES(nosig) Number of seconds with no signal
ES(RTP)
Number of seconds with RTP packet drops. This will always be zero if the stream is
not encapsulated in RTP headers.
ES(MLR)
Number of seconds with packet drops in the TS layer (seconds when media loss
rate is non-zero). This is equal to the number of error seconds with CC errors.
ES(IAT) Number of seconds when the delay factor exceeds the threshold.
ES(overfl) Number of seconds when the bitrate exceeds the error-threshold.
ES(underfl) Number of seconds when the bitrate falls below the error-threshold.
1
Note that the MicroTimeline bar is not scaled, it always represents 96 hours.
42 VBC Controller User’s Manual v5.4
c
BRIDGE Technologies Co AS

IPTV(Statistical)
Selecting
IPTV(Statistical)
shows all aggregate IPTV measurements that are not error-seconds
measured by the probe during the selected period (last 4 days, 24 hours or 60 minutes).
Parameter Description
sum(OK-polls) Number of times that the probe has been successfully polled.
sum(Failed-polls)
Number of times that VBC has failed to poll the probe. Each time VBC fails
to poll a probe the No contact alarm is raised for one minute.
sum(MLR)
Number of TS packets lost in the MPEG2 transport stream. This is not the
same as the number of CC errors (which would be the number of detected
packet losses and not the packet count).
sum(RTPdrop) Number of RTP packets dropped.
IPTV(Last minute)
Selecting IPTV(Last minute) shows parameters that are updated for each poll (i.e. each minute).
Parameter Description
Signal
For how long the probe has been receiving a signal for this stream. This is the
same as the time since the last no-signal error second.
cur(Max-IAT)
The peak delay factor during the last minute. This is the same as the peak IAT
during the last minute and is a measure of how much jitter is present in the signal.
cur(Max-bitr) Peak bitrate during the last minute.
cur(Min-bitr) Lowest bitrate during the last minute.
ETR
Selecting
ETR
displays all ETR derived error second (DES, see description in next section) parameters measured by the probe during the selected period (last 4 days, 24 hours or 60 minutes). VBC
alarms are based on the error second parameters, and the severity of the corresponding alarm is
indicated by the colored bulb by the parameter name.
Parameter Description
DES(etrPri1) Number of seconds with ETSI TR 101 290 priority 1 errors
DES(etrPri2) Number of seconds with ETSI TR 101 290 priority 2 errors
DES(etrPri3) Number of seconds with ETSI TR 101 290 priority 3 errors
DES(etrOther) Number of seconds with ETR 290 other errors
DES(etrIface) Number of seconds with ETR 290 interface errors
Measured %
Displays for how long the stream has been ETR 290 measured by the probe,
shown as a percentage of the selected measurement period
VBC Controller User’s Manual v5.4
c
BRIDGE Technologies Co AS 43

ES versus DES
For IPTV (Ethernet) streams that are continuously monitored the parameters are specified as
ES(param) meaning the parameter reflects error-seconds directly. The ETR parameters are generally
monitored round-robin, so to convert these measurements to error seconds per hour (or other time
periods) they have to be extrapolated. For example, clicking the “60 minutes” for the ETR parameters
will extrapolate all ETR measurements during the last 60 minutes so that they are comparable. As
an example, if a stream is ETR monitored for only 3 minutes during the last 60 minutes, the number
of error seconds measured during this 3 minutes period is multiplied by 20 and the Measured %
parameter will show 5 (since 5 % of 60 minutes equals 3 minutes).
OTT
For OTT streams, selecting OTT in the drop-down menu gives the following parameters:
Parameter Description
ES(Transport) Number of seconds with OTT transport errors.
ES(Http) Number of seconds with OTT HTTP errors.
ES(Xml) Number of seconds with OTT XML errors.
The OTT error second counters listed above have corresponding VBC alarms.
Probes and Extractors with the OTT Active Testing license detect a large number of OTT errors and
maps each into one of these general categories. This mapping can be seen by navigating to a probe’s
OTT menu and clicking the Alarms tab in the pop-up window.
44 VBC Controller User’s Manual v5.4
c
BRIDGE Technologies Co AS

4.6.3 Selected Stream Compare MediaWindow
Up to 10 probes can be compared in the
Selected stream compare MediaWindow
view. The high
resolution version is used when only two probes are selected.
From the MediaWindow graph it is possible to compare packet jitter and CC errors in the streams.
By comparing graphs it is possible to locate where packet jitter is introduced and where packet loss
occurs. Refer to the probe manuals for more information about MediaWindow measurements.
The range of the graph can be set to a maximum of 4 days. For smaller ranges the scroll buttons
may be used. It is also possible to view the bitrate graph by clicking the
BW:MLR
button. When the
IAT:RTP button is clicked the graphs show packet jitter versus RTP packet loss.
It is the probes that draw the MediaWindow graphs inside frames created by the VBC. If the probes
are not time synchronized (using NTP or TDT/TOT) the graphs may appear unaligned and the time
labels may be wrong. Refer to K Appendix: Enable NTP time synchronization for more details.
VBC Controller User’s Manual v5.4
c
BRIDGE Technologies Co AS 45

4.6.4 Selected Stream Compare ETR
Up to five streams may be compared across different probes and interfaces in the
Selected stream
compare ETR view.
Refer to the probe manual for a comprehensive description of the compare sub-views.
46 VBC Controller User’s Manual v5.4
c
BRIDGE Technologies Co AS
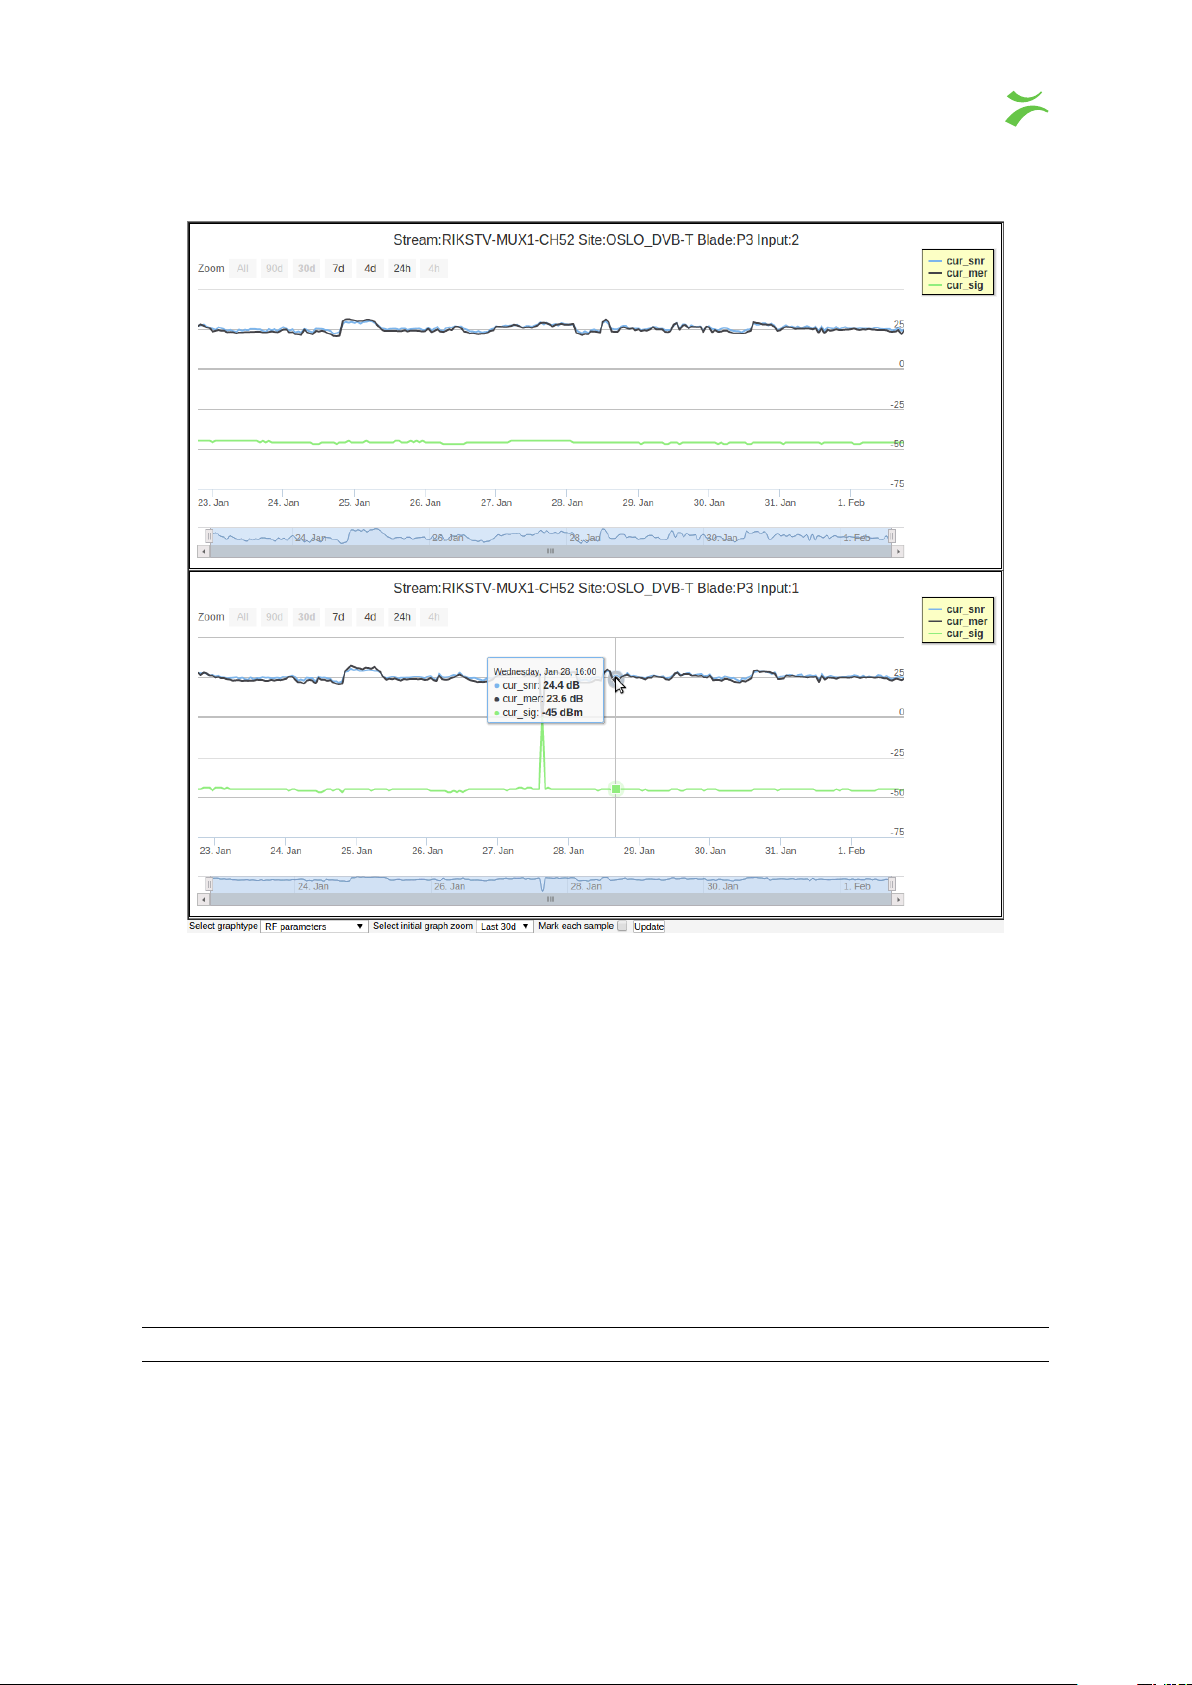
4.6.5 Selected Stream Compare Streamdata
This view is available for all Ethernet IPTV streams, OTT and RF streams. The data source is the
stream-data in the database. The history available depends on the settings found under the
tuning
link on the
About — System
page. The maximum history is two years. Note that the time
Disk
needed to generate this page depends primarily on the speed on the VBC server, the history window
of the database and the number of streams selected.
For 4h and 24h intervals data is plotted with minute resolution, for larger intervals 1 hour spacing is
used.
Clicking the legends will toggle the visibility of each graph.
The user can customize the graphs by making selections in the menu-bar below the graphs and
clicking Update.
The data that can be plotted depends on the type of the stream monitored. The available settings are:
Graph type Available parameters
VBC Controller User’s Manual v5.4
c
BRIDGE Technologies Co AS 47

Error seconds KPI (IPTV streams) Select among
• Error seconds no signal
• Error seconds media loss rate
• Error seconds inter arrival time
Error seconds bitrate (IPTV streams) Select among
• Error seconds bitrate overflow
• Error seconds bitrate underflow
Bitrates and DF (IPTV streams) Select among
• Max delay factor
• Maximum bitrate
• Minimum bitrate
Sum packet loss (IPTV streams) Select among
• Sum of media loss rate
• Sum of RTP drops
RF parameters (for RF interfaces) Select among
• Signal level
• Signal to noise ratio
• Modulation error ratio
Error seconds KPI (OTT streams) Select among
• Error seconds quality
• Error seconds availability
• Error seconds transport
• Error seconds http
• Error seconds xml
Select initial graph zoom: This specifies the initial zoom for all the graphs after the Update has been
clicked. Each graph can be adjusted individually afterwards.
Mark each sample: Emphasize each database sample so that it is easy to spot holes in the database
when the stream was not monitored.
48 VBC Controller User’s Manual v5.4
c
BRIDGE Technologies Co AS

4.7 Thumbs view
If one or more VB288 Objective QoE Content Extractors are configured as part of the VBC’s setup,
the Thumbs view will present a thumbnail picture for each stream which is extracted.
The current stream status is indicated by the thumbnail picture’s frame color. The MicroTimeline
stream bar presenting stream status for the last 4 days is the same as in the Stream view page.
The line just below the stream name indicates whether it is an IPTV stream or a OTT stream. A
stream will occur as many times as it is extracted on VB288s. A stream will occur regardless of
whether it is monitored by probes.
The number of streams presented on a page is only limited by the size of the display screen.
Refreshing the screen after resizing the browser window will automatically fill up all of the available
screen area.
Clicking a stream name brings up the Stream view – Selected view.
The selectable stream groups are available in the Stream-group drop-down menu. The user selects
whether all streams or only one stream group should be represented in the view. The stream groups
are configured in the Main — Stream groups page.
The Sort drop-down menu allows stream sorting based on name, interface or current stream status
severity.
The Filter field allows the user to specify a text string; only streams where the stream name, multicast
address or sites name matching the specified string will be displayed. This functionality is very useful
to quickly locate a specific stream in a large system.
VBC Controller User’s Manual v5.4
c
BRIDGE Technologies Co AS 49

4.8 Service view (Transport Stream Service View option)
In the optional
Service view
transport stream services are presented in alphabetical order as default.
For each service the bulb shows the current status and the 96-pixel MicroTimeline stream-bar shows
the status for the last 96 hours (i.e. 4 days). For services to be shown in the
Service view
the
corresponding stream must be ETR 290 monitored in one or more probes and must have a service
name signaled in the transport stream (in Service Description Table (SDT) for DVB systems or Virtual
Channel Tables (VCT) for ATSC streams).
Note that the MicroTimeline is updated per stream and not per service. Thus all services that are
part of the same stream will have the same MicroTimeline. The
Extended reports
functionality
can generate service based PDF reports where the status is filtered per service (and optionally
aggregated over different sites).
Each bulb color corresponds to the aggregate status for all probes that belong to sites that the user
has access to. The bulbs are updated every 60 seconds – which corresponds to the probe poll
interval.
The service bars reveal any alarm that has been present during the last 4 days. The bars will
automatically scroll one pixel to the left each hour with the rightmost pixels showing the status for the
previous full hour. The bar color corresponds to the severity of alarms that have occurred.
The number of services presented on a page is only limited by the size of the display screen.
Refreshing the screen after resizing the browser window will automatically fill up all of the available
screen area. If there are more services in a system than can be displayed in a single view the
remaining services may be monitored by clicking the numbered links at the bottom of the page.
The user chooses to display all services in the system or limit the display to one service group. The
selectable service groups are available in the Service group drop-down menu. The service groups
are configured in the Main — Service groups page.
The Sort drop-down menu allows service sorting based on name, interface or current stream status
severity.
50 VBC Controller User’s Manual v5.4
c
BRIDGE Technologies Co AS

The Filter field allows the user to specify a text string; only services with names matching the specified
string will be displayed. This functionality is very useful to quickly locate a specific stream in a large
system.
Clicking a service name brings up the
service.
4.8.1 Service view — Thumbs
Selected Service View
, allowing further inspection of a
The
Service view — Thumbs
view is identical to the regular
Thumbs
view, except that individual
thumbs will be displayed for each service within an MPTS (Multi Program Transport Stream).
VBC Controller User’s Manual v5.4
c
BRIDGE Technologies Co AS 51

4.8.2 Service view — Selected
The
Selected Service View
monitoring the selected service. If a probe monitors the same service for several inputs there will be
one entry in the list for each interface.
lists MicroTimeline bars for all probes and interfaces that are ETR 290
Selecting one to five locations and clicking the
Compare ETR measurements for selected services
will open the Selected TS Service Compare ETR view.
Parameter Description
# The probe number
SID
The service ID of the monitored service. This can differ between different sites
if the service ID is remapped in the system
Interface
The type of probe interface that carries the stream containing the monitored
service
Stream The name of the stream carrying the service, as defined in the probe
Stream last 96h
The MicroTimeline bar for the stream that contains the selected service for the
given probe and interface
Now
A bulb indicating the current status for the stream that contains the selected
service for the given probe and interface
Probe
A link to the
Blade
view for the probe that has performed the service measure-
ments
52 VBC Controller User’s Manual v5.4
c
BRIDGE Technologies Co AS

4.8.3 Selected TS Service Compare ETR
Up to five transport stream services may be compared across different probes and interfaces in the
Selected TS Service Compare ETR view.
Refer to the probe manual for a comprehensive description of the compare sub-views.
VBC Controller User’s Manual v5.4
c
BRIDGE Technologies Co AS 53

4.9 Map
The map feature displays a geographic overview of blades that have a geographic location configured.
Each blade is represented by a pin. The color of the pins shows the status of the devices.
Clicking a pin will display more information about that blade, such as name, site and IP and makes it
possible to access the blade details.
The geographical location of a blade is configured in the Equipment view.
Note that the Map feature requires an Internet connection to reach the map server.
54 VBC Controller User’s Manual v5.4
c
BRIDGE Technologies Co AS

4.10 RDP
The RDP view allows users to obtain control and overview of the RDP configuration and RDP status
of individual probes in a system. This makes it easy to avoid stream corruptions that might otherwise
occur due to several probes forwarding a stream to the same destination address.
The return data path list shows the RDP configuration of the probes in a system:
Return Data Path (RDP)
Parameter Description
[Start]
Click the
Start
button to start RDP forwarding for the corresponding
probe
[Stop]
Click the
Stop
button to stop RDP forwarding for the corresponding
probe
RDP
If RDP forwarding is active for a probe, the corresponding RDP field will
display a selection mark (v)
Site
The site associated with a probe. Click the site link to open the site view
Name The probe name. Click the probe name link to open the probe view
IP address The probe IP address
Engine
The probes have 2 independent RDP engines, this column shows the
engine number
Forw. interface
Shows which probe ethernet interface the RDP stream will be used to
forward the stream
Stream addr:port:SSM
The address of the stream to be forwarded. The format is IPaddress:port number:Source Specific Multicast
VBC Controller User’s Manual v5.4
c
BRIDGE Technologies Co AS 55

Dest addr:port
The destination address that the stream should be forwarded to. The
format is destination IP address:port number (interface gateway IP
address)
Active RDP
It is possible to define that only one RDP forwarding can be active at any time. Enabling RDP
forwarding for a probe will then stop RDP forwarding for all other probes, to avoid possible stream
interference due to several probes forwarding to the same address. Mark the checkbox and click the
Apply button to activate this functionality.
RDP probe settings – only Ethernet
It is possible to define and upload RDP settings to a probe. This is done by setting parameters,
selecting a probe by highlighting a row in the RDP probe list and clicking the
probes
button. It is also possible to select several rows to upload identical settings to several probes.
Apply to selected
The RDP probe settings are:
RDP probe settings – only Ethernet
Parameter Description
Stream to forward: address: The IP address of the multicast or unicast to be forwarded
Stream to forward: port: The port number of the multicast or unicast to be forwarded
Stream to forward: SSM: The source IP address for a Source Specific Multicast
Destination: address: The RDP destination IP address
Destination: port: The RDP destination port number
Relay settings: Interface:
From the drop-down menu select the interface the RDP
streaming should use: Data interface or Management in-
terface
It is also possible to copy probe settings to the RDP probe settings dialogue field by highlighting a
row in the RDP probe list and clicking the Update from selected probe button.
56 VBC Controller User’s Manual v5.4
c
BRIDGE Technologies Co AS

4.11 RDW
4.11.1 RDW — Canvases
The
RDW — Canvases
logged in as
admin
view creates, edits, or removes canvases for the current user, or all users if
. Please refer to chapter 3 for more information on the Remote Data Wall feature.
You can filter the list of canvases by searching for name or owner in the Filter box.
Canvases
Name: Name of this canvas. Clicking the name opens the canvas configurator.
Owner: Name of the user who owns this canvas.
To create a new canvas, click the New Canvas button and enter the name of the new canvas.
To change the name or owner of a canvas, first click the Edit button on the top right.
To remove a canvas, click the Remove button on the top right, then click the Remove button for the
canvas you want to remove.
VBC Controller User’s Manual v5.4
c
BRIDGE Technologies Co AS 57

4.11.2 RDW — Devices
The
RDW — Devices
lets the user change canvas, identify, or reload devices connected to its
canvases. Please refer to chapter 3.2 for more information on how to connect devices to the Remote
Data Wall.
There are four ways of filtering the know devices.
All Devices show all devices that are, or has been connected to the server at one point.
Recent show all devices that are connected, or was disconnected within the last day.
Connected show all devices that are connected now.
Inactive show all devices that has been disconnected for more than one day.
Devices
Name: Name of this device.
Canvas to show: Name of the canvas to show on this device
Commands: Identify
displays the device name on the device.
Reload
forces the
device to reload the canvas
58 VBC Controller User’s Manual v5.4
c
BRIDGE Technologies Co AS

Status:
Show the current status of the device, it can be Connected, Disconnected,
or Inactive
Status Last Updated: Last time the device was connected
Auto reload: Show if and when the device will automatically reload
To change the name or reload time of a device, first click the Edit button on the top right.
To remove old devices, click the
the device you want to remove.
4.11.3 Canvas Configurator
Remove
button on the top right, then click the
Remove
button for
The
Canvas Configurator
lets the user configure a canvas by setting the size and color of the
background, adding and placing widgets, and more.
It has three main areas; the toolbar at the top of the screen, the canvas and widget options on the
right of the screen, and the canvas itself, where the widgets are placed.
Toolbar
Function Button Key Description
Preview Eye F
Toggle preview mode, where you can see how the canvas
would behave on a client device
VBC Controller User’s Manual v5.4
c
BRIDGE Technologies Co AS 59

Select and Move Cursor V
Pan Hand Alt
Zoom Zoom Z
This tool can be used to select one or multiple widgets. Click
a widget to select it or drag a box to select multiple widgets.
Holding the shift button while clicking adds or removes the
clicked widget to the selection. To move the selected widgets,
drag them in place, or use the arrow keys. Selected widgets
can by copied with
ing the
Delete
Ctrl+C
and pasted with
Ctrl+V
. Press-
key will delete all selected widgets from the
canvas. Click the canvas background to deselect everything.
By either selecting this tool, or holding
Alt
, you can click and
drag to move the viewpoint
This tool allows you to zoom in where you click. Holding
Shift while clicking will zoom out instead.
Add Widget Plus W
This tool lets you add new widgets to the canvas. Either click
the widget you want, or type its name and press enter, then
drag out a box for the widget. This adds the widget to the
canvas, and to the current selection.
Text T T
With this tool selected, click a Textbox widget to be able
to edit it. With text selected, press
Ctrl+B
to make it
bold
,
Ctrl+I to make it italic or Ctrl+U to make it underlined.
When changing widget options, only select one widget at a time. To change the options of the canvas,
deselect all widgets.
Common options
Size and Position
W Sets the width of the widget or canvas
H Sets the height of the widget or canvas
X Sets the horizontal position within the canvas
Y Sets the vertical position within the canvas
Appearance
Fill Sets the background color
Border Sets the border color and width
Text Sets the text color
Canvas options
Grid
Snap To Grid Makes the widgets snap to the grid size set
Show Grid Makes the grid lines visible in the configurator
60 VBC Controller User’s Manual v5.4
c
BRIDGE Technologies Co AS

Widgets
This shows a list of all widgets. They can be selected here, and if some widgets
are overlapping you can change the order in this list to change which will be
rendered on top
Widget options
Plaque
Display Selects the position of the plaque. Off removes it
Text Sets the content of the plaque
Each widget has its own options which differ from widget to widget. To edit these, it is important to
only select one widget at a time.
4.11.4 Web Widget
The web widgets allows for embedding any web page or image on the RDW canvas.
Options
URL URL to the web page or image to load
Scale Sets the zoom level of this page or image
Refresh Sets if and how often the page or image is reloaded
Allow scripts Sets if the page is allowed to run JavaScript
Allow progressive loading Sets if the page is allowed to download additional data
4.11.5 Textbox Widget
The Textbox widget can be used to add static text to the RDW canvas.
Options
Size Sets the font size
Alignment Sets the text alignment; either Left, Center, or Right
4.11.6 Thumbnail Widget
The thumbnail widgets lets you display updating thumbnails from your multicasts and OTT channels.
Options
Channel Select a Multicast stream or OTT channel to display thumbnails from
Service If the selected stream is a MPTS, you can select a specific service
Profile
If you selected a OTT channel and multiple profiles are available, you can select one
VBC Controller User’s Manual v5.4
c
BRIDGE Technologies Co AS 61

Size
Sets the size of the image, can either be Contain keeps the aspect ratio of the source,
filling in black bars where needed, Cover resizes the image to make sure the image
is fully visible, or Original displays the image in its original size
Loudness Turns on the selected audio meter for the selected channel, if available
4.11.7 Loudness Widget
The loudness widget displays audio values from your multicasts and OTT channels. It can either be
a graph over the last couple of minutes, or a audio meter showing the current value. For a vertical
meter, drag the box out high and thin. For a horizontal meter, drag the box out low and wide. For a
graph, drag the box out high and wide.
Options
Channel Select a Multicast stream or OTT channel to display audio samples from
Service
If the selected stream is a MPTS or has multiple audio PIDs, you can select a specific
service
Profile
If you selected a OTT channel and multiple profiles are available, you can select one
Retention Sets how much data the graph should display
Scale Sets the where the graph or meter caps the values
Mode Sets if the meter should show RMS or LUFS values
4.11.8 Media Window Widget
The media window widget shows media window data from your multicast streams.
Options
Channel Select a Multicast stream to display media window data from
Plot Sets which of the three available plots to display
Retention Sets how much data the graph should display
4.11.9 Alarms Widget
The alarms widgets show the active VBC alarms, sorted by severity.
4.11.10 RF Graph Widget
The RF graph widgets can display RF data from your tuners.
Options
Channel Select a Tuning to display RF data from
Data to display Sets which data to display; Either CNR, MER, or Channel Power
62 VBC Controller User’s Manual v5.4
c
BRIDGE Technologies Co AS

Unit Sets which unit to convert the values to
Scale Sets the where the graph caps the values
Retention Sets how much data the graph should display
4.11.11 Clock Widget
The clock widgets shows the time in the configured timezone.
Options
Clock type Sets what kind of clock to display
Timezone Sets which timezone this clock should display
Minute offset Sets the offset in minutes from the selected timezone
VBC Controller User’s Manual v5.4
c
BRIDGE Technologies Co AS 63

4.12 Equipment
The
Equipment
provides a convenient way for the user to view each device’s configuration and software version.
For each device the following information is available:
page lists important properties for all the blades that the user has access to. It also
Standard
# The table list number
Enabled If this table entry is checked the device is enabled in the VBC
Site
The name of the site that a device is assigned to. Note that a single device
may be assigned to several sites
Name
The name of the device, as specified by the admin user when adding a
device to a site
Type Type of device (‘probe’, ‘extractor’, ‘generator’ or ‘MDC’)
Ver The hardware version for this device, where available.
IP address The device’s IP address
SW-version The software version of the device
Config
The device’s configuration can be viewed by clicking its View link. The
configuration XML file may be saved for back-up and copying purposes
RF cards
Slot 1 The RF card present in slot one, if available
Slot 2 The RF card present in slot two, if available
License
HW Key The hardware key needed to generate licenses
License text A textual representation of the devices’ current license options
Resource
Uptime Time since device started
NTP sync Whether the device is syncing against a time-server
Time Current device time
64 VBC Controller User’s Manual v5.4
c
BRIDGE Technologies Co AS

Temp Device’s temperature in Celsius
Disk free Current amount of disk free
Min df Minimum ever disk free (since power on)
Ram free Current amount of free memory
Min rf Minimum ever free memory (since power on)
SD free Available space on flash card (if equipped with one)
Other
Description Description/Name as specified on device.
Location Location as specified on devices
Serial Serial number of device
Maintenance ends Date the software maintenance ends
Maintenance left Remaining time for software maintenance
The admin user has more options in the
Equipment
page than regular users. In addition to viewing
configurations and software versions the admin can distribute configurations to several blades and
perform batch software upgrades of probes and extractors.
The simplest way of performing a software upgrade of probes and extractors is by importing a
software file (with .tea or .tea2 extension) via the
then selecting the corresponding file from the drop-down selection list in the
Import device software image
Upload software to
pop-up view and
devices pop-up view.
Do not power off probes that are being software uploaded. If a probe is powered off during software
upload it will need special service to recover. An alternative to importing a software file is to copy
the software file directly to the
This is typically achieved using the
/opt/btech/vbc/configs/vb2_software
scp
command in a terminal shell. The software file will then
folder on the VBC server.
become available for selection.
A number of check box filtering options allow the admin user to view only selected devices in
the equipment list, the alternatives are:
Show enabled,Show disabled,Show probes,Show
extractors and Show unassigned.
Note that auto-detected devices show up in the list as unassigned.
Click the
Add new device
button to manually add a device to the equipment list. This will open the
Edit device pop-up view.
VBC Controller User’s Manual v5.4
c
BRIDGE Technologies Co AS 65

Edit device
IP address The device IP address
Name Type a device name that will be used throughout the VBC user interface
HTTP port Define the HTTP port to be used for the web traffic
Site
From the drop-down menu define the site that the device should be associated with
Type From the drop-down menu define the type of device
URL
When a device of type Custom has been selected, it is possible to define a URL to
access this device’s GUI
Location
By entering the geographical location of the blade here, it will be visible in the
Map
view. The location is entered as decimal degrees latitude and longitude, commaseparated, with positive numbers indicating north and east, respectively.
Enabled
Check the box to disable the device. This means that the device will not be active
within the VBC GUI
When the new device has been defined, click the
Apply changes
button. Click the
Close
button to
close the pop-up view.
It may in some cases be useful to add one device to multiple sites. This can be done in by adding the
same device IP address multiple times.
Highlighting an existing device and clicking
menu described above. Make changes to the device as appropriate and click the
Edit selected devices
will open the Edit device pop-up
Apply changes
button.
Highlighting one or more existing devices and clicking the
Delete selected devices
button will delete
the device(s).
66 VBC Controller User’s Manual v5.4
c
BRIDGE Technologies Co AS

4.12.1 Equipment — Device configuration management
Copy settings between devices of same type
Clicking this link will open the
Copy settings between devices
pop-up view. The process of copying
settings between devices involves five steps:
1. Select source device
2. Select one or more destination devices
3. Click the Update list of available selections link
4. Select the groups of settings that should be copied
5. Perform the actual copying by clicking the Copy selected sections link
The VBC will determine which settings are compatible between devices and update the selection list
accordingly.
VBC Controller User’s Manual v5.4
c
BRIDGE Technologies Co AS 67

Copy stream list between any devices
Clicking this link will open the Copy stream lists pop-up view.
The stream (multicast) list is compatible between probes and extractors, and it is therefore possible to
freely copy this list between these types of devices. Select source device and one or more destination
devices and click the
Copy Ethernet streamlist to selected devices
link. Note that multicast join
information is not included in this copying process.
The status of the copying process can be viewed in the Status field. Clicking the
View
link will open a
pop-up view providing additional status information.
68 VBC Controller User’s Manual v5.4
c
BRIDGE Technologies Co AS

4.12.2 Equipment — Manual configuration files
Import configuration file
Clicking this link will open the
Import configuration file
pop-up view. The config file can either be
downloaded from another probe and uploaded without change or have been manually edited as
described on the next page. Select the configuration XML file to be imported and click the
Go!
button.
Upload imported configuration file to devices
Clicking this link will open the Upload imported configuration file to devices pop-up view.
Select the configuration file to be uploaded and select the destination devices. Click the
configuration file to selected devices
upload process can be viewed in the Status field. Clicking the
link to perform the configuration upload. The status of the
View
link will open a pop-up view
Upload
providing additional status information.
VBC Controller User’s Manual v5.4
c
BRIDGE Technologies Co AS 69

Manualy editing the configuration
It is possible to manually edit an XML configuration file. Use a valid configuration file (by clicking a
View
link of the
Equipment view
) and save it locally. Edit the file and make appropriate changes
before saving it. Any CRC attribute in line 2 of the config file must be removed (i.e. remove text
similar to
crc="b8a1fa3f"
). Import the file from the
Import configuration file
view. The file will
then become selectable in the Upload imported configuration file pop-up view.
Note:
Please make sure that the structure of the XML is not corrupted when manually editing the file.
Any syntax errors in the file will cause errors when the file is imported to the devices.
4.12.3 Equipment — Device software
Import device software image
Clicking this link will open the
software file and click the
Probe can all be imported using this dialog. Software files have .tea or .tea2 extensions.
Import device software image
Go!
button. Software images for VB1, VB2, VB3, VB288 and Software
pop-up view. Select the required
Upload software to devices
When the software file has been successfully imported, it will become available as a selection in the
drop-down selection menu in the Upload software to devices pop-up view.
70 VBC Controller User’s Manual v5.4
c
BRIDGE Technologies Co AS

Upload software to devices
Clicking this link will open the
previously imported from the
selection in the drop-down selection menu. Software image files located in the
Upload software to devices
pop-up view. Software image files
Import device software image file
pop-up view will be available for
/opt/btech/vbc/
configs/vb2_software folder will also be selectable.
The upgrade procedure will by default use HTTP to transfer the update image to the device; this
requires access control to be disabled during the upgrade process, which is configured in the
— Login
view in the probe or VB288. If the device type allows it, it is also possible to use HTTPS;
Setup
this requires that the device is using software version 5.3 or later. For hardware probes it is also
possible to use a procedure based on FTP and telnet; this requires the corresponding protocols to
be enabled in the
Setup — Security
view of the probe and to be allowed in the network (not being
blocked by firewalls etc.).
If changing the access control or security settings of the target device is not possible, you will need to
use the stand-alone software upgrade procedure as described in the User’s Manual of the specific
product.
Select a software image from the menu and select one or more destination devices. Click the Software
upgrade selected devices link to perform the upgrade. The status of the upgrade process can be
viewed in the Status field. Clicking the
View
link will open a pop-up view providing additional status
information.
VBC Controller User’s Manual v5.4
c
BRIDGE Technologies Co AS 71

Do not power off devices that are being software upgraded. If a device is powered off during
software upload it will need special service to recover.
Upgrading to a new major release requires a valid software maintenance license, please refer to
I Appendix: Software Maintenance for more details. If the current software maintenance license does
not cover the uploaded software version, the upgrade will be aborted and the current version is kept.
Click the Clear status link to clear the software upload status fields.
4.12.4 Equipment — Manage files
Manage uploaded software and config files
Clicking this link will open the
list and click the
Delete selected files
Manage files
. Deleted files will no longer be available in drop-down menus
pop-up view. Mark files that should be removed from
throughout the menu system.
72 VBC Controller User’s Manual v5.4
c
BRIDGE Technologies Co AS

4.13 Alarm setup
In the Alarm setup menu the admin can change the severity level for any alarm.
Changing the severity level for alarms will impact the color of bulbs, stream-bars and alarms. The
alarm lists present all active alarms sorted on severity, with black alarms top and green alarms bottom.
Setting severity level to
OK (green)
will make sure those alarms do not impact bulbs or stream bars
but they will still be present in the alarm lists.
The severity level is also used for the SNMP alarm list and traps.
The alarm setup menu also allows the admin user to configure the alarm window and alarm reset
time for each VBC alarm.
An overall system controller like the VBC Controller should not raise instantaneous alarms, as this
for a large system might lead to a multitude of alarms toggling on and off, leading to an untidy
user interface difficult to interpret. VBC alarms are therefore based on error second measurements
summed over an alarm window period (sliding window). When the number of error seconds counted
over the alarm window period exceeds the user defined threshold for that alarm type the VBC will
raise an alarm. The alarm window and alarm reset time for ‘No contact’, the VB288 Objective QoE
Content Extractor alarms and the Archive server alarms are fixed at 1 minute alarm windows. The
default alarm window period is 1 minute for ‘No signal’ and 60 minutes for remaining alarms.
The alarm reset period is the number of consecutive minutes, without any new error seconds, needed
to clear an active alarm.
Clicking the document links will open guides describing how to set thresholds for probes and the
VBC. It is highly recommended to read these in order to correctly configure the alarm thresholds and
alarm windows.
VBC Controller User’s Manual v5.4
c
BRIDGE Technologies Co AS 73

4.13.1 Alarm setup — Message Fwd
The VBC allows the admin to customize how alarms are to be generated and forwarded to 3rd party
systems, either by SNMP or by email.
Alarms to forward
Only those alarms that have
and thus forwarded as traps. When the
SNMP forwarding
Monitoring
checked will be part of the VBC’s SNMP alarm list
alarm list is updated, the SNMP alarm list is also
updated if:
1. The alarm type has been selected for SNMP forwarding
2.
The site that reports the alarm matches the selection in Site to use for SNMP alarms (selected
in the Alarm setup — Message fwd — SNMP Traps view)
When the SNMP settings have been changed, the admin may want to rebuild the SNMP alarm list
completely to get rid of alarms that are no longer relevant. This can be achieved by selecting Clear in
the Clear alarm lists frame in the Main — General view.
74 VBC Controller User’s Manual v5.4
c
BRIDGE Technologies Co AS

The VBC’s alarm MIB describes all the details of the trap and alarm lists formats. The MIB can be
obtained from your Bridge Technologies reseller. The SNMP alarm list is only available through the
SNMP MIB.
Alarms can also be forwarded by email to pre-defined email groups. Define email groups using the
Email Groups
tab, and select the groups that are to receive the alarm in the
Email group
column of
the specific alarm.
One email will be sent per the VBC alarm. Alarm aggregation is not performed for the email alarms.
It is possible to also include the blade alarms from the device causing the alarms in the email - this
will contain more specific information about the alarms than what the VBC alarms does.
SNMP Traps
Sometimes it is desirable to switch off alarm aggregation for the SNMP traps in order to get more
precise alarms. The drawback is that during alarm storms the VBC will end up sending hundred of
traps instead of just a dozen.
Consider the case where there is one site with one probe monitoring 100 streams and there is a
signal loss for all streams. If Enable trap aggregation is disabled there will be one trap per stream
of the format “Sitename:Bladename No signal streamname”. If Enable trap aggregation is enabled
there will only be only one alarm with format “Sitename:Bladename No signal Streams:100”. Thus
enabling trap aggregation reduces the number of traps from 100 to 1 in this case.
User properties
Site to use for SNMP alarms:
Select which sites should generate alarm traps. By default all
sites will be selected
Enable trap aggregation: Select if traps should be aggregated
Parameterize trap text:
When the
Parameterize trap text
check-box is ticked the VBC
SNMP traps will be parameterized. Refer to separate documentation on trap text format
Trap dest 1–4: The IP address of the trap destination
VBC Controller User’s Manual v5.4
c
BRIDGE Technologies Co AS 75

Email Groups
The
Email Groups
page lists the email recipients can be set up to receive SNMP alarms. The email
recipients are configured on this page and then selected on the Alarms tab.
A number of global parameters can be configured:
Mail queue parameters
Postpone mail send (sec)
Number of seconds to wait after alarm status has changed before
sending email. A value of 180 should ensure that relevant bladealarms are included (if they have been enabled for the email group).
Number of attempts
Number of attempts to try to send email before deleting it from the
queue.
Mail send interval (ms)
Minimum time between email-sending of alarms – to control network
load.
Mail max age (sec)
Delete emails if they have been in the send queue for longer than
this time.
Remember to click
Apply
after modifying the global email parameters for the new parameters to take
effect.
Click the
Add new
button to add a new email group to the list. This will open the
pop-up view.
Edit email group
76 VBC Controller User’s Manual v5.4
c
BRIDGE Technologies Co AS

Email group
Group name
This names the email group so that it can be selected in the recipient
dropdown.
Recipient list A comma-separated list of recipient email addresses.
Description A description of the group.
Message text A message to be included in every email.
Add blade alarms
If checked also relevant blade-alarms will be included in the email, otherwise
only VBC alarms are included.
When the new email group has been defined, click the
Apply changes
button. Click the
Close
to close the pop-up view.
Highlighting an existing email group and clicking
Edit selected
will open the Edit email group pop-up
menu described above. Make the appropriate changes and click the Apply changes button.
Highlighting one or more existing email groups and clicking the
Delete selected
button will delete
the email group(s).
The settings for the outgoing email server is configured in Main — General view.
Please note that the alarm emails may end up being caught by spam filters. Please make sure
that exception rules are added if needed so that these messages are not classified as spam. A
correct mail server setup is needed in order to send out the alarm emails.
button
VBC Controller User’s Manual v5.4
c
BRIDGE Technologies Co AS 77

4.13.2 Alarm setup — Scheduling
The VBC scheduling functionality allows alarm masking at stream level during selected time intervals.
Scheduling Setup
In this view the user can define time windows during which alarms for a selected stream will be
suppressed by the VBC. This enables alarm masking at times when it is known that a stream would
otherwise generate non-relevant alarms, e.g. at times when a stream is not transmitted. Clicking
the
Add new
button will open the
Edit alarm scheduling
pop-up view, allowing the user to define a
scheduling scheme and associate it with a stream. Existing scheduling schemes may be edited by
highlighting it and clicking the
Edit selected
button. A scheme may be deleted by highlighting it and
clicking the Delete selected button.
The search field in the upper right corner of the view enables filtering on a text string; only list entries
matching the specified text string will be visible.
Note that it is possible to associate more than one scheduling scheme for the same stream.
During times when a stream has alarm masking enabled, the stream’s MicroTimeline will be colored
blue. Note that this applies to VBC stream scheduling only, and not to scheduling performed at probe
or extractor level.
78 VBC Controller User’s Manual v5.4
c
BRIDGE Technologies Co AS
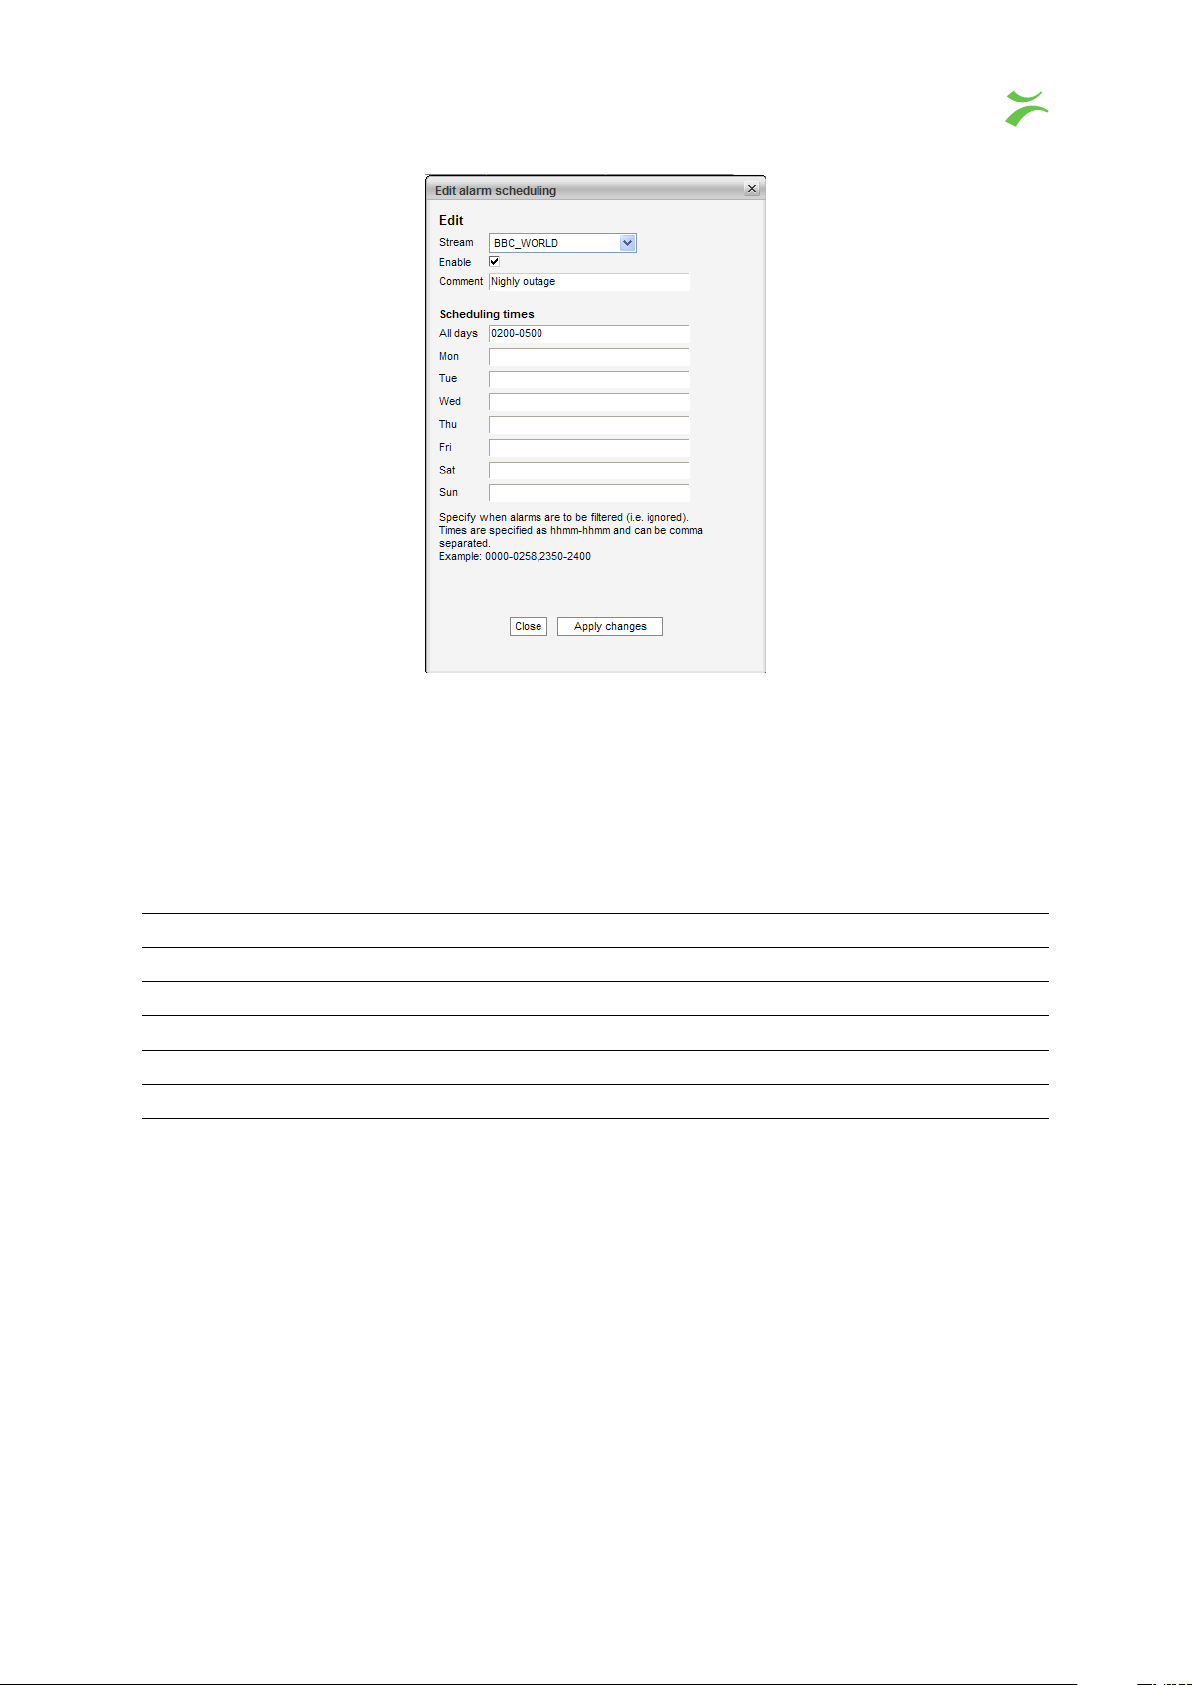
The alarm scheduling applies to the PDF reports as well with the limitation that a complete hour H is
completely filtered if H:59 is filtered, otherwise not filtered at all. Hence if alarm scheduling is active
at 13:59 for a stream, the report will mask all errors for that stream from 13:00 to 13:59.
The format of the scheduling period string is:
HHMM:HHMM,HHMM:HHMM
. As an example, mask-
ing errors from midnight to 6 in the morning and from 18.00 to 20.00 can be written as this:
0000-0600,1800-2200.
Parameter Description
Stream The name of the stream for which the scheduling applies
Comments A text string providing information about the scheduling scheme
Enabled An indication of whether the scheduling scheme is enabled or not
All days One or more scheduling periods that apply for all days during a week
Mon – Sun One or more scheduling periods that apply for the specified day
VBC Controller User’s Manual v5.4
c
BRIDGE Technologies Co AS 79

Scheduling Overview
This view displays an overview of all scheduling defined in probes and the VBC. VBC scheduling
applies at stream level, whereas probe scheduling applies at PID or service level.
Note that all services and PIDs that are associated with service or PID threshold templates different
from Default will be present in the scheduling list, irrespective of whether scheduling is actually
enabled or not. If no scheduling applies for a service or PID present in the list, the corresponding
Scheduling template
of the
Scheduling template
field will read Never. It may be a good idea to perform a column sorting
column (by clicking the column heading), this way grouping enabled
scheduling entries.
The search field in the upper right corner of the view enables filtering on a text string; only list entries
matching the specified text string will be visible.
Parameter Description
Stream The name of the stream for which the scheduling applies
Interface The probe interface associated with the probe scheduling
Type The type of scheduling level: stream, service or PID
SID The service ID associated with a probe service scheduling scheme
PID The PID associated with a probe PID scheduling scheme
PID ignore
For a probe PID threshold template, scheduling is selected to apply for
any of these errors: CC errors, missing PID, unreferenced PID or all errors.
The
PID ignore
field of the scheduling list displays which of these errors
are associated with a scheduling template. If no scheduling applies for a
PID in the schedule list, the field will display all types of errors and the
associated
Scrambling template
field will read None. In the screenshot
above this applies for PID 101 in the stream CNN_EUROPE.
80 VBC Controller User’s Manual v5.4
c
BRIDGE Technologies Co AS

Probe
Scheduling template
Scheduling The scheduling time window(s) during which alarms are masked
The IP address of the probe associated with the probe scheduling list
entry
The probe scheduling template associated with the scheduling list entry
(as defined in the probe
Setup — Scheduling
view). If no scheduling is
enabled this field will read None.
VBC Controller User’s Manual v5.4
c
BRIDGE Technologies Co AS 81

4.14 Timeline (requires Archive Server)
The
Timeline
configure the Archive Server. Select
the right hand pane.
view requires an Archive Server, please refer to chapter 4.23 for details on how to
Timeline
in the left hand menu, and the timeline should load in
4.14.1 Choosing what to inspect
To change which stream and service you are looking at, select the desired service from the drop down
at the top left. Note that tracks that are already added will stay put to enable comparing services. If
you do not want to have the old tracks there, click the small X in the top right of each track. You can
filter which streams you see by typing part of the stream or service name into the filter box. The drop
down should now only be populated by the matching streams or services. To clear the filter, just click
on the X in the right hand part of the filter box.
In the bottom left you can select from which source you want to add tracks, and to the right of those
you will find the different types of data stored from the selected device.
To remove a track, press the X located at the top right of the track you want to remove.
Some tracks can be resized by clicking on the vertical arrows located under the close button for the
track.
4.14.2 Navigating in time
To navigate in time you have two options. Back and forth in time, and zoom in / out.
To go back and forth it time you can select the desired time from the time and date picker located at
the center top. The time and date picker is most useful for large jumps in time, like if you want to look
at data from days/weeks/months back in time. Just select the correct date and time, and the timeline
should automatically jump to that point in time.
82 VBC Controller User’s Manual v5.4
c
BRIDGE Technologies Co AS

The buttons to the left and right of the timepicker let you move in small increments in both directions,
and are most suited for smaller adjustments in time.
The last way to navigate in time is to drag the timeline in the direction you would want to move it. The
timeline should smoothly glide with the dragging motion, and new data should pop up seamlessly.
To zoom in and out, use the + and – buttons located to the right of the filter box. Between the buttons
the current zoom level is shown. The zoom level describes how much time is shown in one box.
VBC Controller User’s Manual v5.4
c
BRIDGE Technologies Co AS 83

4.15 Reports
The fundamental measurements of the VBC reports are based on the parameters availability, quality
and timing. The reports can be created for IPTV and OTT streams. To create reports for ETR
measurements please use the Ext. Reports functionality.
IPTV (Ethernet) streams
Availability
Availability refers to the presence of a stream. An availability of 100% means that
there have been no signal disruptions for the complete interval that a stream has
been monitored. The no-signal error seconds are measured directly by probes as
ES(nosig).
Quality
Timing
Availability
Quality
Quality refers to the packet loss affecting a stream. A quality of 100% means
that there has been no packet loss during the interval that the stream has been
monitored. The packet loss is measured directly by the probes as ES(MLR).
Timing refers to the timing of a stream. Timing is based on error seconds just like
availability and quality. However a difference is that the value leading to timing error
seconds is not a boolean type. While it is straight forward to determine signal loss
and packet loss, determining timing issues requires comparing a jitter measurement
against a user specified threshold for IPTV streams. A jitter error-second is thus
determined by comparing the IAT measurement against the IAT threshold defined
as part of the Ethernet threshold template associated with the stream in the probe.
Ethernet threshold templates are created in the probe’s Multicasts — Ethernet
thresh. view, and it is associated with a stream in the Multicasts — Streams — Edit
view.
OTT services
Availability refers to whether at least one profile for an OTT service is present.
Otherwise error seconds are calculated and the availability parameters will drop to
a lower value.
Quality error seconds are counted if not all profiles for a OTT service are present.
100% means that all profiles are present all the time.
Timing Timing is not measured for OTT services in VBC version 5.4.
As an example, 10 error seconds during a period of 48 hours would be presented as 99.9942% for
any of the parameters availability, quality or timing. The calculation is 100%
−
48×60×60
10
×
100 =
99.99942%.
84 VBC Controller User’s Manual v5.4
c
BRIDGE Technologies Co AS
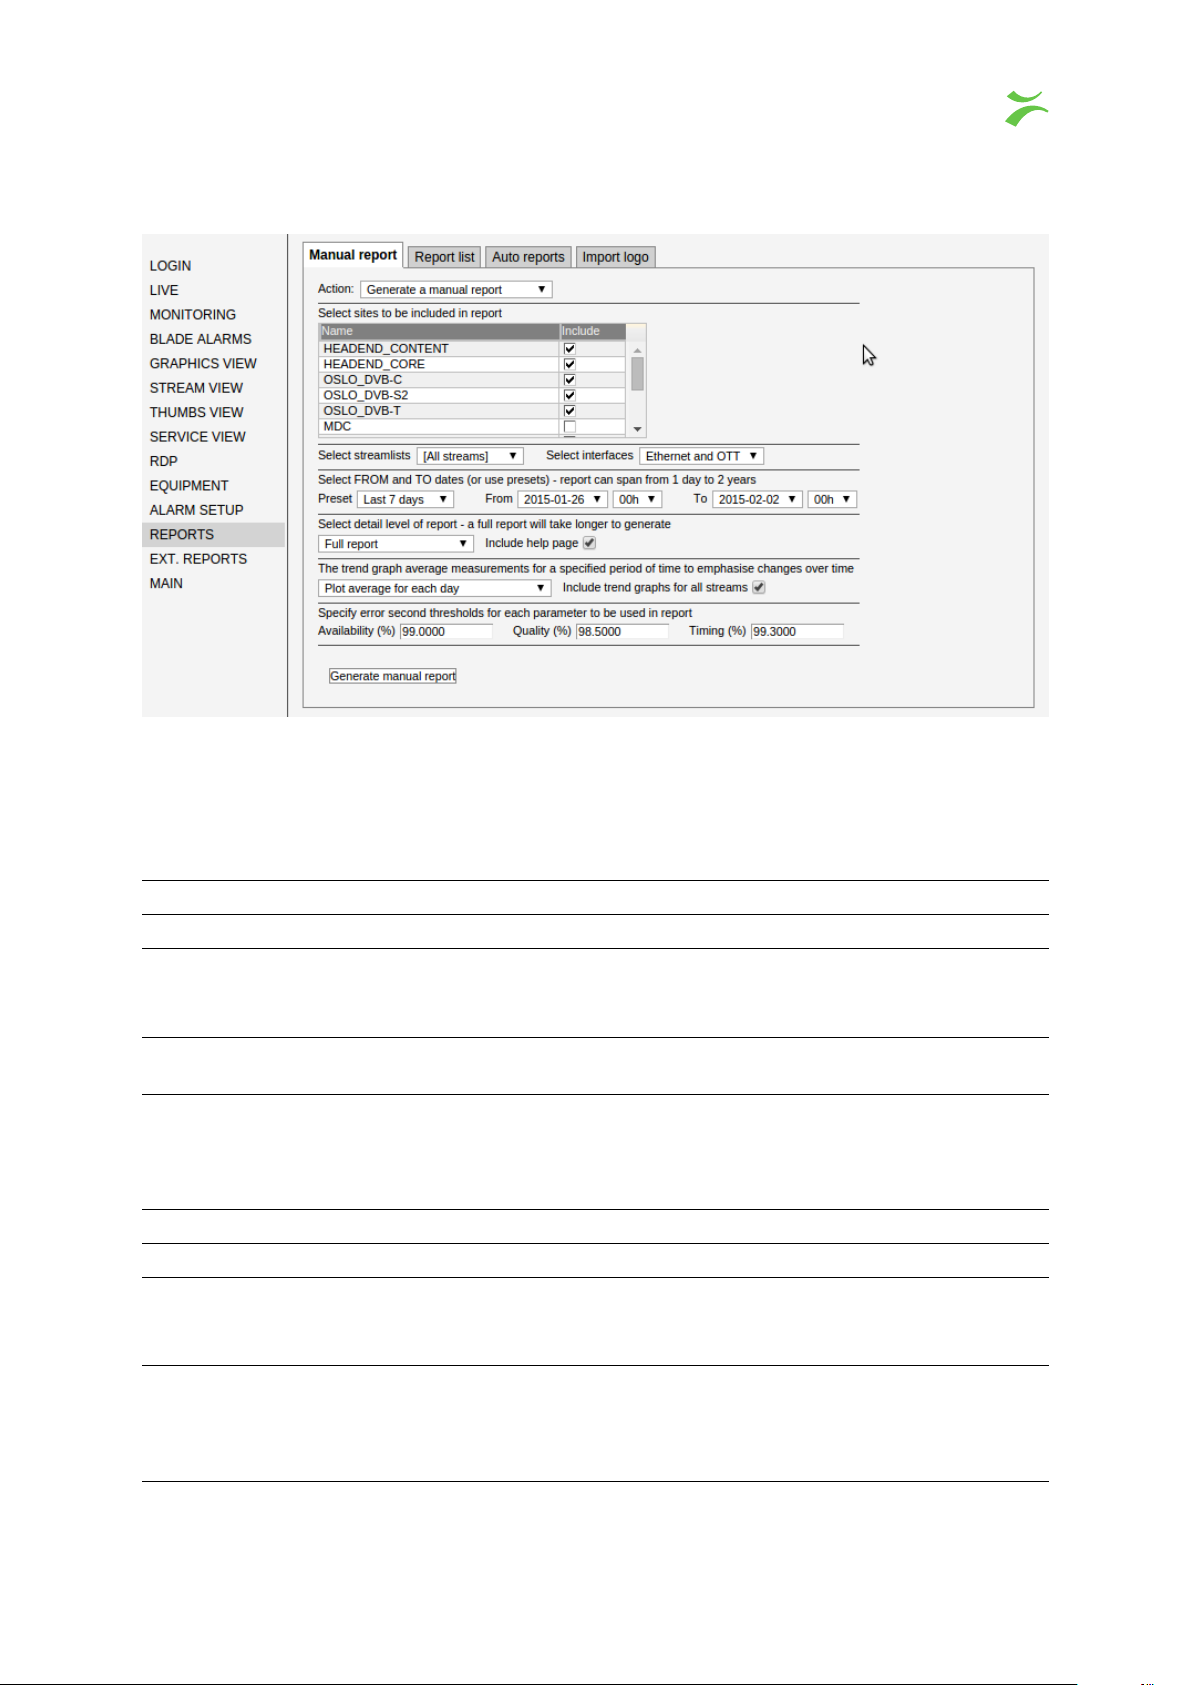
4.15.1 Reports — Manual Report
The
Manual report
below.
view allows the user to generate a report based on the parameters described
Note that parameter requirements for automatically generated reports are also specified in this view.
Select the auto report period using the ‘Action’ drop-down menu and set the parameters.
Parameter Description
Site list Only probes belonging to selected sites will contribute to the report.
Stream selection
The user may select to generate a report containing all streams in the
system or only streams associated with one stream group. The stream
groups are configured in the Main — Stream groups page.
Interfaces
Chose to create a report for IPTV (Ethernet) streams, OTT services or
both.
Preset
Allows the user to select between a number of pre-defined report periods.
The ‘Report from’ and ‘Report to’ fields are updated according to the
selection. If the preset value Userdefined is selected, the user may
manually determine the report period.
Report from First date of the report. A report can span from 1 day to 2 years.
Report to Last date of the report.
Report detail level
Choose whether to generate a full report, a report containing only erroneous streams or a report containing only summary information. When
the check box is marked, a help page will be included in the report.
Trend graph interval
The trend graphs show progress over time by averaging all measurements
for the selected interval (day, week or month) and plotting these values
over time. When the check box is marked trend graphs for all streams will
be included in the report.
VBC Controller User’s Manual v5.4
c
BRIDGE Technologies Co AS 85

Thresholds
Specify the availability, quality and jitter threshold percentages to be used
in the report.
When all parameters have been selected the report is generated by clicking the
button.
When editing the settings for a automatic report the button
the button
Generate test report
will apply the settings and create a test report so that the settings
Apply changes
will save the settings and
can be tested.
4.15.2 Reports — Report list
Generate report
The report list menu provides a list of all reports that the logged-in user is allowed to view. The admin
user has access to all reports while regular users can only view his own reports.
Newest reports will be presented at the bottom of the list (by default). Older reports with identical
report parameters are removed when a new report is generated.
The status line at the bottom displays pending reports as well as terminated reports. A terminated
report means that the report could not be generated likely because the report engine found an
incomplete or inconsistent data set. Rather than doing a best effort report the report will be discarded
and the ‘Terminated’ count increased. Click the
Fields. ..
button to select which fields should be
present in the report list. Click the Delete selected button to delete one or more reports.
86 VBC Controller User’s Manual v5.4
c
BRIDGE Technologies Co AS

4.15.3 Reports — Auto reports
The VBC may automatically create reports daily, weekly or monthly, based on parameter requirements
made by the user in the Manual report view.
If the enable daily report check-box is marked, a report will be created every day at time 00:01.
Likewise generation of weekly and monthly reports can be enabled; the weekday and month day for
VBC Controller User’s Manual v5.4
c
BRIDGE Technologies Co AS 87

the generation is specified by the user. Click the Apply changes button for changes to take effect.
Check the checkbox in the
Email report
row and enter the email address of a recipient, each of the
checked report type will be emailed by their time of generation to the selected recipient(s). If there is
more than one recipient, add a comma (‘,’) between the addresses.
The Auto reports configuration will be individual to each user account registered on the VBC, so each
user account may have its own configuration of the auto extended reports. This can be used to have
multiple daily reports emailed every night etc.
The parameters for the report is located under the Settings column, these are set in the Manual
extended report tab by selecting the Edit for the appropriate report for the Action setting.
4.15.4 Reports — Import logo
In the Import logo tab the admin can import a custom logo that will be used in generated reports.
The aspect ratio of the logo should be OK inside the reports even if it is displayed with fixed width
and height in this view.
4.15.5 Reports — The PDF Report
The generated PDF reports contain the following information:
• Title page (page 1) describing who generated the report, report dates and contributing sites
•
The summary page (page 2) containing measurements and trending across all streams and
the SLA thresholds
•
An optional help page describing the graphical elements of the report and showing the similarities between the VBC’s report graph and the probe’s MediaWindow graph
• The stream table listing all streams
• Per stream information (if requested) including optional trending graphs
88 VBC Controller User’s Manual v5.4
c
BRIDGE Technologies Co AS

The PDF report title page
The company logo can be imported.
The PDF report summary pages
The summary information grid shows overall information.
VBC Controller User’s Manual v5.4
c
BRIDGE Technologies Co AS 89

The SLA overview shows how the reported streams perform compared to the SLA threshold values.
If the measured parameter value is better than the SLA threshold the bulb icon associated with the
parameter bar is green, otherwise it is red.
The three trend graphs show how the parameter percentages develop over time. During each trend
period (day, week or month) the number of error seconds are summed across all streams and the
average is used to represent that trend interval. The labels are 100%, the user specified threshold
and the all time low. If a measurement period is incomplete the associated value is indicated as a
grey point located at the threshold line.
The threshold setting percentages are specified when the report is generated. This table also shows
the corresponding number of error seconds for the entire reporting interval as well as for one day.
90 VBC Controller User’s Manual v5.4
c
BRIDGE Technologies Co AS

The pie charts show how many streams fall below the threshold settings. In the above example there
are 125 streams that are OK while 23 have an availability of less than the threshold setting. Hence
84.4% of the streams are OK with respect to availability.
The overall chart states how many streams are not affected at all – hence 113 of the streams are
above the threshold settings for all parameters.
The stream table page lists all streams providing both error second and percentages for availability,
quality and timing. The ES (time) values are an average based on measurements from all the probes
monitoring the stream. The presented value is the total number of error seconds summed for each
probe divided by the probe count.
A red bulb indicates that a parameter is outside the thresholds. The time the stream has been
measured is stated, 100% means it was measured during the entire reporting interval. The number
of probes that measured the stream is shown.
VBC Controller User’s Manual v5.4
c
BRIDGE Technologies Co AS 91
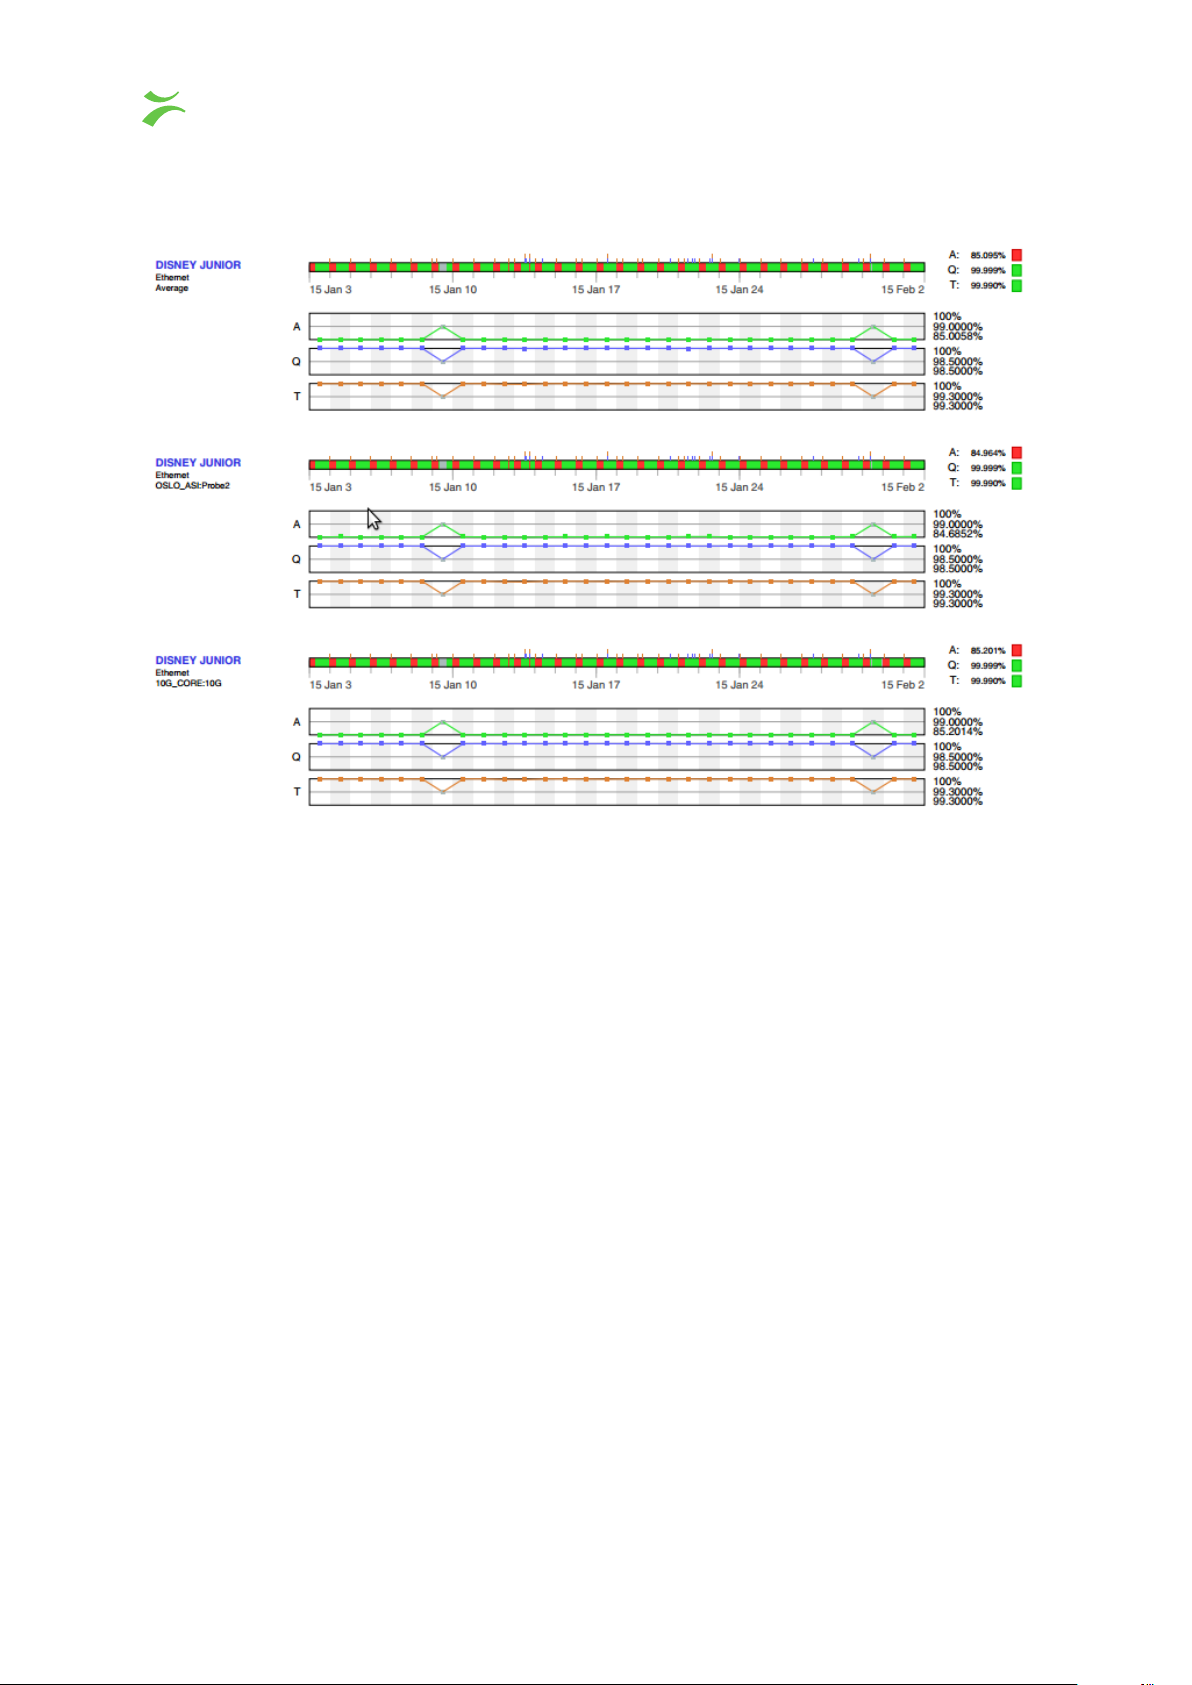
Per stream page
The stream graph is a graphical representation of the parameters quality, availability and timing over
time. For each sample period (the sample period will depend on the range of the report) a color
code is used to indicate if any of the quality (blue), availability (green) or timing (brown) parameters
were affected for the stream. So it is sufficient for the stream to measure 1 error second during a
specific sample period to color it accordingly. Conversely, the only way to have an all green bar is for
the stream to measure 0 error seconds across the entire interval of the report. A grey color is used
whenever no streams are measured. To the right of the stream graph are the status bulbs comparing
the sum of error seconds against the user specified threshold.
For streams that are monitored on more than one probe, the average graph is drawn first followed by
elementary probe measurements. The average graphs (the stream graph and the three trend graphs)
are derived by summing the error-seconds of the elementary probe measurements and dividing by
the number of probes. This averaging is performed according to the stream graph resolution (refer to
the summary information) for stream graphs and for each trending interval for trend graphs.
92 VBC Controller User’s Manual v5.4
c
BRIDGE Technologies Co AS

4.16 Ext. Reports
The extended reports section gives the user the ability to generate reports based on the raw
Alarms
from the probes added to the VBC. These reports will provide information about ETR 290
Blade
alarm status as found on the ETR 290 section on a probe. The reports are based entirely on Probe
ETR alarms, to get the alarm graphs “green” the ETR thresholds on each probe have to be changed.
Both the status of streams (MPTS or SPTS) as well as the individual services in MPTS/SPTS can be
included in the report.
The reports can be created manually or automatically on a daily, weekly or monthly basis and emailed
to a list of recipients.
VBC Controller User’s Manual v5.4
c
BRIDGE Technologies Co AS 93

4.16.1 Ext. Reports — Manual extended report
In the
action
section choose what type of report template should be modified (daily, weekly or
monthly) or select Generate Manual Report.
Press the check box for each site that should be included in the selected report.
Select which alarm data to be included in the report. To add checks drag either entire groups of
checks or individual checks from the list of available checks on the right to the list of included checks
on the left of the screen. The normal multi-select with Shift+Mouse or Ctrl+Mouse can be used.
Checks which are added to a group will be plotted as one entity in the graph and the status of each
check in the group is joined to produce one graph. If one of the checks are alarming in a period of
time then the group will have an error in that period.
To add a custom group click the
items and press
Delete
button. To rename an existing group double click the name of the group. It is
Add group
button. To delete a check or a group of checks select the
not possible to rename a check directly but the same effect can be achieved by adding a group and
adding one single check to that group. This makes it possible for instance to plot ‘TS sync’ as ‘Signal
availability’.
The dropdown can be used to select between the following presets:
Predefined options for report data
All checks:
All the checks supported by the ETR 290 engine in probe are plotted,
this includes checks not part of the ETSI TR 101 290 specification. The
checks are plotted individually.
All ETR 290 checks:
All the checks specified the ETSI TR 101 290 specification. The checks
are plotted individually.
All interface checks:
All of the interface checks such as signal level, MER, SNR and bit error
rate. The checks are plotted individually.
All check groups:
This will plot the different check groups supported by the ETR 290 engine.
The status of each check in the group is joined to produce one graph.
Groups for Finland: The checks grouped to fit Finnish government regulations.
Select which stream group to generate the report for or select
[All streams]
to generate the report
94 VBC Controller User’s Manual v5.4
c
BRIDGE Technologies Co AS

for all streams. Please note that if there are no streams in the specified stream group on the selected
site the report will be empty. The stream groups are configured in the
Main — Stream groups
page.
Select which service group to generate the report for or select [All services] to generate the report
for all services. For a stream report this will then show all streams containing the services listed in the
service group. Please note that if there are no services in the specified stream group on the selected
site the report will be empty. The service groups are configured in the
Main — Service groups
page.
Please note that you should specify either a stream group or a service group, not both at the same
time.
The time span may be switched between the
last day
, the
last 7, 30 or 90 days
. Or the user may a
set a User defined interval including up to 2 years of report data.
The level of detail can be switched between:
All streams
– This selection will display the status for all the streams monitored at the selected sites
and display them individually. Generating such a report can take a long time and the number of pages
may become high.
Merged streams
– This selection will generate a report where the data for the streams are merged.
If the same stream is monitored at different probes/sites and/or at different interfaces on one probe
the measurement results will be merged showing the overall status of the stream. If the monitored
stream has errors at one probe it will become red in the merged stream graph.
All streams and services
– This selection will gather data from all of the streams and all of the
services that are a part of the transport streams.
Merged streams and services
– This selection generate a report based on all of the streams and
their services and merge it all into one section.
All services
– This selection will gather data from all of the services inside the monitored transport
streams.
Merged services
– This selection will gather data from all services in all of the monitored transport
streams and then merge the data together.
The entities in the report can be sorted in different ways. Select one of the following in the dropdown:
• Site -> Blade -> Interface -> Stream
• Stream -> Site -> Blade -> Interface
• Stream -> Interface -> Site -> Blade
Set the
on percentage. If the selected report is of type a
error-second threshold
for the alarm checks in the extended report, the threshold is based
Manual extended reportorDaily, weekly or
monthly report the apply or generate button must be pressed for the settings to take action.
VBC Controller User’s Manual v5.4
c
BRIDGE Technologies Co AS 95

4.16.2 Ext. Reports — Extended report list
The extended report list contains all the extended reports generated by the VBC; both the manually
and/or automatically generated pdf documents. The list is split up into two tables that may be switched
between by pressing the buttons; Manual extended reports or Automatic extended reports.
The fields in each table may be changed by pressing the
Fields..
button, if there is a field that is not
important to have in the tables it can be removed by pressing the corresponding checkbox.
The fields shown in the table are generally the parameters entered in in the
Manual extended Report
tab, except for Job number and sites.
Job
– a value that gets incremented each time a report is generated this is a global variable for
Manual extended reports and Automatic extended reports.
Sites – the number of sites included in the report.
Press view to download and open the corresponding report.
4.16.3 Ext. Reports — Auto extended reports
96 VBC Controller User’s Manual v5.4
c
BRIDGE Technologies Co AS

The automatic extended reports tab gives the opportunity to select when and how often the an
extended report will be automatically generated.
Click the checkbox and select at what intervals the report should be generated, daily, weekly or
monthly. For weekly reports the day of the week when the report are to be generated can be specified.
Similarly for a monthly report the day of the month can be specified. The reports will be generated at
01.00 on the selected day(s).
Check the checkbox in the
Email report
row and enter one or more email address, separated by a
comma. Each generated report will be emailed to the selected recipient(s).
The Auto reports configuration will be individual to each user account registered on the VBC, so each
user account may have its own configuration of the auto extended reports. This can be used to have
multiple daily reports with different settings etc.
The parameters for the report is shown under the Settings column, these are set in the Manual
extended report tab by selecting the Edit for the appropriate report for the Action setting.
VBC Controller User’s Manual v5.4
c
BRIDGE Technologies Co AS 97

4.16.4 Ext. Reports — PDF Report
The PDF report title page
The front page of the PDF report, a company logo may be imported.
The PDF report summary page
98 VBC Controller User’s Manual v5.4
c
BRIDGE Technologies Co AS
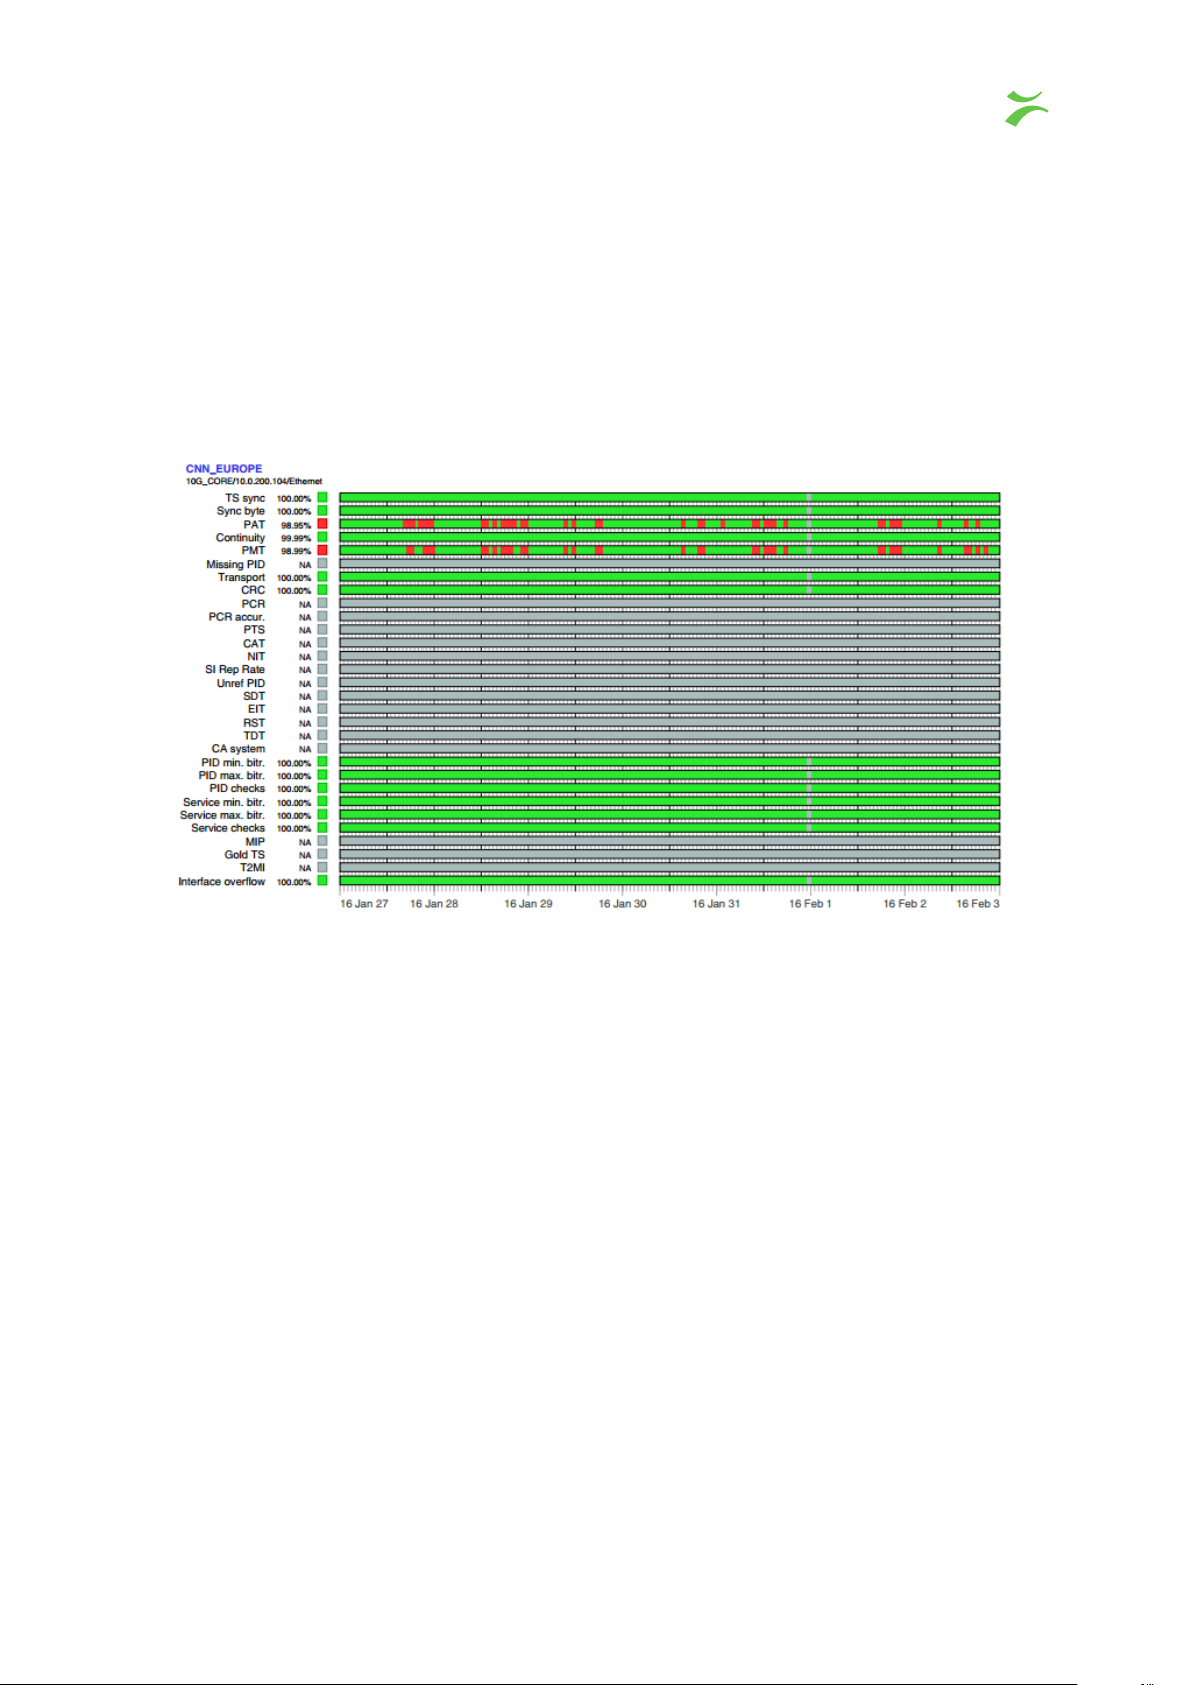
This page of the extended report shows a short summary about the specific report, sites and SLA
thresholds.
The SLA thresholds shows what ETR parameters that are being monitored, how many corresponding
error-seconds for the number of days specified and corresponding error-seconds for 1 day. If the
checks are added into one groups then this page will show which probe alarms are used for each of
the groups.
The PDF report Alarm-graph page
The alarm-graph is similar to the ones found in the ETR 290 section on each probe, if there was a No
TS sync at some part of the day. The alarm-graph will be red at some point. The alarm-graphs will
show entire streams or single services depending on what selected in the Manual extended report
section. Alarms that are grey all the time are disabled in the probe. When generating the report it is
possible to omit checks which are not of interest or to group several checks together.
VBC Controller User’s Manual v5.4
c
BRIDGE Technologies Co AS 99

4.16.5 Ext. Reports — Alarm poll and report status
The alarm poll and report status section will provide information about the last report generation from
the VBC, if a device was unreachable or the VBC succeeded in getting the alarm, this section will tell
what went wrong or not.
Alarm poll and report status
#: Number of the blade
Blade type: Device type, either probe or extractor
IP address: The IP of the selected device
Uptime: Uptime in minutes
Seq no: Sequence number of the last alarm message received
Last alarm poll time: What the time was when the VBC fetched the alarm list from the device
Alarm poll status:
Status of the alarm poll, did the VBC manage to fetch the alarm list from
the device
Last report:
When was the latest report data generated for the selected device. This
should normally be done once every hour
Report gen. status: Provides information on the status of the last report data generation
100 VBC Controller User’s Manual v5.4
c
BRIDGE Technologies Co AS
 Loading...