

Page 1
VB2-series
Users' Manual
Sw version 5.0
The current manual is always found in the log-in area of the www.bridgetech.tv site.
Refer to section 1.2 of this manual for more information.
PROBE USERS' MANUAL VERSION 5.0
2014© BRIDGE Technologies Co AS - Bentsebrugata 20 - N-0476 Oslo, Norway - tel: +47 22 38 51 00 -
www.bridgetech.tv
Page 2

Table of Contents
1 INTRODUCTION.............................................................................................................. 7
1.1 About the Probe........................................................................................................... 7
1.1.1 Probe - Overview................................................................................................. 7
1.1.2 VB20 and VB220................................................................................................... 8
1.1.3 Probe - Functionality............................................................................................9
1.2 How to use this manual............................................................................................... 10
2 PRINCIPLE OF OPERATION......................................................................................... 11
3 SAFETY......................................................................................................................... 13
4 INSTALLATION AND INITIAL SETUP.............................................................................14
4.1 Quick Installation Guide.............................................................................................14
4.2 The Enhanced Chassis (EC)...................................................................................... 14
4.2.1 Dual Power Supply............................................................................................. 15
4.2.2 Cooling System..................................................................................................15
4.3 The Enhanced Chassis -48V DC version (ECDC).....................................................16
4.3.1 Dual Power Supply............................................................................................. 16
4.3.2 Cooling System..................................................................................................17
4.3.3 ECDC Power Supply...........................................................................................17
4.4 Serial Number Location............................................................................................. 18
4.5 Portable chassis (VB20)............................................................................................. 19
4.5.1 AC Power Supply ...............................................................................................19
4.5.2 Cooling System..................................................................................................19
4.5.3 Serial number location......................................................................................... 19
4.5.4 Interfaces............................................................................................................ 19
4.6 The ACC/DCC Hardware (VB220).............................................................................20
4.6.1 Cooling System..................................................................................................20
4.6.2 ACC Power Supply............................................................................................. 20
4.6.3 DCC Power Supply............................................................................................ 21
4.6.4 Serial Number Location......................................................................................21
4.7 The Hardware Modules and Connectors (VB220)......................................................22
4.7.1 The Probe Module............................................................................................... 22
4.7.2 The VB242 ASI Input Module (VB220 option).....................................................23
4.7.3 The VB250 COFDM Demodulator Module (VB220 Option)................................24
4.7.4 The VB252 COFDM Dual Demodulator Module (VB220 Option)........................25
4.7.5 The VB260 QAM Demodulator Module(VB220 Option)......................................26
4.7.6 The VB262 Dual QAM/8VSB Demodulator Module (VB220 Option)..................27
4.7.7 The VB270 DVB-S/S2 Demodulator Module (VB220 Option).............................28
4.7.8 The VB272 dual DVB-S/S2 Demodulator Module (VB220 Option).....................29
4.7.9 The VB273 DVB-S/S2 Redundancy switch (VB220 Option)................................30
4.8 Installing the Unit in a Rack (VB220).........................................................................34
4.8.1 Default Installation - Connectors at the Front of Rack........................................34
4.8.2 Optional Installation - Connectors at the Rear of Rack.......................................34
4.8.3 Optional Installation - Mid-Mounting...................................................................35
4.9 Powering up the Unit................................................................................................. 35
4.10 Initial Configuration..................................................................................................36
4.10.1 Initial Configuration Using the Pre-Set IP-Address...........................................36
4.10.2 Initial Configuration Via Serial Console Emulated Over USB...........................36
4.10.3 Verifying Correct Initial Setup of the Probe.......................................................40
4.10.4 Initial Setup Troubleshooting............................................................................41
5 QUICK SETUP GUIDE................................................................................................... 42
5.1 Basic Setup: All Interfaces.........................................................................................42
5.2 Input Signal Definitions..............................................................................................42
5.2.1 ASI Input ........................................................................................................... 42
5.2.2 Ethernet Input (IP Option Only)..........................................................................42
5.2.3 OTT Input (OTT Engine Option Only)................................................................. 43
5.2.4 Demodulator Input(VB220)................................................................................. 43
5.3 Monitoring: All Interfaces............................................................................................ 44
Page 3

5.4 Adjusting Alarm Thresholds: All Interfaces.................................................................44
6 THE PROBE GRAPHICAL USER INTERFACE..............................................................46
6.1 Main........................................................................................................................... 48
6.1.1 Main - Summary.................................................................................................48
6.1.2 Main - CPU usage..............................................................................................52
6.1.3 Main - Eii graphing............................................................................................. 53
6.2 Alarms........................................................................................................................ 54
6.2.1 Alarms - All Alarms.............................................................................................55
6.2.2 Alarms - Alarm setup..........................................................................................56
6.3 OTT (requires the OTT Option).................................................................................. 63
6.3.1 Active testing......................................................................................................63
6.3.2 Channels............................................................................................................69
6.3.3 Settings.............................................................................................................. 71
6.3.4 Thresholds......................................................................................................... 72
6.4 Mon ........................................................................................................................... 74
6.4.1 Mon - Parameters.............................................................................................. 74
6.4.2 Mon - Setup......................................................................................................... 87
6.5 MW ........................................................................................................................... 87
6.6 RDP........................................................................................................................... 92
6.7 Traffic ........................................................................................................................98
6.7.1 Traffic - Protocols (requires AET-OPT)................................................................98
6.7.2 Traffic - Detect...................................................................................................100
6.8 Ethernet ..................................................................................................................101
6.8.1 Ethernet - Summary.........................................................................................101
6.8.2 Ethernet - History............................................................................................. 103
6.8.3 Ethernet - IGMP (requires AET-OPT)...............................................................105
6.8.4 Ethernet - Join..................................................................................................106
6.8.5 Ethernet - FSM (requires AET-OPT)................................................................. 107
6.8.6 Ethernet - Multicasts......................................................................................... 110
6.8.7 Ethernet - Ethernet thresh................................................................................114
6.9 ETR 290 (Option)..................................................................................................... 117
6.9.1 ETR 290 - ETR Overview.................................................................................117
6.9.2 ETR 290 - ETR Details..................................................................................... 118
6.9.3 ETR 290 - Services..........................................................................................121
6.9.4 ETR 290 - Bitrates............................................................................................ 125
6.9.5 ETR 290 - Tables.............................................................................................. 126
6.9.6 ETR 290 - PID list............................................................................................. 128
6.9.7 ETR 290 - PCR................................................................................................ 129
6.9.8 ETR 290 – T2MI (Option)..................................................................................132
6.9.9 ETR 290 – SCTE 35 (Option)............................................................................ 134
6.9.10 ETR 290 - Status............................................................................................ 136
6.9.11 ETR 290 - Compare........................................................................................137
6.9.12 ETR 290 - ETR thresh.................................................................................... 143
6.9.13 ETR 290 - PID thresh.....................................................................................155
6.9.14 ETR 290 - Service thresh...............................................................................157
6.10 ASI ......................................................................................................................... 160
6.10.1 ASI Status...................................................................................................... 160
6.10.2 ASI - Setup..................................................................................................... 162
6.11 ASI (Optional module for VB220)............................................................................ 164
6.11.1 ASI - Status....................................................................................................165
6.11.2 ASI - Setup (Round-Robin Mode)................................................................... 166
PROBE USERS' MANUAL VERSION 5.0
2014 © BRIDGE Technologies Co AS - Bentsebrugata 20 - N-0476 Oslo, Norway - tel: +47 22 38 51 00 -
www.bridgetech.tv
4
Page 4

6.12 COFDM (VB250 Option Module for VB220)...........................................................167
6.12.1 COFDM - Status (VB250)............................................................................... 167
6.12.2 COFDM - Tuning setup (VB250)....................................................................170
6.12.3 COFDM - COFDM threshold (VB250)............................................................173
6.12.4 COFDM - RF Overview (VB250)....................................................................175
6.13 COFDM (VB252 Option Module for VB220)...........................................................176
6.13.1 COFDM - Status (VB252)............................................................................... 176
6.13.2 COFDM - Tuning setup (VB252).....................................................................184
6.13.3 COFDM - COFDM threshold (VB252)............................................................187
6.13.4 COFDM - Impulse response (Requires Advanced RF Option).......................191
6.13.5 COFDM - RF overview (VB252).....................................................................192
6.14 QAM/VSB/RF (VB260 or VB262 Module Option for VB220)..................................193
6.14.1 QAM - Status.................................................................................................. 193
6.14.2 QAM - Tuning setup.......................................................................................196
6.14.3 QAM - QAM threshold....................................................................................199
6.14.4 QAM - RF overview........................................................................................203
6.15 SAT (VB270 or VB272 Option module for VB220).................................................204
6.15.1 SAT - Status...................................................................................................204
6.15.2 SAT - Tuning setup......................................................................................... 208
6.15.3 SAT - SAT threshold.......................................................................................211
6.15.4 SAT - RF overview.......................................................................................... 213
6.16 SAT Redundancy Switch (VB272 and VB273 Option module for VB220)............214
6.16.1 Tuning setup.................................................................................................... 214
6.16.2 SAT Tuning setup............................................................................................215
6.16.3 Threshold setup............................................................................................... 216
6.16.4 Redundancy status and overview ................................................................... 217
6.16.5 Redundancy modes........................................................................................ 217
6.16.6 Status for input...............................................................................................218
6.17 Setup...................................................................................................................... 219
6.17.1 Setup - Params.............................................................................................. 219
6.17.2 Setup - Pages................................................................................................ 221
6.17.3 Setup - Time................................................................................................... 222
6.17.4 Setup - Ethernet.............................................................................................222
6.17.5 Setup - VBC................................................................................................... 228
6.17.6 Setup - Login..................................................................................................229
6.17.7 Setup - ETR................................................................................................... 230
6.17.8 Setup - VBC thresh........................................................................................234
6.17.9 Setup - Scheduling.........................................................................................236
6.17.10 Setup - Routing............................................................................................ 238
6.17.11 Setup - Security............................................................................................ 239
6.18 Data....................................................................................................................... 241
6.18.1 Data - Configuration.......................................................................................241
6.18.2 Data - Software.............................................................................................. 242
6.18.3 Data - Table Descriptors.................................................................................243
6.18.4 Data - Eii........................................................................................................ 243
6.18.5 Data - BOOT..................................................................................................245
6.19 About..................................................................................................................... 246
6.19.1 About - Release info.......................................................................................246
6.19.2 About - License.............................................................................................. 246
6.19.3 About - Technologies......................................................................................247
PROBE USERS' MANUAL VERSION 5.0
2014 © BRIDGE Technologies Co AS - Bentsebrugata 20 - N-0476 Oslo, Norway - tel: +47 22 38 51 00 -
www.bridgetech.tv
5
Page 5

1. Appendix: Probe Versus VideoBridge Controller - Alarms..........................................248
2. Appendix: Monitoring Practices.................................................................................. 249
3. Appendix: OTT Profile Health.................................................................................... 255
4. Appendix: Software Upload........................................................................................ 257
PROBE USERS' MANUAL VERSION 5.0
2014 © BRIDGE Technologies Co AS - Bentsebrugata 20 - N-0476 Oslo, Norway - tel: +47 22 38 51 00 -
www.bridgetech.tv
6
Page 6
1 INTRODUCTION
1.1 About the Probe
1.1.1 Probe - Overview
The VB-2 series of probes consists of the VB220 rack-mount IP probe and the VB20
portable IP probe. The VB220 can be bundled with a range of interface modules for
monitoring of signals as found in cable (QAM), satellite (DVB-S/S2) and terrestrial
(DVB-T/T2/8VSB). The feature set and capabilities of the VB220 and the VB20 are
otherwise idendical.
The VB-2 series of probes enables full confidence monitoring of one Ethernet input
(electrical or optical) in addition to optional contents check of one electrical ASI
transport stream input. It provides detailed IP-packet monitoring of up to 260 IP
multicasts.
The OTT software option is available on VB220 and VB20 and enables monitoring of
up to 50 adaptive bitrate channels in steps of 10 depending on license
activated.Supported streaming formats include Apple(tm) HSL, Adobe(tm) HDS and
Microsoft(tm) SmoothStream.
The ETR 290 software option performs extended ETSI TR 101 290 analysis, enabling
detailed transport stream monitoring, including verification of PSI/SI and bitrate
monitoring for individual services and service components.
A built-in web server in the probe allows remote signal monitoring using a standard
web-browser. Management may take place either via a separate Ethernet network, or
using the regular video/data network – both IPv4 and IPv6 are supported on the
management interface.
The probe can also be managed via the VideoBridge Controller (VBC) - a centralised
server management solution. The VBC adds management features like alarm
aggregation and report functionality as well as centralised access and user roles.
The VB220 is a module housed in a 1 RU chassis. Three probe modules may be
PROBE USERS' MANUAL VERSION 5.0
2014 © BRIDGE Technologies Co AS - Bentsebrugata 20 - N-0476 Oslo, Norway - tel: +47 22 38 51 00 -
www.bridgetech.tv
7
Page 7

installed in one chassis, thus tripling the monitoring capacity.
1.1.2 VB20 and VB220
The main difference between the VB20 and the VB220 probes are summarized in the
following table:
Feature VB20 VB220
RF/ASI inputs No Up to 4 RF inputs by adding
interface modules in chassis,
QAM/8VSB: VB262
DVB-S/S2: VB272
DVB-T/T2: VB252
ASI: VB242
Number of
IP/Ethernet
multicast/unicast
streams
260 260
Full Service
Monitoring (FSM)
Yes Yes
IGMP logging Yes Yes
Ethernet Traffic
analysis
Yes Yes
T2MI analysis and
monitoring
Requires T2MI-OPT Requires T2MI-OPT
ETR analysis No (Requires ETR290-OPT, can
be licensed with up to 4
ETR290 Engines for ethernet
and one Engine for ASI. Each
additional RF interfaes get
their own ETR Engine.)
No (Requires ETR290-OPT, can
be licensed with up to 4
ETR290 Engines for ethernet
and one Engine for ASI. Eacb
additional RF interfaces get
their own ETR Engine.)
OTT monitoring and
analysis of HLS,
HDS, Smoothstream
Up to 50 channels in steps of
10 per license. Requires OTTENG-OPT.
Up to 50 channels in steps of
10 per license. Requires OTTENG-OPT.
SCTE 35 monitoring
and analysis
Requires SCTE 35-OPT and at
least one ETR 290 engine.
Requires SCTE 35-OPT and at
least one ETR 290 Engine
The illustrations and GUI screenshots used in this users manual will refer to
VB220They are equally valid also for the VB20
PROBE USERS' MANUAL VERSION 5.0
2014 © BRIDGE Technologies Co AS - Bentsebrugata 20 - N-0476 Oslo, Norway - tel: +47 22 38 51 00 -
www.bridgetech.tv
8
Page 8
In subsequent text the word Probe is used as a generic reference to VB20 and VB220.
1.1.3 Probe - Functionality
An IP-based network is fully transparent with respect to signal contents quality,
provided that the IP-packets arrive, and provided that they arrive in time. The probe
therefore uses the patented MediaWindow to allow monitoring at-a-glance of packet
loss and errors in inter-packet arrival time. This way the operator can conveniently
ensure correct signal quality at IP-level.
The advanced Ethernet protocol analysis tool automatically detects all protocols
carried over Ethernet past the port the probe is connected to, and it displays statistics
like percentage utilization of the interface and percentage of the different transported
protocols. This gives the probe a real-time sniffer capability.
The probe allows the user to define a Return Data Path (RDP), using the regular
video/data network or the management network to return a stream. A faulty signal can
then be further analysed at the studio premises, when necessary.
The recording functionality allows the user to record a stream, either triggered
manually by the user or triggered by a user defined alarm.
Full Service Monitoring (FSM) checks that vital system components like CA-servers are
active.
Optional Ethernet TR 290 monitoring allows the operator to check parameters like
transport stream sync and PSI/SI standards conformity. This option also performs
further PSI/SI analysis, making it possible to view PSI/SI contents. PID and service
bitrates are also continuously measured.
Optional OTT monitoring allows the operator to set up active testing of Over-the-top
type signals as found in adaptive bitrate streaming architectures. Formats supported
include Apple (tm) HLS, Microsoft (tm) Smoothstream, MPEG DASH and Adobe (tm)
PROBE USERS' MANUAL VERSION 5.0
2014 © BRIDGE Technologies Co AS - Bentsebrugata 20 - N-0476 Oslo, Norway - tel: +47 22 38 51 00 -
www.bridgetech.tv
9
Page 9

HDS.
The probe can be expanded through licence options to monitor the T2MI protocol layer
as found in DVB-T2 networks.
The probe can also be licensed with an SCTE 35 option that allows monitoring and
logging of splice time codes embedded in the transport streams.
1.2 How to use this manual
This users' manual is valid for software versions 5.0 of the probe.
Throughout this manual the term stream is often used rather than unicast or multicast.
One stream may consist of one or more services, and refers to one IP uni- or multicast
(for Ethernet input) or one transport stream (ASI, COFDM, QAM/VSB or QPSK/DVB-S2).
Chapter 3 lists safety precautions, and this chapter should be read prior to equipment
installation.
Chapter 4 explains how to install the equipment in a rack, and also how to perform the
necessary initial configuration of the probe management IP-address. A step-by-step
quick installation guide is found in section 4.1.
Chapter 5 contains a quick setup guide; a step-by-step description of how to setup a
probe once the initial setup has been performed.
Chapter 6 describes the graphical user interface (GUI) as seen when pointing a web
browser to the probe's IP-address.
Appendix I describes the alarm handling in the probe versus the VideoBridge
Controller (VBC).
Appendix II explains some useful Ethernet monitoring practices.
Appendix III explains the OTT profile health bar and timeline.
Appendix IV explains a probe software upload procedure used when upgrading from
software versions older than 4.2.
Note that current versions of the users' manual can be found on the
http://www.bridgetech.tv website. Log-in as end user: customer with password:
xmas4u . Additional technical documentation is also found at the same location.
PROBE USERS' MANUAL VERSION 5.0
2014 © BRIDGE Technologies Co AS - Bentsebrugata 20 - N-0476 Oslo, Norway - tel: +47 22 38 51 00 -
www.bridgetech.tv
10
Page 10
2 PRINCIPLE OF OPERATION
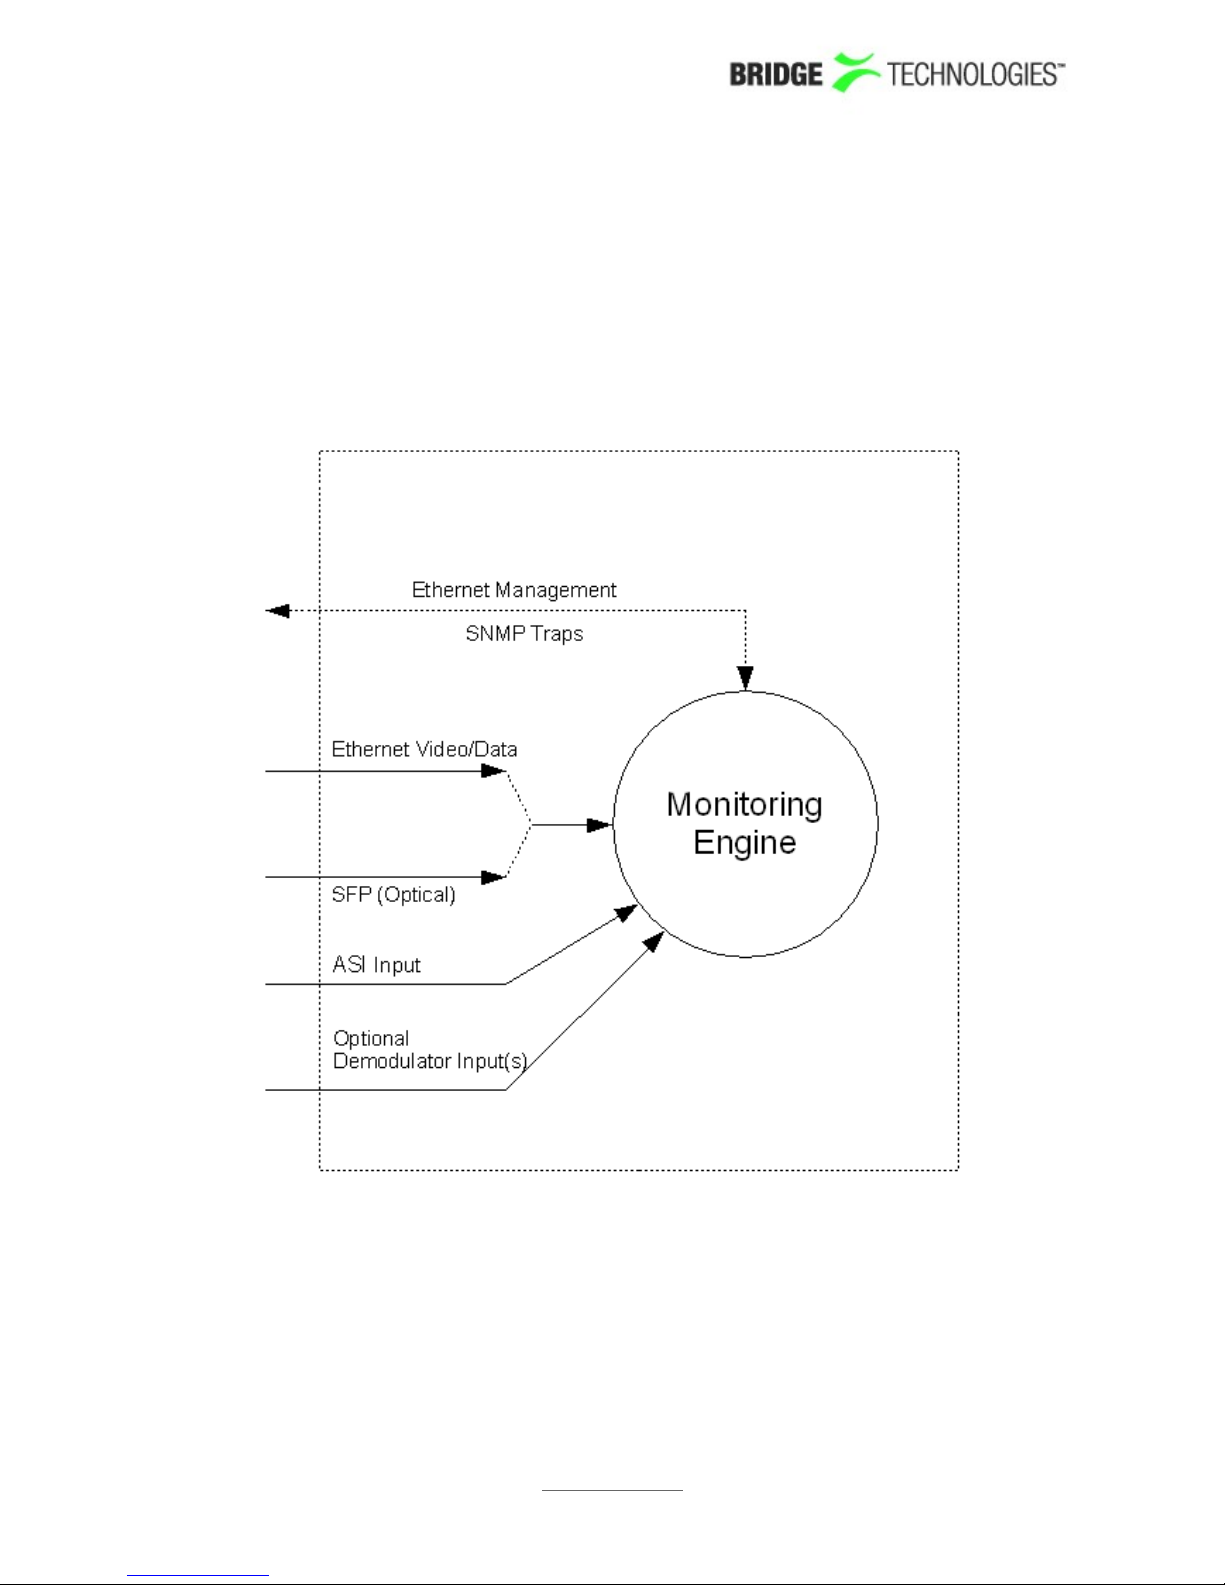
The probe module is equipped with two Ethernet ports and an SFP optical port. The
user selects which transport stream signal input to be used by the monitoring engine,
either the Ethernet video/data port or the SFP optical input. Management of the probe
is conducted via the Ethernet management port or alternatively in-band via the
Ethernet video/data port.
Figure 1: The Probe Module
PROBE USERS' MANUAL VERSION 5.0
2014 © BRIDGE Technologies Co AS - Bentsebrugata 20 - N-0476 Oslo, Norway - tel: +47 22 38 51 00 -
www.bridgetech.tv
11
Page 11
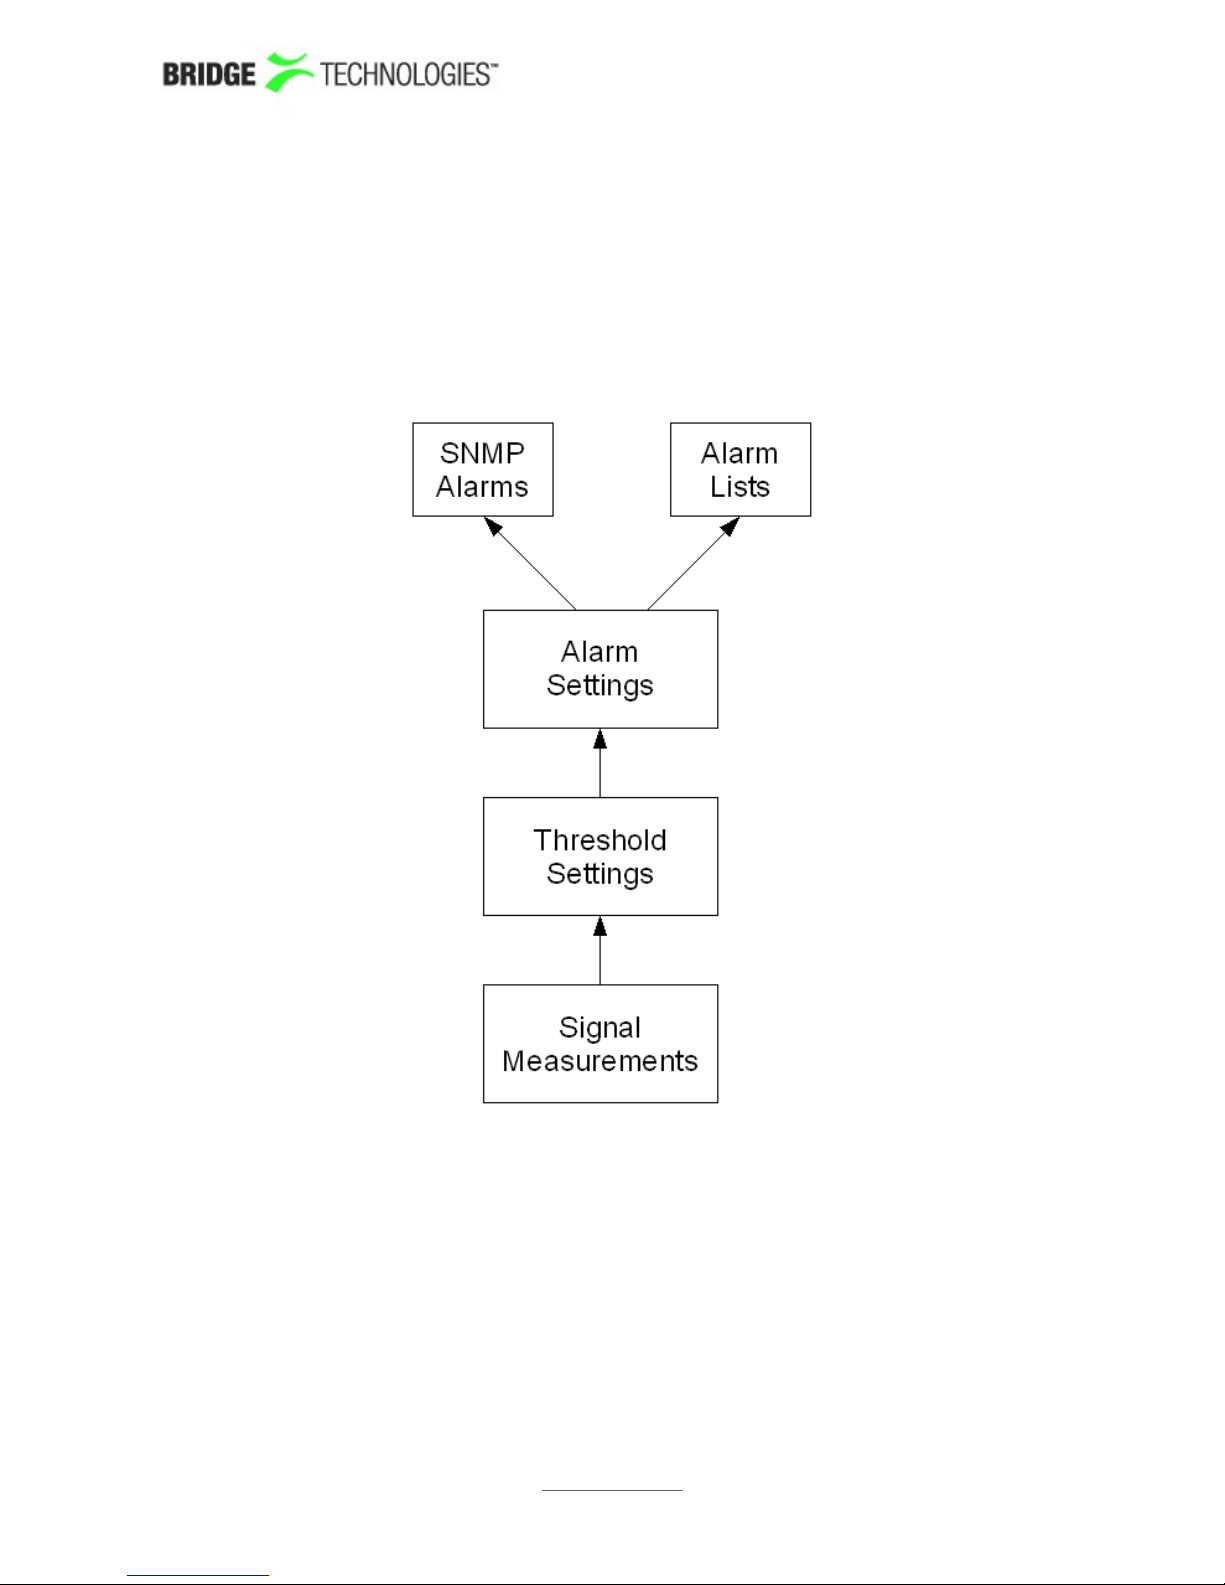
A simplified diagram of the alarm handling mechanisms of the probe is shown in figure
2. The input signals are continuously analysed, and measured data are checked
against user defined threshold values. If the data do not comply with the threshold
values alarms will be generated. The overall alarm settings further make it possible to
enable and disable alarms, thus defining which alarms should be reported in the probe
alarm list and sent as SNMP traps to an external management system.
Figure 2: Simplified Diagram of the Alarm Handling in the probe
PROBE USERS' MANUAL VERSION 5.0
2014 © BRIDGE Technologies Co AS - Bentsebrugata 20 - N-0476 Oslo, Norway - tel: +47 22 38 51 00 -
www.bridgetech.tv
12
Page 12

3 SAFETY
Read the installation instructions before connecting the chassis unit to the
power source. Do not install the chassis unit with power on.
The chassis or the portable unit is intended for installation in restricted
access areas. A restricted access area can be accessed only through the use
of a special tool, lock and key, or other means of security.
Blank faceplates and cover panels serve three important functions: they
prevent exposure to hazardous voltages and currents inside the chassis,
they provide electromagnetic interference shielding and they direct the flow
of cooling air through the chassis. Do not operate the chassis unit unless all
modules, faceplates, front covers and rear covers are in place.
Only trained and qualified personnel should be allowed to install, replace or
service this equipment.
This equipment must be installed and maintained by service personnel as
defined by AS/NZS 3260. Incorrectly connecting this equipment to a generalpurpose outlet could be hazardous.
Ultimate disposal of this product should be handled according to all national
laws and regulations.
To prevent the system from overheating, do not operate it in an area that
exceeds the maximum ambient temperature of 45 degrees Celsius.
Do not work on the system or connect or disconnect cables during periods of
lightning activity.
The chassis or the portable unit requires short-circuit (overcurrent)
protection. Ensure that the protective device is rated not greater than 120
VAC, 15 A; 240 VAC, 10 A; 60 VDC 20 A.
PROBE USERS' MANUAL VERSION 5.0
2014 © BRIDGE Technologies Co AS - Bentsebrugata 20 - N-0476 Oslo, Norway - tel: +47 22 38 51 00 -
www.bridgetech.tv
13
Page 13

4 INSTALLATION AND INITIAL SETUP
4.1 Quick Installation Guide
1. Read the safety instructions, refer to chapter 3
2. Install the unit in a 19'' rack for rack mount probes, refer to section 4.5
3. Connect the signal cables, refer to section 4.3
4. Power up the unit, refer to section 4.6
5. Perform initial set-up of IP-addresses, refer to section 4.7
6. Verify that the GUI launches correctly, refer to section 4.7.3
4.2 The Enhanced Chassis (EC)
The 1RU Enhanced Chassis can house a maximum of 3 modules, and it is equipped
with two 100-240V AC 75W power supplies. The unit is forced air ventilated, the air
flow going from front to back. The maximum power consumption of the chassis with
optional modules is 75W. By default all connectors are located at the front of the unit.
The power plugs are located at the rear of the unit. The rack ears of the chassis may
be moved to provide for mid or rear mounting of the unit. The rack ears are designed
to support the weight of the unit.
Figure 4: The Enhanced Chassis with probe boards installed
PROBE USERS' MANUAL VERSION 5.0
2014 © BRIDGE Technologies Co AS - Bentsebrugata 20 - N-0476 Oslo, Norway - tel: +47 22 38 51 00 -
www.bridgetech.tv
14
Page 14

4.2.1 Dual Power Supply
The Enhanced Chassis (EC) is delivered with two 100-240V AC / 75W power supplies,
providing power redundancy. Each EC unit consists of a 1RU chassis with 3 option
slots. In normal operation load is shared between the two power supplies. If mains fallout occurs for one of the power sources or one of the power supplies fails, the power
supply still in operation will take the full load, seamlessly. This means that monitoring
operation will not be affected if one of the power sources fails. Power supply failure will
be indicated by a red LED located rightmost on the front of the chassis.
Figure 5: Red LED indicating failure for one of the power supplies
4.2.2 Cooling System
The chassis is equipped with six long-life fans that suck in air from front of the chassis.
The air exits at the back of the unit. The fans are temperature controlled, allowing
them to run at an optimum speed. Venting holes at the sides of the chassis provide an
optional air intake, ensuring good aerodynamical properties of the cooling air flow. It
is recommended, but not essential, that these venting holes are not covered.
PROBE USERS' MANUAL VERSION 5.0
2014 © BRIDGE Technologies Co AS - Bentsebrugata 20 - N-0476 Oslo, Norway - tel: +47 22 38 51 00 -
www.bridgetech.tv
15
Page 15
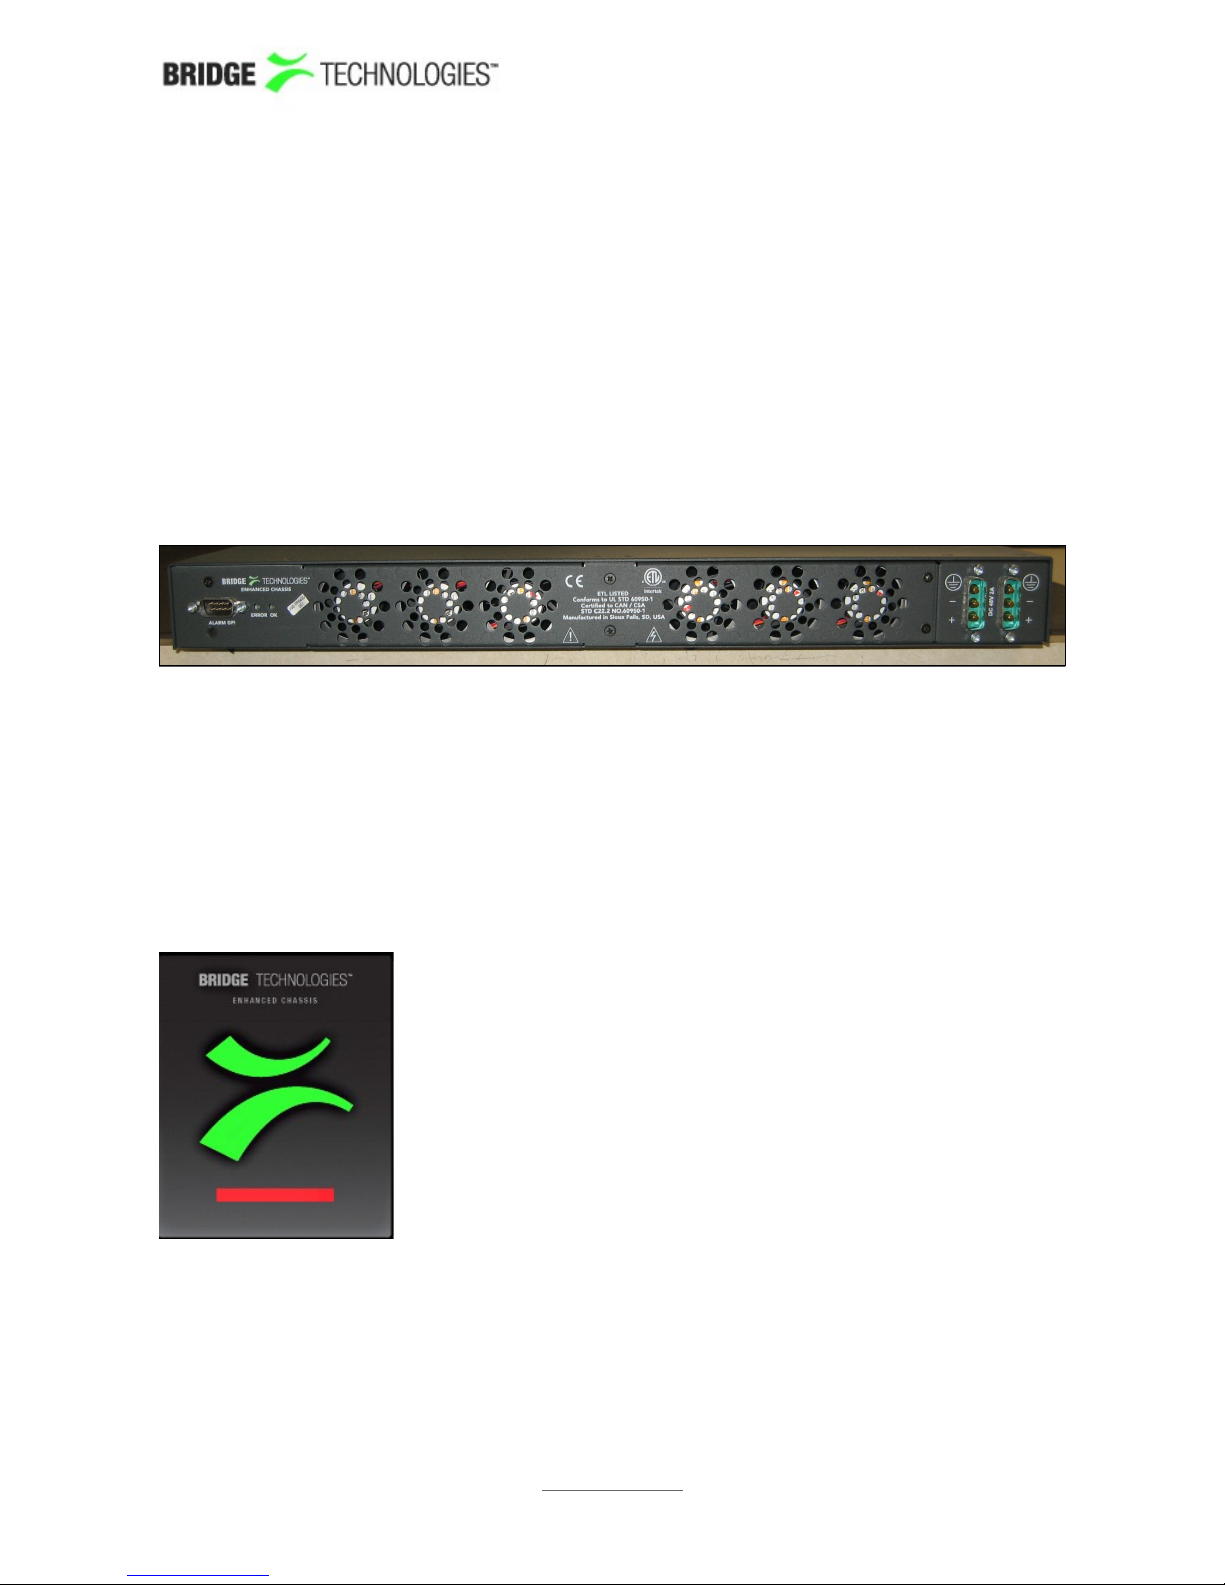
4.3 The Enhanced Chassis -48V DC version (ECDC)
The 1RU Enhanced Chassis can house a maximum of 3 modules, and it is equipped
with two -48V DC 75W power supplies. The unit is forced air ventilated, the air flow
going from front to back. The maximum power consumption of the chassis with
optional modules is 75W. By default all connectors are located at the front of the unit.
The power plugs are located at the rear of the unit. The rack ears of the chassis may
be moved to provide for mid or rear mounting of the unit. The rack ears are designed
to support the weight of the unit.
4.3.1 Dual Power Supply
ECDC rear: two -48V DC connectors located on the the right.
The Enhanced Chassis (EC) is delivered with two -48V DC / 75W power supplies,
providing power redundancy. Each EC unit consists of a 1RU chassis with 3 option
slots. In normal operation load is shared between the two power supplies. If mains fallout occurs for one of the power sources or one of the power supplies fails, the power
supply still in operation will take the full load, seamlessly. This means that monitoring
operation will not be affected if one of the power sources fails. Power supply failure will
be indicated by a red LED located rightmost on the front of the chassis.
Red LED indicating failure for one of the power supplies.
PROBE USERS' MANUAL VERSION 5.0
2014 © BRIDGE Technologies Co AS - Bentsebrugata 20 - N-0476 Oslo, Norway - tel: +47 22 38 51 00 -
www.bridgetech.tv
16
Page 16
4.3.2 Cooling System
The chassis is equipped with six long-life fans that suck in air from front of the chassis.
The air exits at the back of the unit. The fans are temperature controlled, allowing
them to run at an optimum speed. Venting holes at the sides of the chassis provide an
optional air intake, ensuring good aerodynamical properties of the cooling air flow. It
is recommended, but not essential, that these venting holes are not covered.
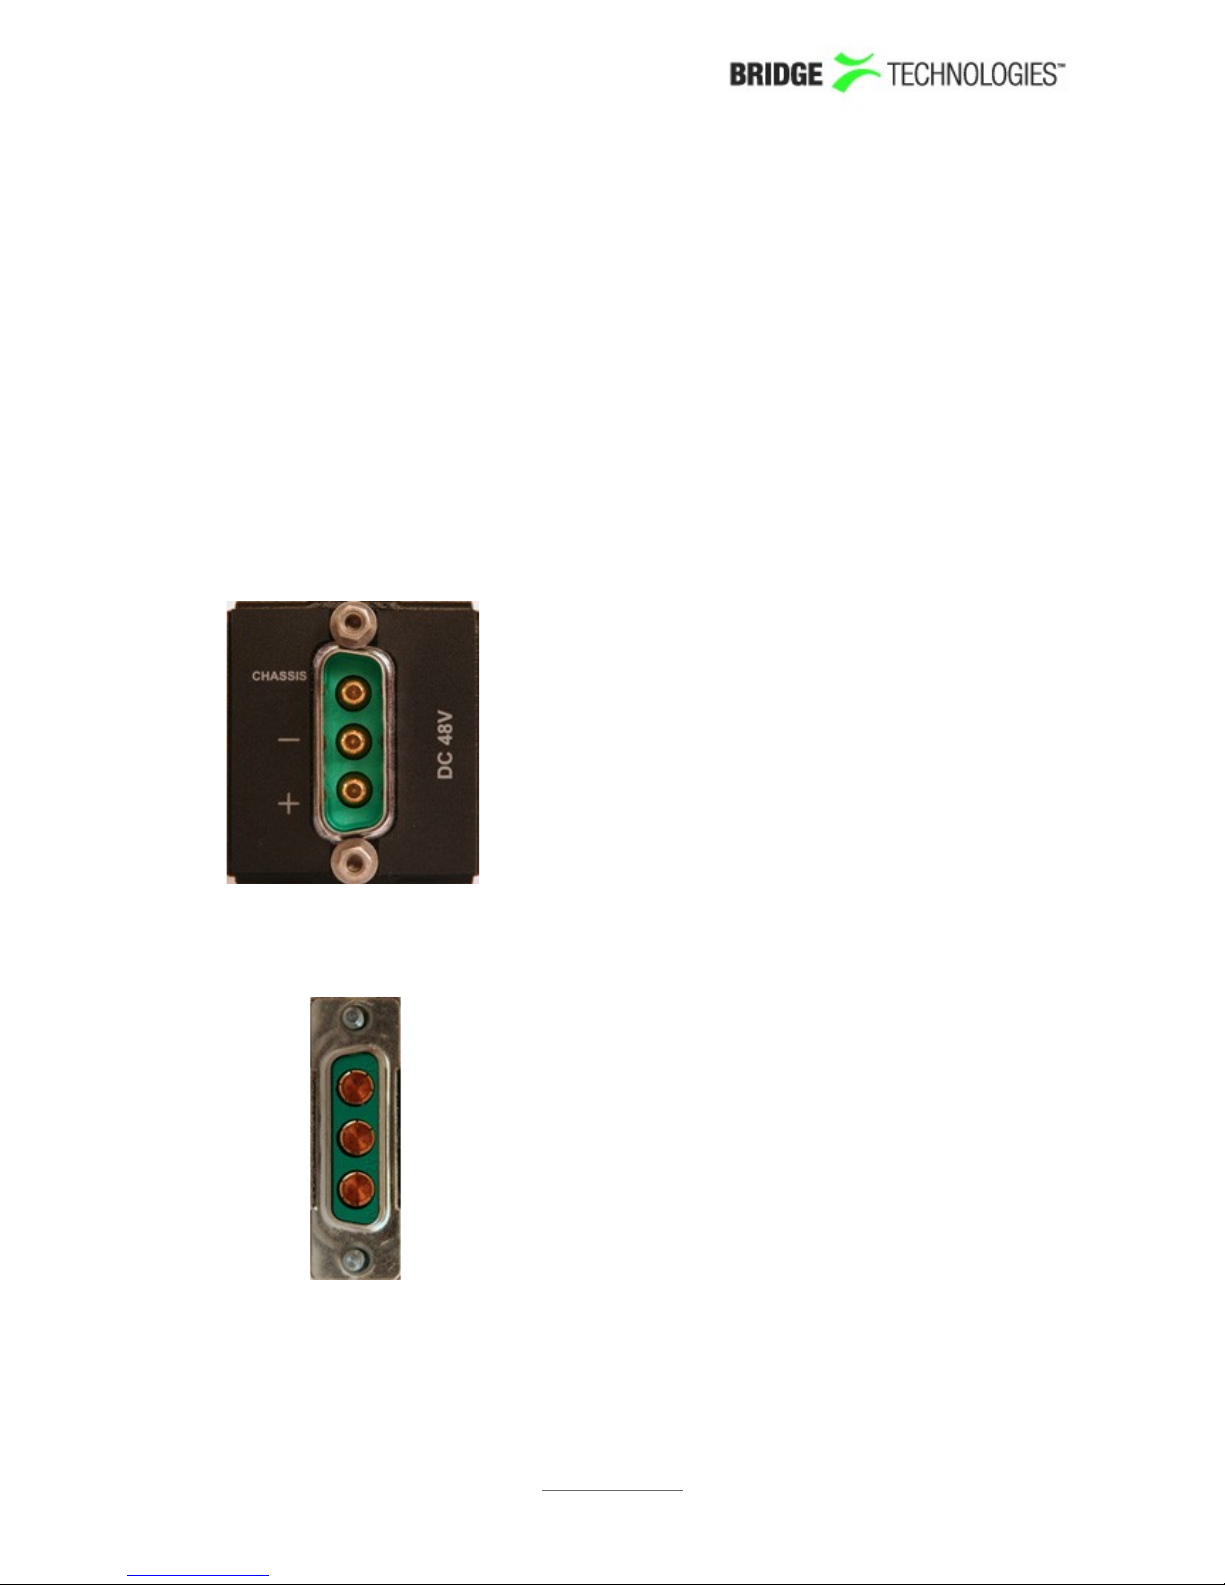
4.3.3 ECDC Power Supply
The ECDC unit is equipped with two -48V DC / 50W power inlet connectors. The power
plug is a male 3-PIN D-sub(15) connector. Matching female plugs are supplied with the
ECDC unit. This plug should be soldered to the power cable in accordance with the
drawing below.
The DCC Power conector on the chassis.
------------- A3 - Gnd
------------- A2 - Minus
--------------A1 - Plus
Soldering the Female 3-PIN D-sub(15) Connector to the Power Cable.
PROBE USERS' MANUAL VERSION 5.0
2014 © BRIDGE Technologies Co AS - Bentsebrugata 20 - N-0476 Oslo, Norway - tel: +47 22 38 51 00 -
www.bridgetech.tv
17
Page 17

4.4 Serial Number Location
The serial number of the Enhanced Chassis is located at the rear of the unit. The
serial numbers of the individual optional modules are located on the components side
of the modules. All serial numbers can also be found on the shipping box.
All modules except the demodulator interface modules have a serial number that is
available via the web GUI under About License.
PROBE USERS' MANUAL VERSION 5.0
2014 © BRIDGE Technologies Co AS - Bentsebrugata 20 - N-0476 Oslo, Norway - tel: +47 22 38 51 00 -
www.bridgetech.tv
18
Page 18
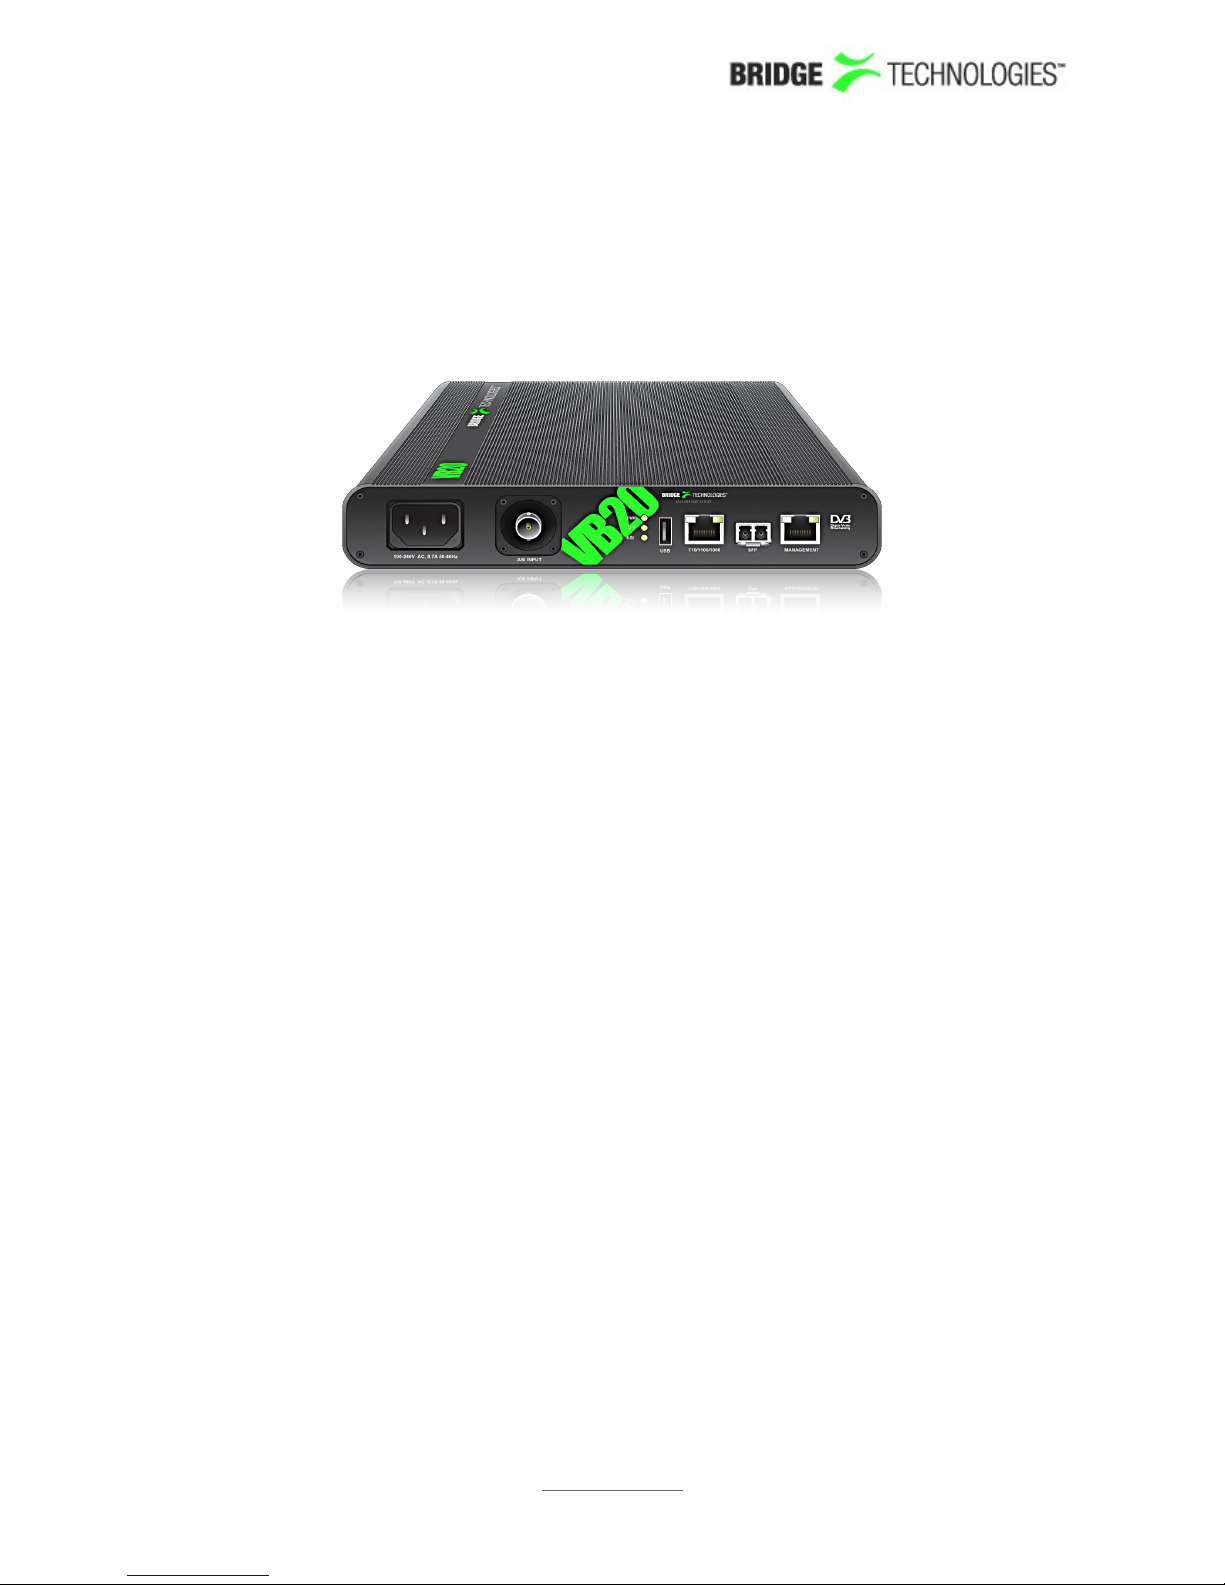
4.5 Portable chassis (VB20)
The VB20 portable probe is built for real world use. Its ruggedised exterior and fanless design gives engineers the perfect fault-finding tool when roaming in the network
or for permanent placement in a harsh environment.
4.5.1 AC Power Supply
The portable chassis is delivered with one built-in 100 – 240V AC / 40 W power supply.
4.5.2 Cooling System
The portable unit is equipped with fans that suck in air from front of the chassis. The
air exits at the back of the unit. It is recommended that the venting holes are not
covered up.
4.5.3 Serial number location
The serial number is located at the rear of the unit. All serial numbers can also be
found on the shipping box.
The serial number of the VB20 probe is also available via the web GUI under About
License.
4.5.4 Interfaces
The VB20 has Ethernet and ASI inputs.
PROBE USERS' MANUAL VERSION 5.0
2014 © BRIDGE Technologies Co AS - Bentsebrugata 20 - N-0476 Oslo, Norway - tel: +47 22 38 51 00 -
www.bridgetech.tv
19
Page 19
4.6 The ACC/DCC Hardware (VB220)
In the cases where redundant power supplies are not required the ACC and DCC
chassis options are suitable.
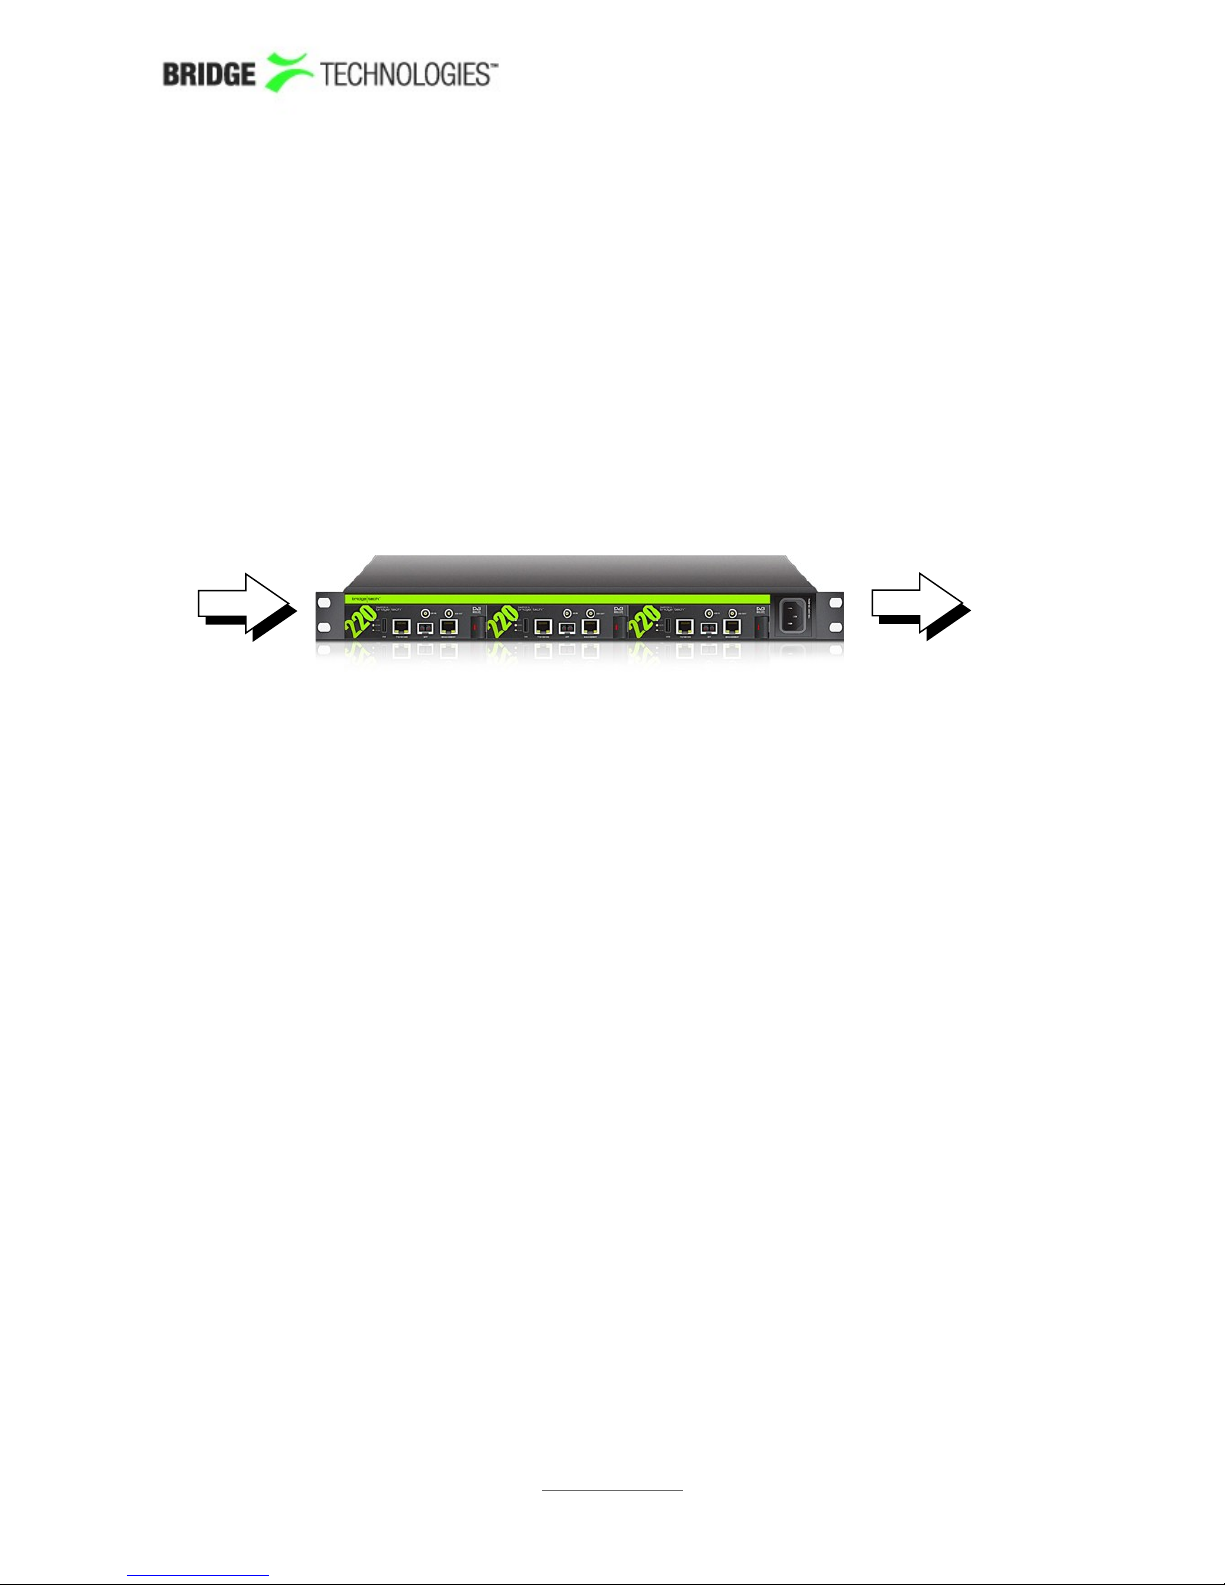
Each ACC or DCC unit consists of a 1RU chassis with 3 option slots. The unit can be
equipped with either a 100-240V AC power supply (ACC) or a -48V DC power supply
(DCC). The unit is forced air ventilated, the air flow going from left to right as seen
from the connector side of the unit. The maximum power consumption of the chassis
with optional modules is 50W. By default all connectors and the power plug are located
at the front of the unit. However the rack ears of the chassis may be moved to provide
for rear mounting of the unit. The rack ears are designed to support the weight of the
unit.
Figure 3: The ACC Unit with probe boards installed – Direction of Air Flow
4.6.1 Cooling System
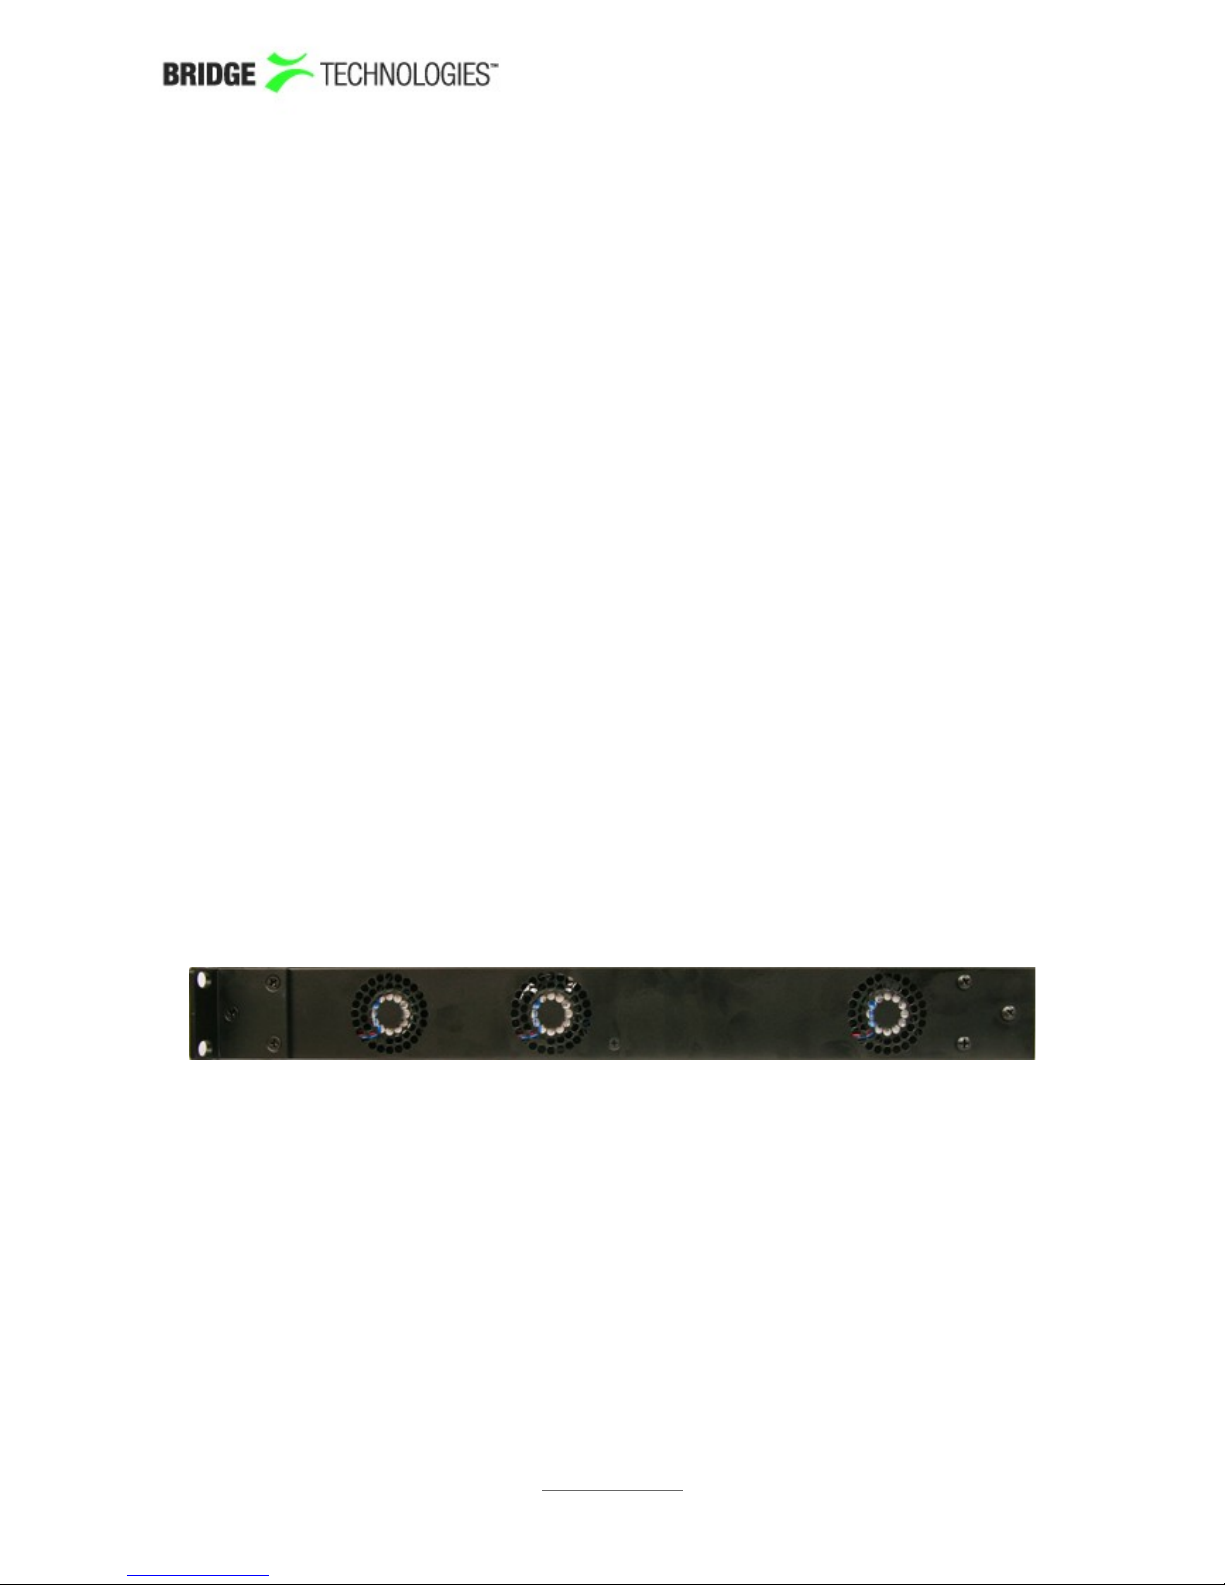
The chassis is equipped with three fans that suck in air from the left-hand side of the
chassis as seen in figure 3. The air exits on the right-hand side.
4.6.2 ACC Power Supply
The ACC unit is equipped with a 100-240V AC / 50W power supply.
PROBE USERS' MANUAL VERSION 5.0
2014 © BRIDGE Technologies Co AS - Bentsebrugata 20 - N-0476 Oslo, Norway - tel: +47 22 38 51 00 -
www.bridgetech.tv
20
Page 20
4.6.3 DCC Power Supply
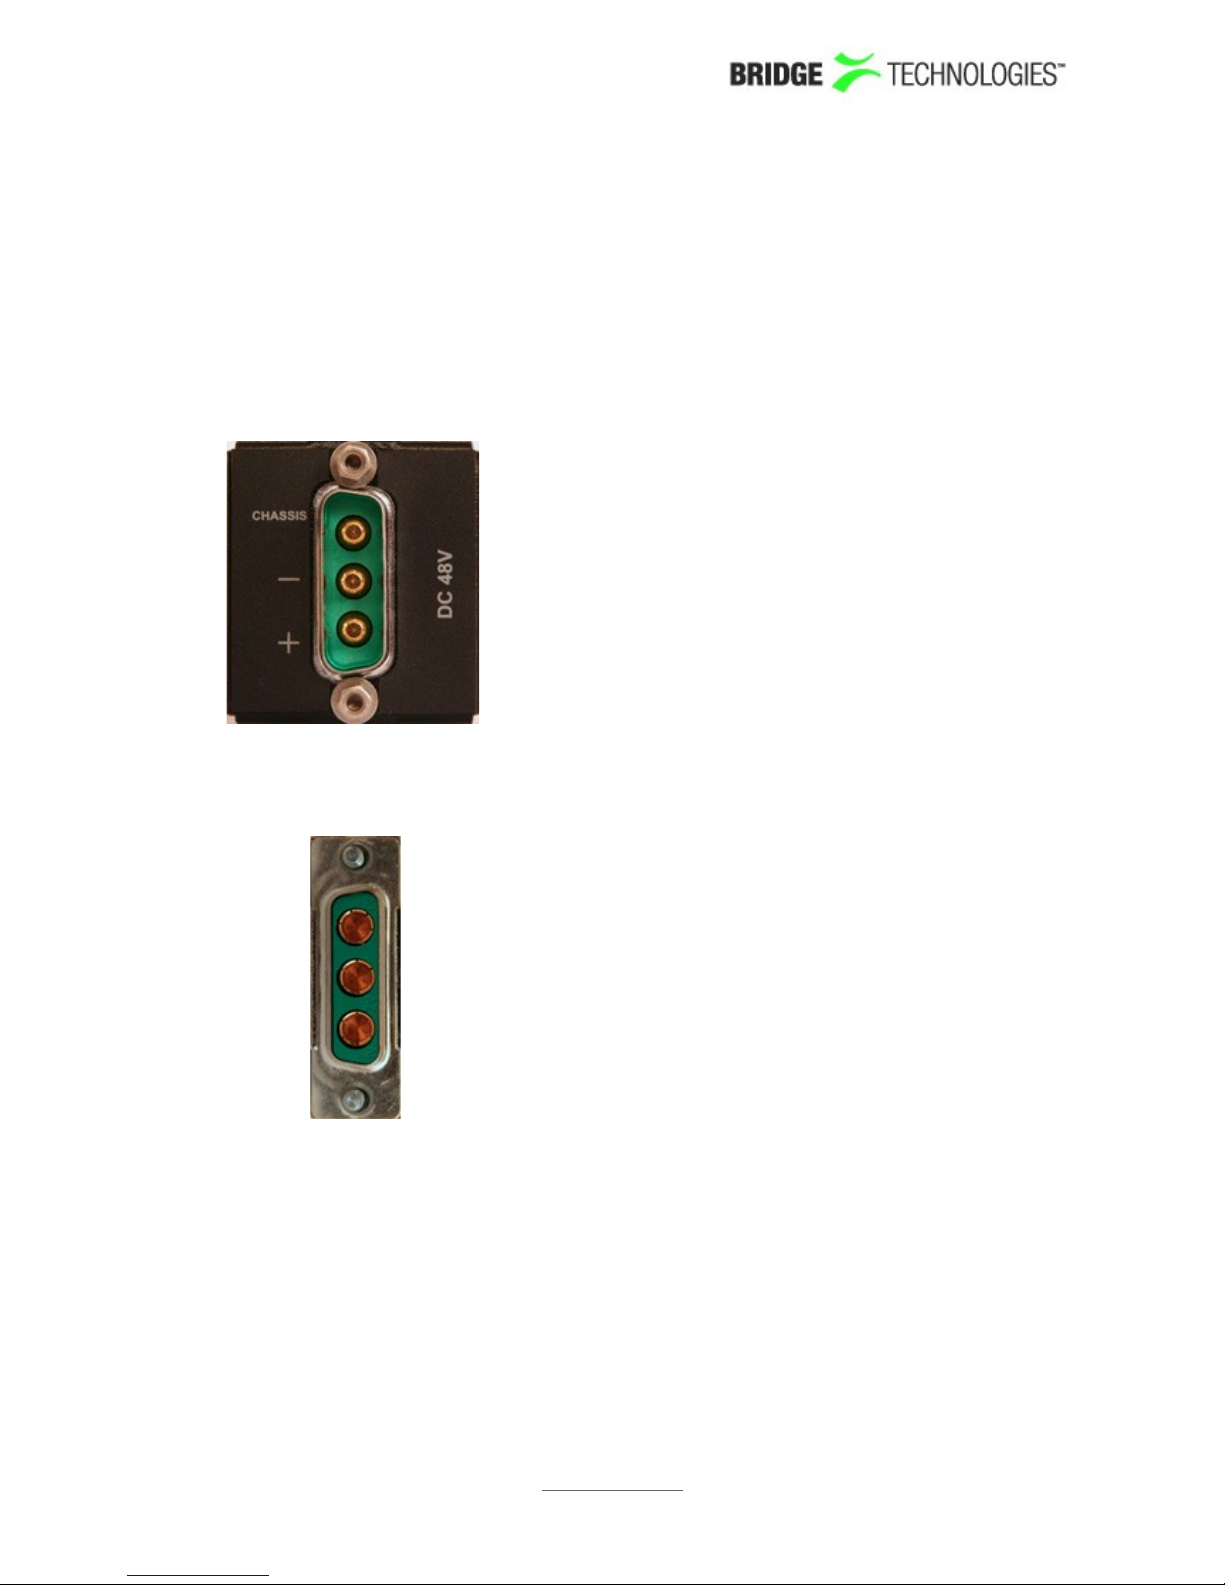
The DCC unit is equipped with a -48V DC / 50W power supply. The power plug is a
male 3-PIN D-sub(15) connector. A matching female plug is supplied with the DCC unit.
This plug should be soldered to the power cable in accordance with the drawing in
figure 5.
Figure 4: The DCC Power Plug
------------- A3 - Gnd
------------- A2 - Minus
--------------A1 - Plus
Figure 5: Soldering the Female 3-PIN D-sub(15) Connector to the Power Cable
4.6.4 Serial Number Location
The serial number of the ACC/DCC unit is located at the rear of the unit. The serial
numbers of the individual optional modules are located on the components side of the
modules. All serial numbers can also be found on the shipping box.
The serial number of the VB220 probe is also available via the web GUI under About
PROBE USERS' MANUAL VERSION 5.0
2014 © BRIDGE Technologies Co AS - Bentsebrugata 20 - N-0476 Oslo, Norway - tel: +47 22 38 51 00 -
www.bridgetech.tv
21
Page 21
License.
4.7 The Hardware Modules and Connectors (VB220)
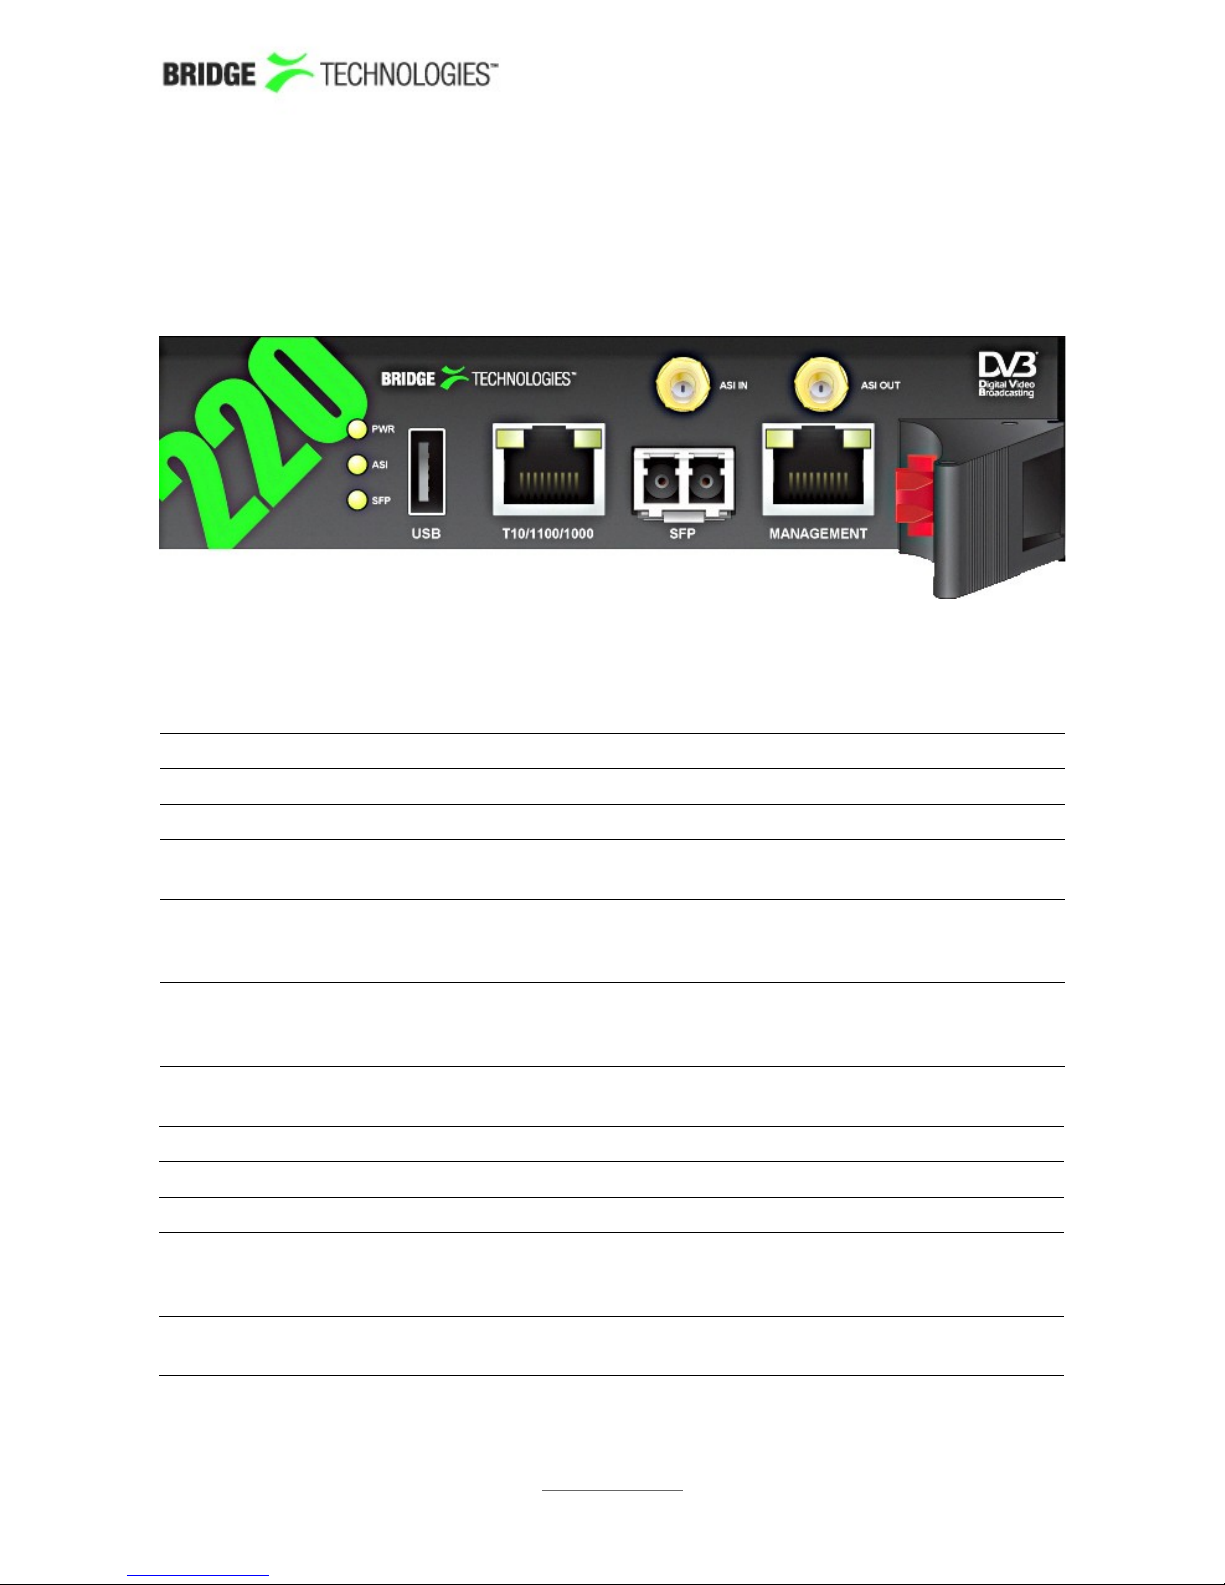
The probe module is equipped with the following connectors:
4.7.1 The Probe Module
USB: USB serial port emulator for initial set-up of the probe – Type A
ASI INPUT: ASI transport stream input – 75 ohm SMB female
ASI OUTPUT: ASI transport stream output – 75 ohm SMB female
SFP: Alternative SFP input used when connecting to optical
networks
T10/100/1000:
(Video – eth0)
For monitoring a 10/100/1000 electrical/copper signal – RJ-45.
The probe can only monitor either the SFP input signal OR the
T10/100/1000 input signal (selected from software).
MANAGEMENT:
(Management –
eth2)
For optionally running management of the probe on a separate
network – RJ-45. This interface supports T10/100.
A number of LEDs serve the following purposes:
POWER: Green power LED
ASI: Green LED indicating ASI sync
SFP LINK: Green LED indicating SFP link status
T10/100/1000: The green LED indicates link. The yellow LED indicates that the
interface is receiving data (RX). Both LEDs are off if input is
taken from the SFP module.
MANAGEMENT: The green LED indicates link. If the yellow LED is active the
speed is 100Mbps – otherwise the speed is 10Mbps.
PROBE USERS' MANUAL VERSION 5.0
2014 © BRIDGE Technologies Co AS - Bentsebrugata 20 - N-0476 Oslo, Norway - tel: +47 22 38 51 00 -
www.bridgetech.tv
22
Page 22
4.7.2 The VB242 ASI Input Module (VB220 option)
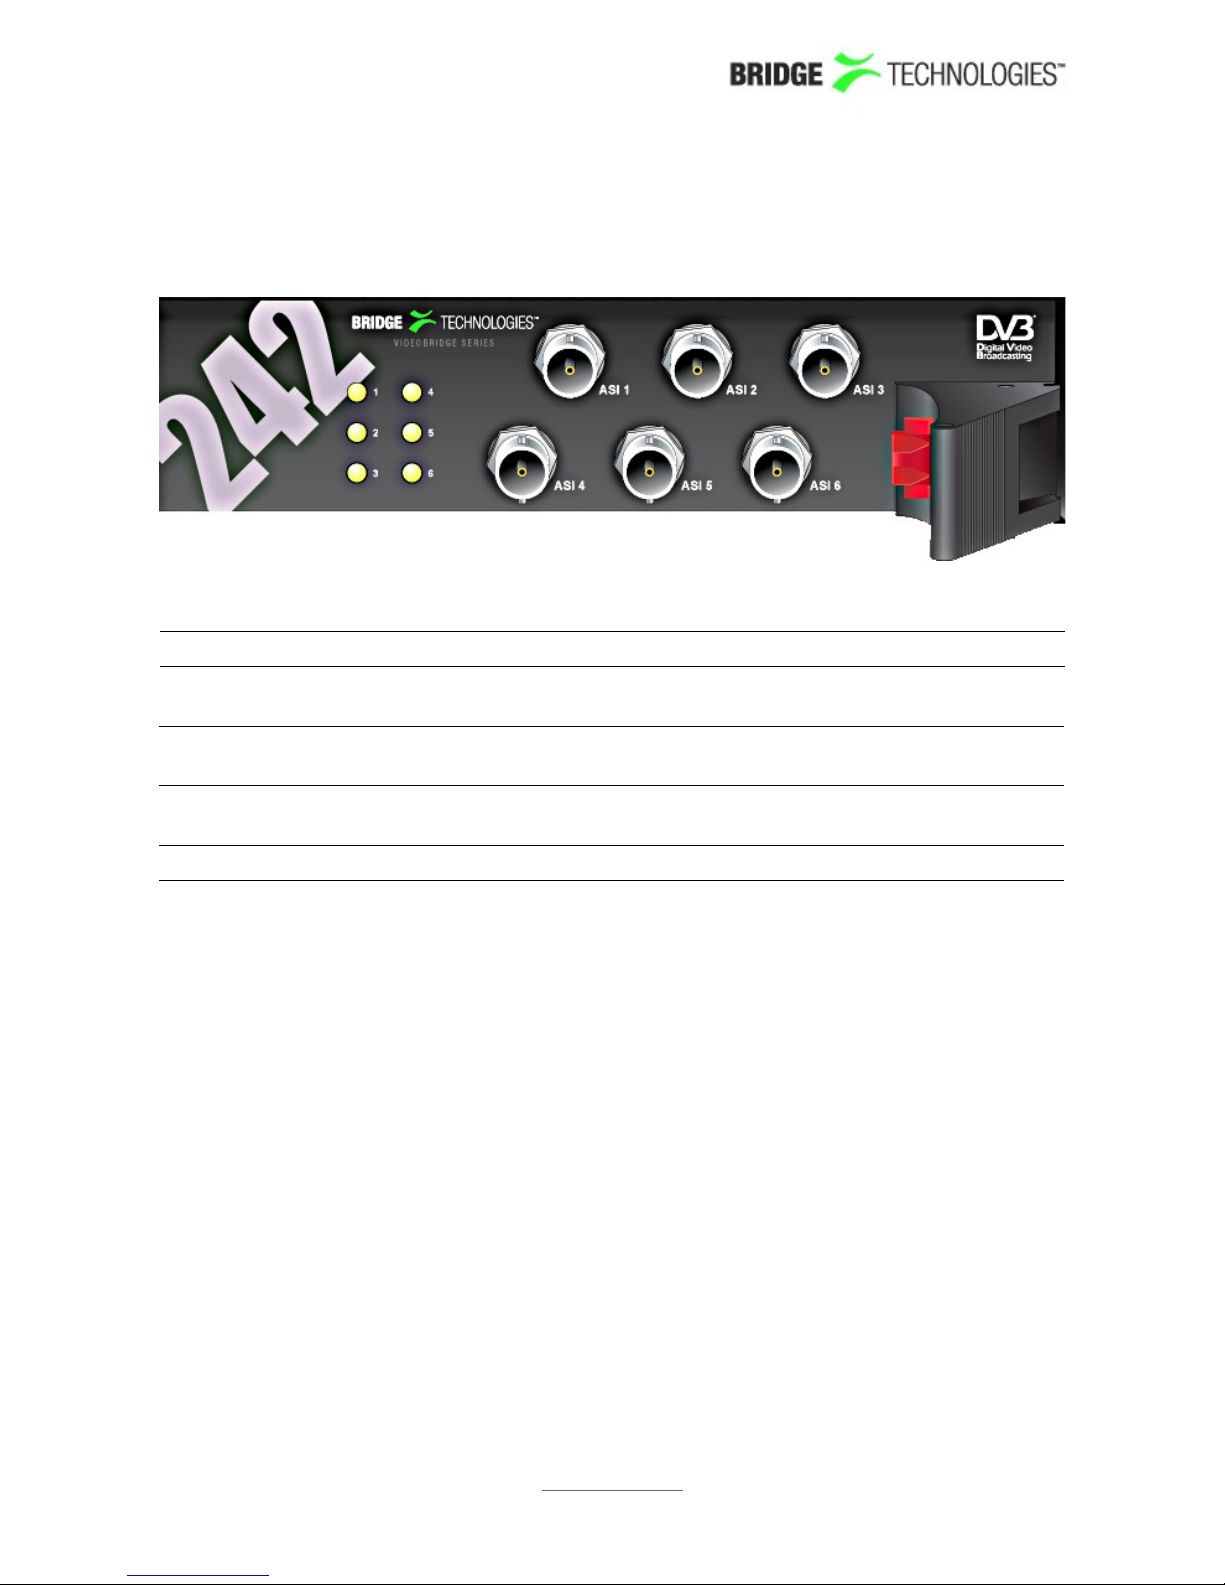
The VB242 module is equipped with the following connectors:
ASI 1 - 6 : ASI transport stream input – 75 ohm BNC female
For each ASI input an associated LED indicates current status:
GREEN: The associated ASI input is currently being monitored and
there is ASI sync.
RED: The associated ASI input is currently being monitored and
there is not ASI sync.
ORANGE: The associated ASI input is not currently being monitored.
The VB242 module operates by default in continuous mode where the connectors ASI1
and ASI2 are transmitted across the backplane of the chassis to the probe module for
continuous analysis.
Alternatively the VB242 module can be configured through the web GUI to operate in
round-robin mode where the inputs ASI1 through to ASI6 are brought across the
backplane one at a time for further analysis.
PROBE USERS' MANUAL VERSION 5.0
2014 © BRIDGE Technologies Co AS - Bentsebrugata 20 - N-0476 Oslo, Norway - tel: +47 22 38 51 00 -
www.bridgetech.tv
23
Page 23
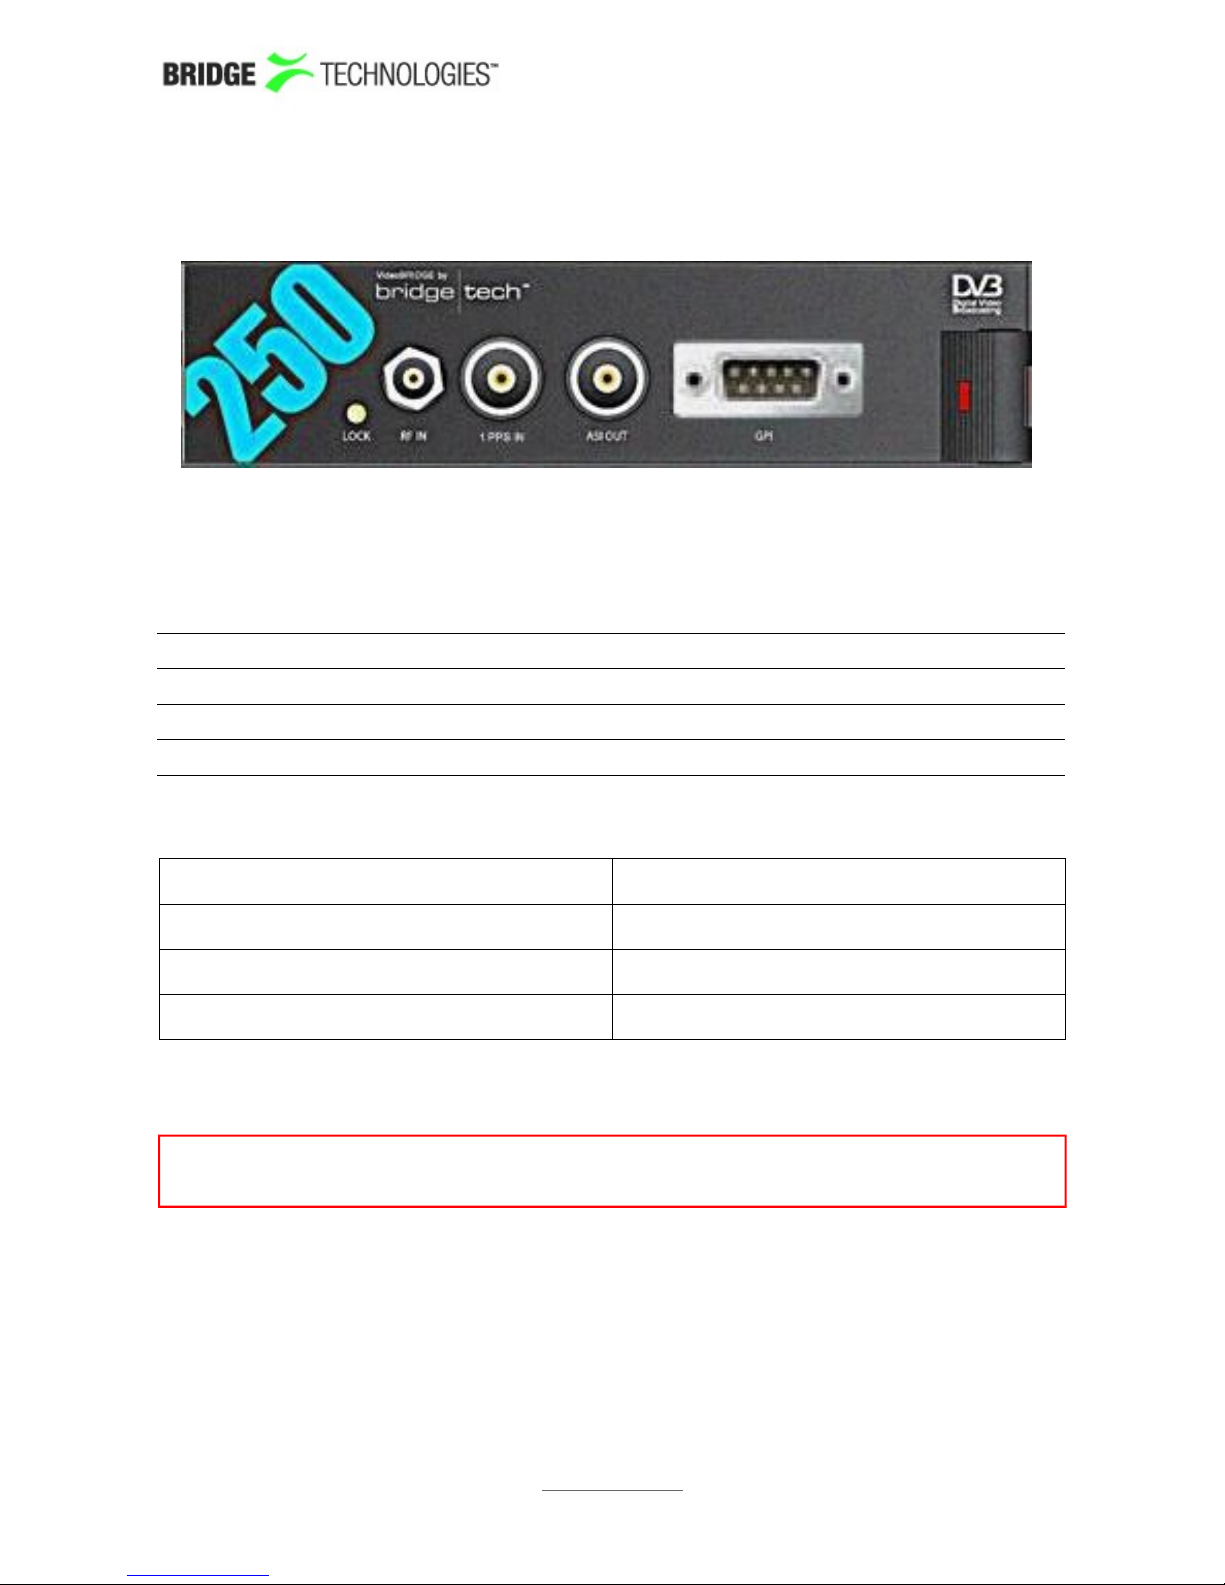
4.7.3 The VB250 COFDM Demodulator Module (VB220 Option)
The VB250 COFDM demodulator is an optional input interface module.
The connectors are:
RF IN: RF input – 75 ohm F-connector
1PPS IN: 1PPS reference clock input - 50 ohm BNC female
ASI OUT: ASI transport stream output – 75 ohm BNC female
GPI: Alarm relay output – 9 PIN D-sub male
GPI – Pinout of alarm relay output (to be implemented)
Normal operation Alarm/Power off
Pins 6-7: Contacts closed Pins 6-7: No connection
Pins 7-8: No connection Pins 7-8: Contacts closed
Pin 5: Gnd Pin 5: Gnd
An LED indicates whether the demodulator locks to the incoming RF signal or not.
Note that the 1PPS signal from the mid-slot is used as reference for all COFDM input
signals if the chassis is equipped with two VB250 interface modules.
The VB250 module was made end-of-life in 2010 and is now superseeded by the
VB252 dual DVB-T/T2 input module.
PROBE USERS' MANUAL VERSION 5.0
2014 © BRIDGE Technologies Co AS - Bentsebrugata 20 - N-0476 Oslo, Norway - tel: +47 22 38 51 00 -
www.bridgetech.tv
24
Page 24
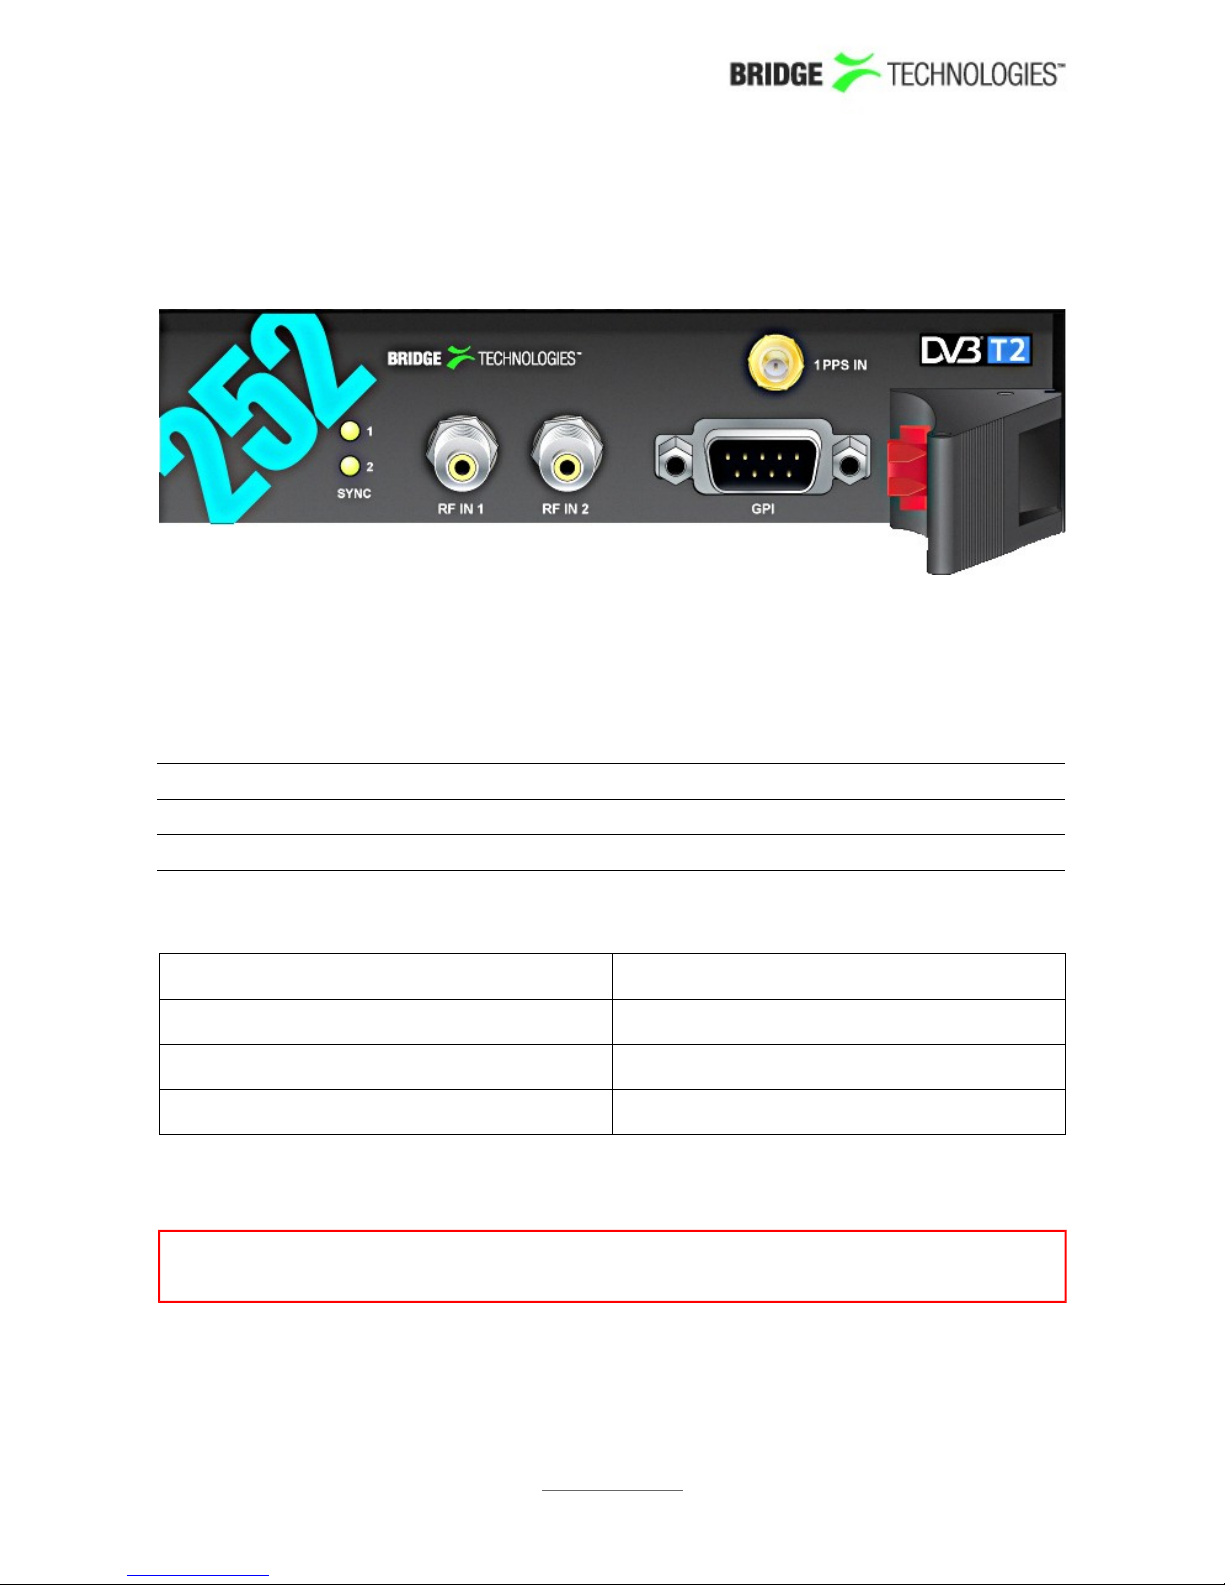
4.7.4 The VB252 COFDM Dual Demodulator Module (VB220 Option)
The VB252 COFDM demodulator is an optional input interface module. It supports DVBT and DVB-T2. It has two RF inputs; one or two of these are enabled according to probe
licensing.
The connectors are:
RF IN: RF input – 75 ohm F-connector
1PPS IN: 1PPS reference clock input - 50 ohm BNC female
GPI: Alarm relay output – 9 PIN D-sub male
GPI – Pinout of alarm relay output (to be implemented)
Normal operation Alarm/Power off
Pins 6-7: Contacts closed Pins 6-7: No connection
Pins 7-8: No connection Pins 7-8: Contacts closed
Pin 5: Gnd Pin 5: Gnd
An LED indicates whether the demodulator locks to the incoming RF signal or not.
Note that the 1PPS signal from the mid-slot is used as reference for all COFDM input
signals if the chassis is equipped with two VB252 interface modules.
PROBE USERS' MANUAL VERSION 5.0
2014 © BRIDGE Technologies Co AS - Bentsebrugata 20 - N-0476 Oslo, Norway - tel: +47 22 38 51 00 -
www.bridgetech.tv
25
Page 25
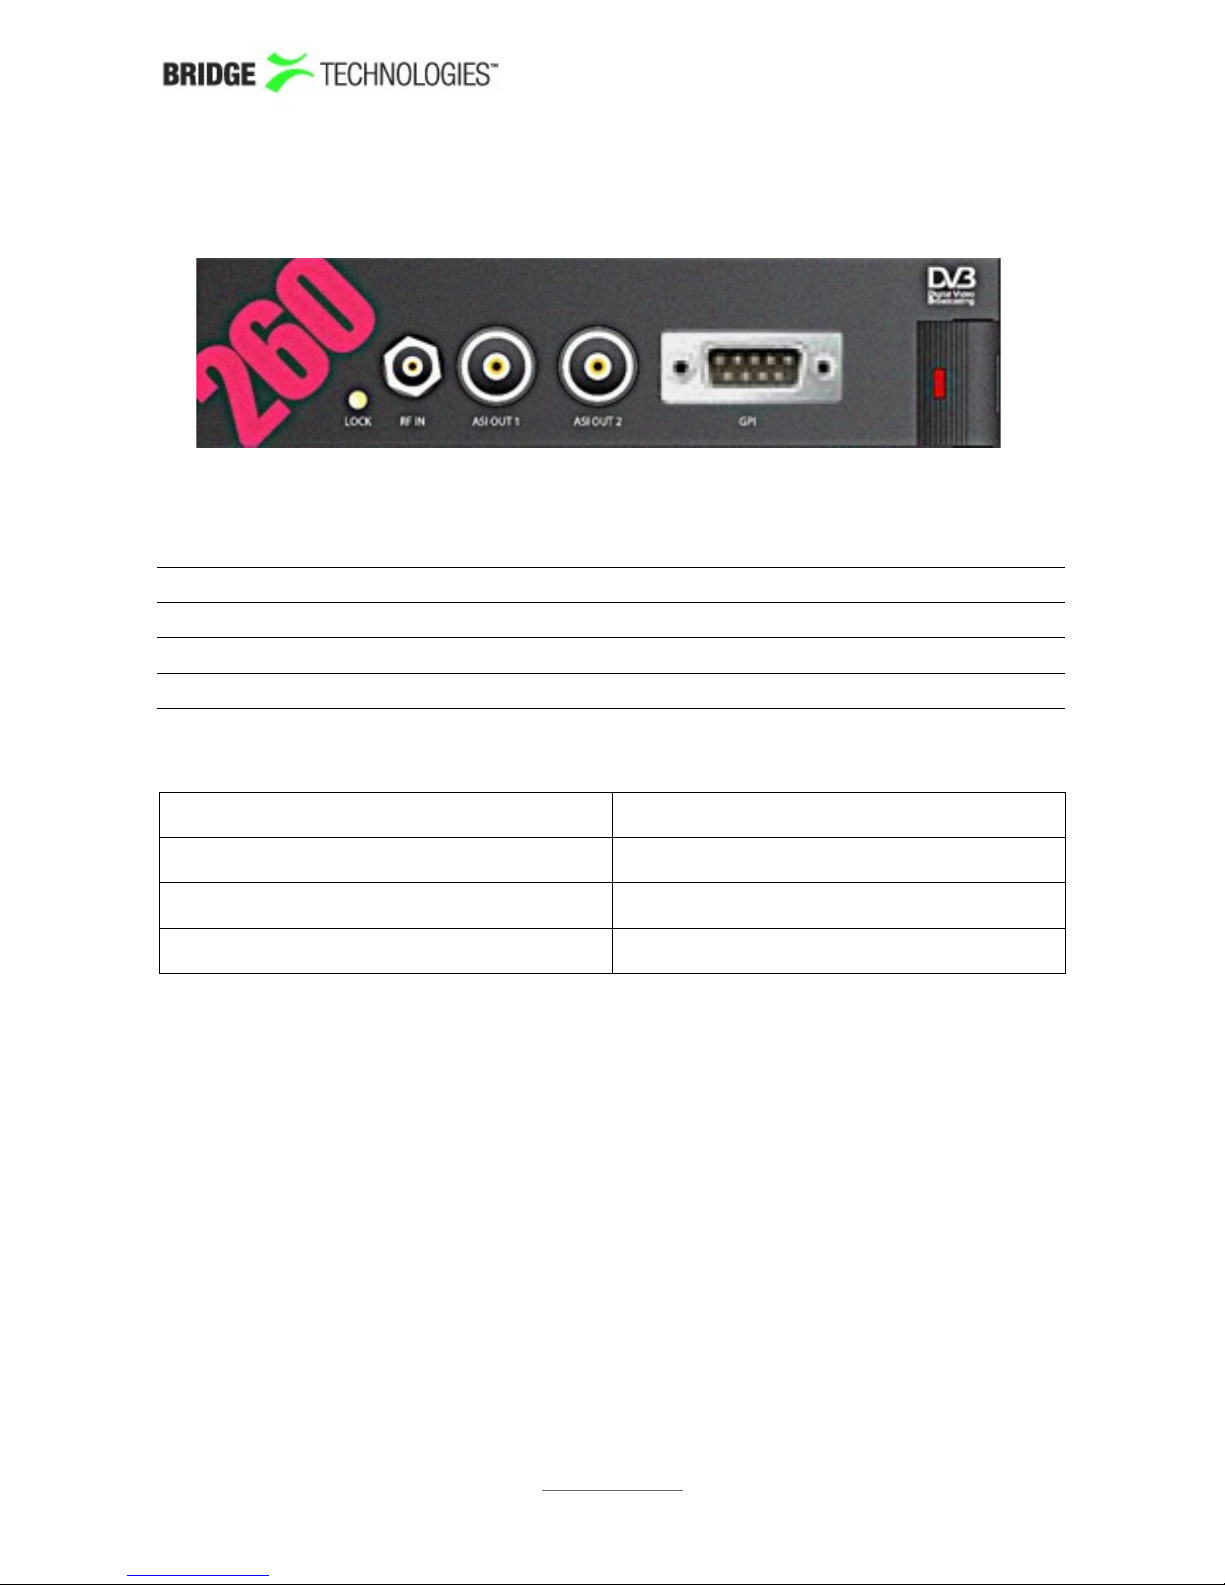
4.7.5 The VB260 QAM Demodulator Module(VB220 Option)
The VB260 DVB-C QAM demodulator is an optional input interface module.
The connectors are:
RF IN: RF input – 75 ohm F-connector
ASI OUTPUT 1: ASI transport stream output – 75 ohm BNC female
ASI OUTPUT 2: ASI transport stream output – 75 ohm BNC females
GPI: Alarm relay output – 9 PIN D-sub male
GPI – Pinout of alarm relay output (to be implemented)
Normal operation Alarm/Power off
Pins 6-7: Contacts closed Pins 6-7: No connection
Pins 7-8: No connection Pins 7-8: Contacts closed
Pin 5: Gnd Pin 5: Gnd
An LED indicates whether the demodulator locks to the incoming RF signal or not.
The VB260 module was made end-of-life in 2010 and is now superseeded by the
VB262 dual RF input ITU-T J.83 Annex A/B/C QAM/8VSB module.
PROBE USERS' MANUAL VERSION 5.0
2014 © BRIDGE Technologies Co AS - Bentsebrugata 20 - N-0476 Oslo, Norway - tel: +47 22 38 51 00 -
www.bridgetech.tv
26
Page 26
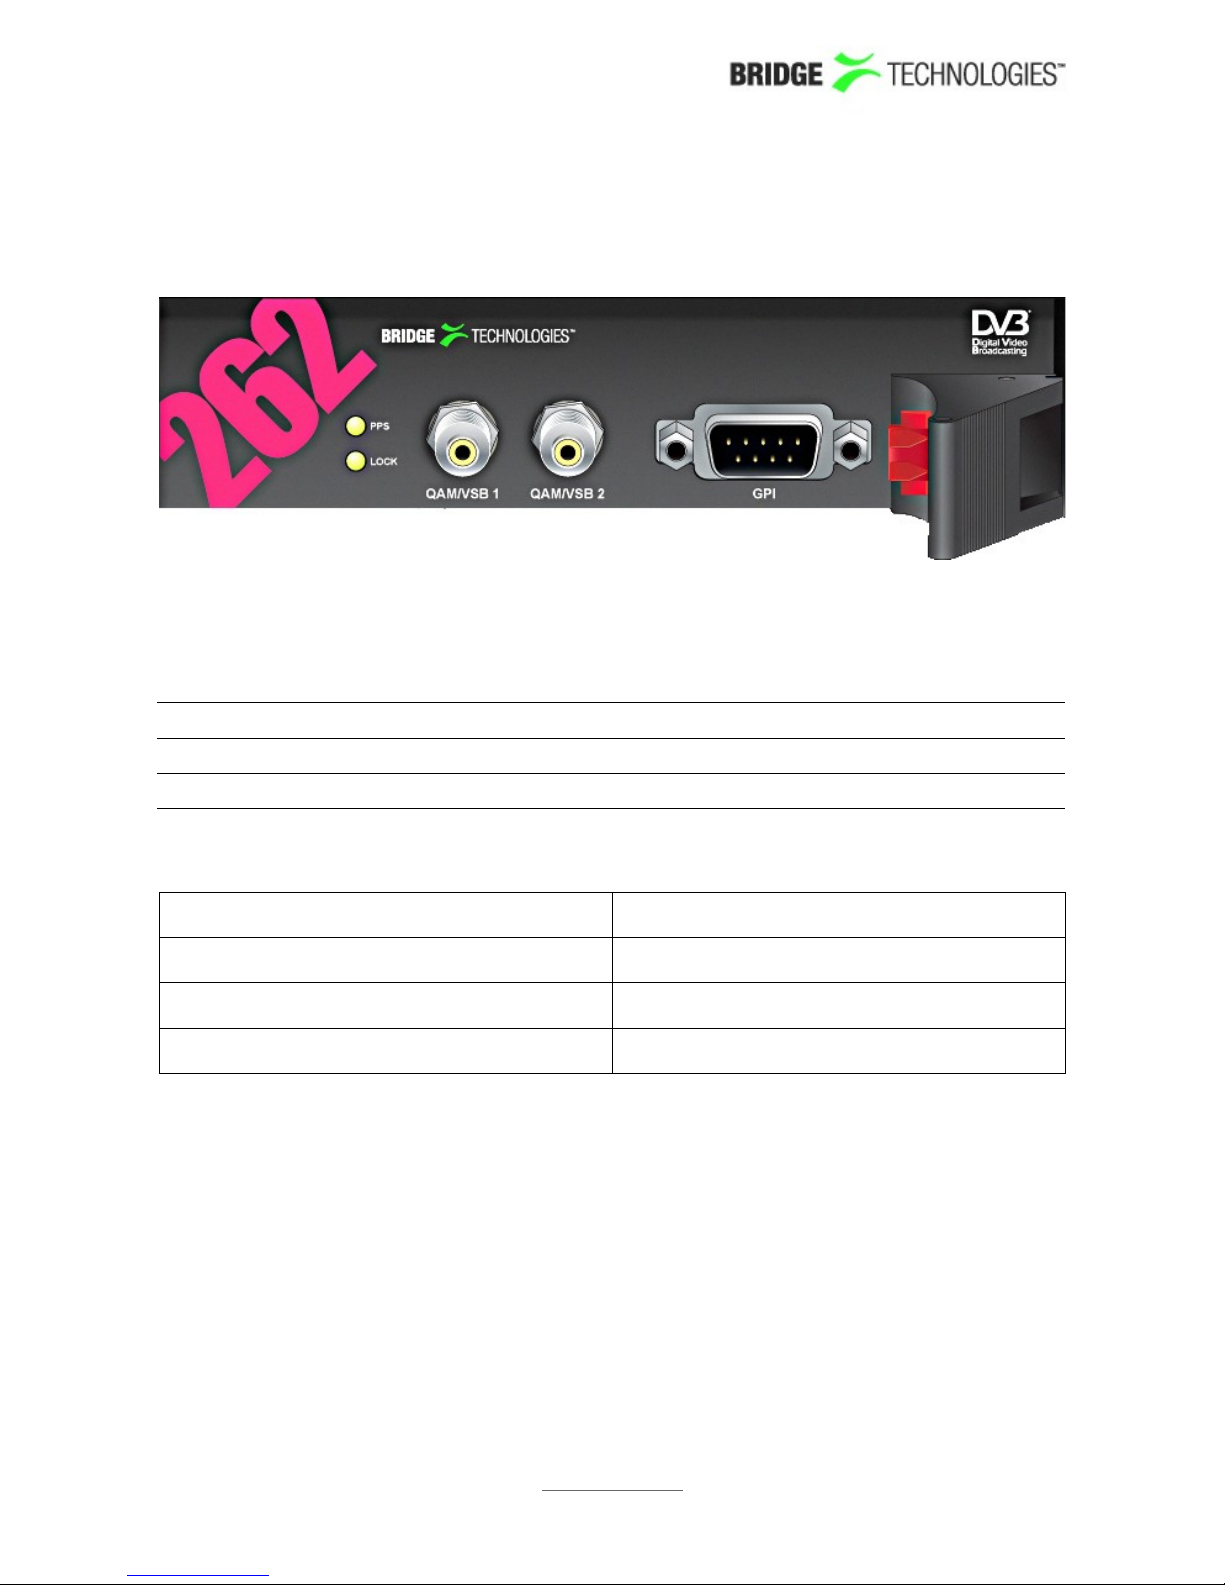
4.7.6 The VB262 Dual QAM/8VSB Demodulator Module (VB220 Option)
The VB262 QAM/8VSB demodulator is an optional input interface module. It has two RF
inputs; one or two of these are enabled according to probe licensing.
The connectors are:
QAM/VSB 1: RF input – 75 ohm F-connector
QAM/VSB 2: RF input – 75 ohm F-connector
GPI: Alarm relay output – 9 PIN D-sub male
GPI – Pinout of alarm relay output (to be implemented)
Normal operation Alarm/Power off
Pins 6-7: Contacts closed Pins 6-7: No connection
Pins 7-8: No connection Pins 7-8: Contacts closed
Pin 5: Gnd Pin 5: Gnd
Two LEDs indicate whether the demodulators lock to the incoming RF signals or not.
PROBE USERS' MANUAL VERSION 5.0
2014 © BRIDGE Technologies Co AS - Bentsebrugata 20 - N-0476 Oslo, Norway - tel: +47 22 38 51 00 -
www.bridgetech.tv
27
Page 27
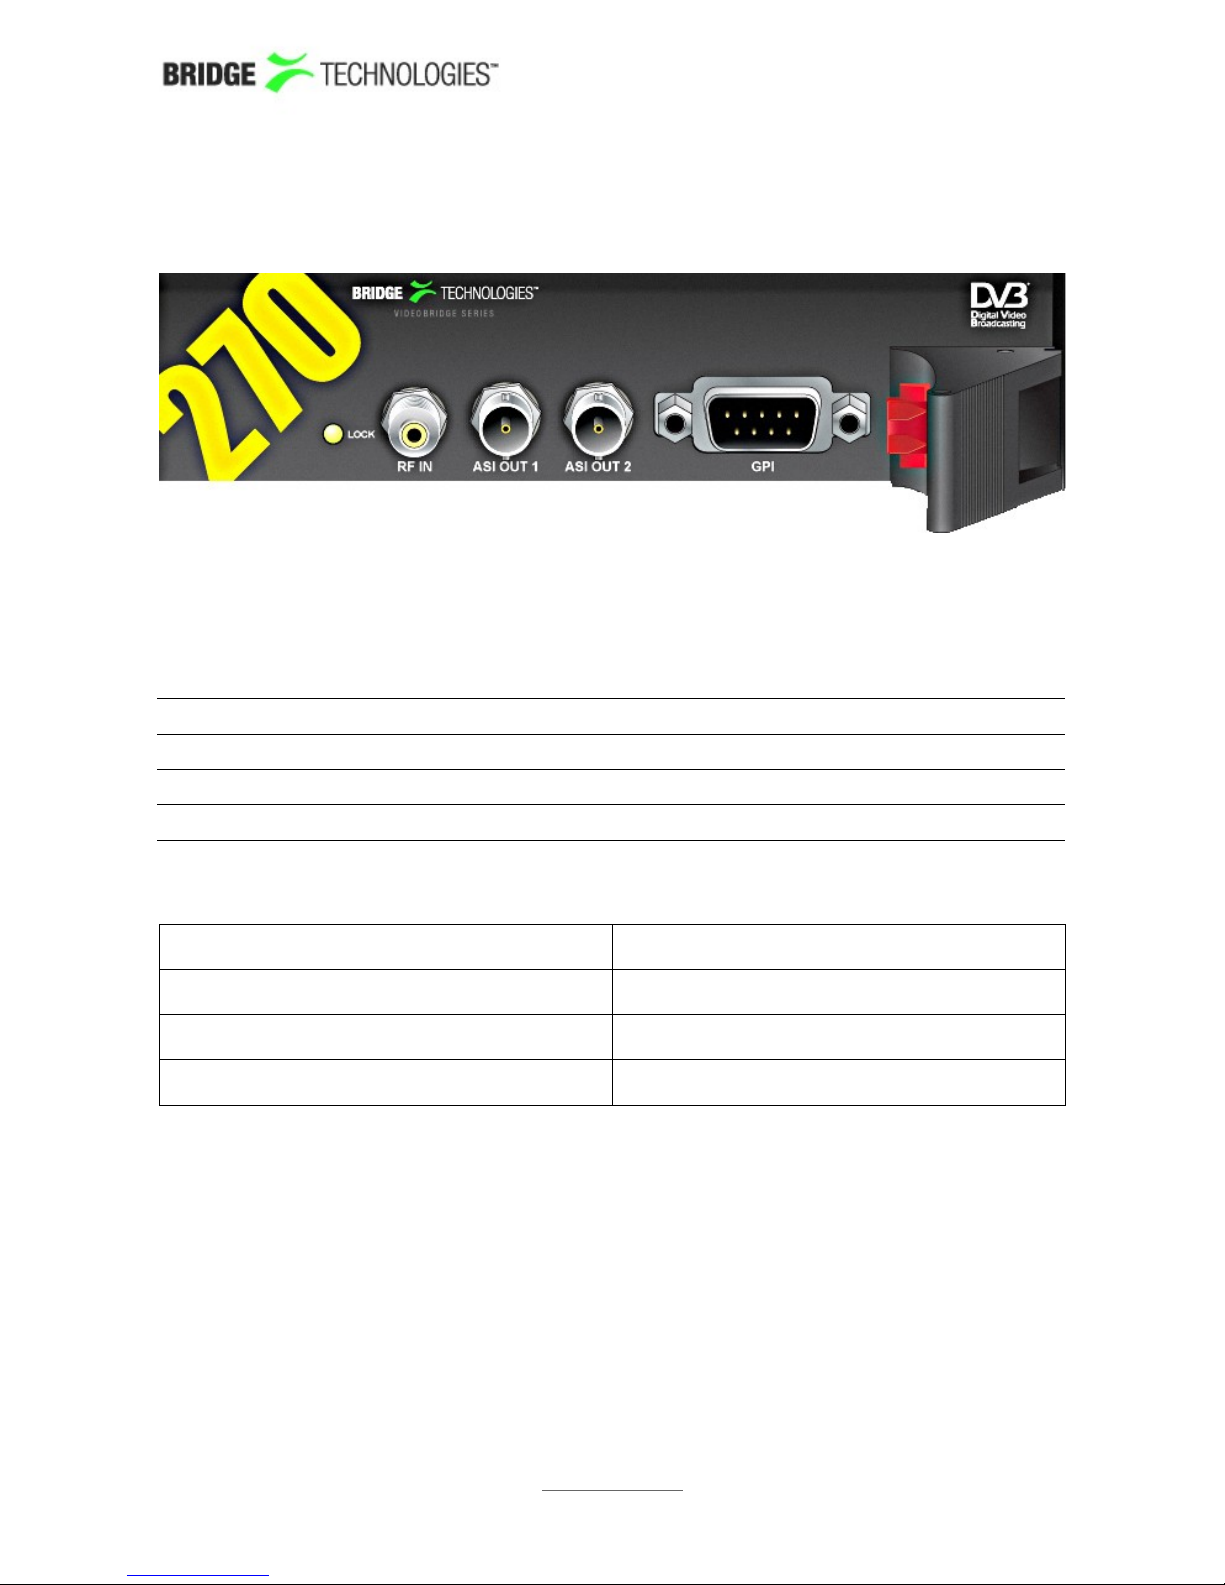
4.7.7 The VB270 DVB-S/S2 Demodulator Module (VB220 Option)
The VB270 DVB-S/S2 Demodulator is an optional input interface module capable of
QPSK (DVB-S) and 8PSK (DVB-S2).
The connectors are:
RF IN: RF L-band input input with DiSEqC 1.2 – 75 ohm F-connector
ASI OUT 1: ASI transport stream output – 75 ohm BNC female
ASI OUT 2: ASI transport stream output – 75 ohm BNC female
GPI: Alarm relay output – 9 PIN D-sub male
GPI – Pinout of alarm relay output (to be implemented)
Normal operation Alarm/Power off
Pins 6-7: Contacts closed Pins 6-7: No connection
Pins 7-8: No connection Pins 7-8: Contacts closed
Pin 5: Gnd Pin 5: Gnd
An LED indicates whether the demodulator locks to the incoming RF signal or not.
The VB270 option module was made end of life in 2013 and is now superseeded by
the VB272 dual DVB-S/S2 input module.
PROBE USERS' MANUAL VERSION 5.0
2014 © BRIDGE Technologies Co AS - Bentsebrugata 20 - N-0476 Oslo, Norway - tel: +47 22 38 51 00 -
www.bridgetech.tv
28
Page 28
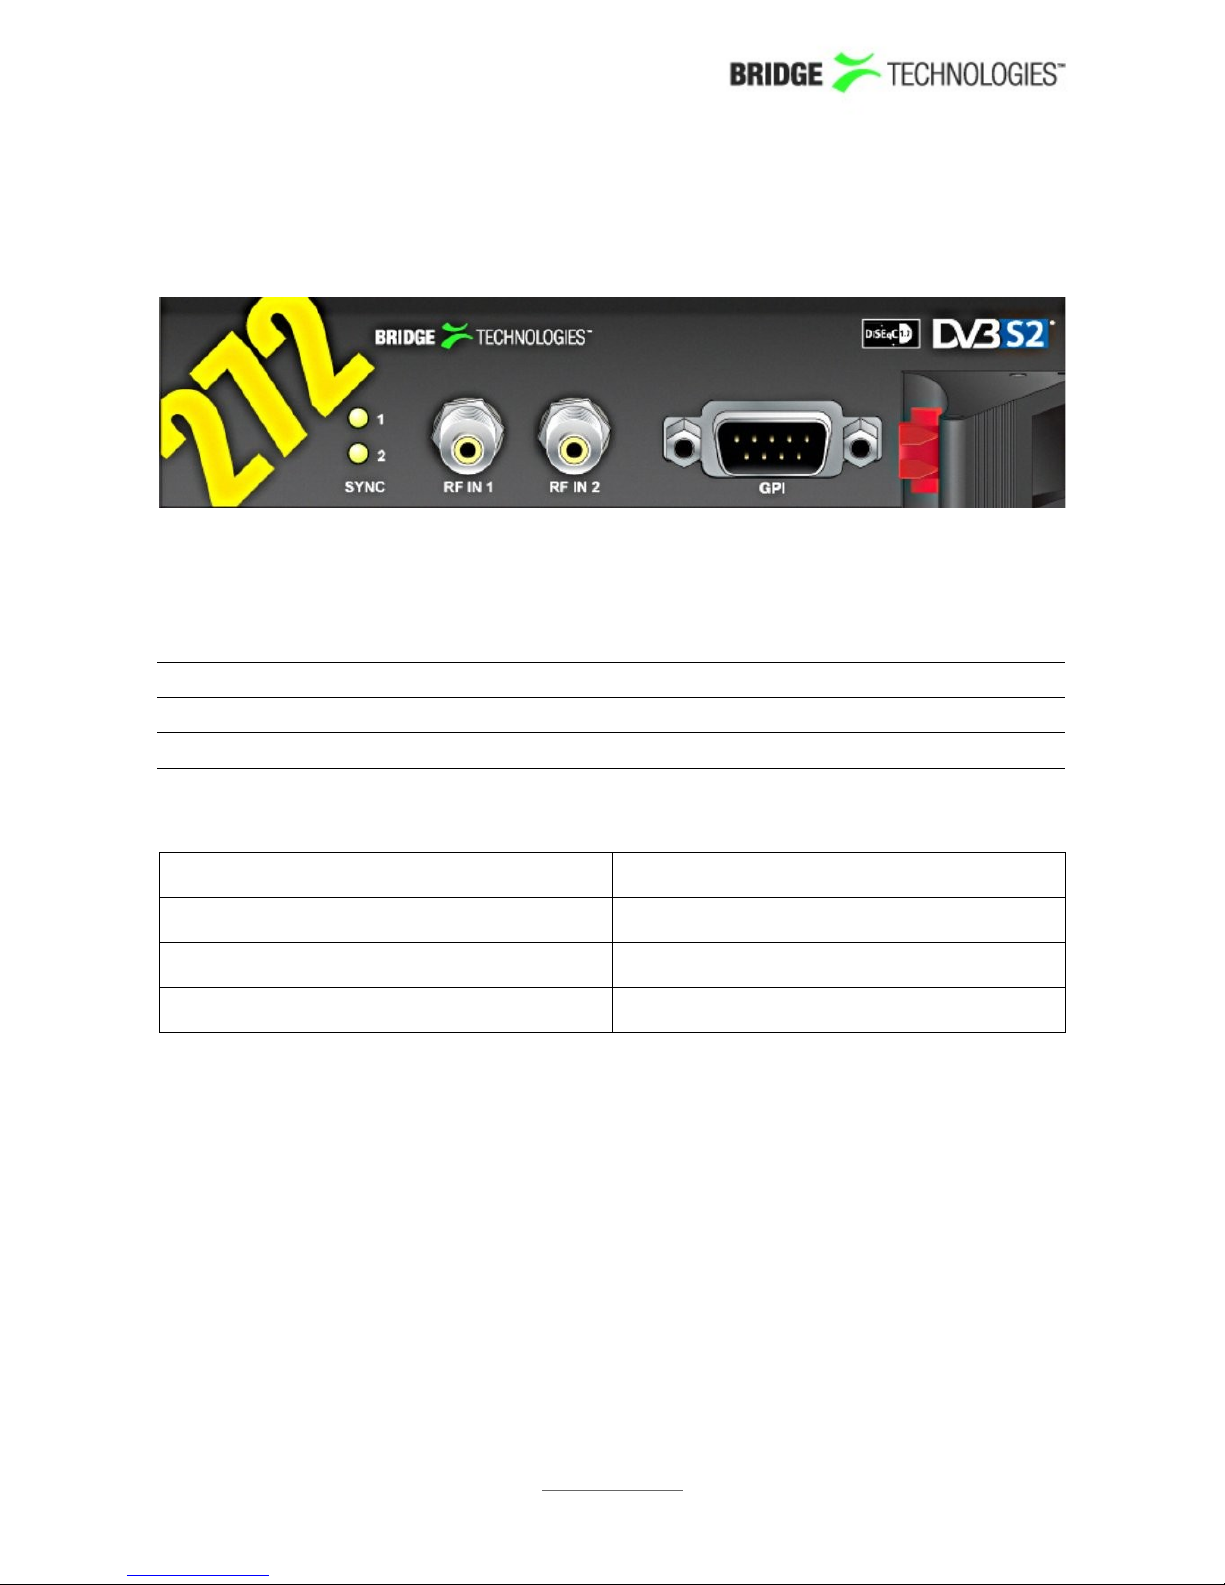
4.7.8 The VB272 dual DVB-S/S2 Demodulator Module (VB220 Option)
The VB272 DVB-S/S2 Demodulator is an optional input interface module capable of
receiving DVB-S (QPSK) and DVB-S2 (8PSK, 16APSK, 32APSK) signals. The module has
two RF inputs. The second input can be activated through a software option key.
The connectors are:
DVB-S/S2 1: RF L-band input with DiSEqC 1.2 – 75 ohm F-connector
DVB-S/S2 2: RF L-band input with DiSEqC 1.2 – 75 ohm F-connector
GPI: Alarm relay output – 9 PIN D-sub male
GPI – Pinout of alarm relay output (to be implemented)
Normal operation Alarm/Power off
Pins 6-7: Contacts closed Pins 6-7: No connection
Pins 7-8: No connection Pins 7-8: Contacts closed
Pin 5: Gnd Pin 5: Gnd
Two LEDs indicate whether the demodulators lock to the incoming RF signals or not.
PROBE USERS' MANUAL VERSION 5.0
2014 © BRIDGE Technologies Co AS - Bentsebrugata 20 - N-0476 Oslo, Norway - tel: +47 22 38 51 00 -
www.bridgetech.tv
29
Page 29

4.7.9 The VB273 DVB-S/S2 Redundancy switch (VB220 Option)
The VB273 DVB-S/S2 satellite IF redundancy switch is an input module capable of
automatically switching between two IF input signals for redundancy purposes. It is
meant to be paired with a VB272-SMA DVB-S/S2 input module described in an earlier
section. The VB273 module has two 75 Ohm BNC IF inputs; one 75 Ohm BNC IF output
and two 50 Ohm SMA RF outputs.
The module contains two built-in upconverters to L-band for monitoring purposes. The
L-band signal versions of the input IF signals are available on the two 50 ohm SMA
connectors marked RF OUT 1 and RF OUT 2. These signals are permanently connected
via supplied loop cables to the neighbouring VB272 Satellite input module.
Chassis setup:
A VB120 or VB220 (Controller card) must be in the leftmost slot in the chassis, the
VB272-SMA must be placed in the middle slot and the 273 blade in the slot to the
right. The RF out 1 and RF out 2 should be connected to their corresponding
connector on the VB272 blade.
The VB273 is built with high reliability and redundancy in mind. The switching
operation is performed by robust bistable relays. This means that if the power should
disappear from the chassis or even if the VB273 module is pulled out of the chassis
the signal path remains in its latched position.
The module is remote controllable via the GUI and in addition there is a button
interface consisting of 3 push buttons for manual override, this is futher explained in
the chapter regarding Satellite Redundancy(6.16).
LED indicators clearly show the current path of the IF signal as well as the operating
mode of the module.
The connectors are:
IF in 1: 75 ohm female BNC for 70 MHz IF signals as found in satellite
uplink scenarios. First input terminal. The input signal level
should lie in the range -15 dBm to 0 dBm in order to guarantee
a correct level on the upconverted RF out 1 terminal
PROBE USERS' MANUAL VERSION 5.0
2014 © BRIDGE Technologies Co AS - Bentsebrugata 20 - N-0476 Oslo, Norway - tel: +47 22 38 51 00 -
www.bridgetech.tv
30
Page 30

IF in 2: 75 ohm female BNC for 70 MHz IF signals as found in satellite
uplink scenarios. Second input terminal. The input signal level
should lie in the range -15 dBm to 0 dBm in order to guarantee
a correct level on the upconverted RF out 2 terminal
IF out: 75 ohm female BNC carrying either the IF-1 signal or the IF-2
signal depending on redundancy switch state. The insertion
loss through the relay is just below 1 dB.
RF out 1: 50 ohm SMA female RF L-band output version of the IF-1 input
signal centered at 1024 MHz + IF input signal frequency e.g.:
1094 MHz for 70 MHz IF input signal.
RF out 2: 50 ohm SMA RF L-band output version of the IF-2 input signal
centered at 1024 MHz + IF input signal frequency e.g.: 1094
MHz for a 70 MHz IF input signal.
The button interface is described in the table below
Push button Description
Input A / Primary Pushing this button ensures IF-1 is
switched to the output as well as
changing the operating mode to
"SuperLocal". The button lights up to
indicate the signal path.
Input B / Secondary Pushing this button ensures IF-2 is
switched to the output as well as
changing the operating mode to
"SuperLocal". The button lights up to
indicate the signal path.
Auto Pushing this button toggles the operating
mode of the module between "Auto"
(push button and it becomes lit) and
"Manual" (hold button until no light).
Button light slowly flashing indicates
operating mode "SuperLocal".
The VB273 operates in 3 distinct modes. These are:
• AUTO: The switching between A and B is done automatically based on the
switching criteria defined in the probe GUI. See chapter regarding satelite
redundancy(6.16).
• MANUAL: The switching between A and B is done manually from the GUI or from
PROBE USERS' MANUAL VERSION 5.0
2014 © BRIDGE Technologies Co AS - Bentsebrugata 20 - N-0476 Oslo, Norway - tel: +47 22 38 51 00 -
www.bridgetech.tv
31
Page 31

third party NMS systems using the Eii interface.
• SuperLocal: The switching between A and B can only be performed from the
front panel or the probe GUI. No further switching is possible from third party
NMS systems until the operating mode is changed to MANUAL or AUTO. This last
mode guarantees no interference from overlying software control systems and
is meant as an override mode in test and fault finding scenarios.
The operating mode can be directly seen via the light of the AUTO button:
• Off: Manual mode
• Permanently on: Auto mode
• Slowly flashing: SuperLocal mode.
Basic specifications:
IF frequency
range:
50 to 140 MHz
Main Line Loss: Typically 1 dB
Isolation: Typically 60 dB for 70-140 MHz.
Oscillator
feedthrough:
Typically -60 dBm at 1094 MHz
IF connectors: BNC, female, 75 ohm
RF connectors: SMA, female, 50 ohm
RF test output
level:
Typically -22 dB
RF frequency: IF frequency + 1024 Mhz
PROBE USERS' MANUAL VERSION 5.0
2014 © BRIDGE Technologies Co AS - Bentsebrugata 20 - N-0476 Oslo, Norway - tel: +47 22 38 51 00 -
www.bridgetech.tv
32
Page 32
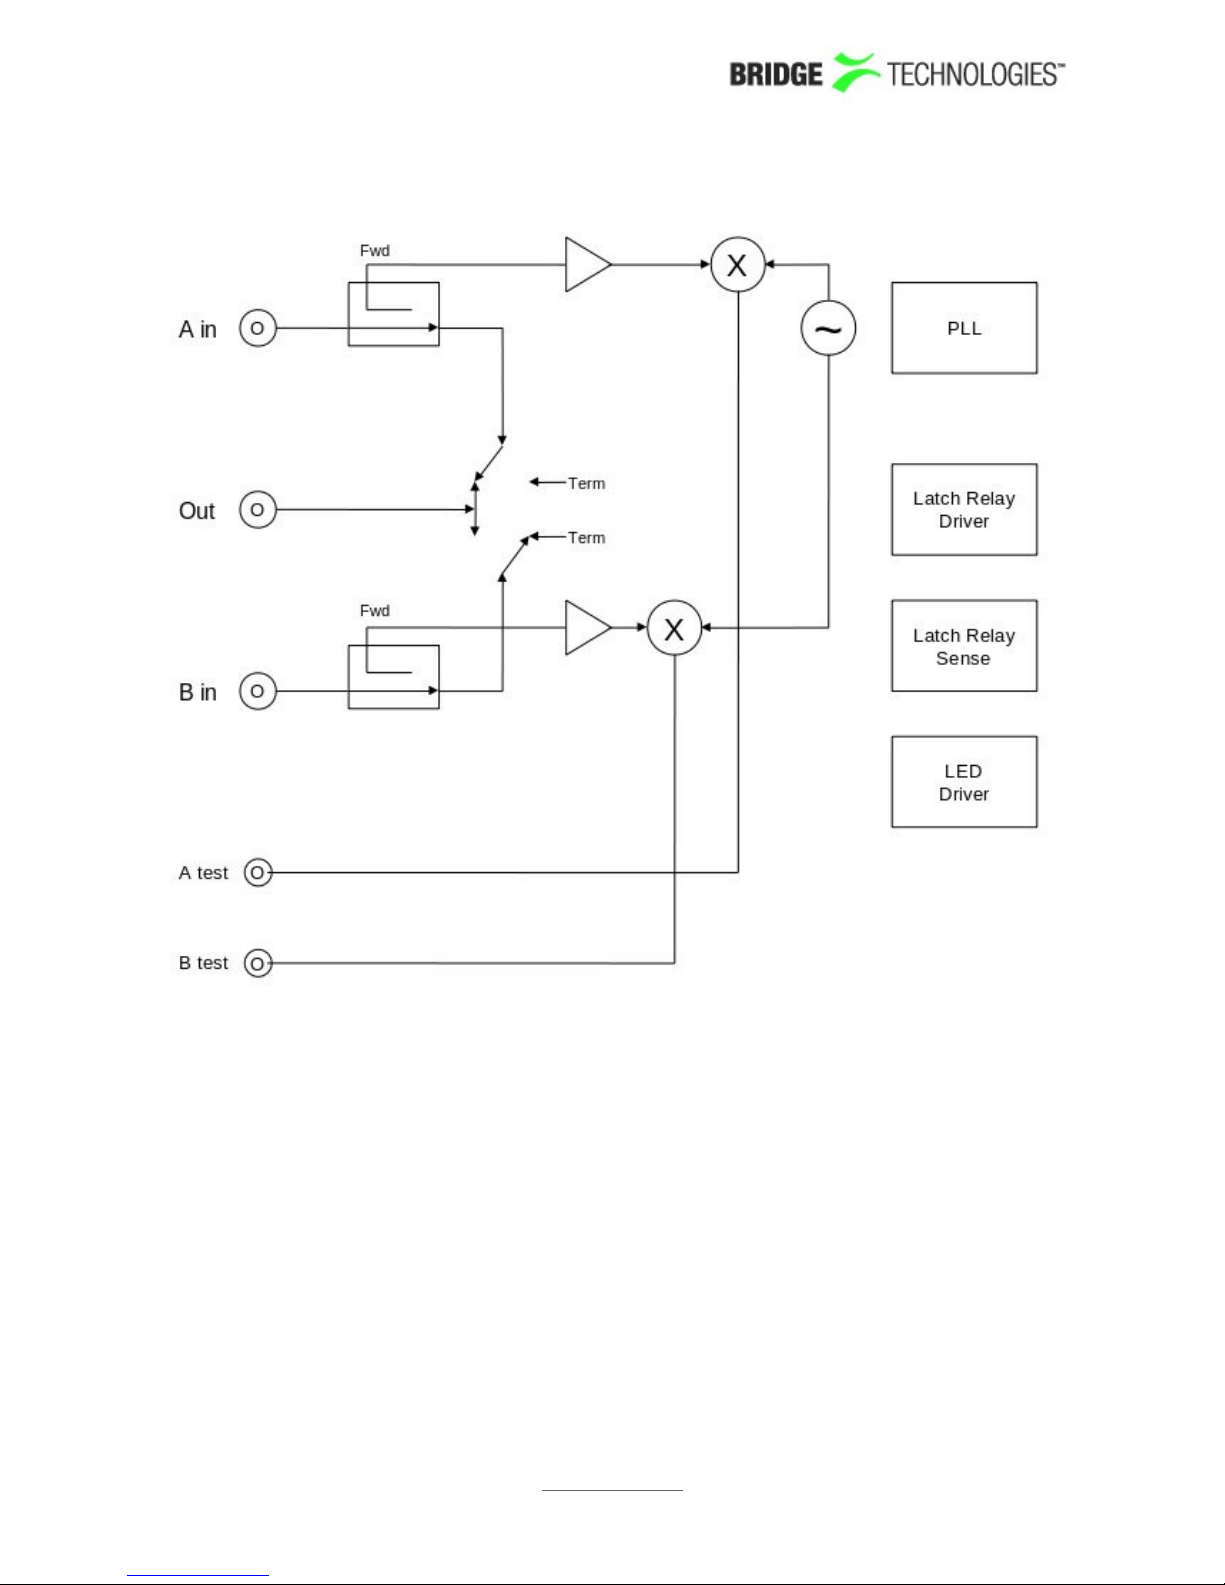
Block diagram
PROBE USERS' MANUAL VERSION 5.0
2014 © BRIDGE Technologies Co AS - Bentsebrugata 20 - N-0476 Oslo, Norway - tel: +47 22 38 51 00 -
www.bridgetech.tv
33
Page 33
4.8 Installing the Unit in a Rack (VB220)
The following equipment is needed for hardware installation of the unit:
• 4 rack screws
• A screw driver for the rack screws
• For rear mounting: a size 2 Phillips screwdriver for rack ear screws
• For -48 VDC PSU: cable soldering equipment
4.8.1 Default Installation - Connectors at the Front of Rack
By default the Enhanced and ACC/DCC chassis are shipped with rack ears for front
mounting of the unit. The rack ears are designed to support the weight of the unit, so
no additional support, like a rack shelf, is needed.
When deciding where to locate the unit, make sure there is sufficient space
surrounding the unit to allow efficient cooling, refer to section 4.2.2 (Enhanced
Chassis) and 4.3.1 (ACC/DCC Chassis).
Use four rack screws to install the unit in the rack.
4.8.2 Optional Installation - Connectors at the Rear of Rack
For rear mounting of the chassis, the rack ears should be moved prior to rack
installation. Unscrew the six size 2 Phillips screws holding the rack ears, and move the
six screws covering the rear mounting holes to the front mounting holes. Remount the
rack ears at the rear end of the unit.
Install the unit as described in section 4.5.1.
Figure 6: Rack Ears Mounting – Side View of ACC/DCC Chassis
PROBE USERS' MANUAL VERSION 5.0
2014 © BRIDGE Technologies Co AS - Bentsebrugata 20 - N-0476 Oslo, Norway - tel: +47 22 38 51 00 -
www.bridgetech.tv
34
Page 34
4.8.3 Optional Installation - Mid-Mounting
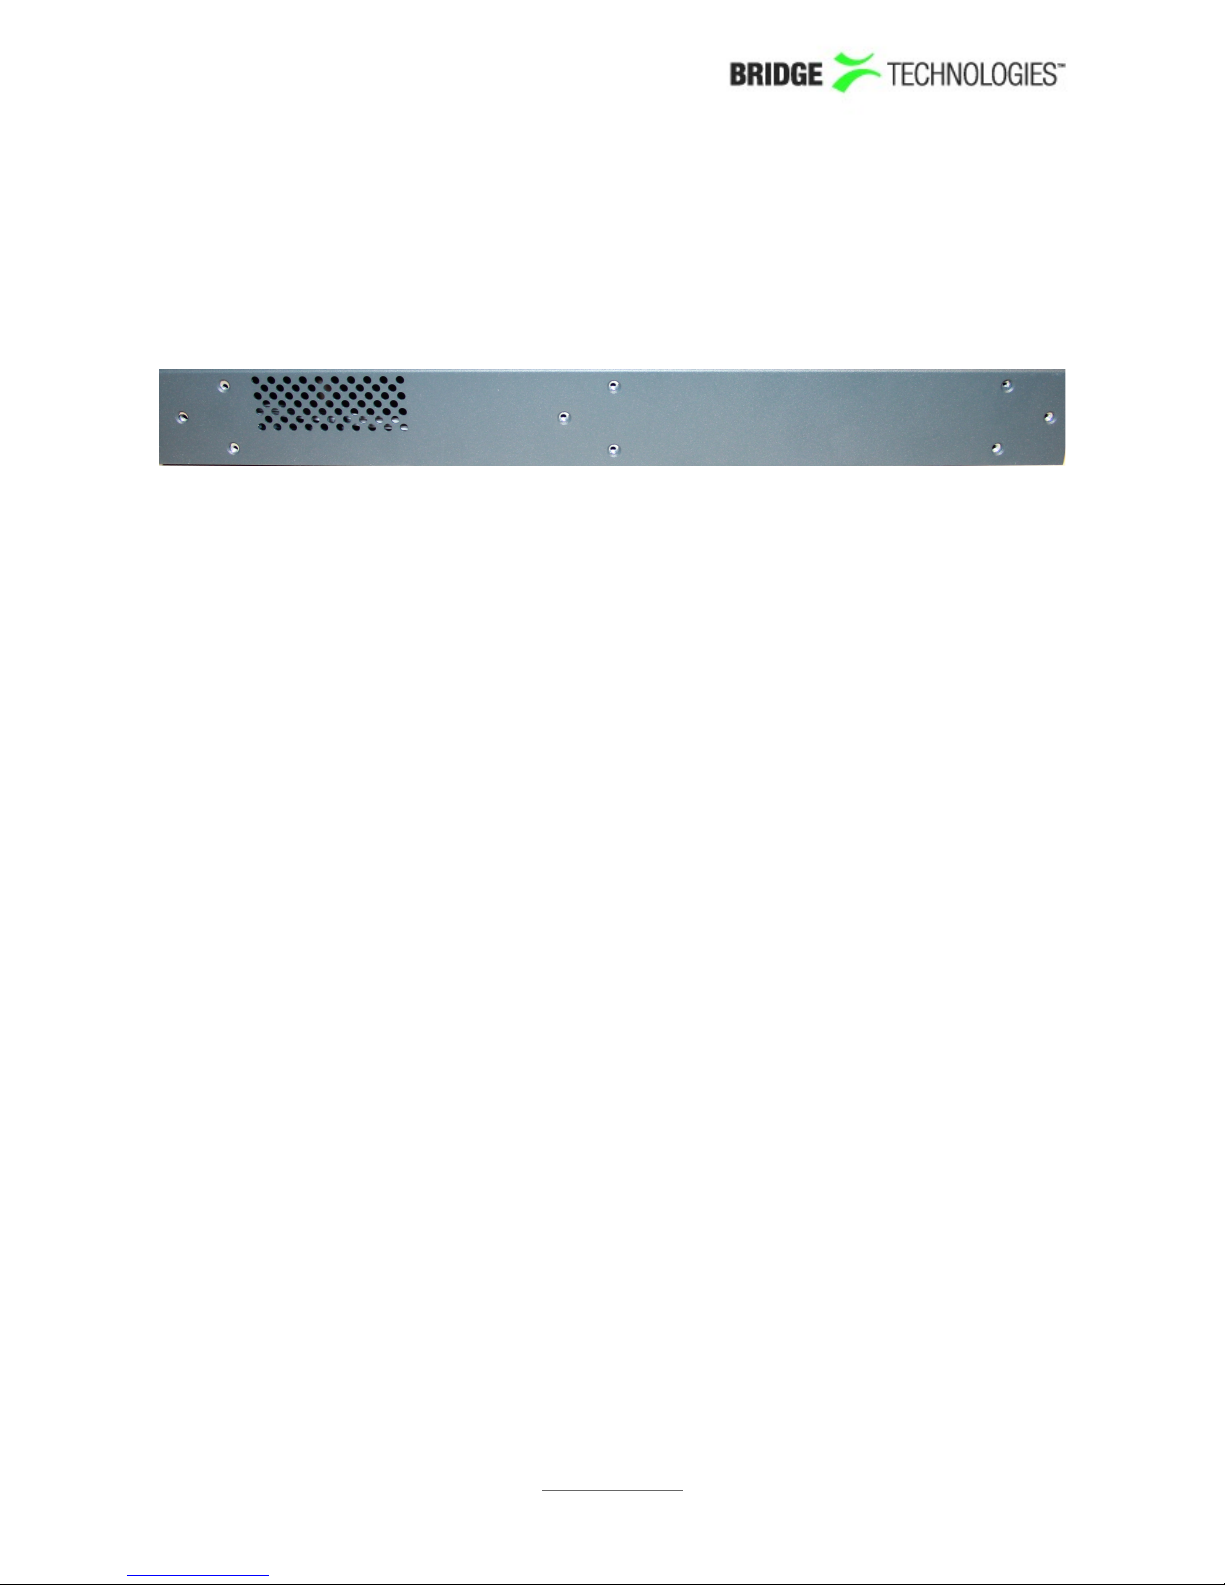
The Enhanced Chassis allows rack ears to be mid-mounted. This can be convenient if
the chassis is installed in a telco environment. Unscrew the six size 2 Phillips screws
holding the rack ears, and move the six screws covering the mid mounting holes to
the front mounting holes. Remount the rack ears at the middle of the unit.
Figure 7: Rack Ears Mounting – Side View of Enhanced Chassis Showing Screw Holes
4.9 Powering up the Unit
For the VB220 once the chassis is securely mounted and signal cables are connected,
it can be powered up by connecting the power cable to a mains source. When the
power cable is connected the power LEDs of the individual optional modules should
light up and the chassis fans should operate.
For a DCC unit (-48V power supply) the shipped 3-PIN D-sub(15) plug should be
soldered to the power cable prior to power-up. Refer to section 5.3 for a description of
this plug.
For the VB20 it is just to connect the mains source and the diodes should light up.
Note that it will take some time from power-up until the modules can be accessed via
the management interface – typically the start-up may take up to two minutes.
PROBE USERS' MANUAL VERSION 5.0
2014 © BRIDGE Technologies Co AS - Bentsebrugata 20 - N-0476 Oslo, Norway - tel: +47 22 38 51 00 -
www.bridgetech.tv
35
Page 35

4.10 Initial Configuration
There are two alternative ways of performing an initial configuration of the probe
module:
1. By using the preconfigured IP-address of the probe management port (eth2)
2. Via serial console emulated over USB
For most users the first method will be the easiest.
Note that if there are several probe modules in the chassis, each module should be
configured individually, one by one.
4.10.1 Initial Configuration Using the Pre-Set IP-Address
The probe modules are shipped with the following factory settings:
Management (eth2) IP address: 10.0.20.101
Management (eth2) subnet
mask:
255.255.0.0
In order to connect to the eth2 management port the PC used for setup should have
corresponding network settings.
For Windows XP the network parameters are set in the Control Panel - Network
Connections - Local Connections - Properties - Internet Protocol (TCP/IP) view.
Select the user defined address, and set the PC's IP-address to 10.0.20.100 and the
netmask to 255.255.0.0.
When the IP-address of the PC has been set to match the probe factory setting, the
permanent network settings can be configured through the probe web browser
interface. Refer to sections 4.6.3 and 6.15.3 for details on how to launch the probe
graphical user interface and how to set the network parameters.
4.10.2 Initial Configuration Via Serial Console Emulated Over USB
If the probe for some reason cannot be reached through Ethernet communication, the
initial set-up may be performed via serial console emulated over USB. This is done by:
1. Installing a driver for the USB communication, if not already supported by the
operating system
2. Setting the management IP-address
1. Installing a Driver for the USB Communication
The probe module uses a serial port emulator chip called FTDI FT232. Newer
operating systems will support the driver for this chip, but users of older operating
systems may have to download and install it. The driver may be downloaded directly
from the chip manufacturer at http://www.ftdichip.com . Select first Drivers, then VCP
followed by the operating system (VCP is short for Virtual COM Port).
PROBE USERS' MANUAL VERSION 5.0
2014 © BRIDGE Technologies Co AS - Bentsebrugata 20 - N-0476 Oslo, Norway - tel: +47 22 38 51 00 -
www.bridgetech.tv
36
Page 36

For Windows XP installation of the driver do the following:
1. Temporarily disconnect the internet connection of the PC.
2. Connect the supplied USB cable between the probe and a USB port on the PC.
3. When asked to connect to Windows Update, select “No not this time”.
4. Select "Install from a list or specific location (Advanced)".
5. Select "Search for the best driver in these locations" and enter the file path.
6. If a warning appears, stating that the driver has not passed Windows Logo
testing, select “Continue anyway”.
7. Open the Device Manager (located in "Control Panel\System" then select the
"Hardware" tab and click "Device Manager"), open "Ports" - the probe appears
as a new COM port with the label "USB Serial Port". Note the port number of this
new COM port (e.g. COM3).
For operating systems other than Windows XP a similar driver installation procedure
may have to be performed. Refer to the documents part of the http://www.ftdichip.com
site for instructions.
PROBE USERS' MANUAL VERSION 5.0
2014 © BRIDGE Technologies Co AS - Bentsebrugata 20 - N-0476 Oslo, Norway - tel: +47 22 38 51 00 -
www.bridgetech.tv
37
Page 37
2. Setting the Management IP-Address
1. Connecting the USB cable
If it is not already connected, connect the USB cable between the USB port on the
probe and a USB port on the PC.
2. Starting a terminal program on the PC
Start a terminal program. Window XP users can use Hyperterm, Linux users can use
minicom and Windows Vista users can download from http:// www.putty.org or
http://en.poderosa.org . Select the new COM port that should appear as the USB cable
is plugged in (Linux users should check /var/log/messages to see what device to use).
The following serial port parameters should be used:
• Baud rate: 9600
• Data bits: 8
• Parity: None
• Stop bits: 1
• Flow control: None
Press ENTER a few times to bring up the login prompt.
3. Logging in
Log in using the user name admin and the password elvis.
4. Setting initial network parameters
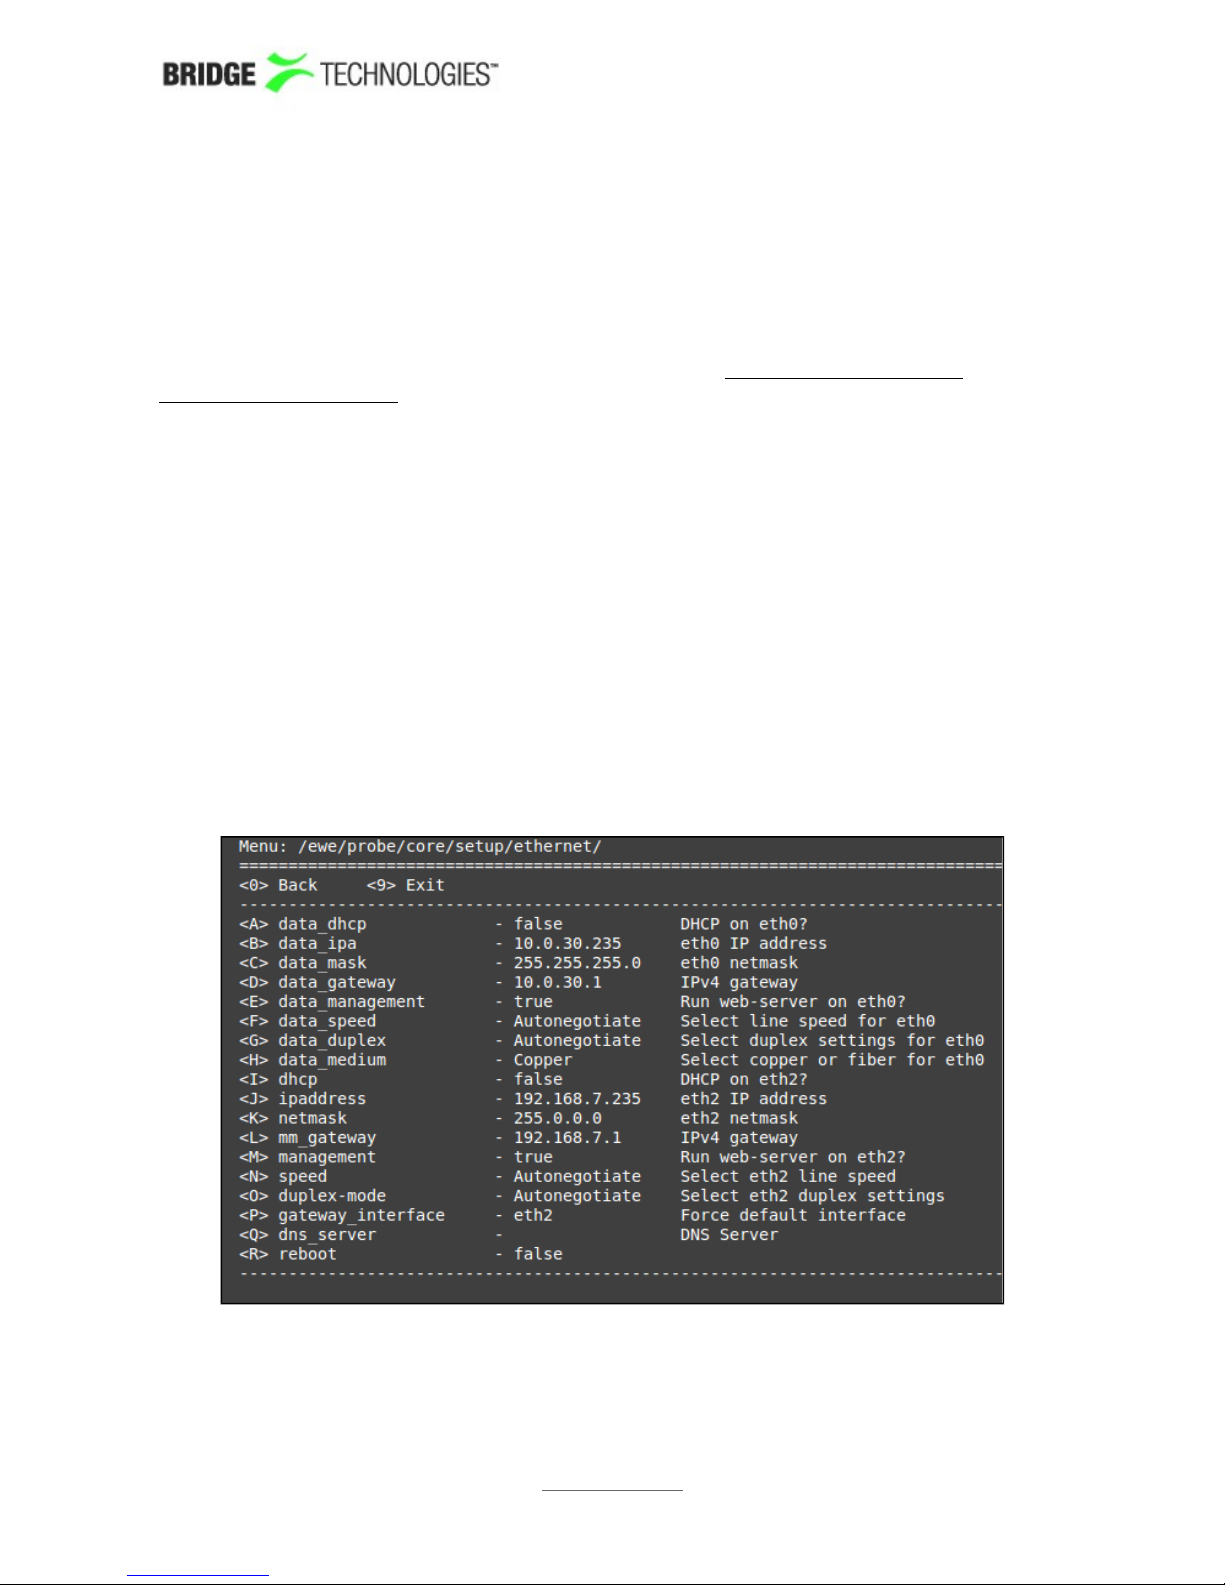
A simple text based menu system should now be displayed:
To change a setting, press the appropriate character (A-R) then enter the new value
and confirm by pressing <ENTER>.
PROBE USERS' MANUAL VERSION 5.0
2014 © BRIDGE Technologies Co AS - Bentsebrugata 20 - N-0476 Oslo, Norway - tel: +47 22 38 51 00 -
www.bridgetech.tv
38
Page 38

The probe is equipped with two network interfaces called management (or eth2) and
data/video (or eth0). It is necessary to configure at least one of these interfaces from
the terminal and then do the rest of the setup from a web browser.
The probe supports both in-band management (i.e. using eth0 for both data/video and
management) and separate management (i.e. using eth2 for management). In any
case make sure that the subnets configured for eth0 and eth2 do not overlap –
otherwise the probe will not work properly. Note that if IP-addresses for eth0 and eth2
are configured so that the subnets overlap, the IP-address of one of the ports will be
automatically set to 1.1.1.1 by the probe.
To configure the management interface, edit values for J, K and L, alternatively use
DHCP (I). NB! Set the gateway interface to eth2 by selecting P.
Make sure Management (M) is enabled (set to true) – otherwise management via web
will not be possible.
The speed and duplex mode settings are also available here (N, O).
To configure the data/video interface instead, enter values for A, B, C, D, E and set the
gateway interface (P) to eth0.
5. Saving the parameters and rebooting
When all the listed parameters have been configured, the probe must be rebooted to
let the parameters take effect. This is achieved by selecting “R” and confirming by
selecting “t” for TRUE.
PROBE USERS' MANUAL VERSION 5.0
2014 © BRIDGE Technologies Co AS - Bentsebrugata 20 - N-0476 Oslo, Norway - tel: +47 22 38 51 00 -
www.bridgetech.tv
39
Page 39
4.10.3 Verifying Correct Initial Setup of the Probe
Once the probe network interfaces have been configured, all further configuration
takes place through HTTP.
1. Launch a WEB-browser application on the management PC.
The following WEB-browsers are tested:
• Internet Explorer 7 or higher in Compatibility View
• Firefox
Opera and Chrome are also known to function.
2. Type the IP-address of the probe in the browser URL field and press
<ENTER>.
The IP-address of the probe is that of the eth0 or eth2 port (the one used for
management) as set in the initial set-up procedure.
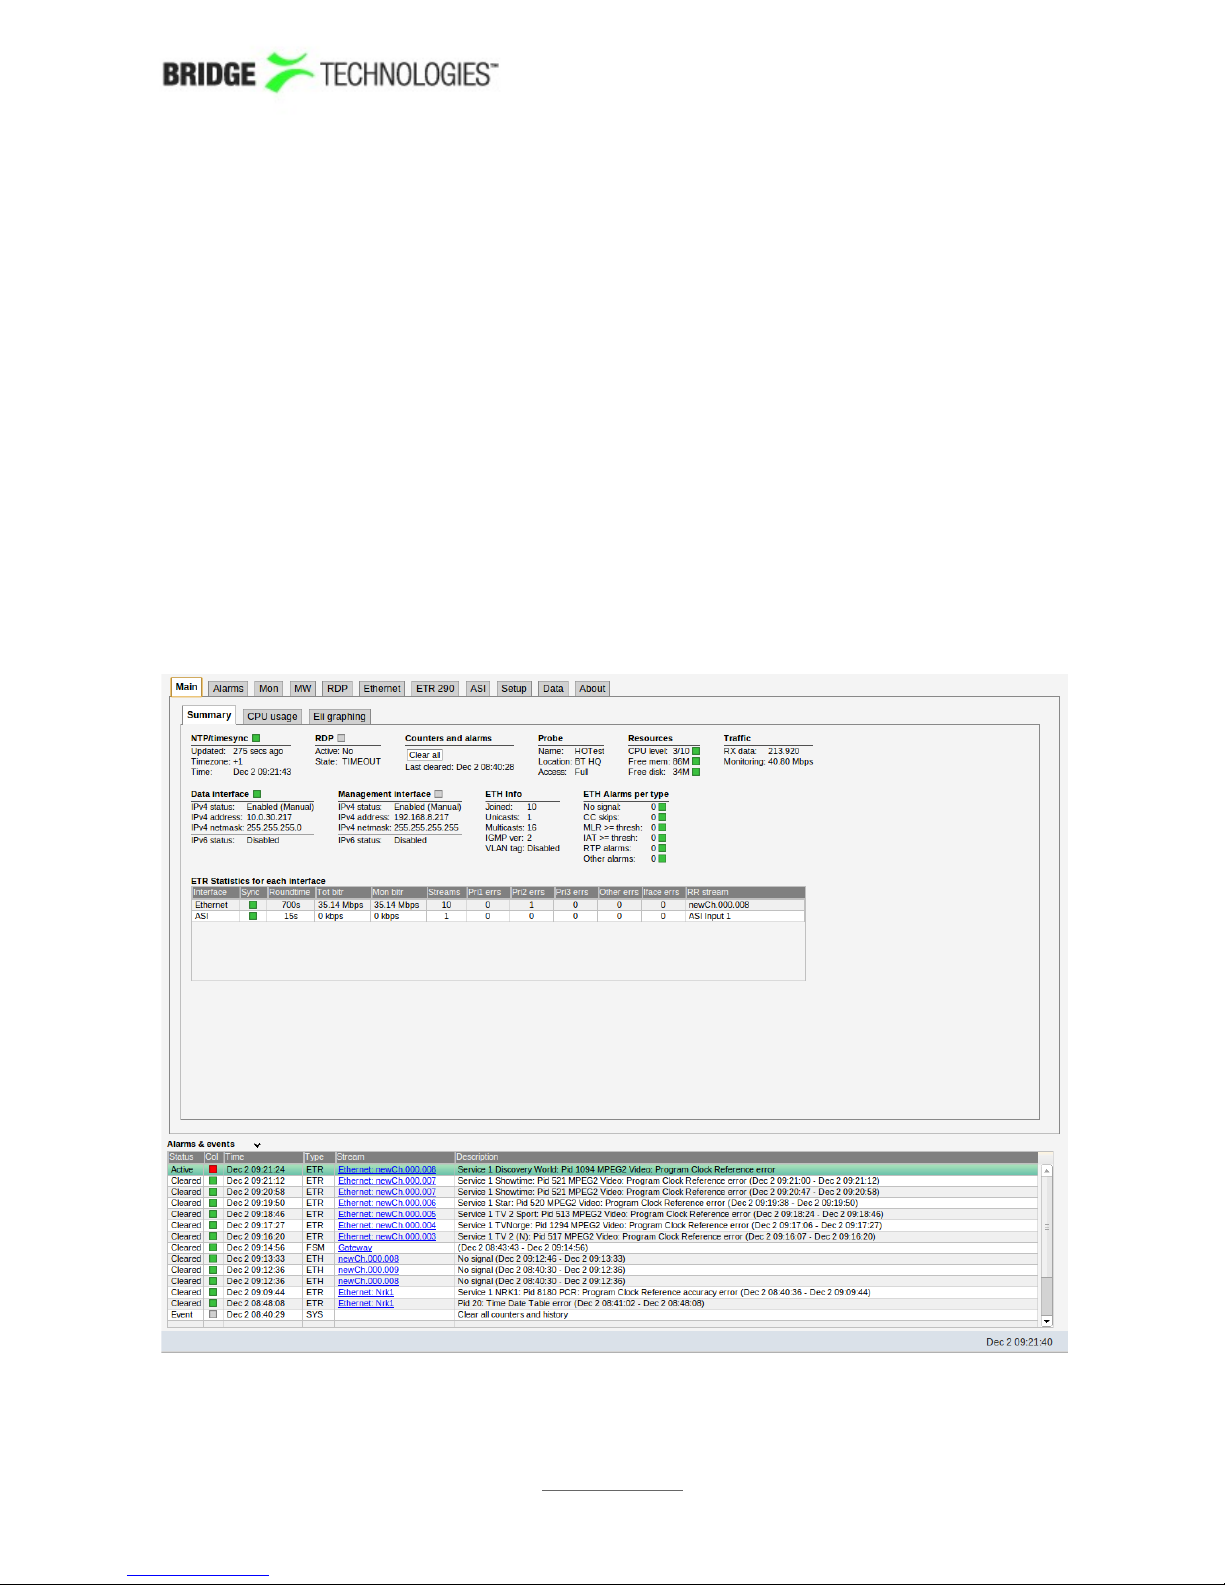
The default management view should be displayed inside the browser. This could look
similar to the screen shot shown below depending on the options and interfaces
installed.
PROBE USERS' MANUAL VERSION 5.0
2014 © BRIDGE Technologies Co AS - Bentsebrugata 20 - N-0476 Oslo, Norway - tel: +47 22 38 51 00 -
www.bridgetech.tv
40
Page 40

4.10.4 Initial Setup Troubleshooting
If there are problems bringing up the probe web-based management interface, verify
the following:
• Verify that the laptop and the probe are configured on the same subnet and
that they have different addresses. The network settings of the probe can be
verified through RS232/USB as described earlier
• Make sure that the IP-address of the gateway and the network interface are
not the same
• Verify that the appropriate Ethernet link indicators of the PC and probe are lit
• Verify that web browser proxy settings are not interfering
• Verify that local firewall settings on the laptop are not interfering
• Make sure that the management and data/video subnets do not overlap
(even if only one is physically connected)
• Make sure the probe was rebooted to activate the new settings
PROBE USERS' MANUAL VERSION 5.0
2014 © BRIDGE Technologies Co AS - Bentsebrugata 20 - N-0476 Oslo, Norway - tel: +47 22 38 51 00 -
www.bridgetech.tv
41
Page 41

5 QUICK SETUP GUIDE
This quick setup guide is intended to provide a step-by-step explanation of how to
setup a probe once the initial setup has been performed (as described in chapter 4).
More detailed instructions are found in chapter 6 of this manual.
The Return Data Path and Full Service Monitoring features are not covered by this
quick setup guide.
5.1 Basic Setup: All Interfaces
1. Set appropriate parameters in the Setup - Params and Setup - Ethernet
views.
2. If no time reference for automatic time locking has been specified set the time
in the Setup - Time view.
3. If access control is required, define a password in the Setup - Login view. Note
that it is important to read the instructions in the associated section of this
manual.
5.2 Input Signal Definitions
5.2.1 ASI Input
1. Set appropriate parameters in the ASI - Setup view. As a start the threshold
templates TR 101 290, Default, Default and Default may be used.
5.2.2 Ethernet Input (IP Option Only)
1. Define multicasts, either by using the multicast detect feature (Traffic Detect) or by defining multicasts manually (Ethernet - Multicasts). Note that
often upstream equipment will not transmit multicasts unless join messages
have been received, and in this case it will usually not be possible to detect
multicasts automatically. Select predefined threshold templates that seem
appropriate for the signal. Note that the sequence of the multicast definitions
will be reflected in monitoring, so order the multicasts correctly if required. Also
note that ETR 290 monitoring for Ethernet streams is disabled by default, so if
this is required, it will have to be enabled by the user (on a per-stream basis).
2. Define stream page name(s) in the Setup - Pages view (not strictly necessary).
3. Join multicasts in the Ethernet - Join view or in the Ethernet - Multicasts
view .
PROBE USERS' MANUAL VERSION 5.0
2014 © BRIDGE Technologies Co AS - Bentsebrugata 20 - N-0476 Oslo, Norway - tel: +47 22 38 51 00 -
www.bridgetech.tv
42
Page 42

5.2.3 OTT Input (OTT Engine Option Only)
1. Define the OTT channel manifest URLs and channel names in the OTT - Setup
view. Leave the Threshold and VBC threshold settings at default values for now.
Remember to tick the Enable box in the dialog box. If you have multiple OTT
engines installed (1 to 5 are allowed) then select which engine to assign to the
channel. 10 OTT streams per engine are allowed. Each engine works in parallel
to each other.
2. Inspect the OTT monitoring progress using the OTT - Active testing dialogue.
Useful information on OTT monitoring can be found in Appendix III in this
document.
5.2.4 Demodulator Input(VB220)
1. Define one frequency in the COFDM/QAM/VSB/RF/SAT - Tuning setup view.
For a start use default threshold templates: TR 101 290 (or ATSC Default),
Default, Default, Default and Default.
2. Verify proper reception of signal under the COFDM/QAM/VSB/RF/SAT -
Status view.
3. Use the Import tuning from NIT feature to automatically add frequencies as
signalled in NIT or add the remaining frequencies manually.
PROBE USERS' MANUAL VERSION 5.0
2014 © BRIDGE Technologies Co AS - Bentsebrugata 20 - N-0476 Oslo, Norway - tel: +47 22 38 51 00 -
www.bridgetech.tv
43
Page 43

5.3 Monitoring: All Interfaces
When input signal parameters have been set, the signals may be monitored.
For Ethernet input the relevant monitoring views are: Main, Alarms, Mon, MW,
Traffic, Ethernet. If the probe is equipped with the ETR 290 and/or the OTT option
then the views ETR 290 and OTT are of relevance as well.
For ASI input the relevant monitoring views are Alarms , ETR 290 and ASI - Status.
For demodulator inputs the relevant monitoring views are Alarms, ETR 290 and
COFDM/QAM/VSB/RF/SAT - Status.
Ethernet monitoring hints are found in Appendix II.
5.4 Adjusting Alarm Thresholds: All Interfaces
When probe inputs and streams have been defined using default thresholds, the result
will usually be a number of more or less permanent probe alarms, and not all of them
are informative. In order for the user to get rid of unwanted alarms, the probe provides
alarm filtering functionality in the form of alarm thresholds and alarm on/off selection.
By default Ethernet thresholds are set to raise alarms when service affecting errors
occur, that are caused by the network. There may however be reasons for these
thresholds to be altered, for instance to reflect receiver robustness in the case of IAT,
or to reflect a TS into IP mapping different from the default (7TS/UDP).
Creating a new threshold template is done either by copying an existing one and
altering the copy, or by creating a new threshold template from scratch. The Ethernet
thresholds are defined in the Ethernet - Ethernet thresh. view. These thresholds
are associated with streams in the Ethernet - Multicasts view.
In addition to the miscellaneous thresholds, that affect only the streams with which
they are associated, the Alarm - Alarm setup view allows the user to enable and
disable alarms on an overall basis. It is also possible to define the alarm severity levels
for different alarms in this view.
PROBE USERS' MANUAL VERSION 5.0
2014 © BRIDGE Technologies Co AS - Bentsebrugata 20 - N-0476 Oslo, Norway - tel: +47 22 38 51 00 -
www.bridgetech.tv
44
Page 44

ETR 290
The default ETR 290 thresholds are based on the ETSI TR 101 290 guidelines. These
are however fairly strict, and the user may want to alter the limits to better reflect
receiver sensitivity. The ETR 290 thresholds should also be changed if there are tables
that are not relevant for a system, or if the user requires alarm functionality that
exceeds the ETR 290 guidelines, for instance to raise alarms if the number of services
present in a signal is lower than a preset limit.
The default PID and service thresholds do not affect alarming at all, they are
completely transparent. The thresholds may be altered for instance in order to mask
an alarm generated by an unreferenced PID or to ensure an alarm is raised if a service
or PID bitrate is outside preset limits.
Creating a new threshold template is done either by copying an existing one and
altering the copy, or by creating a new threshold template from scratch. The
thresholds are defined in these views: ETR 290 - ETR thresh., ETR 290 - PID
thresh., ETR 290 - Service thresh., and possibly COFDM/QAM/VSB/RF/SAT COFDM/QAM/VSB/RF/SAT threshold (if a demodulator is present in the chassis).
The thresholds are associated with streams in these views: ASI - Setup, Ethernet Multicasts - Edit and possibly COFDM/QAM/VSB/RF/SAT - Tuning setup (if a
demodulator is present in the chassis).
PROBE USERS' MANUAL VERSION 5.0
2014 © BRIDGE Technologies Co AS - Bentsebrugata 20 - N-0476 Oslo, Norway - tel: +47 22 38 51 00 -
www.bridgetech.tv
45
Page 45
6 THE PROBE GRAPHICAL USER INTERFACE
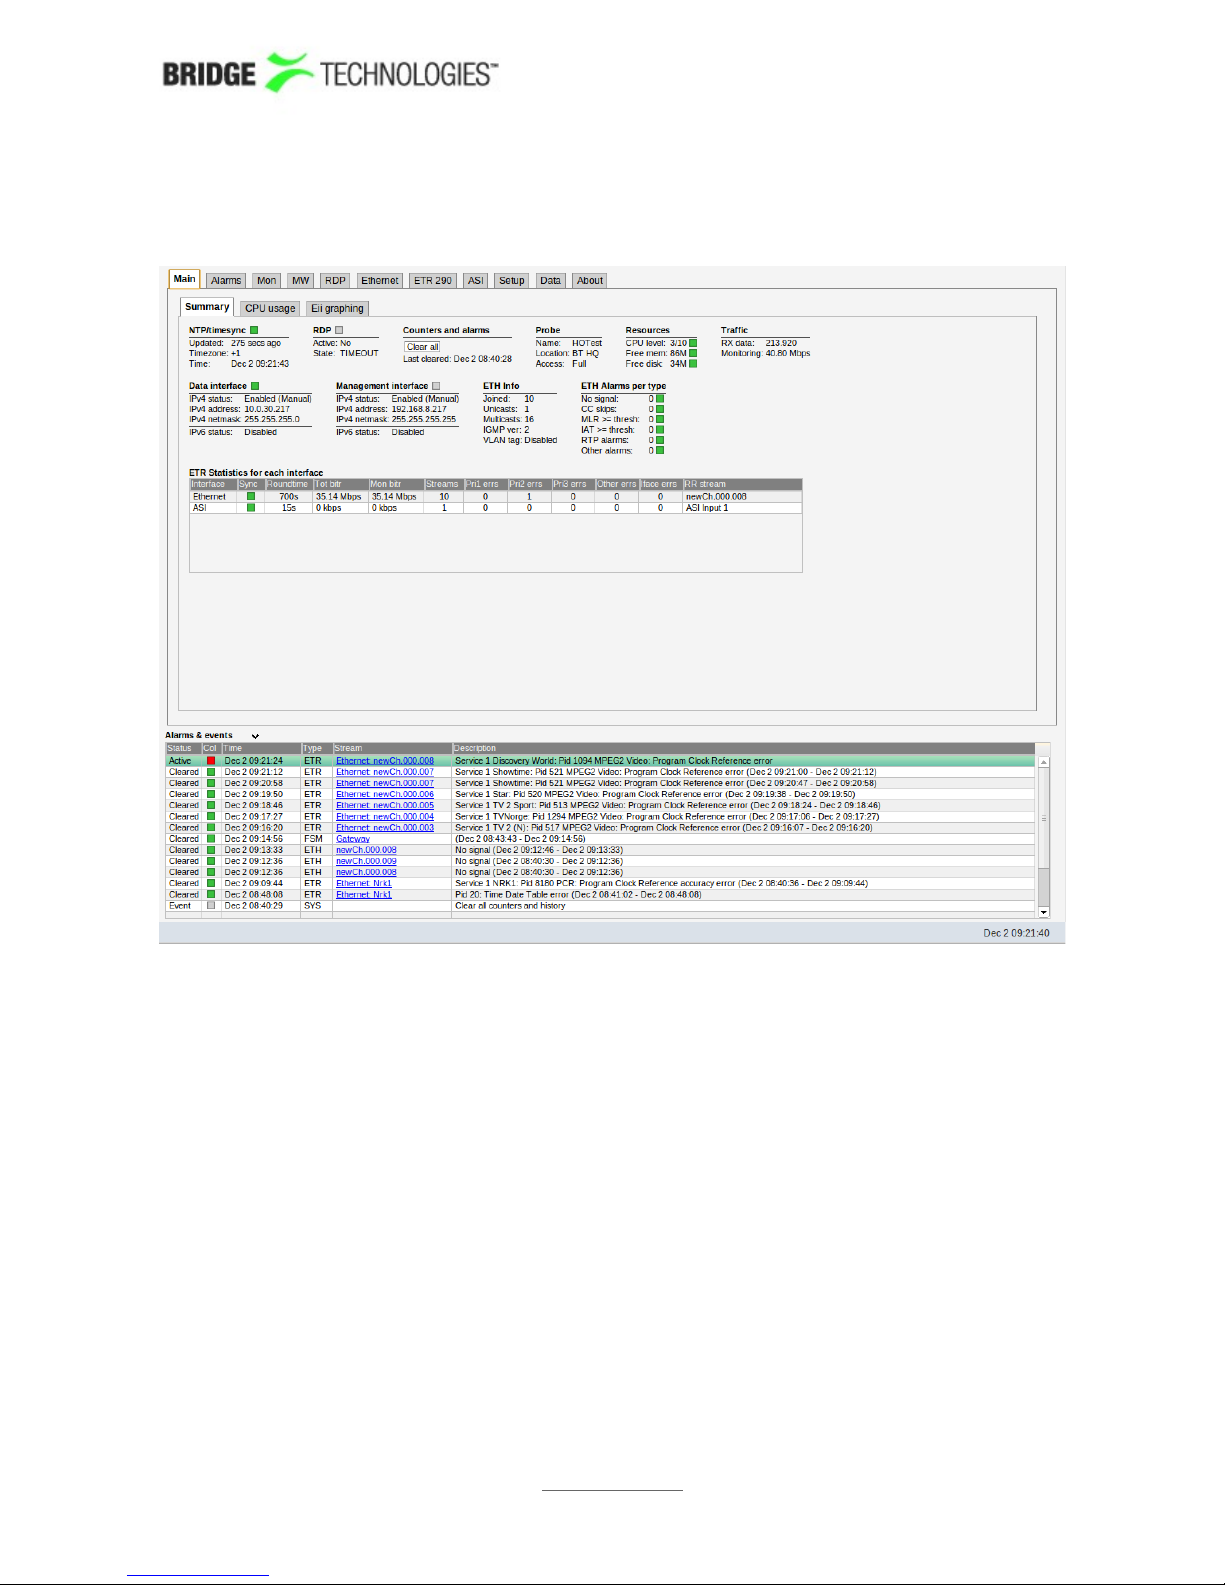
The probe web interface is reached by pointing a web browser towards the IP-address
of the probe as shown in the screen shot above.
The following WEB-browsers are tested:
• Internet Explorer 7.0 or higher
• Firefox
Chrome and Opera are also known to function.
Newer versions of Internet Explorer should have compatibility view enabled.
For IE11 this can be enabled in the menu Tools/Compatibility View settings.
Note that different web browsers behave differently with respect to memory leaking,
and if the probe GUI should be available at all times the browser should be selected
carefully. Browser memory leak manifests itself as the browser responding more and
more slowly, and this is corrected by closing down the application and restarting.
The interface is easy and intuitive to use. Navigate by clicking on the tabs just below
the probe logo. Some of the pages have their own tabs for accessing nested pages.
PROBE USERS' MANUAL VERSION 5.0
2014 © BRIDGE Technologies Co AS - Bentsebrugata 20 - N-0476 Oslo, Norway - tel: +47 22 38 51 00 -
www.bridgetech.tv
46
Page 46

The bottom frame of the interface is by default the Alarms & events list, usually
referred to as the alarm list. The alarm list can be displayed or hidden by clicking the
Toggle link.
The WEB interface has been designed to be resizeable in both vertical and horizontal
directions with a minimum screen resolution of 1024x768 pixels.
Tool-tip is available for most buttons and labels. To access tool-tip information simply
navigate the mouse pointer towards a button or a label and leave it hovering for a
second or two.
In this manual the term stream is generally used instead of the terms multicast and /or
unicast. A stream may contain a single or multiple services.
PROBE USERS' MANUAL VERSION 5.0
2014 © BRIDGE Technologies Co AS - Bentsebrugata 20 - N-0476 Oslo, Norway - tel: +47 22 38 51 00 -
www.bridgetech.tv
47
Page 47
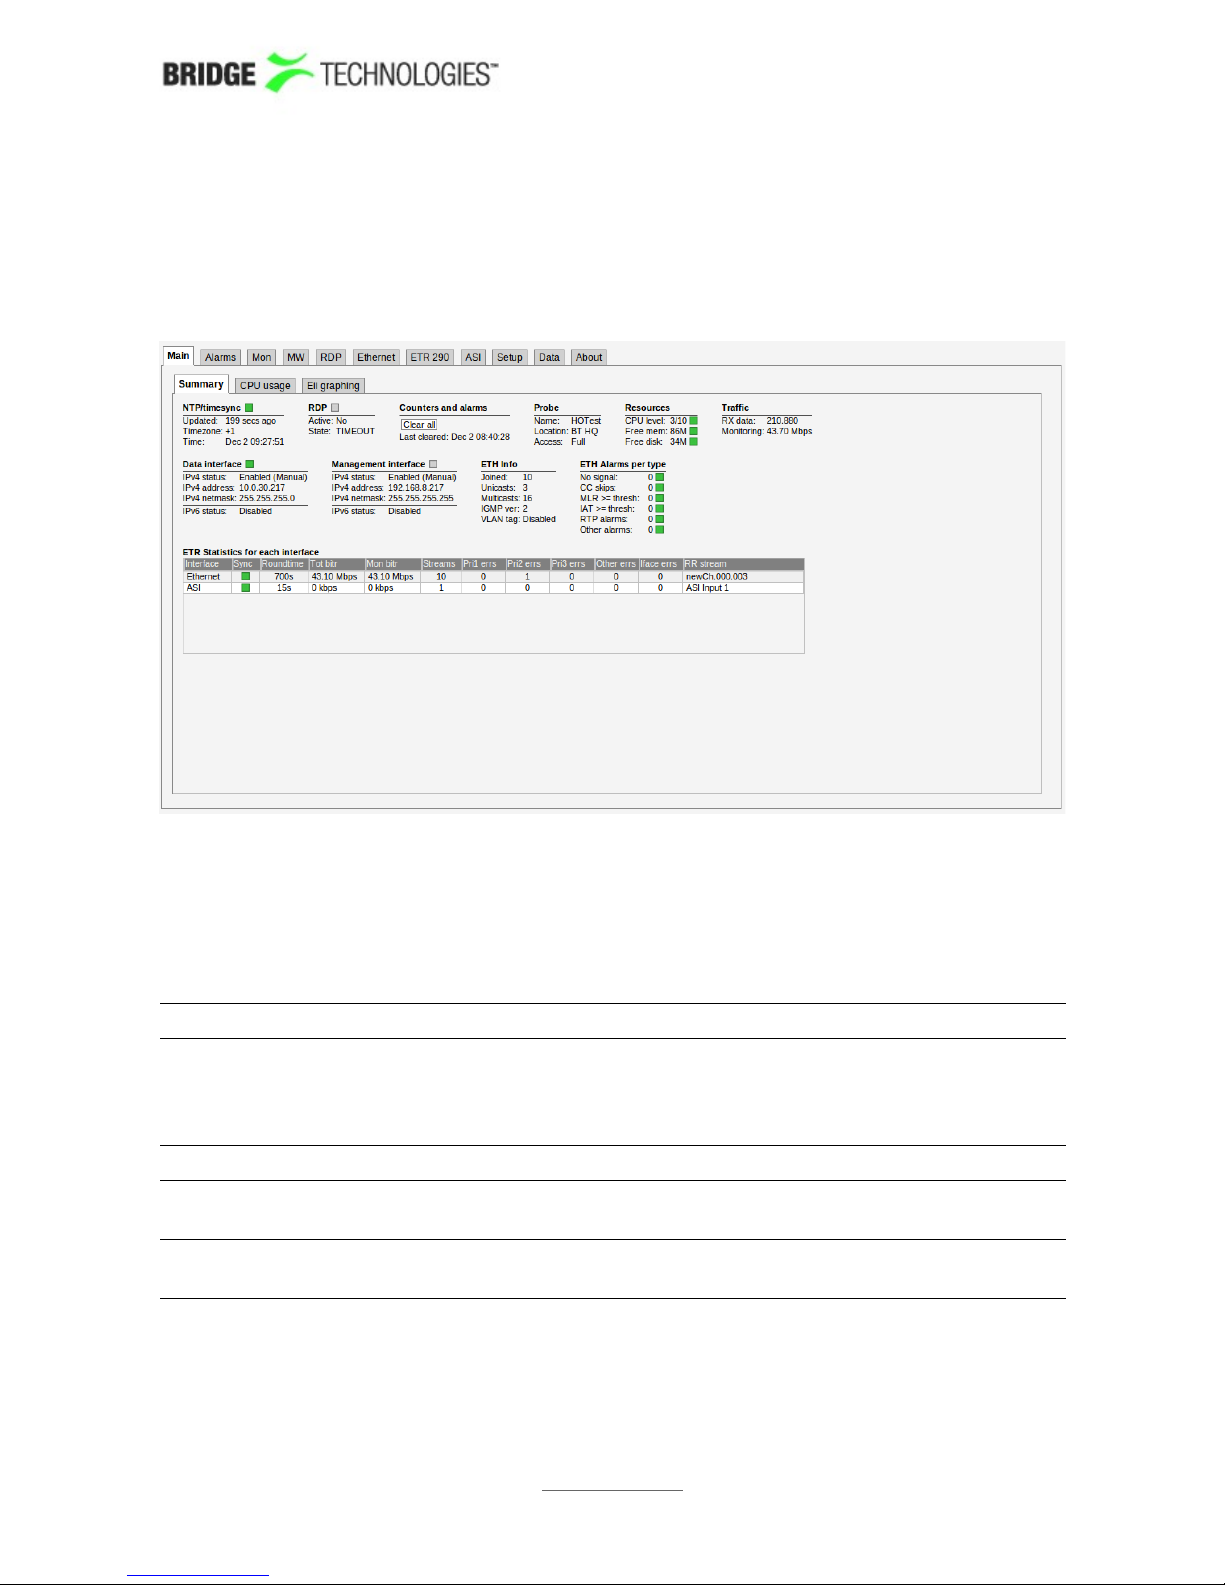
6.1 Main
6.1.1 Main - Summary
The intention of this page, together with the alarm list, is to provide enough
information for the operator to immediately see if there is anything seriously wrong
with one or more input streams.
The following parameters are shown:
NTP/timesync
(Bulb): The NTP/timesync bulb indicates whether the probe clock is locked to
an external time reference signal. Green indicates that the probe is
locked to an external reference whereas grey indicates that the probe
runs in unlocked mode.
Updated: The time since the last time synchronisation update
Timezone: The timezone as selected by the operator in the Setup - Params
view
Time: The current local time (configured in Setup - Params or Setup
Time view)
PROBE USERS' MANUAL VERSION 5.0
2014 © BRIDGE Technologies Co AS - Bentsebrugata 20 - N-0476 Oslo, Norway - tel: +47 22 38 51 00 -
www.bridgetech.tv
48
Page 48

RDP
(Bulb): The RDP bulb indicates whether RDP is active or not. Green indicates
RDP active whereas grey indicates that RDP is currently not active.
Active: The RDP active state is either yes or no, yes indicating that RDP
relaying or alarm triggered recording mode has been selected by the
operator in the RDP view.
State: The current RDP state. The different RDP states are:
Idle : relaying or recording is not active and alarm triggered
recording has not been selected
Relaying (interface) : a transport stream or range of PIDs has been
selected for forwarding to an operator determined IP address
Trigger : the operator has selected alarm triggered recording mode
RECORDING : a stream is currently being recorded, either due to the
operator selecting manual recording or by an alarm triggering
recording
Counters and alarms
Clear all: Click the Clear all button to reset all counters, graphs and alarms.
All probe measurement and alarm history is cleared. Note that it is
not possible to undo this operation.
Last
cleared:
The time since the the Clear all counters button was last clicked. If
no time is indicated the counters have not been cleared since probe
startup/reboot time.
Probe
Name: The probe name as defined by the operator in the Setup - Params
view
Location: The probe location as defined by the operator in the Setup - Params
view
Access: The access rights of the current user. Access rights are either full
access or read only access.
Resources
CPU level: The CPU level indicates the workload of the probe, on a scale from 1
to 10 of total capacity.
Free mem: The available free probe memory
Free disk: The available free probe disk space
PROBE USERS' MANUAL VERSION 5.0
2014 © BRIDGE Technologies Co AS - Bentsebrugata 20 - N-0476 Oslo, Norway - tel: +47 22 38 51 00 -
www.bridgetech.tv
49
Page 49

Traffic
RX data: The total bitrate of received data traffic
Monitoring:The total bitrate of multicasts and unicasts monitored (analysed) by
the probe
Data interface
IPv4
status:
The IPv4 status as defined in the Setup – Ethernet view
IPv4
address:
The probe IPv4 Ethernet data/video interface IP address as defined by
the user in the Setup – Ethernet view
Ipv4
netmask:
The probe IPv4 Ethernet data/video interface netmask as defined by
the user in the Setup – Ethernet view
Management interface
IPv6
status:
The IPv6 status as defined in the Setup – Ethernet view
IPv6
address:
The probe IPv6 Ethernet data/video interface IP address as defined by
the user in the Setup – Ethernet view
Ipv6
netmask:
The probe IPv6 Ethernet data/video interface netmask as defined by
the user in the Setup – Ethernet view
ETH info
Joined: The number of joined streams (multicasts and unicasts)
Unicasts: The number of unicasts currently being joined/monitored by the probe
Multicasts:The number of multicasts currently being joined/monitored by the
probe
IGMP ver: The IGMP version currently used by the probe. IGMPv2 is used unless
the operator has selected source specific multicasts (Setup - Params
view), in which case IGMPv3 is used.
VLAN tag: The VLAN tag currently used by the probe. If no VLAN tag has been
specified by the operator (Setup - Params view), the VLAN tag value
will read disabled.
ETH alarms per type
No signal: The number of currently active Ethernet 'No signal' alarms
CC skips: The number of currently active Ethernet 'CC skips' alarms
PROBE USERS' MANUAL VERSION 5.0
2014 © BRIDGE Technologies Co AS - Bentsebrugata 20 - N-0476 Oslo, Norway - tel: +47 22 38 51 00 -
www.bridgetech.tv
50
Page 50

MLR>=thre
sh:
The number of currently active Ethernet MLR alarms, i.e. the total
number of 'MLR>= warning-threshold' and 'MLR>= alarm-threshold'
alarms
IAT>=thresh:The number of currently active Ethernet IAT alarms, i.e. the total
number of 'IAT>= warning-threshold' and 'IAT>= alarm-threshold'
alarms
RTP
alarms:
The number of currently active RTP alarms, i.e. the total number of
'RTP packet drop', 'RTP duplicates' and 'RTP out of order' alarms
Other
alarms:
The total number of currently active Ethernet alarms not included in
the alarm figures specified above
The ETR statistics table will only be present in the view if the probe is ETR290 licensed.
ETR statistics for each interface
Interface: The ETR290 monitoring engine. The list of monitoring engines will
depend on probe hardware configuration and software license.
Sync: A green sync bulb indicates that the transport stream sync alarm of
the associated stream is currently not active, whereas red indicates
an active 'TS sync' alarm.
Roundtime: The round-robin 'tuning' time of the currently monitored transport
stream. Note that if an ETR monitoring engine has been configured to
analyse a single transport stream only or if monitoring has been
manually locked to a transport stream, the roundtime figure is
irrelevant as the stream will be continuously monitored.
Tot bitr: The total transport stream bitrate including null packets, summed for
all streams monitored by an ETR engine
Mon bitr: The total effective transport stream bitrate excluding null packets,
summed for all streams monitored by an ETR engine
Streams: The number of transport streams being analysed by a particular ETR
engine
Pri1 errs: The number of streams with active priority 1 alarms as reported by a
particular ETR engine
Pri2 errs: The number of streams with active priority 2 alarms as reported by a
particular ETR engine
Pri3 errs: The number of streams with active priority 3 alarms as reported by a
particular ETR engine
Other errs: The number of streams with active 'other' alarms reported by a
particular ETR engine
Iface errs: The number of streams with active interface errors reported by a
particular ETR engine
RR stream: Round-robin stream; the name of the transport stream currently
PROBE USERS' MANUAL VERSION 5.0
2014 © BRIDGE Technologies Co AS - Bentsebrugata 20 - N-0476 Oslo, Norway - tel: +47 22 38 51 00 -
www.bridgetech.tv
51
Page 51
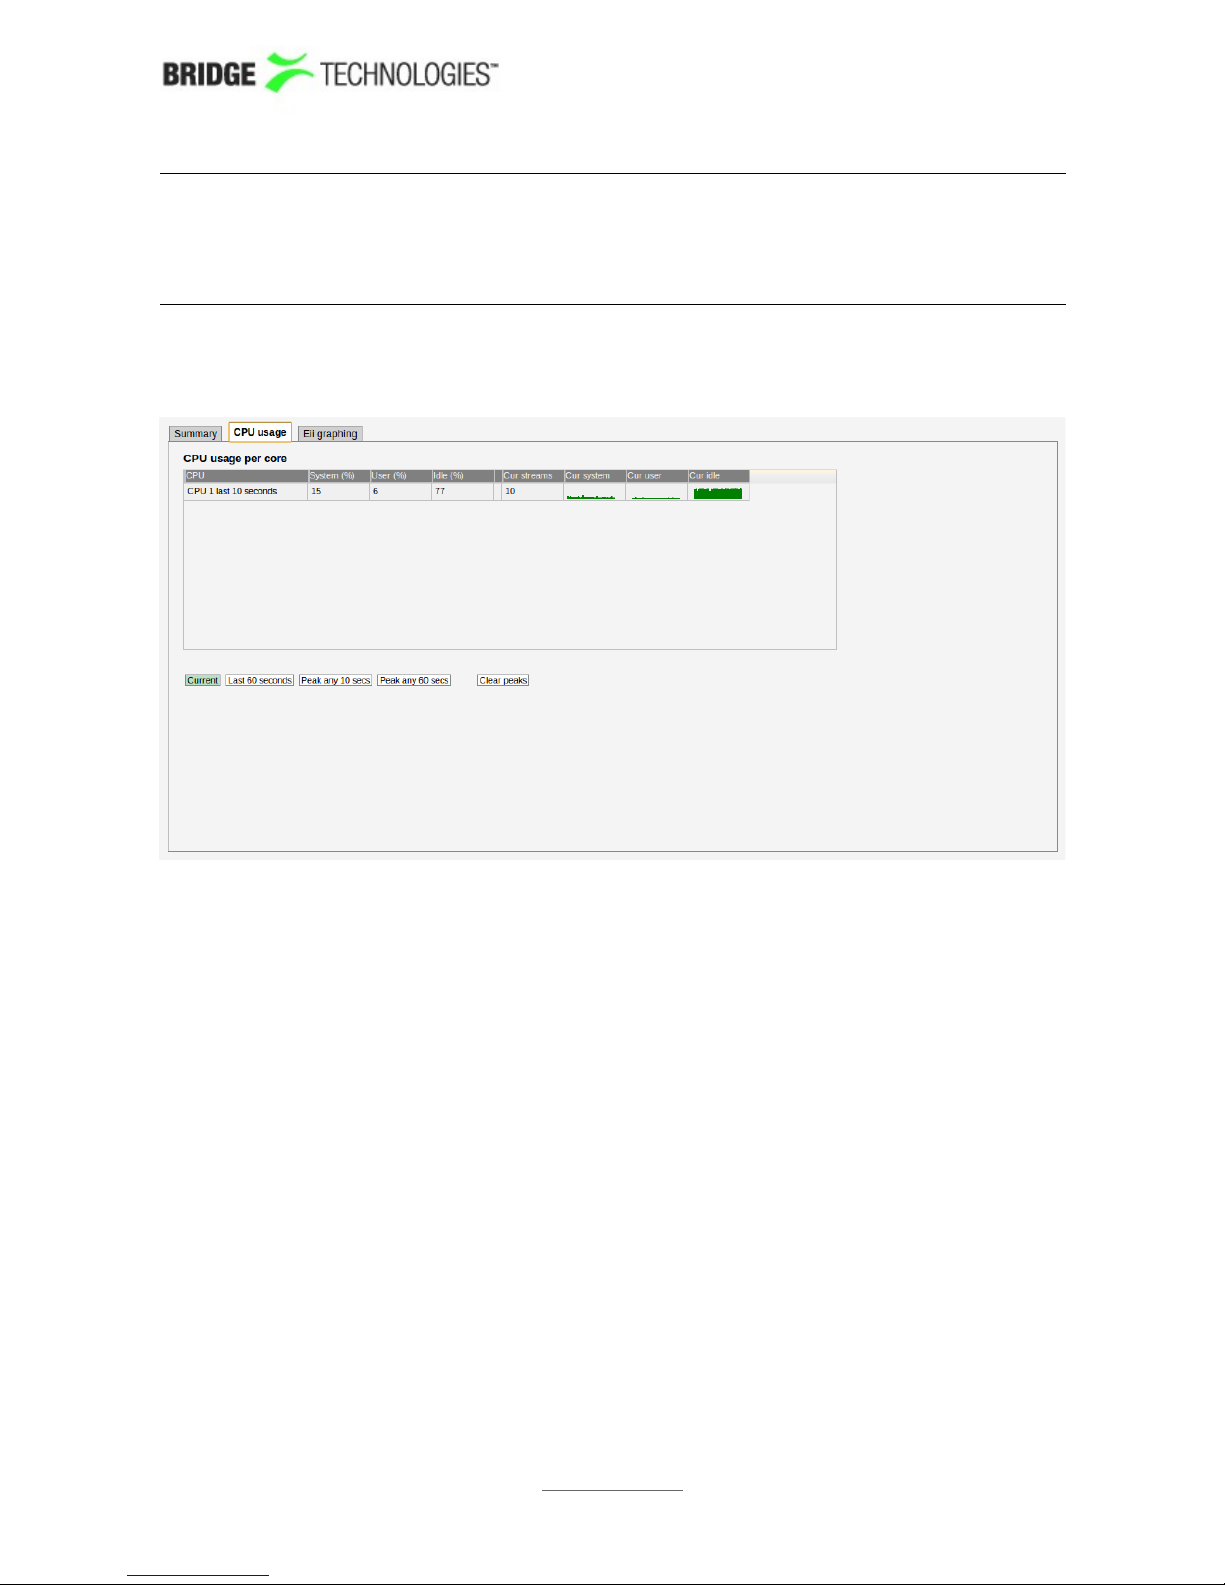
being analysed by a particular ETR monitoring engine. For Ethernet
this is the multicast/unicast name, for ASI and demodulators this is
the stream name defined by the operator. If the monitoring engine is
locked to one stream by the user, this field will read LOCKED:
<stream name>.
6.1.2 Main - CPU usage
The CPU usage view is meant for troubleshooting performance issues in case of
excessively high traffic load.
Three internal performance indicators (System, User and Idle) are displayed as
percentage numbers and also graphed for the last minute. Issues can potentially arise
if the System indicator becomes high (>80%).
By selecting Current the instantaneous values are sampled and displayed every 2
seconds. Selecting Last 60 seconds displays the peak instantaneous values observed
within the last minute. Selecting Peak any 10 secs performs an averaging over the
last 10 seconds and then registers the highest observed 10-second average since last
time Clear peaks was pressed. Peak any 60 secs is similar only with 60 seconds as
averaging constant instead of 10.
Clear peaks clears the peak values observed until now and starts the peak
registration again.
PROBE USERS' MANUAL VERSION 5.0
2014 © BRIDGE Technologies Co AS - Bentsebrugata 20 - N-0476 Oslo, Norway - tel: +47 22 38 51 00 -
www.bridgetech.tv
52
Page 52
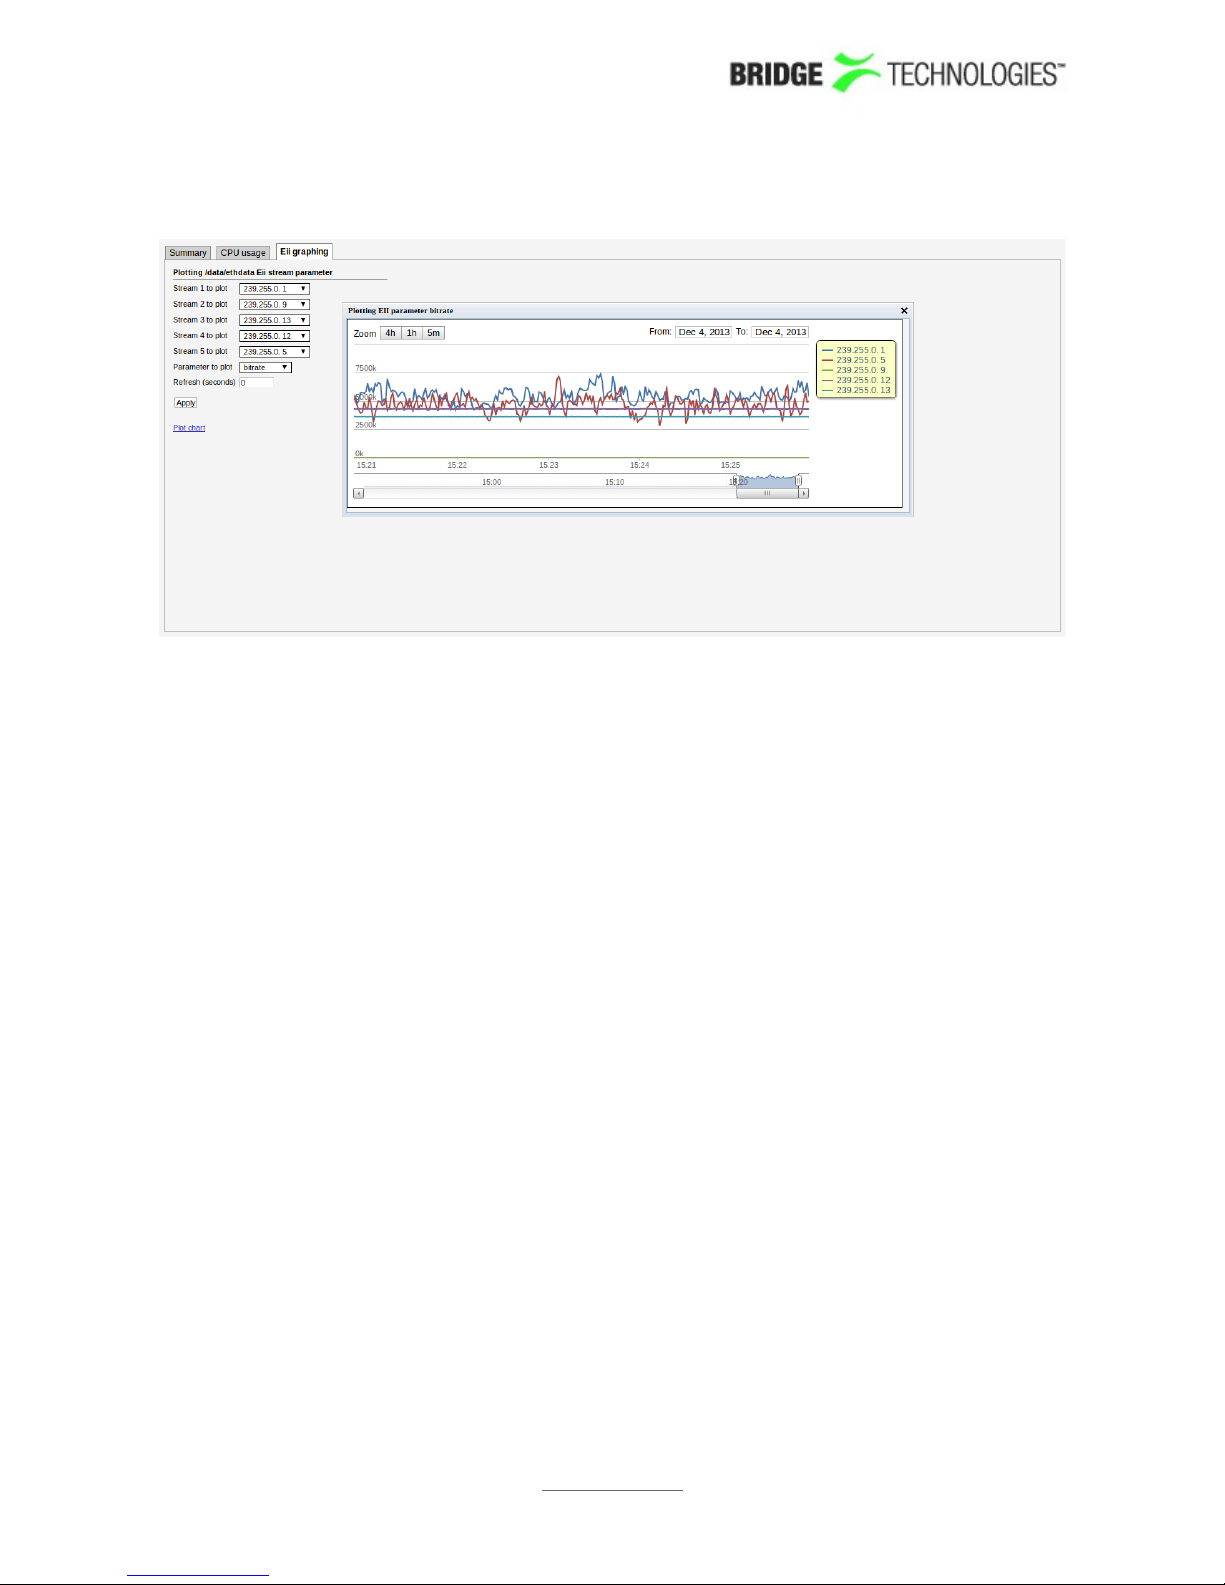
6.1.3 Main - Eii graphing
Eii is short for External Integration Interface and constitutes a set of XML files
accessible through the probe web server interface for machine access to
measurement data.
Portions of the Eii interface are available in this view for simple trend graphing over
arbitrary long time by the web browser.
The screenshot shows the bandwidth of two IP streams being graphed by sampling the
Eii interface every 2 seconds. The graph is stored in the client web browser for as long
as the graph window remains open. The graph starts again with zero history if the
window is closed and then opened again.
Up to 5 streams are possible to plot on the same graph using the dropdown menus
named Stream N to plot where N is 1 through to 5. The parameter to plot is selected
through the dropdown called Parameter to plot. The following choices are available:
bitrate
rtp_drops
iat_avg
cc_errs
Refresh (seconds) selects how often samples are read and plotted on the graph.
See separate Eii documentation on the customer area of the BRIDGE Technologies
website for more details.
PROBE USERS' MANUAL VERSION 5.0
2014 © BRIDGE Technologies Co AS - Bentsebrugata 20 - N-0476 Oslo, Norway - tel: +47 22 38 51 00 -
www.bridgetech.tv
53
Page 53
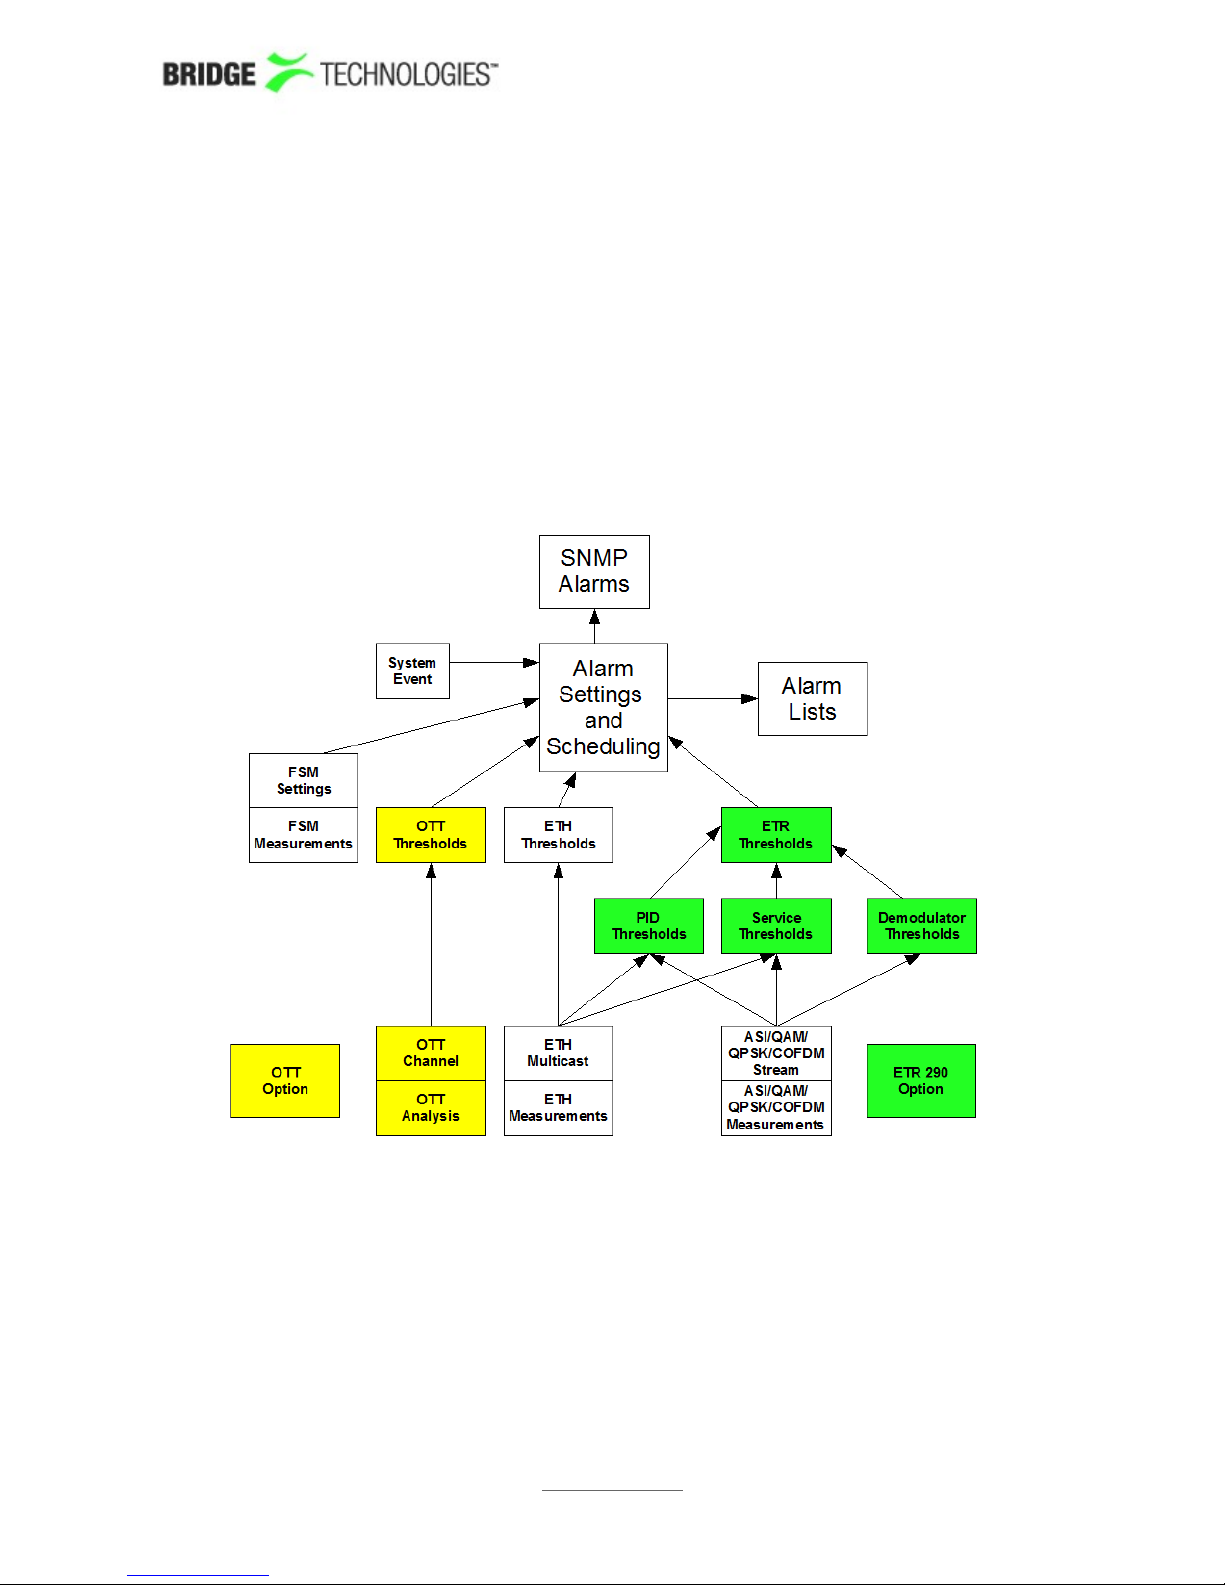
6.2 Alarms
Figure 7 shows an overview of the total alarm handling of a probe. This figure is useful
to obtain an understanding of the alarm processing of the probe - in particular how
threshold settings and alarm setup will affect alarm handling.
The probe continuously compares measurement data with user defined thresholds in
order to generate alarms. These alarms are further checked against the settings
defined in the Alarms - Alarm setup view, and the resulting alarms are presented in
the alarm lists. These alarms will also be sent as SNMP traps to support third party
management systems. Refer to Appendix 1 for a description of alarm handling in the
VideoBridge Controller (VBC).
Figure 7: Alarm handling in the probe - note that ETR 290 is included as standard in
the VB20 and VB220 probe.
The probe distinguishes between events and alarms. The ETR software module will
always generate alarms and the Systems software module will always generate
events. The Ethernet software module will by default generate events for errors that
PROBE USERS' MANUAL VERSION 5.0
2014 © BRIDGE Technologies Co AS - Bentsebrugata 20 - N-0476 Oslo, Norway - tel: +47 22 38 51 00 -
www.bridgetech.tv
54
Page 54
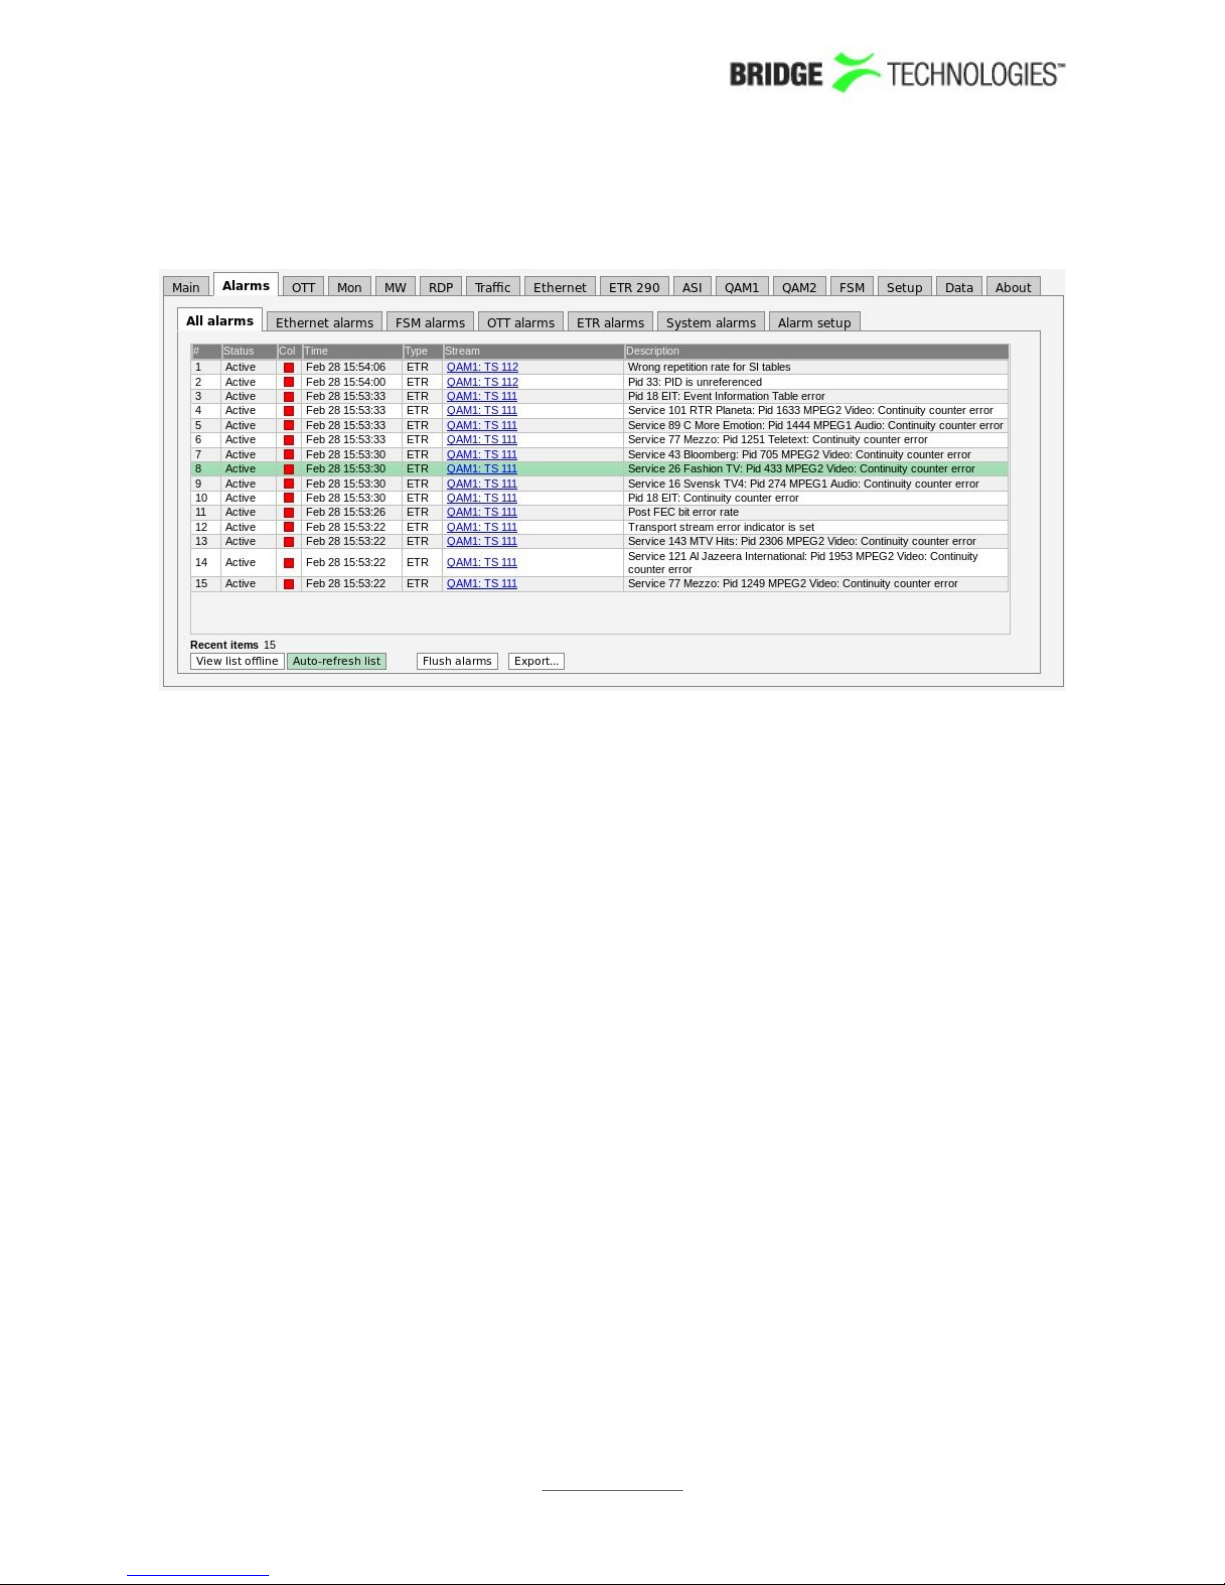
are resolved within 1 second, otherwise it will generate alarms. This can be overridden
by checking the “Treat ethernet events as alarms” box in the Setup - Params view
6.2.1 Alarms - All Alarms
The Alarms view gives the user the possibility of viewing alarms according to type or
as one complete list. The Ethernet alarms list, FSM alarms list, ETR alarms list and
System alarms list can hold 400, 100, 400 and 100 alarms respectively and are
independent of each other, meaning that one may become full without affecting the
other lists.
If Auto-refresh list is selected, the alarm list will be continuously updated with new
alarms. Active alarms are always located at the top of the list.
Clicking the View list offline button gives the user the opportunity to view all stored
alarms and events. By clicking one of the blue information icons leftmost in the offline
list, a detailed alarm description can be viewed. The search field in the upper right
corner of the view allows the user to type a text string and the alarm list is updated to
display only streams and alarms matching the specified text. To updated the offline
alarm list click the Auto-refresh list button and then go back to the offline mode.
PROBE USERS' MANUAL VERSION 5.0
2014 © BRIDGE Technologies Co AS - Bentsebrugata 20 - N-0476 Oslo, Norway - tel: +47 22 38 51 00 -
www.bridgetech.tv
55
Page 55
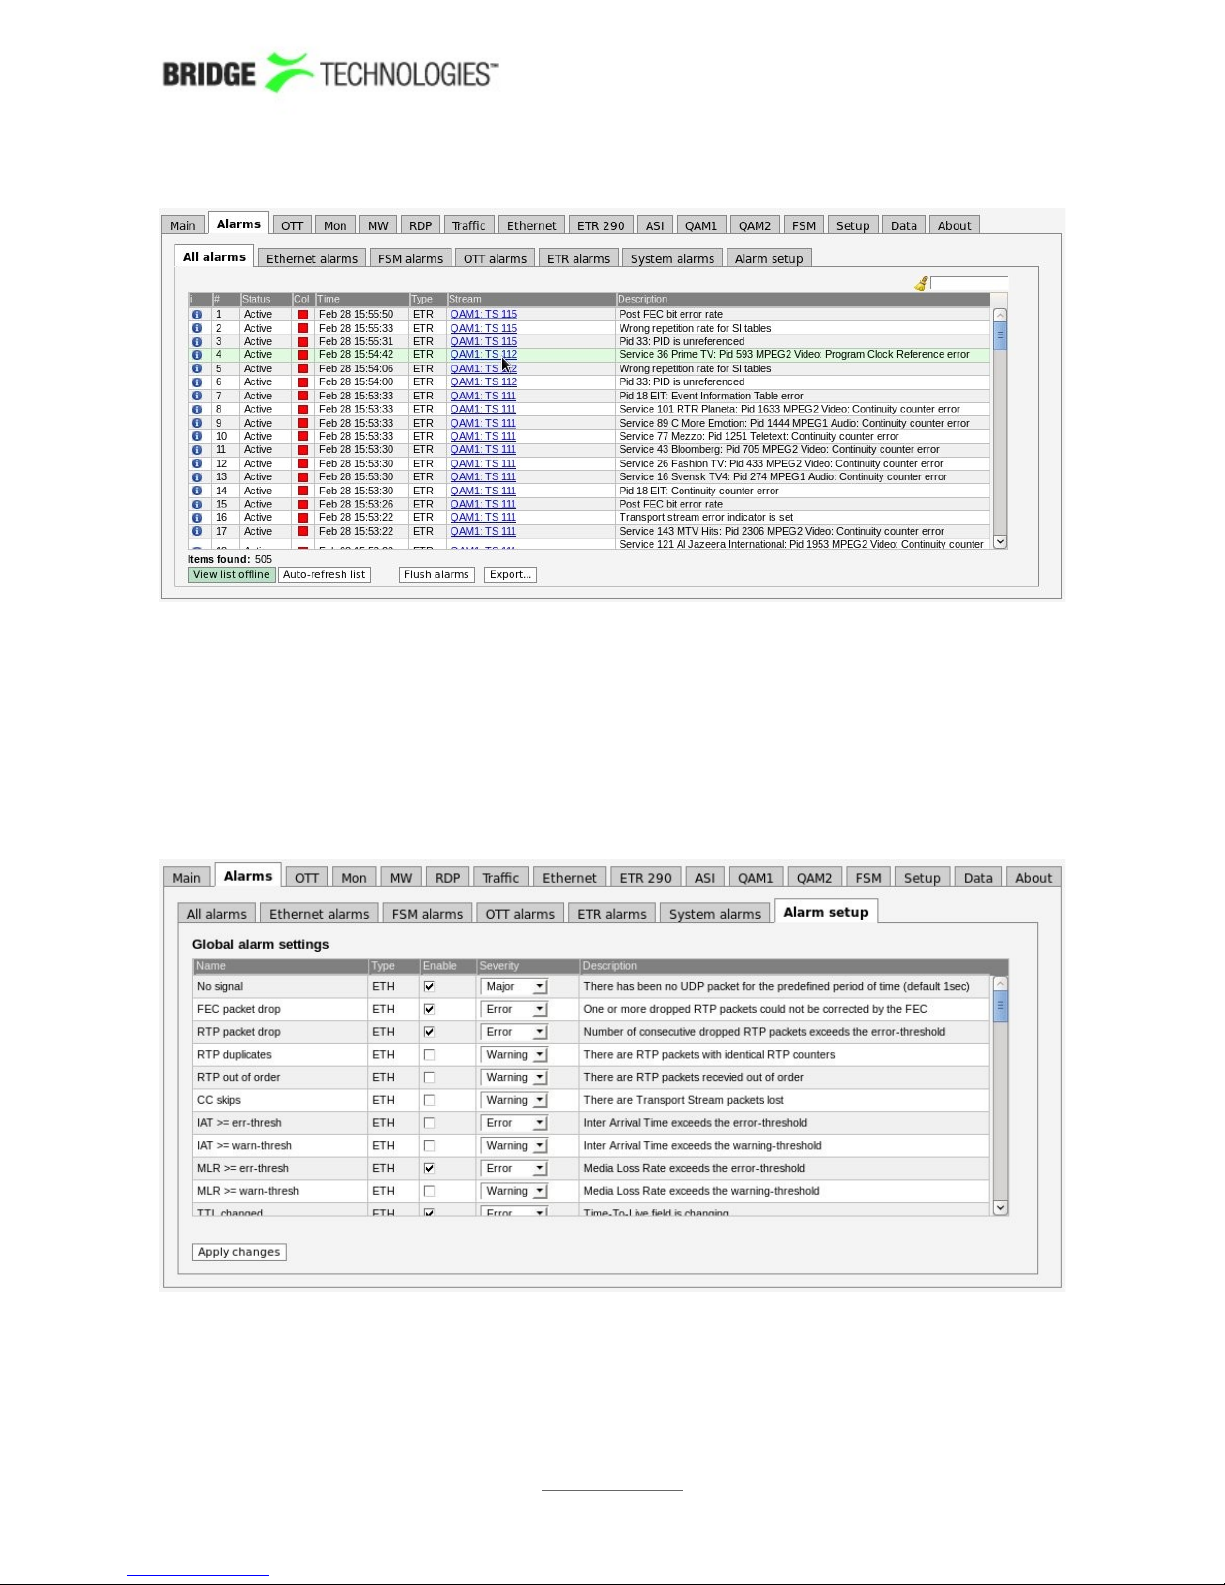
The alarm lists may be cleared by clicking the Flush alarms button. However it
should be noted that this action will permanently clear the alarm lists – they cannot be
restored.
The Export button enables export of the corresponding alarm list as an XML-file. This
file will open in a new window.
6.2.2 Alarms - Alarm setup
The Alarm setup represents the final probe filtering stage for alarms. The user
selects whether an alarm should be enabled or ignored, and associates an error
severity level with each alarm.
PROBE USERS' MANUAL VERSION 5.0
2014 © BRIDGE Technologies Co AS - Bentsebrugata 20 - N-0476 Oslo, Norway - tel: +47 22 38 51 00 -
www.bridgetech.tv
56
Page 56

Figure 7 in section 6.2 gives an overview of the total alarm handling of a probe. The
settings in the Alarm setup view are represented by the Alarm Settings box in this
figure.
Note that the probe alarm handling will also depend on the threshold template
settings defined by the user in the Ethernet - Ethernet thresh., ETR 290 - ETR
thresh., ETR 290 - PID thresh. , ETR 290 - Service thresh. and OTT –
Threshold views.
Also note that only enabled alarms are shown in the alarm lists and forwarded as
SNMP traps. Enabling or disabling probe alarms does however not affect the alarms
presented by the VideoBridge Controller. Refer to appendix I for a description of the
probe versus VBC alarm handling.
The following alarm severity levels may be selected:
OK: If enabled, the alarm will be present in the alarm list, colour green
Warning: If enabled, the alarm will be present in the alarm list, colour yellow
Error: If enabled, the alarm will be present in the alarm list, colour orange
Major: If enabled, the alarm will be present in the alarm list, colour red
Fatal: If enabled, the alarm will be present in the alarm list, colour black
The following alarms and events are configured:
ETH (Ethernet) alarms
No signal: There has been no UDP packet for the
predefined period of time (default
1sec)
Default: Enabled, severity
Major
FEC
packet
drop:
One or more RTP packets could not be
corrected by the FEC
Default: Enabled, severity
Error
RTP
packet
drop:
Number of RTP packet drops - only
available if RTP headers are present
Default: Enabled, severity
Error
RTP
duplicates
:
Number of RTP packets with identical
RTP counters
Default: Disabled, severity
Warning
RTP out of
order:
Number of RTP packets recevied out of
order
Default: Disabled, severity
Warning
CC skips: Number of transport stream
discontinuities due to packet loss.
Note that the CC skips number does
not necessarily equal the number of
lost packets, as several consecutive
packets lost will be counted as one CC
Default: Disabled, severity
Warning
PROBE USERS' MANUAL VERSION 5.0
2014 © BRIDGE Technologies Co AS - Bentsebrugata 20 - N-0476 Oslo, Norway - tel: +47 22 38 51 00 -
www.bridgetech.tv
57
Page 57

skip.
IAT >=
err-
thresh:
The Inter-packet Arrival Time exceeds
the error threshold
Default: Disabled, severity
Error
IAT >=
warn-
thresh:
The Inter-packet Arrival Time exceeds
the warning threshold
Default: Disabled, severity
Warning
MLR >=
err-
thresh:
The Media Loss Rate exceeds the
error-threshold
Default: Enabled, severity
Error
MLR >=
warn-
thresh:
The Media Loss Rate exceeds the
warning-threshold
Default: Disabled, severity
Warning
TTL
changed:
The Time-To-Live field is changing Default: Enabled, severity
Error
TOS
changed:
The Type-Of-Service field is changing Default: Enabled, severity
Error
Multiple
mcast
sources:
There are multiple multicast sources Default: Enabled, severity
Error
Mcast
source
changed:
The multicast source changed to one
of the valid multicast sources specified
by the operator.
Default: Enabled, severity
Error
Bitrate
overflow:
The stream bitrate exceeds the
maximum bitrate Ethernet threshold
value specified by the operator.
Default: Enabled, severity
Error
Bitrate
underflow
:
The stream bitrate goes below the
minimum bitrate Ethernet threshold
value specified by the operator.
Default: Enabled, severity
Error
FSM alarms
Full service
monitoring:
Enable to view all FSM alarms. Default: Enabled, severity
Major
ETR (ETR 290) alarms
TS Sync: No TS Sync Default: Enabled, severity
Major
Sync byte: Sync byte error Default: Enabled, severity
Major
PAT: Program Association Table error Default: Enabled, severity
Major
PROBE USERS' MANUAL VERSION 5.0
2014 © BRIDGE Technologies Co AS - Bentsebrugata 20 - N-0476 Oslo, Norway - tel: +47 22 38 51 00 -
www.bridgetech.tv
58
Page 58

Continuity: Continuity counter error Default: Enabled, severity
Major
PMT: Program Map Table error Default: Enabled, severity
Major
PID: PID is missing Default: Enabled, severity
Major
Transport: Transport stream error indicator is
set
Default: Enabled, severity
Major
CRC: Table checksum error Default: Enabled, severity
Major
PCR: Program Clock Reference error Default: Enabled, severity
Major
PCR
Accuracy:
Program Clock Reference accuracy
error
Default: Enabled, severity
Major
PTS: Presentation Time Stamp error Default: Enabled, severity
Major
CAT: Conditional Access Table error Default: Enabled, severity
Major
NIT: Network Information Table error Default: Enabled, severity
Major
SI Rep Rate: Wrong repetition rate for SI tables Default: Enabled, severity
Major
Unref PID: PID is unreferenced Default: Enabled, severity
Major
SDT: Service Description Table error Default: Enabled, severity
Major
EIT: Event Information Table error Default: Enabled, severity
Major
RST: Running Status Table error Default: Enabled, severity
Major
TDT: Time Date Table error Default: Enabled, severity
Major
MGT: Master Guide Table error Default: Enabled, severity
Major
VCT: Virtual Channel Table error Default: Enabled, severity
Major
PIM/PNM: PIM/PNM error Default: Enabled, severity
Major
RRT: Region Rating Table error Default: Enabled, severity
Major
ATSC EIT: ATSC EIT Table error Default: Enabled, severity
PROBE USERS' MANUAL VERSION 5.0
2014 © BRIDGE Technologies Co AS - Bentsebrugata 20 - N-0476 Oslo, Norway - tel: +47 22 38 51 00 -
www.bridgetech.tv
59
Page 59

Major
STT: System Time Table error Default: Enabled, severity
Major
ETT: Extended Text Table error Default: Enabled, severity
Major
CA System: CA System error Default: Enabled, severity
Major
PID checks: PID check error Default: Enabled, severity
Major
Service
checks:
Service check error Default: Enabled, severity
Major
MIP: Megaframe Insertion Packet error Default: Enabled, severity
Major
Pre FEC BER: Bit error rate prior to Viterbi FEC
above specified threshold
Default: Enabled, severity
Major
PROBE USERS' MANUAL VERSION 5.0
2014 © BRIDGE Technologies Co AS - Bentsebrugata 20 - N-0476 Oslo, Norway - tel: +47 22 38 51 00 -
www.bridgetech.tv
60
Page 60

Post FEC
BER:
Bit error rate after Viterbi FEC
above specified threshold
Default: Enabled, severity
Major
MER: Modulation Error Ratio above
specified threshold
Default: Enabled, severity
Major
SNR: Signal to Noise Ratio below
specified threshold
Default: Enabled, severity
Major
Signal
strength:
Signal strength below specified
threshold
Default: Enabled, severity
Major
SFN meas: Measurements to do with DVB-T/T2
SFN networks
Default: Enabled, severity
Major
Packet error
count:
Detection of one or more errored
packets after demodulator FEC
Default: Enabled, severity
Major
Centre
frequency:
Difference between received and
configured RF frequency exceeds
speficied threshold (VB262, VB252)
Default: Enabled, severity
Major
Symbol rate: Difference between received and
configured symbol rate exceeds
specified threshold (VB262)
Default: Enabled, severity
Major
Post BCH
FER:
DVB-T/T2 BCH Frame Error Rate
exceeds speficied threshold
(VB252)
Default: Enabled, severity
Major
Interface
overflow:
Input interface overflow error Default: Enabled, severity
Major
SYS (system) events
[Critical
system
errors]:
Enable this to view all critical
system errors
Default: Enabled, severity
Fatal
[System
errors]:
Enable this to view all system
errors
Default: Enabled, severity
Major
[System
info]:
Enable this to view system
information messages
Default: Enabled, severity OK
OTT alarms
The number
of profiles
changed:
The number of profiles flagged in
the manifest file changed
Default: Enabled, severity
Warning
Download The download duration time Default: Disabled, severity
PROBE USERS' MANUAL VERSION 5.0
2014 © BRIDGE Technologies Co AS - Bentsebrugata 20 - N-0476 Oslo, Norway - tel: +47 22 38 51 00 -
www.bridgetech.tv
61
Page 61

bitrate low: exceeds the OTT bitrate threshold.
The bitrate threshold is part of the
OTT threshold template defined in
the OTT – Thresholds view. A
threshold template is assigned to a
stream in the OTT – Setup view.
Warning
Download
bitrate too
low:
The download duration time
exceeds the OTT chunk duration
time.
Default: Enabled, severity
Error
Manifest
size:
The manifest file size exceeds the
OTT manifest size threshold.
Default: Enabled, severity
Warning
Actual
bitrate:
The actual measured bitrate does
not match the profile bitrate
specified in the manifest file.
Default: Enabled, severity
Warning
Download
timeout:
The download time exceeds twice
the chunk duration time.
Default: Enabled, severity
Major
Address
resolve error:
Unable to resolve address name. Default: Enabled, severity
Error
Connection
failed:
Connection failed. Default: Enabled, severity
Error
Send error: Could not send data to host. Default: Enabled, severity
Error
Receive
error:
Could not receive data from host. Default: Enabled, severity
Major
Empty reply: Response did not contain any data
in body.
Default: Enabled, severity
Major
HTTP error: Invalid HTTP response. Default: Enabled, severity
Major
HTTP redirect
error:
HTTP 3xx redirection error Default: Enabled, severity
Major
HTTP client
error:
HTTP 4xx client error Default: Enabled, severity
Major
HTTP server
error:
HTTP 5xx server error Default: Enabled, severity
Major
Static
manifest:
Manifest file unchanged for longer
than configured threshold.
Default: Enabled, severity
Major
Manifest
parse error:
Failed to parse manifest file. Invalid
format.
Default: Enabled, severity
Major
Unknown
manifest:
Cannot recognize manifest XML
format.
Default: Enabled, severity
Fatal
PROBE USERS' MANUAL VERSION 5.0
2014 © BRIDGE Technologies Co AS - Bentsebrugata 20 - N-0476 Oslo, Norway - tel: +47 22 38 51 00 -
www.bridgetech.tv
62
Page 62
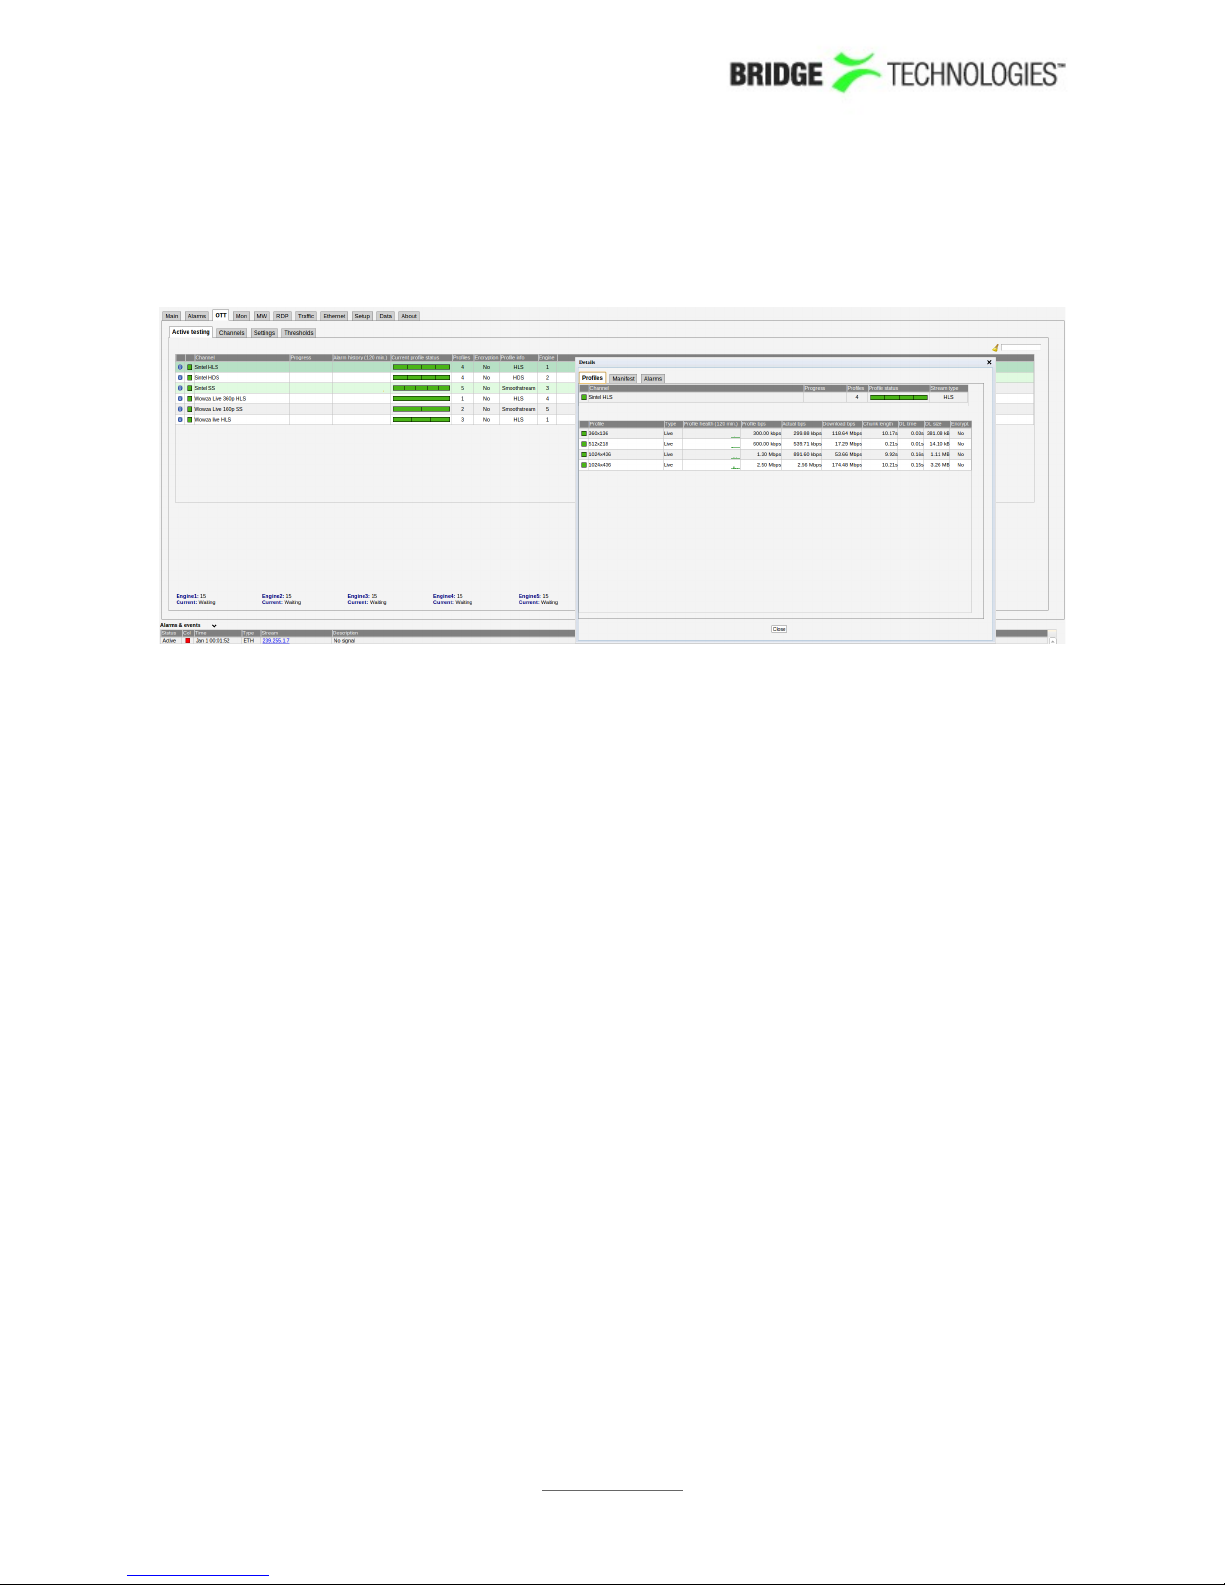
6.3 OTT (requires the OTT Option)
6.3.1 Active testing
The OTT option enables monitoring of OTT channels. Up to five OTT engines, each
individually licensed, can work in parallel, and one engine can analyse up to ten OTT
channels sequentially. If the probe is licenced with more than one OTT engine the user
is free to allocate the total number of channels between engines. As an example a
probe licenced with two OTT engines may have five channels allocated to one engine
and fifteen to the other.
The probe will parse a channel's manifest file, and for a live stream one of the latest
chunks in each OTT profile's chunk sequence will be analysed. The engine then moves
on to the next OTT channel in the channel list defined by the user. For a VoD stream
the OTT engine will analyse all chunks in the VoD file, one in each round-robin loop.
If manifest file parsing or chunk analysis reveals an error, an alarm will be raised. Note
that some alarms depend on user defined threshold values. Alarms must also be
enabled in the Alarm – Alarm setup view.
PROBE USERS' MANUAL VERSION 5.0
2014 © BRIDGE Technologies Co AS - Bentsebrugata 20 - N-0476 Oslo, Norway - tel: +47 22 38 51 00 -
www.bridgetech.tv
63
Page 63

The following OTT information is displayed in the Active Testing view:
Channel: The channel name defined by the user and linked to a URL in the
OTT – Setup view. A bulb indicates the current status of the
channel, i.e. the most severe profile status.
Progress: Channels will be analysed sequentially, and the progress bar
shows which channel is currently being monitored and how
analysis is progressing.
Alarm history
(120 min.):
A bar graph showing alarm severity history for the last 120
minutes. Each bar colour represents the alarm severity level as
configured under Main - alarm setup. The
Current
profile status:
The channel health bar displays the current status for individual
channel profiles. Profiles are separated by vertical black lines.
Colours indicate profile alarm status:
Green: OK
Yellow: Warning
Orange: Error
Red: Major
Black: Fatal
Profiles: The number of profiles associated with a channel
Encryption: Scrambling information is resolved from the profile manifest. If the
profile is scrambled the encryption field will read Yes. If the profile
is transmitted in clear the encryption field will read No.
Profile info: Channel and profile information is resolved from the manifest files.
At channel level the OTT format is displayed (Smoothstream,
HLS,Adobe HDS or MPEG DASH). At profile level the profile bitrate
is displayed.
Engine: The probe can be licensed with up to 5 OTT engines. Each engine
can handle up to 10 channels. The engine number allocated to this
channel is shown here as a number from 1 to 5.
Details - Profiles
By clicking the blue information icon next to the channel a detailed popup view is
shown for that channel. The Profiles view in this popup consists of two tables detailed
below:
The following information relevant for the overall OTT channel is shown in the first
part of the Details Profiles popup window:
Channel: The channel name defined by the user and linked to a URL in the
OTT – Setup view. A bulb indicates the current status of the
channel, i.e. the most severe profile status.
Progress: Channels will be analysed sequentially, and the progress bar
shows which channel is currently being monitored and how
analysis is progressing.
PROBE USERS' MANUAL VERSION 5.0
2014 © BRIDGE Technologies Co AS - Bentsebrugata 20 - N-0476 Oslo, Norway - tel: +47 22 38 51 00 -
www.bridgetech.tv
64
Page 64

Profiles: The number of profiles associated with a channel
Profile
status:
The channel health bar displays the current status for individual
channel profiles. Profiles are separated by vertical black lines.
Colours indicate profile alarm status:
Green: OK
Yellow: Warning
Orange: Error
Red: Major
Black: Fatal
Stream type: Channel and profile information is resolved from the manifest files.
At channel level the OTT format is displayed (Smoothstream, HLS,
Adobe HDS or MPEG DASH).
In the same view below the table for the overall channel a more detailed view per
channel profile is shown with the following information in it:
Profile: The name of the OTT profile as flagged in the manifest files
Type: Live for live content or VoD for stored content. The distinction
between the two is done based on whether the profile sequence
numbers update or not.
Profile
health:
A timeline graph display of a combined bitrate and alarm
representation for individual profiles. Refer to Appendix III for a
description of these graphs. The timeline duration is 2 hours, and
the graph resolution is one minute.
Profile bps: The profile nominal bandwidth as flagged in the manifest files.
Actual bps: The actual profile bitrate, i.e. the chunk size (megabits) divided by
the chunk length (seconds). The actual profile bitrate should
match the manifest bitrate specification within limits defined by
the user in the OTT thresholds template associated with a channel.
Otherwise an alarm will be raised.
Download
bps:
The download bitrate, i.e. the chunk size (megabits) divided by the
download time (seconds).
Chunk length: The profile chunk length (seconds) specified in the manifest file.
Download
time:
The actual profile chunk download time (seconds)
Download
size:
The actual profile chunk size (megabits)
Encrypt: Yes or No depending on whether the content for that profile is
encrypted or not.
PROBE USERS' MANUAL VERSION 5.0
2014 © BRIDGE Technologies Co AS - Bentsebrugata 20 - N-0476 Oslo, Norway - tel: +47 22 38 51 00 -
www.bridgetech.tv
65
Page 65
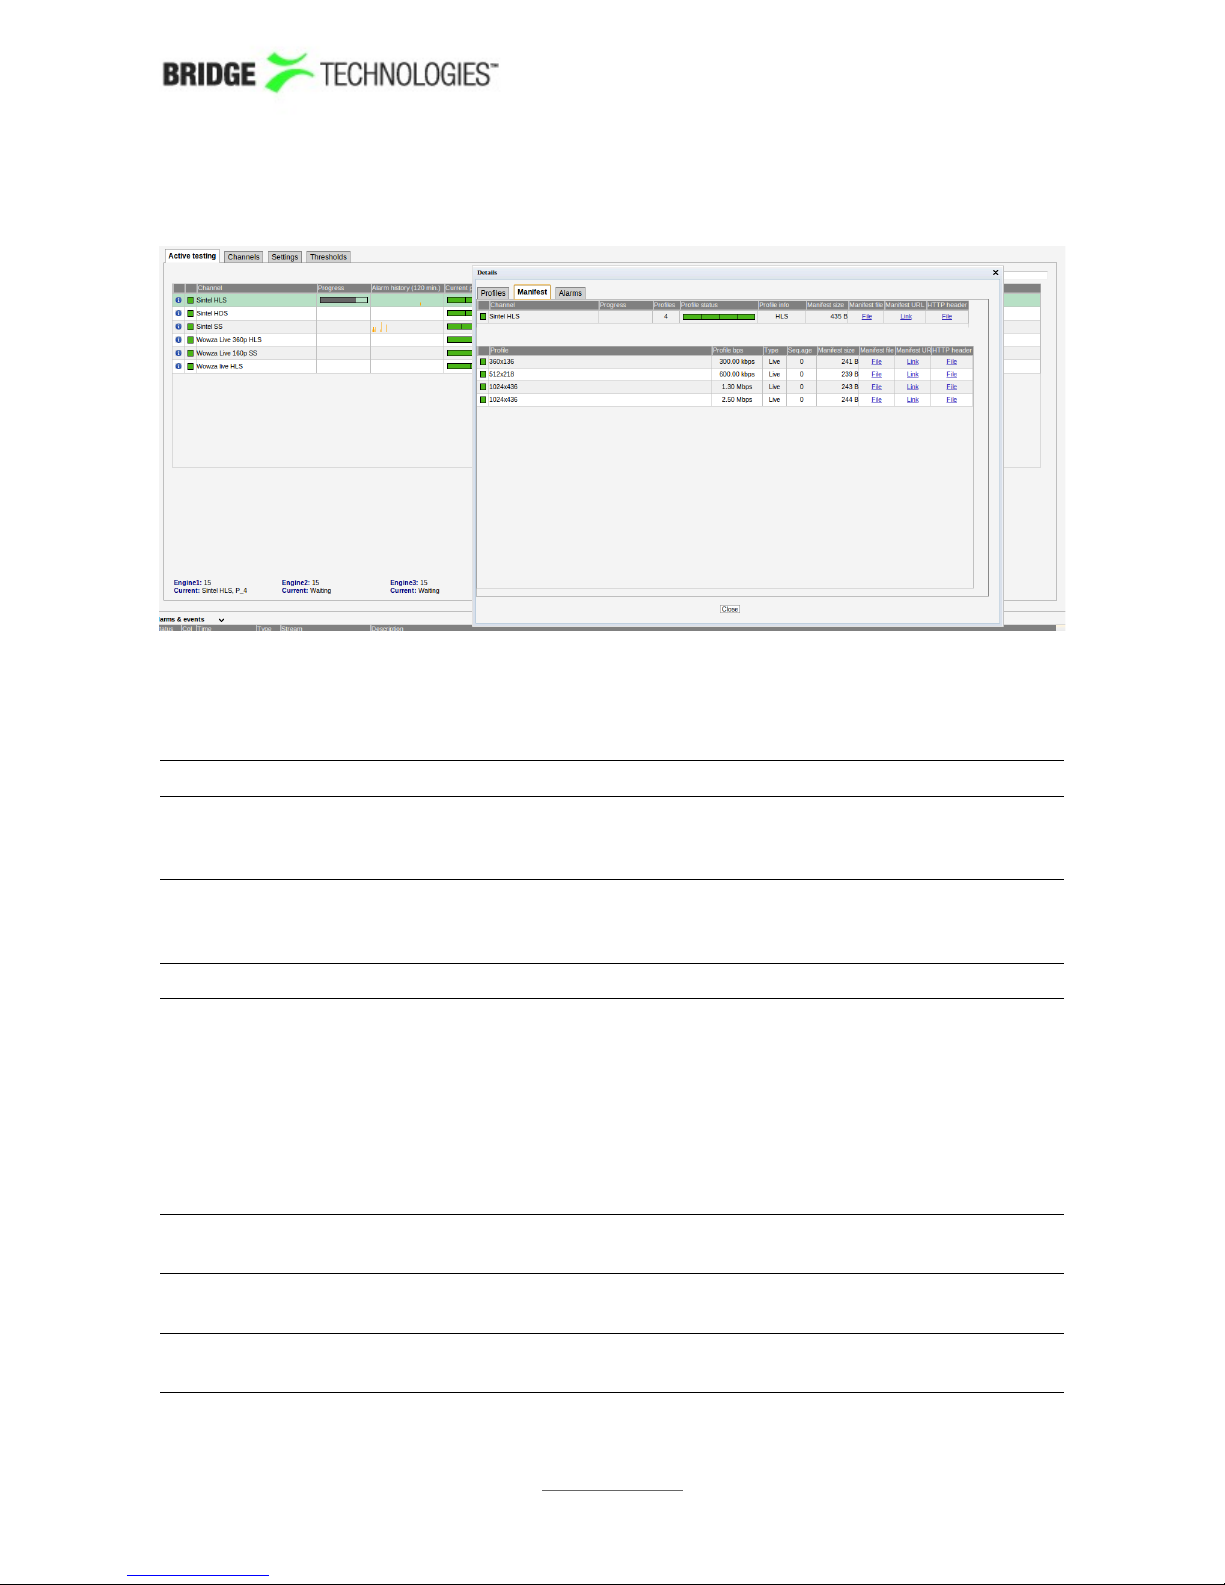
Details - Manifest
The Manifest view shows health information on the overall manifest file for the
channel as well as for the manifest files for the individual profiles.
Active testing - Details - Manifest:
Channel: The channel name defined by the user and linked to a URL in the
OTT – Setup view. A bulb indicates the current status of the
channel, i.e. the most severe profile status.
Progress: Channels will be analysed sequentially, and the progress bar
shows which channel is currently being monitored and how
analysis is progressing.
Profiles: The number of profiles associated with a channel
Profile
status:
The channel health bar displays the current status for individual
channel profiles. Profiles are separated by vertical black lines.
Colours indicate profile alarm status:
Green: OK
Yellow: Warning
Orange: Error
Red: Major
Black: Fatal
Profile info: The type of stream is shown here. Apple HLS, Microsoft
Smoothstream, Adobe HDS, or MPEG DASH.
Manifest size: The size in bytes of the main/top manifest file for the overall
channel.
Manifest URL: A clickable link to the current main/top manifest file for the overall
channel.
PROBE USERS' MANUAL VERSION 5.0
2014 © BRIDGE Technologies Co AS - Bentsebrugata 20 - N-0476 Oslo, Norway - tel: +47 22 38 51 00 -
www.bridgetech.tv
66
Page 66

HTTP header: The current HTTP header of the main/top manifest file for the
overall channel.
Just below the channel manifest information in the same window is the detailed
manifest information per profile. This view contains the following information:
Profile: The name of the OTT profile as flagged in the manifest files
Profile bps: The profile nominal bandwidth as flagged in the manifest files.
Type: Live for live content or VoD for stored content. The distinction
between the two is done based on whether the profile sequence
numbers update or not.
Seq.age: The profile sequence age.
Manifest size: The size in bytes of the manifest file for a particular profile.
Manifest file: Clickable URL for displaying the manifest file as text for this
particular profile.
Manifest URL: Clickable URL to the profile manifest file
HTTP header: URL to HTTP header in text form for a particular profile manifest
file.
PROBE USERS' MANUAL VERSION 5.0
2014 © BRIDGE Technologies Co AS - Bentsebrugata 20 - N-0476 Oslo, Norway - tel: +47 22 38 51 00 -
www.bridgetech.tv
67
Page 67
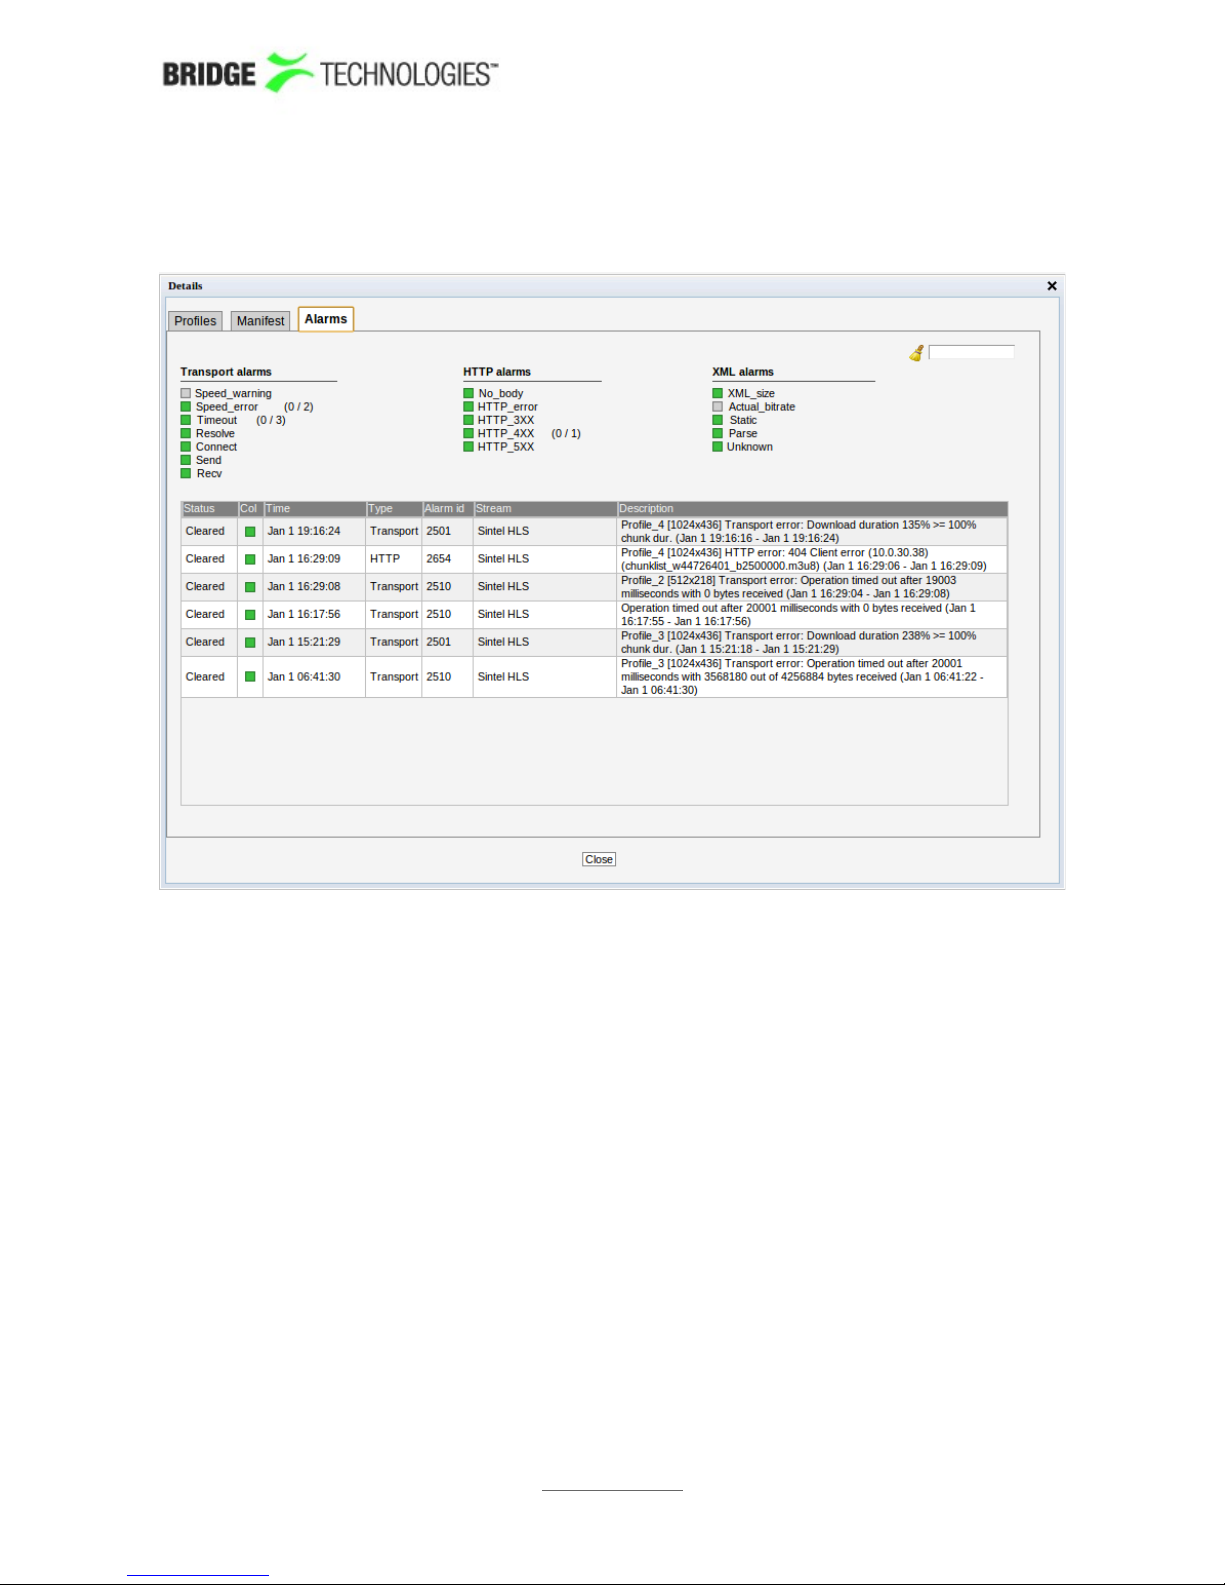
Details – Alarms
The Active testing Details Alarms view gives an at-a-glance overview of any active
OTT alarms for the selected channel. An alarm log for the selected channel is also
provided here.
In the right corner of the popup window is a free text search field used to narrow down
the entries in the alarm log.
The alarms are the same ones as explained for the Alarms Setup view.
PROBE USERS' MANUAL VERSION 5.0
2014 © BRIDGE Technologies Co AS - Bentsebrugata 20 - N-0476 Oslo, Norway - tel: +47 22 38 51 00 -
www.bridgetech.tv
68
Page 68
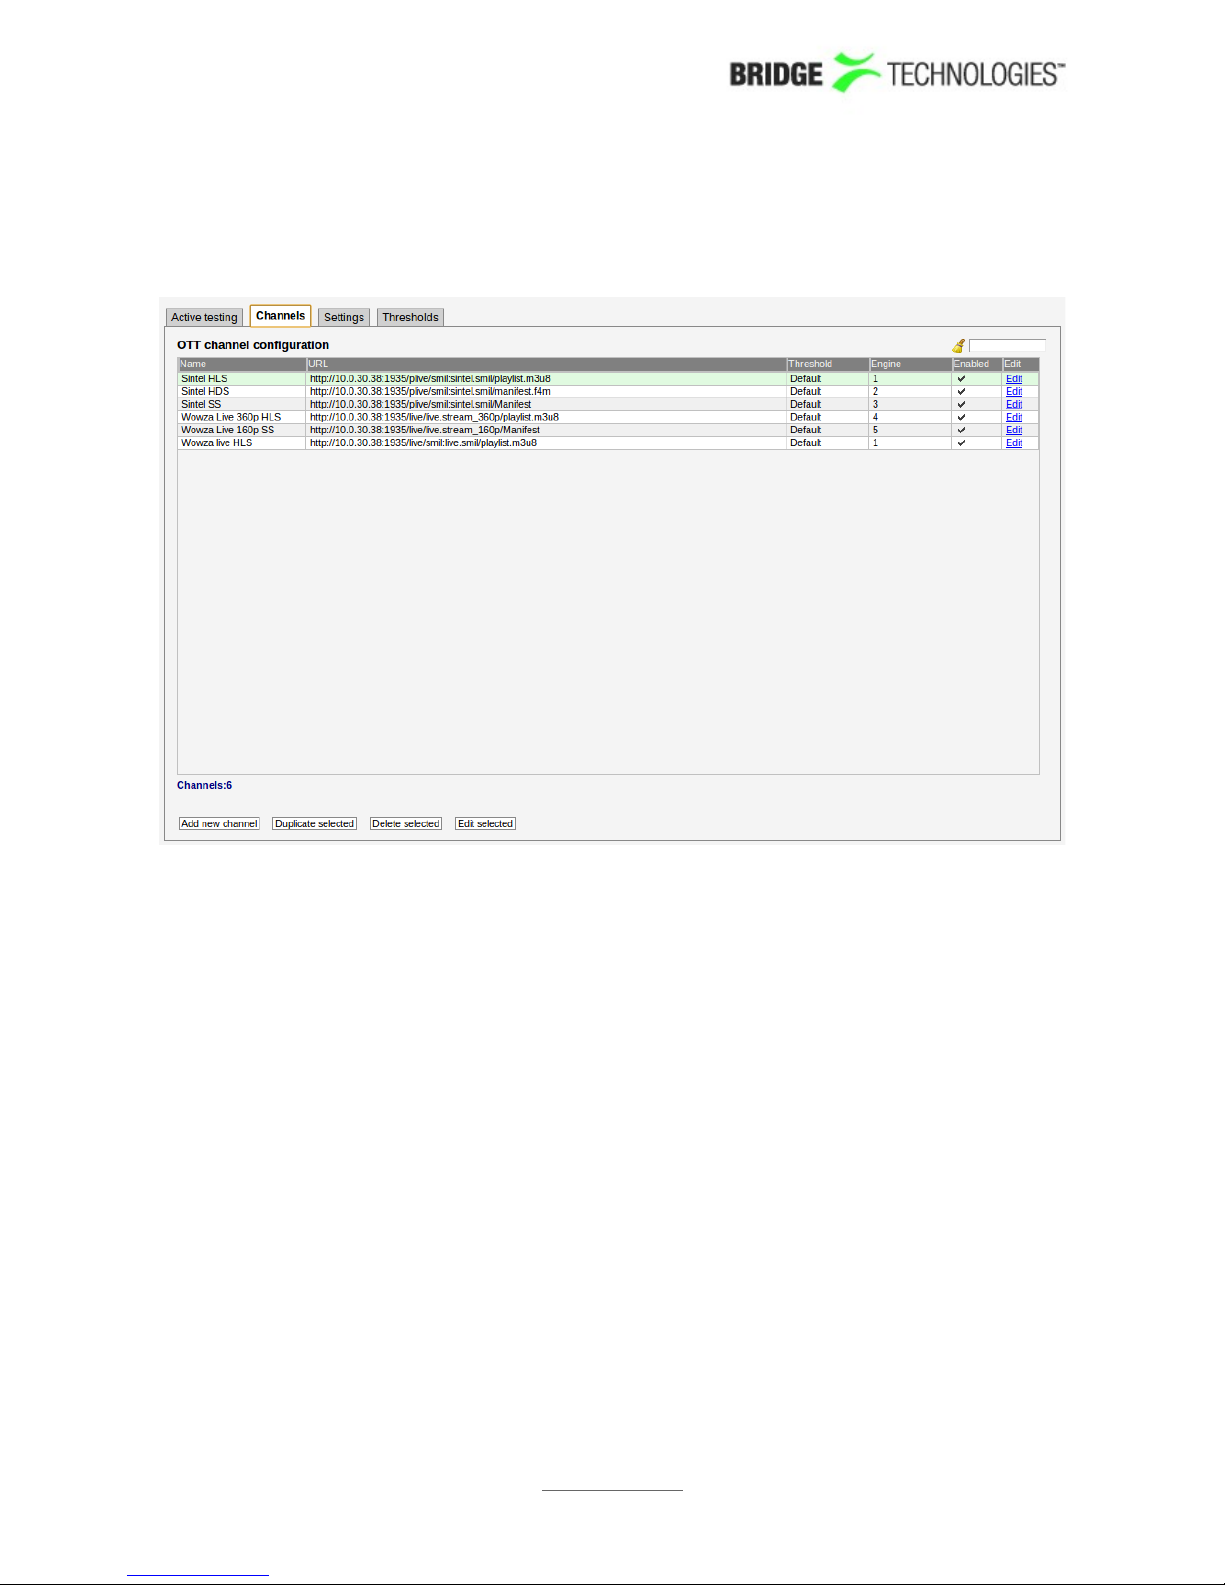
6.3.2 Channels
The OTT Channel Configuration list shows OTT channels configured by the user. To add
a channel to the list click the Add new channel button. This will open the Edit
channel pop-up view, allowing the user to define channel parameters. A list channel
entry can be selected by clicking the channel; the list entry will be highlighted. Several
list entries can be selected by using regular Ctrl + click functionality. Clicking the
Duplicate selected button will open the Edit channel pop-up view with all channel
parameters duplicated, except the channel name. Clicking the Delete selected will
delete the highlighted list entry. Clicking the Edit selected will open the Edit
channel pop-up view associated with the highlighted channel. Batch editing is
supported; this is convenient if a new threshold template should be assigned to a
number of channels or if monitoring of several channels should be enabled or
disabled. Select the channels and click the Edit selected button. Parameters differing
between channels will be indicated in the Edit selected pop-up view by an asterisk
wildcard symbol.
The search field allows searching for one for more list entries containing a user defined
text string.
The column named Engine indicates which OTT engine is assigned to what channel.
The probe can be licensed with anywhere from 1 up to 5 OTT engines. Each engine is
capable of handling 10 channels.
PROBE USERS' MANUAL VERSION 5.0
2014 © BRIDGE Technologies Co AS - Bentsebrugata 20 - N-0476 Oslo, Norway - tel: +47 22 38 51 00 -
www.bridgetech.tv
69
Page 69
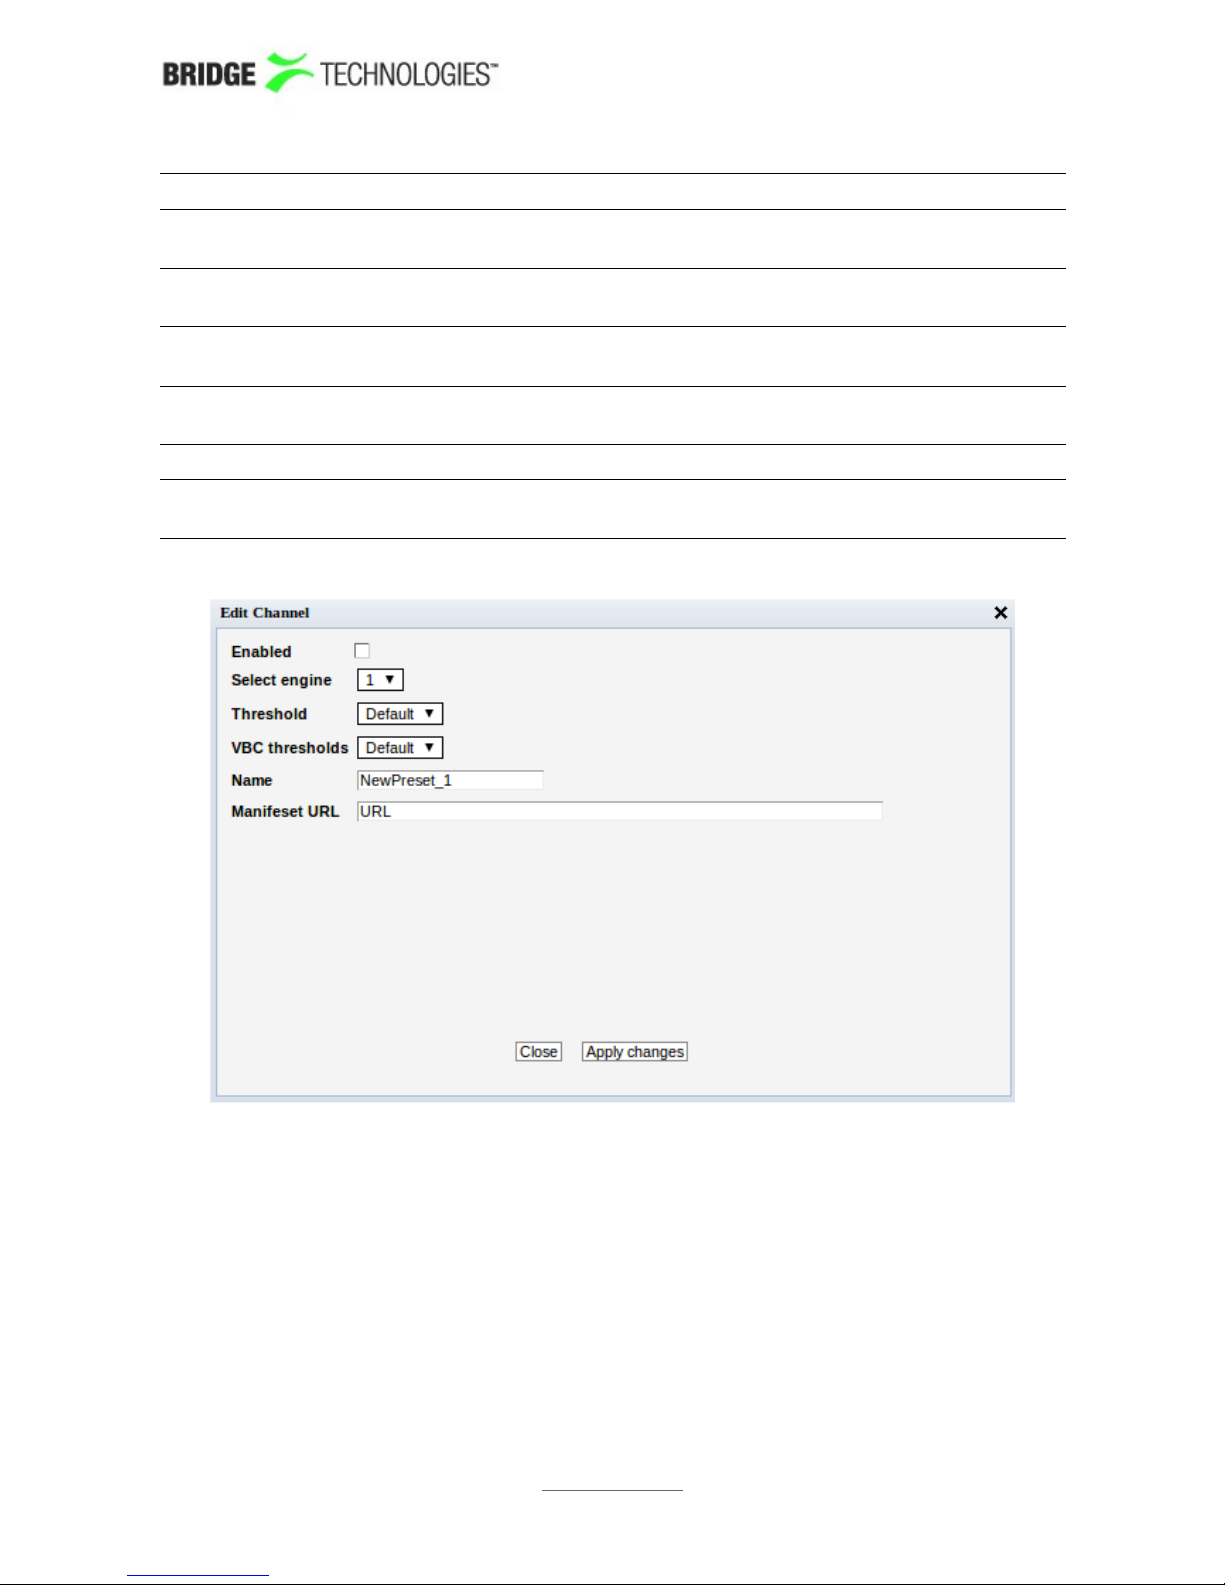
OTT Channel Configuration
Enabled: If channel monitoring is enabled the 'Enabled' field will be check
marked.
Select
engine:
A number between 1 and 5 depending on license activated indicating
which OTT engine the channel uses.
Threshold: The OTT threshold template assigned to the channel by the user
telling the system when to generate alarms.
VBC
thresholds:
The alarm threshold template used to configure when alarms are
generated towards the VBC server.
Name: The channel name specified by the user
Manifest
URL:
The channel URL specified by the user
PROBE USERS' MANUAL VERSION 5.0
2014 © BRIDGE Technologies Co AS - Bentsebrugata 20 - N-0476 Oslo, Norway - tel: +47 22 38 51 00 -
www.bridgetech.tv
70
Page 70
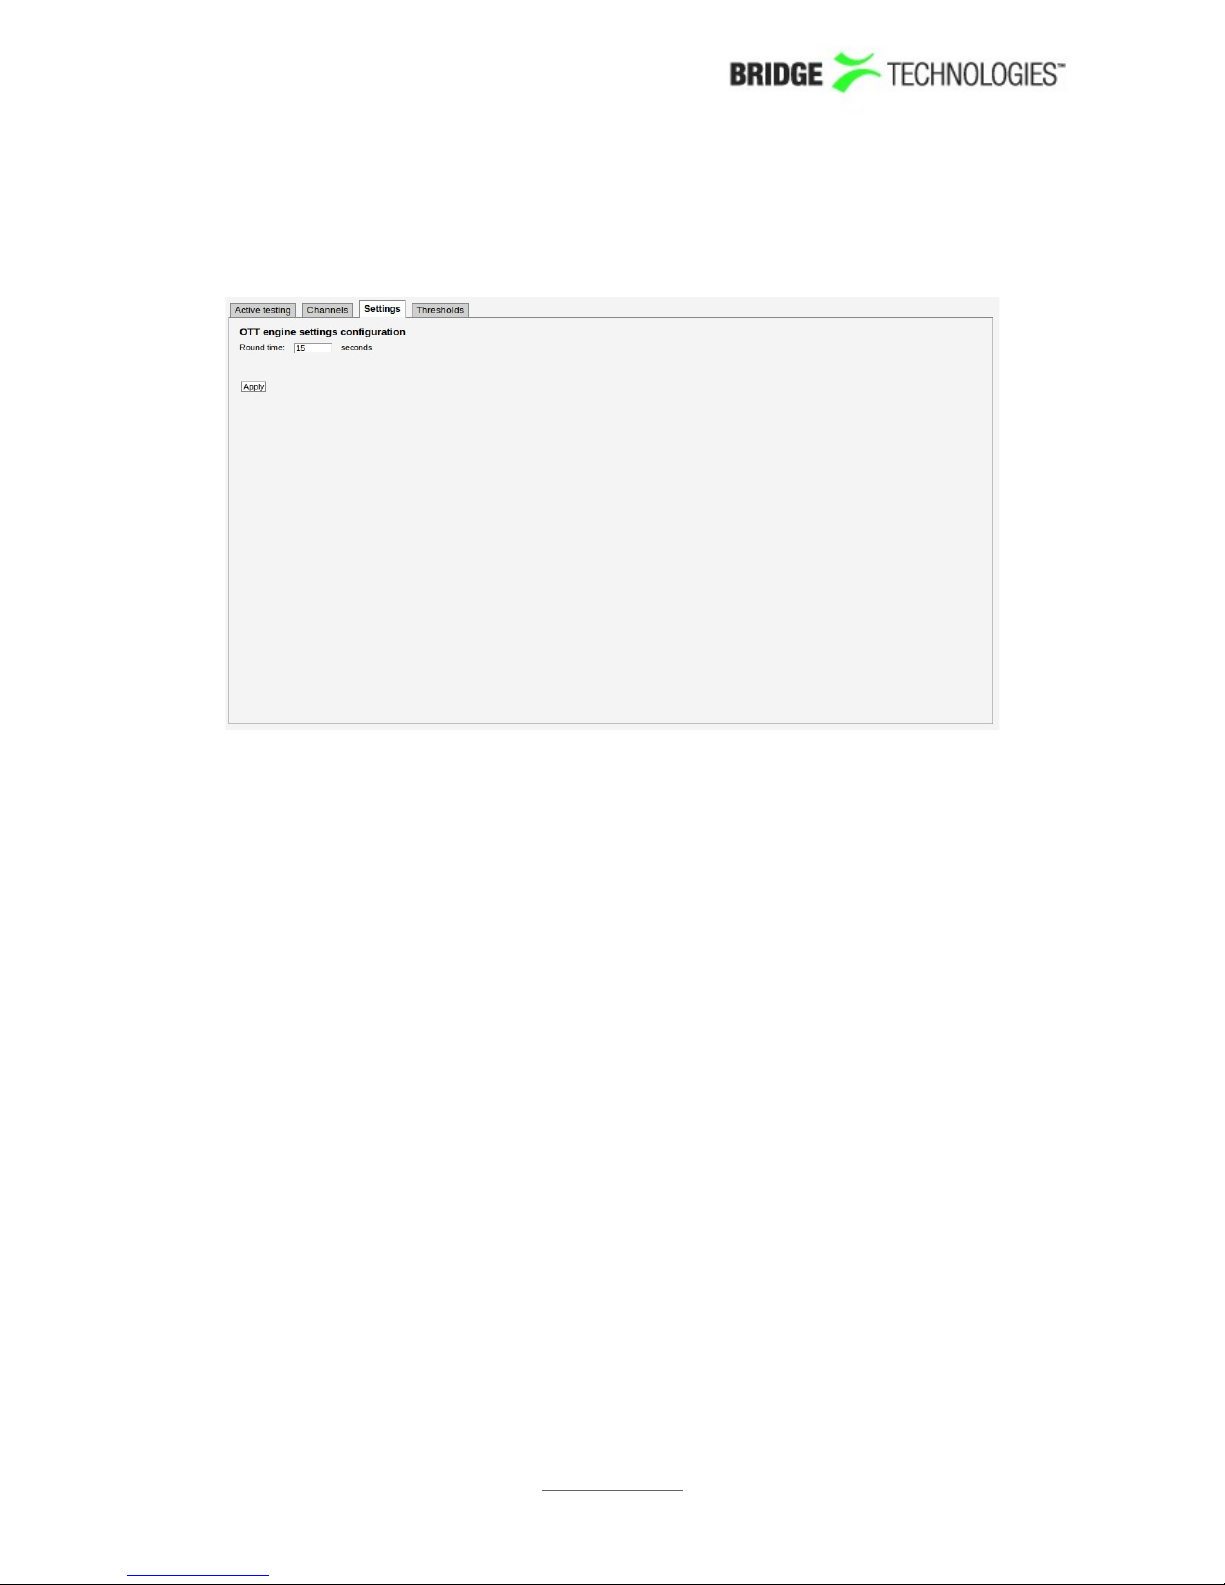
6.3.3 Settings
In the settings section the Round time of every OTT engine may be set to a number
of seconds (Default: 15 seconds). Note: The round time may not be set to any value
less than 1 second. Press Apply to confirm changes made.
PROBE USERS' MANUAL VERSION 5.0
2014 © BRIDGE Technologies Co AS - Bentsebrugata 20 - N-0476 Oslo, Norway - tel: +47 22 38 51 00 -
www.bridgetech.tv
71
Page 71
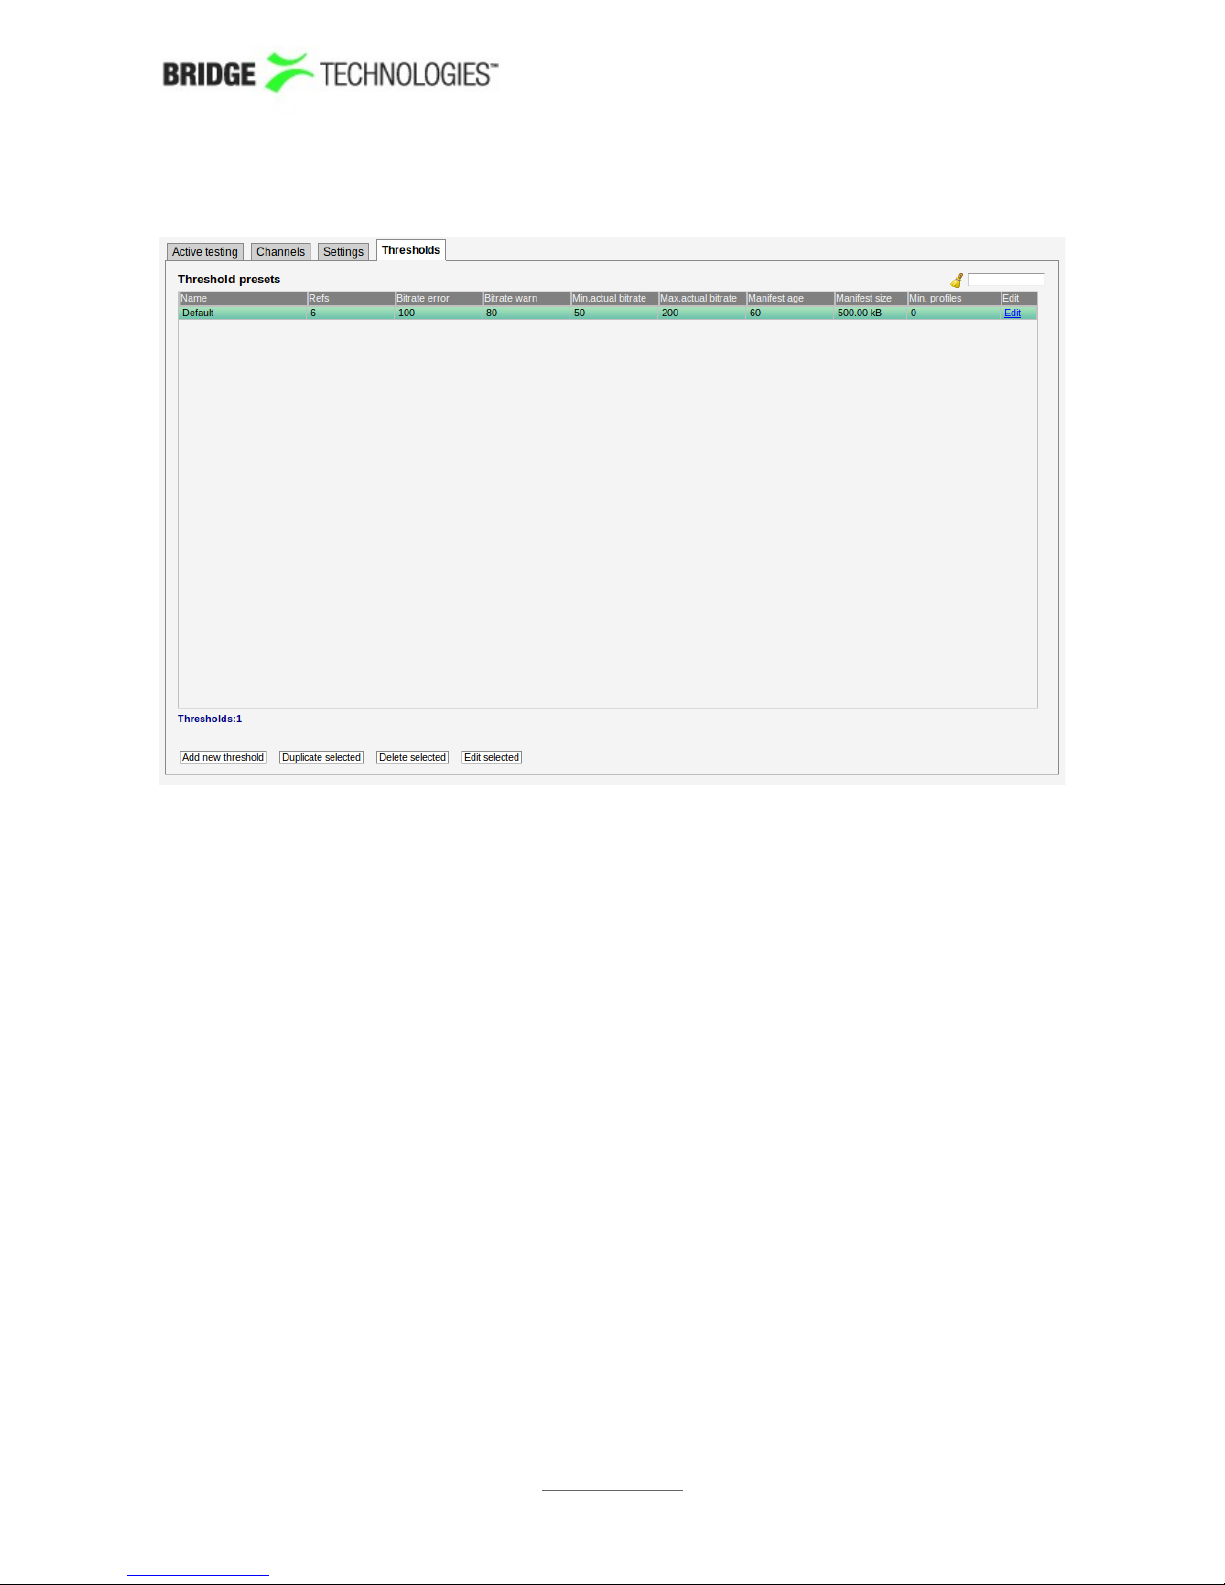
6.3.4 Thresholds
The OTT Threshold presets list shows OTT threshold templates configured by the
user. To add a threshold template to the list click the Add new threshold button. This
will open the Edit threshold pop-up view, allowing the user to define threshold
parameters. A list threshold template entry can be selected by clicking the threshold
template; the list entry will be highlighted. Several list entries can be selected by
using regular Ctrl + click functionality. Clicking the Duplicate selected button will
open the Edit threshold pop-up view with all threshold template parameters
duplicated, except the threshold template name. Clicking the Delete selected will
delete the highlighted list entry. Clicking the Edit selected will open the Edit
channel pop-up view associated with the highlighted threshold template. Batch
editing is supported. Select the threshold templates and click the Edit selected
button. Parameters differing between templates will be indicated in the Edit selected
pop-up view by an asterisk wildcard symbol.
The search field allows searching for one for more list entries containing a user defined
text string.
PROBE USERS' MANUAL VERSION 5.0
2014 © BRIDGE Technologies Co AS - Bentsebrugata 20 - N-0476 Oslo, Norway - tel: +47 22 38 51 00 -
www.bridgetech.tv
72
Page 72
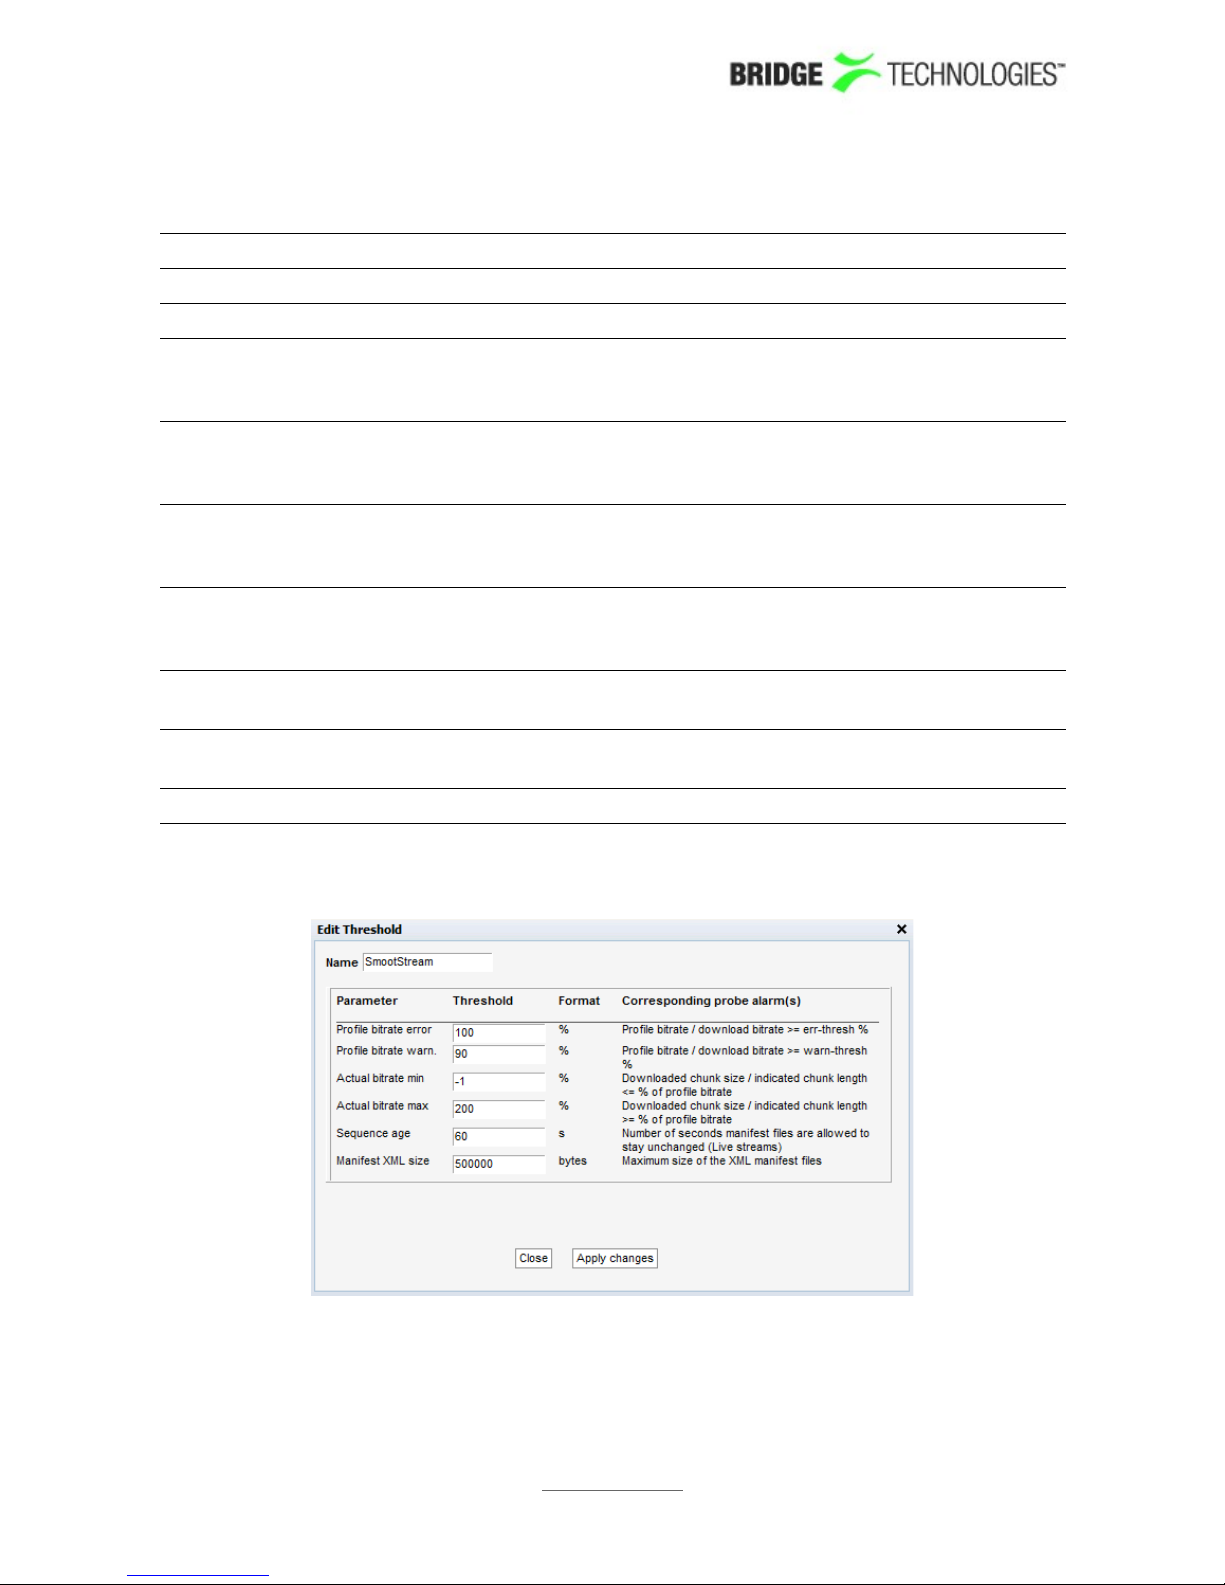
Threshold presets
Name: The threshold template name defined by the user
Refs: The number of channels associated with the threshold template
Bitrate
error:
The maximum allowed difference between profile bitrate and
download bitrate (%). If the difference exceeds the threshold value a
bitrate error alarm will be raised.
Bitrate
warn:
The maximum allowed difference between profile bitrate and
download bitrate (%). If the difference exceeds the threshold value a
bitrate error warning will be raised.
Min. actual
bitrate:
The minimum allowed bitrate when measured actual bitrate is
compared to profile bitrate (%). If the actual bitrate goes below the
threshold an actual bitrate alarm will be raised.
Max. actual
bitrate:
The maximum allowed bitrate when measured actual bitrate is
compared to profile bitrate (%). If the actual bitrate exceeds the
threshold an actual bitrate alarm will be raised.
Manifest
age:
The maximum time a manifest can remain unchanged before a
manifest age alarm is raised
Manifest
size:
The maximum detected size of the manifest before a manifest size
alarm is raised
Edit: Click the Edit link to edit threshold template parameters.
PROBE USERS' MANUAL VERSION 5.0
2014 © BRIDGE Technologies Co AS - Bentsebrugata 20 - N-0476 Oslo, Norway - tel: +47 22 38 51 00 -
www.bridgetech.tv
73
Page 73
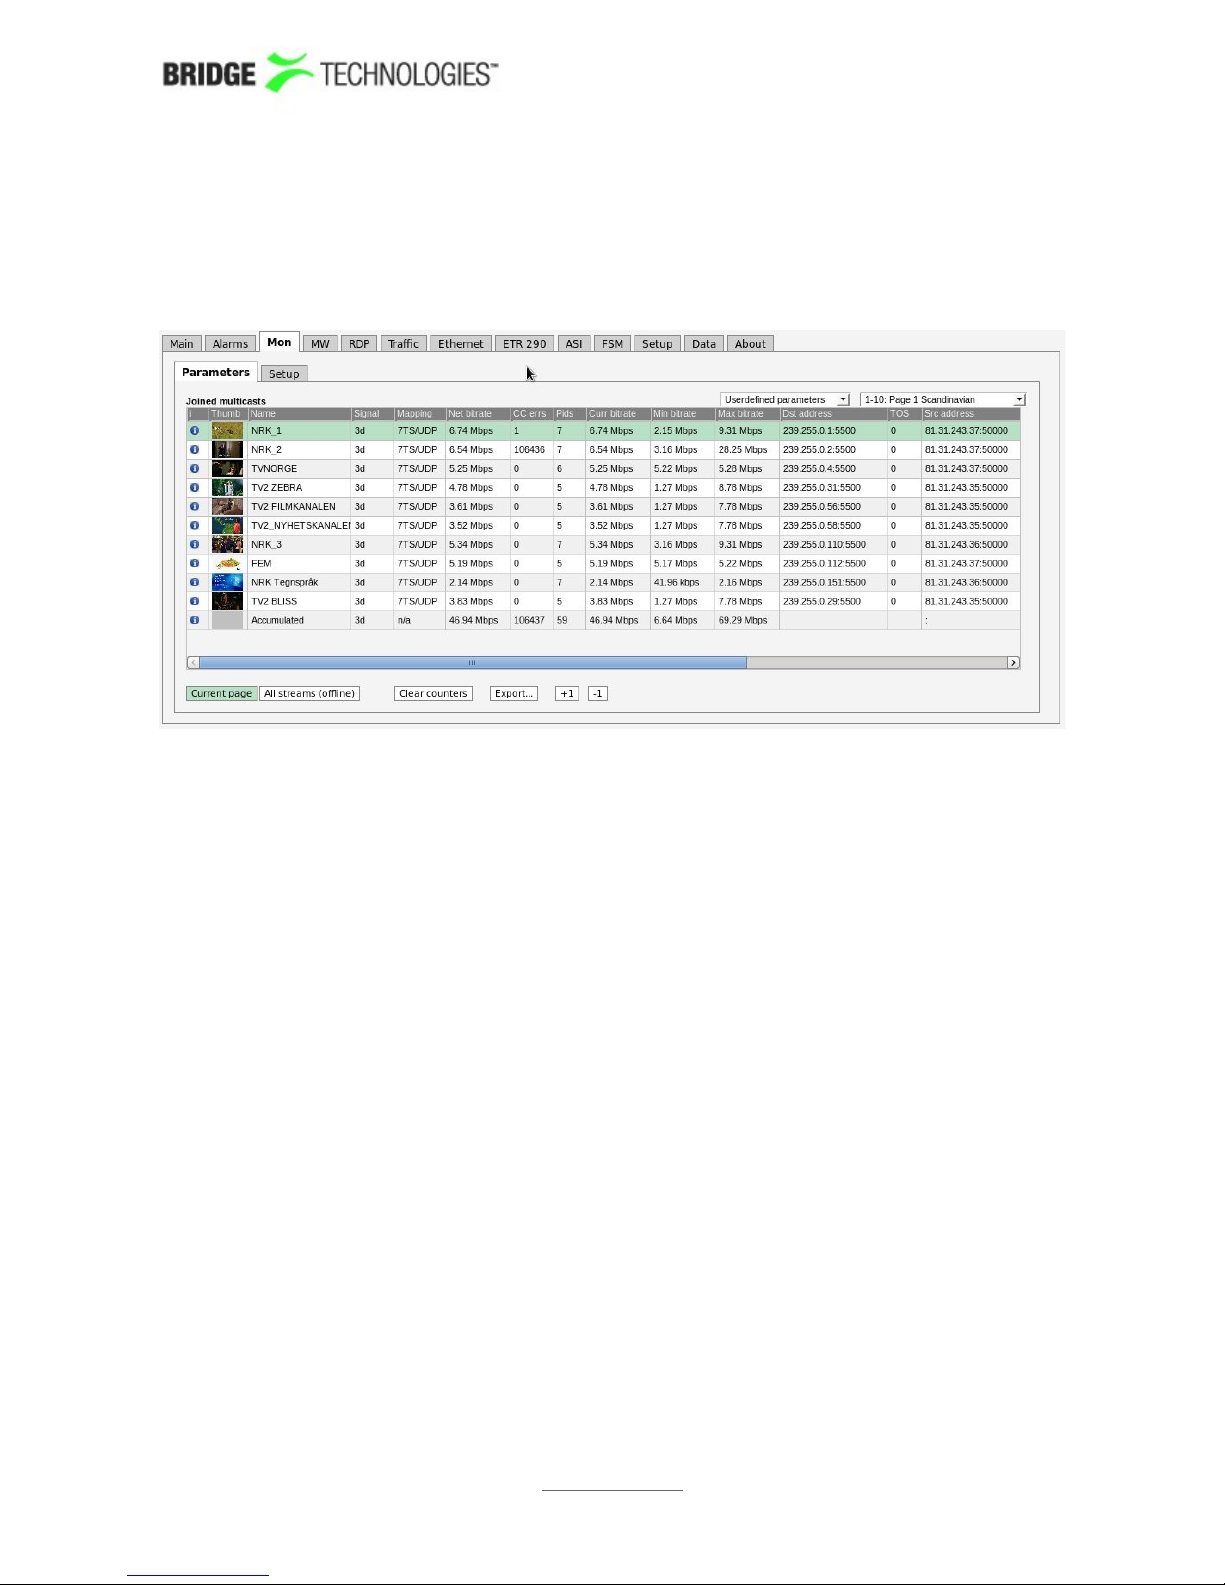
6.4 Mon
6.4.1 Mon - Parameters
The Mon - Parameters view displays detailed information about each stream.
The user selects which group of measurements should be displayed. Selections are IP
parameters, TS parameters, Ethernet parameters, RTP and FEC parameters,
Userdefined parameters and Statistical parameters. If Userdefined parameters is
selected, the Mon view displays parameters selected by the user in the Mon - Setup
view.
For each page the Accumulated row at the bottom of the multicast list displays
accumulated values for all streams associated with the page. The accumulated Min
bitrate and Max bitrate is the minimum and maximum value of the Accumulated
current bitrate.
When the Current page button is clicked it is possible to select the page from a dropdown menu. The associated thumbnails are shown in the leftmost column of the list of
measurements. Click one of the small thumbnails to view a larger thumbnail that is
updated more frequently. Note that it is possible to disable probe thumbnail extraction
in the Setup - Params view.
When All streams (offline) is clicked a complete list of measurements for all joined
streams is displayed. A search field allows the user to type a text string and the
multicast list is updated to display only multicasts matching the specified text. Note
that monitoring parameters and thumbs will not be updated in All streams (offline)
mode.
PROBE USERS' MANUAL VERSION 5.0
2014 © BRIDGE Technologies Co AS - Bentsebrugata 20 - N-0476 Oslo, Norway - tel: +47 22 38 51 00 -
www.bridgetech.tv
74
Page 74
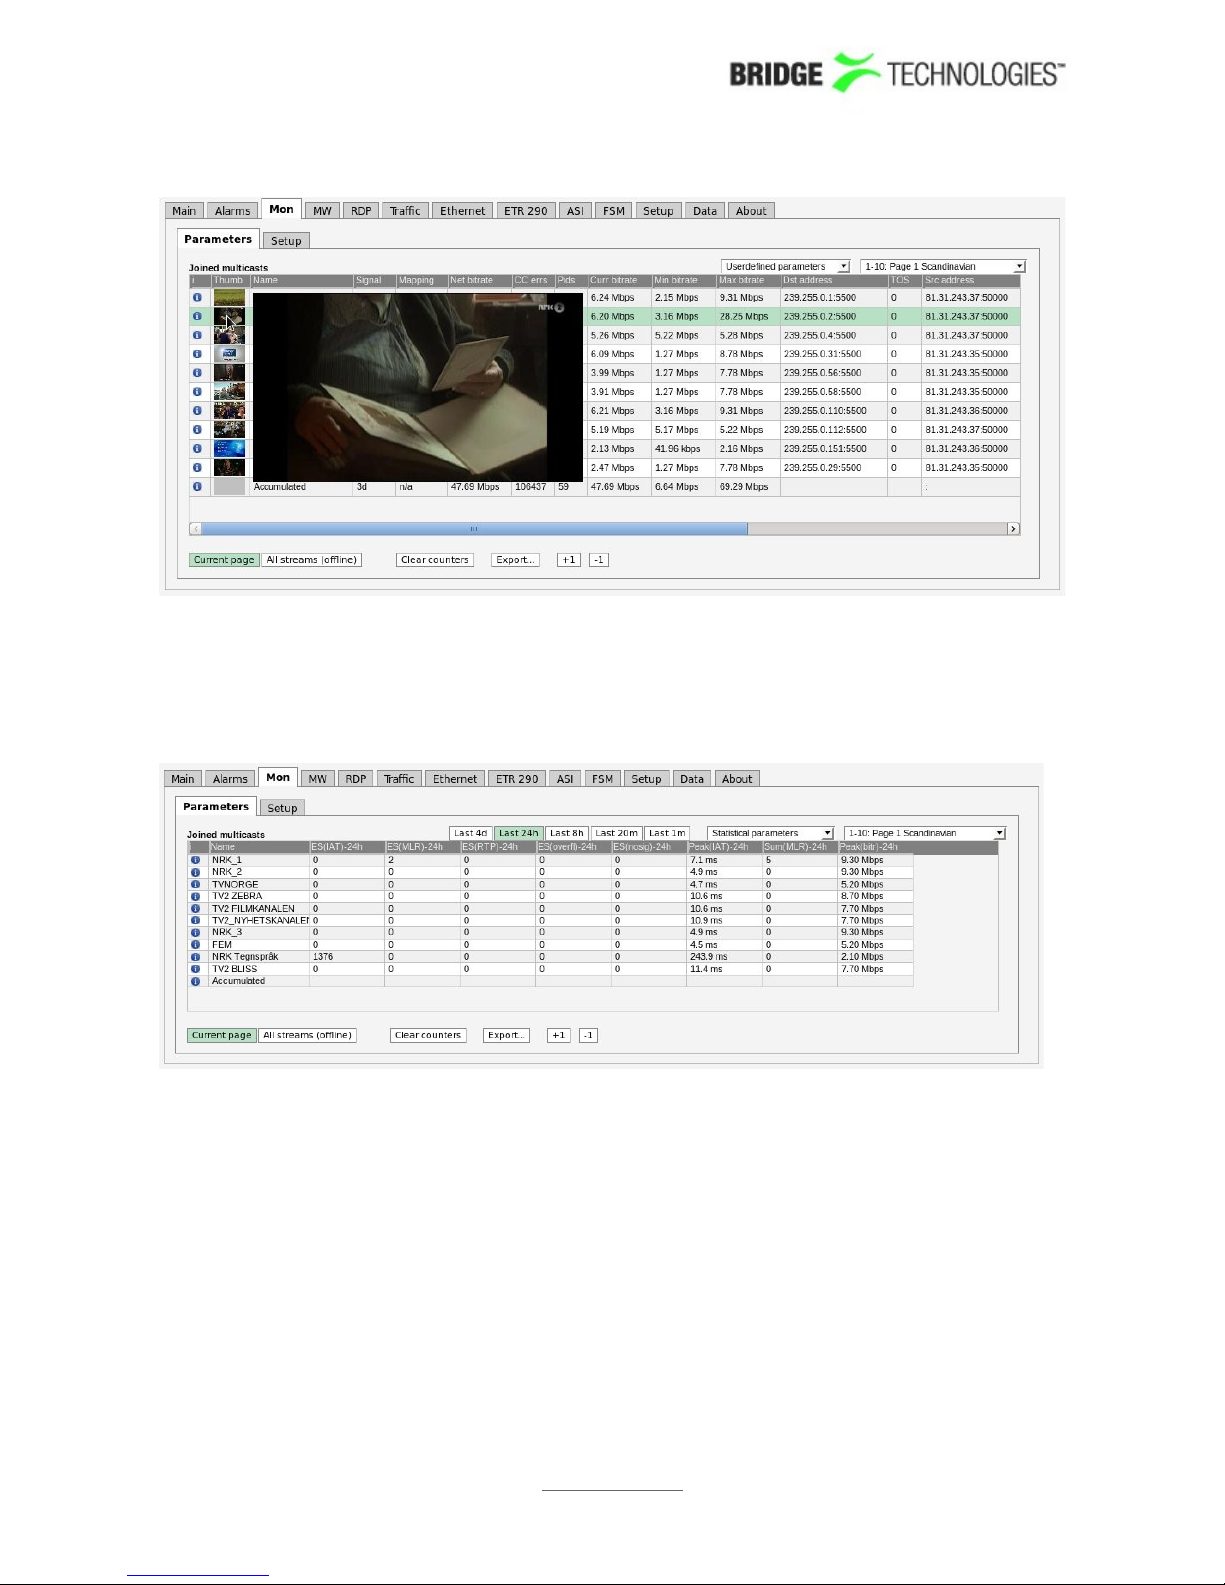
Peak and aggregate measurements are cleared when the Clear counters or Clear
counters all pages button is clicked.
Clicking the Export button will allow export of the measurement data as an XML file
that is opened in a new window.
Click the Trim ch-list button to unjoin streams with current status 'No signal', thereby
removing them from the list.The Statistical parameters view lists sum or peak
values for parameters over the interval indicated by the selected time button (Last 4d,
Last 24h, Last 8h, Last 20m, Last 1m).
Clicking a stream brings up the Detailed monitoring popup described later in this
section.
In All streams (offline) mode a search field allows the user to type a text string and
the multicast list is updated to display only multicasts matching the specified text.
PROBE USERS' MANUAL VERSION 5.0
2014 © BRIDGE Technologies Co AS - Bentsebrugata 20 - N-0476 Oslo, Norway - tel: +47 22 38 51 00 -
www.bridgetech.tv
75
Page 75
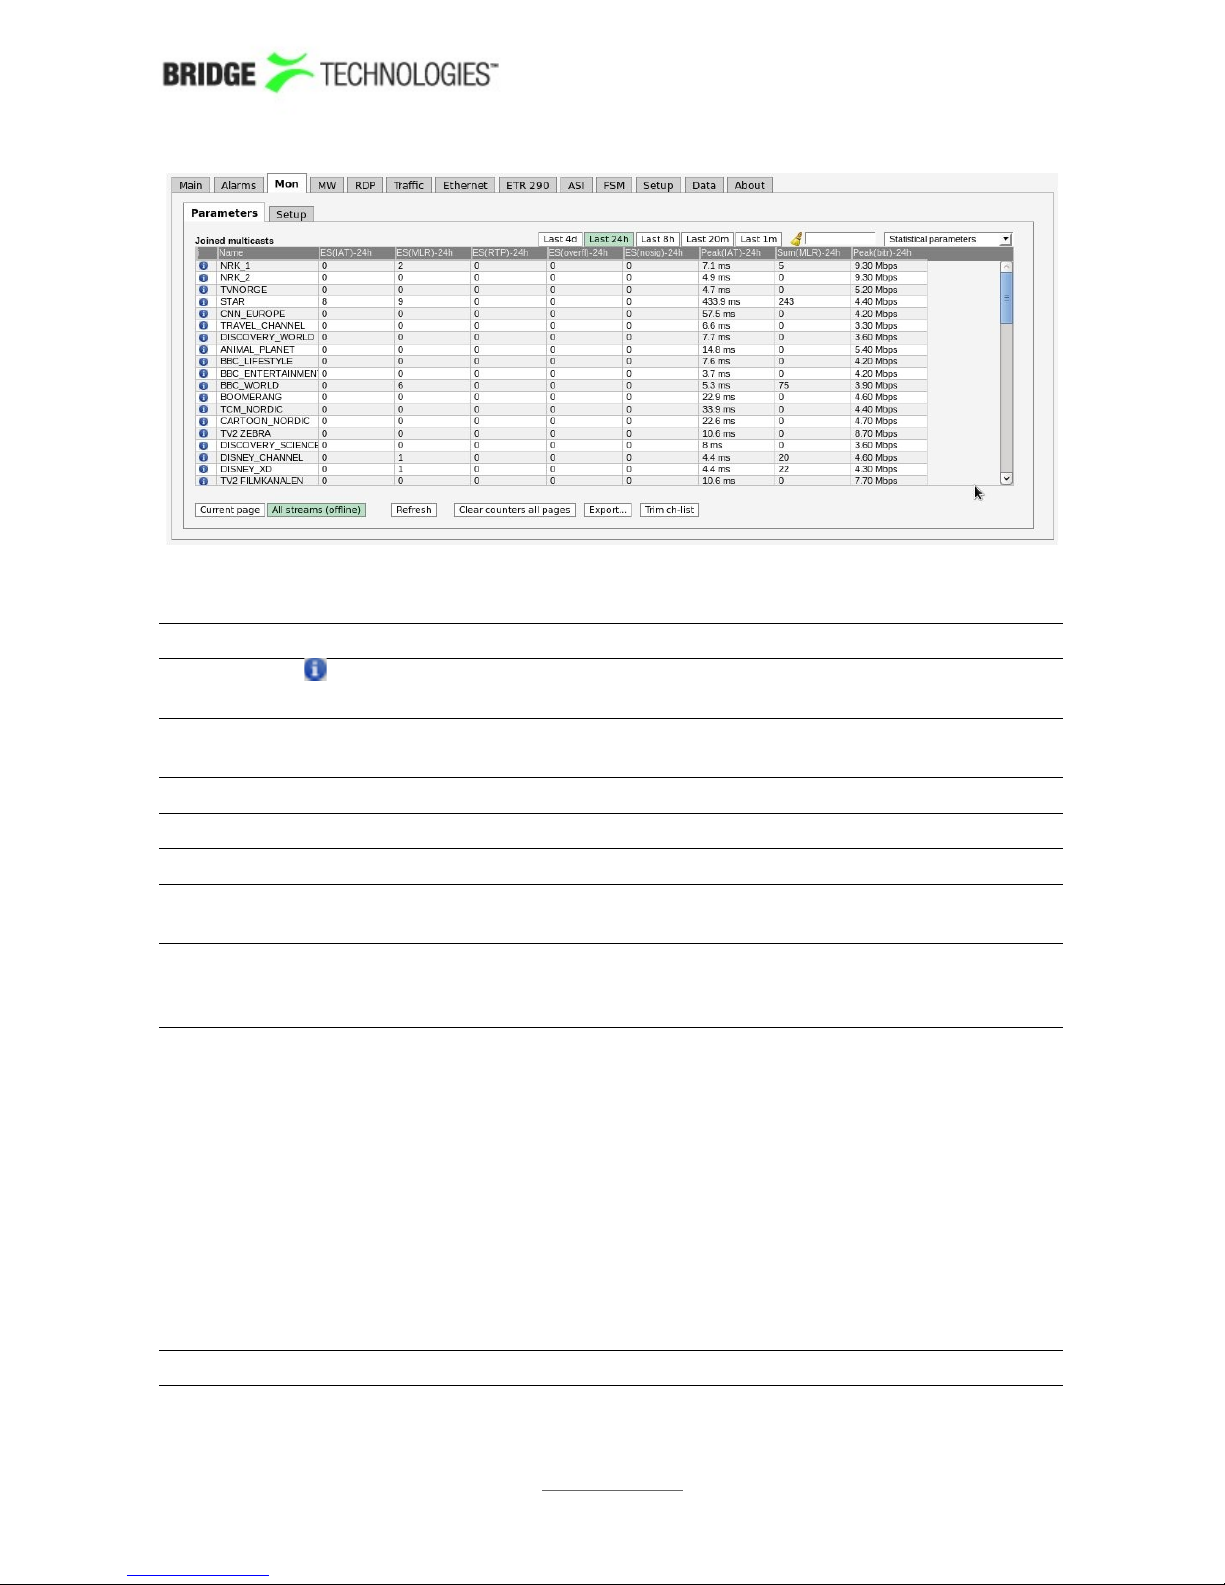
Current measurements
Joined multicasts
:
Click the information icon to access the Detailed Monitoring
pop-up view.
Thumb: A thumbnail is displayed for each stream. Click the small
thumbnail to view a larger image that is updated more frequently.
Name: The stream name specified by the user in the Edit Multicast view
Signal: Time since last signal loss
Page: The page associated with the multicast
Mapping: The number of MPEG-2 packets mapped into each RTP or UDP
packet
Net bitrate: Instantaneous MPEG-2 Transport Stream bitrate excluding null
packets (PID 8191). The instantaneous bitrate is measured over a
time period of 1000 ms.
CC errs: The number of times a discontinuity has been detected for all the
MPEG-2 Transport Stream continuity counters. This value is the
total number of discontinuities detected for all PIDs present.
Note that this value does NOT represent the number of MPEG-2 TS
packets lost because any continuity counter mismatch detected
for an IP-frame will increase CC errs by one.
CC errors are serious as they will in practice usually result in visual
video artefacts ('blocking') if occurring on the video PIDs. CC errors
can be due to an erroneous input signal to the streaming head-end
(e.g. from satellite rain fading or changes in the uplink).
Alternatively, CC errors can arise from IP packets being dropped in
the network.
PIDs: Number of PIDs in the MPEG2-TS
PROBE USERS' MANUAL VERSION 5.0
2014 © BRIDGE Technologies Co AS - Bentsebrugata 20 - N-0476 Oslo, Norway - tel: +47 22 38 51 00 -
www.bridgetech.tv
76
Page 76

Syncb errs: Number of transport stream packets with wrong syncbyte (0x47)
Curr bitrate: Instantaneous MPEG-2 Transport Stream bitrate including null
packets (PID 8191). The instantaneous bitrate is measured over a
time period of 1000 ms. For non-TS traffic the bitrate is calculated
from the size of the UDP payloads.
Min bitrate: The minimum current bitrate measurement
Max bitrate: The maximum current bitrate measurement
IP packets: The number of IP packets received
Dst address: Multicast/unicast destination address : port
TOS: Type-Of-Service (also called Differentiated Services Field)
TTL: Time-To-Live
VLAN ID: Native VLAN ID of this stream
Src address: Multicast/unicast source address : port
Joined src: The source address of the originally joined multicast.
IAT avg: Average Inter-Arrival Time. The average time between consecutive
IP frames (in milliseconds). Recalculated each second.
IAT min: The Minimum Inter-Arrival Time is the minimum registered time
between two consecutive IP frames carrying video. Units are in
milliseconds.
IAT max: The Maximum Inter-Arrival Time is the maximum registered time
between two consecutive IP frames carrying video. Units are in
milliseconds.
The Max-IAT is a measure of the maximum amount of networkinduced packet jitter present. IP packet jitter affects video quality
and should be minimised.
Src MAC: Source MAC address
Dst MAC: Destination MAC address
RTP drops: Accumulated number of dropped IP-frames due to network errors.
Only available for multicasts that carry RTP information.
When running video inside an RTP wrapper it is possible to exactly
deduce the number of dropped IP frames due to network issues.
This is possible as a result of the 16-bit sequence counter inside
the RTP header.
The following sequence will generate an RTP drops of +3:
..., 10, 11, 12, 16, 17, 18, ...
RTP dups: Accumulated number of duplicate IP-frames.
Only available for multicasts that carry RTP information.
PROBE USERS' MANUAL VERSION 5.0
2014 © BRIDGE Technologies Co AS - Bentsebrugata 20 - N-0476 Oslo, Norway - tel: +47 22 38 51 00 -
www.bridgetech.tv
77
Page 77

Duplicate IP-frames in the network can occur under normal
circumstances and does not necessarily indicate network
problems.
The following sequence will generate an RTP dups of +2:
..., 10, 11, 12, 12, 12, 13, 14, ...
RTP ooo: Accumulated number of times a packet has been found to be out
of order.
Only available for multicasts that carry RTP information.
An out-of-order situation is defined to have occurred when the
current sequence number is lower than the previous one.
The following sequence will generate an RTP ooo of +2 (since
there are two occurrences): ..., 10, 11, 15, 12, 16, 17, 13, 14, 18,
19, ...
RTP lag: The maximum number of packet positions an out-of-order packet
has been moved relative to its correct position. So for example
1,2,3,5,6,7,8,4,9,10 will result in an RTP lag of 4.
The RTP lag is a good measure of how big a packet re-ordering
buffer is needed in the receiving equipment to re-order packets.
Min hole size: Minimum number of consecutive dropped RTP packets. The
sequence 1,2,3,10,11,12,15 gives a min hole size of 2.
Max hole
size:
Maximum number of consecutive dropped RTP packets. The
sequence 1,2,3,10,11,12,15 gives a max hole size of 6.
Min hole sep: Minimum number of RTP packets separating any holes. The
sequence 1,2,3,10,11,12,15 gives a min hole sep of 3.
Num holes: Number of packet loss sequences. The sequence
1,2,3,10,11,12,15 gives a num holes of 2.
FEC mode: The CoP3 FEC mode
FEC drops: Number of RTP packet drops in the main stream that the FEC could
not correct
C-FEC drops: Number of IP packets in the column-FEC streams dropped
R-FEC drops: Number of IP packets in the row-FEC streams dropped
Statistical parameters
MPEG-2 transport stream parameters
i:
Click the information icon to access the Detailed Monitoring
pop-up view.
Name: The stream name specified by the user in the Edit Multicast view
ES(IAT): Number of seconds during selected period with Inter-packet Arrival
PROBE USERS' MANUAL VERSION 5.0
2014 © BRIDGE Technologies Co AS - Bentsebrugata 20 - N-0476 Oslo, Norway - tel: +47 22 38 51 00 -
www.bridgetech.tv
78
Page 78

Time higher than associated Ethernet IAT warning threshold
ES(MLR): Number of seconds during selected period with Media Loss
(corresponding to number of seconds with CC-errors)
ES(RTP): Number of seconds during selected period with RTP packet drops
ES(overfl): Number of seconds during selected period with bitrate overflow
ES(nosig): Number of seconds during selected period without signal
Peak(IAT): Peak Inter-packet Arrival Time during selected period.
Sum(MLR): Sum of Media Loss during selected period (equals number of TS
packets lost)
Peak(bitr): Peak stream bitrate during selected period
PROBE USERS' MANUAL VERSION 5.0
2014 © BRIDGE Technologies Co AS - Bentsebrugata 20 - N-0476 Oslo, Norway - tel: +47 22 38 51 00 -
www.bridgetech.tv
79
Page 79
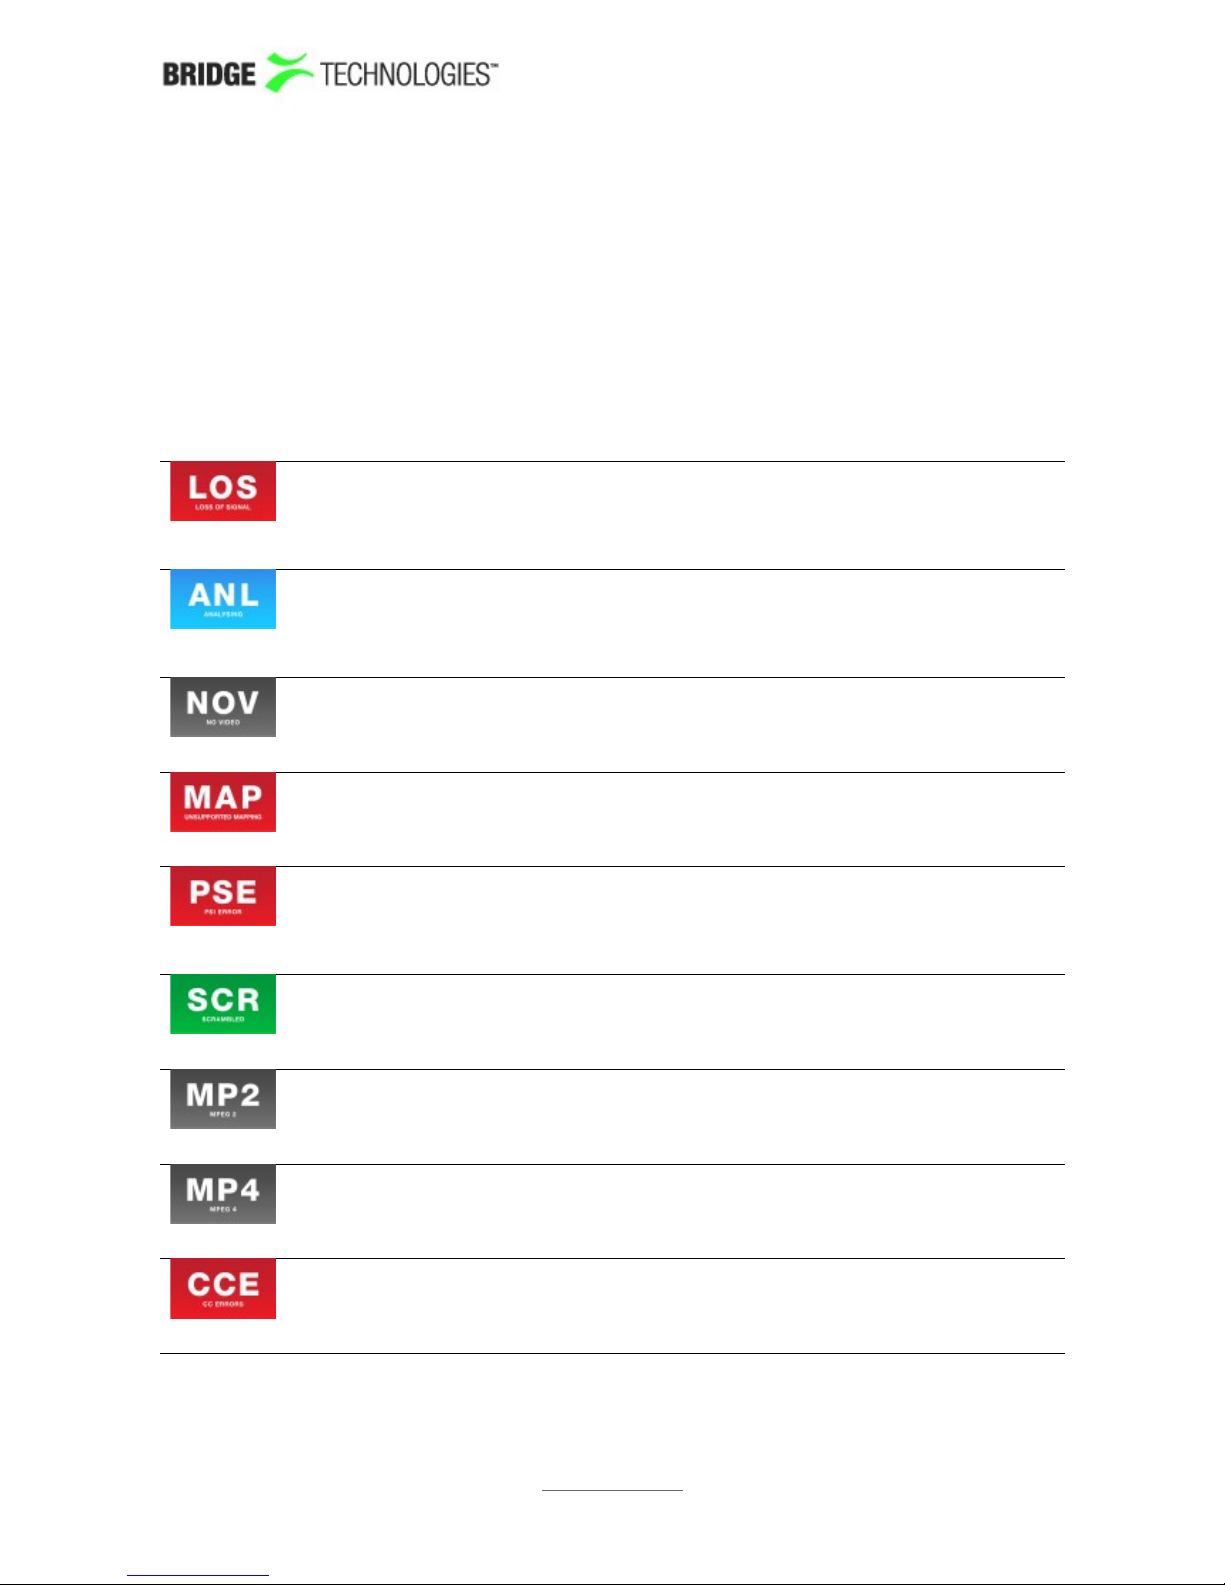
Thumbnails
The probe will try to generate thumbnail pictures for all streams. For multi-program
transport streams (MTPS) the first video component is selected. Both MPEG-2 and
MPEG-4 video formats are supported (standard and high definition).
The thumbnail update rate will depend on the number of streams available in the
view, i.e. the update rate will generally be higher in 'Current page' mode than in 'All'
mode. When a small thumbnail is clicked the larger thumbnail image will have an
increased update rate.
If the probe cannot generate a thumbnail from the signal, it will present one of the
following icons:
Shown if no data is received for the stream. There should be a match
between presenting this icon and a No-signal alarm; however since the
alarm and thumbnail mechanisms work independently of each other
they have been given different names (loss of signal and no signal).
Shown while the thumbnail engine is trying to decode a thumbnail
picture and more precise status information has not yet been obtained.
This icon is typically displayed after probe reboot or if new streams have
recently been joined.
Shown if the stream does not carry a video PID – which is the case for
radio streams.
The probe does not support thumbnail generation for this protocol
mapping. In this version of the probe TS/UDP and TS/RTP are supported.
This icon is shown if the probe is unable to receive or analyse the PMT
PID. Only streams with PSI information can have thumbnails decoded
since the probe does not support a manual specification of the video
PID.
The probe can only generate a thumbnail picture if the video data is not
scrambled.
The signal is recognised as being MPEG-2 encoded but cannot be
correctly decoded by the thumbnail extractor.
The signal is recognised as being MPEG-4 encoded but cannot be
correctly decoded by the thumbnail extractor.
The signal cannot be decoded due to excessive CC errors.
PROBE USERS' MANUAL VERSION 5.0
2014 © BRIDGE Technologies Co AS - Bentsebrugata 20 - N-0476 Oslo, Norway - tel: +47 22 38 51 00 -
www.bridgetech.tv
80
Page 80
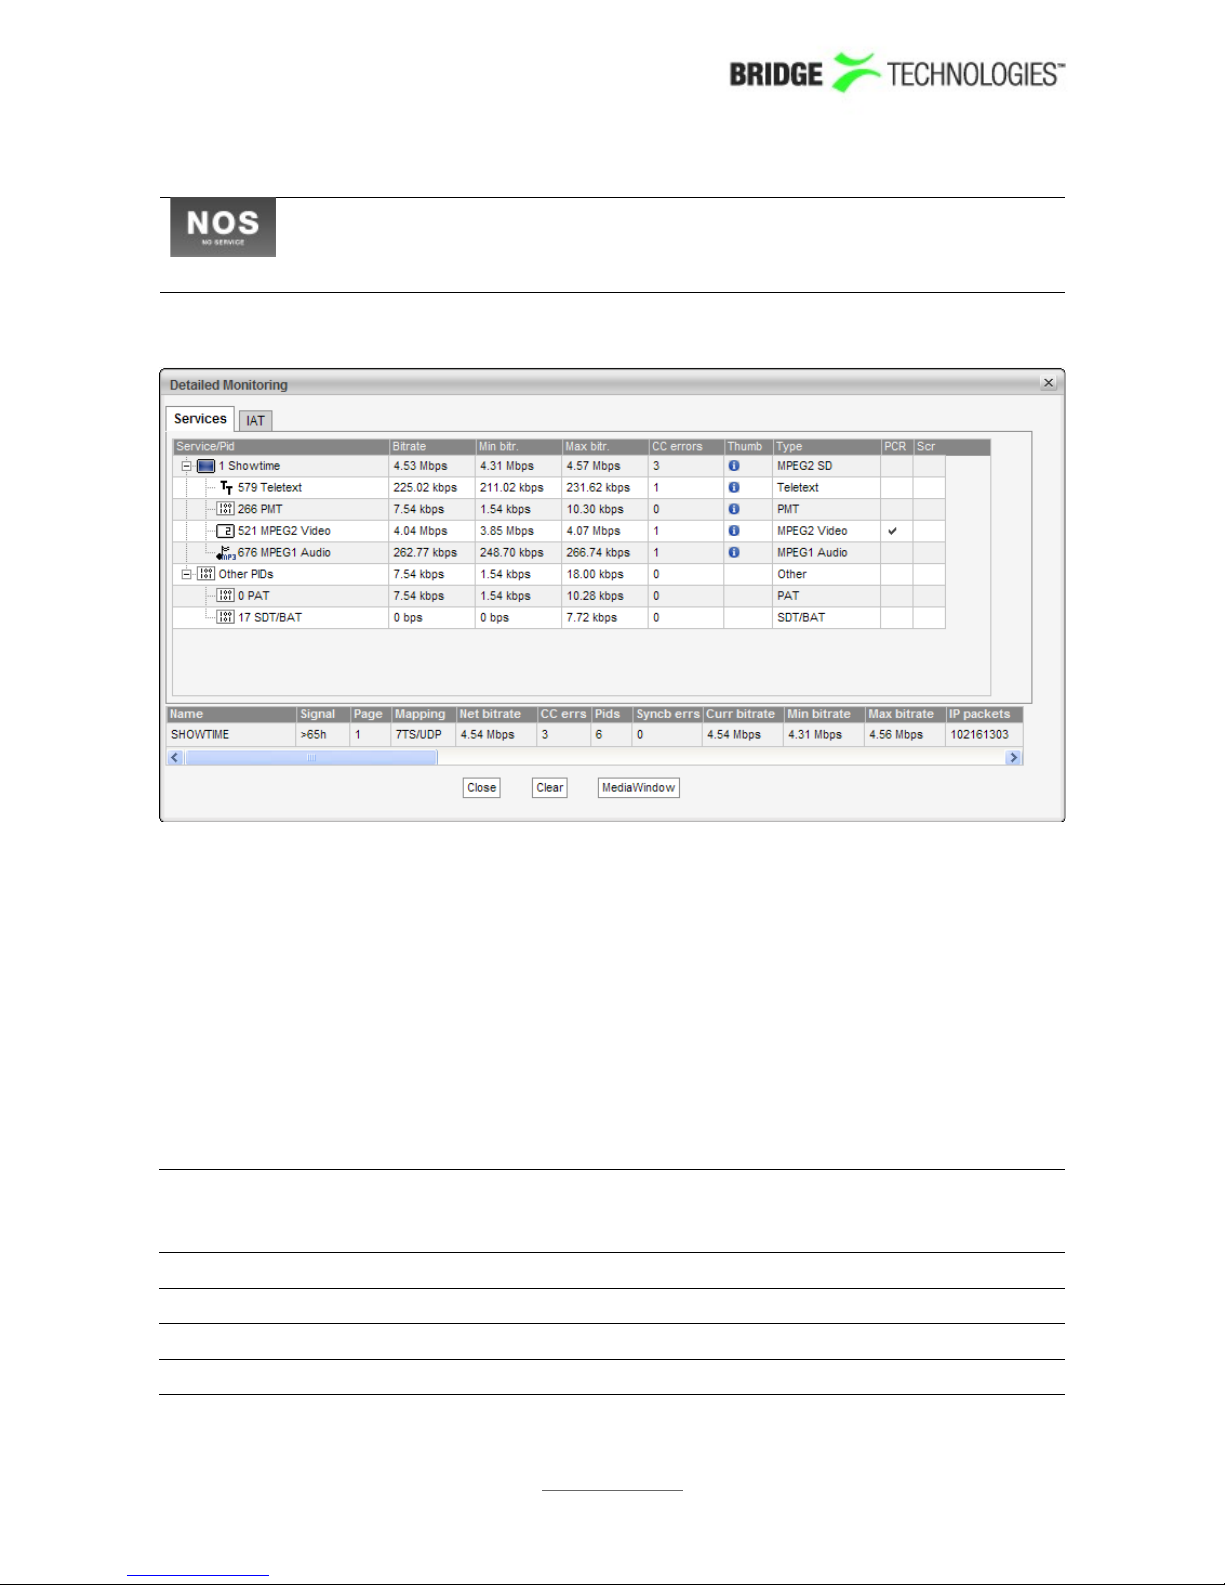
The stream contains no service, as signalled in PSI.
Detailed Monitoring
The Detailed Monitoring popup is activated by clicking a stream line in the
monitoring list.
The probe is continuously gathering detailed information for the selected multicast.
The probe will continue updating the detailed information for the selected multicast
until another is selected. Clicking the Clear button will clear all information about the
selected stream, including PSI/SI analysis data.
The Detailed Monitoring - Services view lists detected MPEG-2 TS services (by
analysing the PSI/SI tables) and provides the following aggregate information for each
service:
Service/Pid:For each service, the service-name or service-id is obtained from the
PSI/SI tables. PIDs that do not belong to a service are denoted “Other
PIDs”. The service ID is presented in square brackets.
Bitrate: Service or component bitrate in megabits per second
Min bitr.: Minimum service or component bitrate in megabits per second
Max bitr.: Maximum service or component bitrate in megabits per second
CC errors: Number of Continuity Counter occurrences
PROBE USERS' MANUAL VERSION 5.0
2014 © BRIDGE Technologies Co AS - Bentsebrugata 20 - N-0476 Oslo, Norway - tel: +47 22 38 51 00 -
www.bridgetech.tv
81
Page 81
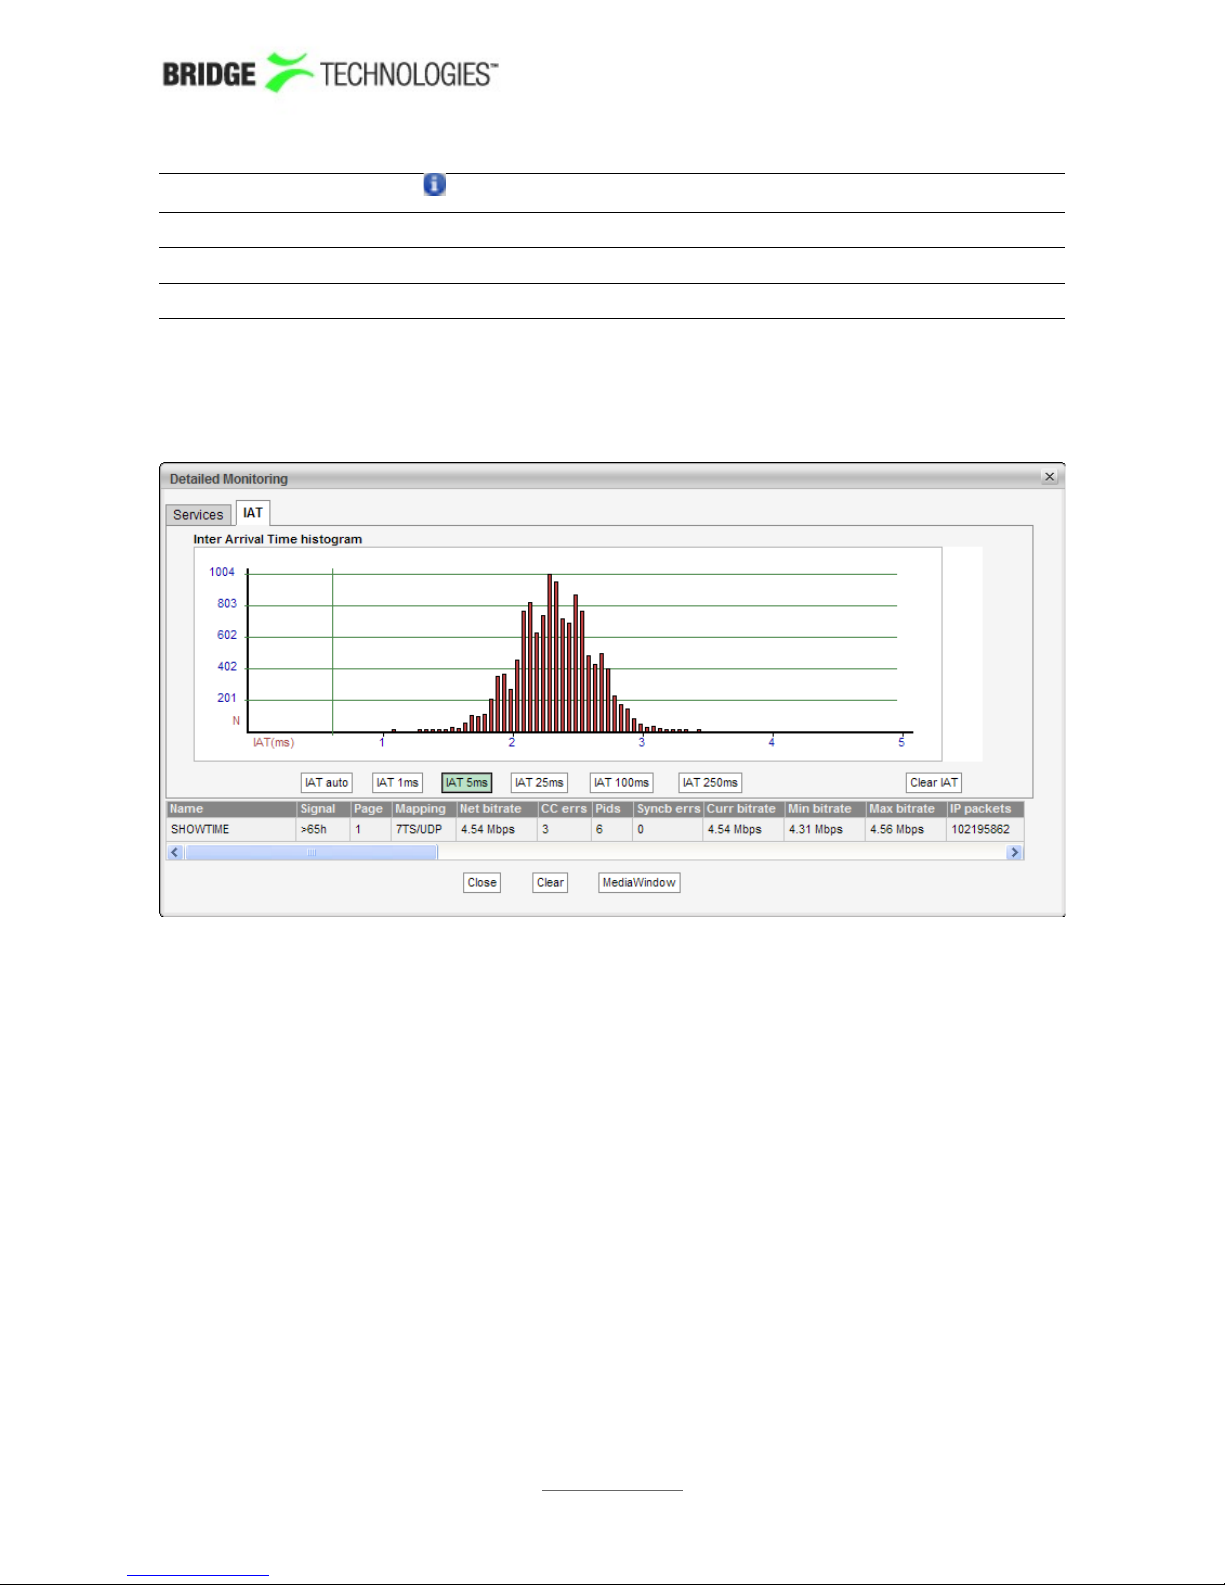
Thumb:
Click the icon to access the Thumb pop-up view
Type: The list entry service type or PID type
PCR: This field will be checked if the corresponding PID carries PCR
Scr: This field will be checked if the corresponding PID is scrambled
Under this list the Mon - Parameters (Current parameters) measurements for the
selected stream are displayed.
In the Detailed Monitoring - IAT view the Inter Arrival Time histogram shows the
accumulated number of IAT measurements within each presented interval. Vertical
green lines indicate the maximum and minimum IAT values. By clicking the IAT range
buttons it is possible to change the zooming of the graph. If the IAT auto button is
pressed the diagram will auto-scale to always include the minimum and maximum IAT
readings.
The IAT histogram is a very useful and intuitive measure of how well the network is
performing in terms of forwarding real-time traffic. A predictable and tightly bunched
graph indicates small levels of network jitter. An unbound graph indicates network
jitter issues typically brought forward by traffic congestion or misconfigured routers.
Clicking the Clear IAT button will clear the IAT graph.
Under the IAT histogram the Mon - Parameters (Current parameters)
measurements for the selected stream are displayed.
Clicking the Clear button will clear all information about the selected stream,
including PSI/SI analysis data.
Clicking the MediaWindow button will open the Media Window Selected channel
view. This is described in section 6.5.
PROBE USERS' MANUAL VERSION 5.0
2014 © BRIDGE Technologies Co AS - Bentsebrugata 20 - N-0476 Oslo, Norway - tel: +47 22 38 51 00 -
www.bridgetech.tv
82
Page 82
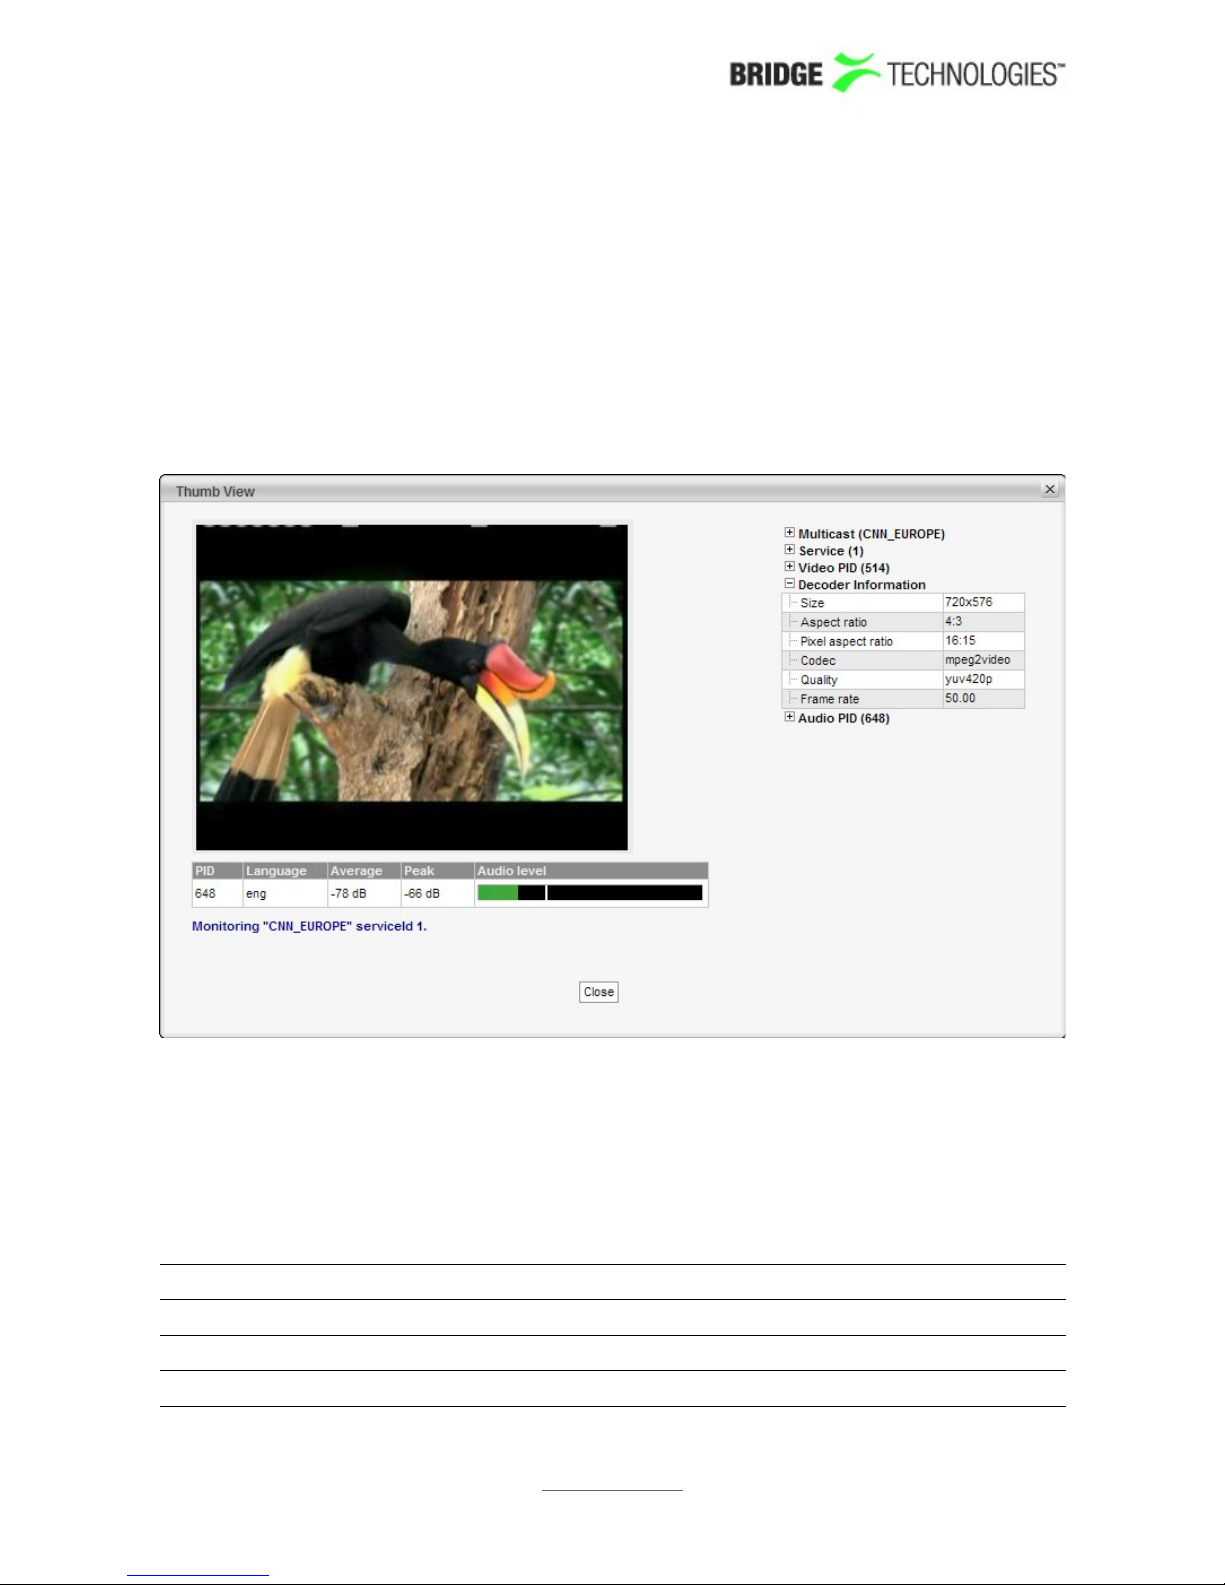
Note that due to the way the probe aggregates interrupts for high bitrates the submillisecond accurracy of the IAT measurements may be affected when the probe
experiences a combined bitrate of 200 Mbit/s or above. Below this limit there is no
interrupt aggregation so the IAT measurements will be accurate. The inaccuracy has
been measured to be plus minus 0.2 ms at 750 Mbit/s.
Note that for variable bitrate streams the IAT histogram will show a very different IAT
distribution compared to the histogram for a constant bitrate stream. The histogram in
the screenshot above displays the IAT distribution for a CBR stream.
Thumb View
The Thumb View pop-up is accessed by clicking an information icon in the Detailed
Monitoring - Services view. This view displays a large thumbnail of the selected
stream with an increased update rate compared to non-selected streams. Service
audio level is indicated by one audio level bar per audio component.
Clicking the Close button will close the Thumb View.
Audio fields
PID: The audio PID for which the associated parameters apply
Language: The audio language, as derived from PSI/SI
Average: The average audio level in dB, measured over a period of
PROBE USERS' MANUAL VERSION 5.0
2014 © BRIDGE Technologies Co AS - Bentsebrugata 20 - N-0476 Oslo, Norway - tel: +47 22 38 51 00 -
www.bridgetech.tv
83
Page 83

approximately 0.5 second
Peak: The peak audio level in dB, detected during a period of
approximately 0.5 second
Audio level: An audio level bar displaying the average audio level as a green
bar referenced to the peak audio level, the peak level being
indicated by a white line
PROBE USERS' MANUAL VERSION 5.0
2014 © BRIDGE Technologies Co AS - Bentsebrugata 20 - N-0476 Oslo, Norway - tel: +47 22 38 51 00 -
www.bridgetech.tv
84
Page 84

The following metadata information is displayed:
Multicast (Stream Name)
Transport
stream ID:
The transport stream ID of the stream containing the selected
service
Name: The name of the multicast containing the selected service, as
defined by the user
Type: The type of the stream containing the selected service; multicast
or unicast
Multicast
address:
The multicast address of the stream containing the selected
service
Multicast port: The port number of the multicast containing the selected service
Source
address:
The SSM source address of the multicast containing the selected
service
Bitrate: The total stream bitrate of the multicast containing the selected
service (bits/s)
Stream status: The status of the stream containing the selected service, as
reported by the decoding engine
Service (Service ID)
PSI/SI Name: The name of the selected service, as derived from SI
Service ID: The service ID of the selected service
Controlbit
scramble state:
The scramble state as indicated by the MPEG TS control bit
PES sync
scramble state:
The scramble state as detected from the PES sync state
Number of
PIDs:
The number of PIDs associated with the selected service
Bitrate: The total bitrate of the selected service (bits/s)
Video PID (PID Number)
PID: The video PID of the selected service
Bitrate: The video PID bitrate of the selected service
Status: The status of the video PID as reported by the decoding engine
PES sync: The latest PES sync state
PES length
indicator:
If signalled in the PES packet header the PES packet length is
displayed
PROBE USERS' MANUAL VERSION 5.0
2014 © BRIDGE Technologies Co AS - Bentsebrugata 20 - N-0476 Oslo, Norway - tel: +47 22 38 51 00 -
www.bridgetech.tv
85
Page 85

Decoder Information
Size: The video picture size of the selected service
Aspect ratio: The video aspect ratio of the selected service
Pixel aspect
ratio:
The video pixel aspect ratio of the selected service
Codec: The video encoding format of the selected service
Quality: The video sampling format of the selected service
Frame rate: The video frame rate of the selected service (Hz)
Audio PID (PID Number)
PID: The audio PID of the selected service. Note that there may be
several audio PIDs associated with a service.
Type: The audio encoding standard
Is scrambled: An indication of audio PID scrambling. The value may be 'yes' or
'no'.
Bitrate: The audio PID bitrate of the selected service
Language: The language of the audio, as defined in the Program Map Table
(PMT).
Peak level: The peak audio level in dB, detected during a period of
approximately 0.5 second
Average level: The average audio level in dB, measured over a period of
approximately 0.5 second
Audio Information PID (PID Number)
Codec: The audio encoding format
Samplerate: The audio sample rate
Channels: The number of audio channels represented by the audio PID
Layout: The audio channel layout
Format: The number of bits used to represent an audio sample
Bitrate: The effective audio bitrate
PROBE USERS' MANUAL VERSION 5.0
2014 © BRIDGE Technologies Co AS - Bentsebrugata 20 - N-0476 Oslo, Norway - tel: +47 22 38 51 00 -
www.bridgetech.tv
86
Page 86
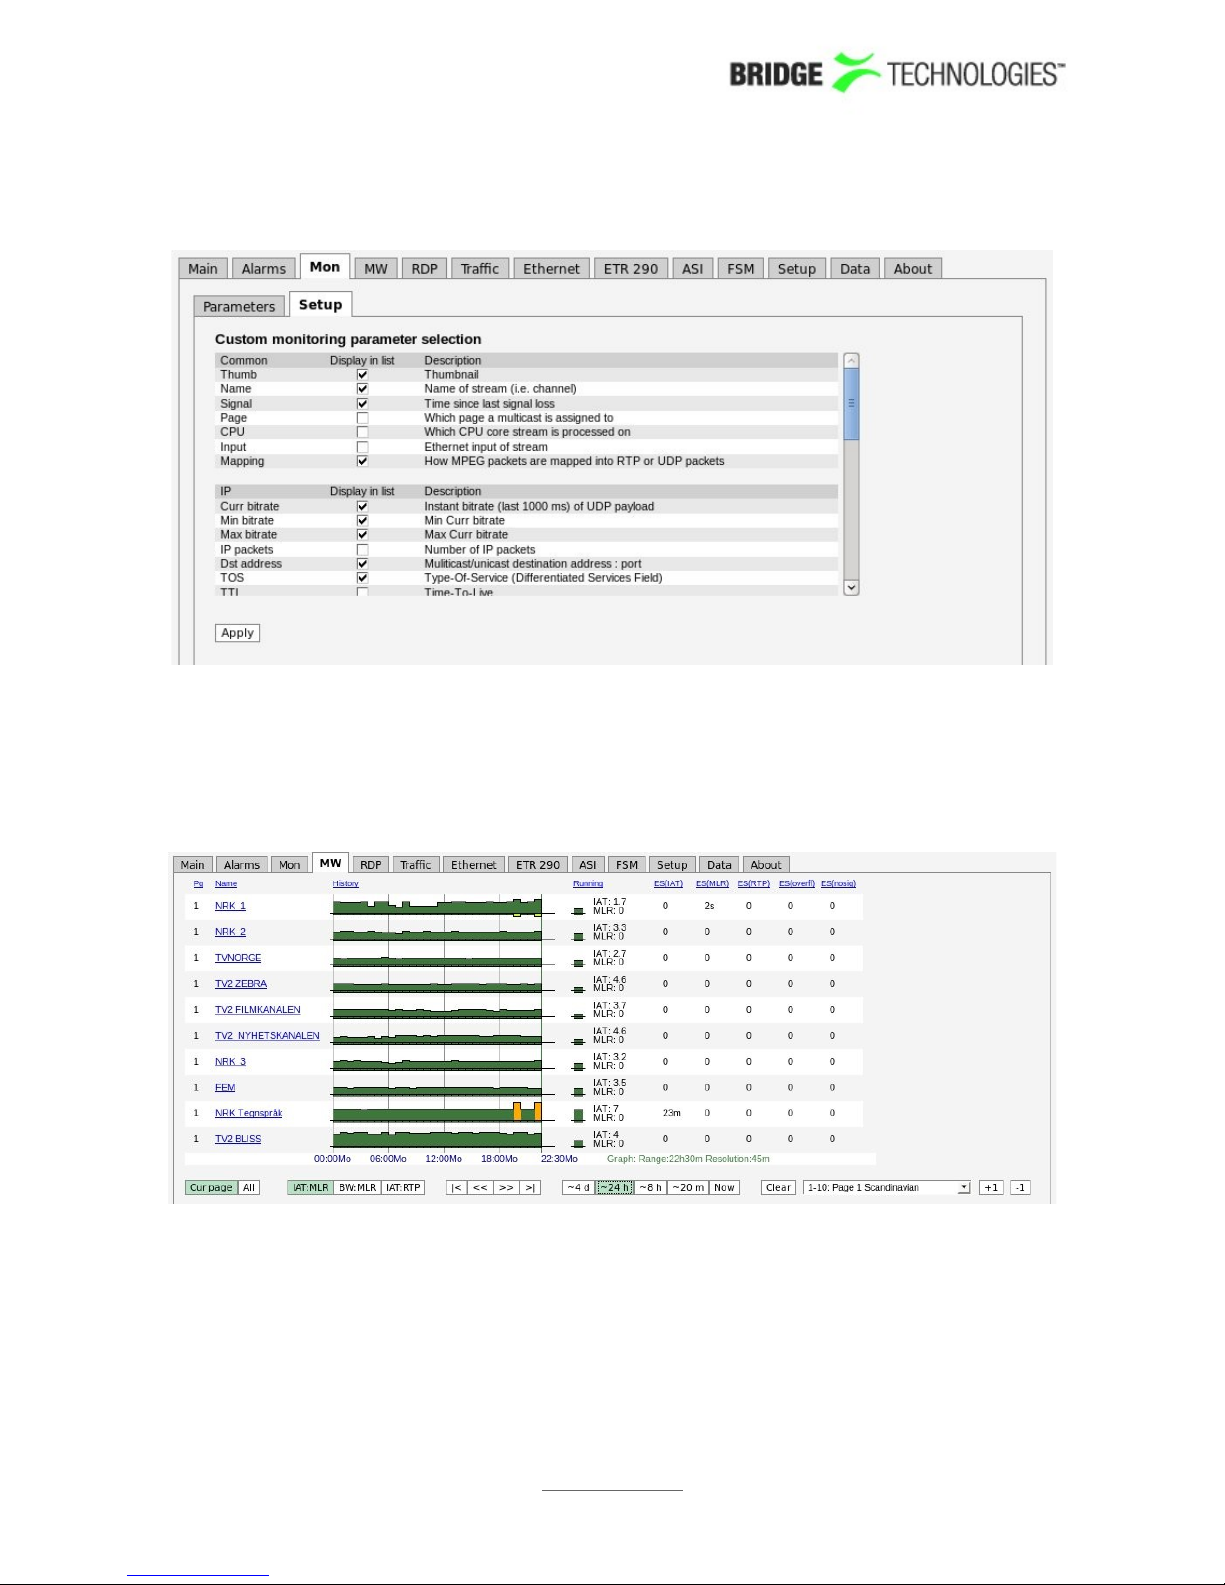
6.4.2 Mon - Setup
The Mon - Setup view enables selection of the parameters to be displayed in the
Mon - Parameters view. Note that thumbnails must also be enabled in the Setup -
Params view for thumbnail availability.
6.5 MW
The MW Media Window view provides an at-a-glance status for each of the
multicasts/unicasts being monitored. From the graphs it is easy to see the jitter
characteristics of the signal and if there is packet loss or CC errors present in the
signal. Periods of no signal are also displayed.
The measurements are always aggregated over a time interval – typically one second.
The IAT(max) is the maximum time measured between two neighbouring IP frames
within the measurement time interval (the peak packet Inter-arrival time). IAT is
PROBE USERS' MANUAL VERSION 5.0
2014 © BRIDGE Technologies Co AS - Bentsebrugata 20 - N-0476 Oslo, Norway - tel: +47 22 38 51 00 -
www.bridgetech.tv
87
Page 87
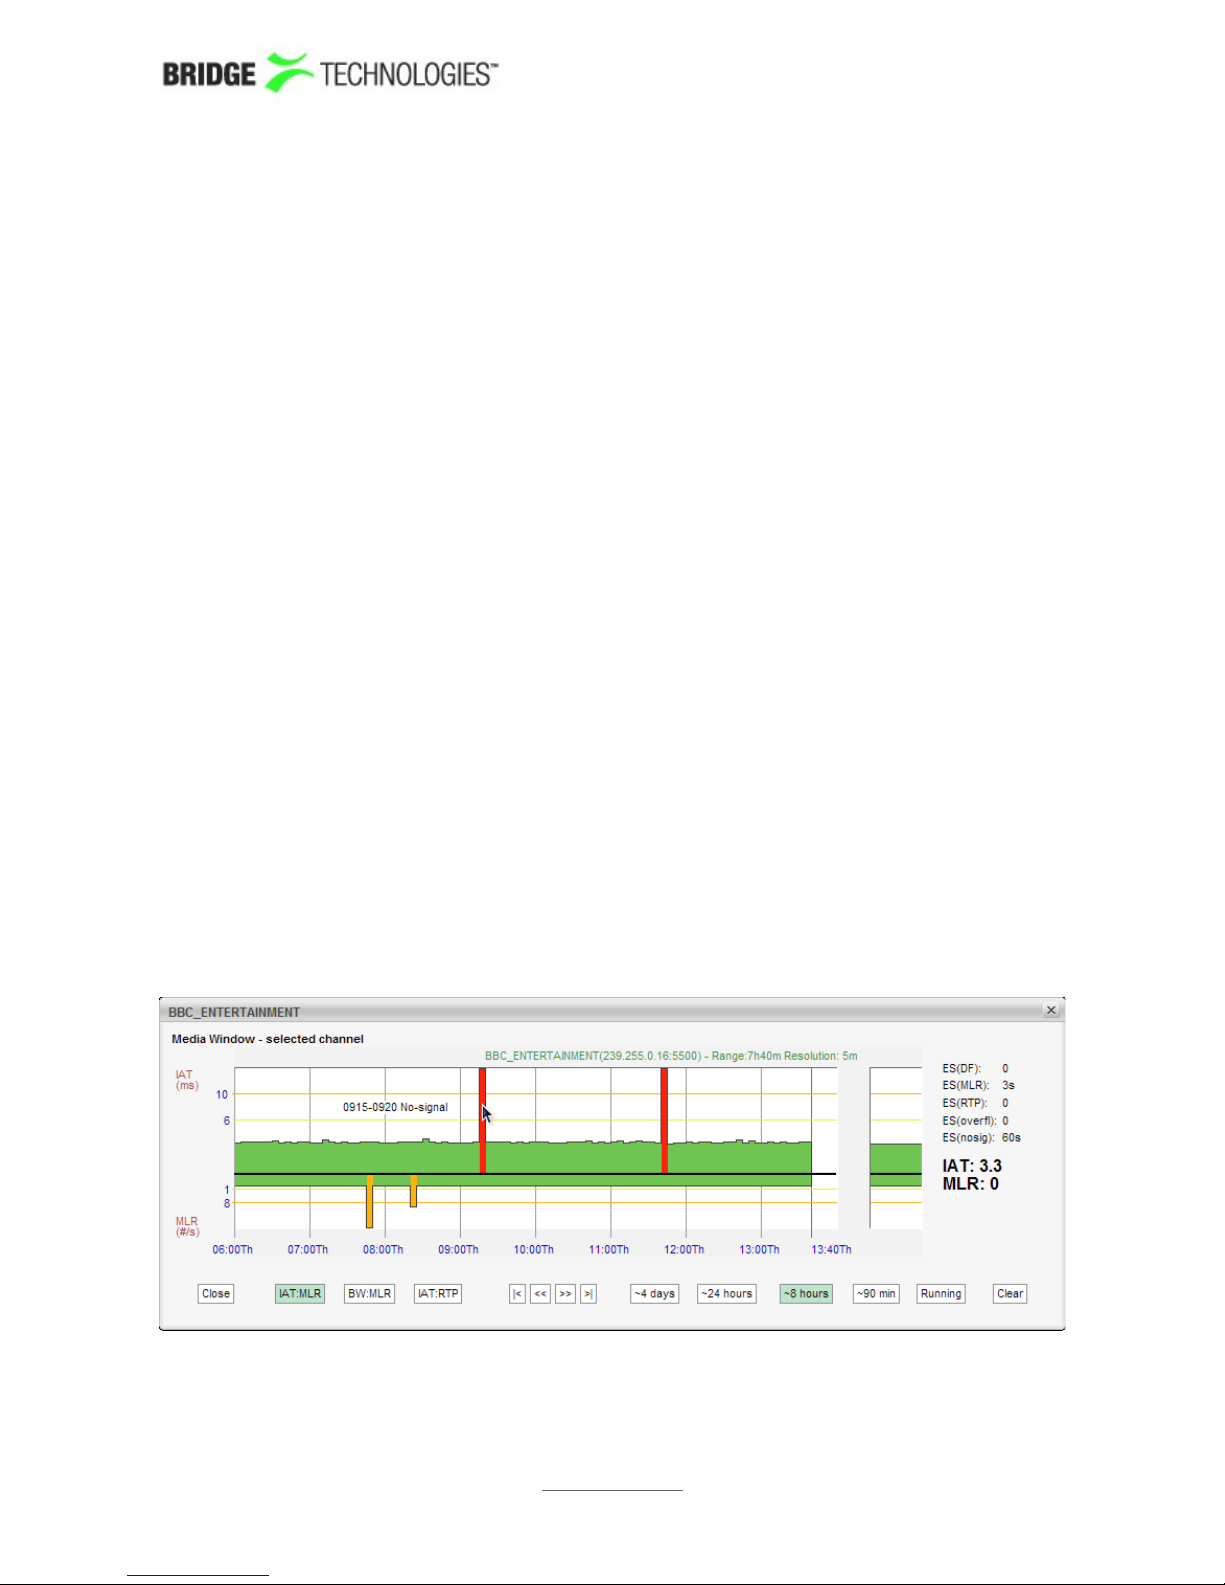
expressed in milliseconds.
The MLR is the peak estimated number of lost MPEG-2 Transport Stream packets inside
any second within the actual time period. The number of lost TS packets is derived
from the continuity counters inside the TS packet headers.
A common scenario is to have 7 TS packets per UDP frame. Losing an IP packet will
therefore usually (but not always) result in an MLR of 7 (not always the case because
some TS packets such as null pacets or PCR packets do not carry a valid CC field).
Bridge Technologies' patented Media Window presents both jitter and packet loss
measurements in one graph, with jitter (IAT) values growing upwards (+ve Y) and
packet loss (MLR) growing downwards (-ve Y). Each sample along the x-axis
corresponds to a measurement time-interval that depends on the range of the graph
selected. Periods of no sync are also displayed in the graph.
Error-second statistics for the graph-interval is displayed to the right. As the graphs
are zoomed or scrolled the error-second statistics is updated as well as the graphs.
Tool-tip provides the exact jitter (IAT) and packet loss (MLR) values for a selected bar in
a selected graph, the denotation is IAT::MLR. The current graph value displayed under
“Running” provides the maximum MLR and IAT values measured during the last 3
seconds.
Red colour is used to indicate that within the period represented by the bar there has
been one or more occurrences of no-signal. Orange is used to indicate error while
yellow indicates warning. The error and warning thresholds are allocated to each
multicast in the Ethernet - Multicasts view.
The user determines whether only multicasts associated with the currently selected
page should be displayed (by clicking the Cur page button), or if all joined multicasts
should be presented in one list (by clicking the All button). The time window buttons
allow selection of x-axis resolution in the graphs, and by using the arrow buttons it is
possible to move the timeline to view an error incident more accurately. Clicking Clear
will clear all graphs. Note that clearing graphs cannot be undone. Clicking the +1
button will display the next page. Clicking the -1 button will display the previous page.
By zooming and panning the user can pinpoint more accurately when errors occurred.
PROBE USERS' MANUAL VERSION 5.0
2014 © BRIDGE Technologies Co AS - Bentsebrugata 20 - N-0476 Oslo, Norway - tel: +47 22 38 51 00 -
www.bridgetech.tv
88
Page 88
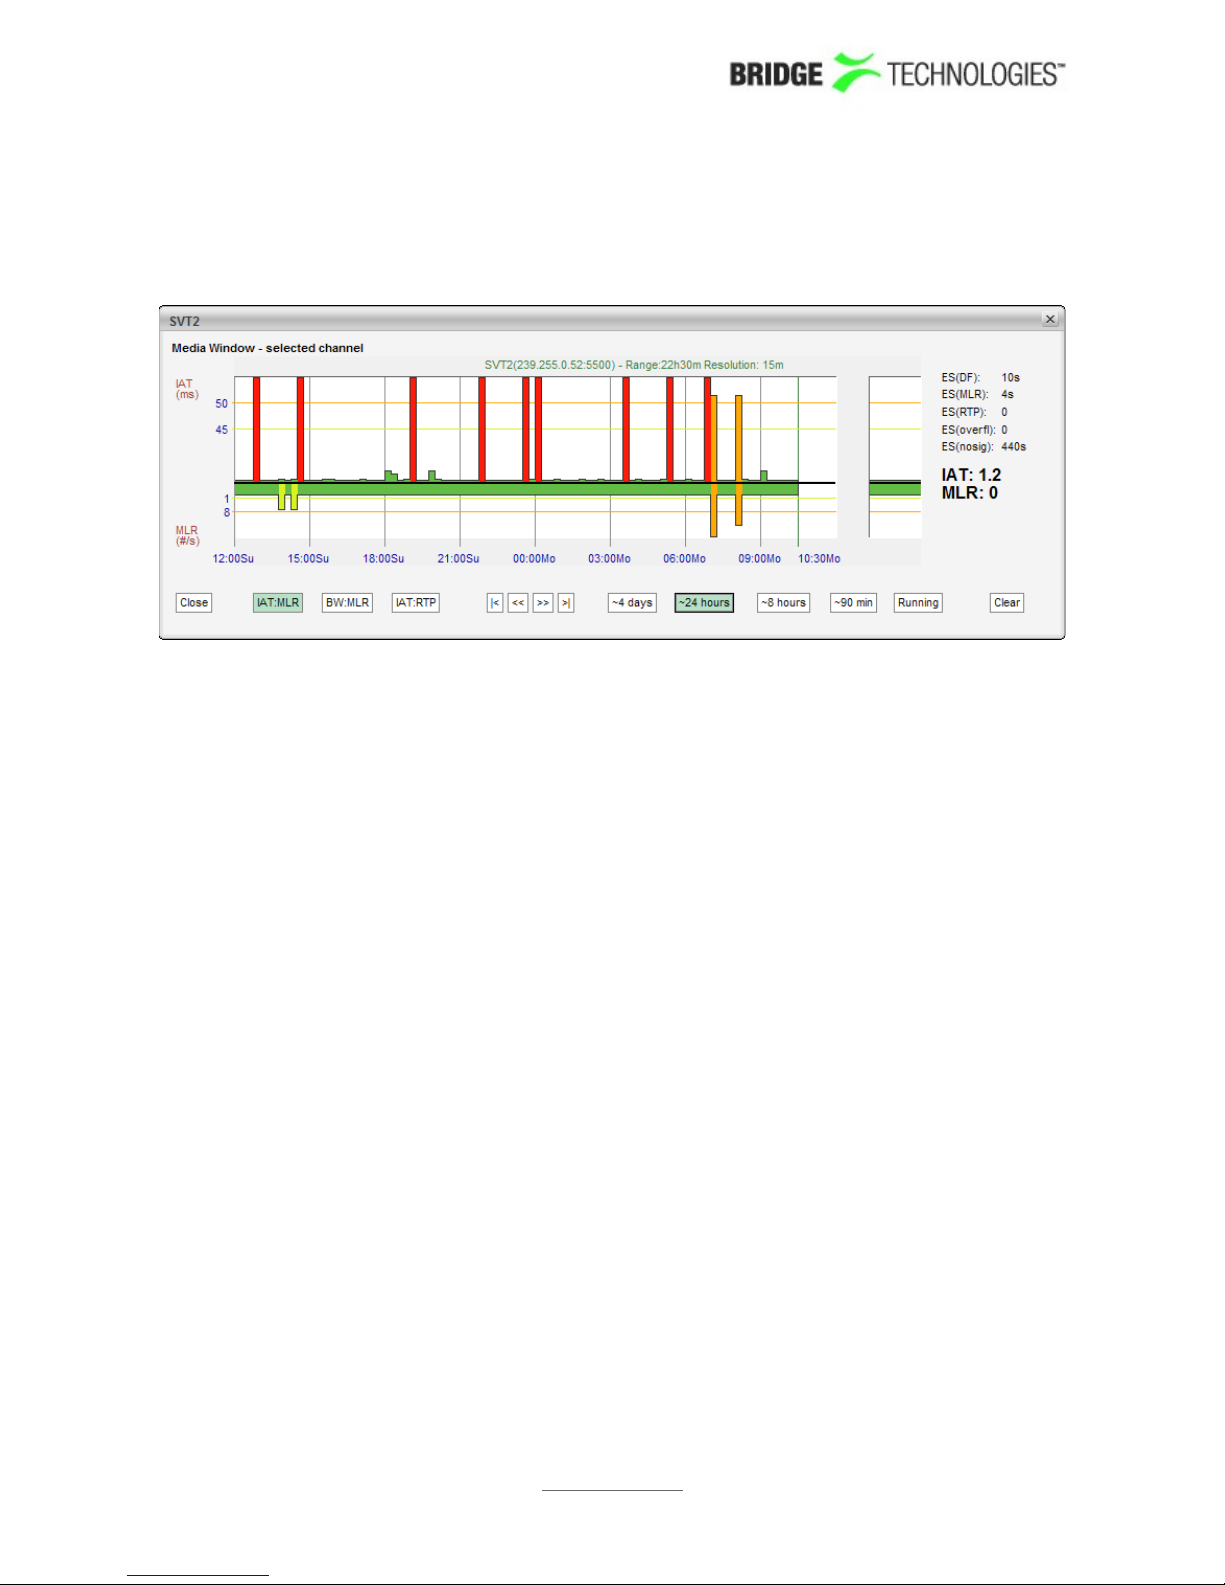
In the above diagram tooltip reveals that 'No signal' occurred between 9:15 and 9:20.
Media Window - Selected channel
The Media Window - selected channel view is activated by clicking a multicast
label in the MW page. By clicking the popup button a popup window will appear, the
user can have this separate window showing selected channel even when navigating
away from the probe. This provides the ability to monitor media windows for several
streams without starting several browser sessions. When in the popup Media Window
by pressing some where in the graph, the field will get zoomed in.
This hi-resolution version of the Media Window reveals more details than the
compressed version. There are 3 times more samples along the X-axis, and the graph
indicates visually the error and warning thresholds. Note that the time windows of the
regular Media Window and Media Window - selected channel are not exactly the
same, even if the same time window has been selected for both views.
PROBE USERS' MANUAL VERSION 5.0
2014 © BRIDGE Technologies Co AS - Bentsebrugata 20 - N-0476 Oslo, Norway - tel: +47 22 38 51 00 -
www.bridgetech.tv
89
Page 89
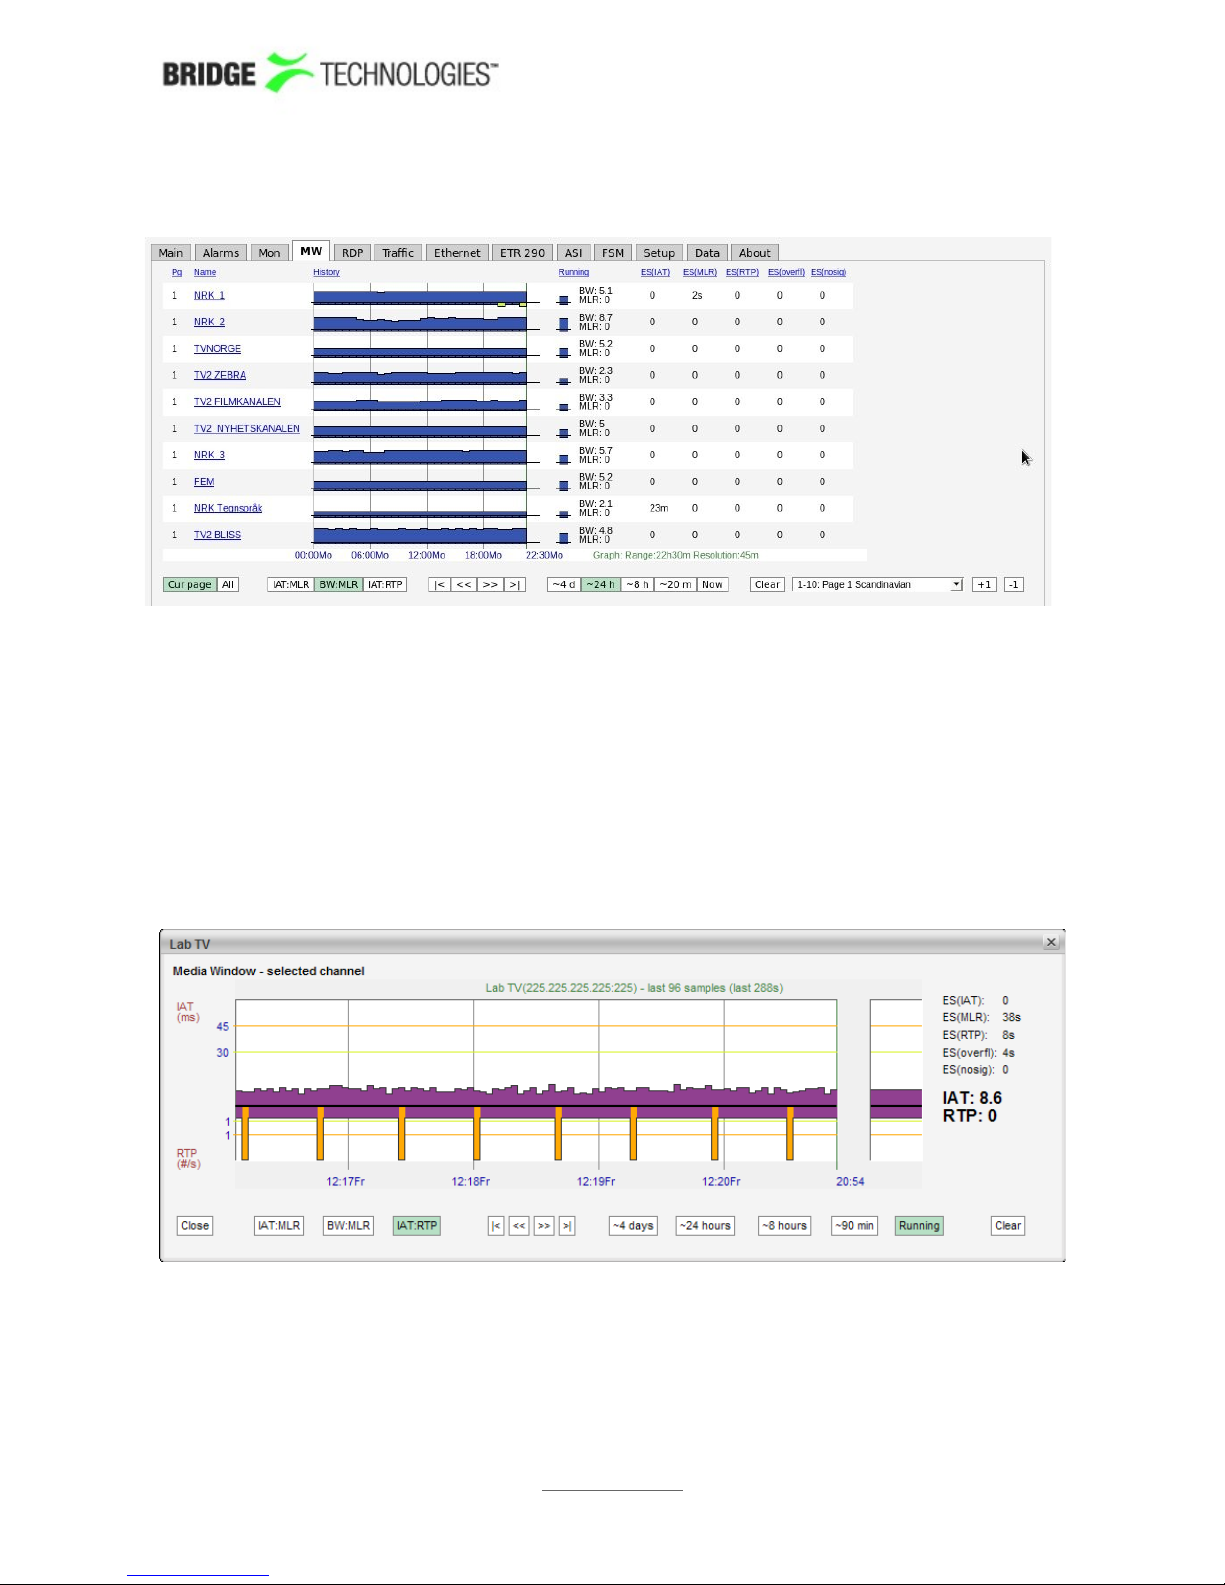
Bandwidth graph
By clicking the BW:MLR button the graph displays the peak bandwidth as a function
of time. The negative part of the composite graphs is still the packet loss (i.e. the
MLR).
If the stream contains a transport stream (mapping TS/x) the bitrate corresponds to
the Mon parameter Net bitrate (i.e. bitrate excluding null packets). Otherwise the
bitrate is the UDP payload bitrate corresponding to the Mon parameter Curr bitrate.
The bandwidth error threshold is configured in the Ethernet - Ethernet thresh.
menu.
RTP graph
By clicking the IAT:RTP button the graph displays the packet jitter as a function of
time. The composite graphs displays the RTP packet loss below the X-axis. If the
monitored stream is not RTP encapsulated, IAT will be represented by grey colour and
there will never be any indication of packet loss in the graph.
PROBE USERS' MANUAL VERSION 5.0
2014 © BRIDGE Technologies Co AS - Bentsebrugata 20 - N-0476 Oslo, Norway - tel: +47 22 38 51 00 -
www.bridgetech.tv
90
Page 90

PROBE USERS' MANUAL VERSION 5.0
2014 © BRIDGE Technologies Co AS - Bentsebrugata 20 - N-0476 Oslo, Norway - tel: +47 22 38 51 00 -
www.bridgetech.tv
91
Page 91
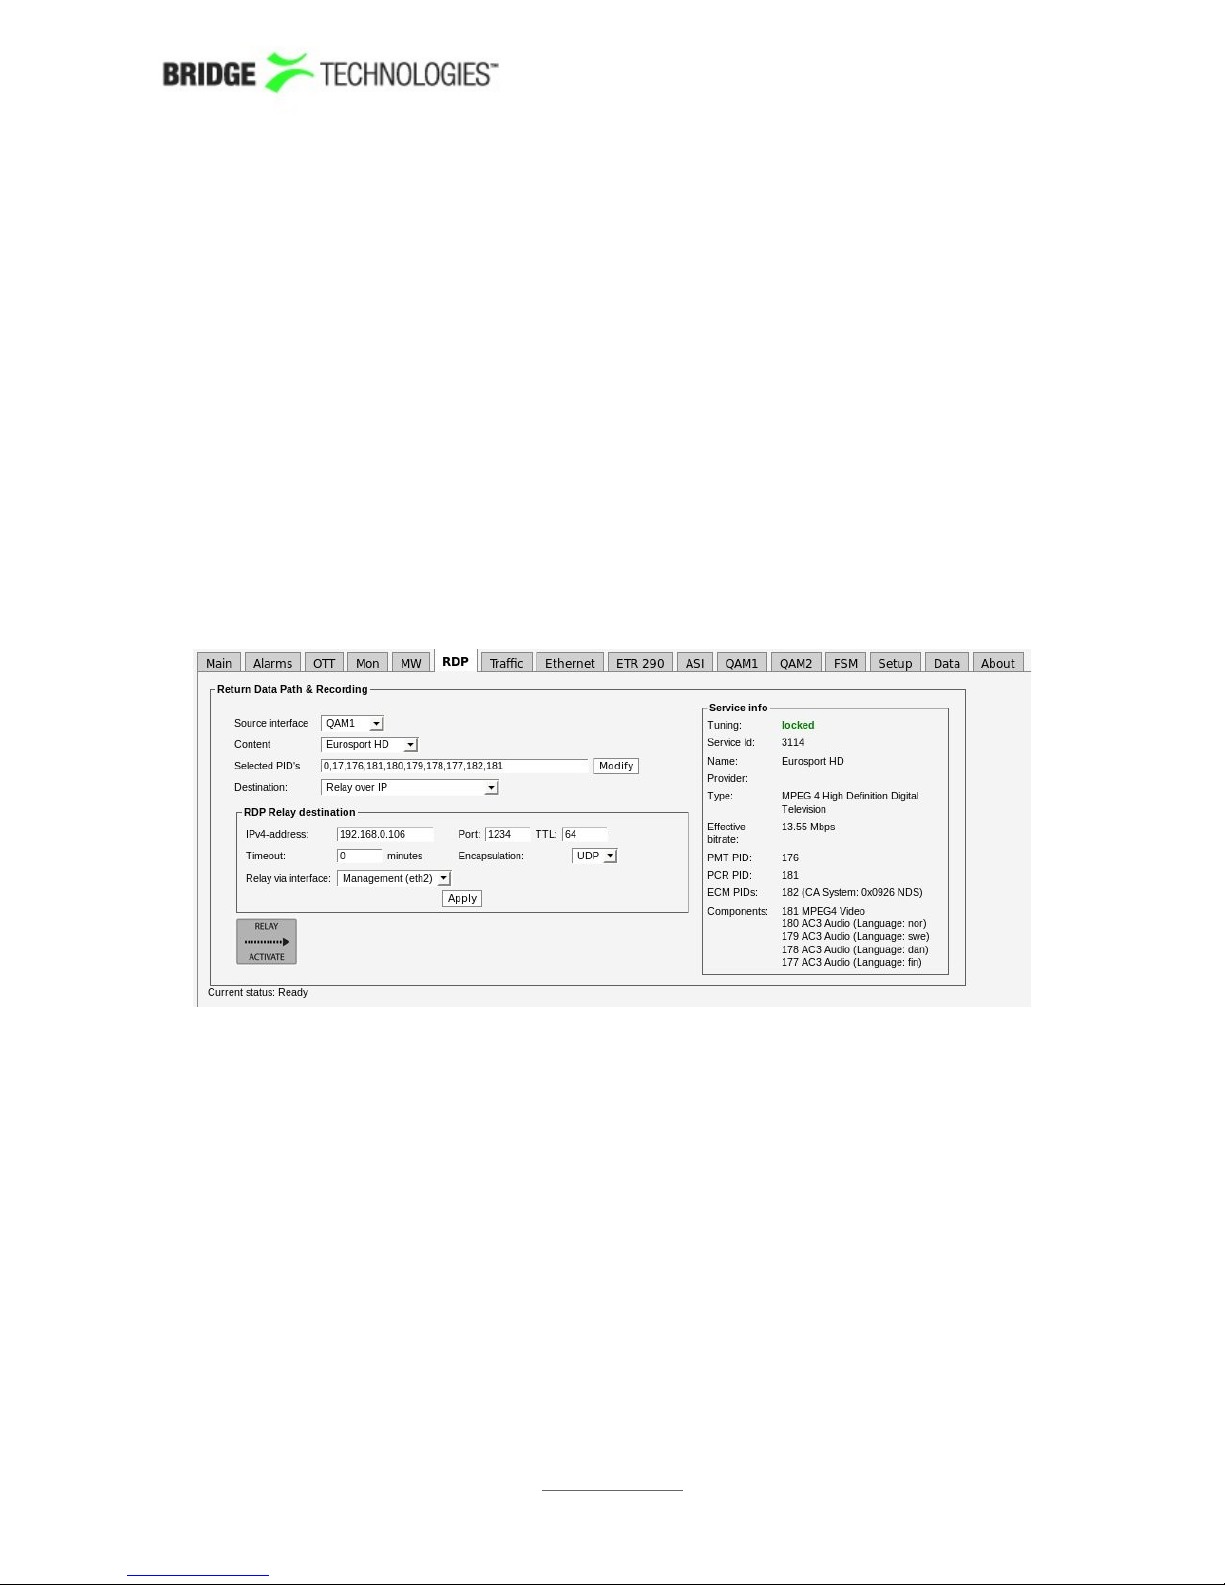
6.6 RDP
The Return Data Path feature enables forwarding of a stream from any probe interface
to another destination IP-address. An Ethernet stream may also be recorded to file.
Although Bridge Technologies probes allow detailed analysis and inspection of signals,
there will always be situations when other tools are required. Rather than carrying
heavy and expensive equipment from site to site for remote investigation, it is much
easier to forward the stream back to where the equipment is located.
Situations when RDP is particularly useful include testing of scrambled signals.
Descrambling of a stream can be easily verified by forwarding the stream to a
centrally located decoder or set-top box. Another example is when local insertion and
PSI/SI multiplexing introduces lots of unknowns in remote locations. Bringing the signal
back for analysis could be very useful.
RDP Relay
A stream can be RDP forwarded to a specified IP-address as a unicast stream or as a
multicast stream. The interface across which to forward the traffic needs to be
specified in both cases.
The relaying functionality is enabled by clicking the grey Relay button. Relaying is
stopped by clicking the green Relay active button. If a relay timeout period different
from 0 is selected, relaying will be stopped when the relay timeout period has expired.
Note that when relaying signals originating from optional input modules, it is
necessary to lock the tuning to one frequency for proper operation. This is done under
the ETR290 view.
RDP Record
PROBE USERS' MANUAL VERSION 5.0
2014 © BRIDGE Technologies Co AS - Bentsebrugata 20 - N-0476 Oslo, Norway - tel: +47 22 38 51 00 -
www.bridgetech.tv
92
Page 92
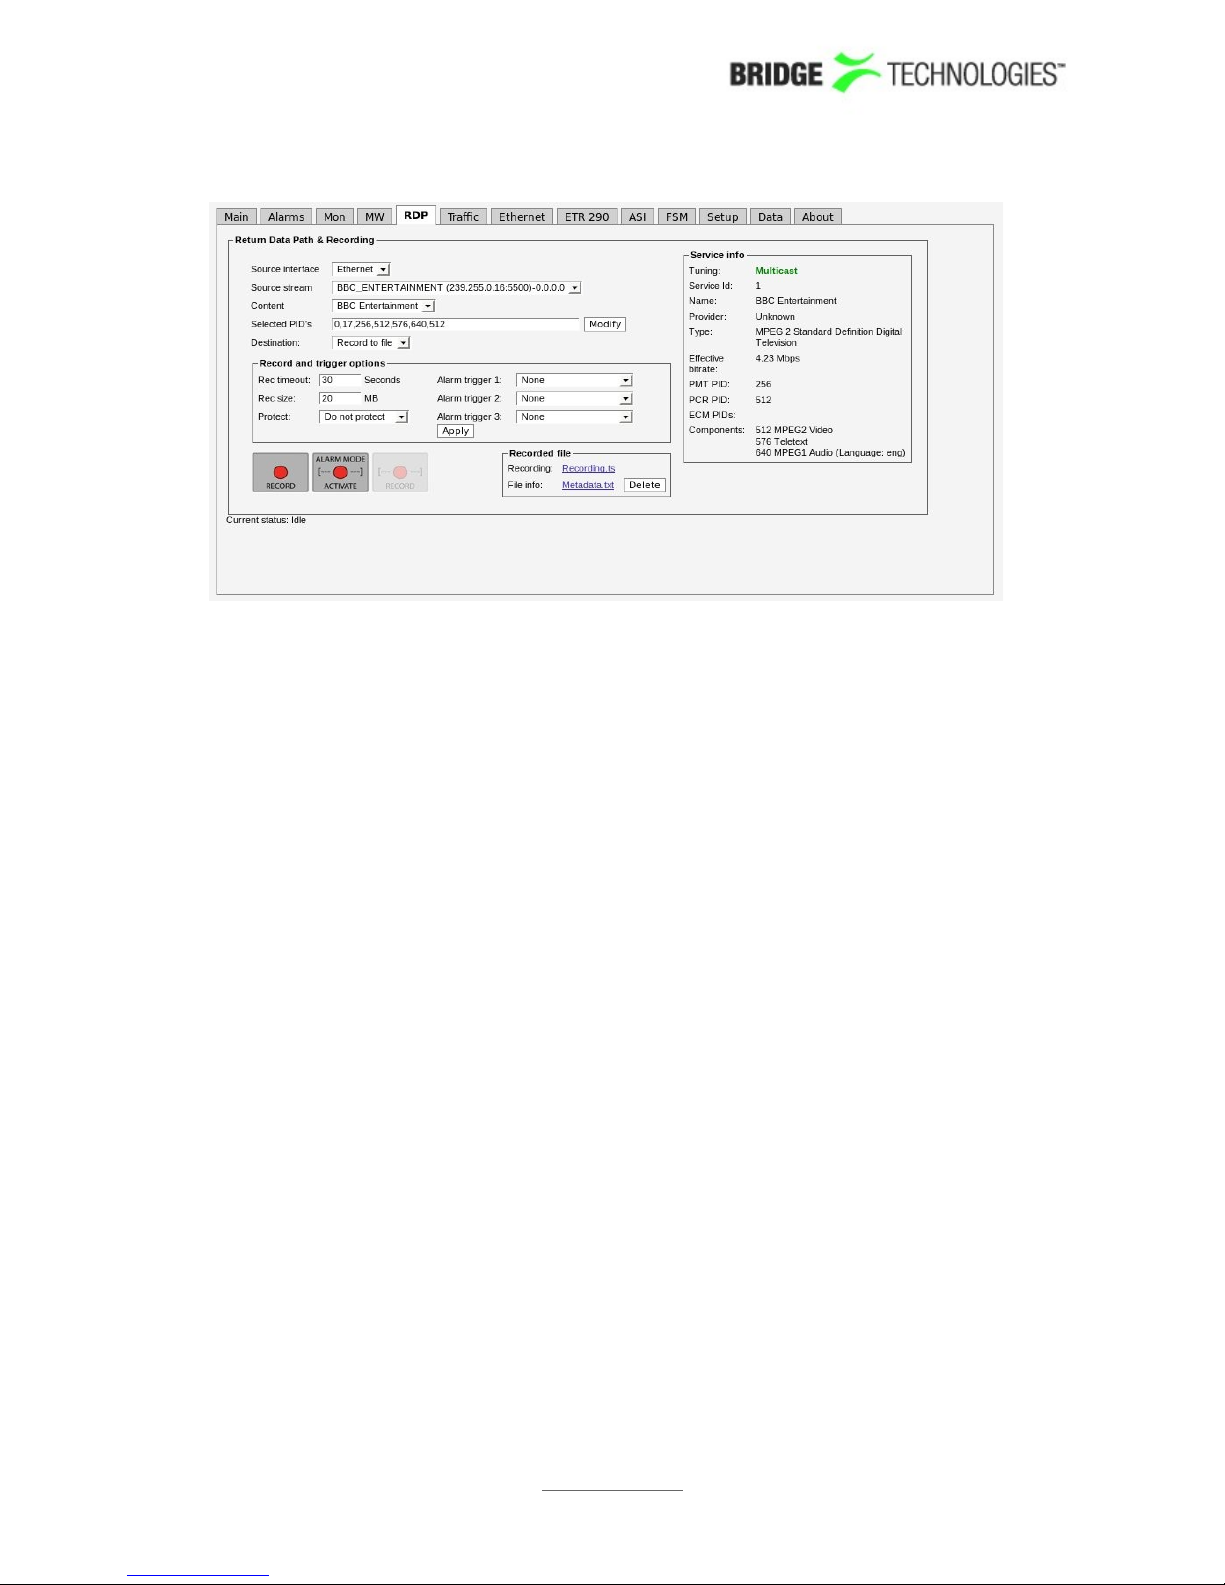
NB! The record feature is not available in the probe if the OTT license option is
activated due to resource limitations.
The record feature allows a short portion of a transport stream to be recorded for
further analysis. The recording can be of an Ethernet multicast or one of the RF/ASI
interfaces.The recording is triggered either manually or by alarms, as specified by the
user. A maximum of three different alarms may trigger recording. A selectable
protection period ensures that recorded data is preserved long enough for the user to
take action as required. The recorded file may be saved to an external disc (e.g. a PC),
usually by clicking the filename and selecting the save option, but this depends on the
web browser being used. If the browser does not support files with extension .ts, the
user may save the file to disc by right clicking the filename link and selecting
Download linked file or Save target as.
In basic record mode, i.e. when alarm mode is not selected, the recording will start
when the user clicks the Record button as shown below (after a short delay of
approximately 2 seconds - note that screen update will generally be slower than actual
record start time).
PROBE USERS' MANUAL VERSION 5.0
2014 © BRIDGE Technologies Co AS - Bentsebrugata 20 - N-0476 Oslo, Norway - tel: +47 22 38 51 00 -
www.bridgetech.tv
93
Page 93
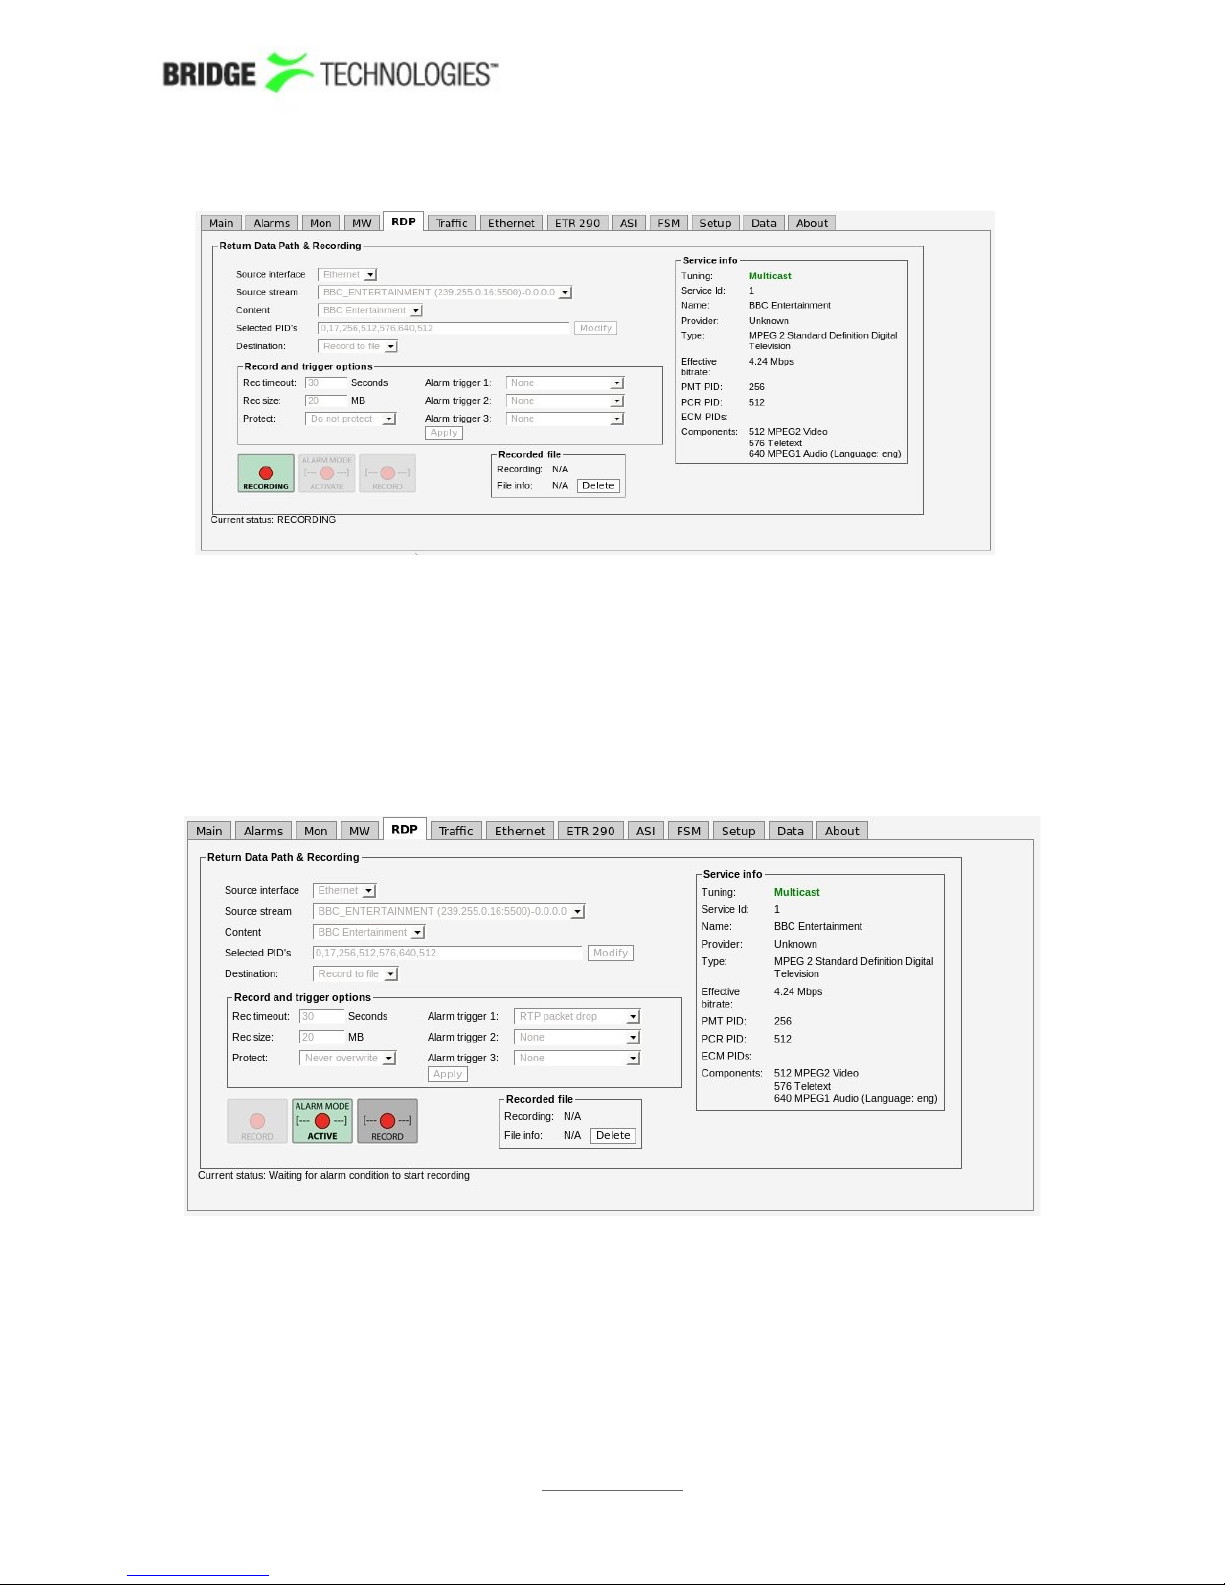
Clicking the leftmost Record button will start a recording which may be manually
stopped by clicking the green Recording button.
If one or more alarms are configured to trigger recording and alarm mode is selected,
the recorder will continuously store the incoming transport stream in a ring buffer.
When an alarm configured for trigging is raised, the recorder will start emptying the
ring buffer and continue recording until the selected file size is reached. In the
resulting recording the error event will be located in the middle of the recording.
To activate the alarm triggered recording mode click the Alarm mode activate
button. When in alarm triggered mode the Record button will allow the user to
override the alarm trigger and make a recording based on data in the ring buffer. This
enables the user to create a recording of a visually detected error.
To exit the alarm triggered recording mode click the green Alarm mode active
button.
PROBE USERS' MANUAL VERSION 5.0
2014 © BRIDGE Technologies Co AS - Bentsebrugata 20 - N-0476 Oslo, Norway - tel: +47 22 38 51 00 -
www.bridgetech.tv
94
Page 94

The basic settings in the RDP view are:
Return Data Path & record
Source
interface:
The source interface drop-down menu allows selection of
available input signals. Note that ETR290 analysis of a
demodulated signal should be locked (round-robin looping
disabled) to obtain a continuous stream for ASI and RF signals.
Content: When Ethernet input is selected the user selects the stream to
forward or record. Ethernet streams being joined/monitored by
the probe are available for selection.
When any other source interface than Ethernet is specified, the
user selects the service to be relayed to a specified IP-address,
or alternatively selects that the complete stream should be
forwarded. The PIDs associated with the service are
automatically displayed in the 'Selected PIDs' field, and these
may be edited if required.
Selected PIDs: When ASI or a demodulator input is selected the user can
specify the PIDs to be forwarded. Typically PAT and PMT PIDs
should be forwarded in addition to video and audio PIDs,
however this depends on the equipment receiving the
forwarded stream. When this field has been edited, click the
Modify button for the changes to take effect.
Destination: For Ethernet input select Record to enable transport stream
recording or Relay to forward a stream to another destination.
For other interfaces only relay mode is selectable.The GUI will
change to enable user selection of relevant parameters for the
different modes of operation.
The Stream info field displays the following information if an Ethernet stream
selected for relaying or recording:
Stream info
Name: The stream name
Src address: The source IP-address and port number of the multicast
Src mac: The source MAC address
Mapping: The current mapping of TS-data
Bitrate: The current bitrate of the multicast
CC errors: The number of CC errors counted for the multicast
(corresponding to the figure in the Mon - Parameters view)
IAT average: The average Inter-packet Arrival Time for the multicast
(corresponding to the figure in the Mon - Parameters view)
PROBE USERS' MANUAL VERSION 5.0
2014 © BRIDGE Technologies Co AS - Bentsebrugata 20 - N-0476 Oslo, Norway - tel: +47 22 38 51 00 -
www.bridgetech.tv
95
Page 95

The Stream info field displays the following information if a complete stream other
than Ethernet is selected for relaying or recording:
Stream info
Tuning state: The tuning is either 'locked' or 'unlocked', depending on round-
robin status.
Monitoring
tuning:
The name of the stream currently selected
Stream Id: The stream ID of the selected stream
Total bitrate: The total bitrate of the selected stream (including null packets)
Effective
bitrate:
The effective bitrate of the selected stream (excluding null
packets)
Num PIDs: The number of PIDs contained within the selected stream
Num services: The number of services contained within the selected stream
The Service info field displays the following information if a service is selected for
relaying or recording:
Service info
Tuning: The tuning is either 'locked' or 'unlocked', depending on round-
robin status.
Service Id: The service ID, as signalled in PAT
Name: The stream name, as signalled in SDT
Provider: The service provider, as signalled in NIT
Type: The service encoding format
Effective
bitrate:
The service bitrate, i.e. the sum of bitrates for PIDs associated
with the service
PMT PID: The PMT PID associated with the service
PCR PID: The PCR PID associated with the service
ECM PIDs: The ECM PIDs associated with the service (if applicable)
Components: The service component PIDs and component types
When destination Relay over IP has been selected, the RDP parameters are:
RDP Ethernet
IPv4-address: The unicast address or multicast address to forward to.
Multicast addresses are in the range 224.0.0.0 –
239.255.255.255.
PROBE USERS' MANUAL VERSION 5.0
2014 © BRIDGE Technologies Co AS - Bentsebrugata 20 - N-0476 Oslo, Norway - tel: +47 22 38 51 00 -
www.bridgetech.tv
96
Page 96

Port: The port to forward to. The combination of IP-address and port
fully describes the destination address.
Unicast
gateway:
If the unicast destination address can only be reached via a
gateway, the gateway address must be specified.
TTL: The Time-To-Live flagging of the relayed signal. The default
value is 64.
Timeout: The relaying period in minutes. If the value 0 is selected, no
timeout applies, and relaying will continue until it is stopped
manually.
Encapsulation: The encapsulation format of the relayed stream. UDP or RTP
may be selected.
Relay multicasts
via interface:
If the multicast is to be forwarded on the management subnet,
eth2 is selected. If eth0 is specified, the multicast is forwarded
on the data/video interface.
When destination Record has been selected the record and trigger options are:
Record and trigger options
Rec timeout: The maximum recording time in seconds. This setting enables
the user to limit recordings of low-bitrate streams.
Rec size: The total file size of the recording (maximum 20MB). When in
alarm trigger mode the resulting recording will consist of 12MB
of data from before the alarm was raised and (Size - 12MB) of
data from after the alarm occurrence. 1MB=1000000 bytes.
Protect: When in alarm trigger mode the user may select to protect a
recording from being overwritten due to a new alarm
occurrence. The user may select between 'Never overwrite', 'Do
not protect', '30 seconds', '60 seconds' and '5 minutes'.
Alarm trigger 1-3:Select a maximum of three different alarms that should trigger
recording. Note that a recording will start upon a transition from
status ok to status alarm. Alarms that have been disabled in the
Alarms - Alarm setup view will be shown in brackets - these
will never trigger a recording.
Note that it is necessary to click the Apply button for changes to take effect.
The recorded file and associated metadata may be accessed from the recorded file
area of the view:
Recorded file
Recording: This field will read recording.ts when a recording has been
stored to file, and N/A when there is no current recording. The
recorded file may be accessed by clicking the recording.ts link
PROBE USERS' MANUAL VERSION 5.0
2014 © BRIDGE Technologies Co AS - Bentsebrugata 20 - N-0476 Oslo, Norway - tel: +47 22 38 51 00 -
www.bridgetech.tv
97
Page 97
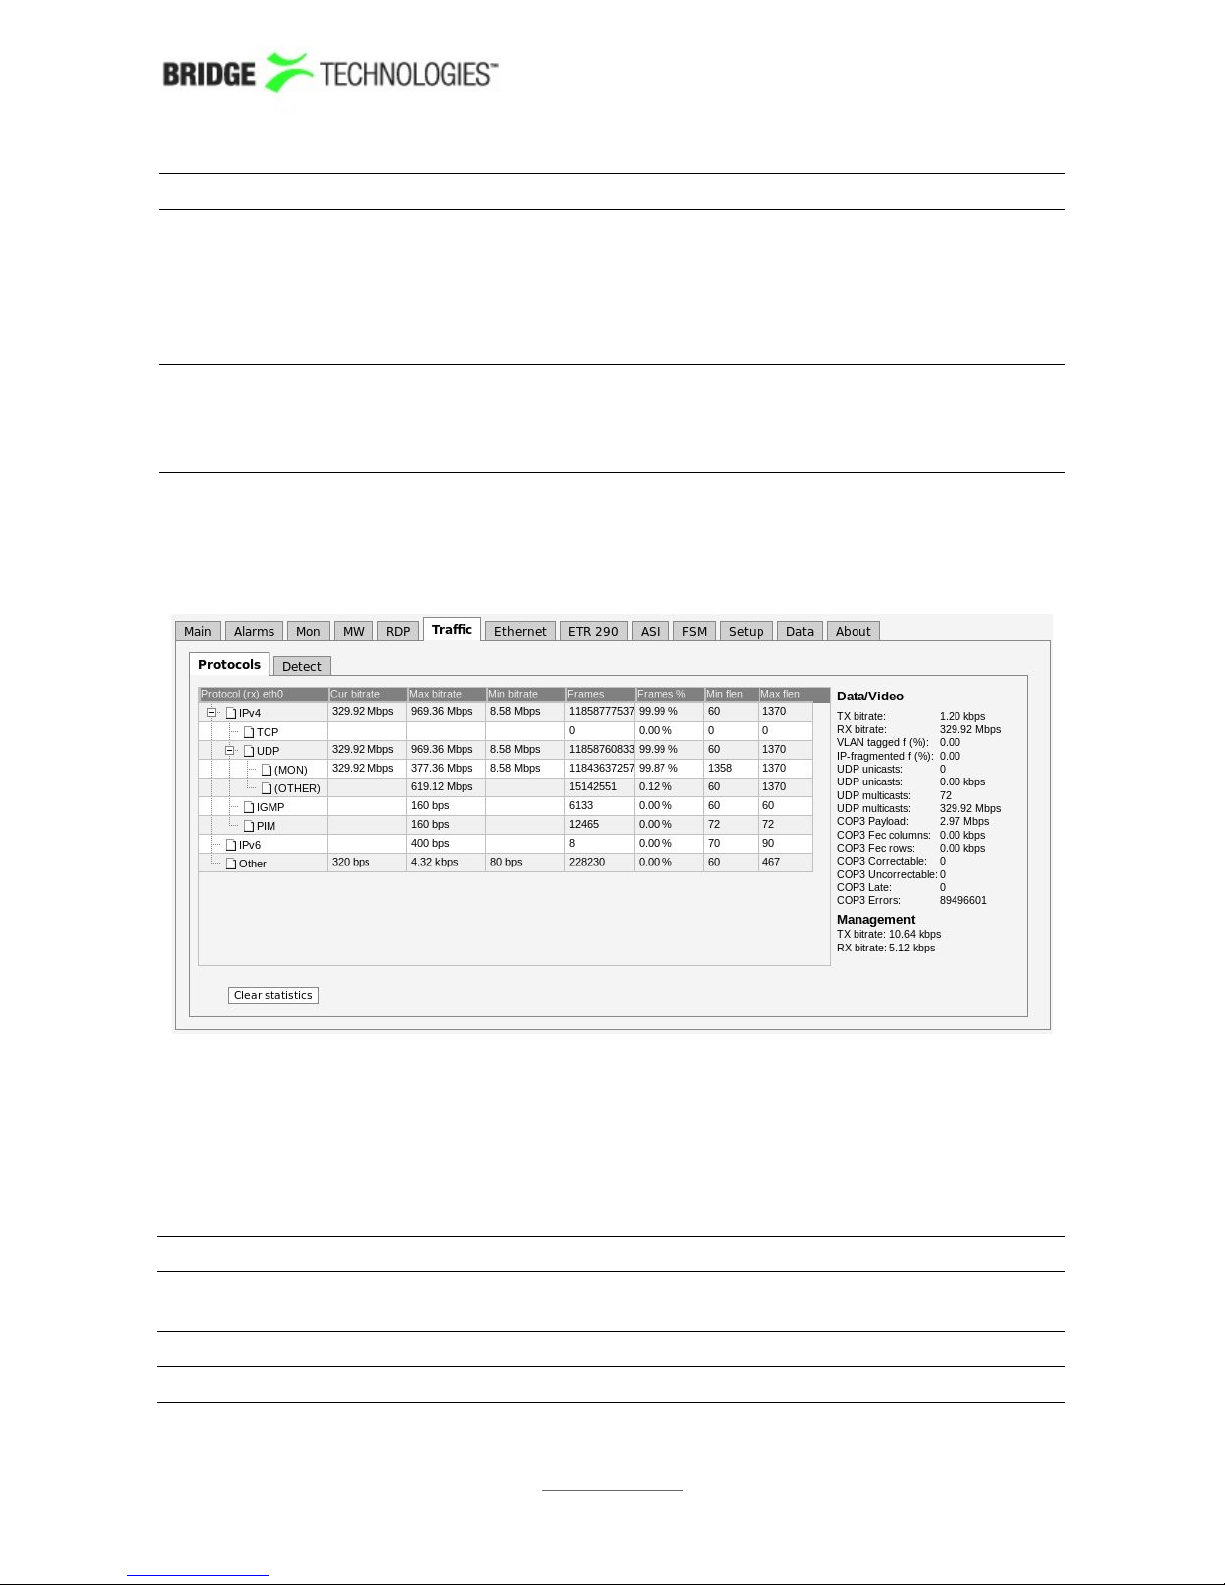
or by right clicking the link (web browser dependant).
File info: This field will read metadata.txt when a recording has been
stored to file and N/A when there is no current recording. The
metadata text contains information about the recording, and it
may be accessed by clicking the metadata.txt link. For best
file info display formatting an application like Windows Word
Pad should be used to read the file.
Delete: Click the Delete button to delete the current recording. Note
that an existing recording should be deleted prior to software
update, as otherwise there may not be enough memory to store
the new sw image during the upgrade process.
6.7 Traffic
6.7.1 Traffic - Protocols (requires AET-OPT)
The Traffic Protocols view allows monitoring of IP traffic on the data/video port in
terms of the protocols used.
Clicking the Clear statistics button will reset displayed values.
The following measurements are presented:
Protocol (rx): The protocol for which the following measurements apply
Cur bitrate: The current total bitrate for this protocol (measured over the
last 1s period)
Max bitrate: The maximum bitrate during any 1s period
Min bitrate The minimum non-zero bitrate during any 1s period
PROBE USERS' MANUAL VERSION 5.0
2014 © BRIDGE Technologies Co AS - Bentsebrugata 20 - N-0476 Oslo, Norway - tel: +47 22 38 51 00 -
www.bridgetech.tv
98
Page 98

Frames: Number of Ethernet frames
Frames %: Percentage of total number of frames
Min flen: Minimum Ethernet frame length
Max flen: Maximum Ethernet frame length
Data/video interface (eth0)
TX bitrate: The current total transmitted bitrate
RX bitrate: The current total received bitrate
VLAN tagged
frames (%):
The percentage of Ethernet frames that are VLAN
tagged
IP-fragmented
frames (%):
The percentage of IP packets that are fragmented,
meaning they span more than one Ethernet frame
UDP unicasts: The number of detected UDP unicasts
UDP unicasts: The total bitrate of detected UDP unicasts
UDP multicasts: The number of detected UDP multicasts
UDP multicasts: The total bitrate of detected UDP multicasts
COP3 Payload: Total bitrate of all payload streams with FEC enabled
COP3 Fec
columns:
Total bitrate of all column-FEC streams
COP3 Fec rows: Total bitrate of all row-FEC streams
COP3
Correctable:
Total count of dropped payload IP packets that are
correctable by the FEC
COP3
Uncorrectable:
Total count of dropped payload IP packets that
cannot be corrected by the FEC
COP3 Late: Payload or FEC packets are received slightly too late
according to the buffer model and may result in errors in
another
implementation of the specifications. The number of packets
with this error.
COP3 Errors: Either the L/D parameters are not consistent across the
streams or payload/FEC packets are received too late or too
early
according to the buffer model. The number of packets with
these errors.
Management interface (eth 2)
TX bitrate: The current total transmitted bitrate
PROBE USERS' MANUAL VERSION 5.0
2014 © BRIDGE Technologies Co AS - Bentsebrugata 20 - N-0476 Oslo, Norway - tel: +47 22 38 51 00 -
www.bridgetech.tv
99
Page 99
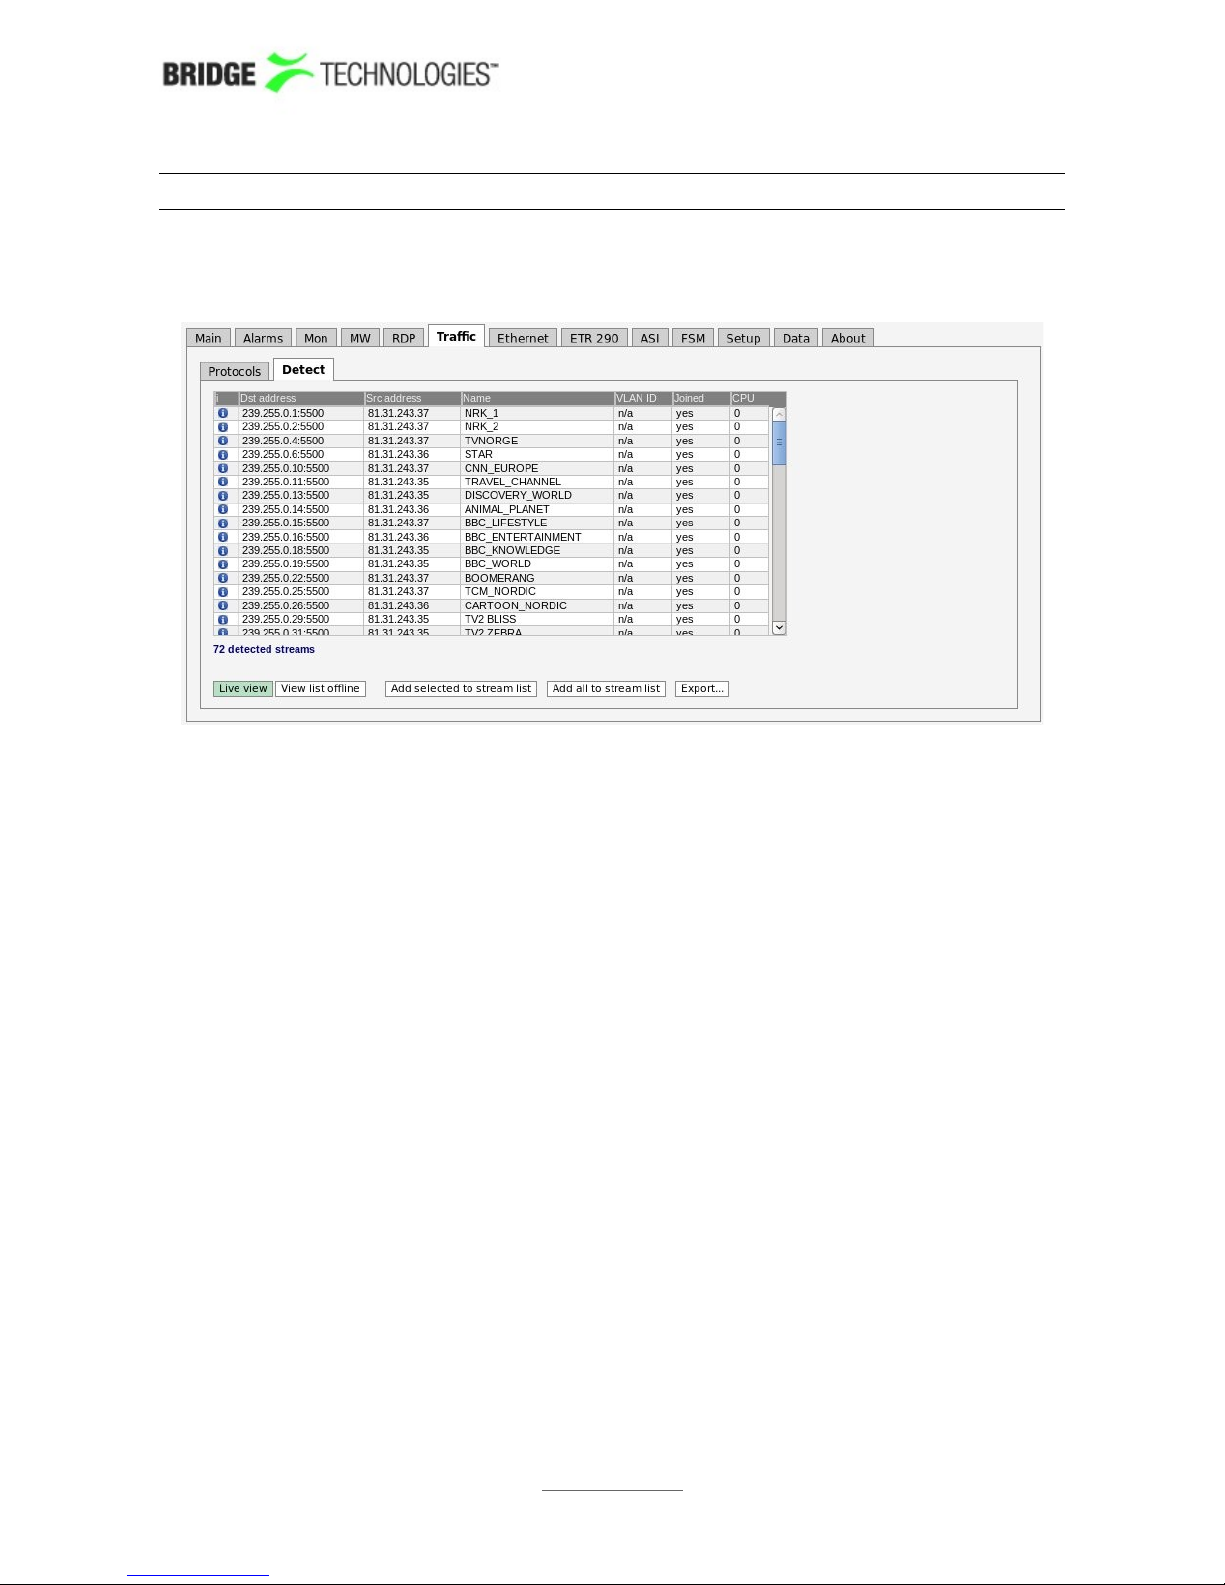
RX bitrate: The current total received bitrate
6.7.2 Traffic - Detect
The Traffic Detect page shows all UDP traffic sensed by the probe. Note that
promiscuous network mode should be enabled in the Setup - Params view for the
probe to detect all traffic, and not only multicasts already joined by the probe. Note
that generally the upstream switch or router will not output streams that are not joined
by downstream equipment, i.e. usually only joined streams will be available for
monitoring.
If the unicast/multicast destination address is known to the probe (i.e. listed in the
Ethernet - Multicasts menu) the stream’s Name is looked up, otherwise a generic
name is used.
When the Ethernet - Detect view is entered after probe booting, the probe will perform
a detect operation. For the probe to update the list, click the Refresh button.
The source address makes it possible for the probe to distinguish between multicasts
with the same destination IP address and port, provided that Source specific
multicasts has been enabled in the Setup - Params view.
If the stream is currently joined by the probe (i.e. the probe is currently monitoring the
stream), the Joined field is set to yes.
VLAN ID is only available if the probe has enabled VLAN tagging for eth0 (Ethernet Parameters).
Detected streams can be added to the probe’s stream list by selecting streams and
clicking the Add selected to stream list. To add all detected streams the Add all to
stream list button can be pressed. Only streams not already in the probe’s stream list
are considered. Clicking the Export button will generate an XML-file that opens in a
new window.
PROBE USERS' MANUAL VERSION 5.0
2014 © BRIDGE Technologies Co AS - Bentsebrugata 20 - N-0476 Oslo, Norway - tel: +47 22 38 51 00 -
www.bridgetech.tv
100
Page 100
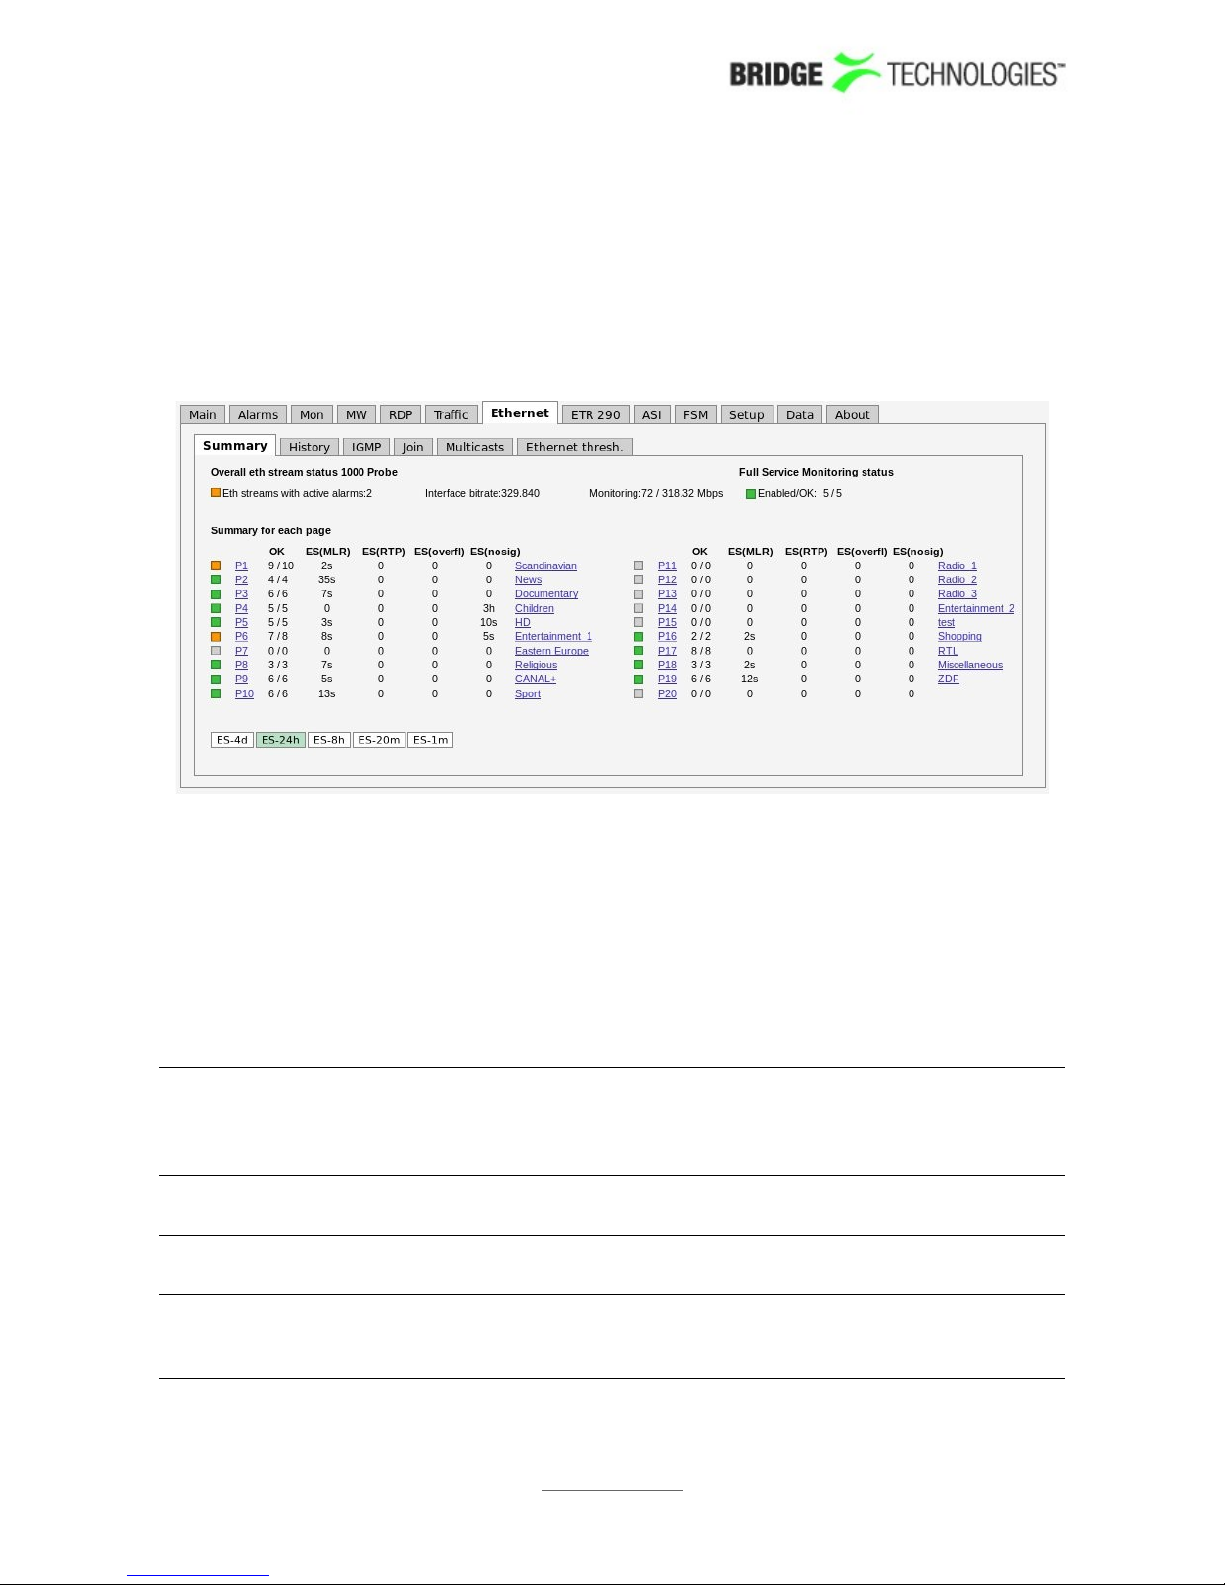
6.8 Ethernet
6.8.1 Ethernet - Summary
The intention of this page, together with the alarm list, is to provide enough
information for the operator to immediately see if there is anything seriously wrong
with one or more Ethernet input streams. The overall status for the Full Service
Monitoring (FSM) is also shown.
Throughout this view the bulb colours indicate the most severe active alarm. They
may be green (no alarm), yellow (warning), orange (error) or red (major). The bulb
colour is based on user defined alarm severity settings for each alarm. A grey bulb
indicates that monitoring is disabled.
The following Ethernet parameters are shown:
Eth streams with
active alarms:
Shows the number of streams that are presently in an alarm
state (0-50). Note that the number of alarms counted refers to
default settings, and alarms disabled by the user will still be
counted.
Interface
bitrate:
This is the total bitrate sensed on eth0. It should be greater
than or equal to the Monitoring bitrate.
Monitoring: This is the total number of Ethernet streams monitored (0-50)
and the total bitrate for these streams.
Full Service
Monitoring
status:
The number of enabled FSM services / number of OK FSM
services
PROBE USERS' MANUAL VERSION 5.0
2014 © BRIDGE Technologies Co AS - Bentsebrugata 20 - N-0476 Oslo, Norway - tel: +47 22 38 51 00 -
www.bridgetech.tv
101
 Loading...