

Page 1

Lightning/2000
version 6.6
User’s Manual
Copyright © 2014, Aninoquisi
July, 2014
™
112 Bruce Street
Huntland, TN 37345
Phone: 931.469.7608
e-Mail: [email protected]
World-Wide Web: www.aninoquisi.com
Page 2

L I G H T N I N G / 2 0 0 0
Table of Contents
A Warning ________________________________________ 7
Introduction _________________________________________ 9
About Lightning/2000… _____________________________ 9
System Requirements ______________________________ 10
Lightning/2000 Installation _________________________ 12
Background Map Installation _______________________ 13
Device Driver Installation __________________________ 13
Basic Operation _____________________________________ 17
Using the Built-in Help _____________________________ 17
How Lightning/2000 Works _________________________ 18
The Boltek Hardware ______________________________ 20
CPU Usage _______________________________________ 21
Running Lightning/2000 ___________________________ 22
Customizing Lightning/2000’s Performance ___________ 23
Operating modes __________________________________ 24
Customizing the Colors, Fonts, and Alarms ____________ 25
Other Customizations ______________________________ 26
The Background Map ________________________________ 27
About the Background Map ________________________ 27
Status Bar _______________________________________ 28
Popup Menus_____________________________________ 28
Changing Map Object Colors _______________________ 29
Displaying/Hiding Map Layers ______________________ 29
Map Object Visibility ______________________________ 30
ii
ii
iiii
Page 3

R E A L - T I M E L I G H T N I N G D E T E C T I O N
Editing the Background Map _______________________ 30
Naming Map Objects ______________________________ 32
The Windows _______________________________________ 33
Raw Lightning Data _______________________________ 34
Real-time Lightning _______________________________ 38
Analysis _________________________________________ 41
Threat Assessment ________________________________ 44
Stroke Rate Graph ________________________________ 46
Rates ___________________________________________ 47
Totals ___________________________________________ 50
Control Panel ____________________________________ 52
Storm Statistics ___________________________________ 55
Detector Status ___________________________________ 61
NOWCast _______________________________________ 62
Summary ________________________________________ 62
Records _________________________________________ 63
The General Status Line ___________________________ 64
Archive Player ___________________________________ 65
The Custom Summary Window ________________________ 69
Overview ________________________________________ 69
Commands _______________________________________ 73
Keywords _______________________________________ 74
The Rate Counters ___________________________________ 77
The Major Counters _______________________________ 78
The Flash Rate Counters ___________________________ 81
The Percent Counters______________________________ 87
3333
Page 4

L I G H T N I N G / 2 0 0 0
The Stroke Rate Counters __________________________ 92
The Stroke Rate Change Counters ___________________ 96
Menu Commands ___________________________________ 105
File Menu _______________________________________ 105
Edit Menu ______________________________________ 109
Window Menu ___________________________________ 110
Options Menu ___________________________________ 114
Help Menu ______________________________________ 116
Counters Menu __________________________________ 117
Panels Menu ____________________________________ 129
Popup Menus ______________________________________ 131
Accessing Popup Menus ___________________________ 131
Popup Menu Reference ___________________________ 132
Using the Dialogs ___________________________________ 159
Align Map Dialog ________________________________ 160
Hardware Settings Dialog _________________________ 161
Range Scaling Dialog _____________________________ 167
Screen Captures Dialog ___________________________ 171
Alarm Properties Dialog __________________________ 187
Stroke Click Sound Dialog _________________________ 188
Stroke Types Dialog ______________________________ 190
E-Mail Options Dialog ____________________________ 192
FTP Options Dialog ______________________________ 197
Custom Summary Manager Dialog __________________ 200
Text Message Settings Dialog ______________________ 204
Software Squelch Dialog __________________________ 206
4444
Page 5

R E A L - T I M E L I G H T N I N G D E T E C T I O N
Settings Dialog __________________________________ 207
Graph Stroke Types and Colors Dialog ______________ 211
Layer Order Dialog ______________________________ 213
Selected Topics ____________________________________ 215
Raw Lightning Data vs. Real-time Lightning _________ 215
Alerts __________________________________________ 216
Energy _________________________________________ 218
Noises __________________________________________ 219
Range Determination _____________________________ 220
Nearby Flashes __________________________________ 221
Sending E-mail via The Custom Summary ___________ 222
Antenna Placement _______________________________ 222
Troubleshooting _________________________________ 224
A Lightning Primer _________________________________ 227
Thunderstorms and Lightning Types ________________ 227
Recognizing Patterns of Strokes ____________________ 235
Lightning as an Indicator of Storm Behavior _________ 238
The Stroke Sort Process and Other Limitations _______ 242
Additional Information Sources ____________________ 244
Alphabetical Keyword List____________________________ 247
Custom Summary Language Definition _________________ 257
Custom Summary Commands and Keywords_____________ 259
Commands ______________________________________ 259
Count Keywords _________________________________ 269
Date/Time Keywords _____________________________ 275
Miscellaneous Keywords __________________________ 286
5555
Page 6

L I G H T N I N G / 2 0 0 0
Peak Count Keywords ____________________________ 294
Percent and Ratio Keywords _______________________ 299
Records Keywords _______________________________ 302
Total Count Keywords ____________________________ 311
Trend Keywords _________________________________ 314
Custom Summary Examples __________________________ 319
Performing Screen Captures and FTP _______________ 319
Sending E-Mail or Text Messages ___________________ 322
Sending Place-Specific E-Mail ______________________ 323
Sending Text Messages to Local Recipients ___________ 325
Sending Place-Specific Text Messages _______________ 325
Posting Status Updates to Your Twitter Account ______ 326
Index ____________________________________________ 327
6666
Page 7

R E A L - T I M E L I G H T N I N G D E T E C T I O N
A Warning
Lightning/2000 produces information on several levels that
can be used to detect approaching storms. Don’t allow your
enthusiasm for tracking severe weather to cloud your
judgment however. You should not depend solely on
Lightning/2000 for your severe weather warnings.
Though we believe that Lightning/2000 is a useful tool in
your severe-weather preparedness arsenal, it shouldn’t be used
for the protection of life or property. Pay attention to other
sources of information such as Doppler radar or weather
radio. Multiple red alerts from Lightning/2000 should be
taken seriously. When they occur, it’s a sign that
thunderstorms are in your area. Small storms however may
not generate multiple alerts. Such storms can pop up with no
warning, yet they are still capable of producing dangerous
cloud to ground lightning.
Lightning’s most common victims tend to be your electronic
equipment, especially your computer. Lightning most
frequently enters your computer through the phone line. It’s
for this reason that we recommend using a surge protector
with phone line protection. It is also a good idea to run any
coaxial cables (from cable TV or satellite dishes) through a
surge protector.
You should also avoid talking on a corded phone during
thunderstorms. Using a cellular or cordless phone (as long as
you’re indoors) is relatively safe.
Lightning routinely occurs several miles out in front of an
approaching storm. Whether you’re actively tracking a storm
or not, you should disconnect the phone or cable line from its
modem if threatening weather approaches. By taking a
minute to do these things, you could save yourself several
thousand dollars in damages.
7777
Page 8

L I G H T N I N G / 2 0 0 0
An approaching tornado calls for immediate action. Seek
shelter on the lowest floor or basement of the building you’re
in near the center of the building. Avoid windows at all costs.
Under no circumstances should you waste time by opening
windows! If you’re in a mobile home, you should seek shelter
outside by lying flat against the ground (or better yet, in a
ditch or culvert) away from trees and automobiles.
Aninoquisi cannot be held responsible for injury or death
resulting from use of this software contrary to this warning.
8888
Page 9

R E A L - T I M E L I G H T N I N G D E T E C T I O N
Chapter 1
Introduction
About Lightning/2000… • System
Requirements • Lightning/2000 Installation
•
Background Map Installation • Device
Driver Installation
About Lightning/2000…
Lightning/2000 is a software tool that can be used to replay
“canned” lightning archive files created by Lightning/2000, or
when used on a system that has the Boltek lightning detection
hardware and antenna, can detect and analyze real-time
lightning data.
Though every effort has been made, a certain percentage of
actual lightning strokes will be misidentified as noises. In
general, the precise location of any particular lightning flash as
plotted by Lightning/2000 cannot be guaranteed.
However with the advent of Lightning/2000 v4.6, the
ability to determine – in most cases – when an individual
lightning flash is relatively nearby became possible
When such flashes are detected, a special “storm” is depicted.
Rather than being a wedge shape, these special nearby storms
are circular or elliptical. When one of these storms is shown,
there is an excellent chance that lightning is imminent or is
occurring in the immediate area.
9999
.
Page 10

L I G H T N I N G / 2 0 0 0
In version 5.4 and later, the use of CID (Compact Intercloud
Discharge) strokes can identify many more nearby lightning
flashes with a high degree of accuracy and a false alarm rate of
nearly zero. Also, the option to require nearby flashes to
include CID strokes is now available (Options | Settings…
from the main menu). This option can reduce the false alarm
rate for identifying nearby flashes using the previously proven
technique (first included in version 4.6) to zero. However if
storms in your area typically do not produce CID strokes,
then this option should not be enabled.
System Requirements
• The Boltek lightning detector is required for
detection of lightning.
• A Pentium 1 GHz processor or faster is
recommended for lightning detection.
• At least 256 MB of memory is recommended
above and beyond the amount of memory
required by Windows.
• Windows XP, Windows Server, Windows Vista,
Windows 7 (32-bit and 64-bit versions) and
Windows 8 (32-bit and 64-bit versions) are
supported. (Only Windows XP is supported
when using the old ISA StormTracker card.)
• 10 Mb of hard-drive space is required for the
basic installation, though daily archive files will
eventually consume much more than this.
• A graphics card with at least 640x480 resolution
with at least 32K colors is strongly
recommended. Unexpected artifacts will occur if
10
10
1010
Page 11

R E A L - T I M E L I G H T N I N G D E T E C T I O N
using a graphics driver mode with only 16 or 256
colors. Aninoquisi is not responsible for
problems observed in such a case.
•
Do not attempt to run Lightning/2000 and
any other software that accesses the lightning
detection hardware at the same time.
11
1111
11
Page 12

L I G H T N I N G / 2 0 0 0
Lightning/2000 Installation
If you have a Lightning/2000 CD, just insert the CD into
your computer’s CD drive. The Lightning/2000 setup
program should start up automatically. If it does not, navigate
to the CD and run the installation program manually.
If you downloaded a ZIP file from the Aninoquisi website,
just double-click on the file and run the setup program that’s
in the ZIP folder.
You will be prompted for a password during the installation
process. That password will be in a text file on the CD, or
will have been sent to you via email.
12
1212
12
Page 13

R E A L - T I M E L I G H T N I N G D E T E C T I O N
Background Map Installation
The largest or most detailed background map should be
copied automatically from your Lightning/2000 installation
CD to the Lightning/2000 installation directory on your
computer. To install a different map, follow the procedure
below.
The procedure for installing a background map is very
straightforward. The .AMF format of the supplied map(s) is
proprietary to Aninoquisi. Maps in this format are available
only from Aninoquisi. If you move and need new
background maps, they can be produced for a small fee.
1. Start Lightning/2000 by choosing the lightning icon
on the Programs menu (available from the Start
button).
2. Choose Install map… from the File menu.
3. Choose the map you wish to install and click the OK
button. The map, if necessary, will be copied to the
Lightning/2000 installation directory on your hard
drive and installed as your default background map.
Device Driver Installation
If you are running Lightning/2000 under Windows XP and
using the Boltek StormTracker ISA card (no longer in production),
you will first need to install the included Windows XP device
driver.
13
13
1313
Page 14

L I G H T N I N G / 2 0 0 0
The installation of this driver is not required to use the Boltek
LD-250 portable lightning detector, nor is it required when
using the Boltek StormTracker PCI card.
If you are using the LD-350, the installation of the proper
driver should happen automatically when you plug the LD350 into a USB port and turn on the power to the unit. If this
does not happen, you may download the driver from the
Aninoquisi website’s Downloads page.
However if you are using the StormTracker PCI card, you will
first have to install its device driver. Lightning/2000 will not
be able to access the PCI card unless device driver is installed.
The installer for the PCI device driver can be found on the
Lightning/2000 installation CD, or it can be downloaded
from the Aninoquisi website’s Downloads page. The current
version of the PCI device driver has its own installer to make
its installation easy and quick.
Here is the procedure for installing the "genport" device
driver for the ISA card in Windows XP:
1. Double-click the "Add Hardware" applet in the Control
Panel.
2. Press the "Next>" button.
3. Let the wizard search for new hardware (it shouldn't
find any).
4. Click the "Yes, I have already connected the hardware
button"
5. Select "Add a new hardware device" (scroll to the
bottom of the list box) and click the "Next>" button.
6. Select "Install the hardware that I manually select from
a list (Advanced)" and click the "Next>" button.
7. Ensure that "Show All Devices" is selected and click
the "Next>" button.
14
14
1414
Page 15

R E A L - T I M E L I G H T N I N G D E T E C T I O N
8. After waiting for it to think a while, click the "Have
Disk..." button.
9. Click the "Browse..." button and navigate to the folder
where Lightning/2000 is installed (C:\Program
Files\Aninoquisi\Lightning2000 is the default folder).
10. Select the "genport" file.
11. Click the "OK" button.
12. Select the "Lightning/2000" driver and click "OK".
15
1515
15
Page 16

L I G H T N I N G / 2 0 0 0
16
1616
16
Page 17

R E A L - T I M E L I G H T N I N G D E T E C T I O N
Chapter 2
Basic Operation
Using the Built-in Help • How
Lightning/2000 Works • The Boltek
Hardware • CPU Usage • Running
Lightning/2000 • Customizing
Lightning/2000’s performance • Operating
modes • Customizing the Colors, Fonts, and
Alarms • Other Customizations
Using the Built-in Help
You can display help on almost any topic. Most dialog boxes
have a Help button.
You can double-click on many items on the screen (each
counter, for example) to display help on the item.
Pressing the F1 key while a menu selection is highlighted will
display help on that menu selection.
Most of the popup menus (accessed by right-clicking in a
window) have a Help… command that you can select to
display help on a window.
Select Help | Contents… from the main menu to display to
display the main help table of contents.
17
17
1717
Page 18

L I G H T N I N G / 2 0 0 0
How Lightning/2000 Works
Every lightning flash (whether it’s cloud-to-ground (CG) or
intercloud/intracloud (IC)) produces several electric pulses
(strokes) that are picked up by the antenna on your Boltek
system. Each of these strokes is analyzed to determine
whether it is lightning or not. The ones that aren’t lightning
are categorized as “noises”.
Note: only the LD-350, the StormTracker ISA or PCI
hardware allows you to discriminate between IC and CG
strokes. When using the LD-250, all strokes detected are of
the “unknown” type. This is because the LD-250 only passes
along very general information about each stroke, rather than
the detailed waveforms that are extracted from the other
hardware.
A noise can be either non-lightning electrical activity or
lightning that cannot be sufficiently analyzed. Some nonlightning electrical activity looks enough like lightning that it
slips through the analysis and is logged as a lightning stroke.
Particularly during times of heavy lightning activity, some
strokes are so garbled that they cannot be discriminated as
CG or IC. These are discarded as noises. Most of these
garbled strokes are IC strokes. It is entirely possible that the
number of noises will equal or exceed the number of strokes
during times of heavy activity. This is normal and is not a
problem with the system. With version 4 of Lightning/2000,
a substantial percentage of these formerly discarded IC
strokes can be recovered. Because of their borderline nature,
they are not plotted unless you have selected the “Plot
recovered noises” option from the Options menu or the
Control Panel.
The “good” strokes are saved for analysis. The results of this
analysis end up being displayed in the Analysis window, the
18
18
1818
Page 19

R E A L - T I M E L I G H T N I N G D E T E C T I O N
Threat Assessment window, and, optionally, the Real-time
Lightning window.
Each lightning stroke is displayed in two different ways as
soon as it is detected. The detector activity window shows
the strength of each incoming stroke. The Raw Lightning
Data window plots each stroke according to its strength and
direction. No distance information is displayed in the Raw
Lightning Data window.
The Raw Lightning Data window can be converted into the
Real-time Lightning window by choosing Raw Lightning
Data Properties | Real-time lightning from the window’s
popup menu, or by choosing Options | Real-time
lightning from the main menu, or by checking the “Realtime” checkbox on the Control Panel. The Real-time
Lightning window attempts to plot individual lightning flashes
in a geographic position, superimposed on a background map.
The positions of flashes in the Real-time Lightning window
are derived from the information developed by and displayed
in the Analysis window. Every minute, the flashes that have
been detected over the last few minutes are analyzed as a
group to come up with storm data that is displayed in the
Analysis window.
By giving the user a variety of ways to look at lightning data,
we’ve tried to “cover all the bases.” The thinking is that even
though any single component of the Lightning/2000 display
may not be sufficient to come up with a decent analysis of
what’s going on, all of the information taken together lets the
user construct a good picture.
The general status line at the bottom of the main window is
our attempt to perform a meta-analysis on all of the
information and come up with a “best guess” at how alert you
ought to be. When the general status line turns red, you need
to consult any sources of weather information available to
find out exactly what’s happening.
19
19
1919
Page 20

L I G H T N I N G / 2 0 0 0
And with the custom summary, you can construct your own
criteria for what constitutes an alert and change the general
status alert level independently.
Because of the inexact nature of the analysis process, it is not
uncommon for a general status alert to be displayed when a
storm is still some distance away. The alternative would have
been to not display an alert when a storm was potentially
nearby. In general, more false alarms will occur than missed
alerts. Missed alerts are less common.
With the advent of Lightning/2000 v4.6, the ability to
determine – in many cases – when an individual
lightning flash is relatively nearby became possible
When such flashes are detected, a special “storm” is depicted.
Rather than being a wedge shape, these special nearby storms
are circular or elliptical. When one of these storms is shown,
there is an excellent chance that lightning is imminent or is
occurring in the immediate area.
Please do not contact Aninoquisi when a false alarm occurs.
This is a normal part of the operation of Lightning/2000. We
are constantly striving to reduce the incidence of false alarms.
.
Check our website regularly for updates of Lightning/2000
components.
The Boltek Hardware
For Lightning/2000 to be able to detect and display live
lightning data, one of the Boltek lightning detection hardware
systems must be connected to the computer.
There are currently four hardware choices: the StormTracker
PCI card or StormTracker ISA card (no longer in
production), both of which install inside your computer, the
LD-250, which connects to your computer via the serial port
20
20
2020
Page 21

R E A L - T I M E L I G H T N I N G D E T E C T I O N
(or to a USB port with the included adaptor), and the LD-350,
which connects to a USB port.
With the StormTracker card or the LD-350, Lightning/2000
has access to the raw waveform description of each lightning
stroke. Analysis performed on these waveforms enables
Lightning/2000 to determine what kind of lightning (CG or
IC) is occurring.
The LD-250 performs its own analysis on each lightning
stroke. It does not determine what kind of lightning stroke
has occurred. Therefore when using the LD-250, all lightning
strokes will be displayed using the colors and symbols defined
for the “unknown” stroke type.
Do not attempt to run Lightning/2000 and any other
software that accesses the Boltek hardware at the same
time.
CPU Usage
When there is little or no lightning activity, Lightning/2000’s
usage of your computer’s CPU is minimized. However, when
there is significant lightning activity, the lightning detection
hardware is checked continuously so that no lightning activity
will be missed.
You may, if you desire, cause Lightning/2000 to check the
Boltek hardware continuously by setting the appropriate
option in the Settings Dialog (Options | Settings… from
the main menu).
It is normal during times of significant lightning activity for
Lightning/2000 to attempt to use as much of the computer’s
processor as possible. Though other tasks may be performed
by the computer at these times, they will proceed more slowly
than if there was little or no lightning activity.
21
21
2121
Page 22

L I G H T N I N G / 2 0 0 0
Running Lightning/2000
After a successful installation, click the “Start” button, click
“Programs”. The Lightning/2000 icon will be at or near the
end of the “Programs” menu. Click this icon to start
Lightning/2000.
Important: if you are running Lightning/2000 under Windows
2000 or Windows XP, and using the Boltek ISA StormTracker, you
will first need to install the device driver. Instructions for this procedure
are in Chapter 1.
When running Lightning/2000 on Windows 7 or Windows 8
systems, it is possible that you will need administrator
privileges to run the program. You can cause any program to
run with administrator privileges by right-clicking on the
program’s executable and then clicking on the
“Compatibility” tab and then checking the “Run this program
as an administrator” box. The Lightning/2000 executable is
named “lightning.exe”. It is normally located in the folder
“C:\Program Files (x86)\Aninoquisi\Lightning2000.
The first thing you need to do is to install your background
map that was supplied when you purchased Lightning/2000.
When installing Lightning/2000 from a CD, the largest map
file on the CD will automatically be installed. If you wish to
install a different map, choose File | Install map… from the
main menu and then pick your map file. If your
Lightning/2000 purchase was via a download of the installer
and a ZIP file that contains your map, you will have to extract
the map file from the ZIP before you can install the map.
The first time Lightning/2000 runs, it will read settings from
the default preferences files. The windows will then be
arranged so that each window is visible (except for the
Summary , NOWCast, Records, Analysis, and Storm Statistics
windows), and no window spills outside the frame of the
main window.
22
22
2222
Page 23

R E A L - T I M E L I G H T N I N G D E T E C T I O N
The next thing you need to do is to open the Hardware
Settings Dialog (Options | Hardware…) and enable the
lightning detection hardware. See Chapter 8 for details on
this dialog box.
You will probably want to customize the appearance of the
Lightning/2000 display to suit your needs. Basically, rightclicking the mouse on any visible element causes a popup
menu to appear. These popup menus contain various options
that can be changed.
Customizing Lightning/2000’s
Performance
There are a few system parameters that may be dependent on
your particular installation. The placement of your antenna
and your location partly determine how your system will
perform. Since we can’t allow for the peculiarities of your
installation, there are some parameters that can be changed
that will affect how Lightning/2000 analyzes data.
The Hardware selection in the Options menu controls the
squelch. The higher the squelch is turned up, the fewer weak
strokes will be detected and processed by Lightning/2000.
Turning up the squelch will not only affect the energy ratio,
but could affect how storms are ranged. Storms may be
ranged too closely if the squelch is turned up too high. You
should generally leave the squelch at 0 or 1 to get the most
accurate analysis of the data, though a squelch setting of 4 or
5 with the LD-350 will provide an equivalent level of noise
rejection. Though setting the squelch to a higher level will
prevent many noises from being detected, those noises aren’t
included in the data analysis no matter what squelch setting
you choose.
23
23
2323
Page 24

L I G H T N I N G / 2 0 0 0
When used in conjunction with the Range Scaling dialog, the
squelch can be used to adjust how storms are ranged.
The Range Scaling dialog can be used to affect how the range
to storms is determined. You can use this dialog to multiply
the range to a storm by a constant factor that depends on the
original range of the storm. See chapter 8 for details on the
Range Scaling dialog.
Operating modes
The user interface of Lightning/2000 can be viewed in one of
several modes: simple mode, stroke mode, flash mode, and
advanced mode. Flash mode and stroke mode implement the
“classic” look of the user interface. However you are free to
arrange the windows and counters in whatever fashion you
wish in any mode.
The “mode” is basically a pre-defined look to the user
interface. You may select one of the modes by choosing
Window | Arrange from the main menu.
Older versions of Lightning/2000 detected only strokes.
Each stroke represents a single detection from the lightning
detection hardware. But lightning actually occurs as flashes.
Each flash is what we think of when we see a bolt of
lightning. A flash consists of many strokes. The closer a
lightning flash is, the more strokes will be detected from it.
Nearby flashes have been observed to consist of greater than
100 strokes in extreme cases.
As each lightning stroke is processed, it is checked to see if it
belongs to any of the current lightning flashes. Once no more
strokes are seen as belonging to a flash, the flash is released
into the system and is tallied.
24
24
2424
Page 25

R E A L - T I M E L I G H T N I N G D E T E C T I O N
In both the simple and advanced modes, flashes are displayed
in the Real-time Lightning window; however the Raw
Lightning Data window may be switched between the display
of strokes and flashes.
In one of the “classic” modes (choose Window | Arrange |
Classic from the main menu), either flashes or strokes may
be displayed. You may change whether flash or stroke
information is presented by choosing Options | Flash mode
from the main menu.
The picture on the left shows strokes in the Raw Lightning Data window;
the picture on the right shows flashes. Whereas it is difficult or impossible
to pick out where the actual storm is when viewing strokes, it becomes
easy to do so when looking at the flashes.
Customizing the Colors, Fonts,
and Alarms
In general, right-clicking on any object on the screen will pop
up a small menu containing the properties of the object that
can be changed.
There are 64 different alarms that can sound. By default, only
the most important of the alarms are enabled. All alarms are
changed from the appropriate object’s popup menu. For
example, to change the alarm settings for the stroke rate,
right-click on the stroke rate counter; to change the alarm
25
25
2525
Page 26

L I G H T N I N G / 2 0 0 0
settings for the IC percentage, right-click on the IC% counter,
and so forth.
The storm range alarms may only be changed from within the
Analysis window. The general status line alarms may be
changed by right-clicking on the status line.
Other Customizations
The contents of the Custom Summary Window and the
General Status Line may be customized by changing the
templates used. The custom summaries currently running
may be changed in the Custom Summary Manager. Choose
Options | Custom Summary Manager… from the main
menu to access the Custom Summary Manager.
By using one of the custom summary commands, the General
Status Line alert level and the background color of the
Custom Summary window may be changed.
Because the Status Line and the Custom Summary Window
are controlled by a template that is a simple text file, that
template file may be edited with any ordinary text editor (such
as Notepad).
By changing the #Write and #WriteLine commands
contained in the template files, you may change the text that is
written out in the Custom Summary Window and/or Status
Line from English to any language.
26
26
2626
Page 27

R E A L - T I M E L I G H T N I N G D E T E C T I O N
Chapter 3
The Background
About the Background Map • Status Bar •
Popup Menus • Changing Map Object
Colors • Displaying/Hiding Map Layers •
Map Object Visibility • Editing the
Background Map • Naming Map Objects
About the Background Map
Map
The background map uses a “flat” projection. Each degree of
latitude spans the same distance on the screen as each degree
of longitude. This means that for locations further from the
equator, circles drawn on the map will appear increasingly
elliptical. Despite this, each storm or lightning flash plotted
on the map is in the precise position that is calculated for it.
Because of the limitations in the old maps (prior to version 6),
this was not always the case.
The map consists of several “layers”. Each layer is a single
type of map object (i.e. countries, states, grid lines, roads,
rivers, etc.). Any layer may be made visible or invisible by
right-clicking on the map and checking or unchecking the
layer on the “Layers” sub-menu.
27
27
2727
Page 28
L I G H T N I N G / 2 0 0 0
Status Bar
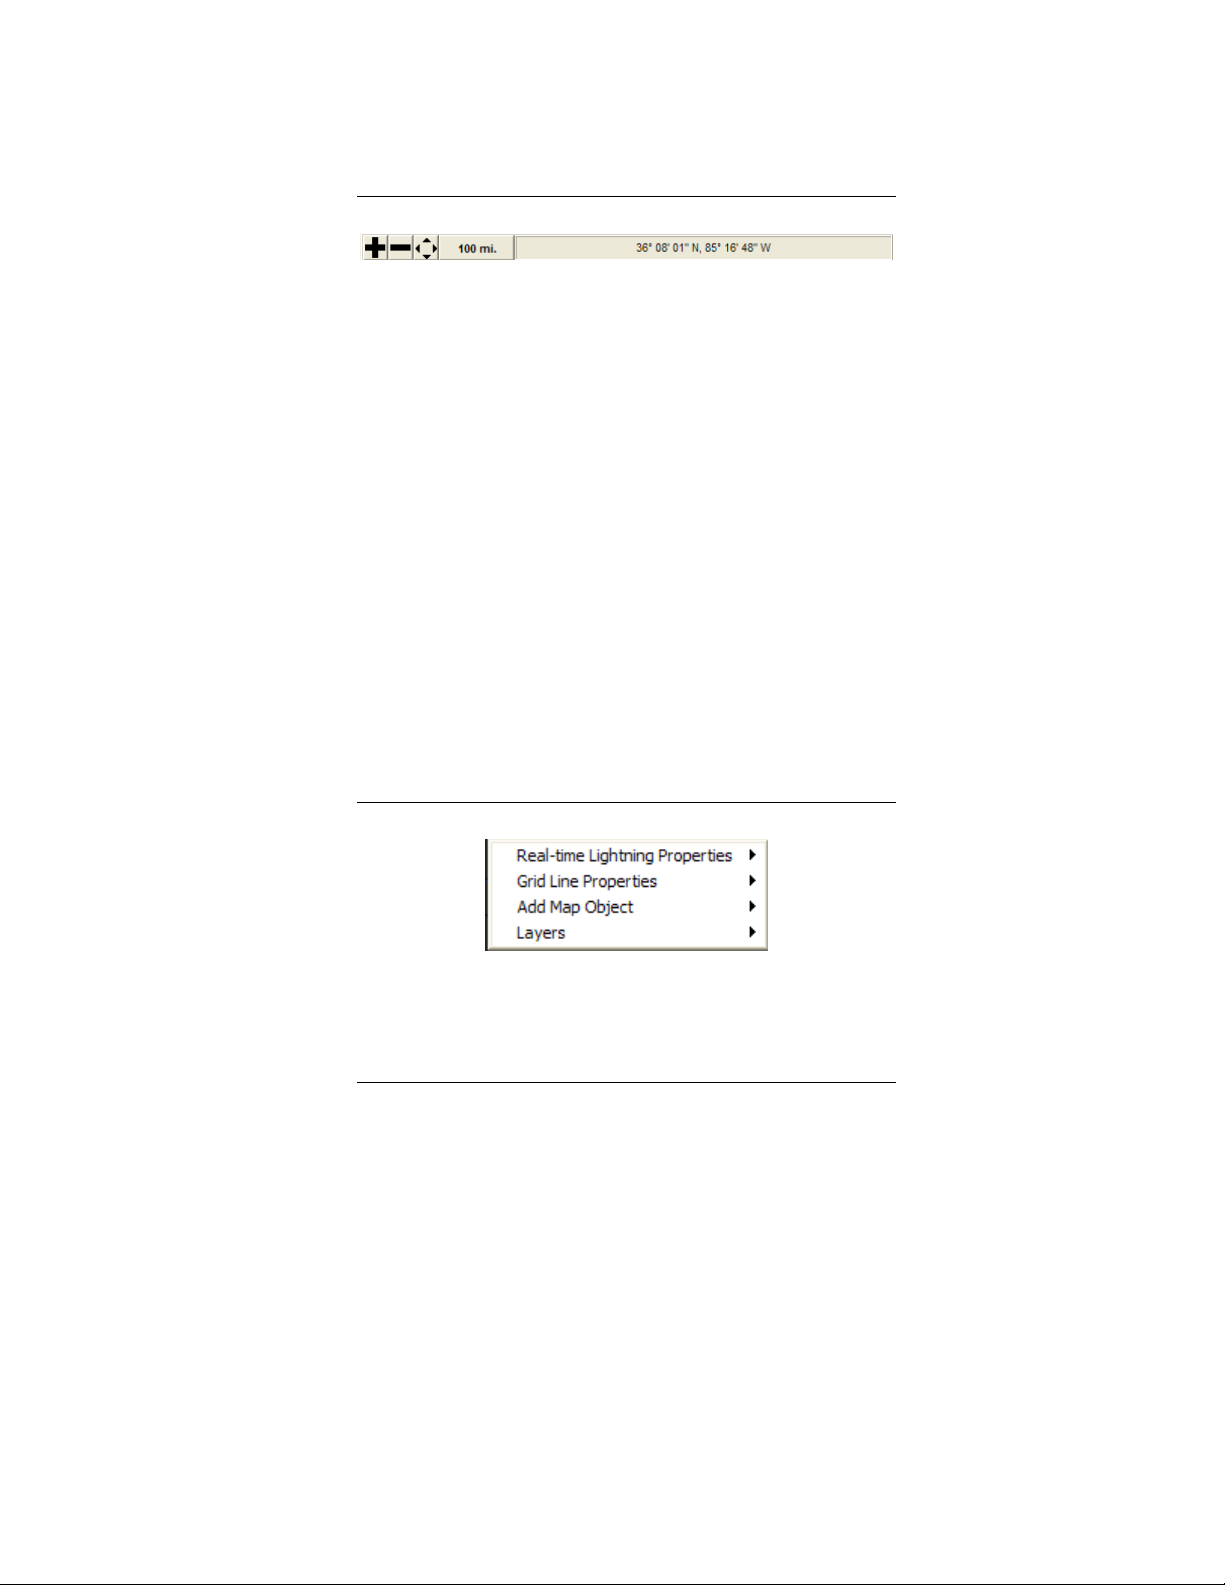
The status bar at the top of the map window allows you to
perform various operations on the map, and to see the exact
location of the mouse cursor on the map.
Use the “+” button to enter zoom mode. When in zoom
mode, click and drag a box around the area you wish to zoom
into.
Use the “-“ button to zoom out. You will zoom out to the
previous map view, or if there is no previous view, to a view
that encompasses two times the map area.
Use the pan button to pan the map view. Click and drag on
the map to pan the map.
The map radius button shows the current radius of the map
view in miles or kilometers (change the units in the Settings
dialog). Press this button to open the Align Map dialog,
where you can specify an exact value for the map’s radius.
Popup Menus
Right-click on the background map to display the map’s
popup menu. The popup menu contains four sub-menus: (1)
the sub-menu for the window you clicked in (Real-time
Lightning, Threat Assessment, or Analysis), (2) the sub-menu
28
28
2828
Page 29

R E A L - T I M E L I G H T N I N G D E T E C T I O N
for the particular map object that you clicked on, (3) the “Add
Map Object” sub-menu, and (4) the “Layers” sub-menu.
The window’s sub-menu allows you to change various
properties of the window itself, including the map’s center.
The map object’s sub-menu contains various properties of the
particular map object that you clicked on (such as color or
font). The “Add Map Object” sub-menu allows you to add a
variety of different objects to the map. The “Layers” submenu allows you to turn off or turn on any of the various
map layers.
Changing Map Object Colors
Changing the color of any object on the map is easy. Just right-click
on the particular object whose color you want to change. The
second sub-menu on the popup menu will contain all of the
properties of the object. For objects with an area, choose
“Color…” to change its color. For objects drawn with just a line
(like rivers), choose “Outline | Color…” from the menu.
Displaying/Hiding Map Layers
Right-click on the map. The fourth sub-menu in the popup
menu is the “Layers” menu. It contains a list of map layers
(in order from the first layer drawn to the last layer drawn).
Each displayed layer has a check mark next to it. Unchecking
a layer makes it invisible; checking a layer makes it visible.
29
29
2929
Page 30

L I G H T N I N G / 2 0 0 0
Map Object Visibility
Most elements of the map itself (cities, rivers, roads, etc.) are
only visible if you zoom in on the map. The zoom level at
which a particular map feature appears is related to the size of
the map feature. For map objects that occupy an area (like
cities), the larger in area the map object, the further zoomed
out you can be and still see the object. For map objects that
are lines (like rivers), the longer the map object, the further
zoomed out you can be. For map objects that are just a point
(like places), they are only visible if you are zoomed in to a
small area.
Cities and places may be made to appear no matter how
zoomed out your are. Right-click on the city or place and
check the “Always Visible” selection from the map object’s
“Properties” sub-menu.
Editing the Background Map
Adding New Map Features
Right-click on the background map and select the "Add Map
Object" sub-menu from the popup menu. You may add a
variety of objects to the map, including places, roads, and
freshwater features.
Select the map object you wish to add and then click on the
map where you would like the map object to go.
Editing Map Features
To edit the shape of a map feature, right-click on the map
feature and choose "Edit" from the map feature’s
30
30
3030
Page 31

R E A L - T I M E L I G H T N I N G D E T E C T I O N
“Properties” sub-menu. You will then see the nodes that
define the shape of the map feature. You may click and drag
a node to a new position. Double-clicking on a node adds a
new node to the feature.
Right-click on the feature and choose "Edit" again to quit
editing that object and return the object to its normal
appearance.
Naming a City or Place
To change the name of a city or place, right-click on the city
or place and choose "Name..." from the “Properties” submenu. To remove the name of a place, right-click on it,
choose “Name…” from the “Properties” sub-menu and
delete the current name and click the OK button.
Moving a Place's Name
To change where the name of a place is drawn, click on the
name and drag it to a new position.
Deleting Map Features
To delete a map feature, right-click on the map feature and
select "Delete..." from its Properties sub-menu. You will be
asked to confirm the deletion.
Saving Changes to the Map
If you have made changes to the background map, you may
choose "File | Save map..." from the main menu. If you
have changed the map and not saved the changes, you will be
asked if you want to save those changes when closing
Lightning/2000.
31
3131
31
Page 32

L I G H T N I N G / 2 0 0 0
Naming Map Objects
Attach a name to a map object by right-clicking on the map
object and choosing “Name…” from its sub-menu on the
popup menu.
Names of roads are somewhat different than names of other
map objects. You can enter just a number for the road name
and that number will be displayed inside a generic road
symbol.
You can enter a road number preceded by one of these
combinations of letters. Each one of these will cause a special
road symbol to be displayed:
A a generic “A” level road
AS an Autostrada
AUS an Australian federal highway
B a generic “B” level road
BAB a German autobahn (Bundesautobahn)
C a generic “C” level road
D a generic “D” level road
E a Euroroute
FA a France Autoroute
G a China federal highway
I a U.S. Interstate highway
M a Great Britain motorway
NH an India national highway
NZ a New Zealand state highway
S a U.S. state highway
US a U.S. federal highway
32
3232
32
Page 33

R E A L - T I M E L I G H T N I N G D E T E C T I O N
Chapter 4
The Windows
Raw Lightning Data • Real-time Lightning
•
Analysis • Threat Assessment • Stroke
Rate History • Rates • Totals • Storm
Statistics • Detector Status • NOWCast •
Summary • Records • The General Status
Line
33
3333
33
Page 34
L I G H T N I N G / 2 0 0 0
Raw Lightning Data
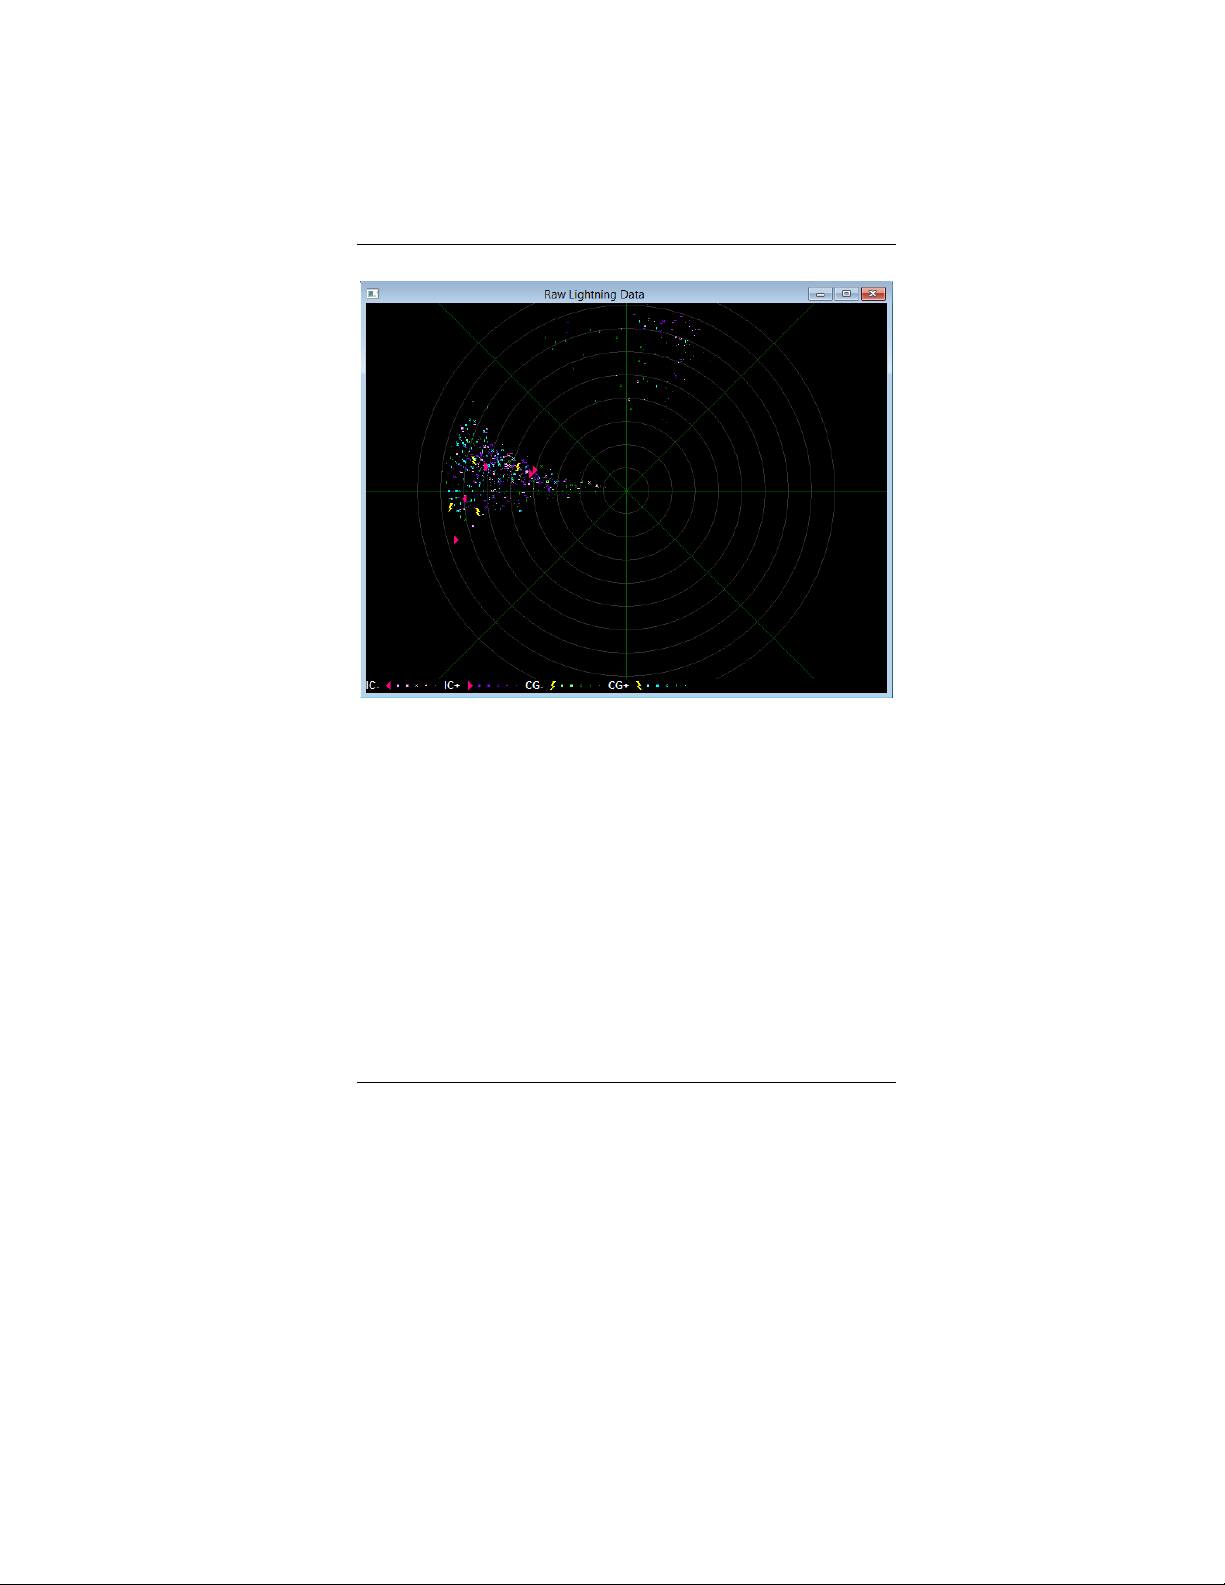
Closer storm to the west, with more distant storms to the north. Note the
“tail” of strokes pointing towards the center of the screen towards the west.
The Raw Lightning Data window contains exactly what the
name implies. Lightning strokes are grouped into one of 6
ages: oldest, older, old, new, newer, and newest. Each stroke
type in each of the 6 ages may be drawn in a different color
and shape. There are 8 types of strokes displayed: +CG
(positive cloud-to-ground), -CG (negative cloud-to-ground),
+IC (positive intercloud/intracloud), -IC (negative
intercloud/intracloud), +CID (positive compact intercloud
discharge), -CID (negative intercloud discharge), Leader, and
Unknown. CID strokes can be displayed only when strokes
are being displayed. Switch to stroke mode by right-clicking
in the window and choosing Raw Lightning Data
34
34
3434
Page 35

R E A L - T I M E L I G H T N I N G D E T E C T I O N
Properties | Settings | View | Strokes from the popup
menu.
For Boltek StormTracker or LD-350 users, the first 7 stroke
types will be displayed. For Boltek LD-250 users, only the
“Unknown” stroke type is used. The LD-250 performs its
own rudimentary analysis on each lightning stroke and only
passes along the amplitude of each stroke. The serial
connection used by the LD-250 does not support the data
rate necessary to pass along the raw stroke information that is
necessary to perform a sophisticated analysis.
Each of the 6 ages of strokes remains on the screen for an
amount of time (up to an hour) that you define. Change the
stroke shapes, colors, and persistences by right-clicking in the
window and choosing Raw Lightning Data Properties |
Strokes… to display the Stroke Types dialog.
The stroke types most likely to be indicative of nearby or
severe storms will be plotted last (i.e. on top). Here is the
order in which strokes are plotted (each stroke type will be
plotted on top of the stroke types later in the list):
• +IC
• -IC
• -CG
• +CG
• +CID
• -CID
• Leader
• Unknown
You can also convert the Raw Lightning Data window to the
Real-time Lightning window by choosing Real-time
lightning from the window’s popup menu. While more
aesthetically pleasing to most users since it displays lightning
35
35
3535
Page 36

L I G H T N I N G / 2 0 0 0
stroke on a background map, only the Raw Lightning Data
window allows you to see fine detail a storm’s structure, such
as the prevalence of CG versus IC strokes, and their relative
amplitudes.
The data in the Raw Lightning Data window has been
processed only enough to determine its strength and
direction. Stronger flashes (they aren’t necessarily nearer
flashes) are displayed closer to the center of the window.
Flashes to the north are displayed towards the top of the
window (but only if your antenna is aligned properly); flashes
to the south are displayed towards the bottom of the window,
and so on. (The alignment of the antenna may be changed in
the Hardware Settings dialog.)
In stroke mode, every stroke will be displayed the instant it is
detected. But in flash mode, only those flashes that are
determined to not be reflections will be displayed. (The
aggressiveness of the reflection determination may be
changed by choosing Options | Reflection rejection from
the main menu.) The selection of flash mode or stroke mode
is available only when using one of the “classic” window
arrangements. The display of flashes is the default when
using the “simple” or “advanced” window arrangements.
In advanced mode (choose Window | Arrange | Advanced
from the main menu), you may choose between the display of
flashes or raw strokes. To do this, right-click in the window
and choose Raw Lightning Data Properties | Settings |
View from the popup menu. You can choose between
viewing strokes and flashes in the Settings Dialog.
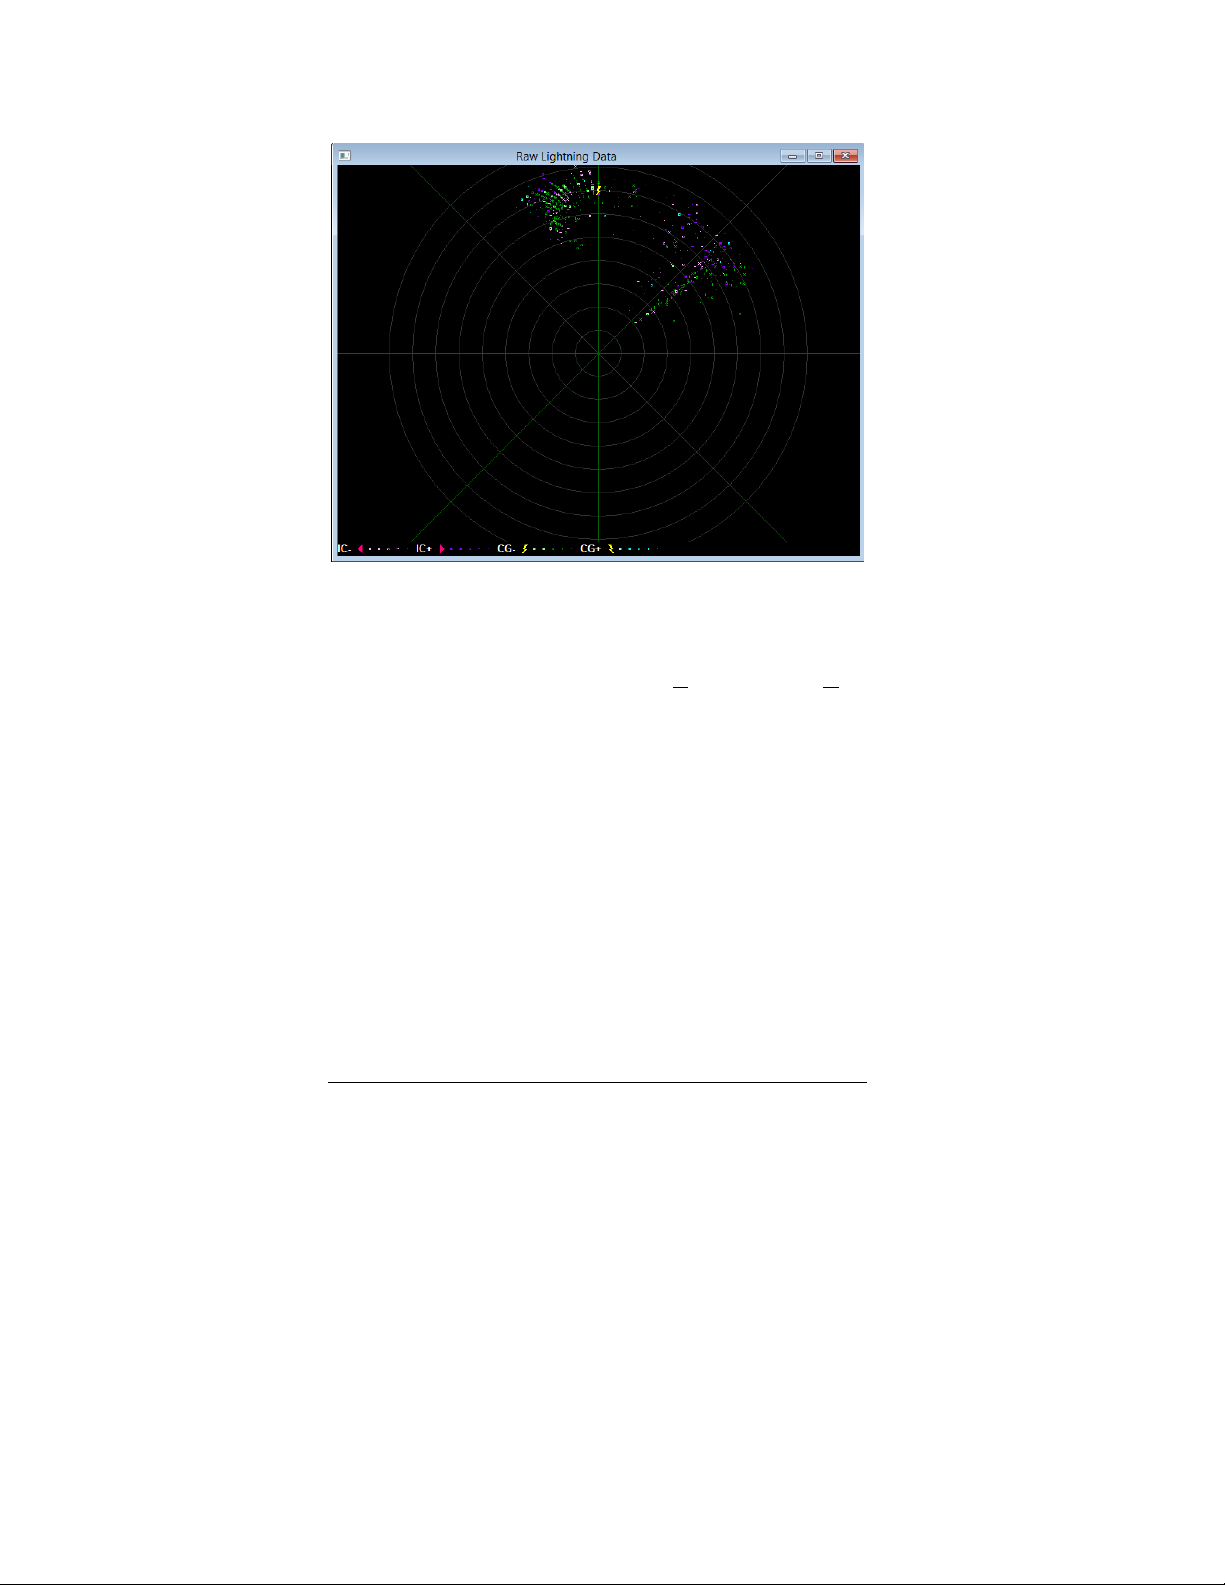
One of the hallmarks of a nearby storm as it appears in this
window is a “tail” of stronger strokes. Because stronger
strokes are plotted closer to the center of the window, these
“tails” will point towards the center of the screen.
More distant storms won’t exhibit this feature. They are
characterized by a cluster of strokes further from the center
of the screen.
36
36
3636
Page 37
R E A L - T I M E L I G H T N I N G D E T E C T I O N
A moderately distant storm to the north-northwest. There is no “tail” of
strokes towards the center of the screen. A somewhat more nearby storm
can be seen to the northeast.
The contents of the Raw Lightning Data window may be
copied to the clipboard by choosing Copy from the Edit
menu.
The click sound produced by new strokes may be changed by
right-clicking in the window and choosing Raw Lightning
Data Properties | Sound… from the window’s popup
menu. Some users have reported that the click sound stops
playing after Lightning/2000 has been running for a while,
particularly during times of heavy lightning activity. We have
researched this problem, and it appears to be due to
irregularities with sound card drivers and/or Windows’
implementation of the function used to play the click sound.
Clicking on a cluster of strokes or flashes in the Raw
Lightning Data window opens the Storm Statistics window,
which displays detailed data about a storm.
37
37
3737
Page 38
L I G H T N I N G / 2 0 0 0
Real-time Lightning
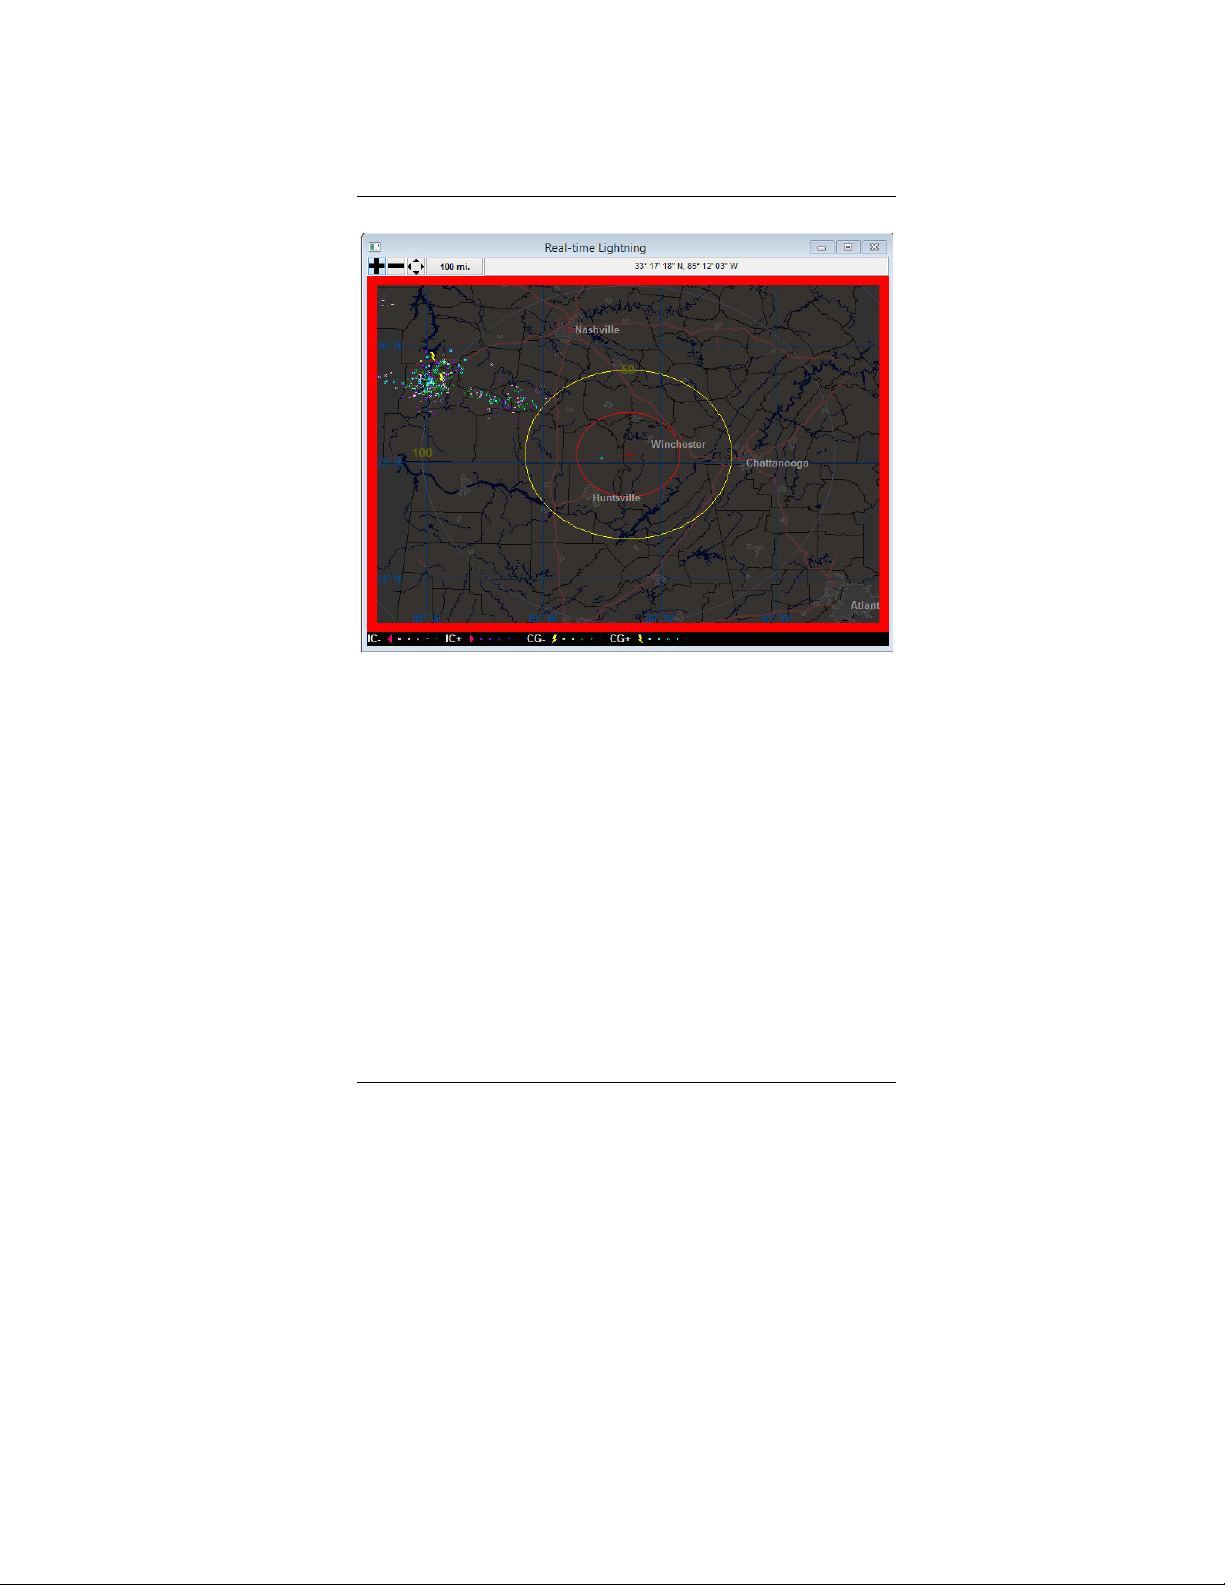
Real-time Lightning window showing a powerful, relatively nearby storm
with some close strokes.
The Real-time Lightning window is displayed by choosing
Raw Lightning Data Properties | Real-time lightning
from the Raw Lightning Data window’s popup menu (by
right-clicking in the window). Incoming lightning strokes are
analyzed using a variety of statistical techniques.
Those strokes that cannot be correlated with an actual storm
will not be displayed in the Real-time Lightning window. The
setting of the reflection rejection option can affect how many
strokes are drawn. See reflection rejection for more details.
The positions of the strokes in this window are based on the
position of storms in the Analysis window. Display storms in
the Real-time Lightning window by choosing Real-time
Lightning Properties | Settings | Show storms from the
38
38
3838
Page 39

R E A L - T I M E L I G H T N I N G D E T E C T I O N
window’s right-click menu. Click on one of the storms to
display detailed information about the storm in the Storm
Statistics window.
The border of the window will change color to indicate when
a yellow or red storm range alert is in effect. The Analysis
window is the central authority for determining when a storm
range alert is in effect.
With the advent of Lightning/2000 v4.6, the ability to
determine – in many cases – when an individual
lightning flash is relatively nearby became possible
When such flashes are detected, a special “storm” is depicted.
Rather than being a wedge shape, these special nearby storms
are circular or elliptical. When one of these storms is shown,
there is an excellent chance that lightning is imminent or is
occurring in the immediate area.
The popup menu also contains options for toggling the
display of the range rings and azimuth radials. The click
sound produced by new strokes may be changed by rightclicking in the window and choosing Real-time Lightning
Properties | Sound… from the window’s popup menu.
.
You can configure any element within the window (including
map features) by right-clicking on the element or map feature.
Because of the constantly changing nature of the strokes from
a particular storm, the Analysis window may indicate that a
storm is moving back and forth from one minute to the next.
The Real-time Lightning window attempts to smooth out
such momentary changes so that storms do not wander
around as much when the individual strokes are plotted there.
When first starting Lightning/2000, it takes as long as 30
seconds for strokes to be plotted in the Real-time Lightning
window. This is because a sufficient number of strokes must
be accumulated to perform a reliable analysis of the storms
that may be present. It is not possible to tell from a single
39
39
3939
Page 40

L I G H T N I N G / 2 0 0 0
stroke or flash how far away it is when using the Boltek
hardware.
Also, the very first stroke detected in a particular direction will
not be plotted. A single detection cannot be reliably placed
within a storm. Multiple strokes in a particular direction need
to occur before a “storm” is detected in that direction.
An image of the Real-time Lightning window can be captured
and saved to a file in any or all of three formats (PNG, BMP,
or JPG). See screen capture in the index to locate details
The Real-time Lightning window can be made to resize itself
(every 5 minutes) so that the majority of lightning activity is
displayed by choosing Real-time Lightning Properties |
Settings | Auto zoom from the right-click menu. The auto
zoom option is not available when using a BMP or JPG
background map.
40
4040
40
Page 41
R E A L - T I M E L I G H T N I N G D E T E C T I O N
Analysis
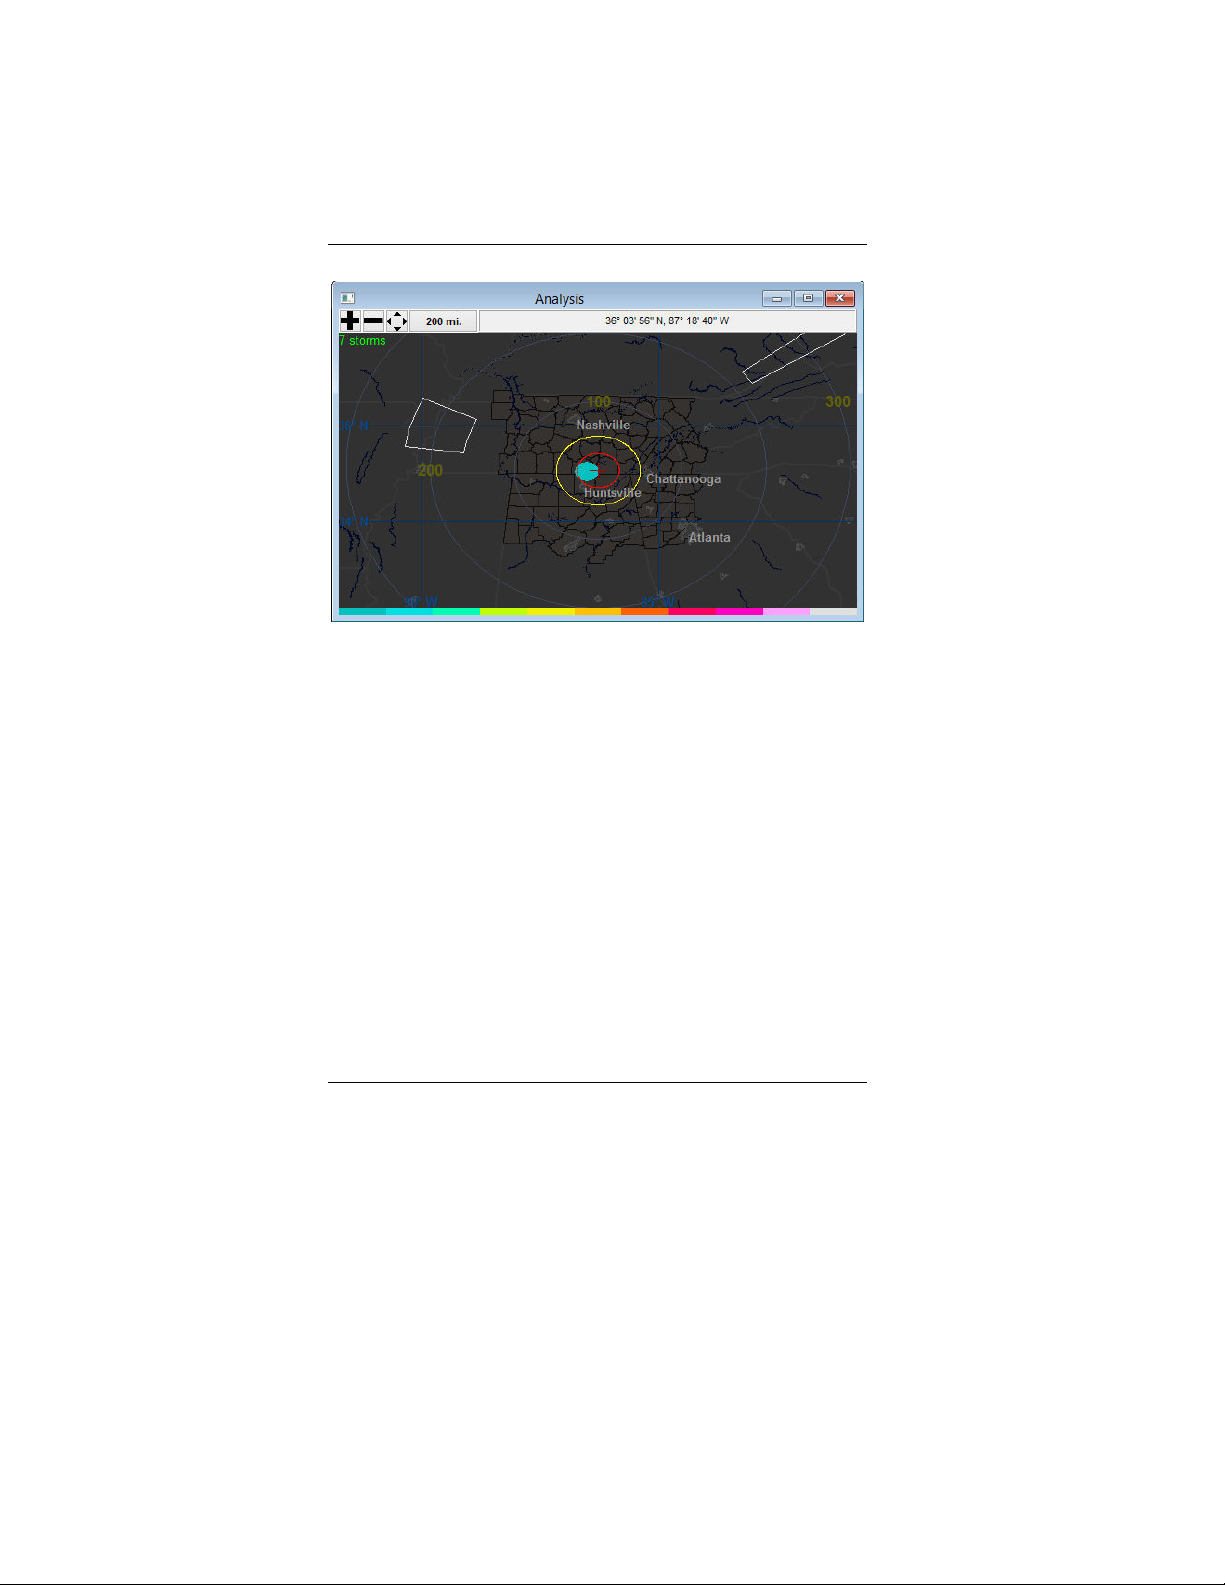
Analysis window showing a storm just to the west.
Lightning/2000 analyzes the incoming lightning strokes that
have occurred over the last 5-20 minutes. The results of this
analysis are displayed in the Analysis window. Denser areas in
the raw data window are identified as “storms”. A “storm”
doesn’t necessarily mean a single, well-defined storm however.
Storms are normally drawn as hollow wedge shapes, colorcoded by intensity. Storms with a preponderance of positive
cloud-to-ground strokes are shown as solid wedges. That’s
because such storms are more likely to exhibit severe
characteristics than other storms. Such storms can only be
discerned when using the StormTracker or LD-350 hardware.
When using the LD-250, storms undergoing rapid
intensification are shown as solid wedges, and storms that
have recently seen a marked decrease in their stroke rates are
also colored in, but in a darker version of their outline color.
41
41
4141
Page 42

L I G H T N I N G / 2 0 0 0
Individual thunderstorms may occupy a large area, but
frequently the area of the storm that is producing the bulk of
the lightning is quite small. A single storm may have a
number of lightning producing areas. Heavy lightning
production doesn’t always correlate with the severity of the
storm, and a low level of lightning doesn’t always mean a
storm should not be monitored.
Lightning/2000 is one more tool in your arsenal of tools that
can be used to gauge the severity of approaching storms.
Using it as your only source of weather data is not advisable
however.
At the current time it isn’t possible for Lightning/2000 (or
any other single-antenna lightning detection system) to detect
a storm that’s “hidden” behind a nearer storm if they are both
in the same direction. This is perhaps the most common
reason for inaccurate ranging of storms. If two storms lie
along the same line of azimuth, the result in the analysis
window will be a single storm that lies midway between the
two.
We use the gross features of lightning strokes to determine
their range. The analysis performed is similar to statistical
techniques used in predicting election results. Just as it’s ill
advised to make an election prediction based on polling a
small number of voters, the ranging on small storms is only
an approximation. However storms that get ranged closely are
likely to be close no matter how many strokes they contain.
The “squatness” of the storm (the distance between the inner
and outer edges of its range box) is an indicator of how
confident Lightning/2000 is in the ranging. Big storms will
have a more squat appearance than small storms. More
strokes means more confidence in the ranging. Think of the
length of the range box as “error bars” on the range.
This having been said, there’s still the possibility of a bad
ranging taking place. The ranging algorithm isn’t foolproof,
42
42
4242
Page 43

R E A L - T I M E L I G H T N I N G D E T E C T I O N
but it seems to perform better than anything we’ve seen
before.
The number of CID strokes per minute is an excellent
indicator of a close storm. A distant storm will never be seen
to produce a large number of CID strokes.
The energy ratio counter is also a good indicator of whether
or not a storm is nearby. Frequent red alerts on this counter
is a sign that you should check a radar at your earliest
opportunity.
With the advent of Lightning/2000 v4.6, the ability to
determine – in many cases – when an individual
lightning flash is relatively nearby became possible
When such flashes are detected, a special “storm” is depicted.
Rather than being a wedge shape, these special nearby storms
are circular or elliptical. When one of these storms is shown,
there is an excellent chance that lightning is imminent or is
occurring in the immediate area.
You can configure any element (including map features) of
the analysis window by right-clicking on the element. The
analysis window is updated once per minute during real-time
lightning detection, and once per simulated minute while
playing back an archive (however it won’t be updated more
than once per second no matter what speed an archive is
played back at).
.
Clicking on a storm’s range box will display the Storm
Statistics window. See Storm Statistics window for more
details.
The settings of the red and yellow alert range rings (as well as
other properties pertaining to the analysis window) can be
changed by right-clicking in the Analysis window.
The storm range alarms are triggered by the information in
this window. When a storm range alarm is triggered, a
colored border will be drawn around the Analysis window, the
43
43
4343
Page 44
L I G H T N I N G / 2 0 0 0
Threat Assessment window, and the Real-time Lightning
window (if the analysis is shown there).
The Analysis window can be made to resize itself (every 5
minutes) so that the majority of lightning activity is displayed
by choosing Analysis Properties | Settings | Auto zoom
from the right-click menu
The contents of the Analysis window may be copied to the
clipboard by choosing Copy from the Edit menu.
Threat Assessment
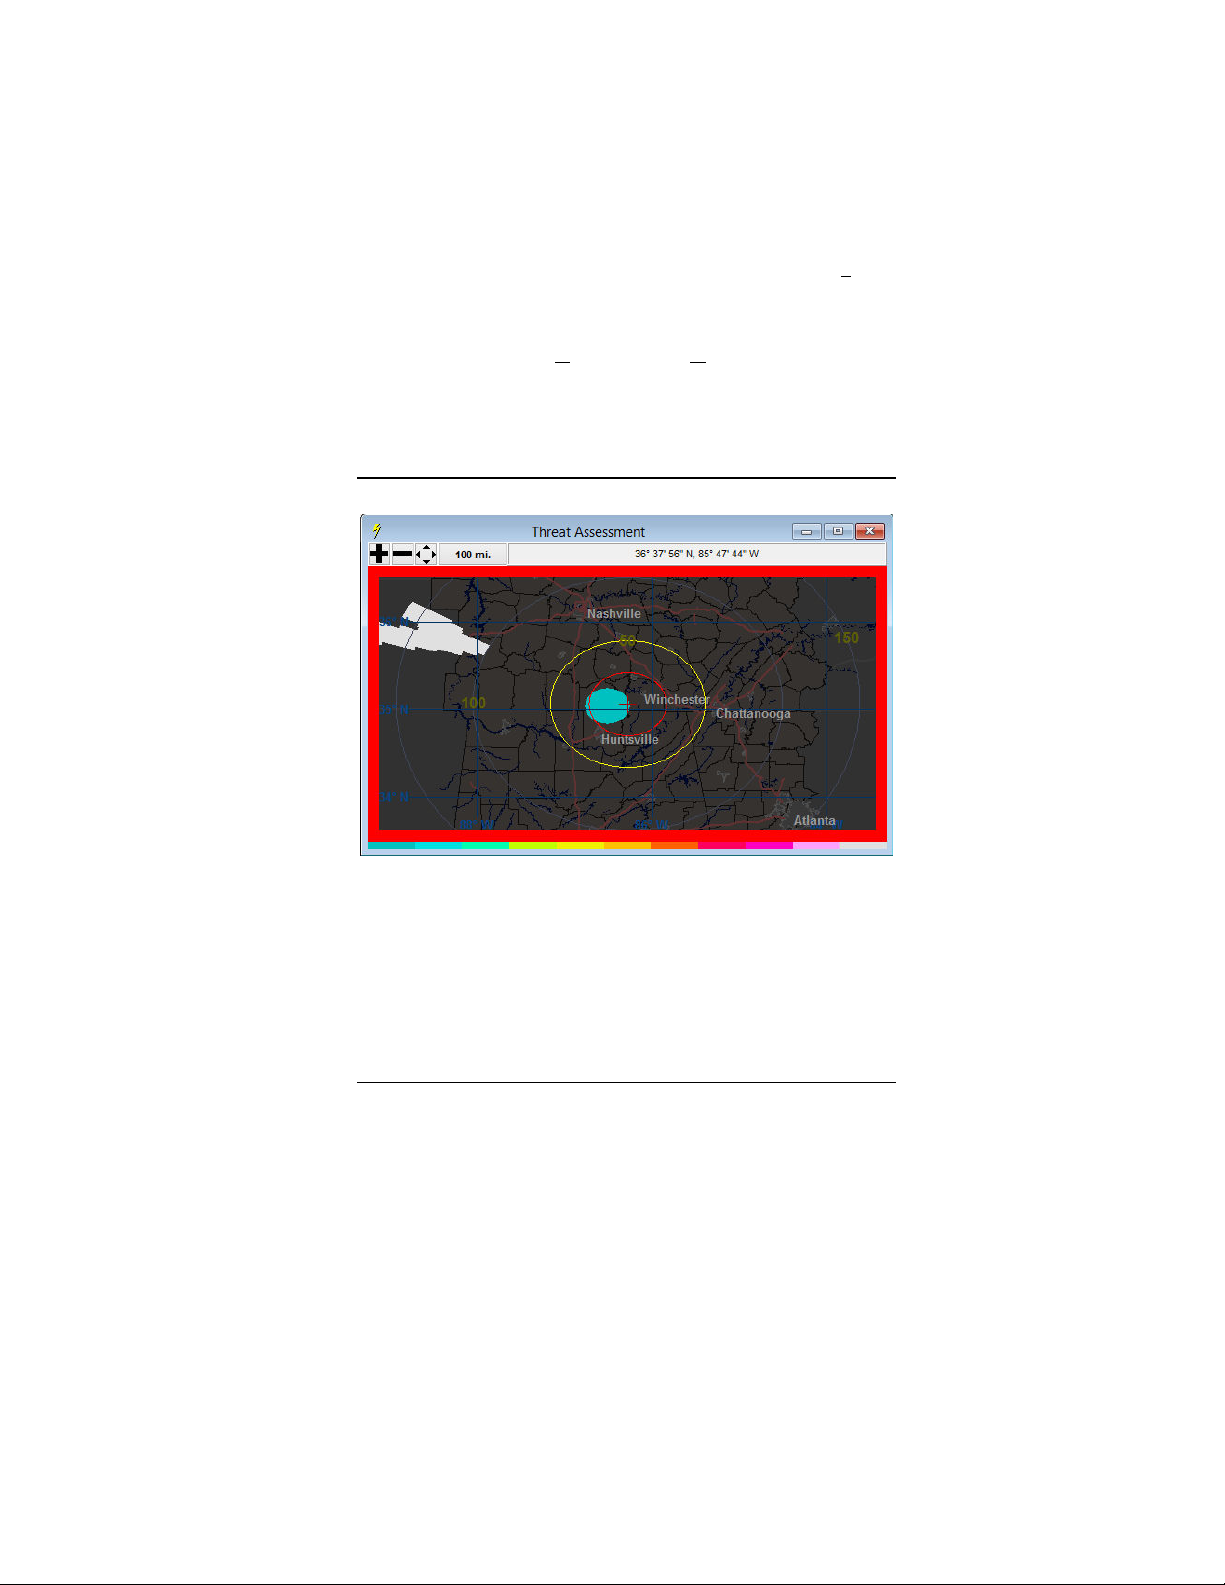
A severe storm off to the northwest, with a local, non-severe storm just to
the west.
The Threat Assessment window is a depiction of storm
activity over the last 5-20 minutes. The information in this
window is based on the average position of all lightning
flashes detected in the last 5-20 minutes.
When the stroke rate is at least 500 per minute, only the last 5
minutes worth of flashes are used. If the stroke rate is at least
44
44
4444
Page 45

R E A L - T I M E L I G H T N I N G D E T E C T I O N
100 per minute, the last 10 minutes worth of flashes are used.
If the stroke rate is at least 50 per minute, the last 15 minutes
of flashes are used. Stroke rates below 50 per minute cause
the previous 20 minutes of flash data to be used.
The average range of all strokes in a similar direction is used
to calculate the placement of the colored areas in the Threat
Assessment window. Through this averaging technique, a
more realistic appraisal of storm activity can be determined.
With the advent of Lightning/2000 v4.6, the ability to
determine – in many cases – when an individual
lightning flash is relatively nearby became possible
When such flashes are detected, a special “storm” is depicted.
Rather than being a wedge shape, these special nearby storms
are circular or elliptical. When one of these storms is shown,
there is an excellent chance that lightning is imminent or is
occurring in the immediate area.
The Threat Assessment window employs reflection rejection
(Options | Settings… from the main menu), if you have
that option turned on.
.
You may click on a storm in this window and display more
detailed statistics about the storm.
The border of the window will change color to indicate when
a yellow or red storm range alert is in effect. The Analysis
window determines when a storm range alert is in effect.
The Threat Assessment window can be made to resize itself
(every 5 minutes) so that the majority of lightning activity is
displayed by choosing Threat Assessment Properties |
Settings | Auto zoom from the right-click menu. The auto
zoom option is not available when using a BMP or JPG
background map.
The contents of the Threat Assessment window may be
copied to the clipboard by choosing Copy from the Edit
menu.
45
45
4545
Page 46
L I G H T N I N G / 2 0 0 0
Stroke Rate Graph
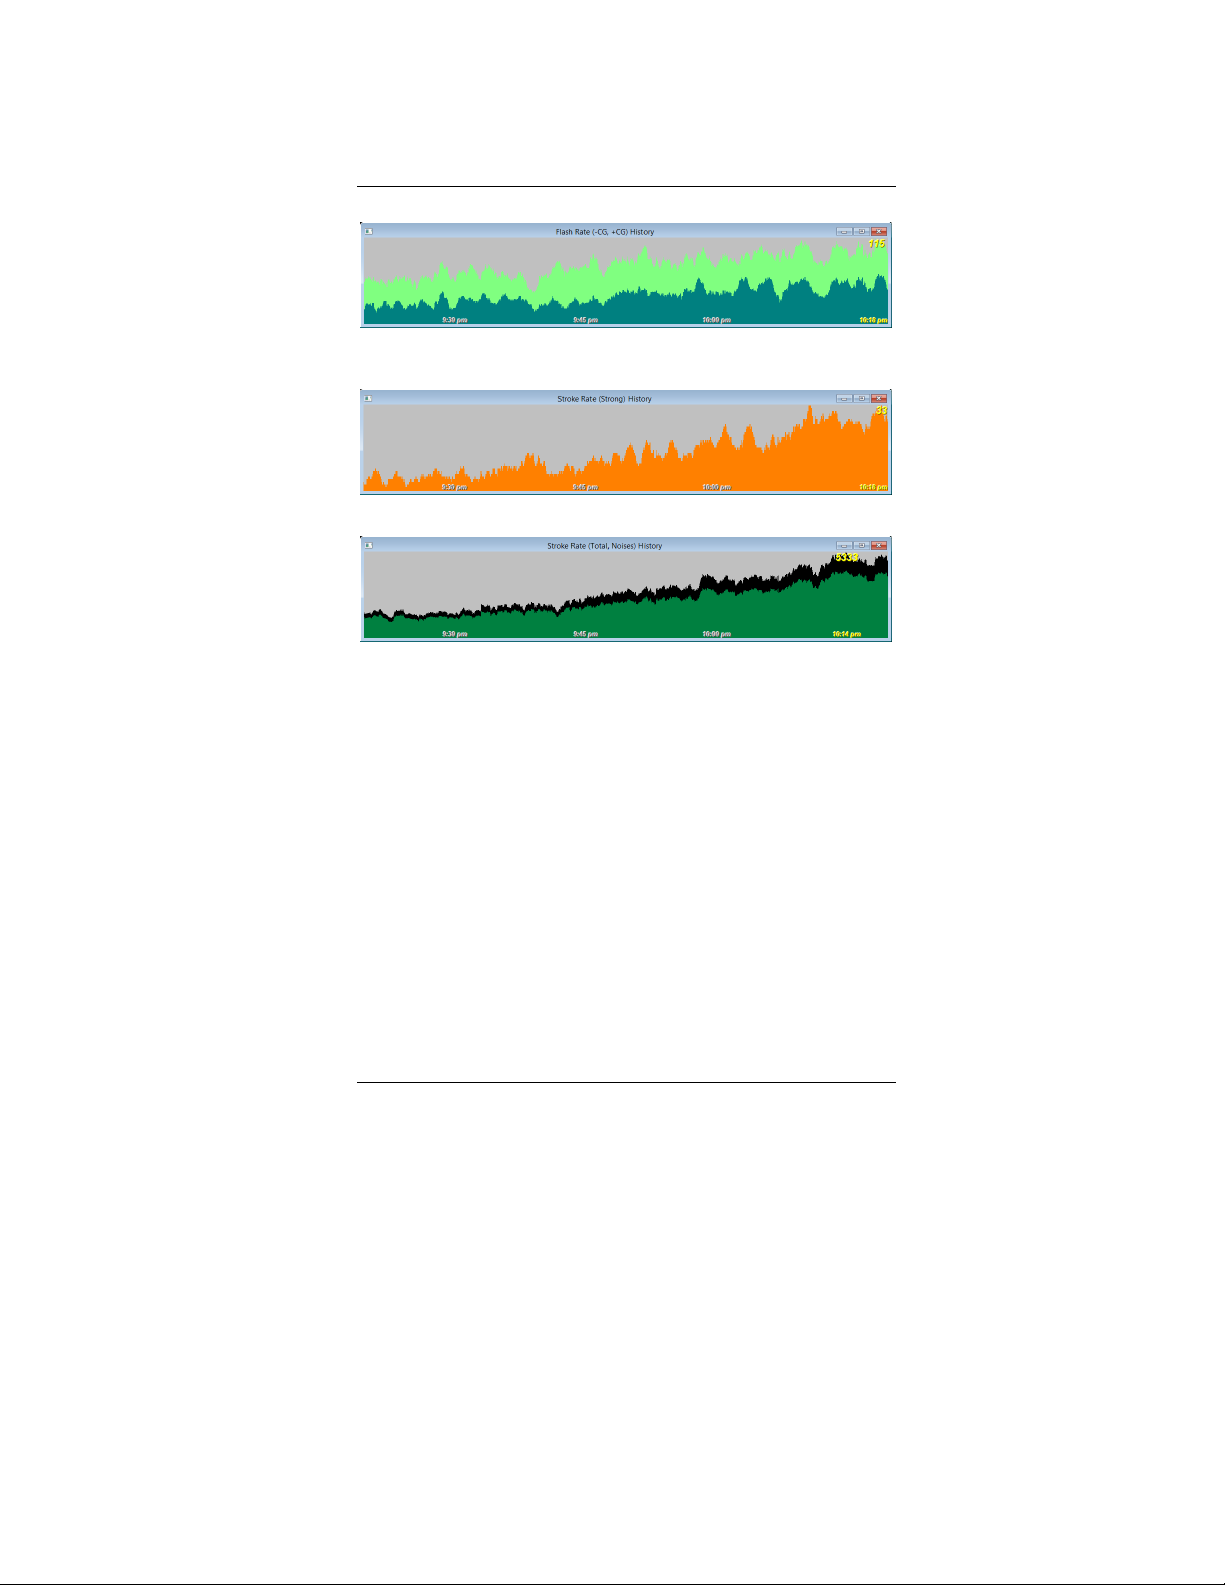
The dramatically increasing CG flash rate is indicative of a severe storm.
This graph shows the flash rates.
The rate of nearby flashes increases as the storm approaches.
The total stroke rate plus the noise rate.
The stroke rate graph shows you at a glance the rate of change
of lightning activity. You can change the length of time that
the graph comprises from 15 minutes to 24 hours by rightclicking on the graph.
The peak activity (within the length of the graph) is indicated
with a text label. Several other text labels indicate the time at
various points over the period covered by the graph. The
font used to draw the labels can be changed by right-clicking
on the label.
Version 6 of Lightning/2000 allows you to show a variety of
rate information on the graph. Flash rates, strokes rates, and
other information may be shown. You may select the
information you want to appear on the graph by choosing
Stroke types and colors… from the graph’s right-click
menu.
46
46
4646
Page 47
R E A L - T I M E L I G H T N I N G D E T E C T I O N
The graph is automatically rescaled so that the peak level
occupies the entire height of the graph. The graph update
interval is dependent on the width of the graph window and
the length of the graph.
During times of no lightning activity, occasional electrical
discharges may be detected. During these periods, the graph
will take on a “picket fence” appearance, with each picket
representing a single stroke or flash. This is normal and is not
indicative of a problem.
The Stroke Rate History window is very useful for spotting
trends in storm activity. A sudden increase in the flash rate
can be clearly seen. Also, a sudden surge in the fraction of
+CG strokes or –IC strokes becomes obvious, and can be an
indicator of a severe storm.
An image of the Stroke Rate History can be saved to a file at a
specified interval. See the Screen Captures dialog for details.
The contents of the graph window may be copied to the
clipboard for use in other applications by choosing the Copy
command from the Edit menu.
Rates
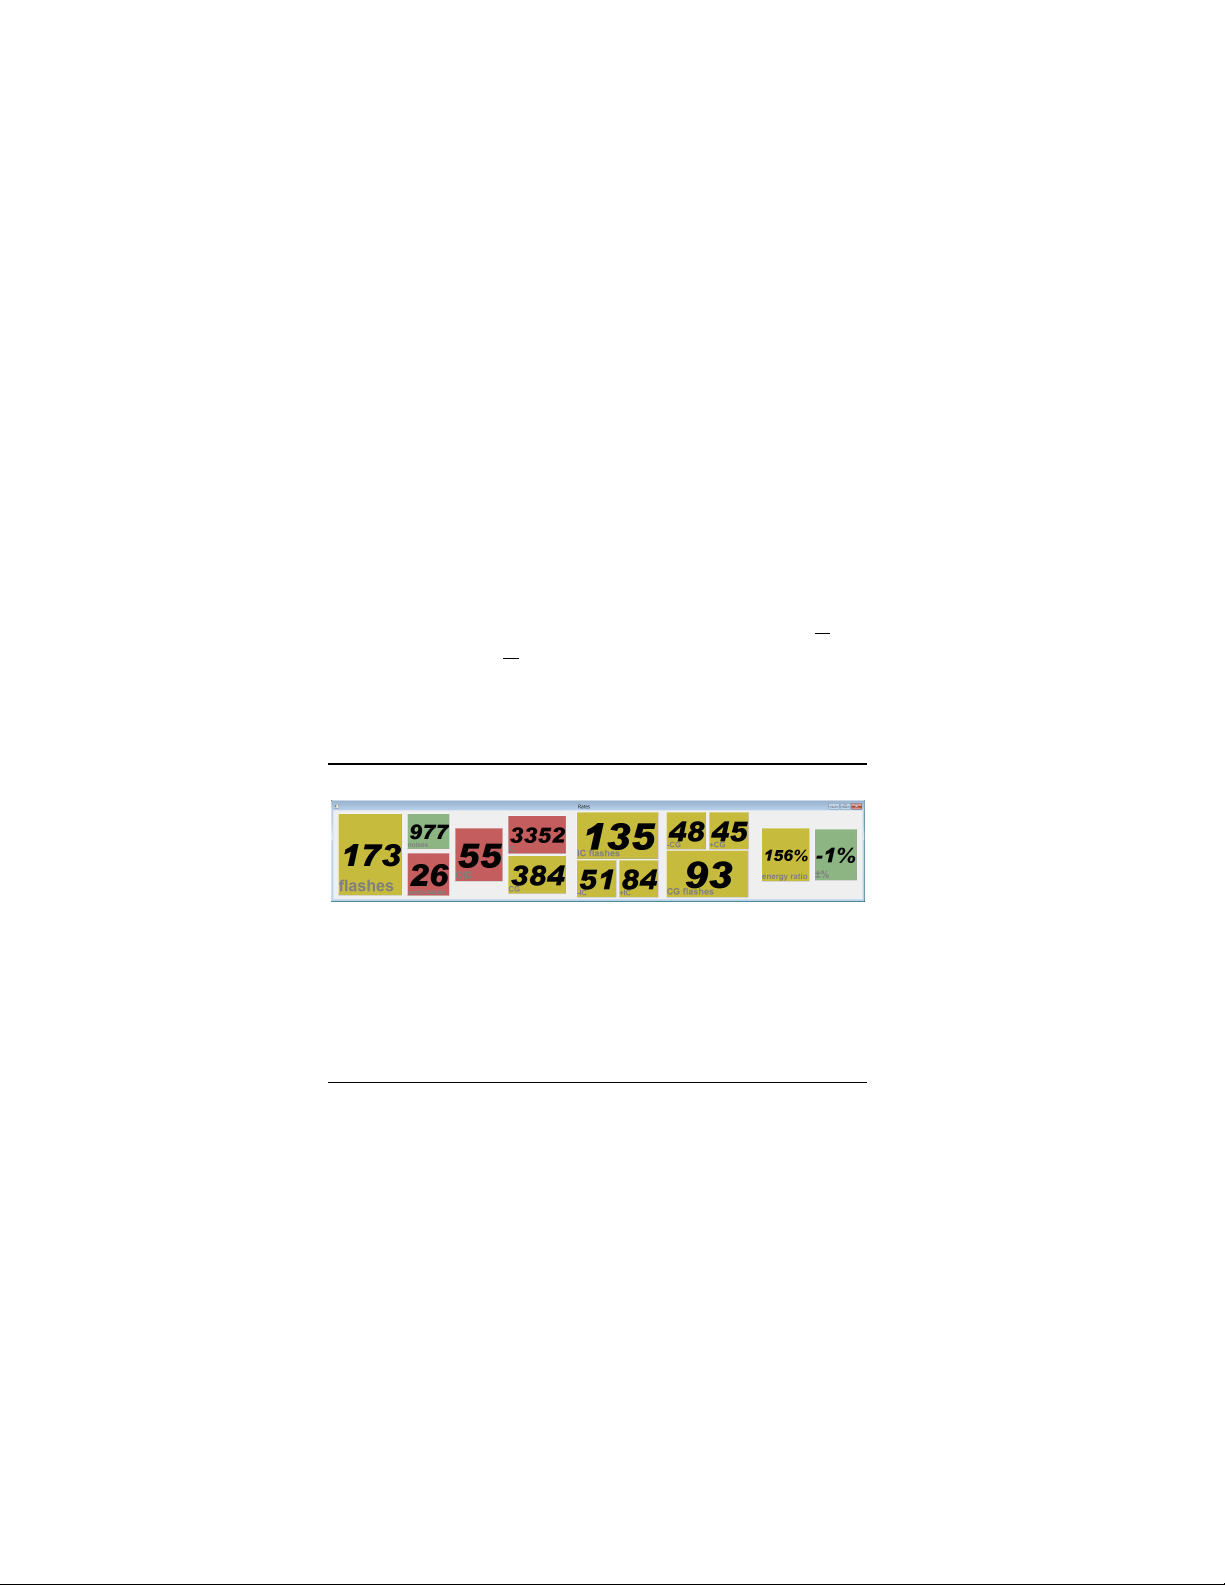
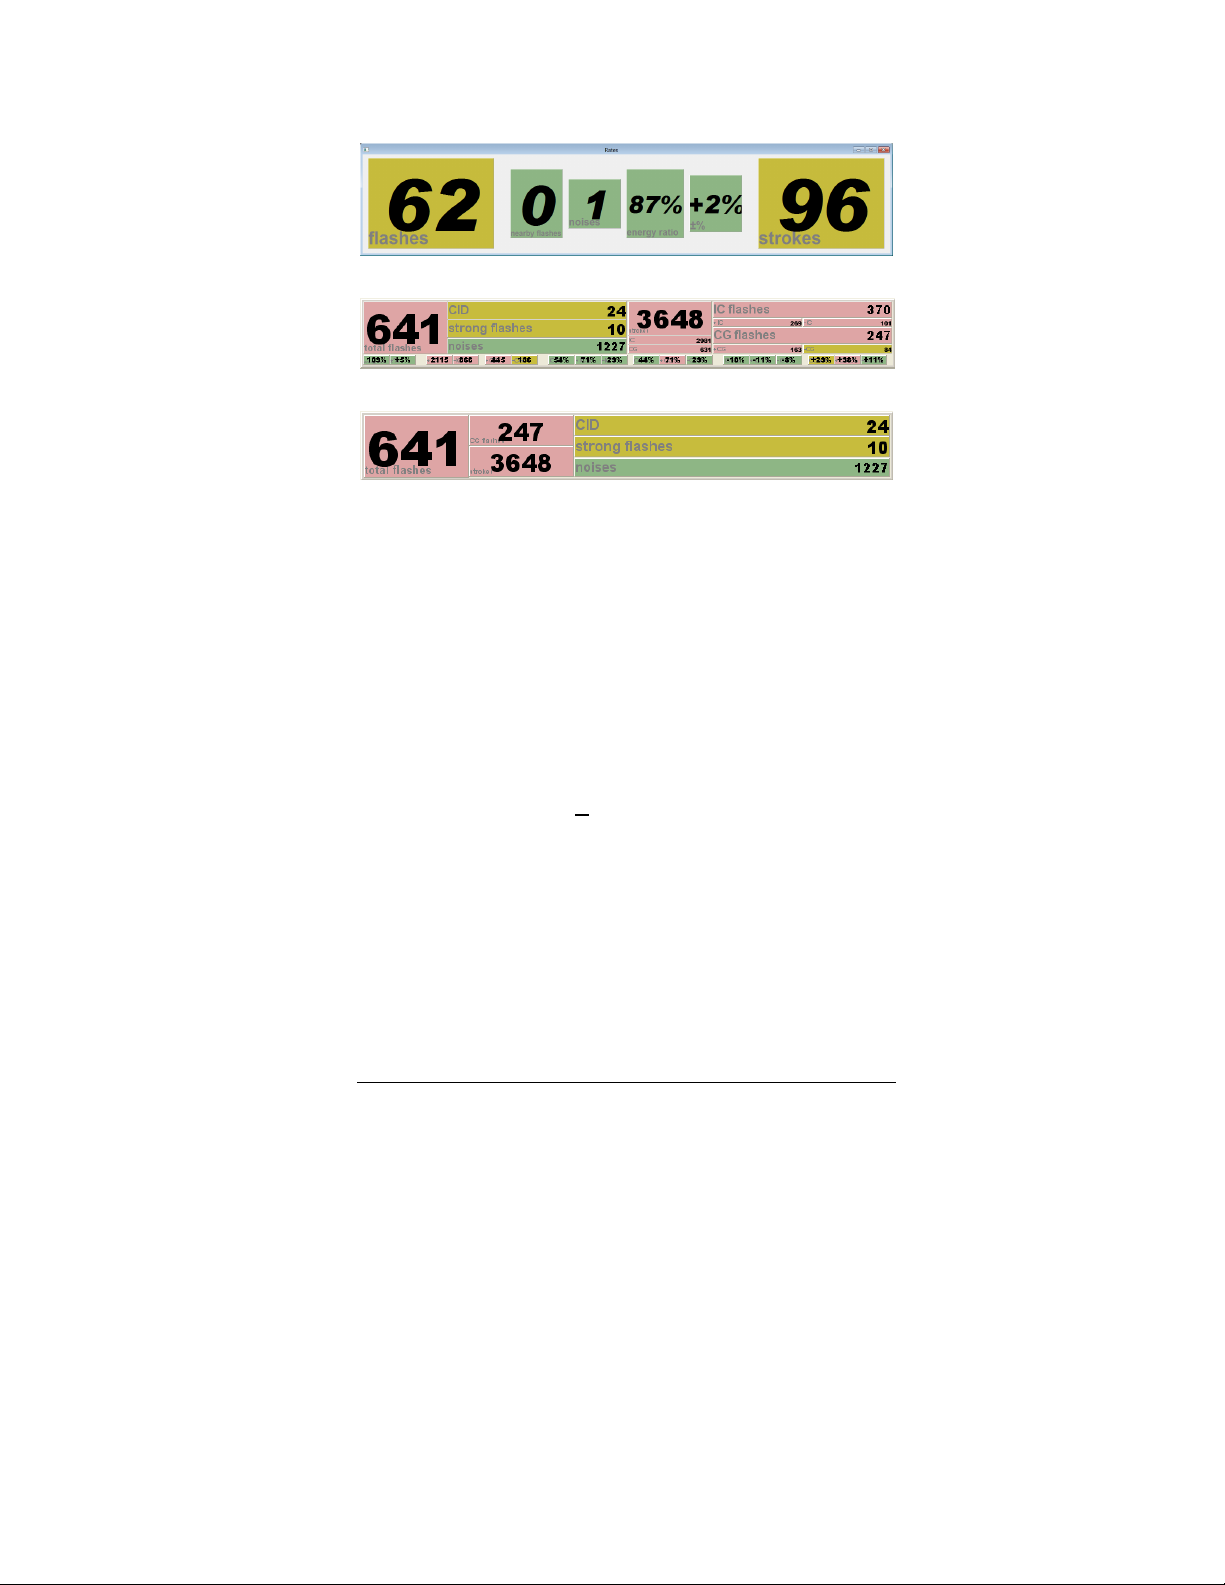
The Rates window as it appears when using the Boltek StormTracker
hardware.
47
47
4747
Page 48
L I G H T N I N G / 2 0 0 0
The Rates window as it appears when using the LD-250.
The Rates window in advanced mode when using the StormTracker.
The Rates window in simple mode when using the StormTracker.
The Rates window contains 31 counters. The leftmost group
contains the most important counters: the total flash rate
counter, the strong stroke rate counter, the noise rate counter,
and the CID stroke rate counter.
When using the LD-250, since there is no stroke type
information, only 6 counters are displayed: the total flash rate
counter, the strong stroke rate counter, the noise rate counter,
the stroke rate percentage change counter, and the stroke rate
counter.
You may make individual counters invisible or visible by
selecting them on the Counters menu. You may drag
individual counters to new positions. Counters may also be
resized by clicking and dragging the edge or corner of the
counter.
The default simple mode configuration displays only 6
counters. The non-displayed counters can be viewed by
dragging down the bottom of the Rates window.
The stroke rate counters are updated as often as once every
one-tenth of a second. The stroke subtype percentage
48
48
4848
Page 49

R E A L - T I M E L I G H T N I N G D E T E C T I O N
counters are updated as often as every half second, as are the
stroke rate change counters.
You can change the look of each counter in this window
individually by right-clicking on the counter or its label. You
can change the look of all the counters or labels at the same
time by choosing an option from the Counters menu on the
menu bar at the top of the main window.
A record value in a counter is denoted by the counter taking
on an “inverted” look (the colors of the counter’s digits and
background are reversed).
49
4949
49
Page 50
L I G H T N I N G / 2 0 0 0
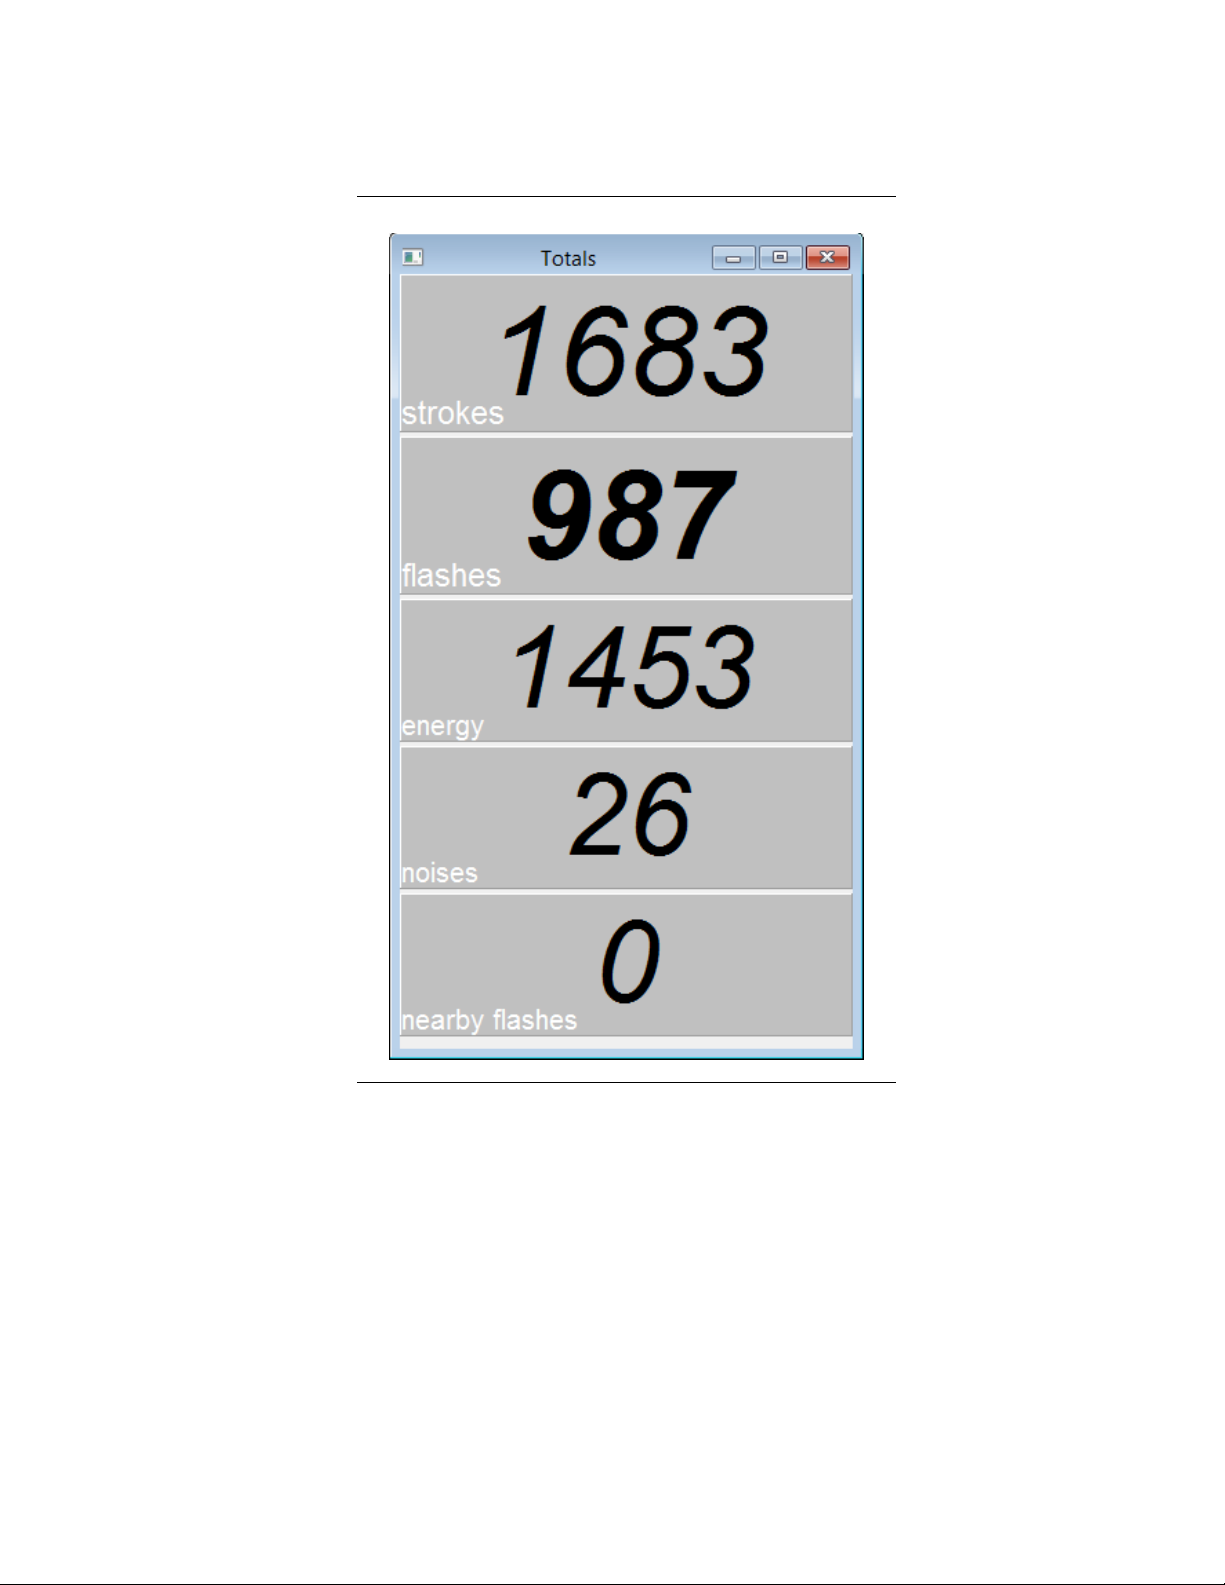
Totals
50
5050
50
Page 51
R E A L - T I M E L I G H T N I N G D E T E C T I O N
The Totals window (in flash or stroke mode) as it appears when using the
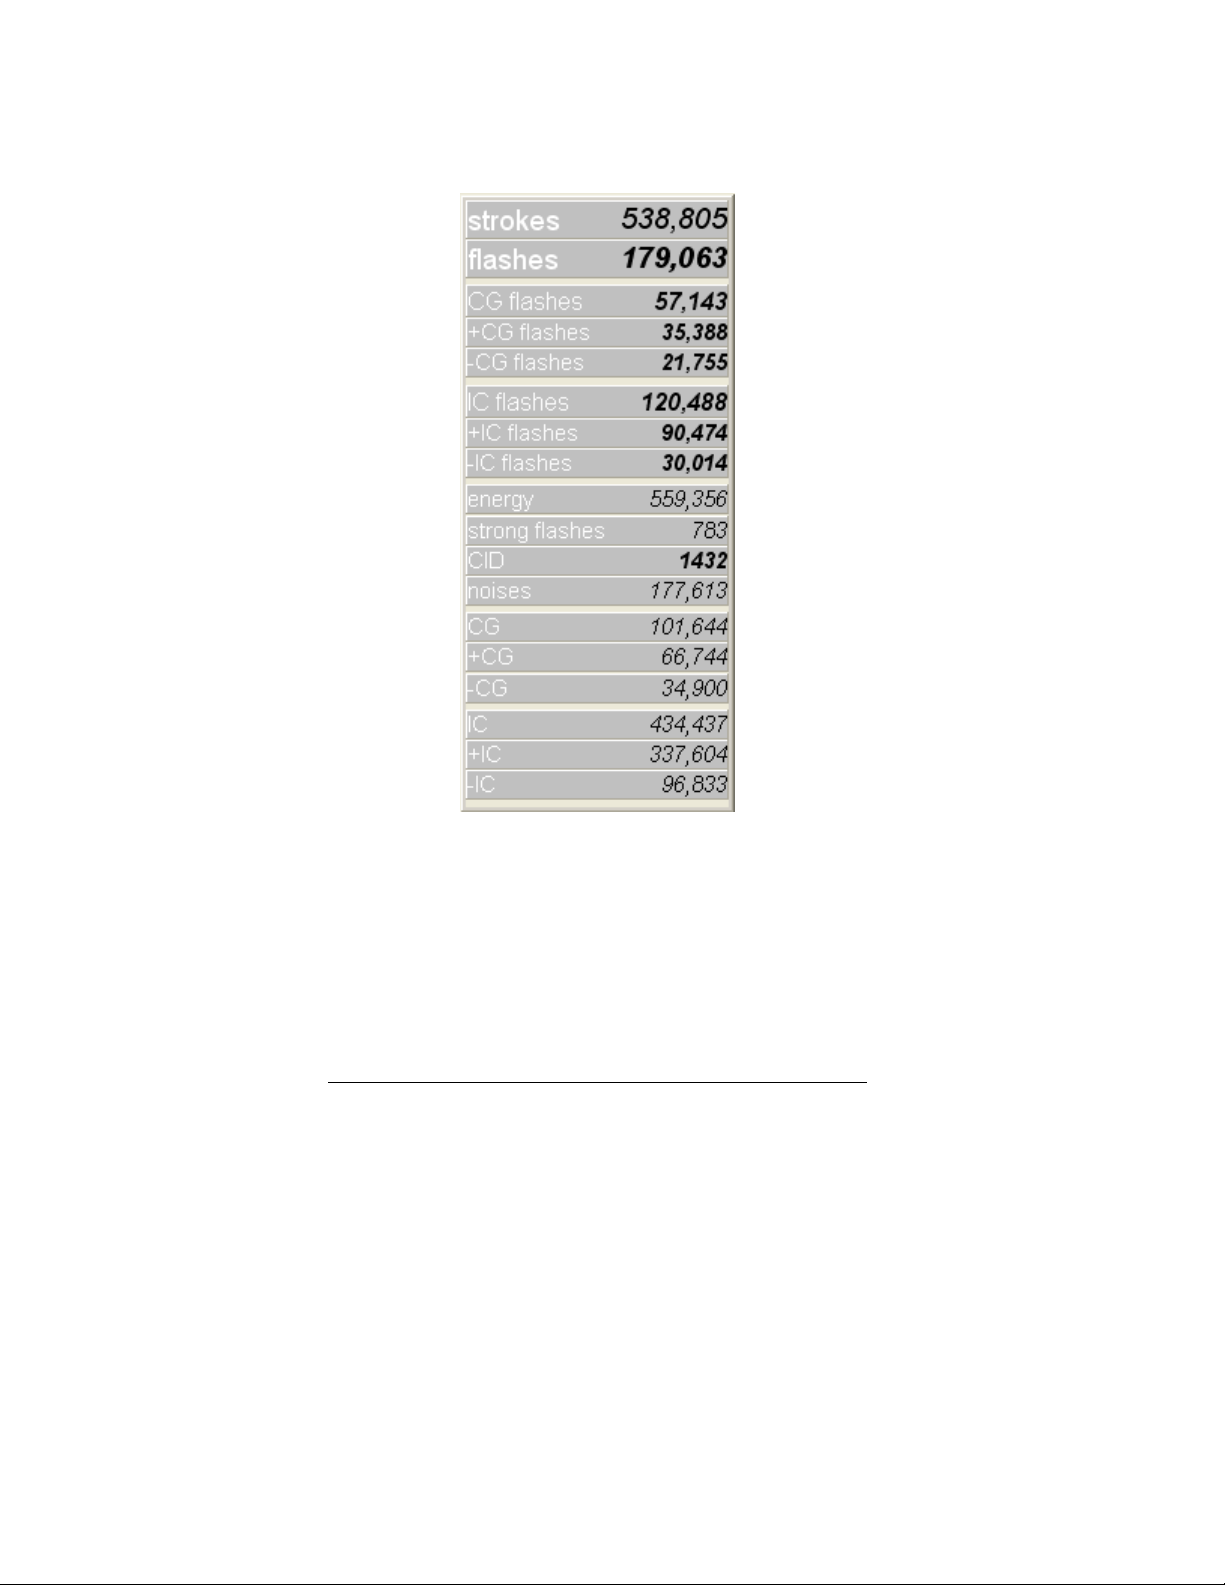
LD-250.
The Totals window as it appears in advanced mode when using the Boltek
StormTracker or LD-350.
The Totals window contains the number of strokes of each of
the various stroke types, as well as energy and noises, that has
been detected since midnight.
You can change the look of each counter in this window
individually by right-clicking on the counter or its label. You
can change the look of all the counters or labels at the same
51
51
5151
Page 52
L I G H T N I N G / 2 0 0 0
time by choosing an option from the Counters menu on the
menu bar at the top of the main window.
It was originally thought that the total number of strokes
detected would always be greater than the total number of
flashes detected. This was because each flash must consist of
at least one stroke. However it is possible to observe a flash
total that is greater than the stroke total. If a stroke occurs
just before midnight, it will be included in the totals for that
day. But the corresponding flash can be registered just after
midnight because we must wait to be sure that no other
strokes will occur that are part of that flash. When this
unlikely event occurs, we can see the flash total counter at “1”
and the stroke total counter at “0”. This seemingly
impossible situation will continue until a flash occurs that
contains more than one stroke.
A record value in a counter is denoted by the counter taking
on an “inverted” look (the colors of the counter’s digits and
background are reversed).
Control Panel
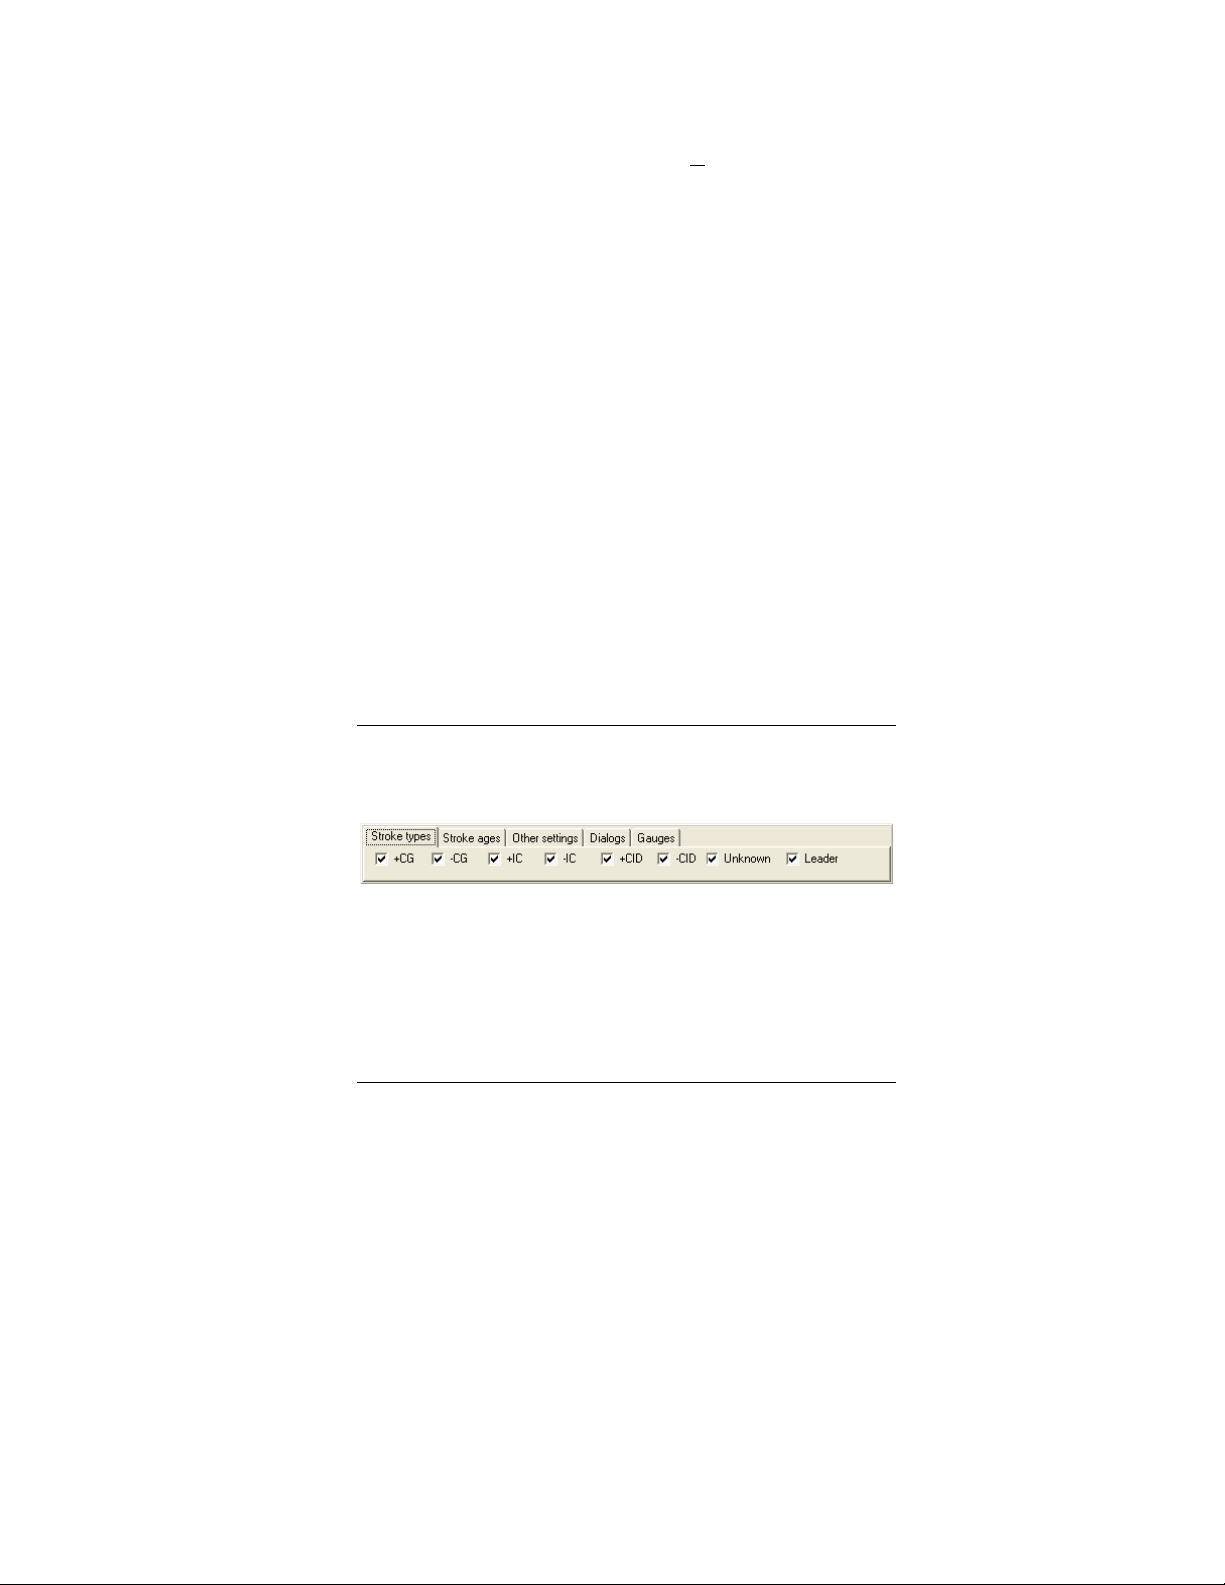
The Control Panel window allows you to quickly change
various settings.
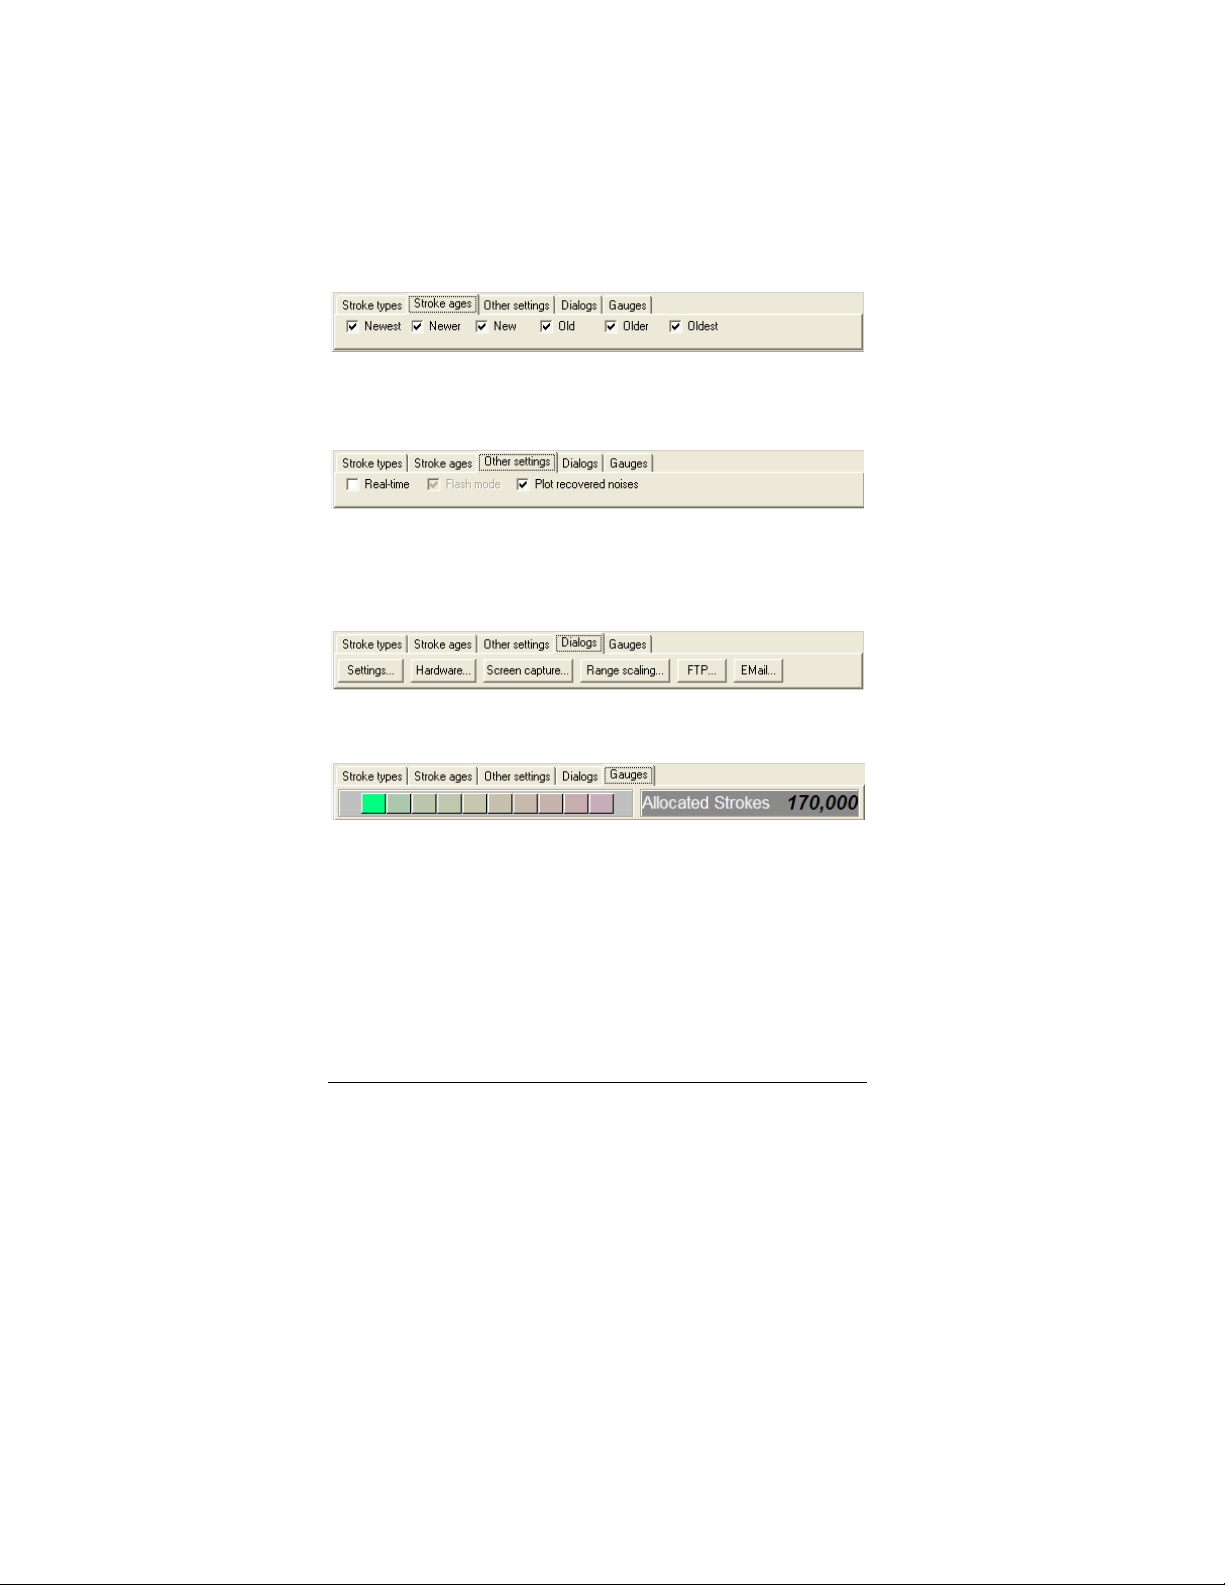
On the Stroke types tab, you can toggle the drawing of any of
the stroke types without having to open the Stroke Types
Dialog.
Since CID strokes are strokes and not flashes (they are
components of flashes), the will not be displayed if you are
52
52
5252
Page 53
R E A L - T I M E L I G H T N I N G D E T E C T I O N
viewing flashes in the Real-time Lightning window or Raw
Lightning Data window.
You may view strokes in the Raw Lightning Data window.
Right-click in the window and choose "Settings..." from the
popup menu to select the "View | Strokes" option.
On the Stroke ages tab, you can toggle the drawing of any of
the 6 stroke ages without having to open the Stroke Types
Dialog.
On the Other settings tab, you can switch between raw
lightning data and real-time lightning modes, as well as switch
between stroke mode and flash mode. You can also toggle
the drawing of strokes that are recovered noises.
The Dialogs tab has shortcut buttons that activate several
different dialog boxes.
The Gauges tab lets you see how often the lightning detector
is being queried for a new stroke, and how many strokes have
been allocated by the system at any given time.
Hardware access meter
This meter indicates how frequently Lightning/2000 is able to
check the lightning detection hardware to see if a lightning
stroke has been detected.
53
53
5353
Page 54

L I G H T N I N G / 2 0 0 0
During periods of little or no lightning activity,
Lightning/2000 only checks the lightning detection hardware
intermittently. At these times, the system load meter will only
have the first or second bar lit.
Allocated strokes counter
This counter shows the total number of strokes allocated at
any time. During times of little activity, this number will not
change.
54
5454
54
Page 55
R E A L - T I M E L I G H T N I N G D E T E C T I O N
Storm Statistics
55
5555
55
Page 56

L I G H T N I N G / 2 0 0 0
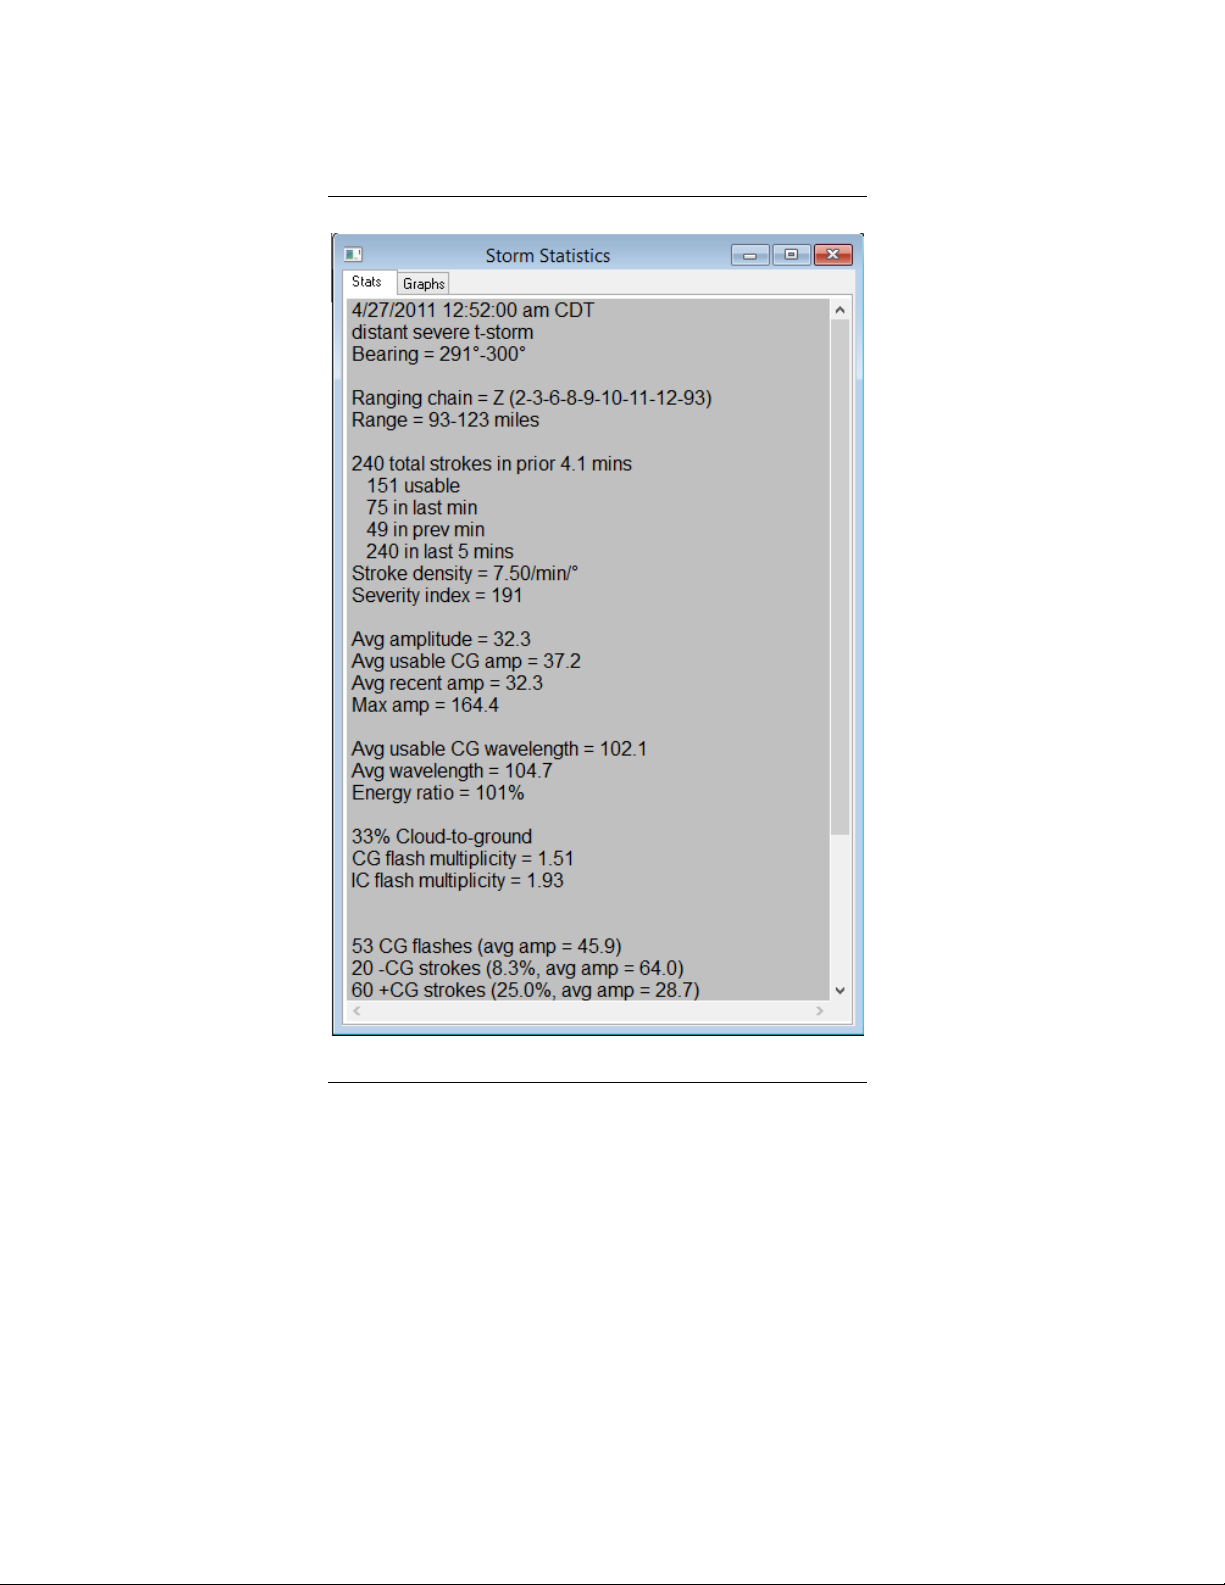
The Storm Statistics window appears whenever you click on a
storm in the Analysis window, or (optionally) the Real-time
Lightning window. It is also displayed when you click on a
group of stroke or flashes in the Raw Lightning Data window.
The information presented here is meant to offer a detailed
look at the character of a storm. The Stats page of the
window contains text information that may be copied to the
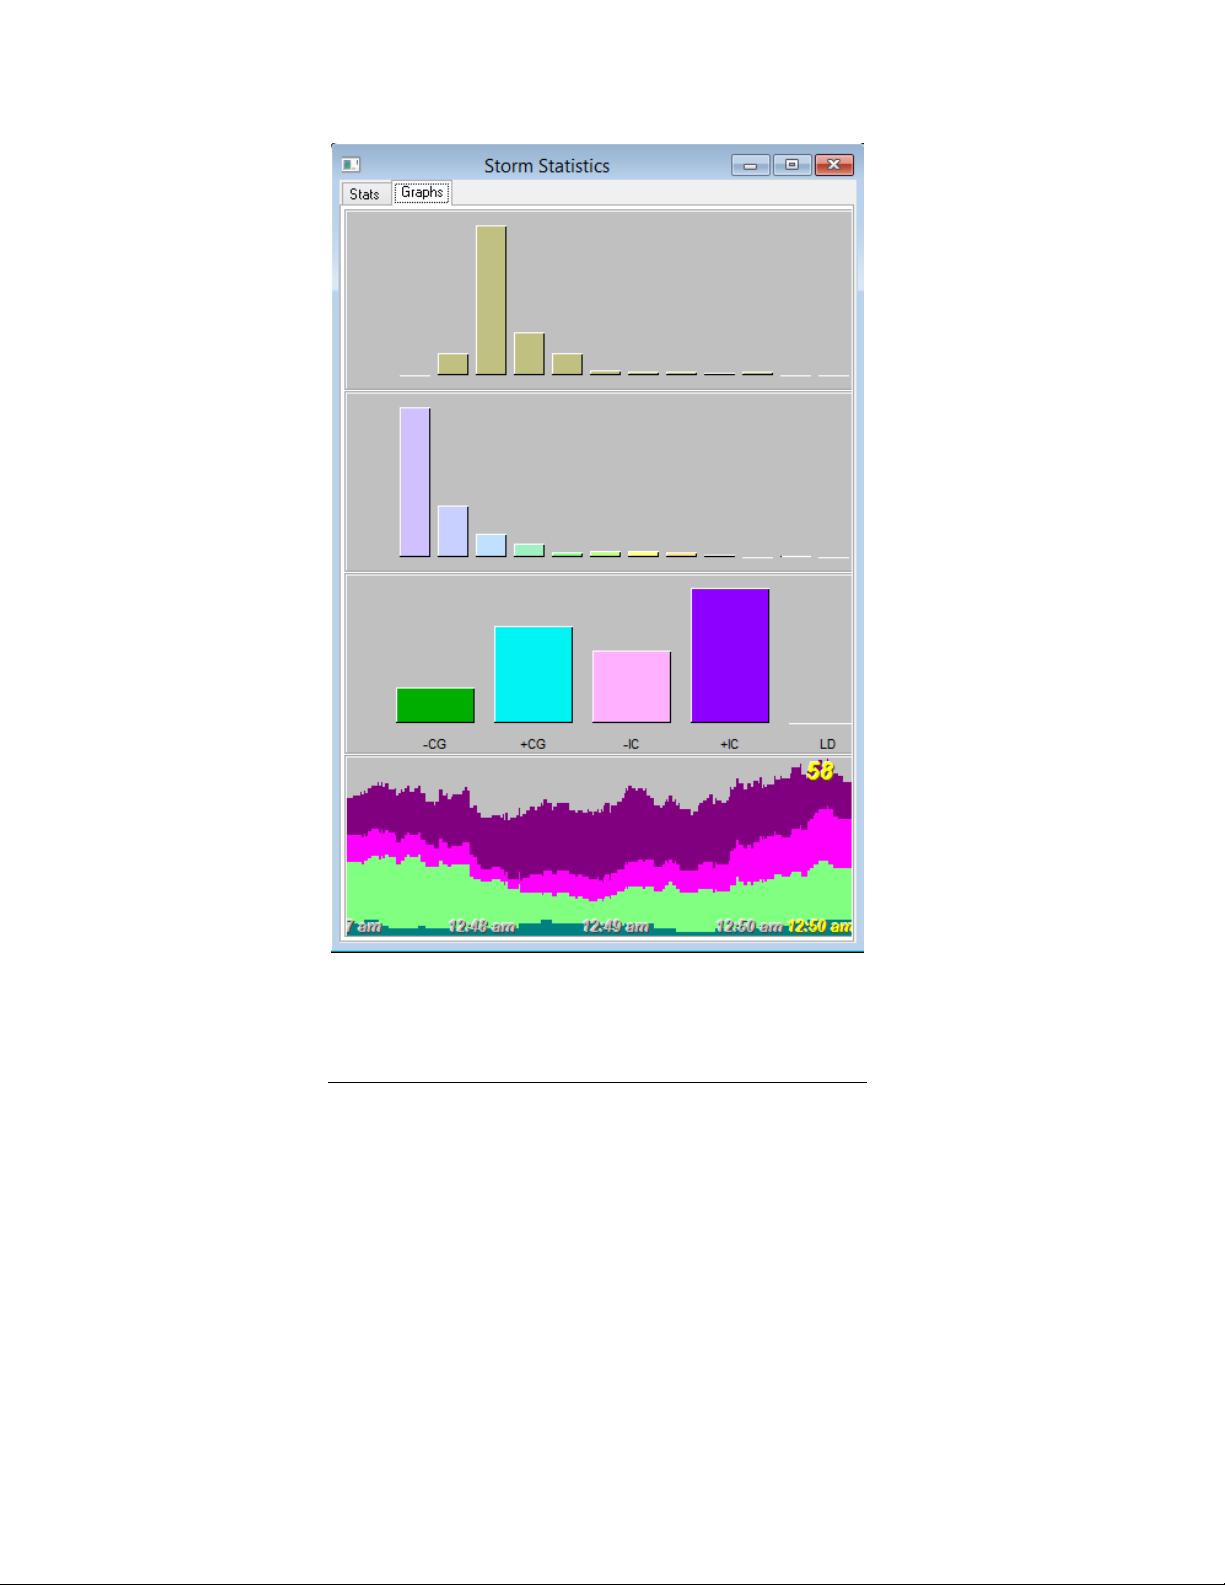
clipboard. The Graphs page contains a concise look at storm
characteristics presented graphically.
The information contained on the Stats page includes:
• The date and time the information is valid for
• The general classification of the storm
o A “distant” storm is one that lies beyond the
yellow alert range ring
o A “regional” storm is one that lies between
the yellow and red alert range rings
o A “nearby” storm is one the lies inside the
red alert range ring
o (The distances of the alert range rings may be
set in the Analysis window or the Real-time
Lightning window.)
• The bearing of the storm (North=0, East=90,
South=180, West=270)
• The ranging chain -- a record of how Lightning/2000
determined the range of the storm.
• The estimated range boundaries of the storm
• The number of strokes examined in the storm
• How many of those strokes were unique (usable).
• How many strokes were recorded in the last minute
56
56
5656
Page 57

R E A L - T I M E L I G H T N I N G D E T E C T I O N
• How many strokes were recorded in the minute
before that
• How many strokes were recorded in the last 5
minutes
• The stroke density in strokes per angular degree per
minute
• The estimated severity index (100 or above indicates
a very severe storm)
• The average amplitude of all strokes in the storm
• The average amplitude of all usable CG strokes in the
storm
• The average recent amplitude
• The maximum amplitude detected
• The average wavelength (in arbitrary units) of all
usable CG strokes in the storm (not available when
using the LD-250.)
• The average wavelength (in arbitrary units) of all
strokes in the storm (not available when using the
LD-250.)
• The energy ratio of the storm
• The percentage of CG strokes in the storm (not
available when using the LD-250.)
• The CG flash multiplicity. This is the ratio of the
number of CG strokes to the number of CG flashes.
A flash may consist of one or more strokes, so this
number represents the average number of strokes per
flash. The flash multiplicity will typically increase as a
storm draws closer. (Not available when using the
LD-250.)
57
57
5757
Page 58

L I G H T N I N G / 2 0 0 0
• The IC flash multiplicity. This is the ratio of the
number of IC strokes to the number of IC flashes. A
flash may consist of one or more strokes, so this
number represents the average number of strokes per
flash. The flash multiplicity will typically increase as a
storm draws closer. (Not available when using the
LD-250.)
• The number of unique CG flashes in the storm (Not
available when using the LD-250.)
• The number of CG stroke subtypes in the storm
(Not available when using the LD-250.)
• The number of unique IC flashes in the storm (Not
available when using the LD-250.)
• The number of IC stroke subtypes in the storm (Not
available when using the LD-250.)
• The number of recovered noises in the storm.
Recovered noises are IC strokes whose precise
characteristics cannot be determined. (Not available
when using the LD-250.)
• The number of leader strokes in the storm (Not
available when using the LD-250.)
• The number of compact intercloud discharge (CID)
strokes in the storm (Not available when using the
LD-250.)
58
58
5858
Page 59
R E A L - T I M E L I G H T N I N G D E T E C T I O N
The information contained on the Graphs page includes:
• The amplitude distribution graph for the storm
• The wavelength distribution graph for the storm
59
59
5959
Page 60

L I G H T N I N G / 2 0 0 0
• The stroke type distribution graph for the storm.
(The distribution of flashes is shown when in flash
mode, simple mode, or advanced mode)
o Negative cloud-to-ground
o Positive cloud-to-ground
o Negative intercloud
o Positive intercloud
o Leaders
o Compact intercloud discharge
• The stroke rate history for the storm. The
information in the stroke distribution graph may be
changed by choose Strokes types and colors…
from the graph’s right-click menu.
The amplitude distribution graph shows the distribution of
the amplitudes of the strokes in the storm, from lowest to
highest. More nearby storms will have more high amplitude
strokes, while distant storms will show mainly low amplitude
strokes.
The wavelength distribution graph shows the distribution of
the wavelengths of the strokes in the storm, from lowest to
highest.
The stroke type distribution graph shows the relative number
of the various stroke types within the storm. More +CG
strokes (or flashes, when in flash mode, simple mode, or
advanced mode) tend to indicate a greater chance of a severe
storm.
The stroke rate history graph shows the stroke rate trend of
the storm over the last 5 minutes. The colors and fonts used
in this stroke rate history graph may be changed
independently of the colors in the Stroke Rate History
window, though it is advisable to make them the same for
purposes of clarity.
60
60
6060
Page 61

R E A L - T I M E L I G H T N I N G D E T E C T I O N
Right-click on elements in this window to change their
properties.
Detector Status
The Detector Status window in simple and advanced modes.
The Detector Status window gives a visual indication of each
incoming lightning stroke. The signal strength meters are
updated immediately following the detection of a stroke. The
number of segments lighted is directly proportional to the
strength of the stroke. Strong strokes light all of the
segments. The peaks are held for 2 seconds.
You can cause a “click” sound to play for each stroke that is
detected. Right-click on the Detector Activity window and
choose Sound… to activate this option.
When using the StormTracker hardware, the top row of the
signal strength meters shows IC strokes and the bottom row
shows CG strokes.
When using the LD-250, the top row of the signal strength
meters shows the north-south amplitude of the stroke and the
bottom row shows the east-west amplitude.
The clock displays the time in the local format, based on your
Regional Settings in the Windows Control Panel. The time
zone abbreviation is formed by using the first letter of each
word in the name of your time zone. You may change the
names of the time zones for your area by choosing Options |
Settings… from the main menu.
The system load meter shows how often the software is able
to check the detector board. There isn’t any significant
chance of data being lost due to excessive system load unless
61
61
6161
Page 62

L I G H T N I N G / 2 0 0 0
the system load meter spends a lot of time in the red area.
Occasional peaks in the yellow or red segments are normal.
They occur when the system is performing a particularly
computation-intensive operation, such as updating the
analysis window or the graph window.
During periods of little or no lightning activity,
Lightning/2000 only checks the lightning detection hardware
intermittently. The system load meter will light only the first
bar at these times.
NOWCast
The NOWCast window presents recent statistics textually.
Any alerts in effect are listed. The recent history of the stroke
rate, the strong stroke rate, the energy rate, the rates of the
stroke subtypes (if using the StormTracker hardware) and the
noise rate are detailed.
NOWCasts are not saved automatically, but the current
NOWCast may be saved at any time by choosing Save |
NOWCast from the File menu. The hotkey for this action is
F5.
If you’re viewing a NOWCast, it can be saved to any location
by choosing Save as… from the File menu.
Summary
The Summary window gives a summary of lightning activity
since midnight local time. The total number of strokes,
strong strokes, energy units, the various stroke subtypes (if
using the StormTracker hardware) and noises are presented
62
62
6262
Page 63

R E A L - T I M E L I G H T N I N G D E T E C T I O N
along with their average rates. Additionally the total amount
of time spent under the various alerts is given. Peak counts
for each of the counters are listed. Finally, statistics on the
number of archive files on your hard drive are given.
Each day’s summary is saved to a file at midnight. The
summary file is a text file that can be opened with a simple
word processor such as Wordpad or Notepad. Saved
summaries can also be opened from Lightning/2000 by
choosing Open | Summary… from the File menu.
The current summary may be saved to the hard disk by
choosing Save | Summary from the File menu. The hotkey
for this action is F6.
Records
The Records window contains a list of record setting values
that have been recorded since you installed Lightning/2000.
The window is updated each time a new record value is
recorded.
Both the record value and the date and (if applicable) the time
the record value was achieved are recorded.
A record value in a counter is denoted by the counter taking
on an “inverted” look (the colors of the counter’s digits and
background are reversed).
The records are stored in the Windows Registry. If you install
Lightning/2000 on a new computer, and you wish to retain
the records that have already been set, you can export the
record information from the Registry.
The records are stored in the Registry key:
“HKEY_CURRENT_USER\Software\Aninoquisi\Lightnin
g2000\Records”. Choose “File | Export” from the Registry
63
63
6363
Page 64

L I G H T N I N G / 2 0 0 0
editor’s main menu to save the records to a file that can then
be taken over to the new computer and imported into the
Registry there.
The General Status Line
The general status line at the bottom of the main window
represents Lightning/2000’s assessment of the threat level
presented by recent lightning activity. It is based on the
recent counts and the analysis window. In general, a red alert
will not be shown unless cloud to ground lightning can be
expected near your location.
The text displayed in the General Status Line is based on the
contents of a template file. The default template file is “Status
Line Template.txt”, located in the Lightning/2000 installation
folder.
The contents of the template file may consist of any of the
keywords or commands used for the Custom Summary
Window. See the chapter pertaining to that window for
details.
If you want to experiment with either the custom summary
template or status line template, you should make a copy of it
first so that any changes you make can be abandoned if they
don't work out so well.
You can use a command to change the alert level of the
General Status Line. These commands are typically used
when a set of conditions occurs that merits the attention of
the user, such as when a severe storm is determined to be
relatively nearby.
Because of the limited amount of space on the General Status
Line, the text output by its template should be limited to what
will fit onto the status line. That text may consist of multiple
64
64
6464
Page 65
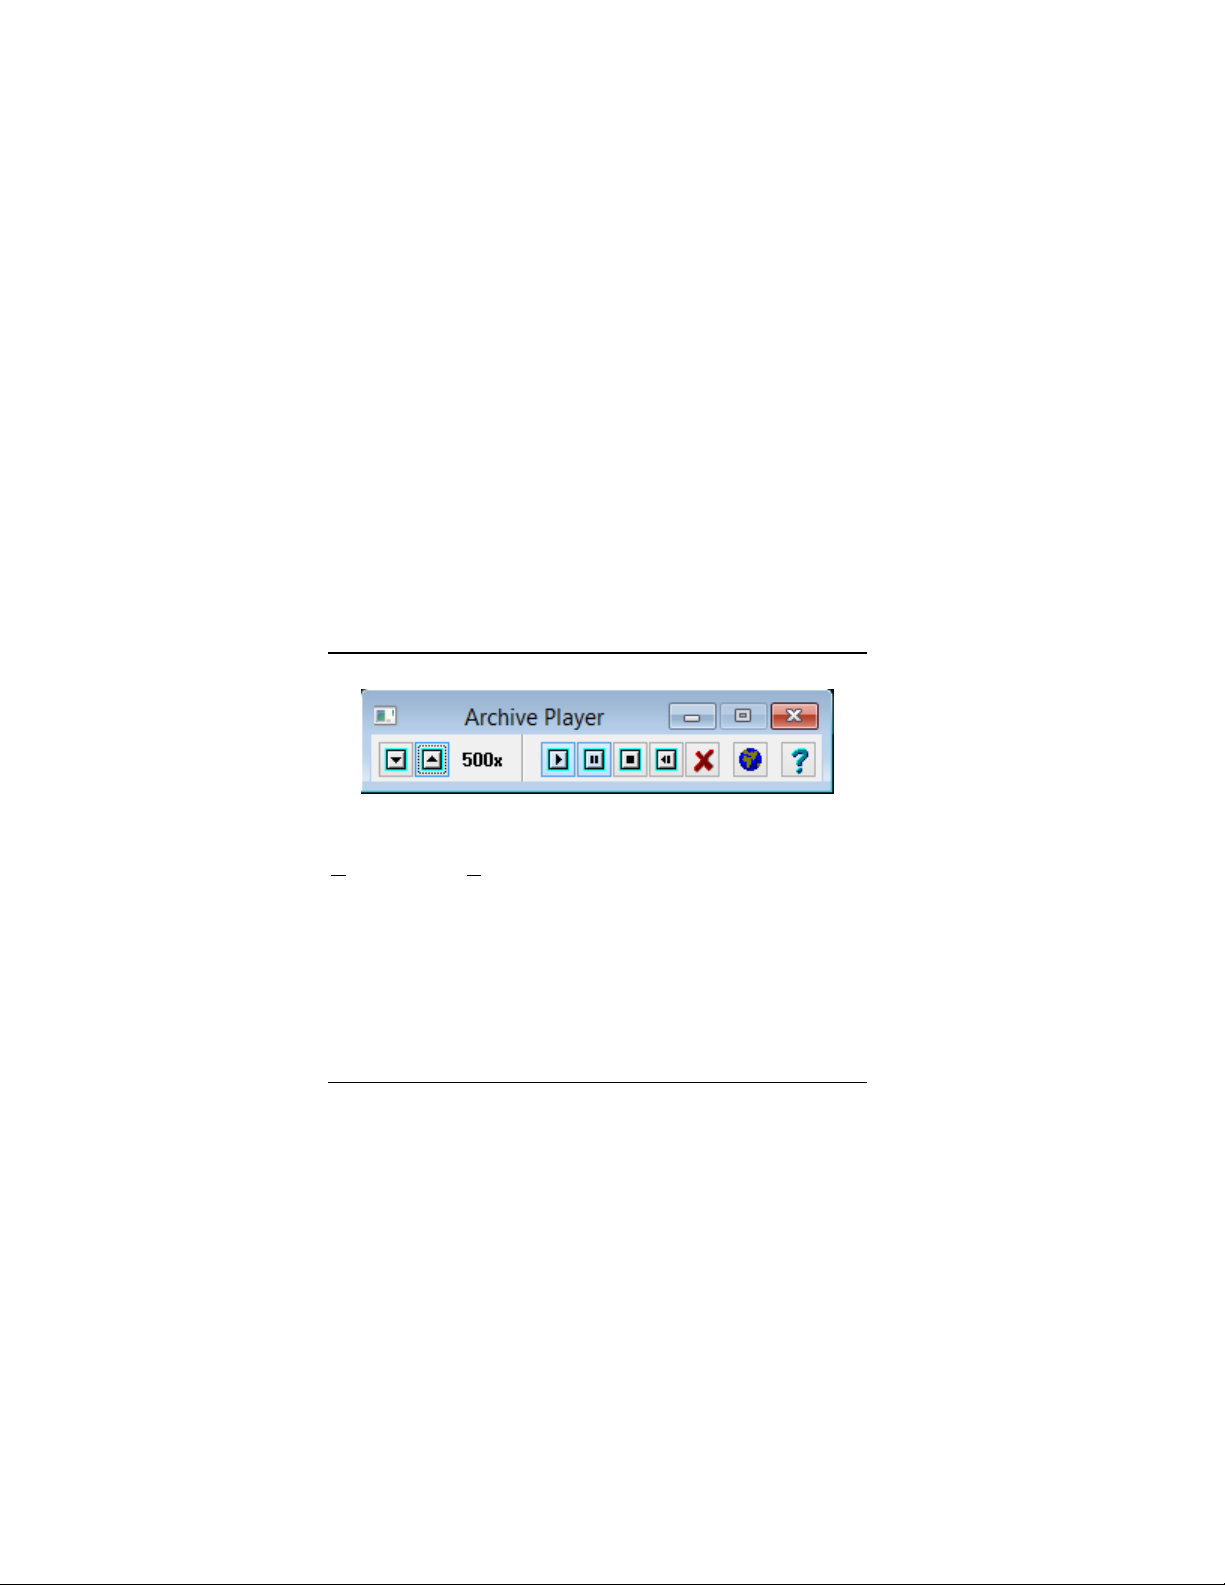
R E A L - T I M E L I G H T N I N G D E T E C T I O N
lines. Multiple lines output by the status line template will be
concatenated together so that they occupy a single line.
A general red alert, unlike any other red alert, always remains
in effect for at least 5 minutes.
The general status line (when using the default template) will
describe thunderstorm activity as being either "nearby",
"regional", or "distant". A nearby storm is one that is
depicted as being inside the red alert distance (as defined in
the Analysis window). A regional storm is one that is
depicted as being inside the yellow alert distance (as defined in
the Analysis window), but outside the red alert distance. A
distant storm is one outside of the yellow alert distance.
The intensity of a storm is listed as one of four levels:
thundershower, thunderstorm, strong thunderstorm, or
severe thunderstorm.
Archive Player
The archive player controls the playback of archive files or
recent activity. The archive player is accessed by choosing
View from the File menu. The speed of the playback can be
controlled with the up and down arrow buttons. The
playback may be paused, stopped, or reset by pressing the
appropriate button.
Only one archive or recent activity playback may be active at
any time. If you’re playing back an archive file and wish to
view recent activity, you will have to cancel the archive
playback first.
65
65
6565
Page 66

L I G H T N I N G / 2 0 0 0
During archive playback, the detector status window, the
general status line, the summary and NOWCast windows
reflect the real-time lightning activity, not the activity
presented by the archive.
At any time during the playback of an archive, you can press
the export button to start exporting archived lightning flashes
to a format that can be read by Google Earth. You may also
export data in a comma delimited text format.
Press the export button a second time to interrupt the
exporting of flashes.
You may start and stop the exporting of flashes any number
of times.
Though Google Earth can (presumably) display any number
of flashes, its operation can become somewhat sluggish when
it is asked to display a large number of flashes. We have
found that displaying over 100,000 flashes causes its operation
to become quite a bit slower. Displaying 10,000 or fewer
flashes seems to cause little or no slowdown.
When you close the archive player (or exit Lightning/2000),
you will be prompted for the name of the file that is to receive
the exported data.
The playback rate of the archive is an exact indication of how
long it will take to complete the playback of the archive. For
example, playing back a daily archive that comprises 24 hours
at 100x will take exactly 0.24 hours (or a little over 14
minutes).
Playing back archives at high rates of speed will tax slower
systems. If the archive contains a large number of strokes,
high-speed playback will probably tax even a fast machine.
Archive playback at high speeds can be made to go more
smoothly. Minimizing windows that have components that
are updated frequently will keep those windows from being
updated, thus making the archive playback go more smoothly.
66
66
6666
Page 67

R E A L - T I M E L I G H T N I N G D E T E C T I O N
The biggest offender is the Real-time Lightning/Raw
Lightning Data window. High-speed archive playback goes
much more smoothly when this window is minimized.
When you first play back an archive file that was recorded
with a different kind of lightning detection hardware than
what you have, a special preferences file “Foreign Archive
Preferences” will be created. Changes you make to the colors,
fonts, alarm levels, or other preferences while running a
“foreign” archive will be automatically saved to the “Foreign
Archive Preferences” file when you exit the archive player.
67
6767
67
Page 68

L I G H T N I N G / 2 0 0 0
68
6868
68
Page 69

R E A L - T I M E L I G H T N I N G D E T E C T I O N
Chapter 5
The Custom
Summary Window
Overview • Commands • Keywords
Overview
For a complete description of every Custom Summary
command and keyword, see Appendix D.
This window executes a series of commands to display text,
change the color of the window, and play sounds. It gets the
text it displays from a file in the Lightning/2000 installation
folder. The default name of the file is "Custom Summary
Template.txt", but any text file can be used as the custom
summary template.
The custom summary template is a text file that can be edited
just like any other text file. On most systems, the Notepad
application is the default application for editing text files.
Word processors (such as Microsoft Word) will not produce a
text file by default, however most can produce a plain text file
as an option.
You may change the name of the text file used by the Custom
Summary window by right-clicking in the window and
choosing “Custom Summary Manager…” from the popup
menu. See the manual section on the Custom Summary
69
69
6969
Page 70

L I G H T N I N G / 2 0 0 0
Manager for details on how to change or edit the text file used
as a template.
A template file is also used to generate the text displayed on
the General Status Line. That template file is of the same
format, and may use any of the keywords or commands used
in the Custom Summary Window.
If you want to experiment with either the custom summary
template or status line template, you should make a copy of it
first so that any changes you make can be abandoned if they
don't work out so well.
The custom summary window gives you unprecedented
flexibility and control over what information is displayed, and
(optionally) what information is automatically emailed or sent
to your Twitter account. You might (for example) create a
very brief custom summary that gets sent to as a text message
to cell phones (assuming they can be reached via an email
address), or a highly specific and descriptive custom summary
that is to be emailed to a list of clients. It is entirely up to
you.
If you have chosen to email the custom summary, the first
line of text in the custom summary will be used as the title of
the email. See the Email Options Dialog for more
information.
The text file that generates the Custom Summary window
consists of a series of statements. A statement may either be
a conditional statement (one starting with if) or a command.
The most frequently used commands are the ones used to
write text into the window (the #Write and #WriteLine
commands).
A comment line is any line beginning with a semicolon (;)
character. Comment lines will not be included in the Custom
Summary window. They are mainly for use in complex
custom summary templates so that you can explain how you
are using the various keywords in the template.
70
70
7070
Page 71

R E A L - T I M E L I G H T N I N G D E T E C T I O N
You may also end any line with a comment by typing a
semicolon. Any text on the line after the semicolon will not
be included in the custom summary window.
All keywords used in the Custom Summary start with the @
character. Commands start with the # character. There are 5
reserved words that you can use to control which commands
are executed: if, then, else, elseif, and endif.
The structure of an if statement is:
if
if expression then
ifif
One or more statements
elseif
elseif expression then
elseifelseif
One or more statements
elseif
elseif expression then
elseifelseif
One or more statements
else
else expression then
elseelse
One or more statements
endif
endif
endifendif
then
thenthen
then
thenthen
then
thenthen
then
thenthen
Only the if, then, and endif parts of the if statement are
required. Both the elseif and else parts are optional. There
may be any number of elseif parts, but there may only be one
else part. The else part is executed only if neither the if part
nor any of the elseif parts were executed.
A statement in the if, else, or elseif parts may be a command
or another if statement.
An “expression” is basically any kind of mathematical
expression, usually containing one or more of the keywords.
There are several special symbols and words that can be used
in an expression:
>
greater than
<
less than
=
equals
<>
not equals
<=
less than or equals to
>=
greater than or equals to
and
and
a logical and of two expressions
andand
71
71
7171
Page 72

L I G H T N I N G / 2 0 0 0
or
or
a logical or of two expressions
oror
xor
xor
a logical exclusive or of two expressions
xorxor
+
the sum of two expressions or the concatenation of
two quoted strings
-
the difference of two expressions
*
the multiplication of two expressions
/
the division of two expressions
div
div
the division of two expressions, truncated to a whole
divdiv
number
Here are a few examples of valid if statements:
if
if @StrokeCount( 5 ) > 1000 then
ifif
#AlertStatusLineYellow
endif
endif
endifendif
if
if ( @CGFlashCount > 50 ) and
ifif
then
then
thenthen
#AlertStatusLineYellow
if
if @CloseStormCount > 0 then
ifif
#Sound( ‘beep5’ )
#WriteLine( ‘A storm is nearby.’ )
endif
endif
endifendif
endif
endif
endifendif
if
if @HardwareType = 0 then
ifif
#WriteLine( ‘No lightning detector is installed.’ )
elseif
elseif @HardwareType = 1 then
elseifelseif
#WriteLine( ‘LD-250 installed’ )
elseif @HardwareType = 4 then
#WriteLine( ‘LD-350 installed’ )
else
else
elseelse
#WriteLine( ‘StormTracker installed’ )
endif
endif
endifendif
then
thenthen
then
thenthen
and ( @StrokeCount > 1000 )
andand
then
thenthen
then
thenthen
When using “and” in an expression, the part after the “and” is
evaluated only if the part before the “and” is true. This is
because the entire expression (before and after) can be true
only if the before part is true and the after part is true. If the
before part is false, then the entire expression is false whether
or not the after part is true. Since it does not matter in this
case if the after part is true or false, there is no sense in
wasting time evaluating the after part.
72
7272
72
Page 73

R E A L - T I M E L I G H T N I N G D E T E C T I O N
When using “or” in an expression, the part after the “or” is
evaluated only if the part before the “or” is false. This is
because the entire expression (before or after) can be false
only if the before part is false and the after part is false. If the
before part is true, then the entire expression is true whether
or not the after part is true. Since it does not matter in this
case if the after part is true or false, there is no sense in
wasting time bothering to evaluate the after part.
For a complete description of the format of the custom
summary template, see Appendix C, “Custom Summary
Language”.
A complete description of all Custom Summary commands
and keywords may be found in Appendix D.
Some examples of Custom Summary templates can be found
in Appendix E.
Commands
A command is any word preceded by a # sign. There are 3
commands that may be included in a template file that pertain
to the general status line (the #AlertStatusLine commands)
at the bottom of the main window, so they should only be
used in templates for the general status line.
A command is typically issued as a result of one or more
conditions being true. For example, the status line template
may determine that a severe storm is nearby and issue the
#AlertStatusLineRed command.
By using the custom summary commands, a wide variety of
actions may be taken. Screen captures may be produced (in
73
73
7373
Page 74

L I G H T N I N G / 2 0 0 0
addition to or instead of the normal automatic screen capture
process). Text files may be produced, consisting of virtually
any information, and then be sent to a server via FTP.
Commands may be sent to a serial port to control external
devices. Text may be written to the Custom Summary
window, consisting of an almost unlimited variety of
information produced by Lightning/2000. An automatically
generated email may be sent.
The names of the commands are not case sensitive.
Keywords
Keywords that evaluate to a per minute stroke or flash count
can be followed by a parameter. Then the count will evaluate
to the number of strokes or flashes in the last N minutes,
where N is the parameter.
The parameter "N" may be either a positive integer, or a
positive real number. Real numbers less than 1 must start
with a zero.
For example, "0.1" is a valid parameter, but ".1" is not.
For example, the @CGFlashCount keyword will evaluate to
the number of CG flashes in the last minute, but if you
specify @CGFlashCount( 2 ), then it will evaluate to the
number of CG flashes in the last 2 minutes.
@CGFlashCount( 1 ) is identical to @CGFlashCount.
There is a limit of 60 minutes for the various stroke counts.
By default, the @Peak keywords will return the peak count
for the day.
Entering ( N ) (where N is a number of minutes) after the
@Peak keyword will return the peak value in the last N
minutes.
74
74
7474
Page 75

R E A L - T I M E L I G H T N I N G D E T E C T I O N
The @Trend keywords return a percentage difference
between an earlier count and the current count.
Keywords are not case sensitive, so @cgflashcount is
identical to @CGFlashCount or @CGFLASHCOUNT.
75
7575
75
Page 76

L I G H T N I N G / 2 0 0 0
76
7676
76
Page 77

R E A L - T I M E L I G H T N I N G D E T E C T I O N
Chapter 6
The Rate Counters
The Major Counters • The Percent Counters
•
The Flash Rate Counters • The Stroke
Rate Change Counter
The counters in the Rates window convey a wealth of
information, though some are considered to be more
important than others. The most important counters are on
the left side of the window and are: the stroke or flash rate
counter, the strong stroke rate counter, the energy ratio
counter, and the noise rate counter.
A counter panel consists of the following parts:
• The counter (the digits displayed)
• The background
• The caption (in the lower-left corner of the panel)
• The alert bar (optional)
The properties of any of the counter’s parts may be changed
by right-clicking on the item you wish to change.
Most of the counters in the Rates window can have record
values. A new record is indicated by the counter taking on an
“inverted” look – the colors for the counter text and the
background are reversed.
77
77
7777
Page 78
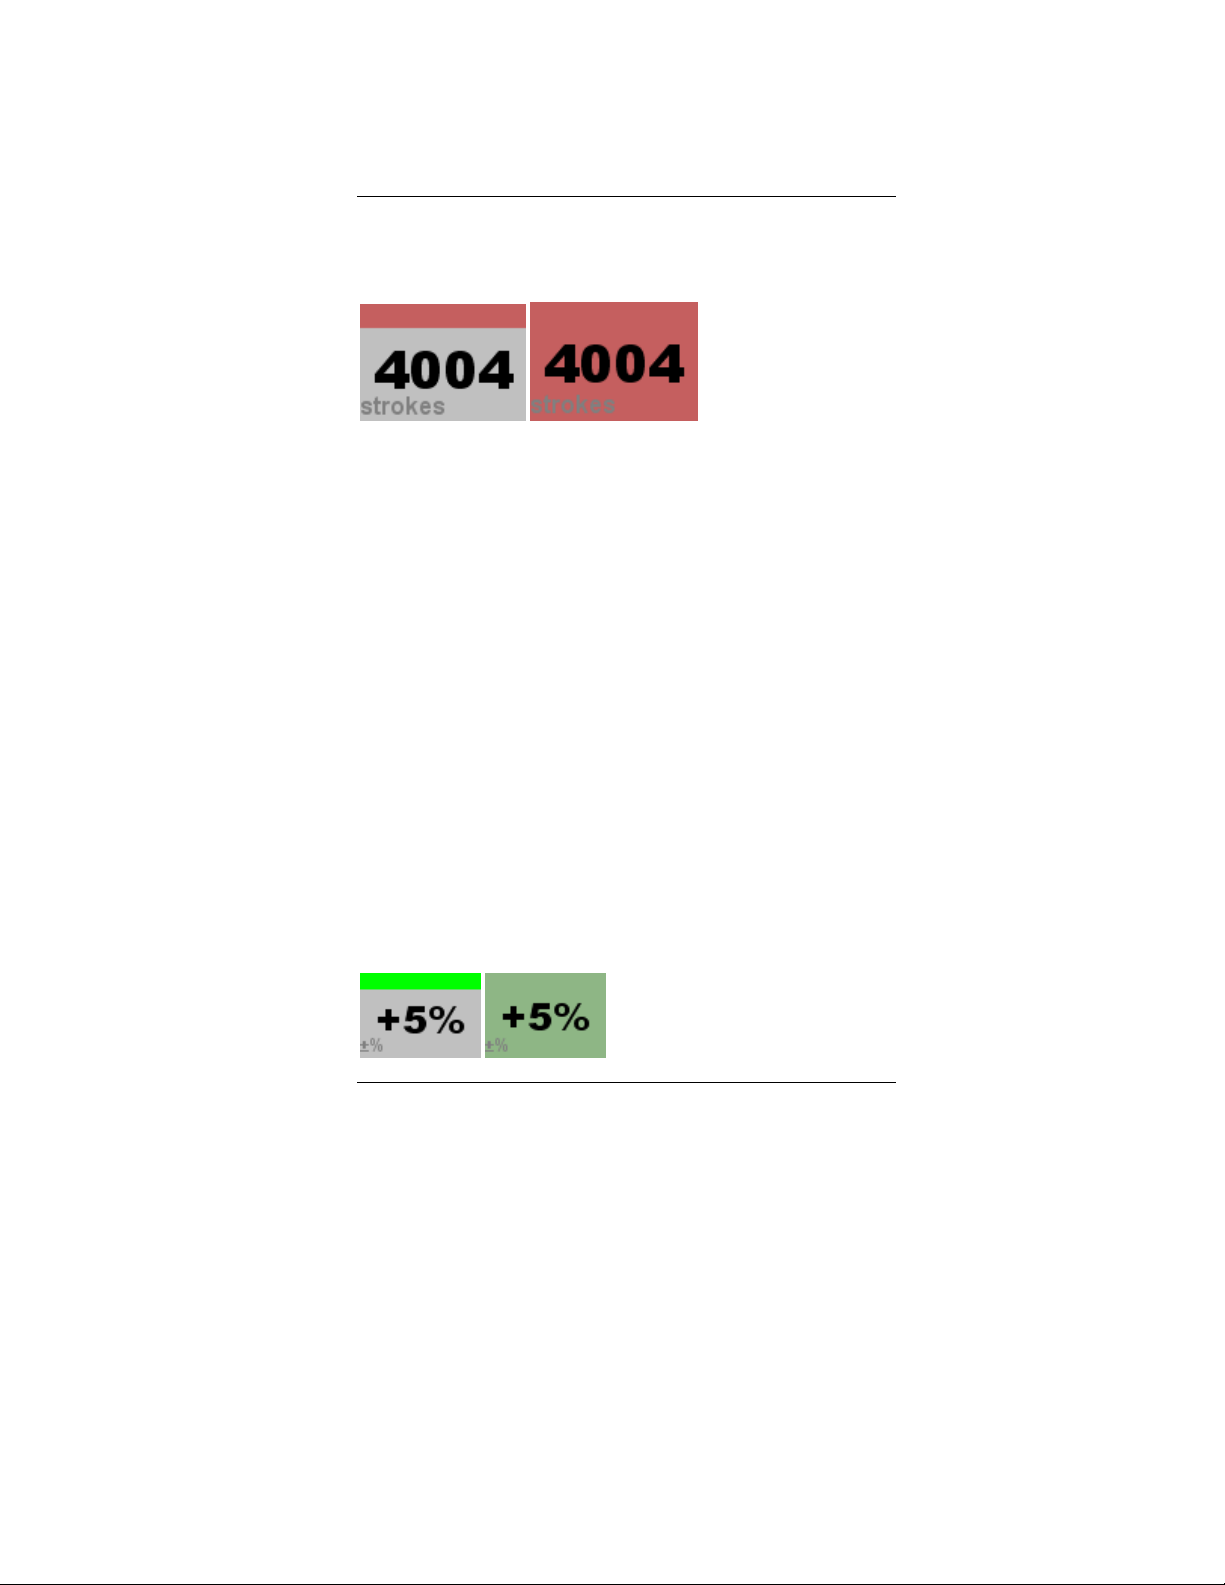
L I G H T N I N G / 2 0 0 0
The Major Counters
Stroke Rate Counter
Stroke rate counter, shown with and without an alert bar.
Default yellow alert trigger level: 50
Default red alert trigger level: 250
Record kept: Yes
The stroke rate counter indicates the number of
lightning strokes of all kinds detected within the last
minute.
In stroke mode, this counter is located at the far left of
the Rates window. In flash mode, the total flash rate
counter is located in that position and the stroke rate
counter’s default location is just below the total flash
rate counter. You may need to drag down the bottom
edge of the Rates window to view this counter in flash
mode. In simple and advanced modes, this counter is
prominently visible.
A new record value is denoted by swapping the colors
of the counter and its background.
Stroke Rate Change Counter
Stroke rate change counter, shown with and without an alert bar.
78
7878
78
Page 79

R E A L - T I M E L I G H T N I N G D E T E C T I O N
Default yellow alert trigger level: 25
Default red alert trigger level: 50
Record kept: No
The stroke rate change counter shows the percentage
change in the stroke rate between one minute ago
and now.
For example, if the stroke rate one minute ago was
100 and the stroke rate now is 120, then the counter
would read “+20%”; if the stroke rate one minute ago
was 120, and the stroke rate now is 100, then the
counter would read “-17%”.
If the stroke rate one minute ago was zero, and the
current stroke rate is zero, "--" is displayed. If the
stroke rate one minute ago was zero, and the current
stroke rate is non-zero, "*" is displayed.
Sudden changes in the stroke rate for a storm could
be signs that the storm is exhibiting potentially
dangerous behavior. A rapid increase in stroke rate
followed immediately by a rapid decrease, or vice
versa has been linked to certain severe
characteristics, such as hail, microbursts, and even
tornadoes.
When you specify a trigger level for the red or yellow
alert, you are specifying the percentage change that
must occur if the stroke rate is 100 strokes per
minute. The percentage change that is needed for
alert status at higher stroke rates is somewhat lower,
and the percentage change that is needed for alert
status at lower stroke rates is higher.
At 1000 strokes per minute, the percentage change
required for an alert is one-half the value specified as
the trigger level. At 10 strokes per minute, the
79
79
7979
Page 80
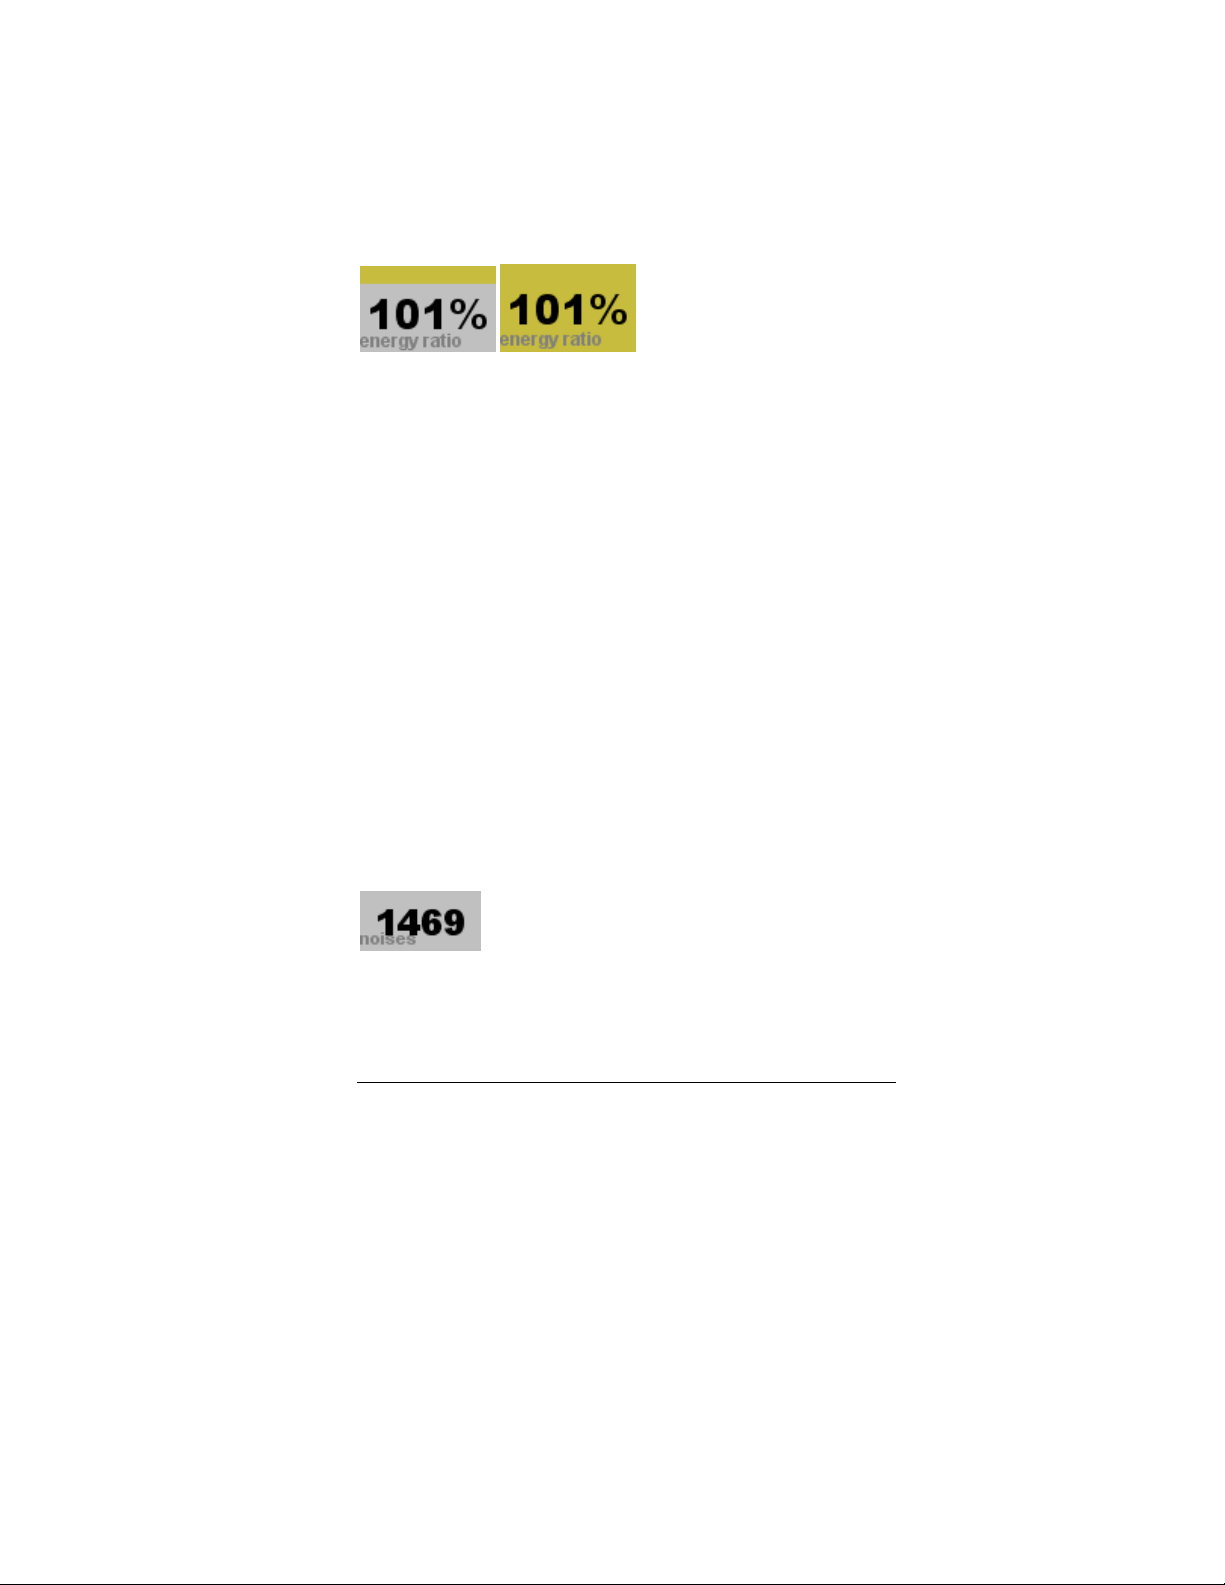
L I G H T N I N G / 2 0 0 0
percentage change required is twice the specified
trigger level.
Energy Ratio Counter
Energy rate counter, shown with and without an alert bar.
Default yellow alert trigger level: 150
Default red alert trigger level: 250
Record kept: No
This counter shows the energy ratio over the last
minute.
The energy ratio is an arbitrary measure of the energy
contained in lightning strokes. It is a good indicator of
a close storm. An energy ratio of over 150% is a good
sign of a relatively nearby storm.
Sometimes the first indicator that a thundershower is
forming nearby will be the red alert on the energy ratio
counter.
At least five strokes per minute must occur before
either the red or yellow energy ratio alert will be
indicated.
Noise Rate Counter
The noise rate counter has no alarms associated with it.
Record kept: Yes
The noise rate counter shows the number of noises
that have been received in the last minute.
80
80
8080
Page 81
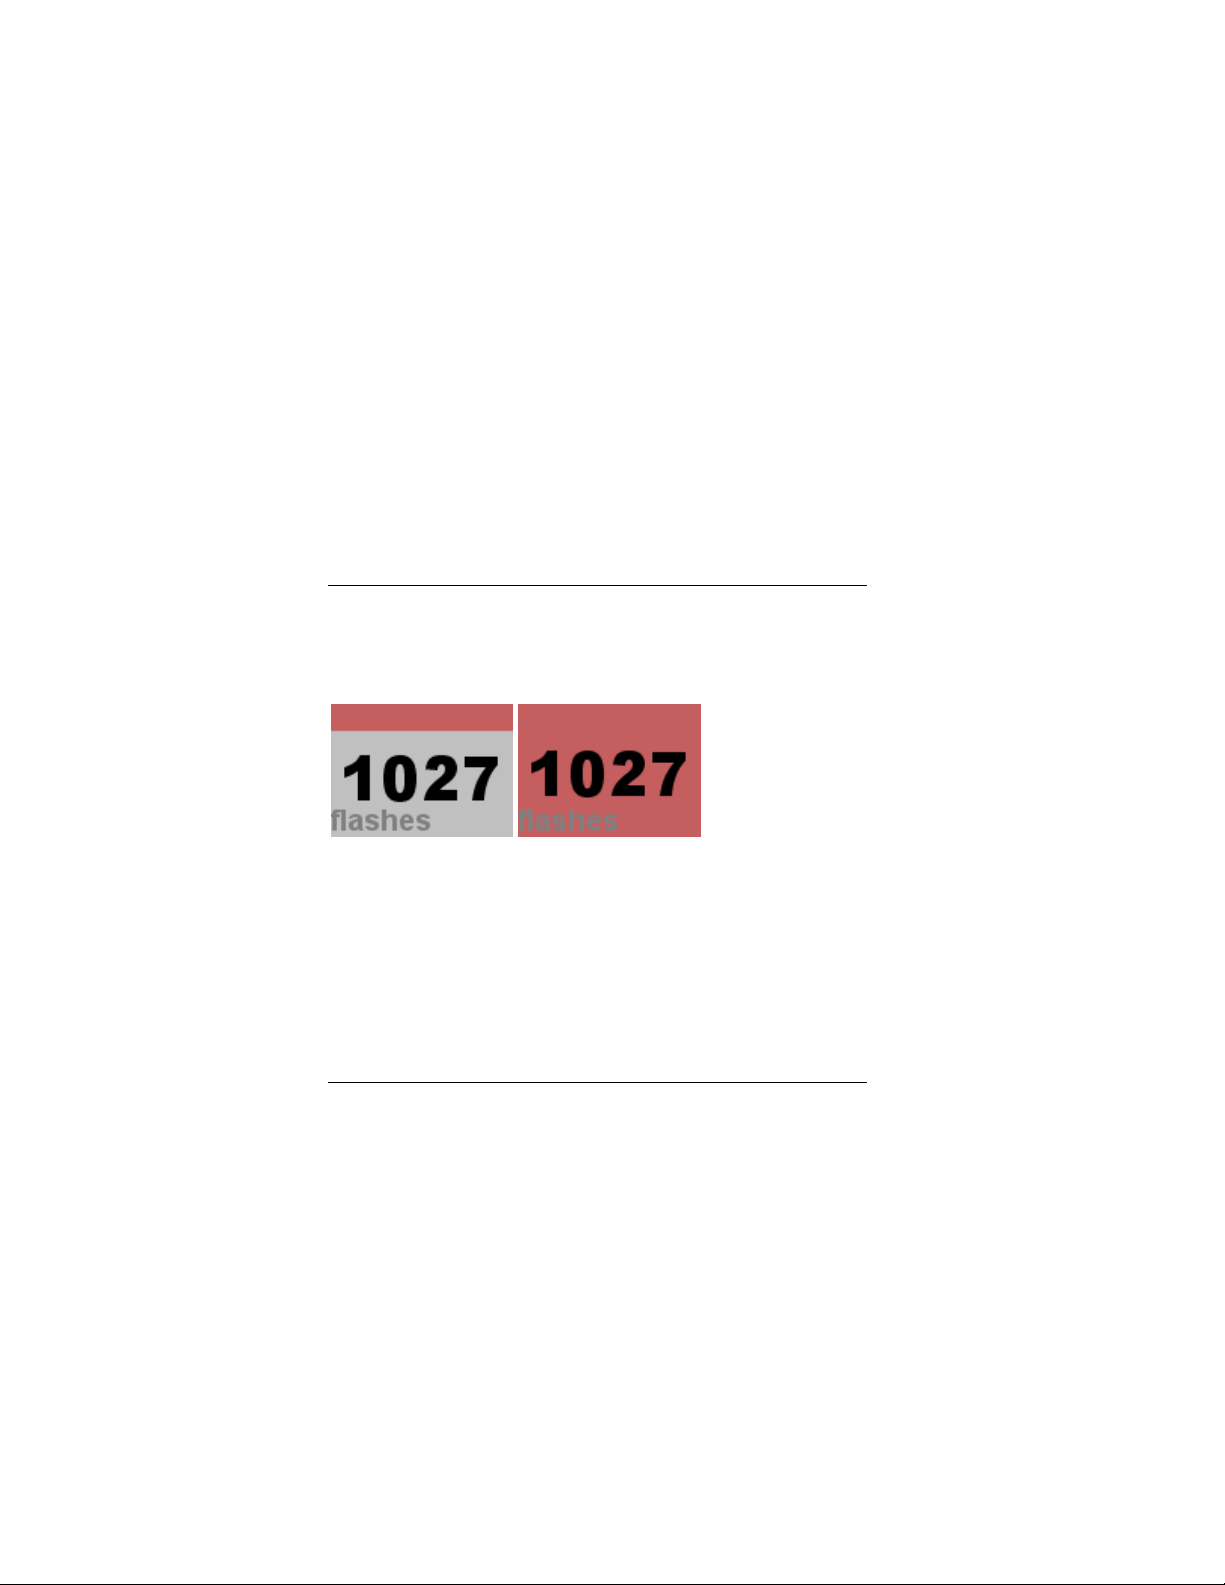
R E A L - T I M E L I G H T N I N G D E T E C T I O N
A noise is defined as any electrical discharge that
cannot be positively identified as a lightning flash.
Noises include electrical noise from household
appliances, signals transmitted by wireless electronic
devices, and lightning strokes that have an
insufficiently well-defined waveform.
During times of heavy activity, as many or more
noises than strokes may be detected. Most of these
noises are intercloud or intracloud (IC) strokes that
cannot be positively identified as such.
A new record value is denoted by swapping the colors
of the counter and its background.
The Flash Rate Counters
Total Flash Rate Counter
Total flash rate counter, shown with and without an alert bar.
Default yellow alert trigger level: 50
Default red alert trigger level: 250
Record kept: Yes
The total flash rate counter shows the total number of
flashes of all kinds in the last minute. This includes
CG and IC flashes. For the LD-250, this counter
81
81
8181
Page 82

L I G H T N I N G / 2 0 0 0
shows an accurate estimate of the total number of
flashes per minute.
A new record value is denoted by swapping the colors
of the counter and the background.
Nearby Flash Rate Counter
Nearby flash rate counter, shown with and without an alert bar.
Default yellow alert trigger level: 1
Default red alert trigger level: 2
Record kept: Yes
The nearby flash rate counter shows the number of
nearby flashes within the last minute.
Nearby flashes are very likely to be no more than a
few miles away. With version 4.6 and later of the
software, only flashes that exhibit certain
characteristics are logged as nearby flashes. This is a
significant change from older versions when this
counter registered strong flashes. (The Custom
Summary language keywords still refer to these types
of flashes as “strong” flashes rather than “nearby”
flashes.) If you want to reset the record value for this
counter from its previous value, right-click on the
counter and choose Reset record… from the popup
menu.
A red alert on this counter is almost always an
indication that a storm is nearby. It is not necessarily
an indicator that the storm is going to impact your
location, since the storm may be moving away from
you.
82
8282
82
Page 83
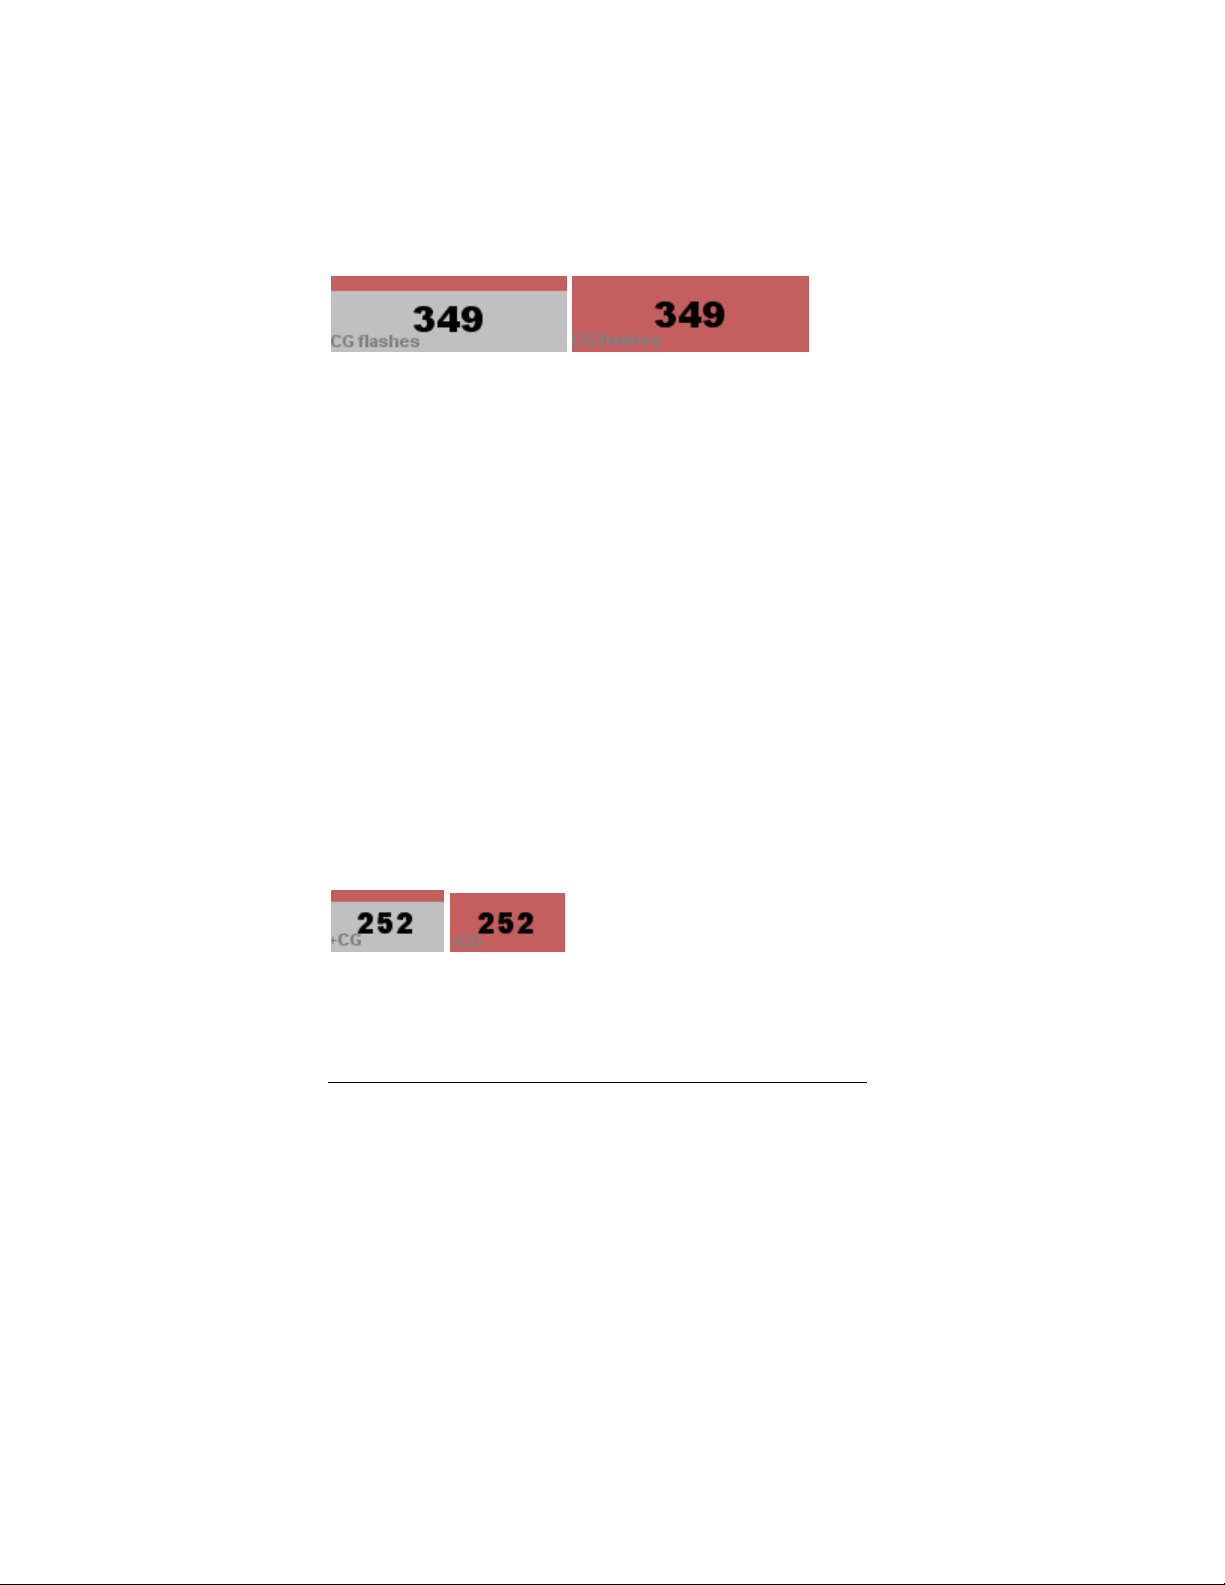
R E A L - T I M E L I G H T N I N G D E T E C T I O N
A new record value is denoted by swapping the colors
of the counter and its background.
CG Flash Rate Counter
The CG flash rate counter, shown with and without an alert bar.
Default yellow alert trigger level: 20
Default red alert trigger level: 100
Record kept: Yes
The CG flash rate counter shows the number of cloudto-ground flashes recorded in the last minute. A CG
flash is what is ordinarily thought of as a lightning bolt.
Each flash is composed of one or more (typically 3 to
10) strokes. Each of these strokes can be detected
by the lightning detector if the flash occurs closely
enough to the detector. For distant flashes, it is
normal to detect only the strongest stroke of the flash.
A new record value is denoted by swapping the colors
of the counter and the background.
This counter is not used with the LD-250.
Positive CG Flash Rate Counter
The +CG flash rate counter, shown with and without alert bars.
Default yellow alert trigger level: 25
Default red alert trigger level: 100
83
83
8383
Page 84
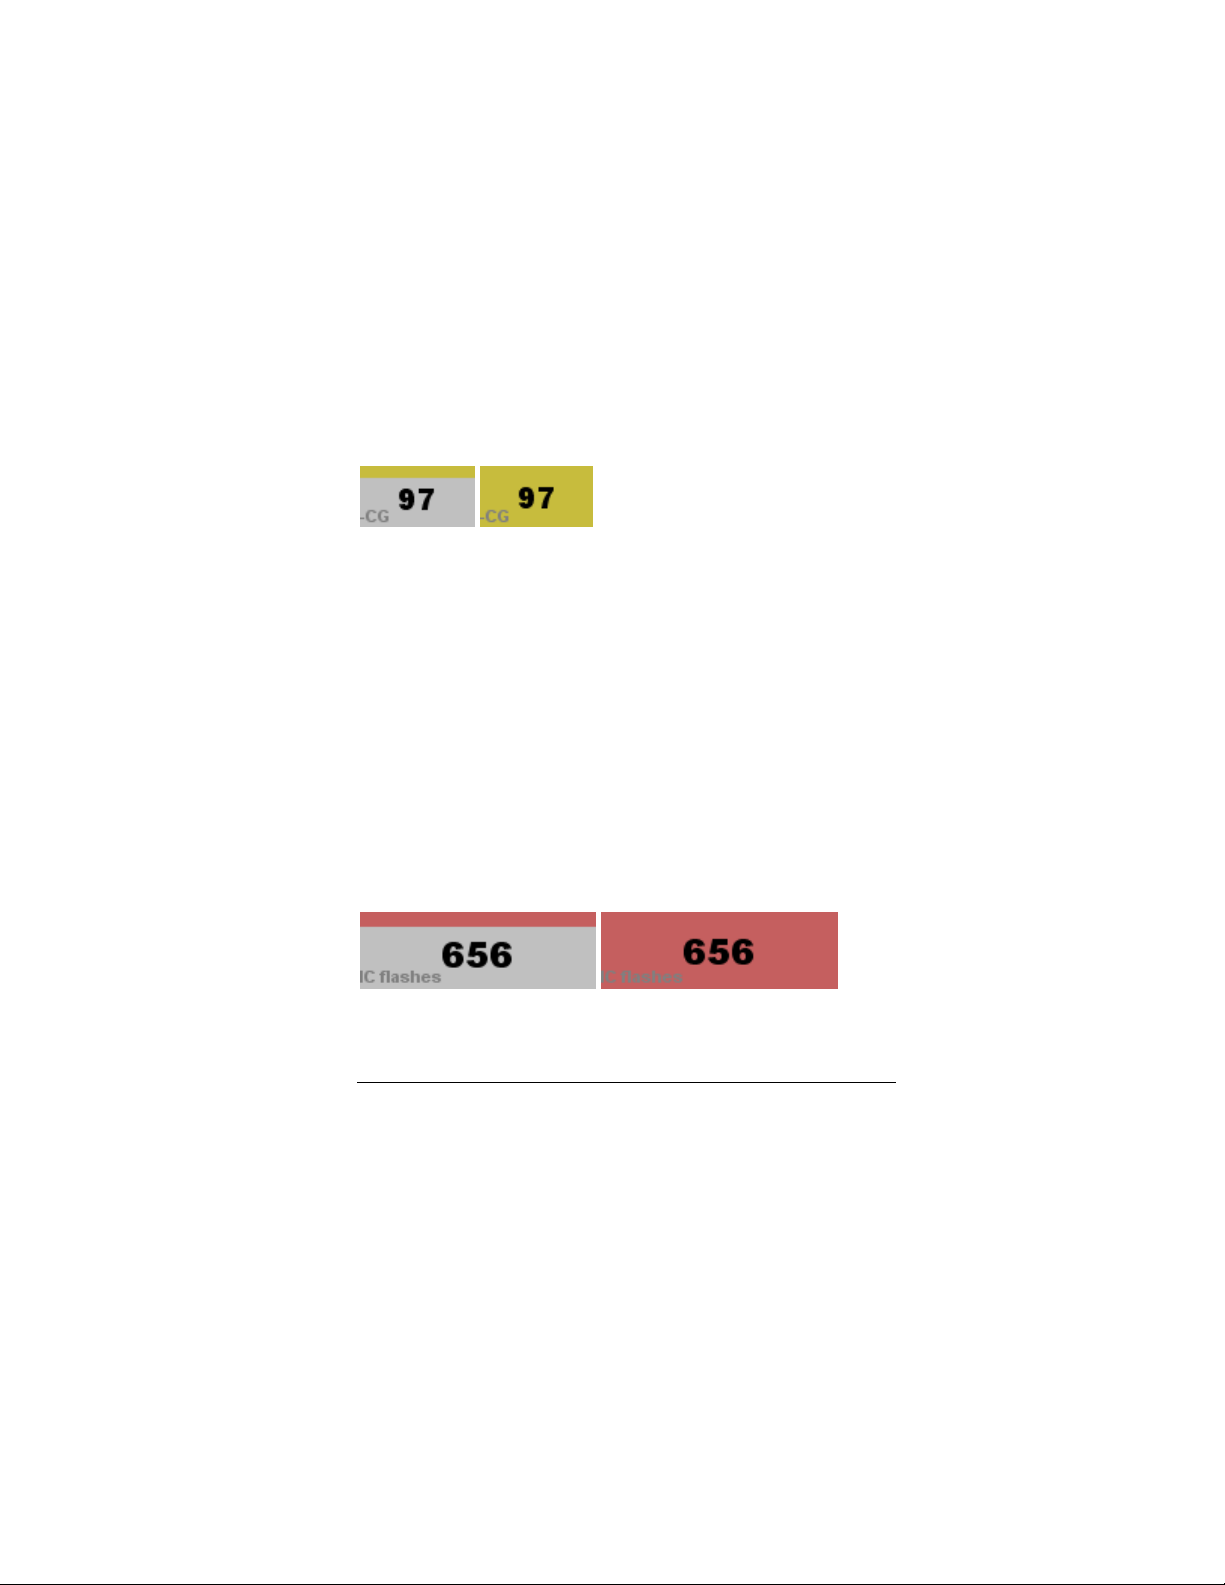
L I G H T N I N G / 2 0 0 0
Record kept: Yes
The +CG flash rate counter shows the number of
positive cloud-to-ground strokes in the last minute.
Positive CG strokes are more common in severe
storms.
A new record value is denoted by swapping the colors
of the counter and the background.
This counter is not used with the LD-250.
Negative CG Flash Rate Counter
The -CG flash rate counter, shown with and without alert bars.
Default yellow alert trigger level: 25
Default red alert trigger level: 100
Record kept: Yes
The -CG flash rate counter shows the number of
positive cloud-to-ground strokes in the last minute.
A new record value is denoted by swapping the colors
of the counter and the background.
This counter is not used with the LD-250.
IC Flash Rate Counter
The IC flash rate counter, shown with and without an alert bar.
Default yellow alert trigger level: 2
84
84
8484
Page 85
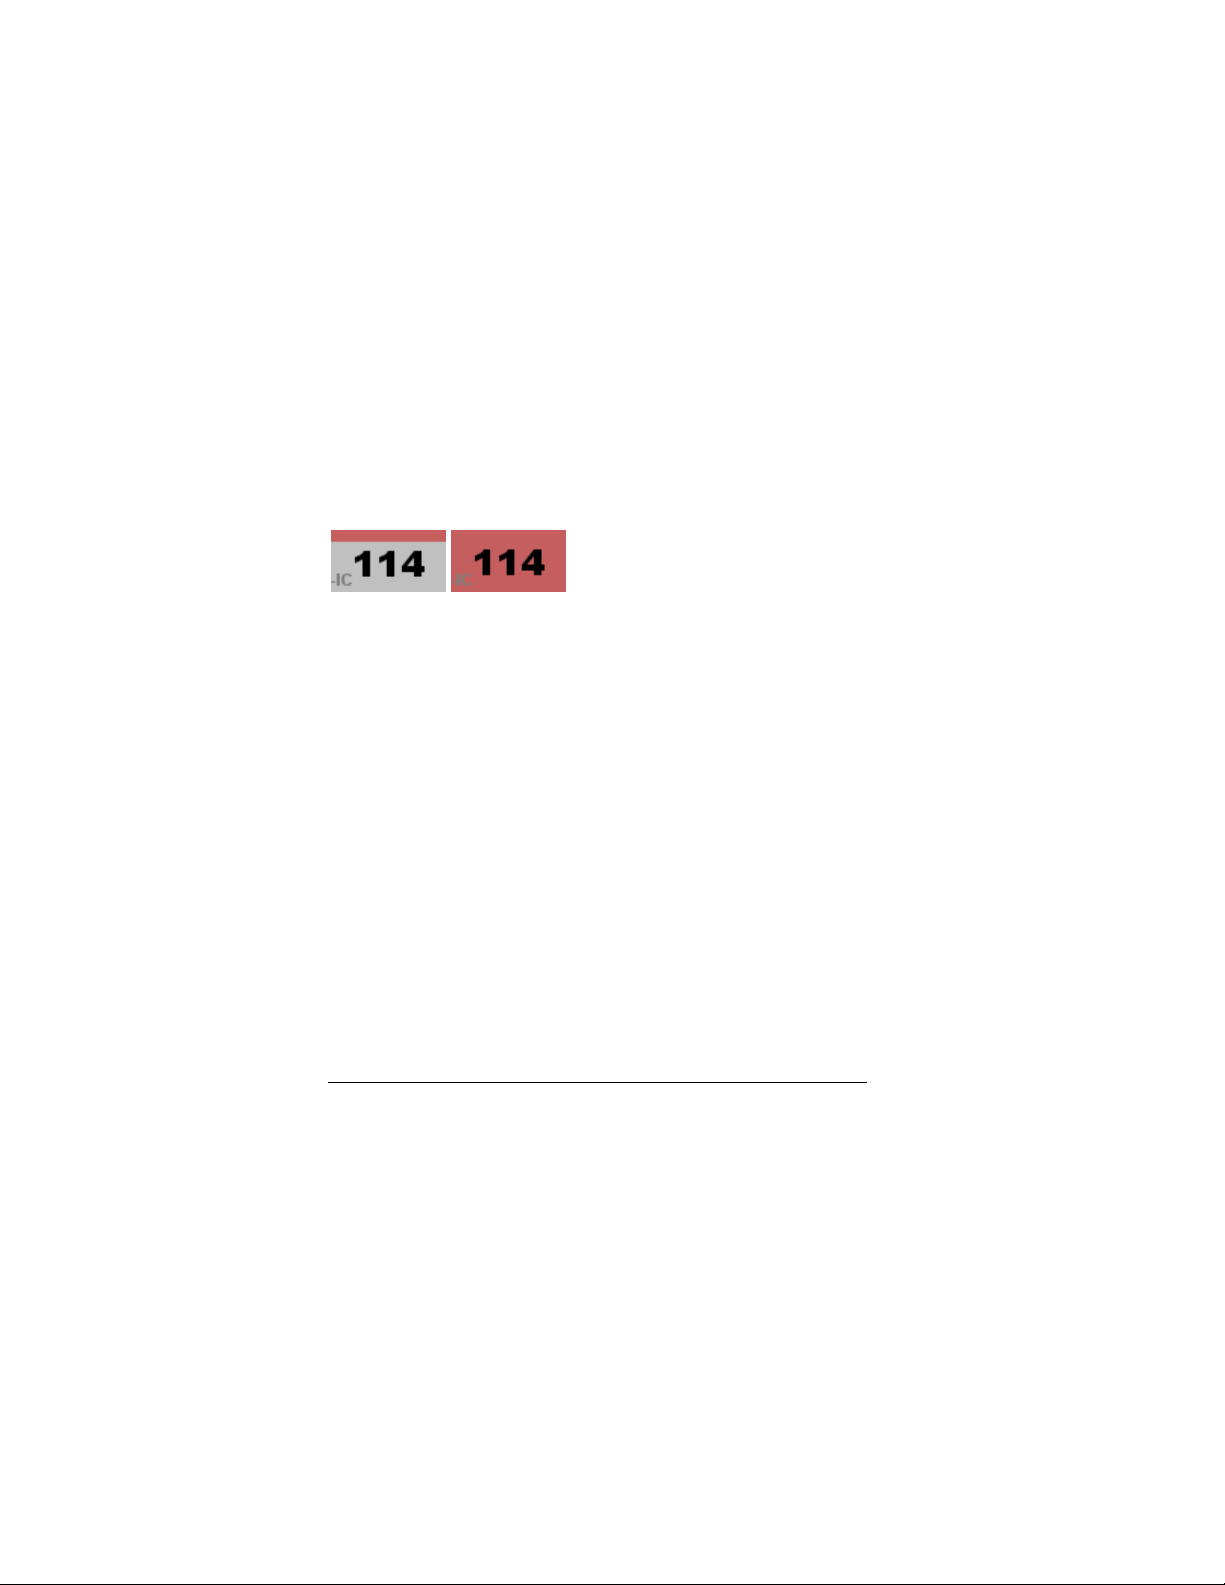
R E A L - T I M E L I G H T N I N G D E T E C T I O N
Default red alert trigger level: 10
Record kept: Yes
The IC flash rate counter shows the number of
intercloud flashes in the last minute.
Each flash is composed of at least one stroke, but IC
flashes have been observed to be comprised of 30 or
more strokes during nearby storms.
A new record value is denoted by swapping the colors
of the counter and the background.
This counter is not used with the LD-250.
Negative IC Flash Rate Counter
The -IC flash rate counter, shown with and without an alert bar.
Default yellow alert trigger level: 25
Default red alert trigger level: 100
Record kept: Yes
The -IC flash rate counter shows the number of
negative intercloud flashes in the last minute. A
correlation between –IC flashes and storm severity
has been observed.
Each flash is composed of at least one stroke, but IC
flashes have been observed to be comprised of 30 or
more strokes during nearby storms.
A new record value is denoted by swapping the colors
of the counter and the background.
This counter is not used with the LD-250.
85
85
8585
Page 86
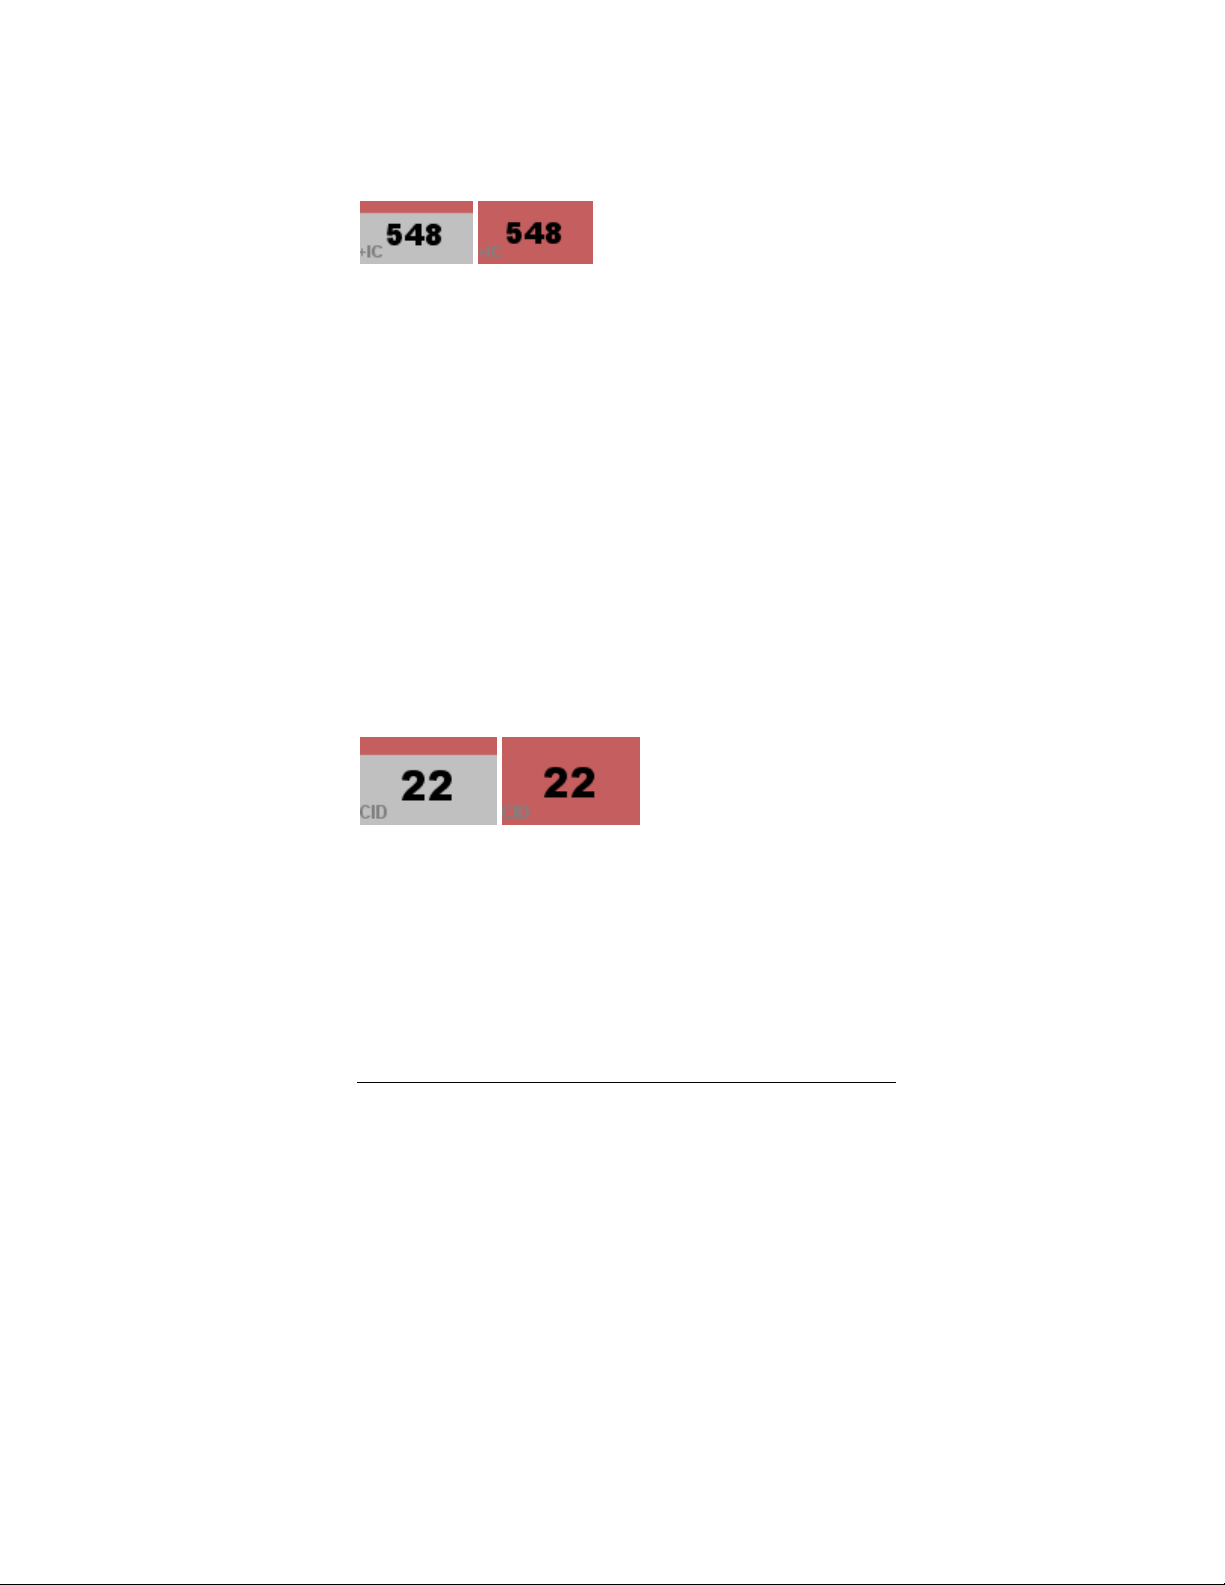
L I G H T N I N G / 2 0 0 0
Positive IC Flash Rate Counter
The +IC flash rate counter, shown with and without an alert bar.
Default yellow alert trigger level: 25
Default red alert trigger level: 100
Record kept: Yes
The +IC flash rate counter shows the number of
positive intercloud flashes in the last minute.
Each flash is composed of at least one stroke, but IC
flashes have been observed to be comprised of 30 or
more strokes during nearby storms.
A new record value is denoted by swapping the colors
of the counter and the background.
This counter is not used with the LD-250.
CID Stroke Rate Counter
The CID stroke rate counter, shown with and without an alert bar.
Default yellow alert trigger level: 2
Default red alert trigger level: 10
Record kept: Yes
The CID stroke rate counter shows the number of
compact intercloud discharges recorded in the last
minute. The CID stroke is discussed in more detail in
Appendix A, A Lightning Primer.
86
86
8686
Page 87

R E A L - T I M E L I G H T N I N G D E T E C T I O N
CID strokes are only detected from relatively nearby
storms, those within 150 miles or 250 km. It is rare to
see more than a single CID stroke in a minute from a
storm that is more than 100 miles or 150 km away. A
CID stroke rate of 5 or more is a very good sign that a
storm is relatively nearby. On rare occasions, it is
possible to see CID strokes from more distant storms.
A new record value is denoted by swapping the colors
of the counter and the background.
Since CID strokes are strokes and not flashes (they
are components of flashes), the will not be displayed if
you are viewing flashes in the Real-time Lightning
window or Raw Lightning Data window.
You may view strokes in the Raw Lightning Data
window. Right-click in the window and choose
"Settings..." from the popup menu to select the "View |
Strokes" option.
This counter is not used with the LD-250.
The Percent Counters
Since these counters’ alarms are not based on stroke rates, but
on percentages, it is possible to see yellow and even red alerts
triggered for these counters even with no lightning activity
within several hundred miles. For example, a distant severe
storm is likely to have an abundance of positive CG strokes
over negative CG strokes – a condition that would trigger an
alert on the “+CG%” counter.
When in flash mode (rather than stroke mode), the percent
counters indicate the percentage of flashes rather than
strokes.
87
87
8787
Page 88
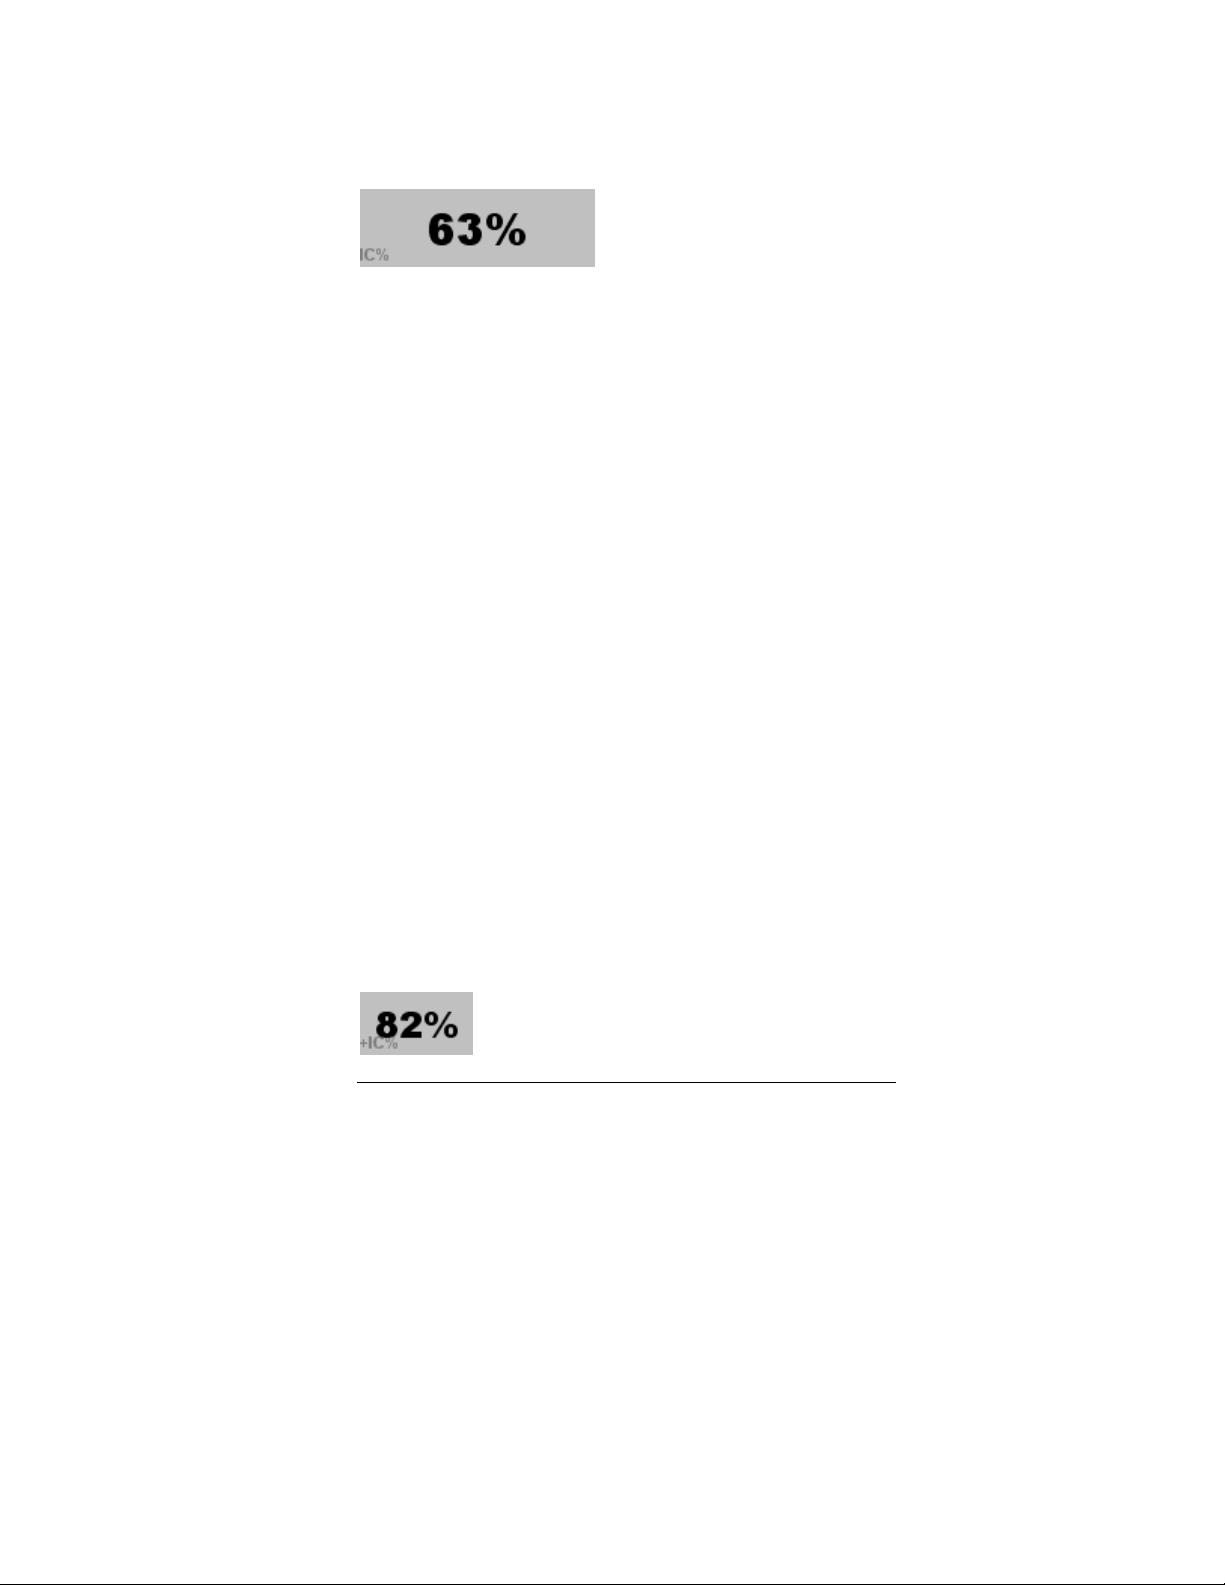
L I G H T N I N G / 2 0 0 0
IC Percent Counter
No alarm is associated with the IC percent counter.
Record kept: No
The IC percent counter shows the percentage of IC
(intercloud/intracloud) strokes compared to the total
number of strokes in the last minute. CID (compact
intercloud discharge) strokes are included as IC
strokes.
For example, if the stroke rate is 200 and the IC
stroke rate is 50, this counter would indicate “25%”.
IC strokes are more commonly detected from
relatively nearby storms (within 250 km or 150 miles).
As a storm approaches, the percentage of IC strokes
will typically rise. However, it depends a lot on the
nature of the storm. For this reason, there is no
longer an alarm associated with the IC percent
counter.
When running Lightning/2000 in flash mode, this
counter shows the percentage of IC flashes, rather
than strokes.
At least 10 strokes per minute must occur before the
red or yellow alert is triggered.
This counter is not used with the LD-250.
Positive IC Percent Counter
The +IC percent counter has no alarms associated with it.
88
88
8888
Page 89

R E A L - T I M E L I G H T N I N G D E T E C T I O N
Record kept: No
The positive IC percent counter shows the percentage
of +IC (positive intercloud/intracloud) strokes
compared to the number of IC strokes in the last
minute.
For example, if the IC stroke rate is 50 and the +IC
stroke rate is 40, this counter would indicate “80%”.
IC strokes are more commonly detected from
relatively nearby storms (within 250 km or 150 miles).
As a storm approaches, the percentage of IC strokes
will typically rise.
When running Lightning/2000 in flash mode, this
counter shows the percentage of +IC flashes, rather
than strokes.
+IC strokes are the more common type of IC stroke
detected.
This counter is not used with the LD-250.
Negative IC Percent Counter
The –IC percent counter has no alarms associated with it.
Record kept: No
The negative IC percent counter shows the
percentage of -IC (negative intercloud/intracloud)
strokes compared to the number of IC strokes in the
last minute.
IC strokes are more commonly detected from
relatively nearby storms (within 250 km or 150 miles).
89
89
8989
Page 90
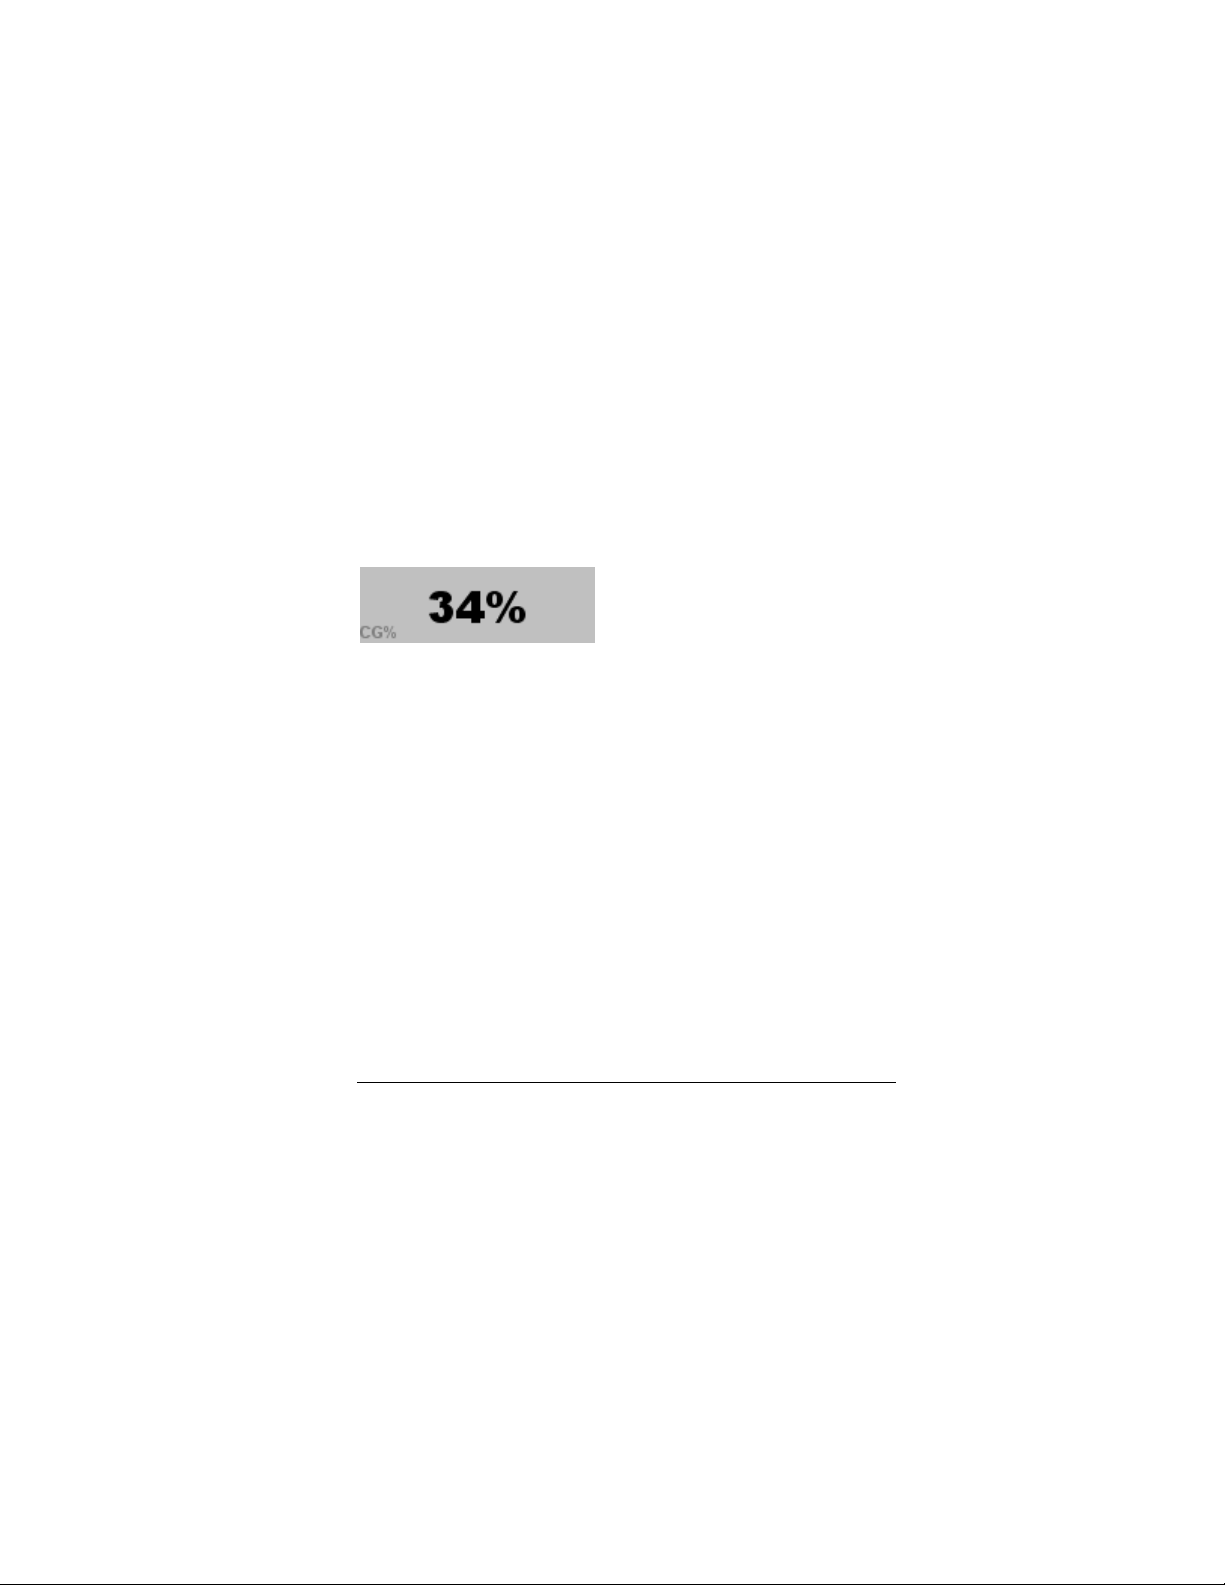
L I G H T N I N G / 2 0 0 0
As a storm approaches, the percentage of IC strokes
will typically rise.
-IC strokes are the less common type of IC stroke
detected. A preponderance of –IC stroke versus +IC
strokes is a trait commonly associated with severe
storms.
When running Lightning/2000 in flash mode, this
counter shows the percentage of -IC flashes, rather
than strokes.
At least 10 IC strokes per minute must occur before
the red or yellow alert is triggered.
This counter is not used with the LD-250.
CG Percent Counter
The CG percent counter has no alarms associated with it.
Record kept: No
The CG percent counter shows the percentage of CG
(cloud-to-ground) strokes compared to the total
number of strokes in the last minute.
For example, if the stroke rate is 100 and the CG
stroke rate is 75, this counter would indicate “75%”.
CG strokes can be detected from storms at any
range, and have been detected from storms over 600
miles (1000 km) away.
When running Lightning/2000 in flash mode, this
counter shows the percentage of CG flashes, rather
than strokes.
This counter is not used with the LD-250.
90
90
9090
Page 91

R E A L - T I M E L I G H T N I N G D E T E C T I O N
Positive CG Percent Counter
The +CG percent counter, shown with and without an alert bar.
Default yellow alert trigger level: 25
Default red alert trigger level: 50
Record kept: No
The positive CG percent counter shows the
percentage of +CG (positive cloud-to-ground) strokes
compared to the number of CG strokes in the last
minute.
For example, if the stroke rate is 50 and the CG
stroke rate is 45, this counter would indicate “90%”.
CG strokes can be detected from storms at any
range, and have been detected from storms over 600
miles (1000 km) away.
+CG strokes are the less common type of CG stroke,
and are associated more with severe storms, though
they do occur in ordinary storms too. They have been
observed to be more likely to occur in the average
thunderstorm as the storm begins to dissipate.
In the Analysis window, storms that have a
preponderance of +CG strokes are colored in.
When running Lightning/2000 in flash mode, this
counter shows the percentage of +CG flashes, rather
than strokes.
At least 10 CG strokes per minute must occur before
the red or yellow alert is triggered.
This counter is not used with the LD-250.
91
91
9191
Page 92

L I G H T N I N G / 2 0 0 0
Negative CG Percent Counter
There are no alarms associated with the –CG percent counter.
Record kept: No
The negative CG percent counter shows the
percentage of -CG (negative cloud-to-ground) strokes
compared to the number of CG strokes in the last
minute.
For example, if the CG stroke rate is 40 and the –CG
stroke rate is 20, then this counter would indicate
“50%”.
CG strokes can be detected from storms at any
range, and have been detected from storms over 600
miles (1000 km) away.
When running Lightning/2000 in flash mode, this
counter shows the percentage of -CG flashes, rather
than strokes.
-CG strokes are the more common type of CG stroke.
This counter is not used with the LD-250.
The Stroke Rate Counters
The alarm levels of the stroke rate counters are set by default
so that yellow alerts can be triggered by storms that are still
moderately far away. Red alerts on these counters will not
normally be triggered until a storm is either fairly nearby, or is
extremely intense and more distant.
92
92
9292
Page 93
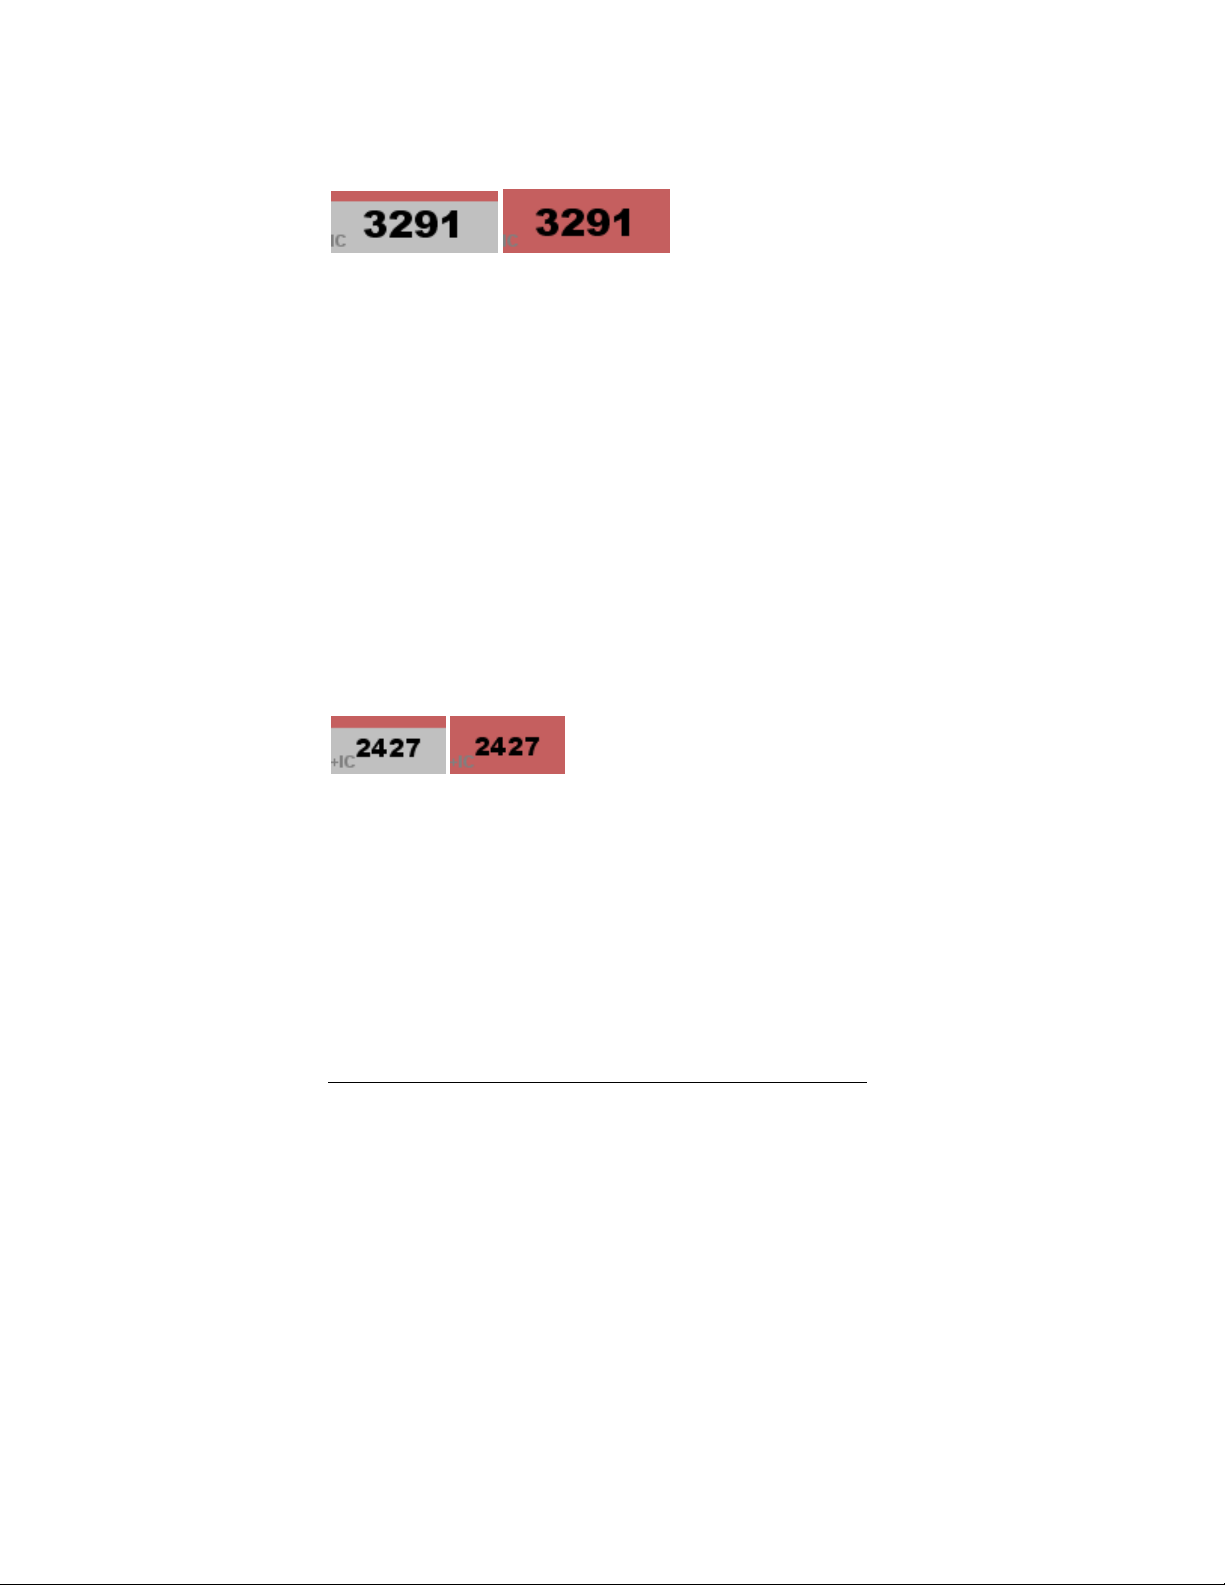
R E A L - T I M E L I G H T N I N G D E T E C T I O N
IC Stroke Rate Counter
The IC stroke rate counter, shown with and without an alert bar.
Default yellow alert trigger level: 50
Default red alert trigger level: 250
Record kept: Yes
The IC stroke rate counter shows the number of IC
(intercloud/intracloud) strokes that have been
detected in the last minute. CID (compact intercloud
discharge) strokes are included in this total.
IC strokes are more easily detected from storms that
are relatively nearby (within 150 km or 250 miles).
A new record value is denoted by swapping the colors
of the counter and its background.
This counter is not used with the LD-250.
Positive IC Stroke Rate Counter
The +IC stroke rate counter, shown with and without an alert bar.
Default yellow alert trigger level: 30
Default red alert trigger level: 150
Record kept: Yes
The positive IC stroke rate counter shows the number
of +IC (positive intercloud/intracloud) strokes that
have been detected in the last minute.
IC strokes are more easily detected from relatively
nearby storms (within 250 km or 150 miles).
93
93
9393
Page 94
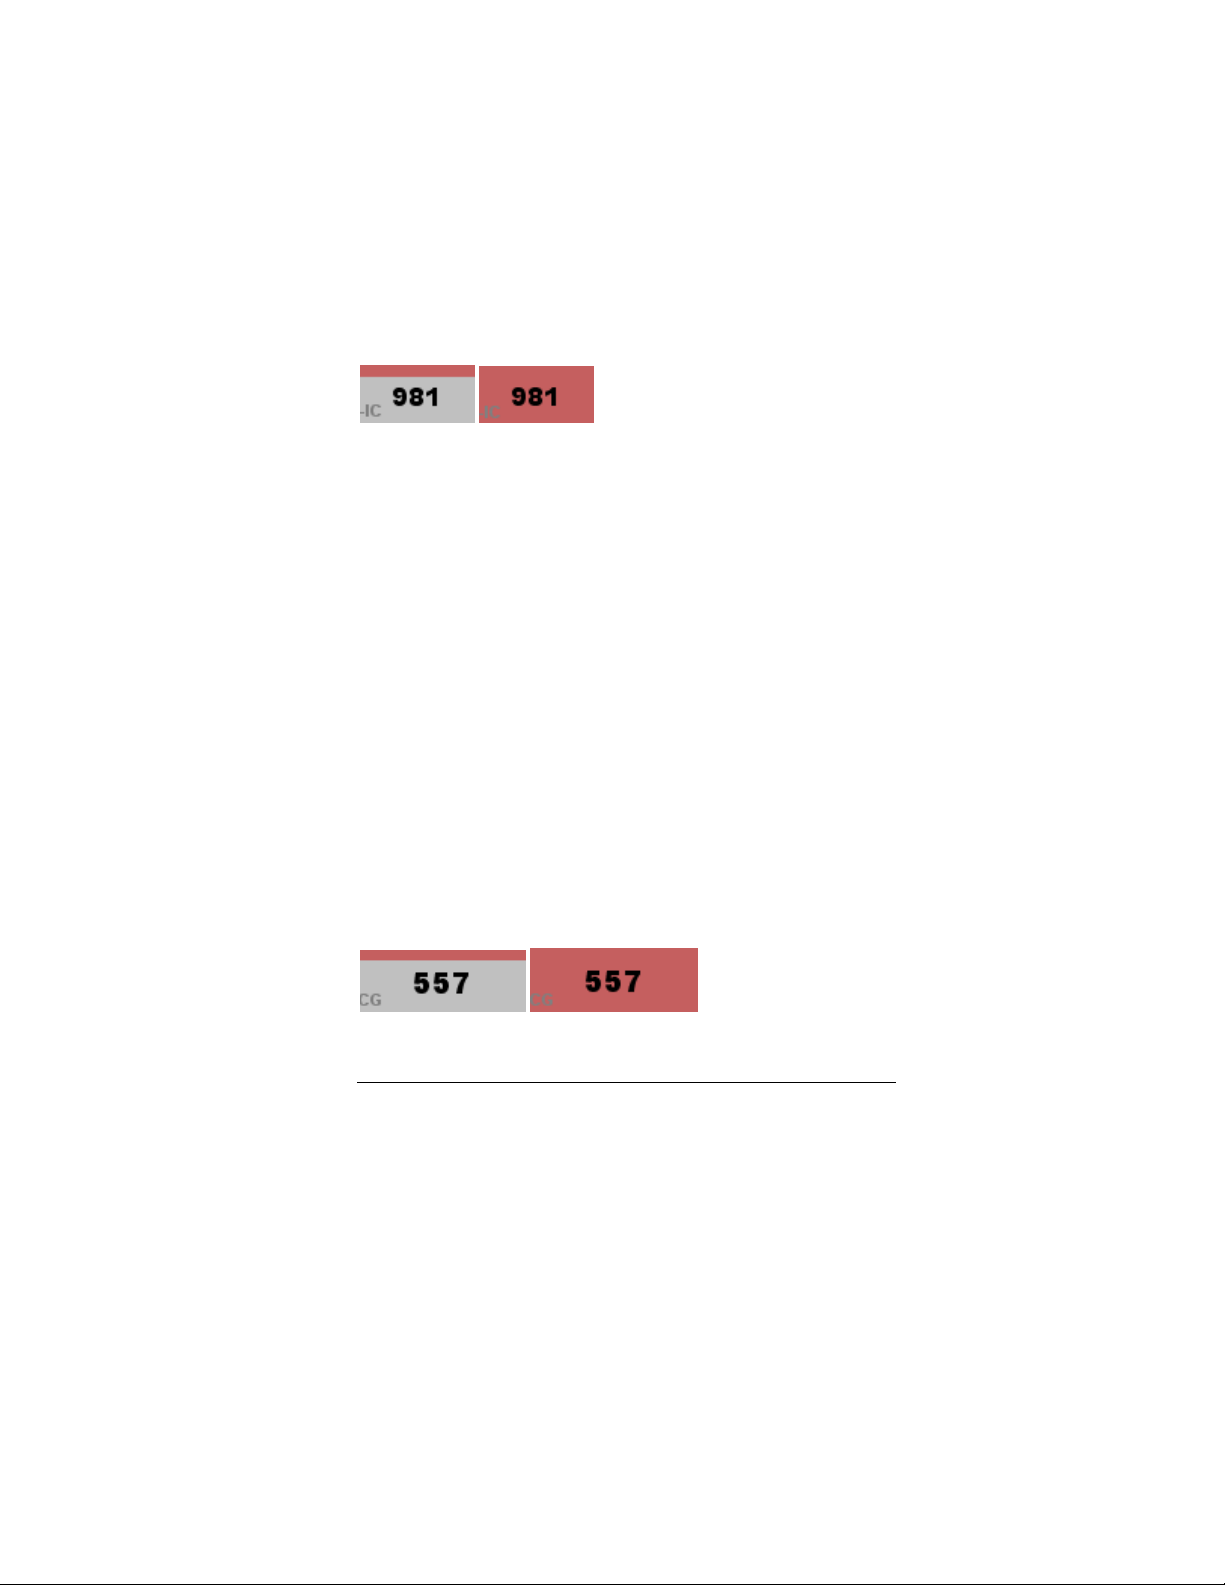
L I G H T N I N G / 2 0 0 0
Positive IC strokes are the more common type of IC
strokes.
A new record value is denoted by swapping the colors
of the counter and its background.
This counter is not used with the LD-250.
Negative IC Stroke Rate Counter
The –IC stroke rate counter, shown with and without an alert bar.
Default yellow alert trigger level: 30
Default red alert trigger level: 150
Record kept: Yes
The negative IC stroke rate counter shows the
number of -IC (negative intercloud/intracloud) strokes
that have been detected in the last minute.
IC strokes are more easily detected from relatively
nearby storms (within 250 km or 150 miles).
Negative IC strokes are the less common type of IC
strokes. A preponderance of –IC stroke versus +IC
strokes has been associated with severe storms.
A new record value is denoted by swapping the colors
of the counter and its background.
This counter is not used with the LD-250.
CG Stroke Rate Counter
The CG stroke rate counter, shown with and without an alert bar.
Default yellow alert trigger level: 40
94
94
9494
Page 95
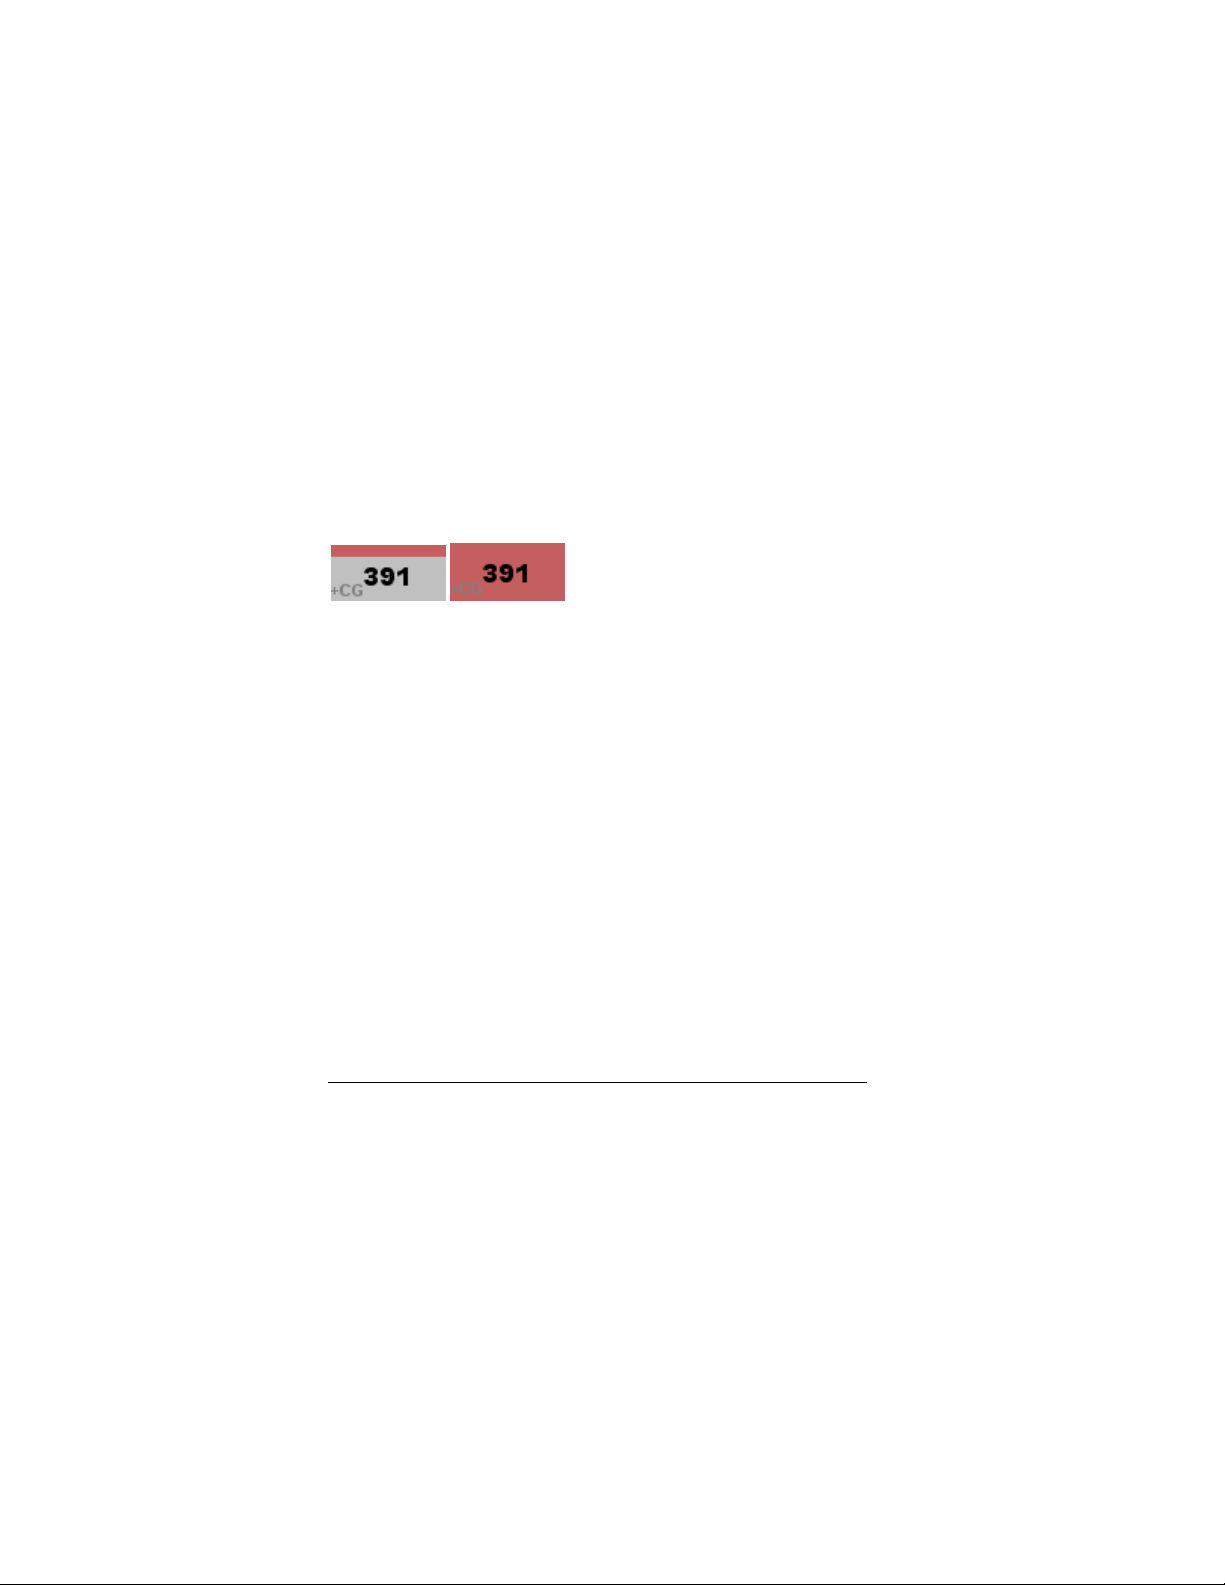
R E A L - T I M E L I G H T N I N G D E T E C T I O N
Default red alert trigger level: 200
Record kept: Yes
The CG stroke rate counter shows the number of CG
(cloud-to-ground) strokes that have been detected in
the last minute.
CG strokes can be detected from storms at any
range, and have been detected over 600 miles (1000
km) away.
A new record value is denoted by swapping the colors
of the counter and its background.
This counter is not used with the LD-250.
Positive CG Stroke Rate Counter
The +CG stroke rate counter, shown with and without an alert counter.
Default yellow alert trigger level: 20
Default red alert trigger level: 100
Record kept: Yes
The positive CG stroke rate counter shows the
number of +CG (positive cloud-to-ground) strokes that
have been detected in the last minute.
CG strokes can be detected from storms at any
range, and have been detected over 600 miles (1000
km) away.
+CG strokes are more common in severe storms.
A new record value is denoted by swapping the colors
of the counter and its background.
This counter is not used with the LD-250.
95
95
9595
Page 96

L I G H T N I N G / 2 0 0 0
Negative CG Stroke Rate Counter
The –CG stroke rate counter, shown with and without an alert bar.
Default yellow alert trigger level: 10
Default red alert trigger level: 50
Record kept: Yes
The negative CG stroke rate counter shows the
number of -CG (negative cloud-to-ground) strokes
that have been detected in the last minute.
CG strokes can be detected from storms at any
range, and have been detected over 600 miles (1000
km) away.
-CG strokes are the most common type of CG stroke.
A new record value is denoted by swapping the colors
of the counter and its background.
This counter is not used with the LD-250.
The Stroke Rate Change Counters
The default configuration does not display the stroke subtype
rate change counters. If you want to view these counters,
resize the Rates window by dragging its bottom edge
downward. You may need to make the stroke subtype rate
change counters visible by selecting them on the Counters
menu. Make them visible by choosing the counter on the
Counters | Percent changes menu.
These counters, though little used by most, can be used to
glean information about how a storm is behaving, particularly
if the stroke rates are high enough. The decision to make
96
96
9696
Page 97
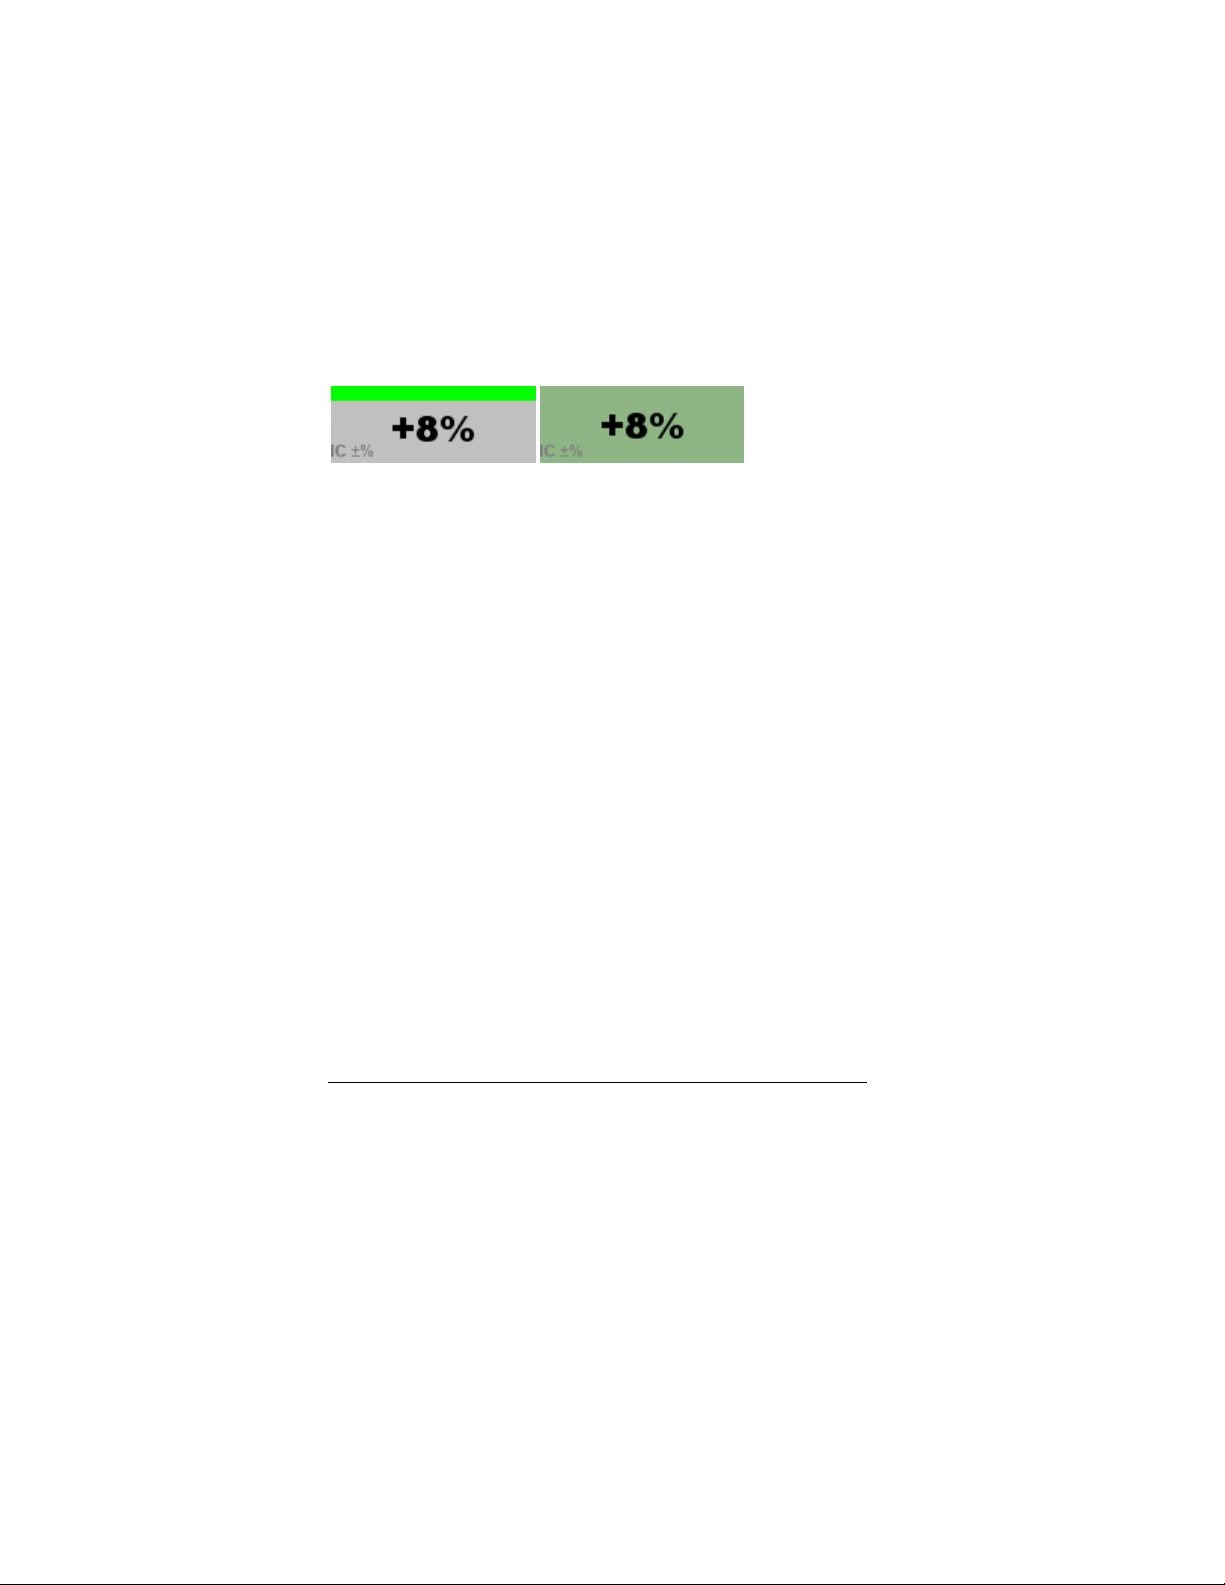
R E A L - T I M E L I G H T N I N G D E T E C T I O N
these counters invisible by default was made after realizing
that there were already more than enough counters for most
users to watch during a storm.
When Lightning/2000 is in flash mode (as opposed to stroke
mode), these counters show the rate of change in the number
of flashes instead of the number of strokes.
IC Stroke Rate Change Counter
The IC stroke rate change counter, shown with and without an alert bar.
Default yellow alert trigger level: 25
Default red alert trigger level: 50
Record kept: No
The IC stroke rate change counter shows the
percentage change in the IC (intercloud/intracloud)
stroke rate between one minute ago and now.
For example, if the IC stroke rate one minute ago was
1 and the IC stroke rate now is 3, then this counter
would indicate “+200%”.
If the stroke rate one minute ago was zero, and the
current stroke rate is zero, "--" is displayed. If the
stroke rate one minute ago was zero, and the current
stroke rate is non-zero, "*" is displayed.
A sudden change in the IC stroke rate may signal a
change in the character of a storm and could indicate
behavior that needs to be monitored.
When you specify a trigger level for the red or yellow
alert, you are specifying the percentage change that
must occur if the IC stroke rate is 100 strokes per
minute. The percentage change that is needed for
97
9797
97
Page 98
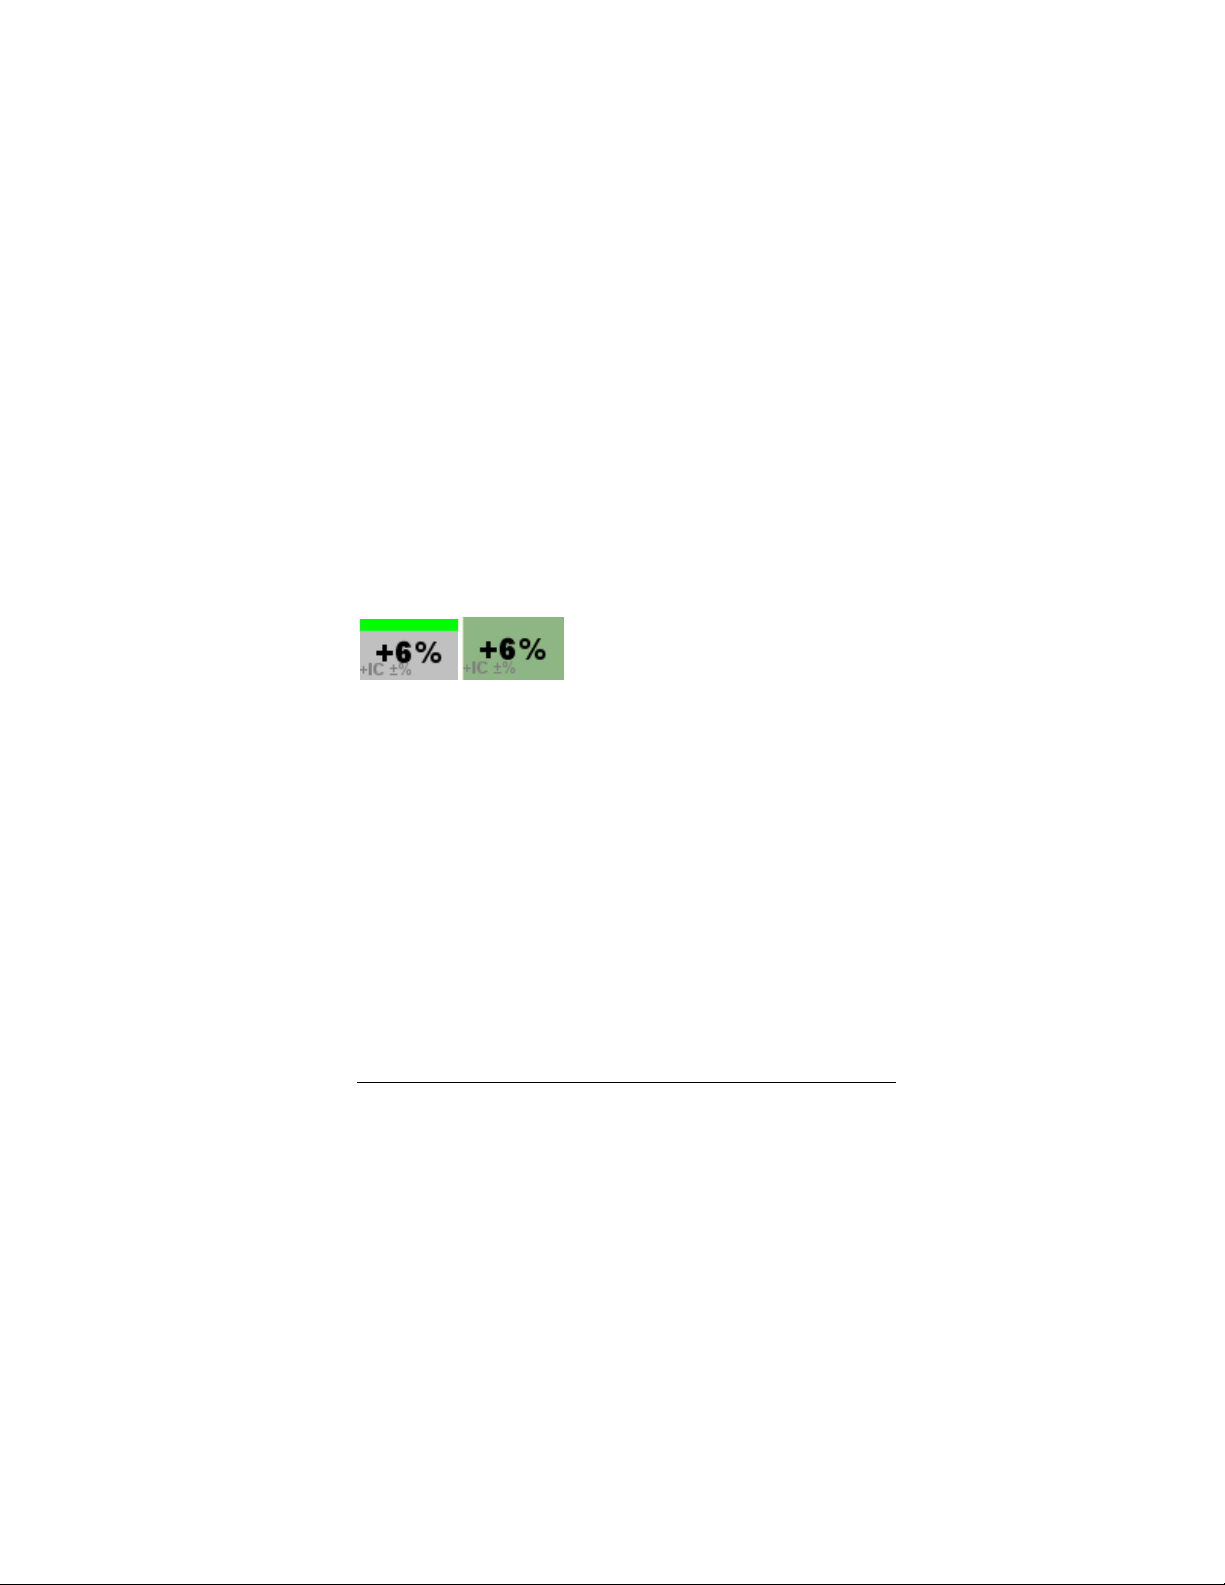
L I G H T N I N G / 2 0 0 0
alert status at higher stroke rates is somewhat lower,
and the percentage change that is needed for alert
status at lower stroke rates is higher.
At 1000 strokes per minute, the percentage change
required for an alert is one-half the value specified as
the trigger level. At 10 strokes per minute, the
percentage change required is twice the specified
trigger level.
When Lightning/2000 is in flash mode, this counter
shows the change in the IC flash rate.
At least 10 IC strokes per minute, both currently and
one minute ago, must occur for the yellow or red alert
to be triggered.
This counter is not used with the LD-250.
Positive IC Stroke Rate Change Counter
The +IC stroke rate change counter, shown with and without an alert bar.
Default yellow alert trigger level: 25
Default red alert trigger level: 50
Record kept: No
This counter shows the percentage change in the +IC
positive intercloud/intracloud) stroke rate between one
minute ago and now.
If the stroke rate one minute ago was zero, and the
current stroke rate is zero, "--" is displayed. If the
stroke rate one minute ago was zero, and the current
stroke rate is non-zero, "*" is displayed.
98
98
9898
Page 99
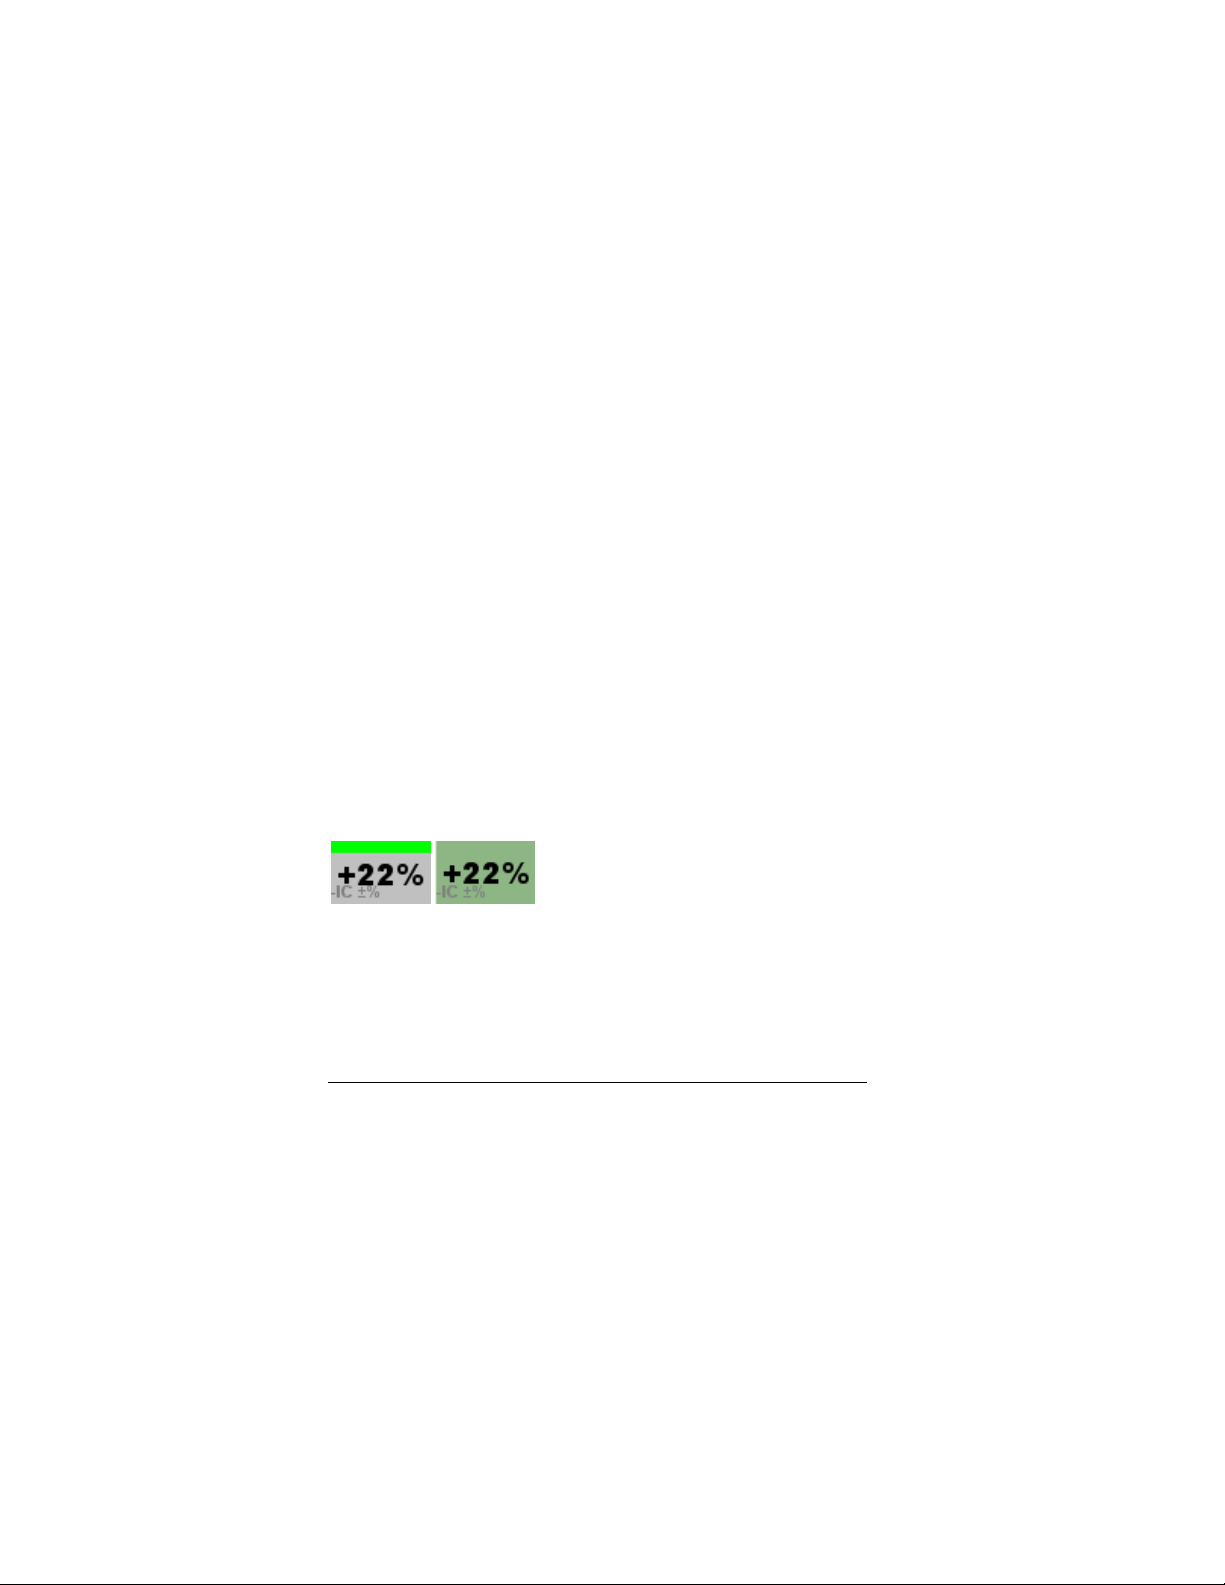
R E A L - T I M E L I G H T N I N G D E T E C T I O N
A sudden change in the +IC stroke rate may signal a
change in the character of a storm and could indicate
behavior that needs to be monitored.
When you specify a trigger level for the red or yellow
alert, you are specifying the percentage change that
must occur if the +IC stroke rate is 100 strokes per
minute. The percentage change that is needed for
alert status at higher stroke rates is somewhat lower,
and the percentage change that is needed for alert
status at lower stroke rates is higher.
At 1000 strokes per minute, the percentage change
required for an alert is one-half the value specified as
the trigger level. At 10 strokes per minute, the
percentage change required is twice the specified
trigger level.
When Lightning/2000 is in flash mode, this counter
shows the change in the +IC flash rate.
At least 10 +IC strokes per minute, both currently and
one minute ago, must occur for the yellow or red alert
to be triggered.
This counter is not used with the LD-250.
Negative IC Stroke Rate Change
Counter
The –IC stroke rate change counter, shown with and without an alert bar.
Default yellow alert trigger level: 25
Default red alert trigger level: 50
Record kept: No
99
9999
99
Page 100

L I G H T N I N G / 2 0 0 0
This counter shows the percentage change in the -IC
(negative intercloud/intracloud) stroke rate between
one minute ago and now.
If the stroke rate one minute ago was zero, and the
current stroke rate is zero, "--" is displayed. If the
stroke rate one minute ago was zero, and the current
stroke rate is non-zero, "*" is displayed.
A sudden change in the -IC stroke rate may signal a
change in the character of a storm and could indicate
behavior that needs to be monitored.
When you specify a trigger level for the red or yellow
alert, you are specifying the percentage change that
must occur if the -IC stroke rate is 100 strokes per
minute. The percentage change that is needed for
alert status at higher stroke rates is somewhat lower,
and the percentage change that is needed for alert
status at lower stroke rates is higher.
At 1000 strokes per minute, the percentage change
required for an alert is one-half the value specified as
the trigger level. At 10 strokes per minute, the
percentage change required is twice the specified
trigger level.
When Lightning/2000 is in flash mode, this counter
shows the change in the -IC flash rate.
At least 10 -IC strokes per minute, both currently and
one minute ago, must occur for the yellow or red alert
to be triggered.
This counter is not used with the LD-250.
100
100
100100
 Loading...