Blue Coat Systems SG Appliance, Managing the Blue Coat SG Appliance User Manual

Blue Coat® Systems
SG™ Appliance
Volume 9: Managing the Blue Coat SG Appliance
SGOS Version 5.2.2

Contact Information
Blue Coat Systems Inc.
420 North Mary Ave
Sunnyvale, CA 94085-4121
http://www.bluecoat.com/support/contact.html
bcs.info@bluecoat.com
http://www.bluecoat.com
For concerns or feedback about the documentation: documentation@bluecoat.com
Copyright© 1999-2007 Blue Coat Systems, Inc. All rights reserved worldwide. No part of this document may be reproduced by any means
nor modified, decompiled, disassembled, published or distributed, in whole or in part, or translated to any electronic medium or other
means without the written consent of Blue Coat Systems, Inc. All right, title and interest in and to the Software and documentation are and
shall remain the exclusive property of Blue Coat Systems, Inc. and its licensors. ProxyAV™, CacheOS™, SGOS™, SG™, Spyware
Interceptor™, Scope™, RA Connector™, RA Manager™, Remote Access™ and MACH5™ are trademarks of Blue Coat Systems, Inc. and
CacheFlow®, Blue Coat®, Accelerating The Internet®, ProxySG®, WinProxy®, AccessNow®, Ositis®, Powering Internet Management®,
The Ultimate Internet Sharing Solution®, Cerberian®, Permeo®, Permeo Technologies, Inc.®, and the Cerberian and Permeo logos are
registered trademarks of Blue Coat Systems, Inc. All other trademarks contained in this document and in the Software are the property of
their respective owners.
BLUE COAT SYSTEMS, INC. DISCLAIMS ALL WARRANTIES, CONDITIONS OR OTHER TERMS, EXPRESS OR IMPLIED,
STATUTORY OR OTHERWISE, ON SOFTWARE AND DOCUMENTATION FURNISHED HEREUNDER INCLUDING WITHOUT
LIMITATION THE WARRANTIES OF DESIGN, MERCHANTABILITY OR FITNESS FOR A PARTICULAR PURPOSE AND
NONINFRINGEMENT. IN NO EVENT SHALL BLUE COAT SYSTEMS, INC., ITS SUPPLIERS OR ITS LICENSORS BE LIABLE FOR
ANY DAMAGES, WHETHER ARISING IN TORT, CONTRACT OR ANY OTHER LEGAL THEORY EVEN IF BLUE COAT SYSTEMS,
INC. HAS BEEN ADVISED OF THE POSSIBILITY OF SUCH DAMAGES.
Document Number: 231-02846
Document Revision: SGOS 5.2.2—09/2007

Contents
Contact Information
Chapter 1: About Managing the SG Appliance
Document Conventions......................................................................................................................................7
Chapter 2: Monitoring the SG Appliance
Using Director to Manage SG Systems ............................................................................................................9
Setting up Director and SG Appliance Communication......................................................................11
Monitoring the System and Disks...................................................................................................................12
System Summary........................................................................................................................................12
Viewing System Environment Sensors...................................................................................................13
Viewing Disk Status...................................................................................................................................14
Viewing SSL Accelerator Card Information...........................................................................................15
Setting Up Event Logging and Notification..................................................................................................15
Configuring Which Events to Log...........................................................................................................15
Setting Event Log Size ...............................................................................................................................16
Enabling Event Notification .....................................................................................................................16
Syslog Event Monitoring...........................................................................................................................17
Viewing Event Log Configuration and Content....................................................................................18
Configuring SNMP ...........................................................................................................................................20
Enabling SNMP ..........................................................................................................................................20
Configuring SNMP Community Strings ................................................................................................21
Configuring SNMP Traps .........................................................................................................................22
Configuring Health Monitoring......................................................................................................................23
Health Monitoring Requirements............................................................................................................23
About the Health Monitoring Metric Types ..........................................................................................24
About Health Monitoring .........................................................................................................................24
About Health Monitoring Notification...................................................................................................26
About the General Metrics........................................................................................................................26
About the Licensing Metrics.....................................................................................................................26
About the Status Metrics...........................................................................................................................27
Changing Threshold and Notification Properties .................................................................................28
Getting A Quick View of the SG Appliance Health..............................................................................29
Viewing Health Monitoring Statistics.....................................................................................................30
Troubleshooting .........................................................................................................................................31
Chapter 3: Maintaining the SG Appliance
Restarting the SG Appliance............................................................................................................................33
Hardware and Software Restart Options ...............................................................................................33
Restoring System Defaults ...............................................................................................................................34
iii

Volume 9: Managing the Blue Coat SG Appliance
Restore-Defaults.........................................................................................................................................34
Factory-Defaults......................................................................................................................................... 35
Keep-Console.............................................................................................................................................. 35
Clearing the DNS Cache ..................................................................................................................................36
Clearing the Object Cache................................................................................................................................ 36
Clearing the Byte Cache ...................................................................................................................................37
Troubleshooting Tip .................................................................................................................................. 37
Clearing Trend Statistics .................................................................................................................................. 37
Upgrading the SG Appliance ..........................................................................................................................37
The SG Appliance 5.x Version Upgrade................................................................................................. 38
Troubleshooting Tip .................................................................................................................................. 40
Managing SG Appliance Systems...................................................................................................................40
Setting the Default Boot System ..............................................................................................................41
Locking and Unlocking SG Appliance Systems.................................................................................... 42
Replacing an SG Appliance System ........................................................................................................ 42
Deleting an SG Appliance System...........................................................................................................43
Disk Reinitialization .........................................................................................................................................43
Multi-Disk SG Appliances........................................................................................................................ 43
Single-Disk SG Appliance.........................................................................................................................44
Deleting Objects from the SG Appliance....................................................................................................... 44
Chapter 4: Diagnostics
Diagnostic Reporting (Service Information) ................................................................................................. 46
Sending Service Information Automatically..........................................................................................46
Managing the Bandwidth for Service Information............................................................................... 47
Configure Service Information Settings .................................................................................................48
Creating and Editing Snapshot Jobs .......................................................................................................50
Packet Capturing (the Job Utility) ..................................................................................................................52
PCAP File Name Format...........................................................................................................................52
Common PCAP Filter Expressions .........................................................................................................52
Configuring Packet Capturing.................................................................................................................53
Core Image Restart Options ............................................................................................................................ 57
Diagnostic Reporting (Heartbeats)................................................................................................................. 58
Diagnostic Reporting (CPU Monitoring)....................................................................................................... 59
Chapter 5: Statistics
Selecting the Graph Scale.................................................................................................................................61
Viewing Traffic Distribution Statistics ...........................................................................................................62
Understanding Chart Data .......................................................................................................................63
Refreshing the Data ...................................................................................................................................63
About Bypassed Bytes............................................................................................................................... 63
About the Default Service Statistics ........................................................................................................ 64
Viewing Bandwidth Usage or Gain ........................................................................................................64
Viewing Client Byte and Server Byte Traffic Distribution ..................................................................65
iv

Contents
Viewing Traffic History ...................................................................................................................................65
Understanding Chart Data .......................................................................................................................67
Refreshing the Data ...................................................................................................................................67
About Bypassed Bytes............................................................................................................................... 68
Viewing Bandwidth Usage or Gain or Client Byte and Server Byte Traffic History.......................68
Viewing the ADN History...............................................................................................................................68
Viewing Bandwidth Management Statistics.................................................................................................68
Viewing Protocol Statistics ..............................................................................................................................68
Viewing System Statistics ................................................................................................................................70
Resources Statistics....................................................................................................................................70
Contents Statistics......................................................................................................................................74
Event Logging Statistics............................................................................................................................75
Failover Statistics .......................................................................................................................................76
Active Sessions—Viewing Per-Connection Statistics.................................................................................. 76
Analyzing Proxied Sessions ..................................................................................................................... 77
Filtering the Display.................................................................................................................................. 83
Viewing HTML and XML Views of Proxied Sessions Data ................................................................ 84
Analyzing Bypassed Connections Statistics ..........................................................................................84
Filtering the Display.................................................................................................................................. 86
Viewing HTML and XML Views of Bypassed Connections Data......................................................87
Viewing Health Monitoring Statistics............................................................................................................87
Viewing Health Check Statistics..................................................................................................................... 87
Viewing the Access Log ...................................................................................................................................87
Viewing Advanced Statistics...........................................................................................................................87
Using the CLI show Command to View Statistics .......................................................................................88
Appendix A: Glossary
Index
v

Volume 9: Managing the Blue Coat SG Appliance
vi

Chapter 1: About Managing the SG Appliance
Volume 9: Managing the Blue Coat SG Appliance describes how to monitor the SG
appliance with SNMP (a brief introduction to Director is provided), event logging, or
health monitoring. It also describes common maintenance and troubleshooting tasks.
Discussed in this volume:
❐ Chapter 2: "Monitoring the SG Appliance"
❐ Chapter 3: "Maintaining the SG Appliance"
❐ Chapter 4: "Diagnostics"
❐ Chapter 5: "Statistics"
❐ Appendix A: "Glossary"
Document Conventions
The following section lists the typographical and Command Line Interface (CLI) syntax
conventions used in this manual.
Table 1-1. Document Conventions
Conventions Definition
Italics The first use of a new or Blue Coat-proprietary term.
Courier font Command line text that appears on your administrator workstation.
Courier Italics A command line variable that is to be substituted with a literal name or
value pertaining to the appropriate facet of your network system.
Courier Boldface
{} One of the parameters enclosed within the braces must be supplied
[] An optional parameter or parameters.
| Either the parameter before or after the pipe character can or must be
A Blue Coat literal to be entered as shown.
selected, but not both.
7

Volume 9: Managing the Blue Coat SG Appliance
8

Chapter 2: Monitoring the SG Appliance
This chapter describes the methods you can use to monitor your SG appliances,
including event logging, SNMP, and health monitoring. A brief introduction to Director
is also provided.
This chapter contains the following sections:
❐ “Using Director to Manage SG Systems” on page 9
❐ “Monitoring the System and Disks” on page 12
❐ “Setting Up Event Logging and Notification” on page 15
❐ “Configuring SNMP” on page 20
❐ “Configuring Health Monitoring” on page 23
Using Director to Manage SG Systems
Blue Coat Director allows you to manage multiple SG appliances, eliminating the need
to configure and control the appliances individually.
Director allows you to configure an SG appliance and then push that configuration out
to as many appliances as required. Director also allows you to delegate network and
content control to multiple administrators and distribute user and content policy across
a Content Delivery Network (CDN). With Director, you can:
❐ Reduce management costs by centrally managing all Blue Coat appliances.
❐ Eliminate the need to manually configure each remote SG appliance.
❐ Recover from system problems with configuration snapshots and recovery.
Automatically Registering the SG Appliance with Director
You can use the Blue Coat Director registration feature to automatically register the SG
appliance with a Blue Coat Director, thus enabling that Director to establish a secure
administrative session with the appliance. During the registration process, Director can
“lock out” all other administrative access to the appliance so that all configuration
changes are controlled and initiated by Director. This is useful if you want to control
access to the appliance or if you want to ensure that appliances receive the same
configuration.
The registration process is fully authenticated; the devices use their Blue Coat
appliance certificate or a shared secret (a registration password configured on Director)
to confirm identities before exchanging public keys. If the SG appliance has an
appliance certificate, that certificate is used to authenticate the SG appliance to Director
as an SSL client. If the SG appliance does not have an appliance certificate, you must
configure a registration secret on Director and specify that secret on the SG appliance.
Refer to the Blue Coat Director Configuration and Management Guide for more information
about specifying the shared secret.
9
Volume 9: Managing the Blue Coat SG Appliance
Note:
The Blue Coat appliance certificate is an X.509 certificate that contains the
hardware serial number of a specific SG device as the Common Name (CN) in the
subject field. Refer to the device authentication information in Volume 5: Advanced
Networking for more information about appliance certificates.
Director Registration Requirements
To register the appliance with Director, the SSH-Console service must be enabled. Director
registration will fail if the ssh-console has been disabled or deleted, or if the SSHv2 host
key has been removed.
Registering the SG Appliance with Director
Though usually initiated at startup (with the serial console setup), you can also configure
Director registration from the Management Console, as described in the following
procedure.
To register the appliance with a Director:
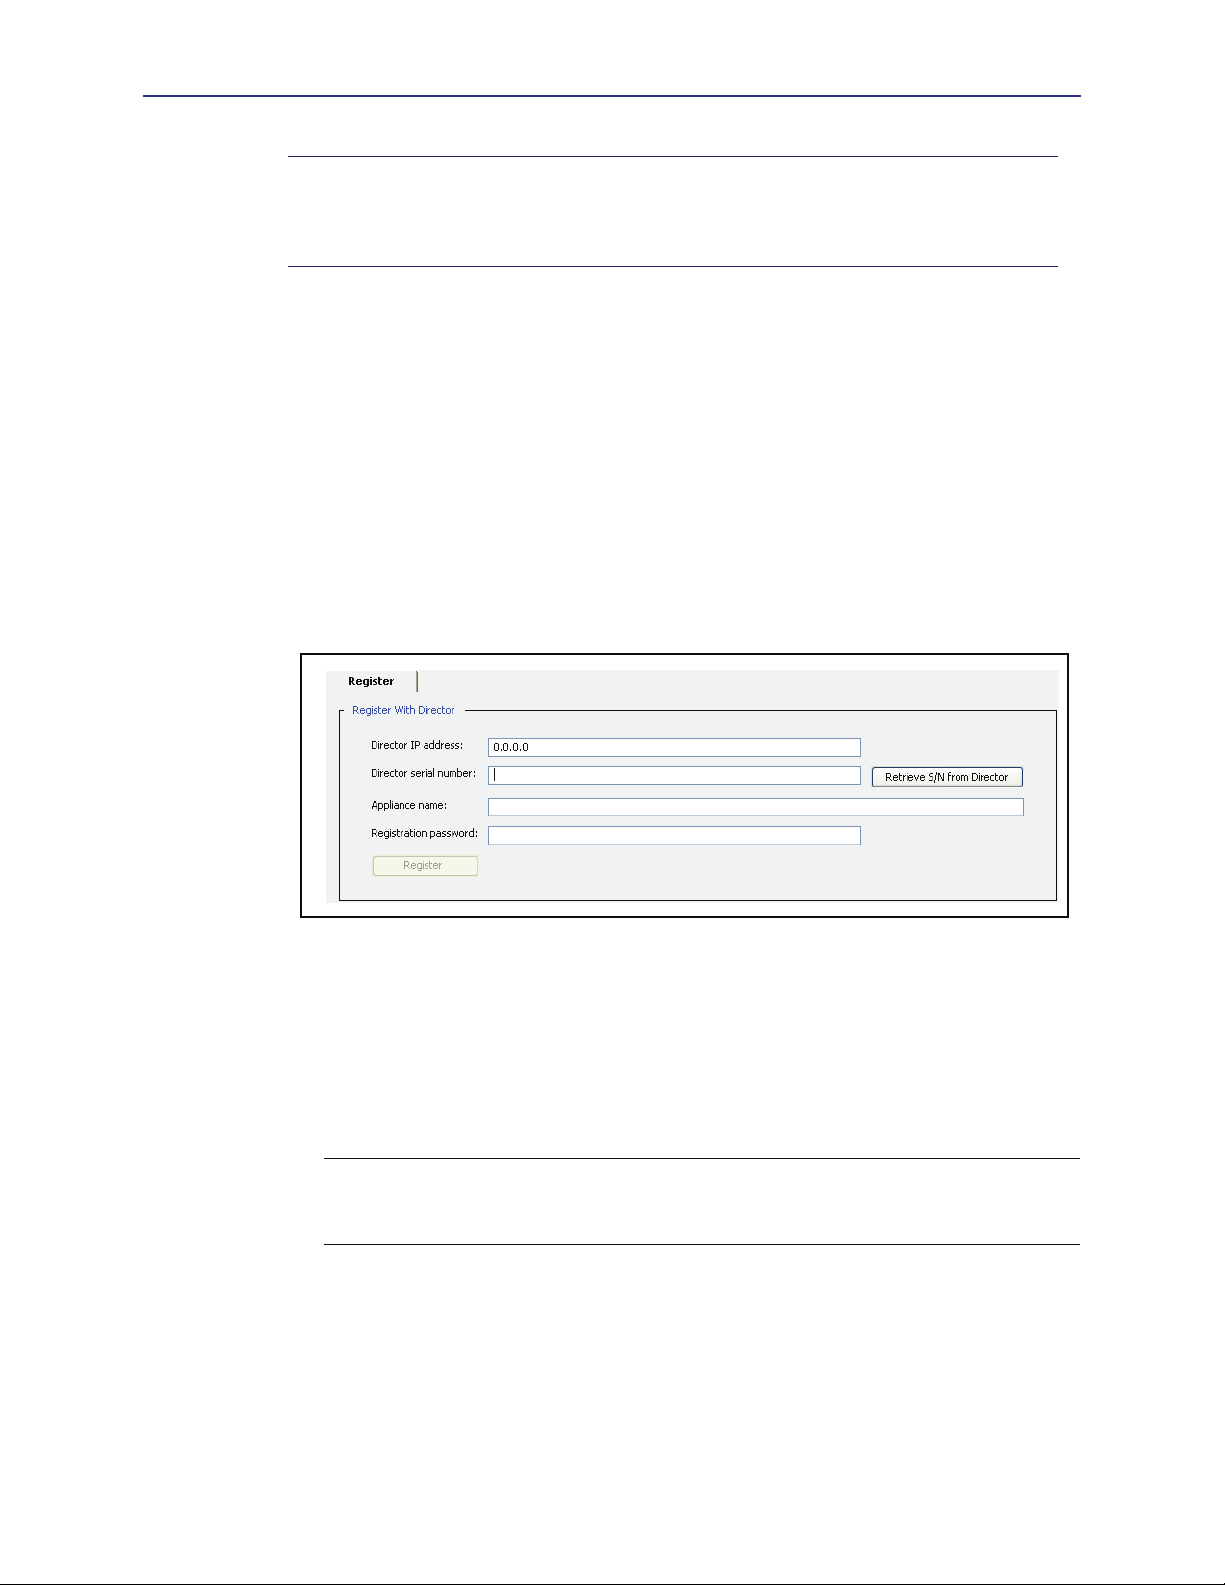
1. Select
Maintenance > Director Registration.
2. In the
3. In the
Director IP address field, enter the Director IP address.
Director serial number field, enter the Director serial number or click Retrieve
S/N from Director
. If you retrieve the serial number from the Director, verify that the
serial number matches the one specified for your Director.
4. Optional—In the
Appliance name field, enter the SG appliance name.
5. If your appliance does not have an appliance certificate, enter the Director shared
secret in the
Note: Refer to the Blue Coat Director Configuration and Management Guide for more
Registration password field.
information about configuring the shared secret. For information about appliance
certificates, refer to Volume 5: Advanced Networking.
6. Click
Register.
Related CLI Commands for Director Registration
SGOS# register-with-director dir_ip_address [appliance_name
dir_serial_number]
10

Chapter 2: Monitoring the SG Appliance
Setting up Director and SG Appliance Communication
Director and the SG appliance use SSHv2 as the default communication mode. SSHv1 is
not supported.
For Director to successfully manage multiple appliances, it must be able to communicate
with an appliance using SSH/RSA and the Director’s public key must be configured on
each system that Director manages.
When doing initial setup of the SG appliance from Director, Director connects to the
device using the authentication method established on the device: SSH with simple
authentication or SSH/RSA. SSH/RSA is preferred, and must also be set up on Director
before connecting to the SG appliance.
Director can create an RSA keypair for an SG appliance to allow connections. However,
for full functionality, Director’s public key must be configured on each appliance. You can
configure the key on the system using the following two methods:
❐ Use Director to create and push the key.
❐ Use the import-director-client-key CLI command from the SG appliance.
Using Director to create and push client keys is the recommended method. The CLI
command is provided for reference.
Complete the following steps to put Director’s public key on the SG appliance using the
CLI of the appliance. You must complete this procedure from the CLI. The Management
Console is not available.
Note:
For information on creating and pushing a SSH keypair on Director, refer to the
Blue Coat Director Installation Guide.
Log in to the SG appliance you want to manage from Director.
1. From
the (config) prompt, enter the ssh-console submode:
SGOS#(config) ssh-console
SGOS#(config ssh-console)
2. Import Director’s key that was previously created on Director and copied to the
clipboard.
Important: You must add the Director identification at the end of the client key. The
example shows the username, IP address, and MAC address of Director. “Director”
(without quotes) must be the username, allowing you access to passwords in clear
text.
SGOS#(config services ssh-console) inline director-client-key
Paste client key here, end with "..." (three periods)
ssh-rsa AAAAB3NzaC1yc2EAAAABIwAAAIEAvJIXt1ZausE9qrcXem2IK/mC4dY8Cxxo1/
B8th4KvedFY33OByO/pvwcuchPZz+b1LETTY/zc3SL7jdVffq00KBN/
ir4zu7L2XT68ML20RWa9tXFedNmKl/iagI3/QZJ8T8zQM6o7WnBzTvMC/
ZElMZZddAE3yPCv9+s2TR/Ipk=director@10.25.36.47-2.00e0.8105.d46b
...
ok
To view the fingerprint of the key:
SGOS#(config sshd) view director-client-key clientID
jsmith@granite.example.com
83:C0:0D:57:CC:24:36:09:C3:42:B7:86:35:AC:D6:47
11

Volume 9: Managing the Blue Coat SG Appliance
To delete a key:
SGOS#(config sshd) delete director-client-key clientID
Monitoring the System and Disks
The System and disks page in the Management Console has the following tabs:
❐ Summary
Provides configuration information and a general status information about the device.
❐ Tasks
Enables you to perform systems tasks, such as restarting the system and clearing the
DNS or object cache. See Chapter 3: "Maintaining the SG Appliance" for information
about these tasks.
❐ Environment
Displays hardware statistics.
❐ Disks
Displays details about the installed disks and enables you take them offline.
❐ SSL Cards
Displays details about any installed SSL cards.
These statistics are also available in the CLI.
Note: The SG 400 appliances do not have an Environment tab.
System Summary
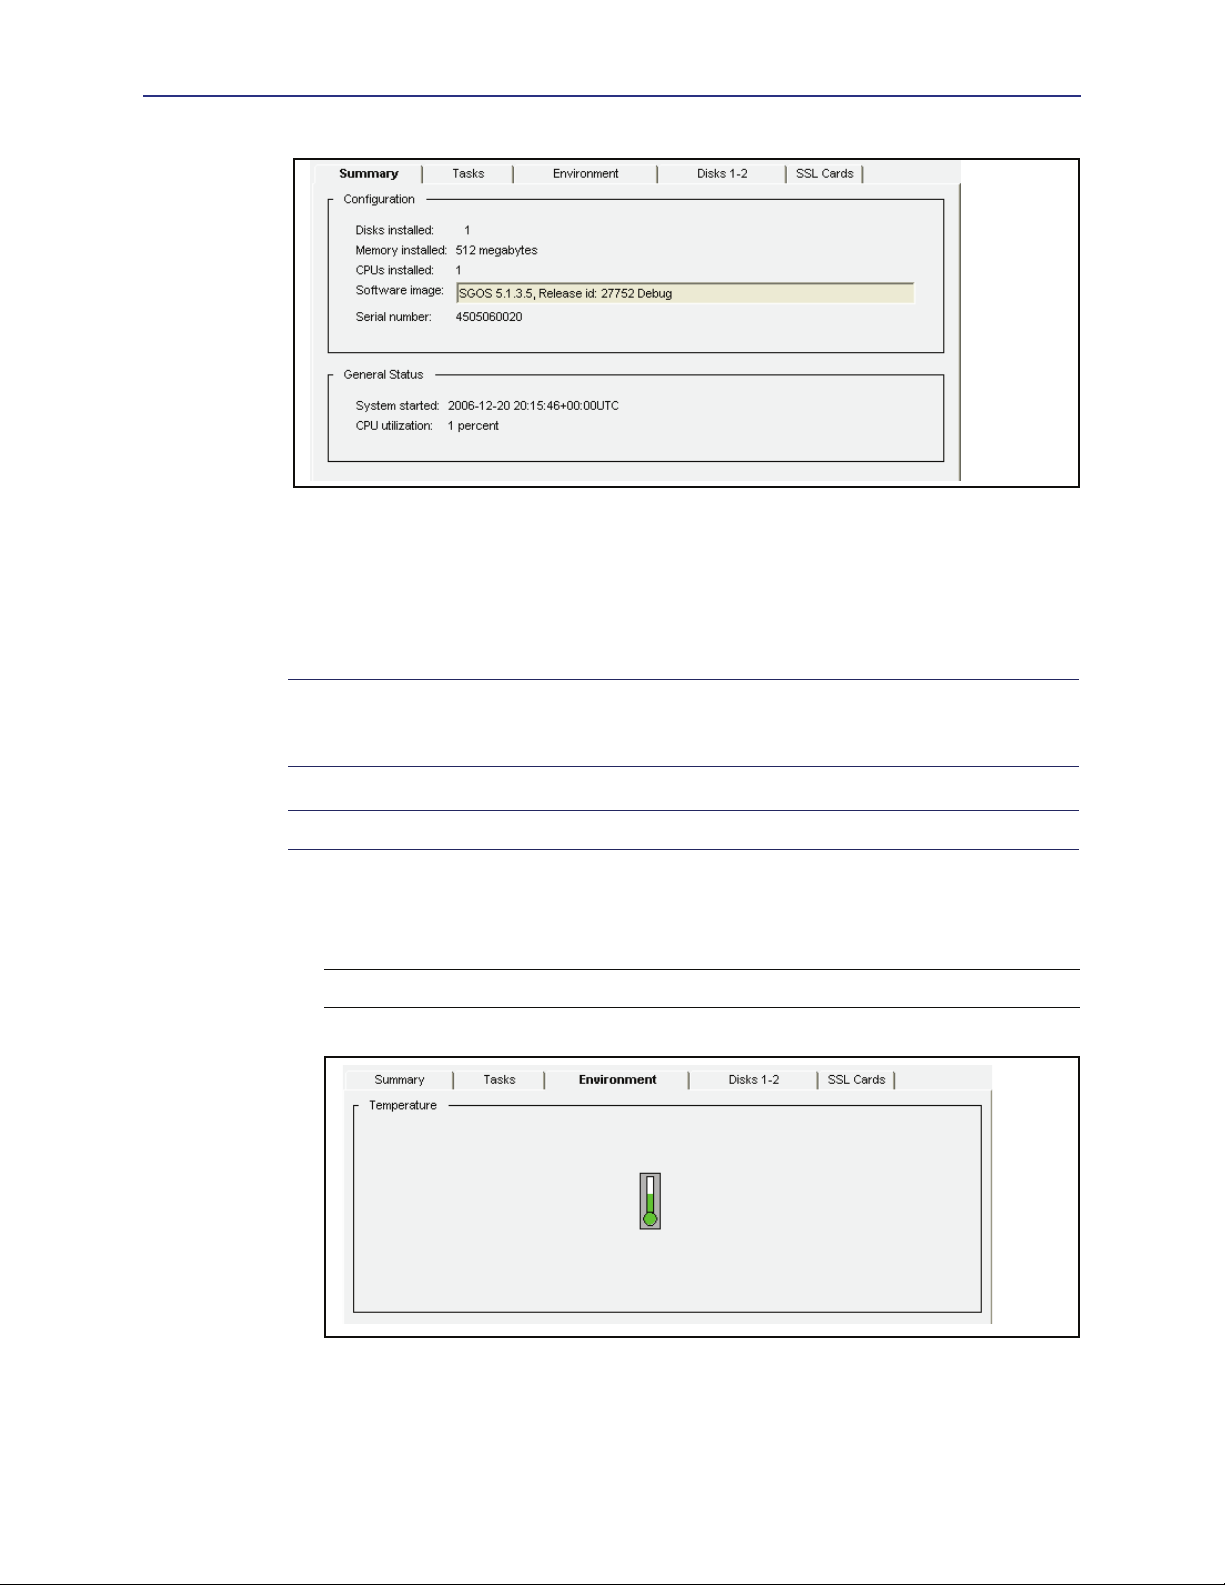
The device provides a variety of information on its status. The fields on the Summary tab
are described below:
❐ Disks Installed—the number of disk drives installed in the device. The Disks tab
displays the status of each drive.
❐ Memory installed—the amount of RAM installed in the device.
❐ CPUs installed—the number of CPUs installed in the device.
❐ Software image—the version and release number of the device image.
❐ Serial number—the serial number of the machine, if available.
❐ System started—the time and date the device was started.
❐ CPU utilization—the current percent utilization of the device CPU.
To view the system summary statistics:
Select
Maintenance > System and disks > Summary.
12
Chapter 2: Monitoring the SG Appliance
Viewing System Environment Sensors
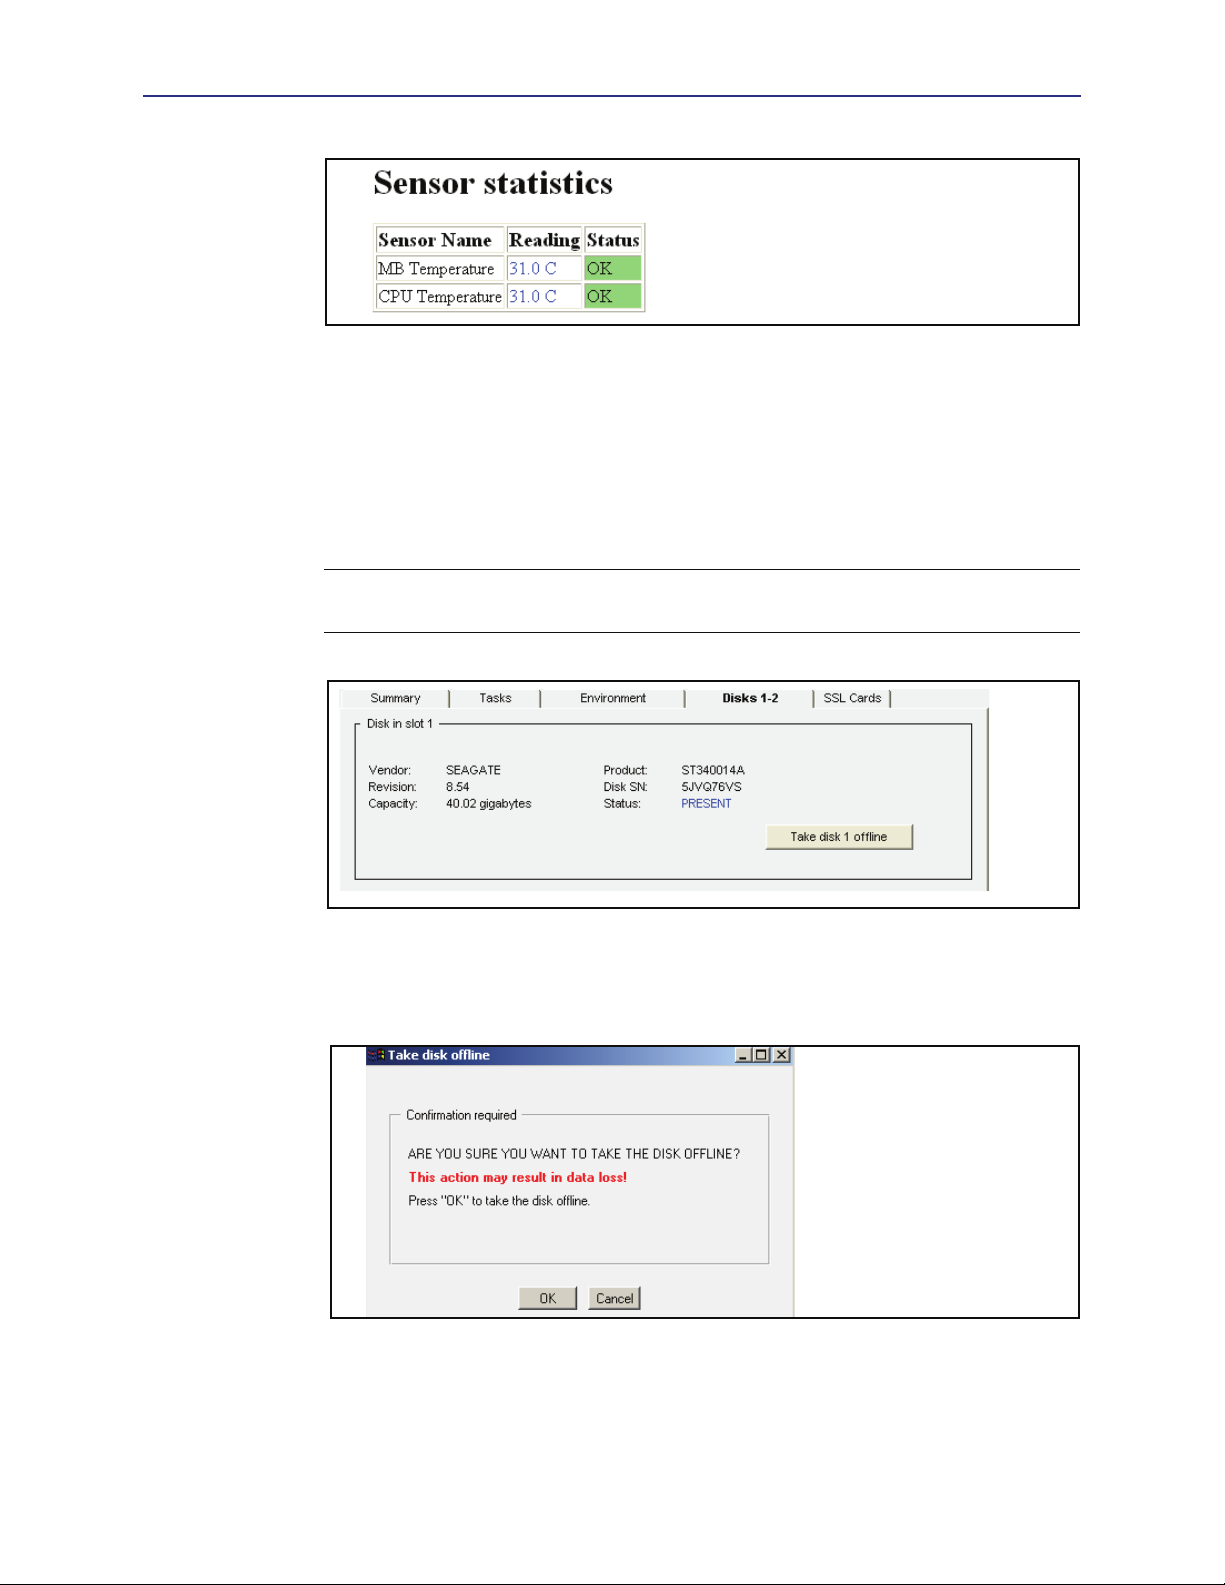
The icons on the Environment tab are green when the related hardware environment is
within acceptable parameters, and red when an out-of-tolerance condition exists. If an
icon is red, click
out-of-tolerance condition.
View Sensors to view detailed sensor statistics to learn more about the
Note: The health monitoring metrics on the Statistics > Health page also show the state
of environmental sensors. See “Configuring Health Monitoring” on page 23 for more
information.
Note: You cannot view environment statistics on an SG 400 appliance.
To view the system environment statistics:
1. Select
Maintenance > System and disks > Environment.
Note: This tab varies depending on the type of SG appliance that you are using.
2. Click
finished.
View Sensors to see detailed sensor values; close the window when you are
13
Volume 9: Managing the Blue Coat SG Appliance
Viewing Disk Status
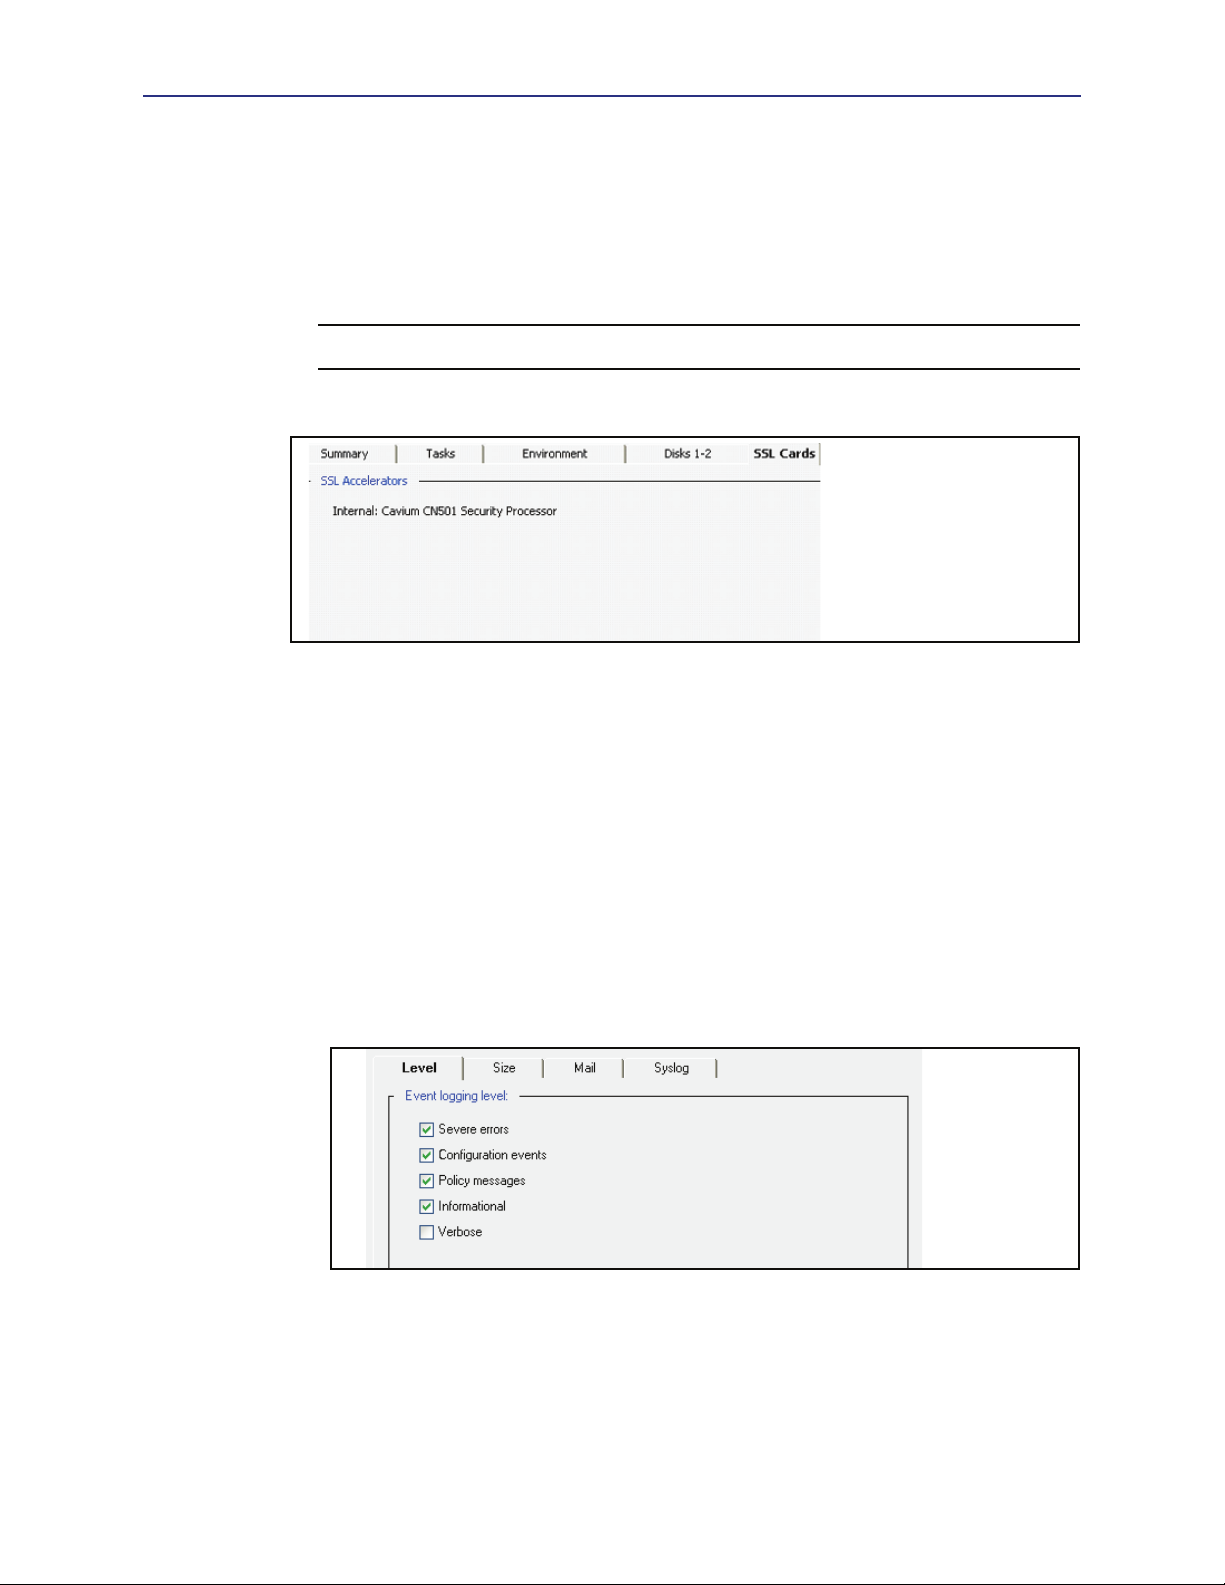
You can view the status of each of the disks in the system and take a disk offline if needed.
To view disk status or take a disk offline:
1. Select
Maintenance > System and disks > Environment.
The default view provides information about the disk in slot 1.
Note: The name and appearance of this tab differs, depending on the range of disks
available to the SG appliance model you use.
2. Select the disk to view or to take offline by clicking the appropriate disk icon.
3. (Optional) To take the selected disk offline, click the
is the number of the disk you have selected); click
Take disk x offline button (where x
OK in the Take disk offline dialog
that displays.
14
Chapter 2: Monitoring the SG Appliance
Viewing SSL Accelerator Card Information
Selecting the Maintenance > System and disks > SSL Cards tab allows you to view
information about any SSL accelerator cards in the system. If no accelerator cards are
installed, that information is stated on the pane.
To view SSL accelerator cards:
Note: You cannot view statistics about SSL accelerator cards through the CLI.
Maintenance > System and disks > SSL Cards.
Select
Setting Up Event Logging and Notification
You can configure the SG appliance to log system events as they occur. Event logging
allows you to specify the types of system events logged, the size of the event log, and to
configure Syslog monitoring. The appliance can also notify you by e-mail if an event is
logged.
Configuring Which Events to Log
The event level options are listed from the most to least important events. Because each
event requires some disk space, setting the event logging to log all events fills the event
log more quickly.
To set the event logging level:
1. Select
Maintenance > Event Logging > Level.
2. Select the events you want to log.
When you select an event level, all levels above the selection are included. For
example, if you select
3. Click
Apply.
Verbose, all event levels are included.
15
Volume 9: Managing the Blue Coat SG Appliance
Related CLI Commands for Setting the Event Logging Level
SGOS#(config event-log) level {severe | configuration | policy |
informational | verbose}
Table 2-1. Event Logging Level Options
severe Writes only severe error messages to the event log.
configuration Writes severe and configuration change error messages to the event log.
policy Writes severe, configuration change, and policy event error messages to
the event log.
informational Writes severe, configuration change, policy event, and information error
messages to the event log.
verbose Writes all error messages to the event log.
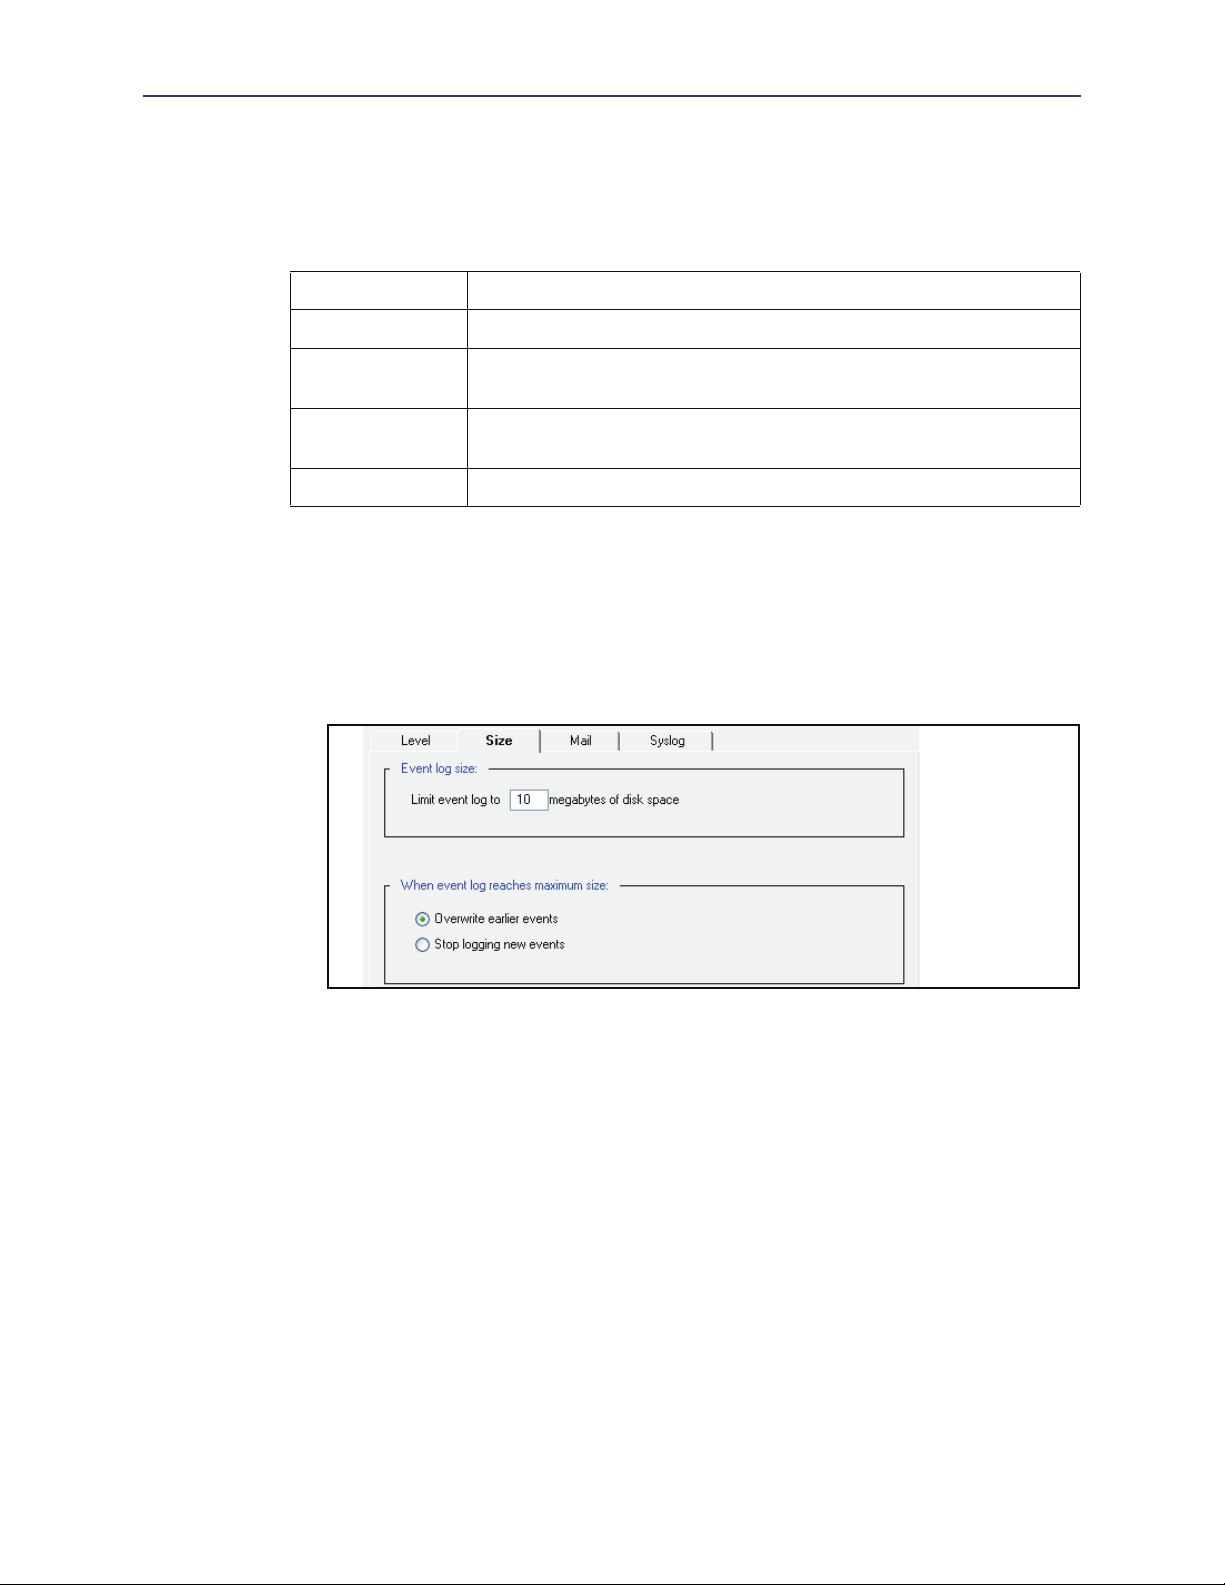
Setting Event Log Size
You can limit the size of the appliances’s event log and specify what the appliance should
do if the log size limit is reached.
To set event log size:
1. Select
2. In the
3. Select either
Maintenance > Event Logging > Size.
Event log size field, enter the maximum size of the event log in megabytes.
Overwrite earlier events or Stop logging new events to specify the desired
behavior when the event log reaches maximum size.
4. Click
Apply.
Related CLI Commands to Set the Event Log Size
SSGOS#(config event-log) log-size megabytes
SGOS#(config event-log) when-full {overwrite | stop}
Enabling Event Notification
The SG appliance can send event notifications to Internet e-mail addresses using SMTP.
You can also send event notifications directly to Blue Coat for support purposes. For
information on configuring diagnostic reporting, see Chapter 4: "Diagnostics".
16
Chapter 2: Monitoring the SG Appliance
Note: The SG appliance must know the host name or IP address of your SMTP mail
gateway to mail event messages to the e-mail address(es) you have entered. If you do not
have access to an SMTP gateway, you can use the Blue Coat default SMTP gateway to
send event messages directly to Blue Coat.
The Blue Coat SMTP gateway only sends mail to Blue Coat. It will not forward mail to
other domains.
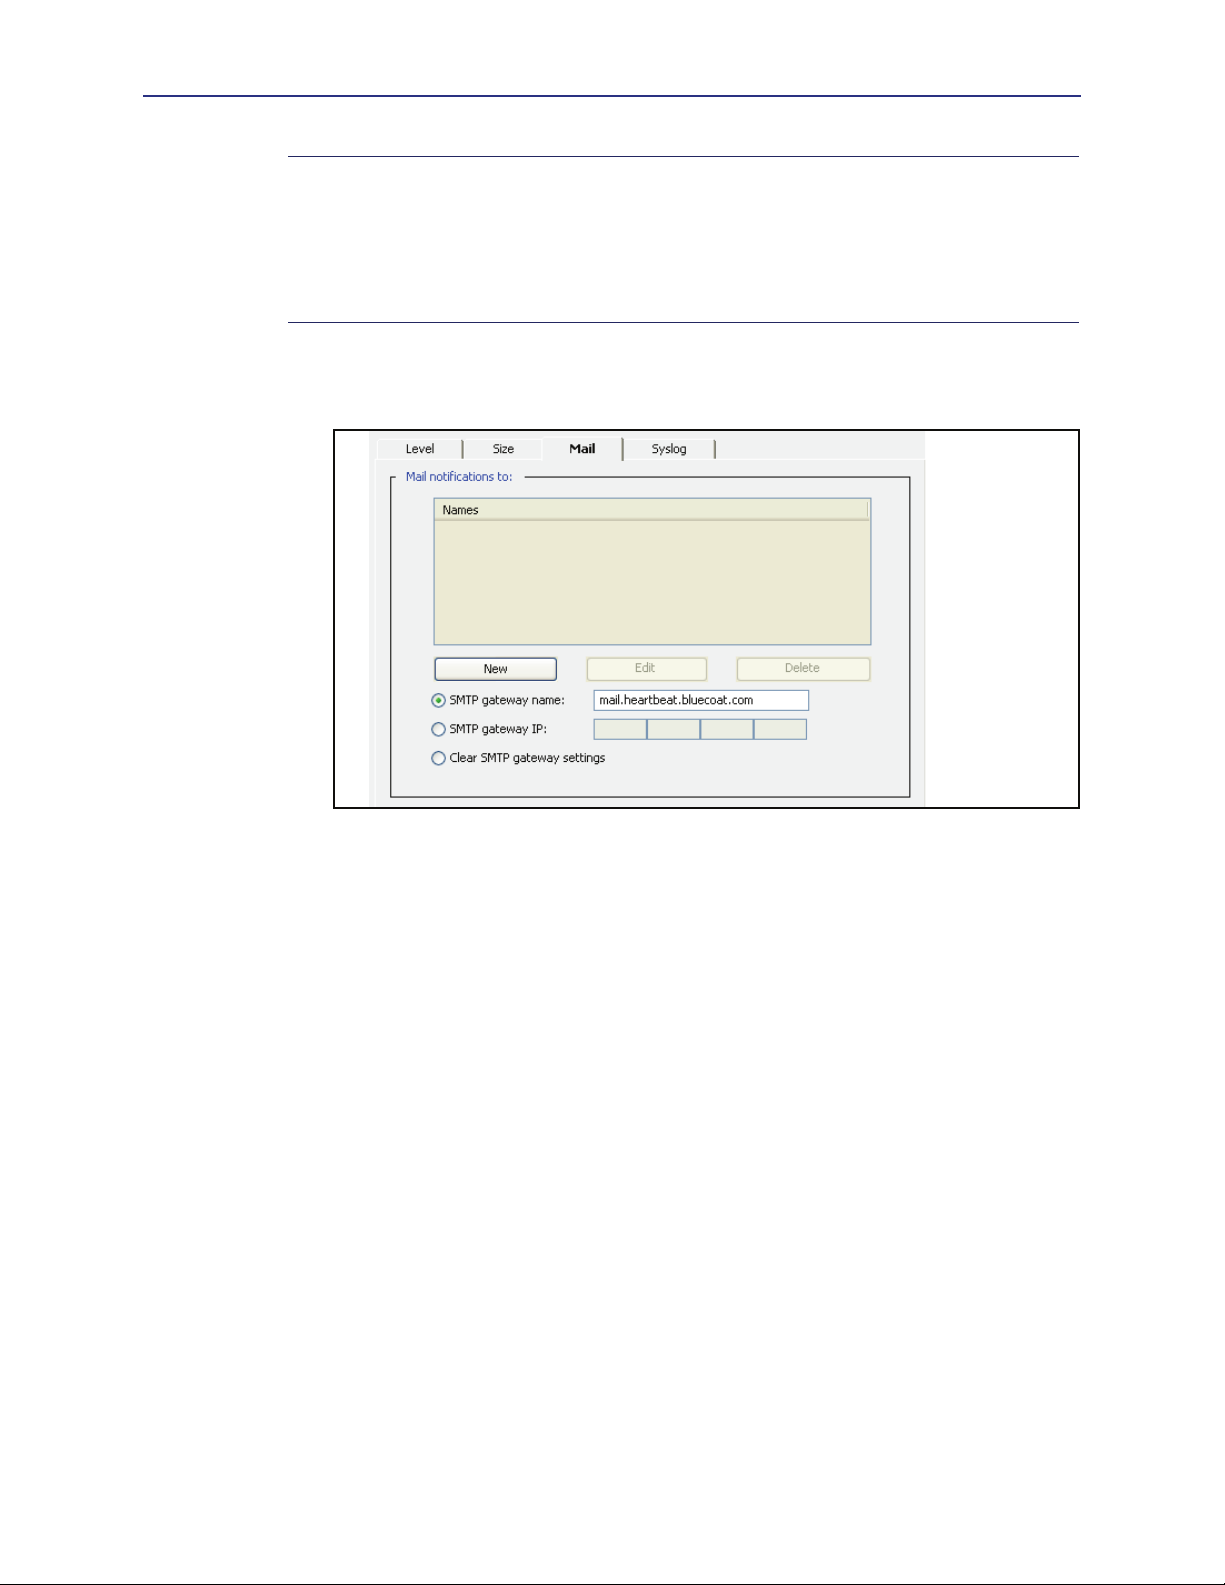
To enable event notifications:
1. Select
2. Click
Maintenance > Event Logging > Mail.
New to add a new e-mail address; click OK in the Add list item dialog that
appears.
3. In the
SMTP gateway name field, enter the host name of your mail server; or in the
SMTP gateway IP field, enter the IP address of your mail server.
4. (Optional) If you want to clear one of the above settings, select the radio button of the
setting you want to clear. You can clear only one setting at a time.
5. Click
Apply.
Related CLI Commands to Enable Event Notifications
SGOS#(config event-log) mail add email_address
Syslog Event Monitoring
Syslog is an event-monitoring scheme that is especially popular in UNIX environments.
Sites that use syslog typically have a log host node, which acts as a sink (repository) for
several devices on the network. You must have a syslog daemon operating in your
network to use syslog monitoring. The syslog format is:
Most clients using syslog have multiple devices sending messages to a single syslog
daemon. This allows viewing a single chronological event log of all of the devices
assigned to the syslog daemon. An event on one network device might trigger an event on
other network devices, which, on occasion, can point out faulty equipment.
Date Time Hostname Event.
17
Volume 9: Managing the Blue Coat SG Appliance
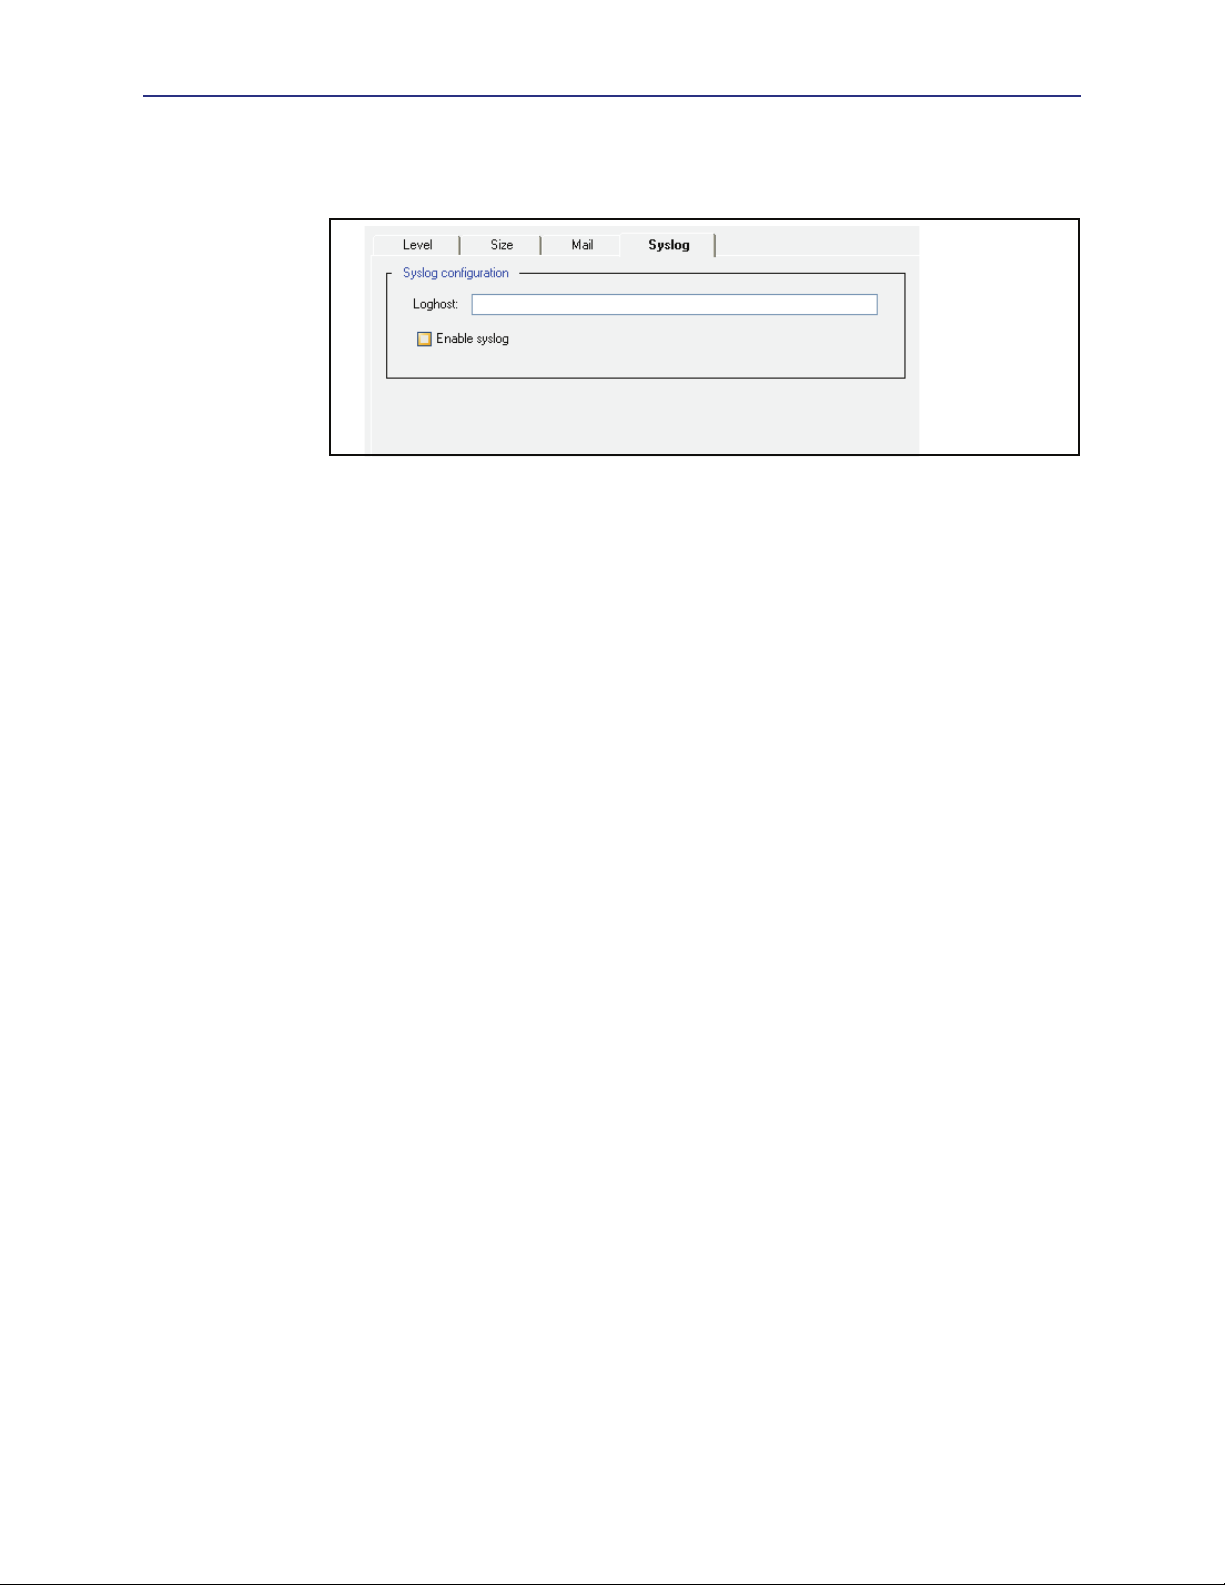
To enable syslog monitoring:
1. Select
2. In the
3. Select
4. Click
Maintenance > Event Logging > Syslog.
Loghost field, enter the domain name or IP address of your loghost server.
Enable Syslog.
Apply.
Related CLI Commands to Enable Syslog Monitoring
SGOS#(config event-log) syslog {disable | enable}
Viewing Event Log Configuration and Content
You can view the system event log, either in its entirety or selected portions of it.
Viewing the Event Log Configuration
You can view the event log configuration, from show or from view in the event-log
configuration mode.
To view the event log configuration:
At the prompt, enter the following command:
❐ From anywhere in the CLI
SGOS> show event-log configuration
Settings:
Event level: severe + configuration + policy + informational
Event log size: 10 megabytes
If log reaches maximum size, overwrite earlier events
Syslog loghost: <none>
Syslog notification: disabled
Syslog facility: daemon
Event recipients:
SMTP gateway:
mail.heartbeat.bluecoat.com
-or-
❐ From the (config) prompt:
SGOS#(config) event-log
SGOS#(config event-log) view configuration
Settings:
Event level: severe + configuration + policy + informational
Event log size: 10 megabytes
If log reaches maximum size, overwrite earlier events
Syslog loghost: <none>
18

Chapter 2: Monitoring the SG Appliance
Syslog notification: disabled
Syslog facility: daemon
Event recipients:
SMTP gateway:
mail.heartbeat.bluecoat.com
Viewing the Event Log Contents
Again, you can view the event log contents from the show command or from the event-log
configuration mode.
The syntax for viewing the event log contents is
SGOS# show event-log
-or-
SGOS# (config event-log) view
[start [YYYY-mm-dd] [HH:MM:SS]] [end [YYYY-mm-dd] [HH:MM:SS]] [regex
regex | substring string]
Pressing <Enter> shows the entire event log without filters.
The order of the filters is unimportant. If
log is used. If
If the date is omitted in either
you supply just times, you must supply just times for both
refer to today). The time is interpreted in the current timezone of the appliance.
end is omitted, the end of the recorded event log is used.
start is omitted, the start of the recorded event
start or end, it must be omitted in the other one (that is, if
start and end, and all times
Understanding the Time Filter
The entire event log can be displayed, or either a starting date/time or ending date/time
can be specified. A date/time value is specified using the notation ([YYYY-MM-DD]
[HH:MM:SS]). Parts of this string can be omitted as follows:
❐ If the date is omitted, today's date is used.
❐ If the time is omitted for the starting time, it is 00:00:00
❐ If the time is omitted for the ending time, it is 23:59:59
At least one of the date or the time must be provided. The date/time range is inclusive of
events that occur at the start time as well as dates that occur at the end time.
Note: If the notation includes a space, such as between the start date and the start time,
the argument in the CLI should be quoted.
Understanding the Regex and Substring Filters
A regular expression can be supplied, and only event log records that match the regular
expression are considered for display. The regular expression is applied to the text of the
event log record not including the date and time. It is case-sensitive and not anchored.
You should quote the regular expression.
Since regular expressions can be difficult to write properly, you can use a substring filter
instead to search the text of the event log record, not including the date and time. The
search is case sensitive.
Regular expressions use the standard regular expression syntax as defined by policy. If
both regex and substring are omitted, then all records are assumed to match.
19
Volume 9: Managing the Blue Coat SG Appliance
Example
SGOS# show event-log start "2004-10-22 9:00:00" end "2004-10-22
9:15:00"
2004-10-22 09:00:02+00:00UTC "Snapshot sysinfo_stats has fetched /
sysinfo-stats " 0 2D0006:96 ../Snapshot_worker.cpp:183
2004-10-22 09:05:49+00:00UTC "NTP: Periodic query of server
ntp.bluecoat.com, system clock is 0 seconds 682 ms fast compared to NTP
time. Updated system clock. " 0 90000:1 ../ntp.cpp:631
Configuring SNMP
You can view an SG appliance using a Simple Network Management Protocol (SNMP)
management station. The appliance supports MIB-2 (RFC 1213), Proxy MIB, and the
RFC2594 MIB, and can be downloaded at the following URL: https://
download.bluecoat.com/release/SGOS5/index.html (The SNMP link is in the lower
right-hand corner.).
Enabling SNMP
To view an SG appliance from an SNMP management station, you must enable and
configure SNMP support on the appliance.
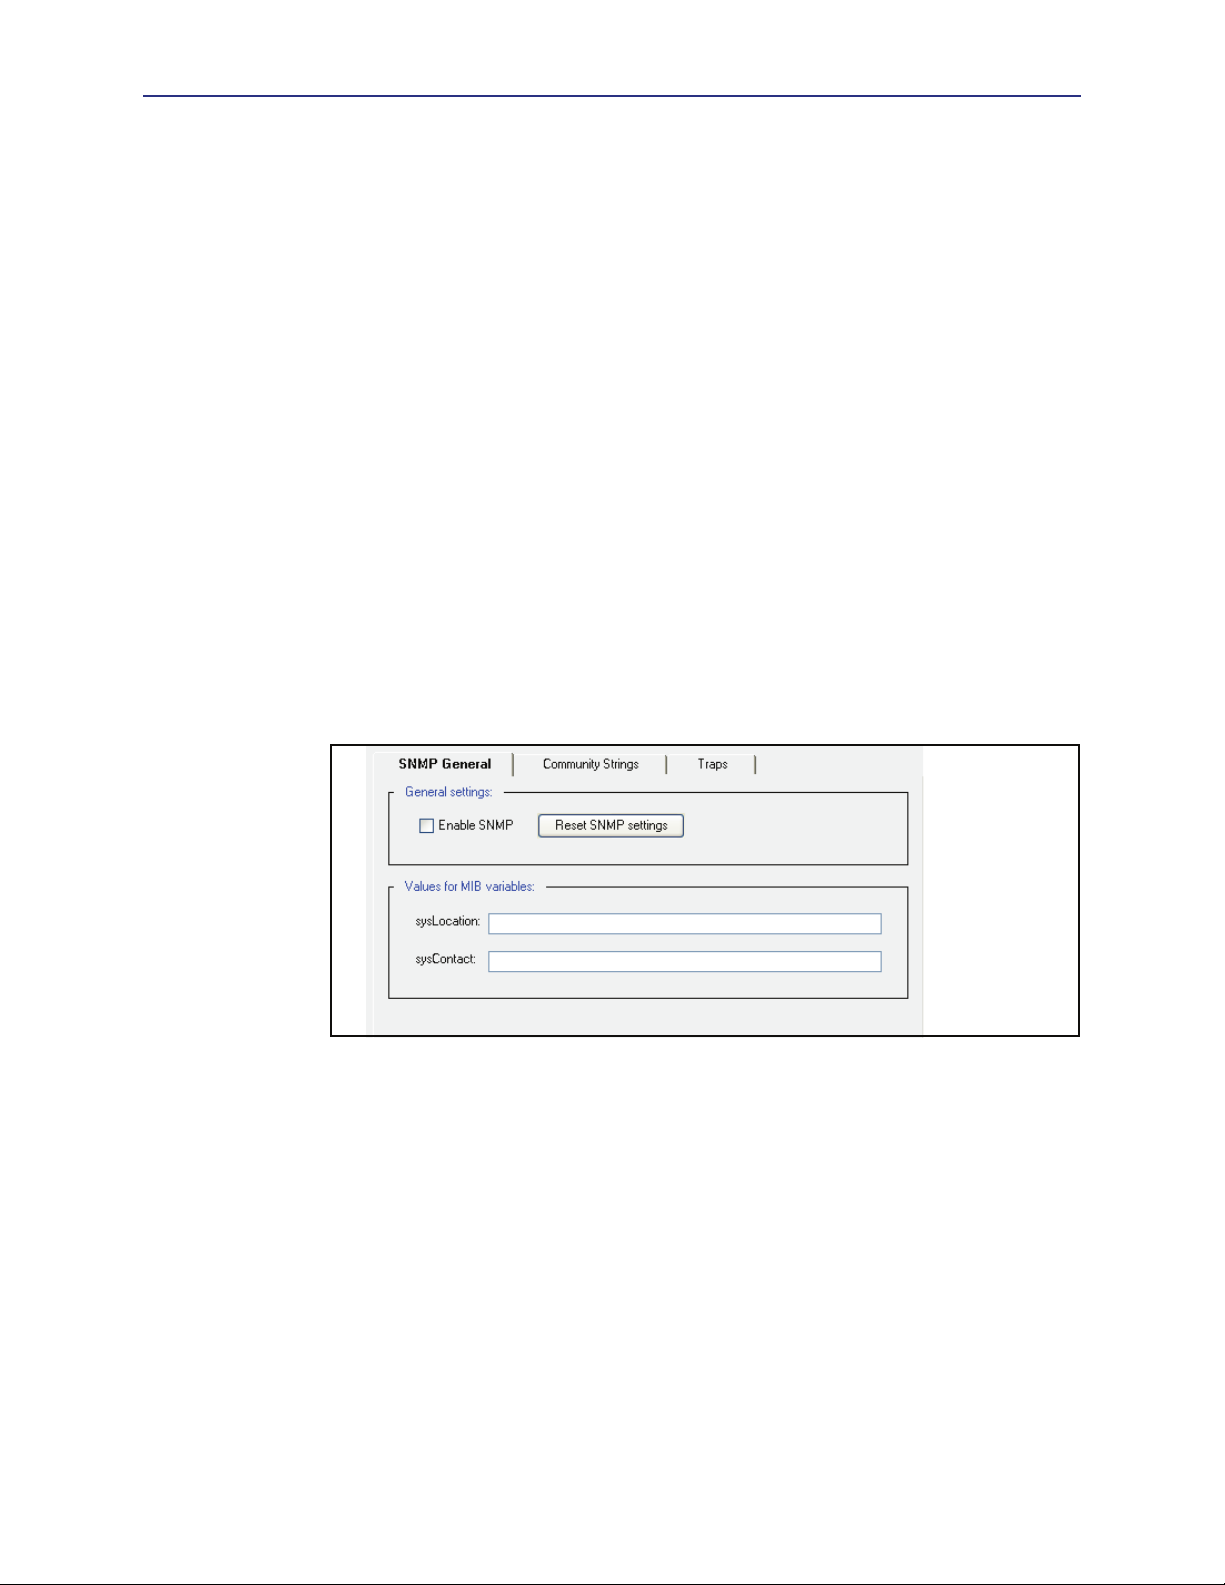
To enable and configure SNMP:
1. Select
2. Select
3. (Optional) To reset the SNMP configuration to the defaults, click
Maintenance > SNMP > SNMP General.
Enable SNMP.
Reset SNMP settings.
This erases any trap settings that were set as well as any community strings that had
been created. You do not need to reboot the system after making configuration
changes to SNMP.
4. In the
5. In the
sysLocation field, enter a string that describes the appliance’s physical location.
sysContact field, enter a string that identifies the person responsible for
administering the appliance.
Related CLI Commands to Enable and Configure SNMP
SGOS#(config snmp) {disable | enable}
SGOS #(config snmp) sys-contact string
SGOS#(config snmp) sys-location string
20
Chapter 2: Monitoring the SG Appliance
Configuring SNMP Community Strings
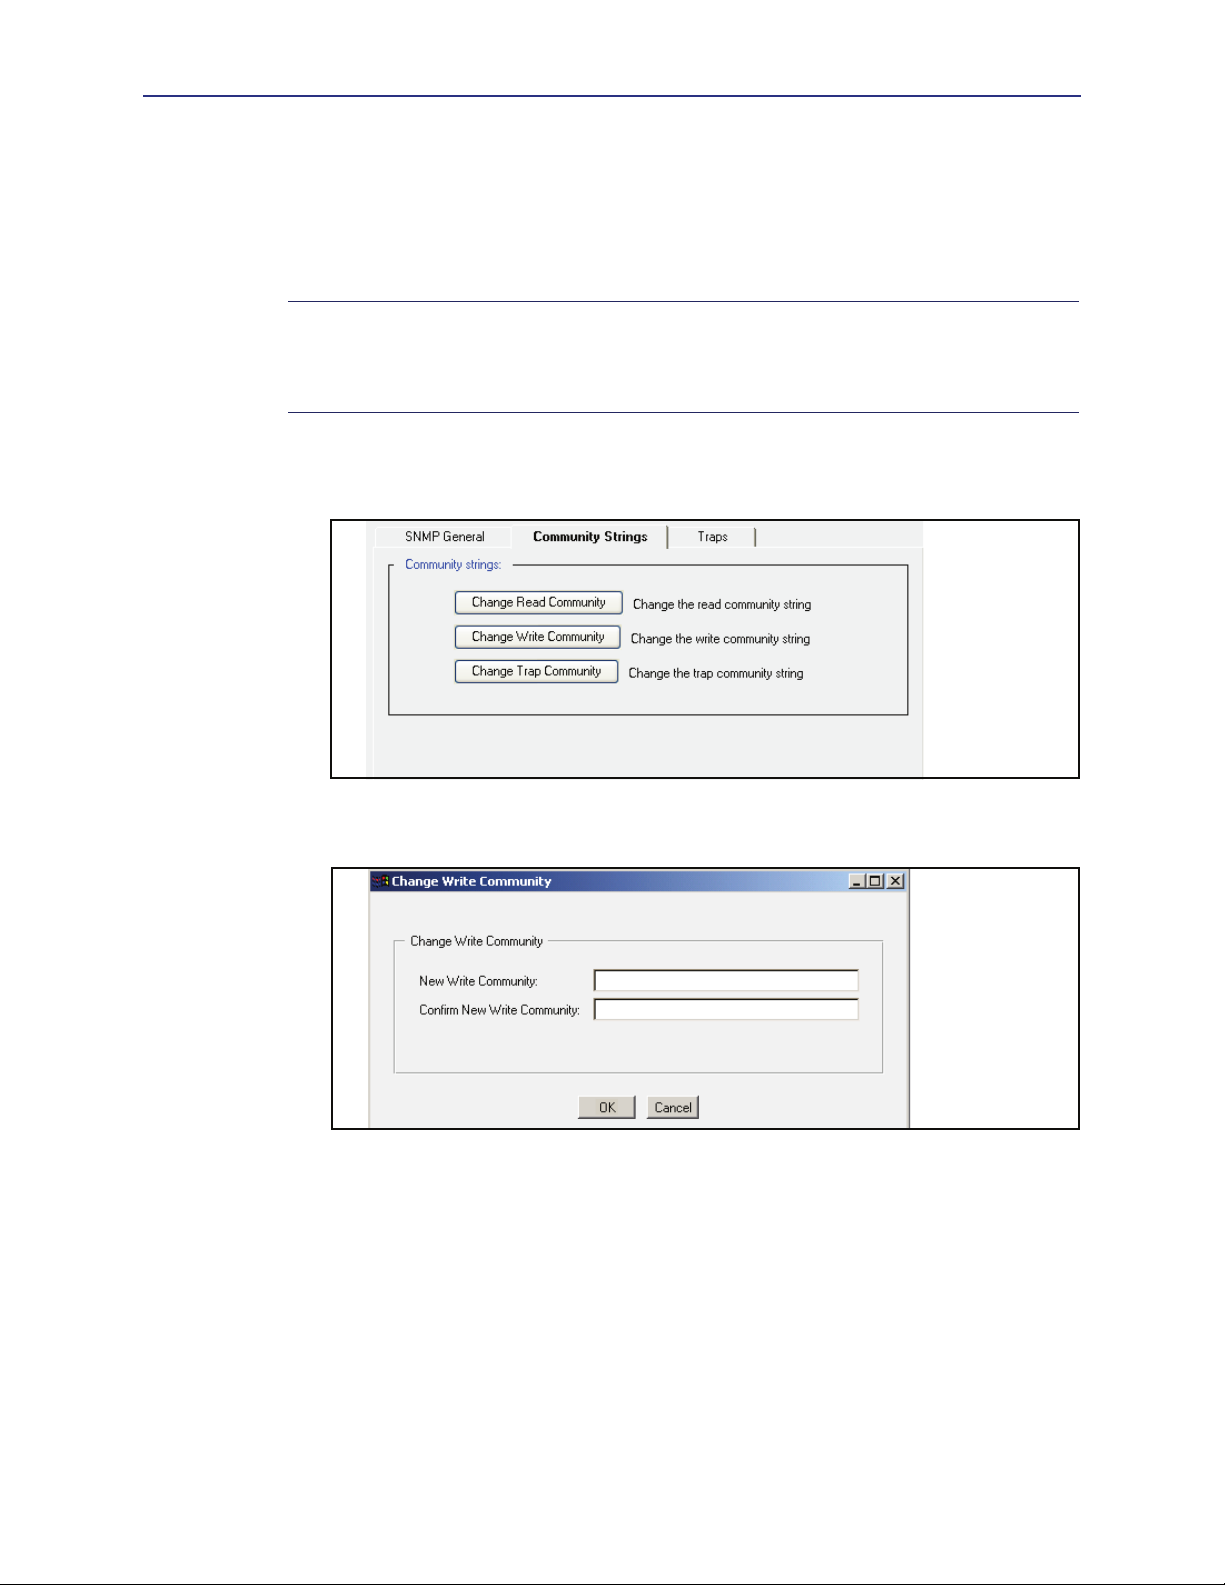
Use community strings to restrict access to SNMP data. To read SNMP data on the SG
appliance, specify a read community string. To write SNMP data to the appliance, specify a
write community string. To receive traps, specify a trap community string. By default, all
community string passwords are set to public.
Note:
If you enable SNMP, make sure to change all three community-string passwords to
values that are difficult to guess. Use a combination of uppercase, lowercase, and numeric
characters. An easily-guessed community-string password makes it easier to gain
unauthorized access to the SG appliance and network.
To set or change community strings:
1. Select
Maintenance > SNMP > Community Strings.
2. Click the community string button you want to change.
The Change Read/Write/Trap Community dialog displays.
3.
Enter and confirm the community string; click OK.
4. Click
Apply.
To set or change community strings:
You can set the community strings in either cleartext or encrypted form.
To set them in cleartext:
SGOS#(config) snmp
SGOS#(config snmp) enable
SGOS#(config snmp) read-community password
SGOS#(config snmp) write-community password
21
Volume 9: Managing the Blue Coat SG Appliance
SGOS#(config snmp) trap-community password
To set them as encrypted:
SGOS#(config) snmp
SGOS#(config snmp) enable
SGOS#(config snmp) encrypted-read-community encrypted-password
SGOS#(config snmp) encrypted-write-community encrypted-password
SGOS#(config snmp) encrypted-trap-community encrypted-password
Configuring SNMP Traps
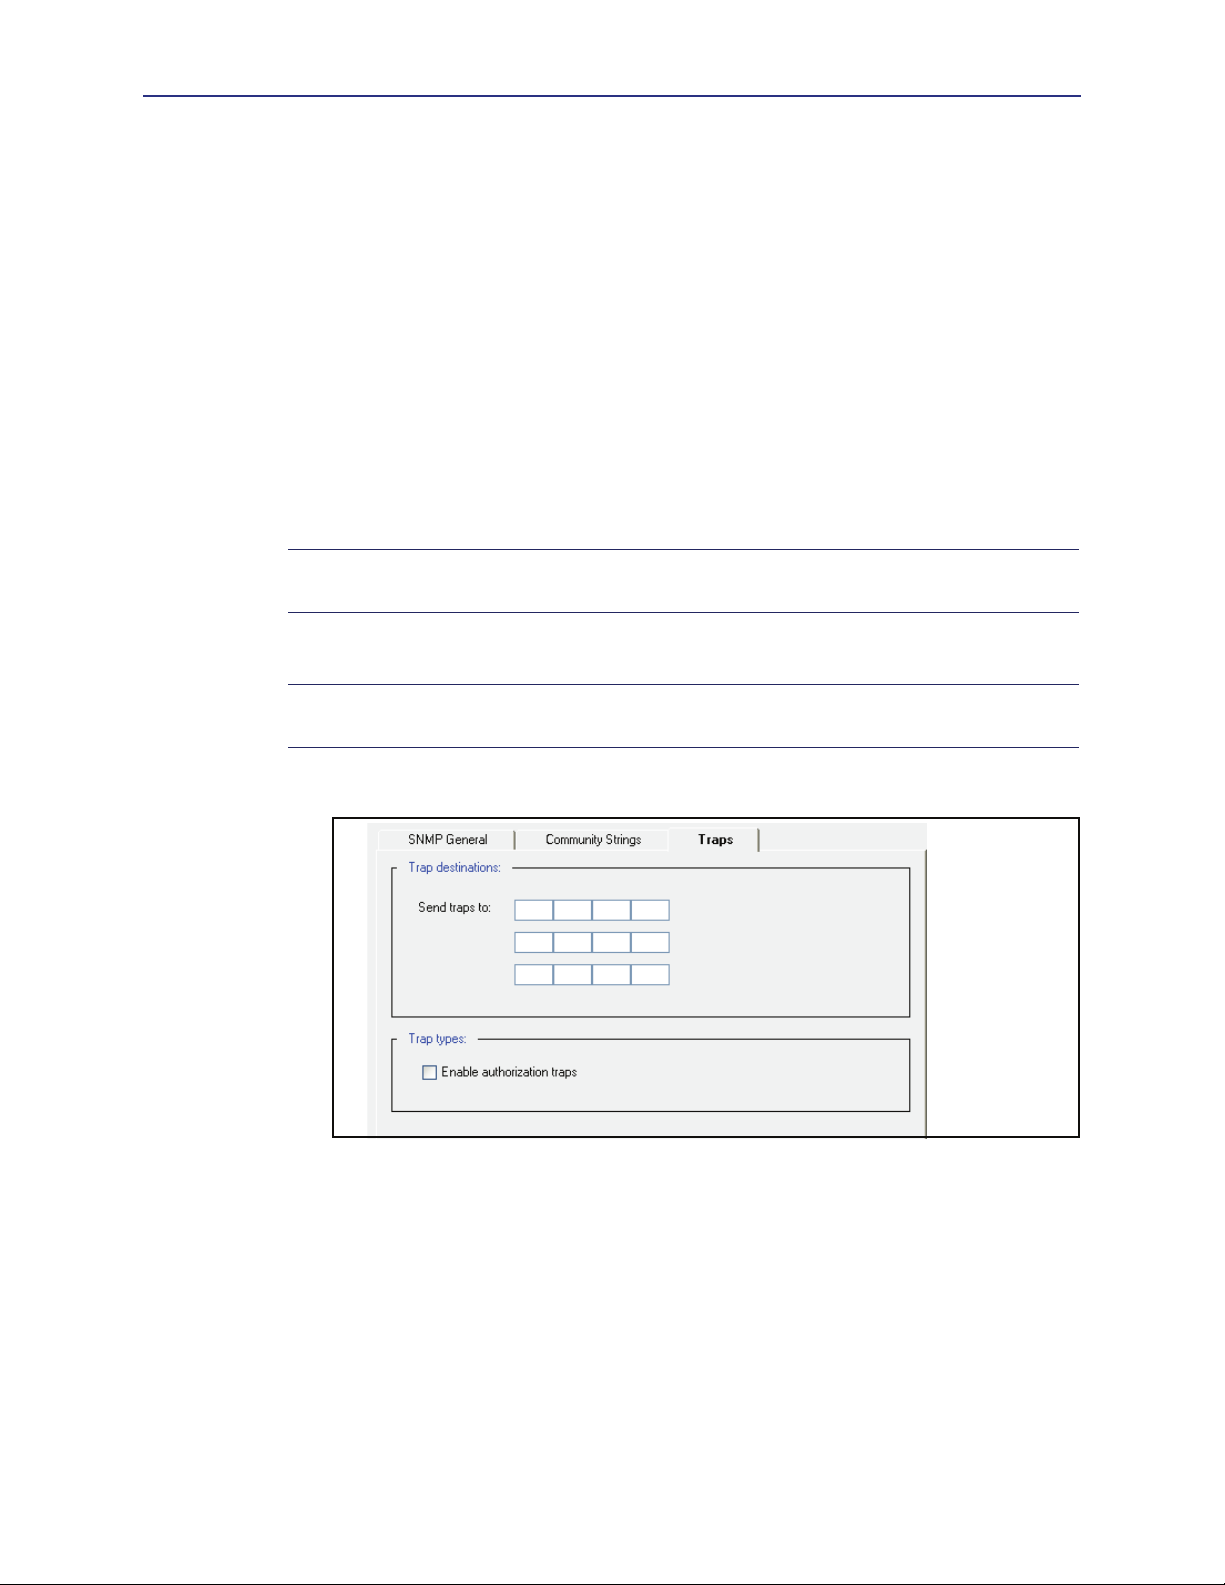
The SG appliance can send SNMP traps to a management station as they occur. By default,
all system-level traps are sent to the address specified. You can also enable authorization
traps to send notification of attempts to access the Management Console. Also, if the
system crashes for whatever reason, a cold start SNMP trap is issued on power up. No
configuration is required.
Note:
The SNMP trap for CPU utilization is sent only if the CPU continues to stay up for
32 or more seconds.
To enable SNMP traps:
Note: You cannot configure SNMP traps to go out through a particular interface. The
interface that is configured first is used until it fails and is used to identify the device.
1. Select
Maintenance > SNMP > Traps.
2. In the
Send traps to fields, enter the IP address(es) of the workstation(s) where traps
are to be sent.
3. To receive authorization traps, select
4. Select
Apply to commit the changes to the SG appliance.
Enable authorization traps.
Related CLI Commands for Enabling SNMP Traps
SGOS#(config snmp) trap-address {1 | 2 | 3} ip_address
Indicates which IP address(es) can receive traps and in which priority.
SGOS#(config snmp) authorize-traps
22
Chapter 2: Monitoring the SG Appliance
Configuring Health Monitoring
The health monitoring feature tracks key hardware and software metrics so that you can
can quickly discover and diagnose potential problems. Director (and other third-party
network management tools) also use these metrics to remotely display the current state of
the SG appliance. By monitoring these key hardware and software metrics, Director can
display a variety of health-related statistics—and trigger notification if action is required.
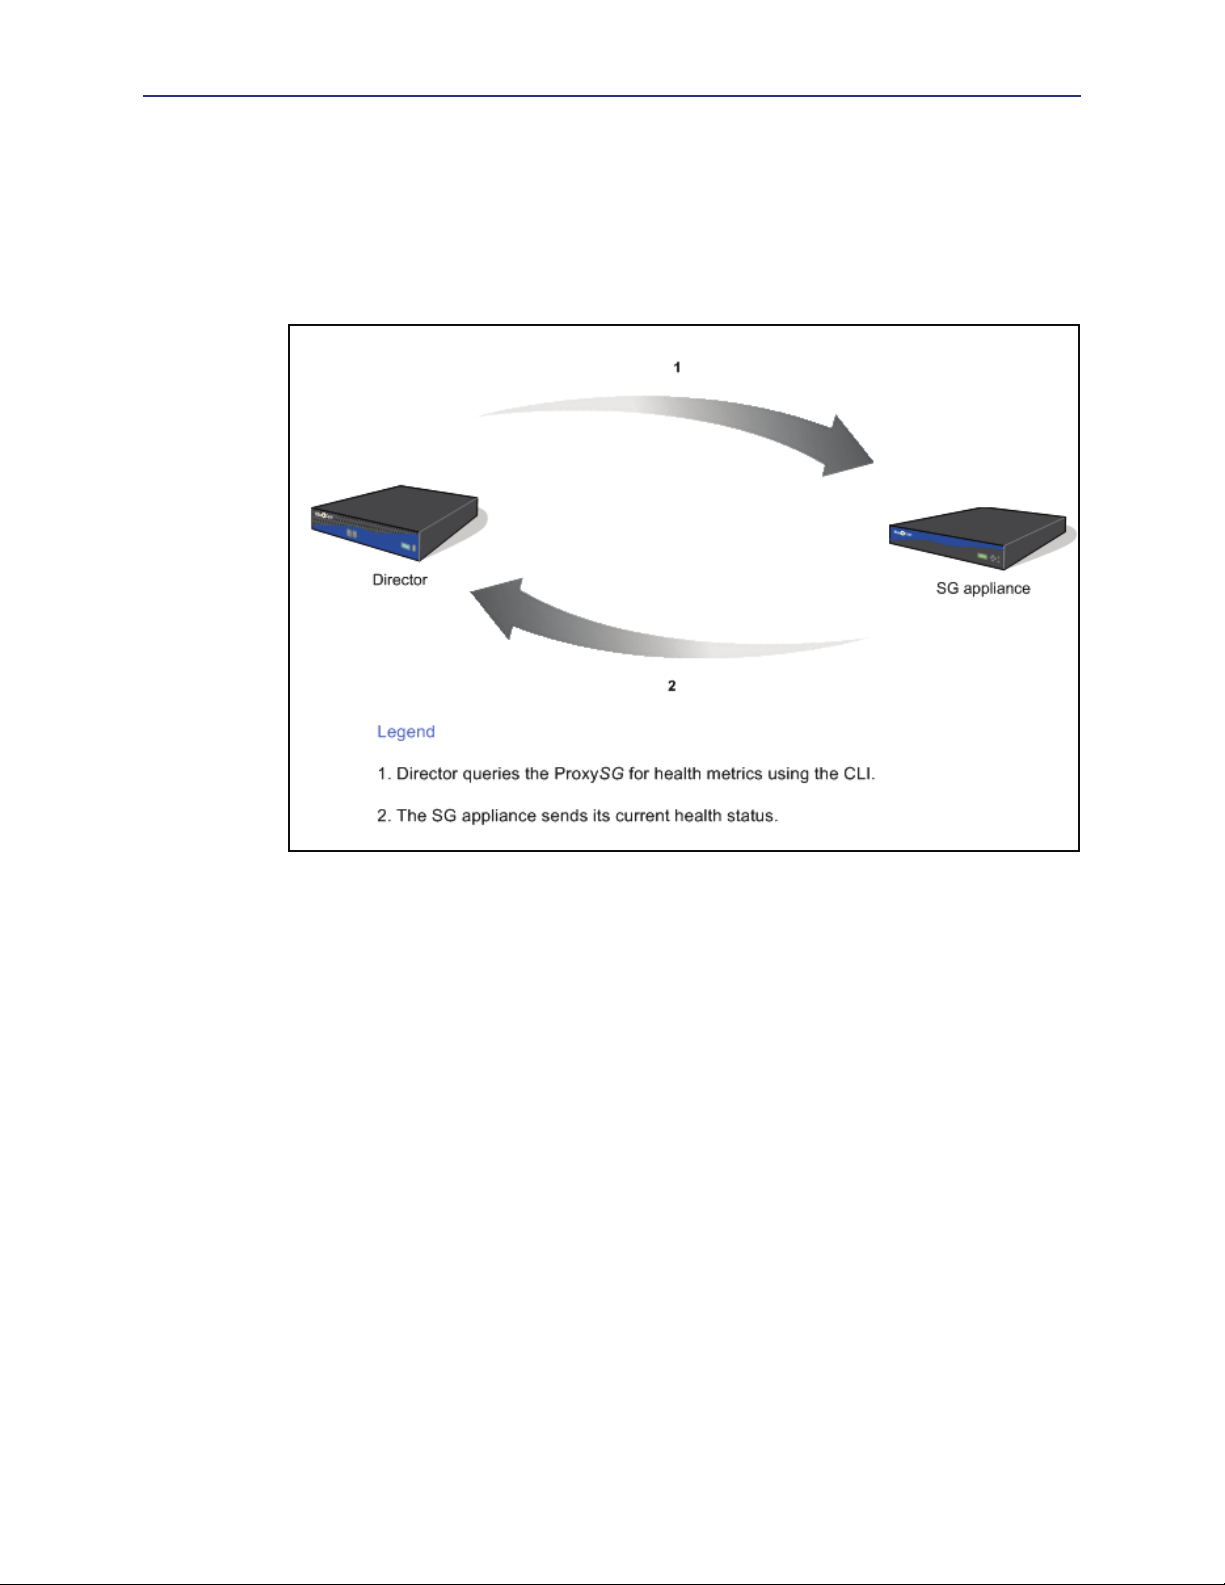
Figure 2-1. Health Monitoring Configuration and Notification Process
As shown in the preceding figure, health monitoring metrics can be remotely configured
and queried from Director. The metrics are also configurable on the SG appliance itself.
To facilitate prompt corrective action, notification can be configured for threshold
“events.” For example, an administrator can configure a threshold so that an e-mail or
SNMP trap is generated when the threshold state changes. Additionally, many of the
threshold levels are configurable so that you can adjust the thresholds to meet your
specific requirements.
Health Monitoring Requirements
Before using the health monitoring feature you must ensure that the e-mail addresses of
all persons that should be notified of health monitoring alerts are listed in the Event log
properties. See “Setting Up Event Logging and Notification” on page 15 for more
information.
23

Volume 9: Managing the Blue Coat SG Appliance
About the Health Monitoring Metric Types
The SG appliance monitors the following types of health metrics:
❐ Hardware
❐ Environmental
❐ ADN
❐ System resource
❐ Licensing metrics
The system resource and licensing thresholds are user-configurable, meaning that you can
specify the threshold level that will trigger an alert.
The hardware, environmental, and ADN metrics are not configurable and are preset to
optimal values. For example, on some platforms, a Warning is triggered when the CPU
temperature reaches 55 degrees Celsius.
These health monitoring metrics are logically grouped as General, Licensing, or Status
metrics.
About Health Monitoring
Health Monitoring allows you to set notification thresholds on various internal metrics
that track the health of a monitored system or device. Each metric has a value and a state.
The value is obtained by periodically measuring the monitored system or device. In some
cases, the value is a percentage or a temperature measurement; in other cases, it is a status
like "Disk Present" or "Awaiting Approval".
The state indicates the severity of the metric as a health issue:
❐ OK—The monitored system or device is behaving normally.
❐ WARNING—The monitored system or device is outside typical operating parameters
and may require attention.
❐ CRITICAL—The monitored system or device is either failing, or is far outside normal
parameters, and requires immediate attention.
The current state of a metric is determined by the relationship between the value and its
monitoring thresholds. The Warning and Critical states have thresholds, and each
threshold has a corresponding interval.
All metrics begin in the OK state. If the value crosses the Warning threshold and remains
there for the threshold's specified interval, the metric transitions to the Warning state.
Similarly, if the Critical threshold is exceeded for the specified interval, the metric
transitions to the Critical state. Later (for example, if the problem is resolved), the value
may drop back down below the Warning threshold. If the value stays below the Warning
threshold longer than the specified interval, the state returns to OK.
Every time the state changes, a notification occurs. If the value fluctuates above and below
a threshold, no state change occurs until the value stays above or below the threshold for
the specified interval.
This behavior helps to ensure that unwarranted notifications are avoided when values
vary widely without having any definite trend. You can experiment with the thresholds
and intervals until you are comfortable with the sensitivity of the notification settings.
24
Chapter 2: Monitoring the SG Appliance
Health Monitoring Example
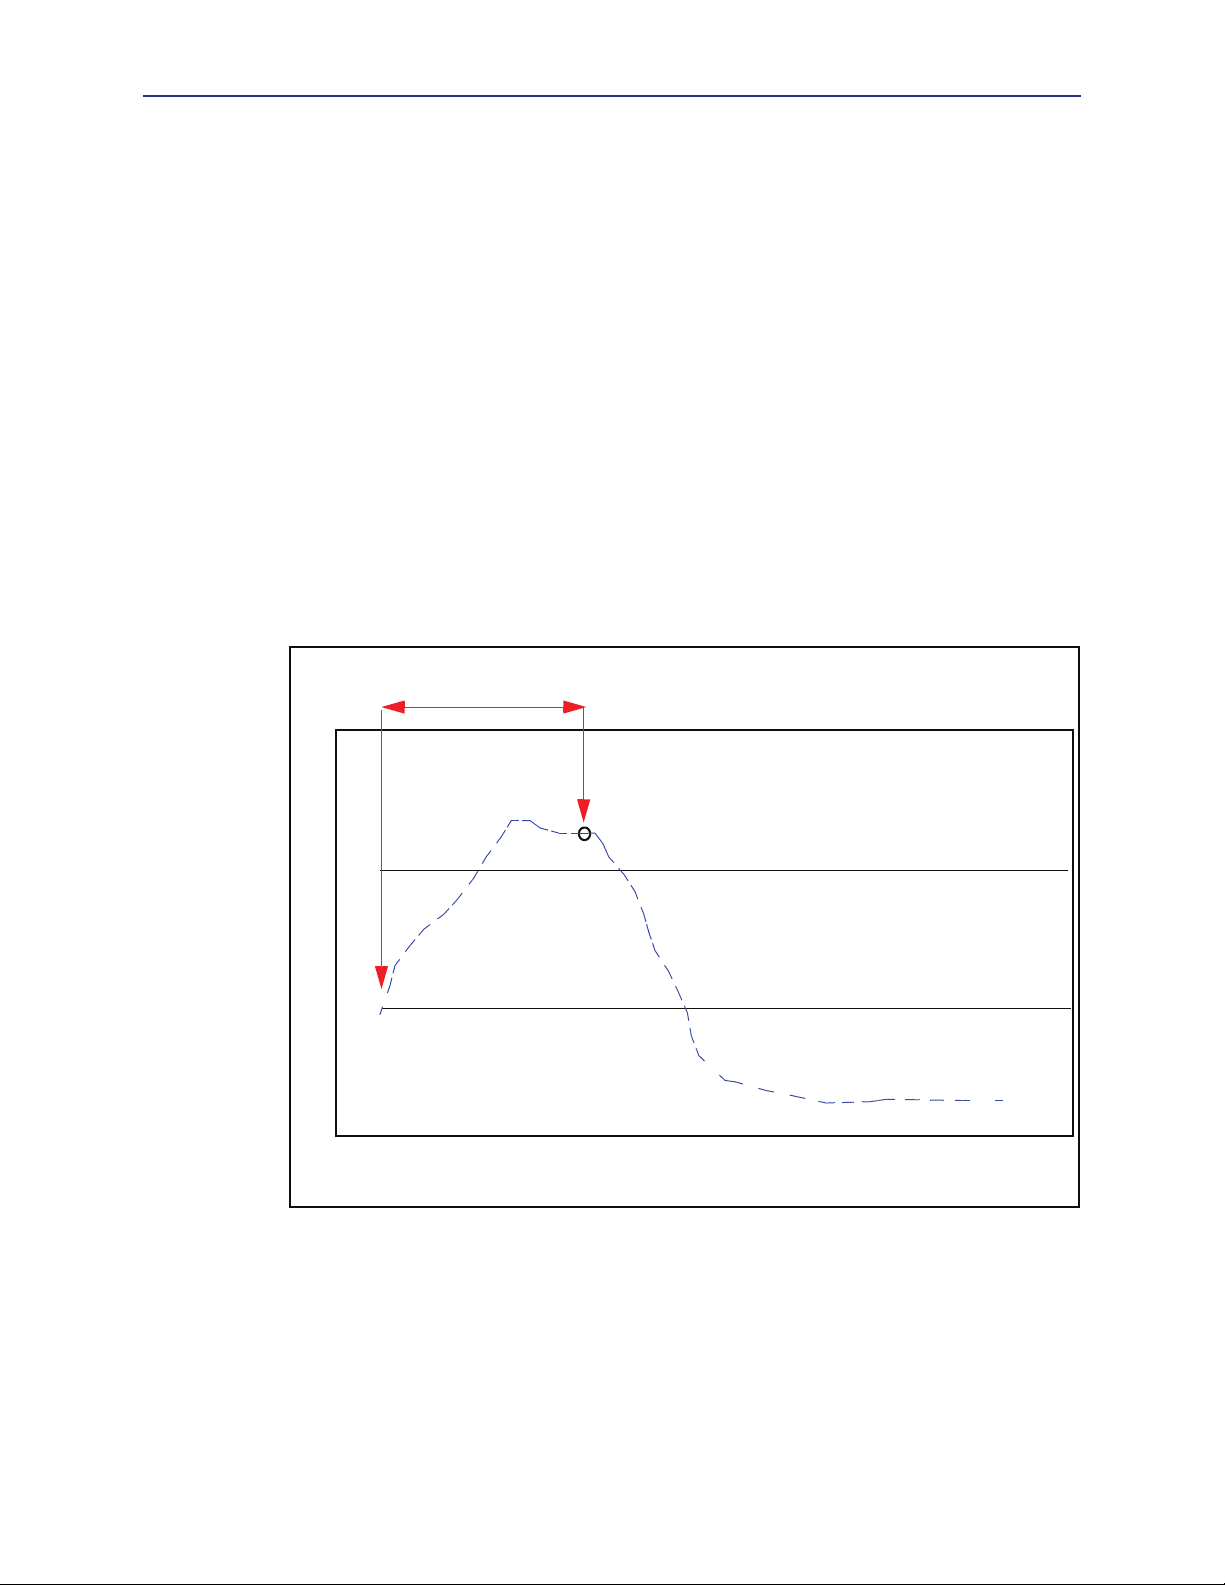
The following picture shows an example. The lower horizontal line represents the
Warning threshold; the upper horizontal line is the Critical threshold. Note how they
divide the graph into bands associated with each of the three possible states. Assume both
thresholds have intervals of 20 seconds, and that the metric is currently in the OK state.
1. At time 0, the monitored value crosses the Warning threshold. No transition occurs
yet. Later, at time 10, it crosses the critical threshold. Still, no state change occurs,
because the threshold interval has not elapsed.
2. At time 20, the value has been above the warning threshold for 20 seconds--the
specified interval. The state of the metric now changes to Warning, and a notification
is sent. Note that even though the metric is currently in the critical range, the State is
still Warning, because the value has not exceeded the Critical threshold long enough
to trigger a transition to Critical.
3. At time 25, the value drops below the Critical threshold, having been above it for only
15 seconds. The state remains at Warning.
4. At time 30, it drops below the Warning threshold. Again the state does not change. If
the value remains below the warning threshold until time 50, then the state will
change back to OK.
20 seconds above the Warning threshold a Warning notification is sent
OK WARRNING CRITICAL
Va l ue
0 5 10 15 20 25 30 35 40 45 50 55 60
Tim e
Figure 2-2. Relationship between the threshold value and threshold interval
About License Expiration Metrics
The threshold values for license expiration metrics are set in days until expiration. In this
context, a "critical" threshold indicates that license expiration is imminent. This is the only
configurable metric in which the Critical threshold value should be smaller than the
Warning threshold value. For example, if you set the Warning threshold to 45, an alert is
sent when there are 45 days remaining in the license period. The Critical threshold would
be less than 45 days, for example 5 days.
25

Volume 9: Managing the Blue Coat SG Appliance
For the license expiration metrics, the threshold interval is irrelevant and is set by default
to 0. You should set the Warning Threshold to a value that will give you ample time to
renew your license. By default, all license expiration metrics have a Warning Threshold of
30 days. By default, the Critical Threshold is configured to 0, which means that a trap is
immediately sent upon license expiration.
About Health Monitoring Notification
By default, the Director polls the SG appliances to determine their current state. If the state
has changed, Director updates the device status. Other types of notification are also
available. Any or all of the following types of notification can be set:
❐ SNMP trap: Sends an SNMP trap to all configured management stations.
❐ E-mail: Sends e-mail to all persons listed in the Event log properties.
❐ Log: Inserts an entry into the Event log. See “Setting Up Event Logging and
Notification” on page 15 for more information.
About the General Metrics
The following table lists the metrics displayed in the Maintenance > Health Monitoring >
General page. The thresholds for these metrics are user-configurable. See “About Health
Monitoring” on page 24 for information about thresholds and alert notification.
All threshold intervals are in seconds.
Table 2-2. General Health Monitoring Metrics
Metric Units Default
CPU Utilization Percentage Critical: 95%/120 seconds
Memory Pressure Percentage Critical: 95%/120 seconds
Interface Utilization Percentage Critical: 90%/120 seconds
About the Licensing Metrics
The following table lists the metrics displayed in the Maintenance > Health Monitoring >
Licensing page. You can monitor User License utilization metrics and the following license
expiration metrics:
Thresholds/Intervals
Warning: 80%/120
seconds
Warning: 90%/120
seconds
Warning: 60%/120
seconds
Notes
Measures the value of CPU 0
on multi-processor systems--
not the average of all CPU
activity.
Memory pressure occurs
when memory resources
become limited, causing new
connections to be delayed.
Measures the traffic (in and
out) on the interface to
determine if it is
approaching the bandwidth
maximum.
❐ SGOS Base License: Licenses not listed here are part of the SGOS base license.
❐ SSL Proxy
❐ SG Client
26

Chapter 2: Monitoring the SG Appliance
See “About License Expiration Metrics” on page 25 for information licensing thresholds.
Metric Units Default
License Utilization Percentage Critical: 100%/0
License Expiration Days Critical: 0 days/0
About the Status Metrics
The following table lists the metrics displayed in the Maintenance > Health Monitoring >
Status page. The thresholds for these metrics are not user-configurable.
Table 2-3. Status Health Monitoring Metrics
Metric Threshold States and Corresponding
Thresholds/Intervals
Warning: 90%/0
Warning: 30 days/0
Val ues
Notes
For licenses that have user
limits, monitors the number
of users.
Warns of impending license
expiration.
For license expiration
metrics, intervals are
ignored. See
Licensing Metrics”
page 26 for more
information.
“About the
on
Disk status Critical:
Bad
Wa rn in g :
Removed
Offline
OK:
Not Present
Present
Temperature
Bus temperature
CPU temperature
Fan
(The fan metric differs by hardware model, for
example, CPU fan, chassis fan)
Critical:
High-critical
Wa rn in g :
High-warning
Critical:
Low-critical
Wa rn in g :
Low-warning
27

Volume 9: Managing the Blue Coat SG Appliance
Table 2-3. Status Health Monitoring Metrics (Continued)
Voltage
Bus Voltage
CPU voltage
Power Supply voltage
ADN Connection Status OK:
Critical:
Critical
High-critical
Low-critical
Wa rn in g :
High-warning
Low-warning
Connected
Connecting
Connection Approved
Disabled
Not Operational
Wa rn in g :
Approval Pending
Mismatching Approval Status
Partially Connected
Critical:
Not Connected
Connection Rejected
See
more information about the ADN
metrics.
Volume 5: Advanced Networking for
ADN Manager Status OK:
No Approvals Pending
Not Applicable
Wa rn in g :
Approvals Pending
Changing Threshold and Notification Properties
The health monitoring threshold and notification properties are set by default. Use the
following procedure to modify the current settings.
To change the threshold and notification properties:
1. Select
2. Do one of the following:
3. Select the metric you want to modify.
Maintenance > Health Monitoring.
• To change the system resource metrics, select
General.
• To change the hardware/environmental/ADN metrics, select
Note: You cannot change the threshold values for metrics in the Status tab.
• To change the licensing metrics, select
Licensing.
Status.
28
Chapter 2: Monitoring the SG Appliance
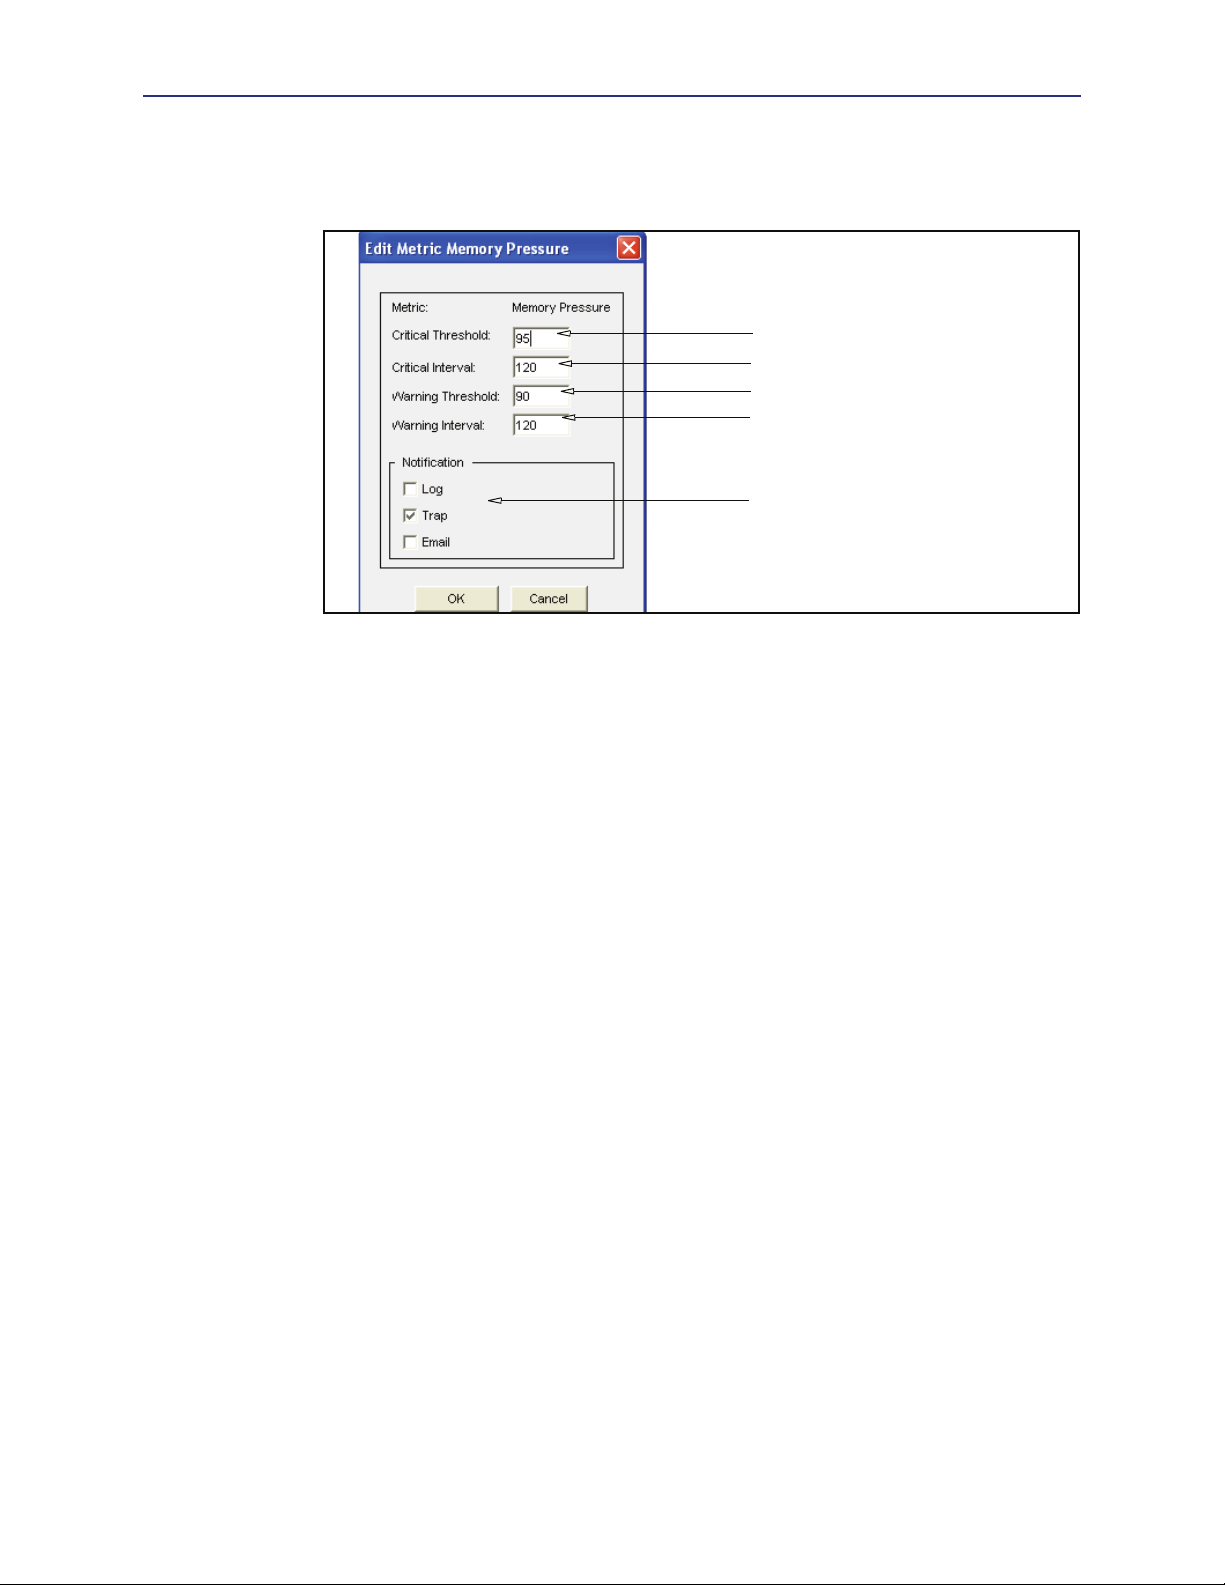
4. Click Edit to modify the threshold and notification settings. The Edit Health Monitor
Setting
dialog displays. (hardware, environmental, and ADN thresholds cannot be
modified.)
5. Modify the threshold values:
a. To change the critical threshold, enter a new value in the Critical Threshold
field.
b. To change the critical interval, enter a new value in the Critical Interval field.
c. To change the warning threshold, enter a new value in the Warning Threshold
field.
d. To change the warning interval, enter a new value in the Warning Interval
field.
5a
5b
5c
5d
6
6. Modify the notification settings.
•
Log adds an entry to the Event log.
•
Trap sends an SNMP trap to all configured management stations.
•
Email sends an e-mail to the addresses listed in the Event log properties. See
“Setting Up Event Logging and Notification” on page 15 for more information.
7. Click
8. Click
OK to close the Edit Metric dialog.
Apply.
Related CLI Syntax to Modify Threshold and Notification Properties
#(config) alert threshold metric_name warning_threshold
warning_interval critical_threshold critical_interval
#(config) alert notification metric_name notification_method
where metric_name refers to cpu-utilization, license-utilization, license-
expiration
, memory-pressure, or network-utilization.
Getting A Quick View of the SG Appliance Health
The Management Console uses the health monitoring metrics to display a visual
representation of the overall health state of the SG appliance. The health icon is located in
the upper right corner of the Management Console and is always visible.
29
Volume 9: Managing the Blue Coat SG Appliance
System health is determined by calculating the “aggregate” health status of the following
metrics:
❐ CPU Utilization
❐ Memory Pressure
❐ Network interface utilization
❐ Disk status (for all disks)
❐ License expiration
❐ License “user count” utilization (when applicable)
❐ ADN status
The possible health states are
Clicking the health icon displays the
condition of the system’s health monitoring metrics, as described in the next section.
Viewing Health Monitoring Statistics
While the health icon presents a quick view of the appliance health, the Statistics > Health
Monitoring
monitoring metrics.
page enables you to get more details about the current state of the health
OK, Warning, or Critical.
Statistics > Health page, which lists the current
To review the health monitoring statistics:
1. From the Management Console, select
Statistics > Health Monitoring.
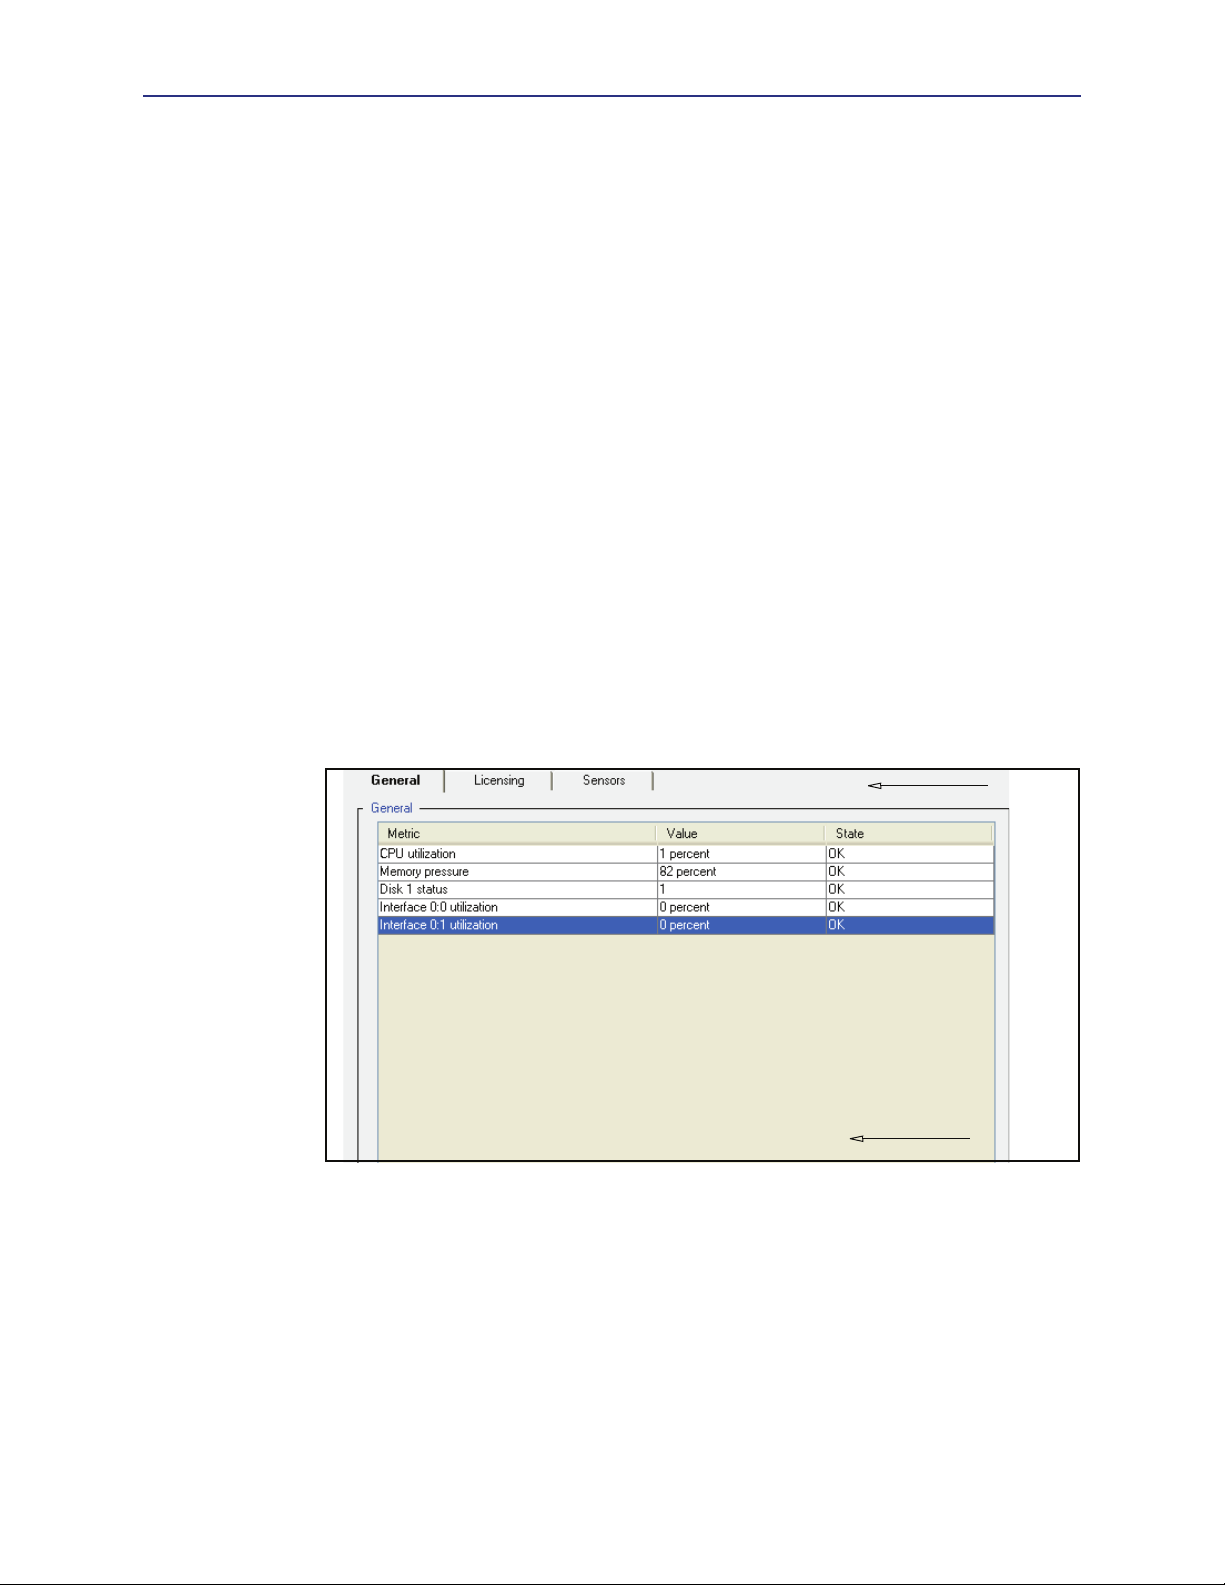
2. Select a health monitoring statistics tab:
•
General: Lists the current state of CPU utilization, interface utilization, memory
pressure, and disk status metrics.
•
Licensing: Lists the current state of license utilization and expiration metrics.
2
3
•
Status: Lists the current state of all metrics.
3. To get more details about a metric, highlight the metric and click
Metrics Detail
dialog displays.
View. The View
30
 Loading...