

Page 1

5335B
User Manual
Power Meter
Test Equipment Depot - 800.517.8431 - 99 Washington Street Melrose, MA 02176
TestEquipmentDepot.com
Page 2

Safety Summary
The following safety precautions apply to both operating and maintenance personnel and must be followed during
all phases of operation, service, and repair of this instrument.
Before applying power to this instrument:
• Read and understand the safety and operational information in this manual.
• Apply all the listed safety precautions.
• Verify that the voltage selector at the line power cord input is set to the correct line voltage. Operating the
instrument at an incorrect line voltage will void the warranty.
• Make all connections to the instrument before applying power.
• Do not operate the instrument in ways not specified by this manual or by B&K Precision.
Failure to comply with these precautions or with warnings elsewhere in this manual violates the safety standards
of design, manufacture, and intended use of the instrument. B&K Precision assumes no liability for a
customerâĂŹs failure to comply with these requirements.
Category rating
The IEC 61010 standard defines safety category ratings that specify the amount of electrical energy available and
the voltage impulses that may occur on electrical conductors associated with these category ratings. The category
rating is a Roman numeral of I, II, III, or IV. This rating is also accompanied by a maximum voltage of the circuit to
be tested, which defines the voltage impulses expected and required insulation clearances. These categories are:
Category I (CAT I): Measurement instruments whose measurement inputs are not intended to be connected to the
mains supply. The voltages in the environment are typically derived from a limited-energy transformer or a baery.
Category II (CAT II): Measurement instruments whose measurement inputs are meant to be connected to the
mains supply at a standard wall outlet or similar sources. Example measurement environments are portable tools
and household appliances.
Category III (CAT III): Measurement instruments whose measurement inputs are meant to be connected to the
mains installation of a building. Examples are measurements inside a building’s circuit breaker panel or the wiring
of permanently-installed motors.
Category IV (CAT IV): Measurement instruments whose measurement inputs are meant to be connected to the
primary power entering a building or other outdoor wiring.
Do not use this instrument in an electrical environment with a higher category rating than what is specified in
this manual for this instrument.
i
Page 3

SAFETY SUMMARY ii
You must ensure that each accessory you use with this instrument has a category rating equal to or higher than
the instrument’s category rating to maintain the instrument’s category rating. Failure to do so will lower the
category rating of the measuring system.
Electrical Power
This instrument is intended to be powered from a CATEGORY II mains power environment. The mains power
should be 115 V RMS or 230 V RMS. Use only the power cord supplied with the instrument and ensure it is
appropriate for your country of use.
Ground the Instrument
To minimize shock hazard, the instrument chassis and cabinet must be connected to an electrical safety ground.
This instrument is grounded through the ground conductor of the supplied, three-conductor AC line power cable.
The power cable must be plugged into an approved three-conductor electrical outlet. The power jack and mating
plug of the power cable meet IEC safety standards.
Do not alter or defeat the ground connection. Without the safety ground connection, all accessible conductive
parts (including control knobs) may provide an electric shock. Failure to use a properly-grounded approved outlet
and the recommended three-conductor AC line power cable may result in injury or death.
Unless otherwise stated, a ground connection on the instrument’s front or rear panel is for a reference of potential
only and is not to be used as a safety ground. Do not operate in an explosive or flammable atmosphere.
Do not operate the instrument in the presence of flammable gases or vapors, fumes, or finely-divided particulates.
The instrument is designed to be used in oice-type indoor environments. Do not operate the instrument
• In the presence of noxious, corrosive, or flammable fumes, gases, vapors, chemicals, or finely-divided
particulates.
• In relative humidity conditions outside the instrument’s specifications.
• In environments where there is a danger of any liquid being spilled on the instrument or where any liquid
can condense on the instrument.
• In air temperatures exceeding the specified operating temperatures.
• In atmospheric pressures outside the specified altitude limits or where the surrounding gas is not air.
• In environments with restricted cooling air flow, even if the air temperatures are within specifications.
• In direct sunlight.
Page 4
SAFETY SUMMARY iii
This instrument is intended to be used in an indoor pollution degree 2 environment. The operating temperature
range is 0◦C to 40◦C and 20% to 80% relative humidity, with no condensation allowed. Measurements made by
this instrument may be outside specifications if the instrument is used in non-oice-type environments. Such
environments may include rapid temperature or humidity changes, sunlight, vibration and/or mechanical shocks,
acoustic noise, electrical noise, strong electric fields, or strong magnetic fields.
Do not operate instrument if damaged
If the instrument is damaged, appears to be damaged, or if any liquid, chemical, or other material gets on or inside
the instrument, remove the instrument’s power cord, remove the instrument from service, label it as not to be
operated, and return the instrument to B&K Precision for repair. Notify B&K Precision of the nature of any
contamination of the instrument.
Clean the instrument only as instructed
Do not clean the instrument, its switches, or its terminals with contact cleaners, abrasives, lubricants, solvents,
acids/bases, or other such chemicals. Clean the instrument only with a clean dry lint-free cloth or as instructed in
this manual. Not for critical applications
This instrument is not authorized for use in contact with the human body or for use as a component in a
life-support device or system.
Do not touch live circuits
Instrument covers must not be removed by operating personnel. Component replacement and internal
adjustments must be made by qualified service-trained maintenance personnel who are aware of the hazards
involved when the instrument’s covers and shields are removed. Under certain conditions, even with the power
cord removed, dangerous voltages may exist when the covers are removed. To avoid injuries, always disconnect
the power cord from the instrument, disconnect all other connections (for example, test leads, computer interface
cables, etc.), discharge all circuits, and verify there are no hazardous voltages present on any conductors by
measurements with a properly-operating voltage-sensing device before touching any internal parts. Verify the
voltage-sensing device is working properly before and aer making the measurements by testing with
known-operating voltage sources and test for both DC and AC voltages. Do not aempt any service or adjustment
unless another person capable of rendering first aid and resuscitation is present.
Do not insert any object into an instrument’s ventilation openings or other openings.
Hazardous voltages may be present in unexpected locations in circuitry being tested when a fault condition in the
circuit exists. Fuse replacement
Fuse replacement must be done by qualified service-trained maintenance personnel who are aware of the
Test Equipment Depot - 800.517.8431 - 99 Washington Street Melrose, MA 02176
TestEquipmentDepot.com
Page 5

SAFETY SUMMARY iv
instrument’s fuse requirements and safe replacement procedures. Disconnect the instrument from the power line
before replacing fuses. Replace fuses only with new fuses of the fuse types, voltage ratings, and current ratings
specified in this manual or on the back of the instrument. Failure to do so may damage the instrument, lead to a
safety hazard, or cause a fire. Failure to use the specified fuses will void the warranty. Servicing
Do not substitute parts that are not approved by B&K Precision or modify this instrument. Return the instrument
to B&K Precision for service and repair to ensure that safety and performance features are maintained.
For continued safe use of the instrument
• Do not place heavy objects on the instrument.
• Do not obstruct cooling air flow to the instrument.
• Do not place a hot soldering iron on the instrument.
• Do not pull the instrument with the power cord, connected probe, or connected test lead.
• Do not move the instrument when a probe is connected to a circuit being tested.
Page 6

SAFETY SUMMARY v
CE Declaration of Conformity
This instrument meets the requirements of:
EMC Directive
• EN 61326-1 2006
• EN 61000-3-2-2006
• EN 61000-3-3:1995
Page 7
SAFETY SUMMARY vi
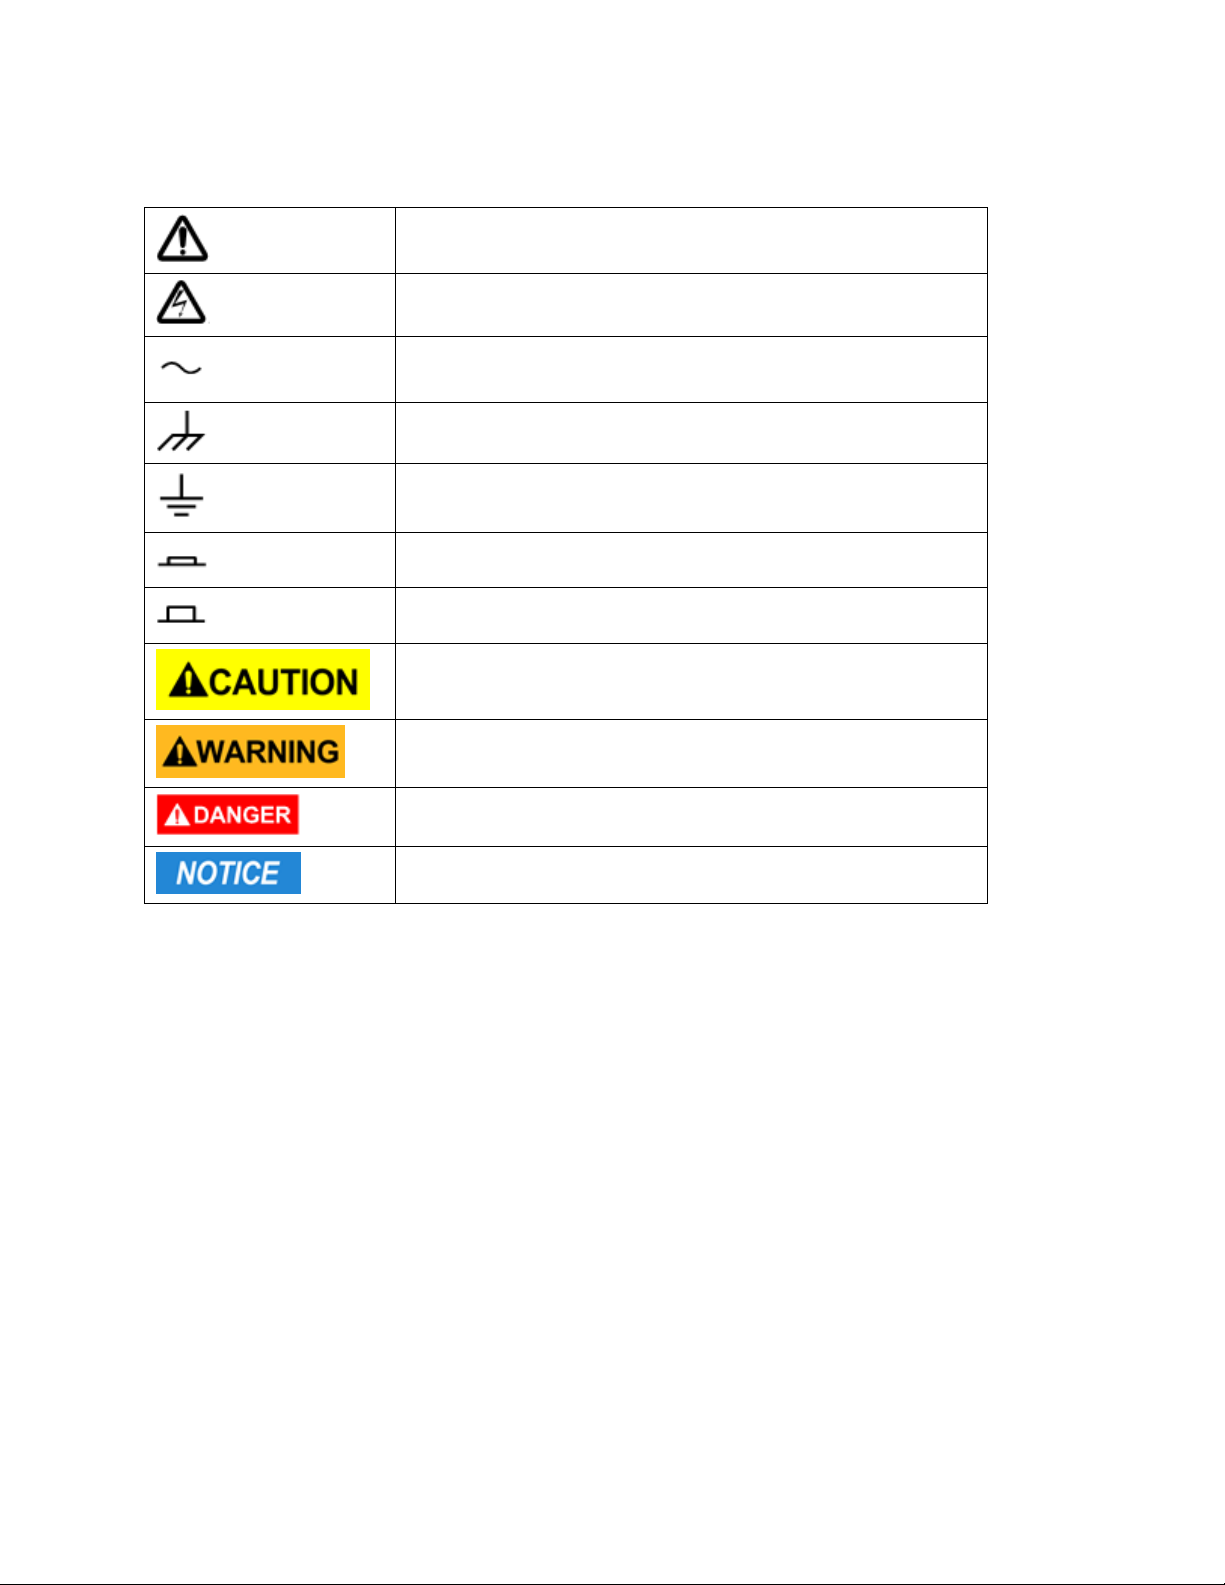
Safety Symbols
Refer to the user manual for warning information to avoid hazard or
personal injury and prevent damage to instrument.
Electric Shock hazard
Alternating current (AC)
Chassis (earth ground) symbol.
Ground terminal
On (Power). This is the In position of the power switch when instrument is ON.
O (Power). This is the Out position of the power switch when instrument is OFF.
CAUTION indicates a hazardous situation which, if not avoided, will
result in minor or moderate injury
WARNING indicates a hazardous situation which, if not avoided,
could result in death or serious injury
DANGER indicates a hazardous situation which, if not avoided, will
result in death or serious injury.
NOTICE is used to address practices not related to physical injury.
Test Equipment Depot - 800.517.8431 - 99 Washington Street Melrose, MA 02176
TestEquipmentDepot.com
Page 8

Contents
Safety Summary i
CE Declaration of Conformity . . . . . . . . . . . . . . . . . . . . . . . . . . . . . . . . . . . . . . . . . . . v
EMC Directive . . . . . . . . . . . . . . . . . . . . . . . . . . . . . . . . . . . . . . . . . . . . . . . . . v
Safety Symbols . . . . . . . . . . . . . . . . . . . . . . . . . . . . . . . . . . . . . . . . . . . . . . . . . . . . vi
Contents vii
1 General Information 1
1.1 Features . . . . . . . . . . . . . . . . . . . . . . . . . . . . . . . . . . . . . . . . . . . . . . . . . . . . 1
1.2 Front Panel . . . . . . . . . . . . . . . . . . . . . . . . . . . . . . . . . . . . . . . . . . . . . . . . . . . 2
1.3 Rear Panel Summary . . . . . . . . . . . . . . . . . . . . . . . . . . . . . . . . . . . . . . . . . . . . . 3
1.4 Measurement Connection Setup . . . . . . . . . . . . . . . . . . . . . . . . . . . . . . . . . . . . . . . 3
1.5 Wiring External Current Sensors . . . . . . . . . . . . . . . . . . . . . . . . . . . . . . . . . . . . . . . 5
1.6 Power up . . . . . . . . . . . . . . . . . . . . . . . . . . . . . . . . . . . . . . . . . . . . . . . . . . . . 6
1.6.1 Power Line Connection . . . . . . . . . . . . . . . . . . . . . . . . . . . . . . . . . . . . . . . 6
1.6.2 Fuse Requirements . . . . . . . . . . . . . . . . . . . . . . . . . . . . . . . . . . . . . . . . . . 6
1.6.3 Power-up Sequence . . . . . . . . . . . . . . . . . . . . . . . . . . . . . . . . . . . . . . . . . . 6
2 Menu 7
2.1 MENU > SYSTEM menus . . . . . . . . . . . . . . . . . . . . . . . . . . . . . . . . . . . . . . . . . . . 7
2.1.1 System Information Menu . . . . . . . . . . . . . . . . . . . . . . . . . . . . . . . . . . . . . . 8
2.1.2 Communication Configuration Menu . . . . . . . . . . . . . . . . . . . . . . . . . . . . . . . 8
2.1.3 System Configuration Menu . . . . . . . . . . . . . . . . . . . . . . . . . . . . . . . . . . . . 9
2.1.4 Self Test . . . . . . . . . . . . . . . . . . . . . . . . . . . . . . . . . . . . . . . . . . . . . . . . 11
2.1.5 System Initialize Menu . . . . . . . . . . . . . . . . . . . . . . . . . . . . . . . . . . . . . . . . 11
2.2 MENU > SETUP menus . . . . . . . . . . . . . . . . . . . . . . . . . . . . . . . . . . . . . . . . . . . . 12
2.2.1 Averaging Setup . . . . . . . . . . . . . . . . . . . . . . . . . . . . . . . . . . . . . . . . . . . 15
2.2.2 External Sensor Setup . . . . . . . . . . . . . . . . . . . . . . . . . . . . . . . . . . . . . . . . 15
2.2.3 Other seings . . . . . . . . . . . . . . . . . . . . . . . . . . . . . . . . . . . . . . . . . . . . . 15
2.2.4 Inrush Measurement Setup . . . . . . . . . . . . . . . . . . . . . . . . . . . . . . . . . . . . . 15
2.3 CAL ZERO . . . . . . . . . . . . . . . . . . . . . . . . . . . . . . . . . . . . . . . . . . . . . . . . . . . 15
2.4 RATIO SET . . . . . . . . . . . . . . . . . . . . . . . . . . . . . . . . . . . . . . . . . . . . . . . . . . . 15
3 External Current Sensor 16
4 Front Panel Operation 17
4.1 Measurement Setup . . . . . . . . . . . . . . . . . . . . . . . . . . . . . . . . . . . . . . . . . . . . . . 17
4.1.1 Crest factor . . . . . . . . . . . . . . . . . . . . . . . . . . . . . . . . . . . . . . . . . . . . . . 17
4.1.2 Set Measurement Range . . . . . . . . . . . . . . . . . . . . . . . . . . . . . . . . . . . . . . . 17
4.2 Voltage and current range . . . . . . . . . . . . . . . . . . . . . . . . . . . . . . . . . . . . . . . . . . 18
4.2.1 Fixed range . . . . . . . . . . . . . . . . . . . . . . . . . . . . . . . . . . . . . . . . . . . . . . 18
4.2.2 Auto Range . . . . . . . . . . . . . . . . . . . . . . . . . . . . . . . . . . . . . . . . . . . . . . 18
4.3 Measurement interval . . . . . . . . . . . . . . . . . . . . . . . . . . . . . . . . . . . . . . . . . . . . . 19
4.4 Filter and Crest Factor Seing . . . . . . . . . . . . . . . . . . . . . . . . . . . . . . . . . . . . . . . . 20
vii
Page 9

CONTENTS viii
4.4.1 Filter . . . . . . . . . . . . . . . . . . . . . . . . . . . . . . . . . . . . . . . . . . . . . . . . . . 20
4.5 Averaging Function . . . . . . . . . . . . . . . . . . . . . . . . . . . . . . . . . . . . . . . . . . . . . . 21
4.5.1 Index averaging . . . . . . . . . . . . . . . . . . . . . . . . . . . . . . . . . . . . . . . . . . . . 22
4.5.2 Linear averaging . . . . . . . . . . . . . . . . . . . . . . . . . . . . . . . . . . . . . . . . . . . 22
4.5.3 Harmonic measurement averaging . . . . . . . . . . . . . . . . . . . . . . . . . . . . . . . . . 22
5 Meter Display 23
5.0.1 Operation steps . . . . . . . . . . . . . . . . . . . . . . . . . . . . . . . . . . . . . . . . . . . . 23
6 Waveform Display Function 25
6.1 Basic Concepts . . . . . . . . . . . . . . . . . . . . . . . . . . . . . . . . . . . . . . . . . . . . . . . . 25
6.1.1 Introduction of so keys on the interface . . . . . . . . . . . . . . . . . . . . . . . . . . . . . 25
6.1.2 Vertical calibration . . . . . . . . . . . . . . . . . . . . . . . . . . . . . . . . . . . . . . . . . . 27
6.1.3 Horizontal calibration . . . . . . . . . . . . . . . . . . . . . . . . . . . . . . . . . . . . . . . . 27
6.1.4 Trigger delay . . . . . . . . . . . . . . . . . . . . . . . . . . . . . . . . . . . . . . . . . . . . . 27
6.1.5 Trigger waveform . . . . . . . . . . . . . . . . . . . . . . . . . . . . . . . . . . . . . . . . . . . 27
6.2 Adjustment of Measurement Parameters . . . . . . . . . . . . . . . . . . . . . . . . . . . . . . . . . . 27
6.2.1 Operation steps . . . . . . . . . . . . . . . . . . . . . . . . . . . . . . . . . . . . . . . . . . . . 28
6.3 Seing of Trigger Configuration . . . . . . . . . . . . . . . . . . . . . . . . . . . . . . . . . . . . . . . 28
6.3.1 External trigger input (Ext) . . . . . . . . . . . . . . . . . . . . . . . . . . . . . . . . . . . . . 28
7 Harmonic Measurement Function 30
7.1 Basic Concepts . . . . . . . . . . . . . . . . . . . . . . . . . . . . . . . . . . . . . . . . . . . . . . . . 30
7.1.1 Introduction of harmonic information . . . . . . . . . . . . . . . . . . . . . . . . . . . . . . . 31
7.2 Seing of Harmonic Measurement Configuration . . . . . . . . . . . . . . . . . . . . . . . . . . . . . 31
7.2.1 Parameter descriptions: . . . . . . . . . . . . . . . . . . . . . . . . . . . . . . . . . . . . . . . 32
7.2.2 PLL source . . . . . . . . . . . . . . . . . . . . . . . . . . . . . . . . . . . . . . . . . . . . . . . 33
7.2.3 Harmonic analysis order . . . . . . . . . . . . . . . . . . . . . . . . . . . . . . . . . . . . . . . 34
8 Integral Operation Function 36
8.1 Basic Concepts . . . . . . . . . . . . . . . . . . . . . . . . . . . . . . . . . . . . . . . . . . . . . . . . 36
8.2 Introduction of so keys on the interface . . . . . . . . . . . . . . . . . . . . . . . . . . . . . . . . . . 37
8.3 Integral measurement display information . . . . . . . . . . . . . . . . . . . . . . . . . . . . . . . . . 37
8.3.1 Integral operation . . . . . . . . . . . . . . . . . . . . . . . . . . . . . . . . . . . . . . . . . . 38
8.4 Specification . . . . . . . . . . . . . . . . . . . . . . . . . . . . . . . . . . . . . . . . . . . . . . . . . . 38
8.5 Seing of Integral Measurement Configuration . . . . . . . . . . . . . . . . . . . . . . . . . . . . . . 39
8.5.1 Parameter descriptions: . . . . . . . . . . . . . . . . . . . . . . . . . . . . . . . . . . . . . . . 40
8.6 Integration . . . . . . . . . . . . . . . . . . . . . . . . . . . . . . . . . . . . . . . . . . . . . . . . . . . 41
9 Remote Operation 42
9.1 RS-232 Interface . . . . . . . . . . . . . . . . . . . . . . . . . . . . . . . . . . . . . . . . . . . . . . . . 42
9.1.1 RS-232 troubleshooting . . . . . . . . . . . . . . . . . . . . . . . . . . . . . . . . . . . . . . . 42
9.1.2 RS-232 Communication seings . . . . . . . . . . . . . . . . . . . . . . . . . . . . . . . . . . . 43
9.2 USB interface . . . . . . . . . . . . . . . . . . . . . . . . . . . . . . . . . . . . . . . . . . . . . . . . . 43
9.3 GPIB interface . . . . . . . . . . . . . . . . . . . . . . . . . . . . . . . . . . . . . . . . . . . . . . . . . 44
9.4 LAN interface . . . . . . . . . . . . . . . . . . . . . . . . . . . . . . . . . . . . . . . . . . . . . . . . . 44
10 Specifications 45
11 Routine Maintenance 49
11.1 Self-inspection . . . . . . . . . . . . . . . . . . . . . . . . . . . . . . . . . . . . . . . . . . . . . . . . . 49
11.2 Error Information References . . . . . . . . . . . . . . . . . . . . . . . . . . . . . . . . . . . . . . . . . 49
11.2.1 Prompt Message List . . . . . . . . . . . . . . . . . . . . . . . . . . . . . . . . . . . . . . . . . 49
11.2.2 Error information list . . . . . . . . . . . . . . . . . . . . . . . . . . . . . . . . . . . . . . . . . 49
11.3 Daily maintenance . . . . . . . . . . . . . . . . . . . . . . . . . . . . . . . . . . . . . . . . . . . . . . 51
Page 10

CONTENTS ix
11.3.1 Equipment cleaning . . . . . . . . . . . . . . . . . . . . . . . . . . . . . . . . . . . . . . . . . 51
11.3.2 Initialize . . . . . . . . . . . . . . . . . . . . . . . . . . . . . . . . . . . . . . . . . . . . . . . . 51
11.4 Troubleshooting . . . . . . . . . . . . . . . . . . . . . . . . . . . . . . . . . . . . . . . . . . . . . . . . 52
12 LIMITED THREE-YEAR WARRANTY 54
13 Service Information 55
Test Equipment Depot - 800.517.8431 - 99 Washington Street Melrose, MA 02176
TestEquipmentDepot.com
Page 11

Chapter 1
General Information
Note: The contents of this manual and included specifications are subject to change go to for the latest version.
(Manual version: 2017-10-13 )
Figure 1.1 shows a schematic Diagram of Front Panel of BK5335B Series Power Meter and Diagram of Key
Functions.
The BK5335B power meter measures AC and DC inputs up to 600 Vrms and 20 Arms from DC to 100kHz. It
measures voltage, current, power, frequency, power factor, phase and harmonic parameters up to the 50th order.
Remote control is available over USB, GPIB, RS232 and LAN communication interfaces. Screen captures are saved
via the USB peripheral port located on the front panel. Voltage and current measurement precision is nominally
0.1%.
1.1 Features
• 4.3-inch color LCD
• Configurable display of measurements in 3 formats
• Input range: 600Vrms/20Arms from DC to 100kHz
• Voltage, current, power, harmonics and other parameters are measured at the same time simultaneously
• Up to 0.1% voltage and current measurement accuracy
• Harmonic measurement up to the 50th-order harmonic
• Screen captures are saved to USB via the front panel connector
• Integration measurement of power produced or consumed
• Frequency measurement
• Remote control via USB, GPIB, RS232 and LAN communication interfaces
1
Page 12

CHAPTER 1. GENERAL INFORMATION 2
1.2 Front Panel
Figure 1.1: Front Panel
Power Buon Rotary Knob
4.3” LCD Arrow Keys
USB So-keys
Main Functions So-keys
Menu, Enter, ESC Print (Screen Capture)
Key Name and function
Waveform Display key: press to view waveforms. See Chapter 6
Harmonic Measurement key: For viewing harmonic measurements. See Chapter 7
Basic Measurement key: The normal measurement screen. See Chapter ??
Integral Measurement key: Measurements over time. See Chapter 8
Menu key, Press to view and configure seings. See Chapter 2
Enter key: Press to commit a seing or value.
Image Save key: press to save a hardcopy of the screen to the USB host port on the front panel.
Test Equipment Depot - 800.517.8431 - 99 Washington Street Melrose, MA 02176
TestEquipmentDepot.com
Page 13

CHAPTER 1. GENERAL INFORMATION 3
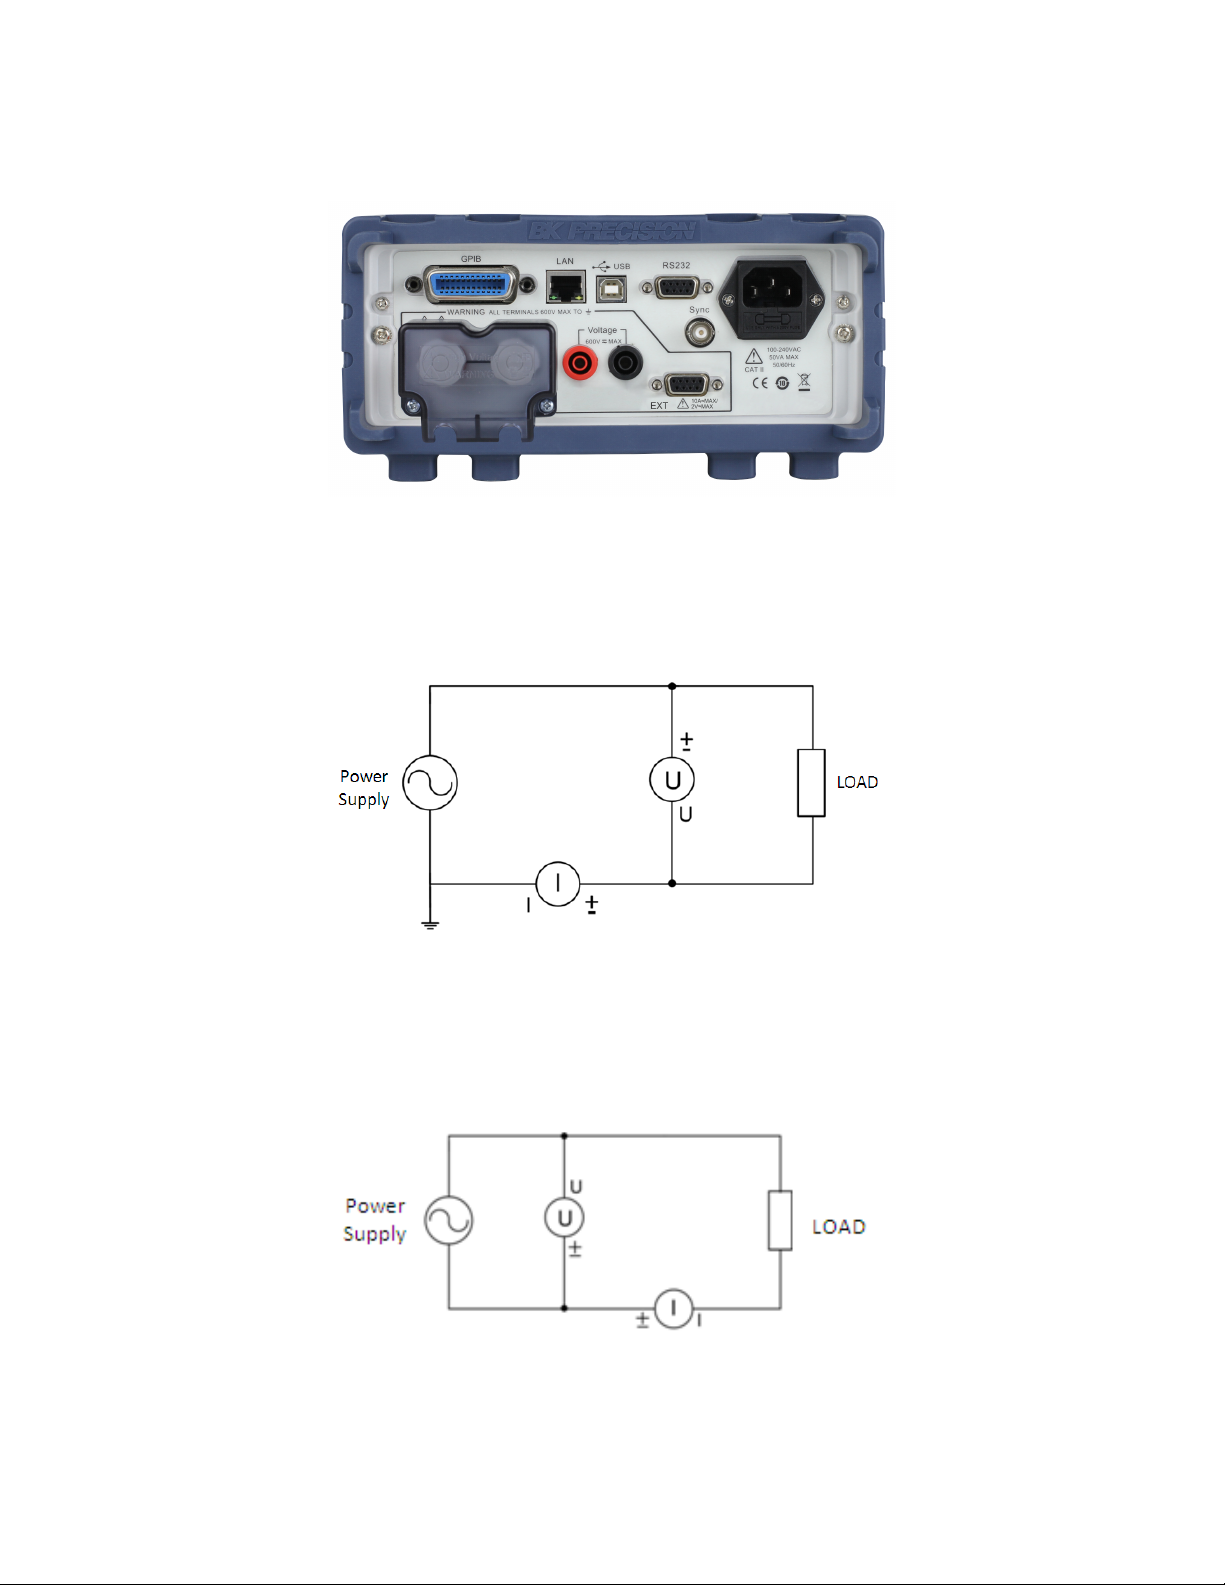
1.3 Rear Panel Summary
Figure 1.2: Rear View
1 GPIB Connector 6 AC Line
2 LAN Connector 7 External Current Sensor
3 USB Connector 8 Voltage Input
4 RS-232 Connector 9 Current Shunt Input
5 Synchronization BNC
1.4 Measurement Connection Setup
Depending on the amount of current that will flow through the meter, 2 configurations are specified.
1. Remove the protective cover over the current input terminals. See Figure 1.3
2. Connect the circuit under measurement as shown in the wiring diagrams, Low current, see Figure 1.4, high
current see Figure 1.5.
3. Use cables rated to conduct the current and withstand the voltage being measured.
4. For safety, re-aach the protective covers over the input terminals.
Page 14
CHAPTER 1. GENERAL INFORMATION 4
Figure 1.3: Current terminal cover
Figure 1.4: Low Current Wiring Setup
Figure 1.5: High Current Wiring Setup
Page 15
CHAPTER 1. GENERAL INFORMATION 5
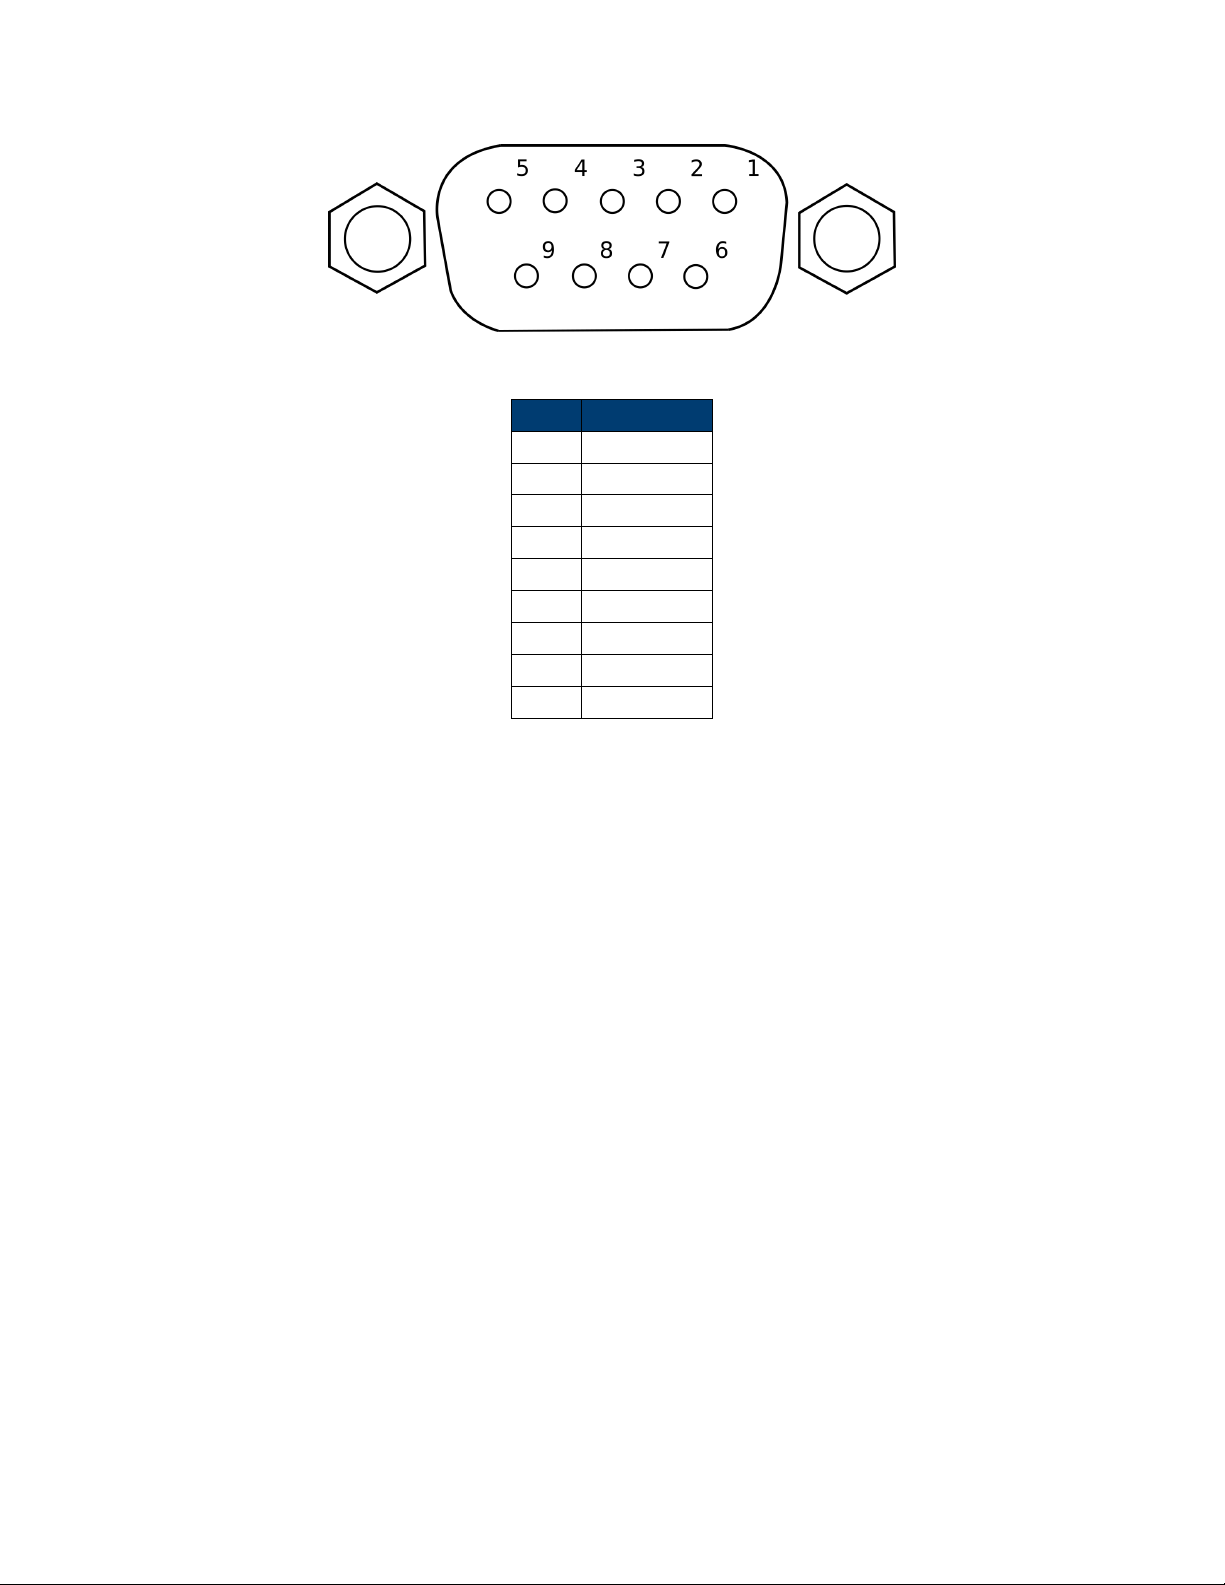
Figure 1.6: External Sensor Interface: DE-9 Connector
Pin # Description
1 +12 V
2 GND
3 -12 V
4 Signal GND
5 Voltage
6 NC
7 Current
8 NC
9 NC
Table 1.1: External Sensor Connector Pinout
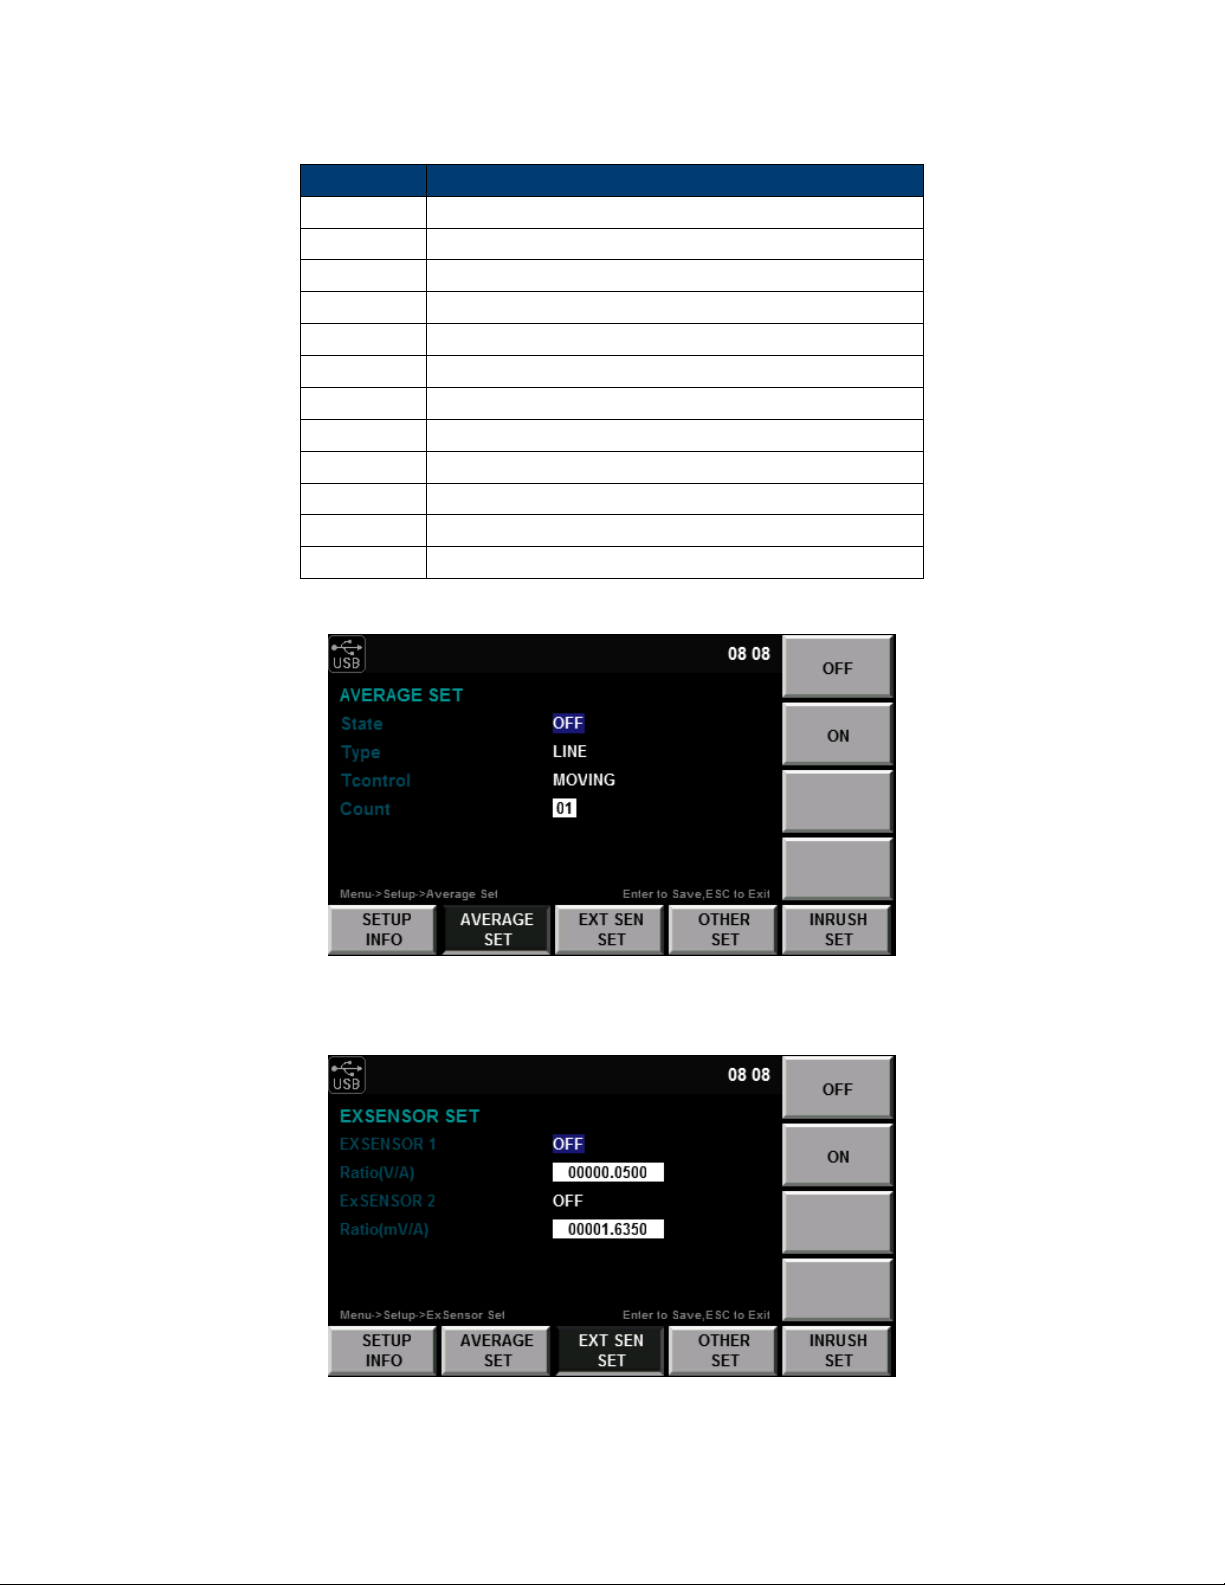
1.5 Wiring External Current Sensors
This power meter accepts a wide range of external current sensors. Measurement is achieved by applying a scaling
factor to the voltage sensed at the external sensor input. A ratio of Volts to Amps is set in the EXSENSOR SET
menu of the instrument. See Section 3 for details. Always disconnect the main current input when using an
external sensor. The ports are electrically connected and if both are connected, measurement error and damage
may occur.
1. Connect the power supply, external current sensor, electronic load and BK5335B Power Meter as shown in
Figure 1.6
2. Turn on the power meter
3. Select Menu > SETUP > EXT SEN SET to access the External Sensor Setup interface
4. Use the arrow keys to select ExSENSOR2 or EXSENSOR1, and then press ON from the so-keys to enable
the external current sensor.
5. Set the “Ratio” using the arrow keys and knob to set the value in V/A (EXSENSOR1) or mV/A (ExSENSOR2)
6. Press Enter to save the seings
7. Press Esc to exit the seings
Test Equipment Depot - 800.517.8431 - 99 Washington Street Melrose, MA 02176
TestEquipmentDepot.com
Page 16

CHAPTER 1. GENERAL INFORMATION 6
Figure 1.7: Fuse Holder
1.6 Power up
1.6.1 Power Line Connection
Input power requirements:
AC Voltage 110 V ±10% or 220 V ±10%
Frequency 47 Hz – 63 Hz
1.6.2 Fuse Requirements
An AC input fuse is necessary when powering the instrument. Refer to Table 1.2 for the fuse requirements.
Model Fuse Specification (110 V) Fuse Specification (220 V)
5335B T 10 A, 250 V T 6.3 A, 250 V
Table 1.2: Required Fuses
1.6.2.1 Fuse Replacement
1. Disconnect the power cord.
2. Locate the fuse box in the rear panel, beneath the AC power socket. Figure 1.7
3. With a small flat blade screwdriver, insert the blade into the fuse box slit to pull and slide out the fuse box.
4. Pull out the fuse inside to check and/or replace with the appropriate fuse for the line voltage used.
5. Insert the fuse in the same location.
1.6.3 Power-up Sequence
Connect AC power cord to the AC receptacle in the rear panel and press the power switch to the (ON) position to
turn ON the instrument. It will display the BIOS version then run through a self-test procedure, Figures ??, 2.9.
Page 17
Chapter 2
Menu
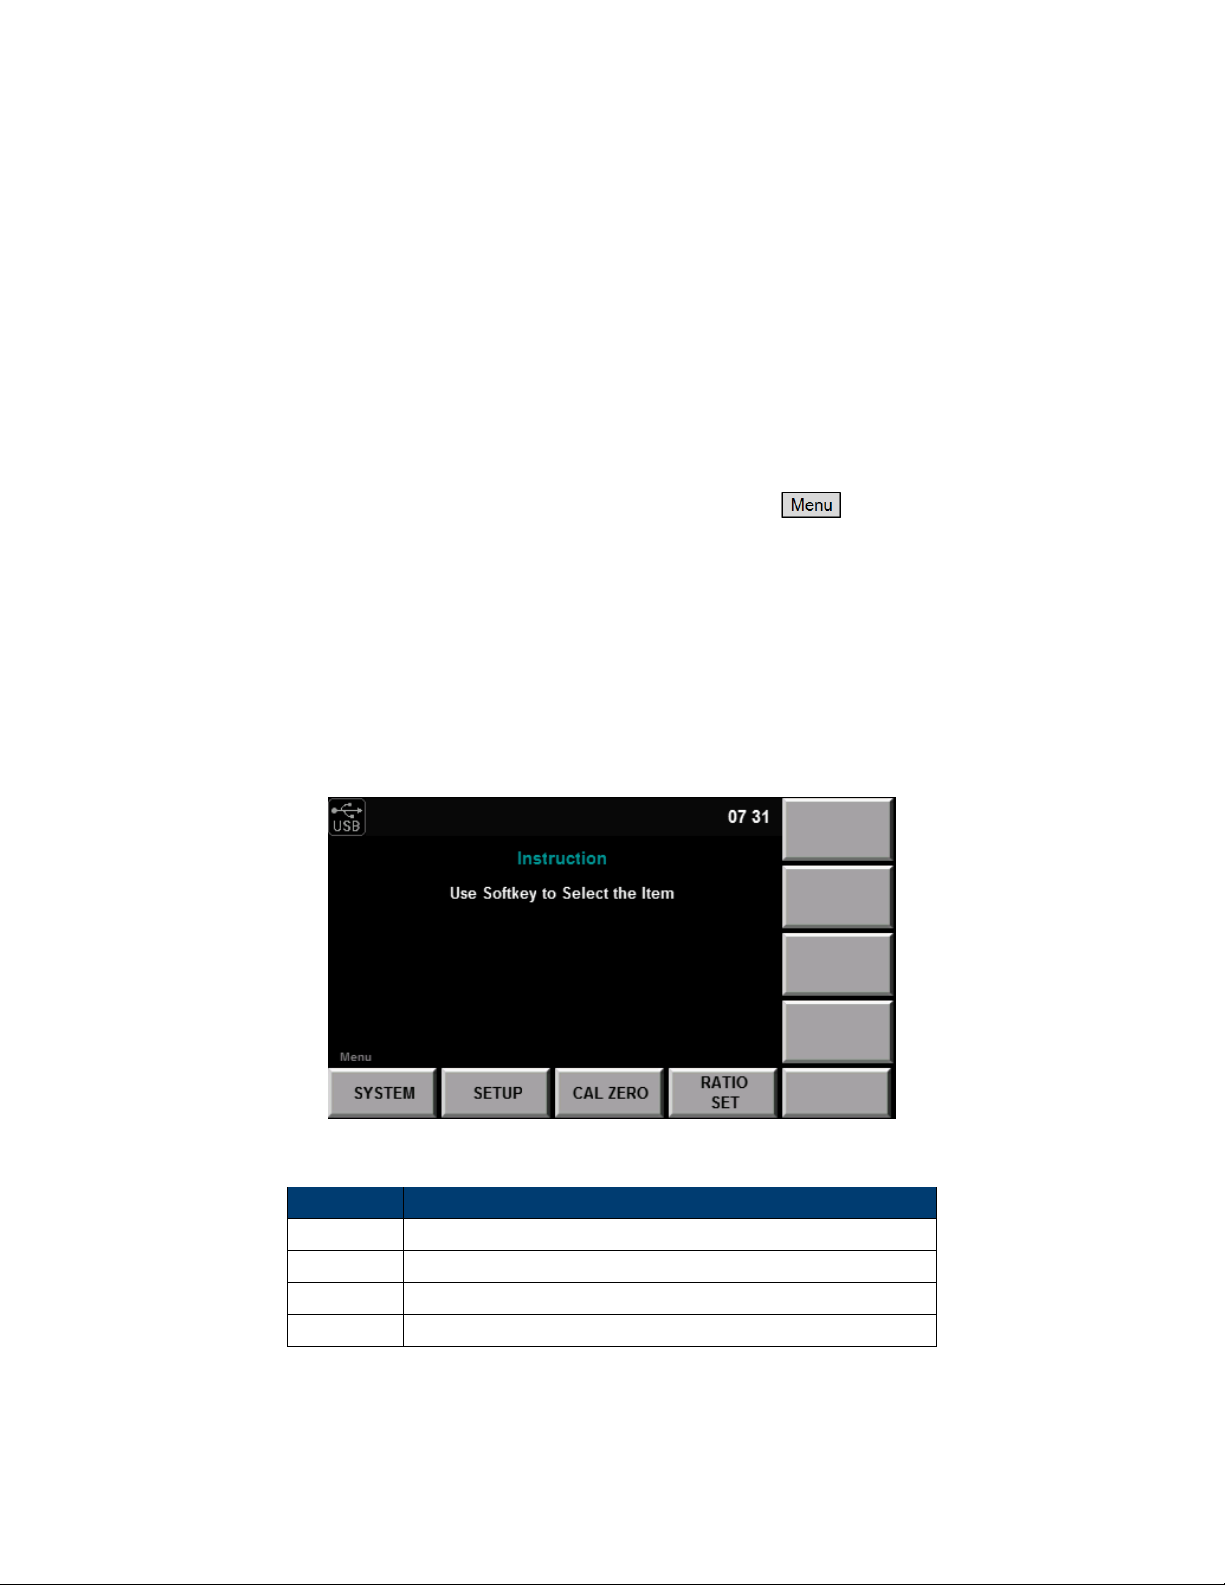
Configuration of system-wide seings is done from the “Menu”. Pressing the buon enters the
configuration/system menu, Figure 2.1.
From the main menu, the so-keys at the boom of the screen provide access to the configuration screens. See
Table 2.1
2.1 MENU > SYSTEM menus
From the system menu, system-wide functions are set and viewed. Figure ??, details such as the LAN MAC
address, date, screen brightness, system initialization (seings reset), and self test are accessed here. See Table 2.2
Figure 2.1: Configuration/System Menu
Function Description
SYSTEM View and change overall system information and parameters
SETUP Device measurement and measurement configuration seings
CAL ZERO Zero the meter
RATIO SET Change the overall scaling factor for measurements
Table 2.1: Main “Menu” functions
7
Page 18
CHAPTER 2. MENU 8
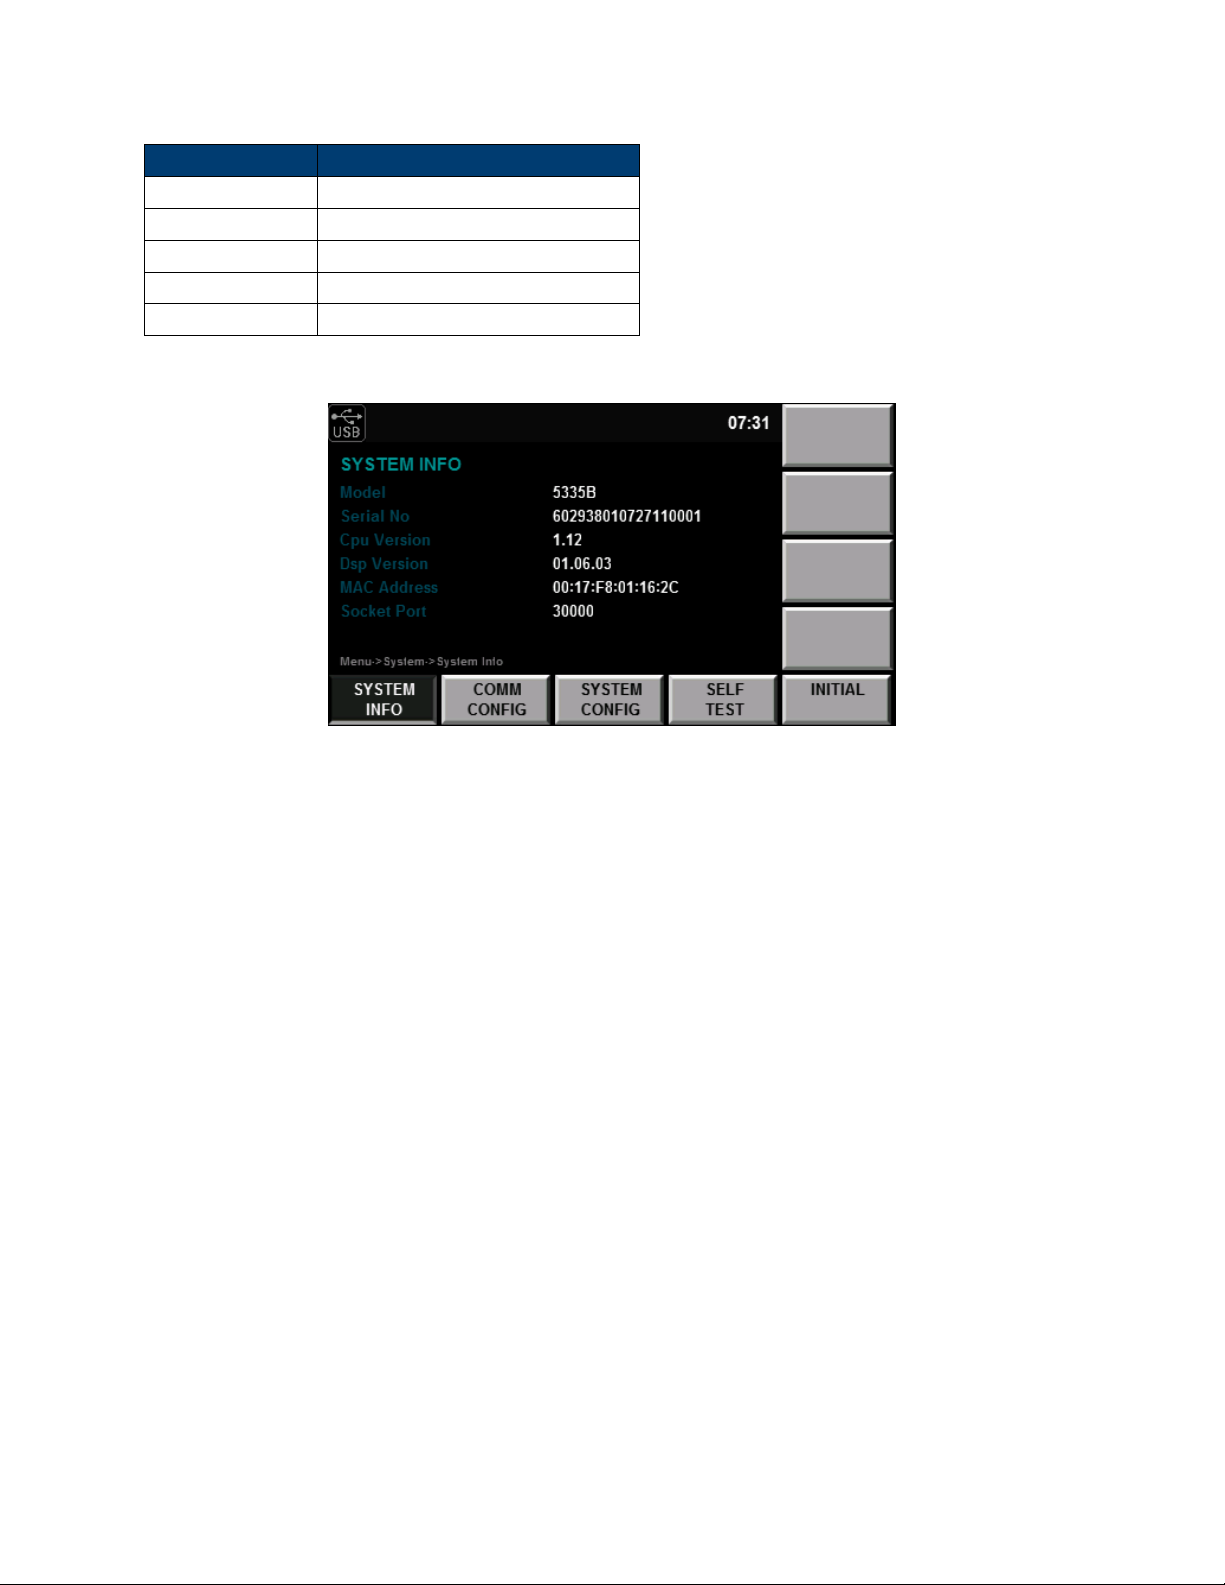
Function Description
SYSTEM INFO System details, Model, Serial, etc.. .
COMM CONFIG Setup the communication interfaces
SYSTEM CONFIG Set date, time, beep and brightness
SELF TEST Perform a self diagnostic
INITIAL Reset device seings
Table 2.2: System Menu sub-menus
Figure 2.2: System Info Screen
2.1.1 System Information Menu
Information about the device is listed in this menu. The serial number listed is that used in production at the
factory and does not match the label. When contacting B+K, use the serial number on the label.
2.1.2 Communication Configuration Menu
Available remote interfaces are RS-232, USBTMC, GPIB and LAN. For details about commands and use of the
remote interfaces, see the programming manual. The manual is found on the product page of the 5335B at
www.bkprecision.com
2.1.2.1 RS-232
This interface support 6 common baudrates: 4800, 9600, 19200, 38400, 57600, 115200. Use the arrow keys to
navigate the menu screen and the so-keys to select the desired baudrate. The number of data bits, parity and
stop bits are preset and unchangeable. (8 bits, no parity, and 1 stop bit, so called N-8-1). See Figure 2.3.
2.1.2.2 USB
This unit operates as a USBTMC (USB Test and Measurement) device. There are no configuration options for this
interface. Figure 2.4
Test Equipment Depot - 800.517.8431 - 99 Washington Street Melrose, MA 02176
TestEquipmentDepot.com
Page 19

CHAPTER 2. MENU 9
Figure 2.3: COMM Configuration - RS-232
Figure 2.4: COMM Configuration - USB
2.1.2.3 GPIB
The GPIB interface may be configured to addresses 1 through 30. Use the arrow keys to select the numeric field
beside “GPIB Address” and use the rotary knob to change the value. The user may select each digit by the arrow
keys as well. Figure 2.5
2.1.2.4 LAN
The LAN (Ethernet) interface may be configured as either DHCP or static. Use the arrow keys to select the IP
Mode field. When DHCP is selected, the current IP, subnet, and gateway are shown on screen (Figure 2.6). When
“MANU” is selected (static mode) (Figure 2.7), the screen shows fields for seing the IP, subnet, and gateway.
Using the arrow keys and the rotary knob allows the user to move between fields and digits, and use the rotary
knob to change the value.
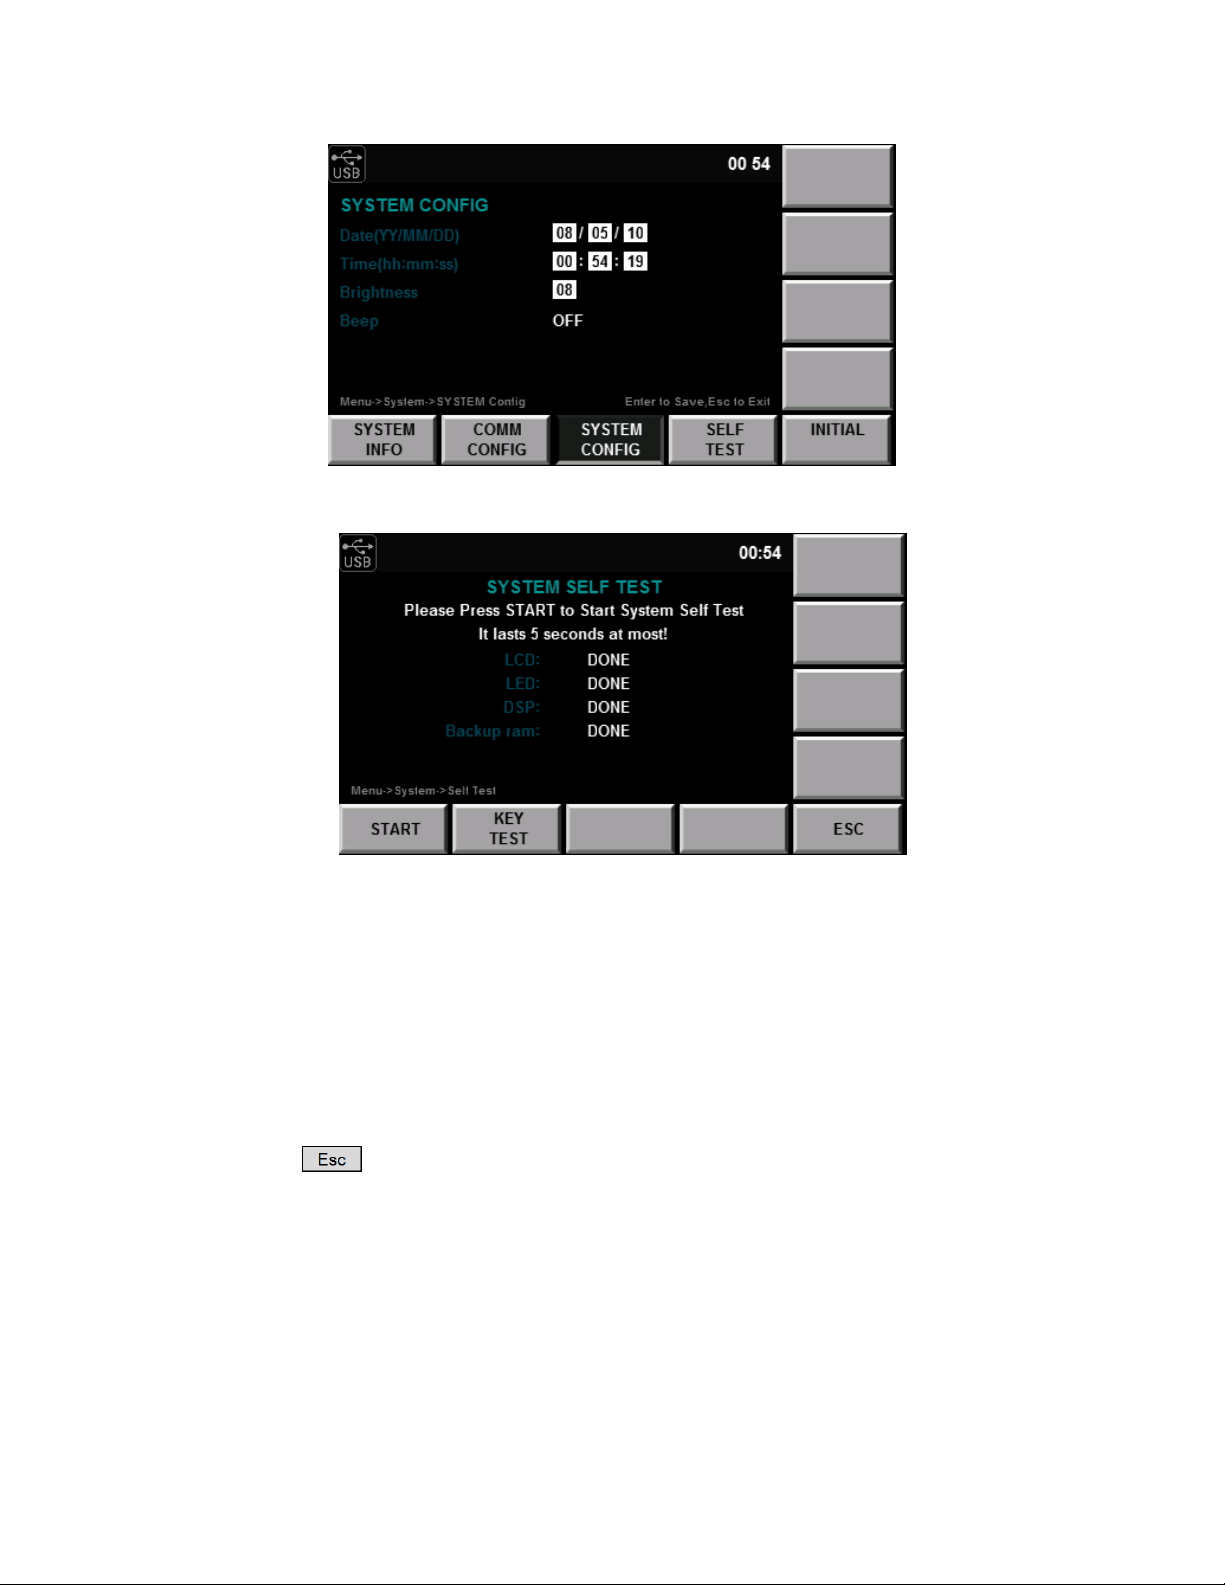
2.1.3 System Configuration Menu
From this menu, seing the date, time, brightness, and the state of the beep function is set. Use the arrow keys to
navigate the fields, and the rotary knob to change the value. For the beep function, the so keys are used to
change the value. When seings are changed, press the key to commit the changes. See Figure 2.8.
Page 20

CHAPTER 2. MENU 10
Figure 2.5: COMM Configuration - GPIB
Figure 2.6: COMM Configuration - LAN (DHCP)
Figure 2.7: COMM Configuration - LAN (Manual (static))
Page 21
CHAPTER 2. MENU 11
Figure 2.8: System Config Menu
h!
Figure 2.9: System Self Test
2.1.4 Self Test
The unit has a built in self test. This function tests the LEDs, the screen and some of the internal electronics,
Figure 2.9. When the test is running, it cycles through colors on the LCD, and lights up the individual LEDs that
illuminate the front panel buons. When complete, the results are displayed on screen, DONE for the LCD and
LEDs, and OK for the internal electronic tests.
From this screen, a test of each buon is also available. A representation of all the buons appears on screen aer
selecting the “KEY TEST” key, pressing the individual keys will highlight the text on screen indicating the buon is
working. Press the to exit the test.
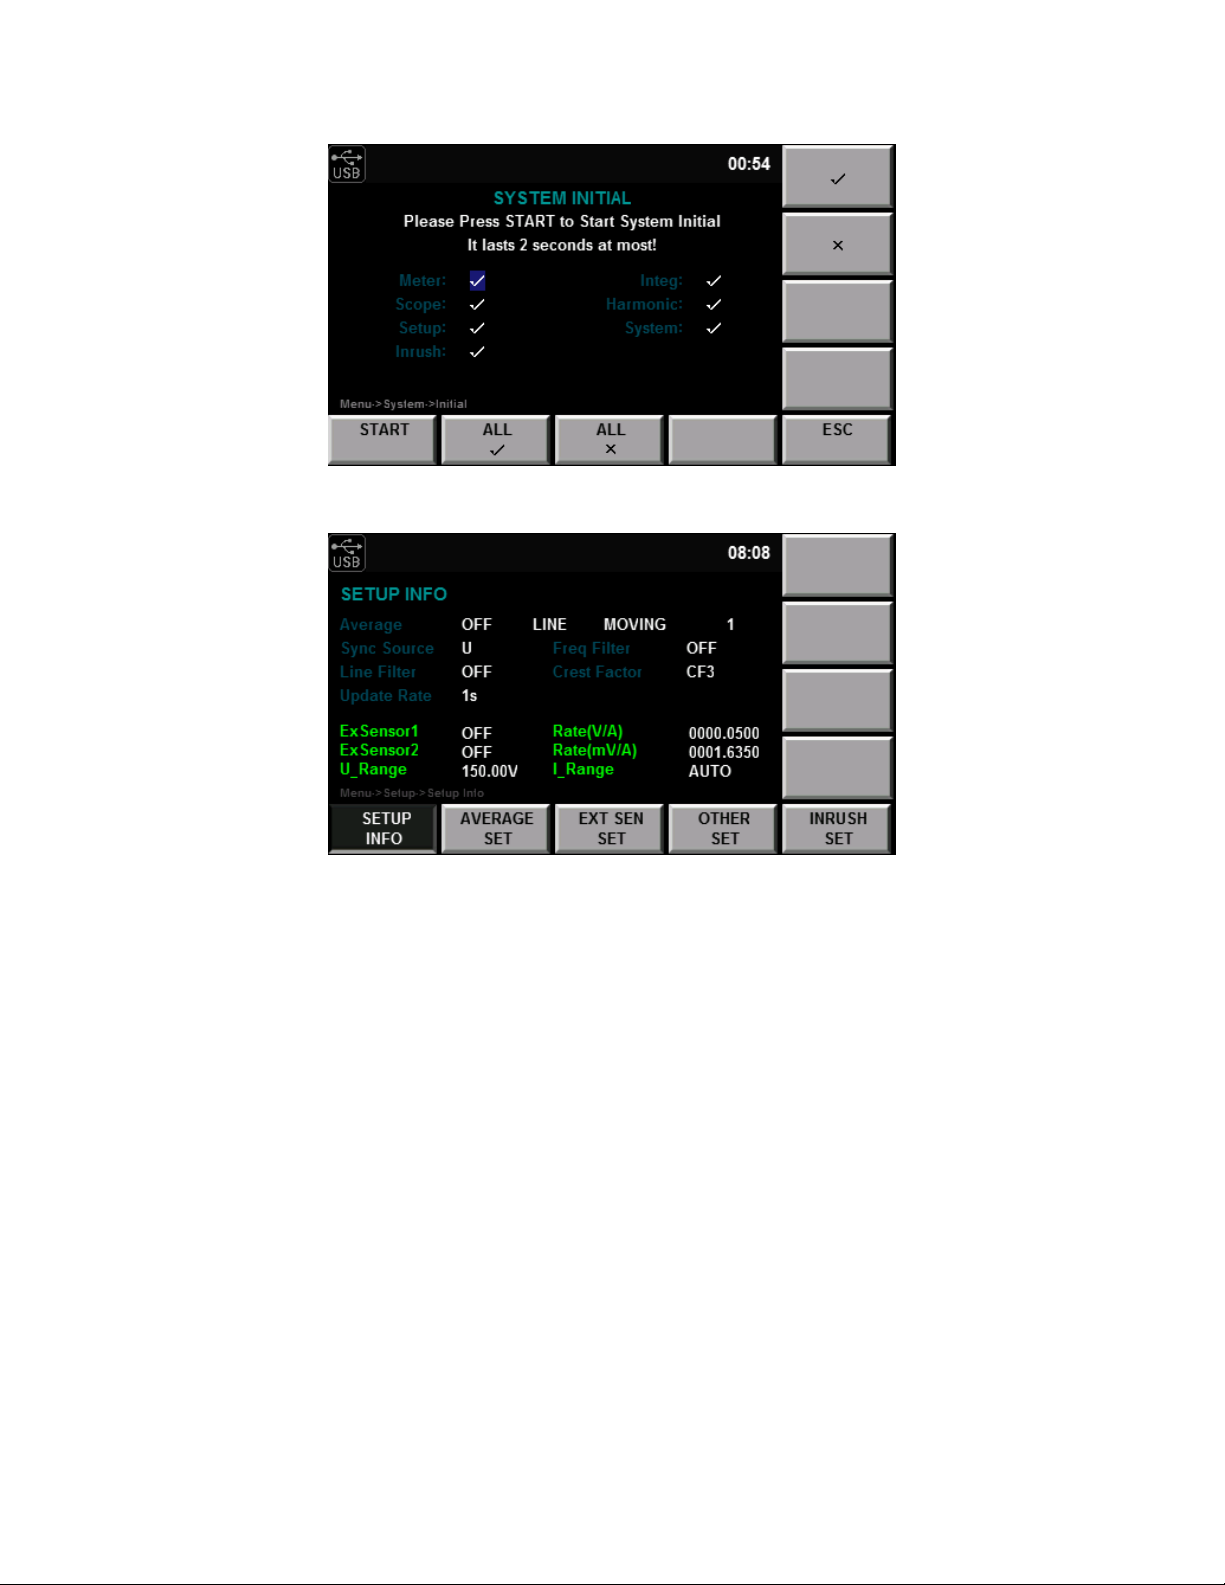
2.1.5 System Initialize Menu
System initialization will bring the manifold functions to their initial states. By navigating the functions listed
on-screen and either selecting the check mark or the “x” via the so-keys, the function will be initialized or le
alone respectively. Figure 2.10
Test Equipment Depot - 800.517.8431 - 99 Washington Street Melrose, MA 02176
TestEquipmentDepot.com
Page 22
CHAPTER 2. MENU 12
Figure 2.10: System Initialize Menu
Figure 2.11: Setup Information Screen
2.2 MENU > SETUP menus
From the “MENU” function, the next page is the “SETUP” so-key (Figure 2.11. This screen essentially gives a
summary of the seings controlling measurements.
Page 23
CHAPTER 2. MENU 13
Field Description
Average Listing of the average mode seings. See Averaging Setup
Sync Source The measurement synchronization signal source. See ??
Line Filter The state of the line filter.
Update rate How oen to measure?
Freq Filter The state of the frequency filter.
Crest Factor The Crest Factor seing state
ExSensor1 External Sensor 1 state (on/o)
ExSensor2 External Sensor 2 state (on/o)
U_Range The voltage range seing.
Rate(V/A) External Sensor 1’s scale value
Rate(mV/A) External Sensor 2’s scale value
I_Range The current range seing.
Figure 2.12: Ratio Set Menu
Figure 2.13: Ratio Set Menu
Page 24
CHAPTER 2. MENU 14
Figure 2.14: Ratio Set Menu
Figure 2.15: Ratio Set Menu
Figure 2.16: Calibration Menu
Test Equipment Depot - 800.517.8431 - 99 Washington Street Melrose, MA 02176
TestEquipmentDepot.com
Page 25
CHAPTER 2. MENU 15
Figure 2.17: Ratio Setup Menu
2.2.1 Averaging Setup
2.2.2 External Sensor Setup
2.2.3 Other seings
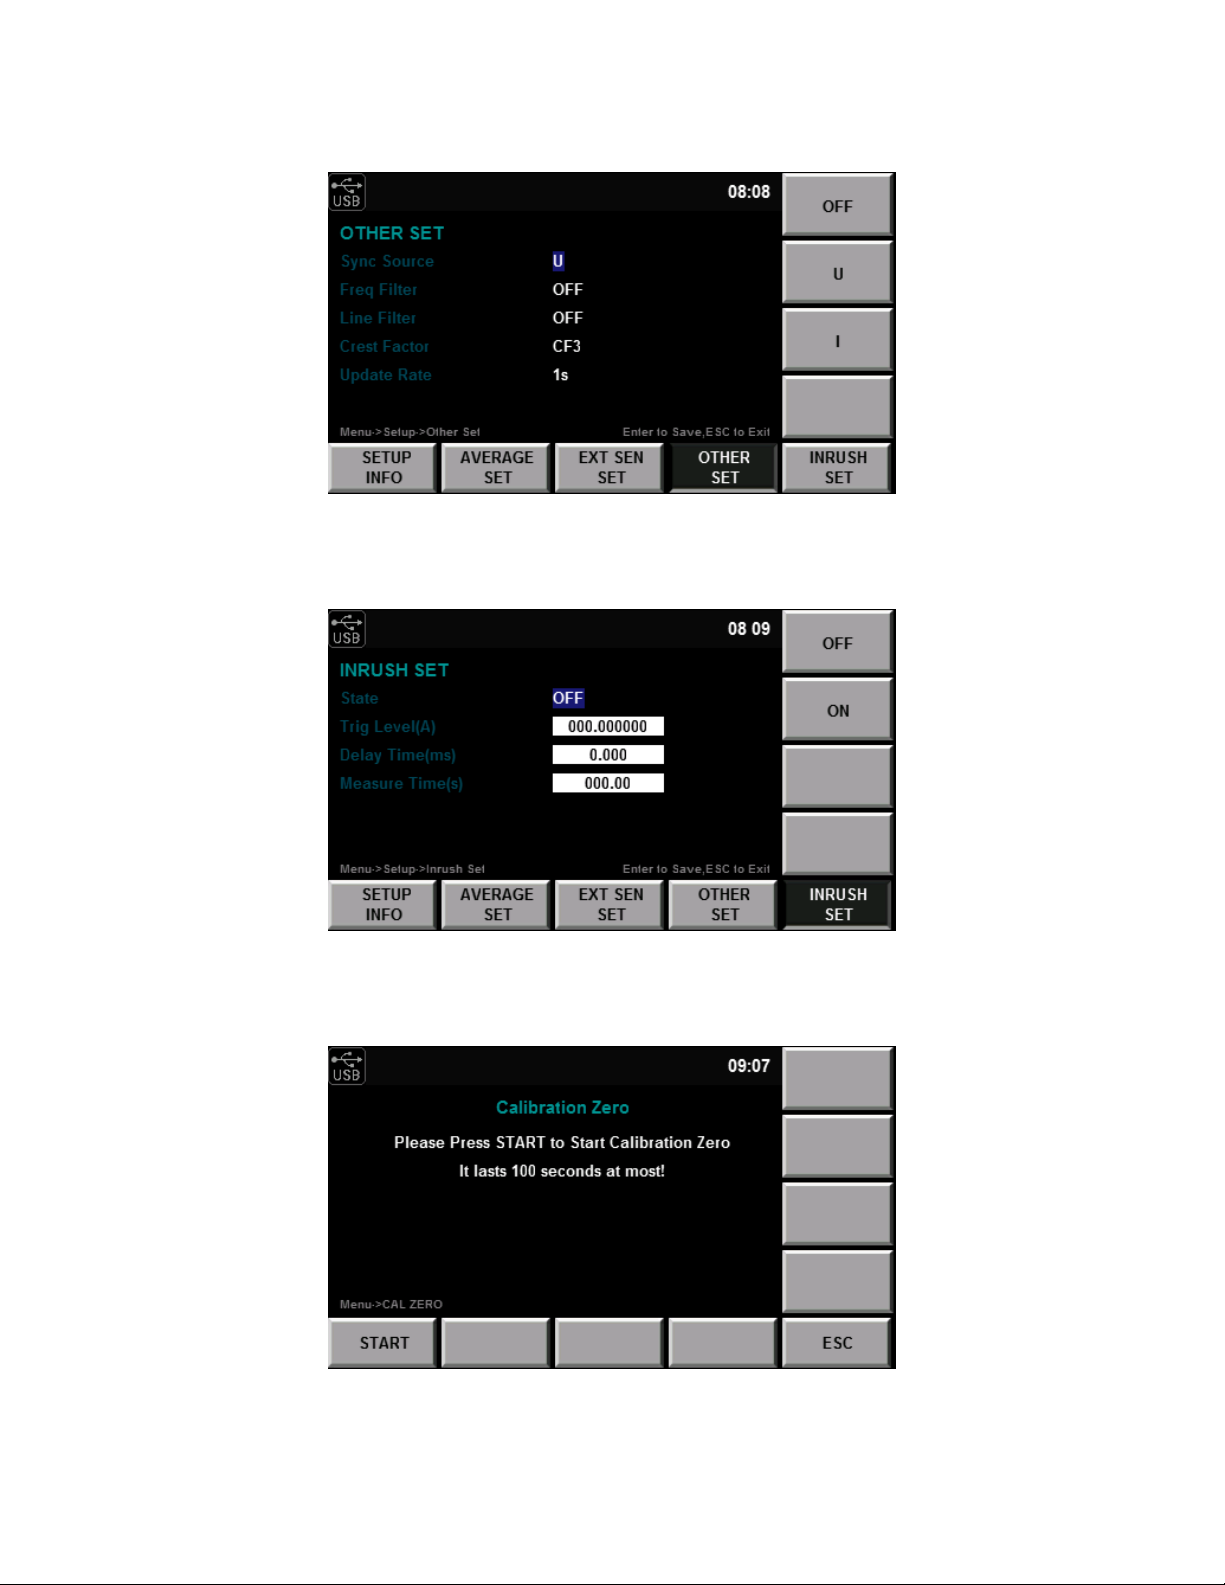
2.2.4 Inrush Measurement Setup
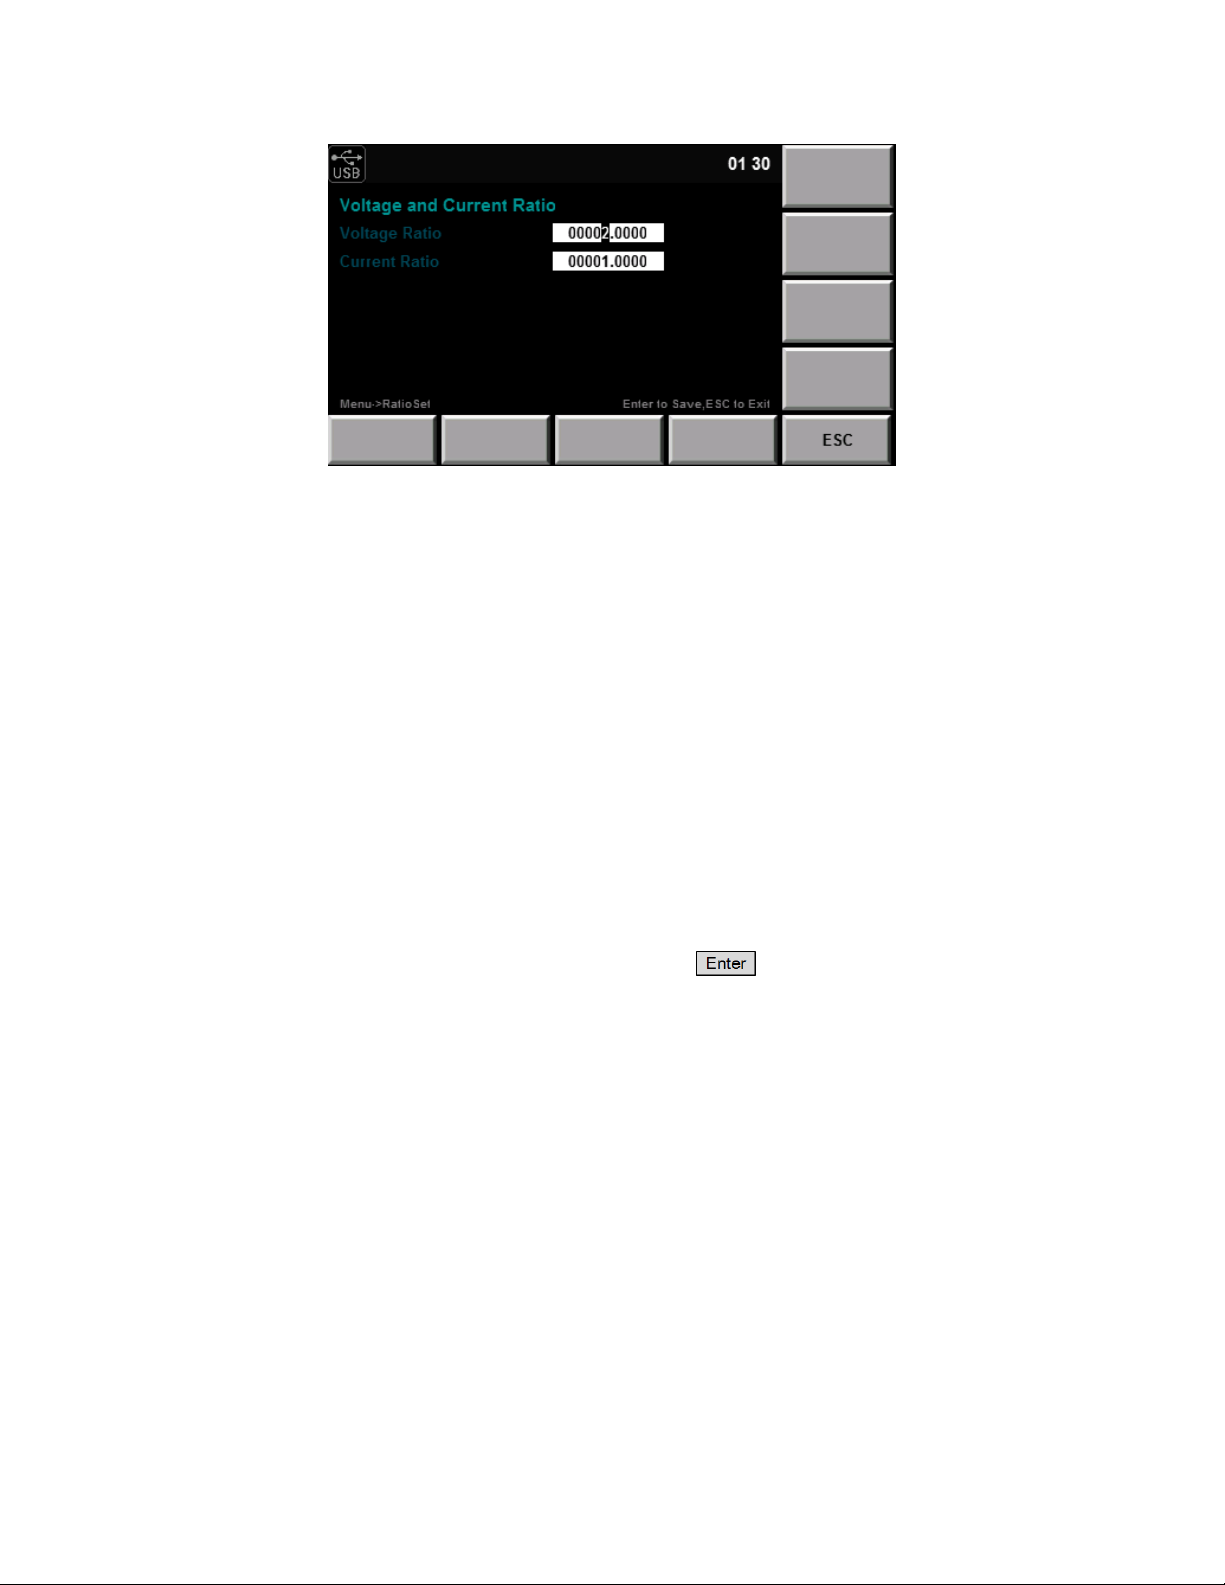
2.3 CAL ZERO
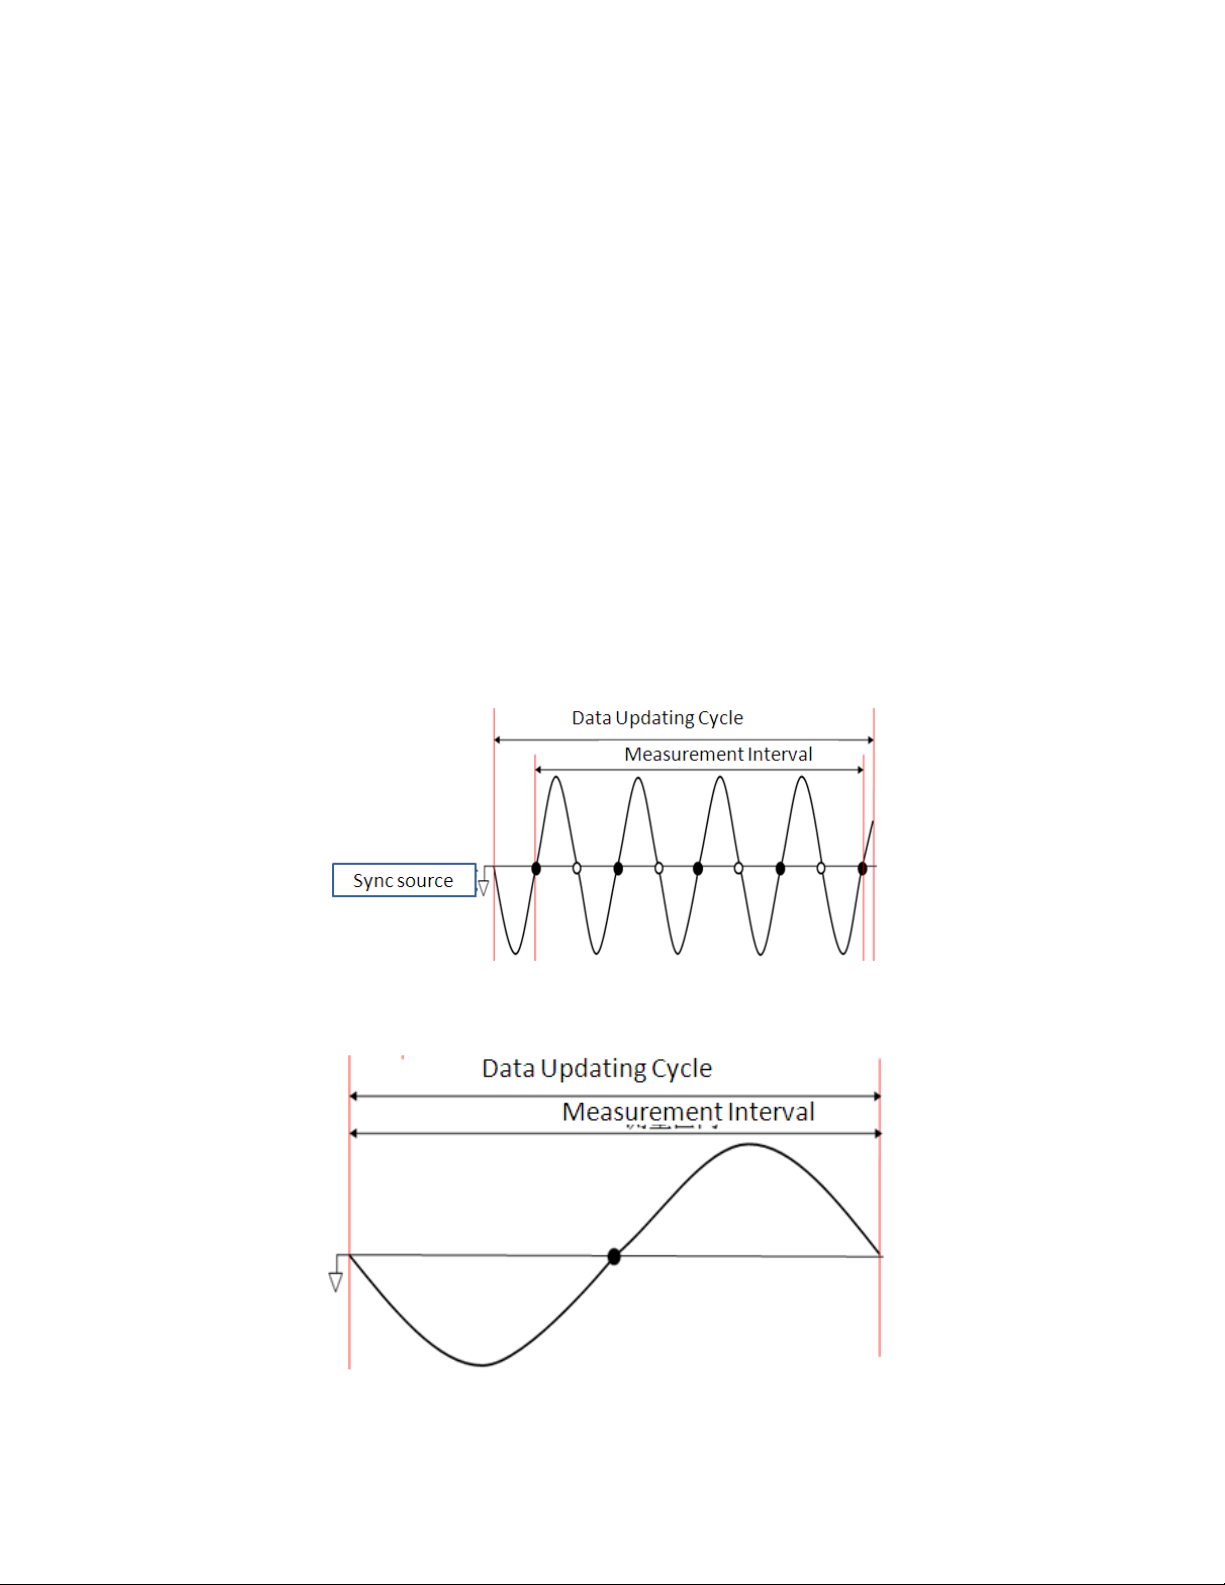
2.4 RATIO SET
This seing has the eect of scaling the measured value of the current and voltage. For example, a 116 V signal
becomes 232 V when the “Voltage Ratio” is set to 2. The Ranges are not eected by this seing, so the 150V range
is still shown and used. Use the arrow keys to move between parameters and digits. Use the knob to change the
value of the selected digit. To commit the seing change, press the buon. See Figure 2.17
Page 26

Chapter 3
External Current Sensor
More information to be added in future versions of this documentation.
When using an external current sensor, the power meter has more current range options. See details Section ??.
Sensor Input Crest Factor Ranges
EXT1 Crest Factor 3 (CF=3) 2.5 V, 5 V, 10 V
EXT1 Crest Factor 6 (CF=6) 1.25 V, 2.5 V, 5 V
EXT2 Crest Factor 3 (CF=3) 50 mV, 100 mV, 200 mV, 500 mV, 1 V, 2 V
EXT2 Crest Factor 6 (CF=6) 25 mV, 50 mV, 100 mV, 250 mV, 0.5 V, 1 V
Table 3.1: External Sensor Ranges
16
Page 27

Chapter 4
Front Panel Operation
4.1 Measurement Setup
Central to seing the proper range of the instrument is the Crest Factor. Crest factor is the ratio of the peak value
of a waveform to the RMS value of the waveform. For example, a perfect sine wave crest factor RMS value is
0.707*Peak. The crest factor is the inverse of the normalized RMS value, 0.707−1= 1.414. In many cases, like the
current waveform of a AC-DC power supply, the crest factor is a larger value. For accurate measurement, the
signal measured should stay within the measurement range of the instrument. For example, a 100V RMS signal
with a crest factor of 5 has peaks of 500V. If the range selected is smaller than 500V than inaccuracy will occur as
the signal will be clipped.
4.1.1 Crest factor
The Crest Factor, the ratio of the peak to the RMS value, has two seings, 6 or 3. This seing applies to both
current and voltage simultaneously, and modifies the available ranges listed in Section 4.1.2. Essentially, by
knowing the RMS signal level and the peak value, the seing of this parameter is determined. For an 117V RMS AC
line signal with lile distortion and a purely real load (power factor = 1), the peak value is 1.414 ∗ 117V = 165V .
1.414 is the approximate Crest Factor of a Sine wave. So, the appropriate seing will be 3 (CF3).
CrestF actor(CF ) =
As this meter also measures the DC level of the signal, this must also be accounted for when choosing the Crest
Factor. If the the signal will exceed the range of the unit (crest factor * range) then the measurement value will be
clipped and the value inaccurate. Conversely, by choosing a Crest Factor and Range combination that
accommodates the peak value of the signal, a larger crest factor than set may be measured. The trade-o is then
the accuracy, and is listed in the specifications, Chapter 10.
Example (Range=150 V, CF = 6): The maximum input signal and crest factor are as follows:
V
= 100 Range = 150V V
rms
So, a signal with a peak that is 9 times that of the RMS value (Crest Factor 9) is measurable using these seings.
P eak
RM S
maxrange
= 900V
4.1.2 Set Measurement Range
The appropriate measurement range (voltage and current range) must be set for accurate measurement.
17
Test Equipment Depot - 800.517.8431 - 99 Washington Street Melrose, MA 02176
TestEquipmentDepot.com
Page 28

CHAPTER 4. FRONT PANEL OPERATION 18
1. In the “Meter” interface Press the so key corresponding to either “U-RANGE” or “A-RANGE”, and use the
knob or the arrow keys to select the voltage or current range desired. See Table 4.1
2. Press the “Enter” key to confirm the seing. Otherwise the instrument will automatically confirm and exit
the seing aer 5 seconds of no activity.
CF 3 CF6
Voltage 15, 30, 60, 150, 300, 600 V 7.5, 15, 30, 75, 150, 300 V
Current 5, 10, 20, 50, 100, 200, 500 mA, 1, 2, 5, 10, 20 A 2.5 ,5 ,10 ,25 ,50 ,100 ,250 mA, 0.5, 1, 2.5, 5, 10 A
Table 4.1: Current and Voltage Ranges per Crest Factor seing
4.2 Voltage and current range
4.2.1 Fixed range
Select the required range from a number of options. For the voltage range, when the crest factor is 3, the
maximum option is “600V” and the minimum option is “15V”. When the crest factor is 6, the maximum option is
“300V” and the minimum option is “7.5V”. See Table 4.1
Measurement accuracy is improved by minimizing the range for a
given input signal.
4.2.2 Auto Range
The measurement range adjusts automatically according to the input signal, and uses same ranges as in Fixed
range mode. See Table 4.1.
Adjustment of the range occurs when the following conditions occur:
Increasing range
• Urms or Irms exceeds 110% of the current range seing.
• When the crest factor is 3, and the peak voltage or current exceeds 330% of the range currently set.
• When the crest factor is 6, and the peak voltage or current exceeds 660% of the range currently set.
Decreasing range
• Urms or Irms is less than or equal to 30% of the current measurement range.
• The crest factor is 3. The value Upk or Ipk of the input signal is less than 300% of the range at the following
level.
• The crest factor is 6. The value Upk or Ipk of the input signal is less than 600 % of the range at the following
level.
The selected automatic range may change when the input is a random
pulse. In this case, a fixed range should be used.
Page 29
CHAPTER 4. FRONT PANEL OPERATION 19
4.3 Measurement interval
The measurement interval, the time during which data is taken. The fundamental frequency of the measured
signals restricts the measurement intervals that yield meaningful results. For example, measuring 10Hz with an
interval of less than the 0.5s seing will not yield stable results. The unit needs a number of cycles to be present to
determine the frequency, and measurement intervals are not synchronized to the input.
Note: The scope timing parameters do not control the measurement interval.
• A cycle is determined by detecting zero crossings.
• Either positive, or negative going transitions of the synchronization source determine the measurement
timing. If the zero crossings do not occur within the set update interval, the entire interval is used for
calculating the various measurements. See Figure 4.1.
The choice of rising or falling transition is determined as that which gives the greatest amount of time.
• For peak value measurements (Ipk+, Upk-, etc.. .), the entire update interval is used. Measurements of Crest
Factor, as it is the Peak to RMS ratio, are also determined using the entire measurement update interval.
• The input signal used as the synchronization source is configurable, and determines the synchronization
with the zero point of that input signal. The overall interval of the voltage, current or data updating cycle
may be selected as the synchronization source.
Figure 4.1: Measurement Timing
Figure 4.2: Measurement Timing 2
Page 30
CHAPTER 4. FRONT PANEL OPERATION 20
The data updating cycle refers to the cycle used for calculating sampling data of the measurement function. It is identical to the set value
of the data updating rate.
The slope refers to signal changes from low level to high level (rising
edge) or from high level to low level (descending edge).
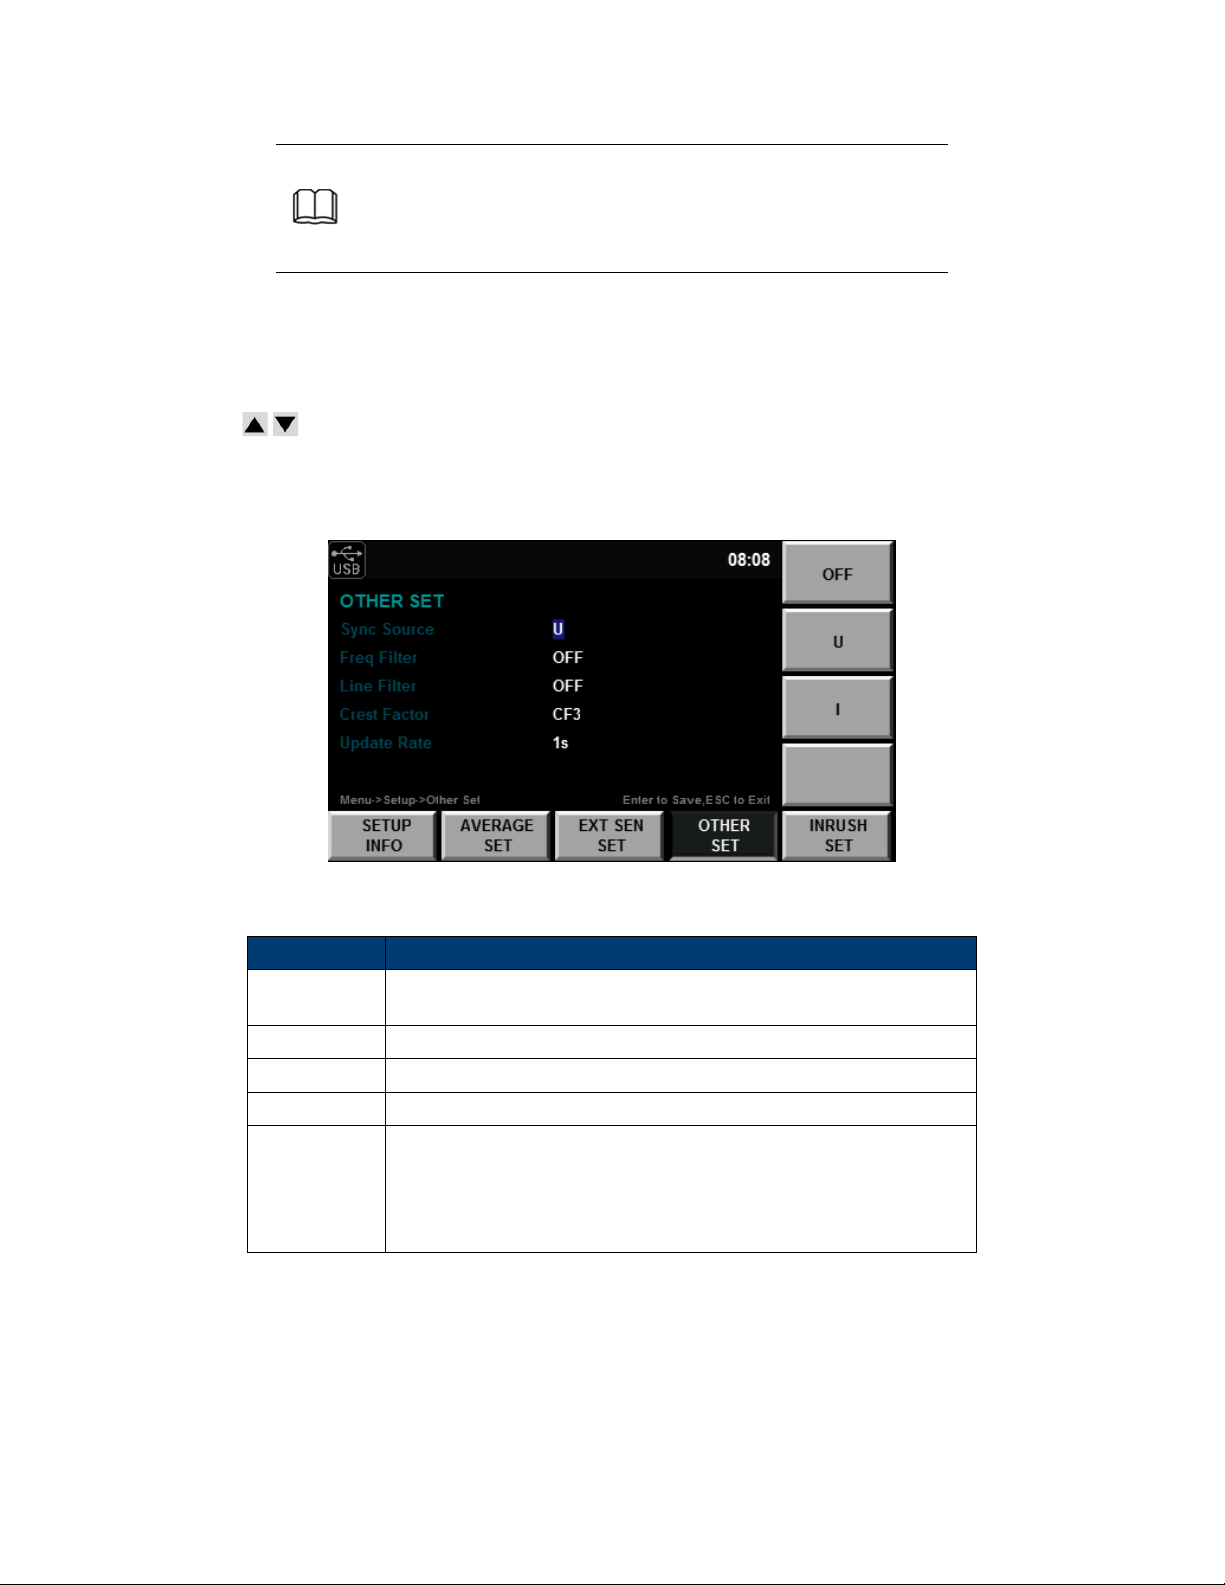
4.4 Filter and Crest Factor Seing
1. Select Menu → SET UP → OTHER SET and enter the OTHER configuration page.
2. Press to select the parameter to be configured (blue font background), and then press the so key
corresponding to the parameter on the right to set the required value, as shown in the Figure ??.
3. Press the Enter key to save the seings.
Figure 4.3: Other Seings Display
Function Description
Sync Source
Freq Filter Enable or disable the Frequency Filter.
Line Filter Enable or disable the Line Filter.
Crest Factor Set the crest factor to 3(CF3), or 6 (CF6) (See Section 4.1.1)
Update Rate
Synchronization Source, the source used to determine the measurement interval. May be set to voltage (U), current (I) or turned o.
Data Update Rate: the capture interval of the voltage, current, power
and other data can be set. When the data updating rate is increased,
rapid load changes of the power system can be measured. Conversely,
when decreased, relative low-frequency signals can be measured. Values = 0.1, 0.25, 0.5, 1, 2, and 5 seconds
Table 4.2: Other Set configuration seings
4.4.1 Filter
Frequency Filter It is inserted in the frequency measurement circuit and may aect frequency measurement. It
can be used for filtering high-frequency components of interference to make the measured frequency parameter
Test Equipment Depot - 800.517.8431 - 99 Washington Street Melrose, MA 02176
TestEquipmentDepot.com
Page 31
CHAPTER 4. FRONT PANEL OPERATION 21
more accurate. When the frequency filter is switched on, the voltage or current of no more than 200Hz can be
measured. The cuto frequency is 500HZ.
Line filter It is inserted in the voltage and current measurement circuit and has direct influence on
measurement of the voltage, current and power. When the line filter is switched on, noise and high-frequency
components from the inverter or distortion waveform can be filtered. The cuto frequency is 500HZ.
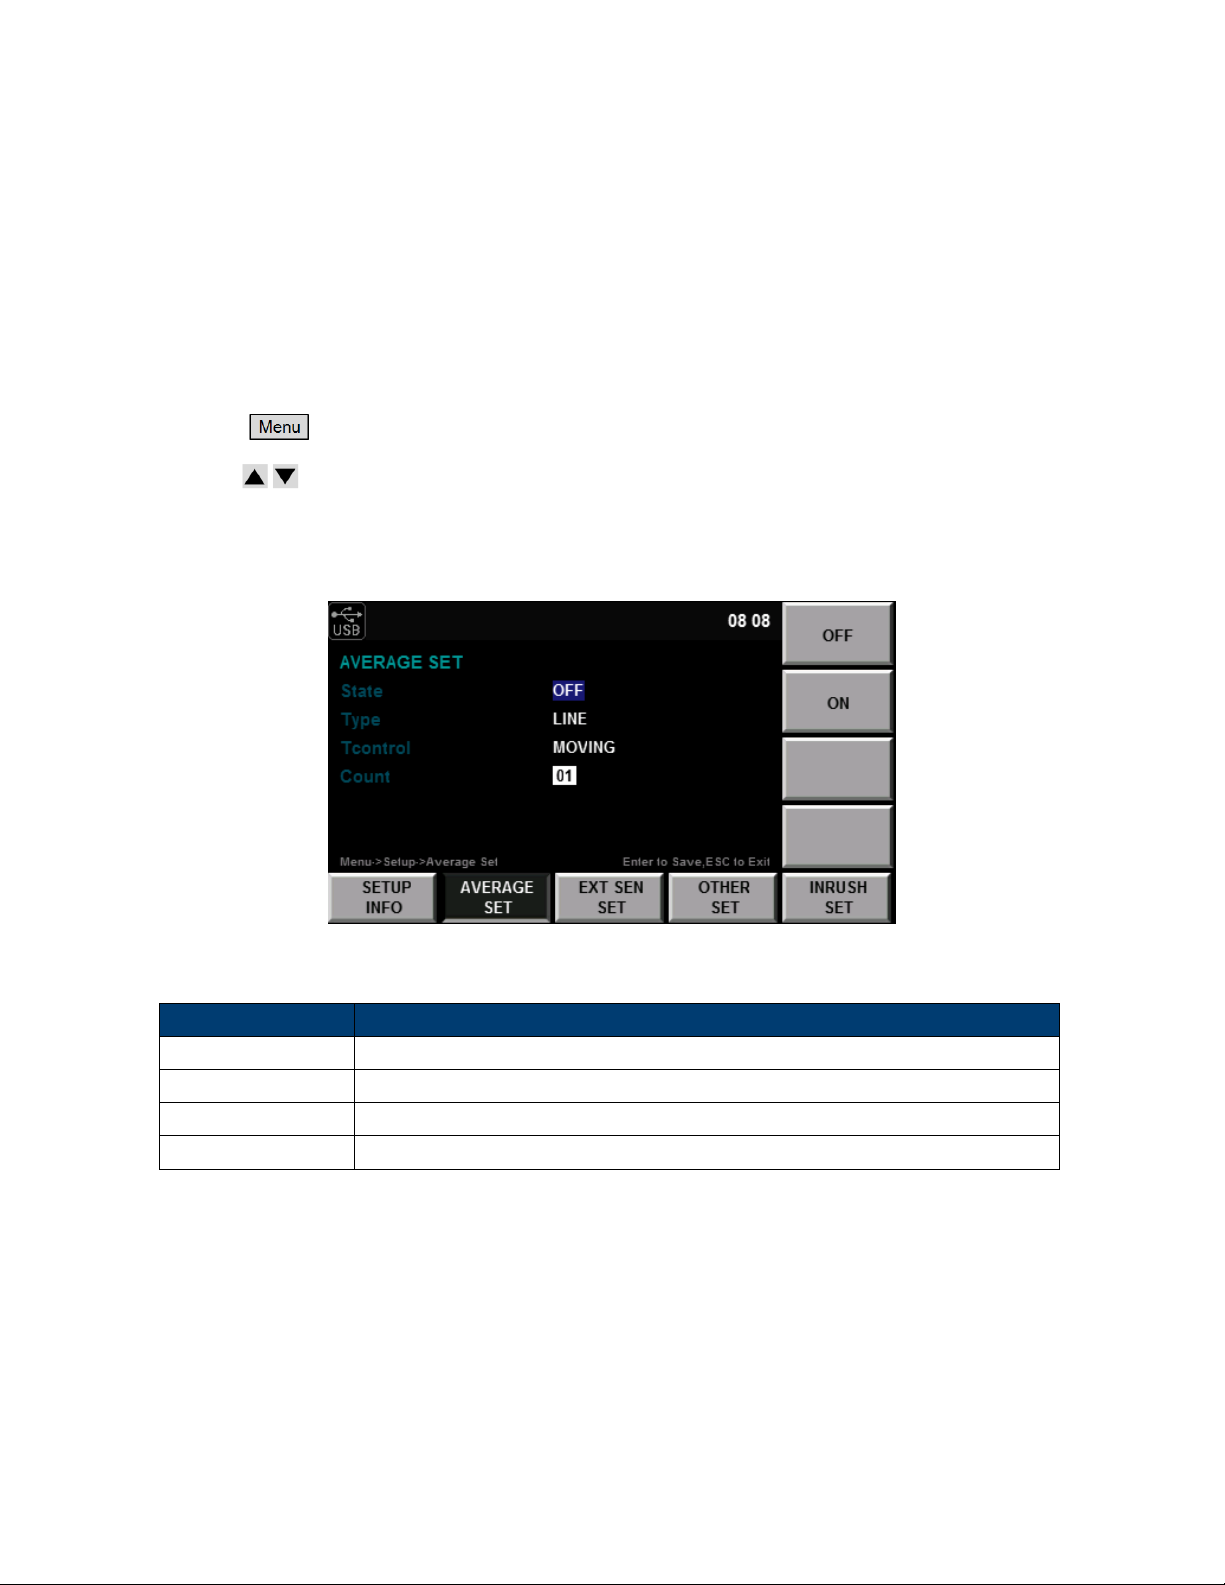
4.5 Averaging Function
1. Select ⇒ SET UP ⇒ AVERAG SET to enter the configuration page of the averaging function.
2. Press to select the parameter to be configured (blue background), and press the so key
corresponding to the required value. See Figure 4.4.
3. Press the Enter buon to confirm the seing.
Figure 4.4: Averaging Seings
Character Function description
State Enable or disable averaging.
Mode Average mode Line=linear or Exp=cumulative moving average
Type Averaging type. MOVING: moving averaging REPEAT: repeated averaging
Count Set the times of the averaging function.
Table 4.3: Average Seings Menu
Note:
• If the mode of the averaging function is set as EXP (index averaging), the aenuation constant can be set.
• If the mode of the averaging function is set as LINE (linear averaging), the averaging times can be set.
Page 32

CHAPTER 4. FRONT PANEL OPERATION 22
4.5.1 Index averaging
D
n
D
n−1
M
n
k aenuation constant (1-64)
4.5.2 Linear averaging
D
n
M
n−(m−1)
M
n−2
M
n−1
M
n
M the number of average values (1-64)
Dn= D
n−1
Mn− D
+
n−1
k
The value displayed aer the nth index averaging, (D1, the value displayed aer the first averaging, is equal to M1)
The value displayed aer the (n-1)th index averaging
the nth measured data.
Dn=
M
n−(m−1)
+ . . . + M
m
n−2
+ M
n−1
+ M
n
linear average of m values from the (n − (m − 1))thto nthvalue
(n − (m − 1))thmeasured data
(n − 2)thmeasured data
(n − 1)thmeasured data
nthmeasured data
When m can be divided exactly by n, the calculated value is the moving average; when there is no particular
relationship between m and n, the calculated value is the repeated average.
When index averaging is set, averaging is implemented under the harmonic measurement function.
When linear averaging is set, averaging can only be implemented in the conventional measurement function and this mode is not applicable to the harmonic measurement function.
The following measurements are subject to direct averaging:
1. Urms, Umn, Udc, Urmn, Uac, Irms, Imn, Idc, Irmn, Iac, P, S and Q.
2. Ucf, Icf, λ and WPAV are calculated by operation of the averaged Urms, Irms, P and S.
4.5.3 Harmonic measurement averaging
The following measurement functions are subject to direct averaging:
1. U(k), A(k),W(k), S(k) and Q(k).
2. λ(k) is calculated via operation of the averaged W(k) and Q(k).
3. U(%r), A(%r), W(%r) , U(%f), A(%f) and W(%f) are calculated via operation of the averaged U(k), A(k) and
W(k). (k indicates the harmonic times.)
Page 33
Chapter 5
Meter Display
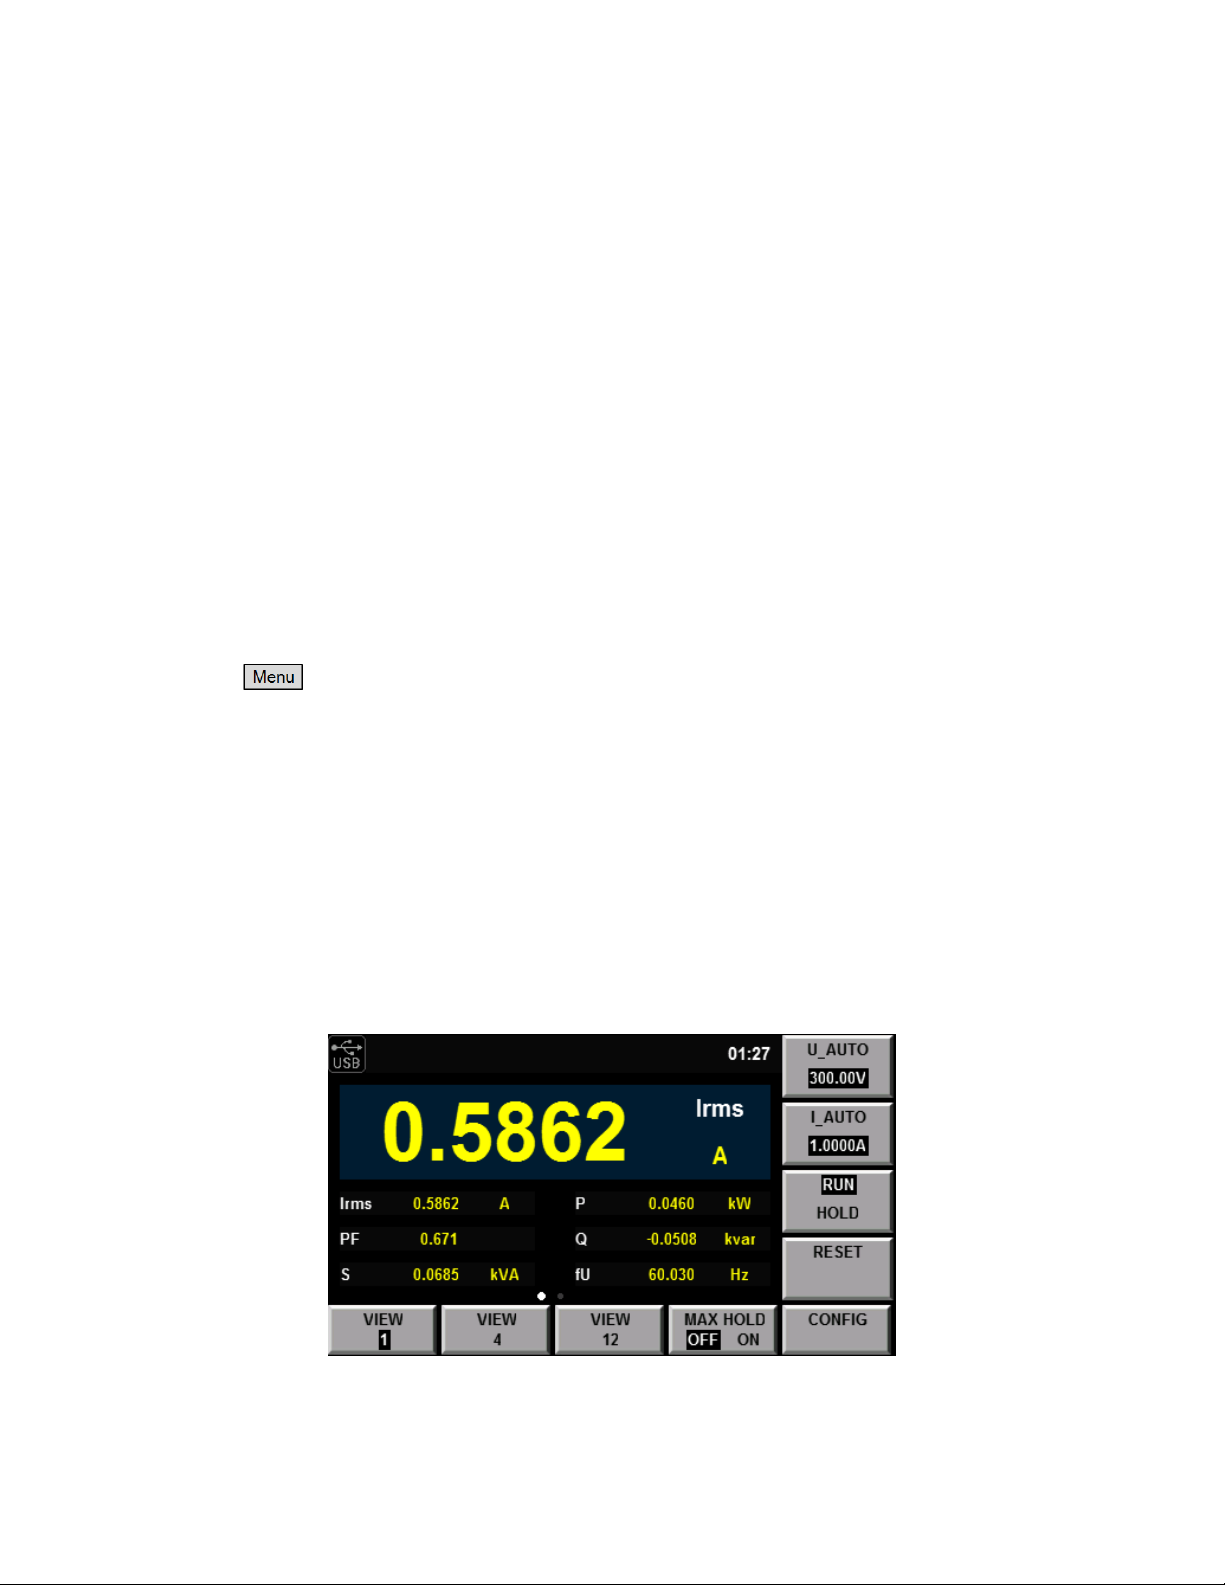
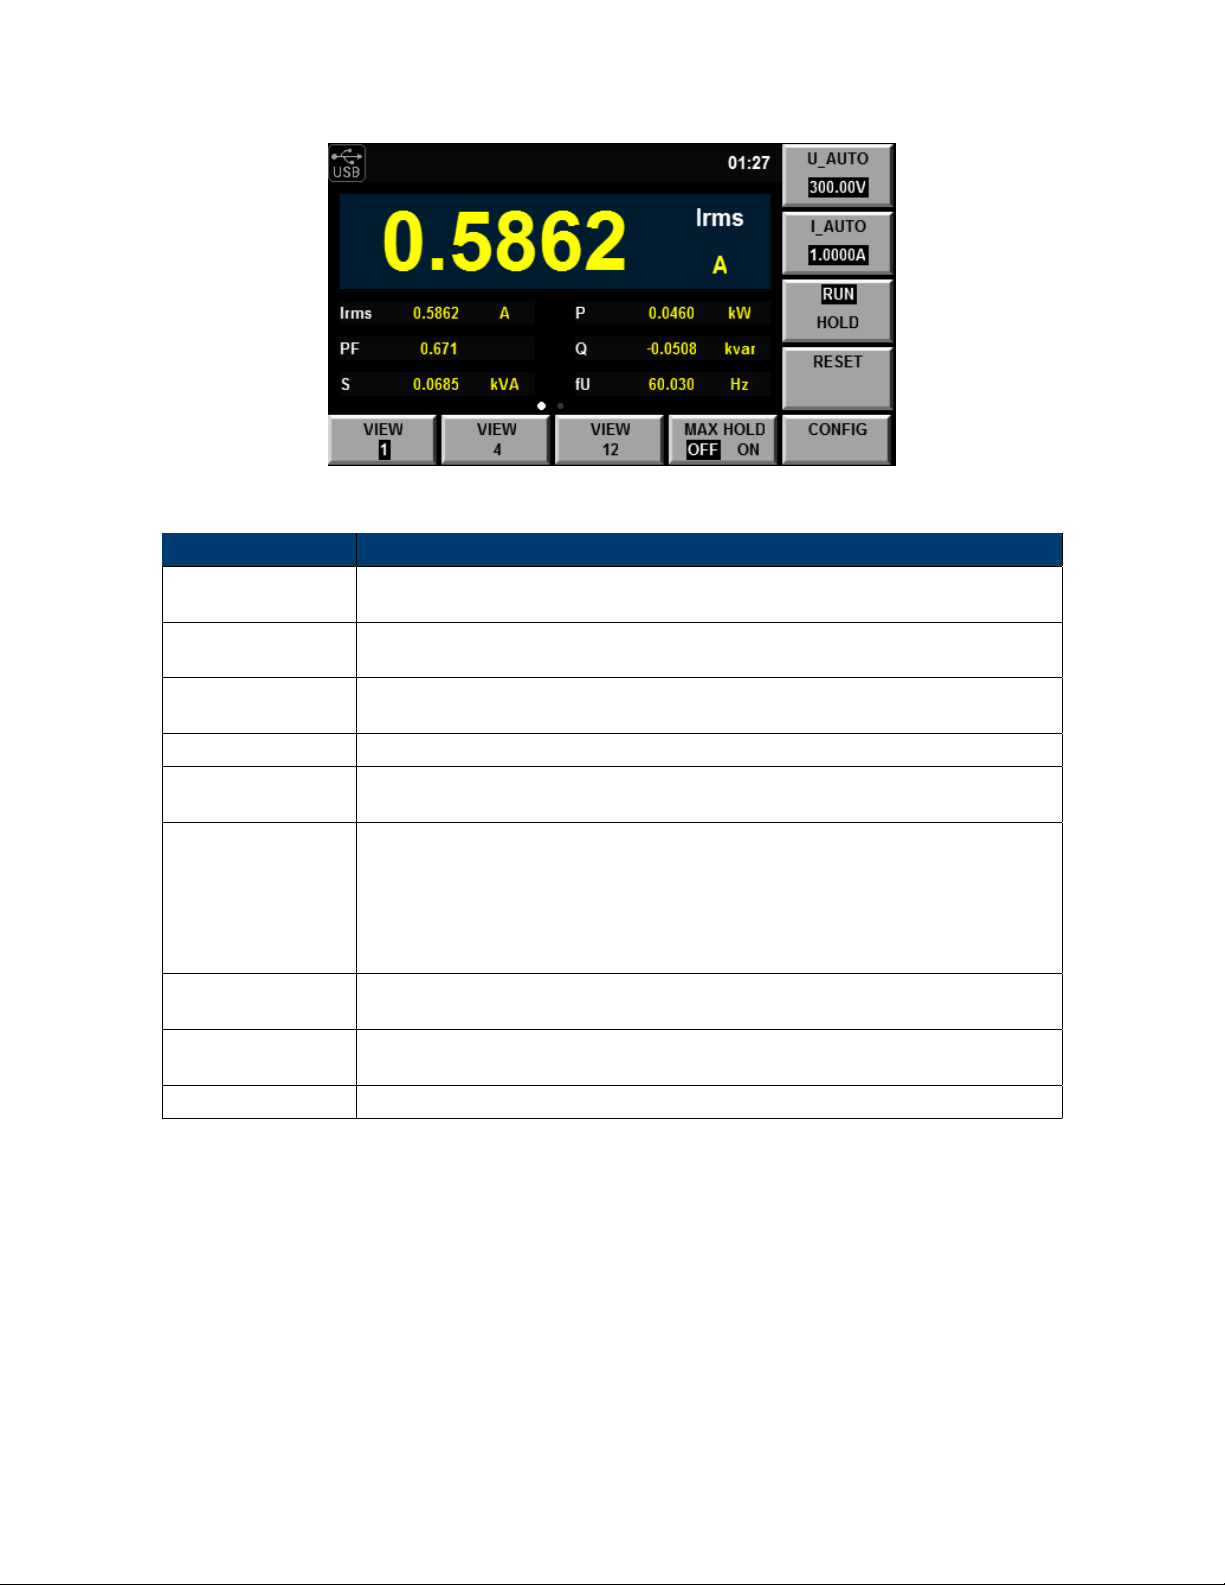
The 5335B has 3 configurable display formats. Each format also allows for 5 dierent configured sets of
measurement. 1 large and 6 small, 4 large and 6 small, or 12 small measurements may be displayed. See
Figures 5.1, 5.2, 5.3.
5.0.1 Operation steps
1. Press
2. The “View” so-keys select the display format (1,4,12). Repeated press of the so-key cycles through the
dierent configurations, up to 5 of them.
3. The “CONFIG” so-key enters the configuration mode for that set of pages.
4. The “FUNC” so-key cycles through the sets of measurements available for Power (P), Current (I), and
Voltage (U).
5. To change the measurements shown on a page, use the arrow keys and move the cursor to an on-screen
parameter, and select the desired measurement from the so-keys on the right of the display.
6. To add or remove a page press the “INSERT PAGE” or “DELETE PAGE” respectively. 1 to 5 pages are
supported.
Figure 5.1: 1 main measurement
23
Test Equipment Depot - 800.517.8431 - 99 Washington Street Melrose, MA 02176
TestEquipmentDepot.com
Page 34
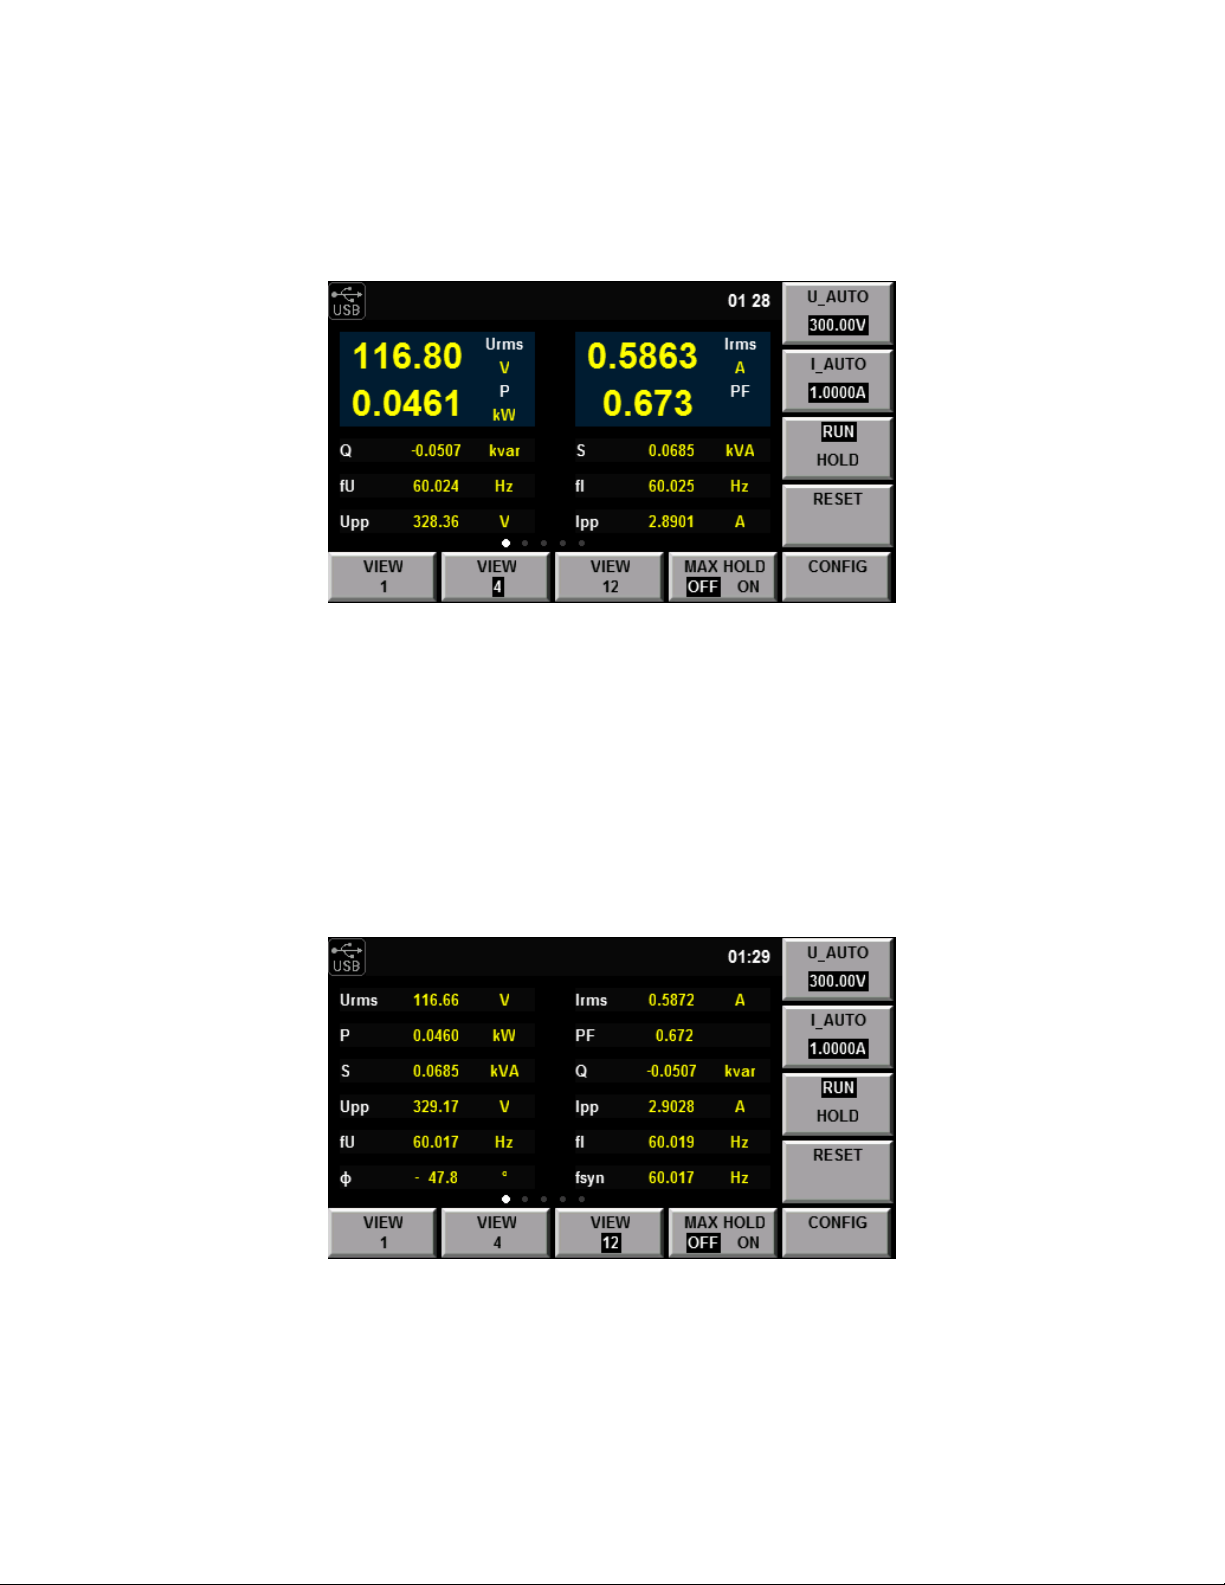
CHAPTER 5. METER DISPLAY 24
Figure 5.2: 4 main measurements
Figure 5.3: 12 main measurements
Page 35
Chapter 6
Waveform Display Function
The 5335B power meter displays waveform representations of the sampled data measured. This function is
designed to be similar to an oscilloscope with many of the typical functions of oscilloscopes available, like trigger,
run/stop and single trigger. The capture of data is not limited to that displayed onscreen, the measurement
interval is also involved. For example, measuring a 15Hz signal with the interval set to 0.1s does not allow for
stable measurement of the frequency. The waveform is however still viewable.
6.0.1 Introduction of so keys on the interface
To enter the waveform function press the buon.
Introduction of waveform display interface
The trigger status is described as follows:
Parameter name Parameter descriptions
V_RANGE Voltage range seing: press to set the voltage range
A_RANGE Current range seing: press to set the current range
RUN/STOP Run/stop: press to run or stop waveform capture
SINGLE
SCOPE(U/A/UA)
KNOB SEL (U/A/TL/TD/Td)
AUTO
TRIG SET Trigger seing
MEASURE SET Measurement seing
Single measurement: pressing this stops capture and proceeds with a single capture
of data following a trigger event.
Select the waveform to be displayed on the screen: voltage/current/voltage and current.
Knob selection: the following variables can beadjusted by rotating the knob: vertical
voltage position/vertical current position/trigger level/trigger delay/level calibration.
Automatic adjustment: when the so key corresponding to this parameter is
pressed, the power meter will automatically calibrate the input signal to display
the best eect of the input signal.
Table 6.1: Waveform Display Parameters
25
Page 36

CHAPTER 6. WAVEFORM DISPLAY F UNCTION 26
Figure 6.1: Waveform Display Details
Trigger status Instruction
Auto
Auto?
Trig
Trig?
Stop
When the trigger mode is set as Auto, the trigger status Auto will be displayed aer
triggering.
When the trigger mode is set as Auto, the trigger status will be Auto in the case of
no triggering?
When the trigger mode is set as Normal, the trigger status Trig will be displayed
aer triggering.
When the trigger mode is set as Normal, the trigger status will be Trig in the case of
no triggering?
When the “Stop” so key in the waveform display interface is pressed, the trigger
status Stop will be displayed.
Table 6.2: Trigger Statuses
6.0.2 Vertical calibration
When the crest factor CF is 3, the selected voltage range and current range will be subject to vertical calibration
(voltage/grid, current/grid). When CF is 6, the selected voltage range and current range will be subject to two-time
vertical calibration (voltage/grid, current/grid).
6.0.3 Horizontal calibration
When the “KNOB SEL” so key is pressed and “T/d” is selected, horizontal calibration (scanning speed) adjusted
by rotating the knob. In this case, time/grid information changes can be observed on the screen by rotating the
knob and changing the horizontal (time/grid) seing. When acquisition is run, the sampling rate can be changed
by adjusting the horizontal calibration knob. When acquisition is stopped, sampling data can be amplified by
adjusting the horizontal calibration knob.
6.0.4 Trigger delay
When the KNOB SEL so key is pressed and “TD” is selected, the trigger delay can be adjusted by rotating the
knob. In this case, when the knob is rotated, the trigger point will move horizontally and the delay time will be
displayed on the screen. When the delay time is changed, the trigger point ( ) will move horizontally, and the
Test Equipment Depot - 800.517.8431 - 99 Washington Street Melrose, MA 02176
TestEquipmentDepot.com
Page 37

CHAPTER 6. WAVEFORM DISPLAY F UNCTION 27
distance between the trigger point and the horizontal center will be indicated. The trigger point is displayed along
the top of the display grid.
6.0.5 Trigger waveform
When the specified trigger conditions are satisfied, the trigger waveform will be displayed, and the triggering time
point is called trigger point. The trigger point is generally displayed in the le of the display screen. Following the
trigger point, the waveform is displayed on the display screen from le to right over time. Before using the trigger
function, the user needs to configure the following parameters:
Trigger mode The trigger mode refers to conditions for updating the contents displayed on the screen. Including
the Auto model and Normal mode Auto mode: the displayed waveform is updated in case of triggering in
the pause time and automatically updated in case of no triggering in the pause time. Normal mode: the
displayed content is updated in case of triggering and not updated in case of no triggering.
Trigger source The trigger source is used for generating triggering conditions. The user can select the trigger
source from the input signal of the input unit and the external clock signal.
Trigger slope The slope refers to signal changes from low level to high level (rising edge) or from high level to
low level (descending edge). When used as a triggering condition, the slope is called trigger slope.
Trigger level Level of trigger slope: triggering occurs when the level of the signal of the trigger source reaches
the set trigger level under the specified trigger slope conditions. When the “KNOB SEL” so key is pressed
and “TL” is selected, the trigger level can be adjusted by rotating the knob. In this case, the trigger level can
be changed by rotating the knob, and changes in the trigger level can be observed on the screen.
6.1 Adjustment of Measurement Parameters
You can rotate the knob to adjust the vertical calibration, horizontal calibration, trigger delay and trigger level of
the waveform display interface. Detailed steps are as follows:
6.1.1 Operation steps
1. Press to enter the waveform display interface.
2. In the waveform display interface Press the so key corresponding to the “KNOB SEL” parameter and select
the parameter to be adjusted. When “KNOB SEL” is pressed once, the parameter to be adjusted via the knob
will be switched in sequence among U/A/TL/TD/Td.
3. When the parameter is adjusted by rotating the knob, the interface will display changes of the
corresponding value.
6.2 Seing of Trigger Configuration
When you need to enable the trigger function, you should select the trigger source, trigger mode, trigger slope and
other trigger-related configuration. Detailed steps are as follows:
Operation steps
1. Press to enter the waveform display interface.
Page 38
CHAPTER 6. WAVEFORM DISPLAY F UNCTION 28
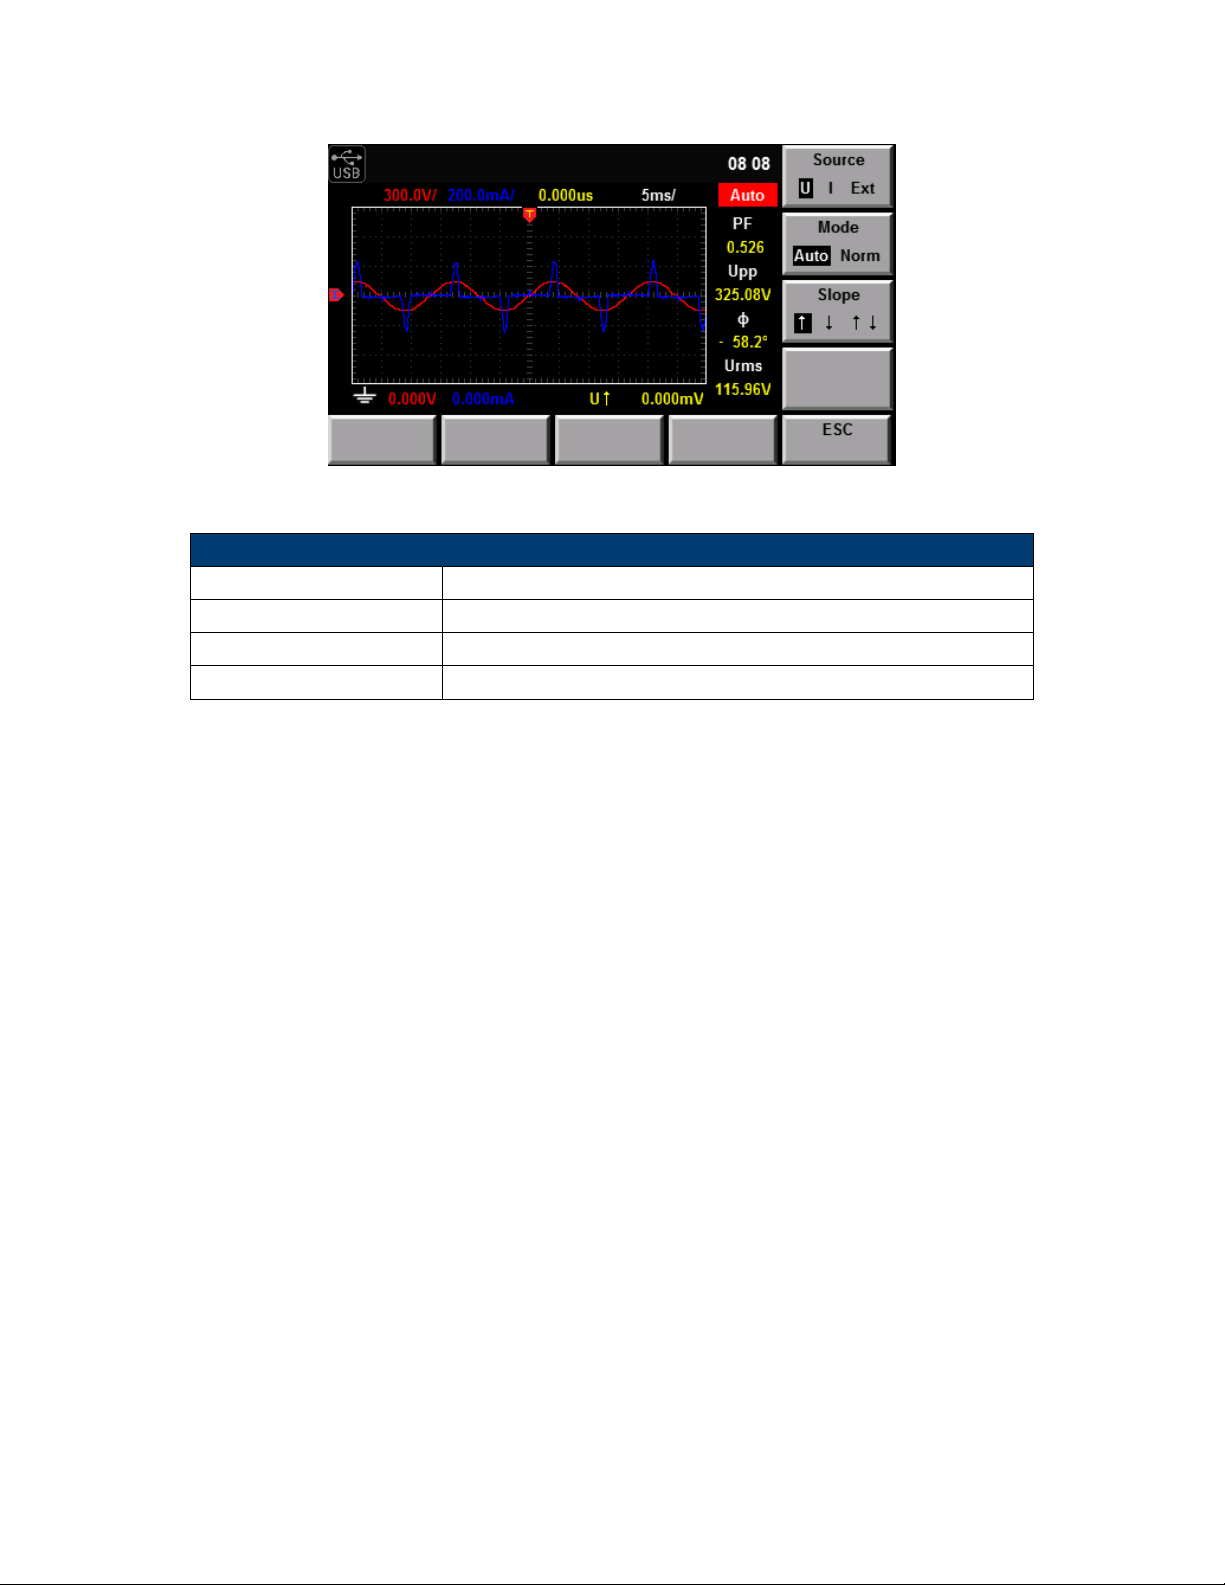
Figure 6.2: Trigger Setup Screen
Projects Specification
Interface type BNC interface
Input level TTL
Minimum pulse width 1µs
Trigger delay time Within (1µs + 3 sampling cycles)
Table 6.3: External Trigger Input Specifications
2. In the waveform display interface Press the so key corresponding to the “TIRG SET” parameter to enter the
trigger seing interface, as shown below.
3. Press the right so key corresponding to the parameter to select the required trigger configuration.
Source trigger source
Mode trigger mode
Slope trigger slope
6.2.1 External trigger input (Ext)
When the trigger source is set as Ext, input the trigger signal into the external signal input interface
(Synchronous) of the rear panel according to the following specifications.
NOTE: When the voltage higher than 0-3.3V is applied on the external signal input interface (Synchronous), the
instrument may be damaged.
Minimum pulse width refers to the width of the high or low trigger level, at least 1µs.
Trigger delay time refers to the delay between the appearance of the trigger level and the response of CPU,
within (1µs + 3 sampling cycles).
Page 39

Chapter 7
Harmonic Measurement Function
This chapter describes the features and use of the harmonic measurement function of the 5335B power meter in
details.
7.1 Basic Concepts
With the 100kHZ bandwidth, the 5335B power meter can realize harmonic measurement of high speed and wide
dynamic range. The voltage, current, active power, reactive power and phase of harmonics and total harmonic
distortion (THD) factor can be tested in the harmonic mode. In addition, the 5335B power meter can be used for
multiple harmonic measurements, 50-order harmonics of the fundamental frequency at most.
The 5335B power meter displays harmonic parameters in the list or bar chart form so as to provide clear analysis
of test results.
Introduction of so keys on the interface
Select the !@!@! buon, and the initial harmonic measurement interface below will appear.
Description of information of harmonic measurement interface:
Parameter name Parameter descriptions
V_RANGE
A_RANGE
RUN/HOLD
RESET Reset.
FUNC(W/A/V) Function options (power/current/voltage)
BAR Displayed in the bar chart form
LIST Displayed in the list form
SETUP Parameter seing.
Test Equipment Depot - 800.517.8431 - 99 Washington Street Melrose, MA 02176
Voltage range seing: press the so key corresponding to this parameter to set the
voltage range.
Current range seing: press the so key corresponding to this parameter to set the
current range.
RUN/HOLD: press the so key corresponding to this parameter to run/hold the harmonic status.
Table 7.1: Harmonic Measurement Parameters
29
TestEquipmentDepot.com
Page 40

CHAPTER 7. HARMONIC MEASUREMENT F UNCTION 30
7.1.1 Introduction of harmonic information
When the “BAR” buon is selected in the harmonic measurement interface, the bar chart of harmonic
measurement results will be displayed. The bar chart is used for displaying the percentage of dierent harmonics.
Harmonics can be displayed in the whole sequence, odd sequence and even sequence. The following is the
whole-sequence harmonic bar chart.
Description of interface information:
Total harmonic parameter: including the total harmonic distortion (THD) factor and total harmonic content.
When dierent measurement functions are selected, dierent harmonic parameters will be displayed. When the
so key corresponding to the “FUNC” parameter is pressed, dierent measurement functions can be selected.
W/A/U can be selected as the measurement function in sequence when this buon is pressed once. Parameter
meanings of dierent functions are as follows:
Power (W) total harmonic distortion rate of power and total harmonic power
Current (A) total harmonic distortion rate of current and total harmonic current
Voltage (U): total harmonic distortion rate of voltage and total harmonic voltage
Single-order harmonic parameters: displaying the frequency, harmonic content, harmonic distortion factor and
phase of single-order harmonics. The user can rotate the knob to select the single-order harmonics to be
displayed. The selected harmonics are displayed in red in the bar chart form.
Description of harmonic list interface
When the “LIST” buon is selected in the harmonic measurement interface, the list of harmonic measurement
results will be displayed. This list is used for showing the voltage, current, active power, reactive power, phase and
total harmonic distortion (THD) factor of dierent harmonics. Harmonic lists can be displayed in the whole
sequence, odd sequence and even sequence. Below is a whole-sequence harmonic list.
Harmonic content: this list is used for showing all harmonic contents of single-order harmonics, including the
voltage, current and power. You can view other harmonic parameters by operating the Le/Right buon to turn
pages. In this case, the line scroll bar and current page are shown in bright white circles. Measurement parameters
are described in the following table:
Harmonic order list: this LIST can show the data of one-order to 50-order harmonic signals. These data can be
displayed in the whole sequence, odd sequence and even sequence. The rows which are not displayed, i.e.
single-order harmonic data which are not displayed, can be presented by operating the Up/Down buon. In this
case, the row scroll bar and current page in displayed in bright blue bars.
7.2 Seing of Harmonic Measurement Configuration
You can set the distortion factor calculation formula, PLL source, harmonic sequence and harmonic analysis times
of harmonic measurement. Specific steps are as follows:
Operation steps
1. Press to enter the harmonic measurement interface.
2. Press the so key corresponding to the “SETUP” parameter in the harmonic measurement display interface
to enter the harmonic parameter configuration interface. Press the “ ” buon to select the required
parameter, as shown in Figure 7.1.
Page 41

CHAPTER 7. HARMONIC MEASUREMENT F UNCTION 31
Abbreviations Instruction
U(V) Voltage
φUI(◦) Phase dierence of k-order harmonic voltage and harmonic current
A(mA) Current
φUU(◦) Phase dierence of harmonic voltage U(k) and fundamental wave U(1)
W(W) Active power
φII(◦) Phase dierence of harmonic current I(k) and fundamental waveI(1)
S(VA) Apparent power
U(%r)/ U(%f) Harmonic distortion factor of voltage
Q(var) Reactive power
A(%r)/ A(%f) Harmonic distortion factor of current
λ() Power factor
W(%r)/W(%f) Harmonic distortion factor of active power
Table 7.2: Measurement Parameters
Figure 7.1: Harmonic Measurement Setup Menu
7.2.1 Parameter descriptions:
Distortion factor calculation formula:
The following two formulas can be selected for calculation of the distortion factor.
%r using all harmonic measurement data from the minimum harmonic order (0) to the maximum harmonic order
(within the upper limit of analysis orders) as the denominator.
%f using the data of fundamental wave (1-order) components as the denominator.
Page 42

CHAPTER 7. HARMONIC MEASUREMENT F UNCTION 32
Parameters Instruction
Distortion factor calculation formula. % r: displaying harmonics in the form of per-
THD Formal
centage to the overall current (voltage, power) amplitude of all harmonics. % f: displaying harmonics in the form of percentage to the fundamental wave current (voltage, power).
PLL Source
Select the PLL (Phase Locked Loop) source: U/I/OFF. Used for determining the fundamental wave cycle as the reference for analysis of harmonic orders.
Serial Harmonic sequence: whole sequence/odd sequence/even sequences
Set the harmonic analysis orders (1-50). You can specify the harmonic measure-
Order Max
ment range. These specified analysis orders are used for calculating the value of the
distortion factor.
Table 7.3: Harmonic Parameters
The distortion factor calculation formulas and methods of dierent measurement functions are as follows:
Measurement function %r %f (7.1)
Harmonic distortion factor of voltage
Harmonic distortion factor of current
Harmonic distortion factor of active power
Total harmonic distortion rate of voltage
Total harmonic distortion rate of current
Total harmonic distortion rate of active power
s
s
U(k)
U(total)
I(k)
I(total)
P (k)
P (total)
max
P
k=2
U(total)
s
max
P
k=2
I(total)
max
P
k=2
P (total)
U(k)
I(k)
P (k)
U(k)
U(1)
I(k)
I(1)
P (k)
P (1)
s
max
P
2
2
2
k=2
U(1)
s
max
P
k=2
I(1)
s
max
P
k=2
U(k)
I(k)
P (k)
P (1)
2
2
2
(7.2)
(7.3)
(7.4)
(7.5)
(7.6)
(7.7)
NOTE Total harmonics are calculated as follows: U (total) =
max
P (total) =
P
P (k) . k indicates the harmonic order, and max indicates the upper limit of analysis orders. max is
k=0
s
max
P
U(k)2, I(total) =
k=0
s
max
P
k=0
I(k)2,
determined by the frequency of PLL source automatically, 50 orders at most.
7.2.2 PLL source
In the harmonic mode, 5335B adopts PLL to multiply the frequency of the input signal. The frequency
multiplication output signal is used as the A/D sampling clock in the instrument so as to achieve the purpose of
synchronous sampling. Therefore, the frequency of the signal of the PLL source can determine the A/D sampling
clock in the instrument. However, the quality of the signal of the PLL source may aect the stability and accuracy
of sampling data.
Test Equipment Depot - 800.517.8431 - 99 Washington Street Melrose, MA 02176
TestEquipmentDepot.com
Page 43

CHAPTER 7. HARMONIC MEASUREMENT F UNCTION 33
7.2.2.1 PLL source selection
The voltage or current of the input unit can be selected as the PLL source. Used for determining the fundamental
wave cycle as the reference for analysis of harmonic orders. The fundamental wave frequency of the PLL source is
10Hz to 1.2kHz.
7.2.2.2 Considerations for selection of PLL source
Please select the signal with the same cycle as that of the harmonic measurement object signal. In order to stably
measure harmonics, select the input signal with lile distortion as the PLL source. If the fundamental wave
frequency of the PLL source changes or the fundamental wave frequency cannot be measured as a result of
waveform distortion, accurate measurement results may not be obtained. When the test object is a switch type
power supply and the voltage signal is subject to less distortion than the current signal, it is recommended to use
the voltage as the PLL source.
7.2.2.3 Signal level of PLL source
If the amplitude level of the signal input into the unit as the PLL source is small relative to the range,
synchronization with PLL will fail. If the crest factor is set as 3, the amplitude level of the PLL source should
exceed 50% of the range at least during seing of the range. If the crest factor is set as 6, the amplitude level of the
PLL source should exceed 100% of the range at least during seing of the range.
1
When the fundamental wave frequency is lower than 440Hz and contains high-frequency components, it is
recommended to turn on the frequency filter. This filter only applies to the frequency measurement circuit.
If the frequency of the PLL source changes, the correct measured value will be displayed aer data are updated
several times. The frequency of the PLL source needs to be tested again via the PLL circuit in the instrument in
case of changes of the PLL source or its frequency, the correct measured value cannot be obtained at once.
7.2.3 Harmonic analysis order
The harmonic analysis order k is an integer number ranging from 0 to the upper limit of analysis orders. Zero
indicates the DC component. The upper limit of analysis orders is automatically determined by the frequency of
the PLL source. The upper limit of harmonic analysis orders can be determined automatically or set manually.
Take the smaller value. 50 orders at most The relationship between the upper limit of harmonic analysis orders
and the fundamental wave frequency of the PLL source is shown in the table below.
PLL fundamental frequency
10Hz – 75Hz
75 Hz – 150 Hz
150 Hz – 300 Hz
300 Hz – 600 Hz
600 Hz – 1200 Hz
Sampling rate Window width Harmonic order upper limit
f*1024 1 50
f*512 2 32
f*256 4 16
f*128 8 8
f*64 16 4
NOTE The upper limit of analysis orders may be reduced.
NOTE If the analysis window determined by the fundamental wave frequency of the PLL source is longer than the
data updating cycle, no harmonic data will be detected. In this case, the data updating cycle should be reduced.
For example, when the fundamental wave frequency of the PLL source is 10Hz (cycle: 100ms), the analysis window
1
When the fundamental wave frequency is no more than 200Hz, the frequency filter must be turned on.
Page 44

CHAPTER 7. HARMONIC MEASUREMENT F UNCTION 34
is one-wave long, and the data measurement interval is 100ms. In this case, the harmonic measurement time is
approximately morethan or equal to 150ms (data measurement interval and data processing time). Therefore,
please select the data updating rate of 250ms or more for measurement and display of harmonic data.
Page 45

Chapter 8
Integral Operation Function
This chapter describes the features and use of the integral function of the 5335B power meter in details.
8.1 Basic Concepts
The 5335B power meter can be used for integral operation of the current and power of the input unit. Technical
indicators can be calculated. In addition, the range can be switched automatically in the Buy and Sell modes
according to the input level so as to accurately complete integrate measurement.
During operation of the air-conditioner, refrigerator, induction cook and other household appliances, the working
status will change frequently, resulting in changes of the working current in a large scale. The current may
decrease of dozens of amperes to a few milliamperes. Ordinary power measuring instruments can only be used for
integral measurement within one range. If the measured value exceeds the current maximum range, the
measurement result is inaccurate. You need to manually switch the range before integral measurement. Integral
measurement of equipment subject to large current changes cannot be performed continuously. The IT9120 series
power meter can automatically switch the range in the integral mode. Therefore, errors of integral measurement
caused by manual range switching can be eliminated, and the power consumption of household appliances can be
measured more accurately. See the schematic diagram below.
Figure 8.1: Range Switching
35
Test Equipment Depot - 800.517.8431 - 99 Washington Street Melrose, MA 02176
TestEquipmentDepot.com
Page 46
CHAPTER 8. INTEGRAL OPERATION FUNCTION 36
Figure 8.2: Meter Display
Parameter name Parameter descriptions
V_RANGE
A_RANGE
RUN/HOLD
RESET Reset.
FUNC(w/q/AV)
LARGE(WP/WP+/WP, q/q+/q-, WPAV)
START
STOP
SETUP Set relevant parameters of integral measurement.
Voltage range seing: press the so key corresponding to this parameter to set the
voltage range.
Current range seing: press the so key corresponding to this parameter to set the
current range.
Run/hold: press the so key corresponding to this parameter to run or hold the
integral function.
Selection of the integral function: active power integral (W), current integral (q) and
average active power integral (AV).
Selection of the item to be displayed in a amplified manner: WP (wa hour, the sum
of positive and minus wa hours), WP+ (the consumption of positive wa hours),
WP- (the negative wa hours of feedback power), q (ampere hour, the sum of positive and negative Ampere hours), q+ (the consumption of positive Ampere hours),
q- (the negative ampere hours of feedback power) and WPAV (average active powerintegral).
Integral Start buon In the manual start mode, the integral function can be enabled
by pressing the so key corresponding to this parameter.
Integral Stop buon In the manual stop mode, the integral function can be disabled
by pressing the so key corresponding to this parameter.
Table 8.1: Integral Measurement So Keys
8.2 Introduction of so keys on the interface
When the “Integ” buon is pressed, the initial integral measurement interface below will appear.
Description of information of integral measurement interface:
8.3 Integral measurement display information
Description of measurement information:
Page 47
CHAPTER 8. INTEGRAL OPERATION FUNCTION 37
Character Function description
Mode
State Display the current status of the integral function.
Start: displayed when the integral function is working.
Stop: displayed when the integral function is interrupted, canceled or stopped.
Ready: displayed in the ready state of the real-time start mode.
Time Up: displayed when it reaches the specified time of the integral timer.
Reset: displayed when the integral value and integral time are reset via integral reseing.
Error:
Time Display the integral time.
St Display the set integral time.
Et Display the set integral ending time.
Timer Display the fixed integral time.
Display the integral start and stop mode. Start mode: MANUAL and TIME
Stop mode: MANUAL, TIME and TINTerval.
when thepower supply is recovered, the integral function is stopped and the integral
result before power failure is displayed. This integral state is called Error state.
Table 8.2: Measurement Information
8.3.1 Integral operation
• Active power integral
In wa hour, displayed as WP (wa hours, the sum of positive and negative wa hours), WP+ (the
consumption of positive wa hours) and WP- (the negative wa hours of feedback power).
• Current integral
In q, displayed as q (ampere hours, the sum of positive and negative ampere hours), q+ (the consumption of
positive ampere hours) and q- (the negative ampere hours of feedback power)
• Average active power integral
In wa, displayed as WPAV (average active power integral)
• Integration time
Displayed as Time, in the format of hhhh:mm:ss.
8.4 Specification
• Save in case of power failure
The integral result can be kept in the memory even in case of power failure during operation of the integral
function. When the power supply is recovered and the integral function is disabled, the integral result
before power failure is displayed. When the power supply is recovered and the integral is rest, the integral
function is enabled again.
• Display resolution
The maximum display resolution of the integral value is 99999. When the integral value reaches 100000, the
decimal point will move automatically. For example, when 0.01mwh is added to 999.99mwh, 1.0000wh will
be displayed.
• Display in case of overflow
When the integral value meets the following overflow conditions, the integral function will be disabled, and
the integral time and integral value at this point will be kept.
Page 48

CHAPTER 8. INTEGRAL OPERATION FUNCTION 38
Function Integral reseing
Functions related to settings of measurement parameters
Wiring Executable Unenforceable Unenforceable
Measurement range Executable Unenforceable Unenforceable
Filter Executable Unenforceable Unenforceable
Averaging function Executable Unenforceable Unenforceable
Synchronization Executable Unenforceable Unenforceable
Data updating rate Executable Unenforceable Unenforceable
Integral function parameter
seing
Integral mode Executable Unenforceable Unenforceable
Integral timer Executable Unenforceable Unenforceable
Integral operation
Integral start Executable Unenforceable Executable
Integral stop Unenforceable Executable Unenforceable
Integral reseing Executable Unenforceable Executable
Other operations
Save operation Executable Executable Executable
Hold operation Executable Executable Executable
Single measurement opera-
tion
Executable Executable Executable
Current integral
status
Integral interruption
Table 8.3: Seings configurability per mode
– The integral time reaches the maximum value (10000 hours).
– The integral values of WP, q and WPAV reach the maximum/minimum display integral values.
• Maximum/minimum display integral value
– Active power integral (WP): ±99999 Mwh
– Current integral (q): ±99999 MAh
– Average power integral (WPAV): ±99999 Mw
• Restricted implementation
Seings of the following functions cannot be changed during integral operation.
NOTE In addition to the above items, other seings (such as self-testing and date/time seing) or operations with
influence on the integral cannot be executed; otherwise, errors may be caused.
8.5 Seing of Integral Measurement Configuration
You can set the start mode, stop mode, automatic zero seing, automatic calibration, wa-hour integration,
current integration and other parameters of integral measurement. Specific steps are as follows:
Test Equipment Depot - 800.517.8431 - 99 Washington Street Melrose, MA 02176
TestEquipmentDepot.com
Page 49

CHAPTER 8. INTEGRAL OPERATION FUNCTION 39
Operation steps
1. Press “Integ” to enter the integral measurement interface.
2. Press the so key corresponding to the “SETUP” parameter in the integral measurement interface to enter
the integral parameter configuration interface. Press the “ ” buon to select the required parameter, as
shown in the figure below.
8.5.1 Parameter descriptions:
Start set in the MANUAL mode or TIME mode via the right so key.
MANUAL press the “START” so key in the integral measurement interface in the manual start mode to trigger
the manual start of the integral function.
TIME: the date on which the integral mode is started can be set in the real-time start mode. Integration will be
started on the set date. When the time/date combination is set in the real-time start mode, integration will
not be started before the current time and date. Integration will be started when the screen is updated once
at least before the start time.
Stop: set in the MANUAL mode, TIME mode and TINTerval mode via the right so key.
MANUAL: press the “STOP” so key in theintegral measurement interface in the manual stop mode tomanually
stop integration. When the integration time reaches the maximum integration time (10,000 hours) or the
integral value reaches the maximum/minimum display value, integration will be stopped, and the current
integral time and integral value will be kept.
TIME The date for stop of the integral mode can be set in the real-time stop mode. Integration will be stopped on
the set date. When it reaches the set time or the integral value reaches the maximum/minimum display
integral value, integration will be stopped, and the current integral time and integral value will be kept.
TINTerval the integral measurement time can be set in the set-time stop mode. When it reaches the set ending
date and time or the integral value reaches the maximum/minimum display integral value, integration will
be stopped, and the current integral time and integral value will be kept.
Auto Clear used for enabling (ON) or disabling (OFF) the function of automatic zero clearing of the integral. On:
integration is restarted when the START buon is pressed to start integration. OFF: integration is restarted
based on the integral value at the end of previous integration when the START buon is pressed to start
integration.
Auto Cal used for enabling (ON) or disabling (OFF) the function of automatic integral calibration. When
automatic integral calibration is enabled, zero seing is implemented. In this case, the power and current
measured just now are subject to integration.
WP type used for selecting the integral mode for positive and negative wa hours. There are four integral modes:
Charge/Discharge: used for measuring the DC positive and negative wa hours (integration of sampling data).
Sold/Bought used for measuring the AC positive and negative wa hours (value integration in each data
updating cycle).
q type used for selecting the current integration mode. Options of the current integration mode are as follows:
rms Eective value;
mn Calibration to the average rectified value of the eective value.
dc Simple averaging;
rmn Average rectified value;
ac AC component
Page 50

CHAPTER 8. INTEGRAL OPERATION FUNCTION 40
8.6 Integration
When the integral measurement function is enabled, you can keep the current integral information and carry out
the following operations: exit, start and stop. Specific steps are as follows:
Operation steps
1. Press “Integ” to enter the integral display interface.
2. In the integral measurement display interface Press the so key corresponding to the “START” parameter to
start or recover integral operation. The Start status and integral operation value are displayed in the
interface.
3. When you need to keep the current integral status and integral result, you can press the so key
corresponding to the “RUN HOLD” parameter. Then the current status of the integral result display and
communication output will be kept no maer whether integral operation is running.
4. When you need to continue to implement integral operation, double-press the so key corresponding to the
“RUN HOLD” parameter to exit the HOLD status. The power meter will display the integral result aer
exiting the HOLD status. The schematic diagram of display of the HOLD/RUN integral result is shown
below.
5. When you need to suspend integral operation, press the so key corresponding to the “Stop” parameter to
suspend integral operation.
6. Press the so key corresponding to the “RESET” parameter to reset the integral value and integral time. The
relationship diagram of start, suspension and reseing of the integral operation status is shown below.
Auto Clear when ON is selected.
Auto Clear when OFF is selected.
Page 51

Chapter 9
Remote Operation
There are four types of communication interfaces available:USB,Ethernet,GPIB and RS232.You can choose any one
of them to communicate with a PC.
9.1 RS-232 Interface
RS232 interface:use a cable with two COM interface (DB9) to connect power meter and PC. It can be activated by
menu key on the front panel.All SCPI commands are available through RS-232 programming.
• RS-232 data format The RS-232 data is a 10-bit word with one start bit and one stop bit. The number of start
and stop bits is not programmable.
• Baudrate Available baudrate:4800 9600 19200 38400 57600 115200
• RS-232 connection The RS-232 serial port can be connected to the serial port of a controller (i.e., personal
computer) using a straight through RS-232 cable terminated with DB-9 connectiors. Do not use a null
modem cable. Table 9.1 shows the pinout for the connector.
If your computer uses a DB-25connector for the RS-232interface,you will need a cable or adapter with a DB-25
connector on one end and a DB-9 connector on the other,wired straight through(not null modem).
RS-232
9.1.1 RS-232 troubleshooting
If you are having trouble communicating over the RS-232 interface,check the following: The computer and the
power meter must be configured for the same baudrate, parity, number of data bits,and flow control options. Note
that the eledtronic load is configured for 1 start bit and 1stop bit (these values are fixed). The correct interface
Figure 9.1: RS-232 DE-9 Connector
41
Test Equipment Depot - 800.517.8431 - 99 Washington Street Melrose, MA 02176
TestEquipmentDepot.com
Page 52

CHAPTER 9. REMOTE OPERATION 42
Pin # Signal
1 NC
2 TX
3 RX
4 NC
5 GND
6 NC
7 CTS
8 RTS
9 NC
Table 9.1: RS-232 (DE-9) Pinout
cables or adapters must be used, as described under RS-232 connector. Note that even if the cable has the proper
connectors for your system,the internal wiring may be incorrect. The interface cable must be connected to the
correct serial port on your computer (COM1, COM2,etc.).
9.1.2 RS-232 Communication seings
Before communication operation, please make sure that the following parameters of electronic load match that of
PC. Baud rate :9600(4800,9600,19200,38400,57600,115200). You can enter system menu through panel to set
communication baud rate. Data bit:8 Stop bit:1 Parity:(none,even,odd) EVEN:: eight data bits with even parity
ODD::eight data bits with odd parity NONE: : eight data bits without parity
Start Bit 8 Data Bits Parity=None Stop Bit
9.2 USB interface
Use Type A to Type B USB cables to connect the power meter.
The USB interface capabilities of the power meter are described below:
• The interface is IEEE488.2 standard USB488 interface
• The interface accepts REN_CONTROL,GO_TO_LOCAL ,LOCAL_LOCKOUT request.
• The interface accepts MsgID = TRIGGER USBTMC command message and forwards TRIGGER requests to
the function layer.
The USB488 device capabilities of the power meter are described below:
• The device understands all mandatory SCPI commands.
• The device is SR1 capable.
• The device is RL1 capable.
• The device is DT1 capable.
Page 53

CHAPTER 9. REMOTE OPERATION 43
9.3 GPIB interface
First conncet GPIB port of power meter to GPIB card of PC. They must be suicient contact and tighten the
screws. And then set address. The address can be set from 0 to 30.
9.4 LAN interface
Use a network cable to connect PC through LAN interface of the power meter.
• IP mode
MANU: manually set IP address, subnet mask, default gateway, etc.
DHCP (Dynamic Host Configuration Protocol)
DHCP refers to a protocol that temporarily assigns necessary information to PCs connected to the Internet.
If the network is provided with an available DHCP server, the server will automatically assign information
(IP address, subnet mask and default gateway) to PCs and other equipment connected to the network.
IT9121 cannot use DHCP unless the network is provided with a DHCP server. Please ask your network
administrator DHCP if DHCP is available.
• IP Address
IP addresses assigned to IT9121 can be set. Default address is 192.168.000.000.
• IP address refers to ID assigned by the network to each equipment (Internet or enterprise Intranet).
• IP address refers to four 32-bit values within 0 - 255 which are separated by decimal points, such as
[192.168.111.24].
• Please ask the network administrator to provide an IP address.
• Use DHCP network to automatically set the IP address.
• Subnet maskseing
The mask used when subnet website is determined from an IP address may be set. Default address is
255.255.255.255.
• Vast TCP/IP networks like Internet are oen divided into several small networks, i.e. subnets. The subnet
mask is used to identify how many digits of the 32-digit values in the IP address belong to the subnet
address. The part beyond the network address is used to identify the host number of each PC connected to
the network.
• Ask your network administrator about values of subnet mask.
• Use DHCP network to automatically set the subnet mask.
• Gatewayseing
IP address of gateway may be set to communicate with equipment in other network (default gateway).
Default address is 192.168.000.000.
• The default gateway controls data exchange between networks and protocols to ensure smooth data
transmission.
• Ask your network administrator about values of default gateway. It is possible that the seing is
unnecessary.
Use DHCP network to automatically set the default gateway.
Page 54

Chapter 10
Specifications
The specifications listed below are valid and specified for the following conditions:
• Warm up time of 30 minutes
• Ambient temperature - 23 ± 5
• Relative humidity 30 to 75%
◦
Test Equipment Depot - 800.517.8431 - 99 Washington Street Melrose, MA 02176
TestEquipmentDepot.com
44
Page 55

Power Meter
5335B
Specifications
Specifications are subject to the following conditions
Temperature: 23±5° C, humidity: 30 to 75% RH.
Warm-up time: 30 minutes
Model 5335B
General Measurement Specifications
Voltage, Current
Basic measurements
Power Real, Apparent, Reactive, DC, Power factor
Time Frequency, Phase
Integration Total power, Total current, Maximum power, Minimum power
Type
Harmonic measurements
Range DC up to 50
Max. Frequency 100 kHz
Input bandwidth DC, 0.5 Hz to 100 kHz
Measurement method Digital sampling
A/D Converter Simultaneous conversion of voltage and current inputs, Resolution: 18-bit, Maximum conversion rate: 10 μs
Line filter Select OFF or ON (cutoff frequency at 500 Hz)
Peak (max,min) Voltage, current, or power
Input voltage continuous max. 1.5 kV-peak or 1 kV-RMS, whichever is less
Input voltage transient (<1s) max. 2 kV-peak or 1.5 kV-RMS, whichever is less
Input voltage common-mode max. 600 Vrms
Voltage input impedance 2 MΩ + 13 pF in parallel (typical)
5 mA to 200 mA range 505 mΩ + 0.1 μH
Current input
0.5 A to 20 A range 5 mΩ + 0.1 μH
impedance (typical)
Sensor input
5 mA to 200 mA range 30 A-peak or 20 A-RMS, whichever is less
Input current continuous max.
0.5 A to 20 A range 100 A-peak or 30 A-RMS, whichever is less
Sensor input Peak value less than or equal to 5 times the rated range
5 mA to 200 mA range 30 A-peak or 20 A-RMS, whichever is less
Input current transient (<1s) max.
0.5 A to 20 A range 150 A-peak or 40 A-RMS, whichever is less
Sensor input Peak value less than or equal to 10 times the rated range
Voltage Measurement Accuracy and Ranges
Ranges
DC to 1 kHz ±(0.1% + 0.2% F.S.)
2
Accuracy
(line, frequency, &
digital filter set to off)
1 kHz < f ≤ 10 kHz
10 kHz < f ≤ 100 kHz
For temperature changes after zero-level
Temperature
coefficient
compensation or range change
Influence of self-generated heat caused by voltage
input (U is the voltage reading (V))
1
Input signal frequency in kHz
2
Input waveform: Sine wave crest factor: 3, common-mode voltage: 0 V, power factor: 1
Frequency filter: Turn on when measuring ≤ 200 Hz
Peak to peak, Maximum, Minimum, Average_rms, Average_rectified, DC,
Crest factor (current), Inrush (current)
Current, Voltage, Real power, Apparent power, Reactive power,
Power factor, Phase, Percentage of total (Current, Voltage, Power)
20 kΩ (50 mV to 2 V)
100 kΩ (2.5 V to 10 V)
CF=3: 15 V, 30 V, 60 V, 150 V, 300 V, 600 V
CF=6: 7.5 V, 15 V, 30 V, 75 V, 150 V, 300 V
±((0.07 f
±(0.5% + 0.5% F.S.) ± [{0.04 × (f
+ 0.02% F.S. /°C to the DC voltage accuracy
+ 0.0000001 × U
2
+ 0.0000001 × U
% + 0.0000001 × U
th
order
1
)% + 0.3% F.S.)
1
- 10)}% ]
2
% to the AC voltage accuracy
2
% F.S. to DC current accuracy
4
Page 56
Power Meter
5335B
Specifications (cont.)
Current Measurement Accuracy and Ranges
Direct input range
External 1
Sensor input range
External 2
DC to 1 kHz ±(0.1% + 0.2% F.S.)
2
Accuracy
(line, frequency, &
digital filter set to off)
1 kHz < f ≤ 10 kHz
10 kHz < f ≤ 100 kHz
2.5 to 200 mA 5 μA/ °C (after zero-level compensation, or range change)
Temperature
coefficient
Power Measurement Accuracy
500 mA to 20 A 500 μA/ °C (after zero-level compensation, or range change)
Influence of internal
sensor self-heating
+ 0.00013 × I
0.00013 × I
DC ±(0.1% + 0.2% F.S.)
0.5 Hz ≤ f < 45 Hz ±(0.3% + 0.2% F.S.)
45 Hz ≤ f ≤ 66 Hz ±(0.1% + 0.1% F.S.)
Real power accuracy
2 , 3
(CF= 3)
4
66 Hz < f ≤ 1 kHz ±(0.2% + 0.2% F.S.)
1 kHz < f ≤ 10 kHz ±(0.1% + 0.3% F.S.) ± [{0.067×(f-1)}%]
10 kHz < f ≤ 100 kHz ±(0.5% + 0.5% F.S.) ± [{0.09×(f-10)}%]
Apparent power (S) Voltage accuracy + current accuracy
Reactive power (Q)
Power factor (
Phase angle (Ф)
PF)
±[(PF–PF/1.0002) + abs(cosØ - cos{Ø+sin
±[abs(Ø - cos
Temperature coefficient Same as the temperature coefficient for voltage and current
Frequency Measurement Accuracy
Frequency
measurement
range
Data update interval 0.1 s 0.25 s 0.5 s 1 s 2 s 5 s
Measurement range 25 Hz ≤ f ≤ 100 kHz 10 Hz ≤ f ≤ 100 kHz 5 Hz ≤ f ≤ 100 kHz 2.5 Hz ≤ f ≤ 100 kHz 1.5 Hz ≤ f ≤ 50 kHz 0.5 Hz ≤ f ≤ 20 kHz
Accuracy ±0.06%
Frequency filter 500 Hz low-pass
1
Input signal frequency in kHz
2
Input waveform: Sine wave crest factor: 3, common-mode voltage: 0 V, power factor: 1
Frequency filter: Turn on when measuring ≤ 200 Hz
3
When power factor (PF)=0 (apparent power (S)):
±0.2% of S when 45 Hz ≤ f ≤ 66 Hz
±{(0.2+0.2×f)% of S} when 0.066 ≤ f ≤ 100 kHz
When 0<PF<1(phase angle (Ф)):
(power reading ) × [(power reading error %) + (power range %) × (power range/indicated apparent power value) + {tan
When the line filter is turned ON:
45 to 66 Hz: Add 0.3% of reading
<45 Hz: Add 1% of reading
4
Accuracy when the crest factor is set to 6, the accuracy is obtained by doubling specified accuracies
CF= 3:5 mA, 10 mA, 20 mA, 50 mA, 100 mA, 200 mA, 0.5 A, 1 A, 2 A, 5 A, 10 A, 20 A
CF= 6:2.5 mA, 5 mA, 10 mA, 25 mA, 50 mA, 100 mA, 250 mA, 0.5 A, 1 A, 2.5 A, 5 A, 10 A
CF = 3: 2.5 V, 5 V, 10 V
CF = 6: 1.25 V, 2.5 V, 5 V
CF= 3: 50 mV, 100 mV, 200 mV, 500 mV, 1 V, 2 V
CF= 6: 25 mV, 50 mV, 100 mV, 250 mV, 500 mV, 1 V
±{(0.07 f
±(0.5% + 0.5% F.S.) ± [{0.04×(f
2
% of reading to the AC current accuracies + 0.00013 × I
2
% of reading + 0.00004 × I2 mA (2.5 to 200 mA), add to the DC current accuracy specifications
Apparent power accuracy + ( 1.0004-PF
-1
(influence from the power factor when PF=0%/100)})] ± 1 digit
when voltage and current are at the measurement range rated input
-1
(PF/1.0002)) + sin-1{(influence from the power factor when PF=0%)/100}] deg ± 1 digit
when voltage and current are at the measurement range rated input
1
)% + 0.3% F.S.}
1
-10)}%]
2
% of reading + 0.004 × I2 mA (0.5 to 20 A) or
2
) - ( 1-PF2) × 100%
(CF 3 and signal <30% F.S.) or,
(CF 6 and signal <60% F.S.), and
≤ 200 Hz with frequency filter on
Ф× (influence when PF=o)%}]
5
Page 57

Power Meter
v092117
5335B
Specifications (cont.)
Harmonic Measurement Parameters
Measurement method PLL synchronization
Frequency range PLL frequency source range 10 Hz to 1.2 kHz (typical)
FFT data length 1024
Window function Rectangle
Fundamental frequency (Fund. freq.) 10 Hz to 75 Hz 75 Hz to 150 Hz 150 Hz to 300 Hz 300 Hz to 600 Hz 600 Hz to 1200 Hz
Sample rate
(Fund. freq.) x
1024 (Fund. freq.) x 512
Window width 1 2 4 8 16
Upper limit of analysis orders 50 32 16 8 4
Harmonic Measurement Accuracy (when line filter is off)
Frequency 10 Hz ≤ f < 45 Hz 45 Hz ≤ f ≤ 440 Hz 440 Hz < f ≤ 1 kHz 1 kHz < f ≤ 2.5 kHz 2.5 kHz < f ≤ 5 kHz
Voltage and current ±0.15% ± 0.35% F.S. ±0.15% ± 0.35% F.S. ±0.20% ± 0.35% F.S. ±0.80% ± 0.45% F.S. 3.05% ± 0.45% F.S.
Power ±0.15% ± 0.50% F.S. ±0.20% ± 0.50% F.S. ±0.40% ± 0.50% F.S. 1.56% ± 0.60% F.S. 5.77% ± 0.60% F.S.
Oscilloscope Function
Channels 2
Measurement Voltage and current
Bandwidth (-3 dB) 10 kHz
Sample rate 100 kS/s
Record length 300 points/channel
Horizontal scale (Accuracy ±4.0%) 500 us, 1 ms, 2 ms, 5 ms, 10 ms, 20 ms, 50 ms, 100 ms, 200 ms, 500 ms
I: 2.5, 5, 10, 25, 50, 100, 250, 500 mA/div, 1 A, 2.5 A, 5 A, 10 A/div,
I: 5, 10, 20, 50, 100, 200, 500 mA/div, 1 A, 2 A, 5 A, 10 A, 20 A/div,
Vertical scale ranges
(Accuracy ±4.0%)
CF 3
CF 6
Maximum input voltage (DC+AC peak) 1800 V
Maximum input current (DC+AC peak) 60 A
Environmental and Safety
Temperature
Operating: 41 ºF to 104 ºF (5 °C to 40 °C)
Storage: -4 ºF to 122 ºF (-20 °C to 50 °C)
Humidity 20% RH to 80% RH (non-condensing)
Electromagnetic compatibility IEC 61326
Safety IEC 61010-1, EN 61010-1, Measurement 600 V CAT II
General
Display 4.3” TFT-LCD display, 480 x 272
Remote Interfaces USB, GPIB, RS232, LAN
Power 100 to 240 VAC, 50 / 60 Hz
Power Consumption 50 VA max.
Dimensions (W x H x D) 8.4” x 3.5” x 14” (214.5 mm × 88.2 mm × 354.6 mm)
Weight 6.2 lbs (2.8 kg)
Standard Accessories Getting started manual, instruction manual (downloadable), AC power cord, USB type A-to-type B cable, certificate of calibration
(Fund. freq.) x 256
U: 7.5, 15, 30, 75, 150, 300 V/div
U: 15, 30, 60, 150, 300, 600 V/div
(Fund. freq.) x 128 (Fund. freq.) x 64
Three-Year Warranty
Test Equipment Depot - 800.517.8431 - 99 Washington Street Melrose, MA 02176
TestEquipmentDepot.com
6
Page 58

Chapter 11
Routine Maintenance
This chapter describes general maintenance items and maintenance methods of the 5335B power meter.
11.1 Self-inspection
The 5335B power meter has a self-inspection function. See “Power-on Self-Test” of Chapter 3 “Inspecting the
Instrument” of 5335B Installation Instructions for detailed steps of self-inspection.
11.2 Error Information References
The 5335B power meter has a detailed error and prompt information function, so as to help the user to easily carry
out positioning and measurement during measurement and use. This section describes all error information of the
5335B power meter as well as error causes and disposals. All prompt information is listed.
11.2.1 Prompt Message List
11.2.2 Error information list
Error information Error information explanation
Error description No USB peripheral is found.
usb is not detected
Save screen fail
Possible cause No USB peripheral is inserted.
Disposal Insert the U disc type USB peripheral and then copy the screen.
Error description The screen is not saved successfully.
Possible cause USB is disconnected.
Disposal Reinsert the USB peripheral.
48
Page 59

CHAPTER 11. ROUTINE MAIN TENANCE 49
Error information Error information explanation
Start time is less than current
End time is less than current
Timer must be larger than
zero.
Harmonic open fail
Error description The start time is less than the current time.
Possible cause The integral seing is incorrect.
Disposal Reset the integral start time.
Error description The ending time is less than the current time.
Possible cause The integral seing is incorrect.
Disposal Reset the integral ending time.
Error description The set time must be larger than zero.
Possible cause The set integral time is not correct.
Disposal Reset the set integral time.
Error description The harmonic function cannot be enabled.
Possible cause Communication abnormality
Integ open fail
Integ start fail
Integ stop fail
Disposal Check the communication cable.
Error description The integral function cannot be enabled.
Possible cause Communication abnormality
Disposal Check the communication cable.
Error description The integral function cannot be started.
Possible cause Communication abnormality
Disposal Check the communication cable.
Error description The integral function cannot be stopped.
Possible cause Communication abnormality
Disposal Check the communication cable.
Page 60

CHAPTER 11. ROUTINE MAIN TENANCE 50
Error information Error information explanation
Error description The oscilloscope function cannot be enabled.
Scope openfail
Time set fail
Cal zero fail
Possible cause Communication abnormality
Disposal Check the communication cable.
Error description Time seing fails.
Possible cause Time seing is illegal.
Disposal Reset the system time.
Error description Zero calibration fails.
Possible cause Communication abnormality
Disposal Check the communication cable.
Table 11.1: Errors
11.3 Daily maintenance
Introduce basic maintenance in daily use of equipment. Such as cleaning, self-maintenance allowed to be
performed by the user, etc.
11.3.1 Equipment cleaning
Use dry cloth or slightly wet cloth to gently wipe the equipment. Do not arbitrarily wipe the inside of the
instrument. Cut o the power supply before cleaning.
11.3.2 Initialize
When this operation is implemented, the system seings are recovered to the factory default values.
1. Select “SYSTEM > INITIAL” in the “Menu” interface to enter the system initialization interface. See the
following figure.
2. Select the menu items to be initialized (blue symbol background) via buon. Menu items with characters ##
following should be initialized; ## indicates that the items will not be initialized.
3. Press the so key corresponding to the symbol on the right of the interface to determine whether to
initialize this menu item. Or use the so key “ ” (for initialization of all menu items) or “ ” (no initialization
for all menu items) in the lower part of the interface.
4. Press the “START” so key to initialize system seings. Press the ESC to exit.
Test Equipment Depot - 800.517.8431 - 99 Washington Street Melrose, MA 02176
TestEquipmentDepot.com
Page 61

CHAPTER 11. ROUTINE MAIN TENANCE 51
Prompt information Explanation of prompt information
Cal Zero is working! The instrument is calibrating the zero point.
Cal Zero is completed! The instrument has completed zero point calibration.
Test screen Self-inspection of LCD screen
Test dsp Self-inspection of DSP.
Test beep Self-inspection of the buzzer.
SelfTest is finished! The instrument has finished the self-test.
Sokey is not available The current so key is not available.
Time set ok! The time seing is completed.
Meter Initialization Initialization of general measurement
Integ Initialization Initialization of integral function
Scope Initialization Initialization of the oscilloscope function
Harmonic Initialization Initialization of the harmonic function
Inrush Initialization Initialization of the inrush function
Setup Initialization Initialization of setup
System Initialization Initialization of the system
Initialization is finished! Initialization is finished.
Integ start Integration is started.
Integ stop Integration is stopped.
Integ time up The integral time is up.
Max pagehas been reached. It displays The maximum page has been reached.
One page should exist at
least
Not used in current state The current operation is not available.
Please reset first Please reset first.
One page should exist at least.
11.4 Troubleshooting
This section describes operations to be carried out by the user in case of failure of the instrument. Preparation
before contact
When the instrument fails, check the following:
• Check whether the power meter is powered up.
• Check whether the power meter is started normally.
• Check whether the instrument fuse is in good conditions.
• Check whether other connectors are in good conditions and whether cables, plugs and other parts are
connected properly.
• Check whether the system configuration of the instrument is correct during use.
• Check whether self-inspection of the instrument is successful and whether the specifications and
performance are within the indicator ranges.
Page 62

CHAPTER 11. ROUTINE MAIN TENANCE 52
• Check whether the instrument displays error information.
• Use other instruments instead of this instrument for confirmation.
Page 63
99 Washington Street
Melrose, MA 02176
Phone 781-665-1400
Toll Free 1-800-517-8431
Visit us at www.TestEquipmentDepot.com
53
Page 64

54
 Loading...