

Page 1

Instruction Manual
3.3GHz (Model 2650/2652) and 8.5GHz (Model 2658)
Handheld Spectrum Analyzer series
Page 2

Before Starting to Use the Unit
· When you use the unit, please observe the following notes listed on the rear of the body.
· For you to use it safely
1) When abnormal sounds, abnormal smell and smoke were confirmed, remove the battery and AC adapter
and stop the use.
2) Never use with hands that got wet, because doing so may cause damage, fire an d electric shock to the
unit.
3) Never use it under the thunder. There is a possibility of receiving a thunderbolt.
4) Never use an AC adapter other than the one specified, because doing so may cause damage to the unit.
For static electricity protection, ground the unit by connecting the three cores if possible. Not grounding
the unit can damage it and the object measured.
5) Never use a battery other than the one specified, because doing so may cause damage to the unit.
When removing or installing the battery , be sure to do it after you turn off the unit and disconnect the
AC adapter.
6) When replacing the fuse, disconnect the AC adapter, open the battery cover on the back and remove
battery , and then take sufficient care to perform the replacement. Use 5A/250V fuse (IEC127-2 sheet 3,
slow-blow type).
Never use a fuse not specified because doing so may cause damage to the unit.
–I–
Page 3

· Guarantee of quality
Guarantee period
Guarantees that it will repair any failure free of charge if it occurs because of our responsibility within
one year after delivery . However , the above guarantee does not apply to such a failure that:
1) is caused by a fire, natural disasters, etc.
2) is caused by inappropriate handling of the unit, such as dropping it while moving it after
purchasing.
3) is caused by handling counter to the instructions or precautions listed in the operating manual.
4) is caused by modifying the unit or by being considered to be your responsibility because of
inappropriate use.
We will not be responsible for direct or indirect damage caused by use of this product or by a failure of
this product.
W arm-up time
In order to stabilize the electric performance at the time of turning on the unit, please perform
warming-up for at least 10 minutes.
The LCD may flicker on conditions of the low temperature and the dark backlight.
In that case, adjust the LCD backlight control BLCTR to be bright.
However, do not be bright too much in order to keep battery operation time longer .
Precautions for storage
1) Strictly observe the storage conditions specified for this unit, such as avoiding direct sunlight and dust.
2) Store this unit in a place where -20°C to 60°C, less than 60°C/70%RH, variations in temperature and
humidity are small.
After service
If you have any question about the contents of this product or how to operate it, please contact us at:
B&K Precision Corporation
22820 Savi Ranch Parkway – Yorba Linda, CA92887
TEL. 714-921-9095 FAX. 714-921-6422
URL: http://www .bkprecision.com/ E-mail: sales@bkprecision.com
–II–
Page 4

Contents
1. Outline
1.1 Product outlines --------------------------------------------------------------------------------------- 1
1.2 Standard accessories ---------------------------------------------------------------------------------- 2
1.3 Optical accessories ------------------------------------------------------------------------------------ 2
---------------------------------------------------------------------------------------------------------- 1
2. Specifications ------------------------------------------------------------------------------------------------- 3
2.1 Performances ------------------------------------------------------------------------------------------ 3
2.2 Outline -------------------------------------------------------------------------------------------------- 6
3. Description of Panel --------------------------------------------------------------------------------------- 7
4. Description of Scre en
5. Function Key Menu
5.1 List of the function key m enus ---------------------------------------------------------------------11
5.2 Menu tree ---------------------------------------------------------------------------------------------12
------------------------------------------------------------------------------------10
--------------------------------------------------------------------------------------11
6. Preparing for Ope ration -------------------------------------------------------------------------------17
6.1 Stand ---------------------------------------------------------------------------------------------------17
6.2 Connection to powe r supp ly ------------------------------------------------------------------------17
6.3 Replacin g the f use -----------------------------------------------------------------------------------18
6.4 Installing the battery ---------------------------------------------------------------------------------18
6.5 Soft carrying case ------------------------------------------------------------------------------------18
7. Center Frequency <FREQ> --------------------------------------------------------------------------19
7.1 Setting with the step keys ---------------------------------------------------------------------------19
7.2 Setting with the encod er ----------------------------------------------------------------------------19
7.3 Setting with the numeric keys ----------------------------------------------------------------------19
7.4 According to the m arker position ------------------------------------------------------------------20
8. Frequency Span <SPAN> -----------------------------------------------------------------------------20
9. Reference Level <REFER>
9.1 Setting the reference level --------------------------------------------------------------------------22
9.2 Switching units of amplitud e axis -----------------------------------------------------------------22
9.3 Reference level setting range for each unit -------------------------------------------------------22
---------------------------------------------------------------------------21
Page 5

9.4 Relation between the ref erence lev el and ATT·AMP -------------------------------------------23
9.5 Setting the offs et level -------------------------------------------------------------------------------23
9.6 Setting the input impe dance correction -----------------------------------------------------------24
10. Display Scale <SCALE> -----------------------------------------------------------------------------24
10.1 Setting with the keys -------------------------------------------------------------------------------24
10.2 Setting with the encoder ---------------------------------------------------------------------------24
1 1. Resolution Bandwidth <RBW> -------------------------------------------------------------------25
11.1 MANU AL mode -----------------------------------------------------------------------------------25
11.2 AUTO mode ----------------------------------------------------------------------------------------25
11.3 ALL AUT O mode ----------------------------------------------------------------------------------25
12. V ideo Bandwidth <VBW> ---------------------------------------------------------------------------25
12.1 MANUAL mode -----------------------------------------------------------------------------------26
12.2 AUTO mode ----------------------------------------------------------------------------------------26
12.3 ALL AUT O mode ----------------------------------------------------------------------------------26
13. Sweep Axis · Detection mode <SWEEP> ------------------------------------------------------26
13.1 MANUAL mode -----------------------------------------------------------------------------------26
13.2 AUTO mode ----------------------------------------------------------------------------------------26
13.3 ALL AUT O mode ----------------------------------------------------------------------------------27
13.4 Setting the detection mode ------------------------------------------------------------------------27
14. AUT O Tuning <AUTO TUNE> -------------------------------------------------------------------27
15. Hold/Run <HOLD/RUN>
16. Calculation Function <CALC>
16.1 NORM mode ---------------------------------------------------------------------------------------28
16.2 MAX HOLD mode --------------------------------------------------------------------------------28
----------------------------------------------------------------------------27
--------------------------------------------------------------------27
16.3 MIN HOLD mode ---------------------------------------------------------------------------------28
16.4 A VERAGE mode ----------------------------------------------------------------------------------28
16.5 OVER WRITE mode ------------------------------------------------------------------------------29
16.6 SPURIOUS FREE mode --------------------------------------------------------------------------29
Page 6

17. Marker · Peak Search <MKR>
17.1 Moving the marker ---------------------------------------------------------------------------------31
17.2 Setting the peak search <PEAK SEARCH> ---------------------------------------------------31
17.3 Changing the unit of marker point ---------------------------------------------------------------31
--------------------------------------------------------------------30
18. Save/Load <SAVE/LOAD> --------------------------------------------------------------------------32
18.1 Save/Load (2650/2652) ----------------------------------------------------------------------------32
18.2 Save/Load (2658) ----------------------------------------------------------------------------------34
19. Measuring Function <MEAS> ---------------------------------------------------------------------36
19.1 Channel power measurement <Ch Power> -----------------------------------------------------37
19.2 Adjacent channel leakage pow er measurement <Adj Ch Pw> -------------------------------38
19.3 Occupied frequency bandwidth measurement <Occ Bw> -----------------------------------39
19.4 Electric field strength measurement <E/F ANT> ----------------------------------------------40
19.5 Magnetic field strength measurement <M/F PROBE> (optional) ---------------------------45
19.6 Frequency counter <Freq COUNT> (factory option) -----------------------------------------47
20. Screen Control <DSPL> ------------------------------------------------------------------------------52
20.1 Adjusting the contrast ------------------------------------------------------------------------------52
20.2 Switching ON and OFF the LCD backlight ----------------------------------------------------52
20.3 Ad justing the brightness of the LCD backlight -------------------------------------------------52
20.4 Inverting the display -------------------------------------------------------------------------------52
20.5 Enable or disabling the beep ----------------------------------------------------------------------52
21. Tracking Generator Mode ---------------------------------------------------------------------------- 53
21.1 Specification only for T.G. function --------------------------------------------------------------53
21.2 Description of I/O connector ----------------------------------------------------------------------53
21.3 Switching ON and OFF the T .G. function -----------------------------------------------------54
21.4 Normalizing of wave form ----------------------------------------------------------------------54
22. Printing <PRINT> (optional) -----------------------------------------------------------------------55
22.1 Hard copy of the screen ---------------------------------------------------------------------------55
23. Data Output <RS232C> ------------------------------------------------------------------------------56
Page 7

23.1 Selecting the trace to transfer ---------------------------------------------------------------------56
23.2 Selecting the communication speed (baud rate) ------------------------------------------------56
23.3 Tran sfer the data ------------------------------------------------------------------------------------56
24. RS-232C Interface ---------------------------------------------------------------------------------------58
24.1 RS-232C specifications ----------------------------------------------------------------------------58
24.2 How to connect -------------------------------------------------------------------------------------58
24.3 Command description -----------------------------------------------------------------------------59
24.4 Input the frequency ---------------------------------------------------------------------------------64
24.5 Writin g of original compensation data -----------------------------------------------------------64
24.6 Sample Programs -----------------------------------------------------------------------------------66
25. PC Software (optional) ---------------------------------------------------------------------------------67
26. Basis Performance Test
26.1 Frequency characteristics --------------------------------------------------------------------------68
26.2 Accuracy of reference level -----------------------------------------------------------------------69
26.3 The displa y accuracy of the center frequency --------------------------------------------------69
26.4 The displa y accuracy of the frequency span ----------------------------------------------------70
26.5 Linearity of the amplitude axis -------------------------------------------------------------------70
------------------------------------------------------------------------------67
Page 8

–
1. Outlines
1.1 Product outlines 2650/2652/2658
2650/2652/2658 is an authentic spectrum analyzer providing performance and functions that are
comparable to those of large-size bench type equipment, in a compact, lightweight and inexpensive
model.
1) Compact and lightweight, 1.8 kg(2650/2652/2658)
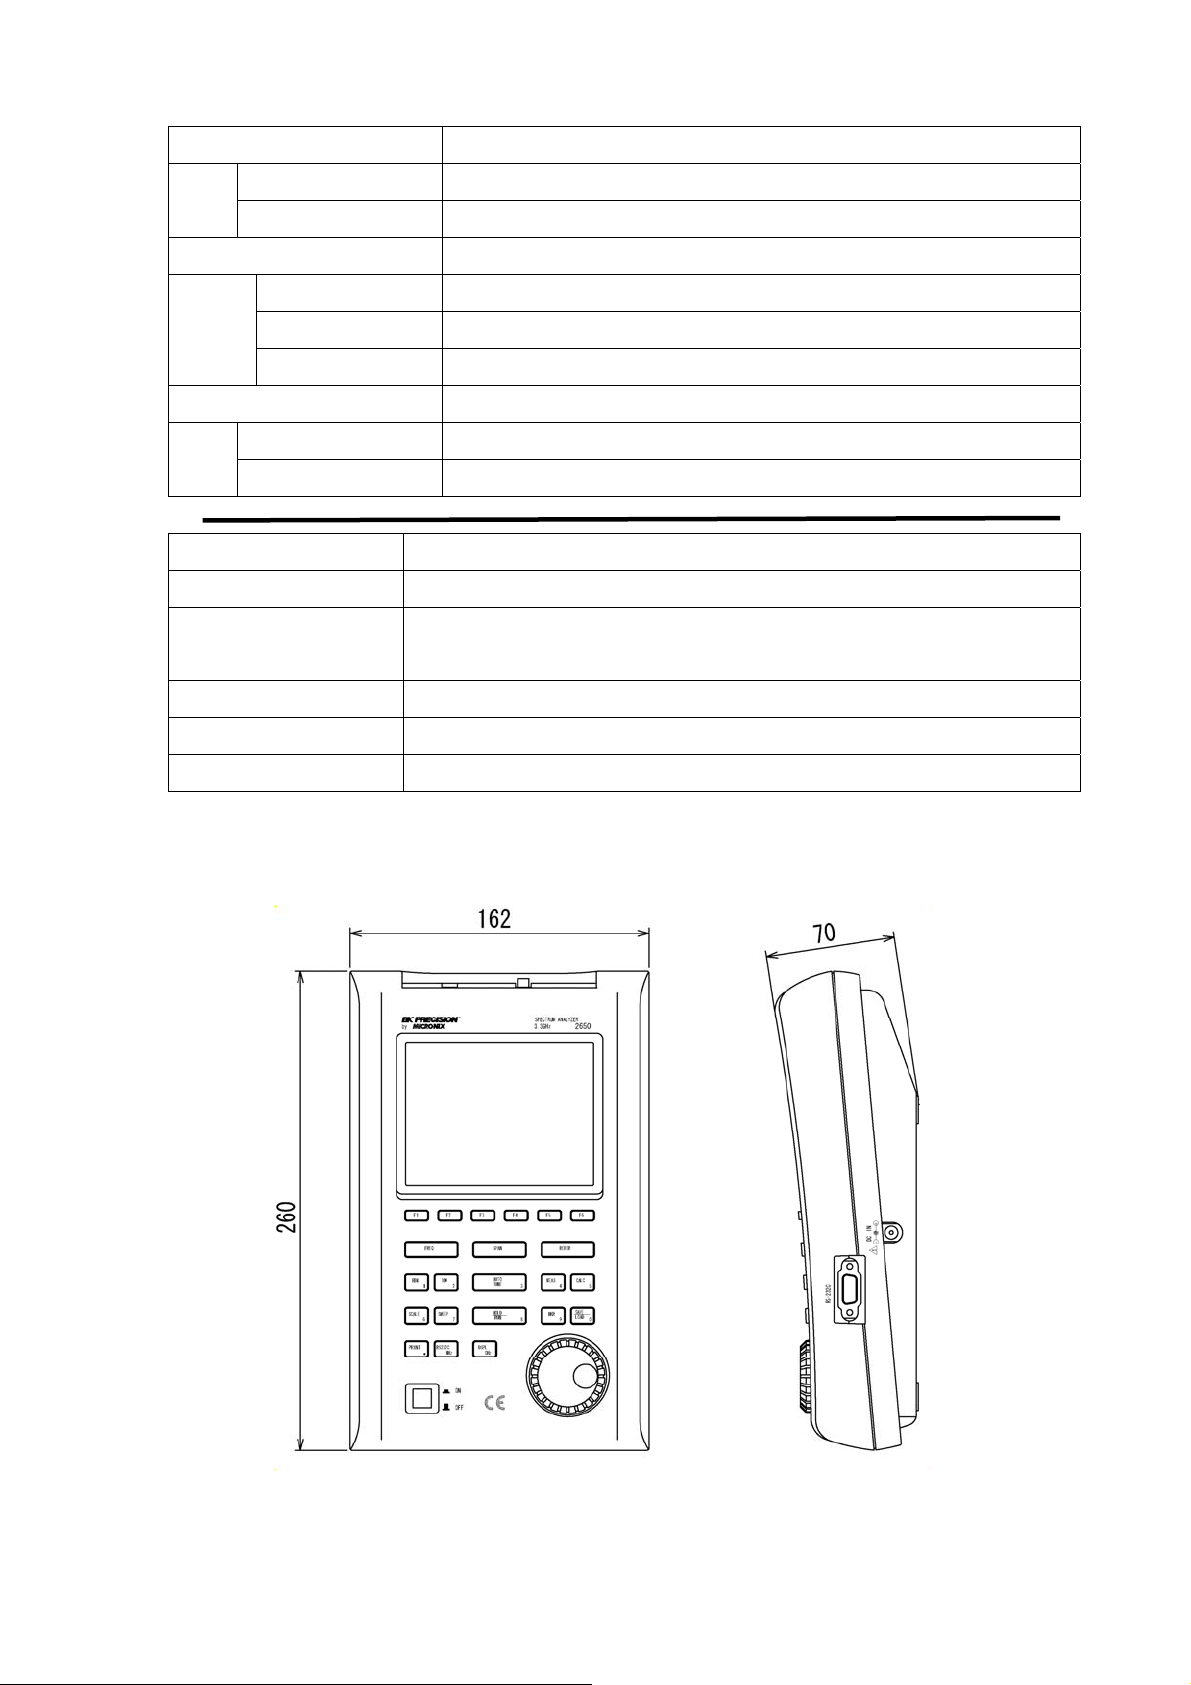
The external dimensions are as small as (W×H×D) 6.4×2.8×10.2” (162×70×260mm), and the weight is
only 3.7lb(1.8 kg) including the battery . It is very convenient for outdoor use and while on business trips.
2)Measuring frequency bandwidth 50kHz to 3.3GHz(2650/2652)/50kHz to 8.5GHz(2658)
This bandwidth covers those of W-CDMA, CDMA, PDC, PHS, GSM, wireless LAN, Bluetooth, etc.
3) Operation with battery for 110 minutes
When battery BP 2650 is fully charged, 2650/2652/2658 works for about 110 minutes (with the back
light turned off). It is extremely convenient for outdoor use and for use in the survey of wireless LAN
installation environment.
4) Performance that is comparable to that of large-size bench type equipme nt
2650/2652/2658 guarantees a highly stable frequency axis by PLL synthesizer system. The center
frequency setup resolution is 100kHz. Furthermore, the mean noise level is -110dBm or less. Thus,
a broad dynamic range is secured and the reference level can be set in 1 dB steps.
5) Abundant functions
Measuring functions··· Channel power measurement, Adjacent channel leakage power measurement,
·
Occupied frequency bandwidth measurement, Electric field strength
measurement, Magnetic field strength measurement (optional), Frequency
counter (factory option).
· Electric field strength measurement: Optimum for measurement of cellular phone and
wireless LAN working environment.
· Magnetic field strength measurement: Optimum for EMI design of printed circuit boards
and for evaluation of signal quality.
· Calculation functions··· MAX HOLD, MIN HOLD, AVERAGE, OVER WRITE
· Marker & peak search · Save/load
6) Auto tuning
The center frequency is set at the spectrum of the maximum level in the 3.3GHz(2650/2652)
/8.5GHz(2658) band, and in addition, optimum reference level, resolution bandwidth, video bandwidth
and sweep time are set when the AUTO TUNE key is pressed. This function is very convenient for
measurement of an unknown signal.
7) Auto range motion
The resolution bandwidth, video bandwidth and sweep time are set automatically based on the set
frequency span. It is also possible to set auto range motion only one out of resolution bandwidth,
video bandwidth and sweep time.
8) Hard copy of the image
Connect a printer (optional) and press the [PRINT] key on 2650/2652/2658. The image on the screen is
printed as it is.
1–
Page 9
–
9) High resolution display on the PC screen
The trace is displayed at high resolution, 1001 points in the horizontal axis, on the PC screen when “PC
Software AK 2650” (optional) is used.
1.2 Standard accessories
1. AC adaptor BC 2650
2. Soft carrying case LC 2650
3. Accessory pouch
4. Fuse (It has been installed in the inside)
5. Operating manual
6. Ni-MH Battery BP 2650 (Refer to “6.4 Installing the battery” for details.)
1.3 Optional accessories
1. Antenna AN301, AN302, AN303, AN304, AN305, AN306
2. Magnetic field probe PR 26M with a dedicated double shielded coaxial cable
3. PC software AK 2650 including RS232 cable (Refer to “25. PC Software” for details.)
4. Printer PT 2650 with AC adaptor. 4pcs of AA batteries, a roll paper (Refer to “22. Printing” for
details.)
5. Roll paper PX 2650 for PT 2650 printer (with 10 rolls)
6. SMA coaxial cables (order accessory kit CC265)
Connector Cable length Frequency range
SMA(P)/SMA(P) 0.5m DC to 10GHz
SMA(P)/SMA(P) 1.0m DC to 10GHz
SMA(P)/SMA(P) 1.5m DC to 10GHz
SMA(P)/N(J) 0.2m DC to 4GHz
SMA(P)/N(P) 0.2m DC to 4GHz
SMA(P)/BNC(J) 0.2m DC to 2GHz
SMA(P)/BNC(P) 0.2m DC to 2GHz
* Impedance is 50Ω.
* Performances change by bending and deteriorate by repeating the insertion and extraction
(Refer to “19.5 Magnetic field strength measurement” for details.)
(Refer to “19.4 Electric field strength measurement” for details.)
2–
Page 10

2.1 Performances
·Frequency section
2650/2652 2658
Frequency range 50kHz to 3.3GHz 50kHz to 8.5GHz
2.Specifications
Center frequency
Setting
resolution
Accuracy
RBW
Frequency
range
―――
100kHz
Allows Rotary encoder, numeric key and function key
within ±(30+20T)kHz±1dot
@frequency span: 200kHz to 10MHz,
RBW: 30kHz, 23±5°C
within ±(100+700T)kHz±1 dot
@frequency span: 20MHz to 3.3GHz,
RBW: 100kHz, 23±5°C
T: Sweep time(s)
within ±6% of RBW@ RBW: 3kHz, 30kHz
50k~3.5GHz Base band 1
3.3G~6.3GHz Band 1- 1
6.1G~8.5GHz Band 1+ 1
within ±(30+20T)kHz±1dot
@frequency span: 200kHz to 10MHz,
RBW: 30kHz, 23±5°C
within ±(60+300T)kHz±1dot
@frequency span: 20MHz to 8.5GHz,
RBW: 100kHz, 23±5°C
Frequency
band
Harmonic
order
T: Sweep time(s)
frequency
error
Frequency span
Setting range 0Hz(zero span),
Accuracy within ±3%±20TkHz±1dot
Display resolution Frequency span/250
Display dot number 251dots, 1001dots (only the measurement by RS-232C communication)
within ±30% of RBW@ RBW: 100kHz to 3MHz
0Hz(zero span), 200kHz to 5GHz
200kHz to 2GHz(1-2-5step) and
3.3GHz
@frequency span: 200kHz to 10MHz,
23±5°C
within ±3%±200TkHz±1dot
@frequency span: 20MHz to 3.3GHz,
23±°C T: Sweep time(s)
Frequency span/1000 (only the measurement by RS-232C
(The unit displays data in 251 horizontal dots, but it internally captures the trace in
(1-2-5step) and 8.5GHz(full span)
within ±3%±20TkHz±1dot
@frequency span: 200kHz to 10MHz,
23±5°C
within ±3%±200TkHz±1dot
@frequency span: 20MHz to 8.5GHz,
23±5°C T: Sweep time(s)
1001 dots)
Resolution bandwidth 3dB bandwidth @9kHz, 120kHz
–3–
Page 11
Video bandwidth 100Hz to 1MHz(1- 3step), AUTO
SSB phase noise -90dBc/Hz (typical) @100kHz offset, RBW: 3kHz, VBW: 100Hz, Sweep time: 0.3s
Spurious response less than -60dBc
Harmonics less than -40dBc@100MHz to 3.3GHz less than -40dBc@100MHz to 8.5GHz
· Amplitude section
2650/2652 2658
Reference level
Setting range 3kHz to 3MHz(1-3step) and AUTO
Accuracy within ±20%
Selectivity 1:12 (typical, 3dB : 60dB)
Setting range +10 to -60dBm (1dB step)
Accuracy
Unit
Average noise level -110dBm (typical)
Frequency
Characteristic
Input impedance 50Ω
Input VSWR less than 2.0
Input attenuator
Operating range 0 to 25dB (1dB step), coupled with reference level
Switching error within ±0.6dB@100MHz
RBW switching error within ±0.6dB
Display dot number 200dots
within ±0.8dB±1dot
@center frequency: 100MHz, RBW: 3MHz, VBW: 1MHz, ATT: 0dB, 23±5°C
dBm, dBV, dBmV, dBµV, dBµV/m, dBµA/m
(dBµV/m and dBµA/m is used in the measuring function)
@center frequency: 100MHz, RBW:
3kHz, VBW: 100Hz
Within ±2.0dB±1dot@50kHz to100MHz
Within ±1.0dB±1dot@100MHz to 3.3GHz
-110dBm (typical)
@center freq: 1GHz, RBW: 3kHz, VBW:
100Hz
Within ±2.0dB±1dot@50kHz to 100MHz
Within ±1.0dB±1dot@100MHz to 8.5GHz
scale
Input damage level +23dBm(CW average power), 25VDC
· Sweep section
2650/2652 2658
Sweep time
Setting range 10ms to 30s and AUTO(1-3step) 10ms to 30s and AUTO (1-3step)
Scale 10dB/div, 2dB/div Display
Accuracy within ±0.8dB/10dB±1 dot
within ±0.2dB/2dB±1dot
within ±1.6dB/70dB±1 dot
–4–
Page 12

@frequency span: 0 to 2GHz
@frequency span: 0 to 2GHz
· Functions
Trigger mode AUTO(frequency span: zero span)
Detection mode Positive peak, Negative peak, Sample
2650/2652 2658
Marker
Peak search
Accuracy
30ms to 30s and AUTO (1-3step)
@frequency span: full span
within ±0.1%±1dot@ frequency span: 0
to 2GHz
within ±1.5%±1dot@ frequency span:
full span
NORM: displays frequency (7digits max) and level (4digits max) at marker point.
DELTA: disp lays differential frequency and level between 2 markers.
NORM: searches a peak point within 10div. Available NEXT peak (10max).
ZONE: searches a peak point within a zone designated by center and width.
Marker moves to a peak point each sweep.
30ms to 30s and AUTO (1-3step)
@frequency span: 5GHz
within ±0.1%±1dot@frequency span: 0
to 5GHz
within ±2.5%±1dot@frequency span:
full span
· General
Calculation NORM, MAX HOLD, MIN HOLD, AVERAGE, OVER WRITE
MAX/MIN HOLD: 2 to 1024 times, AVERAGE: 2 to 256
Measuring
AUTO tuning
Save Saves 100 traces and 100 setups Save/
Load
2650/2652/2658common
Immunity of radiated
interference
Load Loads 1 trace and 1 setup
Channel power, Adjacent channel leakage power, Occupied frequency bandwidth,
Electric field strength (needs antenna), Magnetic field strength (needs optional
magnetic field probe) measurement, Frequency counter.
When pushing AUTO TUNE key , the
maximum level spectrum within 3.3GHz
bandwidth is adjusted to center, and
reference level, RBW, VBW and sweep
time are adjusted to optimum values.
Less than -35dBc (reference level: 10dBm)
When pushing AUTO TUNE key , the
maximum level spectrum within 8.5GHz
bandwidth is adjusted to center, and
reference level, RBW, VBW and sweep
time are adjusted to optimum values.
Level display at 10V/m
Immunity to cabled
interference
Level display at
transient interference
of 4.0kV
Input connector SMA(J)
Less than -30dBc (reference level: 10dBm)
–5–
Page 13
Communication
Interface RS-232C
Baud rate 2,400 to 38,400bps
Hard copy Allows direct hard copy with an optional printer.
Display LCD
Display
Power source
· Other
2650/2652/2658common
Operating temperature 0 to 50°C (Guaranteed at 23±10°C, without soft carrying case)
Operating humidity
Storage temperature -20 to 60°C, less than 60°C/70%RH
Dimensions 162 (W) × 70 (H) × 260 (D) mm (exclude projections and stand)
Weight approx. 1.8kg (include battery ), a p pr ox . 1.5kg (without battery)
*Refer to ”21.Tracking Generator Mode” for T.G. Specification
2.3 Outline
Backlight CFL backlight
Resolution 320 (H) × 240 (V) dots
Battery Ni-MH battery (optional)
External DC source DC jack, +4.75 to +5.25VDC/4A
less than 40°C/80%RH
(Guaranteed at less than 33°C /70%RH, without soft carrying case)
[Unit: mm]
* B&K Precision Corporation reserves the right to make chang es in design, specification and other information without prio r notice
–6–
.
Page 14
–
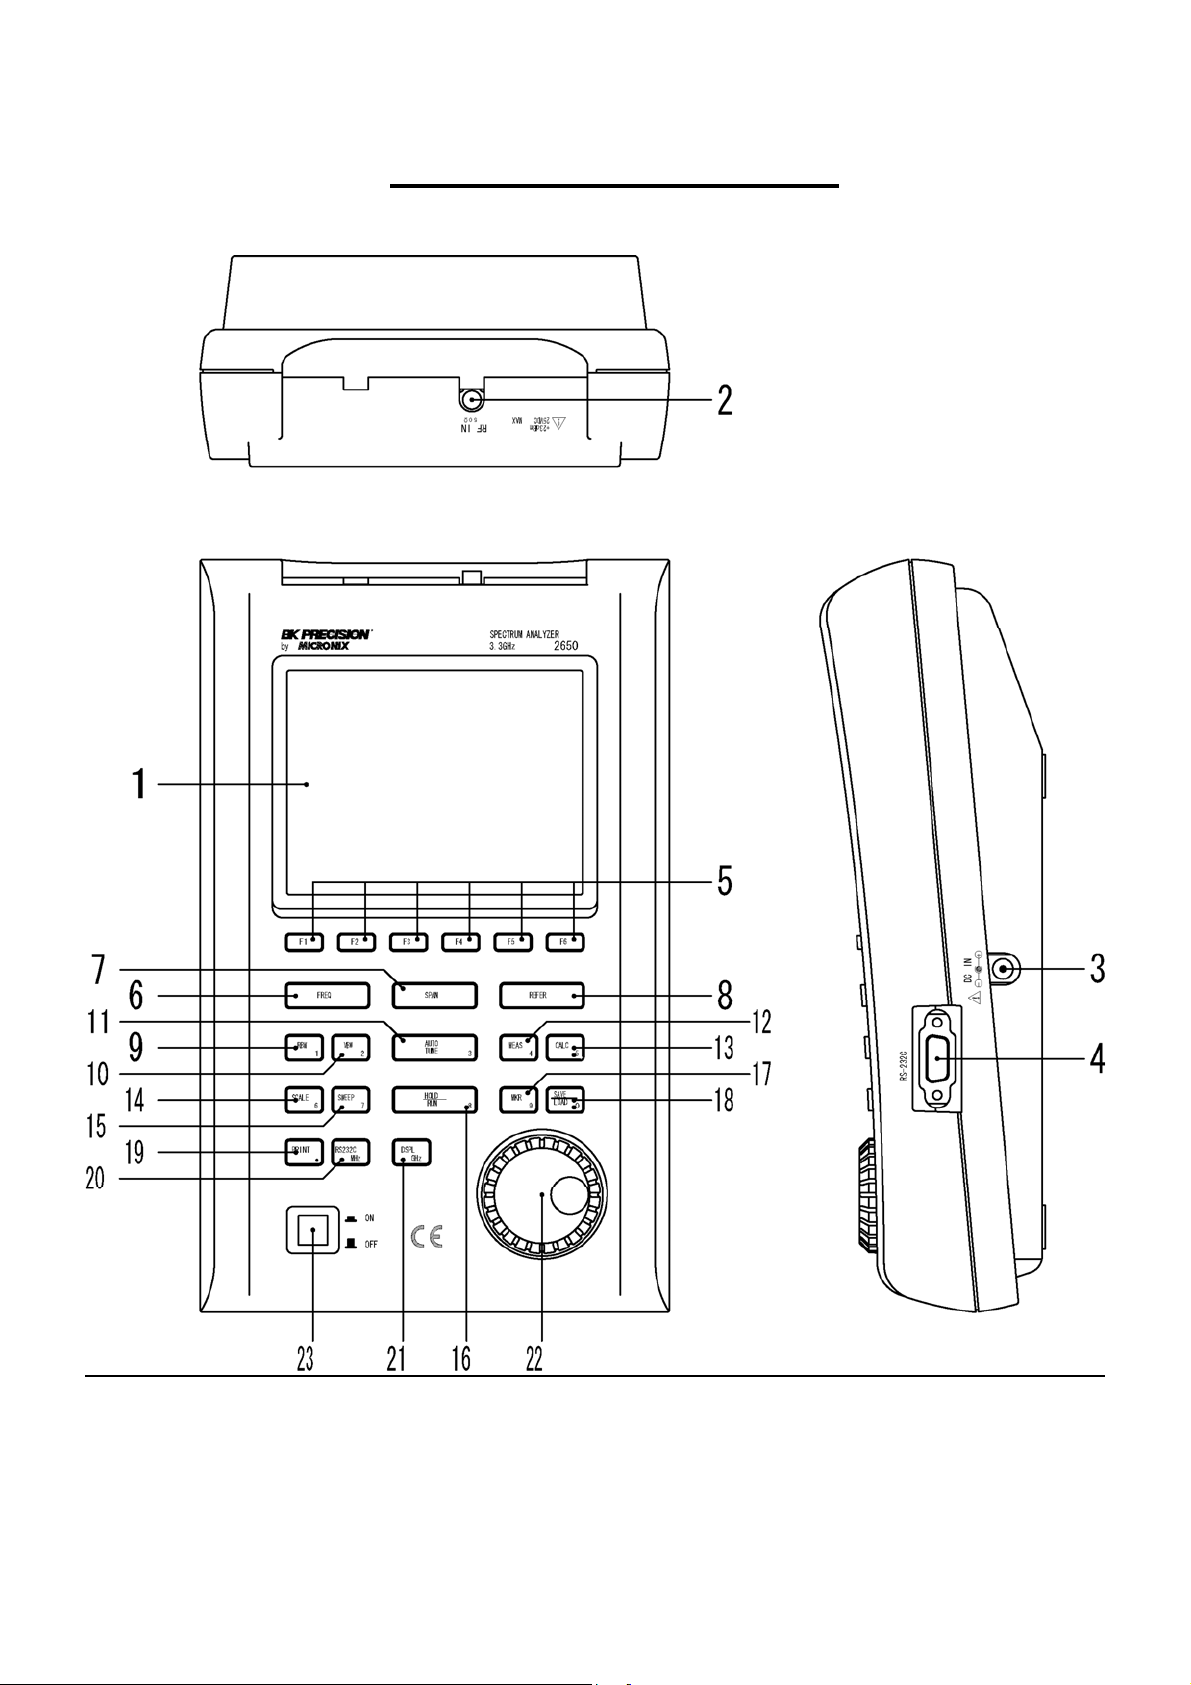
3. Description of Panel
7–
Page 15

–
1) LCD screen
This is a large liquid crystal display with 240 (V) × 320 (H) dots. It simultaneously displays traces (8 div
× 10 div), various setting values, measured values, etc.
2) Input connector
SMA (J) connector .
3) Input connector for DC power source
Connects AC adaptor BC2650.
4) RS-232C connector
Connects PC and printer, by using RS-232C cable.
5) Function keys (F1 to F6)
Functions change according to operation. Have functions corresponding to the on-screen displays.
6) Center frequency key
2650/2652
: Use this key to set the center frequency. It can set between 0 to 3.3GHz (100kHz step).
2658: Use this key to set the center frequency. It can set between 0 to 8.5GHz (100kHz step).
7) Frequency span key
2650/2652: Use this key to set the frequency span. It can set between 200kHz to 2GHz, ZERO SP AN
FULL SPAN (3.3GHz).
2658 Use this key to set the frequency span. It can set between 200kHz to 5GHz, ZERO SPAN
and FULL SPAN (8.5GHz).
8) Reference level key
Set the reference level, etc. Reference level can set between +10dBm and -60dBm (1dB step).
9) Resolution bandwidth key
Use this key to set the resolution bandwidth. It can set between 3kHz and 3MHz.
10) Video bandwidth key
Use this key to set the video bandwidth. It can set between 100Hz and 1MHz.
11) AUTO tuning key
Tune up to the maximum level in 3.3GHz(2650/2652)/8.5GHz(2658) zones, and display by the optimal
setup. This does not operate normally when the signal level is lower than -40dBm , or when the input
frequency is below 50MHz, or when the frequency span is ZERO SP AN or FULL SPAN.
8–
Page 16

–
12) Measuring function key
Available for Channel power, Adjacent channel leakage power, Occupied freq uency bandwidth, Electric
field strength and Magnetic field strength measurement (optional).
13) Calculation function key
A vailable for Max hold, Min hold, A verage and Over write.
14) Display scale key
Use this key to select the display scale of amplitude axis from 2dB/div or 10dB/div .
15) Sweep key
Use this key to set the sweep time between 10ms to 30s or set the detection mode.
16) Hold/Run key
Stops or restarts the measurement.
17) Marker & Peak searc h key
Use this key to set and move a marker.
18) Save/Load key
Saves 100traces and 100setups, and loads 1trace and 1setup.
19) Print key
When pressing this key , the image is printed with a printer PT2650 (optional) as it is.
20) RS-232C key
Sets baud rate and transfers a current or saved trace.
21) Display control key
Sets contrast, backlight ON/OFF , brightness of backlight, invert display and buzzer ON/OFF.
22) Rotary encoder
Use this to make various settings.
23) Power switch
Use this to turn the power ON or OFF .
9–
Page 17
–
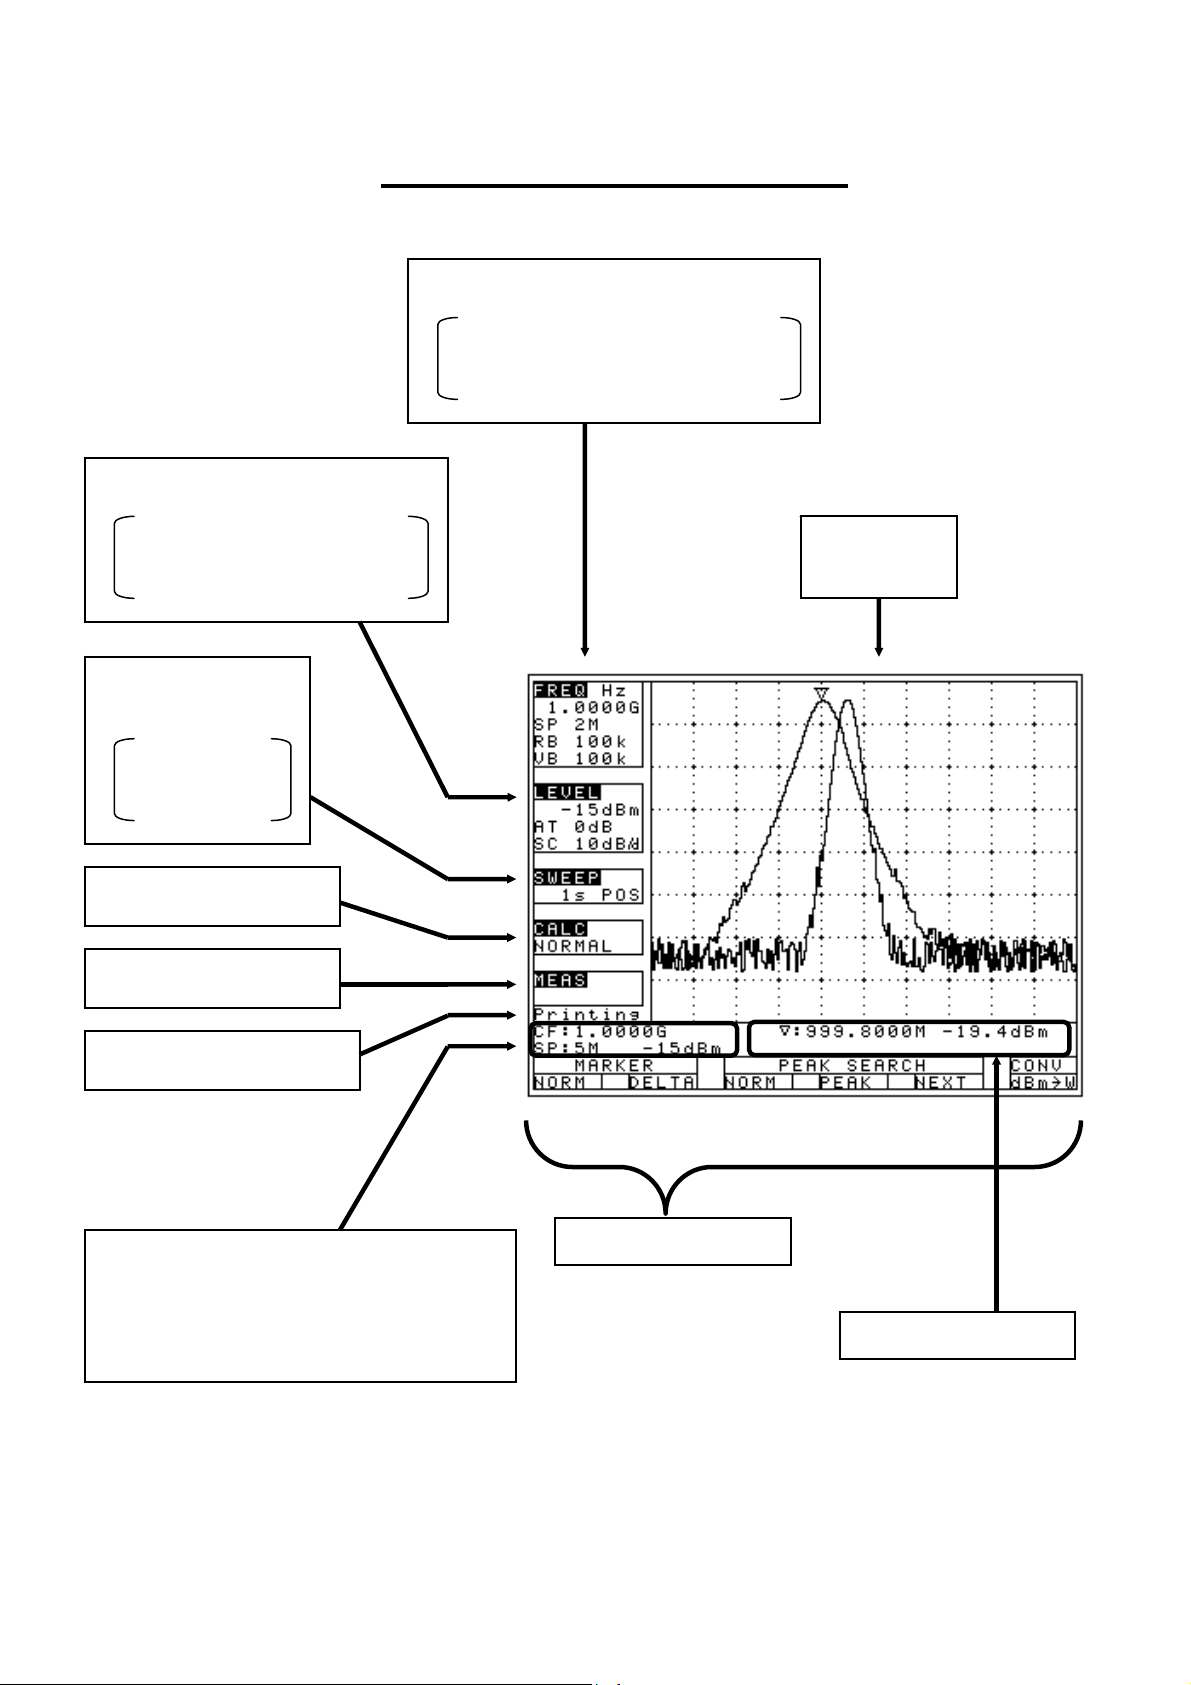
4. Description of Screen
Frequency axis setting values display
Center frequency , Frequency span,
Resolution bandwidth, V ideo bandwidth
Amplitude axis setting values display
Reference level, Input attenuator,
Display scale
Sweep axis setting
values display
Sweep time,
Detection mode
Calculation function display
Measuring function display
Operating information display
Trace display
10div × 8div
Loaded trace information display
* This is also used as a setting values display
when the measuring function is used.
Display for function keys
Measured values display
10–
Page 18
–
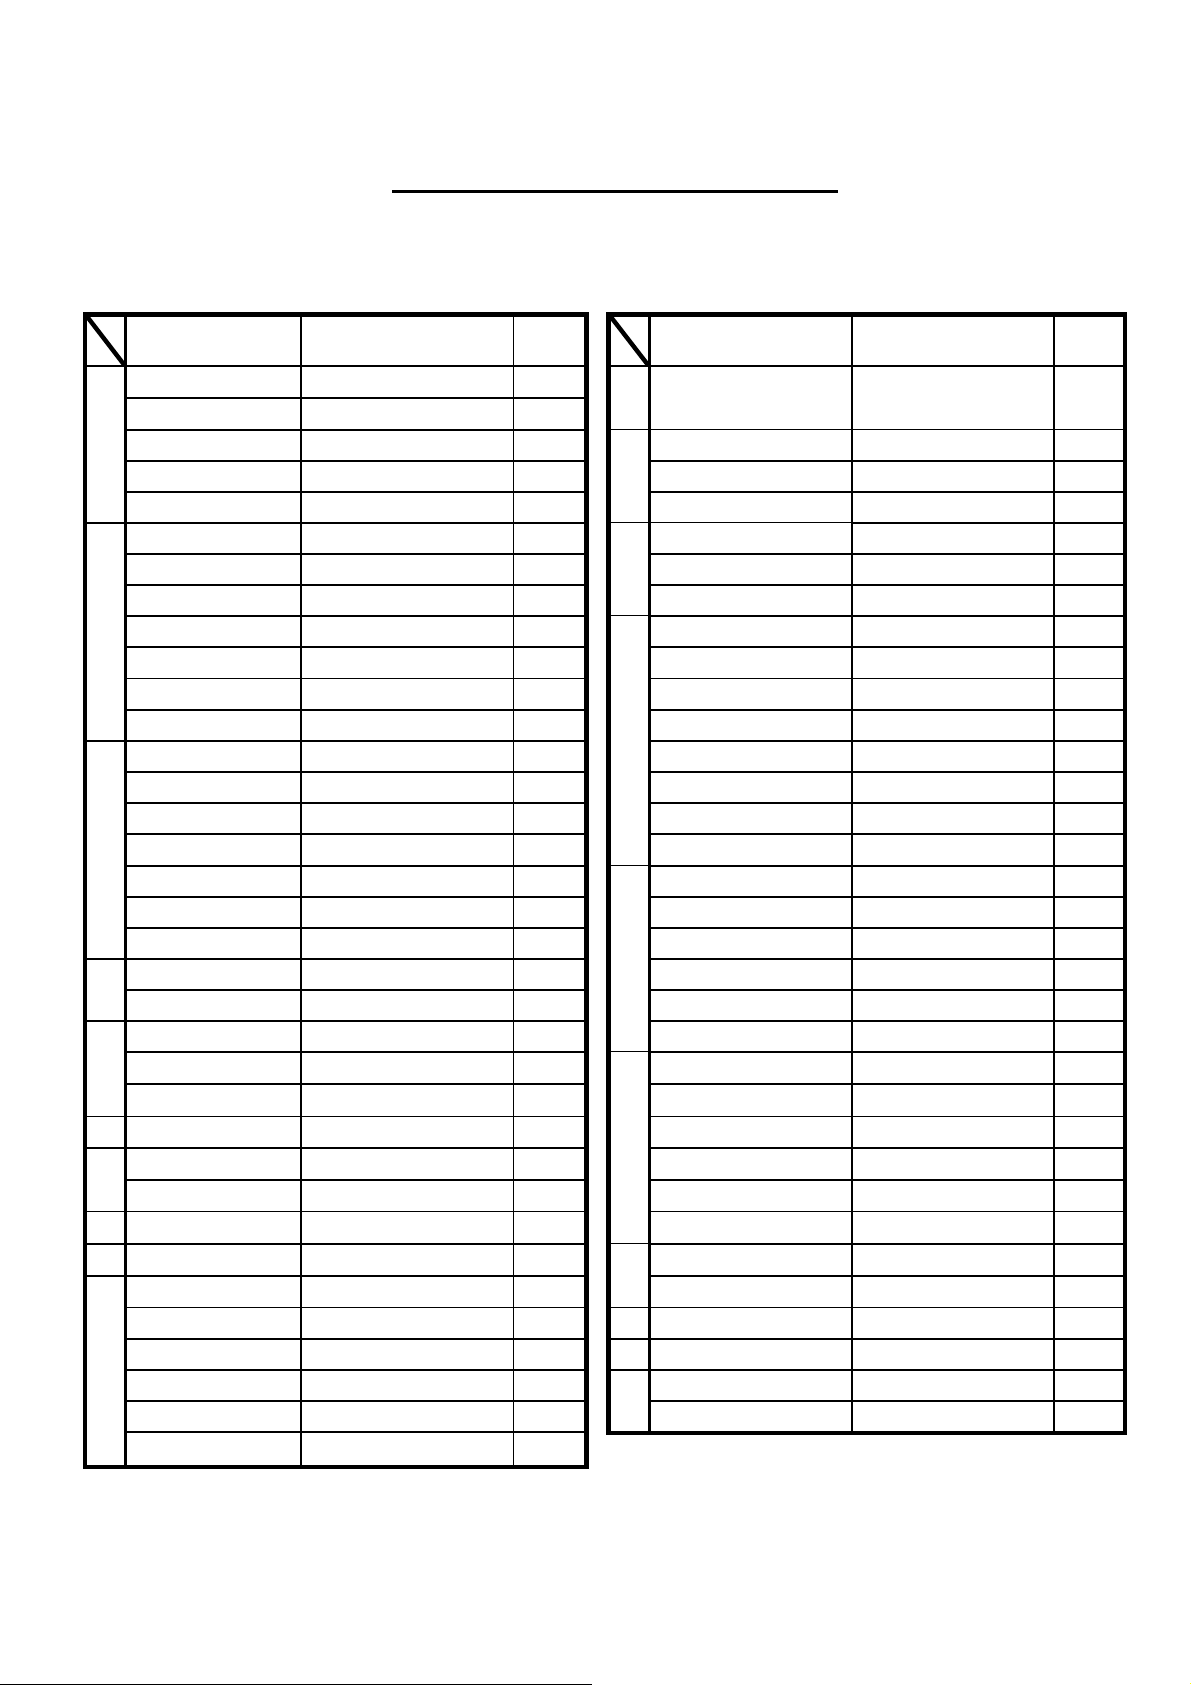
5. Function Key Menu
5.1 List of the Function key menus
The types of function keys are shown in the table below. For description of each function, see the detailed
pages. For the flow of change in the function key display , refer to “5.2 Menu tree”.
Function key menus Key flow
A)
Adj Ch OFS
Adj Ch Pw
Adj Ch WIDTH MEAS→(F2)→F3 36 NORM CALC→F1 28
ANT MEAS→(F4)→F1 38
AVER CALC→F4 28
B) B.L. DSPL→F2 52 O) Occ BW MEAS→F3 39
BACK SPACE FREQ→F5→F6 20 OFSdB REFER→F5 23
BAND CNTR MEAS→(F1)→(F1)→F2 35
BAND WIDTH MEAS→(F1)→(F1)→F3 35
BAUD RS232C→F2 54 PEAK SEARCH NEXT MKR→(F3)→F5 31
BLCTR DSPL→F3 52 PEAK SEARCH NORM MKR→(F3)→F3 31
BUZZR DSPL→F5 52 PEAK SEARCH PEAK MKR→(F3)→F4 31
C) CENTER FREQ → FREQ→F1 19 PEAK SEARCH WIDTH MKR→(F3)→F5 31
CENTER FREQ ← FREQ→F2 19 PEAK SEARCH ZONE MKR→(F3)→F3 31
Ch Power MEAS→F1 35 PRE SET SAVE/LOAD→F6 33
CLEAR FREQ→F5→F5 20
CLEAR SAVE/LOAD→F3 33 R) RATIO MEAS→(F3)→F2 39
CONV MKR→F6 31 RBW ALL RBW→F3 25
CTRS DSPL→F1 52 RBW AUTO RBW→F2 25
D) DET SWEEP→F4 27 RBW MANU RBW→F1 25
DISP CLEAR SAVE/LOAD→F4 33 REFERENCE CNTR MEAS→(F2)→F4 38
E) E/F ANT MEAS→F4 40
EncST FREQ→F4 19 S)
EXEC RS232C→F3 56
F) Freq COUNT MEAS→F6 45 SPURI ※2 CALC→F6 29
I) IMP REFER→F6 24
INVT DSPL→F4 52
K) KeyST FREQ→F3 19
L) LOAD SAVE/LOAD→F2 32
M)
M/F PROBE
MAXHD CALC→F2 28 U) UNIT REFER→F1~4 22
MEAS OFF MEAS→(F1~5)→F6 36 V) VBW ALL VBW→F3 26
MINHD CALC→F3 28 VBW AUTO VBW→F2 26
MKR DELTA MKR→F2 30 VBW MANU VBW→F1 26
MKR NORM MKR→F1 30
MEAS→(F2)→F2 36
MEAS→F2 36
MEAS→F5 43
Detailed
page
M) MODE MEAS→(F1~3)→F1 37,38
N)
P) PEAK SEARCH CNTR MKR→(F3)→F4 31
T)
Function key menus Key flow
NORM ※1 SAVE/LOAD→F6→F1 48
NUM FREQ→F5 19
OVRWR CALC→F5 29
PROBE MEAS→(F5)→F1 45
REFERENCE WIDTH MEAS→(F2)→F5 38
SAVE
SCALE 10dB
SWEEP ALL
SWEEP AUTO
SWEEP MANU
T.G.MODE ※3
TRACE RS232C→F1 56
SAVE/LOAD→F1 32
SCALE→F1 24
SWEEP→F3 27
SWEEP→F2 26
SWEEP→F1 26
SWEEP→F6 53
※2 2658 only ※3 2652 only
Detailed
page
39
11–
Page 19
–
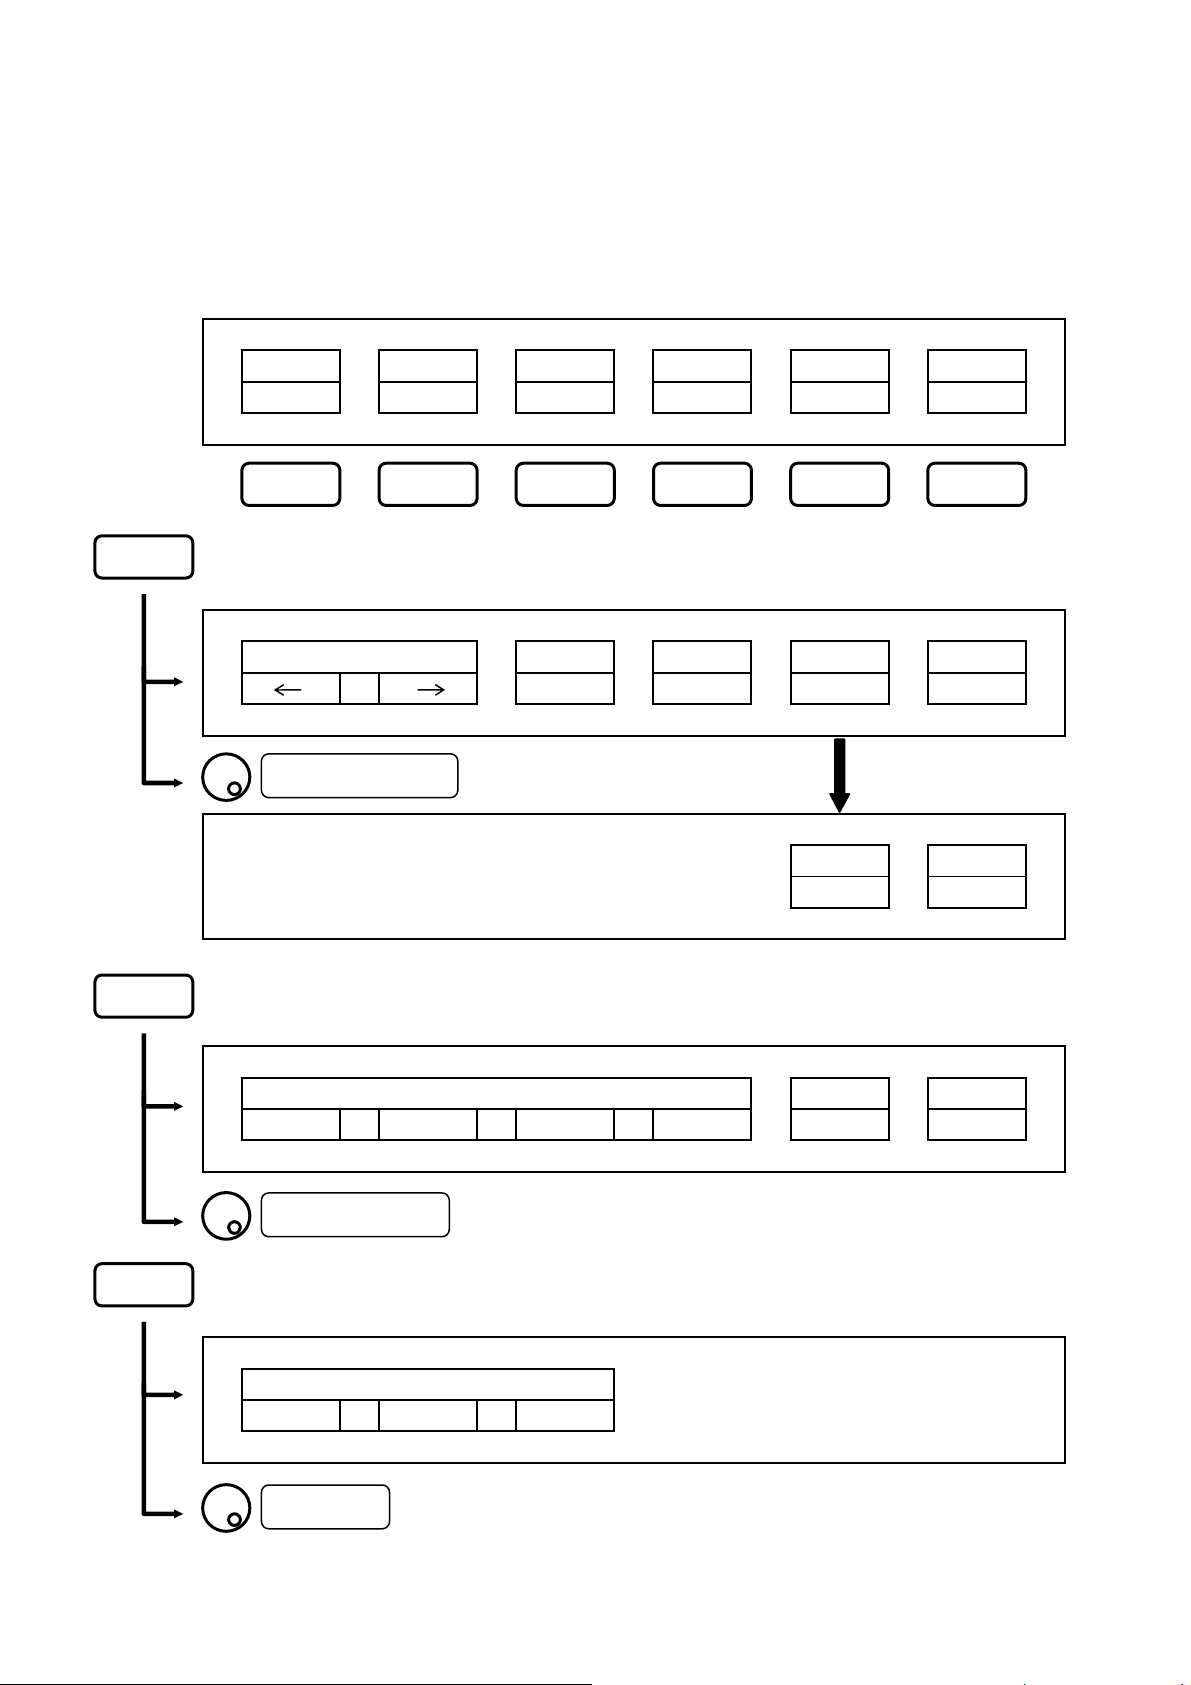
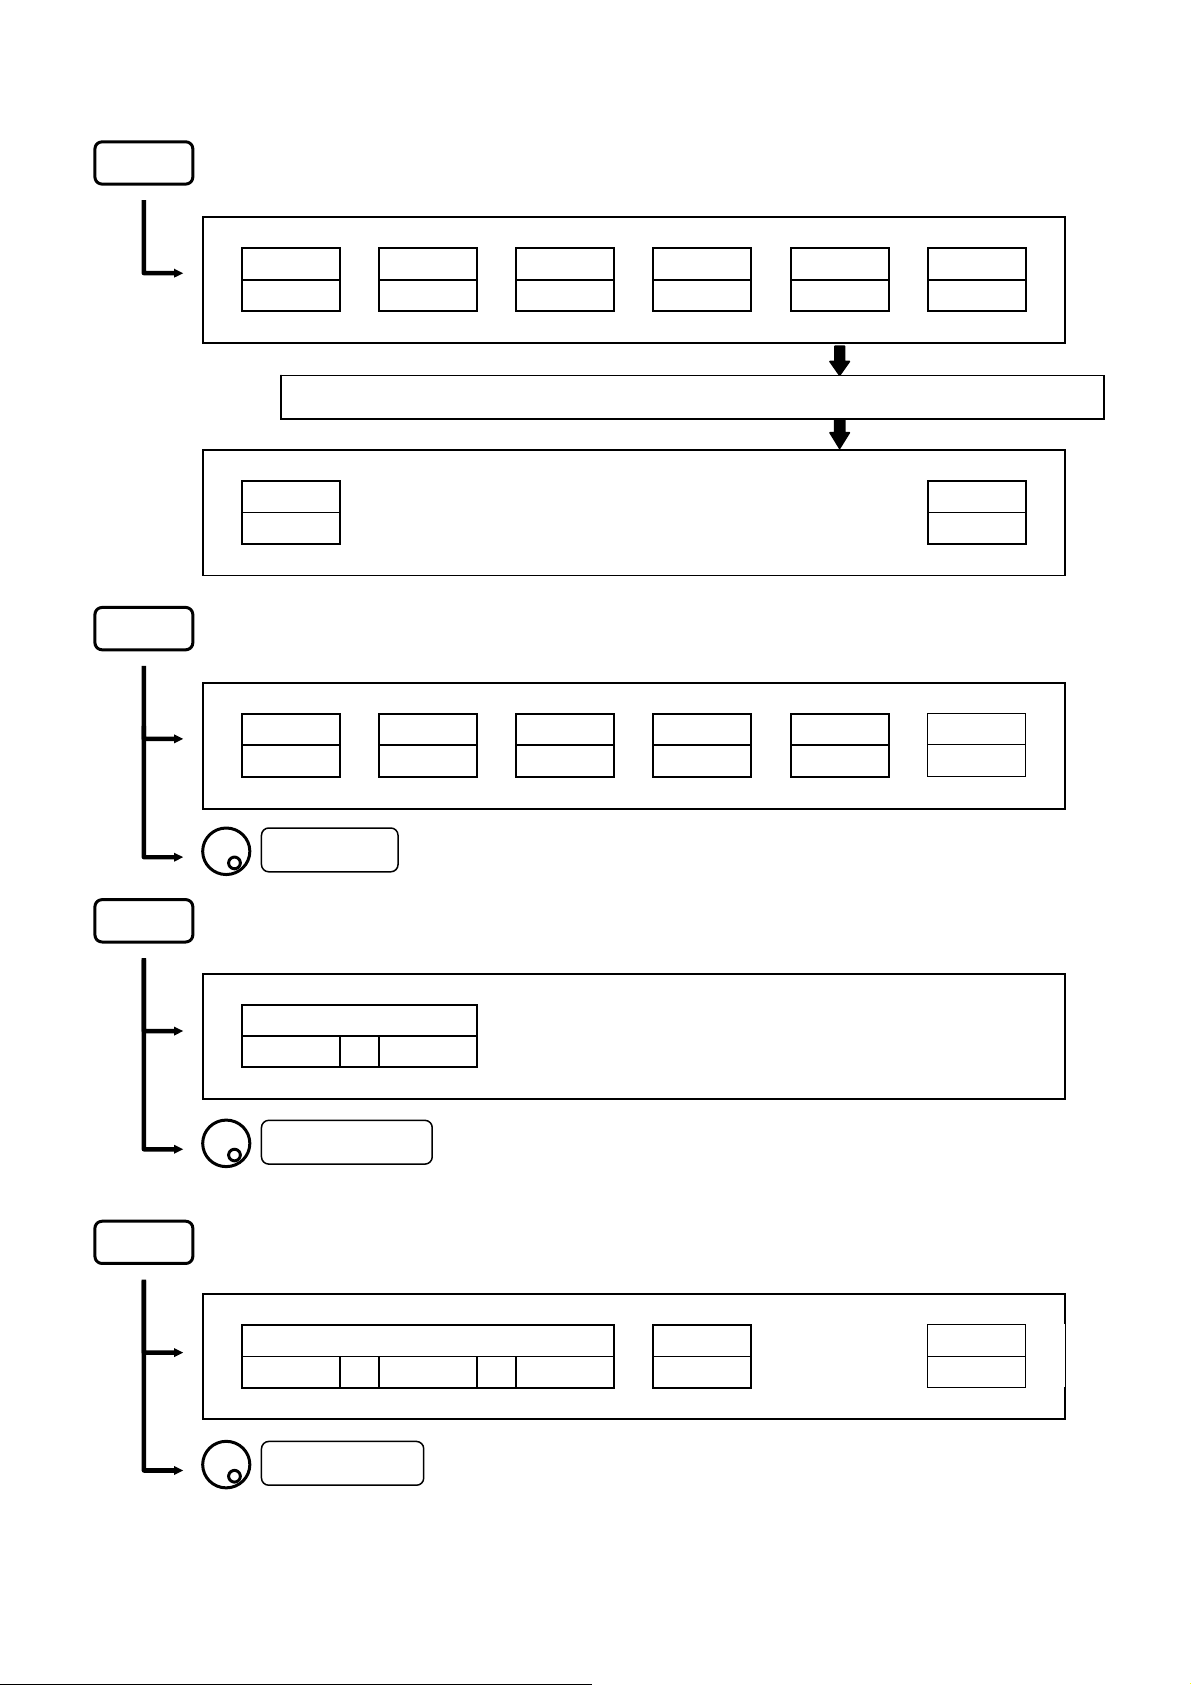
5.2 Menu tree
The displayed items on the bottom of the screen correspond to the function keys under them, as shown in
the figure below:
“Displayed items on the bottom of the screen”
Ch Adj Occ E/F M/F Freq
Power Ch Pw
FREQ
REFER
RBW
* Refer to “7. Center Frequency” for details
* Refer to “9. Reference Level” for details
* Refer to “11. Resolution Bandwidth” for details
F1 F2 F3 F4 F5 F6
CENTER FREQ KeyST EncST SET
: Set the center frequency
dBm
: Set the reference level
MANU AUTO ALL
: Set the RBW
dBµV
RBW
UNIT OFSdB IMP
BW
100M
dBmV
ANT
0.1M
PROBE
NUM
BACK
CLEAR
dBV
0.0
COUNT
MKR
SP ACE
50Ω
12–
Page 20
–
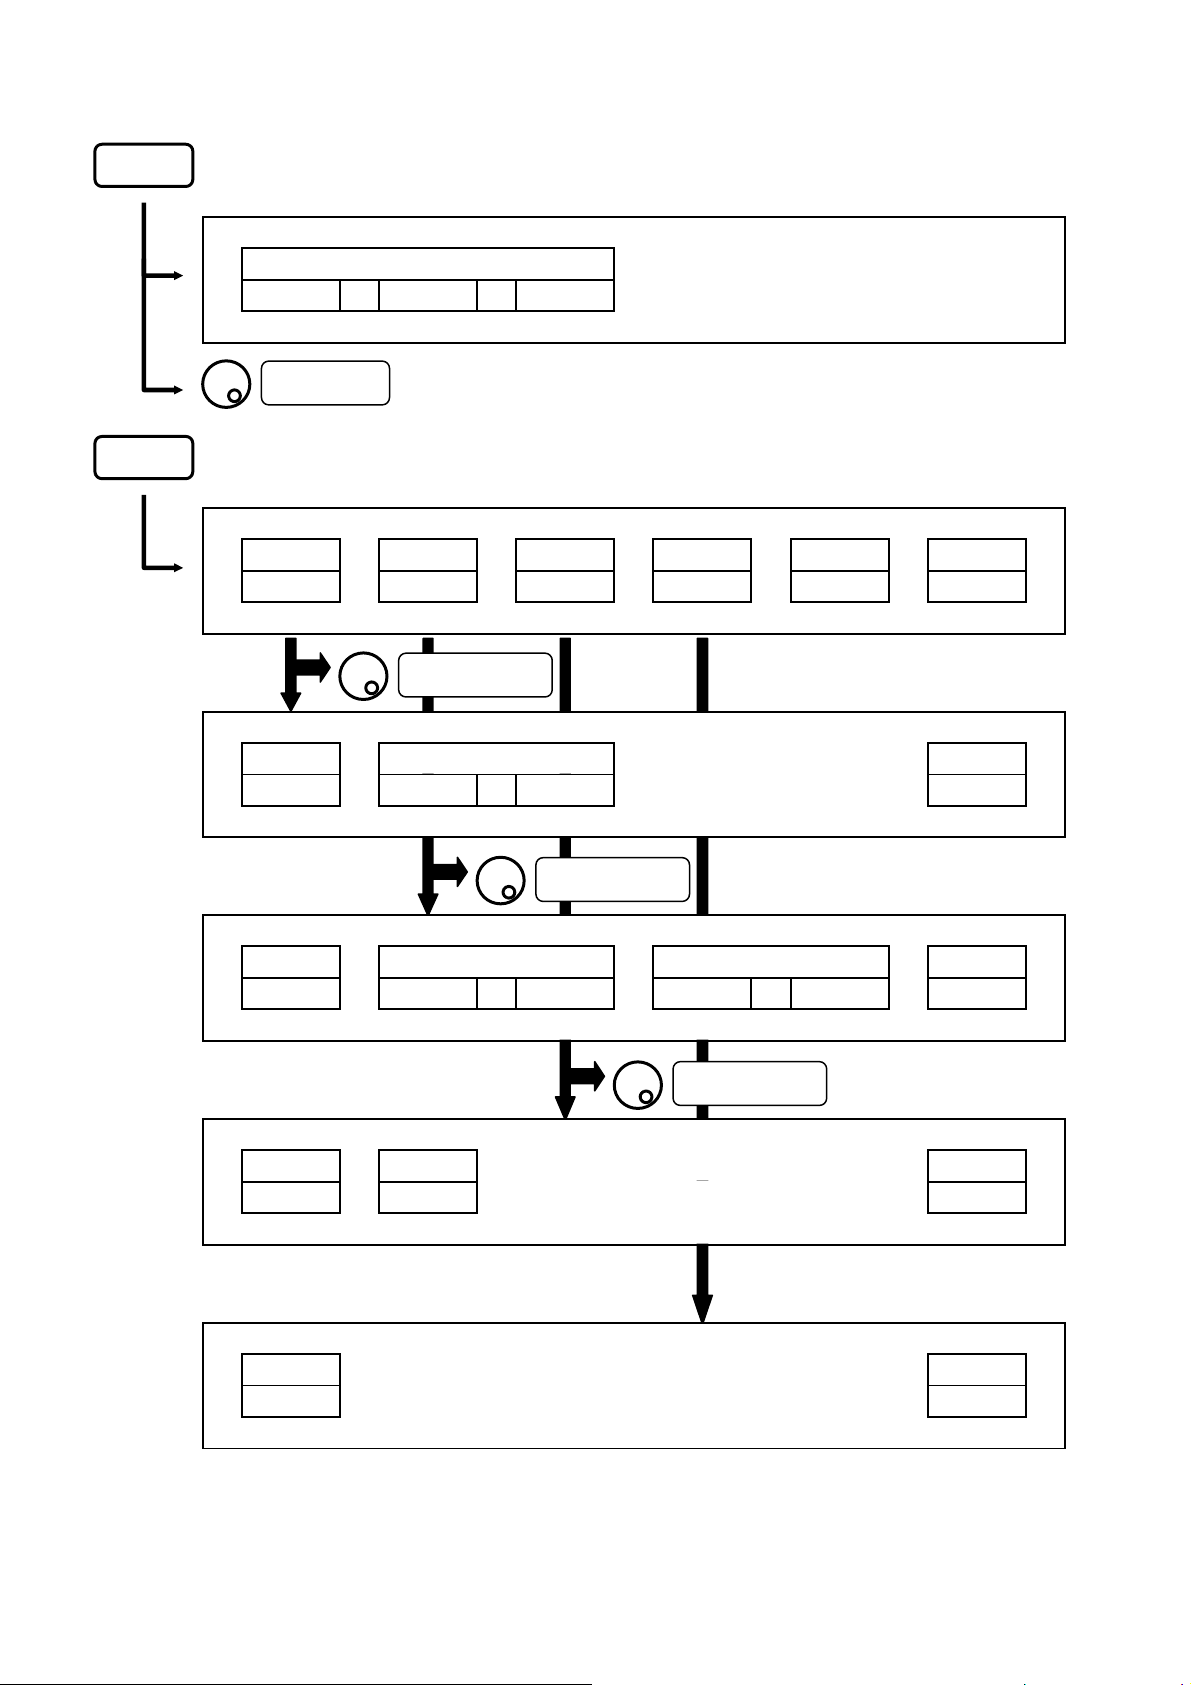
VBW
MEAS
* Refer to “12. V ideo Bandwidth” for details
MANU AUTO ALL
: Set the VBW
(1/2)
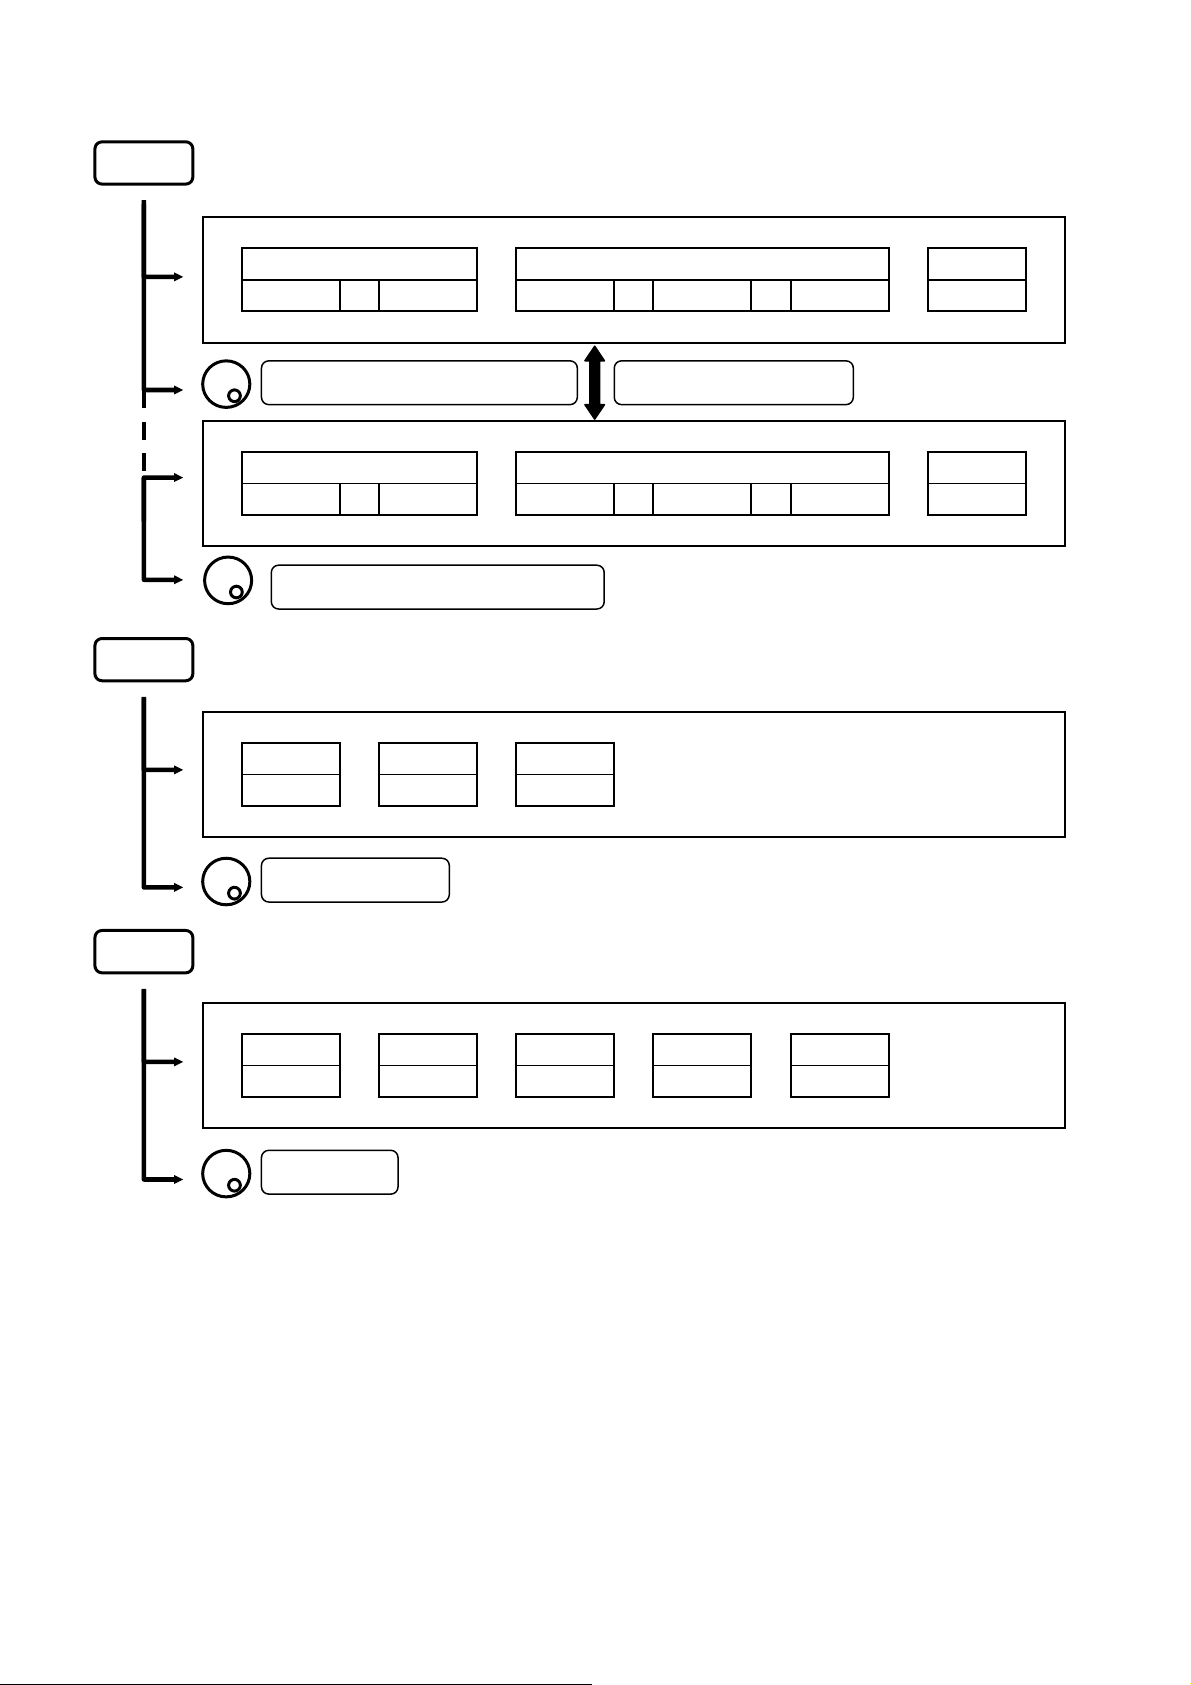
* Refer to “19. Measuring Function” for details
Ch Adj Occ E/F M/F Freq
Power Ch Pw
MODE BAND
BAND CNTR WIDTH
MODE Adj Ch Pw REFERENCE MEAS
TOTAL OFS WIDTH
MODE RATIO MEAS
N% 99.5%
ANT MEAS
AN301
VBW
BW
: Set the parameter
: Set the parameter
ANT
PROBE
COUNT
MEAS
OFF
CNTR WIDTH
OFF
: Set the parameter
OFF
OFF
13–
Page 21
–
MEAS
CALC
SCALE
SWEEP
(2/2)
Ch Adj Occ E/F M/F Freq
Power Ch Pw
BW
ANT
PROBE
Input the probe ID (first time only) *Refer to “19.5 Magnetic field strength measurement” for details.
PROBE MEAS
PR 26M
* Refer to “16. Calculation Function” for details
* SUPRI is only for 2658
NORM MAXHD MINHD AVER OVRWR
**
**
256
: Set the number
* Refer to “16. Display Scale” for details
SCALE
10dB 2dB
: Set the display scale
* Refer to “13. Sweep A xis・Detection Mode” for details
* T .G. MODE is only for 2652
SWEEP DET
MANU AUTO ALL
MODE
: Set the sweep time
COUNT
OFF
SPURI
OFF
T.G.
MODE
14–
Page 22
–
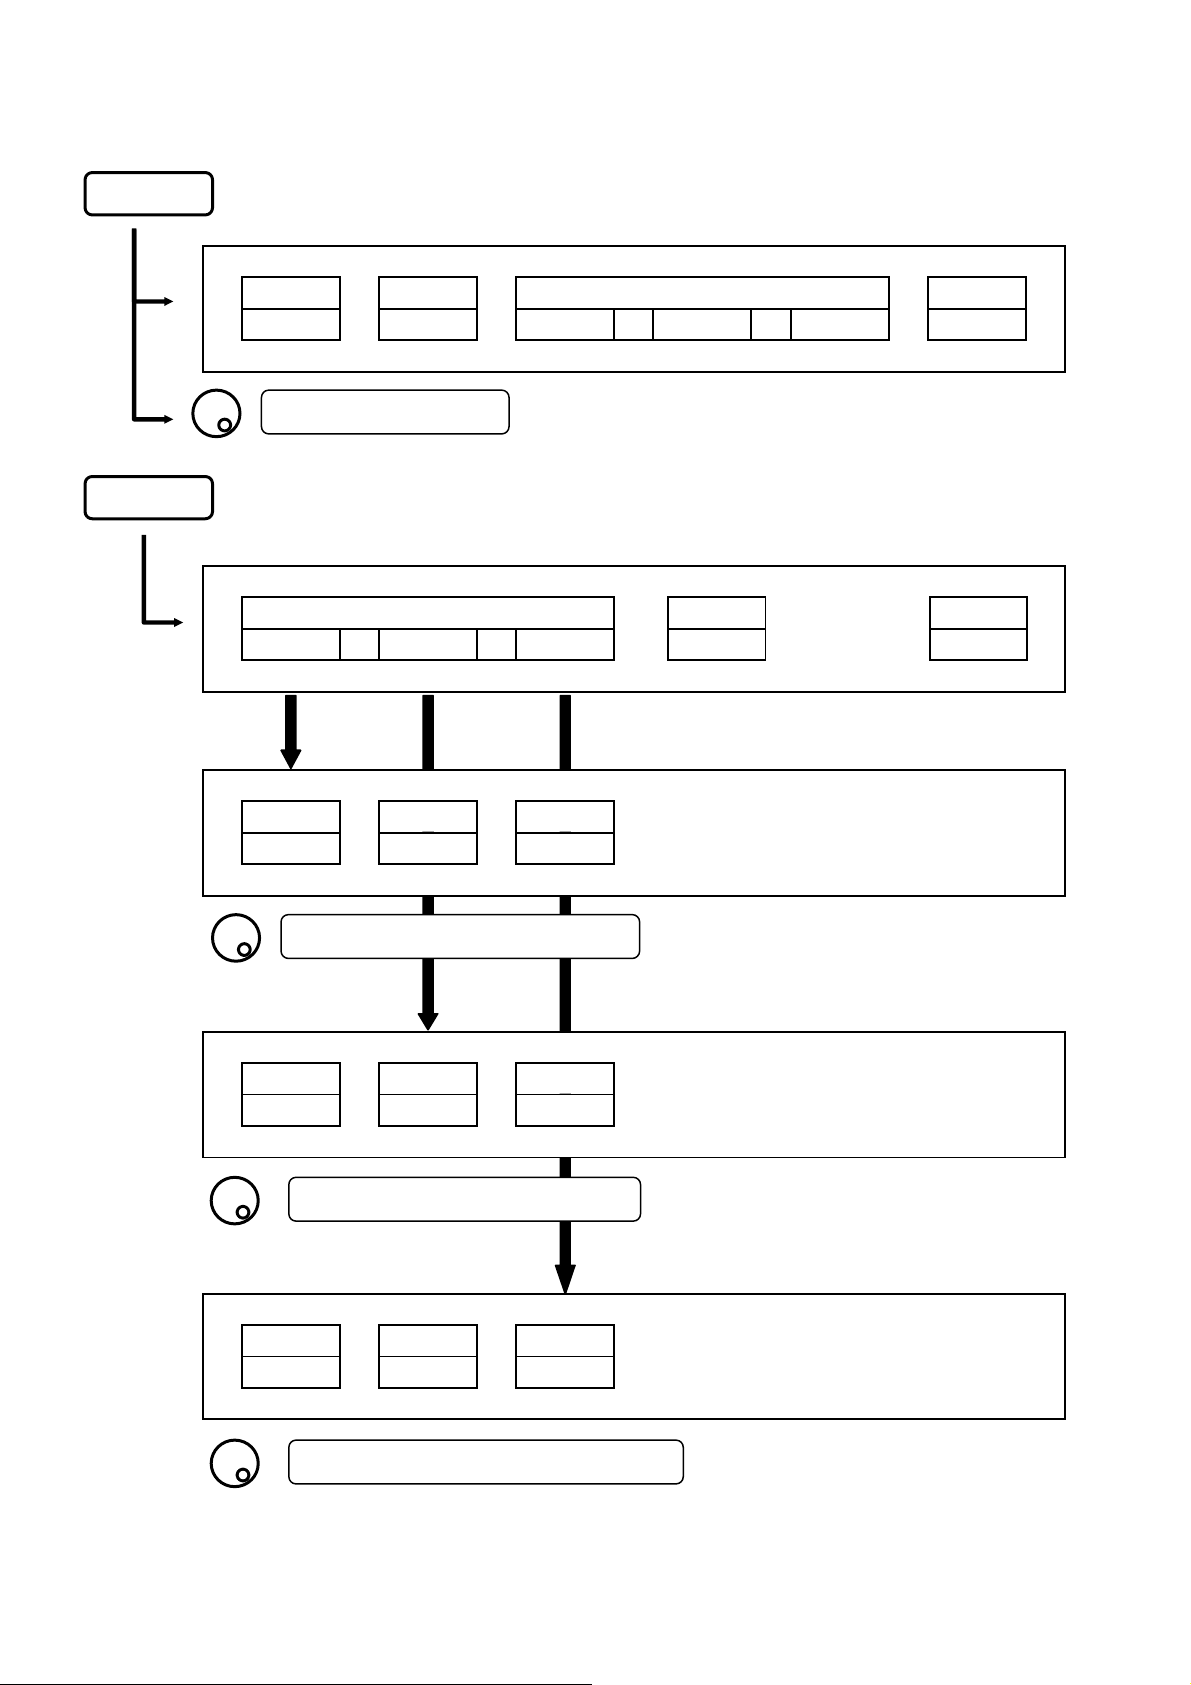
MKR
RS232C
DSPL
* Refer to “17. Marker · Peak Search” for details
Changing for marker mode of the one that selected it last.
NORM DELTA
: Move the marker position (NORM mode)
NORM DELTA
MKR PEAK SEARCH CONV
MKR PEAK SEARCH CONV
: Set the zone center frequency (ZONE mode)
* Refer to “23. Data Output” for details
TRACE BAUD
CURR 38400
: Set the trace to transfer
* Refer to “20. Screen Control” for details
CTRS B.L. BLCTR INVT BUZZR
140 ON
: Set the contrast
NORM PEAK NEXT
F3: Changing the marker mode
ZONE CNTR WIDTH
EXEC
200
OFF
ON
dBm→W
dBm→W
15–
Page 23
–
SAVE/LOAD
SAVE/LOAD
Main menu
Save menu
Load menu
Delete menu
* Refer to “18.1 Save/Load (2650/2652)” for details
TRACE PARAM EXECUTE
00 00
SAVE LOAD DEL
: Set the address to store the trace
* Refer to “18.2 Save/Load (2658)” for details
SAVE
MODE SELECT
LOAD CLEAR
TRACE
00
PARAM EXEC
00
SAVE
:Set the address to store the trace or parameter
TRACE
00
PARAM
00
EXEC
LOAD
:Set the address to call the trace or parameter
TRACE
00
PARAM
00
EXEC
CLEAR
:Set the address to elimination the trace or parameter
DISP
CLEAR
PRE
SET
PRE
SET
16–
Page 24

–
6. Preparin g for Operation
6.1 S tand
Utilize the stand on the back to use the screen in an easier-to-see angle on the desk.
6.2 Connection to power supply
The BC 2650 AC adapter is both for the use with AC power supply and for char ging the BP 2650 built-in
battery . (Charge is started automatically if AC adapter is connected)
Connect the adapter as in the figure below and connect the AC plug to the power line (100-240 VAC,
50/60 Hz). For static electricity protection, ground the unit by connecting the three cores if possible. Not
grounding the unit can damage it and the object measured. Do not use an AC adapter other t han t he BC
2650 supplied with the unit. Using an AC adapter other than the BC 2650 may cause damage to the unit.
Battery full charge time: approx.8hours
Battery operate time: the longest 110min. (back light OFF)
* When it is not operated at normal temperature,
and setting parameters is the initialization.
AC adapter
BC 2650
Please confirm that the GND of the power supply is grounded also.
* If the voltage of a battery becomes low at the time of battery operation, it will be displayed on a screen as
“Low Batt”, and a buzzer will sound (it sounds, even if it is set up so that a buzzer may not sound), and a
Connect to 100 to 240 VAC, 50/60Hz
← Please ground and
use it surely .
power supply will be shut off within several minutes. At that time, since the switch is the position of “ON”,
please push once and return to the position of “OFF”. If it is with the position of “ON” after a power supply
is shut off, it discharges inside, will be in electric overdischar ge state, and becomes the cause of
contracting the life of a battery . Please take care.
17–
Page 25

–
* Moreover, under low temperature (near 0˚C), since a battery performance falls a nd voltage becomes low,
r
even when capacity remains enough, it may display on a screen as “Low Batt”.
* When a battery repeats charge and electric discharg e, the fall (the fall of capacity and increase in internal
resistance) of a battery performance begins from about 200 times, and capacity falls to the original half by
about 500 times also under good conditions. On bad conditions (high temperature, etc.), the life of battery
will be shorter than this.
6.3 Replacing the fuse
5A/250V fuse (IEC127-2 sheet3, slow-blow type) is used for the battery power supply . When replacing it,
turn the power off first, disconnect the AC adapter , remove the battery cover and on the b ack as sh own in
the figure below , remove the battery, and then take sufficient care to perform the replacement.
Be sure to use the fuse supplied with the unit, or specified one.
6.4 Installing the battery
When installing the battery , turn the power of f first, disconnect the AC adapter, open the battery cover on
the back of the unit after removing the two screws as shown in the figure below, and then take s ufficient
care to perform the installation. Be sure to use the specified battery, BP 2650.
Battery cover
Connecto
Fuse
6.5 Soft carrying case
When carrying the unit or using it outdoors, the soft carrying case is convenient. You can also carry the
AC adapter and printer with it, putting them in the accessory pouch.
* Avoid using the unit in the soft carrying case in places where temperature is high because, with
the soft carrying case, the temperature inside becomes higher than the ambient temperature.
18–
Page 26

–
7. Center Fr equency <FREQ>
Press to switch over to the function screen shown below:
FREQ
CENTER FREQ KeyST EncST SET
F1 F2 F3
100M 0.1M NUM MKR
F4
* Center frequency can be set between 0 to 3.3GHz.(2650/2652)
* Center frequency can be set between 0 to 8.5GHz.(2658)
* Center frequency may shift for the time being (1 to 10 sec.), after changing a setting.
7.1 Setting with the step keys ([F1], [F2])
1. Each time is pressed, the center frequency decreases in the set step size.
2. Each time is pressed, the center frequency increases in the set step size.
F1
F2
F5
F6
3. Setting the step size:
Each time is pressed, it is set in the following order:
F3
0.1MHz 1MHz 10MHz 100MHz
7.2 Setting with the encoder
1. When is turned, the center frequency changes in the set step size.
2. Setting the step size:
Each time is pressed, it is set in the following order:
F4
0.1MHz 1MHz 10MHz 100MHz
7.3 Setting with the numeric keys
1. Press to enter into the numeric key input mode.
* [F5] functions as the <CLEAR> key. [F6] functions as the <BACK SPACE> key.
* In this mode, setting with [F1], [F2] or the encoder is not accepted.
2. The center frequency can be directly input according to the “Numeric Key Mapping Diagram”.
F5
3. The value is entered by pressing a unit key, [MHz (RS232C)] or [GHz (DSPL)].
* Any figures below the resolution (100 kHz) will be discarded.
19–
Page 27

–
4. Changing the setting:
z
F5
F6
: Deletes the entire value and allows you to input one from the beginning.
: Deletes the last input figure.
5. Canceling the numeric key mode:
FREQ
: Enables setting with step keys ([F1], [F2]) or the encoder again.
“Numeric Key Mapping Diagram”
RBW
VBW
1 2 3
SWEEP SCALE
RS232C
DSPL PRINT
AUTO
TUNE
HOLD
RUN
87 6
MEAS
CALC
45
MKR
SAVE
LOAD
0 9
.
MHz GH
7.4 According to the Marker position
1. When is pressed, the center frequency is set according to the frequency of current marker
position.
* Any figures below the resolution (100 kHz) will be discarded.
* This does not operate when the marker is not displayed. (and the function display disappears.)
F6
8. Frequency Span <SPAN>
Press Use to set the frequency span.
2650/2652: When is turned, the frequency span changes in the specified step.
SP AN
*The frequency span can be set only with the encoder. Function keys are not available.
ZERO 200k 500k 1M 2M 5M 10M
20M 50M 100M 500M 1G 2G FULL (3.3G)
[Hz]
20–
Page 28

–
2658: When is turned, the frequency span changes in the specified step.
ZERO 200k 500k 1M 2M 5M 10M
20M 50M 100M 500M 1G 2G 5G FULL (8.5G)
■ Switching frequency band
2658 consists of the following three bands.
Frequency band Measured frequency range
Base band 50kHz to 3.5GHz
Band 1 - 3.3GHz to 6.3GHz
Band 1 + 6. 2GHz to 8.5GHz
The frequency band is selected to be the least band number, based on Center frequency and Span.
(At the span less than 200MHz, only one band is used.)
When the setting frequency range belongs to two bands, the lower band has priority.
Note: Switch frequency band allows only to automatic setting.
The frequency connection point of two bands is fixed as below table.
[Hz]
Two bands Frequency connection point
Base band and band 1 - 3.4GHz
Band 1 – and band 1 + 6.2GHz
Note: The trace may fall into disorder just a little at the frequency connection point. For the precise
measurement is needed, Center frequency or Span should be set so that the measured
frequency range is in one band.
9. Reference Level <REF ER>
Press to switch over to the function screen shown below:
REFER
dBm dBµV dBmV dBV 0.0 50Ω
UNIT OFSdB IMP
F1 F2 F3
21–
F4
F5
F6
Page 29

–
9.1 Setting the Reference leve l
1. When is turned, the reference level changes.
(Refer to “9.3 Reference level setting range for each unit” for details.)
9.2 Switching units of amplitude axis
strength measurement” and “19.5 Magnetic field strength measurement” for details.)
1. Press to switching units to dBm.
Press to switching units to dBµV
Press to switching units to dBmV
Press to switching units to dBV
F1
F2
F3
F4
(dBµV/m and dBµA/m are optional. Refer to “19.4 Electric field
9.3 Reference level setting range for each unit
UNIT dBm dBµV dBmV dBV
MAXIMUM 10 117 57 -3
MINIMUM -40 67 7 -53
MINIMUM
(shifted trace data)
“Unit that is able to use it with the measuring function”
-60 47 -13 -33
* When the reference level is set between the “MINIMUM” and “MINIMUM (shifted trace data)”,
the trace in “MINIMUM” is shifted and displayed on a screen. When the reference level is set below to
the “MINIMUM”, the ATT display area is displayed as “S/W AMP”.
Calculation expression (conversion formula to and from dBm)
· A [dBµV] = 107+X [dBm] · B [dBmV] = 47+X [dBm] · C [dBV] = -13+X [dBm]
· D [dBµV/m] = 68.8/λ×√(X/Gar) [dBm] λ: Wavelength[m] Gar: Antenna absolute gain [times]
· E [dBµA/m] = 107+X+F [dBm] F: probe calibration coefficient * changes by frequency
UNIT dBµV/m (Electric filed strength measurement)
Setting AN301 AN302 AN303 AN304 AN305 AN306 PR 26M
MAXIMUM 143 146 148 150 137 159 160 to 203
MINIMUM 93 96 98 100 87 109 110 to 153
MINIMUM
(shifted trace data)
73 76 78 80 67 89 90 to 133
dBµA/m
(Magnetic field
strength measurement)
22–
Page 30

–
9.4 Relation between the reference level and ATT · AMP (in dBm indication)
The programmable attenuator (ATT) and the input amplifier (AMP) inside 2650/2652/2658 are automatically
set according to the setting value of the reference level (REFER). (ATT cannot be set independently.)
REFER
(dBm)
ATT
(dB)
AMP
(dB)
REFER
(dBm)
ATT
(dB)
AMP
(dB)
REFER
(dBm)
ATT
(dB)
AMP
(dB)
REFER
(dBm)
ATT
(dB)
AMP
(dB)
10 25 0 -3 12 0 -16 20 21 -29 7 21
9 24 0 -4 11 0 -17 19 21 -30 6 21
8 23 0 -5 10 0 -18 18 21 -31 5 21
7 22 0 -6 9 0 -19 17 21 -32 4 21
6 21 0 -7 8 0 -20 16 21 -33 3 21
5 20 0 -8 7 0 -21 15 21 -34 2 21
4 19 0 -9 6 0 -22 14 21 -35 1 21
3 18 0 -10 5 0 -23 13 21 -36 5 26
2 17 0 -11 4 0 -24 12 21 -37 4 26
1 16 0 -12 3 0 -25 11 21 -38 3 26
0 15 0 -13 2 0 -26 10 21 -39 2 26
-1 14 0 -14 1 0 -27 9 21 -40 1 26
-2 13 0 -15 0 0 -28 8 21
* When the input signal level is higher than the suitable level for 1st mixer’s terminal, it generates
harmonics distortion and spurious. 2650/2652/2658 is designed so that the input signal level of 1st mixer
is determined to proper level by the reference level.
9.5 Setting the offset level
1. to set the offset of reference level.
F5
When amplifier and attenuator are used externally, display level can be matched by offset.
The setting range is from -50.0 to 50.0dB (0.1dB step).
Offset is calculated to the reference level, and it is displayed.
* When offset is set, it is displayed on LEVEL display area as “OFS”.
Furthermore, the value of a marker point is displayed reflecting the calculated offset.
* Offset of dBµV, dBmV, dBV, W, etc. are changed automatically.
23–
Page 31

–
9.6 Setting the input impedance compensation
1. F6 to select the input impedance compensation.
50Ω 75Ω
When a coaxial adaptor (50Ω/75Ω impedance converter) is attached, and choose “75Ω”, then
offset is calculated to the reference level, and it changes for the measured value as 75Ω system, and
display it.
* When “75Ω” is selected, “75Ω” is displayed in the LEVEL area on the screen. When “75Ω” is
selected, the offset is set to 5.7dB (insertion loss of adapter).
Moreover, can set offset.
Moreover, while setting the unit of the marker point to [W, V, V/m] etc, it changes from dBm
correctly.
* When you set it as “75Ω”, please be sure to attach the coaxial adapter (50Ω/75Ω
impedance converter).
10. Display Scale <SCALE>
Press to switch over to the function screen shown below:
10.1 Setting with the keys ([F1], [F2])
10.2 Setting with the encoder
SCALE
1. Press to set the 10dB/div display scale.
2. Press to set the 2dB/div display scale.
SCALE
10dB 2dB
F1 F4 F2 F3 F5 F6
F1
F2
1. Turn to switch between the 10dB/div and 2dB/div display scale.
10dB 2dB
* In 2dB/div, display level may not become smaller than fixed level, by frequency
compensation.
24–
Page 32

–
11. Resolution Bandwidth <RBW>
VBW
Press to switch over to the function screen shown below:
RBW
MANU AUTO ALL
F1 F2 F3
RBW
F4
* Any selected parts of MANU, AUTO and ALL become inverted display.
1 1.1 MANUAL mode
1. Press or turn the to enter MANUAL mode. Use to set the RBW.
2650/2652/2658: 3kHz 10kHz 30kHz 100kHz 300kHz 1MHz 3MHz
F1
11.2 AUTO mode
1. When is pressed, optimum RBW is set according to the settings of SPAN and SWEEP.
F2
F5
F6
* Since “*” is displayed on the right end of RBW setting value display portion of a screen
when set as AUTO mode, it can check being set as AUTO mode.
1 1.3 ALL AUTO mode
1. When is pressed
* Since “*” will be displayed on the right end of each setting value display portion of RBW, VBW,
and SWEEP if ALL AUTO mode is set up, it can check being set as ALL AUTO mode.
* When RBW is set as 3kHz or 10kHz, selectivity (60dBc) becomes larger than an actual value, by
influence of SSB phase noise.
F3
, optimum RBW, VBW and SWEEP are set according to the setting of SPAN.
12. Video Bandwidth <VBW>
Press to switch over to the function screen shown below:
MANU AUTO ALL
F1 F2 F3
VBW
F4
F5
F6
* Any selected parts of MANU, AUTO and ALL become inverted display.
25–
Page 33

–
12.1 MANUAL mode
1. Press or turn the to enter MANUAL mode. Use to set the VBW.
F1
100Hz 300Hz 1kHz 3kHz 10kHz 30kHz
100kHz 300kHz 1MHz
12.2 AUTO mode
1. When is pressed, VBW is set according to the settings of SPAN and SWEEP.
* Since “*” is displayed on the right end of VBW setting value display portion of a screen
when set as AUTO mode, it can check being set as AUTO mode.
F2
12.3 ALL AUTO mode
1. When is pressed, RBW, VBW and SWEEP are set according to the setting of SPAN.
* Since “*” will be displayed on the right end of each setting value display portion of RBW, VBW,
and SWEEP if ALL AUTO mode is set up, it can check being set as ALL AUTO mode.
F3
13. Sweep Axis · Detection Mode <SWEEP>
Press to switch over to the function screen shown below:
SWEEP
MANU AUTO ALL PosPK
F1 F2 F3
SWEEP DET
* Any selected parts of MANU, AUTO and ALL become inverted display.
When [F4] is pressed, the part of DET become inverted display.
F4
13.1 MANUAL mode
1. Press f1 or turn the to enter MANUAL mode. Use to set the SWEEP.
10ms 30ms 0.1s 0.3s 1s 3s 10s 30s
* 2650/2652: Can't set 10ms at the FULLSPAN.
* 2658: 30ms to 30s and AUTO @Span 0 to 5GHz 0.1 to 30s and AUTO @Full span
F1
13.2 AUTO mode
F5
F6
1. When is pressed, SWEEP is set according to the settings of SPAN and RBW.
F2
* Since “*” is displayed on the right end of SWEEP setting value display portion of a screen
when set as AUTO mode, it can check being set as AUTO mode.
26–
Page 34

–
13.3 ALL AUTO mode
1. When is pressed, RBW, VBW and SWEEP are set according to the setting of SPAN.
* Since “*” will be displayed on the right end of each setting value display portion of RBW, VBW,
and SWEEP if ALL AUTO mode is set up, it can check being set as ALL AUTO mode.
F3
13.4 Setting the Detection mode
1. Pressing allows you to change the method to capture the trace.
PosPK SMPL NegPK
· PosPK (Positive Peak)
· SMPL (Sample)
· NegPK (Negative Peak)
F4
: Traces the maximum value of the sample points.
: Traces the momentary value of the sample points.
: Traces the minimum value of the sample points.
14. AUTO Tuning <AUTO TUNE>
When is pressed, center frequency is set at the spectrum of the maximum level in
the 3.3GHz(2650/2652)/8.5GHz(2658) band, and in addition, optimum reference level, RBW, VBW and
AUTO TUNE
SWEEP are set according to the setting of SPAN.
* The AUTO tuning does not operate normally, at the time of the following 4 conditions.
1) ZERO SPAN
2) FULL SPAN
3) Signal level is -40dBm or lower
4) Signal frequency is 50MHz or lower
15. Hold/Run <HOLD/RUN>
Press to switch to between sweep halt and continuous sweep.
* This operates only with the key press, with no function indication.
HOLD/RUN
16. Calculation Function <CALC>
Press to switch over to the function screen shown below:
CALC
NORM MAXHD MINHD AVER OVRWR
F1 F2 F3
** **
256
F4
F5
F6
27–
Page 35

–
* After sweeps stops, press to restart sweep.
HOLD/RUN
* Press [F1] to [F5] to set the CALC mode.
* Use to set the number of sweeps.
16.1 NORM mode
1. Press . Calculation is not performed in this mode. The number of sweeps is always
unlimited.
* Usually, please choose this mode.
* “NORMAL” is displayed in the CALC area on the LCD screen.
F1
16.2 MAX HOLD mode
1. Press Use to set the number of sweeps.
2. Sweeps are performed the set number of times, the maximum value of each point of trace data is
displayed as a trace, and then sweep is halted.
2 4 8 16 32 64 128
* “MAX --- (number of sweeps)” is displayed in the CALC area on the LCD screen.
F2
256 512 1024 (unlimited)
(Refer to “4. Description of Display” for details)
**
(Refer to “4. Description of Display” for details)
16.3 MIN HOLD mode
1. Press Use to set the number of sweeps.
2. Sweeps are performed the set number of times, the minimum value of each point of trace data is
displayed as a trace, and then sweep is halted.
2 4 8 16 32 64 128
* “MIN --- (number of sweeps)” is displayed in the CALC area on the LCD screen.
F3
256 512 1024 (unlimited)
16.4 AVERAGE mode
1. Press Use to set the number of sweeps.
2. Sweeps are performed the set number of times, average value of each point of trace data is
displayed as a trace, and then sweep is halted.
2 4 8 16 32 64 128 256
* “AVG --- (number of sweeps)” is displayed in the CALC area on the LCD screen.
F4
**
(Refer to “4. Description of Display” for details)
(Refer to “4. Description of Display” for details)
28–
Page 36

–
16.5 OVER WRITE mode
1. Press to enter into the OVER WRITE mode, where traces are written one over another.
F5
The number of sweeps is unlimited.
* “OVER WR” is displayed in the CALC area on the LCD screen.
* Only the last one trace is saved.
16.6 SPURIOUS FREE mode (2658 only)
1. By pushing it will become the SPURIOUS FREE mode which simply deletes
spurious characteristic at band 1+.
* "SPR." is displayed beside CALC in liquid crystal screen CALC area.
* The SPURIOUS characteristic at band 1+ is a spurious calculated by the following formula
for a input signal over 6.76GHz, in case of measurement at band 1+.
F6
(Refer to “4. Description of Display” for details)
(Refer to “4. Description of Display” for details)
(Refer to “8. Frequency Span” for details)
Spurious characteristic at band 1+ [GHz] = (Input signal [GHz] +5.64GHz) /2
* SPURIOUS FREE mode
1. SPURIOUS FREE mode is the mode which simply deletes SPURIOUS characteristic
at band 1+.
2. SPURIOUS FREE mode has a special effect in measurement of a regular wave.
3. If SPURIOUS FREE mode is used in measurement of a signal with level change or frequency
change, the phenomenon will happen that an amplitude level falls.
* How to discriminate SPURIOUS characteristic at band 1+ in manual operation
The procedure for discriminating SPURIOUS characteristic at band 1+ is as follows.
1. Set to SPAN = 10MHz.
2. Set the frequency of SPECTRUM to be discriminated to the center frequency
of 2658.
3. Verify that SPECTRUM to be discriminated is at the center of a screen, and change
the main frequency by +1MHz.
4. Judge by measured trace data.
The same frequency as the frequency set up first. Measurement data.
29–
Page 37

–
2MHz over Main frequency changed by +1MHz Spurious characteristic at band 1+
Example: Discriminate SPECTRUM displayed on 7GHz.
1. Set 2658 to SPAN = 10MHz and main frequency = 7 GHz.
2. Verify that SPECTRUM is at 7 GHz.
3. Set 2658 to Main frequency = 7.001 GHz.
4. Measure spectrum and distinguish as follows.
Spectrum is at 7GHz. Measurement data.
Spectrum is at 7.003 GHz. SPURIOUS characteristic at band 1+.
17. Marker · Peak Search <MKR>
Press to switch over to the function screen shown below:
MKR
· The display when a NORM marker is selected.
The marker is manually moved at NORM mode. Peak search function, NEXT peak search function is
available.
MARKER PEAK SEARCH CONV
NORM DELTA NORM PEAK NEXT dBm
→W
F1 F2 F3
F4
F5
F6
· The display when a ZONE marker is selected.
The marker moves to the biggest peak position automatically at ZONE mode, inside specified zone.
MARKER PEAK SEARCH CONV
NORM DELTA ZONE CNTR WIDTH dBm
→W
F1 F2 F3
F4
F5
F6
17.1 Moving the marker
Use to move the marker.
Use to put DELTA REF at the current marker position.
F1
F2
30–
Page 38

–
17.2 Setting the peak search <PEAK SEARCH>
· NORM mode (Use to select NORM.)
Use to move the marker to the maximum peak position.
Use to move the marker successively from higher to lower peak positions other than the
maximum peak. (The marker moves to 10 peaks.)
* When you move the marker to the 10th peak or moving the marker, the NEXT peak search
· ZONE mode (Use to select ZONE.)
Use to move the center position.
Use to change the width.
F4
F5
function stops and the function display disappears.
F4
F5
F3
F3
17.3 Changing the unit of marker point
Press to change the unit of marker point.
When unit of reference level is dBm, the unit is changed from [dBm] to [W].
When unit of reference level is dBµV, the unit is changed from [dBµV, dBmV, dBV] to [V].
F6
When unit of reference level is dBµV/m, the unit is changed from [dBµV/m] to [V/m].
When unit of reference level is dBµA/m, the unit is changed from [dBµA/m] to [A/m].
Moreover, according to each unit, it is displayed as follows.
[W] [W, mW, µW, nW, pW, fW]
[V] [V, mV, µV, nV]
[V/m] [V/m, mV/m, µV/m, nV/m]
[A/m] [A/m, mA/m, µA/m, nA/m]
31–
Page 39

–
18. Save/Load <SAVE/LOAD>
18.1 Save/Load (2650/2652)
Press to switch over to the function screen shown below:
SA VE/LOAD
TRACE PARAM EXECUTE PRE
00 00 SAVE LOAD DEL SET
F1 F2 F3
F4
18.1.1 Setting the location to store the trace
1. Pressing allows you to set the number of location to store the trace.
2. Use to set the number of location.
00 01 02 03 04 ··· 98 99
* The part of TRACE become inverted display after it is selected.
F1
18.1.2 Setting the location to store the parameter
F5
F6
1. Pressing allows you to set the number of location to store the parameter.
F2
2. Use to set the number of location.
00 01 02 03 04 ··· 98 99
* The part of PARAM become inverted display after it is selected.
18.1.3 Saving the data
1. Press to save the data at the set number.
* This saves the trace when TRACE is selected, or the setting parameters when PARAM is selected.
* “*” is displayed on the right end of the number of location place at which data is saved.
* It can be overwritten, too
F3
18.1.4 Loading the data
1. Press to read out the data at the set number.
* This reads out the trace when TRACE is selected. The setting parameter of the loaded trace is
displayed in the loaded trace information display area.
F4
(Refer to “4. Description of Display” for details)
* This reads out the setting parameters when PARAM is selected.
32–
Page 40

–
* When you load a trace, the current trace disappears, the HOLD state is set, and the loaded trace
is displayed. For the loaded trace, you can use the marker, but cannot use a measuring function.
When you press the HOLD/RUN key, the loaded and the current traces are displayed
overlapping each other.
* “*” is displayed on the right end of the number of location place at which data is saved.
* When you search the trace or setting parameters to be read out, repeat
F4 F4
18.1.5 Clearing the loaded trace
1. Press to clear the loaded trace that has been displayed.
F5
18.1.6 Presetting (Initialization)
1. Press to preset the setting parameters as the Initialization shown below:
F6
“Initialization”
Items Parameter
Center frequency 1GHz
Frequency span 20MHz
Reference level 10dBm
Offset 0.0dB
Impedance 50Ω
Sweep time 0.3s
Detection mode Positive peak mode
RBW 100kHz
VBW 10kHz
···, and load the trace or setting parameters in turn.
Display scale 10dB/div
33–
Page 41

–
18.2 Save/Load (2658)
Press to switch over to the function screen shown below:
SA VE/LOAD
SAVE LOAD CLEAR CLEAR SET
F1 F2 F3
MODE SELECT DISP PRE
F4
18.2.1 Saving the data
1. Press to move to a save menu.
2. Operating
3. Use to set the number of location.
00 01 02 03 04 ··· 98 99
4. Press to save the data.
F1
or chooses objects (trace or parameter).
F1 F2
F3
F5
F6
* This saves the trace when TRACE is selected, or the setting parameters when PARAM is selected.
* “*” is displayed on the right end of the number of location place at which data is saved.
* It can be overwritten, too
18.2.2 Loading the data
1. Press to move to a load menu.
2. Operating
3. Use to set the number of location.
00 01 02 03 04 ··· 98 99
4. Press to load the data.
* This reads out the trace when TRACE is selected. The setting parameter of the loaded trace is
displayed in the loaded trace information display area.
* This reads out the setting parameters when PARAM is selected.
F2
or chooses objects (trace or parameter).
F1 F2
F3
(Refer to “4. Description of Display” for details)
* When you load a trace, the current trace disappears, the HOLD state is set, and the loaded trace
is displayed. For the loaded trace, you can use the marker, but cannot use a measuring function.
34–
Page 42

–
When you press the HOLD/RUN key, the loaded and the current traces are displayed
overlapping each other.
* “*” is displayed on the right end of the number of location place at which data is saved.
18.2.3 Clearing the data
1. Press to move to a clear menu.
2. Operating
F3
or chooses objects (trace or parameter).
F1 F2
3. Use to set the number of clear.
00 01 02 03 04 ··· 98 99
4. Press to clear the data.
F3
18.2.4 Clearing the loaded trace
1. Press to clear the loaded trace that has been displayed.
F5
18.2.5 Presetting (Initialization)
1. Press to preset the setting parameters as the Initialization shown below:
F6
“Initialization”
Items Parameter
Center frequency 1GHz
Frequency span 20MHz
Reference level 10dBm
Offset 0.0dB
Impedance 50Ω
Sweep time 0.3s
Detection mode Positive peak mode
RBW 100kHz
VBW 10Hz
Display scale 10dB/div
35–
Page 43

–
19. Measuring Function<MEAS>
R
Press to switch over to the function screen shown below:
MEAS
Ch Adj Occ E/F M/F
Power Ch Pw BW ANT PROBE COUNT
F1 F2 F3
F4
Select the measuring function:
F1
F2
F3
F4
F5
Ch Power · · · · · · · · · · · · · ·
Adj Ch Pw · · · · · · · · · · · · ·
Occ BW · · · · · · · · · · · · · · · ·
E/F ANT · · · · · · · · · · · · · · ·
M/F PROBE · · · · · · · · · · ·
Channel power measurement
Adjacent channel leakage power measurement
Occupied frequency bandwidth measurement
Electric field strength measurement
Magnetic field strength measurement (optional)
F5
Freq
F6
F6
Freq COUNT · · · · · · · · · ·
* Once you select the measuring function, pressing next time will directly bring up the
Frequency counter (factory option)
MEAS
function screen for the function you selected the last time. If you want to stop the measuring function,
or if you want to select another measuring function, press [F6] (MEAS OFF). This stops the measuring
function and switches to the above screen, which allows you to select the measuring function.
* The measuring function is stops, when push while these 4 functions (Channel power,
MK
Adjacent channel leakage power, Occupied frequency bandwidth, Frequency counter) are selected.
Because each 4 functions and marker operation cannot be used simultaneously. Similarly, the function
of the marker stops, when the functions of these 4 measurements are selected while using the marker.
* The unit displays data in 251 horizontal dots, but it internally captures the trace and calculates the
measured value (Channel power measurement, Adjacent channel leakage power measurement and
Occupied frequency bandwidth measurement) in 1004 dots.
36–
Page 44

–
19.1 Channel power measur ement <Ch Power>
F1
Measures the sum of the power in the zone specified. Two modes, TOTAL and BAND, are available.
· TOTAL mode [Use (MODE) to select TOTAL.]
F1
Measure the sum of the power in the zone specified by the center frequency and frequency span (whole
range of the screen).
* It is shown on MEAS area of LCD as “CP TOTAL”
* The measured value is displayed at the right lower corner
on the screen.
[Channel power
measurement mode]
[Measured value]
· BAND mode [Use (MODE) to select BAND.]
F1
Measure the sum of the power in the zone specified by the zone center frequency and zone width.
* It is shown on MEAS area of LCD as “CP BAND”.
* The measured value and setting parameter are
displayed at the right lower corner on the screen.
1. Use (CNTR) to set the
F2
zone center frequency.
[Channel power
Measurement mode]
[Measured value]
2. Use (WIDTH) to set the
zone width.
F3
[Parameter]
37–
Page 45

–
19.2 Adjacent channel leakage power measur ement <Adj Ch Pw>
F2
Measures the adjacent channel leakage power as the ratio of the power in the range specified by the offset
frequency against the reference frequency (reference carrier frequency) and the bandwidth, to the carrier
wave power. Two channels of adjacent waves on the upper and lower sides of the same offset frequency are
measured. In addition, you can select from three modes, TOTAL (total power method), REF BAND (in-band
method) and PEAK (reference level method), according to the classification of definitions of carrier wave.
· Mode selection and measurement
PEAK.]
* It is each shown on MEAS area of LCD as “ACP TOT”, “ACP BAND” or “ACP PK”.
* The measured value and setting parameter are displayed at the right lower corner on the screen.
[Adjacent channel
Leakage power
Measurement mode]
[Parameter]
[Measured value]
[Use (MODE) to select a mode: TOTAL, BAND or
F1
1. Use (Adj Ch OFS) to set the
F2
offset frequency of adjacent channel.
* The offset is from the center of the reference carrier wave.
2. Use (Adj Ch WIDTH) to set the
F3
band width of adjacent channel.
3. Use (REFERENCE CNTR) to set
F4
the center frequency of reference carrier.
* [F4] is only for the TOTAL and BAND mode.
4. Use (REFERENCE WIDTH) to set
F5
the band width of reference carrier.
* [F5] is only for the BAND mode.
· Definition of the reference carrier for each mode
TOT AL (total power method)
This is based on the sum total of the
power of whole range on the screen.
Use [F4] to set center frequency of
the reference carrier wave.
BAND (in-band method)
This is based on the sum total of the
power within the set bandwidth. Use
[F4] to set center frequency of the
reference carrier wave.
38–
PEAK (reference level method)
This is based on the power of the peak on the screen. Center frequency of
the reference carrier wave is set up to
the peak inside the screen automatically.
Page 46

–
19.3 Occupied frequency bandwidth measurement <Occ BW>
F3
Measures the bandwidth at the point of N [%] of total power (N% POWER) or the bandwidth at the point X
[dB] down from the peak level (XdB DOWN). Two modes are available.
· N% POWER mode [Use (MODE) to select N%.]
F1
Measures the bandwidth at the point of N [%] of total power displayed on the screen.
* It is shown on MEAS area of LCD as “OBW N%”
* The measured value is displayed at the right lower
corner on the screen.
1. Use (RATIO) to set
F2
the percentage to total power.
* Setting range: 80.0 to 99.9%
[Occupied frequency
bandwidth
measurement mode]
[Parameter]
[Measured value]
· XdB DOWN mode [Use (MODE) to select XdB.]
F1
Measures the bandwidth at the point X [dB] down from the peak level,
* It is shown on MEAS area of LCD as “OBW XdB”
* The measured value is displayed at the right lower
corner on the screen.
1. Use (dB) to set
F2
the down level from peak level.
[Occupied frequency
bandwidth
measurement mode]
[Parameter]
[Measured value]
* Setting range: 0.1 to 80.0dB
39–
Page 47

–
19.4 Electric field strength measur ement <E/F ANT>
F4
Measures electric field strength by connecting an optional antenna.
Allows using an antenna other than options by creating and inputting the original compensation table.
(Refer to “23.5 Writing of original compensation data” for how to create and write)
[Antenna connection]
[Measurement environment]
Antenna
AN301
AN302
AN303
AN304
AN305
AN306
2650/2652/2658
* Please receive by the rear side of
“Specifications of the antenna (antenna gain and VSWR are specified at a center of frequency range).”
Items AN301 AN302 AN303 AN304 AN305 AN306
Type Sleeve Sleeve Sleeve Sleeve 1/4 λ whip Sleeve
Frequency range 0.8 to 1.0GHz 1.25 to 1.65GHz 1.70 to 2.20GHz 2.25 to 2.65GHz 300 to 500MHz 4.7 to 6.2GHz
Antenna gain +1dBi or higher +1dBi or higher +1dBi or higher +1dBi or higher +1dBi or higher +1dBi or higher
VSWR 1.5 or lower 1.5 or lower 1.5 or lower 1.5 or lower 1.5 or lower 1.5 or lower
Dimensions 7.5φ×250mm 7.5φ×250mm 7.5φ×180mm 7.5φ×180mm 8.0φ×195mm 7.5φ×100mm
Weight approx.20g approx.20g approx. 20g approx.20g approx.30g approx.10g
Reference level
setting range
(except for the
minimum value
in screen shift)
93 to
143dBµV/m
96 to
146dBµV/m
98 to
148dBµV/m
100 to
150dBµV/m
87 to
137
dBµV/m
109 to
159dBµV/m
* Measured value varies depending on how to have 2650/2652/2658 main unit. Moreover, if the
person who has is different, measured value will vary. Because AN305 is 1/4 λ whip antenna.
Therefore, in the measurement used an antenna AN305, measurement errors occurs. The error
value is several dB or 10dB or more. In order to lessen the error value, use it, separating from
the body as much as possible so that there is no influence of human body.
40–
Page 48

–
· Mode selection and measurement
Use (ANT) to select an antenna, AN301, AN302, AN303, AN304, AN305, AN306 or USER.
F1
As soon as the antenna is entered, the measurement is taken.
* It is each shown on MEAS area of LCD as “E/F AN301”, “E/F AN302”, “E/F AN303”, “E/F AN304”,
“E/F AN305”, “E/F AN306” or “E/F USER”.
* “USER” is an original compensation table the user crates.
(Refer to “25.3 Command description” for details.)
* Trace may exceed from a screen by antenna gain compensation.
Unit of amplitude axis changes to [dBµV/m]
* Optimum center frequency and frequency span are
set according to the antenna.
In addition, a trace is not displayed for
frequencies outside those supported by the
antenna.
[Electric field strength [Measured value]
measurement mode]
· Antenna directivity (reference data)
X
Y
* All the data are those when the antenna is connected to the RF input with no obstacles around.
* However, data of AN305 is reference data of the conditions in which people have 2650/2652/2658
Example) case of AN301
Center frequency: 900MHz
Frequency span: 200MHz
E plane: X-Y axis (X direction=0°)
0°
90° 270°
180°
attached AN305.
So, the directivity changes in practice, because, for example, the unit is carried by people.
41–
Page 49

–
AN301 (900MHz, E plane) Antenna gain vs Frequency
4
3
2
1
0
-1
ANT Gain (d B i)
-2
-3
-4
0.80.85 0.90.95 1
Frequency (GHz)
AN302 (1.5GHz, E plane) Antenna gain vs Frequency
4.5
3.5
2.5
1.5
ANT Gain (dB i)
0.5
-0.5
-1.5
1.25 1.35 1.45 1.55 1.65
Frequency (GHz)
42–
Page 50

–
AN303 (2.0GHz, E plane) Antenna gain vs Frequency
5.5
5
4.5
4
3.5
3
2.5
ANT Gain (d B i)
2
1.5
1
0.5
1.71.81.922.12.2
Frequency (GHz)
AN304 (2.4GHz, E plane) Antenna gain vs Frequency
5.5
5
4.5
4
3.5
3
2.5
ANT Gain (dBi)
2
1.5
1
2.25 2.35 2.45 2.55 2.65
Frequency (GHz)
43–
Page 51

–
AN305 (horizontal plane) Antenna gain vs Frequency
1.6
1.4
1.2
1
0.8
0.6
0.4
ANT Gain (dBi)
0.2
0
-0.2
300 325 350 375 400 425 450 475 500
Frequency (MHz)
270º
300º
240º
330º
210º
5.0
4.0
3.0
2.0
1.0
0.0
0º
180º
30º
150º
60º
90º
120º
300MHz
400MHz
500MHz
AN306 (5.4GHz, E plane) Antenna gain vs Frequency
3.5
3
2.5
2
ANT Gain (dBi)
1.5
1
5.70 5.95
4.70
4.95
5.20
5.45
Frequency(GHz)
6.20
44–
Page 52

–
19.5 Magnetic field strength measur ement <M/F PROBE> (optional)
Measures the magnetic field strength using the optional magnetic field probe PR 26M.
Magnetic field probe
PR 26M
“Specifications of magnetic field probe PR 26M”
F5
Items Specifications
Frequency range 10MHz to 3GHz
Space resolution (-6dB)
Dimensions
Connector SMA (P)
Reference level setting
range (maximum)
Reference level setting
range
(except for the
minimum value in
screen shift)
Measurement error
approx.0.25 mm
(Depending on objects)
Outside: 12φ×135mm
probe tip: 2mm(W)×1mm(T)
160 to 203dBµA/m
110 to 153dBµA/m
approx.±1dB
(Probe simple substance)
(Refer to the operating manual for PR 26M for details.)
· Registration of the probe ID
The tip of the optional magnetic field probe
PR 26M is made of glass-ceramic board.
Take care when handling the probe even
though the strength of the glass-ceramic
board is sufficiently ensured under normal
operation.
Magnetic field strength measurement cannot be used without entering the “Probe ID” attached to the optional
magnetic field probe, PR 26M. Once you have entered it, you don't need to enter it again.
When you press and in that order, “Input PROBE ID” will appear in the measured
MEAS F5
value display area on the screen. Then, input the 14-digit “Probe ID” with the numeric keypads.
45–
Page 53

–
Press (ENTER) to confirm it. Press (CLEAR) to delete the entire value and allow
F4
F5
you to input one from the beginning. Press (BACK SPACE) to delete the last input figure.
Press to cancel the probe ID input display.
F3
F6
· Mode selection and measurement
Use (PROBE) to select a probe, PR 26M or USER. As soon as the probe is entered, the
measurement is taken.
* It is each shown on MEAS area of LCD as “M/F PR 26M” or “M/F USER”.
* “USER” is an original calibration table the user creates.
F1
(Refer to “24.3 Command description” for details.)
Unit of amplitude axis are changing to [dBµA/m]
* A trace is not displayed for frequencies
[Measuring mode]
[Measured value]
outside those supported by the probe.
46–
Page 54

–
19.6 Frequency counter <Fr eq COUNT> (factory option)
F6
Measure the frequency that is displayed on the spectrum of center on screen, at high accuracy. Set frequency
roughly, as center frequency. And adjust the center frequency and the reference level so that the level of the
center on screen becomes as high as possible.
“Specifications”
Items Specifications
Measurement
frequency range
Measured level
1MHz to 3.3GHz(2650)/1MHz to 8.5GHz(2658)
+10 to -70dBm (CF: 1MHz to 2GHz, RBW:100kHz)
+10 to -60dBm (CF: 2GHz to 3.3GHz, RBW: 100kHz)
Measured
resolution
Display digits 8 digits max
Reference X’tal
Temp. characteristics: ±5ppm (0 to 40˚C)
Accuracy: ±2ppm (23˚C),
* Setting range of sweep time is 0.1s or more.
* It does not correspond to FULL SPAN.
· Measurement
1. Press to enter frequency counter mode.
100Hz
F6
[Measuring mode] [Measured value]
* It is shown on MEAS area of LCD as “F COUNT”.
Since the frequency of spectrum of a screen center is
measured, please set up spectrum of frequency to measure
roughly to become the center of a screen. The measured value
is displayed on the lower right of a screen.
* When the level of spectrum is small and cannot
measure, it is displayed as “Non signal”.
* If frequency counter (factory option) is not mounting,
it is always displayed as “Invalid for F/C”.
47–
Page 55

–
20. Screen Control <DSPL>
Press to switch over to the function screen shown below:
DSPL
CTRS B.L. BLCTR INVT BUZZR
140 ON 200 OFF ON
F1 F2 F3
F4
20.1 Adjusting the contrast
Use to adjust the contrast.
F1
20.2 Switching ON and OFF the LCD backlight
F5
F6
Each time is pressed, the LCD backlight is alternately switched to ON or OFF .
F2
20.3 Adjusting the brightness of the LCD backlight
Use to set the brightness.
F3
20.4 Inverting the display
Press to invert the screen display. Press again to return it to the previous state.
F4
20.5 Enabling or disabling the beep
Pressing allows you to disable the beep that sounds when you operate a key or the encoder.
Press again to return it to the previous state.
* If the voltage of a battery becomes low at the time of battery operation, it will be displayed on
a screen as “Low Batt”, and a buzzer will sound (it sounds, even if it is set up so that a buzzer may
F5
F5
F4
not sound), and a power supply will be shut off within several minutes.
52–
Page 56

21. Tracking Generator Mode(2652 only)
21.1 Specification for T.G. function
Item Limit
Frequency range 5MHz to 3.3GHz
Output Level
Output flatness
Output impedance
Output VSWR Less than 2.0
Output connector SMA (J)
21.2 Description of I/O connector
1 2
-10dBm±1dB @1GHz(Fixed value)
±1.5dB
50Ω
1) Input connector
SMA (J) connector .
Input for an external signal.
Make sure that the total power of all signals at the analyzer input dose not exceeds +23dBm.
2) Output connector
SMA (J) connect or.
It is an output term inal of Tracking Generator .
-53-
Page 57

21.3 Switching ON and OFF the T.G. function
SWEEP
Press to set the T.G.. Mode screen.
1.
to switch over to the function screen shown below :
SWEEP DET
MANU AUTO ALL PosPK
F1 F2 F3
F6
T.G. NORM
ON ON
F1 F2 F3
F4
F4
F5
F5
T.G.
MODE
F6
F6
2.
Each time is pressed, the T.G .. out put is alternately switched to ON or OFF.
If the T .G. output is switched to ON, it will be displayed on a screen as “TG: ON”.
F1
If the T.G. output is switched to OFF, it will be displayed on a screen as “TG: OFF”.
21.4 Normalizing of waveform
NORM ON :To become smooth at a dotted line position on the screen, the waveform of the input signal is normalized.
1. t to switch over to the function screen shown similar to the preceding clause.
2.
3. Each time
If the normalizing of waveform is switched to ON, it will be displayed on a screen as “NORM: ON”.
※ If the following setting changes are done, the normalizing of waveform is automatically turned off.
・The span is expanded. ・The central frequency is changed over the range of the screen.
※ It cannot be normalized that the shape of waves is not displayed at a proper position on the screen
SWEEP
Press to set the T.G.. Mode screen.
(
When SPAN is changed from FULL SPAN according to the setting of a center frequency, the setting is released.)
The magnetic field strength measurement(optional) or the frequency counter(factory optional) is selected.
・
・The AUTO tuning is executed. ・The presetting is executed. ・The power supply is turned off.
when the setting of the scale is 2dB.
F6
F2
is pressed, the normalizing of waveform is alternately switched to ON or OFF.
-54-
Page 58

–
22. Printing <PRINT> (optional)
When using the optional printer, connect the RS-232C cable as shown in the figure below.
(Female)
22.1 Hard copy of the screen
When you press the with the printer (optional) connected to the unit, it is set to the HOLD
state and starts printing. It remains in the HOLD state after the printing is finished. It stops printing if you
press the again during printing.
PRINT
Since the printer operates with power supply from either the AC adapter or dry batteries, you can easily
produce a hard copy of measured data even when outdoors where no AC power supply is available.
When battery-powered, the printer operates for approximately 30 minutes (continuous use), allowing you
PRINT
(Male)
Printer
to produce about 80 hard copies of the screen image.
55–
Page 59

–
23. Data Output <RS232C>
Press to switch over to the function screen shown below:
RS232C
TRACE BAUD
CURR 38400 EXEC
F1 F2 F3
*
Refer to “25. RS-232C Interface” for “How to connect” and “RS-232C specifications”
F4
23.1 Selecting the trace to transfer
Use to select a trace.
F1
CURR 00 01 02 03 ··· 98 99
*An asterisk (*) appears when there is a saved trace at the selected number as well as
“SAVE/LOAD”.
F5
F6
* The trace currently displayed on the screen is transmitted when “CURR” is selected.
23.2 Selecting the communication speed (baud rate)
Use to select a baud rate.
F2
2400 4800 9600 19200 38400
23.3 Transfer the data
Press to start the transfer.
The data are transmitted as ASCII cord character strings.
F3
56–
Page 60

–
· Contents of data *“CR(0D[HEX])+LF(0A[HEX])” is added to the tail of every data.
Character strings Description Example
PARAM This means that the data from the next line are “setting parameters”. PARAM
CF **
SP ** Frequency span SP 20M
RF ** Reference level RF 10dBm
ST
##
**
RB **
VB **
SC ** Display scale (**=10dB/d or 2dB/d) SC 10dB/d
TRACE This means that the data from the next line are “trace data”. TRACE
, **, ···
**
Center frequency
Sweep time and detection mode
Resolution bandwidth
Video bandwidth
These are trace data. Ten two-digit hexadecimal characters
separated by commas make a line, and there are 26 lines (251data) of
data in total. For Trace 1001 data transfer, there are 101 lines (1001
data) of data in total.
Refer to 1
Refer to 2
Refer to 3
Refer to 4
Refer to 5
Refer to 6
CF 2.5140G
ST 30ms SMP
RB 300k
VB 1M
24, 20, 1f, 1f, 1e, ···
···
23
1: Center frequency
2650/2652: CF
2658: CF
** [**
** [**
=0.0M, 0.1M to 999.9M (0.1step), 0.0001G to 3.3G(0.0001step)]
=0.0M, 0.1M to 999.9M (0.1step), 0.0001G to 8.5G(0.0001step)]
2: Frequency span
2650/2652:
2658:
SP
SP
**
=ZERO,200k,500k,1M,2M,5M,10M,20M,50M,100M,200M,500M,1G,2G,FULL]
**[**
[
=ZERO, 200k, 500k, 1M, 2M, 5M, 10M, 20M, 50M, 100M, 200M, 500M, 1G, 2G,5G FULL]
**
3: Reference level
RF
** [**
= -60 to 10dBm, 47 to 117dBµV, -13 to 57dBmV, -73 to -3dBv,
72 to 149dBµV/m, 89 to 203dBµA/m (all 1step)]
4: Sweep time and Detection mode
ST
## [**=10ms, 30ms, 0.1s, 0.3s, 1s, 3s, 10s, 30s]
**
[##=POS, NEG, SMP]
5: Resolution bandwidth
2650/2652/2658: RB
** [**
=3k, 10k, 30k, 100k, 300k, 1M, 3M]
6: Video bandwidth
VB
** [**
=100, 300, 1k, 3k, 10k, 30k, 100k, 300k, 1M]
57–
Page 61

–
(
)
(
)
24.1 RS-232C specifications
·Transfer rate
·Date bit length
·Stop bit
·Parity check
: 2400/4800/9600/19200/38400bps
: 8bit
: 1bit
: none
24.2 How to connect
24. RS-232C Interface
When using the RS-232C interface, connect the RS-232C cable as shown in the figure below.
* RS-232C interface cable specifications · · · Cable length: approx. 1.5m
Connector: D-sub 9pin male / D-sub 9pin female
Wiring: straight
* Refer to “23. Data Output” about changing baud rate.
Male
Female
COM PORT (D-sub 9pin, male)
*Use the conversion connector, in the case
that is D-sub 25pin (male)
24.3 Command description
* “CR(0D[HEX])+ LF(0A[HEX])” is added to the tail of every command. When you send a command
from your PC, 2650/2658 returns a response. Responses include “OK” + CR + LF, “ERR” + CR +
LF and “(response to command)” + CR + LF.
*By inputting “?” instead of “**” for each command, the current setting parameters are returned.
Except for “····Request” command and command for inputting corrected data.
58–
Page 62

–
1) Set the center frequency
Command: FREQ
(
*******
*******
=Refer to [25.4 Input the frequency])
2) Request the set marker
Command: FREQSETMKR
*The center frequency is set according to the frequency of
current marker position.
3) Set the span
2650/2652: Command: SPAN
(
2658: Command: SPAN
(
=ZERO, 200K, 500K, 1M, 2M, 5M, 10M, 20M, 50M, 100M,500M, 1G, 2G, FULL[unit: Hz])
****
=ZERO, 200K, 500K, 1M, 2M, 5M, 10M, 20M, 50M, 100M,500M, 1G, 2G, 5G, FULL[unit: Hz])
****
4) Set the reference level
Command: REF
(
=-60 to 10[1step, unit: dBm])
***
***
****
****
*For units other than dBm, use the conversion
formulas in “9.3 Refference level setting range
for each unit” to convert them into dBm
before inputting the value.
5) Set the reference unit
Command: UNIT
(
=DBM, DBVU, DBMV, DBV)
***
***
6) Set the RBW
Command: RBW
2650/2652/2658 (
****
=3K, 10K, 30K, 100K, 300K, 1M, 3M, AUTO, ALL[unit: Hz])
****
Command Unit
DBM dBm
DBUV dBµV
DBMV dBmV
DBV dBV
7) Set the VBW
Command: VBW
=100, 300, 1K, 3K, 10K, 30K, 100K, 300K, 1M AUTO, ALL[unit: Hz])
(
****
8) Start/S top the measuring function
Command: MEAS
(
= CP, AC P, O B W,
***
EF, MF, FC, OFF)
9) Request the result of measuring function
Command: MEASRES
*Example of the return data
Case of channel power measurement··· POW: -25.5dBm
Case of adjacent channel power measurement··· L: -44.7dBc U: -48.3dBc
Case of occupied bandwidth measurement··· C: 1.45G W: 20.00k
****
***
Command Measuring function
CP Channel power measurement
ACP Adjacent channel leakage power measurement
OBW Occupied frequency bandwidth measurement
EF Electric field strangth measurement
MF Magnetic field strangth measurement
FC Frequency counter (factory option)
OFF OFF
Case of frequency counter··· FC:2400.0000M
* When the level of spectrum is small and cannot measure, it is returned as “Non signal”.
* If frequency counter (factory option) is not mounting, it is returned as “Invalid for F/C”.
59–
Page 63

–
10) Set the mode of channel power measur ement
Command: CPMODE
(
*****
=TOTAL. BAND)
*****
Command Mode
TOTAL Measure the power of whole range on the screen
BAND Measure the power within zone set
11) Set the zone center fr equency of channel power measurement
Command: CPCNTR
(
12)
*******
Set the zone width of channel power measurement
=Refer to [24.4 Input the frequency])
*******
Command: CPWIDTH
(
*******
=Refer to [24.4 Input the frequency])
*******
13) Set the mode of adjacent channel power mesurement
Command: ACPMODE
(
*****
=TOTAL, REF, PEAK)
*****
Command Mode
TOTAL TOTAL(total power method)
BAND BAND(in-band method)
PEAK PEAK(reference level method)
14) Set the band offset of adjacent channel power mesurement
Command: ACPOFS
(
*******
=Refer to [24.4 Input the frequency])
*******
15) Set the bandwidth of adjacent channel power mesurement
Command: ACPCHBW
(
*******
=Refer to [24.4 Input the frequency])
*******
16) Set the refer ence band center frequency of adjacent channel power mesur ement
Command: ACPREF
(
*******
=Refer to [24.4 Input the frequency])
*******
17) Set the refer ence bandwidth of adjacent channel power measur ement
Command: ACPREFBW
(
*******
=Refer to [24.4 Input the frequency])
*******
18) Set the mode of occupied bandwidth measurement
Command: OBWMODE**
=N%, DB)
(
**
19) Set the N% ratio of occupied bandwidth mesurement
Command: OBWRATIO
(
=80.0 to 99.9[0.1step, unit: %])
***
***
Command Mode
N% N% POWER mode
DB XdB DOWN mode
20) Set the XdB down of occupied bandwidth mesurement
Command: OBWDB
(
=0.1 to 40.0[0.1step, unit: dB])
***
***
60–
Page 64

–
21) Set the antenna of electric field strength measurement
Command: EFANT
(
=AN301, AN302, AN303, AN304, AN305,
****
****
AN306, USER)
22) Transfer the user -compensation data of electric field str ength measur ement
Command: EFUSER
Example of the compensation data:
*If the compensation coefficient is -0.3dBi at 2.5GHz, the compensation data is “2.5G:-0.3DBI”
Set apart by “,” between data and input from lower frequency. 10data are available.
*****
*****
=2.25G:2.08DBI,···2.65G:3.5DBI
23) Set the probe of magnetic field str ength measur ement
Command: MFPROBE
(
=PR 26M, USER)
****
****
24) Transfer the user-compensation date for magnetic field str ength measurement
Command: MFUSER
Example of the compensation data:
*If the compensation coefficient is 86.7dB at 10MHz, the compensation data is “10M:86.7DB”
*****
*****
=10M:86.7DB, 100M:69.2DB,···3G:40dB
Command Antenna
AN301 Setting data for AN301
AN302 Setting data for AN302
AN303 Setting data for AN303
AN304 Setting data for AN304
AN305 Setting data for AN305
AN306 Setting data for AN306
USER Setting date for user’s original antenna
Command Probe
PR 26M Setting data for PR 26M
USER Setting data for user’s original probe
Set apart by “,” between data and input from lower frequency. 10data are available.
25) S tart/Stop Calculation
Command: CALC
(
=OFF, MAX, MIN, AVE, OVR)
***
***
26) Set the number of MAX HOLD
Command: MAXNO
(
=2, 4, 8, 16, 32, 64, 128, 256, 512, 1024, 0) * Command: 0 = unlimited
****
****
Command Calculation
OFF OFF
MAX MAX HOLD
MIN MIN HOLD
AV E AV E R A G E
OVR OVER WRITE
27) Set the number of MIN HOLD
Command: MINNO
=2, 4, 8, 16, 32, 64, 128, 256, 512, 1024, 0) * Command: 0 = unlimited
(
****
****
28) Set the number of AVERAGE
Command: AVENO
(
=2, 4, 8, 16, 32, 64, 128, 256)
***
29) Set the display scale of amplitude axis
Command: SCALE** (**=2, 10)
***
Command Display scale
2 2dB/div
10 10dB/div
61–
Page 65

–
30) Set the sweep time
Command: SWEEP
(
=10M, 30M, 0.1S, 0.3S, 1S, 3S, 10S, 30S, AUTO, ALL)
****
Command Sweep time
10M 10ms
30M 30ms
0.1S 0.1s
0.3S 0.3s
1S 1s
31) Set the detection mode
Command: DET
(
=POS, NEG, SMP)
***
***
32) Request the AUT OTUNE
Command: AUTO
*Returns the response after tuning.
****
Command Sweep time
3S 3s
10S 10s
30S 30s
AUTO AUTO
ALL ALL AUTO
Command Detection mode
POS Positive peak mode
NEG Negative peak mode
SMP Sample mode
33) Request the action
Command: HOLD/RUN
34) Request the marker information
Command: MKRRES
*Example of returned data: 1.42G -15dBm
35) Set the marker mode
Command: MKR
(
*****
=NORM, DELTA)
*****
Command Marker mode
NORM, Normal marker
DELTA Delta marker
36) Set the marker position
Command: NORMMKR
(
*******
=Refer to [24.4 Input the frequency])
*******
37) Set the peak search mode
Command: PEAK
=NORM, ZONE)
(
****
****
Command Peak search mode
NORM Normal peak search
ZONE Zone peak search
38) Request the peak search
Command: PKSEARCH**
(
=01, 02, 03, 04, 05, 06, 07, 08, 09, 10, 11)
**
39) Set the zone center fr equency of peak search
Command: PKCNTR
(
*******
=Refer to [24.4 Input the frequency])
*******
Command Position to where the marker moves
01
02
···
11
Position of the maximum peak
on the screen
Position of the 2nd highest peak
on the screen
···
Position of the 11th highest peak
on the screen
62–
Page 66

–
40) Set the zone width of peak search
Command: PKWIDTH
(
*******
=Refer to [24.4 Input the frequency])
*******
41) Set the unit of marker
Command: CONV
(
=DBM, M, DBV, V, DBUVM, VM)
***
***
42) Request the transfer of hard copy
Command: PRT
*When transferring the returned data to optional printer, hard copy is performed.
43) Request to transfer trace
Command: SRS
(
=CURR, 00 to 99)
****
****
44) Request to transfer 1001 date of trace
Command: SRSF
(Refer to “24.3 Transfer the data” about returned data.)
Command Unit of marker
DBM dBm
W W
DBV dBV
V V
DBUVM dBµV/m
VM V/m
Command Trace that is transferd
CURR Trace of Current
00 Trace of save data 1
··· ···
99 Trace of save data 100
45) Request the preset
Command: PRESET
46) Set the remote contr ol
Command: REMOTE
=ON, OFF)
(
***
* When remote control is ON, “REMOTE”
is displayed in the operating information
display area on the LCD screen.
(Refer to “4. Description Of Screen” for details)
***
Command Remote control
Any operation from the keys or the
ON
OFF
encoder of the main body will not
be accepted. Control the unit with
RS-232C commands.
The operation from the keys or the
encoder of the main body and
RS-232C commands will be accepted.
47) Single sweep
Command: CAPT
* It sweeps only once and will be in a HOLD state.
48) Setting of the offset level
Command: OFFSET
(
=-50.0 to 50.0 [0.1step, unit:dB])
****
49) Setting the input impedance
Command: IMP**
(
=50, 75)
**
* When selecting of “75Ω”, please attach the coaxial connector (impedance converter) MA301 (optional)
to an input connector.
****
Command Offset level
50 Offset level is set to 0dB.
75 Offset level is set to 5.7dB.
63–
Page 67

–
50) Clearing of saved trace-data and parameter
Command: MCLR
(
=WALL, SALL, W00 to W99, S00 to S99)
***
***
24.4 Input the frequency
For the items written (
*******
above, enter a frequency as follows.
*******
=0.0k to 999.9k[0.1step, unit: Hz]
0.0M to 999.9M[0.1step, unit: Hz]
2650/2652: 0.0000G to 3.3G[0.0001step, unit: Hz]
2658: 0.0000G to 8.5G[0.0001step, unit: Hz]
* However, the offset frequency and zone width can be input only in the range decided by the center
frequency and frequency span. The value out of the range becomes error.
* Values of the offset frequency and the zone width will change as you alter the frequency span.
=Refer to [24.4 Input the frequency]) in [25.3 Command description]
24.5 Writing of original compensation data
Command Clearing data
WALL All of saved trace-data
SALL All of saved-parameter
W00 Trace-data of save-No. 00
··· ···
W99 Trace-data of save-No. 99
S00 Parameter of save-No. 00
··· ···
S99 Parameter of save-No. 99
On the case of electric field strength measurement used the antenna prepared by the user, or,
on the case of magnetic field strength measurement used the magnetic field probe prepared by the user,
it is necessary to write the data of the antenna gain or the magnetic probe field compensation coefficient to
2650/2652/2658 main unit. Please write the antenna gain or the magnetic probe field compensation
coefficient according to the following description. There are two kinds of methods, “method 1: use PC
software AK 2650 (optional)” and “method 2: use communication program which is prepared by user”.
1) Preparation things
· RS-232C interface cable
· Windows® PC (with RS-232C interface) * It is not writable with 2650/2652/2658 main unit only.
· PC software AK 2650 (case of “Method 1 of writing data”)
2) Write-in data
As example, the compensation data (antenna gain) of antenna AN305 and the compensation data
(compensation coefficient) of magnetic field probe PR 26M are shown below.
· Compensation data (antenna gain) of antenna AN305.
Frequency 300MHz 350MHz 400MHz 450MHz 500MHz
Antenna gain 0.0dBi 1.0dBi 1.4dBi 1.4dBi 0.0dBi
· Compensation data (compensation coefficient) of magnetic field probe PR 26M.
Frequency 10MHz 100MHz 1GHz 2GHz 3GHz
Compensation coefficient 86.7dB 69.2dB 50.7dB 44.9dB 40.1dB
64–
Page 68

–
* Here, although the number of data is five points, it is possible to write even the data of
3) Method 1 of writing data
The method which used the optional PC software AK 2650.
* Please use AK 2650 of the version more than 1.03b.
The software can be updated from our website.
1. Write the antenna gain to text file.
Please create a new text file by new creation of a personal computer, and open by the text editor.
· Format
“Frequency”:“Antenna gain”,“Frequency”:“Antenna gain”,“Frequency”:“Antenna gain”, ···
Example) case of AN305
300M:0.0DBI,350M:1.0DBI,400M:1.4DBI,450M:1.4DBI,500M:0.0DBI
2. It writes in by PC software AK 2650.
maximum of ten points. Data cannot be written in 0Hz.
* Please write unit with a capital letter. Moreover, Frequency can also use G (GHz).
Connect the personal computer to 2650/2658 by RS-232C interface cable. Turn on the power of
2650/2658. Start the PC software AK 2650. Please set the same baud rate of 2650/2652/2658 and
AK 2650. (Refer to “24. Data Output” for details)
On the case of electric field strength measurement, please choose [File] → [Write E/F User Data],
on the case of magnetic field strength measurement, please choose [File] → [Write M/F User Data],
from the upper menu of software, and select the text file which made some time ago. Then, data is
written.
4) Method 2 of writing data
It is method of writing in which does not use AK 2650. A user needs to prepare communication program.
1. Prepare the RS-232C communication softwar e.
Connect the personal computer to 2650/2652/2658 by RS-232C interface cable. Turn on the power
of 2650/2652/2658.Start the RS-232C communication software. Please set the same baud rate of
2650/2652/2658 and software, and unite the setting of communication.
(Refer to “23. Data Output” for details.)
2. Write the data
Please transmit data of the following format to 2650/2652/2658 from RS-232C
communication software.
· Format
Case of compensation data of electric field strength measurement.
EFUSER“Frequency”:“Antenna gain”,“Frequency”:“Antenna gain”, ···
65–
Page 69

–
3. After writing is completed corr ectly, “OK” is returned from 2650/2652/2658.
5) How to use
1. Please set the measuring function of 2650/2652/2658 to electric field strength measurement
mode or magnetic field strength measur ement mode.
Case of compensation data of magnetic field strength measurement.
MFUSER“Frequency”:“Compensation coefficient”,“Frequency”:“Compensation coefficient”, ···
Example) case of PR 26M
MFUSER10M:86.7DB,100M:69.2DB,1G:50.7DB,2G:44.9DB,3G:40.1DB
* Please write unit with a capital letter.
On the case of electric field strength measurement, please select [MEAS] → [E/F ANT],
on the case of magnetic field strength measurement, please select [MEAS] → [M/F PROBE],
Please push [F1] and display [USER] on the upper of [F1].
Now, electric field strength measurement or magnetic field strength measurement by the written
compensation data can be performed.
* When the power supply of 2650/2652/2658 is turned off at once and turned on again it
returns from electric field strength measurement mode or magnetic field strength measurement
mode to the usual measurement mode. Then if it goes into electric field measurement mode or
magnetic field strength measurement mode once again, it can measure in the same state.
6) About the antenna gain
In this contents, the antenna gain is meaning absolute gain [dBi].
When antenna gain is relative gain, it can change into absolute gain by adding +2.15dB.
· Absolute gain [dBi] = Relative gain [dBd] + 2.15dB
As reference, the conversion formula to electric field strength is using the following.
· E=√ (480π2 × Pa ÷ (Ga × λ2)
E: Electric field strength [V/m]
Pa: Received electric power [W]
Ga: Antenna gain [times] = 10
λ: Wavelength [m] = (3 × 10⁸) ÷ frequency [Hz]
24.6 Sample program
An example program to send following setting with RS-232C is shown below:
Setting: Center frequency 1GHz
10 ‘ ‘FREQ SETTING
20 OPEN “COM1:N81N” AS #1
(antenna gain [dBi] ÷ 10)
30 PRINT #1 “FREQ1G”; ‘”FREQ1G” OUTPUT
40 INPUT #1 A$ ‘”OK” READ
50 CLOSE #1
66–
Page 70

–
25. PC Software (optional)
This is the software AK 2650 that controls 2650/2652/2658 by RS-232C. All setting can be performed
from PC. Although the 251 points of trace data is displayed on horizontal axis in the screen of the
2650/2652/2658,1001 points of trace data are taken per sweep. When this software is used, all of these
1001 points data are transformed to a PC and trace is displayed at high resolution.
Corresponding OS
Hardware Requirements
Computer that is able to act normally W indows®, and able to use the COM port and CD-ROM
drive.
Screen size 1024x768 or more computers.
Operating system
Windows® 95/98/2000/Me/NT 4.0/XP
Communication method
Bidirectional communication by RS-232C.
Installation procedure
1. Start windows®.
2. Insert the AK 2650 software CD into the CD -ROM driv e.
The setup will start automatically and the initial screen will appear .
3. Follow the instructions on the screen.
* If the setup does not start,
1. Double-click on the My Computer icon.
2. Double-click on the CD-ROM icon.
3. Double-click on “setup.exe”.
4. Follow the instructions on the screen.
Refer to the “README” in the AK 2650 for details.
* The software can be updated. Please contact to our company for details.
67–
Page 71

–
26. Basis Performance Test
T o keep the quality of the unit, regular performance testing is recommended. This section describes
a method and specification of basic performance testing. If a problem is found in the results of basic
performance testing, or formal testing is needed, please contact the dealership where you purchased the
product, or contact us.
[Connection diagram]
26.1 Frequency c haracter istics
Adjust the output level of the spectrum analyzer calibration unit (thereafter, “calibration unit”) so that the
displayed power value is -15dBm at each frequency for this unit, and measure the absolute value with a
Spectrum analyzer calibration unit
Receiver for calibration
2650/2652/2658
receiver for calibration (microwave power meter, etc.).
Setting of 2650/2652/2658
Center
frequency
50kHz 200kHz 10kHz Within Reference±2.6dB±1dot
100kHz 200kHz 30kHz Within Reference±2.6dB±1dot
1MHz 2MHz 100kHz Within Reference±1.6dB±1dot
10MHz 10MHz 3MHz Within Reference±1.0dB±1dot
100MHz 10MHz 3MHz Reference
1GHz 10MHz 3MHz Within Reference±1.0dB±1dot
2GHz 10MHz 3MHz Within Reference±1.0dB±1dot
3.3GHz 10MHz 3MHz Within Reference±1.0dB±1dot
6.2GHz *2 10MHz 3MHz Within Reference±1.0dB±1dot
8.5GHz *2 10MHz 3MHz Within Reference±1.0dB±1dot
Frequency
span
RBW *1
*1 RBW switching error is included at RBW other than 3MHz. *2 2658 only
Specifications Measurement value Judgment
· Setting of 2650/2652/2658 · Setting of calibration unit
Reference level
VBW
Sweep time
Detection mode
Display scale
:
:
:
:
:
-15dBm
1MHz
1s
SMPL
2dB/div
Frequency
Output power
:
Same as a center frequency of
2650/2652/2658.
:
Adjust the power indication of
2650/2652/2658 to
-15dBm.
68–
Page 72

–
26.2 Accuracy of refer ence level
Adjust the output level of the calibration unit so that the displayed value of this unit is the 0th div from
the top, and calibrate the absolute value with the receiver for calibration (microwave power meter, etc.).
Setting of 2650/2652/2658
Reference level
+10dBm within ±1.4dB±1dot
0dBm within ±1.4dB±1dot
-10dBm within ±1.4dB±1dot
-15dBm
-20dBm within ±1.4dB±1dot
-30dBm within ±1.4dB±1dot
-40dBm within ±1.4dB±1dot
* Input attenuator switching error is included at the reference level other than -15dBm.
Specifications Measurement value Judgment
within ±0.8dB±1dot
· Setting of 2650/2652/2658 · Setting of calibration unit
Center frequency
Frequency span
RBW
VBW
Sweep time
Detection mode
Display scale
:
:
:
:
:
:
:
100MHz
10MHz
3MHz
1MHz
1s
SMPL
2dB/div
Frequency
Output power
:
100MHz
:
Adjust it so that the indicated
value of 2650/2652/2658
is at the 0th div from the top.
26.3 The display accuracy of the center frequency
Measure the frequency with the peak search function of 2650/2652/2658.
Setting of 2650/2652/2658
Center frequency Frequency span RBW
100MHz 200kHz 3kHz
100MHz 10MHz 30kHz
100MHz 20MHz 100kHz
100MHz 200MHz 100kHz
1GHz 20MHz 100kHz
2GHz 20MHz 100kHz
3.3GHz *1 20MHz 100kHz
6.1GHz *2 20MHz 100kHz
8.5GHz *2 20MHz 100kHz
Specifications
within ±50kHz±1dot
±RBW×6%
within ±800kHz±1dot
±RBW×30%@2650
within ±360kHz±1dot
±RBW×30%@2658
within ±360kHz±1dot
±RBW×30%@2658
Measurement
value
*1 2650 only *2 2658 only
Judgment
· Setting of 2650/2652/2658 · Setting of calibration unit
Reference level
VBW
Sweep time
Detection mode
Display scale
:
:
:
:
:
-15dBm
AUTO
1s
SMPL
10dB/div
Frequency
Output power
*
:
Same as a center frequency of
2650/2652/2658.
:
-15dBm
However, calibrate the signal generator
in advance.
69–
Page 73

–
26.4 The display accuracy of the frequency span
Adjust the frequency of the calibration equipment so that the peaks are at the positions of f1 and f9, and
measure the frequencies of f1 and f9. Calculate from f1 and f9 the display accuracy of the frequency span.
* f1: 1st div from the left on the trace screen f9: 9th div from the left on the trace screen
Setting of 2650/2652/2658
Frequency span
200kHz 100MHz 3kHz within ±26kHz ±1dot
10MHz 100MHz 100kHz within ±320kHz ±1dot
20MHz 100MHz 300kHz within ±0.8MHz ±1dot
200MHz 100MHz 3MHz within ±6.2MHz ±1dot
500MHz 1GHz 3MHz within ±15.2MHz ±1dot
2GHz 1GHz 3MHz within ±60.2MHz ±1dot
FULL(3.3GHz)*1 1.65GHz 3MHz within ±99.2MHz ±1dot
2GHz *2 4.8GHz within ±60.2MHz ±1dot
2GHz *2 7.4GHz within ±60.2MHz ±1dot
FULL(8.5GHz)*2 4.25GHz within ±255.2MHz ±1dot
Center
Frequency
RBW
Specifications
f
1
Measurement
value
· Setting of 2650/2652/2658 · Setting of calibration unit
Reference level
VBW
Sweep time
Detection mode
Display scale
:
:
:
:
:
-15dBm
AUTO
1s
SMPL
2dB/div
Frequency
Output power
26.5 Linearity of the amplitude axis
Adjust the level of the calibration unit so that the peak is at the top of the amplitude axis (0th div), and
f
9
Measurement
:
:
value
*1 2650/2652 *2 2658 only
Adjust it to the positions of f1
and f9.
-15dBm
(f9 - f1)
×
1.25
Judgment
regard the point set at that time as the reference. Gradually lower the output, starting from the reference,
and measure the amplitude value of 2650/2652/2658.
Setting of 2650/2652/2658
Display scales
10dB/div
2dB/div
Output of calibration unit Specifications
XdBm (adjust it to the 0th div)
X-10dBm
X-70dBm
XdBm (adjust it to the 0th div)
X-2dB
X-10dB
Reference(-15dBm) (-15dBm)
Within -25dBm±0.8dB±1dot
Within -85dBm±1.6dB±1dot
Reference(-15dBm) (-15dBm)
Within -17dBm±0.2dB±1dot
Within -25dBm±0.8dB±1dot
· Setting of 2650/2652/2658 · Setting of calibration unit
Center frequency
Reference level
Frequency span
RBW
VBW
Sweep time
Detection mode
:
:
:
:
:
:
100MHz
-15dBm
10MHZ
3MHz
1MHz
1s
SMPL
Frequency
:
100MHz
Measurement
value
Judgment
70–
Page 74

Limited Two-Year Warranty
B&K Precision Corp. warrants to the original purchaser that its product and the component parts
thereof, will be free from defects in workmanship and materials for a period of two years from the
data of purchase.
B&K Precision Corp. will, without charge, repair or replace, at its’ option, defective product or
component parts. Returned product must be accompanied by proof of the purchase date in the
form a sales receipt.
To obtain warranty coverage in the U.S.A., this product must be registered by completing and
mailing the enclosed warranty card to B&K Precision Corp., 22820 Savi Ranch Parkway, Yorba
Linda, CA 92887 within fifteen (15) days from proof of purchase.
Exclusions: This warranty does not apply in the event of misuse or abuse of the product
or as a result of unauthorized alternations or repairs. It is void if the serial number is
alternated, defaced or removed.
B&K Precision Corp. shall not be liable for any consequential damages, including without
limitation damages resulting from loss of use. Some states do not allow limitation of incidental or
consequential damages, so the above limitation or exclusion may not apply to you.
This warranty gives you specific rights and you may have other rights, which vary from state-tostate.
Model Number: ______________ Date Purchased: __________
22820 Savi Ranch Parkway
Yorba Linda, CA 92887
www.bkprecision.com
Page 75

Service Information
Warranty Service: Please return the product in the original packaging with proof of purchase to
the below address. Clearly state in writing the performance problem and return any leads,
connectors and accessories that you are using with the device.
Non-Warranty Service: Return the product in the original packaging to the below address.
Clearly state in writing the performance problem and return any leads, connectors and
accessories that you are using with the device. Customers not on open account must include
payment in the form of a money order or credit card. For the most current repair charges contact
the factory before shipping the product.
Return all merchandise to B&K Precision Corp. with pre-paid shipping. The flat-rate repair
charge includes return shipping to locations in North America. For overnight shipments and nonNorth America shipping fees contact B&K Prec isio n Co rp..
B&K Precision Corp.
22820 Savi Ranch Parkway
Yorba Linda, CA 92887
Email: service@bkprecision.com
Include with the instrument your complete return shipping address, contact name, phone
number and description of problem.
Page 76

OM-040055EB Rev. 07/10
Printed in Japan
©2007 B&K Precision Corp.
22820 Savi Ranch Parkway
Yorba Linda, CA 92887
USA
TEL: 714-921-9095
FAX: 714-921-6422
www.bkprecision.com
 Loading...