

Page 1
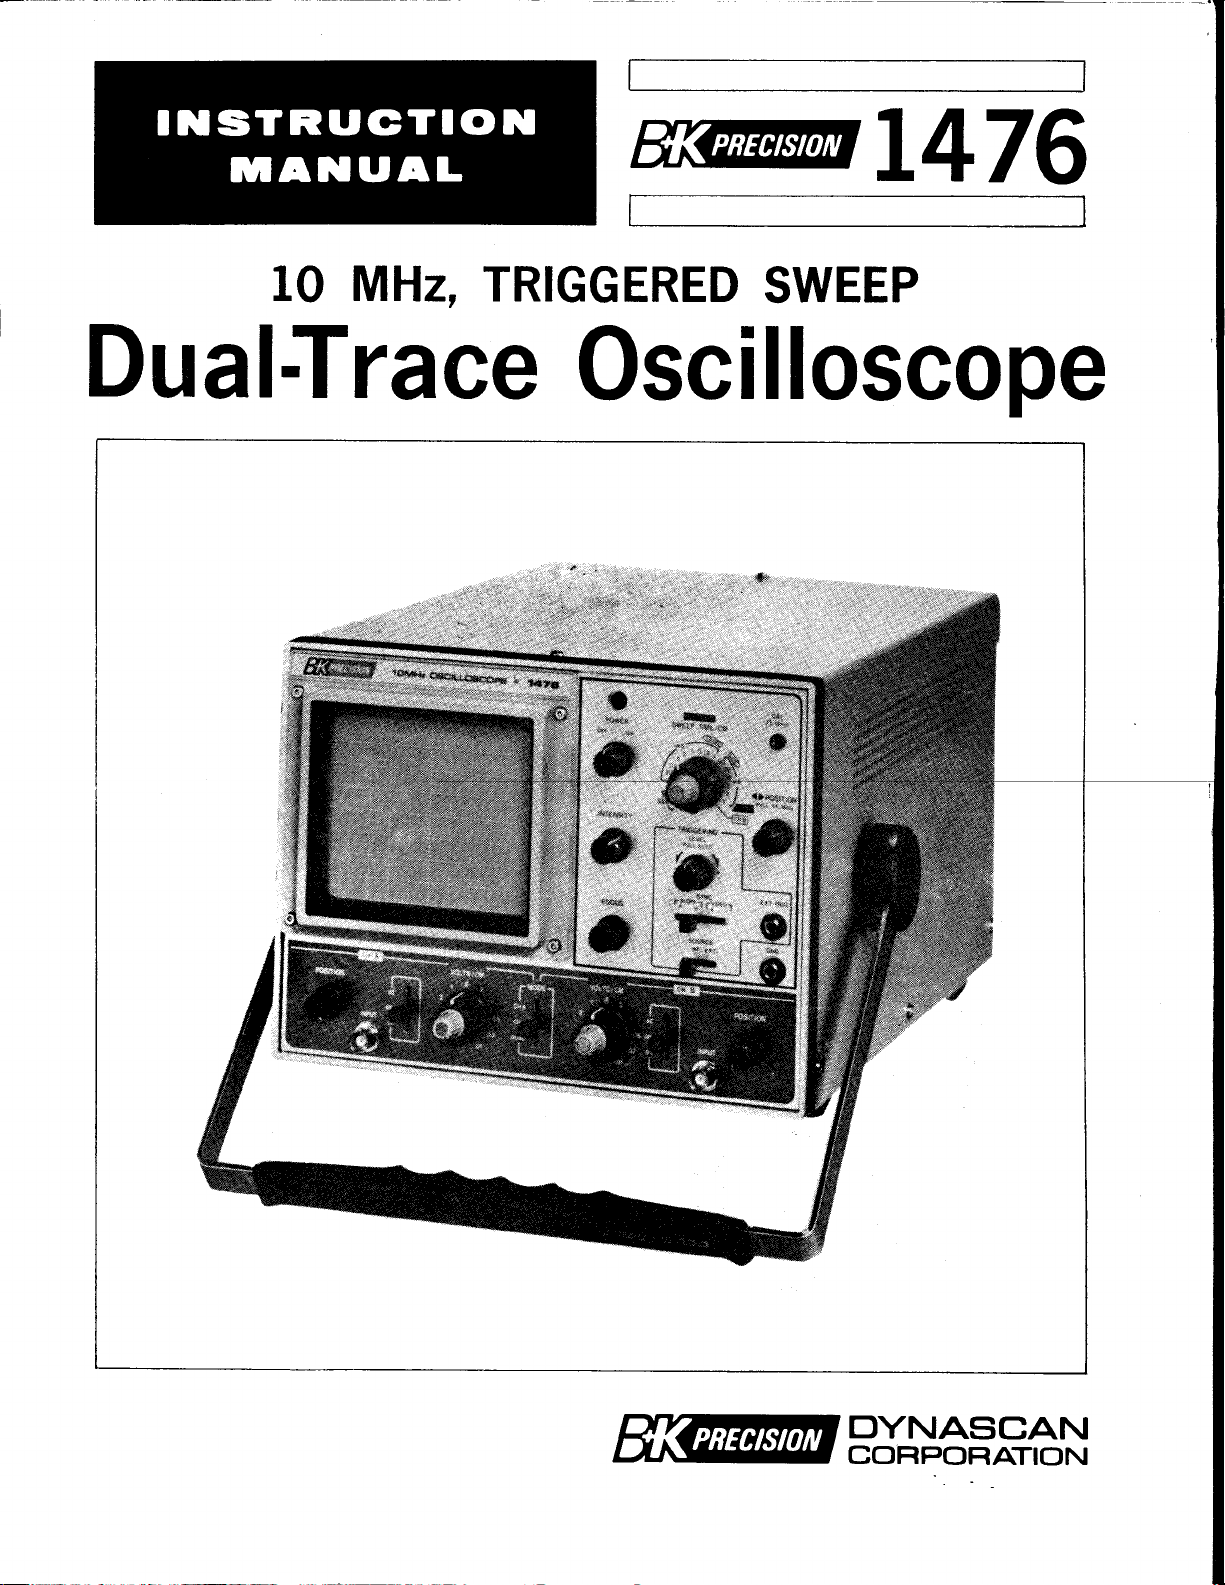
@L476
10 MHz,
Dua
l-T
TRIGGERED
race
Osci
SWEEP
I loscope
@"o#6FmN
Page 2
WARNING
Normal
electrical shock
present.
stop
voltages
or
AC RMS
current under certain conditions. Your
practices
away
significantly reduce the risk factor
precautions:
1.
Don't
necessary.
2. Use
insulated work surface on which to
are
3.
Use
instrument
that could
4.
Always
equipment, where one side of the
This
transformer,
60 Hz in USA), depending upon which way
only
to test instruments or the equipment under
ground
oscilloscopes and most
ground.
use of test equipment exposes
because
electrical shock
An
human heartbeats.
most
more easily
can
should be considered dangerous
that will
from
expose high voltage needlessly. Remove
an insulated floor
not
the time-proven "one hand in the
includes most recent television sets and audio
does
prevent
your
heart in
Turn
or wet. Where insulated floor surface is
damp
probe.
provide a good ground
use an
the
present
this
lead of some
testing
causing l0 milliamps
Higher
produce
contact with
case
equipment
off
material
particularly
Be
isolation transformer to
chassis
of
such equipment may be
a
dangerous
test
instruments
other test instruments with 3-wire
often be
must
vollages
a lethal current. However,
normal work
exposed high voltage, and
of accidental contact
you
if
while making
or a large, insulated
place equipment; and
careful
return
AC
shock
you
to a certain
performed
of
current
pose
an even
and hazardous
habits should include all accepted
know and observe the
housings and
test
connections
pocket" technique while handling an
to avoid
path.
power
the
hazard if the
to a "hot"
contacting
power
is
line
connected directly
equipment. Without an isolation
floating
2-wire AC
test
may
chassis. The
amount of
where exposed voltage
pass
to
through the heart will
greater
voltage
since it
with a
floor
not
available, wear
transformerless
chassis
threat
as
as low
produce
can
that
will
high
voltage. You will
following
covers
in high voltage circuits.
to stand on, and an
mat
make certain
nearby
a
"hot
at line voltage
plug
power
is touched,
result from
power plugs
is inserted.
connecting
ground
danger
because
steer
such surfaces
heavy
to the
from
such
volts
35
only when
metal
but damage
lead
DC
a lethal
current
safety
gloves.
object
chassis"
chassis.
(120
VAC,
Not
the
of
most
is an earth
is
test instruments or any equipment with a 3-wire AC
5.
On
outlet. This
ground.
possible,
If
6.
its high voltage
unexpected
7.
Also
such as on-off switches, fuses,
turned off.
8. Never work
CPR
is
a safety feature to keep the housing
familiarize
points
remember that
alone.
(cardio-pulmonary
yourself
points.
in defective equipment.
AC
Someone
resuscitation)
with the equipment being
However, remember
present
line voltage
should be
is
power
transformers, etc.,
nearby to render aid
first aid is highly recommended.
power plug,
or other
that high
some
on
even
exposed
tested
and the location
voltage
power
input
when
if
necessary.
use only a 3-wire
elements at
may appear
circuit
the
equipment
earth
of
points
Training
at
is
in
Page 3
INSTRUCTION
FOR
MANUAL
B
10
MHz,
DUAL."TRACE
K.PRECISION
&
MODEL
L476
TRIGGERED
OSCILLOSGOPE
SWEEP
@BMFffiN
6460 West
Chicago, Illinois
C.ortland
60635
Street
Page 4
INTRODUCTION
FEATURES
SPECIFICATIONS
TABLE
.
OF
CONTENTS
Page
4
OPERATOR'S
OPERATING
Initial Starting Procedure
Single-Trace
Calibrated Voltage Measurement
Calibrated Time Measurement
External
Z-Axis
Dual-Trace
DUAL-TRACE
Introduction
FrequencyDividerWaveforms
Dvide-by-8CircuitWaveforms
DigitalCircuitTimeRelationships
GatedRingingCircuit
DelaylineTests...'....
StereoAmplifierServicing
VideoEquipmentServicing
SINGLETRACE APPLICATIONS
Introduction
Video Equipment
Sigral Tracing
Composite
Sync
VITS
Vectorscope
CONTROIS, INDICATORS
INSTRUCTIONS
Waveform
Horizontal
lnput
Waveform
APPLICATIONS
Video
Pulse
Analysis
(Vertical
Operation
.
and
lnterval Test Sigral)
Observation
Input
Observation
Servicing
Peak-to-Peak
Waveform Analysis
(X-Y
AND FACILITIES
Operation)
Voltage Readings
.
9
9
l0
ll
t2
t2
t2
.
.. . .. 14
....l4
....14
.......14
.....l4
........16
.......16
.......17
l8
l8
l9
l9
l9
2l
23
TELEVISION ALIGNMENT
Introduction
lmportance of Sweep Aligrrment
Sweep Aligrment Methods
Tuner Alignment
IF Alignment
Chroma Alignment
26
26
27
28
29
29
Page 5
TABLE OF
CONTENTS
page
FMRECEIVERALIGNMENT..
PHASE
FREQUENCYMEASUREMENT
SQUARE
CIRCUIT
MEASUREMENT
WAVE
Introduction
Testinghocedure
AnalyzingtheWaveforms....
DESCRIPTION
General
VerticalPreamplifiers
Mode
logic
VerticalAmplifier
TriggerCircuit
SyncAmplilierandlnverter
AutoSweep
HorizontalAmplifier
ChoppingOscillator
I VoltCalSignal
PowerSuppty
BlockDagram
TESTING
OF AMPLIFIERS
...
....3I
....
...... 33
........34
....34
....38
.....38
.. .. . . 38
.......38
....38
...38
......40
.....4O
......4O
........40
.....4O
....50
3l
33
I',IAINTENANCE
WARRANTY
WARRANTY
OPTIONALACCESSORIES...
AND
CALIBRATION....
INSTRUCTIONS
........
........ 43
.....44
.....
40
43
Page 6
The B & K-Precision
loscope
observing
Dual vertical
of
waveforms
simultaneous
permits
rate waveforrns.
is a laboratory-quality,
and measuring
inputs
waveforms.
two
are
chopped
viewing.
simultaneous
DUAL TRACE
FULLY
SOLID STATE
TRIGGERED
SWEEP
LARGE
SCREEN
CALIBRATED
VOLTAGE SCALES
CALIBRATED
SWEEP SPEED
WIDE BANDWIDTH
INTRODUCTION
Dual-Trace
Model
waveforms in electronic
provided
are
Low-frequency, low repetition rate
at a 200
Alternate sweep
viewing of high-speed, high repetition-
1476
professional
for
kHz rate to
instrument
simultaneous viewing
of
the two inputs
Oscil-
circuits.
provide
for
for
FEATURES
input waveforms can be
Two
viewed
taneously, as
Only
filament. All
transistors,
e ffect transistors) and
The 1476's
pres€ntations is beyond
son
oscilloscopes.
at rest
being
they
Fully
allows
waveforms
ing.
synchronized
trigger.
The 130 mm
diameter cathode
easy-to-read
8 x l0 cm
area.
Accurate measurement of the
stantaneous
ferent attenuator
Channel A and Channel B.
Accurate time
l8
DC to
nSEC rise time assure distortion-
free,
at
either
the cathode
with non-triggered
until
observed,
are
adjustable
the desired
Waveforms can
different ranges.
l0
high
high frequencies.
singly
desired.
ray tube uses
other
diodes, FET's
stability
sweeps
The
triggered by
to assure
always synchronized.
trigger
portign
to be used
to an
(approx.
ray tube
presentation
rectangular viewing
voltaees on I I
ranges for
measurements
MHz bandwidth
resolution
or
simul-
stages
of waveform
for trigger-
external sync
5.1 inches)
presentation
use
(field
IC's.
compari-
sweeP
remain
the
signal
that
threshold
of the
be
also
gives
on an
ln-
dif-
both
on
35
and
dual-trace
The
width, wide range of sweep speeds, and
provided,
of
electronic equipment, research and
laboratory instruction.
make this the ideal oscilloscope
applications,
EXPANDED
SCALE
a
HIGH
SENSITIVITY
VIDEO
SYNC
VECTORSCOPE
CALIBRATION
SOURCE
Z-AXIS
INPUT
feature,
including troubleshooting and
together
A five time rtragrification
the horizontal sweep allows closeup
the
magnification
mum
gSEC/cm.
Permits
impedance, l0: I
probes
measurements, thus assuring less
circuit
A
built-in sync separator circuit
included
television
VIDEO
are automatically selected at sweep
times of 0.5 SEC/cm to 0.
mSEC/cm for viewing
frames. Horizontal sync
automatically
times of 50
for viewing television lines.
The unit may be used as a vector-
scope to
exactly
vision manufacturers.
A
built-in calibrated I volt
t o -peak square wave
checking and
vertical
tional
Intensity modulation
cluded for time or frequency
kers.
brightness increases in
state, decreases in logic
with the l0
development, and
examination of
waveform. In
provides
sweep speed
the low-capacitance, high-
to be used for
loading.
specifically
signals.
SYNC,
selected at sweep
pSEC/cm
provide
as speciiied by color tele-
recalibration of the
amplifiers
equipment.
Compatible
MHz
high
sensitivrt)
for
a broad
portion
a
addition,
attenuation
virtually
for viewing
When
verticai
sync
I
to
a color display
without
capability
with
TTL logic;
logic high
low state.
bandrange
repairing
(5X)
of
of
the 5X
a maxi-
of
0.2
all
is
using
pulses
television
pulses
are
pSEC/cm
peak-
permits
addi-
in-
mar-
1
WIDE
RANGE OF
SWEEP SPEEDS
Sweep speed
to 0.5 SEC/cm
speed
forms from DC
range of
necessary for
to l0
pSEC/cm
1
provides
viewing
MHz.
every
wave-
MECHANICAL
FEATURES
Carrying
molded fingergrip also doubles as tilt
stand. Locking detent each
allows adjustment of
Rear feet
face-up
wrap for
bezel over face of
dard oscilloscope camera for making
waveform
handle with comfortable
22-l/2"
support
position
and double as
power
storing
photographs.
viewing
oscilloscope in
CRT
angle.
Slotted
cord.
mounts stan-
cord
Page 7
SPECIFICATIONS
VERTICAL AMPLIFIERS
Deflection
Calibration
Frequency
Risetime
Overshoot
Ringing
Input
Input Capacity
Max.
Operating
Chop Frequency
Channel Separation
Factor
Accuracy
Response
Resistance
Voltage
Input
Modes
0.01
calibrated
quence.
!
DC: DC to l0 MHz
AC:2Hz to l0
35 nanoseconds.
3%
display.
3% or less
display.
I megohm, t 57o.
22
300
p'p.
Channel
Channel B
Dual-trace automatically
at
slower; alternate trace
cally selected
times.
2OOkHz(t2Vo).
Better than 60 dB
(CH
A and CH
V/cm to
Variable
5%
on all ranges.
or less at I @ kHz
(t3
pF
(DC +
V
A only.
all sweep times of I mSicm
B)
V/cm in I I
20
ranges
at
pF).
only.
in l-2-5 se-
between
dB)
G3
(-3
MHz
100 kHz squarewave
AC
for
@ |
dB).
squarewave
peak)
or 600
chopped
automati-
all faster sweep
kHz.
ranges.
V
and
Video Sync
HORIZONTAL
B Input)
CH
Deflection
Frequency
Input Resistance I
Input Capacity
Maximum
Voltage
X-Y Operation With
Factor .01
Response
Input 300
Vertical and
circuit
composite
chronized and
LINE
sync switched automatically
SWEEP
FRAME 0.5 SEC/cm
mSEC/cm
LINE
(horizontal
AMPUFIER
DC
22
p-p.
CH B
becomes
the
input
tion
tal
horizontal
provided
(horiz.)
:
(Horizontal
V/cm to 20 V/cm.
to I MHz ( - 3 dB).
megohm
pF
V
SWEEP
CH
(horizontal).
control
position
so that any
video waveform can be
expanded
and
TIME/CM switch.
(vertical
50
sync
(t3
(DC
position,
the
B input
sync
pSEC/cm
pulses).
(nominal).
pF).
+
AC
TIMEICM
the CH A input
Y
input
becomes the horizon-
control.
sync s€parator
portion
syn-
viewing.
for
FRAME
to
lnput through
peak)
(vertical)
becomes
The CH B
(vert.)
to 0.1
pulses).
pSEC/cm
I
or 600
switch in
the
posi-
and
of
by
V
X
SWEEP CIRCUITS
Sweep System
Sweep Time
Sweep Time Accuracy
Magnification
Sweep
Horizontal Linearity
TRIGGERING
Source
Slope
Triggering
Range
(Common
to CH A and CH B)
Triggered and automatic. In
matic mode,
without
I
calibrated
quence.
+
Obtained by enlarging the
sweep
mum
gSEC/cm.
3% or
INT
sensitivity). MODE
sourceofinternaltrigger;
signal is the
the
the
source in the
Positive
ly
AUTO.
INT: 20 Hz
EXT:
input
sigral.
pSEC/cm
<q^
CH A and DUAL
CH B signal
variable
to 0.5
ranges,
Variable
5 times from
speed becomes
sweep
less
distortion.
and EXT
triggering
CH B mode.
and negative,
level
to l0 MHz
deflection
cathode ray
DC to l0
is obtained
sweep
SEC/cm in 18
in l-2-5
between ranges.
center.
(l
V
switch selects
the CH A
source in
modes,
is the triggering
continuous-
control;
as
tube).
MHz.
pull
(min.
measured
auto-
se-
above
Maxi-
0.2
p-p
and
for
I cm
on
CALIBRATION
INTENSITY MODULATION
Voltage
Input Resistance
POWER
Input
PROBES
Model
Attenuation
Input
Connector
Tip
REQUIREMENTS
No.
lmpedances
VOLTACE
I
frequency.
TTL logic-compatible,
increases
decreases
l0 kO
120
20
approved for oscilloscopes.)
Fig.
PR-31,
Combination
l0:l = l0 megohms,
Direct
BNC
Spring-loaded,
p-p
V
square
brightness;
brightness.
(nominal).
or 240 V AC,
(3-wire
watts.
51.
PR-35, PR-36,
=
I megohm,
(t
wave
high logic
low
tlo7o,
line
cord, CSA-
PR-37.
l0: I
and direct.
18
120
hook-on tip.
5%)
at
logic
5O/6O Hz,
pF.
pF.
line
-
-
See
Page 8
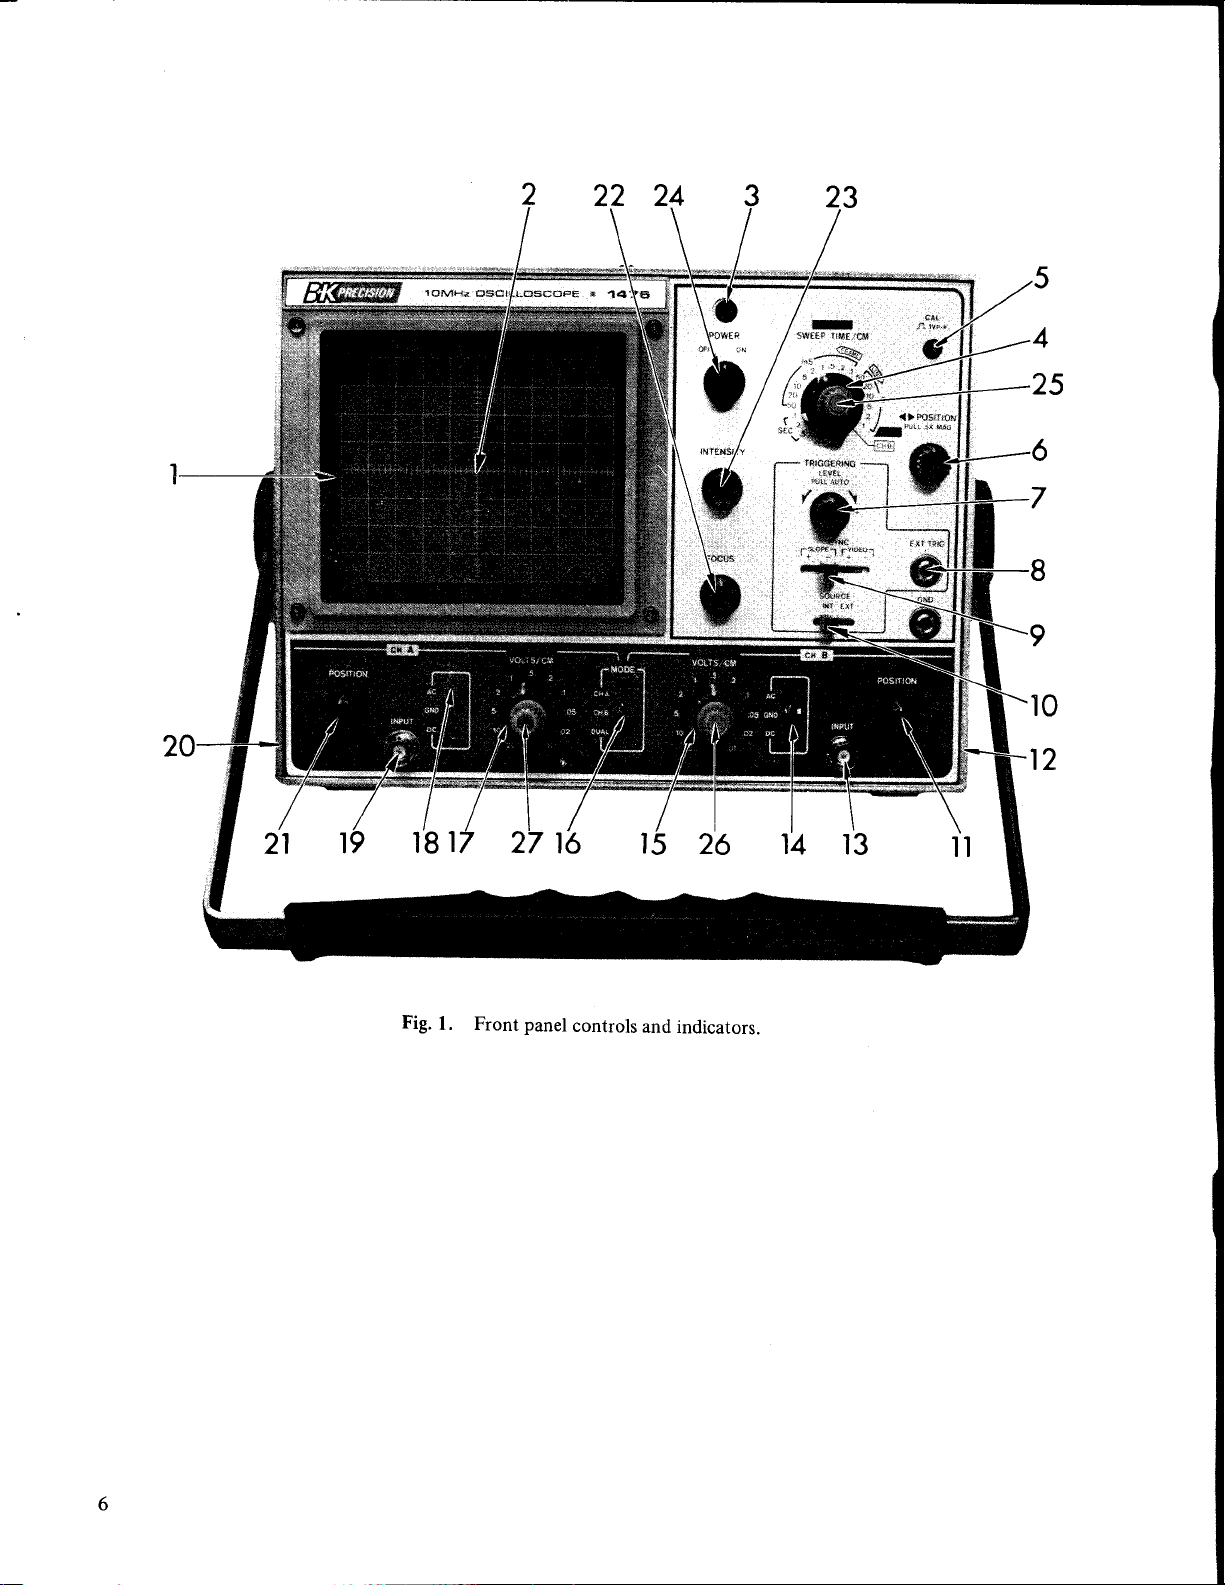
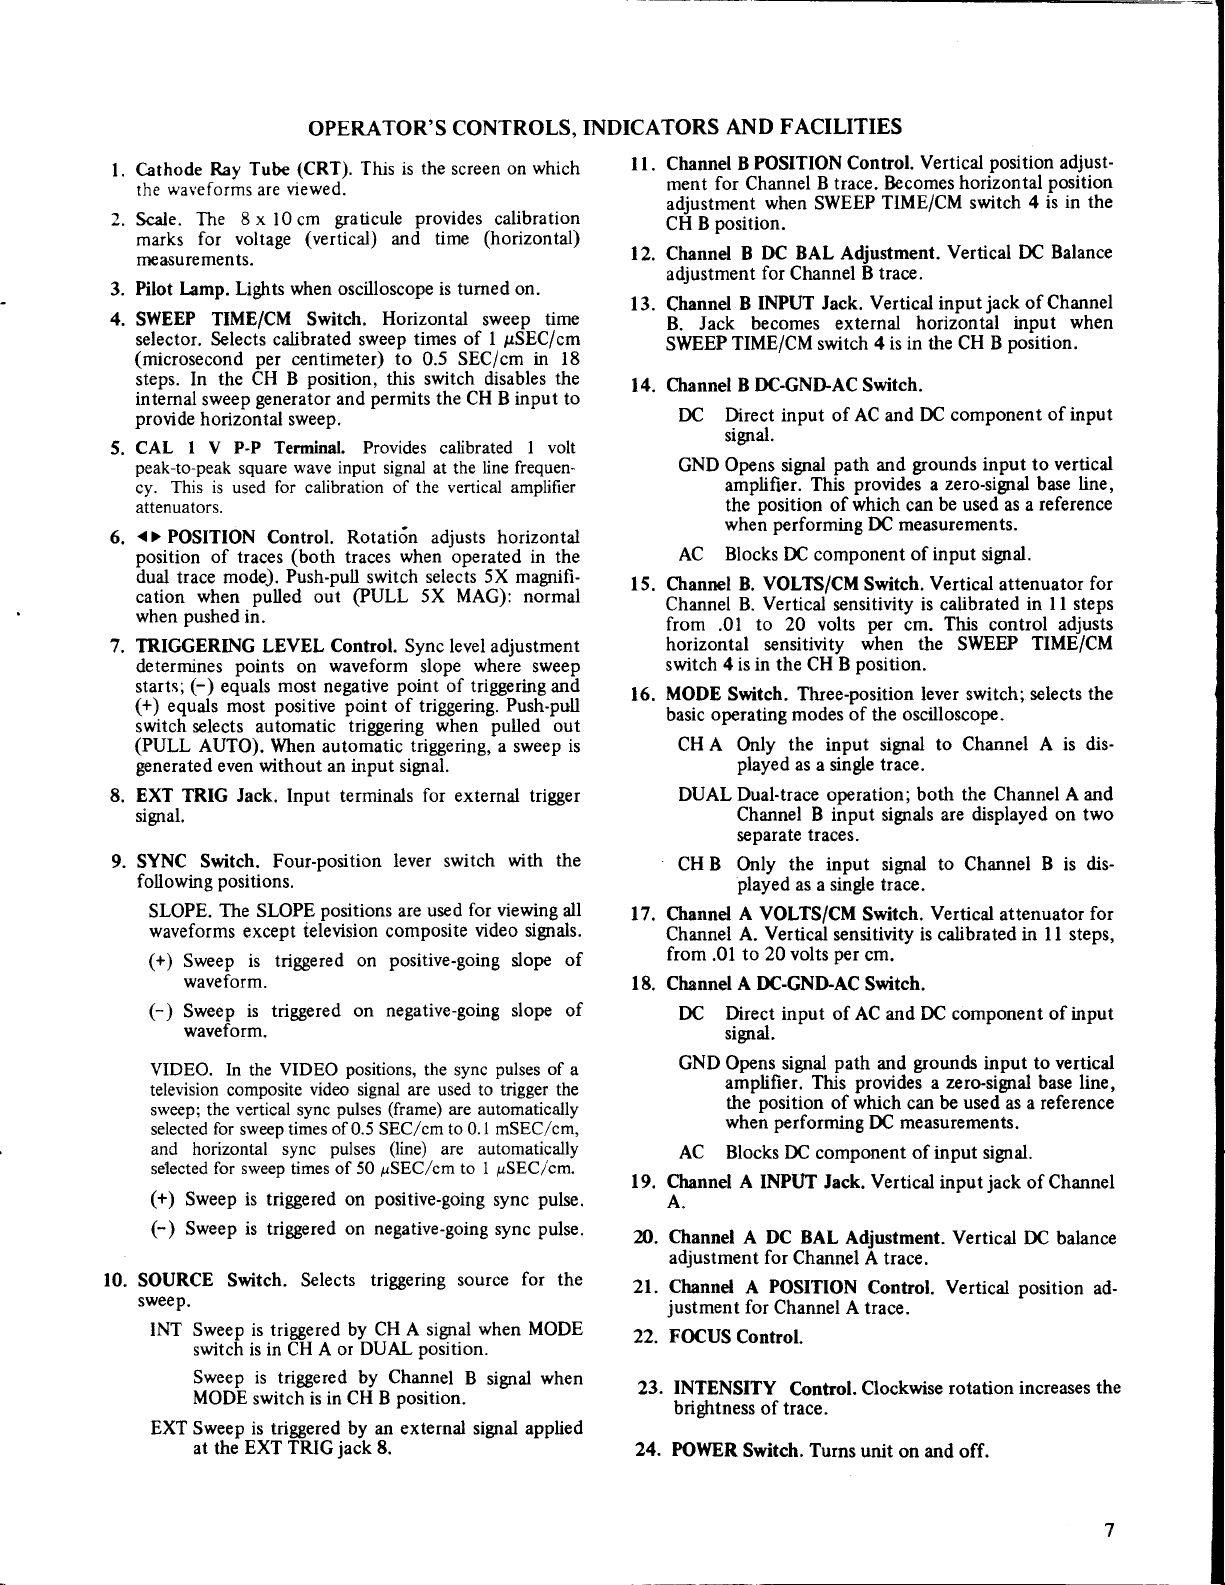
Fig.
|. Front panel
controls
7
I
9
r0
12
and indicators.
Page 9
OPERATOR'S
Cathode
l.
the
Scale. The
2.
marks
rneasurements.
Pilot Lamp.
3.
4.
SWEEP
selector. Selects calibrated sweep
(microsecond per
steps. In
internal sweep
provide
CAL
5.
peak-to-peak
cy.
attenuators.
< >
6.
position
dual
cation
when
7
TRIGGERING LEVEL Control. Sync level adjustment
determines
starts;
(+)
switch selects automatic
(PULL
generated
EXT TRIG Jack.
E.
signal.
SYNC
9.
following
SLOPE.
waveforms except television composite
(+)
(-)
VIDEO. In
television composite
10.
SOURCE
sweep.
INT Sweep is triggered by
Ray Tube
waveforms
for voltage
Lights
TIME/CM Switch.
the CH B
horizontal sweep.
|.-P Terminal. Provides
This is
POSITION
equals most
sweep; the vertical sync
selected
and horizontal sync
selected
(+)
(-)
EXT Sweep is triggered by an external signal applied
used
of traces
trace mode).
when
pushed
points
(-)
equals
AUTO).
even without an input signal.
Switch. Four-position
positions.
The SLOPE
Sweep is triggered
waveform.
Sweep
waveform.
lor
for sweep
Sweep is triggered on
Sweep is triggered
Switch. Selects
switch is in CH A or
Sweep is triggered by Channel
MODE
at the
(CRT).
viewed.
are
8 x
l0 cm
when oscilloscope is tumed on.
centimeter)
generator
wave input
square
for
Control. Rotatitin adiusts horizontal
(both
Push-pull
pulled
in.
on
most
positive point
When automatic
Input
is triggered on
VIDEO
the
sweep times
times
switch is in CH B
EXT TRIG
This is
graticule
(vertical)
position,
calibration
out
waveform
negative
positions
video signal are used to trigger the
pulses
and time
Horizontal
this switch disables
permits
and
signal at the
of the vertical amplifier
traces
switch
(PULL
triggering
terminals for external trigger
positive-going
on
negative-going slope of
positions,
(frame)
pulses
of
0.5 SEC/cm
(line)
pSEC/cm
of 50
positive-going
on negative-going
triggering source
CH A sigrral
DUAL
jack
8.
CONTROLS.
the
screen
provides
times of I
to
0.5 SEC/cm
when
selects 5X magrifi-
5X MAG): normal
slope
point
of triggering.
triggering,
lever switch
used
are
the sync
position.
position.
calibration
(horizontal)
sweep time
pSEC/cm
the CH B input to
calibrated
line frequen-
operated in the
where
of triggering
when pulled
a sweep
for
viewing all
video sigtals.
pulses
are automatically
to 0. I mSEC/cm,
are automatically
prSEC/cm.
to 1
sync
sync
when MODE
B
sigral
which
on
in
l8
the
I volt
sweep
and
Push-pull
out
is
with the
of
slope
of
pulse.
pulse.
for the
when
INDICATORS
Channel
ll.
ment
adjustment
CH
Channel B
12.
adjustment
13.
Channel
B. Jack
SWEEP
Ctrannel B DC-GNDAC Switch.
14.
DC Direct input of AC and DC
GND Opens sigral
AC
Channel B.
15.
Channel B.
from
horizontal sensitivity
switch
MODE
16.
basic
CH A Only
DUAL Dual-trace operation; both
CH B Only the input signal to Channel B is
17. Channel
Channel A.
from
18. Channel A DC-GNDAC
DC Direct input of AC and DC component of input
a
GND Opens sigrral
AC Blocks DC
19. Channel A
A.
l). Channel
adjustment for
21. Channel A POSITION
justment
FOCUS
22.
INTENSITY
23.
brightness
FOWER
24.
FACILITIES
AND
POSITION Control.
B
for Channel
position.
B
B INPUT
becomes external
TIME/CM switch 4 is
signal.
amplifier.
the
when
Blocks
to
.01
4 is in the CH B
Switch. Three-position lever switch;
operating modes of
played
Channel B input signals are
separate
played
A VOLTS/CM
to 20 volts
.01
sigral.
amplifier. This
the
when
A DC BAL
for
Control.
Switch. Turns
B trace. Becomes
when SWEEP
DC BAL Adjustment.
for
Channel B
Jack. Vertical input
path
provides a zero-signal
This
position
VOLTS/CM
Vertical
Vertical
position
INPUT Jack. Vertical inputjack ofChannel
of trace.
ofwhich can
performing
DC component
sensitivity
20 volts
position.
the
input signal
as a single
traces.
as a single trace.
sensitivity
per
path
provides
which
of
performing
component of input signal.
Adjustment. Vertical
Channel A trace.
Channel A trace.
Control.
Vertical
TIME/CM switch
Vertical
trace.
horizontal
in the CH B
component
grounds
and
DC measurements.
Switch.
per
when the
the
Switch.
cm.
Switch.
and
DC
Control.
Clockwise
unit on and
be used as a
of input
Vertical
is calibrated
This
cm.
oscilloscope.
to Channel A is dis-
trace.
Vertical
is
calibrated
grounds
a zero-sigral base line,
can be
measurements.
Vertical position
rotation increases
position
horizontal
jack
input to vertical
signal.
control
SWEEP
the Channel A and
displayed on two
input to vertical
used
off.
adjust-
position
in the
4 is
Balance
DC
of Channel
input when
position.
of input
line,
base
reference
attenuator
in I I steps
attenuator
in I I steps,
as a reference
DC balance
for
adjusts
TIME/CM
selects the
dis-
for
ad-
the
Page 10
VARIABLE
25.
the extreme
is calibrated.
VARIABLE
CH B
26.
adiustment.
In-the extreme
attenrator
CH A VARIABLE
n.
adjustment.
In-the extreme
attenuator
Control.
Fine sweep
clockwise
Control.
Fine control
clockwise
is calibrated.
Control.
control
Fine
clockwise
is calibrated.
of
(CAL),
B
CH
B vertical
CH
position
(CAL) position,
A
CH
A
of CH
(CAL)
time adjustment.
the sweep
vertical
attenuator
In
time
sensitivity'
vertical
the
vertical
attenuator
vertical sensitivity-
position, the vertical
29.
Line Cord
AC
loscopes.
(See
Probe
30.
combination
for
use
designed
input impedance
capable
Vector Overlay
31.
for
of operation
vectorscope
(See
Fig. 3).
l0: l/Direct
with this
for use with
of
(Not
operation.
Fig. 2). CSA-approved
The B & K-Precision
probes
oscilloscope.
an oscilloscope
I megohm
up to 10
Shorvn).
have been
However,
having a nominal
shunted by
MHz, can be
Interchanges with
for oscil-
ModelPR-31
designed
probe
any
pF
35
and
used.
scale
INT MOD
28.
Jack. Intensity
modulation
DC BALANCE CONTROL
(One
on each
1.
side
PULL
)
APART
(Z'axis) input.
Fig.
2. Rear
CRT
ADJUSTMENT
COMBINATION
AND
CORD
and side
panel
facilities.
ROTATION
FEET
WRAP
2829
t-r,_tfj1-
--
2. ROTATE 180"
PUSH
3.
1O:1
ATTENUATION
BACK
TOGETHER
Fig.
3.
PROEE
hobe
P ROBE
COMPENSATION
(PR-31
)
probe
Adlust
square wave display while observing
from
signal
COMPENSATION ADJUSTMENT
ADJUSTMENT
compensation
cal J1 1V
details.
p-p
for
ACK.
(PR-35)
best
Page 11
OPERATING
INSTRUCTIONS
INITIAL STARTING PROCEDURE
i Set PO\l ER switch 24 to OFF
l. Connect
3. Set
control
their ranges.
PUII
4.
position.
5. Set
DC-GND-AC
6. Set MODE
single-trace operation
trace operation.
7. Tum on oscilloscope
ON
8. Wait
warm
mode)
9. If
INTENSITY
observed.
10. Adjust FOCUS
for
I 1. Readjust
center the
12. Check for
and 20
CALIBRATION
ments
The oscilloscope
measurements.
power
cord 29 to a I
CH A
position.
no trace appears, increase
the
POSITION
I I
and<>POSITION
TRIGGERING
CH A DC-GND-AC
switch
switch 16
Pilot lamp 3 will light.
few
a
seconds for
up. A trace
should
thinnest,
position
traces.
as described in the MAINTENANCE
require
(two
appear on the face of
control 23
control 22and INTENSITY
sharpest trace.
controls 6,21 andl I if necessary,
proper
portion
checking
is now ready
LEVEL
14
or the DUAL
by turning
adjustment of
l7-volt,
control
control 6
control 7 to
switch 18
to the
GND
to the CH A position
the cathode ray
traces
if operating
(clockwise)
until the trace
of this
periodically.
only
position.
50160 Hz outlet.
21,
CH B
to the centers of
and CH B
positions.
position
POWER
DC
manual. These
for making
switch
tube
in the DUAL
the CRT.
the
BAL controls 12
POSITION
the AUTO
for
for dual-
to
24
(CRT)
to
setting of
is easilv
control23
to
AND
adjust-
waveform
the l0:l
capacitance
impedance
when
J.
SetCH
only the AC
most measurements
being measured
the
and the DC reference,
frequency
The GND
ground
readings.
4.
Connect
equipment
the
measured.
a. If
b. The
5.
Set CH A VOLTS/CM
gives
vertical deflection.
probably
concemed
speed,
desired
duces
jicient
position
in the DIRect
(low-capacity
possible,
A
DC
point
the
less AC
former to prevent
measurement
when
2 to
which presents
at least I
tigger signal
to decrease circuit loading.
DC-GND-AC
component
position
reference
ground
number
includes a large DC
for measuring
waveform
position
clip
under
in the
peak-to-peak
using the DIRect
be
test. Connect
circuit
equipment
powered
(two
6
cm
unsynchronized.
with
adjusting synchronization
of waveforms.
cm vertical
and I megohm with
is required only when
is required, such
WARNING
should not exceed
to synchronize
position.
position)
switch
and
(below
of
under test is a transformer-
item, use
dangerous electrical
to six large
The
l8 to
(this
the
is
must
be used if the
both the
any
and
Hz)
5
probe to
where the waveform
voltage at the
switch 17
display on the
a
chassis
the
an
position
The remaining
stable display
Any signal
deflection
l20pF shunt
The higher input
should
AC for measuring
normal
component). Use
AC component
time a very low
is
to be observed.
as for DC voltage
ground
tip of the
isolation
point
600 volts
of the
position
to
a
squares on the scale)
develops suf-
the
sweep.
be used
position
a zero-signal
shock.
probe.
screen will
and
showing
point
of the
probe
is
to be
trans-
of
that
steps are
sweep
pro-
that
for
to
the
Never
allow
remain
few
seconds.
burned. Reduce
motion
SINGI,E-TRACE
Either
single-trace
following
the
Perform
l.
with
the
connect the
The following
B & K-Precision Model PR-3
For
2.
all except low-amplitude
are set for
(below
forms
DIRect.
DIRect, or
to
input
impedance
a small spot of
stationary on the
The screen mav
by
Channel A or Channel
operation. For simplicity,
instructions.
the
MODE
See Fig. 3
intensity
causing it to
WAYEFORM
steps
switch
probe
instructions assume
l0: I attenuation. For low-amplitude
volt
0.5
vice
with
CAUTION
high brilliance
screen for
become
-or
sweep.
OBSERVATION
of
the "Initial Starting Procedure"
16 in
the
to the CH A
cable
i combination
peak-to-peak),
for
changing
versa.
only l8
The
probe
more
permanentlv
keep
ihe
spot
B
can be used for
Channel A
CH A position.
INPUT
the
waveforms,
set the
the probes
has
shunt
capacitance
a l0 megohm
pF
than a
is used in
jack
use of the
probes.
the
probe
from
to
iir
Then
19.
probes
wave-
for
l0:l
in
6.
Set SOURCE
provides
observed
waveforms
external
an
switch
cable should
to the external
Set SYNC switch 9 to the
for observing
to
all
the
the
negative-going
unknown, the
8.
Readjust TRIGGERING
synchronized
the
that will
in the
disappear
sweep,
amplitude waveforms.
should
the SLOPE
other
sweep is to
(-)
control may
such
switch l0 to
internal
is
should
types
position
produce
center
if there
sync
also used to
be viewed
sync
placed
be
be connected from
sync source.
television
(+)
or SLOPE
of waveforms. Use
be triggered
if the
wave.
SLOPE
display
be
a sweep,
portion
when
as
INT
the
that the waveform
so
trigger the
source is required,
without
pushed
is inadequate
using internal
in the EXT position
the EXT
VIDEO(+)
composite
by a
sweep is to
If the type
(+)
position
LEVEL control
which
of
measuring
If no sweep
video
(-) positions
the
positive-going
be triggered
may be used.
jitter.
in and rotated
its
As a
is usually
range.
signal
DC or
or
of waveform
can be obtained,
position.
sweep. Most
sync. When
the
SOURCE
and
jack
TRIG
(-)
positions
waveforms
for
observing
(+)
position_if
wave,
7 to obtain
starting
The trace
to trigger
extremely
point,
to
any
somewhere
This
being
or
or
by
is
point
will
the
low
a
8
a
a
Page 12
pull
the
control
out
(PULL
AUTO) for
triggering.
Set SWEEP
9.
of waveforms. This
portion
a
progressively
is
This
because the
repetition rate
TIME/CM switch 4
control may be set for viewing
of a waveform,
dimmer as a smaller
sweep speed
does not change.
for
the desired
the
but
portion
increases
trace becomes
but the sweep
NOTE
When
using very
rates, the operator
fast
sweep speed
may
low repetition
at
wish to operate
intensity control toward maximum. Under
conditions, a
extreme left of the
retrace "pip"
This does
trace.
may appear at the
not in any way
affect the oscilloscope operation and may be
disregarded.
10. After
obtaining
9,
step
it is sometimes desirable to make a final
adjustment
(-)
The
waveform
(+)
direction
at
direction selects
the desired number of waveforms,
of
the TRIGGERING LEVEL
which
the most negative
selects
sweep triggering will occur
positive point
most
the
automatic
number
is
displayed.
with the
these
control 7.
point
and the
only
as in
on the
on the
waveform
control
desired
I l. For
outward
a close-up view of a portion
which
at
may
be adjusted to start the
portion
of the waveform.
on the<)POSITION
the sweep by a factor
displays only
portion
a
control clockwise,
center, turn the
on the
control to return the
non-magnified
CALIBRATED
Peak voltages, peak-to-peak
-
voltages
easily
Dual-Trace
of a specific portion
and
accurately
Triggered
Adjust
l.
controls
waveform to
2. Set
CH A
vertical
deflection
center
the
the
to
left
and to
control
condition.
VOLTAGE
Sweep
previously
as
be measured.
VOLTS/CM
limits of the vertical
sweep triggering
of the
will occur.
sweep on
waveform,
The
any
pull
control 6. This expands
(5X
of five
partion
magrification)
of
the
sweep. To view
and
of center, turn the<>POSITION
portion
view
counterclockwise.
sweep to
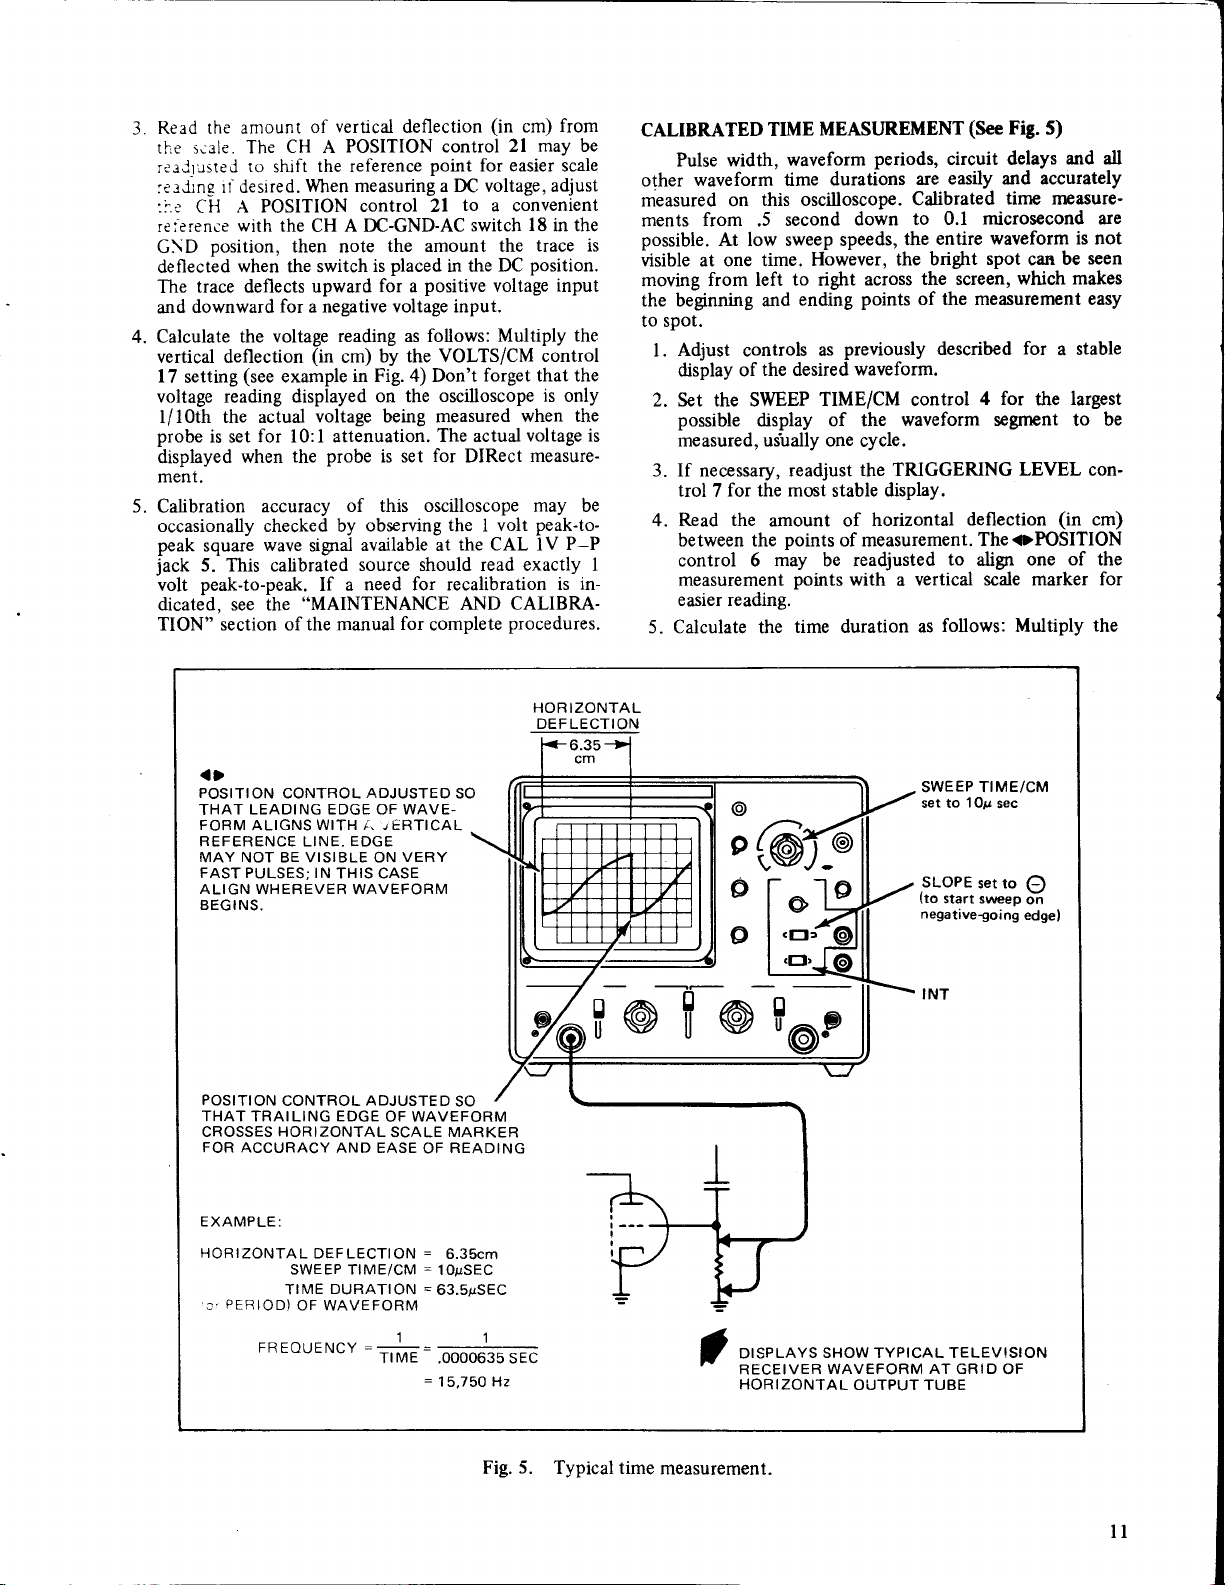
MEASLJR-EMENT (See
voltages,
of the
measured
complex
on the
to
the right of
Push
inward
the normal,
Fig. a)
DC voltages
waveform
Model
1476
and
Oscilloscope.
instructed
switch 17 for
possible
without exceeding
to
display the
the maximum
scale.
are
the
POSITI
ON CONTROL ADJUSTE
SO THAT
FORM
A HORIZONTAL
BOTTOM OF
ALIGNS
EXACTLY
REFERENCE
EXAMPLE:
VERTICAL
PROBE
PEAK-TO-PEAK
.} POSITION
TOP OF WAVEFORM
VERTICALSCALE MARKER
AND
WAVE-
DEF
VOLTAGE/CM
ATTENUATION
WAVEFORM
CONTROL ADJUSTED
EASE
WITH
LECTI ON
.O2Y x
D
LINE
4.2
READING
OF
4.2cm
.O2
.084V
0.84V
CROSSES
v
10
SO THAT
CENTER OF
FOR ACCURACY
qTo1"t
t
VOLTS/cm
SET
.o2v
PROBE
TO
10:1
ATTENUATION
l0
Fig.
4.
Typical
voltage measurement.
Page 13
vertical
Read the amount
3.
the s;ale. The
rea.ltusted
:erJrng
::.r'
reierence
G\D
deflected
The
and
4. Calculate
ri desired.
CH A
with the
position,
when the switch
trace deflects upward
downward
the voltage
vertical deflection
setting
(see
l7
ro
of
CH A
the reference
shift
When measuring a DC voltage, adjust
POSITION
CH A DC-GND-AC
then note
for a negative voltage input.
(in
example
voltage reading displayed
l/l0th the actual
probe
is
set
displayed
when
voltage being measured
for l0: I attenuation.
probe
the
ment,
5. Calibration
accuracy
occasionally checked by
peak
square
jack
5. This calibrated
peak-to-peak.
volt
dicated, see the
wave
signal
If a
"MAINTENANCE AND
TION" section of the manual
deflection
POSITION control
point
for easier scale
control 2l
to
switch
the amount the
placed
is
for a
in the
positive
reading as follows:
VOLTS/CM control
by the
cm)
in Fig.4) Don't
on the
forget that the
oscilloscope is only
(in
a convenient
DC
voltage
Multiply the
from
cm)
2l may be
l8
in the
trace is
position.
input
when the
voltage is
measure-
is set
The actual
for
DIRect
of this oscilloscope may be
observing
available at
the I volt
the CAL lV
peak-to-
P-P
source should read exactly I
need for recalibration
is in-
CALIBRA-
for
complete
procedures.
MEASUREMENT
CALIBRATED
Pulse width,
waveform time
other
measured on
ments
from
possible.
visible at one time.
moving
the beginning and
TIME
waveform
this oscilloscope.
second
.5
At low sweep speeds,
However,
from left to right
ending
to spot.
Adjust
l.
controls
display of
2. Set the SWEEP
possible
display
as
the desired
TIME/CM control
of the
measured, usually one
3. If necessary, readjust
trol 7 for the most
Read the
4.
between the
control 6
measurement
amount of
points
may
be readjusted
points
easier reading.
5. Calculate the
time duration
(See
Fig. 5)
periods,
durations
down
across
points
previously described
circuit delays
easily and accurately
are
Calibrated
to 0.1
entire
the
the bright
tinp rneasure'
microsecond are
waveform is not
spot
the screen, which
the measurement easy
of
can
for
waveform.
4 for
the
waveform
segment
cycle.
the TRIGGERING
display.
stable
horizontal
of measurement.
to aligrr
LEVEL con-
deflection
ThecPOSITION
one of the
with a vertical scale marker
follows: Multiply
as
and all
seen
be
makes
stable
a
largest
to be
(in
cm)
for
the
<)
POSITION
THAT
FORM
REFERENCE LINE. EDGE
MAY NOT BE VISIBLE ON
FAST PULSES; IN
ALIGN
BEGINS.
POSITION
THATTRAILING EDGE
CROSSES HORIZONTAL
FOR ACCURACY
EXAMPLE:
HORIZONTAL
c.
CONTROL
LEADING EDGE OF WAVE-
ALIGNS
WHEREVER WAVEFORM
CONTROL
SWEEP
TIME
PEBIOD)
OF WAVEFORM
ADJUSTED
WITH l. r ERTICAL
THIS CASE
ADJUSTED
AND EASE
DEFLECTION
TIME/CM
DURATION
SO
VERY
OF WAVEFORM
SCALE
SO
MARKER
READING
OF
=
6.35cm
1 OpSEC
=
63.SpSEC
HORIZONTAL
DEF LECTI ON
O.JJ
cm
f
ol-ol"t
SWEEP TIME/CM
'l0l,l
set to
SLOPE
tto start syveep
negativejoing
INT
sec
set to
edgel
Q
on
FREouENCY -
=:-
IIME
=
.0000635 sEc
15,750 Hz
Fig.
5.
Typical time
DISPLAYS
RECEIVER
HORIZONTAL
measurement.
SHOW TYPICAL TELEVISION
WAVEFORM AT GRID
OUTPUT TUBE
OF
ll
Page 14
horizontal
deflection
switch 4 setting
when the
divided
5X magnification is used, the result must be
by 5 to obtain the actual time duration.
6. Time measurements
especially
started
waveform
true when measuring delays. The
by a
measured in a subsequent
measurement
and the
subsequent
(in
(see
example in Fig. 5).
often
sync sigral
of the
display
waveform.
cm) by the SWEEP TIME/CM
require external
from
one
circuit. This allows
between the
perform
To
urements using external sync, use the following
a. Set the
b. Connect a
source
c. Set the SYNC
position
d. Readjust
necessary for
e.
If measuring
start of the
7. Another excellent method for
with
dual-trace operation. The
SOURCE switch l0 to the EXT
from the EXT TRIG
cable
of sync sigral. Use a
switch
for
proper polarity
the
short shielded cable.
9 to the
SLOPE
for the
the TRIGGERING LEVEL
a stable
a delay,
sweep
waveform.
measure
to the
the
start of the waveform.
measuring
procedures
the "DUAL-TRACE APPLICATIONS"
manual,
EXTERNAL HORTZONTAL
For some measurements,
tion sigral is required.
measurement,
tion
and the X input
horizontal
phase
measurement,
where the Y
input may be a sinusoidal wave,
input must be 10 mV
voltage of
any
satisfactory operation. To
the following
use
This is also referred to
provides
or an external sweep
per
cm
mV or
100
use an external horizontal
procedure:
1. Set the SWEEP TIME/CM
the CH B
2. Use
Channel B
3. Adjust the
CH B VOLTS/CM
position.
the Channel A
probe
for
amount of horizontal
probe
the horizontal input.
control 15.
4. The CH B POSITION
horizontal
control
position
is disabled.
control, and the
input
control I I
INPUT
extemal
an
provides
horizontal
of
deflection or
greater
switch
for
the vertical
(X-y
OPERATTON)
horizontal
is sufficient for
4 fully
deflection with the
now serves
NOTE
Do NOT
X-Y operation.
to adjust
5. All
Z.NilS
.The
modulated
rygks 99
INT MOD
oscilloscope will govide
of the trace.
horizontal
sync
controls
INPUT
trace
(Z-aas
required.
(intensity
See Fig.
use
the
Use
displayed
input) where
A TTL
modulation)
6.
PULL
5X MAG
the
CH B VOLTS/CM
gain.
are disconnected
on the
screen
frequency-
compatible
allernate
sigrral
j
ack 24 on
brightness
control durine
and have
may
t2
Remember,
sync. This
sweep is
circuit and the
pulse
sync
such meas-
steps:
position.
jack
8 to the
(+)
(-)
or
sync signal.
control 7 if
from
time
the
time delays is
given
are
in
section of the
deflec-
as an X-Y
vertical
deflection.
such
deflec-
The
for
as
voltage. This
greater;
thus
input,
clockwise
to
input and the
the
as
POSITION
<>
controT
no effect.
be intensity
or
time-scall
applied
th-e-rear
and
at the
of
the
blanking
is
f
\
l
t
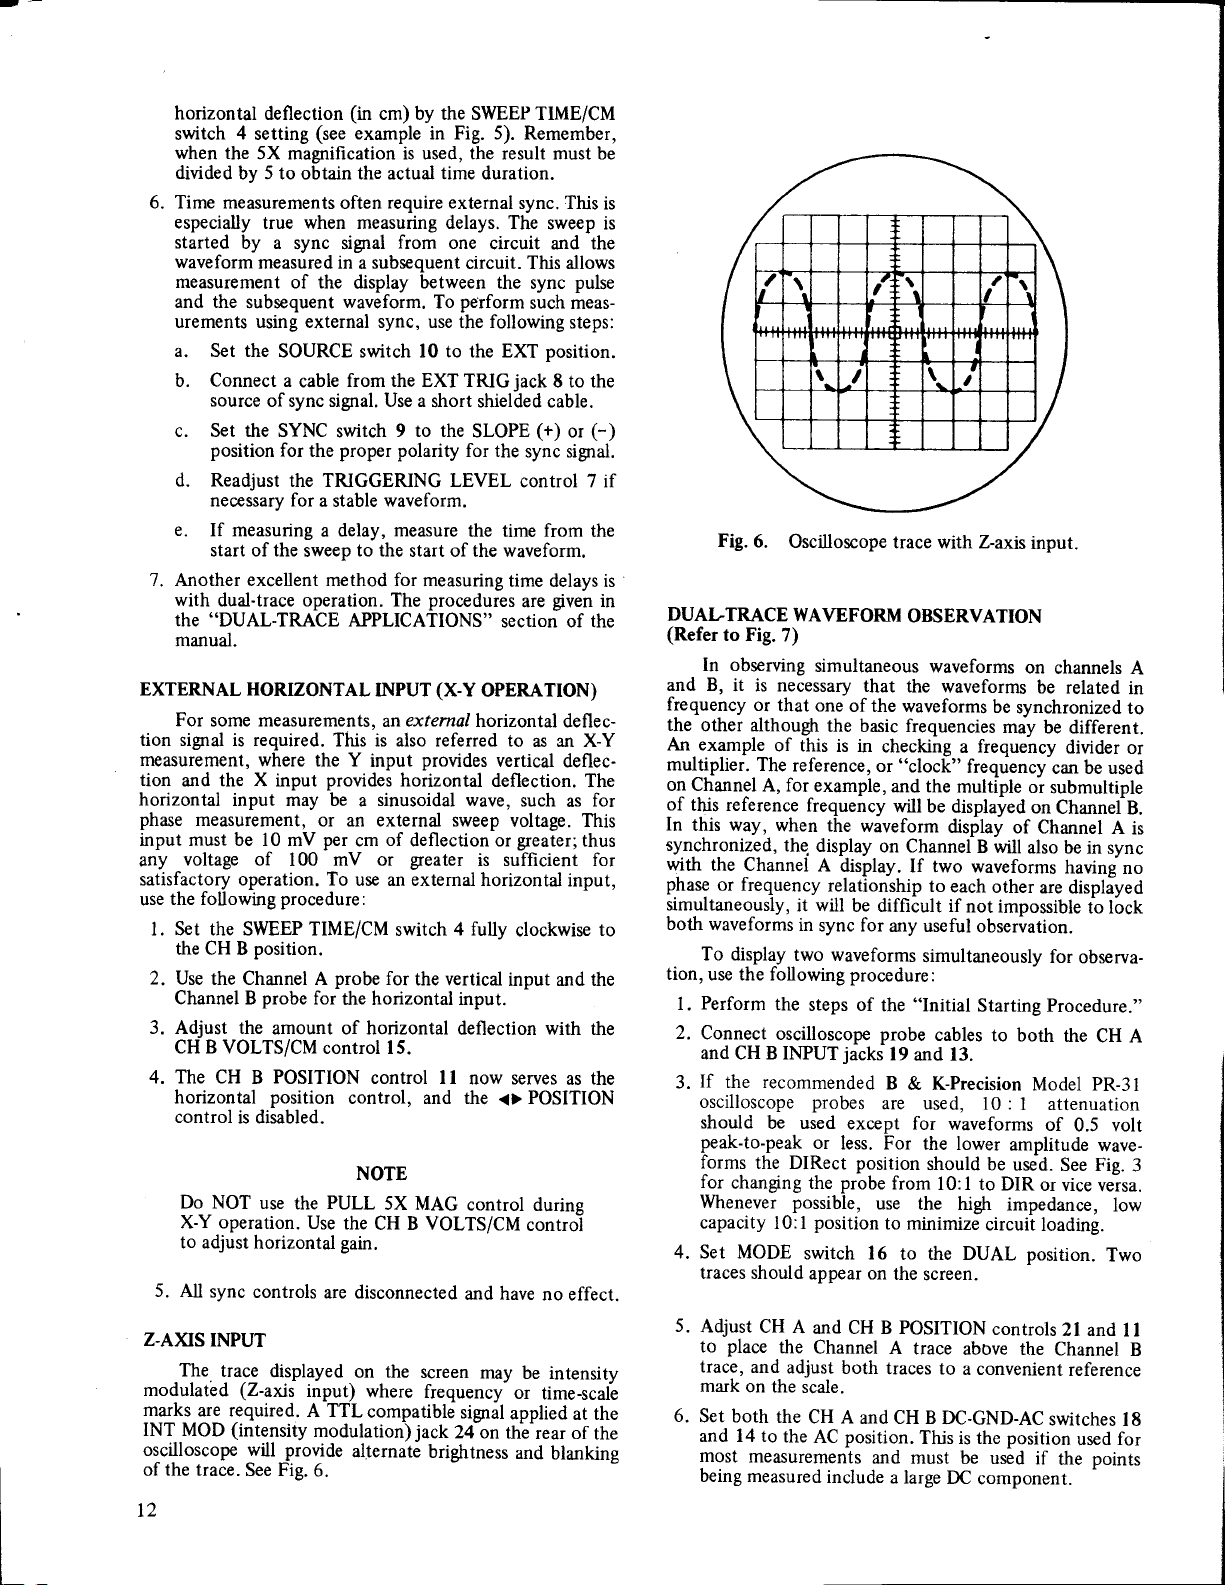
Fig.
6.
Oscilloscope
DUALTRACE
(Refer
to Fig.
In observing
and B,
frequency
the
other although
An example
mulliplier.
on Channel
of
this reference
In
this way,
synchronized,
with
the Channel
phase
or frequency
simultaneously,
both
waveforms
To display
tion,
use the following procedure:
Perform
l.
2.
Connect
and CH B IMUT
If
the recommended
3.
WAVEFORM
7)
simultaneous
it is necessary
or
that one
the basic frequencies
of this
The
A, for
is in
reference,
example,
frequency
when the
thq
display
A
display.
relationship
it will
in
sync for
two waveforms
the
steps of
oscilloscope probe
jacks
oscilloscope probes
should
peak-to-peak
forms
for
be used
except for
or
less. For
the DIRect position
changing the
probe
Whenever possible,
capacity l0: I
4. Set MODE
traces should
5.
Adjust
place
to
trace,
and
mark
on the
6.
Set both
and 14 to
most
measurements
being measured
position
switch 16
appear on
CH
A
and CH B POSITION
the
Channel
adjust
both
scale.
the
CH A
the
position.
AC
include
't
t
I
t
\
trace with Z-axis
OBSERVATION
waveforms
that
the waveforms
of the
waveforms
checking a frequency
or
"clock" frequency
and the
will
be displayed
waveform
on Channel
If two waveforms
to
be difficult if
any useful
simultaneously
the "Initial
19
and 13.
B
& K-Precision
are used,
the lower
should be
from
use the
to minimize
to the DUAL
the
screen
A
trace
traces to
and CH B
This is the
and must
a large
t
\
I
t
t
input.
on
be
be
synchronized
may
be different.
can be used
multiple
or
submultiple
on
display
each
of Channel
B will
other
also be in
are displayed
not impossible
observation.
for
Starting Procedure."
cables
to both
Model PR-31
10 :
waveforms
I attenuation
of
amplitude
used.
l0:l
to DIR
high
or vice
impedance,
circuit
loading.
position.
controls
above the
a convenient
DC-GND-AC
switches
position
be used
DC
if
component.
channels
related
divider
ChanneiB.
A
sync
having
no
tb lirck
observa-
the
CH A
0.5 volt
wave-
See Fig.
veisa.
low
Two
2l and
ll
Channel
reference
l8
for
used
points
the
A
in
to
or
is
3
B
Page 15
gound
Connect
g:ound
-.i
*aveiorms
*aveform will
the
the equipment
of
probes
the
are to be measured. The sipal to which the
be synchronized
Channel A input
to
for
of the
clips
under
points
in the
intemal sync operation.
WARNING
the equipment under test is a transformer-
a. If
less AC unit. use an isolation transformer to
prevent
b. The
dangerous
peak-to-peak
measurement should not
probe
the
R
Set the VOLTS/CM controls
B to
and
deflection.
is
position
a
The displays on the screen will
unsynchronized. The
those outlined for single-trace operation, describe
to
procedure
the
electrical shock.
voltage at the
in the DIR
used
that
remaining steps,
for
obtaining
exceed
l5
gives
displays.
Set the SOURCE switch
9.
provides
internal sync so that
l0 to
the Channel A waveform
being observed is also used to
in dual-trace operation, a sync source
point
measurement
set the SOURCE switch to the EXT
case
position
to
8
the sync source.
the SYNC switch
Set
10.
positions
waveforms, or
positions
and connect a cable
for observing
for observing
for Channel A is required. In this
from the EXT TRIG
9 to the VIDEO(+) or
te.-vrsion composite video
to the SLOPE
other types
all
probes
to the
test.
Connect
circuit
must
be applied to
600
the tips
where the
point
volts.
chassis
of
position.
17 for
and
Channels A
2 to 3 cm vertical
probably
although similar
stable,
the
synchronized
position.
INT
trigger the sweep.
other
than the
(external)
(+)
or SLOPE
waveforms.
of
the
if
be
This
Often
jack
(-)
(-)
(+)
Use
the
positive-going
a
sweep
I l.
Adjust
stable, synchronized sweep.
control
produce
will
the
center
if there is inadequate signal
when measuring
as
no sweep can be obtained,
positions
if the sweep is
wave, or to the
is
triggered by a negative-going
to be
TRIGGERING LEVEL
may be
pushed
a sweep,
portion
in and
which is usually somewhere
of its range. The
extremely low amplitude signals. If
(-)
control 7
As a
rotated to
trace will disappear
to
trigger
pull
out the control
AUTO) for automatic triggering.
t2.
Set SWEEP
of waveforms. This
portion
a
progessively
13.
After obtaining the desired number of
TIME/CM
switch
control
of a waveform, but the trace becomes
dimnrer
a smaller
as
step 12, it is sometimes
for the
4
may be set
portion
desirable to make a final
adjustment of the TRIGGERING
(-)
The
point
will occur
positive point
triggering will occur. The
start the sweep
direction of rotation selects
on the sync waveform at
and
on
the
the sync
direction selects the most
waveform
(+)
control
on
any desired
which
may be
portion
waveform.
The obsewed waveforms of
14.
expanded
be
on the <>POSITION
rotated
be
left
desired.
right extremes of
and
Push
by a factor of 5 by
control
clockwise or counterclockwise
inward on the control to retum the
Channels A and B can
This control can then
6.
waveform
the
sweep to the normal, non-magrrified condition.
Calibrated voltage measurements,
15.
calibrated
urements and operation with Z-axis
to be triggered
position
if the
wave.
to obtain a
any
the
point,
point
sweep,
that
such
starting
(PULL
desired number
for
viewing
only
is displayed.
waveforms
LEVEL
the
most
sweep
which
at
as
control 7.
negative
triggering
sweep
adjusted
of the sync
pulling
outward
to
view the
displays as
time meas-
input are identical
by
the
in
in
to
""o
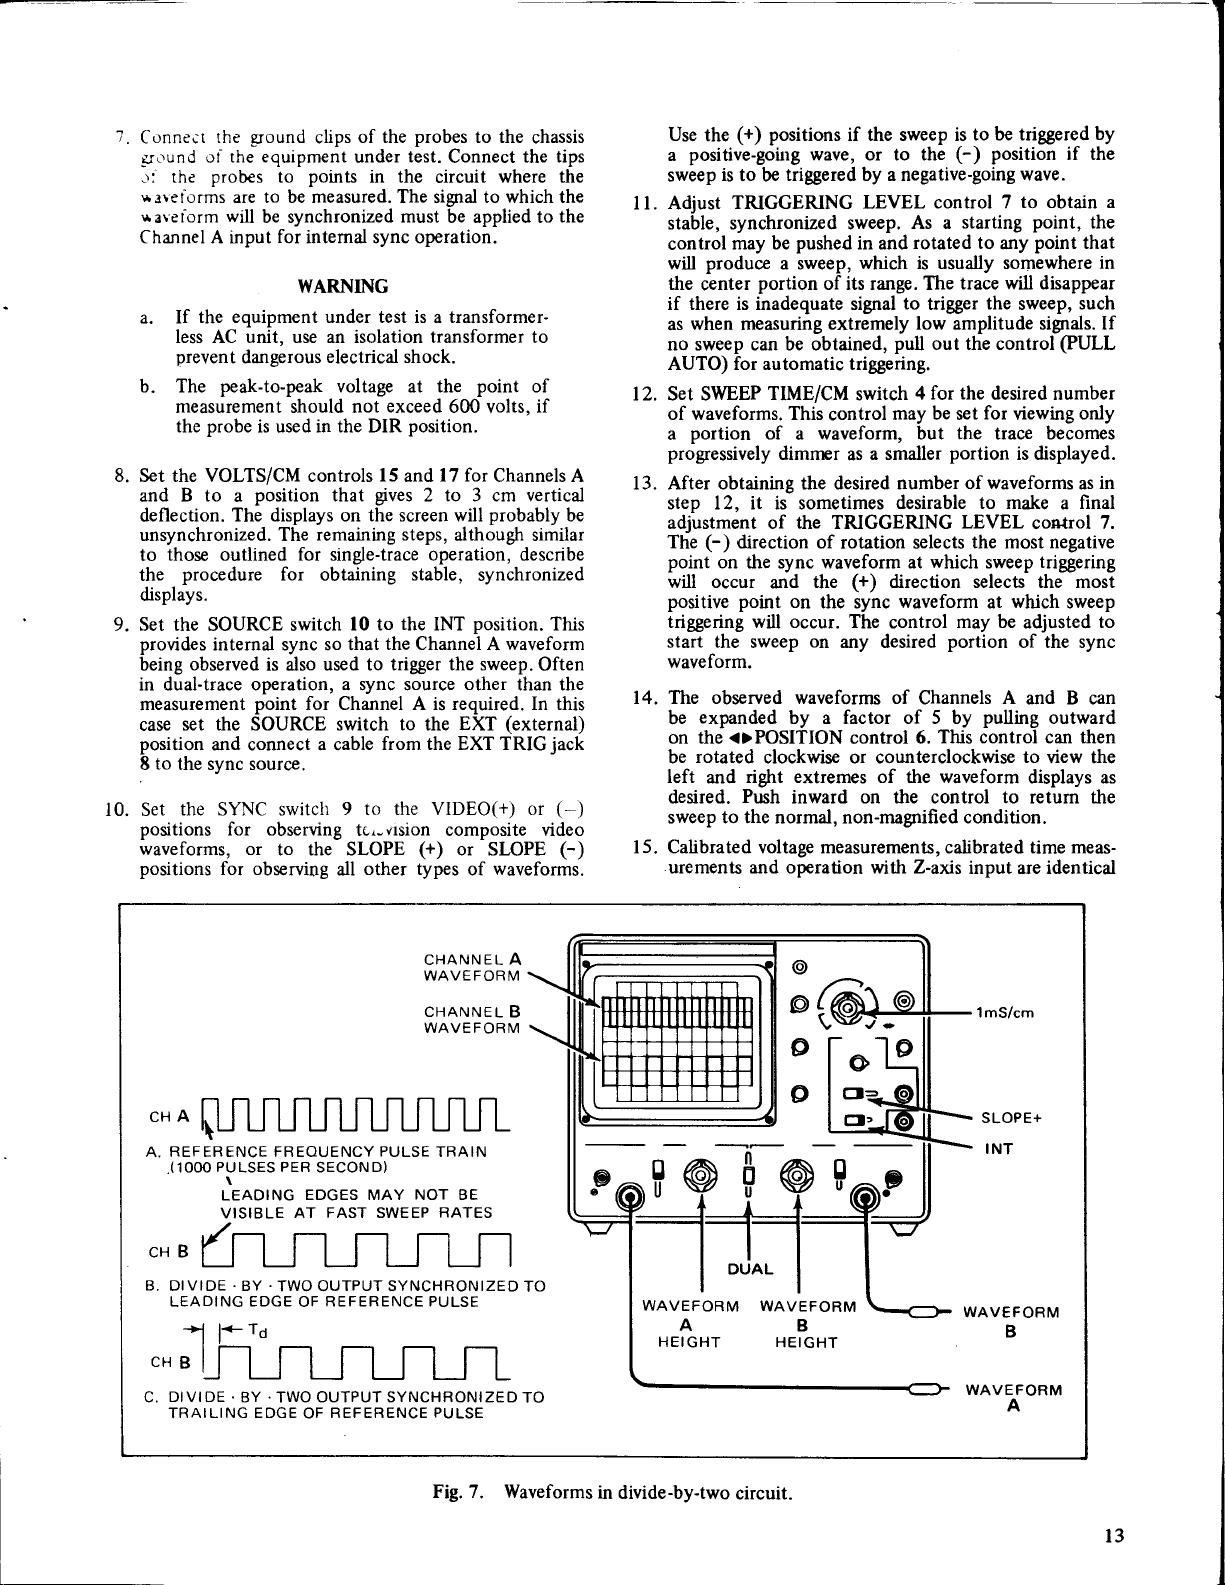
A. REFERENCE FREOUENCY
a",
B.
PULSES PER
.(1OOO
LEADING
VISIBLE
DIVIDE
LEADING
.BY .TWO
SECOND)
EDGES MAY NOT BE
AT FAST SWEEP
EDGE
OUTPUT
REFERENCE PULSE
OF
I l*ra
."t
l
DIVIDE
C.
TRAILING
.BY .TWO
EDGE
OF
OUTPUT SYNCHRONIZED
REFERENCE
CHANNEL A
WAVEFORM
filii,t?3Hfi
PULSE
TRAIN
RATES
SYNCHRONIZED
PULSE
Fig. 7. Waveforms
TO
TO
WAVEFORM
A
HEIGHT
in
divide-by-two
@
@
o
o
WAVEFORM
B
HEIGHT
circuit.
l mS/cm
SLOPE+
INT
WAVEFORM
B
WAVEFORM
A
l3
Page 16

previously
those
to
Either the
Channel
controls can be
described
or Channel
A
used as
required
the horizontal sweep controls
amplitude or
either
done
the DUAL
reverting
positions
CH B
DUAL.TRACE
time
interval
using the
by
position of the
to
single-trace
the
of
dual display
operation,
MODE switch.
APPLICATIONS
INTRODUCTION
most obvious and
The
the dual-trace oscilloscope
viewing
or
voltage,
"Cause
circuit
tions of
detail
simultaneously
phase-related,
such as in
and Effect"
desigrer
or
the dual-trace
to familiarize the
or
digitd circuitry.
the
of this oscilloscope.
FREQUENCY
Fig. 7
divide-by-two
"clock"
outputs
the settings
waveforms. In addition
these
the TRIGGERING
A and Channel
required
waveform levels
7, the
waveform may be
B
In Fig. 7C
the case
DTVIDER
illustrates the
circuit.
pulse
train. Fig. B and
of the divide-by-two circuitry.
of specific
LEVEL control,
vertical
B
produce
to
suitable
the divide-by-two
where the output circuitry
going waveform. ln this case,
shifted
frequency
pulse
with respect
pulse
width.
by a
yet
is that it
waveforms that are
twc
that have
waveforms
repairman. Several
oscilloscope
further in the basic operation
user
WAVEFORMS
waveforms
Fig. A
oscilloscope
to these
position
displays. ln
of
2 cm
either that
output
to the leading
time interval
for single-trace
Bvertical
in conjunction
to obtain
measurements.
operation.
adjustment
with
required
the
can be
This
facilities such
MODE
switch
using the CH
the most useful
the
has
or
feature of
capability
A or
for
frequency-
a common synchronizing
Simultaneous
is an invaluable aid
viewing of
possible
to the
applica-
will be reviewed in
involved in a basic
indicates the
Fig. C indicate the
reference or
possible
Fig. 7 also indicates
controls for viewing
basic control settings,
well
as
controls
the
as
Channel
should be set as
the drawing of Fig.
are indicated.
The
Channel
indicated in Fig. TBor 7C.
waveform is shown
responds to a negative-
the output
waveform is
edge of the reference
corresponding
to the
by
for
as
In an application where
at or near its maximum
rise time effects of
propagation
time
circuit and
possible
must
time delay which may
frequency divider
loscope the input
the consecutive
delay which
be
compensated
circuit. By use of the dual-trace oscil-
and output waveforms can
imposed to determine
delay that
any circuit with
in
procedures given
occurs. Sigrificant
several consecutive stages. Using the
for
be alculated. A more
if the Tp
may
This
also may
waveform
portion
done by
be
be
at a
of
the
possible
faster
sweep
the
logic circuitry
frequency,
desigrr
can
be
the
produce
stages
sigrificant in a critical
for. Fig.
be introduced into a
the exact amount of
propagation
delay may occur
calibrated time measurement,
precise
measurement
waveform
pulling
to view the
is expanded
PULL
the
5X MAG
desired
speed.
DIGITAL CIRCI.IIT TIME REL,dTIONSHIPS
A dual-trace oscilloscope is a necessity
manufacturing
oscilloscope
between
and servicrng digital
permits
easy
two waveforms.
comparison of time relationships
In digital equipment it is
of
circuits
relationship to
frequency
often time-related
are
to be synchronized, or to have
each other.
dividers
previously
as
in many other
dynamic state, some of the
upon the
digital
circuit
waveform measurements
ing Fig. l0
each of these
individual
or mode of
input
and identifies
are appropriate. The
the normal waveforms to
shows
points
and
waveforms have limited value unles their timing
operation.
equipment.
common
Many
for
of the
described, but waveforms
combinations. In the
waveforms
several
change,
Fig.
9 shows a typical
of the
their timing relationships.
relationship to one or more of the other
known
comparison
would
No.
Channel B, although other
desired. Waveforms
be displayed on
8
to be correct. The dual-trace oscilloscope
to
be made. In
typical fastrion,
be displayed on Channel A and
8 and
No.
10,
would
be successively displayed on
timing
through No.
relationship
or
No.4
on
Channel A.
No. 1l
Channel B in
waveform
comparisons may
13
to
operating
is
accumulated
a built-in
8C indicates the
be super-
propagation
Tp can
can be obtained
horizontally.
control. It
portion
of
the
in designing,
A dual-trace
a large number
a
specific time
circuits are
depending
points
at which
accornpany-
be expected at
The
waveforms is
waveform
No. 3
this
allows
No. 4 thru
be
would probably
waveform
No.
rtftra{l trttu!(y
(
r.o,^G',oN
":,"
rut*
"
r@
rr^N
1
tuLsf 5
.". .' t6a, c,rc!,,
Fig.8. Waveforms in divide-by+ight circuit.
DIVIDEBY.EIGHT
Fig. 8 indicates
divide-byeigfit
identical
8A is supplied
Fig.
divide-by+ight
indicates the
B
Fig.
pulses
input
circuit. The
to those used in
output is applied
the output
and
CIRCUIT
waveform
to the Channel
ideal . time
WAVEFORMS
relationships
oscilloscope settings
basic
Fig. 7. The
to the Channel
relationship between
pulse.
reference
t4
.te
stcfro l
for a basic
frequency of
A input, and
are
the
B input.
the
ln the family
waveform No.
10,
for
viewing all of the waveforms;
pulse per
waveform
desirabie" With external
displayed
Waveforms No.
source because they do not
of the
start
waveforms
entire
there
are
portion
of the waveforms would
cases, it is
while the
of time-related
No.
8 or
frame,
For convenience,
No. 8 or No. l0 as the sync
sync,
without
readjustment of the
4 thru No. 7
contain
frame.
would not
It
as shown in Fig. i0 in all
many times when
recommended
sweep speed
that the
or 5X magnification
expand the waveform display.
GATED RINGING CIRCUIT
The circuit
demonstrate the
oscilloscope is
and waveforms of Fig. I I are shown to
type of
effective
circuit
both in desip and
waveforms
is an excellent
l0
there
shown in Fig.
sync source
is but one triggering
external
sync
source
may
any of the waveforms may
sync controls.
not be used as the
should
be
a closer
a triggering
necessary to
appropriate.
be
sync
pulse
view
In fact,
cases.
examination
In such
remain unchanged
be used to
in which the
dual-trace
troubleshooting
using
be
be
sync
at the
the
of a
Page 17

3rtliJ3uons.
ije:.i::al
'*r\:'iorm
;:ieiorms
:eierence
srmal
!o those of Fig. 7.
and is applied
are sampled
waveform
be
can
D
COOE
SS
AO OR€
ATA
O
INPUT
(
5 - Erls)
The basic
oscilloscope control settings
Waveform A is
to
Channel
at Channel B
of
Channel
A. The
examined more closely
the reference
are
A input. All
and compared
frequency
other
the
to
burst
either by increasing
SECURITY
glr
I
SECURI?Y
Etf
2
the sweep
or bv
timei
time
puiline
'maeniiication"
oui on
desired to- center
oscilloscope
screen.
per
centimeter
the
This
the desired
mSEC
to
<>POSITION
control
'5-
can
waveform
peJ
centimeter
control
then be
to
rotated
information
obtain
on the
5
as
cooEo
tuicTtoi
oA
IXPUI
(t-6rrs)
IART
S
ItrPUT
LIiE ORIVEi
----
TA
vt2
MU LTI
PLEXER
-
t-
1_:_)
L_
-
l3
45678
Tl
sE cuRl
3
alT
t3
DA'^ SELECI LIiE-O
(E)
Fig.
Typical digital circuit
9.
using several time-related waveforms.
l5
Page 18

urre
{
orres:recrr'
$
oerestrtcrc'
$
srlrcr
'e'
DATA
SILECT
7
DATA
FIIE
EM
n rrt?LCxER
q,TruT
EXA'TI
9nr
RCS€T
a
lo
ll
12r
LHe
nrrn anrxrr
13r
DELAY
used to
lines
can F used
and the
repetitive
the displays.
b9
addition
inheren_t
tion
waveform
loscope
Tput
display.
and
output terminations
-
found
oscilloscope
LINETESTS
The
dual-trace
determine
as well
the delay
as ultrasonic
to-trigger
delay
line
pulse
type
The interval
compared
-large
to determining
in
the delay
of the
delayed
display.
settings
and. output
Any
evaluated.
A common
as well
waveforrns
pulse
The
application
in color television.
settings
output
O'
-
l-
I
tl
tl
rl
SEClrnlrY
I
illa
Fig.
feature
or
synchronize
will
Family
10.
of the
times
of transmission
type
delay lines.
can
be observed
make
it
between
to
the delay
line
pulse
Fig.
12
stretching
results
time
delay
time,
can be
observed
demonstrates
as
the
basic
are
shown
and ripple
of moAfying
can be observed
of
the
receivers.
and
typical
I
I
rl
ll
I
----.1
aT I
F-
of
time-related waveforms from
oscilloscope
The
the
Channel
on
possible
to
iepetitive
io
be ini,estigated.
pulse
the
determinid
on
the
the
test
circuit.
on the
can
the
directly.
delay
line
Fie.
circuil
t:
connections
olll|o
atls,
$CURtry
OA'ABIT 2 OATA
can also
type
inpirt
S€CURtty
be
delay
pulsir
A diiplay
Channel
b.
A
synchronize
pulses
should
In
dfstortion
by examina-
Channel
typical
oscil-
Typical
oscillosiope
be observid
input
and
checks
is
shows the
to
----rl
3IT 3
ON€
TRANSMISSION
check
section.
compared
the
delay
determining
waveform
lrom
output
STEREO
B
is in
ampliliers
or
efficiently
identical.
side-by-side
progessively
amplifiers.
been
repair-methods
immediatelv.
!
COTPL€TT
FRATI
typical
the
"{" delay
The
input
for
composite
is
approximately
the-delay
revpals
an impedance
resulting
AMPLIFIER
Another
t-roubleshooting
are used
otherwise
used
sigral
comparison
When
located,
digital
circuit in
lin-e employed
waveform
delay
time,
video
signal for
characteristics
any distortion
mismatch
from
an open
SERVICING
convenient
stereo
and
the
abnormal,
to
localize
applied
to
sampling
the
defective
the
effects
are employed
Fig.
and the
using the
one
microsecond.
line.
use for
dual-channel
amplifiers.
output
the
dual-trace
the
the
inputs
of
both
identical
or
of whatever
can
be observed
9.
in the
video
output
line,
may
geatly
waveforh
sync
The
In
addition
the
be
introduied
attenuated
horizohtal
reference.
of the
that
or
a
oscilloscopes
If
identical
of
one is
weak,
oscilloscope
defective
rmits
signal
of
both
can
state. \t4th
amplifiers,
Ue
points
malfunctioning
troublesh6otiri'g
and anal--yzed
amplifier
are
pulse
indicated
output
channel
distorted
can
be
an
-maOe
6v
in
botir
stage has
and
of
to
a
l6
Page 19

cllt0 lilGtrc
.10
0
il0
_lll]ffi__
0
-------ljilu
-10
+2
__J
0
-7
Fig.
CHANNEL
A
(INPUT
PULSE)
CHANNEL
B
(OUTPUT
PU
LSE)
Gllrc
lllfliftfi
lllllllllr+llilllilrr-liilli
|IXUUU
Gilto ttfou$ct
t,
ll$-------uxu{[-----]1lu
t, ltP(|fttD
Il il till_____J il fl ll t] ___,1 fl fl fl tl
UUUll|l
I l.
Gated
cllcltT
tfttfotl
__Jllllttft
IJJU]}U
ouTtul
llllfiRfl llmft[_
tuts]
(?ouillt
flt00nB
UIJIIIJII-U|]UUII-_
ringing
circuit
3oH@
rnnltD)
and waveform.
o
o
o
o
o
o--@
o
/lnffiR_
UJ]JU{
uu
VIDEO EQUIPMENT
Many of the
performed
later
tions. One of
interval test
effectively
the
single-trace applications
and 21. the information
vertical
detail in Fig.
synchronized to.
the Field
onto
operation,
can be viewed
indicates
alternate VITS.
1. The video equipment from
2. T\e control
obtain
With
3.
connect
detector test
4.
Set
a. If the
b. If the sync
5.
Adjust
fields
6. Connect
detector
7.
Set the MODE
waveform
Channels
8. Set the
position.
sweep speed.
the right
displays.
app€ar
t-l.rere
displqr
complete
field
B display.
using single-trace operation.
in the applications
these
sigral), can be accomplished much more
using a dual-trace oscilloscope.
blanking interval
20. Also, because the oscilloscope
and
#l
each otheras
the signal information on each
the sscilloscope
tion is
mitting
to be
a color broadcast.
a 2-field vertical
the
oscilloscope
the Channel
the
SYNC switch
sync
video
position.
switch
VIDEO(-)
the
the SWEEP
are displayed
the
test
A and
SWEEP
This expands
hand
The waveform
as shown
provision
is no
to either
vertical frame,
display will
SERVICING
video
s€ction covering single-trace
procedures,
on the Field
pulse
the vertical blanking interval waveform,
Field
*2
shown in Fig. 72, With
separately without overlapping.
yiewed
settinp of Fig.
point.
signal
Channel
point.
displays
the VITS
must
display
and television
A
as follows:
and blanking
are
and blanking
switch
TIME/CM
on the
probe
B
switch
to the
should now
B.
TIME/CM
portion
in the
for
of the
appear
servicing
section and as shown in Fig.
is different. This is
waveforms
control setting for viewing
probe (set
positive,
position.
oscilloscope
the display
information
of the expand6d
information
drawing of
synchronizing
two
it
on the
procedures
are outlined
These
viewing the VITS
#l and Field 1t2
are
which
the
set to
be
14 are those
on Channel
pulses
control so that 2 vertical
(set
DUAL
control
fields which
cannot
a station trany
receiver
at l0:l) to the
pulses
of the
use
the VIDEO(+)
are negative,
screen.
to l0:l) to
position.Identical
be obtained
to
by
will
bn each
Fig.
the oscilloscope
predicted-which
be
Channd
(ve;tical
outlined in
As
shown in
sweep is
superimposed
dual-trace
blanking
Fig.
VITS
informa-
required
A.
operating,
observed
the video
the.lms/CM
increasing
appear
toward
waveform
trace'may
21.
Becatrse
comprise-
A
or Channel
can
opera-
video
be
20
pulse
14
the
to
I
use
on
the
a
5000
l&Sec
PPs
PULSE
Fig. 12.
WIDTH
Delay
ULTRA SONIC
DELAY
LINE
(
5,l Sec)
line measurement
OUTPUT
.
9. Pull
the
tional
counterclockwise
left
shown
Because
sweep
the
5X
until
in Fig.
speed
sigral
<>POS
of
displays
control outward
magnification.
the
direction
expanded
15.
NOTE
the
low repetition
combination,
will
be reduced.
Rotate
moving
VITS
the
to obtain
the
control
the
information
rate
brightness
traces
and
appears
the
high
level of
an
to the
addiin
as
l7
a
Page 20

:-
DELAY
lsS
(INPUT)
A
ci
(OUTPUT}
B
CH
@3
FIER.
HORIZONTAL
TO
NO
NOTE:
NECTION;PLACE
INSULATION
LEAD
IMITY OF
LIFIER
IN CLOSE
OR
TUBE.
AMPLI
ELECTRICAL
CLIP
PLATE CAP
OF
HORIZONTAL
PROX.
CON-
ON
AMP-
VI
DEO
AMPLI
the Channel
Once
10.
identified
as
information,
sigrr4l-tracing
probe
should
that the sync
insure
sync
is interrupted,
sigral
reverse because,
provision
two vertical
in the
fields
Fig. l5 shows
and Field#
#l
is displayed
tion
VITS information.
on the bottom
SINGLE.TRACE
INTRODUCTION
ln addition
are, of course,
outlined,
applications
oiiilloscope
oscilloscope,
there
where only' single-trace
required. After
ii
the
FI ER
Fig. 13.
Channel
A and
being
the Channel
trgubleshooting,
and
left at
be
as
oscilloscope
Field
either
B
probe
the video
sigral
waveform displays
the
not hterrupted.
is
previously explained,
to
which comprise
the dual-trace
presentation of the Field
trace.
APPLICATIONS
to the dual-trace
many service
gaining
will be able
user
to make the
BOTH
SET
iO:l ATTENUATION
OELAY L INE
*NOTE:
ATTENUATORS
SAME,
DEPENDI
Checking
displays
B
or Field
#l
have been
may be used
the Channel
and
detector
test
there is
identify either
a complete
The Field
applications
#1
previously
and laboratory
operation
experience
judgment
PROBES
FOR
SETTING
MAY
BUT
NG ON
"Y" delay
VITS
#2
for
A
point to
If the
may
no
of the
frame.
informa-
of the
with the
as
VERTICAL
OF
SHOULD
VARY WIDELY,
CIRCUIT
line
BE THE
TYPE.
in
color
whether a
to
the single-trace
using
The following
is adequate.
tion
alternate
described
VIDEO
A triggered sweep
servicing
also includes
make
features
These
r
r
o
television receivers'
job
can be
performed more
or the dual-trace
are applications
In several
the dual-trace
method
using
for the same application.
EQUIPMENT
SERVICING
oscilloscope
aligning
and
several
video servicing
video equipment.
features that were
easier and more
include:
SWEEP
vertical
viewing
speeds
Vector
Wide bandwidth
TIME/CM
sync at
sweep
frames and
appropriate
for viewing
overlay for color
for high
pulse presentation.
VIDEO
TO
OUTPUT
AMPLIFIER
method
which single-trace
in
will be
it
cases,
application
is
control
automatically
speeds
horizontal sync
lines.
demodulator
resolution
efficiently
operation.
of
by
opera'
found
that
an
has been
advantageous
in
This oscilloscope
incorporated
to
comprehensive.
selects
appropriate
for
at sweep
checks.
and
video
l8
Page 21

VI
DEO
VERTICAL
SYNC
PU
LSE
VERTICAL
BLANKI
TELEVISION SET
NG
[@ t
0
$@.'
@
2mS/cm
o
eE
{D,
I
l
I
l
Fig.
SIGNALTRACING
VOLTAGE READINGS
television receivers
ment for
instrument. It
presence
may
the
path, a point
When
Oscilloscope
15.
VITS
information.
AND
general
For
be used to trace a
signal
this happens, the
troubleshooting and isolation
(or
that matter), the oscilloscope is an indispensable
provides
of normal
path.
signals.
As measurements
may
be
Fig.
14. Set-up for viewing fields I
presentation
PEAK.TO.PEAK
almost any
a visual display of absence
sigral
found where the
source
of fields I and 2 of
other
electronic
This method
by measuring
proceed
of trouble has
several
sigral disappears.
of troubles
(sigrral-tracing)
along the
been located.
equip-
points
sigral
in
or
in
and 2 of
mere
peak
performance
peak
accompanying
usually
pictures
peak-to-peak
readings
waveform pictures.
followed
until the
The
ments
MEASUREMENT
COMPOSITE
servicing is
signal, the blanking pedestals
and 17
composite video
pulses
can be observed
to
Knowledge of waveform
normal
waveforms help
problems.
television receiver
VITS
information.
.However,
presence
voltage measurement
voltage
procedures
are
Probably the most important
and vertical
determine whether
the
oscilloscope
or
absence of
cln often
measurements.
service data on the equipment
includes waveform
include the required
voltage.
on the
by additional
trouble
show
waveform,
The
oscilloscope
is isolated to as
for
given
earlier
paragraph.
VIDEO
the composite waveform
typical
sigrals
blanking
at various
the
technician
of the
located
be
Compare the
Any abnormal
readings
making
and the
known
peak-to-peak
in the
WAVEFORM
oscilloscope
synchronized with
pulses.
stages
circuits
makeup.
technician
should
to
shows much
sigral.
The schematic
pictures.
sweep time
with those
CALIBRATED
and the
causes
be in
provides
lt
signal. The cause of
by making
These waveform
and
peak-to-peak
shown on
readings
in the
small an area
are
locate
study
suspected circuits
voltage
ANALYSIS
waveform
consisting
sync
traces
when
horizontal
Composite
of
the television
performing
ihe
appeaiance
of various
and
such waveforms
good
operating
more than the
peak-to-
a
poor
peak-to-
such
diagam or
being
serviced
the normal
voltage
the
should be
possible.
as
measure-
VOLTAGE
video
in
of the
pulses.
correct
Fig.
observing
video
receiver
normally.
abnormal
video
sync
signals
of
many
in a
con-
l6
'a
l9
Page 22

HORIZONTAL
PULSE
SYNC
HORIZONTAL
BLANKING
PULSE
pofl
@[@?op
CHA
1
0p
S/cm
VIDEO_
INT
Fig.
16. Set-up
VIOEO
DETECTOR
for viewing
horizontal
lines
of composite
3@[@fl
@
CI
o
videq
@
PI
CTU
TUBE
signal.
RE
VIDEO+ or
(See
text)
INT
-
20
Fig.
17. Set-up
VIOEO
OETECTOR
for viewing vertical
fields
of
composite
video
sigral.
Page 23

'1
dition,
noting the waveform
various
at
points
amplifier.
To set up the oscilloscope
waveforms,
use the following
l. Tune the television set to a
2. Set the MODE switch to the CH A
3.
4.
5.
6.
the
Set
SWEEP TIME/CM
position for
mS/cm
Set
Set the
Pull
position
the
SyNC
SOURCE
the TRIGGEzuNG
observing
for
observing
switch
switch
for viewing conposite video
procedure:
local
channel.
position.
switch
to the
horizontal lines
vertical frames.
INT
position.
position.
to the
to the
VIDEO+
LEVEL control
sync,
7.
the
Set
8.
Connect a
CH A DC-GND-AC switch
probe
Connect the-gound clip
set chassis.
With the
connect the tip
cable
of
to the CH A INPUT
of the
probe
probe
the
set
to the
probe
for
the video
to
output of the television set.
9. Set
defleetion
the
CH A
possible
VOLTS/CM
without
switch
going
for the largest
off-scale.
10. If necessary, rotate the TRIGGERING
position
to
a
I l. If the
sync and blanking
signals are
VIDEO+
position;
negative, use
12. Push in the
position
to
a
Adjust the
13.
desired brightness and best
14. To
view
a specific
color burst,
for 5X
rigltt
magrification. Rotate
to select the desired
provides
that
pulses
positive,
set the SYNC srvitch
if the sync and blanking
the VIDEO-
TRIGGERING
provides
that
INTENSITY
and FOCUS controls for the
portion
pull
outward on
a synchronized display.
of the displayed video
position.
L:'YEL control and
well-synchronized
a
focus.
the waveform,
of
the
<>POSITION control
the
portion
same control
of the waveform to
be viewed.
15. Composite video
points
on the video circuits by
points
those
of the
as required to
scale, and by
setting
waveforms may be checked at other
moving the
and
changing
keep the
the VOLTS/CM
display
readjusting
the
LEVEL control to maintain stabilization. The
the observed waveform may
of
moving from one monitoring
fore,
it
may
be necessary to reverse the
be
point
SYNC.
in the video
l0
sS/cm
to the
or
for
automatic
position.
AC
2
1ack.
to the
television
l0:l attenuation,
detector
vertical
LEVEL
control
to the
pulses
are
rotate
display.
as the
such
left or
probe
tip
to
control
within the
limits
TRIGGERING
polarity
reversed when
to another; there-
polarity
of the
roRr
CIRCUIT
F€CI
OE
IORNL
CIRCUIT
Loss r
f Rt
X€Y
QUt
Rt sPoNst
trctsSlvt 8t(*i
fRtQUticY
i0N-
sPoNst
,
MST
!INTAR
SHIFT
LO5S C Lfr
FRT
XCY
QUT
RtsPorst
Fig.
zoNTAr
PULSE
)r
sroR
A
xlcli
,r\
Rt-
r'1
tl
It
18. Analysis
NORMAL
SYNC PULSE
SYNC
COMPRESS
PULSE
ION
CAUSED-BY
IMITING
L
rrwHITEI
Fig.
N
19.
SA T URAT IO
CAUSED B Y
LIMITING
OVERALL
FREQU€NCY
r lol/
of
Sync pulse
sync
RECEIVER
R€
SPONST
I
rtit
8LA((
SrRtATI0rS F0t-
LryIiG A sflRP
ch^r6t
TURI
c#ict
OIiG
PICTURI
sr{Att0
I
pulse
distortion.
waveforrns.
€FFECT
PICTURE
PtcluR(
Nmnt
L0ss 0f
TUET
vtRr
C
5U0l|c
f
Uet
IA
OT
lcat
qllt
li
Ii su-
URGT
ARTAS;
Ptc-
Oil
PIc-
PIc-
I L
PULSE
SYIIC
The
evaluated
be
horizontal
pulse
sync
bandpass
ANALYSIS
IF amplifier response of a television
to some extent by careful observation
pulse
sync
waveform
characteristics. Some
and their relation to
Fig.
18. Sync
positive
shown in
or
pulse
negative limiting in IF
Fig.
19.
receiver
waveform. The appearance
is affected by the IF
typical waveform
IF amplifier
waveform
response
are indicated
distortions
produced
overload conditions are
can
of the
of the
amplifier
symptoms
in
by
(VERTTCAL
11TS
Most
network
(the
signal
VITS)
troubleshooting
localize
and
trouble
shows when
ing procedures
scope
displays
The
interval.
white
line
of the VITS.
VITS
On the
above
TNTERVAL
television
that
and
servicing
to the
antenna,
realigrment
show how
is
transmitted
television
the
top
signals
can be
television
may
to
analyze
during
set, it
of the
TEST
STGNAL)
contain
a very
sets. This VITS
tuner,
lF or video
be required.
and interpret
the
can
be
picture,
a built-in
valuable
The follow-
vertical
seen
as a
when
the
test
tool
in
can
sections
oscillo-
blanking
brighi
vertiial
2l
Page 24

linearity or height is adjusted to view the vertical blanking
interval
the blanking
(on
TV sets
circuit
with internal retrace blanking
must be disabled to see the
VITS).
circuits,
tire VITS appears at
just
and
before
the first line of
the bottom of the
video.
vertical
blanking
pulse
.
|
lTllltl
-,|-
Fig. 20.
''i'."'i',..'i'
ruLI I,EURIT
\
Typical VITS signal,
rlit.sQuet0
(tY
Et
/ilNory
fields I
tuL5t
lNTtRCnANCt0)
ruL
't
*r'r
I
I
30e
ll SLAi(lNG
Pt
and
,,o,
!IA!
0t
2.
Each
equal amplitude. By
of these frequencies
the television
the multi-burst frequencies is transmitted at
of
receiver,
observing
after
the
the comparative arnplitudes
the
signal is
processed
frequency response of the set is
through
checked.
up the oscilloscope
Set
Connect the
^
1.
the video detector
video section
If the
2.
CH A
of the
television set
circuit, bypass this
the MODE
3. Set
4. Set up
switch to CH A.
the oscilloscope
waveform analysis as
frames will
Reduce sweep
be
visible.
time
ms/cM) with the
expands the dispiay
VITS information will
expanded
Further expand the
6.
(pull
the
ion,
waveform
outward on the <>POSITION
<>POSITION
moving
the trace
follows
as
probe (set
other
or
to view the
at l0:1) to the
desired
test
VITS:
output
point
of
in the
television set.
has
ve{tical retrace blanking
a
during
circuit
previously
to
millisecond
.1
the measurement.
vertical
tbr
cornposite
described. Two vertical
per
centimeter
vicleo
(.1
swEEP TIME/CM switch. This
by increasing the
sweep
speed. The
appear to ihe right on the
display.
with
sweep
the 5X magrification
control). Rotate
control in a counterclockwise direct-
the
to
left, until the expanded
VITS appears.
WHITE
FIELO
J
wx,t€
U
8LAcx1
aoRrz
SYNC
Fig. 21. Vertical
another, but is
amplitude,
sion networks use the
checking of
can use them to evaluate television set
line of Field f I
followed
MHz, 3 MH43.6 MHz,
quence
ol Field
multi-burst
valuable
fl2
window pulse
progressively
have less value
screen.
followed
mation.
The
transmitted VITS may
and
network
by sine
of frequencies
(line
#2
portion
to the technician.
(lines
l8
and
Field
by line
*2
IZING
blanking
a
waveshape
(line
wave frequencies of
279) may contain an identical multi-burst. This
280), which may contain
and the staircase of
lighter
to the technician.
is interlaced with Field
#l
279
interval, shorving typical VITS
precision
precision
transmission equipment, but the technician
17) may begin with a "flag"
(3.58
is
called the
of
VITS is the
the
shading,
line l8 is followed
and
vary
sequence of specific frequency,
similar to
The
Fig. 20
signals for adjustment
MHz)
"multi-burst." The
portion
second
are valuable
As
from one
performance.
MHz,
0.5
4.2 MHz.
and
line of
the sine-squared
3.58
to the
seen on the television
#2 so that line
by line 280. The
channel to
21. The
and
white
of
1.5 MHz, 2
that can be
I
Field
#
MHz
network,
televi-
The first
video,
This se-
first line
and
bursts at
infor-
and
most
Field
pulse,
but
17
is
en-
NOTE
The brightness level of the
reduced because, although
only 60 Hz
speed is
(a
pSEC/cm
20
16,000
signal display
repetition rate
the
pSEC
period)
(.1
mSEC/cm magrified
times).
The waveform
7.
should
be
similar
to
22. For the oscilloscope display, each
pulse
starts a
(multi-burst)
279
Fig.22. Oscilloscope
single-trace
new
sweep. This causes line 17 and line
to
be superimposed, as are lines 18
presentation
of
operation.
will
the writing
that shown
vertical sync
VITS
information,
be
is
five
in Fig.
aa
Page 25

280. The
and
reinforces
ideniical
multi-burst
the trace. However, lines
and
both sigrals are superimposed
other.
8.
presentation
The
is the limit
of observation
oscilloscope.
preceding paragraphs (Fig.22')
the
of
With
the Model I4'76
however, a single-field
This
With
the Model 1416
the
causes
Channel B information
oscilloscope.
position.
displayed on alternate sweeps, as
Field
preselecting
Field
multi-burst
valuable
because
VITS,
VITS. Because
#2
#1
Field
or
Field
#1
or
#2
Field
information
for
troubleshooting television
present
it
is
either
can be used for troubleshooting
on
both
tracing.
Now
to
muiti-burst
not
be equally
response
good
color television
the
multi-burst
attenuation
reference
for
reference).
u.a,lyze the waveform.
are transmitted
coupled through
curve. Fig.
23
shows
receiver, identifying
and
for
voltage
showing the
each.
Remember
(the
2.0 MHz modulation
at
sigrals are identical,
l8 and
280 are not
over each
possible
with a single-trace
oscilloscope,
presentation
VITS
oscilloscope,
are Field
there is no
#2
(Fig.
15)
in the VITS is
brovision
infoniration,
will appear. The
the most
receivers
Field
#l
and
and
the same
the
that
level,
the
receiver
but
due to its
desired response
each
allowable
-
fiequency
dB equals
6
amount
frequencies
All
shbuld
which
can
to
#l
either
Field
signal
of the
should
for
half
be used
be
be
and
for
and,
*2'
of
of
the
chance
response
video detector
the
on
shows the VITS
except
bursts on either
into the
below
channel
reasoning
If the
channels,
misadjusted,
traps
or faulty.
for
Iook for
bridges
a
.of
the
antenna
on
some
channels.
on
all
IF
amplifier
As
another
the
bench with
that
the burst
passband,
picture
ihe
carrying
is right,
poor
maybe
at the input
response
causing
channels, the trouble
stages.
example,
very
a
at the
video detector
at 2.0 MHz
side.
This suggests
chopping
carrier frequency.
VITS.
If the
and the
at 2 MHz
an FM
a bite
of the
If the VITS response
all channels,
the
trouble will
open peaking
across foil patterns,
system
causing "holes" or
If the VITS is
let
us assume
poor
picture.
to be about
low
is
an IF trap
frequencies
out
Switch
same thing
IF amplifier
trap
requires
is
not
at the
on only one
set
could similarly
at
ihe detector
be
in the
coils, off-va_lue
etc.
GRATICU
LE
abnormal
is
that we have
at
probablv
a set
Our oscilloscope
normal
tilted
compared
to
is detuned
about
2 MHz
to
is
another
seen, then
realignment.
seen
on other
tuner
input
channel,
-Other
be misadjusted
output
is
video
normal
amplifier.
resistors,
-solder
the
in
the
our
is
5
+
o
.D
!Jo
I
lrJ
vt
z
o
Soo
lrl
G
4t
To locaiize
video
detector. This
before
or after the
the
detector,
channels
tuner or
t7
(l
z
-j
I
l-36-MH,
MODULATION
I
4.2-MAz
MOOUL ATION
25
\l
IJ
t/
42
FREQUENCY-MHz
Fig.
23.
Color TV IF
trouble,
will localize
detector. If the
check the VITS
look okay
antenna-system
but
:J-
2
o-MH
l'oJ"o'
Ll.o-ux.
MODULATION
43
start
others
troubles.
a?
o
Ptcrune
CARRT€
I
t
o
5-MH:_
A
M
TION
ODUL
44
amplifier response
by
observing
on other
do
45
trouble
to a
multi-burst
channels.
you
not,
Don't
the VITS
point
is normal
probably
overlook
R
\
46 47
curve.
at the
either
If
some
have
the
cro
-
--
VECTO
OVE
Fig.24.
VECTORSCOPE
Performance
circuits in
the vectorscope
tional
equipment
B &
K-hecision
\
\
this.
First
scope
Attach
1.
must
overlay
2. Connect the
and tune in
3.
Adjust
Installation
OPERATION
testing
and
color television
operation
needed
color bar
the horizontal
generators
and
be equalized (see
vector
overlay to scope. Remove bezel,
and re-attach bezel
color bar
the
color bar
television
the
set's
of vector
receivers
of the oscillosiope.
is
a color
vertical
Fig.
generator
pattern.
hue
R
RLAY
overlay.
adjustment
is
simplified
bar
are
gain
25).
(see
Fig.
to the
and brilliance
--€o
of
the
The
generator.
ideally
suited for
of the
24).
television
controls
SC R EWs
color
by using
addil
The
oscillo-
insert
set
to
mid-range.
4.
at
Set SWEEP
5.
Connect
jacks.
the horizontal
driven element
cathode is the
cathode.
the
output
6. Adjust the
gain)
pattern
oscilloscope
TIME/CM control
probe
cables to the
Channel A is
input.
of the red
driven element,
(The
driven element
signal of the
CH A
VOLTS/CM
that
approximately
is now
to the CH
CH A and
the vertical input
Connect both
gun,
usually the
then
is the element
color amplifier is
(vertical gain)
and
controls to obtain
set up for
fills the
vector overlay.
vectorscope
position.
B
IMUT
CH B
and
Channel B
probe
tips to the
grid.
connect
If the
to the
to which
applied.)
(horizontal
CH B
a compressed
45"
The
operation.
is
23
Page 26

R.Y
I /
WI
1
j
,v
(R-YI
'\l
-
450
t\
B-Y
.
90"
| 050
I
@
'@!
o
Irl@
A lo- @
vector
For
7.
probe to the driven
vector
television
displays
syslems
If
will appear
rotate'the
on the
is
with the
The
measurement
a color
in
iarize
produced
ihat
the
of
control
their
elliptical
presentation, merely
pattern is the same
set
obtained
with either
picture
the
vector overliy
rigfit side.
vector
vector display
TV set.
himself with
by
the color
petals
changes
ahplitude.
pattern
element
manufacturer.
for sets
grid
drive
NOTE
tube uses
on the
right
The color
overlay.
the functions
of
The serviceman
the effect
the
amplitude
but
controls.
color
not their
position^of
the
lastly, 105" sets
than 90"
Fig.
of the blue
using 105"
or
cathode
sidq
180" so
provides a very
control
sets.
Equalizing hor2ontal and vertical
25.
scope operation.
the horizontal
move
gun.
given
as
type
Fig. 26 shows
systems
cathode
of the screen.
bars
of
He
position.
the
drive.
the burst
drive,
the BURST
will then aligr
the demodulators
should
on the
should observe
vary the size
will
petals
will have a
The table below
The color
by
typical
and 9O"
Just
label
quick
famil'
pattern
The hue
but not
more
thg
ADJUST
REOUIRED
li3ts
pattem.
range of tlte color set's
posible
axis.
petal
CHROMA reference
oscillator
tors.
is
position.
on
are aligred
general
vector display
aligrment.
procedure
counting
between
A
gain
some
The vector display can be used
At
should be
A
slight touch-up
necessary to bring
the chroma bandpass
be aligred
If the
Vector-
for
common
to
rotate the
the center
is transformer-coupled
Do not attempt
set has adjustable
to locate
bars simply adjust
R-Y
troubles and
hue
petal
R-Y
of the
vertical.
by a
sweep
by
can
Follow the manufacturer's
BY.
and
If
oscillator.
of this
R-Y
the
to make any adjustments
amplifiers.
generator
just
vector display.
a
also be
the
used for demodulator
proper
their effect
to
control.
hue
it
transformer is all that
for the correct
It should be
about the vertical
control
is not, locate the
In most sets this
to the demodula-
petal
to a vertical
These amplifiers
and cannot
demodulators,
and instead of
coils
the
on
the
check
R-Y
the
the
alignment
angle
in
24
Page 27

GRID
DRI
R-Y
VE
l*-.--
VECTOR
ID
GR
DRIVE
VECTOB
TROUBLE
Loss
Overloading
Color
weak
Lack
Demodulator
DISPLAYS
of color
amplif
of range
DISPLAY
sync
of
color
iers
unbalanceo
of hue
out
of alignment
FOR
FOR
GENERATOR
amplif
control
PICTURE
90"
B-Y
-r--
1 050
105. PICTURE
coLoR,
BAR
iers
or
TUBE
CATHODE
DRIVE
R-Y
TUBE
EFFECT
Petals
Petals
Flower pattern
R-Y
Angle
ON
pattern
of
are crushed
petal
cannot
vertical
between
petal
not
specification
General
Specif
PATTERN
will
rotate
or flattened
very
elliptical
be
made
to
petal
R-Y
to manufacturer's
(90"
ication
or
and B-y
105.
).
be
G REEN
EFFECT
Varying
Color
distortion
Color
distortion
Hue
control
fleshtones
U/rong
colors
ON
colors
won't
T.V.
PICTURE
adjust
Fig.26.
Vectorscope
operation
and
patterns.
25
Page 28

,
TELEVISION ALIGNMENT
INTRODUCTION
Alignment of
circuits in
oscilloscope, such
of test
sweep,
equipment
IF sweep and RF sweep, marker
supplies and a
tuners, the
television receivers
as
this instrument. The additional
required are sweep
VTVM.
aligrrment displays a bandpass response
of the
oscilloscope
of the type always
books and in the television set manufacturer's
instructions
75 74 rl
l8 l9
rNZ
JA
rxz}
{75
Fig.27. TV
(typical
40
response curves
response'curves
7i 70
42 4) a4 45
CHANNEL
rxz wr0t
6
I
technique.
The ideal
instruments for television
oscilloscope and the B & K-hecision
tor. The B & K-Precision
all necessary
from
and
precision
For
television
ever,
use
of
ln this
emphasized. Proper
is
equipment reqtrired for
instruction manuals
sweep ranges, markers and DC
one instrument. The
calibrated accuracy of the
alignment.
complete
set,
the following
the
oscilloscope
aligrrment
follow
manual,
the manufacturer's
general
for
only
use ofthe sweep
alignment
for those
video IF
strip, and chroma
required
a
high-quality
pieces
The sweep
generators
generators,
generator
curve on the
for video
DC bias
method
screen
shown in theory
aliglrment
69 5A 67 55 65
47 48
46
4
are shown in F
'RIoU€NCY
FFEOUETCY
coNSTAtt
R.F
OVENALL TUTER
R€YOftSE
OVERALL
R€SPdSI
ChROUA TAX€-OFF
COIL
ryERAIL CffiM
RtsPof,s
Ar
Ar
SWTEP
I-F
FTSPONSE
ig. 27).
4
CH
tF
obtained by sweep-frequency
aligrrment are this
Sweep/Marker
Genera-
Sweep/Marker Generator provides
bias voltages,
simplified operating
procedure
instrument results
instructions of each
particular
instructions. How-
instructions
set-up
sweep-frequency
proper
the
use of the
should be
demonstrates
alignment.
oscilloscope
generator
provided
and
other
in the
instruments.
of
all
in
NOTE
For
a
comprehensive analysis of television
ment, we recommend the instruction
B&K Model
the
This "handbook
not
only the
but all the how and
aligrment
in
generators,
valuable
make
procedures,
aligrment easier
many illustrations
step approach
textbook. Copies
B & K-Precision
MPORTANCE
The most
of
the
receiver
sweeps
channel
processed
shaped by the
rapid way to determine the
tuner,
IF
provide
is to
through the
at a controlled, repetitive rate. As this
through the
gain
sections. Because the
tuned
circuits to
has
at
bandwidth
proper
the
certain
points
properties
Fig.
27 shows the sweep signal with
curves of the tuner, IF
circuits below it.
to
be obtained
These outlines
scale.
the outputs of the various
if
415 Sweep/Marker
of television alignment"
procedures
for using the
why answers about television
general.
this
Even
comprehensive manual
if
you
insights and tips
more
and
and easy-to-understand
qualify
it as the
are available from
distributor or the factorv.
OF SWEEP ALIGNMENT
and chroma
a
entire
tuned
and bandpass
portions
constant-amplitude signal which
bandwidth of
portions
properfies
signal is channeled
another
it is important that each
charhcteristics. If the
and the envelope observed,
up to that
point
amplifiers and
The
bandwidths
shown are approximately
are similar to
receiver were demodulated and the
oscilloscope.
Because
of the relative
response'is least critical.
Some reference
importance of
frequencies
area
are
is the most
this area will affect the amplitude
response
curve
Notice
that
constant-amplitude
spectrum.
information
circuits
This
Notice
chroma
plitude
Notice
are modified by
of the
is shown by reference to the
that the sigral information
frequency range
with respect to the
the chroma frequency range
frequencies
proper
on the
aiignment. Notice
slope of the IF
are identified
critical because improper
and shape of
and this
in turn affects
the chroma information is located
portion
the transmitted
of
that the relative amplitudes
passing
television receiver tuner
overall
at
(4.08
MHz)
level
signal
(3.08
MHz).
for this frequency-versus-amplitude
overall IF
between
chroma
tuned to
usually 4.08 MHz
27. TTus
characteristic
response
response curve,
the IF output
portion
of the receiver. The
the upper end of the
and
a Chroma
and the
provides
bandpass
chroma frequency range
a response
compensates for the amplitude-versus-frequency
of the
curve.
The
chroma
result
portion
of
cornbining
align-
manual for
Generator.
includes
instrument,
use other
sweep
provides
that will
professional.
The
step-by-
"how
to
align"
your
overall
given
condition
television
television
of the
a
signal is
of the
of
from
receiver,
one series of
it is
the various
section
sigral is demodulated
gain
the
and
can be determiJred.
basic response
chroma bandpass
the
curves that would
sections
curve observed
bandwidths,
of the TV
on an
the tuner
to show the
that
the
response
chroma
curve.
This
IF aligrment
the
color
picture
chroma
quality.
on a
television
of the
through
chroma
the tuned
and IF amplifiers.
IF
response
the
upper end
is reduced
at the
To
characteristic
takeoff
amplifier
chroma takeoff
cuwe.
of the
in am-
end
lower
compensate
of the
coil is used
of the
coil
as shown in Fig.
of the
the
overall IF
response of the
of
in
ii
ti
=
:
is
26
Page 29

the
of
IF
produce
range
applied
indicated
specified
cedures.
takeoff coil
the bandpass
SWEEP
ing
frequency sigral
bias line
grounding
circuits
to the manufacturer's
receiver
is
problem
strip and
response and the chroma
likely that
response is
and the response
curve
(3.08
to the bandpass
Aligrment of the chroma
ALIGNMENT METHODS
The best method of checking aligrment
which stages require alignment
are then observed
The technician can then
require alignment.
satisfactory but the chroma
overall response
a flat
MlIz to 4.08
the overall
by
as a separate step
In other
performed
is
transformer.
at
must be
AGC line. The outputs
the
between the video
is
the output of the bandpass
the
IF
poor
on the
MHz). The resultant sigtal
amplifier which
chroma
procedures,
tuner antenna
the
clarnped
recommended response curve.
response are
requires touch-up,
slope
chroma
in
response curve.
takeoff coil is sometimes
in manufacturer's
adjustment
together with
by
on an oscilloscope and compared
decide which
For example, if the IF response
response is
detector output of the
affecting chroma
takeoff
the
chroma
has the response
the
is to inject
terminals.
application of bias
of the IF and chroma
amplifier.
poor
particularly
coil is
frequency
then
is
test
of the chroma
adjustment
determin-
and
an RF
sweep
The AGC
portions
not,
then it is most
of the
then
If the IF
if the
response.
to
pro-
of
or
the
IF
portion
RF
The
aligrment
thah
circuit,
attention.
between
pre-alignment procedure
some manufacturers.
mined, an alignment
ed. The aligrment
Some
terminals which can
quencies
done by selecting
One way of doing this
generator
picture
selected and this is
is the
sweep
the
for the aligrment of these
injected at the mixer
aligrment. The IF
then modulated with
before
receiver and the recovered
chroma circuit alignment.
problem
of
that
Once
suggest
VSM, or video
modulation is demodulated at
TV receiver
Other
the
which is located
This is
the tuner and
the deficient
sigrral combinations
in
the
for IF alignment. After this is complete,
carrier
this
frequency for the channel being used is
and applied
manufacturers
is detected
of the tuner
because
IF
section;
part
of the
is
portion
check
procedures
generate
receiver so that
the
right combination
is to first connect an
modulated
sweep
stages.
re'commend
grid (or
picture
a video
at the
passband
the
however, the
on the
the first
given
of that section
by
modulation
to the
base,
carrier
sweep volfage
sweep
seldom
is so
tuner,
tuned matching
IF stage. A separate
for the
the
of
vary
IF and
overall aligrment can be
frequarby
video
receiver
with manufacturers.
the tuner
at
video sweep fre-
of input sigtals.
a video sweep sigral
method). This video
the video detector
chroma
bandpass circuits
IF'sweep frequency
an
if transistorizpd) for IF
(VSM
detector of the TV
voltage
creates
greater
much
mixer output
may require
network
link
circuits
is deter-
perform-
can be
antenna
RF
sweep
the
(this
MHz)
@5.75
again). As
is ueed for the
an
by
of
is
ANTENNA
TERMINALS
SELECTOR
562
,'A";'
*\-/^5
ara-
SWEEP/MARKER
GENERATOR
SWEEP
RF
VOLTAGE
OUT
TELEVISION SET
Eig.28.
Typical
.O1V/cm
tuner alignment
A DJUST
HORIZONTAL
sl zE
s€t'up.
o-l
f-r-
e
@
27
Page 30

Another
chroma
sweep modulation of the IF
used to
of IF
alignment and
of
the
final
overall
ln conjunction with IF
manufacturers
spot frequencies
point).
test
tuned
circuits in the IF before
In
particular
his
manual is
procedures
manufacturer's
apparently deficient receiver does not
response,
ponent
troubleshooting
TLINER ALIGNMENT
l, Connect the output
antenna terminals
sweep
2. Tune the TV
method
circuits
check the combined effect of the
chroma circuits is necessarv to obtain the desired
chroma response.
recommend
Other
all cases the manufacturer's method
receiver
preferred
are also reliable
procedure.
the technician must then
failure has
generator
is to first
dir.ectly.
into the
procedures.
set to the same channel.
The
chroma aligrment.
pre-tuning
procedures
IF
and the
for
alignment. SAMS
If
occurred and
(Refer
of the sweep
of the
to sweep one of the TV channels.
video-sweep
IF
then
is
pix
frequency
aligrment,
(usually
outline
sweep
manufacturer's
in most
and
complete
must
Fig.
to
television
align
aligred and
(45.75
chroma
Usually
practically
IF
traps by injecting
at a specified tuner
prealigrment
a
aligrment
is
PHOTOFACT
cases repeat the
realigrment
restore the required
consider that a
employ standard
28)
generator
set.
video
MHz) is
response
a touch-up
of all
procedures.
the best for
service
of an
com-
to the
Adjust
the
all
the
3. Connect the
directly to the tuner
Connect the Channel
DIRECT)
is normally the
where a demodulated
Set
4.
5. The
6. Select the marker
7.
the
sensitivity
to avoid
would distort the response
erroneous
screen.
oscillorope sweep and
exact
synchronization
proper
presentation
accomplished
setting the oscflloscope
(SWEEP
the horizontal
to the Channel B input
measure
T'lte
tuner response
oscilloscope.
the
response
adjustments for realignment.
ground
shield to minimize hum
the
to
tuner test
gid
of the mixer
sigral
CH A VOLTS/CM
and
operate the
overloading
picture
TIME/CM
the upper and
of alignment on
of the
for sinusoidal
to CH B
voltage
sweep
generator
See the manufacturer's
curve is now displayed
curve specifications and
clip of the oscilloscope
(Vertical)
A
point.
The tuner
tube
present.
is
control
generator
sweep
television receiver, which
the
curye and
the
generator
sweep
phase
and
respons€ curve. This
for external
terminal on the
lower response of
with
each
or sawtooth
position)
from the
horizontal input
and connecting
sweep
oscilloscope.
frequencies
instructions
pickup.
probe (set
test
or equivalent,
for
maximum
at low level
provide
oscilloscope
must be in
other for
is easily
sweep by
generator
required
the tuner.
on
necessary
the
probe
to
point
an
to
the
for
EP|MAF
SWE
GENERATOR
KER
AGC
BI
AS
.01V/cm
VIDEO
DETECTOR
@
0
@
0
o
ADJUST
HORIZONTAL
SIZ E
DIRECT
O[:t>
o
@
@
28
Fig.29. Typical IF aligtment
set-up.
Page 31

IF
ALIGNMENT
l.
Connect the
signal injection
generator
tuner
has
applied
2. Synchronize
generator
ALIGNMENT
3. Connect
probe
4.
Connect
video
5.
Set
viewing
at the
the
to
the television
the vertical probe
detector
the
CH
of
(Refer
output
to sweep the IF
been
antenna terminals.)
the oscilloscope
previously
as
procedure.
gound
output.
A VOLTS/CM
the response
Fig.
to
of the sweep generator
point
of the mixer.
properly
clip of the
set
chassis.
curye.
29)
frequency
aligrred,
sweep
described
oscilloscope
of the
gain
control for
Adjust
RF
oscilloscope
the
band.
sweep
with
the
in
the TIJNER
to the
sweep
(If
the
may
be
sweep
vertical
to
the
suitable
9€/"
3
o8
*lO"h-
-l
MHz
4
o8Mf'z
j-
8s%
I
+l5oh,-?c/o
6. Keep
7. Select
8. Follow
the
overloading. Follow
tions
check the
A sweep
the markers
Model
the response
sweep
on disabling
the marker
critical frequencies
and marker
simultaneously,
415,
is a big advantage.
the manufacturer's
generator
AGC.
curve and making
output level low
the manufacturer's recommenda-
generator
generator
such
instructions
f-
I
prevent
to
frequencies
of interest
capable of displaying
as the B & K-hecision
the alignment.
45.OO
MHz
required
(see
Fig.
for evaluating
to
30.)
all
Fig.
31 . Typical
ranges
to
sweep
frequencies.
used for
2. Apply
the
manufacturer's
3. Synchron4e
described
Use
4.
(Channel
curve
5.
Set
CH A
the
6. A re-sponse
should
of
bandpass
IF alignment.
the
celor
amplifiers
for
a demodulator
A) to
at the input
the
vertical
(VOLTS/CM)
screen.
be
seen. Select
interest.
specifications
VALLEY
r57"
Lr
chroma respons€
of response
approximately
Use
proper
instructions
the
tuner
curve
Refer
levels.
the
same IF
DC
bias to
(bandpass
oscilloscope
alignment.
probe
the
oscilloscope.
to
the demodtrlators.
gain
controls
for
similar to
the
to
the manufacturer's
and
MAX
roTo
MAx
4.50
MHZ
curve, showing
the 4l to
injection
the
color killer
amplifiers).
for the
sweep
for
Measure
a
marker
of
convenient
that
generator
atgnment
I
I
l
--l
tolerance
44MHz
level
that was
to enable
Refer
correct
the vertical
shown
bias
previously
as
the
response
the
oscilloscope
viewing
in Fig.
frequencies
instructions
procedure.
band
to
level.
input
size on
of
the
3l
for
Fig.30.
CHROMA
before
injection
injection
drastically.
f9.r
alignment.
Typical
ranges
starling
such
1. Ipave
connected
IF response
of response
ALIGNMENT
IF
alignment
this
of
video
specineA
Follow
direct
the
chroma
sweep
herein,
the
injection
sweep/marker
as for
curve,
levels.
(Refer
to Fig.
must
be
aligrment procedure.
is used
manufacturei's
IF
alignment.
rathei
the
response
of
video
generator
showing
32)
satisfactorily
than
the
curve
procedure
sweep
Set the
and
sweep
tolerance
completed
If
direct
IF
sweep
is
altered
explicitly
for
it ro-i
AGC
generator
NOTES
bias
29
Page 32

SWEEP/MARKER
GENERATOR
il9
t-l-
Acl
ADJUS'
VERTIC
A
\y
o
a
Irlo
l=- ol
0
t==G-
fl@?
ADJUST
HORIZONTAL
SIZE
30
TELEVISION
Frg.32.
Typical
VIDEO
DETECTO
SET
chroma
FI RST
COLOR
alignment
AMP
DEMOOULATOR
sEcoNo
COLOR
(BANOPASS
set-up.
PRO€}E
AMP
AMP)
Page 33

FM RECEIVER
Refer
Procedure:
l. Conriect a sweep
FM
receiver.
centered sweep.
2. Connect the
generator
scope and set the oscilloscope controls for external
horizontal sweep
Connect
3.
input of the
4. Adjust the oscilloscope vertical
controls
5. Set the marker
marker "pip"
6. AliCr the IF
specifications.
Move
7.
curve should be displayed,
should
to the Channel B input
the
for
probe
the
appear
generator
Sbt
the sweep
sweep
(SWEEP
vertical
FM
receiver.
display similar to that
generator
should be in the
amplifiers according to the manufactuter's
to the demodulator
exactly
ALIGNMENT
Fig.
to
33
to the
generator
voltage output
TIME/CM to CH B).
probe
hput
precisely
in the
to the demodulator
and horizontal
center
and the 10.7
center
mixer
input of the
for a lO.7
the
of
jack
of the oscillo-
shown in
to 10.7 MHz. The
of the
output.
MHz
(See
Fig.
Mllz
sweep
gain
Fig.33A.
bandpass.
The
"S"
"pip"
33B).
Adjust
faciurer's instructions
distances
increased and
10.7
Phase
scope. Typical
produce
distortion
shift
Dstortion due to non-linear
in the oscilloscope
A
tested. The
input of the oscilloscope,
circuit is
The
amount
can be
To make
procedure (Refer
Using
1.
sigral,
frequency
the demodulator
from center
MHz
measurements
a specific
sine wave
same sine wave
applied to the horizontal
of
calculated from the
an
apply a
decreased
frequency.
center
PHASE
applications
in
input is applied
phase
phase
to Fig.
audio sigral
to the audio
MEASUREMENT
may
phase
audio amplifiers or
waveform.
strift, and measurement
difference
resulting waveform.
measurements,
3a).
sine wave test
according
so the
as the
equal amounts
'made
be
are in
amplification
to the audio
input
and the
generator
network
applied
is
input of the oscilloscope.
between
sigral at the
being tested.
to the
marker
marker
with
circuits designed
other audio
is also
use
with
to the vertical
of the
the two
the
pure
a
output
manu-
moves
frequency
circuit being
equal
from the
an
oscillo-
to
phase
of
networks.
displayed
tested
signals
following
sinusoidal
desired test
is
\
I
@
VERTICAL
srzE
[
HORIZONTAL
stzE
MARKER
INPUT
SWEEP
GENERATOR
RF
OUT
SWEEP
VOLTAGE
.ca,$
DEMOOULATOR
Fig.33.
Typical
FM
receiver
aligrment
set-up.
3l
Page 34

GENERATOR
o
AUDIO
SIGNAL
@
"@r
o
O
P^fl@fr
"lJ.
['.l9
lo- @l
lI
la
-
rt,
1J
CH8
NO AMPLITUDE
.
T{O
PHASE
OISTORTION
SHIFT
Fig.
34.
AMPLITUDE
NO PHASE
Typical
OISTORTION
phase
SHIFT
AUDIO
BEING TESTED
measurement
VERTICAL
SIZE
LOAD
alignment
HORIZONTAL
SIZE
set-up.
NOTES
ISoO
oUT oF
AMPLITUOE
PHASE
Fig. 35. Typical
32
PHASE
OISTORTION
SHIFT
phase
AMPLITUDE
90" OUT
measurement
PHASE
oscilloscope
OISTORTION
SHIFT
PHASE
OF
displays.
Page 35

2. Set
the signal
ating
level of the
circuit's output may
the
test circuit is overdriven,
the oscilloscope
reduced.
3.
Connect the
circuit.
4.
Set the
5.
Connect
the test
to
be reversed.)
Adjust
6.
viewing
7. Some
sjsrals
diagonal
properly
A
pattern.
Phase
elliptical
can be
Fig.36.
SWEEP TIME/CM
the
circuit.
the vertical
the
size.
typical
are
line.
adjusted,
phase
90'
shift
oscilloscope pattern.
calculated
generator
circuit
is clipped
Channel B
Channel
(The
and horizontal
Channel
in
of les
A and B
results
plrase,
If the
this line
shift
from
the oscilloscope
output for
being
be
observed on the
the
and the
probe
to the
control to
A INPUT
input
and output
oscilloscope
gain
are shown
the
oscilloscope
vertical
produces
(or
and horizontal
is
at a 45o
more)
The
the normal
tested.
sine wave
signal level
output
CH B.
probe
controls
Fig.
in
trace
angle.
a
circular
than
90o
amount
trace
If
oscilloscope.
to
test
for
35. If
produces
of
oper-
desired,
display on
must
of the test
the
input of
connections
inputs
a
suitable
the
is a
straight
eain
oscilloscope
phase
shift
ai
shown in
the
be
may
two
-are
an
If
UNKNOWN FREqUENCY
TO VERTICAL
STANOARD
TO
HOR IZONTAL
INPUT,
FREQUENCY
iNPUT
SEE NOTE((t
RAT
STANDARO
IO
UN KN
TO
2.1
OF
OI./
N
))
sEENorE
l:l
/2OSt
llz. I
NOTE:
Fig.
ANYONE
UPON PHASE
37.
Lissajous
ment.
OF
THESE FIGURES OEPENOING
RELATIONSHIP
waveforms
used for
frequency
measure-
FREQUENCY
Procedure:
l. Connect
C-H
B__INPUT jack
SWEEPexternal
2.
Connect
unknown
3.
Adjust
convenient,
4.
thr
the
resulting
ratio
Fig.
36. Phase
the
sine wave
.TIMEICM
horizontal
the vertical
frequency.
the
Channel
easy-to-read
pattern,
between
the
H
-A
6
g
=
PHASE
shift calculation.
MEASUREMENT
of known
of the
control
input.
input
oscilloscope
to CH
probe
A
and B gain
display.
called
two
a
frequencies.
(CH
Ussajous pattern,
ANGLE
frequency
and
n.
ftris provides
A INpUT)
controls
S; Fig.
to the
set
to
for
shows
j7.
the
the
a
SQUARE
WAVE
INTRODUCTION
A
square wave generator
scope,
various
square.wave
of
ya_v9_ls
tubes
and
signal.
stray
response
reproduction
a_mplltler
limitations.-.Poorly
introduce
is
number
t-ry9
500
Irequency
ry_spond
2l
it' we
4gtng
oltterent
controlled
output
harmonics
sees
lnstruments
such
types
odd
harmonics
1.5
ryj9ct9d
kHz,
2.5 kHz,3.5
and
transistors
reproduce
Interelectrode
capacitances
are a few
can
unsatisfactory.
st harmonic.
distortion
As
st^ated-
of
odd
amplifier,
-3n
Hz
only,
we
to
The
need
realize
normal
_lrequencies.
signal
qual^ity
.
of
when
or
as this
of distortion
of a
into
a square
of
.a.
minimize
before,
harmonics.
but
can
input
for
square
that
use
with
of
the,square
amplifying
voices.
TESTING
instrument,
given
of
as
we
by
signals
some
to pass
present
frequency
that frequency.
a
circuir,
kHz,
also
are
non-linear,
wave
capacitances,
well
as
of
square-
designed
to
determine
a
limited
the
factors
wave
the
point
the
a
square
By
can
.evaluite
injecting
from
wave
audio
simultaneously
With
which
we
signal
*ave)_which
complex
OF AMPLIFIERS
and
a low-distortion
can be
in electronic
contains
If a
frequency
provided.
are
it is
which
distortion
or defective
injecting
a square
how
500H2
evaluation
amplifiers
a
square
can
of many
.
difficult
is
identical
junction
device
which
sigral.
caused by
where
their
wave
contains
a 500
airplifier
wave
the
up
becomes
a large
wave,
evaluate
frequenciis
ii what'the
waveforms
used
a large
500i2
componenis
and
prevent
A
amplifiirrs
amplifier
to the
will
oscillo_
to display
circuiti.
number
Sirice
vacuum
to amplify
to
the iirpui
capacitanies,
tiansformei
faithful
well-desigrred
performanci
a large
Hz
sine waie
response
of ihe
would
l5th
apparent
be
rbquired
number
we
have
ihe
input
amplifier
of
musical
A
square
of
these
can
at
sami
or
of
a
and
(the
33
Page 36

The
extremely flat so that
distortion that
response.
DC as it
frequencies.
quency
low erd
of the bandpass;
of the square
end of
of
the amplifier bandpass
It
should
amplifier
espicially
ariplifieis).
-amplifier
of
overall-amplifier
deficiencies
some
wave sigral.
[he amplifier,
testing
specifications
judgment
better
TESTING
Connect
l.
the input
2. Connect
output
wave output of
square
may be observed
The oscilloscope
will
introduce
When
the
square
the amplifier
of
wave, distortion
be noted
should
important
fhe square
performance and
Whether a si-1,;
on
PROCEDURE
the
of
the CH
of the amplifier
the
checking
wave input should
however,
be made
in limited
quality.
not readily
it is
the
amplifier
perforrnance.
its
of
output
the
amplifier
B test
the
it does not
least distortion,
bandpass up
':ecause
that the
wave signal
The square
important
(Refer
of
signal
when evaluating amplifier
vertical input
ampliher response,
toward
of the harmonic content
will
occur
reached.
is
actual response
;.rsing
a sine
bandwidth
provides
will
apparent
or
wave
probe
being
square
that
known in order
be
Fig. 38)
to
the square
tested.
being
the oscilloscope
of
tested'
generator
contribute
sttould be set
especially
be
before
wave sigrral.
amplifiers
give
wave also
when using
the manufacturer's
wave
must
to any
at
the fre-
varied from
the upper
the upper
of
check
This is
(voice
quick
a
an,
wave is used
check-
estimate of
will
reveal
a sine
to make a
generator to
to the
be
to
low
the
end
for
an
DC
If
3.
the
sufficiently
component
AC-GNDDC switch.
used
frequencies
4. Adjust the
viewing height.
Adjust
5.
wave display
For
6.
use the 5X magrrification.
ANALYZING THE
The
half-cycle is created by
high frequency sine wave components.
and
true for the rapid
maximum amplitude
half-cycle
amplitude alone
produce
of one
square
Distortion
categories:
component
low to allow both the
to be
without affecting the results
(below
vertical
sweep time
the
on the
a ciose-up
short
point.
rounding of the square corners at
a
view
WAVEFOR-II{S
time which
rise
drop
Therefore, a theoretical
of the high frequency components should
wave
cycle
can
of the
viewed,
5 tlz).
to zero
be
use the DC
However,
gain
control
control
screen.
portion
of a
occurs
the
in-phase sum
the end of the half-cycle from
at
amplitude
(See
Fig. 39).
classified
circuit being
AC
the
except
for
for one
of
the
at the beginning of the
of all the medium
into three distinct
tested
AC
and
position
position
cycle
The
at the 180- or
all four
of the
may be
at very low
a convenient
of
square
wave,
square
same holds
reduction in
points
DC
I
l
is
I
t
SOUARE WAVE
GENEFATOR
@
o
p
o
pofr@i9i
CHB
ADJUST VERT
GAIN FOR
CONVENI ENT
VIEWING
HEIGHT
FI
AMPLI
BEING
CIRCUIT
TESTED
ER
OUTPUT
,ADJUST
SPEED
CYCLE DISPLAY
SWEEP
FOR 1
34
Fig.
Equipment set-up
38.
for square
wave testing of amplifiers.
Page 37

Fig.39.
Fig.40.
Square wave response with high frequency
loss.
poor low
Response
and nlsn
enos.
curve
of amplifier
with
frequency
The first
t.
change
.otnil.^
an amplifier
Iilters created
will create
response curve.
The second
2.
change
waveshape
vacuum
as
extreme case,
clipper
3. The third
distortion
more components
In actual
wave component
frequency-selective
a
inductance
difference
phase
distortion
wave testing
distorted
the
amplitude
In a typical
accurately
circuit.
revealing
compensated
applied
This figure indicates satisfactory
4lA.
response
low frequency
applied
Fig.
41B.
the region
overcompensation
rise
the
at
As
wave
can
up
to the l5th or
ly 40
times the
rule of thumb, it is
require at least
the
complete spectrum.
Hz
100
about 4000
10,000
is
norhal
from
waveform.
circuit
peaks
is
in waveshape
to non-linear
tubes,
network.
is delay
produced
practice
(sinusoidal
or both.
phase
in
or delay distortion.
practical
of
square
phase
and
wide band
reveals
The response
poor
low-frequency
high-frequency
to
input of this
the
(approximately I kFIz
response.
to the input
This figure displays
of 1000
top of the leading
of thumb, it can
a rule
be used
square
[Iz, a 1000 Hz
to reveal response and
20th odd harmonic
fundamental
a two-frequency check
wave will
FIz. To
amplitude
In other
of
by
combination
or dips
non-linear
an iron core
a deliberate
by a shift
of a complex
a reduction
network
presence
The
angle
circuitry,
wave includes a combination
distortion clues.
many distortion characteristics
of an amplifier
of this same amplifier
to 4000llz but clearly
at the higher
seen
ln the case
analyze
square
refers to
distortion
words,
resonant
in an
distortion
produced
components
non-linear circuit such
phase distortion,
or
harmonic) is usually
between comPonents,
amplifier, a square
response . along
boost. A l0O
amplifier
fo
Next, a l0O0
good
l0 kHz region
edge of the square
be
of the
that rvide-band circuitry
encompass components
above
wave should be satisfactory.
and
a component
of
the introduciion
networks
of reactive
otherwise
by
transformer,
phase
in
waveform.
in amplitude of a square
which includes capacity,
ofthe C
Therefore, in square
we will usually
is indicated in
will
medium frequency
2 Wlz) but
frequency response
safely
or up to approximate-
square
to
illustrated by
4000 Hz and beyond
or selective
comPonents
flat frequency
and refers
application
elements such
or
between one
or L introduces a
wave check
with over'
Hz
squ,ue
appear
shows
Hz
squiue
appear as in
will
reveals the
by the sharp
wave.
said that a square
phase
relationships
wave. Using this
properly
the
of
to a
of the
in an
and
as
which is
caused by
creating
{ind that
the
of
Fig. 40'
wave
Fig.
as in
poor
wave
will
analyze
Fig. 40,
up to
a
in
a
or
of
in
a
Hz
roo
SOUARE
IAVE
Fie.41 .
-
Resultant
from amplifier
100
Hz and I kHz
in Fig.45.
square waves
Now,
shows a rise from
flattening
we
100 Hz
and
same
low-frequency
such as to only depress
the square wave,
obtained. However,
ponent,
element,
producing
the region between
from
out
expect that the higher frequency
can
square wave will be relatively normal in amplitude
phase
but that the lower frequency
square
If the
wave, will
combination of
as
already noted, is usually
causing, in turn,
the strong tilt of Fig.
poor
beyond
response
a curve
reduction
100 Hz
and 4000
low-frequency
1000
and 4000
components in
components in this
be strongly
of this amplifier. See
elements
the low
similar
phase
a
modified
in this amplifier were
frequency
Fig.
to
in amplitude to
caused
strift
of the component,
4lA. Fig.
Hz
Fig.40
in
response to a
Hz. Therefore,
by the
Fig.
components in
42
by a reactive
43 reveals
the
poor
41A.
would be
a
com-
35
a
Page 38

Fxl
OUT-OF.PHASE
Fig.42.
Reduction of square
frequency
Fig.
43. Square wave
phase
component in a tuned
tilt resulting from
shift.
wave
fundamental
circuit.
3rd harmonic
Fig.
Tilt resulting
45.
trequency
gaphical
tilt is
phase-shifted
very
the square
by
direction.
frequency
opposite
polarity
seen to be
slight
Fig.
44
phase
a l0'
development
3rd harmonic.
shifts in
wave.
indicates the
shift of a
Fig.
component in
in
the two
of the
checked through
Fig.
45
been reduced
noted
characterized
the
square wave.
indicates low-frequency
in
that these
by
from phase
in a lagging
of a
caused
phase
tilt
low-frequency element
45
indicates a 10'
a lagging direction.
cases
phase
angle in
algebraic
addition
amplitude
examples
change in
shift of
fundamental
direction.
similarly
by the strong
are
in square wave
tilted
square
influence
It
also
becomes evident
quickly
shown
shape
phase
strift in
because of the
the two
of
cases as
components.
difference
components
and
shifted
of low-frequency
phase.
in
distortion
shape of the flat top
wave.
of the
that
up by
tilt in
produced
in a leading
a lowl
The
tilts
can be
which
have
It will
portion
The
are
in
be
are
of
36
FXI
Fig.
OUT
OF
,14.
Tilt resulting
frequency
PHASE
(LEAD)
phase
fro.m
in a leading
shift
of
direction.
fundamental
Fig.
low-frequency
46.
shift.
Fig.
4lB,
previously
overshoot produced
higher
overshoot
edge
explained
square wave,
the
components.
occurs
in the
greater
sum along the
frequencies.
makes
of the
itself
square wave.
by remembering
the sharp
summation
of a
If
an abnormal
at high frequencies,
square wave will
than
other components
leading edge.
component
discussed,
by rising
It
should
evident
This
that
rise ofthe
practically
the
be
loss
revealed
amplifier
again be
at
the top of
characteristic
in a normal
leading edge
inlinite
number
rise
in amplifier
high-frequency
phase
and
high-frequency
response
noted that
at th-e
this
the leading
relationship
well-shaped
is
created by
of harmonic
response
components
ii
amplified disproportionately
creating a higher
algebraic
Page 39

Fig.
47.
Effect
of high-frequency
boost and
poor
damping.
Fig.
accompanied
sinusoidal
the square
high "Q"
sudden transition
indicates high-frequency boost in an amplifier
47
by a lightly damped
"shock"
transient. The
type of diminishing oscillation along the top of
wave
indicates
network in the amplifier circuit. In this
a transient oscillation in a relatively
in the square wave
potential
from
case,
a sharply
the
rising, relatively high-frequency voltage, to a level value of
low-frequency
voltage,
supplies
the energy for
oscillation in
Fig.
48.
Effect
of high-frequency boost
damping.
the resonant network.
reasonably heavily
oscillation may
Fig.
be
49
summarizes the
If this network
damped, then
produced
serves as a handy reference.
good
urd
the
in
a single
amp'lifier is
cycle transient
as indicated in Fig. 48.
preceding
explanations
and
A. Frequency distortion.
reduction ol
ponent).
Low lrequency
G. High lrequency loss
shiIt.
low lrequency comphcse
No
phose
Fig.
(cmplitude
shilt.
shill. E.
phose
ond
B. Ipw
H. Domped
49. Summary of waveform
frequency boost
oted lundamentol).
Iow lrequency loss
shilt.
qscillollon
analysis for
(occentu-
phose
ond
square wave
testing
C. Hiqh lrequency
shiIt.
High
lrequency loss
quency
phose
Low lrequency phose
thickend
by hum-voltoge).
of amplifiers.
loss-No
shilt.
ond low
shilt
pbare
trc-
(trcco
37
Page 40

CIRCUIT
DESCRIPTION
The
breakdown of the
by reference to the schematic diagram.
GENERAL
vertical
network. The outputs of
switched,
switching of the CH
mined
LOGIC. The main vertical amplifier
OUTPUT AMPLIFIER, which drives
plares
amplifier.
calibrated
CH
converter
to
VERTICAL
identical circuitry
both. CH
transistor
fier
side
Ql04
gain
provide gains
'control
vertically across the
MODE LOGIC
from
MODE LOGIC
controlled
the
LOW, turning
amplifier.
goes
amplifier.
ICl03 are
CHOPPED
ALTERNATE
amplifier
sweep circuits.
the
amplifier.
VERTICAL
the
block diagam,
oscilloscope.
Basically, the oscilloscope consists
preamplifiers,
desired, into
as
position
the
by
of the cRT.
Horizontal deflection is
Drive
to the horizontal
sweep speed
preamplifier
B
All
supply
provides
the CRT.
Channel
A will
vertical
The
Ql0l
with output
panel
drive the differential amplifier
is changed
VRl02
Transistor
Trigger
IClOl
mode
The
panel
front
low turning on
When DUAL is selected
is turned
When the SWEFP
CH B
trigger amplifier sigral is
The
selected
vertical output
when X-Y operation is selected.
voltages are
a
PREAMPLIFIERS
A and Channel
and circuit
described below.
be
preamplifier
which forms a balanced
sigrrals
DC BAL
in
of 5,2, and l.
provides
array
circuitry.
amplifier
delivers the signal
and
of operation
by ICl03 and
MODE switch,
on the
When CH B is selected
switched on
mode, and after
mode:
AMPLIFIER
sigral
Fig.
50, outlines
Circuit details are obtained
each having its own input Attenuator
the vertical
the main vertical
A and CH B
of the
circuits
fully regulated and a
regulated,
opposite
of
control. Emitter followers
the emitters of
a DC component
screen.
ICl0l is
Ql07
ICl04.
CH A
the CH
and off at
When
providing a trigger
on,
TIME/CM switch
from
stage consisting
preamplifiers
MODE
provided
amplifier
or by
2kV,
B
operation is
consists
polarity. VRl0l
front
The
turned on
and
Ql08
to the
(CH
A, CH B, and DUAL) is
When
the
Q
preamplifier
the
preamplifier_and
B
the
a 200 kHz rate for the
each sweep
DUAL,
in
applied
preamplifiers
the
the
circuit
of two identical
preamplifiers
amplifier.
switch
feeds the
vertical deflection
the
by the
is furnished by
the signal from the
accelerated
preamplifiers
of dual
differential ampli-
and
Ql05
Ql05
panel POSITION
to move the trace
or off by the
buffers the signal
trigger
CH A is selected
output of ICl03
output
Q
and Q outputs of
Q
the
is in CH
to the
of transistors
can be
is
MODE
and
VERTICAL
horizontal
DC-to-DC
potential
contain
the
same
FET
Q103
QI06.
and
Ql06
amplifier.
and
of
when in
A trigger
CH
sigtal
position,
B
horizontal
is
applied
Ql13
The
deter-
for
input
is the
and
Stage
to
by
goes
trigger
ICl03
trigger
to the
to
to
which amplifies
Q120,
drive the
DC
frequency
TRIGGER
MODE switch
enables trigger amplifier
trigger amplifier
output
on in all
CH B.
SYNC
preamplifiers)
is
inverted
selected
adds
SYNC SEPARATOR
routed to
and
developed
input
The output of
posite
switch
the horizontal sync
to
lpSEC,
horizontal
SWEEP CIRCUIT
and
gates
SWEEP CONTROL flip-flop
the clock waveform,
turning off
and resistors selected
form
ramp
is
of IC30l is held
pulses
ramp exceeds the level set by
IC 302
set input forces the
Q307,
vertical deflection
balance control,
compensation
CIRCUIT
The
is fed thru transistor
AMPLIFIER AND INVERTER
Source
then fed
DC
a
When VIDEO*
19.
Q3
signal.
video signal.
When
(.lms
pass
to the
The trigger signal
to
the
of
Transistors
MILLER
a
voltage. The
fed to the holdoff
As
until the sweep
places
terminating
source,
trigger
5105.
positions
switch
or
to differential amplifier
(SLOPE-)
by SYNC switch
COMPONENT
the
SYNC
Q320
across C332
Positive-going
Q320
FRAME
in the
.5
to
sweep circuit. In the
19 is turned off, removing C33l and allowing
Q3
pulses
sync
SCHMITT
IC303. The output
Q307
soon as
a low on the set
the signal
while
adjustments.
either
Selecting
Ql07
and
Ql27
SWEEP
of the
5303
EXTERNAL triggering.
sec),
to initiate
Q308
INTEGRATING circuit
the Q output of IC30l
selects
non-inverted
or
to the output of
-
is selected, the
or
SEPARATOR
is held at cutoff
corresponding
pulses
corresponds
positions
19 is on; this allows C33l to hlter out
Q3
pulses, permitting
pass
to
passes
TRIGGER
the Q output
and
by the
ramp
sweep
circuit
low by IC303 to exclude any
ramp is terminated.
output
Q
the
sweep.
to the levels
plates
VRIOI and
Q128.
switch
5304.
to the sweep circuit.
pulses
IC30l. On
the
Q309
IC302
the CRT.
of
TCll3 are high-
CH A or
and
thru emitter
VR309
input of IC30l.
of
CH B, is selected by
CH A or
either
and CH
Q108,
TIME/CM switch
either INTERNAL
LEVEL
circuit consisting
drive
to the
of the
LINE positions,
circuit
sweep.
and the
SWEEP
from the collector
and IC303.
IC30l high
trigger
The
Q3l3
Q313.
The trigger signal
IC305.
(SLOPE+)
control
IC305.
output
negative
by a
to an average
Q320
sync tips
SWEEP
vertical
only
consisting of
from IC303 clock the
the
negative
of IC30l
timing capacitors
TIME/CM
to
goes
When the sweep
(SWEEP
required to
VRl05
out
of the com-
follower
provide
low, the reset
A low on the
which turns on
is a
DUAL
B enables
amplifier
turned
is
except
(from
Either
of 1C305
value
TIME/CM
sync
the
signal
VR3l0
of
Q320
voltage
ofthe
of cutoff.
pulses
50irSEC to
Q303,
two
edge of
goes
low,
switch,
a linear
of
Q309
new clock
LENGTH),
is
is
38
Page 41

<=
_u
FF:J
9d?
<!!
z9+
a>J
=tr9
>a
I
4x
YT
=<
3>
Ct
UO]
9i-
3cc
ZrF
NFi
x:>
Y"<
<s
z=
ii>
!L
-<
(
o
[<
z
[-:>
I
--
O
l
I
a
-I
<a
QU
oN
I
O
rd
UF
Zz
-aO
Lr
aO
.\4
J=
u
clt
<=
a>
J
<(r
o91
-u
sd
<s
O*
35
F<
il:)
>z
<F-
I<
<2
-r
ra
EO
.,r E
:U
<:
rC
a>
<
F-
(,
4
-5?
=95
.)fu
6
lns
f
L
ti:
;>
;\-
J
<F
()V
=k
til
>3
>il
.,2
Z^
i=
ul
G.z
-l
zs";
6{>
D<
@t-
u
5a
l
u
6Z
r;
vr
F
l
U
!(J
xZ
ud
!l
<L
39
Page 42

AUTO
SWEEP
Transistors
SWEEP
(AUTO)
C303
reset
determined
SWEEP TIME/CM
transistors
off
sipal.
circuit.
charges
of IC30l
and enabling the
Q304,
When
and no
and turns
and allows a
by the resistor
Q3O4
Q305,
the trigger level
sigral is
switch.
and
Q305
sweep to trigger on the
and
present
Q306
When
at
this
on,
sweep
and capacitor selected by
a trigger signal
discharge
form the AUTO
Q306
control is
the
trigger
places
C303,
a low on the
turning
to recirculate
pulled
out
amplifier,
a rate
at
present,
is
Q306
incoming
the
CHOPPING
Two NAND
20Okllz
positions
selected. IC3O4
during
VOLT
I
Transistors
wave.
OSCILLATOR
CHOPPING
of the
retrace
and
CAL SIGNAL
VR30l adjusts
gates
from
OSCILLATOR
swEEP TIME/CM
provides
when
and
Q30l
the amplitude of the CAL SIGNAL.
1C304
pulse
a
chopping.
Q302
and IC305
activared
switch when
for
blanking
provide
a
in the
Hz
60
form
CHOp
DUAL
the trace
is
square
a
HORIZONTAL
The
thru VR306
amplifier
VR305
horizontal
thru
and
Q3l7
plates
adjustment and VR304
adjustment.
is
When
IC303 and the
the horizontal
and
of
High voltage
tical amplifier
operating.
Line voltage
amplifier
POWER on-off
to
an ac
caution when
ting
exposed high
AMPLIFIER
sweep ramp
(timing
consisting of
a horizontal
position
in the
Q318
the
Up to
power
&
power
from
adj.) to the input of the
centering
control.
X-Y
mode,
CHB
amplifier. The
is applied to the horizontal
cRT. vR303
up to 2000 volts is
power
&
180
(120
volts dc is
or 240 VAC) is
supply
switch any time the oscilloscope
source, even if
the housing is removed
voltage
the
collector of
Q314,
Q315, Q317,
adjustment and VR3
transistor
signal is
is the magnification
applied
output of
is the
Q3l3
X5
is applied
Q309
horizontal
and
Q318.
is the
is
turned
to both
magnification
Q3l2
transistors
deflection
centering
off
MAINTENANCE
present
supply board when the oscilloscope is
board,
could result
on the CRT and ver-
present
on the sweep board.
present
power
turned off. Always observe
on the vertical
transformer,
is connected
from the unit.
in fatal electric
the
and
Contac-
shock.
POWER
operating
provided
output
DC-to-DC
output
voltage
fed
provide
operating
AND
cedure
CRT ROTATION ADJUSTMENT
SI.JPPLY
power
The
the oscilloscope.
Regulated
stages require
The
of T10l
dividers
to a
CALIBRATION
Internal
can be located
1. Loosen two
output
for
all logic
accelerating
converter
regulator
a
constant accelerating
conditions.
B & K.PRECISION
DYNASCAN CORPORATION
adjustments outlined
supply
the 180V.
voltage
is rectified
to the
circuit
SERVICE
2815 W. Irving
Chicago, Illinois
screws on rear
provides
voltages
consisting
CRT. A
by
of
amplifier
and
for the
of
and filtered
portion
consisting
DEPARTMENT
TEST EQUIPMENT
Park Road
reference
panel
all voltages
+10,
CRT is derived
Ql42
of
potential
60618
in the
to Fig.5l
with
necessary
and -8, and
circuits.
and T101.
and applied
of the high voltage
Q129
under
calibration
and 52.
adjustment
Amplifier
and
+5
from a
Ql30
var.ied
slots.
for
are
The
thru
is
to
pro-
HOUSING REMOVAL
l. Remove 6 screws; 2 on left side, 2 on
on top.
2.
Lift cover off
24O VAC
l. Remove housing from
2. Remove
3.
Rotate
4.
Replace 0.7A fine
5.
Replace housing.
The calibration
which
can be
equipment. Additional
compensation and horizontal
attempted
specified
information
40
test equipment.
scope.
OPERATION
scope.
plug
from Pl0l.
plug
I 80"
performed
without
for this oscilloscope
reinsert
and
with 0.3A
adjustments outlined
with
a minimum of
intemal adjustments
complete service
sweep linearity
Requests
on
fuse.
should be
right
side, and
Pl0l
.
are
here
specialized test
of frequency
should not be
information and
for
complete
addressed
2
those
service
to:
2. Grasp
3.
DC
BALANCE
l. Adjust
2. Adjust
3. Rotate
4.
VERTICAL
a square wave
accuracy is
cover and rotate
horizontal
Tighten two
cH
vertically
5VICM while
If the trace
performing
(side
movement
performing
The following
graticule
controls to obtain
B).
i
on
VOLTS/CM
the
panel
GAIN ADJUSTMENT
available.
to aligr horizontal
line.
screws.
ADJUSTMENT
a horizontal trace.
pOStfION
the CRT.
observing the trace.
moves vertically more than
STEP 3,
screwdriver adjustment)
of the trace
STEP 3.
adjustments
generator
control to
switch from lV/CM
adjust the CH A or CH B DC
does not exceed 5mm whiie
should be attempted
with l%
or belter
trace with
(CH
or
A
center
so that the vertical
the
trace
to 2V/CM to
while
5mm
BAL
only if
amplitude
Page 43

VR1 06
@
FUSE:
-O.7A
120V
240V -O.3A
120V
F
TC113
@
il
'IO
VR
VRl04
@
1
VR105
@
TC',r03 TC101
@@@
TC109
@@@
I
VR4O1
TC107
VR103
?tt ,'h
TC102
rC108
VR108
@
VR109
VR107
@ HHE
@
,U,
Q^'^'"o
VR113
TC106
TC104TC105
@@@
TC112
TC1
@@@
10
/-r
\-i
TC1
1 1
P1
01
il
VR111
F
ROTATE
CHANGE
vR1O1
VB103
VR'I04
VR105
VR 106
VR 1O7
VR108
vR109
VR110
VR1'I1
VR113
VR4O1
VR4O2
240V
TO
PLUG
VOLTAGE
CHA
DC
BAL
CHA
GAIN ADJ
HIGH
FREQ
CENT
ADJ
ASTIG
_
1.9
KV ADJ
INTENSITY
18OV
+
X
GAIN
CHB
CHB
CHA DC
CHB DC
ADJ
ADJ
ADJ
DC
BAL
GAIN ADJ
BAL
BAL
(1)
ADJ
(2)
(2}
hocediue
1. Set
CH A
2.
Apply I kHz
CH A input
3.
4. Repeat
HORIZONTAL
l.
VRl03
Adjust
5cm
Set
rotation.
steps 2
deflection.
<>POSITION control
Fig.
5l'
calibration
CH B VOLTS/CM
and
square wave
connector. Set mode
for exactly
and 3 for CHB
POSITION ADJUSTMENT
switch
of 50mV
switch to
5 cm
of deflection
and
to
the mechanical
FRONT
PANEL
diagram,
to .OIV/CM.
peak-to-peak
adjust VRl13
CH
on CRT.
center
vertical
A.
into
for
of
amplifier
and
2. Set
3.
Adjust
horizontally
4.
Tum
amount
minimum
ASTIGMATISM
l. Rotate
2.
Adjust
small,
power
supply
SWEEP
TIME/CM
VR305
the <>POSITION
of
SWEEP
FOCUS
bright
so that
centered
deflection
of
4
cm.
ADJUSTMENT
TIME/CM
control
spot with
TOP
board.
switch to
on CRT.
control full
in both
INTENSITY
lmS/CM.
the
line on
directions
switch
and VRl06 (ASTIG.)
to EXT
CW
set
VIEW
at
the
scope
and CCW.
should
H. position.
midrange.
for
is
The
be a
a
4l
Page 44

TC301
@
VR3O9
@
VR3O5
@
VR3O6
@
VR3O4
@
VR3O3
@
vR3'to
@
VR3O1
VR3O3
VR3O4 MAG
VR3O5
VR306
VR3O8
VR3O9
VR311
TC301
CAL
MAG
POS
TIME
X
CENT
WIDTH
TRIG
TIME
FOIL SIDE
ADJ
GAIN
CENT ADJ
ADJ
ADJ
ADJ
ADJ
ADJ
(lps-5Ops)
ADJ
VIEW
VR311
Fig.
52.
Calibration
diagram,
horizontal
amplifier
VR3O1
@
VR3O8
@
board.
42
Page 45

WARRANTY
SERVICE
INSTRUCTIONS
MAINTENANCE
i.
2.
If
your
product,
a
parts
department,
enclosed
Illinois 60635
result of unauthorized
removed.
damages
damages,
state.
authorized
cannot
lrving
to the
Refer
adjustments
that may
If the above-mentioned
your
with
Enclose
or
agency
your
DYNASCAN
period of one
DYNASCAN
To obtain
a
ship PREPAID
(see
list of
distributor
local
and the
upon delivery to an
warranty registration
Exclusions:
DYNASCAN
resulting
so the above
warranty
This
your
I.or
to
obtained
be
Park Road, Chicago,
pack
unit,
letter describing
(UPS
enclosed
list
authorized B &
for the
CORPORATTON
component
year
from the
will, without charge, repair
accompanied by
warranty coverage,
within five
This warranty
convenienoe
make repairs or can refer
alterations
shall not be liable for any
from loss of
limitation
you
gives
locally,
section
be applicable.
procedures do
sicurely
it
(preferably in the original carton
problem and
the
preferred) to
with
unit).
K-Precision
name of
your
Service
K-Precision
B &
DYNASCAN
28 l5 West lrving
Chicago,
LIMITED
parts
date of
authorized B &
proof
(5
days)
does
specific rights and
wr) suggest
please
Illinois 60618,
ONE-YEAR
warrants to the original
will be
thereof,
purchase.
of the date
product
this
card to
use. Some states do
DYNASCAN, B &
from the
or exclusion may not apply
send
date of
not
apply
repairs.
or
you
you
the unit
properly packaged
your
of
not
B &
correct
include
the nearest B &
service agencies
nearest
service agency, or write
Deprtment
Product Group
CORPORATION
Park Road
Illinois
60618
WARRANTY
free from defects
or replace, at
K-PRECISION
purchase
of
must be
purchase.
in the event
It
void if
is
consequential
not
allow
you
may also
your
contact
to the nearest
to B &
B &
K-PRECISION
K-Precision
problem
the
instruction
you
are experiencing
or double-packed).
your
purchaser
its option,defective
service contractor
the form of a sales receipt.
in
registered by completing
K-PRECISION,
of
misuse
serial
the
damages, including
limitation
you.
to
have other rights
K-PRECISION distributor,
service contractor.
to avoid damage
and address.
name
K-Precision
has
in workmanship and materials
or abuse
number is altered'
Service Department,23l5
authorized
misplaced, contact
been
its
that
product
or the factory
P.O. Box 35080, Chicago,
of the
of incidental or
which
in shipment.
Deliver
for
to,
manual
service
to:
K-PRECISION
B &
or component
and mailing the
product
without
consequential
vary from state to
who
If warranty scrvice
service
or
defaced
limitation
may be
for
as a
or
West
43
Page 46

OMIONAL
ACCESSORIES
following
The
able to
complement
B & K-PRECISION
your
Model
1476
MODEL LC-74 PROTECTIVE COVER
This rugged
venience and
pocket provides
handy
A
MODEL RM.I4 RACK MOI.JNTING
kit includes everything needed to
This
oscilloscope in a standard
hardware,
and complete instructions.
INSTRUMENT CONNECTING
following
The
purchased
be
oscilloscope
Model
grained
protection
leatherette cover
when transporting the oscilloscope.
stowage
for
KIT
19"
rack, including
CABLES
B & K-PRECISION cables, which
separately,
may be
useful for
directly to other equipment:
CC-41.
36'
RG/58U with a
each end.
Model
CC-42. 36' RG/58U
UHF connector
Model
CC-43.
banana
Model
plugs.
CC-44. 36" RG/58U connector
microphone
(PL-259).
36"
connector.
Model CC-45. 36'
type N
connector.
RG/58U with BNC connector
RG/58U
with
with
accessories
are avail-
Oscilloscope.
provides
probes.
mount the
panel,
connecting
BNC connector
BNC connector and
and coaxial
BNC connector and
con-
may
your
on
and
MODEL PR-37
The B &
designed
PR-37
tion. A
reference
The
52"
with
ed
sulating
tion capacitor
probing
nearby
The
BNC
fitting,
The
IC
DIP,
making it
The PR-37
different
for instant
nected.
vinyl
case.
K-PRECISION
for
use
is
a slim-body
three-position
position
coaxial
the PR-37
tip BNC
adjustment
dense
components.
BNC
adapter
ideal for interface
guides
tip
is available
colors are
identification
The PR-37
Model PR-37G
DELUXE
with wideband
that
cable is extremely
are
tip adapter, IC
solid-state
the
almost impossible
particularly
and
PROBE
probe
of
switch select
grounds
a spring-loaded
tool. The
circuitry with
tip converts
probe
with
contact
in
both
of the
channel
accessories
grey
is
Model
PR-37
oscilloscopes
precision
the tip
tip
grey
useful with
lightweight
l0:l
or direct
through
flexible.
and an insulated
insulating
the
test
to
come
Accessories
retractable
no danger
probe
points
into
any
short two
and red
a dual-trace
which
to
in
convenient zippered
PR-37R
and
probe
deluxe
to
I0O MHz.
construc-
modes,
a 9M
resistor.
includ-
tip
cover,
compensa-
tip is designed
of
shorting
tip
or output
pin
colors.
push-on
into a
pins
a
jacks.
of i standard
of
an IC.
probes
scope
is
orobe
is red.
is
The
or a
in-
for
of
con-
MODEL
tion envelope of
This
PR.32 RF
probe
permits
DEMODULATOR PROBE
display and analysis
RF signals to 250MHz
25OMHz). Input impedance
pF
4.5
by
stray
maximum. Internal
pickup.
RF
of the modula-
is 30kO
minimum, shunted
shielding protects
C6dB
against
@
ffi
F
Page 47

West
6460
Chicago,
trlYNASCAN
COF|POF|ATION
Cortland
Illinois
Street
60635
480-262-9-00t
 Loading...