

Page 1

!47 1
v
D
u
10 MHz,
-T
al
TRIGGERED SWEEP
r
ace Osc
I I I
osco
p
\
v
Product
A
of DYNASCAN
CORP0RATI0N
West Belle Plaine
1801
.
Chicago,
lllinois 60613
PRTCE
$2.00
Page 2

lv
INSTRUCTION MANUAL
FOR
b
B
10
MHz,
DUAL.TRACE
K.PRECISION
&
MODEL
L47T
TRIGGERED
OSCILLOSCOPE
SWEEP
v
DIVISION
OF
| 801
DYNASCAN
W.
Belle Ploine
Chicogo,
lllinois 606I3
CORPORATION
Avenue
Page 3

INTRODUCTION
FEATURES
SPECIFICATIONS
TABLE
OF CONTENTS
\t
Page
OPERATOR'S
OPERATING INSTRUCTIONS
Initial Starting
Single-Trace
Calibrated
Calibrated Time Measurement
External Horizontal
Z-Axis
Dual-Trace Waveform
DUAL-TRACE
Introduction
FrequencyDividerWaveforms
Dvide-by-8CircuitWaveforms... 14
Digital
Gated Ringing
DelayUneTests
Stereo
Television
SINGLE-TRACE
Introduction
Television
Signal Tracing
Composite Video Waveform Analysis
Sync
VITS
Vectorscope
CONTROLS, INDICATORS AND FACILITIES
Procedure
Waveform
Voltage Measurement
lnput
APPLICATIONS
. .
Circuit Time
Circuit 14
Amplifier
Servicing
APPLIC
. .
Servicing
and
Pulse
Analysis
(Vertical
Interval Test Signal)
Operation
Observation
(X-Y
Input
Observation
Relationships
Servicing
ATIONS
Peak-to-Peak
Operation)
...
Voltage Readings
. . .
. . .
......16
9
9
10
ll
l2
t2
t2
14
14
14
v
l6
t7
18
18
t9
t9
r9
2l
23
TELEVISION
Introduction
Importance
Sweep Alignment Methods
Tuner
IF Alignment
ChromaAlignment...
ALIGNMENT
. .
of Sweep
Alignment
Alignment
26
26
27
28
29
29
v
Page 4

v
FM
RECEIVER
ALIGNMENT
TABLE
OF
CONTENTS
Page
,...31
b
PHASE
MEASUREMENT
FREQUENCY
SQUARE
CIRCUIT
WAVE
Introduction
Testing
Procedure
DESCRIPTION
General
Vertical
Mode
Vertical
Trigger
Sync
CALIBRATION
CH
l12
Vertical
Horizontal
Preamplifiers
Iogc
Amplifier
Circuit
Amplifier
I
and CH2 DC
and l/5 Attenuator
Gain
Position
MEASUREMENT
TESTING
.
OF AMPLIFIERS
and Inverter
ADJUSTMENTS
Balance
Adjustment
Adjustment
. . .
Balance
3l
33
34
34
38
38
38
38
38
38
40
40
40
40
40
50
40
40
40
.
. .
40
v
WARRANTY
WARRANTY
INSTRUCTIONS
42
43
Page 5

The B &
loscope
observing
vertical inputs are
Dual
of two
waveforms are chopped
simultaneous
permits
waveforms.
rate
DUAL
K-Precision
is a laboratory-quality,
measuring
and
waveforms. Low-frequency,
viewing. Alternate
simultaneous
viewing
TRACE
FULLY
SOLID STATE
TRIGGERED
SWEEP
LARGE SCREEN
CALIBRATED
VOLTAGE SCALES
CALIBRATED
SWEEP SPEED
WIDE BANDWIDTH
Model
professional instrument
waveforms
provided for
200
a
at
high-speed,
of
input
Two
viewed
taneously,
the cathode
Only
filament.
transistors,
fe
e f
ct
Among
state construction
o
No stabilization
required.
time
o
o
o
o
o
The 147|'s
presentations
son
oscilloscopes.
at
being
they
waveforms
ing.
The 130 mm
diameter
easy-to-read
8
Accurate
stantaneous
ferent
Channel A and
Accurate
DC
nSEC
free,
at
power drain.
Low
Dependability
reliability
Ruggedness.
Light
Compactness.
with
until
rest
observed,
are
adjustable
Fully
the
allows
Waveforms
synchronized
trigger.
x 10 cm
area.
attenuator
different
18
to
l0MHz
rise time assure
high
frequencies.
high
Dual-Trace
l47I
in electronic circuits.
simultaneous
low
kHz rate to
of the two
sweep
waveforms
either singly
desired.
as
other stages
All
diodes,
transistors)
the advantages
weight.
stability
is beyond
non-triggered
The sweeps
triggered
always
desired
to be
to an
(approx.
cathode
presentation
rectangular viewing
measurement
voltages on l1
Channel
measurements
time
ranges.
bandwidth
resolution
INTRODUCTION
repetition
high
ray tube
are:
-
to assure
trigger
used
ranges
viewing
provide for
repetition-
can
or
FET's
and
of solid
warm-up
waveform
of
comPari-
by the signal
synchronized.
threshold
portion
for trigger-
also
can
external
5.1 inches)
ray tube
of the in-
for
B.
distortion-
presentation
Oscil-
for
rate
inputs
FEATURES
be
simul-
a
uses
use
(field
IC's.
sweeP
remain
that
the
of
be
sync
gives
on an
dif-
both
on
35
and
dual-trace
The
width,
provided,-make this
of applications,
electionic
laboratorv
wide
WIDE RANGE
SWEEP
SPEEDS
feature,
range
including
equipment,
instruction.
OF
EXPANDED
SCALE
HIGH
SENSITIVITY
TV SYNC
VECTORSCOPE
CALIBRATION
SOURCE
Z-AXIS
INPUT
together
of sweep
the ideal
research
Sweep
to
speed
forms
five
A
the horizontal
up
the
magnification
mum
pSEC/cm.
Permits the
impedance,
probes
measurements,
circuit
A built-in
included
television
SYNC,
pulses are automatically
at
0.1
vision
tal sync
selected
pSEC/cm
ing
The
scope
exactly
vision
A builtin
o-peak
t
checking
vertical
tional
Intensity
included
markers.
logic;
low state,
state.
with
speeds,
oscilloscope
troubleshooting
0.5
examination
waveform.
sweep
mSEC/cm
television
unit
and
and
range
speed
SEC/cm
necessary
from DC
magnification
time
sweep
low-capacitance,
to be used
loading.
sync
specifically
signals.
television
times
frames.
pulses are
at sweep
to I
lines.
may
provide a color
to
specified
as
manufacturers.
calibrated
square
and
amplifiers
equipment.
modulation
for time
Compatible
brightness
decreases
MHz band-
the 10
sensitivity
high
for a broad
and
development,
of I
provides
for viewing
to 10
sweep
of
a
In addition,
provides a maxi-
speed
l0:1
for
thus assuring
separator
When
vertical
of 0.5 SEC/cm
for viewing
Television
automaticallY
times
pSEC/cm
be used
by color
wave
recalibration
without addi-
or frequencY
increases
range
repairing
and
ptSEC/cm
every
wave-
MHz.
(5X)
close-
allows
portion of
the
of
highattenuation
virtually all
for viewing
I
in logic
less
circuit
using
sync
selected
tele-
horizon-
of
for view-
vector-
as a
displaY
tele-
peak-
volt
Permits
of the
caPabilitY
TTL
with
logic
in
high
of
5X
0.2
is
TV
to
50
v
v
\,
Page 6

SPECIFICATIONS
v
b
v
VERTICAL AMPLIFIERS
Deflection
Calibration Accuracy
Frequency Response
Risetime
Overshoot
Ringing
Input Resistance
Input Capacity
Max.
Operating
Chop Frequency
Channel Separation
SWEEP CIRCUITS
Sweep System
Sweep Time
Sweep Time Accuracy
Sweep
Horizontal
TRIGGERING
Source
Slope
Triggering
Factor
Voltage
Input
Modes
Magnification
Linearity
Range
(Common
(CH
0.01
calibrate
sequence.
!
5% on all
DC: DC to 10
AC:
35
3%
display.
3%
display.
I megohm,
22
300
p-p.
Channel A only.
Channel B only.
Dual-trace automatically chopped
at
slower; alternate trace automatically
times.
2OO kHz
Better than 60 dB @ I kHz.
Triggered and automatic.
matic mode,
without input
pSEC/cm
I
calibrated
quence.
!
5%.
Obtained by
sweep
mum
pSEC/cm.
3Vo or less distortion.
INT
sensitivity). MODE
source of internal
signal is the triggering
the CH A
the CH B
source in the CH B mode.
Positive
ly variable
AUTO.
20
deflection
ray
A aNd CH
V/cm
10 Hzto
nanoseconds.
or less
or
less at 100
(t
pF
3
(DC
V
all sweep times of I
selected
(x
to
CH A and CH B)
5 times
sweep
and
and negative,
Hz
to
tube).
B)
to 2O
range s in l-2-5
d
ranges.
(-
MHz
l0
MHz
kHz squarewave
at 100
kHz
+
5%.
pF).
+
peak)
AC
for
all faster sweep
2Wo).
sweep
signal.
to 0.5 SEC/cm in 18
ranges, in
enlarging
from
speed becomes O.2
EXT
switch selects
trigger;
and DUAL modes,
signal is the
level
control;
MHz
l0
as measured on
Y
in I 1
lcm
3 dB)
dB).
e3
squarewave
or 600
mS/cm
is obtained
center.
(lV p-p
continuous-
(rrrih.
and
In
auto-
l-2-5 se-
the above
Maxi
the CH
source in
and
triggering
pull
I cm
cathode
for
horizontal sync
TV Sync
HORIZONTAL
B Input)
CH
Deflection
V
A
Frequency
Input Resistance
Capacity
Input
Madmum
Voltage
X-Y
Operation
CALIBRATION
INTENSITY
Voltage TTL
Resistance
lnput
POWER REQUIREMENTS
Input
PROBES
Model No.
Attenuation
lnput Impedances
Connector
Tip
(Not
AMPLIFIER
Factor .01
Response DC
Input
VOLTAGE
MODULATION
Included)
Vertical
separator
any
form can be
expanded
and
automatically
CM
TW
mSEC/cm.
TVH
pSEC/cm.
megohm
I
pF
22
300
p-p.
With SWEEP
CH B
becomes the
the CH
input
tion control
position
tal
V
I
frequency.
increases
decreases
470 kCl
ll7 or 230
Ifz,
CSA-approved
See
PR-208
Combination l0: I
l0:1
Direct = I megohm,
BNC
SpringJoaded, hook-on tip.
and
provided
circuit
portion
TW
switch.
V/cm
to 800
V
p-p
logic-compatible.
20 watts.
Fig.
=
of
complex
synchronized
for
viewing.
(frame)
by SWEEP
=
=
(Horizontal
(t 3 pF).
(ttC
position,
(horizontal).
square
(nominal).
51.
or
l0
SEC/cm
0.5
pSEC/cm
50
V/cm.
20
to
kHz
e3
(nominal).
+
AC
TIME/CM
the CH A
Y
input
B input
becomes
control.
wave
brightness;
brightness.
VAC,
(3-wire
for oscilloscopes.)
PR-24B.
megohms,
Input
peak)
becomes
The
and direct.
so that
TV wave-
TVH
switched
sync
dB).
I
TIME/
to 0.1
to I
through
or 600
switch in
(vertical)
the X
CH B
the horizon-
(+
5%) atline
logic
Low
high logic
lVo,5016O
line cord,
pF.
l8
pF.
120
and
(line)
V
input
and
posi-
-
Page 7

6
7
8
10
19
18
Fig.
17
1. Front
panel
controls and indicators.
15
\'
Page 8

OPERATOR'S
CONTROLS.
INDICATORS
AND FACILITIES
v
v
v
Cathode Ray Tube
l.
the waveforms
1
Scale. The 8 x
marks for voltage
measurements.
Pilot
Lamp.
3.
4.
SWEEP TIME/CM Switch. Horizontal
selector. Selects
(microsecond
steps. In
internal sweep
provide
CAL I V
5.
peak
This is
attenuators.
<
>
POSITION
6.
position
dual
cation
when
TRIGGERING
7.
determines
starts;
(+)
equals most positive point
switch
(PULL
generated
EXT TRIG
8.
signal.
SYNC
9.
following
SLOPE. The SLOPE
waveforms except television composite video
(+)
(-)
TV. In the TV
television composite
the sweep; the
automatically selected
to
0.1
automatically
pSEC/cm
(+)
(-)
SOURCE Switch.
10.
sweep.
INT
EXT
Lights when oscilloscope
the CH
horizontal
P-P
square
used
of traces
trace mode).
when
pushed
points
(-)
equals
selects automatic
AUTO). When
even without
Jack. Input terminals for external trigger
Switch. Four-position
positions.
Sweep
waveform.
Sweep
waveform.
mSEC/cm, and horizontal
to I
Sweep is
Sweep
Sweep is
switch
Sweep
MODE
Sweep
at the
(CRT).
viewed.
are
l0 cm
calibrated sweep times of 1
per
centimeter)
B
generator
sweep.
Provides
Jack.
wave input
for
calibration
Control. Rotation
(both
Push-pull
pulled
in.
LEVEL Control.
on
most
is triggered
is
triggered
vertical sync
selected
pSEC/cm.
triggered on
is triggered on negative-going sync
Selects triggering source
triggered
is in CH A or DUAL
is triggered by
switch is in CH B
is
triggered by an
EXT TRIG
This is the
graticule provides
(vertical)
position,
out
waveform
negative
automatic triggering, a
an
positions
positions,
video signal are used
for
and time
to
this switch disables the
permits
and
calibrated
at the line frequency.
signal
of
the vertical amplifier
traces when operated in the
switch selects
(PULL
Sync level adjustment
point
of triggering. Push-pull
triggering when
input
signal.
lever
are
positive-going
on
on
negative-going
the sync
times of 0.5 SEC/cm
sweep
sync
for
sweep times
positive-going
CH
by
A signal
position.
Channel
position
jack
external
8.
screen on
is turned on.
0.5 SEC/cm in l8
the CH B input
I volt
adjusts
MAG):
5X
slope
of triggering
switch
for
used
pulses
pulses
B signal when
signal applied
which
calibration
(horizontal)
sweep
where sweep
pulses
(frame)
when MODE
time
pSECicm
peak-to-
horizontal
5X magnifi-
normal
and
pulled
sync
out
sweep is
with
the
viewing all
signals.
slope
slope
of a
to
trigger
are
(line)
are
of
pulse.
pulse.
for
the
to
of
of
50
Channel B
I l.
ment for
adjustment
CH
Channel B DC BAL Adjustment.
12.
adjustment
Channel B INPUT
13.
B. Jack
SWEEP
14. Channel B
DC Direct
GND
AC Blocks DC component
Channel B.
15.
Channel B.
from
horizontal sensitivity
switch 4 is in the CH
MODE
16.
basic operating modes
CH A Only the input signal
CH B
DUAL Dual-trace operation; both
17. Channel A VOLTS/CM
Channel A. Vertical
from
18. Channel A DC-GND-AC
DC Direct input of
GND Opens signal
AC Blocks DC
19. Channel A INPUT Jack. Vertical input
A.
20. Channel A DC
adjustment for
Channel
21.
justment
FOCUS
22.
POWER/INTENSITY
23.
rotation
oscilloscope.
Further
trace.
POSITION
Channel
when SWEEP
position.
B
for
becomes
TIME/CM switch
DC-GND-AC
input
signal.
Opens
signal
amplifier.
position
the
performing
when
VOLTS/CM
Vertical
to 20 volts
.01
Switch.
played
Only the
played
Channel B input signals are
separate
to 20 volts
.01
signal.
amplifier. This
position
the
performing
when
A POSITION
for
Channel A
Control.
of this
Clockwise rotation
clockwise
Control.
B trace. Becomes
Channel
Jack. Vertical input
external
of AC and DC
path
provides a zero-signal
This
of which can
sensitivity
position.
B
Three-position lever switch; selects the
of
as a single
input
single
as a
traces.
sensitivity is calibrated
per
AC and
path
provides
of which
component
BAL Adjustment. Vertical
Channel A trace.
Control. Fully
control
rotation
Vertical
TIME/CM switch
B trace.
4 is in the CH B
Switch.
and
DC measurements.
Switch.
per
when the SWEEP TIME/CM
the
trace.
signal
trace.
Switch.
cm.
Switch.
and
measurements.
DC
Control. Vertical position
trace.
(OFF
increases
horizontal
Vertical DC Balance
horizontal input
component
grounds
be used
of input signal.
Vertical
is
calibrated
This
cm.
oscilloscope.
to Channel
to Channel
the
displayed on two
Vertical
DC
component of input
grounds
zero-signal
a
used
can be
of input signal.
position)
turns on oscilloscope.
position
jack
input to vertical
attenuator
control
Channel A
attenuator
input to vertical
jack
counterclockwise
brightness of
adjust-
position
4 is in
the
of Channel
when
position.
of
input
base line,
reference
a
as
for
in 1l steps
adjusts
A is
dis-
B is dis-
and
in
as a reference
of Channel
DC
for
1l steps,
base line,
balance
ad-
turns off
the
Page 9

INT MOD
24.
25. AC Line Cord
loscopes.
Pro.bi]*9-Fie'
26'
and
designed
Jack.Intensity modulation
tu
PR-24B
combination
for
(Z-axis)
(See
Fig.
"6'
2). CSA-approved for oscil-
\s!w
2'' ven-ar,PrvYvu rvr
3-)' The B & K-Precision Model
use with this oscilloscope. However,
l0:1/Direct
probes
CRT
input.
Pl':jt
have
ROTATION ADJUSTMENT
been
any
probe
designed for
nominal input impedance
pF
J5
and capable of
-"
"
ir::l"r
io,
overray
vectorscope
DC
(One
(Not
operation.
BALANCE CONTROL
on each
use with an oscilloscope hav
of I megohm
operation up
shown).
side)
rnterchanges
to
10MHz, c
shunte
with
-r>
1.
2.
PULL
APART
ATTENUATION
ROTATE
1O:1
180'
Fig.2.
Rear
and
panel
side
FROBE
COMPENSATION
(PR-2OB
facilities.
ONLY)
PROBE
COMPENSATION
(PR-
ADJUSTMENT
248
ON
ADJUSTM
L.Y)
v
ENT
PUSH
3.
r>-
BACK
TOGETHER
Fig.3.
hobe
details.
v
Page 10

OPERATING
INSTRUCTIONS
v
v
INITIAL
l. Set
2. Connect
3.
4.
5.
6. Set
7.
8. Wait
9.
10. Adjust FOCUS
11. Readjust
12. Check
measurements.
STARTING PROCEDURE
POWER/INTENSITY
(fully
counterclockwise).
power
Set
control
their ranges.
Pull
Position.
Set CH A
DC-GND-AC
single-trace operation
trace
Turn
control
3
will light.
warm
mode)
If
no trace
I\TENSITY
observed.
for
the
center the traces.
and
CALIBRATION portion
ments require
The oscilloscope
POSITION
CH A
I I
and<>POSITION
TRIGGERING
DC-GND-AC
switch 14Io
MODE
operation.
on oscilloscope
a
20 as described in the MAINTENANCE
switch
23
clockwise.
few
seconds
A trace
up.
should appear on the face
appears, increase
control
thinnest,
position
for proper
checking
control 23
25 to
cord
(two
control
sharpest trace.
controls
adjustment of
is now ready
a I l7-vo1t, 50/60 Hz
control
LEVEL
the
16
to the CH A
or the DUAL
by rotating
It will
for
the
cathode
traces if operating in
23
until
22and
6,21
of
only
to OFF
21,
CH B
control 6 to the centers of
control 7 to the AUTO
switch
GND
"click"
(clockwise)
this manual. These
periodically.
18
positions.
position
POWER/INTENSITY
on
ray
of the CRT.
the
trace is easily
INTENSITY
11 if necessary,
and
DC BAL
for making waveform
position
outlet.
POSITION
CH
and
position
for
dual-
pilot
and
tube
the setting of
lamp
(CRT)
the DUAL
control 23
controls
AND
adjust-
for
to
to
12
the l0:l
capacitance
impedance
when
3. SetCH
only
most measurements and
being measured includes a
the
and
B
frequency
The GND
ground
readings.
4. Connect
equipment
the
measured.
a. If
b.
5. Set CH
gives
vertical deflection.
probably
concerned
speed,
desired number of waveforms.
duces at least I cm vertical deJlectton develops
ficient
position
in the DIRect
(low-capacity position)
possible,
A
the
DC
the
point
the equipment under test
less
former to
The
measurement should
when
2 to 6
which
tigger signal to
to decrease
DC-GND-AC
AC component
position
reference is required, such as
ground
AC
A VOLTS/CM switch
for measuring both
DC reference, and any
.
waveform
position
clip
test. Connect
under
the
in
circuit
powered
prevent
peak-to-peak
using the
(two
cm
be unsynchronized.
with
adjusting
presents
megohm with l20pF shunt
and I
is
WARNING
DIRect
position.
circuit
switch
(this
is
must be used if
large DC component).
(below
required only
of
item, use an
The
5
probe
where the waveform is to be
dangerous
voltage at
not
position
to six large
display
synchronization and sweep
a stable
synchronize
The higher input
should be used
loading.
18 to AC for measuring
the
normal
the AC
time a very low
Hz)
is to be observed.
when a zero-signal
for DC voltage
to
chassis
the tip of the
is a transformer-
isolation trans-
electrical shock.
the
exceed
17 to a
The
Any
600 volts
of the
squares
the
on
remaining
display showing the
signal
the sweep.
position for
the point
Use
component
ground
point
of the
probe
of
probe.
position that
scale)
on the
steps
that
will
are
pro-
suf-
screen
to
v
CAUTION
Never
allow
remain
few
seconds. The
bumed.
motion
SINGLE.TRACE
Either
single-trace operation.
following instructions.
the
Perform the
1.
with
the
connect
following instructions
The
B & K-hecision Model
For
2.
all
set
are
(below
forms
DIRect. See Fig. 3
DIRect, or
to
input impedance with only l8
a small spot of high
stationary on the screen for
Reduce
by
Channel A or Channel B can be used
MODE
the
except
for
screen
intensity or keep the
causing
it to
WAVEFORM OBSERVATION
For simplicity, Channel A is used in
of the
steps
switch
probe
cable
low-amplitude waveforms, the
l0:l attenuation.
0.5 volt
for
versa. The
vice
brilliance to
more than
may
become
sweep.
"Initial
16
in the
to the CH A INPUT
assume
PR-20B
For low-amplitude wave-
peak-to-peak),
changing
probe
permanently
Starting
CH A
the
combination
set
probes
the
has a
pF
shunt
a
spot in
for
Procedure
position.
the
capacitance
jack
of the
use
probes.
probes
probe
from l0:l
megohm
l0
Then
19.
for
in
Set SOURCE switch
6.
provides
observed
waveforms
an
switch should
cable should be connected
to the
Set SYNC switch 9
7.
for observing television
to the SLOPE
all
the
the
negative-going wave. If the type
unknown, the SLOPE
Readjust TNGGERING LEVEL control 7 to
8.
synchronized
the control
that
in
disappear
sweep, such as
amplitude
internal sync so
is also
should
external
other types of waveforms.
sweep
(-) position
will
the
sync source
be
external
sync source.
(+)
is to be triggered
display
may
produce
center
portion
if
there
when measuring DC or
waveforms. If no
l0 to the
used to trigger
viewed using
be
placed
or SLOPE
if the sweep
be
a sweep,
is inadequate signal
is required,
in the
from the
to the TV
composite
by a
(+)
position
without
pushed
in
which
of its
INT
that the
the
internal
EXT
EXT
(+)
or TV
video
(-)
positions for
Use the
positive-going
to
is
be triggered by a
of waveform is
may be used.
jitter.
As a
rotated
and
is usually somewhere
range.
sweep can be obtained,
position.
waveform
sweep.
When
sync.
the SOURCE
position
waveforms
(+)
starting
The
to trigger
extremely
and a
jack
TRIG
(-) positions
observing
position
wave, or
obtain
point,
to
any
trace will
This
being
Most
8
or
if
a
point
the
low
Page 11

pull
the
triggering.
Set SWEEP TIME/CM
9.
of waveforms. This
a
progressively
This is because
repetition rate does not
When
rates, the operator may
intensity
conditions,
extreme left of the trace. This does not
affect the
disregarded.
Alter
10.
step 9, it
adjustment
The
waveform
(+)
control
portion
of a waveform,
using
control
obtaining
(-)
direction selects
at
direction
dimmer as a smaller
the sweep speed
very
retrace
a
oscilloscope operation and may
is sometimes
of the TRIGGERING
which sweep triggering
selects the
(PULL
out
switch
control
fast
toward
the desired
may
change.
NOTE
sweep speed at
wish to operate with the
maximum.
"pip"
the most negative
most
4 for
but
number of waveforms, as
desirable to make a
AUTO) fof'automatic
the desired number
for
be set
portion
increases
may appear at the
positive point
viewing only
the trace
low repetition
Under
LEVEL
will occur
becomes
is
displayed.
but the sweep
these
in
any
control
point
way
be
on the
and
on the
in
final
7.
the
waveform
control
desired
For a
l1'.
CALIBRATED
Peak
voltages
easily and accurately
Trace Triggered
l.
2.
close-up
outward on I^he<>POSITION control
the sweep by a
displays only the
portion
a
control clockwise, and
center,
the
on
non-magnifie d
voltages,
of
Adjust controls as
waveform to be
CH A VOLTS/CM switch
Set
vertical deflection
of the vertical
limits
which sweep
at
may be
portion
turn
control
a specific
adjusted
of the
of
view
factor of five
to the left of center,
center
the
control
return the sweep
to
condition.
VOLTAGE
peak-to-peak
portion
measured on
Oscilloscope.
Sweep
previously
measured.
scale.
triggering
to start the sweep
waveform.
portion
a
portion
view
to
counterclockwise.
MEASLJREMENT
voltages,
of a complex
possible without
will occur. The
the waveform,
of
(5X
instructed
6.
magnification) and
of the
turn the
portion
sweep.
to the right of
to
DC voltages and
the Model 1471 Dual-
l7 for the maximum
on
This e*puhds
To view
<>POSITION
Push
inward
normal,
the
(See
Fig. 4)
waveform are
to display
exceeding the
any
pull
the
\
V
.} POSITION
POSITI
ON CONTROL
SO THAT BOTTOM OF
FORM
ALIGNS
A
HORIZONTAL
EXACTLY W]TH
REFERENCE
EXAMPLE:
VERTICAL
PROBE ATTENUATION
PEAK-TO.PEAK
TOP OF WAVEFORM CROSSES CENTER
VERTICAL
AND EASE
ADJUSTED
WAVE-
DEFLECTION = 4.2cm
VOLTAGE/CM
WAVEFORM
CONTROL
SCALE
OF
LINE
ADJUSTED
MARKER
READING
=
.O2
.084V
=
10
=
0€4v
THAT
SO
FOR ACCURACY
OF
o-
@..t
o
Irlo
o
Lz-JB
qfr@H@'
VOLTS/cm
SET TO
.o2v
PROBE
1O:1
ATTENUATION.
Y
l0
Fig. 4. Typiqal voltage
v
measurement.
Page 12

v
Read the amount
3.
the scale.
readjusted
reading
if desired.
the CH A
reference
GND
deflected
The
and
Calculate
4.
vertical
with the CH
position,
when the
trace deflects
downward
the voltage
deflection
17 setting
voltage
1/l0th
probe
displayed
reading
the actual
is
set
when
ment.
5. Calibration
occasionally
peak
square
jack
5. This calibrated
peak-to-peak.
volt
dicated, see
TION" section
of vertical
The
to shift
POSITION
reference
the
measuring a DC
When
control
POSITION control
CH A
A DC-GND-AC
then
upward
switch
is
for a
the amount
note
for a negative
reading as
(see
example
displayed
for
l0:l
the
accuracy
checked
(in
voltage
by
cm)
in Fig.
on the
being
attenuation.
probe is set
of this
observing
by
wave signal available
source should
need for
If a
"MAINTENANCE
the
of the
manual
deflection
point for
voltage,
to
2l
switch
placed
in the
positive
voltage
input.
follows:
VOLTS/CM control
the
a) Don't
forget that the
oscilloscope
measured
The actual
for DIRect
oscilloscope
the I volt
the CAL
at
read exactly
recalibration
AND CALIBRA-
for
complete
(in
cm)
may
2l
easier
from
be
scale
adjust
a convenient
l8
in the
trace is
the
position.
DC
Multiply
is
input
the
only
voltage
when the
voltage
is
measure-
may be
peak-to-
P-P
lV
I
in-
is
procedures.
CALIBRATED
Pulse width,
waveform
other
measured
ments
possible.
visible
moving
the
on
from
At low
one time.
at
from left
beginning
to spot.
1.
2.
Adjust
Set
display
controls
of the desired
the SWEEP
possible
measured,
If necessary,
3.
4. Read
for the most stable
trol
7
the
between
control
6 may
measurement
reading.
easier
Calculate
5.
MEASUREMENT
TIME
waveform
durations
time
oscilloscope.
this
second
.5
sweep speeds,
However,
to right
ending
and
as
TIME/CM
display
usually
of
one
readjust
amount
points
the
be
points
time
the
(See
periods, circuit
easily and
are
Calibrated
down
the
entire
0.1
to
the bright
the
across
points of the
time measure-
microsecond
waveform is
spot
screen,
measurement
previously described
waveform.
for
contrcI
waveform segment
the
4
cycle.
the TRIGGERING
disPlaY.
horizontal
of
measurement.
of
readjusted
with a
duration
deflection
to
vertical
follows:
as
The oPOSITION
align
scale
Fig. 5)
and
delays
accurately
be seen
can
which makes
easy
for a stable
largest
the
to be
(in
of
con-
cm)
LEVEL
one
marker
Multiply
the
all
are
not
the
for
v
<>
POSITION CONTROL
LEADING
THAT
ALIGNS
FORM
REFERENCE LINE.
MAY NOT BE
FAST
ALIGN
BEGINS.
POSITION
THAT TRAILING EDGE OF WAVEFORM
CROSSES
FOR ACCURACY
EXAMPLE:
HORIZONTAL DEFLECTION
(or
PERIOD)
VISIBLE
PULSES; lN
WHEREVER
CONTROL ADJUSTED
HORIZONTAL
SWEEP
TIME
OF
FREOUENCY = 1
ADJUSTED
EDGE
WITH A
OF
VERTICAL
EDGE
ON
THIS CASE
WAVEFORM
SCALE
AND EASE
TIME/CM
DURATION = 63.5pSEC
WAVEFORM
TrME
WAVE-
VERY
OF
=
=
10pSEC
.0000635
=
15,750
SO
SO
MARKER
READING
6.35cm
HORIZONTAL
DEF LECTION
SEC
Hz
6.35
cm
@
o
3@fr@f@'
TYPICAL
DISPLAYS
RECEIVER
HORIZONTAL
SHOW
WAVEFORM
OUTPUT
TIME/CM
SWEEP
'l
set to
0p sec
set to
.SLOPE
(to
start
sweep
negatlve-going
INT
TELEV!SION
AT GRID OF
TUBE
Q
on
edge)
v
5. Typical time
Fig.
measurement.
ll
Page 13

horizontal
switch 4 setting
when the
divided by 5 to obtain the
Time
6.
especially
started by a
waveform
measurement
and the subsequent waveform.
urements using external sync,
a.
b. Connect a
c.
d. Readjust
e.
Another excellent method for
7.
with
the
manual.
EXTERNAL HORTZONTAL
For
tion signal is required. This is also referred to
measurement, where the Y
tion and the X
horizontal
phase
measurement,
input must be
voltage of 100
any
satisfactory
the following
use
1. Set the SWEEP
CH
the
2. Use
Channel
3. Adjust the
CH B VOLTS/CM
The
4.
horizontal
control is disabled.
Do NOT
X-Y operation.
to adjust horizontal
5. All
Z.AKS
The
modulated
marks
are
INT MOD
oscilloscope will
of the trace.
deflection
5X magnification is
measurements often require
true
measured in
of the
Set the
source of sync
Set
position
necessary for
If measuring a delay, measure
start of the
dual-trace operation. The
"DUAL-TRACE
some
the Channel A
CH B
sync
INPUT
trace displayed
SOURCE
the SYNC
for
the TRIGGERING LEVEL
measurements.
input
may
input
mV
l0
operation. To use an external horizontal input,
procedure:
position.
B
probe
B
amount
POSITION
position
use the PULL 5X MAG
controls are disconnected
(Z-axis
required.
(intensity
provide
See Fie. 6.
(in
(see
when measuring
sync signal
cable
the
a stable
sweep
or an
TIME/CM
for
Use
input) where frequency
A TTL
modulation)
cm) by the SWEEP TIME/CM
example in Fig.
used, the result must be
time duration.
actual
external
delays. The
from
a subsequent
display between the
switch l0 to the EXT
from the EXT
Use
signal.
switch
proper polarity
waveform.
to the
APPLICATIONS"
rNPUT
an
input
provides
be a sinusoidal
external sweep voltage.
per
control
of deflection or
cm
mV or
probe
for
the horizontal input.
horizontal
of
15.
control
control, and the
NOTE
the CH
gain.
the
on
compatible
alternate brightness
one
circuit.
perform
To
the following
use
TRIG
a short shielded
9 to the
start of
external
horizontal
greater
switch
B VOLTS/CM
SLOPE
for the
the time
the
measuring
procedures
(X-y
OPERATTON)
horizontal deflec-
provides
wave,
is sufficient
fully
4
the vertical input
deflection
I I now serves
control during
and have no effect.
screen
may be intensity
signal
jack
24 on
5). Remember,
circuit and the
jack
waveform.
time delays
section
vertical deflec-
deflection.
<>
or time-scale
applied at the
the rear
and blanking
This
sync.
This
sync
such meas-
(+)
sync signal.
control 7
are
as an
such
greater;thus
clockwise
POSITION
control
is
sweep is
allows
pulse
steps:
position.
8 to the
cable.
(-)
or
if
from
the
is
given
in
of the
X-Y
The
for
as
This
for
to
the
and
with
the
the
as
the
of
f
\
I
l
t
Fig.
6.
Oscilloscope trace with
DUALTRACE
(Refer
to
observing
In
and B, it is necessary
frequency
the
other although
An example
multiplier.
on Channel A, for
of this reference frequency
In this way, when
eynchronized,
with the Channel
phase
or
simultaneously,
waveforms
both
To display
tion,
use
Perform
l.
2. Connect oscilloscope
and CH B INPUT
If the recommended
3.
PR-24B
should be used except for waveforms
peak-to-peak
forms
for
changing the
Whenever
capacity
4.
Set
traces should
5.
Adjust CH
place
to
trace,
mark
6. Set both
and
most measurements
being measured
WAVEFORM
Fig.
7)
simultaneous waveforms
or that
frequency
the following procedure:
the DIRect
MODE
and adjust
on
14 to
one of the waveforms
of this
The reference,
example,
the
display
A display. If two
will
it
in
sync
two waveforms
the
steps of the
oscilloscope
or
possible,
position
I
l0:
switch
appear
A
and CH B
the
Channel A
the scale.
the CH
the
AC
a
\
t
I
I
that
the basic frequencies
in
is
the waveform
relationship to each
be
for
jacks
less. For the lower
position
probe
16 to the DUAL
on
both traces to
A
and
position.
include a large DC
\
OBSERVATION
waveforms
the
checking a frequency
"clock"
or
the multiple
and
will
be displayed on
display of Channel
on Channel B will
difficult if
useful observation.
any
simultaneously for
"Initial
probe
cables to
19
and 13.
B & K-Precision Model PR-20B
probes
and
are used,
should be used.
from
l0:l to DIR or vice
the
use
to minimize
the screen.
CH B DC-GND-AC
high impedance,
POSITION
trace
This is the
must
be used if
t
\
,
t
a
t
Z-axis
input.
on
channels A
related
be
be synchronizedto
may be different.
frequency
waveforms having
other
not impossible
Starting Procedure."
circuit
controls 2l and
above the
a
convenient reference
component.
divider or
be
can
or
also be in
are displayed
both the CH
l0:l attenuation
of
amplitude wave-
loading.
position.
switches l8
position
used
submultiple
Channel B.
sync
to lock
observa-
0.5 volt
Fig.
See
versa.
Two
Channel B
used
the
ooints
A is
no
A
or
low
1l
for
v
in
b
3
v
r2
Page 14
v
v
Connect
7.
gound
of
waveforms
waveform
Channel
the
the
of
probes
will
A
the equipment
are to
input for
a. If the equipment
less
AC unit,
prevent
b.
peak-to-peak
The
measurement
the probe
8.
Set
the VOLTS/CM
and B
deflection.
to
a
The
unsynchronized.
to those
outlined
the procedure
displays.
Set
9.
the
provides
SOURCE
internal
being observed
in
dual-trace
measurement
10.
case set
position
8 to
Set
positions
the
the
the
and
sync
SYNC
for
waveforms-,
positions
for
ground
clips of the probes
points
to
be measured.
be
synchronized
internal
WARNING
under test
use an isolation
dangerous
should
is
used in
controls
position
displays
The
remaining
for
for
obtaining
switch
sync so that
is
also used
operation,
point
for
SOURCE
connect
a cable from
source.
switch
observing
or
to
the
observing
under test.
in the
The
must
sync
operation.
is
electrical
voltage
shock.
at
not exceed
the DIR
position.
15 and
gives
that
on the
2 to
screen
steps,
single-trace
stable,
l0
to the
the
Channel
to trigger
a sync
Channel
switch to
9 to
source
A is required.
the EXT
the
television
SLOPE
all other
(+)
types
to
the
Connect
circuit
signal
be
applied
where
to which
a transformer-
transformer
the point
600 volts,
17 for
Channels
3
cm vertical
will probably
although
operation,
describe
synchronized
position.
INT
A waveform
the
sweep.
other
fhan
(external)
the EXT
TV(+)
TRIG
or
composite
or-SLOPE
of waveforms.
chassis
the
tips
tle
the
to the
to
of
if
A
be
similar
This
Often
the
In
this
jack
TVe)
video
e)
Use
a
sweep is
(+)
the
positions
positive-going
to be
triggered by
wave, or
I l. Adjust TRIGGERING
stable,
control may
will
the
if there
as when
no
AUTO)
12. Set
of waveforms.
a
progressively
13. After
step
adjustment
The
point
will
positive
triggering
start the
synchronized
pushed
produce
center
be
a sweep, which
portion
is
inadequate
measuring
sweep
can be obtained, pull
for
automatic
SWEEP TIME/CM
This
portion
of a waveform,
dimmer
obtaining
12,
ft is
the desired
sometimes
of the
(-)
direction
on
the
occur
point
will
sweep
of
sync waveform
the
and
on
occur. The
on
of its range.
extremely
control
TRIGGERING
the sync waveform
waveform.
14. The observed
be expanded
on the
be
left
<>POSITION
rotated
and right
desired. Push
to
sweep
15. Calibrated
urements
waveforms
by a
clockwise
extremes
inward
the
normal,
voltage measurements,
and operation
if the
sweep
is to
be
to the
(-) position
a negative-going
LEVE!
sweep. As
in
signal
control 7 to
a starting
and rotated
is
usually
trace
The
to
trigger the
low
amplitude
out
the
to
any
control
triggering.
switch 4
as a
for
may
be set for
but the
smaller
portion
number
desirable
the
desired
trace
of waveforms
to make
LEVEL
rotation
(+)
selects the
which
at
direction
sweep triggering
selects
at which
control may
be adjusted
any desired portion
of
factor
control 6. This
Channels A
of
5
by
pulling
control
or counterclockwise
of
the waveform
on
the
non-magnified
control to
condition.
calibrated
with Z-ans
input
triggered
if
by
the
wave.
obtain
point,
the
point
somewhere
will
that
in
disappear
sweep, such
signals. If
(PULL
number
viewing only
becomes
is
displayed.
as in
a final
control
7.
most negative
the
most
sweep
to
of the
and
sync
B can
outward
can then
to
view
displays
return
time
the
as
the
meas-
are identical
a
v
CHA
A. REFERENCE
(1OOO
PULSES
LEADING EDGES
VISIBLE AT FAST
CHB
.
l
.
l*to
.BY
BY
B.
DIVIDE
LEADING EDGE
cHB
C. DIVIDE
TRAILING EDGE
FREOUENCY
PER
SECOND)
MAY
.TWO
OUTPUT
REFERENCE
OF
.TWO
OUTPUT
OF REFERENCE
CHANNEL
WAVEFORM
A
f;,iit|5hfr
PULSE
TRAIN
NOT BE
SWEEP RATES
SYNCHRONIZED
PULSE
SYNCHBONIZED
PULSE
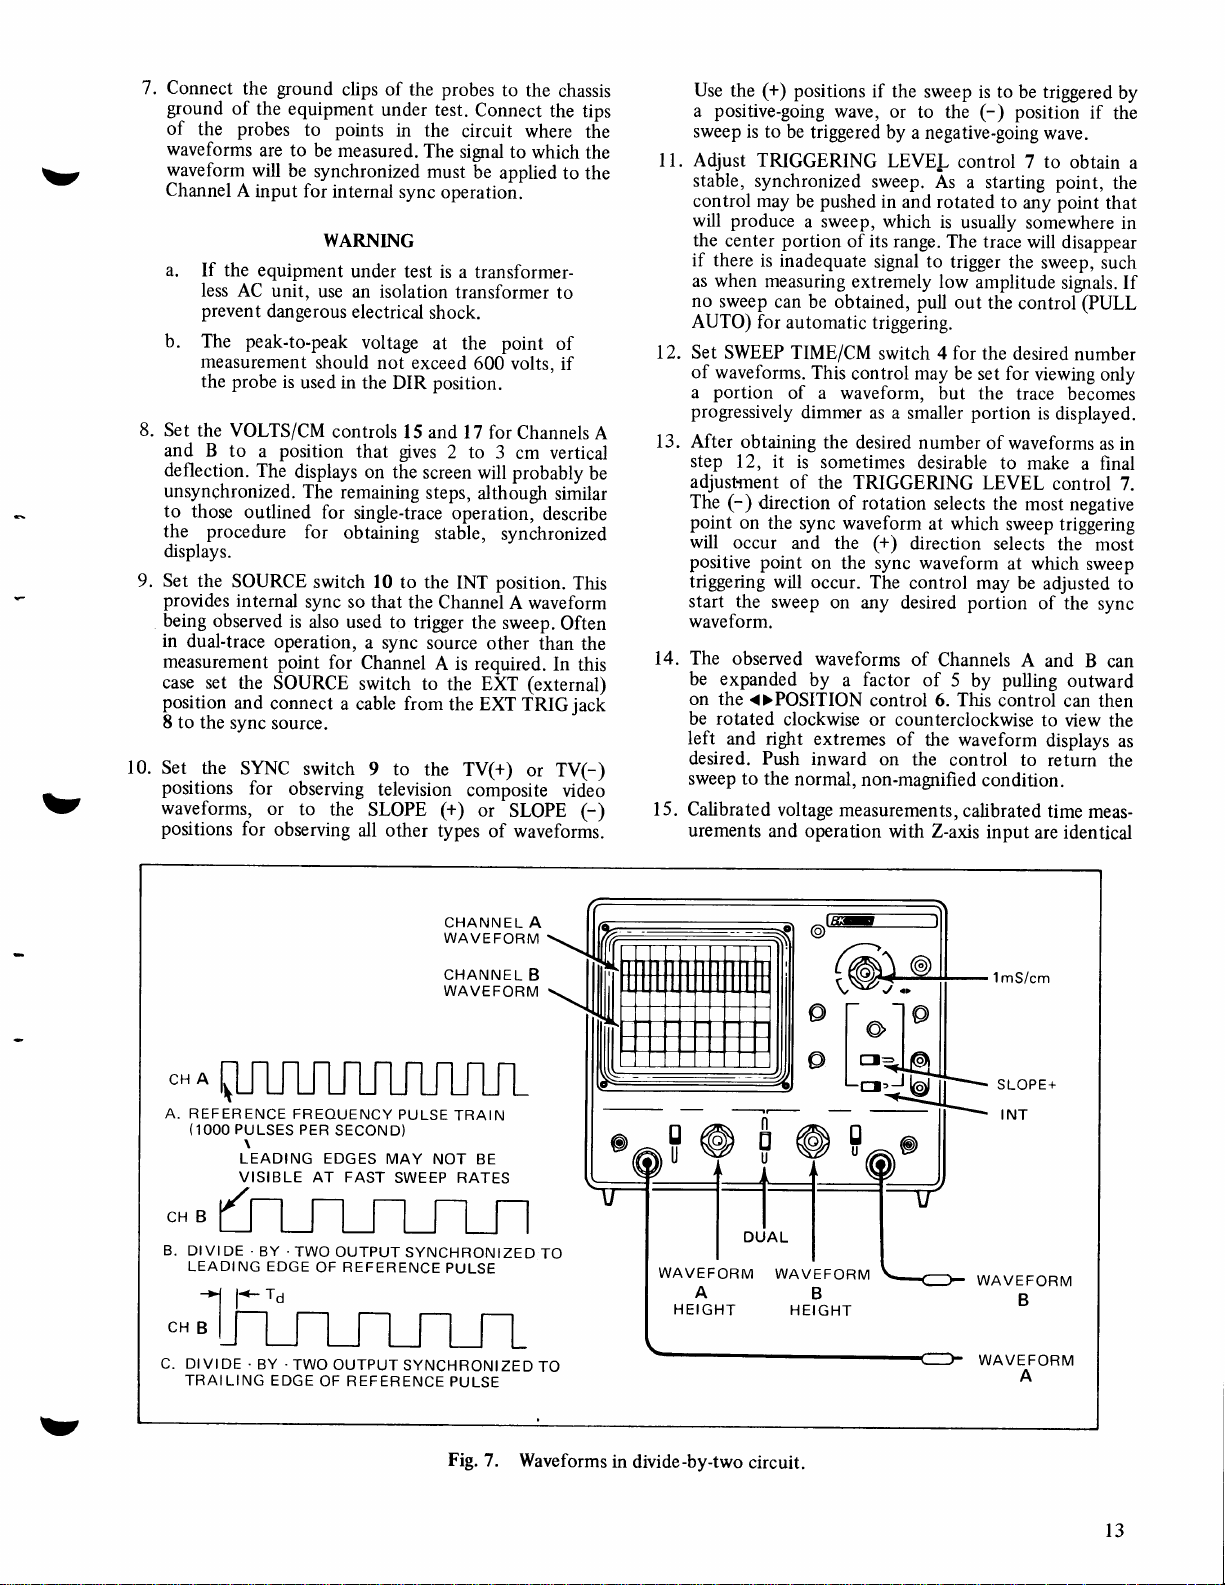
Fig.
7. Waveforms
TO
TO
WAVEFORM
A
HEIGHT
in
divide-by-two
WAVEFORM
HEIGHT
circuit.
l
mS/cm
B
WAVEFORM
B
WAVEFORM
A
l3
Page 15

to those
Either the
controls
the horizontal
previously
Channel A
be used as required in conjunction with
can
sweep
amplitude or time
done either
the DUAL
reverting to
CH B
by using
position
single-trace
positions
of the
described
interval
the
MODE
for
or
Channel B vertical
controls
single-trace
to obtain the required
measurements.
dual display
of the MODE
operation, using the
switch.
DU AL-TRACE APP LICATION S
INTRODUCTION
yet
The most obvious and
the dual-trace oscilloscope is
viewing
or
voltage,
"Cause
circuit
tions
detail
of this
simultaneously
phase-related,
such as in
Effect" waveforms is
and
designer
of the dual-trace oscilloscope
to familiaize
oscilloscope.
or that
digital
or
the
the
two
circuitry. Simultaneous
repairman.
user
FREQUENCY DIVIDER WAVEFORMS
Fig. 7
divide-by-two circuit.
"clock"
illustrates the
pulse
train.
Fig. A indicates the
Fig.
outputs of the divide-by-two circuitry.
the settings of specific
waveforms. In
these
the TRIGGERING
A and Channel B
required to
the
7
,
waveform may be either
B
In Fig.
the case
going
shifted
frequency
pulse
produce
waveform levels of
the divide-by-two output
7C
where the
waveform.
with respect to
pulse
by a
width.
oscilloscope controls
addition
LEVEL
vertical
suitable
output circuitry
this
In
the
time
the
most useful
has the
that it
waveforms
have
a common synchronizing
invaluable
an
Several
will
further
in the basic operation
waveforms involved in- a basic
Fig. C indicate
B and
to
these basic control settings,
control,
position
as
controls should
displays. In the drawing
are indicated. The Channel
2 cm
that indicated in Fig.
waveform is
responds to a negative-
the output waveform
case,
leading
interval
edge
corresponding
adjustment
This
facilities
switch or by
capability
that are
frequency-
possible
be reviewed in
reference
the
Fig.7 also
for viewing
well
the
as
the reference
of
operation.
can
be
as
such
A or
CH
feature
of
for
viewing of
the
to
aid
applica-
or
possible
indicates
Channel
be set as
of Fig.
or
7C.
7B
for
shown
the
to
In an application where the logic
or near its maximum
at
rise time
time
effects of
propagation
circuit and must
possible
frequency
loscope the
imposed to
delay
in
time
divider
input
determine the exact
that
occurs.
any circuit with
procedures given
be
calculated. A
the Tp
may
portion
be done
be
if
This
also may
waveform at a faster
DIGITAL
CIRCUIT TIME RELATIONSHIPS
A dual-trace oscilloscope is a necessity
manufacturing
oscilloscope
permits
between two waveforms.
In digital equipment
of
circuits
to
relationship to
frequency
are
dynamic
upon the
dividers
often time-related
state, some of the waveforms change, depending
input or mode of operation. Fig.
digital circuit and identifies
waveform
ing Fig. l0
measurements
shows
each of these
individual waveforms
relationship
known
comparison
is
would be displayed
No. 8
to one or
to
be correct. The dual-trace oscilloscope
to
No.
and
Channel B, although other
desired.
be displayed
8 or No.4 on
Waveforms
on
Channel A.
circuitry is operating
frequency,
design
the
consecutive
delay which
be
compensated
delay which
can be significant in
for. Fig.
may be introduced
stages
produce
circuit. By use of the
and output waveforms can
amount
Significant
several cdnsecutive
for
calibrated
more precise
propagation
stages.
time
measurement,
measurement
of the waveform is expanded
possible
to view the desired
pulling
by
sweep
and servicing digital
easy
PULL
the
5X MAG
speed.
equipment.
comparison of time relationships
it is
common
for a large
be synchronized, or to have
each other. Many of the
previously
as
in many other
described, but waveforms
combinations. In the
9 shows a
several
of the
are appropriate. The accompany-
the
points
normal
and their
waveforms
timing
relationships.
to be expected
have limited value unless their timing
of the other waveforms
more
made.
be
In typical
on Channel A and
would
10,
No. l l through No.
Channel
B in relationship to
fashion,
waveform
be successively
timing
comparisons
13
the
accumulated
a built-in
a critical
8C indicates
the
into a
dual-trace oscil-
be super-
propagation
of
delay may occur
Using
the
Tp can
can
obtained
be
horizontally.
control. It
poition
of
the
in designing,
A dual-trace
number
a specific time
circuits are
typical
points
at
which
at
The
is
this
allows
waveform
No. 3
No. 4 thru
displayed
would
waveform
on
may
be
probably
No.
v
b
rN
Fig. 8. Waveforms
DIVIDBBY.EIGHT
8 indicates
Fig.
divide-byeight
identical
Fig. 8A is
divide-bycight
circuit.
to those
supplied
output
used in Fig. 7. The
Fig. B indicates the
input
pulses
the output
and
l4
rN
oILAY
OrvrDt
in
CIRCUIT
tY Ir6xr ctPCu
divide-bycight
WAVEFORMS
r
waveform relationstrips
The basic
oscilloscope
reference frequency of
to
is
applied
ideal
the
time
Channel
A input, and
to the Channel B
relationship
pulse.
circuit.
for a basic
settings are
between
the
lnput.
the
family
In the
waveform No.8
10,
for
viewing
pulse per
of time-related
all of
the
frame.
or
waveforms;there is but one
For convenience,
waveform No. 8 or No.
desirable.
displayed
Waveforms No. 4
source
start
entire
there
portion
cases,
while the
expand the waveform
GATED
Mth external
without
because they
of the
frame.
waveforms
many times when
are
readjustment
No.
thru
do not contain a
would not
It
as shown in
of the waveforms would
it is recommended
sweep speed or 5X magnification be used to
display.
RINGING
CIRCUIT
The circuit and waveforms
demonstrate the
oscilloscope is
type
effective
of circuit
waveforms
shown
No. l0 is an excellent
external
the
10 as
sync,
7
any
should
sync source
waveforms
of the
of the
not be used
sync
triggering
be necessary
Fig.
a closer
that the sync
in
l0
all cases.
examination
appropriate. In
be
remain
of Fig.
1l
are
in which the
both in design and
troubleshooting
in
Fig.
sync source
triggering
sync using
may
be
may be
controls.
the
as
sync
pulse
to
at
view
the
the
In fact,
of a
such
unchanged
shown
to
dual-trace
b
Page 16

v
applications. The basic
identical
waveform and is
waveforms are
to those of Fig.
applied
sampled at Channel B and compared
reference waveform of
signal can be
examined more
oscilloscope
Waveform A
7.
to
Channel A input.
control settings are
Channel A. The
closely
either
the reference
is
All other
frequency
increasing
by
SECURITY
BIT
SECUR
BIT 2
to the
burst
I
ITY
sweep
the
pulling out on
or by
time
centimeter
per
times magnification.
desired
to
the desired waveform
center
oscilloscope screen.
<>POSITION
the
control
This
to
mSEC
.5
control
then be
can
information
per
centimeter
to obtain
rotated as
on
5
the
v
CODEO
rO ll
FUNCT
OATA
II{PUT
(E-8rTS)
ua2
MULTI
PLEXER
SE
CURI
BIT
LINE ORIVER
- - -l
-
TY
3
II
OATA ENABL€
DATA SEL€CT
LINE-D
(8)
UI 4B
5
DATA
U9
ENASLE
COUNTER
LINE ORIVER
OUTPUT
NO.t
UtOrT
COUNTER
l5
v
END
FRAME
Fig.
RESET
9. Typical
Y 4
digital circuit
using
time-related waveforms.
several
l5
Page 17

a
Z
sranr
!
COUNTER
exlg.r
aaoa*
b
oa*selrc'o
{
gorras*tc,'"'
gorrasrlecr'"'
$
OUTPU]
'D'
nur
-'-i
DATA SfLECT
7
DATA ENABLE
8
to
E'{D FRAME RESET
murrtPlExcR
I
I
OUTPUT
t2
LIl{E
DFIVER
13
[-
[=]
F
|
|
DATA(5 B;TS)
SECURITY
F-
I
DAIA 8IT I DATABIT
[l]]l
|
ll
ll
I F
MESSAGE
|
[-l lru
DATA
SECURITY
2
-.
__--
FBAME
(8
Btrs)
SECURITY'
DATA
|
|
li
ll
N
BIT 3
I
ONE
COMPLETE
TRANSMISSION FEAME
--fU
LONG BLANK
PULSE
1
1
1
_
I
b
INDIVIDUAL ADDRESS
DELAY LINE
The
to
used
determine the
lines as
be used to
can
the
and
repetitive
the displays.
large compared to
be
addition
inherent
TESTS
dual-trace
well
feature
as ultrasonic type delay lines. The input
trigger
delay line output can be observed on Channel
pulse
type
interval
The
to
determining delay time,
in
the delay
tion of the delayed
ANY
DATA
DEPENDING
Fig. 10.
delay times of
or
synchronize
will make it
between
the delay
line
pulse
MAY BE
BIT
UPON THE
Family of
of the oscilloscope
transmission
the Channel A display
possible
repetitive
time to
be investigated. In
the
can be determined by
observed on the
waveform display. Fig. 12 demonstrates
loscope
input
settings as
and output
display. Any
evaluated.
and
output terminations
A common
found
in color television
oscilloscope settings
well
waveforms
pulse
stretching and
the basic test circuit. Typical
as
are
on the oscilloscope
shown
ripple
The results of modifying the input
observed directly.
can be
application of the delay line chedks is
receivers. Fig.
and typical circuit connections to
FUNCTION
POSITIVE OR NEGATIVE
time-related
OR
CODED
also be
can
INPUT
waveforms
type delay
pulse
A
to
synchronize
pulses
pulse
B.
should
distortion
examina-
Channel B
the
typical oscil-
be
can
observed
and
13 shows
the
Fig.
9.
typical
from
the
check
section.
The
compared
the
composite video signal
digital circuit
"Y"
delay line
input
for
waveform and the output
delay time, using
in
employed
in
the horizontal
for reference.
the
delay is approximately one microsecond.
determining the delay
waveform reveals
characteristics
distortion that
any
from an impedance mismatch
output
resulting
STEREO
Another
in troubleshooting
is
amplifiers are used
from
AMPLIFIER
convenient
and the output of one
an open
line.
SERVICING
for
use
amplifiers.
stereo
or otherwise abnormal, the dual-trace
efficiently used
identical
side-by-side
progressively
amplifiers.
been
signal applied
comparison of both units can be
sampling
When
located, the
to
localize
the defective
effects
the defective
to the inputs of both amplifiers, a
identical signal
or malfunctioning
whatever troubleshooting
of
repair methods are employed can
the line, the output
of
may
greatly
or
a
dual-channel
If identical channel
is weak,
oscilloscope
points
be observed and analyzed
immediately.
video amplifier
waveform
sync
The
In
addition
are
pulse
of
indicated
to
be introduced
attenuated
oscilloscopes
distorted
can be
With an
state.
made
by
in both
has
stage
and
b
l6
Page 18

v
v
0
l0
.
0
tlu
0
-10
+2
0
-2
.l
Fig.
CHANNEL
A
(INPUT
PU
LSE)
CHANNEL
B
(
OUTPUT
PU
LSE)
cAIt0 nnGtiG
o€caY €Nv€LoE
t,
t, rilPufrt0
t
cltctjI
|lffiftft flt}lilft /infi-fifl
'lllllllllr--llllllillrJlililllllr-
lJliuuu
ctlt0 fRt0uftct oUIPUI
ll Rflltfl__ fl 1111 fl fl__ fl ltft n L_
ljluli+
ftrouilcy
ff,t0uttCY
Cl.lPPt0
u.llullu
utu{$ lj}$$u
(
P0ulrTY ||YtnTto)
EURST
I
RtSI0Rt0r
P0ilnlIY
EUnSI
tj.tHu{
\lllt'----lll,l[__Jlllt_
PUI.ST
SIIAPTO
11. Gated
OUIPUI
ringing circuit
and waveform.
o-ilo
1pS/cm
SLOPE+
INT
TELEVISION
Many
performed
later in the apptcations
tions. One
interval test
effectively
the
single-trace applications section and
and 21, the information
vertical
detail in Fig. 20. Also, because the
synchronized to.
Field
the
onto each other
operation, the signal
can be viewed separately
indicates
alternate
The color television receiver
1.
information is to be viewed
SERVICING
of the television servicing
using
single-trace
operation. These are outlined
section
of
using a dual-trace
blanking interval
#l
procedures,
these
signal),
the
Field
and
as shown
can be accomplished
oscilloscope. As
on
the
pulse
is different.
vertical blanking
waveforms are superimposed
#2
in Fig.
information on each blanking
without
the oscilloscope
control
VITS.
procedures
covering single-trace
viewing
the VITS
much more
outlined in
as shown in
Field
and Field
#l
This is shown in
oscilloscope
interval
22, With
waveform,
dual-trace
overlapping. Fig.
setting
for viewing the
on which the VITS
must
be set
to a station
transmitting a color broadcast.
2. T\e control
obtain
With the oscilloscope and television receiver operating,
3.
settings
a 2-field vertical display on Channel A.
connect the Channel A
detector test
the
4. Set
If the
a.
video
point.
SYNC switch as
sync and blanking
signal
of Fig. 14 are
(set
probe
follows:
positive,
are
those required
at
pulses
to the
l0:1)
of the observed
use the TV+ switch
position.
If the
b.
the TV-
Adjust the
5.
fields
Connect the
detector test
the MODE
7. Set
waveform
and
sync
switch
blanking
position.
SWEEP TIME/CM control
are displayed on the oscilloscope
Channel B
probe (set
point.
to the DUAL
switch
displays
should
pulses
are negative, use
so that 2
screen.
to 10: I
to
)
position.
the
Identical
now be obtained on
Channels A and B.
the
Set
8.
position.
sweep
the
displays.
SWEEP TIME/CM control
This expands the display by increasing
speed.
right hand
The
appear as
there
display
no
is
to either of
complete vertical
field
display will appear on the
the VITS information will
portion
waveform
shown
provision
of
information on
in the
drawing
for
synchronizing
the
the two fields
frame,
it
cannot be
to
the
.1mS/CM
appear
expanded
of Fig.
waveform
each
trace may
21. Because
the oscilloscope
which.comprise
predicted
Channel A or Channel
B display.
can
be
opera-
(vertical
Fig.
20
*2
sweep
pulse
14
to
video
vertical
video
the
toward
which
is
a
v
5OOO
lpSec
PPS
PULSE
Fig. 12.
DUAL
ULTRA SONIC
DELAY LINE
(5pSec)
WIDTH
Delay line measurement
AC
OUTPUT
Pull
9.
the <>POS
tional
5X
counterclockwise
left
until the expanded VITS information
shown in Fig.
control outward to
magnification. Rotate the
direction moving the
15.
NOTE
Because of
the low repetition rate
sweep speed combination, the
the
signal displays will
be
brightness level of
reduced.
obtain an addi-
control in a
traces to the
appears
and the high
as
t7
Page 19

CH
CH
1IJ
(INPUT}
A
(OUTPUT)
B
DELAY
S
b
1pS/cm
a
o
VI
DEO
AMPLI
FI ER
10. Once the
identified
information,
Channel A
and Channel B displays have
as being either Field
the
Channel B
signal-tracing and trgubleshooting,
probe
should be left at the
insure that the
sync signal
reverse
provision
two
vertical fields
Fig.
l5
and Field#2
#l
tion
displayed
is
because,
shows the dual-trace
sync signal is
is interrupted, the waveform
previously
as
in the oscilloscope
which
comprise a
VITS
information.
on the
trace.
SINGLE.TRACE APPLICATION
INTRODUCTION
In addition to the
outlined,
applications
oscilloscope is required.
oscilloscope,
there are, of
where
the user will be able to make the
dual-trace
course,
only
single-trace
After
SET
BOTH
10:I
ATTENUAT|ON
OELAY
*NOTE'-rrrl
ATTENUATORS
SAME,
DEPENDING
Fig.
13.
Checking
or Field
#l
probe
may
be used
the
and
video detector test
not
interrupted. If the
displays may
explained, there
to identify either
complete
presentation
The
Field
of the
#1
applications
many
service
and
operation of' the
gaining
experience
judgment
PROBES
BUT MAY VARY WIDELY,
"Y"
#2
Channel A
point
FOR
INE
L
NG O F VERTICAL
SHOULD BE THE
ON
CIRCUIT
line
delay
been
VITS
for
in
to
using the
The
tion
to
alternate method
color
described
no
of
is
the
TELEVISION
frame.
Field
informa-
servicing
also includes
make
These
S
previously
laboratory
with
the
as
AMPLI FI ER.
CLIP ON
PLATE
CLOSE
VI DEO
TO
OUTPUT
AMPLI
PROX.
F I ER
more
CAP
efficiently
TYPE.
television
whether
a
job
HORIZONTAL
HORIZONTAL
TO
TO
NOTE: NO ELECTRICAL CON-
NECTION;PLACE
INSULATION OF
LEAD OR
IMITY
LIFIER TUBE.
IN
HORIZONTAL AMP-
OF
receivers.
performed
be
can
single-trace or the dual-trace method of operation.
following
is adequate. In
are applications in which
several cases,
the
for
using
the
same application.
dual-trace application has been
single-trace opera-
it will
be
found
SERVICING
A triggered
and
sweep
aligning
several
television servicing
features
o
include
SWEEP TIME/CM control
vertical
sync at sweep speeds appropriate
viewing frames
speeds appropriate
o
Vector
o
pulse
Wide
bandwidth
presentation.
overlay for
oscilloscope is advantageous in
television receivers.
features
that were incorporated to
easier
and more comprehensive.
This
:
automatically
horizontal
and
for
viewing lines.
sync
color demodulator checks.
for
high
resolution
by
that an
oscilloscope
selects
for
at
sweep
video and
j
3
l8
Page 20

v
VI DEO
2mS/cm
I
o
VERTICAL
SYNC
PULSE
VERTICAL
BLANKING
DETECTOR
Fig.
SET
14.
TELEVISION
VIDEO
Set-up
[@?@e@'
for viewing fields I and
mere
peak
performance
peak
accompanying service data
usually includes waveform
pictures
peak-to-peak
readings on the oscilloscope with those shown on the
waveform
followed
until the
The
ments are
MEASUREMENT
VIDEO
AMP
VITS
2 of
However,
presence
voltage measurement
voltage measurements. The schematic diagram or
procedures
information.
the
or
can
include the required sweep
voltage. Compare
pictures.
by additional
trouble is isolated to as
for
given
PICTURE
TUBE
oscilloscope
absence
often
earlier
paragraph.
of
of the
located
be
on the equipment
Any abnormal
readings in the
making
the
in
much more than the
shows
signal.
pictures.
peak-to-peak
CALIBRATED
provides a peak-to-
It
signal. The cause
making
by
These waveform
time
peak-to-peak
the
readings
suspected
an area as
small
of
peak-to-
such
being serviced
and the
voltage
normal
voltage
should
circuits
possible.
measure-
VOLTAGE
poor
be
Fig.
SIGNALTRACING
VOLTAGE
television receivers
ment for that matter), the oscilloscope is an indispensable
instrument. It
presence
may
the
path,
When this happens, the
Oscilloscope
15.
VITS
READINGS
general
For
of normal
used to trace
be
path.
signal
point
a
information.
may be
presentation
AND PEAK.TO-PEAK
troubleshooting and isolation of troubles in
(or
almost any
provides
As measurements
a visual display of absence
signals. This
a signal by
found where the
source
of fields
other electronic
method
measuring
proceed
of trouble has been
I and
(signal-tracing)
points
several-
along the
disappears.
signal
located.
2 of
equip-
or
signal
in
COMPOSITE
Probably
servicing
signal,
and 17 show
composite
pulses
be observed
can
to determine
Knowledge of waveform makeup, the
normal waveform, and the
waveforms help the technician locate
problems.
television
VIDEO WAVEFORM ANALYSIS
the most important waveform in
is the
the
and
composite
blanking
typical
video
signals
vertical blanking
at various
whether
The
technician should study such
receiver
waveform
pedestals
oscilloscope
synchronized
pulses.
stages
circuits are
known to
and
causes
be
consisting of the
the
traces
with horizontal
Composite video
of
the
performing
of
good
in
television
pulses.
sync
when
television
appearance of
various abnormal
and correct many
waveforms
operating
video
Fig. 16
observing
sync
signals
receiver
normally.
con-
a
in a
l9
Page 21

HORIZONTAL
PULSE
SYNC
HORIZONTAL
BLANKING
PULSE
@l
[,
l--
L,lElr-
@i@flo'
10pS/cm
TV_
INT
s
VIDEO
VERTICAL
SYNC
PULSE
TELEVISION
Fig.
16. Set-up
VERTICAL
BLANKlNG
SET
for
viewinghorizontal
of composite
fields
video signal.
fl@fr@3
START
WITH
CHA
2mS/cm
(See
(See
INT
WITH
text)
text)
START
TV+ or TV-
20
DETECTOR
TELEVISION
Fig. 17. Set-up
VIDEO
SET
viewingvertical
for
VIDEO
AMP
fields of
composite
video
PICTURE
signal.
TUBE
b
Page 22

v
U
dition, noting
the waveform
amplifier.
To
composite video
1. Tune
2. Set
3. Set
position
mS/cm
4. Set
5.
Set
Pull
6.
up the oscilloscope
set
waveforms,
the television set to a
the MODE switch
the
SWEEP
for observing
position for observing TV
the
SYNC
switch to
the SOURCE switch
the TRIGGERING
sync.
7. Set the CH
8. Connect
Connect the
chassis. With
set
connect
output
the
Set
9.
deflection
If
10.
necessary,
to a
If the sync and
11.
signals
position;
use
the
Push
12.
to a
Adjust
13.
desired
A DC-GND-AC
probe
a
ground
tip of the
the
of
television set.
the
A VOLTS/CM switch
CH
possible
rotate
position
are
that
positive,
if the sync and blanking
position.
TV-
in the TRIGGERING
position
that
the
INTENSITY
brightness
14. To view a specific
pull
burst,
color
for 5X
rigfrt to
magnification.
the desired
select
be viewed.
15. Composite video
points
on the video circuits
points
those
setting
the
of
required
as
scale,
and
and by
LEVEL control
the observed
of
moving
fore,
from one monitoring
may
it
be
SYNC.
at various
use-the
points
for
viewing
following
local channel.
position.
to the CH
TIME/CM
TV
A
switch
to
horizontal lines
vertical
the TV+
to the INT
position.
position.
LEVEL control
to the AC
switch
to the CH A INPUT
cable
clip
probe
the
without
of the
set
probe
going
probe
for
10:l
the
to
for
the
off-scale.
the TRIGGERING
provides
blanking
a synchronized
pulses
of the
set the SYNC
switch
pulses
control and
FOCUS
the waveform, such
provides
and best
portion
outward
LEVEL
a well-synchronized
and
focus.
of
on the <>POSITION
Rotate the same control
portion
waveforms
changing
to keep the display
readjusting
maintain stabilization. The
to
of the waveform
may be checked
moving the
by
the VOLTS/CM control
within the limits
the
waveform may be
point
to another;
necessary
to reverse
the
in the video
television
procedure:
10
pS/cm
the
or to the 2
frames.
for
automatic
position.
jack.
to the television
attenuation,
detector
video
largest
vertical
LEVEL
control
display.
displayed video
to the TV+
negative,
are
rotate
display.
controls
for the
as the
control
left or
to
other
at
probe
tip
to
TRIGGERING
polarity
reversed when
there-
polarity
of
the
IORI
CTRCUIT
DEFECI
NOR|{A L
C IRCUIT
OF HIGH
LOSS
FRTqUENCY
P0N5
Rt
s
t
TXC€SS IVT H IGII
FRTQUENCY
sPoflst , N0N-
PHAST
LINIAR
SH
IFT
or
L0ss
F RE
IiC Y
QUT
Por{S
RE S
t
Fig.
ZONTAI
PULSE
ION
TOR T
)IS
A
,r\
Rt-
l'l
Lor
r1
tl
vh/
18. Analysis
NORMAL
SYNC
SYNC
COMPRESS
CAUSED
L
SA T URAT
PULSE
PULSE
ION
BY
IMITiNG
rfhflllTErl
N
IO
CAUSED
BY
LIMITING
Fig.
19.
OVERALL
FREOUENCY
4
J
n
of sync
pulse
Sync
R€CEIVER
RESPONSE
\
pulse
distortion.
waveforms.
EFFEqT
ON
PICTURE
PICTURI
NOR|sT
PIC
OF
LOSS
IA
TURT OE
F
RT
IXT VI
ICAt
IIH
K
SLAC
I,
IIT
STR
IAT IOIIS
A S|IARP
LOJING
PIC-
cHAilGt In
TURT SHAt)ING
CTIANG€ II{
OING OF
LARGT
ARTAS
PICTURE
PIC-
sntARt0
I
URI
I
FOt-
SHA
L
ty
PULSE ANALYSIS
SYNC
The IF amplifier
be evaluated to some
horizontal
sync
sync
pulse
waveform is affected
response of a television receiver can
extent by careful
pulse
waveform. The appearance
bandpass characteristics. Some
and their relation
Fig.
positive
shown in
Sync
18.
or negative limiting
Fig.
pulse
19.
to
IF amplifier
waveform distortions
in IF
observation of the
the
by
typical waveform
IF amplifier
symptoms
response are indicated
prdduced
overload
conditions
of the
in
by
are
(VERTICAL
VITS
Most
network
(the
signal
VITS)
troubleshooting
locaLize
and
ing
scope
trouble
when
shows
procedures
displays
of the VITS.
The VITS
interval. On the
white line
above
INTERVAL
television
that
and
servicing
signals
can be a
television
to the antenna,
realignment may
show how
is
transmitted
television
the
to analyze
set,
top of the
TEST
SIGNAL)
contain a built-in
very
sets.
tuner, IF or
be required.
and interpret
during the
it
can be seen
picture,
valuable tool
This MTS
video
sections
The follow-
oscillo-
vertical
when the
blanking
as a
vertical
bright
test
in
can
2l
Page 23

linearity
or height
interval (on
the
blanking
*TITT FLAG
BOTTOU
I
,I
PICTURE
rr!
wxrrEJ
BLACXl
is
TV
adjusted to view the
with
sets
circuit must
I T l'r"ttil'
Fig.20.
oF
FIELO
IF
IZING
VITS
I
VERTICAL
internal retrace
disabled to
be
fields
signal,
ELANXING
INTERVAL
vertical
blanking
the VITS).
see
1and2.
blanking
t+t
SLAC(
H0Rt2
PT
Oi
circuits,
ITt
SLAi(lr{G
STAL
279 andline 18
appears
just
at the
before the first line of video.
followed
is
bottom
line
by
of
the vertical blanking
280. The
Each of the multi-burst frequencies is transmitted
equal strength. By observing the
frequencies
these
television receiver,
the
after
frequency response
the
comparative strengths
signal is
processed
of the set is
checked.
Set up the oscilloscope
l. Connect the CH A
the
video detector or other
video section of the television
lf the
2.
television
set
circuit, bypass this
the MODE
3. Set
up
4. Set
waveform
frames
5.
Reduce
ms/CM) with
expands the
the oscilloscope for
will be
switch to CH A.
analysis
as
visible.
time to
sweep
the
display by increasing the
VITS information will
expanded waveform
Further
6.
(pull
the
ion,
VITS
expand the
outward
<>POSITION
on the {} POSITION
control
moving the trace to the left,
appears.
follows
as
probe (set
to
view
the VITS:
at 10:1) to the output of
desired test
point
set.
has
a vertical retrace blanking
circuit during the measurement.
TV vertical composite video
previously
.l
SWEEP
described. Two
millisecond
TIME/CM
per
centimeter
switch. This
sweep speed. The
appear
to the right
display.
with the 5X magnification
sweep
control). Rotate
in
a counterclockwise direct-
until the
NOTE
The brigfrtness level of the
reduced
only 60 Hz
speed is
because, although
(a
pSEC/cm
20
16,000
pSEC
(.1
mSEC/cm magnified five
signal
repetition
the
period)
display will
the writing
times).
7.
The
waveform
should
be similar
to
shown in Fig.
that
22. For the oscilloscope display, each vertical
pulse
(mnti-burst)
279
starts a new
sweep. This causes
to
be superimposed,
line 17
as
entire
pulse
through
in
vertical
on the
expanded
be
rate is
and
lines 18
are
VITS
and
the
the
(.1
sync
line
of
at
l.r
t*
-
\
t
Fig.21.
Vertical
blanking interval, showing
tion.
The transmitted VITS is a
specific
Fig.
signals
sion
evaluate television
VITS
followed by sine wave
MHz, 3 MHz,
sequence
first
multi-burst. This
portion
second
contains
staircase
frequency,
20 and 21. The
for
adjustment and checking
equipment,
(line
amplitude,
television networks use the
but the
performance.
set
17) begins
frequencies of
MHz,
3.6
of frequencies is
frame
of
Field
#2
multi-burst
that
frame
the
of
can be
most valuable
of the
VITS
sine-squared
MHz
3.58
shading, are valuable to
technician.
the
interlaced
As seen
with Field
lf2
22
VITS
informa-
precision
and waveshape
sequence
as shown
precision
of network transmis-
technician
with a
(3.58
called
(Iine
279) also
portion
can use them to
The first
"flag"
MHz,
0.5
MHz)
and 4.2
"multi-burst."
the
contains an
of the
of
frar,ne
white
l
.5MHz,2
MHz. This
identical
VITS
of the
video,
is the
to the technician. The
(lines
ptrlse,
window
bursts at
18 and 280),
pulse
progressively
which
and the
lighter
the network, but have less value
on the televiSion
that line
so
17
screen,
is
Field
followed
#1
by line
of
in
The
to
t
is
Fig.22.
Oscilloscope
single-trace
presentation
operation.
of
VITS
inforniation,
5
Page 24

and 280. The multi-burst
reinforces
identical
the trace.
and
However,lines
both signals are superimposed
other.
ry
8. The
presentation
preceding paragraphs
of the
is the limit of observation
oscilloscope. With the
ever,
a single-field VITS
by
placing
the
MODE
Model
presentation
switch
causes the Channel B information
alternate sweeps, as are Field
Because
or Field
(Fig.
15)
there
#2
will
provision
is no
information,
appear. The
either
the VITS is the most valuable for troubleshooting
television
Field
troubleshooting
Now to
multi-burst
not
be
response
good
color
I
the multi-burst
attenuation
reference
receivers
and Field,+2 VITS, either can be used for
#l
and, because
and signal
tracing.
analyze the waveform. All
arc tiansmitted
equally
coupled through the receivei
curve. Fig. 23
at
shows
television receiver, identifying each
and showing
for
each. Remember
voltage
(the
2.0
MHz
are identical,
signals
18 and
280
over
possible
with
a single-trace
l47l oscilloscope, how-
can be obtained
in
the dual
position.
to be displayed
and Field
#1
preselecting
for
Field
multi-burst
it is
+2
or
#7
information in
present
frequencies
the
same
but should
level.
due to its
the
desired response
frequency
the
allowable
-6
that
modulation
amount of
dB equals half the
should be used
which
are not
(Fig.
VITS.
Field
Field
on
of
each
22)
This
on
#1
#2
both
the
for
chance
response
video
the
on
shows
except that
bursts on
into
below
channel carrying
reasoning is right,
If the
channels,
misadjusted,
traps at the
or faulty.
for
[,ook
bridges across
a
of
of
the antenna system
on
detector on
amplifier
IF
As
another example, let us assume that we have
channels. If the VITS
some
all channels,
stages.
the bench with a very
the VITS
passband,
the
the
poor
at the video
the burst
either
side. This suggests an IF
2.0 MHz
at
chopping
picture
maybe
carrier
VITS.
the
and
response
an
If the
IF
at 2
FM trap
causing a bite on
input of
the VITS response
If
channels,
all
for
open
foil
the
set could similarly be
the trouble
peaking
patterns,
GRATICULE
causing
the trouble
poor picture.
detector
out frequencies
frequency.
same
amplifier requires
MHz
only one
at the detector
will
be in the video
coils, off-value
etc.
"holes"
is
or
tilted
abnormal at the
probably
is
a
in
set
Our oscilloscope
to be about normal
low
is
compared to the
trap
is detuned
about 2
MHz
Switch to another
thing
is seen,
then our
realignment.
is not seen on other
at the tuner input is
channel.
Other
misadjusted
output
is normal
amplifier.
resistors,
solder
for reference).
o
PICTURE
CARRIE R
i.t7
{l
l,/
-l
r
t
I
I
@
It
30
I
lrl
I
t
(n
z
o
Soo
UJ
t
r25
L3.O-MH
L:
,.6-MHz
MO
DULATION
4.2-MHz
MOOULATION
2
o-MH
iMoDULAT
MOOULAT]
j
ON
i-MHr
1,.
-Mo
)ULA'I
o.5-Mh
MODULA']
z-)
'roN
Fig.24.
\
\
\
\
\
VECTORSCOPE OPERATION
Performance
in
circuits
the
color
vectorscope operation
tional .equipment needed is a color
& K-Precision color bar
B
this.
First the
must
scope
be
Installation
testing and
television
horizontal
equalized
(see
l. Attach vector overlay
mounting
attach bezel
2.
Connect
and
screws and lift off bezel.
(see
Fig. 24).
the
tune in
the color bar
bar.generator to
color
3. Adjust the television set's
VECTOR
OVERLAY
vector
of
adjustment
receivers
overlay.
of the
is simplified by
of the oscilloscope. The
generator.
generators
vertical
and
bar
are ideally suited
gain
of
the oscillo-
Fig. 25).
to
scope.
Remove
Insert overlay
the
television set
pattern.
hue and
brilliance controls
4
color
using
addi-
The
for
bezel
and
to
mid-range.
I
4t 42 43 44 45 46
FREOUENCY-MHz
Fig.23. Color
TV IF
amplifier
response
curve.
gun,
the
A and CH B
CH
both
usually
4.
47
Set SWEEP
5.
Connect
jacks.
the horizontal
TIME/CM control to
probe
cables
to the
Channel A is the vertical input and Channel B is
input. Connect
driven element of the red
CH B
probe
the
position.
IMUT
tips to the
grid.
If the
cathode is the driven element, then connect to the
To localize
detector. This
video
trouble,
start
will localize trouble to a
before or after. the detector.
the detector, check
channels
look
okay
the
others do not,
but
VITS
tuner or antenna-system
by observing the
multi-burst is normal
If the
other
on
VITS
point
channeld.
at the
either
If
you probably
troubles. Don't overlook
at
some
have
the
cathode.
the output
Adjust the
6.
gain)
VOLTS/CM controls io obtain a compressed 45"
pattern
oscilloscope is
(The
signal
CH
that
approximately
now set
element is
driven
the
of
color amplifier
(vertical gain)
A
up for vectorscope
fills
element to which
the
is
applied.)
and CH B
the
vector overlay. The
(horizontal
operation.
23
Page 25

^tE@--l
@
@
COLOR
BAR
GENERATOR
For
7.
probe
vector
television
vector
presentation,
to
the driven
pattern
set
is the
manufacturer.
displays obtained
the
either
picture
systems with
If
will appear on the right
rotate
the vector overlay 180" so the BURST
on
is
the right side.
with the
measurement
in a color
vector overlay.
The
vector
of the
TV
set.
iarize himself with the
produced
that the
of
control changes
their
elliptical
by the
color amplitude
petals
the
amplitude.
pattern
but
the
Fig.
merely move
element
of the
same
for
gid
using i05o
sets
drive or
NOTE
tube uses
cathode
side
The
color bars will then
display
provides
functions
The
serviceman
effect on the
color controls.
control
not
their
position
Iastly,
than
of the
105"
sets
90" sets.
CHASSIS
25. Equalizing
scope
horizontal
operation.
the horizontal
gun.
type
blue
as
The color
given
by the
Fig. 26 shows typical
cathode
drive,
of the
systems
screen.
and
drive.
the burst
Just
90"
label
align
quick
very
a
of the demodulators
should
famil-
pattern
He
should observe
will vary the
position.
petals
size
The hue
but not'
will have a more
The
table below
and
ADJUST
REOUIRED
GREEN
vertical
lists
A
RED
gain
some common troubles
pattern.
The vector
range of
possible
axis.
petal
the color
to
At
the
should
CHROMA
oscillator
is
tors.
A
slight
is necessary
position.
on
the
Do not
chroma
are aligned by
general
If
be
aligned by
the
set has adjustable demodulators,
vector display
alignment.
procedure
to locate
counting bars simply
between
R-Y
PICTURE
TUBE
for
Vector-
their
and
display
rotate
set's hue
the
can
R-Y
be used
control. It
petal
center of the hue
be vertical. If
reference
oscillator. In
it is
transformer-coupled
effect
to
about the
control
not,
most
to the demodula-
touch-up of this transformer
to
bring the
attempt
petal
R-Y
to make
to
any
adjustments
bandpass amplifiers. These
a
can
Follow
and
B-Y.
generator
sweep
just
alsb
vector
a
be
used
and
display.
for demodulator
the manufacturer's
proper
the
adjust
coils and instead
for
the
correct angle
on the
the
check
should be
vertical
the R-Y
locate
the
sets this
is
all that
a vertical
amplifiers
cannot
in
the
alignment
of
b
24
Page 26

v
GR
DRI
ID
VE
CATHODE
DRI VE
Nn na/
,",=Rv1
v
\as
\noo
(/lw
\''
U
VECTOR
R-Y
VECTOR DISPLAYS
TROUBL E
Loss
Overloading
Color
weak
Lack
Demodulator
DISPLAY
GRI D
DRIVE
of color
amplifiers unbalanced
of range
sync
of color
hue
of
out of alignment
,
FOR
90'PICTURE
BY
Tq}\*Y'/l
\z\
\
;
FOR 105"
GENERATOR
amplifiers
control
r'os"
coLoR.
BAR
or
\*_"
TUBE
CATHODE
DR IVE
NO
q\[]e
*i4N
/U
*
\*."
PICTURE TUBI
EFFECT
Petals
of
Petals
are
Flower
petal
R-Y
vertical
Angle
between
petal
specification
General
\
CHASSIS
PATTERN
ON
pattern
crushed
pattern
very elliptical
cannot
R-Y
not
manufacturer's
to
(90'
Specif ication ) .
%f
rotate
will
flattened
or
be made to
petal
and
or 105"
OTu
be
B-Y
Ol^t
RED
L(JE
E
-
GREEN
EFFECT ON T.V.
Varying colors
distortion
Color
distortion
Color
Hue
control
f leshtones
Wrong colors
PICTURE
TUBE
won't
V
I
PICTURE
adjust
U
,4
Fig.26.
Vectorscope operation and
patterns.
25
Page 27

INTRODUCTION
Alignment
circuits in
oscilloscope,
of
test equipment
sweep, IF
supplies
alignment
of
television
such as
sweep and RF
and a VTVM.
displays
of the oscilloscope
books
instructions
and in
75
38
the television
(typical
?3 72 7t 70
4t 4?
40
tuners,
the
video
receivers
this instrument.
required
are
sweep,
The
a bandpass
of
sweep
response
the type
set manufacturer's
response.
43 44
CHANNEL
6
69
MxZ
68
45 46
wr0€
4
curves
67
IF
required
The
sweep
marker
generator
always
are shown
TELEVISION
strip, and
a high-quality
additional pieces
generators
generators,
curve on the
shown in
for
method
alignment
inFig.
chroma
video
DC
bias
of
screen
theory
27).
ALIGNMENT
For
a
comprehensive
ment,
we
the B & K Model
"handbook
This
not only the
all the
but
alignment
generators,
valuable
make
alignment easier
many
illustrations
step approach
textbook. Copies
B & K-Precision
NOTE
analysis of
recommend
the instruction
415
Sweep/Marker
of television
procedures
how
and
general.
in
this
comprehensive manual
procedures,
for using the
why answers
Even
insights and tips
and
qualify
it as the
easy-to-understand
and
are available
distributor or the factorv.
television
alignment"
about television
you
if
use
professional.
more
"how
align-
manual
Generator.
includes
instrument,
other
sweep
provides
that
will
The
step-by-
to
align"
from
your
v
for
a
]8 MHZ
(75
MHZ)
Fig.27.
TV
technique.
The
ideal
oscilloscope
tor. The B
necessary
1ll
from
one
and
precision
television
ever,
use of the
emphasized.
is
equipment
instruction
instrument.
calibrated
alignment.
For
complete
set,
the following
oscilloscope
In
this manual,
required
manuals
Ill r r\
til ||
ut tl
T|ll
I||l
tttl
rlll
6A66
!Ooo
;e33
zFFF
f@-@
N^,
-
o
qc-
oq
ci6io
response
instruments
curves
for
obtained
television
and the B & K-Precision
& K-Precision
sweep ranges,
accuracy
follow
Proper
Sweep/Marker
markers
The
of the
alignment
the
manufacturer's
general
set-up instructions
for
sweep-frequency
only
the
use
of the
for
alignment
for
those
simplified
instructions
proper
sweep
instruments.
CONSTANT
AMPL I T
UOE
R.F
SWE€P
MHZ
MHZ
)
OVERALL
RESPONSE
OVERALL
RESPONSE
CHROIIA TA(E_CFF
COIL RESPONS€
OVERALL
R€SPONS€
o
2
o
q
by sweep-frequency
alignment
Sweep/fuarker
Generator provides
and
DC
bias voltages,
operating
instrument
each particular
of
instructions.
demonstrates
alignment.
use
of the
oscilloscope
generator
should
provided
be
TUNER
I- F
CHROUA
are
this
Genera-
pro-edure
iesults
How-
and
oiher
in the
all
in
IMPORTANCE
The most
of the tuner, IF
receiver
sweeps
through the entire
channel at a
processed
shaped by the
sections. Because
tuned
circuits to another
has
at
proper
the
certain
bandwidth
Fig.
OF
rapid way
provide
is to
controlled,
through
gain
the
characteristics.
points
and the
properties
27 shows
SWEEP ALIGNMENT
and chroma
a
the tuned
and
bandpass
signal is
up to that
the sweep signal with
curves of the tuner, IF
circuits
to
below
scale.
These
be obtained
receiver were
oscilloscope. Because
response
is
Some
importance of
frequencies
area is
the most
this area will
response
curve
Notice
constant-amplitude
spectrum.
Notice
The
it.
bandwidths
outlines
are similar to the
if the outputs
demodulated and the
of the
least critical.
reference frequencies
proper
are on the
alignment.
slope
critical because improper IF alignment
the
affect
and this
that
amplitude and
in turn
the chroma information is located
portion
that the relative
information are modified
circuits
This
Notice
chroma
plitude
the chroma
for
overall
between the
chroma
of
the television receiver tuner
is shown by
that the
frequency
with
frequency-versus-amplitude
this
IF
portion
reference to
signal information at the
range
respect
frequency
response
IF output
the
to
range
curve, a chroma takeoff
and the bandpass amplifier
of the
receiver.
tuned to the upper end
and
The
provides
chroma
result of
usually 4.08
27. This
MHz
compensates for the amplitude-versus-frequency
characteristic of the
response
curve.
to determine the
portions
constant-amplitude
bandwidth of
repetitive rate.
portions
properties
channeled
overall
condition
of the television
signal which
given
a
fu
television
this
of the receiver,
of
the various
from
one
it is important that each
If the
envelope
signal is demodulated
observed, the
point
can be determiped.
basic response
amplifiers and
chroma bandpass
shown are approximately
curves
of the various
that would
sections
of
curve observed
relative
of
bandwidths, the
are identified to
Notice
the
that the
IF response
show the
curve.
shape of the
color
picture
television
affects
of the transmitted
amplitudes of the
passing
by
through the tuned
and IF amplifiers.
the
(4.08
MHz)
IF
overall
is reduced in
response
upper
end
signal level at the lower end
(3.08
MHr).
To
compensate
characteristic of the
coil is used
The
of the
a response
portion
combining
chroma
chroma
takeoff
frequency
as shown in
of the
the
response
overall IF
signal is
it is
series of
section
gain
and
the TV
on an
tuner
chroma
This
chroma
quality.
on a
chroma
curve.
of the
run-
of the
coil
range
Fig.
the
of
in
of
is
b
26
Page 28

IF curve and the
produce
range
applied to the bandpass
indicated
specified as a separate step
cedures.
takeoff coil
the bandpass transformer.
SWEEP
ing
frequency signal at the tuner antenna
bias
gounding
circuits
to
receiver require alignment.
is
problem
strip and
response and the
likely that
response is
a flat overall response
(3.08
by the overall
Alignment
In other
ALIGNMENT
The
best
which
line must be
are
the manufacturer's recommended
The
technician can
satisfactory but the
is
response of the
MFIz
to 4.08
of
performed
is
method of
require alignment
stages
AGC
the
qbserved
then
between the video detector
the output of the bandpass
chroma
the
IF
poor
on
MHz). The resultant
amplifier which
chroma
the
chroma
procedures,
METHODS
checking
clamped
line. The
then decide which
chroma
response are
requires
the
slope
chroma
in the
response
takeoff
in manufacturer's
adjustment
together
on an oscilloscope
For example, if the IF response
with the adjustment of
alignment and
is to
application of bias
by
outputs of the IF and chroma
response
response is
touch-up,
affecting chroma
takeoff
chroma
has the response
curve.
coil
inject
terminals.
output of the
amplifier. If
poor
particularly
coil
frequency
signal
is sometimes
test
of the chroma
determinRF
an
The AGC
and
compared
curve.
portions
not,
then
then
it
response.
is to
then
is
pro-
sweep
or
the
of
the
IF
the
IF
is most
if the
The
alignment
thah that
circuit,
attention.
between the tuner and
pre-alignment
some
mined,
ed. The alignment
Some
terminals
quencies
done
One way of doing this
generator
picture
selected
is the
sweep
the
for the alignment of these stages.
injected
alignment.
then modulated
before this is detected
receiver and
chroma circuit alignment.
problem
of
the
which is located on
This
procedure
manufacturers.
Once the
an
suggest signal
by selecting the right combination
VSM, or video
modulation
TV receiver
Other
deficient
alignment check
which
in
the
for IF alignment.
carrier
and
at the
frequency for the channel
this is modulated by a
and applied
manufacturers recommend
mixer
The IF
with a video
the
of the tuner
because
IF
part
is
can
receiver so
sweep
is demodulated
picture
recovered
the
section;
of the
the first
given
is
portion
of that section
procedures
combinations
generate
that overall alignment
is to first connect
modulation
to the
grid
(or
carrier
sweep voltage
at the video detector
sweep
however, the mixer output
After this is complete,
base, if transistorized) for IF
portion
RF
passband
seldom creates an
is so
the tuner,
tuned matching
IF
stage.
for
of the receiver is deter-
vary
IF
video sweep signal
at the video detector of
chroma
frequency
voltage
link
the
can be
manufacturers.
with
the tuner antenna
at
video sweep
and
of input signals.
method). This video
bandpass
IF
an
sweep frequency
(45.7
(VSM
is used for the
greater
much
may require
network
A separate
circuits
perform-
can be
RF
an
being used is
sweep
circuits
5 MHz)
again). As
of the
by
fre-
the
(this
is
TV
U
ANTENNA
TERMINALS
CHANNEL
SELECTOR
cr62
SWEEP/MARKER
GENERATOR
RF SWEEP
OUT VOLTAGE
TELEVISION
SET
.0'lV/cm
o-
o
Ir-l
@
L==]g
ADJUST
HORIZONTAL
SIZE
t
lb
Fig. 28.
Typical
tuner
alignment
set-up.
27
Page 29

Another method
chroma circuits directly.
sweep modulation
used to
of IF
of the
final
manufacturers
spot
test
tuned
his
manual
procedures
manufacturer's procedure.
apparently
response,
ponent
troubleshooting pr
TLJNER
check the
alignment
chroma
overall
In
conjunction
frequencies
point).
circuits in the IF
In
all
cases
particular
is
the technician
failure
ALIGNMENT
l. Connect
antenna
generator
sweep
2. Tune
the TV
circuits
chroma response.
recommend pre-tuning
fther
receiver
preferred
are also
deficient
has
the
terminals
is to first video-sweep
The IF
IF
of the
combined effect
and
chroma alignment. Usually
is
with
into
the
procedures
before
manufacturer's
the
and
for
alignment.
reliable
receiver
must
occurred
ocedures.
(Refer
output of
of the television
to
sweep one of the TV
set to the
then
is
frequency
pix
necessarv
IF
alignment,
(usually
IF
outline
sweep alignment
the
and in most
If
complete realignment
does not
then
and must employ
to Fig.
the sweep
same
channel.
aligned
(45.7
of
the
chroma response
to obtain
IF traps
at
a specified
prealignment
a
method
manufacturer's
SAMS
cases repeat the
restore
consider that
28)
generator
set.
channels.
align the
video
and
5 MHz)
a touch-up
the
desired
practically
by injecting
tuner
of
procedures.
is the best for
service
PHOTOFACT
of an
the required
a
com-
standard
to the
Adjust
the
all
all
Connect the
3.
directly to the tuner shield to
is
Connect the Channel
DIRECT)
normally the
is
where a demodulated
4. Set the
sensitivity
to avoid overloading the television receiver, which
would
erroneous
screen.
5.
The oscilloscope
exact
synchronization
presentation
proper
accomplished for
setting the oscilloscope
(SWEEP
horizontal
the
Channel
to the
6. Select the marker
measure the
The tuner
7.
oscilloscope. See
the response
adjustments for realignment.
ground
the
to
CH A VOLTS/CM
and
operate
distort
picture
TIME/CM
sweep
B input terminal
upper and
response
curve specifications and
clip
A
tuner test
grid
of the
signal
the
response curve and
the
of alignment
sweep and sweep
and
of the response
sinusoidal
for external
to CH
voltage
generator
lower response of the tuner.
curve
the manufacturer's
of the oscilloscope
minimize hum
(Vertical)
point.
mixer tube or equivalent,
present.
is
control
sweep
phase
or
position)
B
from
on the oscilloscope.
frequencies
is now displayed
probe
The tuner test
for maximum
generator
on
the
generator
with each
curve.
sawtooth sweep by
horizontal input
and connecting
the
sweep
instructions for
the
probe
pickup.
(set
point
at low level
provide
oscilloscope
must
be in
for
other
This
is easily
generator
required
on the
necessary
to
v
an
to
EPlMAR
SWE
GENERATOR
VOLTAGE
KER
SWEEP
ffi
ffi
ffi
ffi
AGC
BIAS
.01Vlcm
VI DEO
DETECTOR
@il
@
o
@F
ADJUST
HOR IZONTAL
SI ZE
DI R ECT
b
CHB
28
Fig.29. Typical
IF alignment
b
set-up.
Page 30

ry
ALIGNMENT
IF
1. Connect
injection
signal
generatoi
has been
tuner
applied at
Synchronize
2.
generator
ALIGNMENT
Connect
3.
probe
to the
4. Connect
video detector
5. Set the CH
viewing
Keep the sweep
6.
overioading.
tions
Select
7.
check
A
the
Model
8.
of the
on
the
the critical
sweep
markgrs simultaneously,
415, is a
Follow
response
the
(Refer
output of
the
sweep
to
the
antenna
the
previously described in
as
procedure.
ground
the
television set chassis.
vertical
the
output.
A
response curve.
Fo[bw the
disabling
marker
marker
and
manufacturer's
the
curve
42.67
MHZ
Fig.29)
to
the sweep
point
of the
the
properly
terminals.)
oscilloscope
clip
probe
VOLTS/CM
generator output
manufacturer's
AGC.
generator
frequencies
generator
advantage.
big
making
and
/
I
L
VALLEY
57"
generator to the
mixer.
IF frequency
aligned,
of the
of the
gain
such
instructions
MAX
Adjust the sweep
RF
with
sweep
oscilloscope
oscilloscope
control
level-
frequencies
of interest
capable
the
as
alignment.
the
45.OO
MHZ
85%
-+15"/or-lO"/o
-50o/o tso/o
45.75
(If
band.
sweep
the
for suitable
low to
recommenda-
required
(see Fig. 30.)
9f -digppVing
B &
for
ADJ
47.25
PIX
MHZ
the
may be
the sweep
TUNER
vertical
to the
prevent
K-Precision
evaluating
SND
MHZ
to
all
3 o8 MHz
gf/"
ttOo/o
Typical
31.
Fig.
2.
3.
4.
ranges
sweep
to
frequenCies,
for IF alignment.
used
Apply the
color
the
manufactureis
Synchr
described
Use a demodulator
(Channel A) to the
curve
5. Set the
A
CH
the screen.
A response
6.
should
of interest.
bandpass specifications
-l
chroma
resPonse
of
approximately
Use the same
proper DC bias
ampfifiers
the
onize
for tuner
input
the
at
vertical
(VOLTS/CM)
curve
be seen.
Refer to
MHZ
3.58
I
I
4.O8 MHZ
I
I
'l
\-
t\
I VALLEY
instructions
oscilloscope
alignment.
to the
gain
Select
MAX
15'/"
TILT
response
levels.
(bandpass
probe for the
oscilloscope.
for a convenient
similar
the
the
MAX
IOO/"
MHZ
4.50
curve,
4I to
lhe
IF injection
the color
to
amplifiers).
the correct
for
sweep
Measure
demodulators.
controls
that
to
marker
manufacturer's
alignment
and
showing
of the
shown
generator frequencies
gs"h
_
*l5o/o,-?Oo/o
tolerance
MHz band
44
procedure.
that
level
to
killer
Rgfer
bias
previously
as
vertical
response
the
oscilloscope
viewing
Fig.31
in
instructions
was
enable
to the
level.
input
on
size
for
of
ry
response
Typical
30.
Fig.
ranges
CHROMA
The IF alignment
before starting
injection
injection specified
drastically.
for
alignment.
l.
of
such
kave the sweep/marker
connected
IF
response
of
ALIGNMENT
this chroma
video
sweep
herein,
Follow
direct
the
injection
for IF alignment.
as
curve,
levels.
(Refer
must
is
manufacturer's
Fig. 32)
to
be
satisfactorily
alignment
rather than the
used
the response curve
of video sweep
generator
Set the sweep
showing
procedure. If direct
procedure explicitly
tolerance
completed
IF
is altered
for chroma
,
AGC bias
and
generator
sweep
NOTES
29
Page 31

@-
v
SWEEP
VOLTAGE
ilru
ilrrTmt
ilm
:
@-i-@
ADJUST
VERTICAL
SlzE
VIDEO
DETECTOR
VIDEO
AMP
@
['l@
@
lo-lg
un=J
ADJUST
HORIZONTAL
S;ZE
DEMODULATOR
PROBE
@
b
,
30
TELEVISION
Fig.32.
Typical
COLOR
chroma
FI
RST
AMP
alignment set-up.
SECOND
COLOR
(BANDPASS
AMP)
COLOR
KI
LLER
AMP
U{
Page 32

Procedure:
1. Connect
FM receiver.
centered
Connect
2.
generator to
Jtopt
horizontal
Connect
3.
input
Adjust
4.
coritrols
Set the
5.
marker
Aligl the
6.
specifications.
Move
7.
curve
should
RECEIVER
FM
a sweep
sweep.
and
the
the
of
the oscilloscope
for display
marker
"pip"
the
strotitO
appear
Refer
generator
Set the
sweep
the
IF amplifiers
Cliannel
the
oscilloscope
the
set
(SWEEP TIME/CM
sweep
vertical
FM
receiver.
generator
ihould
probe to the
displayed,
be
exactly
ALIGNMENT
Fig. 33
to
to
sweep
voltage
B input
probe to
input
vertical
similar
to that
precisely to
the
be in
according
demodulator
the
in
mixer
the
generator for
output
center
and
center
of the
jack-
of
controls
CH
to
the
horizontal
and
shown
10.7
of
manufacturer's
the
to
output-.-The
10.7
the
(See Fig. 338).
of the
input
for
demodulator
the
10.7
a
sweep
oscillo-
the
external
B).
Fig.33A'
in
MHz.
bandpass'
"pip"
MHz
MHz
gain
The
"S"
Adjust
faciurer's
distances
increased
MHz center
10.7
measurements
Phase
scope.
produce a
shift
Distortion
in
tested.
input
ciicuit
The amount
can
procedure
Typical applications
-specifiC
distorti,on
due to
oscilloscope
the
A
wave input
sine
The same
of the
is applied
be calculated
make
To
(Refer
Using an
1.
signal,
frequenry
demodulator^
the
instructions
center
from
decreased
and
frequencY.
PHASE
phase
in audio
nonlinear
waveform.
wave
sine
oscilloscope,
to the
phase
of
audio
apply
from
phase
Fig.
to
a sine
the
to
the
signal
audio
according
marker
the
so"
as
the
equal
marker
amounts
MEASUREMENT
made
be
may
shift,
amplifiers
is applied
horizontal
difference
resulting
measurements,
34).
wave
in circuits
ate
measurement
and
other
or
amplification
audio circuit
the
to
applied
is
input
and
generator with
network
outp^ut
the
of
input
between
waveform.
use
test signal
being
to
moves
frequency
with
audio
is also
to the
of the
the oscilloscope.
the two
the
pure-
a
the
at
tested.
equal
from
oscillo-
an
desigled
phase
of
networks.
displayed
being
vertical
tested
signals
following
sinusoidal
desired
the
test
manu-
the
to
is
-
b
I
7
J
MARKER
GENERATOR
.-
I
\
@
CHB
[rl@
I
\
I
L
ffi
o
L=jA
@B
SWEEP
MARKER
INPUT
GENERATOR
RF
OUT
'-l
SWEEP
VOLTAGE
VERTICAL
SIZE
r--
I
DEMODULATOR
HORIZONTAL
SIZE
DTRECT
FM RECEIVER
Fig. 33. Typical
FM
receiver
alignment
set-up.
31
Page 33

AUDIO
SI
GNAL
GENERATOR
ffi'6tr
CHB
v
o
Fig.
34.
Typical phase
3Fj6
ll|Lffijjl
r-t-lrl
AUDIO
NETWORK
BEING
TESTED
measurement
VERTTCAL
srzE
\_
alignment
HORTZONTAL
stzE
LOAD
set-up.
I
)
b
NO AMPL
ISoO
AMPLITUOE
Fig.35.
ITUDE
NO
PHASE
oUT oF
PHASE
Typical
DISTORT ION
SHIFT
PHASE
OISTORTION
SHIFT
phase
measurement
AMPLITUDE
NO PHASE
NO AMPL
ITUOE
PHASE
9oo
OUT
oscilloscope
OISTORTION
SHIFT
DISTORTION
SHIFT
PHASE
displays.
NOTES
i
I
i
1
V(
32
Page 34

generator
signal
the
Set
2.
''
lii""el;";1-Jtie
.ii'iii"
test
the
theoscilloscopeisclippedandthesignallevelmustbe
reduced.
Connect
3.
circuit.
SWEEP
the
Set
4.
Connect
5.
thetestcircuit.(Theinputandoutputtestconnections
to
6.AdjusttheChannelAandBgaincontrolsforasuitable
7.
-
pattern.
ellipticai
;ff6;;.6"lut.O
Fig. 36.
vertical
the
reversed.)
be
viewing
typical
Some
ire
sigrals
diagonal
;;;"e.;it
g0.
A
shift
Phase
oscilloscope
may
outpui
is
circuit
Channel
the
TIME/CM
Channel
the
and
size.
results
ph?se,the
in
If
line.-
adlusteO,
phase
of
fto.
shift
less
output
circuit
observjg
be
overdriven,
probe to
B
A INPUT
horizontal
are
oscillosco,Pf
vertical
the
line
this
produces
(or
more)
puitttn'
the
for
being-tested.
control
shown
is at
The
oscilloscope
the
on
wave
sine
the
output
the
CH
to
probe
oscilloscope
Fig'
in
tr.ace
horizontal
and
angLe'
45"
a
circular
a
90"
than
amount
trace
If
oscilloscope-
B'
to
35'
of
normal
the
opgr-
display
the
of
input
the
If
galn
phase
shown
as
the
on
test
may
two
are
shift
desired,
the
inputs
i,1,a^ttt:iq!l
oscilloscope
produces
If
of
an
in
UNKNOWN
TO
STANDARD
TO
FREqUENCY
ICAL
VERT
IZONTAL
HOR
INPUT,
FREqUENCY
INPUT
SEENOTE((E))
sEEN'TE
/7O$t
S E
THE
NOTE :
Fig.37.
AN YONE
UPON
Lissajous
ment.
OF
PHASE
RELATIONSHIP
waveforms
used
IGURE
F
for
IO
RAT
KNOl.J
UN
TO
STANDARD
>2:
l:l
lDz:
PE ND
S DE
frequency
OF
N
l
I
NG
I
measure-
I
b
AMPLIFIERS
SQUARE
INTRODUCTION
A square
\l
B
_A
f,
v
Procedure:
Connect
1.
B INPUT
CH
SWEEP
external
connect
2.
unknown
Adjust
3.
convenient,
resulting
The
4.
ratio
the
Phase
36.
Fig.
FREQUENCY
the sine
TIME/CM
horizontal
the
frequencY.
the
betiien
wave
of
iack
control
inPut.
vertical
channel
easy-to-read
input
pattern, called
two
the
=
PHASE
il
calculation'
shift
MEASUREMENT
known
of
oscilloscope
the
A and
display.
CH
to
(cH A
probe
gain
B
a Ussajoul
frequencies'
ANGLE
frequenc,y
and
provides
This
B.
INPUT)
controls
Patlern,
Fig' 37
See
to
set
to the
for a
shows
'
the
the
scope.
;;;i;r
il;-
odd
of
;;;
kHz,
1 .5
and
tubes
;rpr"duce
;;a
.'
tigt.f
capacitances
stiav
;;t';;;;-;
t.p""',i".ti;;
amplifier
fi*ituiions.
introduce
unsatisfactorY.
is
As stated
number
un
inlo
Hz onli,
500
frequency
i.r1io"O
harmonic.
21st
Theneedforsquarewaveevaluationbecomesapparent
we-realize
if
Juring
Oiff.i"tnt
r""ii"iirO
;;;;ta
t uiironi.i
r..t
instruments
WAVE
wave
as
such
"tffir
of
of
#u'ur
harmonics"
;i;;t;a
kHz,3.5
2-.5
transistois
a
interelectrod
;f
can
Poorly
distortion
odd
of
amplifier,
but
we
inptit
io
normal
frequenciet.
rig""t
quafity
ihe
of
utnphfying
when
or
TESTING
generator
instrument,
this
distortion
given.frequency
a
into
square
as
i;;
a
tnitti-ii.
before,
harmonics.
by
tun
signals
thii
use
with
of
square
voices.
present
that
of
circuit,
a
kHz,
non-linear,
are
wave
e capacitanges,,
as
well
the
of
square.
the
designed
lhe
to
a
can
we
injecting
"dtt6tminE
from
audio
iotnt
pass simultaneously
to
Witl'
which
signal,of.
a
iave)
co-pltx
OF
low-distortion
a
and
can
in
contains
frequency'
frequenry
provided'
are
also
square
By
it
is identical
which
limited
factors
signal'
wale
distortion
defective
or
where
point
wave
injecting
evaluate
square
a
how
500
amplifiers
square
a
we cin
many
which
j,ungtlon
device
which
waveforms
used
be
electronic
a
500
a
If
,c{,nnonents
difiicult
is
ancl
prevent
A
caused
amplifiers
their
contains
500
a
amplifier
wave
amplifier-
the
to
up
Hz
will
large
a
.wave?,
evaluate
frequencies
what
is
oscillo-
display
to
circuits.
large
Hz
sll:t
to
to
-,til::ilii:?
translormer
Y:11-,1:signed
performance
Hz sine
response
,9:
the
be
number
w9
the
the
of
number
square
vacuum
amplify
input
the
.faithful
these
by
can
large
a
wave
same
tnt
would
15th
required
have
input
-(lhe
amplifier
musical
A
of
at
or
of
and
a
33
Page 35

The
extremely flat
distortion that
response. The oscilloscope vertical input should be
DC
as it
frequencies. When
quency
low end of the amplifier bandpass
of the bandpass; however,
of the square
end of the
amplifier should
especially important
amplifiers).
of amplifier
overall
some
wave signal.
testing
specifications
better
TESTING
of the
It
should
amplifier
deficiencies not readily
the
judgment
Connect the
1.
the input
2. Connect
output of
wave output of the
square
will
introduce the least
amplifier bandpass
The
amplifier, it is
PROCEDLJRE
that
so
may
be observed when
checking
wave input
square
wave,
distortion
be noted that
made using a sine
be
in limited bandwidth
wave
square
performance
quality.
Whether
on
of the
the CH B test
the
of its
output of
the
amplifier
a sine
amplifier
performance.
amplifier
it does not
distortion, especially
amplifier response,
should
because
will
is reached.
the
actual
signal
will
and
The
square
apparent when
wave or square
important
be
(Refer
to
the square
being tested.
probe
being
generator
signal
contribute
evaluating
be varied from the
up toward the
of the harmonic
occur before
response
wave
amplifiers
provides
gve
an
wave also will reveal
wave is used
that the manufacturer's
known in order to
Fig.
38)
wave
of the oscilloscope
tested.
must be
amplifier
the
upper
the upper
check
signal.
quick
a
estimate of,
using a sine
generator
to any
to
set
low
at
fre-
end
content
of an
This is
(voice
check
for
make
to
to the
If
3.
4.
5.
6.
use the
ANALYZING
half-cycle is
and high
true
a
maximum amplitude ?o
half-cycle
amplitude alone of the high
produce
of one
Dstortion can be classified
categories:
DC
the
sufficiently low to
component
AC-GND-DC
used without
frequencies
Adjust
viewing height.
Adjust the sweep
wave display on the
For
The
for the rapid drop at the end of the half-cycle from
the vertical
a close-up
5X magnification.
short
created
frequency
point.
rounding of the
a
wave
square
component
to
be viewed,
switch.
affecting the results
(below
view of a
THE WAVEFORMS
rise time which
by the in-phase
sine
Therefore,
cycle
of the
allow
use
However,
Ht\.
5
gain
control
time control
screen.
portion
occurs
wave
components.
zero
amplitude
a theoretical
frequency
square corners
(See
Fig.
circuit being tested is
both the
the
the AC
for one
at the beginning of the
sum
39).
into
AC
and
position
DC
position
except
for
cycle
of the
of all the medium
The
at the 180" or
components should
at aIl
three
may
at very low
a convenient
of
square
square
same holds
reduction in
points
four
distinct
DC
of the
be
v
wave,
SOUARE
GENERATOR
o
WAVE
I
o
INPUT
AMPLI FI ER
CIRCUIT
BEING TESTED
^\m---l
cHB I o.
ADJUST VERT
CONVE.NIENT
FOR
GAIN
VIEWING
HEIGHT
OUTPUT
ADJUST SWEEP
SPEED
CYCLE DISPLAY
FOR 1
SLOPE
INT
+
b
I
I
34
Fig.
Equipment
38.
set-up
for
square
wave
testing
v
of amplifiers.
Page 36

1.
change
complex
an amplifier
filters created
will create
fesponse
The second
2.
change
waveshape
vacuum
as
extreme case,
clipper
The third
3.
distortion
more components
Fig.39.
5t
Fig.40.
Square wave response
loss.
-
Response
and
high
curve
ends.
amplifier
of
with high
with
frequency
low
Poor
ln actual
component
wave
frequency-selective
a
inductince
difference
phase
distortion
testing
wave
distorled
the
amplitude
accuratelycircuit.
revealing
compeniafed
applied
+[n.
response
low
applied
f1g. +tB.
th;
overcompensation
rise at
wave
up
+O times
ty
rute
require
the
100
about
10,000
and
In a typical
The response
poor
to the
This
(approximately 1
frequency
to
region
top of
the
As a rule
be used
can
the 15th or
to
thumb,
of
at
complete
Hz
square
4000
llz, a 1000
normal
from
waveform.
circuit
by
peaks
or dips
curve.
non-linear
is
in waveshape
non-linear
to
tubes,
a deliberate
network.
delay
is
produced
practice
(sinusoidal harmonic)
or both.
in
ieveals
figure indicates
the
This
of
the
least
The
phase
angle
or delay
practical
of
iquare
phase
distortion
wide
many
low-frequency
high-frequency
ol
input
response.
of this
input
figure displays
t00O
at the
leading
the
of thumb,
to reveal
20th
fundamental
is
it
two-frequency
a
spectrum.
wave
tlz. To analyze
Hz
frequency
is
first
The
distortion
amplitude
words,
other
ln
resonant
of
combination
in
an
distortion
produced by
components
an iron
of
a reduction
network
band
of an
to
odd
will
core
non-linear
phase distortion,
or
by a shift
a complex
presence
between
distortion.
circuitry,
includes
wave
clues.
amplifier,
distortion
amplifier
response
boost.
amplifier
this
satisfactory
to 2
kHz
Next, a
same
glod
FIz but clearly-
4000
l0
higher
edge of
be
can
it
response
harmonic
the
of
that
seen
the case
In
encompass
above
wave
square
and
component
of a
the introductign
networks
reactive
of
otherwise
and
application
or
transformer,
circuit
phase
in
waveform.
in amplitude
is usually
which
check
includes
or L introduces
C
the
of
components,
Therefore,
usually
will
we
a combination
a square
characteristics
is indicated
a19-ng
A 100
will appear.as
medium
t'Ilz)--but
Hz
1000
amplifier
frequency
kHz region
the square
said
safely
phase
and
up
or
square
wide-band
pro-p-etly-analyze
to
illustrated
componen-ts_
4000
should
of
in
or selective
components
ffequency
flat
to
refers
elements
between
wave check
Hz
square
shows
square
appear
will
response
by
wave.
that
relationships
to approximateryav9.
circuitry
by
Hz and
be satisfactory.
the
of
such
an
in
and
as
such
which
of a
caused
in square
in
with over-
frequency
reveals
Using this
is
one or
square
by
capacity,
creating
that
find
of
the
of
Fig. 40,
wave
Fig.
in
poor
wave
as in
in
the
the sharp
a square
will
Fig. 40,a
to
up
beyond
a
a
a
a
the
to
refers
Hz
Fig.40
Hz
Now, the region
rise
shows
flattening
we can
Hz
roo
souAR
E
100
and
same
low-frequency
mvE
such
the
obtained.
\,
Fis.4l.
Resultant
from amplifier
100
Hz and
in
I kHz
Fig.45.
square
waves
ponent,
element, causing,
producing
a
out
expect that the
Hz
square
phase
but
square
the
If
combination
only depress
as to
square
wave, a
However, reduction
already
as
the strong
between
from
from
beyond
will be
wave
the
that
wave will
response
noted,
in turn, a
poor
curve
100
low-frequency
1000 and
frequency
higher
relatively
frequency components
lower
be strongly
amplifier.
of this
elements in this
of
low
the
similar
in amplitude
is usually caused
phase
Fig.
of
tilt
4000
and
4000
components
normal
modified
See
frequency components
Fig.
to
of the component,
shift
Fig. 43 reveals
41A.
in
the
to
to a
the
in
in this
poor
were
be
a com-
reactive
response
Hz. Therefore,
in amplitude
by
Fig. 41A.
amplifier
42 would
by a
in
a
35
Page 37

Fxl
OUT-OF-PHASE
v
Fig.42. Reduction
frequency
Fx3
Fig.
OL)T
43.
PHASE
OF
Square
phase
shift.
wave
of square
component in a tuned circuit.
(LEAD)
tilt resulting from
wave
fundamental
3rd harmonic
resulting
Fig.
graphical
tilt is
phase-shifted
very
the square wave.
by a 10"
direction.
frequency
opposite in the two
polarity
checked
been reduced
noted that these examples
characterized by
the square wave.
Tilt
45.
frequency
development
seen to be
3rd
slight shifts in
Fig.44
Fig.
indicates the tilt
phase
shift of a low-freque^ncy element in
Fig.
45
component in a lagging direction. The
of the
through
46
phase
algebraic
indicates low-frequency components which have
in amplitude
change in shape
from phase
lagging
in a
of a
caused
harmonic.
phase
indicates a 10"
cases because of
angle
addition of components.
shift of
direction.
similarly
by the strong influence
are
in square wave
and shifted in
of low-frequency distortion
tilted
It
also
quickly
phase
in the two
of the
fundamental
square wave.
becomes evident that
shown
shape
shift
the
cases as
phase.
flat top
of the
by tilt
up
produced
a leading
in
a low-
tilts
difference
can
It
will be
portion
The
in
are
in
be
v
are
of
FXI
OUT
M. Tilt resulting
Fig.
36
PHASE
OF
frequency
(LEAD)
from
leading
in a
phase
direction.
shift of
fundamental
Fig.
overshoot
higher frequencies.
overshoot
edge
explained
square wave, the
the
summation of
components.
occurs
the
in
greater
sum along
l,ow-frequency
46.
shift.
Fig.
of the
at
previously
41B,
produced
makes
square wave. This
by remembering
If
high
frequencies,
square wave
than other
the leading
itself evident
sharp
a
an
components
component loss
discussed,
by
rising amplifier response
It
should again be
rise of
practically
abnormal rise in
the high-frequency
will be amplified disproportionately
edge.
revealed high-frequency
at the top
characteristic relationship
that
in a normal
the
leading edge
infinite number
amplifier response
creating a higher
phase
and
at the
that
noted
of the leading
well-shaped
is created by
of harmonic
components
algebraic
this
is
v
Page 38

Fig.
47.
Effect of high-frequency
damping.
Fig.
indicates
47
accompanied
square
nQ"
transition
relatively
type
wave indicates
network in
sinusoidal
the
high
sudden
rising,
low-frequency
high-frequency
by a
of
lightly
diminishing
damped
a
transient
the amplifier
in the square
high-frequency
voltage, supplies
boost and
boost
"shock"
oscillation
oscillation
circuit.
potential
wave
voltage,
energy
the
poor
in an amplifier
transient.
the top of
along
a relatively
in
this
In
case,
from a strarply
to a level
oscillation
for
The
the
value of
in
Fig.
48.
resonant
the
reasonably
oscillation
Fig.
49 summarizes
a handy
as
serves
Effect of high-frequency
damping.
network
network.
heavily damped,
may be
If this
produced
the
then
as indicated
preceding
reference.
boost and
good
the amplifier
in
a single cycle
Fig.
48.
in
explanations
is
transient
and
A. Frequency
reduction
ponent). No
D. Low
G. High
frequency
frequency
shilt.
distortion.
low
oI
phcse
(crmplitude
lrequenry com-
shift.
phcse
shilt.
phose
snd
loss
Fig. 49.
Summary
B.
H. Domped oscillotlon
of waveform
oted
Iow
shiIt.
lundqmentql).
lrequency
analysis
frequency
Low
boost
loss cnd
for
square
(qccenlu-
phcse
wave
frequency
High
C.
shiIt.
High lrequency
F.
quency phose
lrequency
Low
thickend
testing of amplifiers.
loss-No
cnd low lre-
loss
shilt.
phcse shilt
by hum-voltoge).
Phcrse
(trace
37
Page 39

The
block
breakdown
reference
by
GENERAL
Basically,
vertical
network.
switched,
switching
mined
LOGIC.
OUTPUT
plates
amplifier. Drive
calibrated
CH
converter
to
VERTICAL PREAMPLIFIERS
identical
both. CH A will
transistor
fier with
side
Ql04
gain
provide
control VRl02
vertically
MODE
from ICl01
MODE
controlled by IC103 and ICl04. When
the
LOW, turning
amplifier.
goes
amplifier. When DUAL
IC103 are
CHOPPED mode,
ALTERNATE
amplifier
sweep circuits.
the
amplifier.
VERTICAL
the vertical output
preamplifiers,
The outputs
as desired,
by the
The
AMPLIFIER,
of
the CRT.
Horizontal
preamplifier
B
All
supply voltages
the
provides
CRT.
Channel A
circuitry and
The
vertical
Ql0l
output
panel
drive
is
changed
gains
across the
Transistor
LOGIC
Trigger
LOGIC
The mode
panel
front
When
low turning
is
When
the SWEEP TIME/CM
CH B
trigger
The
selected
diagram, Fig.
of
the oscilloscope.
to the
schematic
the
oscilloscope
each having
of
of the
main
sweep speed
DC BAL
the differential
of 5, 2,
amplifier
and delivers
switched
turned on,
AMPLIFIER
into the main
CH A
position
vertical
deflection
to
the horizontal
when X-Y
a regulated,
and Channel
be described
preamplifier
which forms
signals of opposite
control.
in the emitters
provides
array
circuitry.
of
MODE
mode. When
amplifier
and 1.
screen.
IClOl
Ql07
operation
switch, the Q output
on the CH A
CH B
is selected the Q output
on the CH
is
on and
and after each
from
signal
stage
50,
Circuit
diagam.
consists of two
the vertical
and
of the MODE
which
circuits or
are
circuit operation
amplifier
DC
a
the
selected
providing
signal
consisting of
its
vertical
preamplifiers
CH B
amplifier feeds
drives
provided
is
amplifier
by the
operation
fully
regulated
2kV,
preamplifiers
B
below.
consists of
balanced
a
polarity.
Emitter followers
Ql05
of
The front panel
component to move
is
turned on or off by the
and
Ql08
signal to the trigger
(CH
A, CH B,
preamplifier
preamplifier_and
B
the
off
at a 2}OkHz rate
DUAL, the
in
a trigger
switch
is applied to
preamplifiers
the
CIRCUIT DESCRIPTION
outlines
details
own
preamplifiers
switch and MODE
the vertical
is
accelerated
Q105
CH A
Q
is
transistors
the
are
obtained
input
by the
selected.
is the
dual
differential
and
buffers the
and Q outputs
sweep when in
in CH
identical
attenuator
amplifier. The
is deter-
the VERTICAL
deflection
horizontal
is furnished
signal from
and a DC-to-DC
potential
same for
FET
VRl0l
Q103
Ql06.
and
Q106
POSITION
the
amplifier.
DUAL)
and
is selected by
IC103
of
and trigger
of
CH A trigger
signal
position,
B
horizontal
the
is applied to
Ql13
circuit
can be
by
the
contain
input
ampli-
is the
and
Stage
to
trace
signal
is
goes
IC103
trigger
of
for the
the
to
to
which amplifies
Q120,
drive the vertical
DC
balance control,
frequency
TRIGGER
The
MODE
enables
trigger
output is fed thru
on in all
CH
SYNC
preamplifiers)
is then fed
inverted
selected by SYNC
adds a
SYNC
routed to
Q320
voltage developed
value of the
out of cutoff. The output
tips of
switch
filter
vertical
TV-H
removing C33l
sweep circuit.
SWEEP CIRCUIT
and
gates
SWEEP
the
turning off
and resistors
form
ramp voltage.
is
of
pulses
ramp
IC
set input
Q307,
trigger
switch 5105.
trigger
amplifier
positions
B.
AMPLIFIER
Source
(SLOPE
DC
COMPONENT
SEPARATOR
When TV+
and
the
When
(.lmS
out
sync
positions,
The
trigger
to the SCHMITT TRIGGER
of IC303.
CONTROL flip-flop
clock
Transistors
MILLER
a
fed to the
As
soon as
IC301
is
until the
exceeds
places
302
forces
terminating the
deflection
while VR104
compensation adjustments.
CIRCUIT
source,
amplifier
Ql27
transistor switch
of the SWEEP TIMErcM
AND
switch 5303
EXTERNAL
or
to differential
-)
or non-inverted
switch 5304. LEVEL
or TV- is
the SYNC
Q319.
input
composite video
the
in
to .5 sec),
the
pulses
waveform,
Q307
selected by
The
holdoff
held low
the
low
a
SEPARATOR
Q320
across
signal.
TW
horizontal
to
SOpSEC
and allowing horizontal
passes
signal
The output
the Q output of IC301
to
initiate
and
Q308
INTEGRATING
sweep
circuit
the Q output of IC301
by IC303 to exclude
ramp
sweep
level set by VR309
on the set input
the
output of
Q
sweep.
the
signal to the
plates
either
CH A or
Selecting
Q107
and
INVERTER
selects
to the output of IC305.
selected, the output of IC305
is
C332 corresponding
Positive-going pulses
of
positions
Q319
pass
to
Q309
ramp
lC3O2
either
and
Q128.
either
triggering.
amplifier
held
at
Q320
signal.
of the SWEEP TIME/CM
is
pulses, permitting
sync
to the
lpSEC,
thru
circuit
pulses
IC30l. On the negative
the
sweep.
and the
the SWEEP
circuit
from
and IC303.
is terminated. When the
IC301
levels required
the
of
CRT. VRl05
and TCll3
B,
CH
is
selected by
CH A or DUAL
and CH
Q108,
The
trigger
Q313. Q:13
cutoff by a negative
corresponds to the
on; this
sweep circuit. In
emitter
from IC303
the
of
switch except
INTERNAL
The trigger
IC305. Either
(SLOPE
circuit
Q319
goes
(SWEEP
IC301. A
high which
+)
control
consisting of
to
an average
drive
allows C331
is turned
pulses
sync
follower
consisting of two
timing
TIME/CM
to
collector of
clock
goes
capacitors
provide
low, the reset
any new
LENGTH),
low on the
to
is a
are
high-
B enables
amplifier
is turned
(from
signal
the
signal is
VR310
is
Q320
sync
to
only
the
off,
to
Q303,
the
edge
of
low,
switch,
a linear
Q309
clock
sweep
turns on
v
v
v
38
Page 40

\,
nsl
&
t{
q
oo,
u,E
8H*
H$
*N
Etr
HEH
EHH
*rH
SHX
YEH
Ips
!t H ts-l
FHS
fr'
;HH
$fi
rr;
!!
FE
nff
Etr
)i
Fl
E
o
a
g
\
*
r-j
(
,,.U Q
HU.
xR*
s
A{
f.l
s
(a
(J
.-.
UR
{-E
Er^Ad
HX^
*Fd
$6N
au
&
Fl
kl
*t
=H
OFI
NAr
HN
tr(
OEl
ER(
H{
(,
I
rA
o
t)
rt,
o
q)
F.r
A
l$
€
o
cl
I
cg
,
(D
GI
bo
fil
€
J
(.)
o
E
o
ra
a0
tr
k
8H
'-1
!
oH
n
H
F$$
HEg
a.
$s
F$
trl
{F,
H
E(
i(g
UFt
U
Hs
$H
q
s4
H
E*
a
o
E
FT
R
F{
b
i
AA.
it
Fr
b
E
F{
s
F{
tug
HS
a
UH
=
XQ
(at
q
E{e
X\
F] U)
U
39
Page 41

AUTO
SWEEP
Transistors
SWEEP
(AUTO)
C303
reset of IC301
determined
SWEEP TIME/CM
transistors
off and enabling
signal.
circuit.
charges
Q304,
When
and no
and turns
and allows
by the
Q304
Q305,
the trigger
present
is
signal
Q306
resistor
switch.
and
the
When
Q305
sweep to trigger
and
level
at the
on,
this
a
sweep to recirculate
and capacitor
a trigger
discharge
form
Q306
control is
trigger
places
selected
signal is
C303, turning
on the
the AUTO
pulled
amplifier,
a low on
at a rate
by the
present,
Q306
incoming
out
the
CHOPPING
Two NAND gates
200 kIIz CHOPPING
positions
selected.
during
I VOLT CAL
Transistors
wave. VR2l2
OSCILLATOR
of the
IC304
retrace
SWEEP TIME/CM
provides
and when
SIGNAL
Q301
adjusts the amplitude
from
IC304
OSCILLATOR
pulse
a
chopping.
Q302
provide
and
and IC305
activated in the CHOP
switch when DUAL
for
blanking
a 60llz
of the CAL
form
the trace
square
SIGNAL.
a
is
v
HORIZONTAL
The
VR306
thru
amplifier
VR305
the horizontal
thru IC303
and the horizontal
Q317
plates
adjustment
adjustment.
which
equipment.
compensation
attempted
specified test equipment.
information for this
cedure can be located
is a horizontal
When
and
of
The
can be
Internal
AMPLIFIER
ramp from
sweep
(timing
consisting
position
in the
and
Q318
the
and
calibration adjustments
performed
Additional
and horizontal
without
B
& K.PRECISION
DYNASCAN
adjustments
adj.)
of
centering adjustment
control.
X-Y
mode,
the
CH B
amplifier. The
is
applied to the horizontal
CRT. VR303
VR304
with a minimum
internal
complete
oscilloscope
SERVICE DEPARTMENT
2815 W.
Chicago, Illinois
by reference
the
collector
to the
Q314,
Q315, Q317,
transistor
signal is applied
is the
is the magnification
of
input of the horiZontal
Q309
Q3l3
output
X5
CALIBRATION
outlined
adjustments
linearity
sweep
service information
Requests
should be
TEST EQUIPMENT
CORPORATION
Park
Irving
60618
outlined in
to
of
for
Road
the
Fig.
here
specialized
complete
addressed to:
calibration
5l
is applied
and
and VR307
to both
of transistors
magnification
should not
and 52.
Q318.
is turned
deflection
centering
are those
frequency
of
service
off
Q312
test
be
and
pro-
POWER
operating the oscilloscope.
is
provided
output stages
DC-to-DC
output of T101
voltage
fed
provide
operating
SIJPPLY
power
The
Regulated
The
accelerating
dividers to
to a regulator
a
supply
output
for
all logic
require the
converter
is rectified
constant accelerating
conditions.
the CRT. A
circuit consisting of
ADJUSTMENTS
VERTICAL GAIN ADJUSTMENT
The following
a square
accuracy
Procedure:
l. Set
2.
3.
4.
wave
is
available.
CH A
Apply lkHz
CH A input
Adjust VR103 for
Repeat
5 CM deflection.
adjustments should
generator
CH B VOLTS/CM
and
square
connector.
steps 2 and 3
provides
voltages
and amplifier
180V.
voltage for
consisting
and
portion
with
wave of
Set mode
exactly 5
for CH B and
all
voltages necessary
+10,
of
the CRT
of
Ql42
filtered
potential
l% or better amplitude
switch
5OmV
CM of deflection on
-8,
and
circuits.
is derived from
a-'1d
and
of the high voltage
29 and
Ql
be
attempted
to
peak-to-peak
to CH A.
switch
adjust
+5
and
Amplifier
T101.
applied thru
Ql30
under varied
only
.01V/CM.
CRT.
VRll3 for
for
are
a
The
is
to
if
U
into
CH A AND
1. Adjust
CH B DC
controls
cH B).
2. Adjust
CH A
trace vertically
Rotate
3.
2V
4. lf
the V
5V/CM
to
ICM
the trace moves
performing
(
side panel
vertical movement
performing
while
40
BALANCE
to
obtain a horizontal
or CH B
on the CRT.
ATTEN.
while
vertically
STEP
3, adjust
screwdriver
of the trace
STEP
POSITION
control
SWITCH from
observing the
more
the CH A or
adjustment)
does not exceed 5mm
3.
(CH
trace
to
center
IV/CM to
trace.
than 5mm
CH B DC BAL
that
so
A or
the
while
the
HORIZONTAL POSITION
<
>
I . Set
2.
3.
4.
POSITION
rotation.
SWEEP TIME/CM
Set
Adjust VR305
horizontally
Turn the
amount
minimum
centered
<>POSITION
of deflection in both directions should be a
of 4 CM.
control to
that the line on the
so
on CRT.
ADJUSTMENT
the mechanical
to lmS/CM.
switch
control
full CW and CCW.
center
scope
The
of
is
v
Page 42

\.
]-Fl
t+to
l2
'EJ
ROTATE
PLUG
TO
CHANGE
VOLTAGE
Fig.
Calibration
51.
diagram,
vR107 VR108
@@
VRLO9
e-'->Q
CH.
GAIN
TC105
VrcroaV
@@@
vertical
amplifier
@
\rRTIO
@
VRl13
TC106
BACK
t/
r
@vatoz
TC102
VrclolV
@@@
@@@
ArcrozA
rc108 Tc109
VIEW
power
and
-CH.
eew
TCIO3
supply
A
board'
vR3o9
@a@@@@
vR308
VR305
*$3'
vR306
VR304 VR303
Fig. 52. Calibratio"
J|ffiori
zontalernplifier
board.
4l
Page 43

WARRANTY
SERVICE INSTRUCTIONS
1. Refer to
the
ments that
2.
Check common
Always
check
replacement.
3.
Defective
period
number
These
4.
If
the above-mentioned
the
A
detailed
name
B
& K-Precision
Contact
your
of
parts
should
of
parts
product
and address. Forward
your
local
nearest service
B
& K-PRECISION
maintenance
may
be
applicable.
electronic
instruction
removed
sent
be
product
will
securely
list of
from
exchanged
be
(preferably
troubles
authorized
B & K-Precision
agency,
2815
section
parts
manual for
from
to the
of the instruction
such
as tubes, transistors
applicable
units
factory
which removed
no
at
charge.
procedures
do not correct
in original carton
encountered
prepaid
service
(express
agency.
Distributor
or write
Seruice Department
DIVISION
West
Chicago, Illinois
Irving
to
OF
Park
manual
adjustments
which are within
prepaid
and
with model
date
product
of
the difficulty,
or double-packed).
must be enclosed
preferred)
for
the name
DYNASCAN
Road
60618
for adjust-
and batteries.
after such
the warranty
and serial
purchase.
pack
as well as
your
to the nearest
location
and
CORP.
42
Page 44

'\-'
:r:d
.'B
& K-Precision
workmanship under
authorized
placing
and
shall
clusiue
or implied. Such
other
approval;
which
installed or
reserves
and
product
marhed,
authorized. B
B & K-Precision
product
any
which is returned to
not otherwise
in lieu of all
and.
than B & K-Precision
(ii)
tampered
has the serial
adjusted
the right
incurring any
without
comrynent if a B
or
B &
to the
K-Precision
&
warranls
that
normal usage
distributor.
or cumponent
our factory
for any
be liable
other warronties
warranty shall
to discrntinue
or its authorized
with or altered
number altered,
otherwise than
obligation.
&
K-Precision
d.istributor."
WARRANTY
product
each
and service
which we are satisfied
not apply to
any
K-Precision warranty
factory
manufactured
for a
obligation under
Our
or our authorized
darnages, consequential
(including
product
any
service contractor
way or subjected
in any
or removed;
defaced
in accordance
model at any
The warranty
within
it
by
period
of one
this
does not conform
contractor,
service
or otherwise.
warranty
any
or component
(iv)
or
with B &
time
ten days
K-Precision's
or change specifications
be void. ond
shall
registration
atter
will
free from
be
year
after. its
warranty is limited
ol merchantability),
without B &
to
which has been
card.
the
with the
transportation
The
(i)
repaired
K-Precision's
misus6, negligence
instructions.
there
sll,a,ll
properly
is not
purehase
defects in
purchase
to repairing,
foregoing
foregoing
whether expressed,
or altered.by
improperly
design
or
be no
completed.
of the
material and
from an
new
wairanty
prepaid,
warranty is
prior
or accident;
eonnected,
K-Precision
B &
without notice
uarranty
and
product
lrom
or re-
and
anyone
written
(iii)
ql
any
post-
we
ex-
an
o
54210
PRINTED
JAPAN
lN
85C1446-OO
(G)
43
*..{
Page 45

NOTES
4
Page 46

it'
ti
F
1..
I
t
li
i
;
I
I
T
t
t
I
l
t
a
,
t
l.
-:
F:.
F-
DIVISION OF
t
8OI
Chicogo,
DYNASCAN
W. Belle Ploine
lllinois
60613
CORPORATION
Avenue
480.169-9-001
 Loading...