


Technical
Document ation
Hand-held Analyzer 2250 Light
With Sound Level Meter Software BZ-7130
1/1-oct. Frequency Analysis Software BZ-7131
1/3-oct. Frequency Analysis Software BZ-7132
Logging Software BZ-7133
Signal Recording Option BZ-7226 and
Tone Assessment Option BZ-7231
User Manual
English BE1766–21


BE176621
October 2012
2250 Light
with the following 2250 Light Software:
Sound Level Meter Software BZ-7130
1/1-oct. Frequency Analysis Software BZ-7131
1/3-oct. Frequency Analysis Software BZ-7132
Logging Software BZ-7133
Signal Recording Option BZ-7226
Tone Assessment Option BZ-7231
User Manual
Valid for all hardware versions and from software versions 4.1

Trademarks
Microsoft, Excel, Internet Explor er, Hotmail and Windows are registered trademarks of Microsoft
Corporation · PCL is a registered trademark of the Hewlett-Packard Company · Google Maps and
Chrome are trademarks of Google Inc. · Mozilla and Firefox are registered trademarks of the
Mozilla Foundation · Apple, Safari and iPhone are registered trademarks of Apple Inc. · Go Wi-Fi!
is a registered trademark of Socket Mobile, Inc. · Intel is a registered trademark and Core is a
trademark of Intel Corporation or its subsidiaries · Airlink and Sierra Wireless are registered
trademarks of Sierra Wireless · JavaScript is a registered trademark of Sun Microsystems Inc.
Copyright 2006 – 2012, Brüel& Kjær Sound & Vibration Measurement A/S
All rights reserved. No part of this publication may be reproduced or distributed in any form, or by
any means, without prior written consent from Brüel&Kjær S ound & Vibration Measurement A/S,
Nærum, Denmark
Safety Considerations
This apparatus has been designed and tested in accordance with IEC 61010 – 1 and EN 61010 – 1
Safety Requirements for Electrical Equipment for Measurement, Control and Laboratory
Use. This manual contains information and warnings which must be followed to ensure safe
operation and to retain the apparatus in safe condition. Special note should be made of the following:
Safety Symbols
The apparatus will be marked with this symbol when it is important that you refer to the
associated warning statements given in the manual.
Protective Earth Terminal Hazardous Voltage
Explosion Hazard
The equipment is not designed to be used in potentially explosive environments. It should not be
operated in the presence of flammable liquids or gases.
Warnings
• Switch off all power to equipment before connecting or disconnecting their digital interface.
Failure to do so could damage the equipment.
• Whenever it is likely that the correct function or operating safety of the apparatus has been
impaired, it must be made inoperative and be secured against unintended operation.
• Any adjustment, maintenance and repair of the open apparatus under voltage must be avoided
as far as possible and, if unavoidable, must be carried out only by trained service personnel.
• Do not dispose of electronic equipment or batteries as unsorted municipal waste
• It is your responsibility to contribute to a clean and healthy environment by using
the appropriate local return and collection systems
• Hazardous substances in electronic equipment or batteries may have detrimental
effects on the environment and human health
• The symbol shown to the left indicates that separate collection systems must be used
for any discarded equipment or batteries marked with that symbol
• Waste electrical and electronic equipment or batteries may be returned to your
local Brüel& Kjær representative or to Brüel& Kjær Headquarters for disposal

Contents
CHAPTER 1
Introduction......................................................................................................... 1
1.1 Welcome.............................................................................................................. 1
1.2 How to Use this Manual....................................................................................... 1
Conventions Used in this Manual ........................................................................ 1
Beginners............................................................................................................. 2
Experienced Users of Acoustic Measurement Equipment................................... 2
CHAPTER 2
Assembling Your 2250 Light............................................................................. 3
2.1 Determining Your Hardware Version................................................................... 3
What is Different with G4 Hardware?................................................................... 3
2.2 Instrument Components....................................................................................... 4
2.3 Analyzer Inputs/Outputs....................................................................................... 6
Description of Inputs and Outputs........................................................................ 8
2.4 Hardware Setup................................................................................................. 11
2.5 Assembling 2250 Light....................................................................................... 12
Charging the Battery for the First Time.............................................................. 12
Making Good Measurements............................................................................. 12
Alternative Measurement Method (Extended Microphone)................................ 13
Measuring for Convenience............................................................................... 14
CHAPTER 3
Making Your First Measurement..................................................................... 15
3.1 “Point and Shoot”............................................................................................... 15
Congratulations!................................................................................................. 16
3.2 Making a Measurement ..................................................................................... 16
What is a Project Template?.............................................................................. 16
Switching On...................................................................................................... 16
Set the Sound Level Meter Project Template.................................................... 17
3.3 Save your Measurement.................................................................................... 21
Viewing the Saved Measurement...................................................................... 21
3.4 Documenting your Measurement ....................................................................... 22
3.5 Switching Off...................................................................................................... 24
CHAPTER 4
Getting to Know Your 2250 Light.................................................................... 25
4.1 What is a Sound Level Meter?........................................................................... 25
4.2 What is 2250 Light?........................................................................................... 26
Sound Level Meter Software for 2250 Light BZ-7130........................................ 26
Built-in Help........................................................................................................ 28
Software and Hardware Versions...................................................................... 28

4.3 What is Measurement Partner Suite BZ-5503?................................................. 28
4.4 Basic Principles when using 2250 Light............................................................. 29
Navigation Principles – ‘Star’ Navigation Concept............................................. 29
The Display Screen............................................................................................ 31
Use of Pushbuttons for Controlling Measurements ........................................... 34
On-screen Feedback and Traffic Light............................................................... 35
Use of Stylus and Navigation Pushbuttons........................................................ 35
How to Change Parameter Values .................................................................... 35
Locking the Pushbuttons and Display................................................................ 37
CHAPTER 5
Calibration......................................................................................................... 39
5.1 Calibration Types............................................................................................... 39
5.2 Standard Calibration.......................................................................................... 40
Calibration Settings............................................................................................ 41
5.3 Calibration History.............................................................................................. 42
5.4 Transducer Database ........................................................................................ 43
5.5 Calibration Reminder......................................................................................... 44
5.6 Charge Injection Calibration............................................................................... 45
Theory of CIC..................................................................................................... 45
Performing a Manual CIC with your 2250 Light................................................. 46
CHAPTER 6
Data Management............................................................................................. 49
6.1 Organising Measurements................................................................................. 49
Description of Jobs and Projects ....................................................................... 49
Navigating in Jobs.............................................................................................. 50
6.2 Selecting Default Measurement Job/Path.......................................................... 51
6.3 Recalling Measurements ................................................................................... 51
Viewing Data...................................................................................................... 52
Re-using Setups from Projects.......................................................................... 53
Viewing or Listening to Annotations................................................................... 53
CHAPTER 7
Connection to PC or Smart Phone.................................................................. 55
7.1 Introduction........................................................................................................ 55
7.2 Transferring Measurement Data to Your PC ..................................................... 56
Connect to Your PC........................................................................................... 57
7.3 Post-processing and Reporting.......................................................................... 57
7.4 Internet Browser for Online Display and Control of the Analyzer....................... 58
CHAPTER 8
Advanced Use of 2250 Light – Tips and Tricks............................................. 61
8.1 Setting your Preferences on 2250 Light............................................................. 61
Display Settings................................................................................................. 61
Power Settings................................................................................................... 62
Regional Settings............................................................................................... 64
Storage Settings ................................................................................................ 65
Headphone Settings .......................................................................................... 65

Printer Settings .................................................................................................. 66
8.2 Modem/DynDNS Settings.................................................................................. 67
Connection to the Network using a LAN Modem............................................... 67
Connection to the Network using a GPRS/EDGE/HSPA Modem...................... 67
DynDNS............................................................................................................. 69
8.3 Network Settings................................................................................................ 70
Connecting to the Analyzer................................................................................ 70
Parameters in Network Settings ........................................................................ 71
8.4 Notifications ....................................................................................................... 73
Alarm Settings.................................................................................................... 73
Text/SMS Notifications....................................................................................... 74
E-mail Notifications............................................................................................ 75
8.5 Web-server ........................................................................................................ 75
8.6 Connecting to Weather Stations and GPS Receivers........................................ 76
Weather Stations ............................................................................................... 76
GPS Receivers .................................................................................................. 77
8.7 Timers and Automatic Measurements............................................................... 77
CHAPTER 9
Updating, Maintenance and Troubleshooting ............................................... 79
9.1 How to Install New Applications......................................................................... 79
9.2 How to Update/Upgrade Applications and Install New Languages.................... 79
Update/Upgrade using BZ-5503........................................................................ 79
Update Through the Internet.............................................................................. 80
Downgrade to an Earlier Version....................................................................... 82
9.3 Troubleshooting................................................................................................. 82
2250 Light Measurements ................................................................................. 82
SD/CF Cards and USB Sticks............................................................................ 82
Battery Pack and Recalibration of Battery Charge Indicator.............................. 84
Touch Screen..................................................................................................... 84
Reset Options.................................................................................................... 84
9.4 Services at Brüel & Kjær for Type 2250 Light.................................................... 88
Accredited Calibration........................................................................................ 88
Initial Calibration ................................................................................................ 88
Regular Recalibration ........................................................................................ 88
Filter Calibration................................................................................................. 88
Service and Repair ............................................................................................ 88
Hardware Maintenance and Repair................................................................... 89
Rental................................................................................................................. 89
Training.............................................................................................................. 89
9.5 Care, Cleaning and Storage .............................................................................. 89
Handling the Instrument..................................................................................... 89
Cleaning the Instrument..................................................................................... 89
Storing the Instrument........................................................................................ 90
CHAPTER 10
1/1- and 1/3-octave Frequency Analysis (Optional Modules)....................... 91
10.1 Setting up the Instrument................................................................................... 91
10.2 Controlling the Measurement............................................................................. 92

10.3 Displaying the Results ....................................................................................... 92
Smileys .............................................................................................................. 96
10.4 Saving Results................................................................................................... 96
CHAPTER 11
Logging (Optional Module).............................................................................. 97
11.1 Setting up the Instrument................................................................................... 98
11.2 Controlling the Measurement........................................................................... 100
11.3 Displaying the Results ..................................................................................... 100
The Profile View............................................................................................... 101
Marking Sound Categories .............................................................................. 103
Editing Markers on Profiles.............................................................................. 104
11.4 Saving and Recalling Results.......................................................................... 105
CHAPTER 12
Signal Recording (Optional Module) ............................................................ 107
12.1 With Sound Level Meter and Frequency Analysis Software............................ 107
Setting up the Analyzer.................................................................................... 107
Controlling the Recording ................................................................................ 109
Playing the Recording...................................................................................... 109
12.2 With Logging Software..................................................................................... 110
Setting up the Analyzer.................................................................................... 110
Controlling the Recording ................................................................................ 111
Control Recording using the Stylus.................................................................. 112
Playing the Recording...................................................................................... 113
Signal Recordings on the PC........................................................................... 114
CHAPTER 13
Tone Assessment Option BZ-7231 – 1/3-octave Method............................ 117
13.1 General............................................................................................................ 117
13.2 Tone Assessment According to ISO 1996-2, Annex D.................................... 117
ISO 1996-2, Annex D – Tone Assessment Calculations ................................. 118
13.3 Setting up the Analyzer.................................................................................... 119
Selecting the Tone Assessment Option........................................................... 119
Setting up a Measurement Manually ............................................................... 120
Setting up the Measurement using the Default Setup ..................................... 120
Signal Recording.............................................................................................. 121
13.4 Measuring........................................................................................................ 122
Result Display.................................................................................................. 122
13.5 Logging Software BZ-7133 Template.............................................................. 124
13.6 Status Codes (Smileys) ................................................................................... 124
13.7 Recalling Saved Measurements...................................................................... 125
CHAPTER 14
Specifications...................................................................... .......... ................. 127
APPENDIX A
Setup Parameters........................................................................................... 137
A.1 Input................................................................................................................. 137
A.2 Frequency Weightings..................................................................................... 138

A.3 Bandwidth........................................................................................................ 139
A.4 Statistics........................................................................................................... 139
A.5 Measurement Control ..................................................................................... 140
A.6 Logged Broadband .......................................................................................... 141
A.7 Logged Broadband (100 ms)........................................................................... 143
A.8 Logged Spectrum............................................................................................. 143
A.9 Markers............................................................................................................ 144
A.10 Signal Recording.............................................................................................. 145
A.11 Occupational Health......................................................................................... 147
APPENDIX B
Measurement Parameters.............................................................................. 149
B.1 Total Measurement.......................................................................................... 150
For BZ-7130, BZ-7131, BZ-7132 and BZ-7133 Software................................ 150
B.2 Logged Measurement...................................................................................... 152
For Logging Software for 2250 Light BZ-7133................................................. 152
B.3 Logged (100 ms) Measurement....................................................................... 154
For Logging Software for 2250 Light BZ-7133................................................. 154
B.4 Instantaneous Measured Parameters (available at any time).......................... 155
Processed Parameters for Display Only.......................................................... 155
Relationship Between Setup and Measurement Parameters.......................... 156
APPENDIX C
Instrument Parameters .................................................................................. 159
C.1 Current Transducer.......................................................................................... 159
C.2 Transducers..................................................................................................... 159
Microphone Setup............................................................................................ 159
Calibration History............................................................................................ 160
C.3 Calibration Setup............................................................................................. 162
C.4 Type 2250 Light Microphones.......................................................................... 162
APPENDIX D
Preferences..................................................................................................... 163
D.1 Display Settings............................................................................................... 163
D.2 Power Settings................................................................................................. 164
D.3 Regional Settings............................................................................................. 165
D.4 Storage Settings.............................................................................................. 166
D.5 Headphone Settings........................................................................................ 166
D.6 Printer Settings................................................................................................ 168
D.7 Modem/DynDNS Settings................................................................................ 169
D.8 Network Settings.............................................................................................. 170
D.9 Notification Settings......................................................................................... 172
D.10 Remote Access Settings.................................................................................. 174
D.11 NMT Server Settings (Hardware Version 4 only)............................................. 174
APPENDIX E
Glossary.......................................................................................................... 175
INDEX................................................................................................................. 183


1
Chapter 1
Introduction
1.1 Welcome
This user manual describes the 2250 Light (Type 2250-L), including:
• Sound Level Meter Software for 2250 Light, BZ-7130
• 1/1-octave Frequency Analysis Software for 2250 Light, BZ-7131
• 1/3-octave Frequency Analysis Software for 2250 Light, BZ-7132
• Logging Software for 2250 Light, BZ-7133
• Signal Recording Option BZ-7226
• Tone Assessment Option BZ-7231
The manual explains how to perform a basic sound measurement, which parameters you can
measure and how the instrument should be operated. In addition, some practical hints and
guidelines are provided, including all relevant technical specifications. Finally, a glossary is
added to help with specific terminology found in this manual.
1.2 How to Use this Manual
1.2.1 Conventions Used in this Manual
Instructions and descriptions that refer to 2250 Light pushbuttons are shown with the
pushbutton icons as seen on the instrument. See Chapter 2 for a list of pushbutton icons and
their functions.
Menu Items and Buttons/Tabs Used on the Screen
Indicated by bold type face (for example, select Calibration from the list of options).
Parameter Text Appearing on the Screen
Parameters, instructions and descriptions appearing on the screen are indicated by ita lics (for
example, Measurement Mode).

2
2250 Light – User Manual
Path Denotations
Indicated by capitals (for example, JOB01\).
1.2.2 Beginners
Before you read the rest of this manual, read Brüel & Kjær’s primer on Measuring Sound.
This will give you a basic idea of acoustic measurements. It can be found on the
www.bksv.com Web site, by ty ping ‘Primer’ in the search window. The Web site also contains lots of other information you might find useful.
Further information is available in the On-line Help installed on 2250 Light.
1.2.3 Experienced Users of Acoustic Measurement Equipment
The manual is designed so that you do not have to read all of it to be able to use the
instrument. It is built around the most frequently used operations, these are as follows:
• Assembling Your 2250 Light (see Chapter 2)
• Making Your First Measurement (see Chapter 3)
• Getting to Know Your 2250 Light (see Chapter 4)
• Calibration (see Chapter 5)
• Data Management (see Chapter 6)
• Connection to PC or Smart Phone (see Chapter 7)
• Advanced Use of 2250 Light – Tips and Tricks (see Chapter 8)
• Updating, Maintenance and Troubleshooting (see Chapter 9)
However, it is recommended that you read the entire manual for appropriate procedures on
how to use 2250 Light to obtain accurate sound level measurement results.

3
Chapter 2
Assembling Your 2250 Light
This chapter describes how to assemble and set up a 2250 Light. It provides a brief description
and an associated diagram showing the instrument’s components and the various input and
output connections. This enables you to start getting familiar with the instrument, while
assembling a system.
This is followed by an overview of the hardware components, showing all the main
configurations of the instrument and its accessories.
Finally, instructions are provided that explain how to assemble standard and optional hardware
components used in your system. Once you have followed the assembly instructions, your
Hand-held Analyzer will be ready to make measurements.
2.1 Determining Your Hardware Version
Over the years, 2250 Light hardware has had a few updates, the most significant happened in
2012 with the introduction of hardware version 4 (also known as G4). To check if your analyzer
uses G4 hardware, click in the Shortcut Bar at the bottom of the display screen, and select
About. The About menu will list the hardware and software versions currently installed.
2.1.1 What is Different with G4 Hardware?
The differences in the G4 hardware compared to previous versions include:
• A brighter screen which is easier to view in direct sunlight
• The CF card slot is removed and replaced by a second SD card slot to take advantage of
the SD format’s dominance in the storage and Wi-Fi markets
• The USB connector changed from USB 1.1 Mini B to USB 2.0 Micro AB. Besides the
faster connection speeds of USB 2.0, the Micro USB connector is more common
• A second standard USB Type A socket was added for easier connection to USB
peripherals like modems, printers, GPS receivers, and USB to RS–232 adaptors
• A 100 Mbps LAN connector is available
• A Trigger Input socket for external trigger of signal recordings
• An Input socket and an Output socket (both currently not in use)
4
2250 Light – User Manual
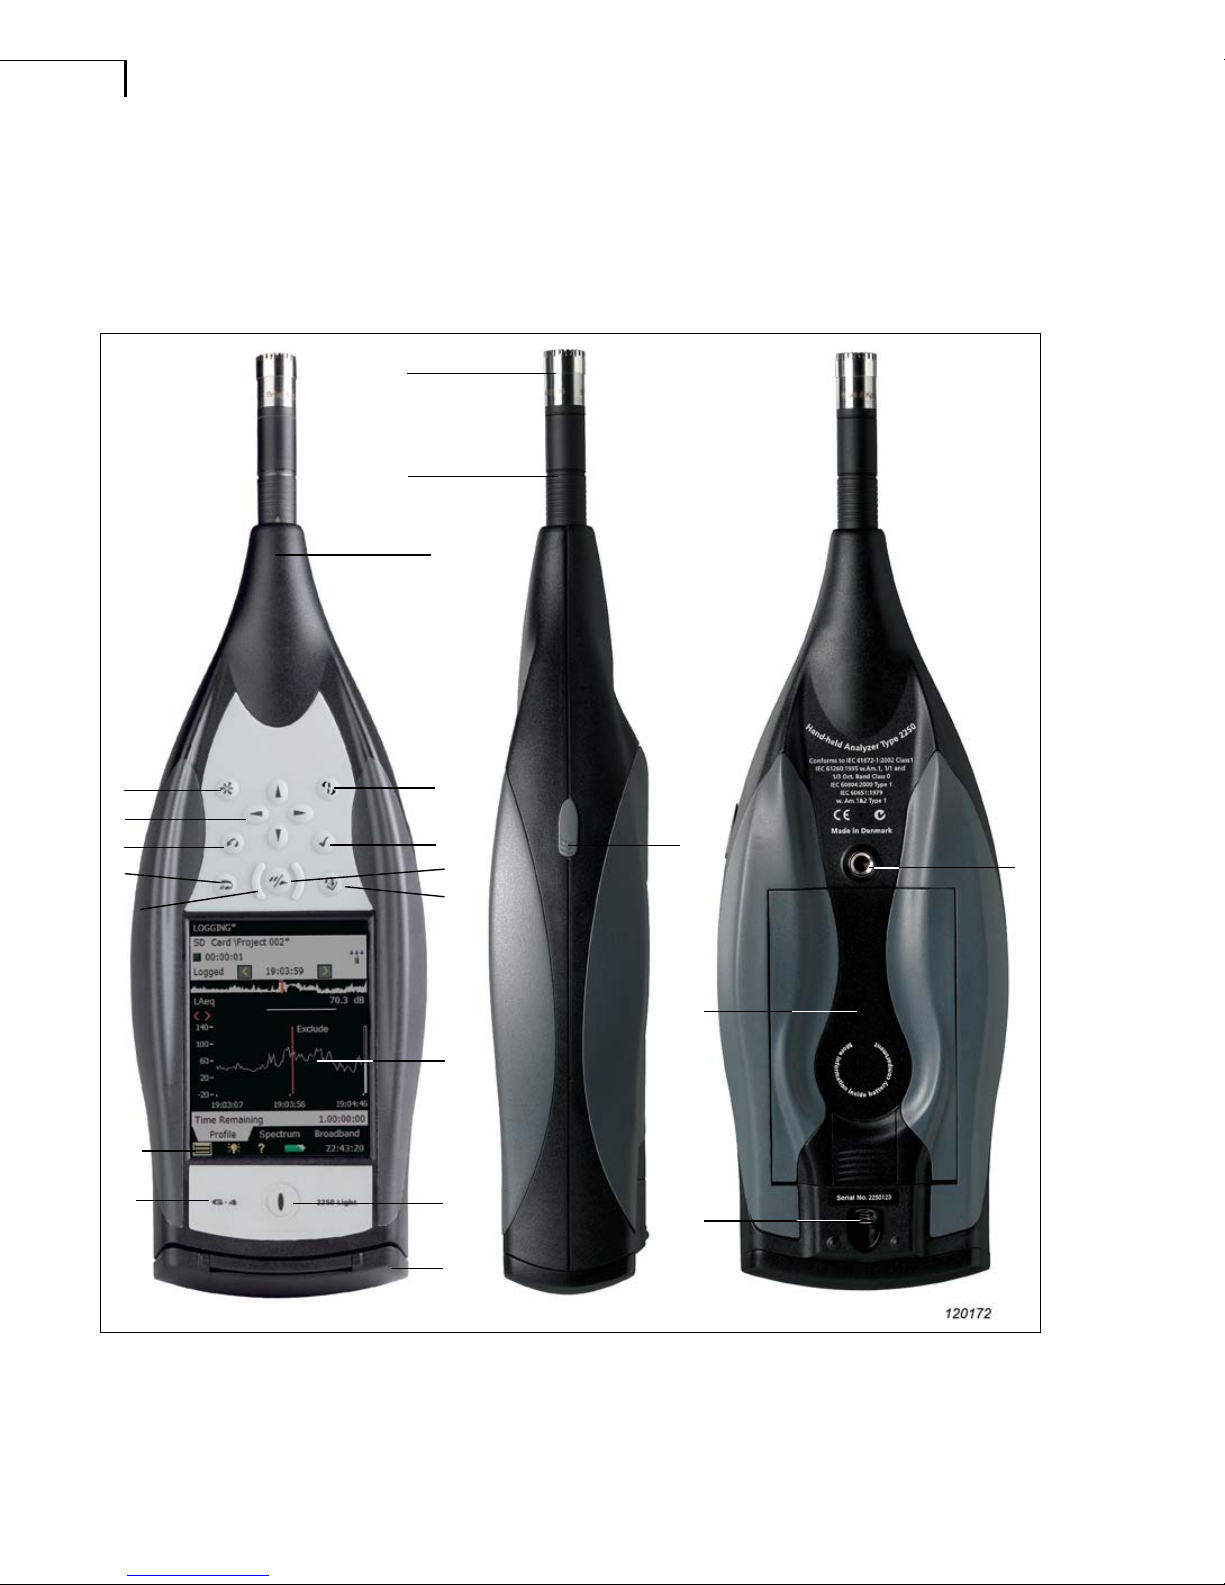
2.2 Instrument Components
An overview of the main instrument components is provided in Fig. 2.1 . The descriptions that
follow refer to those components.
Fig.2.1 Instrument components
1) Measurement Microphone: A Brüel & Kjær Prepolarized Free-field ½ Microphone is
used. A robust and reliable microphone with a wide frequency range
2) Preamplifier: Used to convert the high-impedance output of the microphone to low
impedance, suitable for driving long extension cables
8
3
6
7
5
16
1
2
4
11
9
10
12
13
14
15
16
17
19
18
20
1
2
22

CHAPTER 2
Assembling Your 2250 Light
5
3) (Manual Event 1 Pushbutton): This allows you to manually indicate events during a
measurement. Using 2250 Light software BZ-7130, BZ-7131 and BZ-7132, you can
control signal recording, while with BZ-7133 you can insert an event ma rker and control
recordings
Note: Signal recording requires a Signal Recording Option BZ-7226 license as well.
4) (Manual Event 2 Pushbutton): A second pushbutton is provided to allow you to
mark a second type of event during a measurement
5) , , , (Navigation Pushbuttons ): These move the active screen component
(Field Selector) and navigate the user interface
6) (Back-erase Pushbutton): This allows you to erase the last 5 seconds of measurement
data or to insert an Exclude Marker (BZ-7133 Logging Software for 2250 Light only)
7) (Accept Pushbutton): This allows you to accept any changes you make to the
instrument’s setup
8) (Reset Measurement Pushbutton): This allows you clear the current measurement
from the screen
9) (Start/Pause Pushbutton): Press this to start, pause or continue with a measurement
10) (Status Indicator): The red, yellow or green lights, (or LEDs), referred to as the
‘Traffic Light’ either side of the Start/Pause pushbutton, indicate important states of the
instrument during operation, that is, measurement stopped, paused or running. See Chapter
4 for further details
11) (Save Pushbutton): This allows you to save measurement results
12) Display Screen: A high-contrast, black and white, touch-sensitive screen
13) ( Main Menu Icon): This calls up the Main Menu, which allows you to navigate
immediately to all the main functions of the instrument, such as Setup, Explorer (or Databrowser), Preferences, and the Calibration procedure
14) (Power-on Pushbutton): Turns the instrument on and off. If held in for 1 second, the
instrument goes into standby mode; if held in for more than 4 seconds, it turns the
instrument off
15) Stylus: Stored in a holder on the side of the instrument, for use on the touch-sensitive
screen. You can choose to use the stylus or the pushbu tto ns, depending on your preference
and the measurement situation. (Also see section 4.4.5.)
16) Top Socket: This is the microphone input socket for 2250 Light. The Measurement
Microphone and Preamplifier (items 1 and 2 respectively) are connected directly to this
socket. For more details see section 2.3 that follows
17) Tripod Mounting Thread: Use this to mount 2250 Light onto the tripod and/or tripod
extension

6
2250 Light – User Manual
18) Wrist Strap/Tripod Mounting Thread: Use this to attach the wrist strap to 2250 Light
for added security, or use it to mount 2250 Light onto the tripod and/or tripod extension
using the tripod adaptor UA-1673
19) Internal Battery Pack: Rechargeable, high-capacity Li-Ion battery pack to power 2250
Light
20) Hinged Cover: A removable plastic cover is provided, which is hinged at the top to
provide protection for the connector panel underneath. To remove, simply open the cover
and pull the hinge out of the slot at the top of the connector panel. The cover includes a
rubber insert printed with an overview of the main connectors and reset button for easy
recognition. Indents are provided on the inside of the cover (behind the insert), which
allow you to drill holes in the plastic cover, giving access to the main connectors
underneath, so you can fit the cover while power is connected, for example
21) High Speed USB and LAN Interfaces (hardware version 4 only): This is used to
provide fast and seamless transfer of data and recordings back to the office. Both highspeed interfaces, USB or LAN, can be used when the analyzer is located in close
proximity to the PC. However, if the analyzer is remote from the host PC, the LAN
interface has the further advantage of data download from anywhere within the same LAN
network. Both interfaces are not just used for data download, but also for remote
monitoring and remote control.
22) G4 Mark: Indicates that the hardware is version 4. Without this mark, your hardware is an
earlier version
2.3 Analyzer Inputs/Outputs
Hardware Versions 1 – 3:
Fig.2.2 Connector panel of 2250 Light for hard ware versions 1 – 3
1) USB Interface Socket: Use the supplied Mini USB Cable AO-1476 to connect
2
1
3
4
5
7
6

CHAPTER 2
Assembling Your 2250 Light
7
2) Earphone Socket: Use the optional Earphones HT-0015 to connect
3) External Power Socket: Use Mains Power Supply ZG-0426 to connect and charge
batteries
4) Battery Charge Indicator: An LED that indicates when the battery pack is being charged
from external power. See section 2.3.1 for more information on the LED color codes
5) Reset Button: Press to reset the analyzer if you have problems
6) Compact Flash Card Slot: Insert a CF memory card to save data or connect a modem
(either a compact flash modem or using an CF to Serial converter)
7) Secure Digital Card Slot: Insert a SD or SDHC memory card to save data
Hardware Version 4:
Fig.2.3 Connector panel of 2250 Light for hardware version 4
1) Micro USB Interface Socket: Use the supplied Micro USB Cable AO-1494 to connect
2) Earphone Socket: Use the optional Earphones HT-0015 to connect
3) External Power Socket: Use Mains Power Supply ZG-0426 to connect and charge batteries
4) Battery Charge Indicator: An LED that indicates when the battery pack is being charged
from external power. See section 2.3.1 for more information on the LED color codes
5) Reset Button: Press to reset the analyzer if you have problems
6) Secure Digital Card Slots: Insert a SD or SDHC memory card to save data
7) Output Socket: Not used
8) Trigger Input Socket: Use this triaxial LEMO connector to control signal recording – see
section 2.3.1 for more information
9) Input Socket: Not used
2
1
3
4
5
6
11
7
8
9
10

8
2250 Light – User Manual
10) LAN Socket: Connect a LAN cable to synchronise measurement and setup data with a
host PC over a Local Area Network
11) USB A Socket: Connect to printers or other external USB devices
2.3.1 Description of Inputs and Outputs
Top Socket
See item 16 in Fig. 2.1.
This 10-pin LEMO connector is the microphone input for 2250 Light. Microphone Type 4950
(including Preamplifier ZC-0032) is normally connected directly to this connector. If required,
however, one of two microphone extension cables (AO-0697-D-030, 3 m and AO-0697-D-100,
10 m), can be fitted between the prea mplifier and the top socket, to extend the distance to the
desired length.
USB Interface
See item 1 in Fig. 2.2 and items 1 and 11 in Fig. 2.3.
The USB Interface provides high-speed direct communication via your PC’s USB port to
synchronise measurement and setup data with a host PC.
– Hardware versions 1 – 3: Use the supplied Mini USB Cable AO-1476
– Hardware version 4 (G4): Use the supplied Micro USB Cable AO-1494
Connect to a Printer or External Device via USB
For hardware versions 1 – 3, use the supplied A daptor AO-0657 to connect to a printer that
supports PCL® language via the USB socket.
For hardware version 4 (G4), use the standard USB Type A socket (item 11 in Fig.2.3) on the
analyzer to connect to printers or other external USB devices.
Earphone Socket
See item 2 in Fig. 2.2 and Fig. 2.3.
The 3.5 mm minijack earphone socket enables the instrument to be connected to a set of
headphones/earphones, for reviewing recorded comments or for monitoring the measured
sound. Use the optional Earphones HT-0015.
External Power
See item 3 in Fig. 2.2 and Fig. 2.3.
2250 Light is powered by an internal rechargeable battery pack. An indication of available
charge is shown by the battery icon at the bottom of the screen. If the charge remaining i s
low or empty, the batteries can be recharged by connecting Mains Power Supply ZG-0426 or
ZG-0429 to the ‘Ext. Power’ socket. When the power supply lead is connected, the
icon will be displayed in place of the battery icon.

CHAPTER 2
Assembling Your 2250 Light
9
CAUTION:
• Use specified battery charger only
• Charging below 0
°C (32°F) is not recommended. If you charge the battery pack below 0°C,
the lifetime of the batteries will be reduced
• Do not charge battery pack at temperatures above 60
°C
• Do not disassemble or expose battery pack to fire or water
Battery Charge Indicator
See item 4 in Fig. 2.2 and Fig. 2.3.
A battery charge light, (LED), indicates when the battery pack is being charged from external
power.
• With hardware versions 1 – 3: The LED is a steady green light when external power is
applied (and the battery is charging), and a flashing green light when charging has finished
• With hardware version 4 (G4): The LED is red when external power is applied (and the
battery is charging); green when the battery is completely charged; and blue to indicate
that the unit is in stand-by and battery powered
Reset Button
See item 5 in Fig. 2.2 and Fig. 2.3.
Located above the USB connector, it is used to reset 2250 Light if you have problems with the
instrument and cannot get it to operate. To reset, press the button with the point of the stylus.
See Chapter 9 for troubleshooting.
Slot for Compact Flash (CF) Cards
With hardware versions 1 – 3 only (see item 6 in Fig. 2.2).
This slot accepts CF sized-cards and can be used for memory, or for example, a modem.
Slot for Secure Digital (SD) Cards
See item 7 in Fig. 2.2 and item 6 Fig. 2.3.
This slot accepts SD and Secure Digital High Capacity (SDHC) memory cards and is typically
used to save measurement data. Capacities up to 32 gigabytes are acceptable.
Note: Hardware versions 1 – 3 have only one SD card slot. Hardware version 4 has two slots.
Input and Output Sockets
See items 7 and 9 in Fig. 2.3.
These sockets are currently not available for use.

10
2250 Light – User Manual
Trigger Input Socket
See item 8 in Fig. 2.3.
This triaxial LEMO connector is used for the external trigger of signal recordings. If you want
to start and stop the recording using an external device, connect it to this input. See details in
Appendix A.
Note: Signal recording requires a license for the BZ-7226 option.
LAN Socket
With hardware version 4 only – see item 11 in Fig.2.3.
The LAN Socket provides high-speed direct communication with a Local Area Network. It
is used to synchronise measurement and setup data with a host PC. The yellow LED on the
right is on when there is a link. The green LED on the left blinks when there is activity on
the LAN connection.

CHAPTER 2
Assembling Your 2250 Light
11
2.4 Hardware Setup
Fig.2.4 2250 Light – hardware overview
UA-1317
Microphone
Holder
UA-0801
Small
Tripod
(or UA-0587)
4231
Sound
Calibrator
HT-0015
Earphones
(optional)
USB Interface Cable, 1.8 m
either:
AO-1476 for HW v.1 – 3
or
AO-1494 for HW v.4
ZG-0426 or ZG-0429
Mains Power Supply
ZC-0032 Microphone
Preamplifier
4950 Microphone
UA-1651
Tripod
Extension
for Hand-held
Analyzer
UA-0587 Tripod
or UA-0801
AO-0697-D-030
Microphone
Ext. Cable, 3 m
AO-0697-D-100
Microphone
Ext. Cable, 10 m
060195/6
UL-1009
Industrial Grade
SD Memory Card
for Hand-held
Analyzer
2250-L
Hand-held Analyzer
ZG-0444
Battery
Charger
for
QB-0061
QB-0061
Rechargeable
Battery Pack
UA-1654
5 extra Styli
KE-0441
Protective
Cover
KE-0440
Travel Bag
for 2250
and
Accessories
FB-0691
Hinged Cover
for Hand-held
Analyzer
UA-1673
Adaptor for
Standard
Tripod Mount
BZ-5298
Environmental
Software CD incl.
Measurement Partner
DH-0696
Wrist Strap
Optional Accessories:
UA-0237
90 mm Windscreen
2250 Light

12
2250 Light – User Manual
2.5 Assembling 2250 Light
2.5.1 Charging the Battery for the First Time
Battery Pack QB-0061 comes charged to approximately half capacity on initial delivery.
Before using your 2250 Light for the first time, it is recommended that you fully charge the
battery pack, by connecting Mains Power Supply ZG-0426 (or ZG-0429) to the external power
socket. It should take approximately 8 – 10 hours.
The battery charge light shows a steady green light when external power is applied (and the
battery is charging), and a flashing green light when charging has finished. You can leave 2250
Light with external power on, even when the battery is fully charged. Also see section 9.3.3.
2.5.2 Making Good Measurements
The fact that you are using your 2250 Light, which fully complies with the IEC 61672–1
standard, ensures you always make good measurements. 2250 Light should be set up using the
following recommended assembly instructions. This is to minimise the influence of acoustical
reflections during measurements. All the components described below are shown in Fig. 2.1
and Fig.2.4.
Another set of instructions is provided in section 2.5.3, for situations where you need to
position the microphone at a distance from 2250 Light, while still complying with the standard.
Placing the Measurement Microphone
The measurement microphone must be placed away from shielding, reflecting, or absorbing
objects. In a diffuse sound field, absorbing objects will reduce the measured sound levels. In
a free sound field, reflecting objects can change the measured sound levels. Typically, the
sound level 0.5 m from a plane reflecting wall is 3 dB higher than if there was no wall.
The operator of the system may be personally shielding, absorbing, and reflecting, and can be
an additional noise source. Measure downwind in dry conditions with a windspeed less than
5 m/s.
The optimum position for the microphone is best found by trying different positions and
observing the resulting sound levels.
Mounting the Measurement Microphone
Before mounting the measurement microphone, note the following precautions:
• When screwing on the microphone, do it gently to avoid damaging threads
• Keep dust and foreign matter off the microphone diaphragm. Do not touch the diaphragm
with anything – it is very delicate
Note: Once the measurement microphone and preamplifier have been assembled and
connected to your 2250 Light, they should normally be left connected to the instrument.

CHAPTER 2
Assembling Your 2250 Light
13
To Connect:
1) Gently screw Microphone Type 4950 onto Preamplifier ZC-0032 (see items 1 and 2 in
Fig.2.1).
2) Insert the male plug of the preamplifier into the top socket of the Hand-held Analyzer (see
item 17 in Fig.2.1) and push gently until it snaps into position.
To Disconnect:
1) To remove the preamplifier and microphone, grip the locking collar firmly and slide
back, to remove the preamplifier and microphone combination from 2250 Light.
Mounting the Windscreen
For short outdoor noise measurements (or indoor measurements exposed to air movement),
mount Windscreen UA-0237 onto the microphone and preamplifier combination.
Mounting 2250 Light onto the Tripod Extension Stem and Tripod
Mount 2250 Light onto the Tripod Extension Stem UA-1651 and Small Tripod UA-0801, as
follows:
1) Screw Tripod Extension Stem UA-1651 onto the threaded stud of the ball-joint on Small
Tripod UA-0801. Secure the ball-joint in a roughly vertical position (that is, in-line with
the tripod) until ready to follow the instructions in step 4).
2) Screw the Extension Stem UA-1651 into the 2250 Light, using the threaded socket
situated on the underside of 2250 Light, at the back, (see item 18 in Fig.2.1).
3) Set Small Tripod UA-0801 (including 2250 Light) in the required position, and adjust it to
the required height. Ensure that one of the three legs is pointing in roughly the same
direction as your 2250 Light needs to point. (We will refer to this leg as the front leg.)
4) Position the extension stem at an angle of 45
° to the horizontal and vertically in-line with
the front leg of the tripod – this is to ensure the whole setup is stable.
Note: The procedure is the same if Tripod UA-0587 is used instead of Small Tripod UA-0801.
Once you have carried out these instructions, you are ready to start measuring, see Chapter 3.
2.5.3 Alternative Measurement Method (Extended Microphone)
The measurement microphone can be placed a distance from 2250 Light by connecting an
extension cable and fitting the microphone to a microphone holder. 2250 Light should be set up
using the following assembly instructions. This is to ensure that the accessories have limited
acoustical influence on the instrument during measurement. All the components described
below are shown in Fig.2.1 and Fig.2.4.

14
2250 Light – User Manual
Connecting a Microphone Extension Cable
There are two optionally available extension cables which are recommended for use with
2250 Light. These are:
• AO-0697-D-030: 3 m long
• AO-0697-D-100: 10 m long
Note: Connecting a recommended microphone extension cable has no appreciable effect on the
Hand-held Analyzer’s measurement and has no effect on the instrument’s calibration.
However, although it is not essential to re-calibrate, it is good measurement practice to calibrat e
the whole measurement chain (including microphone extension cable) before starting a
measurement.
Decide which cable you require and assemble as follows:
1) Gently screw Microphone Type 4950 onto Preamplifier ZC-0032 (see items 1 and 2 in
Fig.2.1).
2) Insert the preamplifier into the female plug of the extension cable and push gently until it
snaps into position.
3) Insert the male plug of the extension cable into the top socket of the Hand-held Analyzer (see
item 17 in Fig.2.1) and push gently until it snaps into position.
Mounting the Measurement Microphone on the Microphone Holder and Tripod
Mount the microphone and preamplifier combination onto Microphone Holder UA-1317 and
Small Tripod UA-0801, as follows:
1) Set Small Tripod UA-0801 in the required position, and adjust to the required height.
2) Screw Microphone Holder UA-1317 onto the threaded stud on the tripod ball-joint, and
position the holder as required.
3) Push the microphone and preamplifier combination carefully into the microphone holder, so
that it grips onto the body of the microphone and preamplifier. Ensure that the microphone
lead sits properly in the plastic guide.
Once you have carried out these instructions, you are ready to start measuring, see Chapter 3.
2.5.4 Measuring for Convenience
Measurements that need to be done at short notice, with no particular accuracy can be carried
out by simply holding the instrument or using any combination of hardware components and
accessories shown in Fig.2.4.

15
Chapter 3
Making Your First Measurement
This chapter describes how to make a basic measurement and how to save and document the
results. It assumes you have just received your 2250 Light and are turning it on for the first
time.
Note: A stylus is stored in a holder on the side of the instrument, see item 15 in Fig.2.1. This
can be used on the touch-sensitive screen to select icons and functions during the procedures
that follow. Alternatively, you can use the various pushbuttons, see items 3 to 11 in Fig.2.1.
The following procedures assume that the measurement microphone and preamplifier have
been mounted as described in Chapter 2 and 2250 Light has a fully charged battery, see
section 2.5.1.
3.1 “Point and Shoot”
Using the following basic procedure you will be able to start using your Hand-held Analyzer
immediately to make measurements and start the familiarisation process:
1) Switch on by pressing and make sure the SOUND LEVEL METER Project
Template is selected.
2) Check that the data path at the top of the screen displays the correct job/project
(i.e, where you want to save the new data). See section 6.1.1.
3) Set Measurement Mode to manual and change any setup parameters by tapping the
Main Menu icon and selecting Setup from the drop-down that appears.
4) Press the Start/Pause pushbutton , then monitor the status indicator (traffic light).
5) Use the Start/Pause , Continue , Back-erase and Reset pushbuttons to
control the measurement.
6) When measurement has finished, press the Save pushbutton to save your data.
7) To view and organise your data, tap the Main Menu icon and select Explorer.

16
2250 Light – User Manual
Note: You are not required to set any measurement ranges on 2250 Light; the in strument ha s a
dynamic range of more than 120 dB, from 140 dB down to the noise floor of the instrument, (if
the microphone has nominal sensitivity).
3.1.1 Congratulations!
You should now be familiar with the basic principles of the 2250 Light. If you need more help,
the following section goes into the measurement process in more detail. If not, please refer to
Chapter 4.
3.2 Making a Measurement
3.2.1 What is a Project Template?
A Project Template cont ains all the commo n display settings and measurement setups required to
perform a noise measurement. The template does not contain any measurement data – this data
is saved as individual projects, stored in job folders, see section 6.1.1. The Project Templates
covered by this manual, are:
• Sound Level Meter Project Template (included in BZ-7130 software)
• 1/1-octave Frequency Analysis Project Template (included in BZ-7131 software)
• 1/3-octave Frequency Analysis Project Template (included in BZ-7132 software)
• Logging Project Template (included in BZ-7133 software)
Note 1: Signal Recording Option BZ-7226 does not contain a specific template – signal
recording options are available in all templates.
Note 2: Tone Assessment Option BZ-7231 does not contain a specific template – tone
assessment options are available in all templates included with BZ-7132/33.
If you make any changes to the settings in a Project Template, an ‘
*
’ will appear next to the
template name to indicate that the new settings have not been saved. Select Save Template
from the Main Menu to save the settings in the current template.
3.2.2 Switching On
Switch 2250 Light on by pressing . The start-up time depends on the state the instrument
was in when last switched off and it may take up to 2 minutes from a cold sta rt, or up to 10
seconds if the instrument is already in Standby Mode (that is, from a warm start).
Note: A cold start is described as a re-boot of the instrument from ROM. This normally occurs
after the instrument has been turned off for some time, either by the user or following an
automatic power-down. A warm start takes the instrument quickly from Standby Mode to
Operating Mode without having to re-boot. (The battery needs to be charged for this to happen,
see section 2.5.1.)

CHAPTER 3
Making Your First Measurement
17
3.2.3 Set the Sound Level Meter Project Template
After initialisation, the screen shown in Fig.3.1 appears:
Fig.3.1
Initial sound level meter
screen
1) Check that the SOUND LEVEL METER Project Template is displayed at the top of
the screen, see Fig. 3.1. If not, use the stylus to tap on the bar at the top of the screen to
reveal a drop-down list and select SOUND LEVEL METER from the list, see Fig. 3.2.
Fig.3.2
Changing the project
template
2) Tap on Measurement Mode in the view area and set to Manual, see Fig.3.3.
Note: The bar-graph showing the sound pressure level L
AF
is now live. This is because
L
AF
is an instantaneous value, always available for display. Other parameters, such as
L
Aeq
is a measured value that needs to be averaged over a period of time and cannot be
displayed before you have started a measurement using the Start/Pause pushbutton .

18
2250 Light – User Manual
Fig.3.3
Setting the measurement
mode
3) Press the Start/Pause pushbutton to start the measurement.
Note: Start appears on the screen as feedback when you press the Start/Pause pushbutton.
Notice the Running Icon on the screen and monitor the red, yellow, green ‘traffic
light’ status indicators around the Start/Pause pushbutton while you are measuring. The
indications should be as follows:
• Yellow status indicator flashing every 5 s before you start the measurement
• Steady green status indicator after you have pressed the Start/Pause pushbutton
and during the measurement (if everything is OK)
• Yellow status indicator flashing every 5 s when you have stopped, saved the measure-
ment and are ready to do another measurement
• Yellow status indicator flashing slowly, 0.5 s on, 0.5 s off, if you pause the measu rement
• Red status indicator flashing rapidly if you encounter an overload condition during the
measurement
4) Use the Start/Pause , Continue , Back-erase and Reset pushbuttons to
control the measurement. The status field at the top of the screen will give short textual
feedback on the pushbutton operation. A visual indication of measurement status is also
displayed on the status line, by way of the Stopped icon , the Running icon and
the Paused icon . See Fig. 3.4.

CHAPTER 3
Making Your First Measurement
19
Fig.3.4
Measurement
feedback in the
status field
5) Toggle between different display parameters, as required, by tapping on each parameter
field (for example LAF90.0 in Fig.3.4) with the stylus and selecting other parameters
from the drop-down lists that appear.
Note: The tabs at the bottom of the screen allow you to choose different ways of
displaying the measurement results:
• The Broadband view shows an instantaneous L
AF
readout, with associated bar graph
and four measurement parameters, followed by two measurement setup parameters.
(The first parameter is displayed in a larger font size for better readability, see
Fig.3.4.)
• The XL View increases the size of the first parameter readout to a 4 digit, full-screen
display (including decimal point)
6) Set Measurement Mode to Automatic and choose a preset time for your measurement.
Then repeat steps 3 and 4. The measurement will automatically pause after the preset
time. This allows you to either save your measurement or continue m easuring, as required.
7) Tap the Main Menu icon and select Setup from the list of options, see Fig. 3.5.

20
2250 Light – User Manual
Fig.3.5
Main Menu options
Change the broadband weighting parameters by tapping on the ‘plus’ icon next to
Frequency Weightings, then on the weighting parameter field on the right-hand side of
the screen. A weighting drop-down menu will appear, see Fig. 3.6. Change the parameters
as required.
Fig.3.6
Changing the broadband
frequency weightings
8) Return to the bar-graph screen of the SOUND LEVEL METER template, by tapping
and you are ready to make a new measurement.

CHAPTER 3
Making Your First Measurement
21
3.3 Save your Measurement
When you have completed your measurement, you need to save it. By default, 2250 Light
creates a job folder called JOB 01. Job folders represent the upper level of the data (or file)
management system, with individual measurements or sets of data, represented by projects
appearing under the relevant job. By default 2250 Light also creates a project called
Project 001 under JOB 01. (Subsequent measurements will be labelled Project 002,
Project 003, etc., under JOB 01. This will happen each time you have saved a measurement.)
Check that the data path at the top of the screen displays \JOB 01\Project 001* and save your
measurement by pressing the Save pushbutton . For more details refer to section 6.1.
Note: An asterisk will appear alongside the project at the top of the status field as soon as you
start your measurement, see Fig.3.7. This signifies that the measurement has not been saved. It
will disappear once you have saved the measurement.
Fig.3.7
Saving your
measurement
3.3.1 Viewing the Saved Measurement
1) To view the saved measurement, tap the Main Menu icon and select Explorer
from the list of options. Tap on the name of your measurement (Project 002 in this
case) and select View from the drop-down that appears, see Fig. 3.8. (Or just tap on the
measurement icon to the left of the name.)

22
2250 Light – User Manual
Fig.3.8
Viewing your
measurement in Explorer
2) This opens the Data Viewer, see example in Fig. 3.9. The viewer displays the data in a
pre-defined format, where you can select and view different parameters, as necessary.
Fig.3.9
The Data Viewer
3) When finished, tap to return to Explorer and to return to the measu rement screen.
3.4 Documenting your Measurement
You can attach a note with the GPS position (re quires a GPS receiver connected to the USB
socket). Adding a GPS note can be done before, during or after savin g the measurement by
tapping the Main Menu icon and tapping Add GPS Note to Cur. Measurement in the list
of options.

CHAPTER 3
Making Your First Measurement
23
If a GPS receiver is connected (via USB) when you press the Save pushbutton , then the
GPS note is automatically created with the position. Remove the GPS receiver after usage to
save power.
Tap the paperclip , icon to see the GPS annotation in the project and tap the text icon in the
annotation to view the GPS coordinates.
Fig.3.10
Example of a GPS note
If you do not have a GPS receiver, but know the position (for example, from your smartphone),
you can manually key in the position in the GPS note.
The GPS note is headlined “Position:”, and includes the latitude and longitude. For manual
entries, please enter the latitude and longitude in one of the following formats :
Degrees: D D.ddddddY DD.ddddddX
Example: 55.816730N 12.532855E
Degrees Minutes: DD MM.mmmmY DD MM.mmmmX
Example: 55 49.0038N 12 31.9713E
Degrees Minutes Seconds: DD MM SS.sssY DD MM SS.sssX
Example: 55 49 0.288N 12 31 58.278E
where X = E or W and Y = N or S. If you use degrees only, then you can use +/– instead of N/S
and E/W (example: 43.08011N,79.071007W = 43.08011,–79.071007). You can use “,” instead
of “space” between latitude and longitude
The GPS note can be used by Measurement Partner Suite BZ-5503 to locate the mea surement
on Google Maps™.

24
2250 Light – User Manual
3.5 Switching Off
Switch 2250 Light off by pressing . If held in for 1 second, the instrument goes into standby
mode; if held in for more than 4 seconds, it switches the instrument off.
The instrument will automatically switch off, when it has been in standby mode without external
power for more than 30 hours.

25
Chapter 4
Getting to Know Your 2250 Light
4.1 What is a Sound Level Meter?
A Sound Level Meter (SLM) is an instrument that is designed to measure sound levels in a
standardised way. A sound level meter comprises a microphone, a preamplifier, a main
processor and a read-out unit.
The microphone converts the sound signal into an equivalent electric signal. The electric signal
that the microphone creates is at a very low level, so it is made stronger with the help of a preamplifier before it is processed by the main processor.
Processing includes applying frequency and time weightings to the signal as specified by
international standards, such as IEC 61672–1, to which 2250 Light conforms.
Frequency weighting adjusts how the sound level meter responds to different sound
frequencies. This is necessary because the human ear’s sensitivity to sound va ries according to
the sound’s frequency. The most commonly used freq uency weighting is A-weighting, which
adjusts a signal in a way that best resembles the human ear’s respo nse at medium-range levels.
It is the weighting required for nearly all environmental and workplace noise measurements,
and is specified in international and national standards and guidelines. All of 2250 Light’s
measurement parameters apply A- or B-weighting, and a choice of C- or Z-weighting, except for
the measurement of peak levels where a single weighting (typically the ‘C’ frequency
weighting) is applied. In this case, C-weighting is used to take into account the energy present
at low frequencies even when they are not particularly annoying.
Time weighting specifies how the sound level meter reacts to changes in sound pressure. It is
an exponential averaging of the fluctuating signal, providing an easy-to-read value. 2250 Light
applies the Fast, Slow and Impulse (or ‘F’, ‘S’ and ‘I’) time weightings, which are the required
weightings according to the vast majority of international and national standards and
guidelines.
Once the signal is processed through the weighting filters, the resulting sound pressure level is
displayed in decibels (dB) referenced to 20 µPa on the instrument’s screen. In 2250 Light, the
sound pressure level values are updated at least once per second.

26
2250 Light – User Manual
Assessing a fluctuating noise level means getting a value for a level that is, in simple terms, the
average level. The ‘equivalent continuous sound level’, L
eq
, is known around the globe as the
essential averaged parameter. L
eq
is the level that, had it been a steady level during the
measurement period, would represent the amount of energy present in the measured,
fluctuating sound pressure level. It is a measure of the averaged energy in a varying sound
level. It is not a direct measure of annoyance, though extensive research has shown that L
eq
correlates well with annoyance.
L
eq
is measured directly with a hand-held analyzer, such as 2250 Light running Sound Level
Meter Software for 2250 Light, BZ-7130. If an A-weighting filter is used, it is expressed as
L
Aeq
, which is defined as the measurement of the equivalent continuous sound level using the
A-weighted filter network.
A full range of measurement parameters is given in Appendix B.
4.2 What is 2250 Light?
2250 Light is a versatile hardware platform suitable for covering a wide range of different
applications. Together with Sound Level Meter Software for 2250 Light BZ-7130, it is a Class
1 modular precision integrating-averaging sound level analyzer with an easy to use interface
for quick and simple measurement setups.
4.2.1 Sound Level Meter Software for 2250 Light BZ-7130
Sound Level Meter Software for 2250 Light, BZ-7130 allows you to measure a comprehensive
set of parameters used for rating noise in terms of its impact on the environmental and working
environments and on occupational noise evaluation.
The more commonly used parameters, which cover a large range of applications, are either
instantaneous measured parameters (available at any time) or timed measured parameters
(measured within a controlled time interval):
Timed Measured Parameters
• Equivalent Continuous Sound Levels (L
eq
– example: L
Aeq
)
• Peak Sound Levels (L
peak
– example: L
Cpeak
)
• Moving (or sliding) Equivalent Continuous Sound Levels (L
Aeq,T,mov
and L
Aeq,T,mov,max
)
• Maximum Time-weighted Sound Levels (L
max
– example: L
AFmax
)
• Minimum Time-weighted Sound Levels (L
min
– example: L
AFmin
)
• Percentile Levels (L
N
– example: L
AF90.0
)
• Sound Exposure Level (L
AE
)
• Sound Exposure (example: E)
• Daily Noise Exposure Level (example: L
ep,d
or L
EX,8h
)
• Noise Dose (examples: based on ISO standards: Dose; based on US standards: DoseS5)
• Number of Peaks (for example, #CPeaks(>140 dB))
• Time Weighted Average (for example, TWA)

CHAPTER 4
Getting to Know Your 2250 Light
27
• Level Average with Exchange Rates 4, 5 or 6 (example: LavS5)
• Weather data (requires a weather station connected)
• GPS data (requires a GPS device connected)
Instantaneous Measured Parameters
• Instantaneous Time-weighted Sound Levels (L
p
– example: LAF)
• Sound Pressure Levels (max levels once per second – example: L
AF
(SPL))
• Instantaneous Peak Sound Levels (example: L
Cpeak,1s
)
• Instantaneous Weather data (re quires a weather station connected)
• Instantaneous GPS data (requires a GPS device connected)
Note: See Appendix B for a comprehensive list of all parameters.
Sound Level Meter Software for 2250 Light, BZ-7130, incorporates a simple user interface,
which is easy to learn and uses intuitive data storage and recall. Comprehensive security
features means no loss of data, even on accidental power-off. Sound Level Meter Software for
2250 Light, BZ-7130, also provides connectivity between your PC and other sound analysis
software.
This hand-held analyzer platform includes a range of optional software modules, that are
enabled through easily activated software license keys. The combination of software modules
and innovative hardware makes the instrument a dedicated solution for performing all your
high-precision measurement tasks. The following optional software modules are covered in this
manual:
• 1/1-octave Frequency Analysis Software for 2250 Light BZ-7131
This software module allows real-time frequency measurements in 1/1-octave bands,
making it a simple matter to, for example, select suitable hearing protection, qualify
noise from heat and ventilation systems and assess tonality
• 1/3-octave Frequency Analysis Software for 2250 Light BZ-7132
This software module is similar to the previous module, except that it allows real-time
frequency measurements in 1/3-octave bands
• Logging Software for 2250 Light BZ-7133
This software module allows logging of broadband and spectral data
a
to obtain a time
history for later analysis, for example, for use in environmental noise as well as workplace noise assessment. It allows free selection of up to 10 parameters to log at periods
from 1 s to 24 h. Results are logged directly to CF or SD m emory cards
• Signal Recording Option BZ-7226
This option allows recording of the input signal (typically sound) in either 16-bit or 24bit resolution during measurement. The signal recording can be controlled manually or
by using an external trigger signal. The recorded signal can be played back and listened
to (hardware version 4 only) using optional Earphones HT-0015. The signal is recorded
directly to the SD memory cards (or CF card if using hardware versions 1 – 3)
a. Requires 1/1-octave Frequency Analysis Software for 2250 Light BZ-7131 or 1/3-octave Frequency
Analysis Software for 2250 Light BZ-7132

28
2250 Light – User Manual
• Tone Assessment Option BZ-7231
This option allows the assessment of tones on-site, according to the ISO standard.
When used with 1/3-octave Frequency Analysis Software BZ-7132 and Logging Software BZ-7133, it allows you to assess tones in a measured 1/ 3-octave spectrum according to ISO 1996:2007, Annex D
4.2.2 Built-in Help
If you need more detailed information at any time during operation, tap the Help icon on the
instrument’s screen. The resulting screen will explain that particular item in much more detail.
You can scroll up and down the explanatory text using either the and pushbuttons, or the
scrollbar on the screen. Return to the normal display screen by tapping .
If you need to view any of the previous 10 screens you have visited in the help system, press
the icon at the top of the display.
4.2.3 Software and Hardware Versions
Once in the help system, you can access the list of installed software versions and licenses,
together with information about the hardware. This information is always available and is
accessed by selecting About from the top of the display.
4.3 What is Measurement Partner Suite BZ-5503?
Measurement Partner Suite BZ-5503 comes standard with your hand-held analyzer and
provides data archive, preview and export capabilities as well as software maintenance and
remote online display. In addition to the included standard configuration, valuable data analysis
and postprocessing functionality is available in an expanding suite of optional application
modules.
The software enables you to do the following:
• Setup or control the analyzer from a PC
• Retrieve data from the analyzer
• Manage and archive data from the analyzer
• View data in archives
• Update the software in the analyzer
• Install licenses for use of software modules in the analyzer
• Remotel y view online displays
• Post-process data (optional)
• Export to other post-processing and documentation tools like Evaluator™ Type 7820 or
Microsoft
®
Excel® or Word
Measurement Partner Suite BZ-5503 is supplied on the Environmental Software DVD
(BZ-5298), which is included with your 2250 Light.

CHAPTER 4
Getting to Know Your 2250 Light
29
4.4 Basic Principles when using 2250 Light
4.4.1 Navigation Principles – ‘Star’ Navigation Concept
The main principle is that all the main menus are accessible via a single tap of the stylus. The
Main Menu icon forms the centre of the ‘star ’ navigation concept, see Fig.4.1:
Fig.4.1
The ‘Star’ navigation concept

30
2250 Light – User Manual
This configuration gives you immediate access to screens you need most, that is, those you will
need to perform, save and document your measurements. The Main Menu allows you to
navigate to the following screens:
• Explorer
•Setup
• Preferences
• Transducers
• Calibration
• Timer Setup
In addition, the Main Menu also allows you to perform the following actions:
• Save Template
• Lock Keys and Screen
Explorer
The Explorer screen is accessed from the Main Menu, and gives you access to the instrument’s
Data/Project manager. This allows you to view the overall project structure, including job
folders and projects, and to view all the individual measurements. W hen you have finished,
press to return to the measurement screen.
Setup
The Setup screen is accessed from the Main Menu and gives you access to the various setup
parameters, such as frequency weightings, control of the measurement, bandwidth, statistics
and the type of input currently connected. You can change these as required, see section 4.4.6.
The Full tab at the bottom of the screen allows you to view the complete list of setup
parameters, while the Quick tab allows you to access the more frequently used parameters.
When you have finished viewing or updating the parameters, tap to return to the
measurement screen.
Changes made to the setup will only be applied temporarily, i.e., until you select another
project template or open another project to re-use the setup from that project. However, if you
want the setup changes to be saved in the current template, select the Save Template option
from the Main Menu .
Note: If you make changes to the setup that you do not want to keep (and you have not yet
selected Save Template), you can undo them by selecting the template again from the Project
Template bar at the top of the screen.
Preferences
The Preferences screen is accessed from the Main Menu and gives you access to the
instrument’s preferences. These include things such as regional settings, appearance of the
screen, power management and language. You can change these as required, see section 4.4.6.
For more information refer to section 8.1. When you have finished viewing or updating the
parameters, tap to return to the measurement screen.

CHAPTER 4
Getting to Know Your 2250 Light
31
Transducers
The Transducers screen is accessed from the Main Menu, you can view details of the
transducer connected to the instrument. Details can be changed, see section 4.4.6. When you
have finished viewing or updating the details, tap to retu rn to the measureme nt screen.
You can tap on the Calibration History link at the bottom of the transducer details and open the
Calibration History screen, see Fig. 4.1. This screen includes the calibration history for the
microphone. When you have finished viewing or updating the details, tap to return to the
Transducers screen.
Calibration
The Calibration screen is accessed from the Main Menu, and gives you access to the
instrument’s calibration procedure. To calibrate the instrument, follow the instructions in the
status field. For more information refer to section 5.1. When you ha ve finished calibrating or
viewing the details, tap to return to the measurement screen.
The Calibration tab at the bottom of the calibration screen allows you to perfo rm and monitor
the calibration, while the Details tab allows you to view the details of the calibr ation and the
calibrator that are being used to calibrate the instrument. While you are viewing the Details tab,
you can tap on the Calibration History link at the bottom of the calibration details and open the
Calibration History screen, see Fig.4.1. This screen includes the calibration history for the
currently selected transducer, tap to return to the Calibration screen.
Timer Setup
The Timer Setup is accessed from the Main Menu and enables you to control the analyzer via
one or more of the analyzer's timers. The purpose of a timer is to initiate measurements in the
absence of an operator. When you have finished, tap to return to the measurement screen.
4.4.2 The Display Screen
During normal operation, you will use the display screen to view your measurements and carry
out a variety of functions, which are described in the following sections.
CAUTION: The touch-sensitive screen is susceptible to damage from sharp objects, such as
pencils, fingernails, etc. We therefore recommend you use the stylus provided to activate items
on screen. See also section 4.4.5.
A typical screen is shown in Fig.4.2.

32
2250 Light – User Manual
Fig.4.2
Typical screen when
making a measurement
The main areas, starting at the top of the screen, are:
• Project Template
• Status Field
• View Area (with View tabs)
• Shortcut Bar
Project Template Bar
This bar displays the name of the Project Template, which contains all the screen settings and
measurement setup for the current project. Tap on the text to open a drop-down list containing
all the available templates. If you make any changes to the setup in a template an ‘
*
’ will
appear next to the template name to indicate tha t the new settings have not been saved. Select
Save Template from the Main Menu to save the settings in the current template.
Status Field
The area just below the Project Template bar is called the Status field. Depending on the
template, this field displays status information using up to three lines of text, as follows:
First Line:
• Path and name of the current project (see section 6.1.1). Tap it to change the name of the
project. T o change the path, tap the Main Menu icon and select Explorer from the list
of options, navigate to the desired job (path) and tap the icon to save this path as the
default measurement path. As in the project template, an ‘
*
’ will appear next to the project
name to indicate that the project has not been saved. Press the Save pushbutton if you
want to save the measurement
• Smiley (if applicable)
• The PC icon indicates connection to a PC
Project Template
View area
Shortcut bar with icons
Status field
View tabs

CHAPTER 4
Getting to Know Your 2250 Light
33
Second Line:
• Measurement state represented as icons: Stopped , Running and the Paused icon
• Elapsed time of the measurement
• Feedback on the action of pressing the following pushbuttons: Reset , Back-erase ,
Start/Pause and Save
• Indication that the measurement microphone is uncalibrated. In this case the word Uncal.
appears in the Status Field
• Four icons are used to represent whether, or not, a windscreen is fitted and whether you are
measuring in a free-field or diffuse field. For example, no windscreen fitted, measuring in
a free-field – ; no windscreen fitte d, measu rin g in a diffuse field – ; windscreen fitted,
measuring in a free-field – ; windscreen fitted, measuring in a diffuse field –
• Immediate textual feedback on overload situation and latched overload indicated with an
overload icon
Third Line: Used for Logging. See “Status Field” on page 101.
Central View Area
The Central View area contains the screens required for a particular measurement, such as bar
graphs, result readouts and various frequently used setup parameters (that is, Meas. mode). The
template defines the content of this area. More than one screen can be used for displaying the
information. Select the screen using the View Tabs at the bottom of the View area.
Changes made to the screens will only be applied temporarily, that is, until you select another
project template or open another project to re-use the screen from that project. However, if you
want the screen changes to be saved in the current template, select the Save Template option
from the Main Menu .
Note: If you make changes to the screen that you do not want to keep (and you have not yet
selected Save Template), you can undo them by selecting the template again from the Project
Template bar at the top of the screen.
Shortcut Bar
The Shortcut Bar, at the bottom of the screen, displays a number of fixed icons that are always
accessible. These include:
• Main Menu icon , giving access to the Main Menu. This allows you to navigate to a
specific function, see description earlier under Navigation Principles
• Backlight icon , allows you to select a backlight level
• Help icon , a quick way to get context-sensitive help from any screen by tapping on the
icon at the bottom. Closing the help window will return you to the previous screen
• Battery/power status icon , shows the condition of the battery. All green shows a
fully charged battery, while red means power levels are low. Tap the icon to get more
details of the battery condition. (When the Power Supply lead is connected, the
icon will be displayed in place of the battery icon.)
• The clock in the lower right corner displays the current time. Tap the readout to get details
of the time and date, or to set the clock.

34
2250 Light – User Manual
4.4.3 Use of Pushbuttons for Controlling Measurements
The design of 2250 Light is such that the layout of the pushbuttons has been optimised for
single-handed operation.
Reset Pushbutton
Use the Reset pushbutton to reset a measurement, i.e., to reset all detectors, averagers,
maximum and minimum hold, etc. If the measurement is paused (that is, Paused icon is
displayed in the status field), then the measurement reverts to a ‘stopped’ state after a reset,
(that is, Stopped icon
displayed with a zeroed readout). If the measurement is running, then
the measurement will be automatically re-started after the reset.
Start/Pause Pushbutton
Use the Start/Pause pushbutton for controlling the measurement. The function of this key
depends on the current measurement state, see Table 4.1.
Save Pushbutton
Use the Save pushbutton to save the mea surement data together with the current project
template (including all the screen settings and setup information) and the calibration
documentation.
Pressing Save will affect the pause and running states. In both cases the measurement state will
be ‘stopped’ shortly after pressing the pushbutton (Stopped icon
displayed).
Back-erase Pushbutton
For BZ-7130, BZ-7131 and BZ-7132 Software:
Use the Back-erase pushbutton to erase the last 5 seconds completely from the measurement.
(This includes, of course, overload indications you would like to erase.)
If used when the current measurement is running, then the measurement will be paused. The
status field displays Pause, Back erase briefly, and then displays the shortened elapsed time
along with the Paused icon .
For BZ-7133 Software:
Pressing the Back-erase pushbutton will start drawing an Exclude Ma rker on the display, see
section 11.3.2. Pressing it again will stop drawing the marker on the display (toggle function).
Tab le 4.1
Start/Pause pushbutton functions
Current
Measurement
State
Function of
Start/Pause Pushbutton
Next Measurement
State
Stopped Start the measurement Running
Running Pause the measurement Paused
Paused Continue the measurement Running

CHAPTER 4
Getting to Know Your 2250 Light
35
4.4.4 On-screen Feedback and Traffic Light
Feedback is given on screen in the Status Field, see Fig. 4.2, and the Traffic Light indicates
important states of the instrument, see Table 4.2
:
4.4.5 Use of Stylus and Navigation Pushbuttons
The stylus and navigation pushbuttons are used for setting up 2250 Light, navigating th rough
the screens and managing the results.
A number of items that appear on the screen (parameter values or icons) can be selected,
updated and activated. For instance, a new parameter value can be selected from a drop-down
list.
The selection and activation of items on the screen can be done in two ways:
• Tapping once on the item on the screen will select and activate it, or
• Moving the field selector around using the navigation keys until the item you want is
highlighted, then pressing the Accept pushbutton to activate it
You can choose to use the stylus or the pushbuttons, depending on your preference and the
measurement situation. For instance, if the amount of noise generated by the instrument needs
to be kept to an absolute minimum, consider using the pushbuttons rather than the stylus – this
is because tapping of the stylus on the touch-sensitive screen may create extra noise. However,
if speed is of major importance, the stylus can navigate through the se tup and measurement
screens quicker.
Throughout the manual we have described how to perform the measurement procedures using
the stylus only, but you may also use the alternative method (using the Navigation and Accept
pushbuttons) if you prefer.
4.4.6 How to Change Parameter Values
Most parameter values are changed by selecting a new value from a drop-down list, which
appears when the parameter field is selected. See the example in Fig.4.3.
Table 4.2
Traffic Light Indica-
tions
State Light Scheme
During power-on or loading template Nothing
Stopped. Ready to measure Short yellow flash every 5 s
Awaiting trigger, searching for
calibration signal
Short green flash every second
Running measurement,
everything OK
Steady green light
Paused. Measurement not saved Slow yellow flash on 1/2 s, off
1/2 s
Overload Fast red flash

36
2250 Light – User Manual
Fig.4.3
Changing parameter
values
Stylus Usage
Tap on the value you want in the drop-down, or tap outside the list to cancel the selection.
Pushbutton Usage
Use the navigation pushbuttons (up arrow , or down arrow ) to select the va lue you want
and press the Accept pushbutton to activate it. Use the left arrow to cancel the selection.
Number Keyboard
When activating a number, a number keyboard appears, see Fig.4.4.
Fig.4.4
Number keyboard
Tap on the digits or use up arrow /down arrow to increment/decrement the number. Use
left arrow /right arrow to select other dig its if necessary. Press the Accept pushbutton
or tap the
button on the screen to enter the number for the parameter. Tap on the
button on the screen, or outside the number keyboard to cancel the change of value.

CHAPTER 4
Getting to Know Your 2250 Light
37
Character Keyboard
When activating a text value, a standard full character keyboard appears on the screen (Fig.4.5).
Fig.4.5
Character keyboard
The character keyboard has all the functionality of a normal keyboard, enter text as required by
tapping the individual keys with the stylus. Tap the Enter key
to accept the changes, or tap
outside the keyboard to cancel.
You can lock your settings, to prevent accidental cha nges, by tapping on the padlock icon
on top of the screen. To unlock tap on the padlock icon again.
4.4.7 Locking the Pushbuttons and Display
The pushbuttons and display can be locked to prevent inadvertent operation.
To Lock: Select the Lock Keys and Screen option from the Main Menu .
To U n l o c k : Press the left arrow pushbutton , followed by the right arrow pushbutton ,
then the Accept pushbutton .
If you attempt to press a pushbutton, or tap on the screen, while the instrument is locked, an
information window pops up with instructions on how to unlock it.

38
2250 Light – User Manual

39
Chapter 5
Calibration
Calibration is an adjustment of your sound level meter to measure and display correct values.
The sensitivity of the microphone as well as the response of the electronic circuitry can vary
slightly over time, or could be affected by environmental conditions such as temperature and
humidity. While you are unlikely to ever experience a large drift or change in sensitivity with
2250 Light, it is nevertheless good practice to perform regular calib rations, normally before
and after each set of measurements. Often calibration is required by measurement standards,
such as IEC 61672–1.
If you want your analyzer to remind you when the next Accredited/Traceable calibration is due,
you can set it up on the Reminder tab of the Calibration screen. See section 5.5.
5.1 Calibration Types
Acoustic Calibration
Acoustic calibration is the preferred calibration method, particularly when standards and
regulations require calibration before a measurement. The method involves applying an
acoustic signal of known magnitude and frequency to the microphone, which calibrates all the
instrument’s components (microphone, preamplifier and electrical circuitry).
Electrical Calibration
If no sound level calibrator is available (or a known amplification is introduced, i.e., by
analyzing a tape recorded signal) then you can type the sensitivity directly into the Sensitivity
field. 2250 Light will be regarded as uncalibrated and the text ‘Uncal.’ will appear in the status
field.
Manual Calibration
If no calibrator is available (or a known amplification is introduced, e.g., by analysing a tape
recorded signal) then you can type the sensitivity directly into the Sensitivity field. The
analyzer will be regarded as uncalibrated and the text ‘Uncal.’ will appear in the status field.

40
2250 Light – User Manual
Charge Injection Calibration
You can check the complete measurement chain during long term measurement using Charge
Injection Calibration. See section 5.6.
5.2 Standard Calibration
To perform the acoustic calibration use Sound Calibrator Type 4231. It provides a stable sound
pressure at 1 kHz and has minimal susceptibility to environmental factors. The procedure itse lf i s
relatively simple, and on 2250 Light the procedure is referred to as the Standard Calibration
procedure.
The procedure for performing an acoustic calibration and instructions on how to fit the
calibrator are given below:
1) Stand away from loud sound sources that may interfere with the calibrator’s signal.
2) Switch on 2250 Light by pressing .
3) Tap on the Main Menu icon and select Calibration from the list of options. A screen
similar to that shown in Fig.5.1 will appear.
Fig.5.1
Initial Calibration screen
This screen contains a bar graph showing the actual sound pressure level and three
placeholders for displaying information about the last calibration.
4) Following the first part of the instruction in the status field, fit Sound Calibrator T ype 4231
carefully onto the microphone of the Hand-held Analyzer. (To avoid handling vibrations to
disturb the calibration rest the assembly in a roughly horizontal position on a table or other
flat surface.)
Ensure that the calibrator fits snugly on the microphone.
5) Switch on the calibrator. Wait a few seconds the level to stabilise.

CHAPTER 5
Calibration
41
6) Tap the button on the screen to start the calibration.
Note: Detecting level... appears on the screen as feedback.
7) While 2250 Light is searching for the calibration signal and the signal level is stabilising, the
‘traffic light’ indicates a short green flash every second. When the level is stable, the traffic
light indicates a steady green and the signal is measured and used for calibration. Once the
calibration has been completed successfully, the traffic light indicates a short yellow
flash every 5 seconds. The Sensitivity is automatically calculated and displayed in a pop-
up together with the deviation from the last calibration. Tap Yes to accept and use the new
sensitivity and save it in the calibration history. Tap No to disregard the new calibration
and continue with the old calibration.
If the calibration deviates more than
1.5 dB from the initial calibration, then the
calibration is stopped without changing the calibration of the instrument. The traffic light
will indicate a fast flashing red and an error description will appear in the status field.
Hint: If the microphone is separated from 2250 Light using a microphone extension cable
then place 2250 Light so it can be seen from the location of the microphone. Start the
calibration process, (select the Calibration screen and tap the button on the
screen, then go to the microphone and fit the Calibrator onto the microphone, switch on
the calibrator and monitor the traffic light on the 2250 Light, as discussed previously.
8) Once you have completed the calibration, tap the button and remove the
calibrator. It will automatically switch off after a few seconds.
5.2.1 Calibration Settings
Select the Details tab on the Calibration screen to view the calibration details, see Fig.5.2.
Fig.5.2
Calibration details
screen
This screen displays the following information:
• Details of the last calibration: date, sensitivity, deviation from last calibration and deviation
from initial calibration

42
2250 Light – User Manual
• The connected transducer: type and serial number
Note: you select a new transducer by tapping on the Main Menu icon and selecting
Setup, followed by Input)
•A Calibration History link: which is provided to enable you to view a history of transducer
and calibration settings, see below
• Max. Input Level: the maximum sinusoidal input level to be measured without overload
indication
The calibration settings can be adjusted as follows:
• Calibrator: select between Type 4231 and a custom calibrator
• Calibration Level: type in the specific level of your custom calibrator. If you are using a
Type 4231 calibrator, then the level of the calibrator is automatically detected, (shown as
Auto detect on the screen)
Note: The Auto detect setting enables the calibration process to automatically detect the
calibration level. For free-field types of microphones (like Type 4950) the calibration leve l
from a Type 4231 calibrator is either 93.85 dB or 113.85 dB. For diffuse or pressure fie ld
types, the calibration level is either 94 dB or 114 dB. The calibration process
automatically determines the correct level
• Calibrator Serial Number: type in the serial number for your calibrator. The calibrator will
be documented in the calibration history
5.3 Calibration History
You select t he calibration history by tapp ing on the Calibration History link on the Calibration
Details screen, see Fig.5.2.
2250 Light saves the last 20 calibrations, plus the initial calibration, which can be viewed on
the Calibration History screen, see Fig. 5.3. When you have finished, tap to return to the
calibration details screen and then tap again to return to the measurement screen.
Fig.5.3
Calibration History
screen

CHAPTER 5
Calibration
43
5.4 Transducer Database
The specifications for Microphone Type 4950 (and Preamplifier ZC-0032), which come fitted
in the top socket of 2250 Light, are described on the Transducer Screen.
1) Select the Transducer Screen by tapping the Main Menu icon and choosing
Transducers from the list of options. The screen shown in Fig.5.4 will appear.
Fig.5.4
Transducer screen
2) Tap on the transducer name/number, or select the plus icon next to name/number, to
view the details in the database, see Fig.5.5.
Fig.5.5
Details of the
microphone
You can add other microphones by tapping on the Add New Micr ophone icon , and filling in
the details of your particular microphone.

44
2250 Light – User Manual
All the details for the microphone can be found on the screen.
A number of parameters are set automatically for Microphone Type 4950.
Note: For Type 4950 the parameters Nominal Sensitivity, Free-field and Capacitance are set
automatically. See details in Appendix C. The analyzer can then make sound field corrections
and windscreen corrections as specified in the setup. To confirm which type of correction is
being applied, an icon is displayed in the measurement Status field. If the microphone is
unknown to 2250 Light, no corrections can be made and no icon appears in the Status field.
The parameters mentioned above have to be set manually (that is, typed in). We recommend
that you insert the value for Nominal Sensitivity directly from the calibration chart. Nominal
Sensitivity is used in the automatic level detection calculations, when calibrating using Sound
Calibrator Type 4231 Calibrator, to determine whether the level is 94 or 114 dB.
In the top line of the status field you can select which transducer is currently connected to 2250
Light. This can also be done via the Setup screen by selecting Input, then selecting the
transducer in the T ransducer Used: field.
At the bottom of the parameter list you can select the calibration history for the currently
selected transducer by tapping on the Calibration History link. See section 5.3 and Fig.5.2.
When you have finished, tap to return to the measurement screen.
5.5 Calibration Reminder
The Calibration Reminder tab, see Fig. 5.6, allows you to kee p track of when you need to run
your next Accredited/Traceable calibration, and shows you the date of your last calibration.
Fig.5.6
Calibration reminder tab
The automatic calibration reminder facility will pop-up a reminder approximately 2 months
before your next calibration is due and keep on reminding you every week until you do one of
the following actions:

CHAPTER 5
Calibration
45
• Send your instrument for Accredited/Traceable Calibration and update the Last
Calibration date
• Check the ‘Do not ask/remind again’ checkbox in the reminder pop-up (see example in
Fig.5.7)
• Disable the automatic calibration reminder
Fig.5.7
Reminder pop-up
You can set the Calibration Interval parameter to either 12 months or 24 months depending on
your local requirements.
You can disable the facility by selecting the Automatic Calibration Reminder parameter to Off.
5.6 Charge Injection Calibration
5.6.1 Theory of CIC
If an external sound source is not available, for example during short or long term monitoring,
you can check the calibration of the analyzer using the Charge Injection Calibration (CIC)
facility. This is done automatically during a logging measurement (see section 11.2). Unlike an
internal calibration, the Brüel & Kjær patented CIC technique enables a complete
measurement chain to be verified, including the microphone, the preamplifier, the cabling and
the analyzer. Each verification measurement is compared to an initial reference measurement.
As the name implies, the method uses injection of charge into the microphone and preamplifier
input circuit, and the ratio between the measured signal and the injected signal is measu red
(CIC Ratio), see Fig.5.8.
The method is based on detection of changes in impedance at the input terminal. It was
developed for monitoring of microphone channels and requires a preamplifier with a small,
extremely stable, built-in capacitor which makes it possible to apply an electrical signal to the
preamplifier (and microphone) input terminal.

46
2250 Light – User Manual
A stable CIC Ratio means a ‘healthy’ system and assures stable operation of microphone,
cable, preamplifier and the remaining measurement system.
Fig.5.8
Charge Injection Calibration. Low-leakage resistance capacitor Cc is set in parallel with
the microphone and fed with voltage ei. The ratio eo/ei is constant when g , Cc, Cm and
C
i
are constant. Changes to preamplifier gain (g), cable parameters, microphone
capacitance (C
m
), etc., will change eo/ei, and hence indicate probable changes in
calibration
5.6.2 Performing a Manual CIC with your 2250 Light
CIC is only available with Logging S oftware BZ-71 33.
Tap the Main Menu icon and select Calibration from the list. Click the CIC tab to view
the various CIC parameters that are available. These include the results of the latest manual
CIC, together with the reference, see Fig.5.9.
The status field at the top of the screen informs you how to perform the CIC.
Press the Start CIC button to start the CIC. After approximately 10 s you will see the result.
Normally, the CIC Reference Ratio is set the very first time a CIC is performed, however, you
should update the CIC Reference Ratio if you change the microphone preamplifier. You do this
by checking the Use as new Reference checkbox.
The CIC Reference Ratio and CIC Ref. Date parameters display the results of the very first
manual CIC, and this will be used as the ‘reference’ for all subsequent CIC Ratio
measurements.
Note: Each microphone in the transducer database has a CIC Reference Ratio.
If the CIC Ratio parameter deviates by more than 0.5 dB from the CIC Reference Ratio, then
there may be a problem, and this should be investigated.
C
m
C
c
C
i
R
1
Preamplifier
Microphone
Cable Generator
g
e
i
e
o
e
o
e
i
C
c
= g
C
m
+ C
i
+ C
c
( )
970294/1

CHAPTER 5
Calibration
47
Fig.5.9
CIC Calibration tab
The result of the Charge Injection Calibration consists of four parameters:
•CIC Ratio
• CIC Ratio Date
• Deviation from Reference
•CIC Result
The CIC Result can be either: ‘Passed’, ‘Background noise too high’ or ‘CIC Ratio deviates
from Ref.’

48
2250 Light – User Manual

49
Chapter 6
Data Management
6.1 Organising Measurements
6.1.1 Description of Jobs and Projects
When saving a set of measurement results, they are organised together with setup information,
calibration information, annotations and signal recordings in a project.
A project contains the following:
• Measurement results:
– Broadband values (for example, L
Aeq
, L
AFmax
, L
AFmin
, etc.)
– Frequency spectra (if 1/1-octave or 1/3-octave Frequency Analysis Software for 2250
Light, BZ-7131/32 are enabled on your 2250 Light and you have selected a Frequency Analyzer template)
• Weather and GPS data
• Measurement Setup
• Display Setup (parameters you have selected)
• Information on the microphone
•Calibration
• Signal Recordings (attached to measurements as required)
The Project name is automatically created by combining the Project Name Prefix with a
number (starting from 001), that is, Project 001 for the first project, Project 002 for the next, and
so on.
If preferred, the Project Name Prefix can be changed from the default name of ‘Project’. To do
this, tap the Main Menu icon , then Preferences followed by Storage Settings to reveal the
Project Name Prefix. Tap on the current name to reveal a keyboard for you to type in the
required name.
Projects are saved in folders which are called ‘jobs’ on your 2250 Light. These are similar to
folders in the Windows
®
filing system.

50
2250 Light – User Manual
Jobs can be created in the internal memory, on a Secure Digital (SD) Card, on a USB memory
stick (hardware version 4 only), or for hardware versions 1 – 3, on a Compact Flash (CF) Card.
6.1.2 Navigating in Jobs
A results browser, called Explorer, is used to navigate through the jobs and projects.
T o view all jobs and projects, tap the Main Menu icon and select Explorer from the list of
options. A screen similar to Fig.6.1 will appear.
Fig.6.1
The Explorer screen
The example from Explorer in Fig. 6.1 displays a list of jobs and then some projects, which
have not been stored under a job name.
The topmost line in the status area (Internal Disk\ in the example in Fig.6.1) shows the location
in the memory.
The next line in the status area contains 4 icons for navigation.
Tap the icon to go up one level in the job-levels. The top level is the Memory level, where
physical memory devices can be selected. You can select:
• With Hardware Versions 1 – 3:
– Internal Disk
– SD-Card (if a card is inserted in the SD slot)
– CF-Card (if a card is inserted in the CF slot)
• With Hardware Version 4:
– Internal Disk
– SD-Card B (if a card is inserted in the bottom SD slot)
– SD-Card T (if a card is inserted in the top SD slot)
– USB-Mem (if a memory stick is inserted in the USB Standard A socket)

CHAPTER 6
Data Management
51
T o go down one level (that is, exit the Memory level), you tap on the job name (Internal Disk in
this case) and select Open from the drop-down list – or you simply tap on the memory icon
next to Internal Disk.
Tap the icon to create a new job folder. The first job folder name will be ‘Job 01’,
subsequent job folders will be labelled ‘Job 02’, ‘Job 03’, etc. You can rename the job folder
name by tapping on the name and selecting rename from the drop-down list. Use the keyboard
to key in a new name – accept by tapping on the Enter key .
T o go down one level (open a job), you tap on the job name in the list and select Open from the
drop-down list – or you simply tap on the job icon to the left of the job name.
You can move a job/p roject (and its content) to another job by tapping the job name/project
name and selecting Cut from the drop-down list. Then navigate to the job you want as the new
holder of the moved job/project and tap on the Paste icon , or navigate to the level above
and tap on the job name and select paste from the drop-down list.
In order to copy a job/project do as described above, but use Copy instead of Cut from the
drop-down list.
Select Delete from the drop-down list in order to delete the job/project and all of its contents.
You can select more than one job/pro ject for copy, cut or delete by tapping and holding the
stylus on a job/project name and then dragging the stylus up or down to select other
jobs/projects.
6.2 Selecting Default Measurement Job/Path
Tap the icon to selec t the current job as the default measurement job, where all projects
will be saved when you press the Save pushbutton. The job name, followed by the current
project name, will appear in the topmost line in the status area to confirm which job you have
selected.
6.3 Recalling Measurements
You can recall your measurement results in one of two ways:
• To display the measured results (and calibration details) only, use the results viewer – this
can be done during an ongoing measurement and is a convenient way of browsing several
sets of measurement data, see section 6.3.1
• To re-use setups from previously saved projects, or view logged data as a profile, use the
Open command in Explorer – this will recall the project template (display settings and
measurement setup used on the saved results) along with the results. This will, however,
stop and reset the current measurement

52
2250 Light – User Manual
6.3.1 Viewing Data
Use Explorer to locate the project with the results you want to view, then tap on the project
name and select View from the drop-down that appears (or simply tap on the project icon). This
will open the Viewer (Fig.6.2).
Fig.6.2
The Viewer for Sound
Level Meter data
The project name is displayed at the top of the Viewer, along with two buttons: and .
These are used to view results on the previous or next project in the job folder.
For Sound Level Meter and Frequency Analysis data the line below this shows the start
time and elapsed time for the measurement.
For Logging and Enhanced Logging data the line shows the Result Selector (selects between
Total, Logged or 100 ms) and the start time for the measurement, along with two buttons:
and . These are used to view results on the previous or next interval in the project, see
Fig.6.3.

CHAPTER 6
Data Management
53
Fig.6.3
The Viewer for Logging
data
All the measured values are displayed below – Sound Level Meter data on the Data tab and
spectrum information (Frequency Analysis only) on the Spectrum tab. Tap on the spectrum
parameters or broadband parameters to select other parameters.
The Calibration tab allows you to view the calibration details for the measurement.
You can view data on projects without disturbing the ongoing measurement.
To exit the Viewer, tap on the icon.
6.3.2 Re-using Setups from Projects
Use Explorer to locate the project with the setup you want to re-use, then tap on the project
name and select Open from the drop-down that appears. This will stop and reset the current
measurement and load the project including all setups and data. You are now using the same
screens as the ones you were using just before you saved the data. Use the screen s to browse
the results. Pressing Start/Pause will start a new measurement using the setups from the
project.
You can save the se tup information in a template by tapping the Main Menu icon and
selecting Save Template.
6.3.3 Viewing or Listening to Annotations
Use Explorer to locate the project with the annotations you want to view/hear, then tap the
project name and select Annotations from the drop-down that appears (or simply tap the
Annotations icon and select the Annotations tab. This will show all annotations attached
to the project (see Fig.6.4.)

54
2250 Light – User Manual
Fig.6.4
Example of annotations
attached to a project
The Loudspeaker icon represents a signal recording. With hardware version 4, you can tap
the annotation name and select Play from the drop-down tha t appears (or tap the icon) to play
the recording using the headphone output.
Note: You can also rename or delete annotations, or copy or move annotations to other
projects.
The Text icon represents a GPS note. Tap the annotation name and select Open from the
drop-down that appears (or tap the icon) to open the Notes Editor. View the note and, if
required, edit the note using the simulated keyboard that appears at the bottom of the screen.
Tap icon to accept the changes and return to the previous screen.

55
Chapter 7
Connection to PC or Smart Phone
7.1 Introduction
You can connect to your analyzer from a PC or smart phone in a number of different ways
using a wide range of different connection types:
• Use Measurement Partner Suite BZ-5503 for full control of the analyzer
– see section 7.2
• Use an Internet browser for online display and control of the analyzer – see section 7.4
Two different methods are available for connecting to the analyzer:
• USB: BZ-5503 connects to the analyzer through a USB cable
• Network: The analyzer is connected to a network (local or Internet) via a modem, LAN
cable or a wireless LAN adaptor. BZ-5503 or an Internet browser will then be able to
connect to the analyzer through TCP/IP using the analyzer’s (global) IP address
In addition to connecting to the analyzer, the analyzer itself can notify you by SMS, or email,
based on various conditions – see section 8.4.
Table 7.1 gives you an overview of the different connection possibilities including links to
relevant chapters with more details.

56
2250 Light – User Manual
Note: The on-line help for BZ-5503 contains additional information on how to connect an
instrument using the different connection types.
7.2 Transferring Measurement Data to Your PC
Measurement Partner Suite BZ-5503 is used for communication between your PC and the
analyzer.
You can use this software to:
• Transfer measurement data and templates from the analyzer to your PC, and vice versa
• View data
• Organise data on the analyzer
• Create users on the analyzer
• Upgrade software on the analyzer
• Install software licenses on the analyzer
Table 7.1
Connection overview
Connect from
Connection
Type
Settings in Preferences
Available
Notifications
BZ-5503 USB Modem = Disabled
see section 8.2.
–
BZ-5503, Internet
Browser or Mobile
Phone with Internet
Browser
Network
GPRS/EDGE/H
SPA modem
Modem = GPRS/EDGE/HSPA
Dialup
Settings in Dialup Networking.
Network Settings.
Possibly settings in DynDNS.
see section 8.2 and 8.3.
Email
see section 8.4
BZ-5503, Internet
Browser or Mobile
Phone with Internet
Browser
Network
Ethernet cable
Modem = Disabled
Possibly settings in DynDNS.
Network Settings.
see section 8.2 and 8.3.
Email
see section 8.4
BZ-5503, Internet
Browser or Mobile
Phone with Internet
Browser
Network
CF WLAN
(hardware
versions 1 – 3
only)
SD WLAN
(G4 only)
Modem = Disabled
Possibly settings in DynDNS.
Network Settings.
Settings in Wireless Network.
see section 8.2 and 8.3.
Email
see section 8.4
BZ-5503, Internet
Browser or Mobile
Phone with Internet
Browser
Network
DSL
Modem/Router
Modem = Disabled
Possibly settings in DynDNS.
Network Settings.
see section 8.2 and 8.3.
Email
see section 8.4

CHAPTER 7
Connection to PC or Smart Phone
57
Using this software, measurements on the analyzer can be controlled from your PC and
displayed online, using the same user interface on the PC as on the analyzer.
Data transferred to the PC are organised in Archives. You can view the measurement data in
the Archives.
7.2.1 Connect to Your PC
Connect the analyzer to your PC using one of the following:
• Hardware versions 1 – 3:
– The supplied Mini USB Cable AO-1476
– A modem connection
– A LAN connection via a CF card adaptor
• Hardware version 4 (G 4):
– The supplied Micro USB Cable AO-1494
– A modem connection
– A LAN connection
The connection can be protected by requiring a login with user name and password – see
settings in section D.10.
See Chapter 8 for descriptions on how to set up your preferences, including PC connections.
7.3 Post-processing and Reporting
Use the optional modules of the Measurement Partner Suite for data analysis and postprocessing. For example, data in the archives can be post-processed directly in the Logging
Module BZ-5503-A or Spectrum Module BZ-5503-B. Furthermore, data can be exported to
various post-processing tools like Evaluator™ Type 7820 for assessing environmental noise,
Protector™ Type 7825 for assessing workplace noise, or Microsoft
®
Excel®.
Signal recordings can be imported to Brüel & Kjær ’s PULSE
™
Multi-analyzer platform for
further analysis.
For more information on Measurement Partner Suite BZ-5503 and the PULSE multi-analyzer
platform, see our website at www.bksv.com or contact your local Brüel & Kjær representative.
For further information, please refer to the on-line help included with the relevant PC Software.
This software is supplied on the Environmental Software DVD (BZ-5298), which is included
with your the analyzer.
7.4 Internet Browser for Online Display and Control of
the Analyzer
When the analyzer is connected to a network (see Fig. 7.1) you can connect to the analyzer
from a PC or smart phone using an Internet browser supporting Java Scripts.

58
2250 Light – User Manual
Analyzer Settings
You access preferences by tapping on the Main Menu icon and selecting Preferences from
the list of options (the screen shown in Fig.8.1 will appear).
Tap on Remote Access Settings, or select the plus icon next to Remote Access Settings and
set the Web Server Parameters to Enabled. Define sets of Usernames and Passwords:
• one set for guest use (view only)
• one set for administrator use of the instrument (view and full control)
See section 8.5 and Table D.10 for more details.
Connect to Analyzer
When you enter the IP address or Hostname of the analyzer (see section 8.2. and 8.3) in the
address or location bar of the Internet browser, the following screen appears
Fig.7.1
2250 home page
Click the Help link to get more detailed help on using the web page. Press the Service link for
updating the software or for rebooting the analyzer.
Click the View Instrument button to enter the web page for viewing the instrument only. You
might be prompted for the Guest Username and Guest Password defined for the web server
(see section 8.5).
Click the View and Control Instrument button to enter the web page for full access to the
instrument. You will be prompted for the Username and Password defined for the web server.

CHAPTER 7
Connection to PC or Smart Phone
59
Fig.7.2
Prompt for username and
password
The View Instrument Web Page
Fig.7.3 shows the View Instrument web page, where you have an on-line display of the
instrument. You can use the o n-line display for monitoring the measurement only, you cannot
change the display, or setup parameters, or start and stop measurements, etc.
Fig.7.3
On-line display –
for monitoring only
The instrument can be viewed by several people at the same time, however, the instrument
response time will increase with the number of connected browsers.
The View and Control Instrument Web Page
Fig. 7.4 shows the View and Control Instrument web page, where you have an on-line display
and keyboard for full control of the instrument. The on-line display can be used for monitoring
the measurement.

60
2250 Light – User Manual
The keyboard on the screen has the same functions as the instrument’s keyboard. Click on the
display with the cursor to control the instrument as you do when tapping on the screen of the
instrument.
Fig.7.4
On-line display and
keyboard for full control
of the instrument

61
Chapter 8
Advanced Use of 2250 Light – Tips and Tricks
8.1 Setting your Preferences on 2250 Light
You can specify a number of parameters controlling display settings, power settings, regional
settings and storage settings. These parameters are grouped together under Preferences.
You access preferences by tapping on the Main Menu icon and selecting Preferences from
the list of options. The screen shown in Fig.8.1 will appear.
Fig.8.1
The Preferences screen
8.1.1 Display Settings
T ap on Display Settings, or select the plus icon next to Display Settings, to expand the list of
available display settings, see Fig.8.2.

62
2250 Light – User Manual
Fig.8.2
Display Settings screen
You can select the optimum choice of brightness for the traffic light (for example, High in
bright light conditions and Low in dark conditions) and you can select whether to have
backlight on the keyboard, or not. In very bright lighting conditions you will not be able to see
the backlight, so set it to Off to save some power.
A link is also provided in Display Settings to adjust the touch-sensitive screen. Tap on Adjust
Touch Screen > to display a full screen with guidance on how to tap on a cross five times at
different places on the screen. At the end of the adjustment procedure you can save the values
or cancel the adjustment.
Finally, you can change the number of decimal places on your dB results readout – tap on
Number of Decimal Places and set to either 1 or 2 decimal places, as required. This setting is
for display only and has no effect on the measurement precision or resolution.
When you have made your choices, tap on Display Settings, or on the minus icon , to
collapse the list.
8.1.2 Power Settings
2250 Light has an advanced power management function, that takes care of supplying the
different circuits with adequate power and switches off those circuits that are not in use. These
power management functions can be changed via the Power Settings screen, see Fig.8.3.
Tap on Power Settings, or select the plus icon next to Power Settings, to expand the list of
available power settings:
• Backlight Dim
• Standby
• Turn off Backlight (only with hardware versions 1 – 3)
• Ext. Power (only with hardware version 4 (G4))

CHAPTER 8
Advanced Use of 2250 Light – Tips and Tricks
63
Fig.8.3
Power Settings screen
Left: Hardware versions
1–3
Right: Hardware version
4
The backlight will be switched on as soon as you operate the instrument, either by using the
keyboard or the stylus on the touch-sensitive screen. The backlight brightness will be one of
the 6 levels set by tapping on the backlight icon at the bottom of the screen. Select the
Minimum level for minimum brightness (and power consumption), and Maximum level for
maximum brightness (and power consumption). Once you have chosen the level, select Close
to save the settings.
When the analyzer has been left unused for the time specified in the Backlight Dim parameter,
the backlight level will change to the dim level (Minimum).
• For hardware versions 1 – 3, this state will hold for the time specified in the Turn off
Backlight parameter (if still left unused). If the analyzer has been left unused for th e time
specified in the Backlight Dim parameter plus the Turn off Backligh t time period , then the
backlig h t will be sw i tched of f complet ely (Fig.8.4). Use the keyboard or tap the screen to
switch the backlight on again
• For hardware version 4, the backlight will never be switched off completely because the
Minimum dim level already has the lowest power consumption
Fig.8.4
Power Settings overview
If the instrument is left unused, not measuring and not communicating over the USB interface,
it will go to standby after the time specified in the Standby parameter. If the instrument is in
standby mode, you have to press the power-on pushbutton to switch it on again.
‘Backlight Dim’
Parameter
‘Turn off Backlight’
Parameter (hardware v. 1 – 3)
Backlight off
Time
‘Standby’ Parameter
040284/2

64
2250 Light – User Manual
The instrument will automatically switch off when it has been in standby mode without
external power for more than 30 hours.
Note 1: If the instrument is powered externally the Standby After parameters are ignored and
the instrument will never go to standby . However, if the instrument is left unused for more than
Standby After time the Standby After setting will overrule the Backlight settings and the
backlight will be switched off.
Note 2: Please use the Display Settings in conjunction with the Power Settings to save power
during measurements and extend the battery operating time.
Hardware version 4 (G4) has an Ext. P ower setting, which determines whether the analyzer
automatically switches on and charges the battery when external power is applied or the battery
is just charged. For unattended externally powered measurements (when not using timers), it is
recommended to select the Switch On and Charge to ensure measurement will restart in case of
temporary power failure.
Hardware versions 1 – 3 have a similar function, but it is a small, manua l switch at the back of
the analyzer, behind the battery pack, which you must set. Remove the battery to access the
switch.
When you have made your choices, tap on Power Settings, or on the minus icon , to collapse
the list.
8.1.3 Regional Settings
T ap on Regional Settings, or select the plus icon next to Regional Settings, to expand the list
of available regional settings, see Fig.8.5.
Fig.8.5
Regional Settings screen
Select your preferred settings for Decimal Point and Date Separator and select your preferred
date/time format from the six different formats provided in the drop-down. Then select your
time zone from the list.

CHAPTER 8
Advanced Use of 2250 Light – Tips and Tricks
65
A selection of common languages have been provided with the user interface of 2250 Light.
Select the one you prefer to change it immediately.
Built-in help is provided in the more commonly used languages – if your particular language is
not covered, English will be chosen automatically.
Select a keyboard matching the one you prefer when using your PC.
Select the unit system for Wind Speed, Temperature and Dimensions as required:
•Use the SI setting for measurement units in accordance with the SI standard, for example,
measuring Wind Speed in m/s
•Use the US/UK setting for imperial measurement units, for example, measuring Wind
Speed in mph
When you have made your choices, tap on Regional Settings, or on the minus icon , to
collapse the list.
8.1.4 Storage Settings
Each time you save the results of a measurement, 2250 Light suggests a project name and
number for the project. The Project Name Prefix can be generated automatically (from the start
date of the project as Year, Month, Date in the format YYMMDD, for example, 051112 as
2005, November 12th) or you can specify a Project Name Prefix (max. 8 characters), using the
standard full character keyboard that pops up when you tap on the current name set as the
project name prefix, see Fig. 8.6. (The field where you type in the project name prefix will
appear at the top or bottom of the pop-up keyboard, depending on how many settings you have
expanded in the list.) The project suffix number will be generated automatically.
Fig.8.6
Storage Settings screen
8.1.5 Headphone Settings
The headphone settings allow you to control the output to the headphone socket on the
connector panel.

66
2250 Light – User Manual
You can listen to the measured signal for monitoring purposes. Select between A/B-weight ed, Cweighted or Z-weighted. (A/B-weighting is determined by setting the parameter in Setup,
Frequency Weightings, Broadband (excl. Peak)).
The measured signal covers approximately 120 dB (from approximately 20 dB to 140 dB with
a Type 4950 microphone of nominal sensitivity). The output of the headphone socket covers
approximately 75 dB. Use the gain settings for the measured signal to adjust the output level to
suit the listening conditions. If the signal has a very high dynamic range (or the levels are
unknown), you can set Automatic Gain Control to On – this will convert the 120 dB input
range to 40 dB output range enabling you to hear signals of any level clearly.
Gain settings are provided for the measured signal. Tap on the gain parameter and use the
keypad to enter a new setting. Use ‘@’ to assign the new value for immediate response at the
output – or use the up/down navigation keys to increment/decrement the value.
Note 1: A 0 dB gain on the measurement signal means you get a 1 V output for a 1 V input
(when the measured signal Automatic Gain Control is set to Off).
Note 2: In hardware version 4 while playing back an annotation, you can use the Up/Down
navigation keys to increase/decrease the gain of the annotation.
Note 3: If you do not want to listen to the input signal, then set the Listen to Signal parameter
to No, to economise on power.
8.1.6 Printer Settings
You can make screen dumps on a printer connected to the analyzer using a standard USB cable,
or on hardware versions 1 – 3, the supplied Adaptor AO-0657. Use the Printer Settings to
select your preferred printer.
When a printer has been selected under the Printer Used parameter, then the Print Screen
command in the Main Menu list appears. Use this command to print a screen dump of any
screen on the analyzer.
The printer must either be a mobile thermal printer (from AM Tech or Seiko) or accept the
PCL
®
printer language.
• MPS: Mobile Pro Spectrum – a mobile thermal printer from AM Tech (www.amteq.co.kr)
• PCL: printers accepting PCL printer language
• PCL Inkjet: suitable for Inkjet printers and supports colour printing
• PCL Laser: suitable for laser printers
• Seiko DPU: DPU-S245 or DPU-S445 – mobile thermal printers from Seiko Instruments
(www.seikoinstruments.com)
PCL is the Printer Control Language developed by Hewlett-Packard (see www.hp.com). For
PCL printers, you can use the Top and Left Margin parameters to position the print on the
paper, and use Width and Height parameters to set the size of the print.

CHAPTER 8
Advanced Use of 2250 Light – Tips and Tricks
67
8.2 Modem/DynDNS Settings
You can use the analyzer for monitoring in remote places and control it using Measurement
Partner Suite BZ-5503, via a telephone connection – wired or wireless – using suitable
modems or via network connections. See the overview of possibilities in Table 7.1, in
Chapter 7. When you connect via a modem, or via a network connection, you will see the
contents of the analyzer in the Instrument Task as if you had made the connection via USB.
You then have the same possibilities for transferring data to the Archive and organising data
on the analyzer, as if you were connected via the USB connector.
Modems can be used for connection in the following way:
The analyzer is connected directly to the Internet through a modem. BZ-5503 or an
Internet browser will then be able to connect to the analyzer through TCP/IP using the
analyzer’s (global) IP address. The setup of the modem connected to the analyzer is
described in section 8.2.2 – please refer to the BZ-5503 on-line help for details on how to
make a connection.
8.2.1 Connection to the Network using a LAN Modem
Using a 3G modem with LAN interface is a simple and very reliable and powerful way of
remotely connecting to the analyzer.
Set up the modem according to its user manual (usually requires connection to a PC) before
you connect the modem to your analyzer. When ready, connect the modem to the analyzer
using a LAN cable. For hardware versions 1 – 3, you will also need the 10/100 Ethernet CF
Card UL-1016 (see “Ordering Information” on page 135.).
The Modem parameter should be set to Off.
The following modem has been tested:
• Airlink Raven XE, Intelligent 3G Ethernet Gateway from Sierra Wireless
(www.sierrawireless.com)
Note: The SIM card account should include a data subscription and should be usable without a
pincode.
8.2.2 Connection to the Network using a GPRS/EDGE/HSPA Modem
Note: The SIM card account should include a data subscription and should be usable without a
pin-code.
To use the modem you need to set up the parameters in Dialup Networking (listed below) and
set the Modem parameter to GPRS/EDGE/HSPA Dialup.
Parameters in Dialup Networking:
• APN (Access Point Name) is an identifier required by the Network Operator. Examples are
internet, public and www.vodaphone.de
• Username, Password and possibly Domain should be set as required by the Network
Operator.

68
2250 Light – User Manual
When the Modem parameter is set to GPRS/EDGE/HSPA Dialup, then a connection is made
using the settings in Dialup Networking. The Status parameter reflects the current status of the
network connection – e.g., ‘Connected’ or ‘Disconnected’. If the connection fails, then the
analyzer will try to reconnect – until it succeeds, or the Modem parameter is set to Disabled.
If the connection succeeds, then the instrument will automatically get an IP address, which is
readable (but not accessible) in Network Settings – for more details see section 8.3.
The IP address is the address on the WAN (Wide Area Network) or Internet. Use this address in
BZ-5503 or an Internet browser to connect to the analyzer.
Note: In some cases you might be able to get a static IP address from the Network Operator,
which means that the analyzer will always get the same IP address, when connected to the
network. However, typically the IP address will be renewed each time the analyzer connects to
the network. In order to deal with this in BZ-5503 or an Internet browser you need to use
DynDNS – see section 8.2.3.
Modems with USB Interface
The following modems have been tested:
• Airlink Fastrack Xtend GPRS, EDGE and HSPA from Sierra Wireless
(www.sierrawireless.com)
Modems with an USB interface can be connected to the USB Type A socket on hardware
version 4.
Modems with RS –232 Serial Interfaces
The following modems have been tested:
• FASTRACK Supreme 10 and 20 GSM/GPRS/EDGE Modem from Wavecom
• Airlink Fastrack Xtend GPRS, EDGE and HSPA from Sierra Wireless
(www.sierrawireless.com)
For hardware version 4, modems with an RS – 232 serial interface can be connected using a
USB to serial converter inserted in the USB Type A socket of the analyzer. The following USB
to serial converters have been tested:
• USB to RS–232 Converter UL-0250 (see “Ordering Information” on page 135.)
• ES-U-1001-R10, ES-U-1001-B10 and ES-U-1001-A from EasySync
(www.easysync-ltd.com)
• USB to RS232 Standard, USB to RS232 Professional and USB to RS232 Mini STD from
U.S. Converters (www.usconverters.com)
For hardware versions 1 – 3, use a compact flash to seria l converter inserted in the compact
flash slot of the analyzer. The following compact flash-to-serial converter has been tested:
• Serial I/O CF Card – Ruggedized from Socket (www.socketmobile.com)
Switch off the analyzer when connecting a serial I/O CF Card and modem to the analyzer.

CHAPTER 8
Advanced Use of 2250 Light – Tips and Tricks
69
Compact Flash Modems
The following modem has been tested:
• Compact GPRS from Pretec (www.pretec.com)
Compact flash modems can be inserted directly in the compact flash socket of the analyzer.
8.2.3 DynDNS
If the analyzer is connected to:
• the Internet through a GPRS/EDGE/HSPA modem, or
• a local network with access to the Internet through a DSL modem/router
and you want to connect to the instrument from a place outside the local network, then you
need to know:
• global IP address of the instrument or
• the global IP address of the DSL modem/router (and ensure that correct port forwarding in
has been set the router – see details in the on-line help for BZ-5503)
In some cases the global IP address is static and will never change, so you connect to the
instrument using BZ-5503 or an Internet browser by using this IP address.
Normally when you browse to addresses using an Internet Browser you do not use the IP
address itself, but a hostname for it (e.g. you would use the hostname www.google.com instead
of ‘74.125.77.99’). This requires a DNS (Domain Name System) provider, which is a kind of
Internet phone book that translates hostnames to IP addresses for you.
However, for a GPRS/EDGE/HSPA or even a DSL router then often the global IP a ddress is
renewed at each new connection or at certain time-intervals (e.g., every two weeks). In this
case you will have to change the IP address in BZ-5503 or the Internet Browser accordingly. To
avoid this, a service like DDNS (Dynamic Domain Name System) can be used.
DDNS is a network service that provides the capability for a modem/router/computer system to
notify a domain name system provider to change, in real time (ad-hoc), the active DNS
configuration of its configured hostnames and IP addresses. This will ensure that the hostname
you use will always be updated to reflect the correct IP-address.
The analyzer supports DDNS provided by the world-wide DDNS service provider
‘DynDNS.com’.
The analyzer can then be configured to notify DynDNS.com each time the global IP address is
set or changed. When BZ-5503 or an Internet Browser connects to the analyzer it then uses a
hostname defined by DynDNS.com. From DynDNS.com it then gets the updated IP address.
You need to make an a ccount at DynDNS.com, specifying a user name and a password for the
account and a hostname (e.g., 'MyBK2250.dyndns.org') identifying the analyzer.
In the analyzer you need to specify the Hostname, Username and Password and set Active to
Yes in Preferences, under Modem/DynDNS settings. Each time the analyzer detects a change in
the IP address it notifies DynDNS.com.

70
2250 Light – User Manual
Note: To avoid too much traffic at DynDNS.com, the analyzer ensures that this service doesn't
allow updates of settings more frequently than every 10 minutes. So you may experience up to
a 10 minute wait for DynDNS settings to update.
8.3 Network Settings
The analyzer can be connected to a LAN (Local Area Network) through an Ethernet interface
or to WLAN (Wireless Local Area Network) using equipment conforming to the
IEEE 802.11a/b/g standard. This connection can be used to synchronise measurement and
setup data with a host PC using BZ-5503.
The analyzer supports TCP/IP (Transmission Control Protocol/Internet Protocol) on the LAN
and WLAN.
This requires the analyzer to have a unique address on the network. This address is called an IP
address and consists of four sets of 3-digit numbers, e.g. 010.116.121.016.
The IP address can be obtained in different ways:
• Automatically
• Using DHCP
A DHCP (Dynamic Host Configuration Protocol) Server on the network assigns
automatically an IP address to the analyzer when connected to the network. This is the
most common way of setting up IP addresses.
• Using Link-local
If no address is automatically assigned by the DHCP Server, then after a few seconds
the analyzer will use an address from the Link-local address range 169.254.x.x.
This will most likely be the case when connecting the analyzer directly to a PC using
an Ethernet Crossover cable
• Manually
You setup the IP address manually.
This will typically be the case in a private network without a DHCP Server.
8.3.1 Connecting to the Analyzer
Wired LAN Connection
• Use a “straight-through” (standard) Ethernet cable with RJ45 connectors at both ends to
connect the analyzer to the network (via a hub, switch or router).
• Use a “crossover” Ethernet cable with RJ45 connectors at both ends to connect the
analyzer directly to a PC.
Hardware version 4 has an Auto-MDIX facility, allowing you to use either a straight-through
or crossover cable to connect to a network or PC.
WLAN Connection
Type 2250-L provides a wireless LAN option using a WLAN card.

CHAPTER 8
Advanced Use of 2250 Light – Tips and Tricks
71
Hardware version 4 accepts the following SD WLAN card:
• P322 802.11abg SD WLAN from Socket Mobile (www.socketmobile.com) –
Brüel & Kjær order number UL-1025
Hardware versions 1 – 3 accept the following CF LAN and WLAN cards:
• 10/100 Ethernet Ruggedized CF Card from Socket Mobile (www.socketmobile.com) –
Brüel & Kjær order number UL-1016
•Go Wi-Fi!
®
P500 CF WLAN, rev . B and rev. C from Socket Mobile – Brüel & Kjær order
number UL-1019
8.3.2 Parameters in Network Settings
Location
Use the Location parameter to specify a text up to 20 character long identifying the
analyzer or location of the analyzer. The Location will be displayed on the PC as well
as the serial number of the analyzer when browsing for analyzers in BZ-5503 and when
connected using the on-line display. Note: The location parameter is useful for both
USB and LAN connections.
Network Connection
• Hardware versions 1 – 3:
– None: (default)
– CF Socket: Select this to use an Ethernet CF Card inserted in the Compact Flash
socket
– LAN Socket: (default) Select this to connect via a LAN cable. This is disabled if an
Ethernet CF card is inserted in the Compact Flash socket
• Hardware version 4 (G 4):
For all analyzer types, the default is LAN Socket.
Set IP Address
Automatically: This will obtain an IP address from a DHCP server – if no server
available, then a Link-local address will be set
Manually: You have to set the IP Address, Subnet Mask, Default Gateway, Preferred
DNS and Alternate DNS (see below)
IP Address
The IP address of the instrument
Selectable if Set IP Address = Manually
Subnet Mask
The Subnet Mask combined with the IP address identifies the network segment the
analyzer is on
Selectable if Set IP Address = Manually
Default Gateway
Address to a gateway for routing to another network

72
2250 Light – User Manual
Selectable if Set IP Address = Manually
Preferred DNS
The IP address of the primary DNS server
Alternate DNS
The IP address of the secondary DNS server
MAC Address
The MAC Address of the network adaptor (LAN or WLAN) in use. MAC (Media
Access Control) Address is a unique identifier assigned to the network adaptor. This
field is for information only
Status
The status of the network connection, either Operational or Non-operational:
• Operational: the network adaptor can be used for a connection
• Non-Operational: the network adaptor cannot be used
Parameters for Wireless LAN Only
Name
Name (SSID) of the network you want to connect to. Update the name either by:
• entering a name directly, or
• tapping on the Available Networks and selecting a name from the list
Available Networks
Tap on the line to get a list of available networks. Tap on a name in the list to connect
to this network. The name is inserted in the Name line above this line. Each network
name is preceded with Signal Strength information, ranging from Excellent (displayed
as ‘•• • ••’) down to No Signal (displayed as no dots a t all)
Security
Select the security as required by the network: Open, Shared, WPA PSK or WPA2 PSK.
Open and Shared are for WEP (Wired Equivalent Privacy) Infrastructure mode.
WPA PSK is for WPA (Wi-Fi Protected Access) with Pre-shared Key (also called Personal mode). WPA2 is an en hanced version of WPA
Encryption
Select the encryption as required by the network: None, WEP Enabled, AES Enabled or
TKIP Enabled. None is for O pen security. WEP Enabled is for Open and Shared securi-
ty. AES and TKIP Enabled are for WPA PSK and WPA2 PSK security
Encryption Key
Insert the encryption key required by the network. The key will be displayed until you
press Enter, then it will be replaced by ' *** '

CHAPTER 8
Advanced Use of 2250 Light – Tips and Tricks
73
8.4 Notifications
The analyzer can send you a daily status or notify you if disk space is getting low or external
power has disappeared, etc. This is done via SMS or e-mail, as described in this section. The
SMS/e-mail notification contains a short status report for the analyzer. This facility is
especially useful if the analyzer is left for unattended monitoring.
8.4.1 Alarm Settings
If one or more of the following alarms occur, then a notification will be issued as either an SMS
or an e-mail, depending on your equipment and settings. If the notification fails (e.g. the
connection has been lost), then the analyzer will retry to send the notification once more after 5
minutes.
Table 8.1
Alarm Settings
Alarm Type Condition Comment
Power On When analyzer is
switched on or reboots
Indicates start from a timer, or a power failure, or
unexpected behaviour
Measurement
State
When a measurement
starts or stops
Indicates measurement finished
– or unexpected
behaviour
CIC When Charge Injection
Calibration fails
Indicates possible measurement problem
Internal Battery When Internal Batter y is
entering a specified
state: High, Low or
Critical.
Indicates internal battery g etting low. Internal Battery
will be in one of the states: Full, High, Low, Critical,
Charging or Unknown. You can set alarm to High,
Low or Critical in Preferences, Notification Settings,
Alarm Settings, Internal Battery.
Note: The internal battery will typically be in one of
the states Full or Charging if externally powered.
Entering one of the set states might then indicate a
power failure
Disk Space When remaining disk
space drops to or below
a specified percentage of
the total disk space
Indicates disk space getting low
– needs to be
swapped with an empty disk. Set the percentage in
Preferences, Notification Settings, Alarm Settings,
Disk Space

74
2250 Light – User Manual
Table 8.2 Content of Notification
Note: some of the information listed above may not be available, depending on the conditions
when the notification was sent, e.g., no measurement values will be available immediately after
a power on.
8.4.2 Text/SMS Notifications
Notifications via SMS (text message) can be used if you have connected a
GSM/GPRS/EDGE/HSPA modem to the analyzer (see section 8.2.2) and set Modem to
Disabled (a text message cannot be sent if the modem is set to GPRS/EDGE/HSPA Dialup).
In addition to sending SMS notifications initiated by alarms, you can send an ‘INFO ’ SMS to
the analyzer and ask for an SMS notification, after which you will get a notification within 30
seconds.
You need to setup a Phone Number in Preferences, Notifications, SMS and set Active to Yes for
the SMS. You can also add a Name for the number for easier identification.
You can setup two ind ividual SMS phone numbers for sending the SMS notification to two
recipients.
Set Notification to SMS and a notification will be sent by SMS to the active phone numbers,
when any of the alarm conditions are met, or if the analyzer receives an ‘INFO’ SMS.
You can test the system by tapping on the Main Menu icon and selecting “Send
Notification via SMS”.
Note 1: Two to three text messages will be used to send the complete notification – depending
on the content and language settings.
Note 2: Text messages cannot be sent or received while the analyzer is connected to BZ-5503
or On-line display.
Information Type Content
Reason for notification ‘Test’, ‘Alarm’ or ‘Status’ followed by a short description
Time of notification Date and Time
Instrument ID Serial No. and Location
Status of current Disk Free memory / Total memory
Status of Internal Battery Full, High, Low, Critical, Charging or Unknown
Measurement Status (if available) Running, Paused or Stopped
Latest CIC Result (if available) Passed, Background noise too high, Ratio outside tolerances,
Ratio deviates from Ref., Undefined Ref., or Undefined
Current value of LAF (if available) The value

CHAPTER 8
Advanced Use of 2250 Light – Tips and Tricks
75
8.4.3 E-mail Notifications
E-mail notifications can be used if the analyzer is connected to a network with access to a mail
server. This can typically be done if the analyzer is connected through LAN or by a
GPRS/EDGE/HSPA serial modem (see section 8.2.2 and section 8.3).
Go to Prefere nces , Notifications, E-mail and setup details for the E-mail a ccount under the To
parameter. The details consist of the SMTP server name, the SMTP port used, whether
SSL/TLS is required or not, the Account, the Username and Password for the account – please
consult Appendix D Section D.10 and your e-mail provider for more details.
Set Notification to E-mail and a notification will be sent by e-mail when any of the alarm
conditions are met.
You can test the system by tapping on the Main Menu icon and selecting Send Notification
via E-mail.
Example of e-mail:
Subject: E-mail from 2479719 Abbey Road Test: Manual e-mail
Test: Manual e-mail
29-04-2009 12:51:16
Instrument 2479719 Abbey Road
SD-Card 383 MB / 483 MB
Internal Battery Charging
Measurement Status Running
CIC Result Passed
LAF 45.8dB
8.5 Web-server
To connect to the instrument using an Internet Browser, the following conditions must be
fulfilled:
• The instrument must be connected to a network as described in section 8.2.2, section 8.2.3
and section 8.3
• The Internet Browser must support Java scripts
The web page of the instrument has been tested on the following Internet Browsers:
•Microsoft
®
Internet Explorer®, from version 7
• Mozilla
®
Firefox®, from version 3
• Google Chrome™, from version 2
• Apple
®
Safari®, from version 4
You may also be able to connect to the instrument using Internet browsers on smart phones
such as an iPhone
®
.

76
2250 Light – User Manual
Password Protection
Connection to the instrument is password protected. There are two levels of protection:
• Guest – for viewing only
• Administrator – for viewing and controlling the instrument
Username and Password
Under Preferences you set the Username and Password individually for the Guest and for
Administrator accounts.
You need to specify Username and Password for the administrator, however, you can specify
whether the guest requires a login or not.
8.6 Connecting to Weather Stations and GPS Receivers
8.6.1 Weather Stations
The analyzer can be connected to the following weather stations:
• Weather Station MM-0316 – for measurement of wind speed and wind direction
• Weather Station MM-0256 – for measurement of wind speed, wind direction, ambient
temperature, ambient pressure, relative humidity and liquid precipitation
Please refer to the user manual for Noise Monitoring Terminal T ype 3639-A, B and C (BE 1818)
for details on how to mount and connect the weather station using Utility Unit ZH-0689.
When you have connected the Weather Station, you can verify the connection by displaying the
instantaneous updated parameters Wind Dir. and Wind Speed from the Env. Inst. group.
Data from the weather station is automatically obtained during the measurement and saved on
data – see measurement parameters in Appendix B. The measured data can be disp layed as
parameters from the Weather group.
Fig.8.7
Data from weather station
obtained during a
measurement and saved
on data

CHAPTER 8
Advanced Use of 2250 Light – Tips and Tricks
77
8.6.2 GPS Receivers
The analyzer can be connected to the following GPS receivers:
• GPS Receiver ZZ-0249 – for measurement of latitude, longitude, altitude and position error
Please refer to the user manual for Noise Monitoring Terminal Type 3639-A, B and C
(BE 1818) for details on how to mount and co nnect the GPS receiver using Utility Unit
ZH-0689.
• ND-100S GPS USB Dongle from Globalsat (www.globalsat.com.tw) – for measurement
of latitude, longitude and altitude
• BU-353 Cable GPS with USB Interface from Globalsat – for measurement of latitude,
longitude and altitude
The GPS receivers with USB interface can be connected directly to the USB port on analyzers
with hardware version 4. On hardware versions 1 – 3, the GPS receivers can be connected
using USB Adaptor AO-0657.
After connecting the GPS receiver, you can verify the connection by displaying the
instantaneous updated parameters Latitude and Longitude from the Env. Inst. group.
If a GPS receiver is connected when data is saved in a project, a GPS note is automatically
created as an annotation with the GPS information.
See more details on GPS notes in section 3.4.
8.7 Timers and Automatic Measurements
Automatic control of the analyzer is available via one or more of the analyzer’s timers (up to
ten).
The purpose of a timer is to initiate measurements in the absence of an operator. Basically, a
timer will:
• Switch on the analyzer at a preset time
• Load a preselected template
• Start a measurement as specified in the template
• Stop the measurement after a preset time defined by the Timer Setup
• Save the measurement
• Switch the analyzer off
• Repeat the above a preset number of times at preset intervals
For a timer to work, the analyzer must be in the ‘switched off’ state.
A timer will never interrupt the analyzer if it is already in use manually. If a switch-on time is
during the time the analyzer is in use, the timer opportunity is lost.
You can control the analyzer during a timer-initiated measurement as long as this does not
affect the measurements. If you try to change any parameters affecting the measurement you
will be warned of this. If you persist, the analyzer will revert to manual control and timer
control cannot be resumed.

78
2250 Light – User Manual
The Timer Setup lists the timers that have been defined previously on the analyzer (i.e., added
by you or previous users).
Fig.8.8
Example Timer Setup
In the topmost line you can add other timers by tapping on the Add New Timer icon . You
can delete a timer from the list by tapping on the Delete Timer icon . Only timers created by
the current user can be deleted – to delete a timer defined by another user, you have to logon as
the other user and then delete the timer.
For each timer you can specify:
• State: Enable or disable the timer
• Name: Name the timer
• Template: Select the template you want to use for the measurement.
Note: Reverberation Time templates are not available for timer control
• Start Time: Set the start time – at least 3 minutes ahead of current time
• Preset Time: Set the preset time for the measurement – regardless of the settings in the
template used by the timer
• Stop Time: The time when the measurement stops – for information only
• No. of Starts: Set to the total number of times you want to start the measurement
• Start Every: The time interval between the start of each successive measurement. This
interval must be greater than Preset Time + 3 minutes
• User: The user who specified the timer. Cannot be changed
Note: When using timers for automatic measurements, ensure the meter is connected to a
stable power supply. It is advised to select the Ext. Power setting ‘Charge battery only’ – see
section 8.1.2 – to avoid interference with timer operation.

79
Chapter 9
Updating, Maintenance and Troubleshooting
9.1 How to Install New Applications
Sound Level Meter Software for 2250 Light BZ-7130, 1/1-octave Frequency Analysis Software
for 2250 Light BZ-7131, 1/3-octave Frequency Analysis Software for 2250 Light BZ-7132,
Logging Software for 2250 Light BZ-7133, Signal Recording Option BZ-7226 and Tone
Assessment Option BZ-7231are pre-installed on 2250 Light. However, a valid license is
required to run the software. If you have purchased 2250 Light together with the software
application(s), then the relevant license(s) will come pre-installed on the instrument.
If you purchase a separate software application for your 2250 Light, then you have to install the
license on the instrument. This is done using Measurement Partner Suite BZ-5503, please
consult the on-line help included with the BZ-5503 software for instructions on how to install a
license.
Tap on the Help icon on the instrument’s screen, then select About to get a list of installed
software and licenses.
9.2 How to Update/Upgrade Applications and Install New
Languages
Brüel & Kjær recommends that you always use the most current software available. New
versions of the analyzer software are available for download via the Brüel & Kjær website
(www .bksv.com), which you may want to install on your analyzer. To do this, use Measurement
Partner Suite BZ-5503, or connect the analyzer directly to the Internet to download. Some
software versions will be free updates, and some will be upgrades requiring that a new license
is purchased.
9.2.1 Update/Upgrade using BZ-5503
BZ-5503 can be used for updating or upgrading new software applications on your analyzer. It
can even downgrade to specific software versions if required by type approving auth orities.
Using BZ-5503, you can also install licenses for the specific applications; and, if you have

80
2250 Light – User Manual
hardware version 1 – 3, insta ll your preferred language (with G 4 hardware, all languages are
pre-installed in the analyzer). Installation requires a USB connection between BZ-5503 and the
analyzer.
The BZ-5503 software will clearly indicate if the new software version is an update (free of
charge) or an upgrade (license fee). Please consult the on-line help included with the
BZ-5503 software for instructions on how to install upgrades/updates of the software,
together with your preferred language.
Tap on the Help icon on the instrument's screen, then select About to get a list of installed
software and licenses.
9.2.2 Update Through the Internet
The analyzer can update software by itself, if it is connected to the internet – see section 7.1.
This method is particularly useful if the analyzer is used for long term monitoring, and you do
not want to go to the measurement site for servicing (that is, you want to disturb the
measurement as little as possible).
Note: The method is used for updating the software with the latest version available from the
Brüel & Kjær website. The languages already installed will be updated at the same time. If you
have hardware versions 1 – 3, you cann ot install new
languages or licenses – to do this, you
must use BZ-5503.
The update procedure is as follows:
1) Tap on the Help icon on the instrument's screen, then select About to get a list of
installed software and licenses. Scroll down to the bottom of the screen and tap on the
Check for updates on the web…> link, the Software Update screen appears – see
Fig. 9.1and Fig. 9.2.
Note: This can be done remotely if you connect to the on-line display using either BZ5503 or an Internet Browser.
2) Click on the Check for Updates button to check for the latest updates. This will connect
to the Brüel & Kjær update server – if a new software version is available the build version
will be displayed and you can start the update (you will be warned, if the new version
requires a new license) or decline the update. If the versions that are available are not later
than those already installed you will be told so and the update will be terminated.
3) If you choose to update the analyzer, the software will start downloading to the SD or CF
card (CF card only with hardware versions 1 – 3) already inserted in the analyzer. You
need at least 200 MByte of free space on the memory card. Depending on the speed and
quality of the Internet connection, this can take from a few minutes to several hours. If the
connection is lost, then the download will automatically continue when connection is
established again.
Note: The analyzer can continue measuring during the download period.
4) When download is complete, the measurement is paused and normal use of the instrument
is prevented. Connections to the instrument are terminated and the upgrade of the

CHAPTER 9
Updating, Maintenance and Troubleshooting
81
instrument will start. This will take 10-15 minutes and the analyzer will reboot when
finished. Any unsaved logging data will be saved and the analyzer is ready to use again.
5) Connect to the instrument again and verify the new software version by tapping on the
Help icon on the instrument's screen, then select About.
To continue the measurement, press the Start pushbutton.
Note: If you have set up your instrument for e-mail notifications (see section 8.4), the n you
will get an e-mail in step 4), when the analyzer is paused, and you will get a new e-mail in step
5), when the analyzer has rebooted and is ready for connection again.
Fig.9.1
About screen - Showing
the ‘Check for updates
on the Web’ link
Fig.9.2
Software update screen Showing the ‘Check for
Updates’ button

82
2250 Light – User Manual
9.2.3 Downgrade to an Earlier Version
It is possible to downgrade to an earlier version of the software:
1) Within the server address (see Fig.9.2) change the text “latest” to the desired software
package, e.g., “SW22.”
2) Press Check for updates.
3) Follow the procedure described in section 9.2.1 or section 9.2.2.
Note: Only the software package SW24 or newer can be downgraded to another package.
Software packages down to SW21 are available for update through the Internet.
9.3 Troubleshooting
9.3.1 2250 Light Measurements
If your 2250 Light measurement seems to be wrong, then:
• Check the cabling, if any
• Check that the microphone, including preamplifier, is correctly mounted in the top socket
(or correctly connected to the extension cable)
• Check that the transducer you have mounted on your 2250 Light is selected as the
Transducer Used parameter, this is also found in the Setup menu
• Check whether the parameters for the selected transducer (Transducer Used) are set
correctly, especially the Microphone Type parameter. This is found by tapping the Main
Menu icon , then Transducers
• Check that the Sound Field and Windscr een Correction parameters have been set correctly.
These are found by tapping the Main Menu icon , then Setup, followed by Input
• Check if the calibration is OK (make a new calibration using an external calibrator)
9.3.2 SD/CF Cards and USB Sticks
The Logging and Signal Recording software requires that measurements are saved on memory
cards – SD or (with hardware versions 1 – 3) CF. A USB memory stick can be used from
hardware version 4.
Device Format and Speed
In order to ensure reliable operation with the memory device, the format of the file system and
the speed of the device are tested. Upon insertion, the analyzer verifies the format of the
memory device’s file system. If the file system is not optimal for usage with the analyzer, then
you are prompted to format it. You will be guided through the process.
When the format of the file system has been accepted, then the speed of the device is tested.
The test writes data to the device and measures the writing speed. The test takes less than a
minute. If the speed test is successful, then you can proceed using the device, otherwise you
should use another memory device or try reformatting the device (if not done already).

CHAPTER 9
Updating, Maintenance and Troubleshooting
83
Problems with Storing or Recalling Data
If you experience problems in storing or recalling data on memory devices, you can check and
repair the integrity of the file system on the device or even re-format it, by doing the following:
1) Insert the memory device in the correct slot of the connector panel of 2250 Light.
2) You will be notified that a device has been inserted – select Yes to change the default
measurement path to it.
3) Tap the Main Menu icon and then Explorer.
4) Tap on the icon to go up folder levels until you have reached the topmost level with a
list of the available memory devices.
5) Tap on the name of the device (not the icon) to get a list of available commands.
6) Select Check and Repair to start the procedure. If any errors are found in the file system,
they are fixed. When finished, you will be informed whether the device was OK or that
errors have been fixed.
Note: The checking procedure can take several minutes, depending on the size of the
memory device.
Formatting a memory device:
7) Select Format to start the formatting procedure.
WARNING: All data on the device will be erase d during the formatting process.
WARNING: Do not re move the device or switch off the instrument during the procedure –
this might damage the file system and data, and make it unusable.
Note: The read/write performance of memory cards and USB memory sticks varies a lot. The
performance depends on the manufacturer of the device, the type of device, its size, how
much it has been used, how fragmented the me mory is, an d ev e n t he da y o f pr o du ct i on . Two
‘identical’ devices can have a different performance because the manufacturer has
changed the internal technology without notice.
In general, as a rule of thumb, you should select memory devices aimed for the industrial
or professional photographer market.
The cards delivered by Brüel & Kjær have all been tested for their read/write performance
in a 2250 Light and can be used for the applications available in a 2250 Light. If you
need more (or other) types of memory devices, please consult your local Brüel & Kjær
representative.
Remember to regularly re-format the device (especially before a long unattended
measurement) – this will ensure the best performance.
8) Select Test Speed, if you want to check the device’s file speed.

84
2250 Light – User Manual
9.3.3 Battery Pack and Recalibration of Battery Charge Indicator
The software keeps the capacity of the battery pack updated. Over time the total capacity of the
battery pack decreases. If you find that the ‘Time Remaining’ estimate (tap on the battery icon
to get this information) does not match the real time remaining (for example, the
instrument switches off automatically because of lack of power while the Time Remaining
estimate indicates at least ½ hour), then you should manually re-calibrate the capacity of the
battery pack. This is done using the following method:
• Drain all the power from the battery:
– Switch the instrument on
– Disconnect external power
– Disconnect the instrument from the PC
–In the Preferences menu, under Power Settings, set Standby After to Never
– You may want to set Backlight On to Always (in the same menu) and select the
maximum level of display backlight in order to drain the battery faster (use the
Backlight icon at the bottom of the screen)
– Leave the instrument until the battery voltage becomes so low that the instrument
switches itself off
• Charge the battery fully (at least 10 hours):
– Connect the Mains Power Supply ZG-0426 (or ZG-0429) to the instrument
– Switch the instrument on (and leave it on) and remember to reset the Standby After
and Backlight On to your preferred settings
Tap the battery icon and a pop-up appears, giving details of the battery condition. This
will indicate ‘Calibrating Battery’ initially. Let the battery charge until the battery charge
indicator just below the power socket starts flashing and the ‘Calibrating Battery’ indication
has disappeared from the pop-up window
9.3.4 Touch Screen
If tapping with the stylus on the screen seems to be getting more inaccurate, you can adjust the
touch sensitive screen, as follows:
•In the Preferences menu, under Display Settings activate the link Adjust Touch Screen.
This displays a full screen with guidance on how to tap on a cross five times at different
places on the screen. The adjustment procedure ends with saving the values or canceling
the adjustment
9.3.5 Reset Options
Reset Button
WARNING:Unsaved data or setups will be lost when you reset the instrument.
If your 2250 Light stops responding to pushbutton presses, or stylus taps, then you can do the
following:

CHAPTER 9
Updating, Maintenance and Troubleshooting
85
• Reset and reboot the instrument by pressing the reset button (located on the connector
panel – see in Chapter 2) with the point of the stylus
If you still experience problems, try resetting your analyzer as described below.
Instrument Reset
1) Reset the analyzer to a default/factory installed state.
– For hardware versions 1 – 3, you will reset the analyzer to a default state, where the
user is set to 2250 Light and the project template is set to Sound Level Meter. The
existing Sound Level Meter project template will be overwritten, as will the
preferences for the user. To reset the analyzer to the default state:
a) Press and hold the Power-on pushbutton for at least five seconds (powers off).
b) Press and hold down the Manual Event 2 and Save pushbuttons while
switching on the analyzer. The display in Fig.9.3 will be shown.
Fig.9.3
Maintenance Mode
–initial screen
Within a few seconds the display in Fig. 9.4 will be shown.

86
2250 Light – User Manual
Fig.9.4
Update 2250 Light
software screen
c) Cancel the update by pressing any other pushbutton than the Accept pushbutton .
Fig.9.5
Reset to default settings
screen
d) Press the Accept pushbutton to reset to default settings.
– With hardware version 4 (G4), the analyzer contains two sets of the
firmware/software package and settings. The one originally delivered with the
analyzer and one installed afterwards. To restore the factory firmware/software
package and settings:
a) Press and hold the Power-on pushbutton for at least five seconds (powers off).
b) Press and hold down the Manual Event 2 and Save pushbuttons while
switching on the analyzer. The display in Fig.9.6 will be shown.

CHAPTER 9
Updating, Maintenance and Troubleshooting
87
Fig.9.6
Restore factory firmware
and settings on hardware
version 4
c) Press the Accept push button to restore factory firmware and settings.
2) (all hardware versions) If the instrument now functions normally, define your preferred
settings in the Preferences menu, adjust the touch screen again and make necessary
changes to Setup (all accessed via the Main Menu ).
If you experience problems selecting another template or you login as another user, then note
which step causes the problem. You might need to delete/reconfigure the templates or users.
To delete/reconfigure templates or users, use Measurement Partner Suite BZ-5503 with the
analyzer connected to the PC via Micro USB Cable AO-1494 (G 4 hardware) or Mini USB
Cable AO-1476, or a modem/LAN connection. Please consult the on-line help included w ith
the BZ-5503 software for instructions on how to configure the analyzer.
Re-installing Software (Hardware Versions 1 – 3)
If the instrument still does not work normally after performin g the ‘Reset to Default Settings’
procedure, then the software might need to be re-installed. This can be done in two ways:
1) If the connection to Measurement Partner Suite BZ-5503 works with the instrument
connected to the PC using a USB cable, then the software can be re-installed and reconfigured through the USB cable. Please consult the on-line help included with the
BZ-5503 software for instructions on how to re-install software on 2250 Light.
2) If the connection to the PC does not work, then you need a Compact Flash card (size at
least 64 Mbytes) and a Compact Flash card reader for the PC. You can then use
Measurement Partner Suite BZ-5503 to update the Compact Flash card with the necessa ry
files. Please consult the on-line help included with the BZ-5503 software for instructions
on how to update a Compact Flash card with installation files for 2250 Light.
Power off 2250 Light and insert the compact flash card in the CF slot on the instru ment.
Then press and hold down the Manual Event 2 and Save pushbuttons while
switching on the instrument. The Maintenance Mode initial screen will be displayed, and
then within a few seconds the screen shown in Fig.9.4 will appear.

88
2250 Light – User Manual
Press the Accept pushbutton to update the software. This will take approximately
5 minutes.
WARNING:Do not remove the CF-card while updating the 2250 Light software!
When the 2250 Light software has been updated, you will get the option of resetting to
the default settings.
If the problem still persists, then you should contact your local Brüel & Kjær representative.
9.4 Services at Brüel & Kjær for Type 2250 Light
9.4.1 Accredited Calibration
For Type 2250 Light, you can order accredited calibration and choose between DANAK,
A2LA, UKAS, Eichamt (Austria), RvA, ENAC, NATA and Inmetro.
For Spain, Primitiva is available.
The calibration will be performed in an ISO 17025 certified laboratory.
9.4.2 Initial Calibration
T o start the measurement history from day one – if this is required, for example, for measurement
use in public, for customer audit or quality procedures – we recommend you order accredited
calibration together with the new instrument.
9.4.3 Regular Recalibration
To fulfil requirements for public measurements and to minimise the cost of errors due to faulty
or inaccurate measurements, we can arrange for calibration every year in an ISO 17025
certified laboratory at Brüel & Kjær. With annual data, you will have an unbroken history to
use as reference, either for internal requirements, for audit required by authorities or at the
request of your customers. And not least, you can follow the history of sensitivity for your
instruments over time.
9.4.4 Filter Calibration
• You can order calibration of filters. Please specify at the time of ordering.
• Calibration of filter response for octave and 1/3-octave filters according to IEC 61260.
9.4.5 Service and Repair
The hand-held analyzer is designed and constructed to provide many years of reliable
operation. However, if a fault occurs that impairs the analyzer’s correct function, then remove
the battery pack and disconnect any external power supply to prevent risk of further damage.
For more information about preventing faults or damage to your sound level meter, see
section 9.5.

CHAPTER 9
Updating, Maintenance and Troubleshooting
89
9.4.6 Hardware Maintenance and Repair
You can minimi se the risk of unexpected co sts by purchasing the hardware maintenan ce with a
five years warranty. Minor repairs, such as those resulting from damage caused by unauthorised
use of the instrument, can be performed at the same time as the instrument is being calibrated at
Brüel & Kjær. This will save you time. If any other errors are det ected by the tec hnician d uring
calibration, repair will be performed before returning the instrument to you.
Repair is available at a fixed price, whi ch includes a Conformance Te st Certificate upon the
return of your instrument (no measurement data included).
9.4.7 Rental
To ensure optimal uptime, you can rent a substitute Hand-held Analyzera while yours is being
calibrated. T o arrange rental, please contact your local Brüel & Kjær representative.
9.4.8 Training
Basic knowledge on sound and vibration measurement, instrument training and application
training are a few examples of what local training or consultancy hours
a
can do for you. T o find
out more about training and consultancy hours, please contact your local Brüel & Kjær
representative.
9.5 Care, Cleaning and Storage
2250 Light is a robust instrument, however, when handling, storing or cleaning your instrument,
please take the following precautions.
9.5.1 Handling the Instrument
• Do not try to remove the microphone grid as you can easily damage the microphone
• Do not attempt to open the instrument. There are no user-serviceable parts inside. If you
think your instrument requires service, please contact your Brüel & Kjær representative
• Do not allow the instrument to get wet
• Protect the instrument from impact. Do not drop it. Transport it in the supplied carrying
pouch
9.5.2 Cleaning the Instrument
If the instrument casing becomes dirty, then wipe it with a lightly dampened cloth. Do not use
abrasive cleansers or solvents. Do not allow moisture to enter the microphone, connectors or
casing.
a. Providing this service is available from your local Brüel & Kjær office

90
2250 Light – User Manual
9.5.3 Storing the Instrument
• Keep the sound level meter in a dry place, preferably within its carrying pouch
• For long-term storage, remove the battery pack
• Do not exceed storage temperature limits of –25 to +70°C (–13 to +158°F)
 Loading...