

Page 1

SiteHawk™ SK-4000
Analyzer
OPERATING INSTRUCTIONS
This is a preliminary manual. Specifications, limits, and text are subject to change
without notice. The information within this manual was as complete as possible at
the time of printing. Bird Electronic Corporation is not liable for errors.
©Copyright 2014 by Bird Electronic Corporation
Instruction Book Part Number 920-SK-4000 Rev. P3
SiteHawk is a trademark of Bird Electronic Corporation
Page 2

Safety Precautions
The following are general safety precautions that are not necessarily related to
any specific part or procedure, and do not necessarily appear elsewhere in this
publication. These precautions must be thoroughly understood and apply to all
phases of operation and maintenance.
WARNING
Keep Away From Live Circuits
Operating Personnel must at all times observe general safety precautions. Do
not replace components or make adjustments to the inside of the test
equipment with the high voltage supply turned on. To avoid casualties,
always remove power.
WARNING
Shock Hazard
Do not attempt to remove the RF transmission line while RF power is present.
WARNING
Do Not Service Or Adjust Alone
Under no circumstances should any person reach into an enclosure for the
purpose of service or adjustment of equipment except in the presence of
someone who is capable of rendering aid.
WARNING
Safety Earth Ground
An uninterruptible earth safety ground must be supplied from the main
power source to test instruments. Grounding one conductor of a two
conductor power cable is not sufficient protection. Serious injury or death
can occur if this grounding is not properly supplied.
WARNING
Resuscitation
Personnel working with or near high voltages should be familiar with modern
methods of resuscitation.
WARNING
Remove Power
Observe general safety precautions. Do not open the instrument with the
power on.
i
Page 3

Safety Symbols
WARNING
Warning notes call attention to a procedure, which if not correctly performed,
could result in personal injury.
CAUTION
Caution notes call attention to a procedure, which if not correctly performed,
could result in damage to the instrument.
Note: Calls attention to supplemental information.
Caution Statements
The following equipment cautions appear in the text and are repeated here for
emphasis.
CAUTION
Please do not open the instrument shell. The electronic equipment inside will
be damaged.
See page 1.
CAUTION
Only use the supplied AC adapter to charge the unit.
The unit cannot be charged from a standard USB port (i.e. from a laptop).
Charging from a standard USB port could damage the power source.
See pages 6 and 35.
CAUTION
Do not touch the center pin with bare hands, water, or emery cloth.
Otherwise, damage may occur to the connectors surface.
See page 35.
ii
Page 4

Safety Statements
USAGE
ANY USE OF THIS INSTRUMENT IN A MANNER NOT
SPECIFIED BY THE MANUFACTURER MAY IMPAIR THE
INSTRUMENT’S SAFETY PROTECTION.
USO
EL USO DE ESTE INSTRUMENTO DE MANERA NO
ESPECIFICADA POR EL FABRICANTE, PUEDE ANULAR LA
PROTECCIÓN DE SEGURIDAD DEL INSTRUMENTO.
BENUTZUNG
WIRD DAS GERÄT AUF ANDERE WEISE VERWENDET ALS VOM
HERSTELLER BESCHRIEBEN, KANN DIE GERÄTESICHERHEIT
BEEINTRÄCHTIGT WERDEN.
UTILISATION
TOUTE UTILISATION DE CET INSTRUMENT QUI N’EST PAS
EXPLICITEMENT PRÉVUE PAR LE FABRICANT PEUT
ENDOMMAGER LE DISPOSITIF DE PROTECTION DE
L’INSTRUMENT.
IMPIEGO
QUALORA QUESTO STRUMENTO VENISSE UTILIZZATO IN
MODO DIVERSO DA COME SPECIFICATO DAL PRODUTTORE
LA PROZIONE DI SICUREZZA POTREBBE VENIRNE
COMPROMESSA.
iii
Page 5

SERVICE
SERVICING INSTRUCTIONS ARE FOR USE BY SERVICE TRAINED PERSONNEL ONLY. TO AVOID DANGEROUS
ELECTRIC SHOCK, DO NOT PERFORM ANY SERVICING
UNLESS QUALIFIED TO DO SO.
SERVICIO
LAS INSTRUCCIONES DE SERVICIO SON PARA USO
EXCLUSIVO DEL PERSONAL DE SERVICIO CAPACITADO. PARA
EVITAR EL PELIGRO DE DESCARGAS ELÉCTRICAS, NO
REALICE NINGÚN SERVICIO A MENOS QUE ESTÉ
CAPACITADO PARA HACERIO.
WARTUNG
ANWEISUNGEN FÜR DIE WARTUNG DES GERÄTES GELTEN
NUR FÜR GESCHULTES FACHPERSONAL.
ZUR VERMEIDUNG GEFÄHRLICHE, ELEKTRISCHE SCHOCKS,
SIND WARTUNGSARBEITEN AUSSCHLIEßLICH VON
QUALIFIZIERTEM SERVICEPERSONAL DURCHZUFÜHREN.
ENTRENTIEN
L’EMPLOI DES INSTRUCTIONS D’ENTRETIEN DOIT ÊTRE
RÉSERVÉ AU PERSONNEL FORMÉ AUX OPÉRATIONS
D’ENTRETIEN. POUR PRÉVENIR UN CHOC ÉLECTRIQUE
DANGEREUX, NE PAS EFFECTUER D’ENTRETIEN SI L’ON N’A
PAS ÉTÉ QUALIFIÉ POUR CE FAIRE.
ASSISTENZA TECNICA
LE ISTRUZIONI RELATIVE ALL’ASSISTENZA SONO PREVISTE
ESCLUSIVAMENTE PER IL PERSONALE OPPORTUNAMENTE
ADDESTRATO. PER EVITARE PERICOLOSE SCOSSE
ELETTRICHE NON EFFETTUARRE ALCUNA RIPARAZIONE A
MENO CHE QUALIFICATI A FARLA.
iv
Page 6

UNITS ARE EQUIPPED WITH RECHAREABLE BATTERIES.
THESE ARE TO BE REPLACED BY AUTHORIZED SERVICE PERSONNEL ONLY!!!
LAS UNIDADES VIENEN EQUIPADAS CON BATERIAS
RECARGABLES.
¡¡¡Y SOLAMENTE EL PERSONAL DE SERVICIO AUTORIZADO
PUEDE REEMPLAZARLAS!!!
GERÄTE SIND MIT WIEDER AUFLADBAREN BATTERIEN
BESTÜCKT.
BATTERIEN SIND NUR VON QUALIFIZIERTEM SERICE
PERSONAL AUSZUWECHSELN!!!
CES DISPOSITIFS SONT ÉQUIPÉS DE BATTERIES
RECHARGEABLES.
SEUL LE PERSONNEL D’ENTRETIEN AUTORISÉ EST HABILITÉ
À LES REMPLACER!
LE UNITÀ SONO DOTATE DI BATTERIE RICARICABILI,
CHE DEVONO DA COME SPECIFICATO DAL PRODUTTORE LA
PROTEZIONE DI SICUREZZA POTREBBE VENIRNE
COMPROMESSA.
v
Page 7

About This Manual
This manual covers the operating and maintenance instructions for the following models:
SK-4000
Changes to this Manual
We have made every effort to ensure this manual is accurate. If you discover
any errors, or if you have suggestions for improving this manual, please send
your comments to our Solon, Ohio factory. This manual may be periodically
updated. When inquiring about updates to this manual refer to the part number
and revision on the title page.
Literature Contents
Start-up Instructions
The Start-up Instructions contains minimum operational steps and the order
they should be performed. Use this manual for reference or if further explanation of any step is required.
Operations Manuals
Chapter Layout
Introduction — Describes the features of the Bird SiteHawk™, lists equipment
supplied and optional equipment, and provides power-up instructions.
Measure Match Mode — Lists the steps to make match measurements, as
well as providing instructions for all functions available in Measure Match mode.
Distance-to-Fault Measurements — The DTF measurement shows the
location of any problems in the antenna system. This is shown in either feet or
meters from the cable end connected to the SiteHawk.
PC Tool — Describes how to use the SiteHawk’s PC Tool function and how to
transfer readings from the SiteHawk to the computer and back again.
Utilities — Describes built-in instrument utility features and how to use them.
Maintenance — Lists routine maintenance tasks as well as troubleshooting
for common problems. Specifications and parts information are also included.
vi
Page 8

vii
Page 9

Table of Contents
Safety Precautions. . . . . . . . . . . . . . . . . . . . . . . . . . . . . . . . . . . . . . . . . i
Safety Symbols . . . . . . . . . . . . . . . . . . . . . . . . . . . . . . . . . . . . . . . . . . . . . . . . . . ii
Caution Statements . . . . . . . . . . . . . . . . . . . . . . . . . . . . . . . . . . . . . . . . . . . . . . ii
Safety Statements . . . . . . . . . . . . . . . . . . . . . . . . . . . . . . . . . . . . . . . . . . . . . . . iii
About This Manual . . . . . . . . . . . . . . . . . . . . . . . . . . . . . . . . . . . . . . . . vi
Changes to this Manual . . . . . . . . . . . . . . . . . . . . . . . . . . . . . . . . . . . . . . . . . . . vi
Literature Contents . . . . . . . . . . . . . . . . . . . . . . . . . . . . . . . . . . . . . . . . . . . . . . vi
Start-up Instructions . . . . . . . . . . . . . . . . . . . . . . . . . . . . . . . . . . . . . . . . . . vi
Operations Manuals . . . . . . . . . . . . . . . . . . . . . . . . . . . . . . . . . . . . . . . . . . vi
Chapter Layout . . . . . . . . . . . . . . . . . . . . . . . . . . . . . . . . . . . . . . . . . . . . . vi
Chapter 1 Introduction . . . . . . . . . . . . . . . . . . . . . . . . . . . . . . . . . . . . . 1
Safety considerations . . . . . . . . . . . . . . . . . . . . . . . . . . . . . . . . . . . . . . . . . . . . 1
Items Supplied . . . . . . . . . . . . . . . . . . . . . . . . . . . . . . . . . . . . . . . . . . . . . . . . . . 2
Items Not Supplied (Selectable) . . . . . . . . . . . . . . . . . . . . . . . . . . . . . . . . . . . . 2
SiteHawk SK-4000 Analyzer Specifications . . . . . . . . . . . . . . . . . . . . . . . . . . . 3
Measurement Capability . . . . . . . . . . . . . . . . . . . . . . . . . . . . . . . . . . . . . . . . . . 5
Connectors . . . . . . . . . . . . . . . . . . . . . . . . . . . . . . . . . . . . . . . . . . . . . . . . . . . . . 5
Power . . . . . . . . . . . . . . . . . . . . . . . . . . . . . . . . . . . . . . . . . . . . . . . . . . . . . . . . . 6
Powering On . . . . . . . . . . . . . . . . . . . . . . . . . . . . . . . . . . . . . . . . . . . . . . . . 6
Powering Off . . . . . . . . . . . . . . . . . . . . . . . . . . . . . . . . . . . . . . . . . . . . . . . . 6
Sleep Mode . . . . . . . . . . . . . . . . . . . . . . . . . . . . . . . . . . . . . . . . . . . . . . . . . 6
Measurement Port . . . . . . . . . . . . . . . . . . . . . . . . . . . . . . . . . . . . . . . . . . . . . . 6
Chapter 2 Calibration . . . . . . . . . . . . . . . . . . . . . . . . . . . . . . . . . . . . . .7
Calibration Accessories . . . . . . . . . . . . . . . . . . . . . . . . . . . . . . . . . . . . . . . . . . . 7
Calibrating the SiteHawk SK-4000 Analyzer . . . . . . . . . . . . . . . . . . . . . . . 7
Calibration Combination Manage . . . . . . . . . . . . . . . . . . . . . . . . . . . . . . . 8
Title Setting . . . . . . . . . . . . . . . . . . . . . . . . . . . . . . . . . . . . . . . . . . . . . . . . 8
Calibration Criteria Edit . . . . . . . . . . . . . . . . . . . . . . . . . . . . . . . . . . . . . . 8
Chapter 3 Measure Match Mode. . . . . . . . . . . . . . . . . . . . . . . . . . . . . .9
Selecting the Measure Match Mode . . . . . . . . . . . . . . . . . . . . . . . . . . . . . . . . 9
Scanning Setting . . . . . . . . . . . . . . . . . . . . . . . . . . . . . . . . . . . . . . . . . . . . . . . . 9
Setting the Measurement Frequency . . . . . . . . . . . . . . . . . . . . . . . . . . . . 9
Setting a Custom Sweep Frequency . . . . . . . . . . . . . . . . . . . . . . . . . . . . . 10
Selecting the Measurement Units . . . . . . . . . . . . . . . . . . . . . . . . . . . . . . 11
Setting the Measurement Data Points . . . . . . . . . . . . . . . . . . . . . . . . . . 11
Setting the Scale . . . . . . . . . . . . . . . . . . . . . . . . . . . . . . . . . . . . . . . . . . . . 12
Tracing Mode Setting . . . . . . . . . . . . . . . . . . . . . . . . . . . . . . . . . . . . . . . . 13
viii
Page 10

Set and Activate Acceptance Limits . . . . . . . . . . . . . . . . . . . . . . . . . . . . . . . . 14
Interpreting the Measurement . . . . . . . . . . . . . . . . . . . . . . . . . . . . . . . . . . . 14
Cable Loss Measurement . . . . . . . . . . . . . . . . . . . . . . . . . . . . . . . . . . . . . . . . 15
Performing a Cable Loss Measurement . . . . . . . . . . . . . . . . . . . . . . . . . . 15
Interpreting a Cable Loss Measurement . . . . . . . . . . . . . . . . . . . . . . . . . 16
Chapter 4 Fault Location Mode . . . . . . . . . . . . . . . . . . . . . . . . . . . . .17
Selecting Fault Location Mode . . . . . . . . . . . . . . . . . . . . . . . . . . . . . . . . . . . . 17
Setting the Frequency Span and Max Distance . . . . . . . . . . . . . . . . . . . . . . . 18
Frequency Span . . . . . . . . . . . . . . . . . . . . . . . . . . . . . . . . . . . . . . . . . . . . . 18
Max Distance . . . . . . . . . . . . . . . . . . . . . . . . . . . . . . . . . . . . . . . . . . . . . . . 18
Data Points . . . . . . . . . . . . . . . . . . . . . . . . . . . . . . . . . . . . . . . . . . . . . . . . . 18
Setting the Frequency Span . . . . . . . . . . . . . . . . . . . . . . . . . . . . . . . . . . . . . . 18
Setting the Distance and Units . . . . . . . . . . . . . . . . . . . . . . . . . . . . . . . . . . . . 19
Unit . . . . . . . . . . . . . . . . . . . . . . . . . . . . . . . . . . . . . . . . . . . . . . . . . . . . . . . 20
Start . . . . . . . . . . . . . . . . . . . . . . . . . . . . . . . . . . . . . . . . . . . . . . . . . . . . . . 20
End . . . . . . . . . . . . . . . . . . . . . . . . . . . . . . . . . . . . . . . . . . . . . . . . . . . . . . . 20
Windows . . . . . . . . . . . . . . . . . . . . . . . . . . . . . . . . . . . . . . . . . . . . . . . . . . . 20
Velocity . . . . . . . . . . . . . . . . . . . . . . . . . . . . . . . . . . . . . . . . . . . . . . . . . . . . 20
Cable Loss . . . . . . . . . . . . . . . . . . . . . . . . . . . . . . . . . . . . . . . . . . . . . . . . . . 20
Cable List . . . . . . . . . . . . . . . . . . . . . . . . . . . . . . . . . . . . . . . . . . . . . . . . . . 20
Trigger . . . . . . . . . . . . . . . . . . . . . . . . . . . . . . . . . . . . . . . . . . . . . . . . . . . . . . . . 21
Trigger mode . . . . . . . . . . . . . . . . . . . . . . . . . . . . . . . . . . . . . . . . . . . . . . . 21
Test for Fault Location . . . . . . . . . . . . . . . . . . . . . . . . . . . . . . . . . . . . . . . . . . . 21
Interpreting the Fault Location Measurement . . . . . . . . . . . . . . . . . . . . . . . 21
Chapter 5 General Operation . . . . . . . . . . . . . . . . . . . . . . . . . . . . . . .23
Limit Lines . . . . . . . . . . . . . . . . . . . . . . . . . . . . . . . . . . . . . . . . . . . . . . . . . . . . 23
Limit . . . . . . . . . . . . . . . . . . . . . . . . . . . . . . . . . . . . . . . . . . . . . . . . . . . . . 23
Style . . . . . . . . . . . . . . . . . . . . . . . . . . . . . . . . . . . . . . . . . . . . . . . . . . . . . 23
Value . . . . . . . . . . . . . . . . . . . . . . . . . . . . . . . . . . . . . . . . . . . . . . . . . . . . 23
Step . . . . . . . . . . . . . . . . . . . . . . . . . . . . . . . . . . . . . . . . . . . . . . . . . . . . . 23
Move Up . . . . . . . . . . . . . . . . . . . . . . . . . . . . . . . . . . . . . . . . . . . . . . . . . 23
Move Down . . . . . . . . . . . . . . . . . . . . . . . . . . . . . . . . . . . . . . . . . . . . . . . 23
FailFlag . . . . . . . . . . . . . . . . . . . . . . . . . . . . . . . . . . . . . . . . . . . . . . . . . . . 23
FailAlarm . . . . . . . . . . . . . . . . . . . . . . . . . . . . . . . . . . . . . . . . . . . . . . . . . 23
markers . . . . . . . . . . . . . . . . . . . . . . . . . . . . . . . . . . . . . . . . . . . . . . . . . . . . . . . 24
Activate Markers and Set Marker Style . . . . . . . . . . . . . . . . . . . . . . . . . . . . . 24
Add . . . . . . . . . . . . . . . . . . . . . . . . . . . . . . . . . . . . . . . . . . . . . . . . . . . . . . 24
Delete . . . . . . . . . . . . . . . . . . . . . . . . . . . . . . . . . . . . . . . . . . . . . . . . . . . 25
Position . . . . . . . . . . . . . . . . . . . . . . . . . . . . . . . . . . . . . . . . . . . . . . . . . . 25
Step . . . . . . . . . . . . . . . . . . . . . . . . . . . . . . . . . . . . . . . . . . . . . . . . . . . . . 25
Move Left/Move Right . . . . . . . . . . . . . . . . . . . . . . . . . . . . . . . . . . . . . . 25
Search Max/Min . . . . . . . . . . . . . . . . . . . . . . . . . . . . . . . . . . . . . . . . . . . 25
ix
Page 11

Using Delta Markers . . . . . . . . . . . . . . . . . . . . . . . . . . . . . . . . . . . . . . . . . . . . 26
marker Add . . . . . . . . . . . . . . . . . . . . . . . . . . . . . . . . . . . . . . . . . . . . . . . . 26
marker Deletion . . . . . . . . . . . . . . . . . . . . . . . . . . . . . . . . . . . . . . . . . . . . . 26
Setting the Position of a Cursor . . . . . . . . . . . . . . . . . . . . . . . . . . . . . . . . 26
marker Activation . . . . . . . . . . . . . . . . . . . . . . . . . . . . . . . . . . . . . . . . . . . 27
Limited Search . . . . . . . . . . . . . . . . . . . . . . . . . . . . . . . . . . . . . . . . . . . . . . . . . 27
Delta Marker Function . . . . . . . . . . . . . . . . . . . . . . . . . . . . . . . . . . . . . . . . . . 27
Saving and Recalling Traces . . . . . . . . . . . . . . . . . . . . . . . . . . . . . . . . . . . . . . 28
Saving a Trace . . . . . . . . . . . . . . . . . . . . . . . . . . . . . . . . . . . . . . . . . . . . . . 28
Recalling a Saved Trace . . . . . . . . . . . . . . . . . . . . . . . . . . . . . . . . . . . . . . . 29
Viewing a Recalled Trace . . . . . . . . . . . . . . . . . . . . . . . . . . . . . . . . . . . . . 29
Others . . . . . . . . . . . . . . . . . . . . . . . . . . . . . . . . . . . . . . . . . . . . . . . . . . . . . . . . 30
Instrument Default . . . . . . . . . . . . . . . . . . . . . . . . . . . . . . . . . . . . . . . . . . 30
Exit . . . . . . . . . . . . . . . . . . . . . . . . . . . . . . . . . . . . . . . . . . . . . . . . . . . . . . . 30
System Information . . . . . . . . . . . . . . . . . . . . . . . . . . . . . . . . . . . . . . . . . . 30
System Setting . . . . . . . . . . . . . . . . . . . . . . . . . . . . . . . . . . . . . . . . . . . . . . 30
Chapter 6 Data Save and Export . . . . . . . . . . . . . . . . . . . . . . . . . . . . 31
SiteHawk SK-4000 Status . . . . . . . . . . . . . . . . . . . . . . . . . . . . . . . . . . . . . . . . 31
SiteHawk SK-4000 Status Save . . . . . . . . . . . . . . . . . . . . . . . . . . . . . . . . . . . . 31
Save Instrument Status . . . . . . . . . . . . . . . . . . . . . . . . . . . . . . . . . . . . . . . 31
Save Tracing Data in CSV File . . . . . . . . . . . . . . . . . . . . . . . . . . . . . . . . . . 31
CSV Flies Save . . . . . . . . . . . . . . . . . . . . . . . . . . . . . . . . . . . . . . . . . . . . . . . 32
Tracing Data SIP File . . . . . . . . . . . . . . . . . . . . . . . . . . . . . . . . . . . . . . . . . 32
SIP File Save . . . . . . . . . . . . . . . . . . . . . . . . . . . . . . . . . . . . . . . . . . . . . . . . 32
Save the Data Path . . . . . . . . . . . . . . . . . . . . . . . . . . . . . . . . . . . . . . . . . 32
Option to save the file dialog box in the SIP file format . . . . . . . . . . . 33
Screen Printing . . . . . . . . . . . . . . . . . . . . . . . . . . . . . . . . . . . . . . . . . . . . . . 33
Save Operation . . . . . . . . . . . . . . . . . . . . . . . . . . . . . . . . . . . . . . . . . . . . . . . . 33
Load Status Function . . . . . . . . . . . . . . . . . . . . . . . . . . . . . . . . . . . . . . . . . 33
Data transfer function . . . . . . . . . . . . . . . . . . . . . . . . . . . . . . . . . . . . . . . . 34
Chapter 7 Maintenance. . . . . . . . . . . . . . . . . . . . . . . . . . . . . . . . . . . .35
Cleaning . . . . . . . . . . . . . . . . . . . . . . . . . . . . . . . . . . . . . . . . . . . . . . . . . . . . . . 35
Charging the Battery . . . . . . . . . . . . . . . . . . . . . . . . . . . . . . . . . . . . . . . . . . . . 35
Device Check . . . . . . . . . . . . . . . . . . . . . . . . . . . . . . . . . . . . . . . . . . . . . . . . . . 35
Storage . . . . . . . . . . . . . . . . . . . . . . . . . . . . . . . . . . . . . . . . . . . . . . . . . . . . . . . 35
Firmware Update . . . . . . . . . . . . . . . . . . . . . . . . . . . . . . . . . . . . . . . . . . . . . . . 36
Limited Warranty . . . . . . . . . . . . . . . . . . . . . . . . . . . . . . . . . . . . . . . . .41
x
Page 12

xi
Page 13
Chapter 1 Introduction
The SiteHawk SK-4000 Analyzer is a multifunction test instrument for use in
installation and maintenance of wireless systems. The current product frequency range is between 85MHz-4GHz.
Antenna systems are tested by using a SiteHawk Analyzer to measure match
conditions. Data points measured across a user-specified frequency band or distance range are graphed on a 1920 x 1080 pixel touch screen display area.
Safety considerations
CAUTION
Please do not open the instrument shell. The electronic equipment inside may
be damaged.
Common Abbreviations
DUT Device Under Test
IF Intermediate Frequency
CW Continuous Wave
SWR Standing Wave Ratio
1
Page 14

Items Supplied
Item Description
1 SiteHawk SK-4000 Analyzer
2 Hard Carry Case
3 AC Adapter
4 USB Interface Cable
5 Soft Carry Case
6 RF Cable, 1 meter long
7 USB Drive
8 Instruction Manual
Optional Accessories
Item Description
1 Calibration Combination (Cal Combo).
2 N-type, Male to 7/16 DIN, Female adapter
3 External Battery Pack
2
Page 15

SiteHawk SK-4000 Analyzer Specifications
Frequency Range 85 MHz to 4 GHz
Frequency Accuracy ±2.5 ppm
Frequency Resolution Setting 1kHz
Output Power -10dBm
Reflected Amplitude Accuracy
–15 dB — 0 dB
–25 dB — –15 dB
–35 dB — –25 dB
Trace Noise Amplitude (IFBW 1kHz) 0.02 dB rms
Single Point Measure Time 0.25 ms
Data Points 51 to 3201
Measure Bandwidth 100Hz to 30kHz
Temperature Stability 0.01 dB/°F
Return Loss Measurement Range
Resolution
VSWR Measurement Range
Resolution
Cable Loss Measurement Range
Resolution
DTF Range 0 to 5000 ft.
Test Port Connector
Impedance
Connector Micro USB B, USB 2.0
Dimensions (L× W × H) 7.16x3.74x1.83 in.
Weight 1.89 lbs.
Maximum Input Power +23 dBm
Maximum Input Voltage 50V
Operating Temperature 14° to 131° F
Storage Temperature -40° to 176° F
Battery Charging Temperature 32° to 95° F
Altitude Up to 5000 ft.
±0.4 dB
±1.5 dB
±4.0 dB
0.02 dB/°C
0 dB to - 60 dB
0.01 dB
1.0 to 65.0
0.01
0 dB to 30 dB
0.01 dB
0 to 1500 m.
N-type, Female
50 ohms
182 x 95 x 46.5 mm
0.9kg
–10° to +55° C
–40° to +80° C
0 to +35° C
Up to 1500 m
3
Page 16

Humidity 95±5° max
(non-condensing)
Pressure 84 to 106.7 kPa
Warm-Up Time 15 minutes
Power Measurement No
Compatible Devices None
Storage Capacity 16 GB
Immunity to Interfering Signals +13 dBm
CE CE compliant. EMC,
Safety, and RoHS
Battery 4 hours continuous use
Battery Charge Time 5 Hrs for Full Charge
4
Page 17
Measurement Capability
Fast measurement speed.
Seven user-selectable trace capture options: 51,101,201,401,801,1601
or 3201 data points per sweep.
Adjustable pass/fail limit with visual indicator.
16GB of internal flash memory for storing thousands of traces and setups.
X and Y scales and units are user adjustable.
Six markers, direct or difference measurement.
Measure relative to limit line or recalled trace.
Measurement hold to temporarily store a trace.
Frequency Start/Stop or Center/Span frequencies.
Return Loss [dB], Cable Loss [dB], SWR [ratio], DTF SWR [ratio] or DTF
Return Loss [dB].
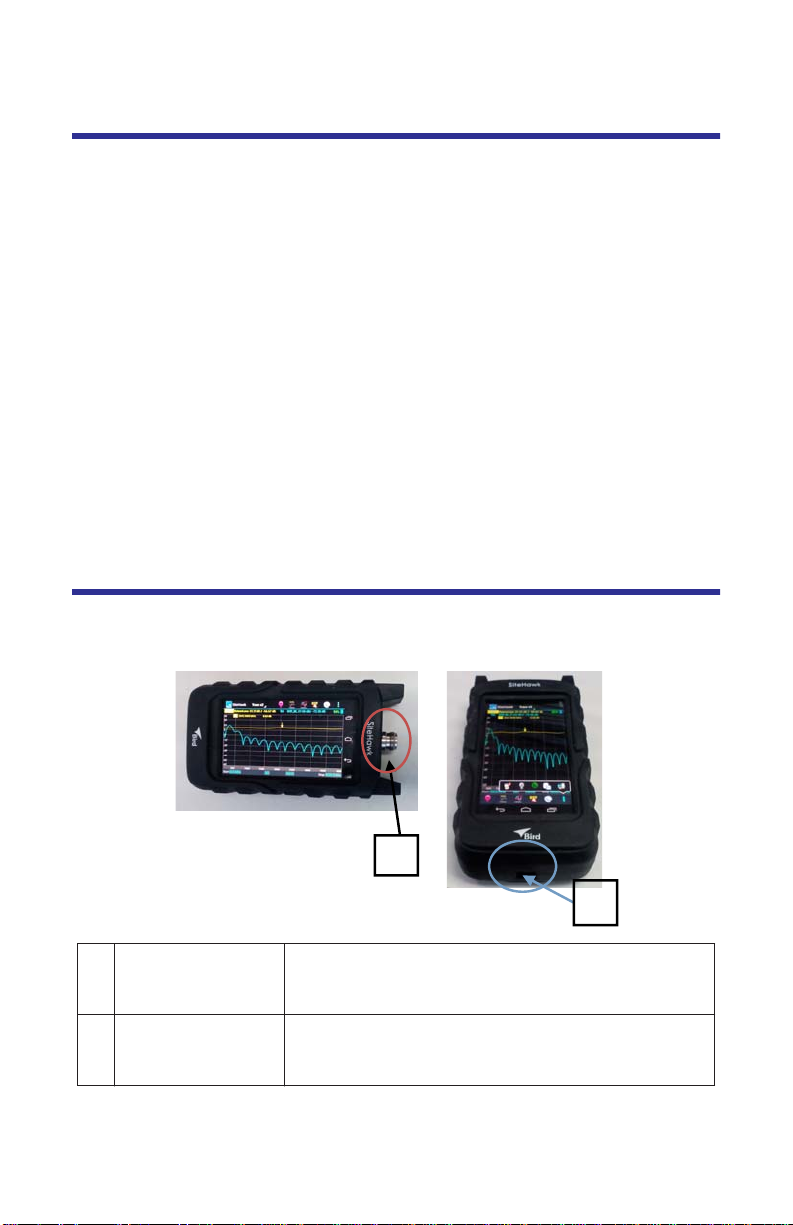
Connectors
Figure 1 Connector Diagram
1
2
1 Antenna Test Port Female N connector for connecting to the antenna.
Use a phase-stable cable for best results.
2 USB 2.0 B Type Micro USB device port for connection to a USB Disk
and battery charging.
5
Page 18

Power
The SiteHawk SK-4000 Analyzer has an internal, rechargeable, lithium-ion battery pack.
CAUTION
Only use the supplied AC adapter to charge the unit.
The unit cannot be charged from a standard USB port (i.e. from a laptop).
Charging from a standard USB port could damage the power source.
The unit will operate for a minimum of 4 hours of continuous usage.
Recharging time, from a full discharge, is approximately 5 hours.
Note: When the unit is received the battery may not be fully
charged. An AC adapter should be used when operating the unit for
the first time.
Powering On
1. Press Power Key for 5 seconds.
2. Release power key.
Note: Unit will complete power-up in approximately 30 secs.
Powering Off
1. Press Power Key for three seconds.
Note: Power off reboot airplane mode.
2. Select Power Off.
3. Press Ok.
Sleep Mode
Press and release Power key.
Note: The display screen will be shut down. The SiteHawk SK-4000
Analyzer will still be on.
Measurement Port
The measurement port is an 50 ohm N-type. This port is used to connect the
DUT.
6
Page 19

Chapter 2 Calibration
.
①
②②
③
④
⑤
⑥
⑦
Calibration
Calibrating the SiteHawk SK-4000 Analyzer
For best results, set the frequency and calibrate the Bird Site Analyzer immediately before taking measurements.
Note: Use a precision open, short, load (OSL) calibration standard or
"Calibration Combo" for accurate measurement results.
Note: When using an extension cable, a phase stable cable is needed
to ensure performance and accuracy.
1. Press the Calibrate icon.
2. Connect the Cal Combo “Open” connector to the unit antenna port.
3. Press the Open softkey.
4. Wait for the unit to sweep and a Green Check to display.
5. Connect the Cal Combo “Short” connector to the unit antenna port.
6. Press the Short softkey
7. Wait for the unit to sweep and a Green Check to display.
8. Connect the Cal Combo “Load” connector to the unit antenna port.
9. Press the Load softkey
10. Wait for the unit to sweep and a Green Check to display.
Note: During calibration, the color of the icon display is yellow.
Note: After calibration, the display will resemble Figure 4 on page 7
and the unit will be set to On.
Note: Changing the frequency settings will automatically turn cali-
bration off. Always set the frequency before calibrating the unit.
Figure 2 Calibration Display Screen
1 Calibration Display Screen
④
⑤
⑥
⑦
①
③
7
Page 20

8
Page 21

Chapter 3 Measure Match Mode
Match measurement verifies and monitors the match conditions in the antenna
system at various frequencies. The results are shown on an x-y graph. Frequency is shown on the x-axis and Return Loss, Cable Loss, or SWR is shown on
the y-axis.
Before making a Match Measurement, be sure to have a Calibration Combination (Cal Combo), all necessary cables with adapters of the correct size and connector type.
Selecting the Measure Match Mode and Units
1. Tap field to display drop down menu.
2. Select one of the following from the Measurement Mode drop down menu:
ReturnLoss
SWR
Cable Loss
Note: When making a match measurement, select units for the Y
(vertical) scale: SWR for standing wave ratio or Return Loss for dB.
Figure 3 Figure 3.1 Selecting the Measure Match Mode
9
Page 22

Setting the Measurement Frequency
Frequencies can be set manually. Frequency range should be greater than the
normal range of the antenna.
Example - For a 450 MHz antenna, set the start frequency at 400
and the stop frequency at 500 MHz, for an 800 MHz antenna, set
the start frequency at 700 and the stop frequency at 1,100 MHz.
Note: Changing the frequency settings will automatically turn cali-
bration off. Always set the frequency before calibrating the unit.
Note: If a frequency that is outside of the range of the Site Analyzer
is entered, the Site Analyzer will override the entry and set the minimum or maximum frequency of the model.
1. Select the Menu Icon.
2. Set the Frequency Span by entering the Start and Stop or Center Frequnecy
and Span.
3. Lightly tap the screen outside of the dropbox to close the menu.
Note: If Stop and Start frequencies are entered the unit will autocrat-
ically update the Center and Span frequency.
If Center or Span is entered the frequency setting will update automatically.
Figure 4 Setting a Custom Sweep Frequency
1
10
3
2
Page 23

Setting the Measurement Data Points
Select the number of data points to take during a measurement. There are seven
data point options:
51 points
101 points
201 points
401 points
801 points
1601 points
3201 points
Increasing the number of data points increases the measurable distance in distanceto-fault measurements and increases the detail in Measure Match mode measurements. When saving a trace, the number of data points collected are saved.
A progress bar, just below the x-axis, will indicate the progress of the sweep.
When the number of measurement data points are changed, the current trace
is erased and the Save softkey is disabled until the sweep finishes and the
screen displays the first new trace.
1. Select Point key in status bar
2. Open the selection list.
3. Select a data point option.
4. Press the Screen to exit.
Figure 5 Setting the Number of Measurement Data Points
1
Setting the Scale
1. Select Scale.
2. Press the Left Icon.
3. Select one of the following the the drop down menu:
For Manual Operation:
Press the TOP and BOTTOM key to enter a certain value
For Auto Scale:
Auto to choose a best scale
2
3
11
Page 24

Figure 6 Setting the Scale
Tracing Mode Setting
1. Press the Test Icon to choose the specific line.
Note: The active Tracing line will be highlighted.
2. Choose one or more of the following:
Max_Value Set
a. Double Click to Active.
b. Enter a maximum value.
Min_Value Set
a. Double Click to Active.
b. Enter a minimum value.
Tracing Count Setting
Note: SiteHawk has four trace lines.
a. Press the left Icon.
b. Choose a specific line.
Note: Every trace line has a independent name, which can’t be
changed.Trace Name include the number, like as:Tr1,Tr2,Tr3,Tr4.
Note: Every Trace has a default setting (appendix), such as: mea-
surement parameters, format, scale, color and so on, this parameter
can be reset by user.
12
Page 25

Figure 7 Tracing Setting Screen
Figure3.6 Tracing Setting Screen
Interpreting the Measurement
The graph below shows a typical Match Measurement for an antenna system.
Figure 8 Graph
The graph contains the following elements:
Trajectory of vertical axis vertical grid scale display activity data values.
Horizontal grid scale display incentive axis data values (frequency, time
or distance).
Baseline position on behalf of the reference trajectory position.
The measured value of the cursor on behalf of the activity on the tra-
jectory difference.
Track number is used to locate in a window.
When scanning duration of more than 1 second, the current incentive
position indicator will appear.
13
Page 26

Cable Loss Measurement
Figure 3.8 Set Up for Cable Loss Measurement
Ensure that the cable being tested is unterminated (not connected to anything
at the far end).
Note: Ensure that the cable does not have power greater than +23
dBm.
Note: Ensure the frequency band of the system is known.
Performing a Cable Loss Measurement
1. Press CableLoss.
Figure 9 Set Up for Cable Loss Measurement
1
2. Set the frequency start and stop to a range that is well beyond the normal
range of the antenna. "Setting the Measurement Frequency" on page 9.
Example - For a 450 MHz antenna, set the start frequency at 400
and the stop frequency at 500 MHz. For an 800 MHz antenna, set
the start frequency at 700 and the stop frequency at 1,100 MHz.
3. Connect a phase stable cable to the SiteHawk Analyzer antenna test port.
4. Connect a Cal Combo to the other end of the cable.
5. Calibrate the SiteHawk Analyzer. See “Calibration” on page 7.
6. Remove the Cal Combo unit from the cable.
7. Connect the phase stable cable to one end of the cable under test.
8. Connect the Short connection on the Cal Combo unit to the other end of
the cable being tested.
9. Wait at least 10 seconds to allow the trace to update.
10. Hold the trace on the screen. See “Trigger” on page 21.
14
Note: After Calibration, with the load still connected, the Output
must be below -25 dB. If not, there may be an issue.
Page 27

11. Place a marker (mark 1) at the minimum loss point within the frequency
band on the trace. See “Makers” on page 24.
12. Place a marker (mark 2) at the maximum loss point within the frequency
band on the trace. See “Makers” on page 24.
13. Save and label the trace, if appropriate. See “Save Operation” on page 33.
Interpreting a Cable Loss Measurement
The graph below shows a typical cable loss measurement. Note that the scale is
greatly reduced to show the cable’s variation across frequency.
Figure 10 Cable Loss Measurement Screen
Min. Loss
Max. Loss
1. Take the average of M1 and M2.
Note: This is the average cable loss across the frequency band.
2. Compare the loss with the manufacturer’s specified loss for a cable of this
length.
Note: If they do not correspond, retake the measurement, then
check the cable for problems.
15
Page 28

16
Page 29

Chapter 4 Fault Location Mode
Fault location identifies the position of impedance discontinuities (reflections)
within the antenna system. The measurement results are displayed on an x-y
graph. Distance from the SiteHawk Analyzer is shown on the x-axis, while relative magnitude of the discontinuity is shown on the y-axis.
Before making a fault location measurement, ensure that the following items
and information are present:
Calibration Combination (Cal Combo) calibration unit
All necessary cables and adapters of the correct size and connector type
The velocity of propagation for the cable type being measured (obtain
from the cable manufacturer)
Number of data points to use in making the distance to fault measure-
ment (user choice)
Selecting Fault Location Mode
1. Select Mode.
2. Select one of the following:
DTF_SWR
DTF_RL
Note: When making a Cable Loss measurement, select units for the Y
(vertical) scale: DTF_SWR for standing wave ratio or DTF_RL for return
loss in dB.
3. Select the number of Data Points.
Figure 11 DTF Mode Select
1
2
3
17
Page 30

Setting the Frequency Span and Max Distance
Frequency Span
Frequency span and the relative propagation rate determines the maximum distance testing fault location test. The following will introduce the related system
parameters set.
Narrowing the frequency span increases the measurable distance.
Note: Changing the frequency span or the max distance will auto-
matically turn calibration off. Always set the frequency span or max
distance before calibrating the unit.
Max Distance
When specifying a frequency span, the SiteHawk calculates the maximum measurable distance. If the maximum distance being measured is known, it can be
entered instead of the frequency span; the SiteHawk calculates the frequency
span. If a maximum distance is manually entered, select the data points before
entering the max distance
Note: If a maximum distance less than the total length of the cable
system is selected, the trace might show a spike that is not really a
fault, but rather an echo from the portion of the cable that is beyond
the maximum length. Such a spike is known as an alias. To avoid aliasing, always set the maximum distance to a value that is a few feet or
meters greater than the entire length of the cable system.
Data Points
Increasing the number of data points increases the measurable distance (475
points results in twice the distance of 238 points, and 949 points results in four
times the distance of 238 points). When changing the number of data points
measured, the software automatically recomputes the new maximum measurable distance. If a maximum distance is entered manually, be sure to select the
data points before entering the max distance. Changing data points does not
turn calibration off.
Note: Changing data points will turn calibration off.
18
Page 31

Setting the Frequency Span
D
T
1
------- -
F
N 1–
------------------------------ -==
F
–
maxFmin
Note: N = Test points
F
= Start frequency
min
F
= End frequency
TF
max
max
CVpT
---------------------------2
CVpN 1–
------------------------------------------ -==
2 F
–
maxFmin
The fuzzy distance be recalculated as the max distance for DTF test.
Note: C = Speed of light
Vp = Start frequency
Example - For a cable with a dielectric constant of 1, the velocity
percentage is 100% and 201 data points are chosen, then the SiteHawk Analyzer should be set to a frequency span of 0.1 MHz
(85MHz to 85.1MHz). The maximum distance of fault will be
299,792.458 meters.
1. Determine the frequency span.
2. Choose how many data points are to be measured.
3. Choose a velocity propagation percentage that is closest to the cable .
4. Press the 3-4-5-6 part on Fig4.2
5. Enter the Start value.
6. Press Enter.
7. Enter the Stop value.
8. Press Enter.
9. Enter the Point value.
10. Press Enter.
Figure 12 Setting the Frequency Span
Setting the Distance and Units
The trace can display the entire length (distance) of the cable system being
measured or a smaller portion of the length for better detail.
If it is suspected that there might be a fault at a known distance along a cable,
set the display to show only that area by using the start and stop points. Think of
this as zooming in on a section of the cable. Both the start point (where to begin
the trace display) and the stop point (where to end the trace display) can be set.
19
Page 32

Distance Unit
1. Select DTF.
2. Unit Select units settings.
Note: The system default unit m, optional units ns, ft.
Start Distance
1. Select the input box.
2. Set starting values.
End Distance
1. Select the input box.
2. Set ending values.
Windows
1. Select the Window.
2. Select the corresponding window style.
Note:
• Default is Normal
• Minimum case DTF displays a portion of the is a curve
• Displays the Maximum case is DTF the whole curve.
Velocity
1. Select Velocity.
2. Set speed value.
Cable Loss
1. Select CableLoss.
2. Set cable loss values.
Cable List
1. Select CableList.
2. Set cable type.
3. Select a certain cable type.
Note: Each type has the fixed valueDŽ
20
Page 33

Trigger
The Device has the following trigger modes:
Continuous - End the scan cycle channel after each occurrence, scan-
ning behavior
Keep - Stop Scanning.
Trigger mode
1. Select the right side of the menu bar.
2. Click the switch trigger set CONTINUE.
Test for Fault Location
1. Connect the SiteHawk Analyzer to the cable being tested.
Note: If the SiteHawk Analyzer is calibrated with a phase stable cable
connected to its antenna port, do not remove the cable. Connect it to
the cable to be tested.
2. Wait at least 10 seconds for the sweep to update.
3. When a trace is on the screen, do any of the following:
Hold the trace. See “Trigger” on page 21.
Add markers to the trace. See “Makers” on page 24.
Save the trace. See “Saving and Recalling Traces” on page 28.
21
Page 34

Interpreting the Fault Location Measurement
The graph below shows a typical Fault Location measurement for an antenna
system. The table lists typical component return losses.
Figure 13 Fault Location Measurement Screen
Typical Component Return Loss
Antenna at Resonance -14 dB
Connector -25 dB
Jumper -35 dB
Lightning Protector -25 dB
Transmission Line -30 dB
Each connector or jumper will show as a spike. If it is larger than the typical
value, check the connector for damage.
Spikes where there are no components represent faults. Note the distance and
check the line at that point for damage.
The largest spike is usually due to the antenna. Typically the trace after the
antenna can be ignored.
If a selected cable length that is less than the total length of the cable system,
the trace might show a spike that is not really a fault, but rather an echo from
the remaining portion of the cable that is beyond the length chosen. Such a
spike is known as an alias.
Note: To avoid aliasing, always set the measurement distance to a7
value that is a few feet or meters greater than the entire length of the
cable system.
A large spike (fault) near the SiteHawk Analyzer will mask other faults farther
away. When a large spike near the Site Analyzer is found, fix it and then repeat
the Fault Location measurement.
22
Page 35

Chapter 5 Additional Features
Limit Lines
The limit line helps to set off those parts of a trace that are outside of the acceptance (limit) values. It appears as a horizontal line at the limit line value.
An acceptance limit line can be set to help visualize what part of the measurement trace is not acceptable. The part of the trace that is not acceptable will display in red. To view the limit line, the limit test must be ON.
Note: This feature is available only in the Measure Match mode and
the Fault Location mode.
1. Press Limit icon.
2. Select Limit Options from the drop down menu.
Limit (On/Off)
Click to open or close the limit line.
23
Page 36

Style (Max/Min)
1. Enter setting limit line.
2. Set Max and Min.
Note: The default Max is the position of the limit line place at 10dB
part, Min type is the position of the limit line place at 10dB part.
Value
Sets where is the limit line is set to.
Step
Moves the limit line inclemently either up or down.
Move Up
Select to move limit line up.
Move Down
Select to move limit line down.
FailFlag (On/Off)
Will display a pass or fail.
FailAlarm (On/Off)
Sounds an audible alarm upon fail.
Figure 14 Setting a Limit Line
24
Page 37

Markers
Up to six markers can be used and activated to visually indicate the trace value
at specific frequency points. All markers follow the current trace only. The SiteHawk analyzer displays the frequency and signal value for each marker at the
bottom of the screen. Each marker is displayed as a triangle pointer or a vertical
line through the trace. The difference (delta) in frequency between two markers
can also be displayed. Markers indicate SWR to 0.01, and Return Loss or Cable
Loss to 0.1 dB.
When both a recalled trace and the current measurement trace are displayed at
the same time, there is an additional marker option, single mode and dual
mode.
In single mode, the markers function normally (indicating the frequency and
value at the marker).
In dual marker mode, select a marker using the Mark softkey.
At the bottom of the screen, the site analyzer will display the marker number,
the frequency, and the value of the current trace at the marker.
Note: The difference in frequency and value between the current
trace and the recalled trace is also displayed. The difference in frequency is always 0.00 (zero). Only the first three markers (M1, M2,
M3) are available in dual mode.
Activate Markers and Set Marker Style
1. Select Marker icon to open marker setting list.
2. Set any of the following parameters:
Adding a Marker
Press + to add a marker.
Delete
Delete a marker.
Position
Sets the position of an active marker.
Step
Moves the position of the marker left or right by the step entered.
Move Left/Move Right
Moves an active marker right or left by the step entered.
Search Max/Min
Search a maximum or minimum point along the trace line
3. Press the Screen to menu.
25
Page 38

Figure 15 Activate Marker and Set Style
(a)
(b)
Using Delta Markers
In the delta marker mode, only active markers will be visible. The delta marker
feature displays the difference (delta) in both frequency and value between the
selected marker and each active marker. If the limit line is active, the difference
between the selected marker and the limit line will be evident. The frequency
difference between the selected marker and the limit line will always be the frequency of the marker. All markers follow the current trace only.
Note: The Delta marker compares points only on one trace and must
have at least two active markers for the Delta Option to work.
1. Activate markers.
Note: In Figure 16, markers 1, 2, and 3 are active.
Figure 16 Activate Markers
26
Page 39

2. Highlight marker to be delta.
Note: In Figure XXX, marker 2 is highlighted.
Figure 17 Highlighted Markers
Note: Figure 18 shows Marker 2 highlighted and delta frequency
and amplitude between markers 1 and 2 and Markers 2 and 3.
Figure 18 Delta Markers
Add
Select Add.
Note: The new marker will be added as an active cursor on the display.
Delete
Select Delete to remove the marker.
27
Page 40

Setting the Position of a Cursor
:
1. Select to choose a specific cursor marker.
2. Enter the value the of the active marker.
Activation
1. Select the left Icon of a specific line.
2. Press a specific Delta Icon to active the marker.
The active marker is highlighted.
The inactive marker is empty.
Note: Users can press the Delta Icon to active the marker.
Limited Search
Note: Cursor marker search mode allowed to display these values:
Maximum
Minimum
1. Press the Left Icon.
2. Display The Second Menu.
Choose the Search Max or Search.
Min Key to find the Certain Value.
Figure 19 Limited Search
28
Page 41

Delta Marker Function
Delta Marker Function is used to calculate the frequency band. Activate it after
selecting the reference marker. Once the reference marker is selected, activate
the Delta marker as the figure below.
Move Delta function is used to move a marker to the next marker position.
Figure 20 Markers Station Calculate Function
1. Press the Left Icon.
2. Display The Second Menu.
Note: Before you activate Delta marker Function, you should select
the reference frequency first.
a. Delta marker default states is OFF.
b. Click Delta marker to turn the status to ON.
c. Click Move Delta key to move to select the next markers.
Saving and Recalling Traces
Traces and instrument setups can be saved and recalled from either the unit’s
internal memory or on an external USB thumb drive. The SiteHawk Analyzer
identifies saved files by a time-date stamp and a unique three digit number.
Filename Example
29
Page 42

Saving a Trace
1. Press the Menu icon.
2. Select the File icon.
Note: A Drop Down menu will appear.
3. Select the format of the saved file:
Data can be saved as a SIp or SIP file.
Data can be saved as a datafile (.csv).
Screenshots can be saved as .png or .jpeg.
4. Press Save.
Note: Unless a custom name is entered, a default filename will be
automatically generated. This file will be saved to the internal memory
of the unit.
Others
Instrument Default
The Instrument default key can be used to reset the device.
1. Press Default.
2. Press OK.
Exit
Exit application.
System Information
Software version
Hardware version and Device Serial Number
System>about
System Setting
Contains the following parameters:
Tracing line color setting
Font size setting
Line Width Setting
Check or cancel Full screen
Language Change
30
Page 43

Chapter 6 Data Save and Export
SiteHawk SK-4000 Status
SiteHawk SK-4000 status, calibration result, and tracing data can be saved to the
instrument, and can be recalled back to the SiteHawk program.
The parameters for this instrument setting include: scale, trace, cursor and analysis. These parameters are saved in the status files.
SiteHawk SK-4000 Status Save
Save Instrument Status
1. Click the icon on the right side.
2. Choose save type.
3. Choose the save file type.
4. Name the file.
5. Choose the save path.
6. Press the Icon.
Save Tracing Data in CSV File
SiteHawk can track data of single trace and then save the file as CSV file. The
CSV file contains a comma separated list of data. The current format and
response trajectory under the incentive value is stored in the CSV file.
Note: Only one way (activities) trajectory data is saved to a file.
Trajectory data is in the following format to the *.CSV file:
Note: F[n] = Frequency about point N.
Data1 = Trace response value, Real part
Data2 = 0,Imaginary part
31
Page 44

CSV Files Save
Save trace data, activating the trace first.
1. Select Save file.
2. Choose save type first.
3. Choose the save file type.
Tracing Data SIP File
SiteHawk S- can save the parameters to the S1p file. The SIP file contains the frequency value and S-parameter.
*.s1p files are used to store a single port parameter.
Only one path of data is saved to the file.
The file contains a comment, title and track data lines. Comment on"!" Mark the
start of the title, and began to "#" mark.
For single port measurement *.s1p file:
The Touchstone file contains the notes, the title and track data lines. Comment
on"!" Mark the start of the title, and began to "#" mark.
Note: Hz——frequency measurement unit (kHzǃ MHzǃ GHz) ˗
FMT—— Data Format˖
RI——Real part and Imaginary part
MA——Linear Amp and Phase
DB——Log Amp ˄dB˅ and Phase
Z0——reference impedance
F[n]——Frequency about point N.
{…}’—— {(RI) |(MA) |(DB)}
{…}”——{(RI) |(MA) |(DB)}
SIP File Save
Save the Data Path
1. Click Save SIP.
2. Choose a path.
3. Type the file name in the pop-up dialog box.
32
Page 45

Option to save the file dialog box in the SIP file format
1. Click the save SIP regional choice format required in the standard format list.
2. Click the finish.
Screen Printing
Printing the screen and save the picture as the PNG mode
Figure 21 PNG Picture and Saved position
ab
Save Operation
1. Save the current date.
2. Click on the Save Screen Picture.
3. Select the save file path.
Note: The default named "XXXXX.png", where "XXXXX" is the current
date and time.
Load Status Function
The user can recall sta or csv data display with the running data at the same
time.
1. Select Load status key.
2. Select the sta data to compare with the running data.
Note: Data compare looks like the follow figure, if you want to closed
the sta date.
3. Press the OFF key witch below the Tr1.
33
Page 46

Figure 22 Recall Sta Data and Running Data
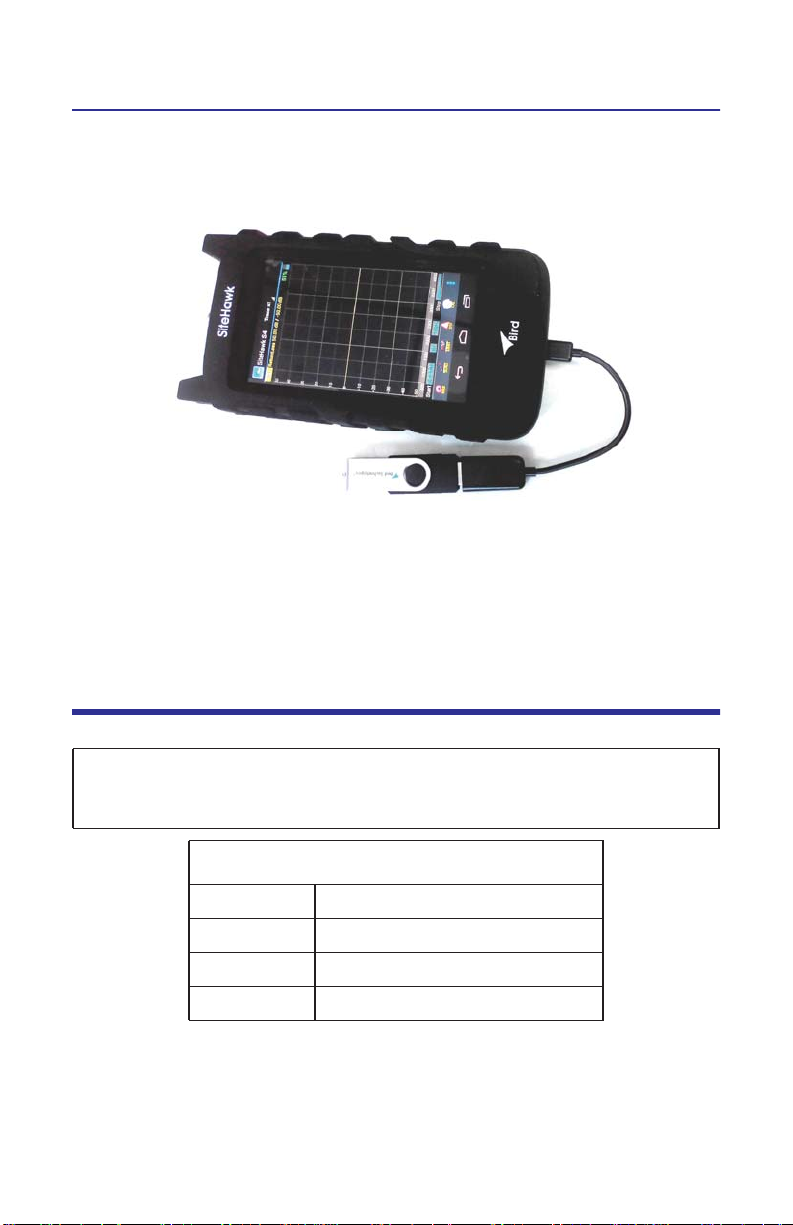
Data transfer function
User can transfer the data from SK-4000 to USB disk by a OTG cable (special,
supplied).
1. Connect the OTG cable and USB drive to the mini USB port at the bottom of
the unit.
2. Exit the SiteHawk application.
3. Select the File Manager icon on the unit’s home screen.
4. Select Phone Storage in the File Manager program.
5. Search for the file to be copied.
6. Press and hold the file for one second.
Note: A file menu will appear at the bottom of the screen.
34
Page 47

7. Select the Copy icon.
8. Go back out to the Home screen of the file manager.
9. Select External Storage.
10. Go to the directory where the file will be pasted.
11. Press the Paste icon to copy the file into the directory.
12. Exit the File Manager.
Figure 23 Data Transfer by USB Disk
35
Page 48

36
Page 49

Chapter 7 Maintenance
Cleaning
Clean the SiteHawk SK-4000 Analyzer only with a soft cloth dampened with mild
detergent and water. Do not use any other type of cleaning solution.
CAUTION
Do not touch the center pin with bare hands, water, or emery cloth.
Otherwise, damage may occur to the connectors surface.
Clean the connector using a cotton swab dipped into an isopropyl alco-
hol solution.
Before using connectors, to make sure that it is dry.
Before connected with the anode of coaxial connector calibrated the
wrench.
Charging the Battery
The internal battery pack will automatically recharge when the SiteHawk
Analyzer is plugged in.
CAUTION
Only use the supplied AC adapter to charge the unit.
The unit cannot be charged from a standard USB port (i.e. from a laptop).
Charging from a standard USB port could damage the power source.
Recharging time, from a full discharge, is approximately 5 hours.
Device Check
Instrument Calibration should only be performed by a certified service producers or authority.
It is recommended that an Instrument Calibration is done every three years.
Storage
Store the SiteHawk Analyzer in an enclosed case and in an environment that does not
exceed values listed in the Specifications section..
Ensure that the equipment stored away from dust, acidic and alkaline environment, explosive gas, and other causes of corrosion.
37
Page 50

Firmware Update
1. Go to www.birdrf.com/Products/Analyzers/Site-Hawk/SK-4000-TC-SiteHawk-Analyzer.aspx#.VCVqYUZ0zcs.
2. Click on the Firmware link.
3. Download the .apk update file.
4. Connect the USB dongle to the PC.
5. Transfer the .apk update file to the external USB drive.
6. Remove the USB dongle.
7. Connect the USB dongle to the USB cable.
8. Connect the USB cable to the SiteHawk Analyzer.
9. Turn on the SiteHawk Analyzer.
David S. Vineyard
Firmware Link
USB Dongle
10. Select “File Manager”.
11. Select “External USB storage”.
38
USB Cable
Page 51

12. Select SiteHawk.apk.
13. Install SiteHawk.apk in the unit.
39
Page 52

40
Page 53

Appendix
Description Default Setting Setting Range
Touchstone Data Format RI - Real-Imaginary SiteHawk
Allocation of Channels 1 SiteHawk
Active Channel Number 1 SiteHawk
Marker Value Identification
Capacity (Stimulus)
Marker Value Identification
Capacity (Response)
Vertical Divisions 10 Channel
Traces per Channel 1 Channel
Active Trace Number 1 Channel
Number of Sweep Points 201 q
Stimulus Start Frequency 85 MHz Channel
Stimulus Stop 4 GHz Channel
Frequency
Stimulus IF Bandwidth 1 kHz Channel
Sweep Range Setting Start / Stop Channel
Trigger Mode Continuous SiteHawk
Table of Calibration Coefficients Empty SiteHawk
Error Correction ON SiteHawk
Trace Scale 10 dB/division Trace
Reference Level Value 0 dB Trace
Reference Level Position 5 Div Trace
Phase Offset 0° Trace
Trace Display Format Return Loss (dB) Trace
Maximum Distance 1.49 m Trace
Time Domain Kaiser Window Normal Channel
Number of Markers 0 Trace
8 digits SiteHawk
5 digits SiteHawk
41
Page 54

42
Page 55

Limited Warranty
All products manufactured by Seller are warranted to be free from defects in
material and workmanship for a period of one year, unless otherwise specified,
from date of shipment and to conform to applicable specifications, drawings,
blueprints and/or samples. Seller’s sole obligation under these warranties shall
be to issue credit, repair or replace any item or part thereof which is proved to
be other than as warranted; no allowance shall be made for any labor charges of
Buyer for replacement of parts, adjustment or repairs, or any other work, unless
such charges are authorized in advance by Seller.
If Seller’s products are claimed to be defective in material or workmanship or
not to conform to specifications, drawings, blueprints and/or samples, Seller
shall, upon prompt notice thereof, either examine the products where they are
located or issue shipping instructions for return to Seller (transportationcharges prepaid by Buyer). In the event any of our products are proved to be
other than as warranted, transportation costs (cheapest way) to and from
Seller’s plant, will be borne by Seller and reimbursement or credit will be made
for amounts so expended by Buyer. Every such claim for breach of these warranties shall be deemed to be waived by Buyer unless made in writing within ten
days from the date of discovery of the defect.
The above warranties shall not extend to any products or parts thereof which
have been subjected to any misuse or neglect, damaged by accident, rendered
defective by reason of improper installation or by the performance of repairs or
alterations outside of our plant, and shall not apply to any goods or parts
thereof furnished by Buyer or acquired from others at Buyer’s request and/or to
Buyer’s specifications. Routine (regularly required) calibration is not covered
under this limited warranty. In addition, Seller’s warranties do not extend to the
failure of tubes, transistors, fuses and batteries, or to other equipment and
parts manufactured by others except to the extent of the original manufacturer’s warranty to Seller.
The obligations under the foregoing warranties are limited to the precise terms
thereof. These warranties provide exclusive remedies, expressly in lieu of all other
remedies including claims for special or consequential damages. SELLER NEITHER
MAKES NOR ASSUMES ANY OTHER WARRANTY WHATSOEVER, WHETHER
EXPRESS, STATUTORY, OR IMPLIED, INCLUDING WARRANTIES OF MERCHANTABILITY AND FITNESS, AND NO PERSON IS AUTHORIZED TO ASSUME FOR SELLER ANY
OBLIGATION OR LIABILITY NOT STRICTLY IN ACCORDANCE WITH THE FOREGOING.
41
Page 56

42
 Loading...