

Page 1

SignalHawk™
Model SH-36S, SH-361S,
SH-362, & SH-362S
OPERATING INSTRUCTIONS
©Copyright 2013 by Bird Electronic Corporation
Instruction Book Part Number 920-SH36-OPS Rev. E
SignalHawk is a trademark of Bird Electronic Corporation
ActiveSync, Microsoft, and Windows are registered trademarks
of the Microsoft Corporation
Page 2

16
Page 3

Safety Precautions
The following are general safety precautions that are not necessarily related to
any specific part or procedure, and do not necessarily appear elsewhere in this
publication. These precautions must be thoroughly understood and apply to all
phases of operation and maintenance.
WARNING
Keep Away From Live Circuits
Operating Personnel must at all times observe general safety precautions. Do
not replace components or make adjustments to the inside of the test
equipment with the high voltage supply turned on. To avoid casualties,
always remove power.
WARNING
Shock Hazard
Do not attempt to remove the RF transmission line while RF power is present.
WARNING
Do Not Service Or Adjust Alone
Under no circumstances should any person reach into an enclosure for the
purpose of service or adjustment of equipment except in the presence of
someone who is capable of rendering aid.
WARNING
Safety Earth Ground
An uninterruptible earth safety ground must be supplied from the main
power source to test instruments. Grounding one conductor of a two
conductor power cable is not sufficient protection. Serious injury or death
can occur if this grounding is not properly supplied.
WARNING
Resuscitation
Personnel working with or near high voltages should be familiar with modern
methods of resuscitation.
WARNING
Remove Power
Observe general safety precautions. Do not open the instrument with the
power on.
i
Page 4

Safety Symbols
WARNING
Warning notes call attention to a procedure, which if not correctly performed,
could result in personal injury.
CAUTION
Caution notes call attention to a procedure, which if not correctly performed,
could result in damage to the instrument.
Note: Calls attention to supplemental information.
Warning Statements
The following safety warnings appear in the text where there is danger to operating and maintenance personnel, and are repeated here for emphasis.
WARNING
When using the AC adapter, connect the AC plug only to a properly grounded
receptacle. Serious injury or death can occur if not properly grounded.
See page 8.
WARNING
Never attempt to connect or disconnect RF equipment from the transmission
line while RF power is being applied.
Leaking RF energy is a potential health hazard.
See page 115.
WARNING
Care should be taken when handling objects with built up static electricity.
Electrical shock may occur.
See page 131.
WARNING
Care should be taken when handling batteries.
Keep out of the reach of children.
Do not heat or dispose of batteries in fire. May burst or release toxic materials.
Avoid forced discharge.
Do not short circuit.
Restrict charging current and time to the recommended value.
Do not solder the battery directly.
Do not disassemble, apply excessive pressure, or deform.
Avoid placing the battery in reverse polarity.
Battery disposal method should be in accordance with local and state
regulations.
See page 134.
ii
Page 5

Caution Statements
The following equipment cautions appear in the text and are repeated here for
emphasis.
CAUTION
Airflow is essential for proper unit operation. Do not obstruct the unit or soft
case exhaust ports!
See page 9.
CAUTION
+20 dBm (100 mW) max. RF input for the Spectrum Analyzer and +22 dBm
(160 mW) max. RF input for the Vector Network Analyzer.
Exceeding the maximum input will damage the SignalHawk. If unsure of power
levels, measure the test connection with a power sensor before using the
SignalHawk.
See page 9 and 113.
CAUTION
Vector Network Analyzer has a +22 dBm (160 mW) max. RF input. Exceeding
the maximum input will damage the SignalHawk. If unsure of power levels,
measure the test connection with a power sensor before using the
SignalHawk.
See page 18.
CAUTION
Do not turn on a DC bias if the thru cable is attached from the VNA In to the VNA
Out. This will damage the VNA input and destroy the unit.
See page 18, 20 and 55.
CAUTION
Center conductor cabling should be discharged prior to connecting. See
“Discharging Static Electricity” on page 131 Any large electrostatic discharge or
high power RF applied directly to the RF input or output will cause internal
damage and void the warranty.
Power to any adjacent broadcast antennas should be shut down as well. If
adjacent antenna broadcasts cannot be terminated, then adding sufficient
external attenuation to the input of the instrument prior to connecting is
recommended. Failure to do so could result in irreparable damage to the
SignalHawk.
See page 18 and 21.
iii
Page 6

CAUTION
Spectrum Analyzer has a +20 dBm (100 mW) max. RF input.
Exceeding the maximum input will damage the SignalHawk. If unsure of power
levels, measure the test connection with a power sensor before using the
SignalHawk.
See page 21.
CAUTION
SignalHawk test ports are not used for power measurement. Always use an
external sensor!
See page 112.
CAUTION
Always turn off the SignalHawk before connecting or disconnecting a sensor.
See page 112.
CAUTION
Harsh or abrasive detergents, and some solvents, can damage the display unit
and labels.
See page 131.
iv
Page 7

Safety Statements
USAGE
ANY USE OF THIS INSTRUMENT IN A MANNER NOT
SPECIFIED BY THE MANUFACTURER MAY IMPAIR THE
INSTRUMENT’S SAFETY PROTECTION.
USO
EL USO DE ESTE INSTRUMENTO DE MANERA NO
ESPECIFICADA POR EL FABRICANTE, PUEDE ANULAR LA
PROTECCIÓN DE SEGURIDAD DEL INSTRUMENTO.
BENUTZUNG
WIRD DAS GERÄT AUF ANDERE WEISE VERWENDET ALS VOM
HERSTELLER BESCHRIEBEN, KANN DIE GERÄTESICHERHEIT
BEEINTRÄCHTIGT WERDEN.
UTILISATION
TOUTE UTILISATION DE CET INSTRUMENT QUI N’EST PAS
EXPLICITEMENT PRÉVUE PAR LE FABRICANT PEUT
ENDOMMAGER LE DISPOSITIF DE PROTECTION DE
L’INSTRUMENT.
IMPIEGO
QUALORA QUESTO STRUMENTO VENISSE UTILIZZATO IN
MODO DIVERSO DA COME SPECIFICATO DAL PRODUTTORE
LA PROZIONE DI SICUREZZA POTREBBE VENIRNE
COMPROMESSA.
v
Page 8

SERVICE
SERVICING INSTRUCTIONS ARE FOR USE BY SERVICE TRAINED PERSONNEL ONLY. TO AVOID DANGEROUS
ELECTRIC SHOCK, DO NOT PERFORM ANY SERVICING
UNLESS QUALIFIED TO DO SO.
SERVICIO
LAS INSTRUCCIONES DE SERVICIO SON PARA USO
EXCLUSIVO DEL PERSONAL DE SERVICIO CAPACITADO. PARA
EVITAR EL PELIGRO DE DESCARGAS ELÉCTRICAS, NO
REALICE NINGÚN SERVICIO A MENOS QUE ESTÉ
CAPACITADO PARA HACERIO.
WARTUNG
ANWEISUNGEN FÜR DIE WARTUNG DES GERÄTES GELTEN
NUR FÜR GESCHULTES FACHPERSONAL.
ZUR VERMEIDUNG GEFÄHRLICHE, ELEKTRISCHE SCHOCKS,
SIND WARTUNGSARBEITEN AUSSCHLIEßLICH VON
QUALIFIZIERTEM SERVICEPERSONAL DURCHZUFÜHREN.
ENTRENTIEN
L’EMPLOI DES INSTRUCTIONS D’ENTRETIEN DOIT ÊTRE
RÉSERVÉ AU PERSONNEL FORMÉ AUX OPÉRATIONS
D’ENTRETIEN. POUR PRÉVENIR UN CHOC ÉLECTRIQUE
DANGEREUX, NE PAS EFFECTUER D’ENTRETIEN SI L’ON N’A
PAS ÉTÉ QUALIFIÉ POUR CE FAIRE.
ASSISTENZA TECNICA
LE ISTRUZIONI RELATIVE ALL’ASSISTENZA SONO PREVISTE
ESCLUSIVAMENTE PER IL PERSONALE OPPORTUNAMENTE
ADDESTRATO. PER EVITARE PERICOLOSE SCOSSE
ELETTRICHE NON EFFETTUARRE ALCUNA RIPARAZIONE A
MENO CHE QUALIFICATI A FARLA.
vi
Page 9

UNITS ARE EQUIPPED WITH RECHAREABLE BATTERIES.
THESE ARE TO BE REPLACED BY AUTHORIZED SERVICE PERSONNEL ONLY!!!
LAS UNIDADES VIENEN EQUIPADAS CON BATERIAS
RECARGABLES.
¡¡¡Y SOLAMENTE EL PERSONAL DE SERVICIO AUTORIZADO
PUEDE REEMPLAZARLAS!!!
GERÄTE SIND MIT WIEDER AUFLADBAREN BATTERIEN
BESTÜCKT.
BATTERIEN SIND NUR VON QUALIFIZIERTEM SERICE
PERSONAL AUSZUWECHSELN!!!
CES DISPOSITIFS SONT ÉQUIPÉS DE BATTERIES
RECHARGEABLES.
SEUL LE PERSONNEL D’ENTRETIEN AUTORISÉ EST HABILITÉ
À LES REMPLACER!
LE UNITÀ SONO DOTATE DI BATTERIE RICARICABILI,
CHE DEVONO DA COME SPECIFICATO DAL PRODUTTORE LA
PROTEZIONE DI SICUREZZA POTREBBE VENIRNE
COMPROMESSA.
vii
Page 10

About This Manual
This manual covers the operating and maintenance instructions for the following models:
SH-36S SH-361S
SH-362 SH-362S
Changes to this Manual
We have made every effort to ensure this manual is accurate. If you discover
any errors, or if you have suggestions for improving this manual, please send
your comments to our Solon, Ohio factory. This manual may be periodically
updated. When inquiring about updates to this manual refer to the part number
and revision on the title page.
Literature Contents
Start-up Instructions
The Start-up Instructions contains minimum operational steps and the order
they should be performed. Use this manual for reference or if further explanation of any step is required.
Operations Manuals
Chapter Layout
Introduction — Describes the features of the Bird SignalHawk, lists equipment
supplied and optional equipment, and provides power-up instructions.
Vector Network Analysis Settings — Describes how to connect Signal-
Hawk to the user’s system, describes the vector network analyzer measurements, and provides quick start steps for each measurement.
Vector Network Analysis Measurements — Describes the power mea-
surement feature, lists compatible power sensors, describes how to connect
SignalHawk to the user’s system, and provides quick start steps to make power
measurements.
Spectrum Analyzer Settings — Describes how to connect SignalHawk to
the user’s system, describes the spectrum analyzer measurements, and provides quick start steps for each measurement.
viii
Page 11

Spectrum Analyzer Measurements — Describes the power measurement
feature, lists compatible power sensors, describes how to connect SignalHawk
to the user’s system, and provides quick start steps to make power measurements.
PC Tool — Describes how to use the SignalHawk’s PC Tool function and how
to transfer readings from the SignalHawk to the computer and back again.
Power Measurements — Describes the Menu key and Soft key functions for
setting up power measurements.
Utilities — Describes built-in instrument utility features and how to use them.
Maintenance — Lists routine maintenance tasks as well as troubleshooting
for common problems. Specifications and parts information are also included.
ix
Page 12

x
Page 13

Table of Contents
Safety Precautions. . . . . . . . . . . . . . . . . . . . . . . . . . . . . . . . . . . . . . . . . i
Safety Symbols . . . . . . . . . . . . . . . . . . . . . . . . . . . . . . . . . . . . . . . . . . . . . . . . . . ii
Warning Statements . . . . . . . . . . . . . . . . . . . . . . . . . . . . . . . . . . . . . . . . . . . . . ii
Caution Statements . . . . . . . . . . . . . . . . . . . . . . . . . . . . . . . . . . . . . . . . . . . . . . iii
Safety Statements . . . . . . . . . . . . . . . . . . . . . . . . . . . . . . . . . . . . . . . . . . . . . . . v
About This Manual . . . . . . . . . . . . . . . . . . . . . . . . . . . . . . . . . . . . . . . viii
Changes to this Manual . . . . . . . . . . . . . . . . . . . . . . . . . . . . . . . . . . . . . . . . . . viii
Literature Contents . . . . . . . . . . . . . . . . . . . . . . . . . . . . . . . . . . . . . . . . . . . . . viii
Start-up Instructions . . . . . . . . . . . . . . . . . . . . . . . . . . . . . . . . . . . . . . . . . viii
Operations Manuals . . . . . . . . . . . . . . . . . . . . . . . . . . . . . . . . . . . . . . . . . viii
Chapter Layout . . . . . . . . . . . . . . . . . . . . . . . . . . . . . . . . . . . . . . . . . . . . viii
Chapter 1 Introduction . . . . . . . . . . . . . . . . . . . . . . . . . . . . . . . . . . . . . 1
Items Supplied . . . . . . . . . . . . . . . . . . . . . . . . . . . . . . . . . . . . . . . . . . . . . . . . . . 2
Looking at the SignalHawk . . . . . . . . . . . . . . . . . . . . . . . . . . . . . . . . . . . . . . . . 3
Power Supply . . . . . . . . . . . . . . . . . . . . . . . . . . . . . . . . . . . . . . . . . . . . . . . . . . . 8
Internal Battery . . . . . . . . . . . . . . . . . . . . . . . . . . . . . . . . . . . . . . . . . . . . . . 8
Power Adapters . . . . . . . . . . . . . . . . . . . . . . . . . . . . . . . . . . . . . . . . . . . . . . 8
Getting Started with the SignalHawk . . . . . . . . . . . . . . . . . . . . . . . . . . . . . . . . 9
Start Menu, Menu Keys . . . . . . . . . . . . . . . . . . . . . . . . . . . . . . . . . . . . . . . 9
VN Analysis . . . . . . . . . . . . . . . . . . . . . . . . . . . . . . . . . . . . . . . . . . . . . . . . 9
Spec Analysis Menu Key . . . . . . . . . . . . . . . . . . . . . . . . . . . . . . . . . . . . . . 9
Power Meter Menu Key . . . . . . . . . . . . . . . . . . . . . . . . . . . . . . . . . . . . . . 9
Utilities Menu Key . . . . . . . . . . . . . . . . . . . . . . . . . . . . . . . . . . . . . . . . . . 9
Help Menu Key . . . . . . . . . . . . . . . . . . . . . . . . . . . . . . . . . . . . . . . . . . . . 10
VNA Help - . . . . . . . . . . . . . . . . . . . . . . . . . . . . . . . . . . . . . . . . . . . . . . 10
Spectrum Analyzer Help - . . . . . . . . . . . . . . . . . . . . . . . . . . . . . . . . . . 10
Power Meter Help - . . . . . . . . . . . . . . . . . . . . . . . . . . . . . . . . . . . . . . . 10
Custom Help - . . . . . . . . . . . . . . . . . . . . . . . . . . . . . . . . . . . . . . . . . . . 10
Back... - . . . . . . . . . . . . . . . . . . . . . . . . . . . . . . . . . . . . . . . . . . . . . . . . . 10
Setup Menu . . . . . . . . . . . . . . . . . . . . . . . . . . . . . . . . . . . . . . . . . . . . . . . . . . . 13
Quick Save Setup . . . . . . . . . . . . . . . . . . . . . . . . . . . . . . . . . . . . . . . . . . . . 13
Label & Save Setup . . . . . . . . . . . . . . . . . . . . . . . . . . . . . . . . . . . . . . . . . . 14
Recall Setup . . . . . . . . . . . . . . . . . . . . . . . . . . . . . . . . . . . . . . . . . . . . . . . . 14
Recall Default Setup . . . . . . . . . . . . . . . . . . . . . . . . . . . . . . . . . . . . . . . . . 14
Manage Setup Files . . . . . . . . . . . . . . . . . . . . . . . . . . . . . . . . . . . . . . . . . . 14
Copy Setup to USB Drive . . . . . . . . . . . . . . . . . . . . . . . . . . . . . . . . . . . . 15
Copy All Setups to USB Drive . . . . . . . . . . . . . . . . . . . . . . . . . . . . . . . . . 15
Copy Setup from USB Drive . . . . . . . . . . . . . . . . . . . . . . . . . . . . . . . . . . 15
Delete . . . . . . . . . . . . . . . . . . . . . . . . . . . . . . . . . . . . . . . . . . . . . . . . . . . 15
xi
Page 14

Bird Technologies
Delete All Setups . . . . . . . . . . . . . . . . . . . . . . . . . . . . . . . . . . . . . . . . . . . 15
View Setup . . . . . . . . . . . . . . . . . . . . . . . . . . . . . . . . . . . . . . . . . . . . . . . . . 16
Recall Setup . . . . . . . . . . . . . . . . . . . . . . . . . . . . . . . . . . . . . . . . . . . . . . . 16
Delete . . . . . . . . . . . . . . . . . . . . . . . . . . . . . . . . . . . . . . . . . . . . . . . . . . . 16
Top of the List . . . . . . . . . . . . . . . . . . . . . . . . . . . . . . . . . . . . . . . . . . . . . 16
Bottom of the List . . . . . . . . . . . . . . . . . . . . . . . . . . . . . . . . . . . . . . . . . . 16
View Next Setup . . . . . . . . . . . . . . . . . . . . . . . . . . . . . . . . . . . . . . . . . . . 16
View Previous Setup . . . . . . . . . . . . . . . . . . . . . . . . . . . . . . . . . . . . . . . . 16
Looking at the Screen . . . . . . . . . . . . . . . . . . . . . . . . . . . . . . . . . . . . . . . . . . . 17
Vector Network Analyzer Quick Start . . . . . . . . . . . . . . . . . . . . . . . . . . . . . . 18
Spectrum Analyzer Quick Start . . . . . . . . . . . . . . . . . . . . . . . . . . . . . . . . . . . . 21
Global Positioning System (GPS) . . . . . . . . . . . . . . . . . . . . . . . . . . . . . . . . . . 22
Adding Custom Locations . . . . . . . . . . . . . . . . . . . . . . . . . . . . . . . . . . . . . 22
Chapter 2 Vector Network Analyzer Settings . . . . . . . . . . . . . . . . . .23
Core Soft Key Functions . . . . . . . . . . . . . . . . . . . . . . . . . . . . . . . . . . . . . . . . . 23
Freq & Span Menu . . . . . . . . . . . . . . . . . . . . . . . . . . . . . . . . . . . . . . . . . . . . . . 24
Start / Stop Freq and Center / Span . . . . . . . . . . . . . . . . . . . . . . . . . . . . . 25
Wheel Step . . . . . . . . . . . . . . . . . . . . . . . . . . . . . . . . . . . . . . . . . . . . . . . . . 25
Full Span . . . . . . . . . . . . . . . . . . . . . . . . . . . . . . . . . . . . . . . . . . . . . . . . . . . 25
Freq List . . . . . . . . . . . . . . . . . . . . . . . . . . . . . . . . . . . . . . . . . . . . . . . . . . . 25
Adding Custom Frequencies . . . . . . . . . . . . . . . . . . . . . . . . . . . . . . . . . 26
Calibrate Menu . . . . . . . . . . . . . . . . . . . . . . . . . . . . . . . . . . . . . . . . . . . . . . . . 27
Ampt & Trace Menu . . . . . . . . . . . . . . . . . . . . . . . . . . . . . . . . . . . . . . . . . . . . 29
Autoscale . . . . . . . . . . . . . . . . . . . . . . . . . . . . . . . . . . . . . . . . . . . . . . . . . . 29
Max Level . . . . . . . . . . . . . . . . . . . . . . . . . . . . . . . . . . . . . . . . . . . . . . . . . . 29
Min Level . . . . . . . . . . . . . . . . . . . . . . . . . . . . . . . . . . . . . . . . . . . . . . . . . . 29
Offset . . . . . . . . . . . . . . . . . . . . . . . . . . . . . . . . . . . . . . . . . . . . . . . . . . . . . 29
Units . . . . . . . . . . . . . . . . . . . . . . . . . . . . . . . . . . . . . . . . . . . . . . . . . . . . . . 30
VSWR . . . . . . . . . . . . . . . . . . . . . . . . . . . . . . . . . . . . . . . . . . . . . . . . . . . . 30
Return Loss . . . . . . . . . . . . . . . . . . . . . . . . . . . . . . . . . . . . . . . . . . . . . . . 30
rho . . . . . . . . . . . . . . . . . . . . . . . . . . . . . . . . . . . . . . . . . . . . . . . . . . . . . . 30
Match % . . . . . . . . . . . . . . . . . . . . . . . . . . . . . . . . . . . . . . . . . . . . . . . . . . 30
Reflection % . . . . . . . . . . . . . . . . . . . . . . . . . . . . . . . . . . . . . . . . . . . . . . 30
Pwr Out . . . . . . . . . . . . . . . . . . . . . . . . . . . . . . . . . . . . . . . . . . . . . . . . . . . . 30
Sweep . . . . . . . . . . . . . . . . . . . . . . . . . . . . . . . . . . . . . . . . . . . . . . . . . . . . . 30
Cont/Single . . . . . . . . . . . . . . . . . . . . . . . . . . . . . . . . . . . . . . . . . . . . . . . 30
Data Points . . . . . . . . . . . . . . . . . . . . . . . . . . . . . . . . . . . . . . . . . . . . . . . 30
Interference Immunity . . . . . . . . . . . . . . . . . . . . . . . . . . . . . . . . . . . . . . 31
IFBW . . . . . . . . . . . . . . . . . . . . . . . . . . . . . . . . . . . . . . . . . . . . . . . . . . . . 31
Trace . . . . . . . . . . . . . . . . . . . . . . . . . . . . . . . . . . . . . . . . . . . . . . . . . . . . . . 31
Clear Write . . . . . . . . . . . . . . . . . . . . . . . . . . . . . . . . . . . . . . . . . . . . . . . 31
Max Hold . . . . . . . . . . . . . . . . . . . . . . . . . . . . . . . . . . . . . . . . . . . . . . . . . 31
Average . . . . . . . . . . . . . . . . . . . . . . . . . . . . . . . . . . . . . . . . . . . . . . . . . . 31
xii
Page 15

Average Readings . . . . . . . . . . . . . . . . . . . . . . . . . . . . . . . . . . . . . . . . . . 31
Reset Average . . . . . . . . . . . . . . . . . . . . . . . . . . . . . . . . . . . . . . . . . . . . . 31
Water Fall . . . . . . . . . . . . . . . . . . . . . . . . . . . . . . . . . . . . . . . . . . . . . . . . 32
Mark & Limit Menu . . . . . . . . . . . . . . . . . . . . . . . . . . . . . . . . . . . . . . . . . . . . . 33
Select Marker . . . . . . . . . . . . . . . . . . . . . . . . . . . . . . . . . . . . . . . . . . . . . . . 33
Marker On / Off . . . . . . . . . . . . . . . . . . . . . . . . . . . . . . . . . . . . . . . . . . . . . 33
Marker to Max Peak . . . . . . . . . . . . . . . . . . . . . . . . . . . . . . . . . . . . . . . . . 33
Markers to Peak/Valley . . . . . . . . . . . . . . . . . . . . . . . . . . . . . . . . . . . . . . . 33
Markers Detect . . . . . . . . . . . . . . . . . . . . . . . . . . . . . . . . . . . . . . . . . . . . 33
Threshold Offset . . . . . . . . . . . . . . . . . . . . . . . . . . . . . . . . . . . . . . . . . . . 34
Marker to Max Peak or Marker to Min Valley . . . . . . . . . . . . . . . . . . . 34
Marker to Next Peak Left or Marker to Next Valley Left . . . . . . . . . . . 34
Marker to Next Peak Right or Marker to Next Valley Right . . . . . . . . 34
All Markers to Max Peaks or All Markers to Min Valleys . . . . . . . . . . 34
All Markers Off . . . . . . . . . . . . . . . . . . . . . . . . . . . . . . . . . . . . . . . . . . . . 34
Marker Delta . . . . . . . . . . . . . . . . . . . . . . . . . . . . . . . . . . . . . . . . . . . . . . . 34
Marker Display . . . . . . . . . . . . . . . . . . . . . . . . . . . . . . . . . . . . . . . . . . . . . . 34
Marker Type . . . . . . . . . . . . . . . . . . . . . . . . . . . . . . . . . . . . . . . . . . . . . . 34
All Markers Type to Icon . . . . . . . . . . . . . . . . . . . . . . . . . . . . . . . . . . . . 34
All Markers Type to Line . . . . . . . . . . . . . . . . . . . . . . . . . . . . . . . . . . . . 34
Marker Display . . . . . . . . . . . . . . . . . . . . . . . . . . . . . . . . . . . . . . . . . . . . 34
Marker More . . . . . . . . . . . . . . . . . . . . . . . . . . . . . . . . . . . . . . . . . . . . . . . 35
RSSI (Received Signal Strength Indicator) . . . . . . . . . . . . . . . . . . . . . . . 35
Volume . . . . . . . . . . . . . . . . . . . . . . . . . . . . . . . . . . . . . . . . . . . . . . . . . . 35
Marker Freq to Center . . . . . . . . . . . . . . . . . . . . . . . . . . . . . . . . . . . . . . 35
Limit Lines . . . . . . . . . . . . . . . . . . . . . . . . . . . . . . . . . . . . . . . . . . . . . . . . . 35
Limit Upper/Lower . . . . . . . . . . . . . . . . . . . . . . . . . . . . . . . . . . . . . . . . . 35
Limit On/Off . . . . . . . . . . . . . . . . . . . . . . . . . . . . . . . . . . . . . . . . . . . . . . 35
Limit Alarm On/Off . . . . . . . . . . . . . . . . . . . . . . . . . . . . . . . . . . . . . . . . . 35
File & Help Menu . . . . . . . . . . . . . . . . . . . . . . . . . . . . . . . . . . . . . . . . . . . . . . . 36
Quick Save . . . . . . . . . . . . . . . . . . . . . . . . . . . . . . . . . . . . . . . . . . . . . . . . . 36
Label & Save Trace . . . . . . . . . . . . . . . . . . . . . . . . . . . . . . . . . . . . . . . . . . 37
Log Traces . . . . . . . . . . . . . . . . . . . . . . . . . . . . . . . . . . . . . . . . . . . . . . . . . . 37
Recall Trace . . . . . . . . . . . . . . . . . . . . . . . . . . . . . . . . . . . . . . . . . . . . . . . . 37
Recall Trace . . . . . . . . . . . . . . . . . . . . . . . . . . . . . . . . . . . . . . . . . . . . . . . 37
Recall & Compare . . . . . . . . . . . . . . . . . . . . . . . . . . . . . . . . . . . . . . . . . . 37
Clear Recalled Trace . . . . . . . . . . . . . . . . . . . . . . . . . . . . . . . . . . . . . . . . 37
Manage Trace Files . . . . . . . . . . . . . . . . . . . . . . . . . . . . . . . . . . . . . . . . . . 38
Screen Image . . . . . . . . . . . . . . . . . . . . . . . . . . . . . . . . . . . . . . . . . . . . . . . 38
Quick Save Screen . . . . . . . . . . . . . . . . . . . . . . . . . . . . . . . . . . . . . . . . . 38
Full Screen . . . . . . . . . . . . . . . . . . . . . . . . . . . . . . . . . . . . . . . . . . . . . . . . 38
Print Screen Image . . . . . . . . . . . . . . . . . . . . . . . . . . . . . . . . . . . . . . . . . 38
Manage Image Files . . . . . . . . . . . . . . . . . . . . . . . . . . . . . . . . . . . . . . . . 39
xiii
Page 16

Bird Technologies
Copy Image to USB Drive - . . . . . . . . . . . . . . . . . . . . . . . . . . . . . . . . . 39
Copy All Images to USB Drive - . . . . . . . . . . . . . . . . . . . . . . . . . . . . . . 39
Copy Image from USB Drive - . . . . . . . . . . . . . . . . . . . . . . . . . . . . . . . 39
Top of List - . . . . . . . . . . . . . . . . . . . . . . . . . . . . . . . . . . . . . . . . . . . . . . 39
Bottom of List - . . . . . . . . . . . . . . . . . . . . . . . . . . . . . . . . . . . . . . . . . . 39
Delete Trace - . . . . . . . . . . . . . . . . . . . . . . . . . . . . . . . . . . . . . . . . . . . . 39
Delete All Traces - . . . . . . . . . . . . . . . . . . . . . . . . . . . . . . . . . . . . . . . . 39
Utility . . . . . . . . . . . . . . . . . . . . . . . . . . . . . . . . . . . . . . . . . . . . . . . . . . . . . 39
Help . . . . . . . . . . . . . . . . . . . . . . . . . . . . . . . . . . . . . . . . . . . . . . . . . . . . . . . 39
Chapter 3 Vector Network Analyzer Measurements . . . . . . . . . . . .41
Match Measurement . . . . . . . . . . . . . . . . . . . . . . . . . . . . . . . . . . . . . . . . . . . . 42
Equations . . . . . . . . . . . . . . . . . . . . . . . . . . . . . . . . . . . . . . . . . . . . . . . . . . 42
VSWR . . . . . . . . . . . . . . . . . . . . . . . . . . . . . . . . . . . . . . . . . . . . . . . . . . . . 42
Return Loss . . . . . . . . . . . . . . . . . . . . . . . . . . . . . . . . . . . . . . . . . . . . . . . 42
Reflection Coefficient . . . . . . . . . . . . . . . . . . . . . . . . . . . . . . . . . . . . . . . 42
Match efficiency % . . . . . . . . . . . . . . . . . . . . . . . . . . . . . . . . . . . . . . . . . 42
Reflection % . . . . . . . . . . . . . . . . . . . . . . . . . . . . . . . . . . . . . . . . . . . . . . 42
Distance to Fault (DTF) Measurement . . . . . . . . . . . . . . . . . . . . . . . . . . . . . . 46
Start Distance . . . . . . . . . . . . . . . . . . . . . . . . . . . . . . . . . . . . . . . . . . . . . . . 47
Stop Distance . . . . . . . . . . . . . . . . . . . . . . . . . . . . . . . . . . . . . . . . . . . . . . . 48
Data Points . . . . . . . . . . . . . . . . . . . . . . . . . . . . . . . . . . . . . . . . . . . . . . . . . 48
Distance Units . . . . . . . . . . . . . . . . . . . . . . . . . . . . . . . . . . . . . . . . . . . . . . 48
Cable . . . . . . . . . . . . . . . . . . . . . . . . . . . . . . . . . . . . . . . . . . . . . . . . . . . . . . 48
Cable List . . . . . . . . . . . . . . . . . . . . . . . . . . . . . . . . . . . . . . . . . . . . . . . . . 49
Velocity . . . . . . . . . . . . . . . . . . . . . . . . . . . . . . . . . . . . . . . . . . . . . . . . . . 49
Loss . . . . . . . . . . . . . . . . . . . . . . . . . . . . . . . . . . . . . . . . . . . . . . . . . . . . . 50
Smooth . . . . . . . . . . . . . . . . . . . . . . . . . . . . . . . . . . . . . . . . . . . . . . . . . . . . 50
DTF Wizard . . . . . . . . . . . . . . . . . . . . . . . . . . . . . . . . . . . . . . . . . . . . . . . . . 51
Vp (Velocity) . . . . . . . . . . . . . . . . . . . . . . . . . . . . . . . . . . . . . . . . . . . . . . 51
Loss . . . . . . . . . . . . . . . . . . . . . . . . . . . . . . . . . . . . . . . . . . . . . . . . . . . . . 52
Estimated Cable . . . . . . . . . . . . . . . . . . . . . . . . . . . . . . . . . . . . . . . . . . . 52
Center Frequency . . . . . . . . . . . . . . . . . . . . . . . . . . . . . . . . . . . . . . . . . . 53
Preferred Resolution . . . . . . . . . . . . . . . . . . . . . . . . . . . . . . . . . . . . . . . 53
Cable Loss (1 Port) Measurement . . . . . . . . . . . . . . . . . . . . . . . . . . . . . . . . . 54
Gain & Loss (2 Port) Measurement . . . . . . . . . . . . . . . . . . . . . . . . . . . . . . . . 55
Bias Tee Voltage . . . . . . . . . . . . . . . . . . . . . . . . . . . . . . . . . . . . . . . . . . . . 55
Bias Tee . . . . . . . . . . . . . . . . . . . . . . . . . . . . . . . . . . . . . . . . . . . . . . . . . . . 55
Chapter 4 Spectrum Analyzer Settings. . . . . . . . . . . . . . . . . . . . . . .57
Core Soft Key Functions . . . . . . . . . . . . . . . . . . . . . . . . . . . . . . . . . . . . . . . . . 57
Freq & Span Menu . . . . . . . . . . . . . . . . . . . . . . . . . . . . . . . . . . . . . . . . . . . . . . 58
Start / Stop Freq and Center / Span . . . . . . . . . . . . . . . . . . . . . . . . . . . . . 59
Wheel Step . . . . . . . . . . . . . . . . . . . . . . . . . . . . . . . . . . . . . . . . . . . . . . . . . 59
xiv
Page 17

Full Span . . . . . . . . . . . . . . . . . . . . . . . . . . . . . . . . . . . . . . . . . . . . . . . . . . . 59
Freq List . . . . . . . . . . . . . . . . . . . . . . . . . . . . . . . . . . . . . . . . . . . . . . . . . . . 59
Adding Custom Frequencies . . . . . . . . . . . . . . . . . . . . . . . . . . . . . . . . . 60
BW & Sweep Menu . . . . . . . . . . . . . . . . . . . . . . . . . . . . . . . . . . . . . . . . . . . . . 61
Resolution BW Mode . . . . . . . . . . . . . . . . . . . . . . . . . . . . . . . . . . . . . . . . 62
Resolution BW . . . . . . . . . . . . . . . . . . . . . . . . . . . . . . . . . . . . . . . . . . . . . . 62
Video BW Mode . . . . . . . . . . . . . . . . . . . . . . . . . . . . . . . . . . . . . . . . . . . . . 62
Video BW . . . . . . . . . . . . . . . . . . . . . . . . . . . . . . . . . . . . . . . . . . . . . . . . . . 63
Span/RBW . . . . . . . . . . . . . . . . . . . . . . . . . . . . . . . . . . . . . . . . . . . . . . . . . 63
RBW / VBW . . . . . . . . . . . . . . . . . . . . . . . . . . . . . . . . . . . . . . . . . . . . . . . . 63
Detection Mode . . . . . . . . . . . . . . . . . . . . . . . . . . . . . . . . . . . . . . . . . . . . . 64
+ Peak Detection . . . . . . . . . . . . . . . . . . . . . . . . . . . . . . . . . . . . . . . . . . . 64
- Peak Detection . . . . . . . . . . . . . . . . . . . . . . . . . . . . . . . . . . . . . . . . . . . 64
Sample Detection . . . . . . . . . . . . . . . . . . . . . . . . . . . . . . . . . . . . . . . . . . 64
Average Power . . . . . . . . . . . . . . . . . . . . . . . . . . . . . . . . . . . . . . . . . . . . 64
Sweep More . . . . . . . . . . . . . . . . . . . . . . . . . . . . . . . . . . . . . . . . . . . . . . . . 65
Continuous . . . . . . . . . . . . . . . . . . . . . . . . . . . . . . . . . . . . . . . . . . . . . . . 65
Free Rep - . . . . . . . . . . . . . . . . . . . . . . . . . . . . . . . . . . . . . . . . . . . . . . . 65
Single . . . . . . . . . . . . . . . . . . . . . . . . . . . . . . . . . . . . . . . . . . . . . . . . . . . . 66
Trigger - . . . . . . . . . . . . . . . . . . . . . . . . . . . . . . . . . . . . . . . . . . . . . . . . . 66
Arm Trigger - . . . . . . . . . . . . . . . . . . . . . . . . . . . . . . . . . . . . . . . . . . . . 66
External Trigger . . . . . . . . . . . . . . . . . . . . . . . . . . . . . . . . . . . . . . . . . . . . . 66
External - Low Level / High Level /
Rise Edge / Fall Edge / Either Edge . . . . . . . . . . . . . . . . . . . . . . . . . . . . 66
Gate Delay . . . . . . . . . . . . . . . . . . . . . . . . . . . . . . . . . . . . . . . . . . . . . . . . 66
Video . . . . . . . . . . . . . . . . . . . . . . . . . . . . . . . . . . . . . . . . . . . . . . . . . . . . . . 68
External - Low Level / High Level /
Rise Edge / Fall Edge / Either Edge . . . . . . . . . . . . . . . . . . . . . . . . . . . . 69
Gate Delay . . . . . . . . . . . . . . . . . . . . . . . . . . . . . . . . . . . . . . . . . . . . . . . . 69
Ampt & Trace Menu . . . . . . . . . . . . . . . . . . . . . . . . . . . . . . . . . . . . . . . . . . . . 70
Autoscale . . . . . . . . . . . . . . . . . . . . . . . . . . . . . . . . . . . . . . . . . . . . . . . . . . 70
Reference . . . . . . . . . . . . . . . . . . . . . . . . . . . . . . . . . . . . . . . . . . . . . . . . . . 70
Scale . . . . . . . . . . . . . . . . . . . . . . . . . . . . . . . . . . . . . . . . . . . . . . . . . . . . . . 70
Attenuation . . . . . . . . . . . . . . . . . . . . . . . . . . . . . . . . . . . . . . . . . . . . . . . . 70
Preamp . . . . . . . . . . . . . . . . . . . . . . . . . . . . . . . . . . . . . . . . . . . . . . . . . . . . 71
Offset . . . . . . . . . . . . . . . . . . . . . . . . . . . . . . . . . . . . . . . . . . . . . . . . . . . . . 71
Units . . . . . . . . . . . . . . . . . . . . . . . . . . . . . . . . . . . . . . . . . . . . . . . . . . . . . . 71
Trace . . . . . . . . . . . . . . . . . . . . . . . . . . . . . . . . . . . . . . . . . . . . . . . . . . . . . . 72
Clear Write . . . . . . . . . . . . . . . . . . . . . . . . . . . . . . . . . . . . . . . . . . . . . . . 72
Max Hold . . . . . . . . . . . . . . . . . . . . . . . . . . . . . . . . . . . . . . . . . . . . . . . . . 72
Min Hold . . . . . . . . . . . . . . . . . . . . . . . . . . . . . . . . . . . . . . . . . . . . . . . . . 72
Average . . . . . . . . . . . . . . . . . . . . . . . . . . . . . . . . . . . . . . . . . . . . . . . . . . 72
Average Readings . . . . . . . . . . . . . . . . . . . . . . . . . . . . . . . . . . . . . . . . . . 72
Reset Average . . . . . . . . . . . . . . . . . . . . . . . . . . . . . . . . . . . . . . . . . . . . . 72
xv
Page 18

Bird Technologies
Water Fall . . . . . . . . . . . . . . . . . . . . . . . . . . . . . . . . . . . . . . . . . . . . . . . . 72
Mark & Limit Menu . . . . . . . . . . . . . . . . . . . . . . . . . . . . . . . . . . . . . . . . . . . . . 73
Select Marker . . . . . . . . . . . . . . . . . . . . . . . . . . . . . . . . . . . . . . . . . . . . . . . 73
Marker On / Off . . . . . . . . . . . . . . . . . . . . . . . . . . . . . . . . . . . . . . . . . . . . . 73
Marker to Max Peak . . . . . . . . . . . . . . . . . . . . . . . . . . . . . . . . . . . . . . . . . 73
Markers to Peak/Valley . . . . . . . . . . . . . . . . . . . . . . . . . . . . . . . . . . . . . . . 73
Markers Detect . . . . . . . . . . . . . . . . . . . . . . . . . . . . . . . . . . . . . . . . . . . . 73
Threshold Offset . . . . . . . . . . . . . . . . . . . . . . . . . . . . . . . . . . . . . . . . . . . 73
Marker to Max Peak or Marker to Min Valley . . . . . . . . . . . . . . . . . . . 74
Marker to Next Peak Left or Marker to Next Valley Left . . . . . . . . . . . 74
Marker to Next Peak Right or Marker to Next Valley Right . . . . . . . . 74
All Markers to Max Peaks or All Markers to Min Valleys . . . . . . . . . . 74
All Markers Off . . . . . . . . . . . . . . . . . . . . . . . . . . . . . . . . . . . . . . . . . . . . 74
Marker Delta . . . . . . . . . . . . . . . . . . . . . . . . . . . . . . . . . . . . . . . . . . . . . . . 74
Marker Display . . . . . . . . . . . . . . . . . . . . . . . . . . . . . . . . . . . . . . . . . . . . . . 74
Marker Type . . . . . . . . . . . . . . . . . . . . . . . . . . . . . . . . . . . . . . . . . . . . . . 74
All Markers Type to Icon . . . . . . . . . . . . . . . . . . . . . . . . . . . . . . . . . . . . 74
All Markers Type to Line . . . . . . . . . . . . . . . . . . . . . . . . . . . . . . . . . . . . 74
Marker Display . . . . . . . . . . . . . . . . . . . . . . . . . . . . . . . . . . . . . . . . . . . . 74
Marker More . . . . . . . . . . . . . . . . . . . . . . . . . . . . . . . . . . . . . . . . . . . . . . . 74
RSSI (Received Signal Strength Indicator) . . . . . . . . . . . . . . . . . . . . . . . 75
Volume . . . . . . . . . . . . . . . . . . . . . . . . . . . . . . . . . . . . . . . . . . . . . . . . . . 75
Marker Freq to Center . . . . . . . . . . . . . . . . . . . . . . . . . . . . . . . . . . . . . . 75
Center Freq to Marker . . . . . . . . . . . . . . . . . . . . . . . . . . . . . . . . . . . . . . 75
Ref Level Ampt to Marker . . . . . . . . . . . . . . . . . . . . . . . . . . . . . . . . . . . 75
Frequency Counter . . . . . . . . . . . . . . . . . . . . . . . . . . . . . . . . . . . . . . . . . 75
Limit Lines . . . . . . . . . . . . . . . . . . . . . . . . . . . . . . . . . . . . . . . . . . . . . . . . . 75
Limit Upper/Lower . . . . . . . . . . . . . . . . . . . . . . . . . . . . . . . . . . . . . . . . . 75
Limit On/Off . . . . . . . . . . . . . . . . . . . . . . . . . . . . . . . . . . . . . . . . . . . . . . 75
Limit Alarm On/Off . . . . . . . . . . . . . . . . . . . . . . . . . . . . . . . . . . . . . . . . . 75
Select Line/Mask . . . . . . . . . . . . . . . . . . . . . . . . . . . . . . . . . . . . . . . . . . . 75
Freq Lock - . . . . . . . . . . . . . . . . . . . . . . . . . . . . . . . . . . . . . . . . . . . . . . 76
EM to Max Peak - . . . . . . . . . . . . . . . . . . . . . . . . . . . . . . . . . . . . . . . . . 76
File & Help Menu . . . . . . . . . . . . . . . . . . . . . . . . . . . . . . . . . . . . . . . . . . . . . . . 77
Quick Save . . . . . . . . . . . . . . . . . . . . . . . . . . . . . . . . . . . . . . . . . . . . . . . . . 77
Label & Save Trace . . . . . . . . . . . . . . . . . . . . . . . . . . . . . . . . . . . . . . . . . . 78
Log Traces . . . . . . . . . . . . . . . . . . . . . . . . . . . . . . . . . . . . . . . . . . . . . . . . . . 78
Recall Trace . . . . . . . . . . . . . . . . . . . . . . . . . . . . . . . . . . . . . . . . . . . . . . . . 78
Recall Trace . . . . . . . . . . . . . . . . . . . . . . . . . . . . . . . . . . . . . . . . . . . . . . . 78
Recall & Compare . . . . . . . . . . . . . . . . . . . . . . . . . . . . . . . . . . . . . . . . . . 78
Clear Recalled Trace . . . . . . . . . . . . . . . . . . . . . . . . . . . . . . . . . . . . . . . . 78
Manage Trace Files . . . . . . . . . . . . . . . . . . . . . . . . . . . . . . . . . . . . . . . . . . 79
Copy Trace to USB Drive . . . . . . . . . . . . . . . . . . . . . . . . . . . . . . . . . . . . 79
xvi
Page 19

Copy All Traces to USB Drive . . . . . . . . . . . . . . . . . . . . . . . . . . . . . . . . . 79
Copy Trace from USB Drive . . . . . . . . . . . . . . . . . . . . . . . . . . . . . . . . . . 79
Delete Trace . . . . . . . . . . . . . . . . . . . . . . . . . . . . . . . . . . . . . . . . . . . . . . 80
Delete All Traces . . . . . . . . . . . . . . . . . . . . . . . . . . . . . . . . . . . . . . . . . . . 80
Screen Image . . . . . . . . . . . . . . . . . . . . . . . . . . . . . . . . . . . . . . . . . . . . . . . 80
Quick Save Screen . . . . . . . . . . . . . . . . . . . . . . . . . . . . . . . . . . . . . . . . . 80
Full Screen . . . . . . . . . . . . . . . . . . . . . . . . . . . . . . . . . . . . . . . . . . . . . . . . 80
Print Screen Image . . . . . . . . . . . . . . . . . . . . . . . . . . . . . . . . . . . . . . . . . 80
Manage Image Files . . . . . . . . . . . . . . . . . . . . . . . . . . . . . . . . . . . . . . . . 81
Copy Image to USB Drive - . . . . . . . . . . . . . . . . . . . . . . . . . . . . . . . . . 81
Copy All Images to USB Drive - . . . . . . . . . . . . . . . . . . . . . . . . . . . . . . 81
Copy Image from USB Drive - . . . . . . . . . . . . . . . . . . . . . . . . . . . . . . . 81
Top of List - . . . . . . . . . . . . . . . . . . . . . . . . . . . . . . . . . . . . . . . . . . . . . . 81
Bottom of List - . . . . . . . . . . . . . . . . . . . . . . . . . . . . . . . . . . . . . . . . . . 81
Delete Trace - . . . . . . . . . . . . . . . . . . . . . . . . . . . . . . . . . . . . . . . . . . . . 81
Delete All Traces - . . . . . . . . . . . . . . . . . . . . . . . . . . . . . . . . . . . . . . . . 81
Utility . . . . . . . . . . . . . . . . . . . . . . . . . . . . . . . . . . . . . . . . . . . . . . . . . . . . . 81
Help . . . . . . . . . . . . . . . . . . . . . . . . . . . . . . . . . . . . . . . . . . . . . . . . . . . . . . . 81
Chapter 5 Spectrum Analyzer Measurements . . . . . . . . . . . . . . . . .83
Spectrum Analysis Measurement . . . . . . . . . . . . . . . . . . . . . . . . . . . . . . . . . 84
Occupied Bandwidth Measurement . . . . . . . . . . . . . . . . . . . . . . . . . . . . . . . 85
Threshold Modes . . . . . . . . . . . . . . . . . . . . . . . . . . . . . . . . . . . . . . . . . . . . 85
% . . . . . . . . . . . . . . . . . . . . . . . . . . . . . . . . . . . . . . . . . . . . . . . . . . . . . . . 85
dBc . . . . . . . . . . . . . . . . . . . . . . . . . . . . . . . . . . . . . . . . . . . . . . . . . . . . . . 85
Setting Occupied Bandwidth . . . . . . . . . . . . . . . . . . . . . . . . . . . . . . . . . . 85
Channel Power Measurement . . . . . . . . . . . . . . . . . . . . . . . . . . . . . . . . . . . . 87
Setting Channel Power . . . . . . . . . . . . . . . . . . . . . . . . . . . . . . . . . . . . . . . 87
Adjacent Channel Power Measurement . . . . . . . . . . . . . . . . . . . . . . . . . . . . 89
Time Domain (Zero Span) . . . . . . . . . . . . . . . . . . . . . . . . . . . . . . . . . . . . . . . . 91
Field Strength Measurement . . . . . . . . . . . . . . . . . . . . . . . . . . . . . . . . . . . . . 92
Received Signal Strength Indicator (RSSI) . . . . . . . . . . . . . . . . . . . . . . . . 92
Demodulate Signal . . . . . . . . . . . . . . . . . . . . . . . . . . . . . . . . . . . . . . . . . . . . . 93
Carrier-to-Interference Ratio . . . . . . . . . . . . . . . . . . . . . . . . . . . . . . . . . . . . . 94
Out-of-Band and In-Band, Out-of-Channel Spurious . . . . . . . . . . . . . . . . . . 96
Chapter 6 PC Tool . . . . . . . . . . . . . . . . . . . . . . . . . . . . . . . . . . . . . . . .97
Computer Requirements . . . . . . . . . . . . . . . . . . . . . . . . . . . . . . . . . . . . . . . . 97
Installing Windows 7 Drivers for the BTG Signal Hawk . . . . . . . . . . . . . 97
Downloading and Installing Software . . . . . . . . . . . . . . . . . . . . . . . . . . . . . 100
Installing the SignalHawk USB Drivers 1 . . . . . . . . . . . . . . . . . . . . . . . . . . 00
Installing the PC Tool Software . . . . . . . . . . . . . . . . . . . . . . . . . . . . . . . 101
Menu Bar . . . . . . . . . . . . . . . . . . . . . . . . . . . . . . . . . . . . . . . . . . . . . . . . . . . . 101
File . . . . . . . . . . . . . . . . . . . . . . . . . . . . . . . . . . . . . . . . . . . . . . . . . . . . . . . 101
xvii
Page 20

Bird Technologies
Edit . . . . . . . . . . . . . . . . . . . . . . . . . . . . . . . . . . . . . . . . . . . . . . . . . . . . . . 101
View . . . . . . . . . . . . . . . . . . . . . . . . . . . . . . . . . . . . . . . . . . . . . . . . . . . . . 101
Tools . . . . . . . . . . . . . . . . . . . . . . . . . . . . . . . . . . . . . . . . . . . . . . . . . . . . . 101
Measurements . . . . . . . . . . . . . . . . . . . . . . . . . . . . . . . . . . . . . . . . . . . . . 102
Communicate . . . . . . . . . . . . . . . . . . . . . . . . . . . . . . . . . . . . . . . . . . . . . . 102
Tool Bar . . . . . . . . . . . . . . . . . . . . . . . . . . . . . . . . . . . . . . . . . . . . . . . . . . . . . 102
Save . . . . . . . . . . . . . . . . . . . . . . . . . . . . . . . . . . . . . . . . . . . . . . . . . . . . . . 102
Open . . . . . . . . . . . . . . . . . . . . . . . . . . . . . . . . . . . . . . . . . . . . . . . . . . . . . 102
Cut . . . . . . . . . . . . . . . . . . . . . . . . . . . . . . . . . . . . . . . . . . . . . . . . . . . . . . . 103
Copy . . . . . . . . . . . . . . . . . . . . . . . . . . . . . . . . . . . . . . . . . . . . . . . . . . . . . 103
Paste . . . . . . . . . . . . . . . . . . . . . . . . . . . . . . . . . . . . . . . . . . . . . . . . . . . . . 103
Delete Trace . . . . . . . . . . . . . . . . . . . . . . . . . . . . . . . . . . . . . . . . . . . . . . . 103
Return to Normal Mode . . . . . . . . . . . . . . . . . . . . . . . . . . . . . . . . . . . . . 103
Zoom In . . . . . . . . . . . . . . . . . . . . . . . . . . . . . . . . . . . . . . . . . . . . . . . . . . . 103
Zoom Out . . . . . . . . . . . . . . . . . . . . . . . . . . . . . . . . . . . . . . . . . . . . . . . . . 103
Autoscale Graph . . . . . . . . . . . . . . . . . . . . . . . . . . . . . . . . . . . . . . . . . . . 103
Add Markers . . . . . . . . . . . . . . . . . . . . . . . . . . . . . . . . . . . . . . . . . . . . . . . 103
Add to Upper Limit Line . . . . . . . . . . . . . . . . . . . . . . . . . . . . . . . . . . . . . 103
Add to Lower Limit Line . . . . . . . . . . . . . . . . . . . . . . . . . . . . . . . . . . . . . 104
Delete Markers or Limit Lines . . . . . . . . . . . . . . . . . . . . . . . . . . . . . . . . . 104
Option Dialog Box . . . . . . . . . . . . . . . . . . . . . . . . . . . . . . . . . . . . . . . . . . 104
Measurement Types . . . . . . . . . . . . . . . . . . . . . . . . . . . . . . . . . . . . . . . . 104
VNA Tool Bar . . . . . . . . . . . . . . . . . . . . . . . . . . . . . . . . . . . . . . . . . . . . . . . . . 104
Match . . . . . . . . . . . . . . . . . . . . . . . . . . . . . . . . . . . . . . . . . . . . . . . . . . . . 104
Distance to Fault . . . . . . . . . . . . . . . . . . . . . . . . . . . . . . . . . . . . . . . . . . . 104
Cable . . . . . . . . . . . . . . . . . . . . . . . . . . . . . . . . . . . . . . . . . . . . . . . . . . . . . 105
Smith . . . . . . . . . . . . . . . . . . . . . . . . . . . . . . . . . . . . . . . . . . . . . . . . . . . . . 105
Options Dialog Box . . . . . . . . . . . . . . . . . . . . . . . . . . . . . . . . . . . . . . . . . 105
DTF Wizard . . . . . . . . . . . . . . . . . . . . . . . . . . . . . . . . . . . . . . . . . . . . . . . . 105
Options Dialog Box (View>Options) . . . . . . . . . . . . . . . . . . . . . . . . . . . . . . . 105
Scale Tab . . . . . . . . . . . . . . . . . . . . . . . . . . . . . . . . . . . . . . . . . . . . . . . . . . 105
Units Tab . . . . . . . . . . . . . . . . . . . . . . . . . . . . . . . . . . . . . . . . . . . . . . . . . 106
Markers Tab . . . . . . . . . . . . . . . . . . . . . . . . . . . . . . . . . . . . . . . . . . . . . . . 106
Limits 1 Tab . . . . . . . . . . . . . . . . . . . . . . . . . . . . . . . . . . . . . . . . . . . . . . . 107
Limits 2 Tab . . . . . . . . . . . . . . . . . . . . . . . . . . . . . . . . . . . . . . . . . . . . . . . 107
Labels Tab . . . . . . . . . . . . . . . . . . . . . . . . . . . . . . . . . . . . . . . . . . . . . . . . . 108
GPS . . . . . . . . . . . . . . . . . . . . . . . . . . . . . . . . . . . . . . . . . . . . . . . . . . . . . . . . . 109
Chapter 7 Power Measurements . . . . . . . . . . . . . . . . . . . . . . . . . . . 111
Quick Setup - Configure Sensor and Instrument . . . . . . . . . . . . . . . . . . . . . 112
Connecting a Sensor . . . . . . . . . . . . . . . . . . . . . . . . . . . . . . . . . . . . . . . . . . . 112
Looking at the Screen . . . . . . . . . . . . . . . . . . . . . . . . . . . . . . . . . . . . . . . . . . 114
Directional Power Sensor Measurements . . . . . . . . . . . . . . . . . . . . . . . . . . 115
Terminating Power Sensor Measurements . . . . . . . . . . . . . . . . . . . . . . . . . 115
xviii
Page 21

Wideband Power Sensor Measurements . . . . . . . . . . . . . . . . . . . . . . . . . . 115
Filter: Full - . . . . . . . . . . . . . . . . . . . . . . . . . . . . . . . . . . . . . . . . . . . . . 115
Duty Cycle - . . . . . . . . . . . . . . . . . . . . . . . . . . . . . . . . . . . . . . . . . . . . 116
Manual Duty Cycle - . . . . . . . . . . . . . . . . . . . . . . . . . . . . . . . . . . . . . 116
CCDF Limit (Complimentary
Cumulative Distribution Function) - . . . . . . . . . . . . . . . . . . . . . . . . . 116
Range Select - . . . . . . . . . . . . . . . . . . . . . . . . . . . . . . . . . . . . . . . . . . . 116
Menu Keys and Associated Soft Key Functions . . . . . . . . . . . . . . . . . . . . . . 116
Zero . . . . . . . . . . . . . . . . . . . . . . . . . . . . . . . . . . . . . . . . . . . . . . . . . . . . . . 116
Type . . . . . . . . . . . . . . . . . . . . . . . . . . . . . . . . . . . . . . . . . . . . . . . . . . . . . 116
Units . . . . . . . . . . . . . . . . . . . . . . . . . . . . . . . . . . . . . . . . . . . . . . . . . . . . . 118
Power: Watts . . . . . . . . . . . . . . . . . . . . . . . . . . . . . . . . . . . . . . . . . . . . 118
Power: dBm . . . . . . . . . . . . . . . . . . . . . . . . . . . . . . . . . . . . . . . . . . . . . . 118
Match: VSWR . . . . . . . . . . . . . . . . . . . . . . . . . . . . . . . . . . . . . . . . . . . . 118
Match: Return Loss dB . . . . . . . . . . . . . . . . . . . . . . . . . . . . . . . . . . . . . 118
Match: Rho . . . . . . . . . . . . . . . . . . . . . . . . . . . . . . . . . . . . . . . . . . . . . . 119
Match Efficiency % . . . . . . . . . . . . . . . . . . . . . . . . . . . . . . . . . . . . . . . . 119
Forward Average . . . . . . . . . . . . . . . . . . . . . . . . . . . . . . . . . . . . . . . . . 119
Reflected Average . . . . . . . . . . . . . . . . . . . . . . . . . . . . . . . . . . . . . . . . 119
Match . . . . . . . . . . . . . . . . . . . . . . . . . . . . . . . . . . . . . . . . . . . . . . . . . . 119
Forward Peak . . . . . . . . . . . . . . . . . . . . . . . . . . . . . . . . . . . . . . . . . . . . 119
Forward Burst . . . . . . . . . . . . . . . . . . . . . . . . . . . . . . . . . . . . . . . . . . . . 119
Crest Factor . . . . . . . . . . . . . . . . . . . . . . . . . . . . . . . . . . . . . . . . . . . . . . 119
CCDF (Complimentary Cumulative Distribution Function) . . . . . . . . 120
Configure . . . . . . . . . . . . . . . . . . . . . . . . . . . . . . . . . . . . . . . . . . . . . . . . . . . . 120
Quick Setup - Zero a Sensor . . . . . . . . . . . . . . . . . . . . . . . . . . . . . . . . . . 122
File & Help . . . . . . . . . . . . . . . . . . . . . . . . . . . . . . . . . . . . . . . . . . . . . . . . 122
Quick Save Data . . . . . . . . . . . . . . . . . . . . . . . . . . . . . . . . . . . . . . . . . . . . 123
Log: On / Off . . . . . . . . . . . . . . . . . . . . . . . . . . . . . . . . . . . . . . . . . . . . . . . 124
Chapter 8 Utilities . . . . . . . . . . . . . . . . . . . . . . . . . . . . . . . . . . . . . . . 125
Utilities . . . . . . . . . . . . . . . . . . . . . . . . . . . . . . . . . . . . . . . . . . . . . . . . . . . . . . 125
Utility Main Menu . . . . . . . . . . . . . . . . . . . . . . . . . . . . . . . . . . . . . . . . . . . . . 126
Version Info . . . . . . . . . . . . . . . . . . . . . . . . . . . . . . . . . . . . . . . . . . . . . . . 126
VNA Help . . . . . . . . . . . . . . . . . . . . . . . . . . . . . . . . . . . . . . . . . . . . . . . . . 126
Spectrum Analyzer Help . . . . . . . . . . . . . . . . . . . . . . . . . . . . . . . . . . . . . 126
Power Meter Help . . . . . . . . . . . . . . . . . . . . . . . . . . . . . . . . . . . . . . . . . . 126
Custom Help . . . . . . . . . . . . . . . . . . . . . . . . . . . . . . . . . . . . . . . . . . . . . . . 126
Installing Custom Help Files . . . . . . . . . . . . . . . . . . . . . . . . . . . . . . . . . 126
Date Time . . . . . . . . . . . . . . . . . . . . . . . . . . . . . . . . . . . . . . . . . . . . . . . . . 127
Select Language . . . . . . . . . . . . . . . . . . . . . . . . . . . . . . . . . . . . . . . . . . . . 127
Backlight Control . . . . . . . . . . . . . . . . . . . . . . . . . . . . . . . . . . . . . . . . . . . 128
Exit to Windows . . . . . . . . . . . . . . . . . . . . . . . . . . . . . . . . . . . . . . . . . . . . 129
Customizing SignalHawk Content . . . . . . . . . . . . . . . . . . . . . . . . . . . . . . . . . 129
xix
Page 22

Bird Technologies
Chapter 9 Maintenance. . . . . . . . . . . . . . . . . . . . . . . . . . . . . . . . . . .131
Cleaning. . . . . . . . . . . . . . . . . . . . . . . . . . . . . . . . . . . . . . . . . . . . . . . . . . . . . . 131
Discharging Static Electricity . . . . . . . . . . . . . . . . . . . . . . . . . . . . . . . . . . . . . 131
Charging the Battery . . . . . . . . . . . . . . . . . . . . . . . . . . . . . . . . . . . . . . . . . . . 131
Upgrading the Software/Firmware . . . . . . . . . . . . . . . . . . . . . . . . . . . . . . . 131
PC Procedure . . . . . . . . . . . . . . . . . . . . . . . . . . . . . . . . . . . . . . . . . . . . . . 132
SignalHawk Procedure . . . . . . . . . . . . . . . . . . . . . . . . . . . . . . . . . . . . . . 133
Replacing the Battery . . . . . . . . . . . . . . . . . . . . . . . . . . . . . . . . . . . . . . . . . . 134
Troubleshooting . . . . . . . . . . . . . . . . . . . . . . . . . . . . . . . . . . . . . . . . . . . . . . . 136
For All Models . . . . . . . . . . . . . . . . . . . . . . . . . . . . . . . . . . . . . . . . . . . . . 136
For Vector Network Analyzer Only . . . . . . . . . . . . . . . . . . . . . . . . . . . . . 136
For Spectrum Analyzer Only . . . . . . . . . . . . . . . . . . . . . . . . . . . . . . . . . . 137
Specifications . . . . . . . . . . . . . . . . . . . . . . . . . . . . . . . . . . . . . . . . . . . . . . . . . 137
SignalHawk Models . . . . . . . . . . . . . . . . . . . . . . . . . . . . . . . . . . . . . . . . . 137
For Spectrum Analyzer Models SH-362S, SH-361S and SH-36S 1. . . . . . 37
Chart I - Distortion & DANL . . . . . . . . . . . . . . . . . . . . . . . . . . . . . . . . . 139
For Vector Network Analyzer
(Models SH-362S, SH-362, & SH-361S Only) . . . . . . . . . . . . . . . . . . . . . 139
Chart II - Return Loss Uncertainty,
1.6MHz to 3.6GHz . . . . . . . . . . . . . . . . . . . . . . . . . . . . . . . . . . . . . . . . . 142
Chart III - Insertion Loss/Gain Uncertainty,
1.6 MHz to 3.6 GHz . . . . . . . . . . . . . . . . . . . . . . . . . . . . . . . . . . . . . . . . 142
Power Sensors Supported . . . . . . . . . . . . . . . . . . . . . . . . . . . . . . . . . . . . 147
Parts List . . . . . . . . . . . . . . . . . . . . . . . . . . . . . . . . . . . . . . . . . . . . . . . . . . . . . 149
Optional Accessories . . . . . . . . . . . . . . . . . . . . . . . . . . . . . . . . . . . . . . . . . . . 150
General . . . . . . . . . . . . . . . . . . . . . . . . . . . . . . . . . . . . . . . . . . . . . . . . . . . 150
Spectrum Analyzer . . . . . . . . . . . . . . . . . . . . . . . . . . . . . . . . . . . . . . . . . 150
VNA . . . . . . . . . . . . . . . . . . . . . . . . . . . . . . . . . . . . . . . . . . . . . . . . . . . . . . 150
External Power Sensors . . . . . . . . . . . . . . . . . . . . . . . . . . . . . . . . . . . . . . 151
Test Cables and Adapters . . . . . . . . . . . . . . . . . . . . . . . . . . . . . . . . . . . . 153
ROHS . . . . . . . . . . . . . . . . . . . . . . . . . . . . . . . . . . . . . . . . . . . . . . . . . . . . . . . . 154
Appendix 1 Menu Maps . . . . . . . . . . . . . . . . . . . . . . . . . . . . . . . . . . .155
Vector Network Analyzer (VNA) Menu Maps . . . . . . . . . . . . . . . . . . . . . . . 155
Spectrum Analyzer Menu Maps 1 . . . . . . . . . . . . . . . . . . . . . . . . . . . . . . . . . . 64
Power Meter Menu Maps . . . . . . . . . . . . . . . . . . . . . . . . . . . . . . . . . . . . . . . 171
Start Menu, Help Menu Maps . . . . . . . . . . . . . . . . . . . . . . . . . . . . . . . . . . . 179
Start Menu, Utilities Menu Map . . . . . . . . . . . . . . . . . . . . . . . . . . . . . . . . . . 180
Setup Function Menu Maps . . . . . . . . . . . . . . . . . . . . . . . . . . . . . . . . . . . . . 182
Limited Warranty . . . . . . . . . . . . . . . . . . . . . . . . . . . . . . . . . . . . . . . .183
xx
Page 23
Chapter 1 Introduction
The SignalHawk is a multifunction test instrument for use in the installation and
maintenance of Radio Frequency (RF) and wireless systems. The model number
is identified on the unit and also on the display screen at the end of the poweron sequence.
Models SH-362S:
Spectrum Analyzer 100 kHz - 3.6 GHz
2 Port Vector Network Analyzer 1.6 MHz - 3.6 GHz
Models SH-361S:
Spectrum Analyzer 100 kHz - 3.6 GHz
1 Port Vector Network Analyzer 1.6 MHz - 3.6 GHz
Models SH-362:
2 Port Vector Network Analyzer 1.6 MHz - 3.6 GHz
Models SH-36S:
Spectrum Analyzer only 100 kHz - 3.6 GHz.
The SignalHawk can control and display readings from Bird power sensors
5010B, 5011, 5012B, 5016B, 5017B, 5018B and 5019B.
The firmware installed on the SignalHawk is updated on a regular basis. The
operator’s manual covers the most recent upgrade to the firmware up to the
date listed on the manual. Not all SignalHawk models have the current revision
of the firmware. Please upgrade the firmware to obtain the most current revision. See “Upgrading the Software/Firmware” on page 131.
1
Page 24
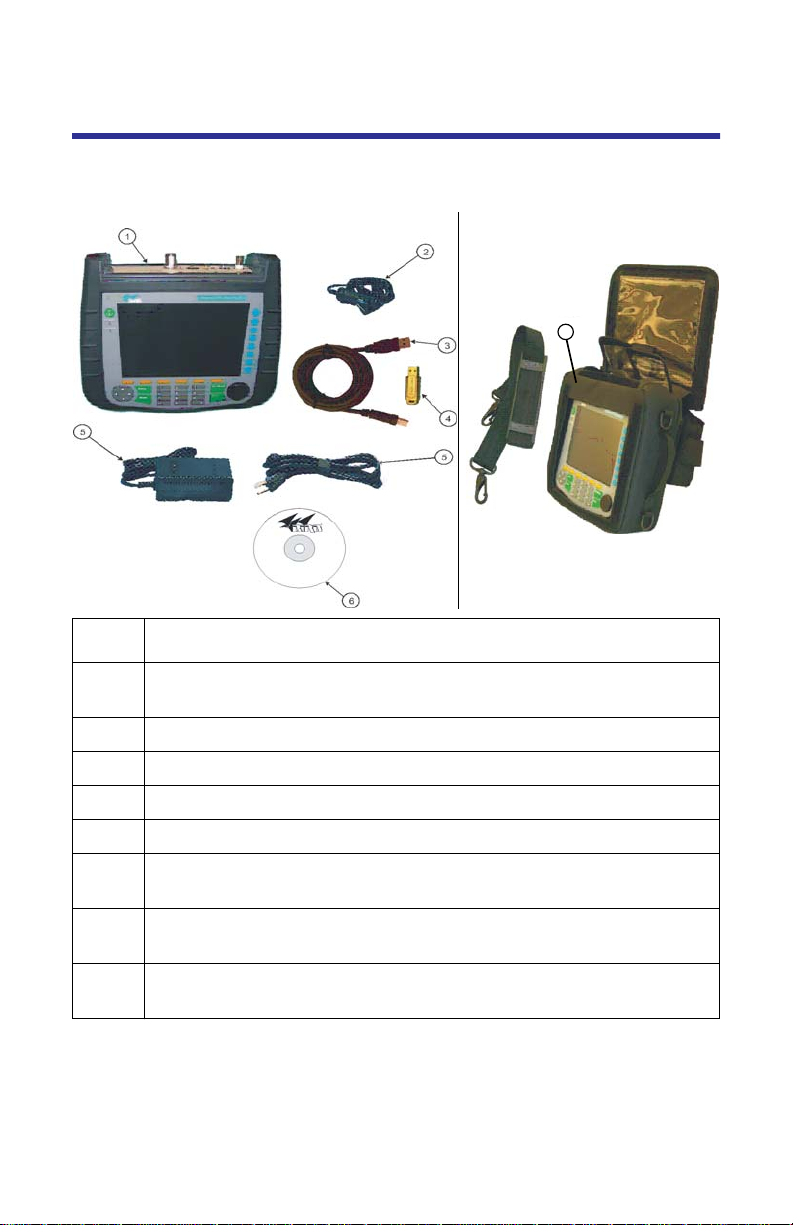
Items Supplied
Figure 1 Hardware and Software Supplied
7
Item Description
1 SignalHawk, with Li-Ion battery pack installed. Stand on back can be
rotated to four positions, and can be used as a carry handle.
2 Cigarette lighter adapter
3 USB cable
4 USB memory drive
5 AC power adapter with detachable cord
6 CD with manuals and PCTool software.
7002A210 - SignalHawk PC Tool Software
7 Soft carry case, featuring connector weather covers, carry handles,
detachable accessory pouch, and detachable shoulder strap
--- Not shown are the Start-up Instructions, Operations Manual CD, and
rain flap (can be installed on unit when not using the soft carry case).
2
Page 25
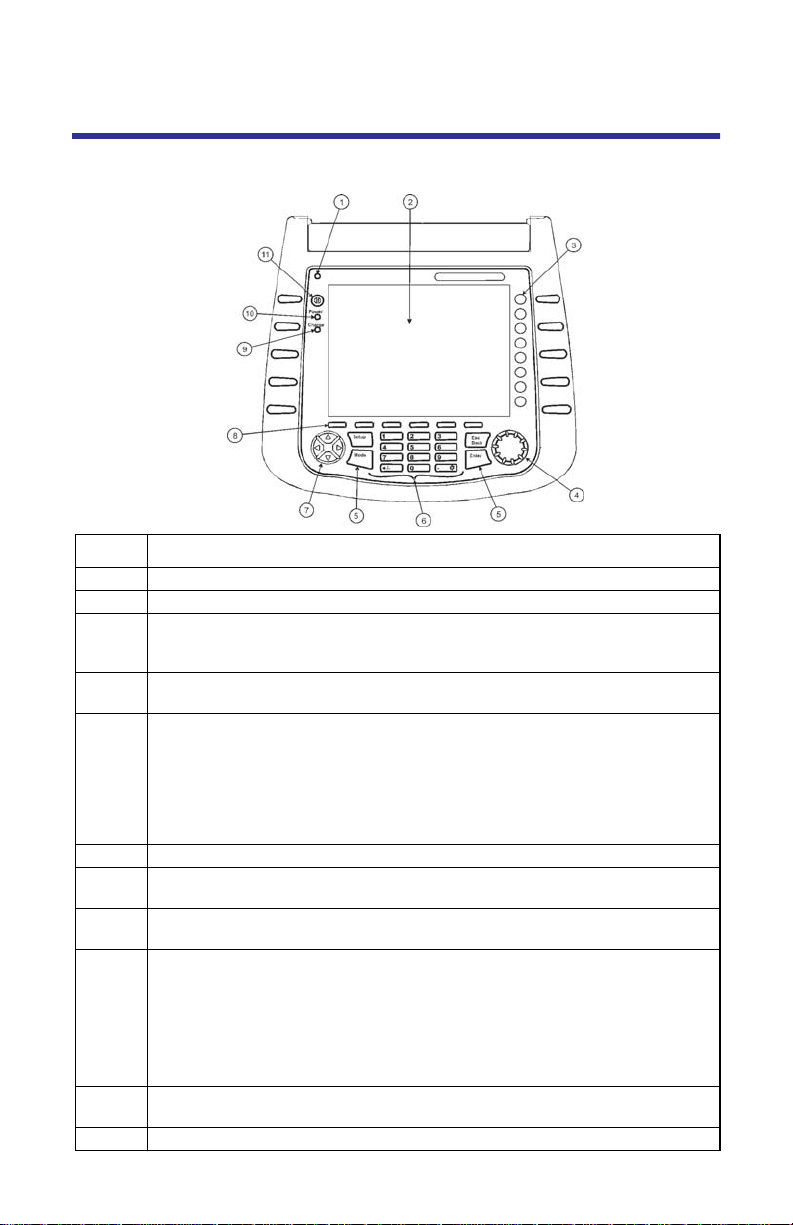
Looking at the SignalHawk
Figure 2 Controls and Indicators
Item Description
1 Light sensor. Do not cover when using backlight in automatic mode.
2 Display screen
3 Eight blue “soft keys.” Press to activate the function or option displayed
4 Thumbwheel, used to move in lists, choose options, and increase or
5 Green “Special” keys. Setup, Mode, Esc/Back and Enter.
6 Numeric keypad, used to enter values
7 Arrow keys (up, down, left, right). Used to move in lists, choose options,
8 Six yellow “menu keys.” A label is displayed just above each key on the display.
9 Amber “Charge” LED
10 Green “Power” LED
11 Power ON/OFF switch
in the label next to it on the display. Label and key function will change
depending on the active menu.
decrease numbers.
Setup: Go to the Setup Menu. In setup, pre-defined measurement
parameters can be selected and loaded. Factory setups cannot be
changed. User-defined setups can be created, changed, and deleted.
Mode: Go to the Start Menu.
Esc/Back: Cancel data entry or return to the previous screen.
Enter: Select an item or complete entering a number.
and increase or decrease numbers.
Press to change the soft keys to the functions associated with this menu.
Off when not connected to external AC
On continuously when battery is fully charged
Blinks slowly when battery is charging
Blinks rapidly when a battery problem exists
Note: This usually occurs when the battery cable has become dislodged and
will resolve itself with no intervention. If it persists, then service is needed.
On while the unit is turned on.
3
Page 26

Figure 3 Connector Panel - SH-362S
Item Description
1 BNC(F) external trigger input, 5V TTL
2 USB Type A for USB drive and accessories
3 USB Type B for PC connection
4 3.5mm mini-headphone jack
5 2.5mm DC jack for external power supplies
6 VNA Thru Port
7 VNA Test Port
8 Spectrum Analyzer Port, N(F) RF input, +20 dBm max.
9 Internal Speaker and air inlet ports. There is also an air
exhaust on the back of the unit.
Note: Do not block the inlet or exhaust.
10 RS-232 DB-9(F) connector for power sensors.
4
Page 27
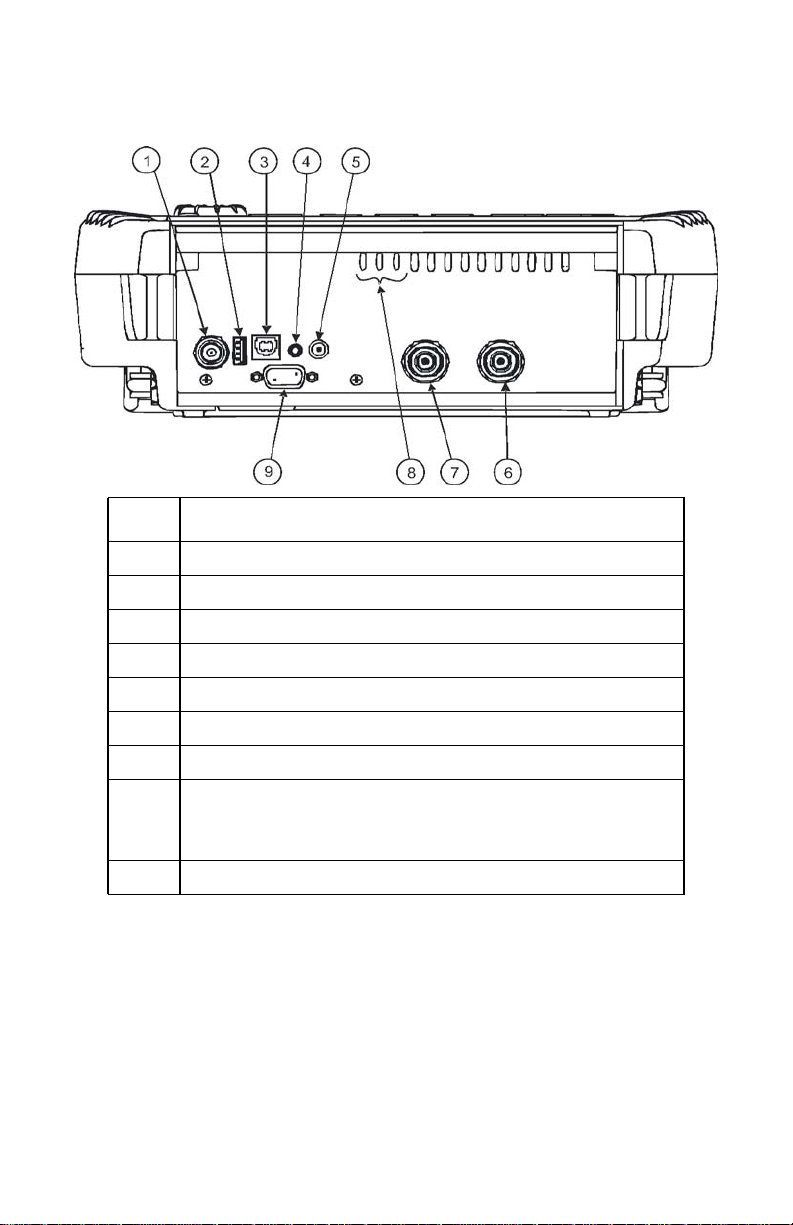
Figure 4 Connector Panel - SH-361S
Item Description
1 BNC(F) external trigger input, 5V TTL
2 USB Type A for USB drive and accessories
3 USB Type B for PC connection
4 3.5mm mini-headphone jack
5 2.5mm DC jack for external power supplies
6 VNA Test Port
7 Spectrum Analyzer Port, N(F) RF input, +20 dBm max.
8 Internal Speaker and air inlet ports. There is also an air
exhaust on the back of the unit.
Note: Do not block the inlet or exhaust.
9 RS-232 DB-9(F) connector for power sensors
5
Page 28

Figure 5 Connector Panel - SH-362
Item Description
1 BNC(F) external trigger input, 5V TTL
2 USB Type A for USB drive and accessories
3 USB Type B for PC connection
4 3.5mm mini-headphone jack
5 2.5mm DC jack for external power supplies
6 VNA Thru Port
7 VNA Test Port
8 Internal Speaker and air inlet ports. There is also an air
exhaust on the back of the unit.
Note: Do not block the inlet or exhaust.
9 RS-232 DB-9(F) connector for power sensors
6
Page 29

Figure 6 Connector Panel - SH-36S
Item Description
1 BNC(F) external trigger input, 5V TTL
2 USB Type A for USB drive and accessories
3 USB Type B for PC connection
4 3.5mm mini-headphone jack
5 2.5mm DC jack for external power supplies
6 Spectrum Analyzer Port, N(F) RF input, +20 dBm max.
7 Internal Speaker and air inlet ports. There is also an air
exhaust on the back of the unit.
Note: Do not block the inlet or exhaust.
8 RS-232 DB-9(F) connector for power sensors
7
Page 30

Power Supply
Internal Battery
The SignalHawk has an internal, rechargeable, lithium-ion battery pack that will
operate the unit for a minimum of 3 hours of continuous use. Recharging time,
from a full discharge, is approximately 4 hours. When running the unit on battery power, the percentage of battery life remaining is displayed in the lower
right corner of the screen.
Note: When the unit is shipped from the factory, the battery may
not be fully charged. Use an AC adapter when the unit is operated
for the first time.
Power Adapters
WARNING
When using the AC adapter, connect the AC plug only to a
properly grounded receptacle. Serious injury or death can
occur if not properly grounded.
The SignalHawk can be operated using the supplied AC adapter or a 12V automobile cigarette lighter adapter. Using these adapters will also charge the internal battery.
Note: When using the supplied car charging adapter, a minimum
voltage of 11.5V is required. To ensure complete charging, at least 13V
must be present at the DC input.
8
Page 31

Getting Started with the SignalHawk
CAUTION
Airflow is essential for proper unit operation. Do not
obstruct the unit or soft case exhaust ports!
CAUTION
+20 dBm (100 mW) max. RF input for the Spectrum
Analyzer and +22 dBm (160 mW) max. RF input for the
Vector Network Analyzer.
Exceeding the maximum input will damage the SignalHawk.
If unsure of power levels, measure the test connection with
a power sensor before using the SignalHawk.
Press the Power button to turn on the unit. The screen will show the Bird Technologies Group logo and then boot the SignalHawk software. During boot up,
the unit will perform an automatic self-test. After about 30 seconds, the unit
will display the Start Menu (see Figure 7 or Figure 8) and be ready for use.
Start Menu, Menu Keys
Menu keys are the six rectangular yellow keys located below the display screen.
Each menu key corresponds to an item on the menu bar displayed on the screen.
When using a menu list, use the thumbwheel or the up- and down-arrow keys to
move the highlight bar through the list. Use the left- and right-arrow keys to
move to a different list box.
VN Analysis
Allows a user to select any of the Vector Network Analyzer measurement
modes.
Spec Analysis Menu Key
Allows a user to select any of the Spectrum Analyzer measurement modes.
Power Meter Menu Key
Allows a user to select any of the Power Meter measurement modes.
Utilities Menu Key
Display the Utility Menu main screen. The Utility Menu provides information
about the instrument software, amount of available memory, battery charge
status, system date and time, and how to contact Bird Technologies Group.
9
Page 32

Help Menu Key
Displays the Help soft keys but does not exit the current screen. Press the Back...
soft key to exit the Help Menu.
VNA Help - Procedures and specifications for the Vector Network Analyzer fea-
ture of the SignalHawk.
Spectrum Analyzer Help - Procedures and specifications for the Spectrum
Analyzer feature of the SignalHawk.
Power Meter Help - Procedures and specifications for the Power Meter feature
of the SignalHawk.
Custom Help - See “Custom Help” on page 126.
Back... - Returns to the features of the previous menu.
10
Page 33
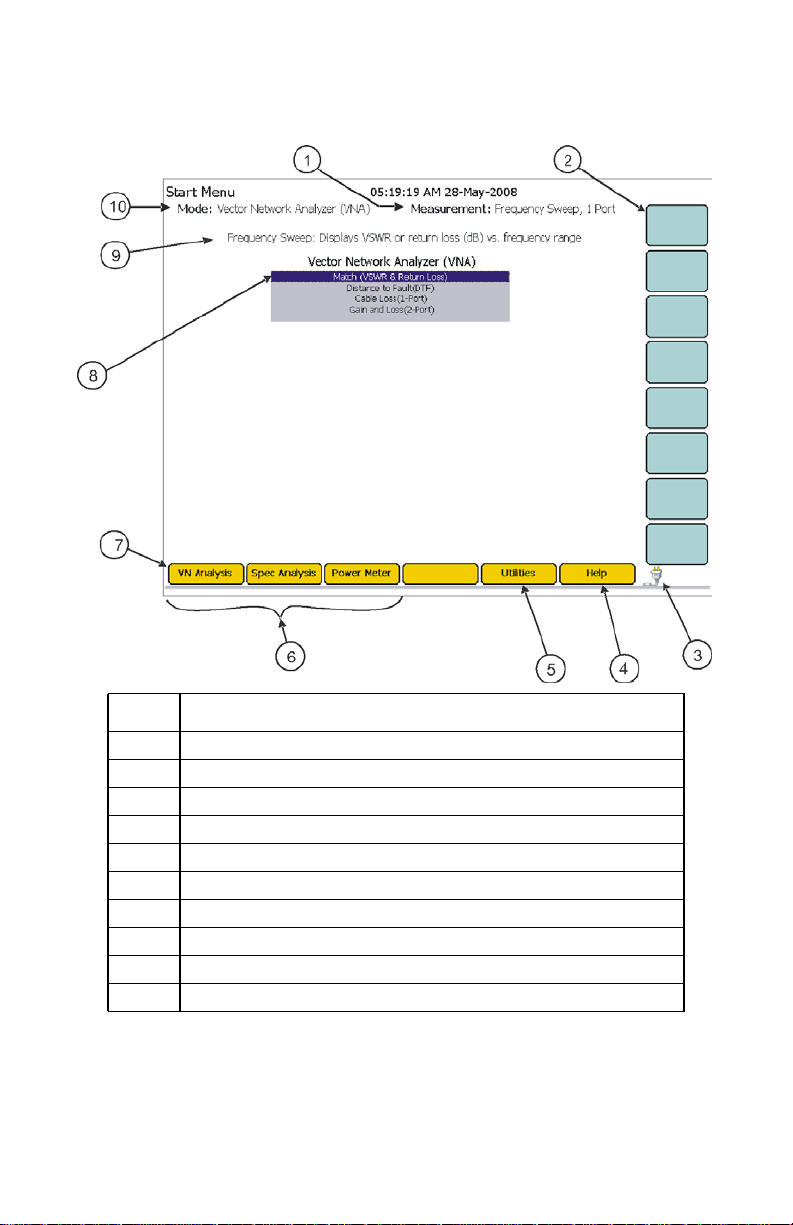
Figure 7 SignalHawk Start Menu - Vector Network Analyzer
Item Description
1 Name of measurement being used
2 Soft keys
3 Power source icon (AC, battery, or battery charging)
4 Go to the Help menu. See “Help Menu Key” on page 10.
5 Go to the Utilities menu. See “Utilities” on page 125.
6 Measurement mode lists
7 Menu keys
8 Selected measurement (highlighted)
9 Name and brief description of highlighted measurement
10 Current active operating mode
11
Page 34
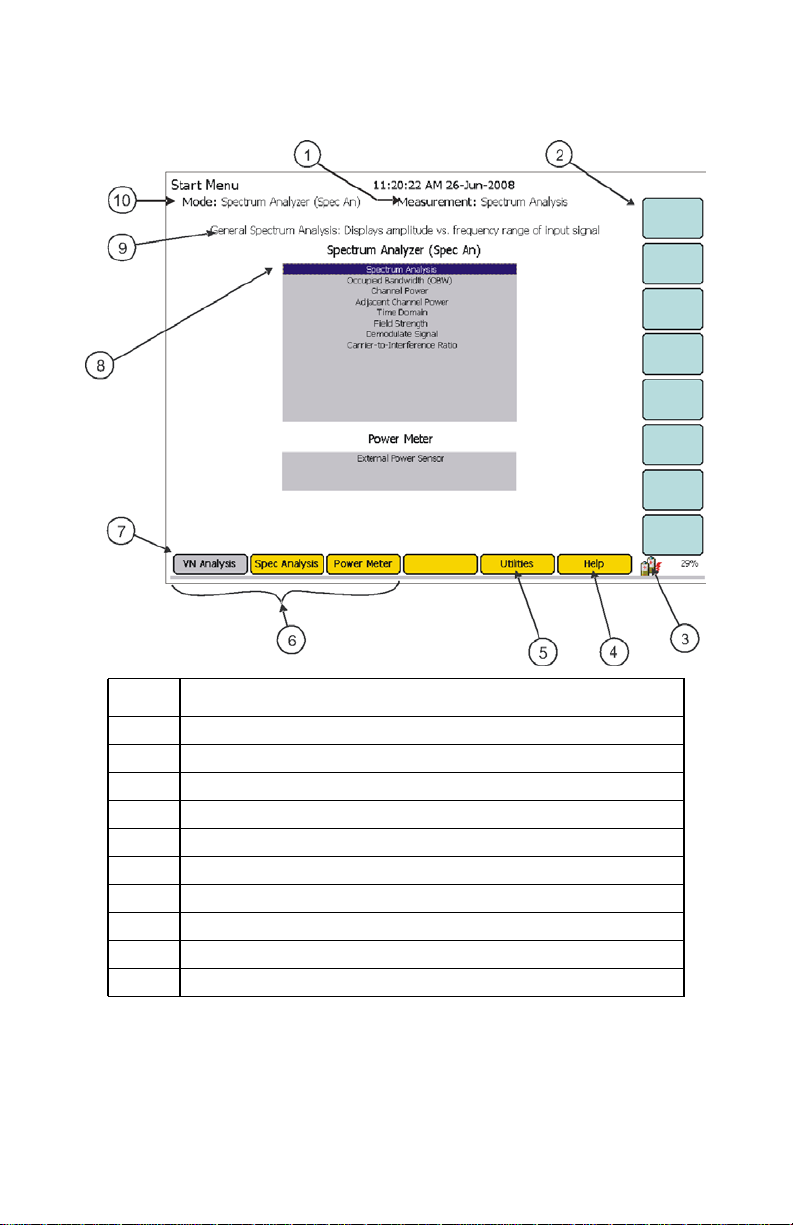
Figure 8 SignalHawk Start Menu - Spectrum Analyzer
Item Description
1 Name of measurement being used
2 Soft key labels
3 Power source icon (AC, battery, or battery charging)
4 Go to the Help menu. See “Help Menu Key” on page 10.
5 Go to the Utilities menu. See Chapter 8, page 125.
6 Measurement mode lists.
7 Menu key labels
8 Selected measurement (highlighted)
9 Name and brief description of highlighted measurement
10 Current active operating mode
12
Page 35

Setup Menu
The Setup Menu allows access to saved setups and settings used previously on the SignalHawk. Press the Setup button to access the menu.
Figure 9 Setup Menu
Quick Save Setup
The saved settings are stored as a file in the internal flash drive of the instrument. Each
quick save is stored in a separate file that is named using the date-time file naming format GeneralSA(MM-DD-hh-mm-ss).shs where YYYY is the year, the first MM is the
month, DD is the day, hh is the hour, the second mm is the minute, and ss is the second of the time when the file was saved.
13
Page 36
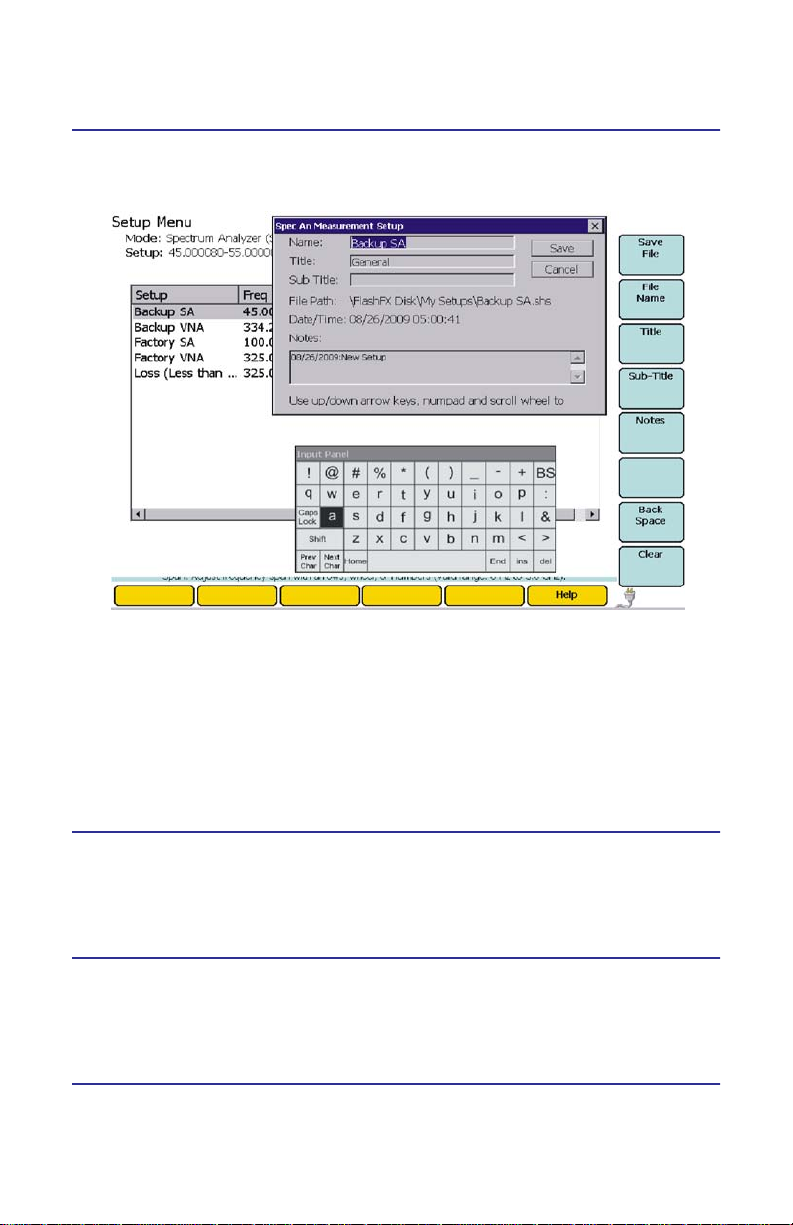
Label & Save Setup
Figure 10 Setup Menu - Save
Labels and saves the settings for a setup for future use.
1. Press the Save File soft key.
2. Enter a file name using the thumbwheel and arrow keys.
Note: Use up-and-down arrow keys to move vertically and the wheel
to move horizontally along the Input Panel. Use the right-and-left keys
to toggle between the text fields (Name, Title, etc.)
Recall Setup
Recalls a saved setup and sets the instrument parameters to run the recalled
setup.
Recall Default Setup
Recalls the factory default setup and sets the instrument parameters to run this
setup.
Manage Setup Files
Allows access to the file management of the saved Setups.
14
Page 37

Figure 11 Setup - Manage Setup Files
Copy Setup to USB Drive
Copies the selected Setup on the list to a connected USB drive.
Copy All Setups to USB Drive
Copies all the Setups on the list to a connected USB drive.
Copy Setup from USB Drive
Copies a saved Setup from a connected USB drive.
Delete
Deletes the selected Setup on the list.
Delete All Setups
Deletes all of the Setups on the list, with the exception of the factory setup.
15
Page 38
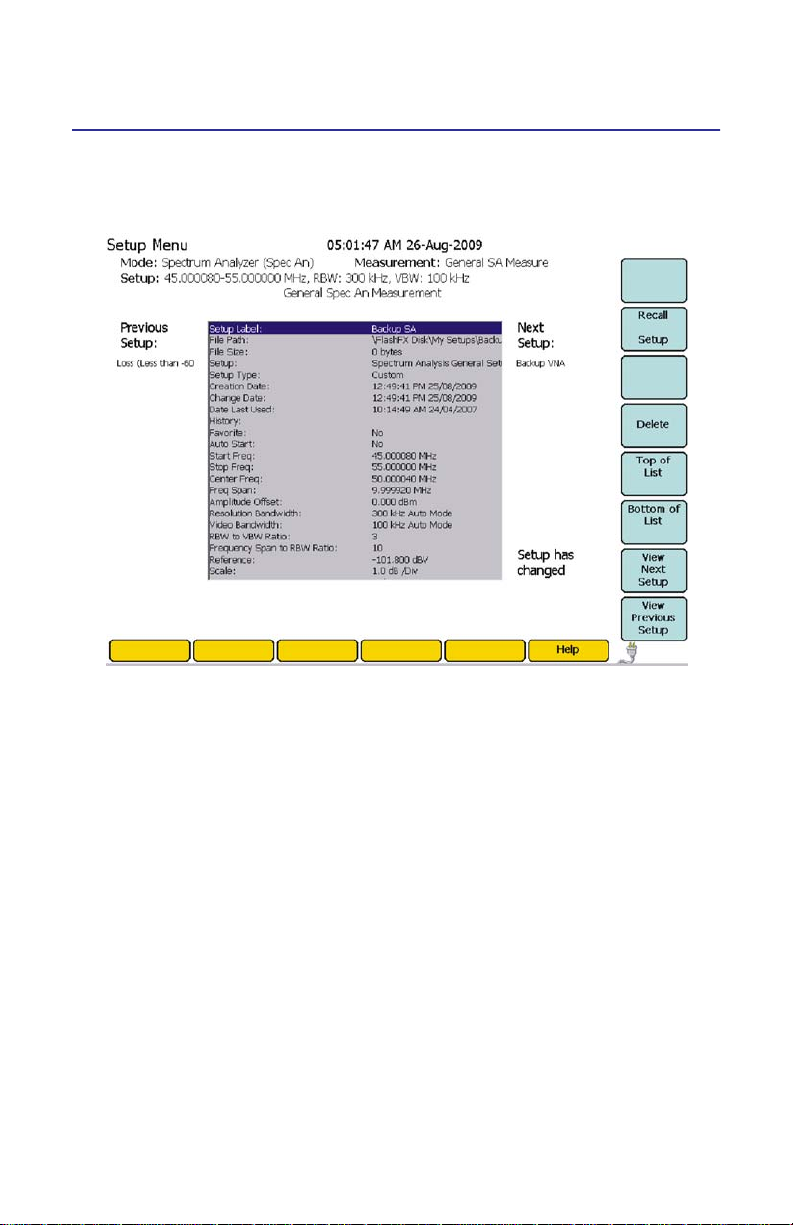
View Setup
Displays the properties of a selected saved Setup on the list.
Figure 12 Setup - View Setup
Recall Setup
Recalls a saved setup and sets the parameters of the SignalHawk to run the
recalled setup.
Delete
Deletes the displayed Setup.
Top of the List
Displays the Setup from the top of the list of saved Setups.
Bottom of the List
Displays the Setup from the bottom of the list of saved Setups.
View Next Setup
Displays the next Setup on the list of saved Setups.
View Previous Setup
Displays the previous Setup on the list of saved Setups.
16
Page 39
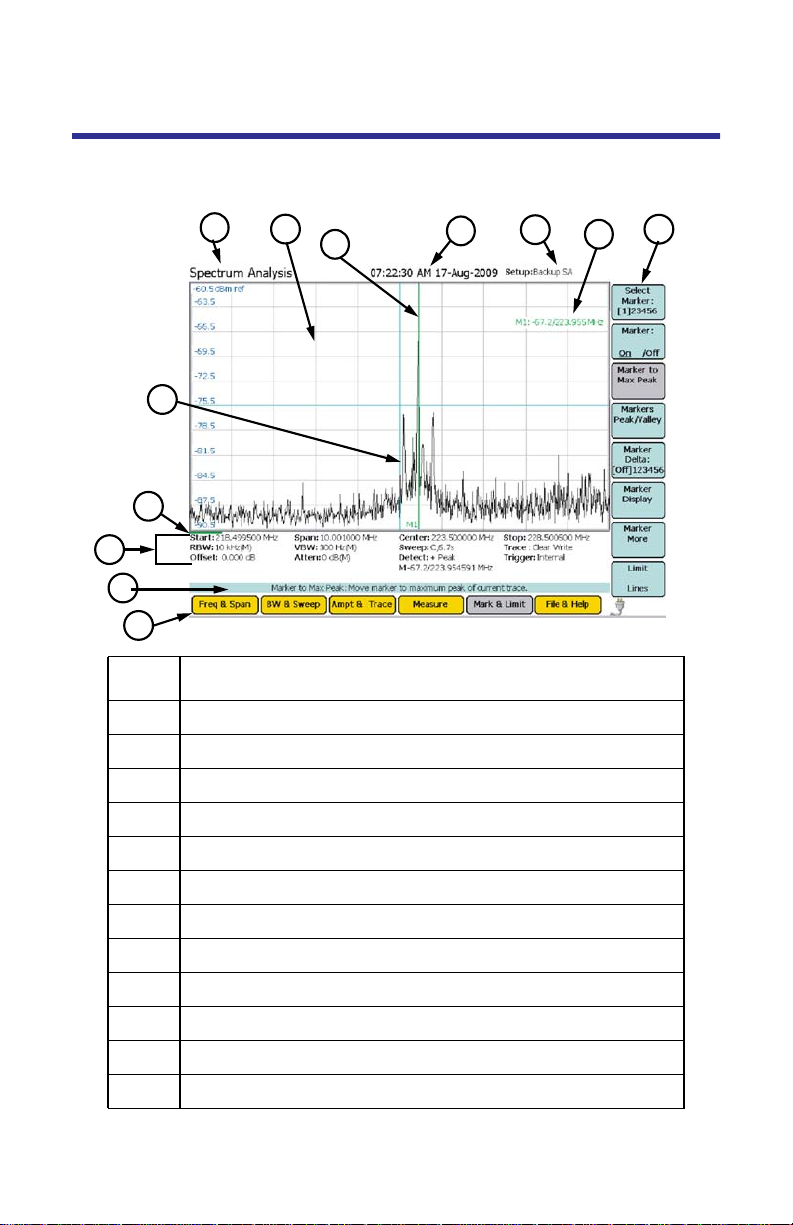
Looking at the Screen
Figure 13 General Screen Features
1
2
3
~
12
11
10
9
8
Item Description
1 Name of selected measurement
2 Sweep display area
3 Marker (Line Marker shown)
4
5
6
7
4 Date and time
5 Name of setup file being used
6 Marker Info
7 Soft key labels
8 Menu key labels
9 Help tips for the current screen
10 Measurement settings
11 Sweep progress bar
12 Data trace
17
Page 40

Vector Network Analyzer Quick Start
CAUTION
Vector Network Analyzer has a +22 dBm (160 mW) max. RF
input. Exceeding the maximum input will damage the
SignalHawk. If unsure of power levels, measure the test
connection with a power sensor before using the
SignalHawk.
CAUTION
Do not turn on a DC bias if the thru cable is attached from
the VNA In to the VNA Out. This will damage the VNA input
and destroy the unit.
CAUTION
Center conductor cabling should be discharged prior to
connecting. See “Discharging Static Electricity” on page 131.
Any large electrostatic discharge or high power RF applied
directly to the RF input or output will cause internal damage
and void the warranty.
Power to any adjacent broadcast antennas should be shut
down as well. If adjacent antenna broadcasts cannot be
terminated, then adding sufficient external attenuation to the
input of the instrument prior to connecting is recommended.
Failure to do so could result in irreparable damage to the
SignalHawk.
1. Measure the output power of the system being tested, or signal power, at
the system’s test port using a power meter, service monitor, or equivalent.
Note: Ensure the output power is less than +22 dBm (160 mW).
2. Power up the SignalHawk.
3. In the Start Menu, use the arrow keys to highlight the desired measurement and press Enter.
4. In the Freq & Span Menu, set the frequency range (See “Freq & Span
Menu” on page 58).
5. Do one of the following:
For Match or Cable Loss Measurement:
a. Select either the Match or Cable Loss measurement.
b. Press Calibrate
c. Select Open, Short, or Load (soft keys) on RF Out corre-
sponding with a calibrated open, short, or load connected
to the RF Out port.
d. Connect the cable and antenna to the RF Out test port.
Note: Maximum input is +22 dBm (160 mW).
18
Page 41

For Distance-to-Fault (DTF) Measurement:
a. Press Measure then Measure: Match and then DTF (soft keys).
b. Press Ampt & Trace then Units (soft key) then select
VSWR or Rtn Loss dB.
c. Press Measure then select either Meter or Feet in Distance
Units (soft key).
d. Press DTF Wizard (soft key), follow instructions displayed,
and then skip to step h.
Note: For Manual setup of DTF, follow steps e to m.
e. Connect the cable and antenna to the RF Out test port.
Note: Maximum input is +22 dBm (160 mW).
f. Press Cable then Cable List (soft keys).
g. Scroll to desired cable and press Select or Enter.
Note: May also manually enter cable Vp and Loss.
h. Press Ampt & Trace then Autoscale (soft key) to view trace
on display OR manually adjust scale with Max and Min
Level settings.
i. Press Sweep then Data Points (soft keys).
j. Adjust data points until stop distance is just greater than
the length of cable.
Note: If needed, repeat steps i and j.
k. Press Calibrate
l. Select Open, Short, or Load (soft keys) on RF Out corre-
sponding with a calibrated open, short, or load connected
to the RF Out port.
m. Connect the cable and antenna to the RF Out test port.
Note: Maximum input is +22 dBm (160 mW).
For Gain & Loss Measurement:
a. Press Measure then Measure: Gain & Loss (soft keys).
b. Press Ampt & Trace and Pwr Out.
Note: Default is 0 dBm, may set as low as -40 dBm for amplifier gain
or as high as +10 dBm for antenna isolation measurements.
c. Press Calibrate, connect cable from the VNA RF Out to In
port, and press Cable from RF Out-In.
Note: Connect loads to VNA RF Out and In ports, press Loads on RF
Out & In and wait until done. This is recommended to measure
antenna isolation in the
-80 to -90 dB range.
d. Press Skip Other Cals.
e. Connect the device under test (e.g. cable, amplifier, filter,
antennas) to the VNA RF Out and In ports.
Note: Maximum input on each port is +22 dBm (160 mW).
19
Page 42

CAUTION
Do not turn on a DC bias if the thru cable is attached from
the VNA In to the VNA Out. This will damage the VNA input
and destroy the unit.
f. Press Ampt & Trace and Sweep.
Note: Press IFBW and set to 100 Hz with down arrow key. This is rec-
ommended to measure antenna isolation in the -80 to -90 dB range.
Note: Steps g through j are needed to bias a tower top amplifier
(TTA), otherwise go to step k.
Note: It is recommended that the Signal Hawk be plugged into a
power outlet.
g. Press Measure and Bias Tee Voltage, toggle to +12V or
+24V per the TTA requirements.
h. Ensure that Pwr Out (in the Ampt & Trace menu) is set as
low as -40 dBm to avoid overdriving the TTA.
i. Connect output of TTA to VNA RF In port and input of
TTA to VNA RF Out port.
j. Press Bias Tee (in the Measure menu) and toggle on.
Note: Bias Tee should be toggled off when not in use.
k. Press Ampt & Trace and Autoscale (soft key) to view trace on
display OR manually adjust scale with Max and Min Level.
6. Press Ampt & Trace then Units (soft key) select VSWR or Rtn Loss dB.
Note: Units cannot be set when the SignalHawk is in Cable Loss or
Gain & Loss measurement mode.
7. Wait for one sweep, then go into the Ampt & Trace Menu and press Autoscale to view trace on display OR manually adjust scale with Max and Min
Level (see “Ampt & Trace Menu” on page 70).
8. In the File & Help Menu, press Quick Save Trace to save the data (see “File
& Help Menu” on page 77).
20
Page 43
Spectrum Analyzer Quick Start
CAUTION
Spectrum Analyzer has a +20 dBm (100 mW) max. RF input.
Exceeding the maximum input will damage the SignalHawk.
If unsure of power levels, measure the test connection with
a power sensor before using the SignalHawk.
CAUTION
Center conductor cabling should be discharged prior to connecting.
See “Discharging Static Electricity” on page 131. Any large
electrostatic discharge or high power RF applied directly to the RF
input or output will cause internal damage and void the warranty.
Power to any adjacent broadcast antennas should be shut down
as well. If adjacent antenna broadcasts cannot be terminated,
then adding sufficient external attenuation to the input of the
instrument prior to connecting is recommended. Failure to do so
could result in irreparable damage to the SignalHawk.
1. Measure the output power of the system being tested, or signal power, at
the system’s test port using a power meter, service monitor, or equivalent.
Note: Ensure the output power is less than +20 dBm (100 mW).
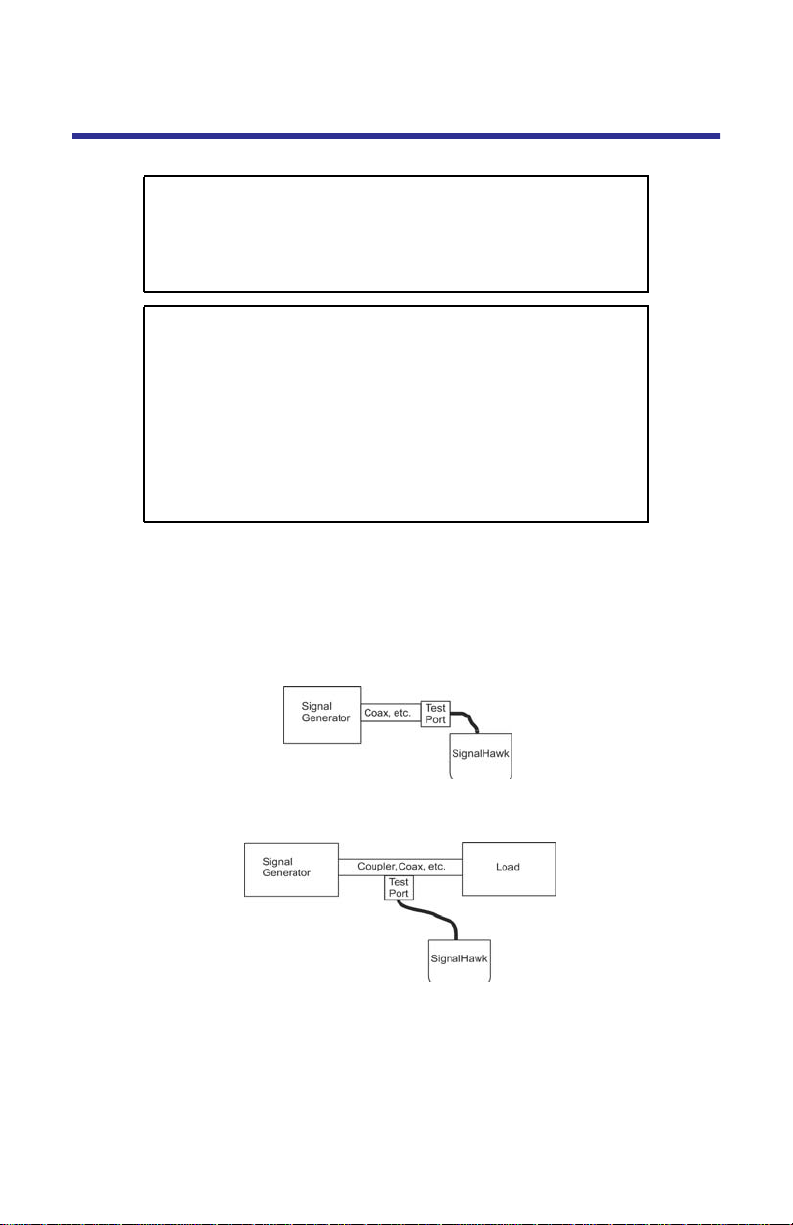
2. Connect the SignalHawk’s “RF Input” connector:
For low-power applications, connect directly to the output of the sig-
nal source. See the below graph:
For high-power applications, use a directional coupler or attenuator to
reduce the output level of the signal source. See the below graph:
3. Power up the SignalHawk.
4. In the Start Menu, use the arrow keys to highlight the desired measurement, and press Enter.
5. In the Freq & Span Menu, set the frequency range (See “Freq & Span
Menu” on page 58).
6. Wait for one sweep, then go into the Ampt & Trace Menu and press Autoscale (see “Ampt & Trace Menu” on page 70).
21
Page 44

7. In the Measurement menu, select the desired measurement.
"Spectrum Analysis Measurement" on page 84.
"Occupied Bandwidth Measurement" on page 85.
"Channel Power Measurement" on page 87.
"Adjacent Channel Power Measurement" on page 89.
"Time Domain (Zero Span)" on page 91.
"Field Strength Measurement" on page 92.
"Demodulate Signal" on page 93.
"Carrier-to-Interference Ratio" on page 94.
"Out-of-Band and In-Band, Out-of-Channel Spurious" on page 96.
"Water Fall" on page 72.
8. Turn on markers or limit lines if needed (see “Marker On / Off” on page 73
and "Limit Lines" on page 75).
9. Make a sweep.
10. In the File & Help Menu, press Quick Save Trace to save the data (see “File
& Help Menu” on page 77).
Global Positioning System (GPS)
Note: Only firmware version 1.2.01302009 or higher will support the
GPS sensor. To get the latest firmware, refer to "Upgrading the Software/Firmware" on page 131.
A Bird Electronic Compact GPS Sensor can be connected to the COM1 serial port
located on the back panel. It is used to record geographic position information
associated with a trace.
GPS status is indicated by an icon in the upper right corner of the display as follows:
Icon Status Recording Action
None No GPS data is being received. No geographic position is saved
with the trace.
GPS data is being received;
however, there is no positional fix.
A positional fix is available from the
GPS.
Adding Custom Locations
See “Customizing SignalHawk Content” on page 129.
22
No geographic position is saved
with the trace.
The entire GGA message
(essential fix data which provides
3D location and accuracy data) is
recorded in the saved trace file.
Page 45

Chapter 2 Vector Network
Analyzer Settings
The proper settings are very important for the most accurate information possible. The SignalHawk can be configured in various ways, allowing for a wide
range of measurement capabilities.
Core Soft Key Functions
“Soft Keys” serve multiple functions on the SignalHawk. There are four core
functions:
1. On/Off Button - Push to toggle the corresponding function on or off.
2. Pop-Up Menu Button - Push to pop-up lists and drop menus. Use the arrow
key, wheel, etc. to select from the pop-up (e.g. Freq list).
3. Highlight Button - Push to highlight selectable variants (e.g. Freq).
4. Trigger Event Button - Push to start a function (Full Span).
23
Page 46

Freq & Span Menu
Figure 14 Freq & Span Menu
In the Freq & Span Menu, the range of frequencies to sweep are specified.
Frequencies can be selected at spans from 1 kHz up to the entire range of the
instrument.
Note: Information obtained from readings set below the minimum
rating may not be accurate.
These frequencies can be set to sweep by one of the following methods:
Set the Center Freq and Freq Span.
Set the Start Freq and Stop Freq.
Select the Full Span of the instrument.
Select a band from the Freq List.
The most common of these methods is to set the center frequency and a frequency span (a range) and let the SignalHawk calculate the start and stop frequencies for the sweep. Reducing the span will usually provide more detail and
lower the noise floor. For many measurements, set the center frequency to the
center of the signal being tested.
24
Page 47

Start / Stop Freq and Center / Span
These settings control the frequency range being swept.
Note: “Center / Span” are used in this manual, but using “Start / Stop
Freq” achieves the same results.
After pressing the soft key, it will highlight the active function. Then the following
can be performed:
Up/Down Arrow Keys: Increase and decrease the frequency or span in
small steps.
Left/Right Arrow Keys: Increase and decrease the frequency or span in
large steps.
Thumbwheel: Each click of the thumbwheel changes the frequency or
span by the value of the “Wheel Step” soft key.
Number Keys: Press any key except +/- to open a box to type in a new
frequency. If a mistake happens, press Esc/Back. When done, press
enter (to keep the same frequency units) or press the soft key corresponding to the desired units.
Wheel Step
When another frequency function is active and the thumbwheel is turned, the
value will change in steps of the “Wheel Step”. After pressing the “Wheel Step”
soft key to highlight it, the following is enabled:
Up/Down Arrow Keys and Thumbwheel: Change the step value by a
small amount.
Left/Right Arrow Keys: Change the step value by a large amount.
Number Keys: Press any key except +/- to open a box to type in a new fre-
quency. If a mistake is made, press Esc/Back. When done, press enter, or press
the soft key corresponding to the desired units.
Full Span
Press this to set the Start Freq to 1.6 MHz, and the Stop Freq to the max freq of
the unit, currently 3.6 GHz.
Freq List
Pressing this opens up a list of predefined frequency bands. Use the up/down
arrows and thumbwheel to scroll to the desired band and press the “Select” soft
key to use it. Recently used bands are displayed at the top of the list.
25
Page 48
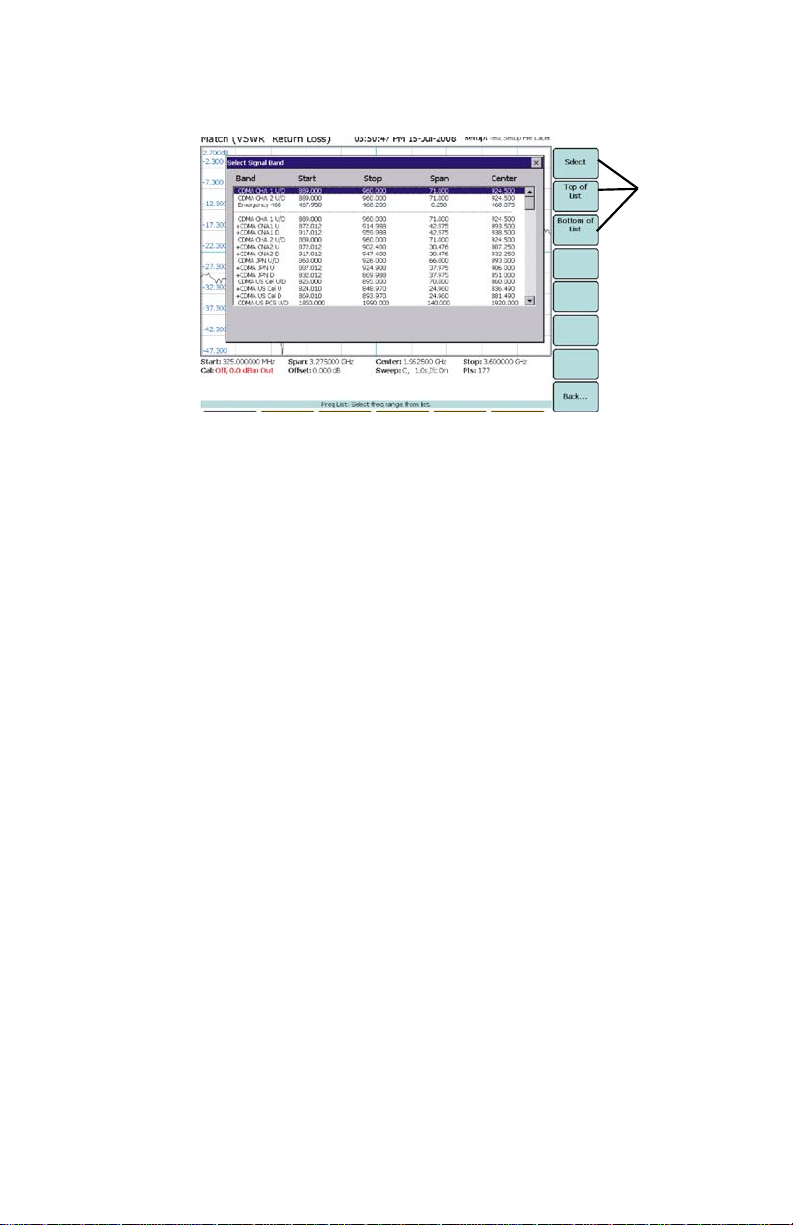
Figure 15 Example, Freq List
Adding Custom Frequencies
See “Customizing SignalHawk Content” on page 129.
Settings
26
Page 49

Calibrate Menu
Ensure that the calibration is done properly. For the best results, use a Bird calibration kit. If calibration is not done properly, the readings from the VNA will be
wrong.
Note: Set any parameters that the calibration may depend on
BEFORE starting the calibration of the unit. Power output should be set
depending on isolation or gain measurement.
Note: If the SignalHawk is not calibrated before taking measure-
ments, readings will be wrong. Calibrating should be done after setting everything else, and before making measurements.
Note: Many factors play a key role in proper calibration. Be sure to
mind the internal temperature of the unit as well as length of time
between calibrations. In addition, many setting changes, especially
changing the frequency setting, can turn calibration off.
1. Connect one of the following to the RF connector:
Open
Short
Load (the “calibration standard”)
Cable from RF Out-In (2-Port Only)
Loads on RF Out & In (2-Port Only)
Note: For faster calibration sweep times when measuring antenna
isolation in the -80 to -90 dB range, it is recommended to use less data
points.
2. Press the corresponding button in the calibrate menu.
Note: For measuring antenna isolation in the -80 to -90 dB range:
Connect loads to VNA RF Out and In ports, press Loads on RF Out & In
and wait until done. Bird recommends using a calibrated load (e.g.
CAL-MN-C) for the RF Out and a standard load (e.g. 2-T-MN) for the RF
In.
3. Wait for the sweep to finish: the button will un-highlight and “Done” will
appear in the label.
Note: If the key is pressed again, it will re-take that sweep.
4. Remove calibration standard.
5. Put on a different calibration standard.
6. Repeat steps 1 to 4 until all calibration types are done.
7. Wait while the unit processes the information. When ready, the unit will
exit the Calibrate menu and the Cal: area of the status bar will display the
calibration method that was performed.
27
Page 50
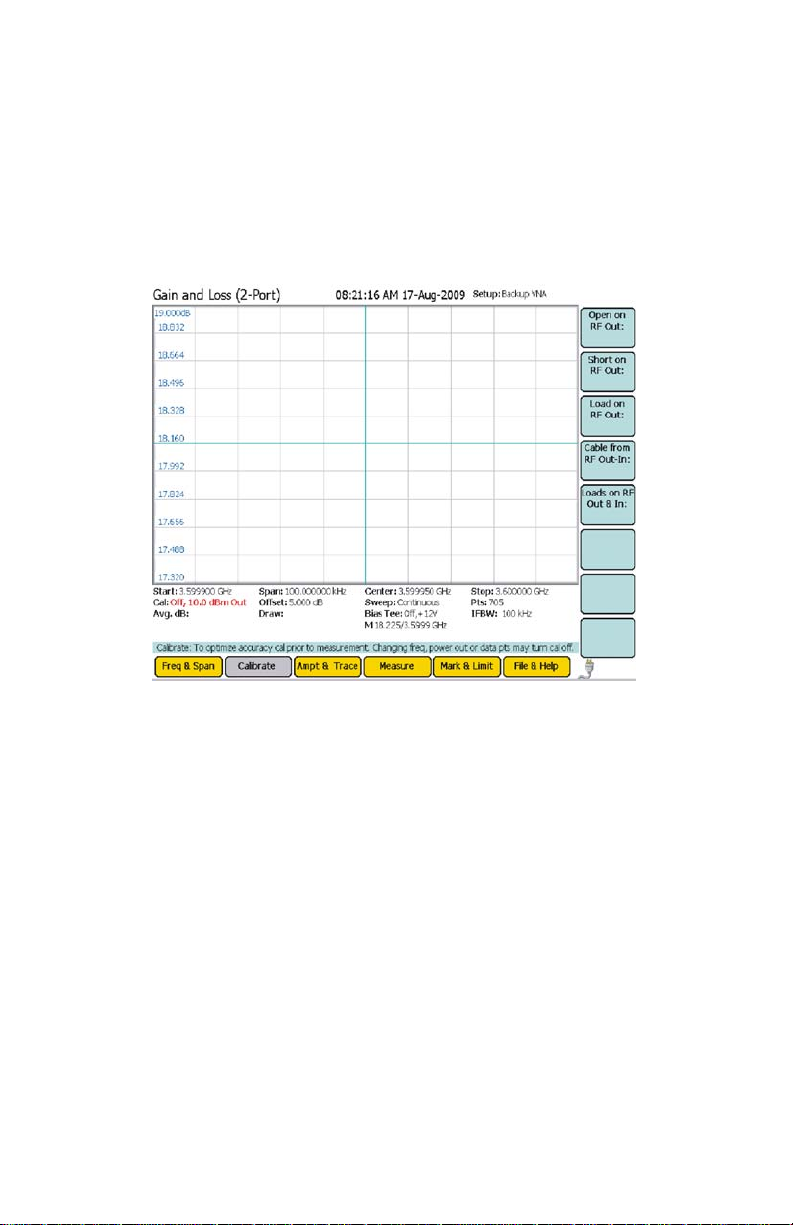
Note: If the unit is operating without valid calibration, the text in the
cal area of the status bar will be red and say “Off”. If it has a calibration,
the calibration method will be listed in black text.
Note: For most isolation and gain measurements, only a thru cal
(Cable from RF Out-In) is needed.
Figure 16 Example, Calibrate Menu
28
Page 51

Ampt & Trace Menu
Figure 17 Example, Ampt & Trace Menu
Autoscale
Resizes the graph to fit the whole trace on the screen. This function will change
the reference and scale of a trace.
Max Level
Sets the upper limit of the vertical axis.
Min Level
Sets the lower limit of the vertical axis.
Offset
Shifts the signal to compensate for external factors (attenuation, couplers,
amplifiers, etc.) This allows for a true signal level reading.
1. Measure the total amount of loss for all attached signal devices.
2. Enter the measured amount as the Offset value or gain.
Example - The system has 10 dB of loss due the use of a
coupler; enter the value of 10 in the Offset). Offset range is 100 to +100.
29
Page 52

Units
VSWR
1 Sqrt Pr Pf+
1 Sqrt Pr Pf–
Return Loss
dB 10 Log Pr Pf=
rho
Sqrt Pr Pf
Match %
100 1 Pr Pf–
Reflection %
100 1 Pr Pf–
Pwr Out
Controls the power level of the signal that is sent out to the RF port. The SignalHawk then measures the power that comes back. The default setting is 0 dBm. Can
be set from -20 to +10 in 1 dB steps. This should be set as high as possible without
overpowering the system.
Note: For most measurements, the output should be set to 0dBm or
lower.
Note: For systems with good match (low reflected power) set the
output higher to improve the signal to noise ratio.
Sweep
Sets the parameters of the sweep for the SignalHawk.
Cont/Single
Toggles the sweep setting from a single sweep to a continuous cycle of sweeping and recording.
Note: Selecting this will enable a manual trigger soft key that starts
the sweep when pressed.
Data Points
Controls the sweep speed and level of detail. The range can go from 12 to 11265
points per sweep.
Note: Increasing the number of data points increases the measur-
able distance in Distance-to-Fault measurements and increases the
detail in Measure Match mode measurements. Use a smaller number
of points when frequency resolution is not critical & a faster sweep
time is desired. Use more points for a more accurate display of finer
frequency divisions.
30
Page 53

If there are fewer points than screen pixels, the unit will
interpolate between them.
Note: Once the unit is calibrated, reducing the number of points
below 1409 does not require recalibration.
If there are more points, the unit will draw multiple data points in each
column.
Interference Immunity
Controls the discrimination between interfering signals from the system being
tested. If there are other signals in the system being tested, this function will
enable the unit to ignore the extraneous signals better, and record a more accurate measurement.
Note: This feature should be enabled at all times, except when test-
ing long lengths of cable.
IFBW
Increases and decreases the internal filtering of the measurement. It can also function as a smoothing effect when measuring very low return losses. It achieves this
by reducing the IFBW (towards 100 Hz) which reduces the noise amplitude of the
display. Also, lower IFBW settings result in longer sweep times, and increase the
effectiveness of the interference immunity. The range is from 100 Hz to 1 MHz.
Note: For Gain-and-Loss 2-Port Measurement Only - When measur-
ing antenna isolation in the -80 to -90 dB range, the IFBW setting
needs to be 100 Hz.
Trace
Opens a trace submenu with the following options:
Clear Write
Switches off the Average and Max Hold functions.
Max Hold
Holds and displays the highest trace data points.
Average
Displays the running average of multiple readings.
Note: This may be used to smooth a trace.
Average Readings
Sets the number of readings to be averaged. The valid range is from 2 to 1024.
Reset Average
Resets the current running average of multiple readings.
31
Page 54
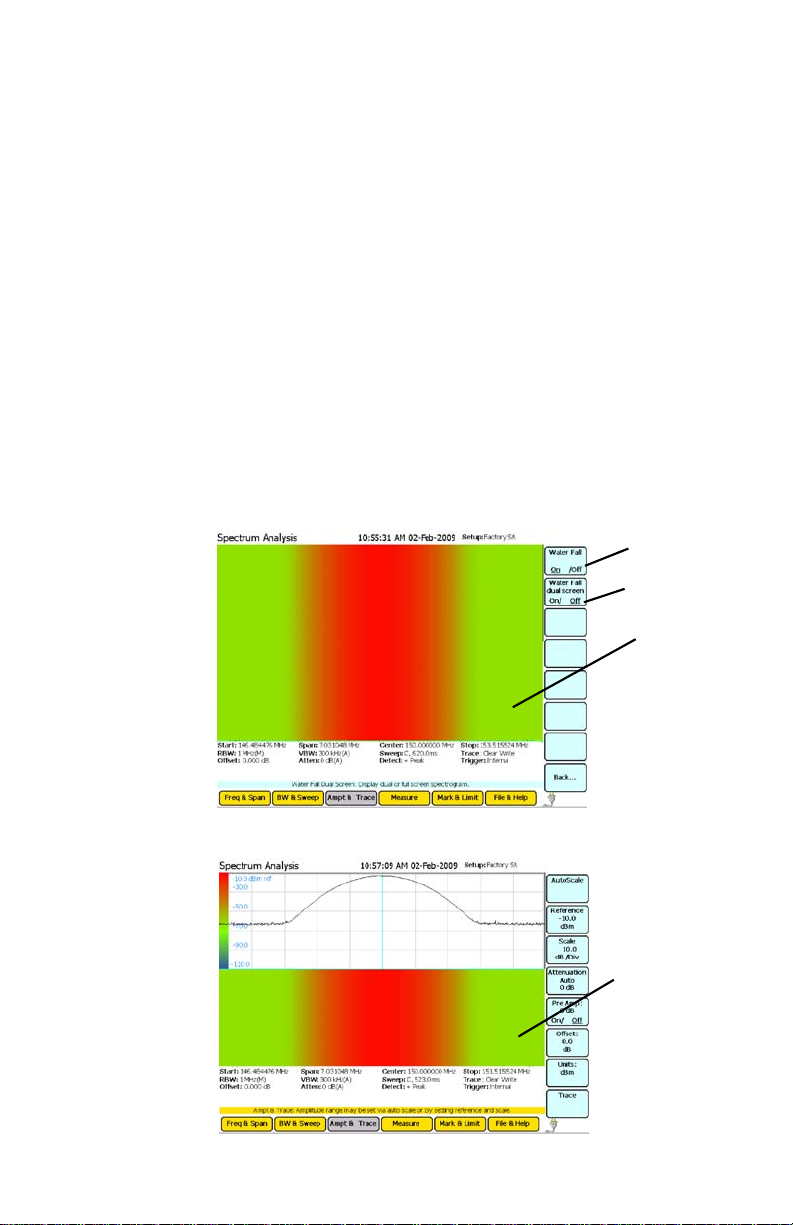
Water Fall
The Water Fall is a spectrogram that shows how the spectral density of a signal
varies with time and presents it in a visual image.
The Water Fall display is used to identify intermittent interference. Power is linearly mapped to graph display color. When mapped out, the horizontal axis is the
Frequency rating while the vertical axis is Time.
The color ranges from dark blue, at minimum power, to red, at
maximum power.
To activate the Water Fall display:
1. Go to the Ampt & Trace menu.
2. Press the Trace soft key.
3. Press the Water Fall soft key.
4. Turn the Water Fall spectrogram on.
5. Select the dual screen display, if desired
Figure 18 Example, Water Fall Spectrogram - Full Screen
STEP 4
STEP 5
Water Fall
Display
Figure 19 Example, Water Fall Spectrogram - Half Screen
32
Water Fall
Display
Page 55
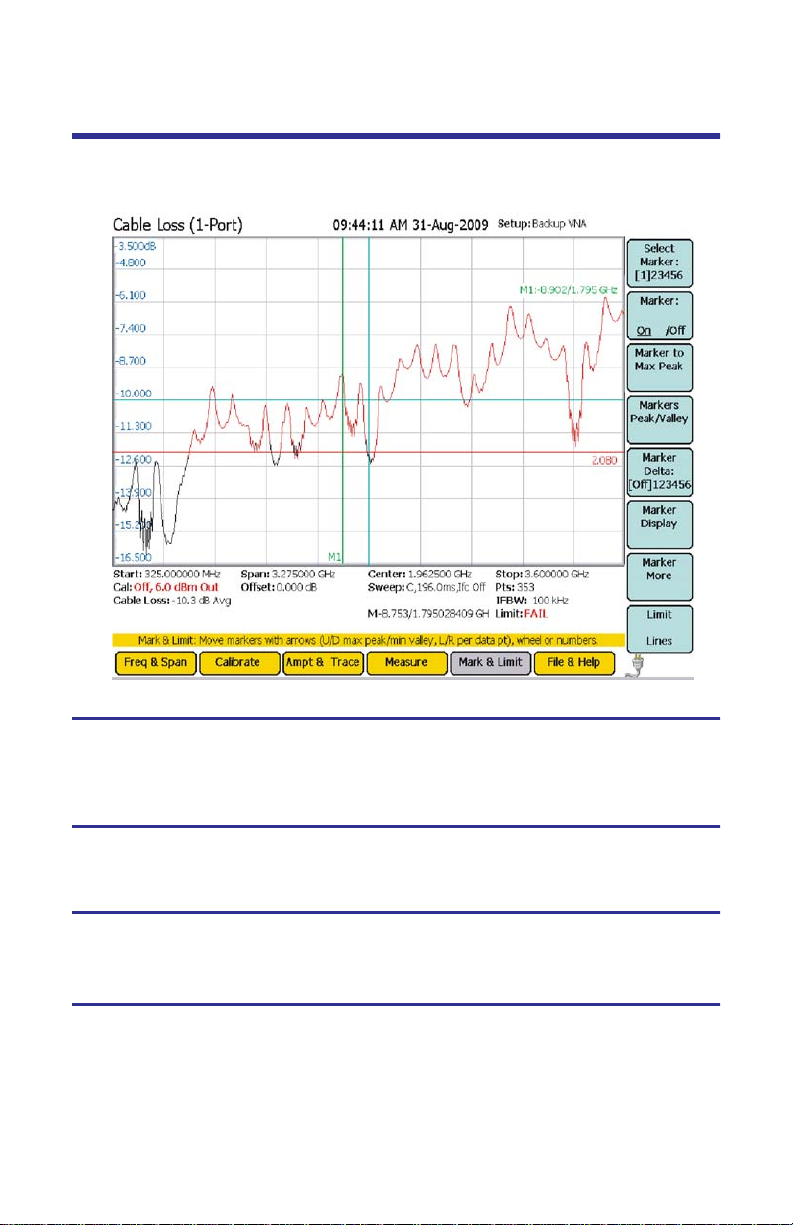
Mark & Limit Menu
Figure 20 Example, Mark & Limit Menu
Select Marker
Changes the active marker. There are six markers to choose from. Pressing the soft
key will cycle through each of the six markers.
Marker On / Off
Turns the Marker on and off.
Marker to Max Peak
Moves the active marker to the highest point on the trace.
Markers to Peak/Valley
Markers Detect
Toggles the functionality of the submenu between finding peaks or finding valleys.
33
Page 56

Threshold Offset
Raises a signal above the noise floor. This filters out low level peaks allowing for
a clear reading.
Marker to Max Peak or Marker to Min Valley
Sets the marker to either the maximum peak or minimum valley depending on
the functionality chosen in Markers Detect. See “Markers Detect” on page 33.
Marker to Next Peak Left or Marker to Next Valley Left
Cycles the active marker to the left through the points on the trace either from
highest peaks or lowest valleys (see “Markers Detect” on page 33) progressing
to the left.
Marker to Next Peak Right or Marker to Next Valley Right
Cycles the active marker to the left through the points on the trace either from
highest peaks or lowest valleys (see “Markers Detect” on page 33) progressing
to the right.
All Markers to Max Peaks or All Markers to Min Valleys
Sets all the markers to either the maximum peaks or minimum valleys depending on the functionality chosen in Markers Detect. See “Markers Detect” on
page 33.
All Markers Off
Turns off all markers on the trace.
Marker Delta
Turns On/Off and displays the delta of the one to five markers.
Marker Display
Marker Type
Sets the current marker to either be displayed as a line or floating
numbered icon.
All Markers Type to Icon
Sets all markers to be displayed as floating numbered icons.
All Markers Type to Line
Sets all markers to be displayed as numbered lines.
Marker Display
Turns On/Off and sets the location of the delta display into one of the four corners of the screen.
34
Page 57

Marker More
Sets the properties of active markers through the following attributes:
RSSI (Received Signal Strength Indicator)
Turns the audio indicator On or Off (an electronic ping). See “Received Signal
Strength Indicator (RSSI)” on page 92.
Volume
Sets the volume of the electronic ping generated from the RSSI.
Marker Freq to Center
Moves the current marker to the center frequency.
Limit Lines
Limit lines give notification of when a signal has reached or gone over a set measurement amount. Limit lines can be moved with arrow keys.
Note: All valid traces are black, and any part of any trace that is out-
side of a limit is red. Red indicates a failed limit.
Limit Upper/Lower
Pick between upper & lower limit line.
Limit On/Off
Pick between limit line on or off.
Limit Alarm On/Off
Pick whether a limit line fail makes the unit beep.
35
Page 58
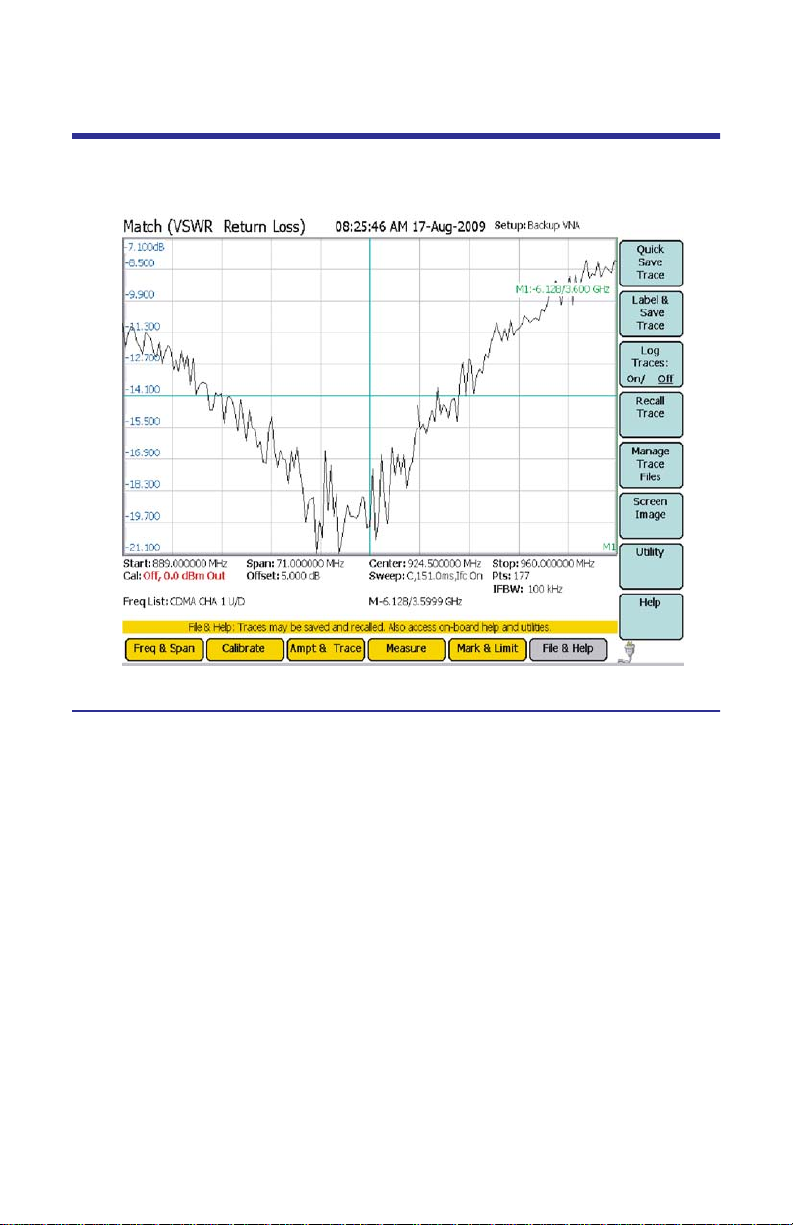
File & Help Menu
Figure 21 Example, File & Help Menu
Quick Save
Saves the trace that is displayed on the screen.
To save the trace:
1. Press the File & Help menu key
2. Press the Quick Save Trace soft key.
The trace is stored as a file in the internal memory of the instrument. Each quick
save is stored in a separate file that is named using the measurement and datetime file naming format: Measurement name(MM-DD HH-MM-SS).shf. Where
the first MM is the month, DD is the day, HH is the hour, the second MM is the
minute, and SS is the second of the time when the file was saved.
The PCTool utility (supplied on the CD that ships with the instrument), enables
copying and/or moving stored files from the internal memory to an external
storage device.
36
Page 59

Label & Save Trace
Labels and saves the trace for future use.
1. Press the Save Trace soft key.
2. Enter a file name using the thumbwheel and arrow keys.
Note: Use the up-and-down arrow keys to move vertically and the
wheel to move horizontally along the Input Panel. Use the right-and-left
keys to toggle between the text fields (Name, Title, etc.)
Figure 22 Example, Save Trace
Log Traces
Press the soft key to turn this function on. Once on, it saves a sweep at a preset
sample rate.
Note: The sample rate can be set from 60 to 3600 seconds.
Recall Trace
Opens up a submenu with three options:
Recall Trace
Displays a saved trace on the screen.
Recall & Compare
Displays a saved trace overlapping over the current trace on the screen.
Note: The Saved trace is orange. The current trace is black.
Clear Recalled Trace
Removes the saved trace from the screen.
37
Page 60
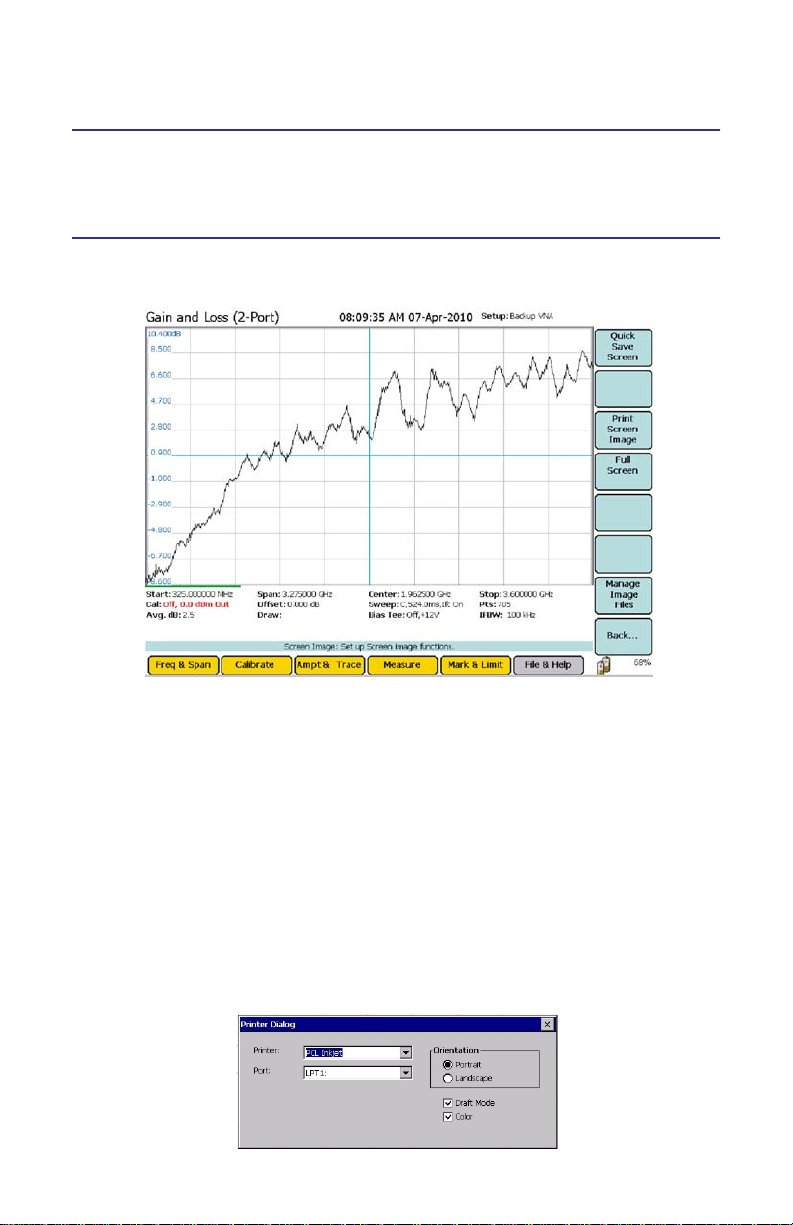
Manage Trace Files
Copy trace files to and from an external storage device (thumbdrive, PC, etc),
and delete traces.
Screen Image
Figure 23 Example, Screen Image
Quick Save Screen
Saves the current trace with a standard naming convention.
Note: Files are saved in .bmp format with the naming convention of
“ScreenDDHHMMSS.bmp”.
Full Screen
Enlarges the graph area to the size of the whole screen. Press escape to go back
to regular screen.
Print Screen Image
Prints the current screen image and presents print setting options for print
adjustment.
Figure 24 Print Screen Menu
38
Page 61

Manage Image Files
Launches the image file manager.
Figure 25 Manage Image Files
Copy Image to USB Drive - Saves selected image to the USB drive.
Copy All Images to USB Drive - Saves all images in the directory to the
USB drive.
Copy Image from USB Drive - Saves image to the internal memory of the
SignalHawk.
Top of List - Selects the image listed at the top of the directory.
Bottom of List - Selects the image listed at the bottom of the directory.
Delete Trace - Deletes the selected image.
Delete All Traces - Deletes all the images listed in the directory.
Utility
See “Utility Main Menu” on page 126.
Help
Enables various Help sections that can be accessed via the soft keys. The Help
sections are listed below:
VNA Help (with Match, DTF, Cable Loss, and Gain & Loss sections)
Spectrum Analyzer Help
Power Meter Help
Custom Help
Note: The DTF section of the VNA Help is also accessible in the DTF
measurement screen.
39
Page 62

40
Page 63

Chapter 3 Vector Network
Analyzer Measurements
In the Vector Network Analyzer mode, the following measurements can be
made:
"Match Measurement" on page 42.
"Distance to Fault (DTF) Measurement" on page 46.
"Cable Loss (1 Port) Measurement" on page 54.
"Gain & Loss (2 Port) Measurement" on page 55.
41
Page 64

Match Measurement
This measurement displays how well matched a system is to a 50 ohm characteristic impedance. Return loss is a measure of impedance mismatch between two
or more circuits.
The SignalHawk can calculate the system match as VSWR, Return Loss, Reflection Coefficient, Match Efficiency % and Reflection %.
Equations
VSWR
VSWR 1 Sqrt Pr Pf+1 Sqrt Pr Pf–=
Return Loss
RL 20 log–=
Reflection Coefficient
1 VSWR–
=
------------------------1 VSWR+
Match efficiency %
MatchEfficiency Percent100 1 Pr Pf–=
Reflection %
100 1 Pr Pf–
1. Measure the output power of the system being tested, or signal power, at
the system’s test port using a power meter, service monitor, or equivalent.
Note: Ensure the output power is less than +22 dBm (160 mW).
2. Power up the SignalHawk.
3. In the Start Menu, use the arrow keys to highlight the desired measurement and press Enter.
4. In the Freq & Span Menu, set the frequency range. See “Freq & Span Menu”
on page 58.
5. Select either Match or Cable Loss measurement.
6. Press Calibrate and press Open, Short, and Load (soft keys) on RF Out with
calibrated open, short, and load on RF Out port.
7. Connect the cable and antenna to the RF Out test port.
Note: Maximum input is +22 dBm (160 mW).
42
Page 65

Figure 26 Example Match Measurement - VSWR
Measurement
Settings
Figure 27 Example Match Measurement - Return Loss
Measurement
Settings
43
Page 66
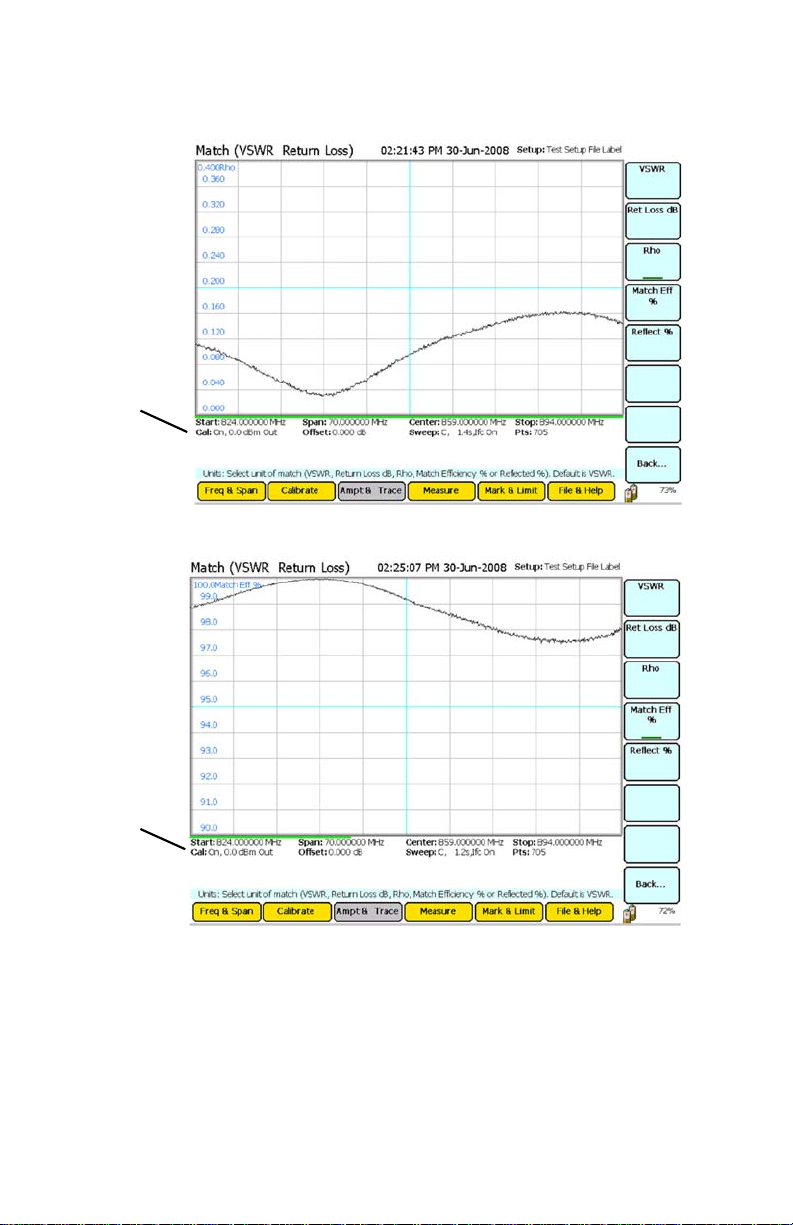
Figure 28 Example Match Measurement - Rho
Measurement
Settings
Figure 29 Example Match Measurement - Percent Efficiency
Measurement
Settings
44
Page 67
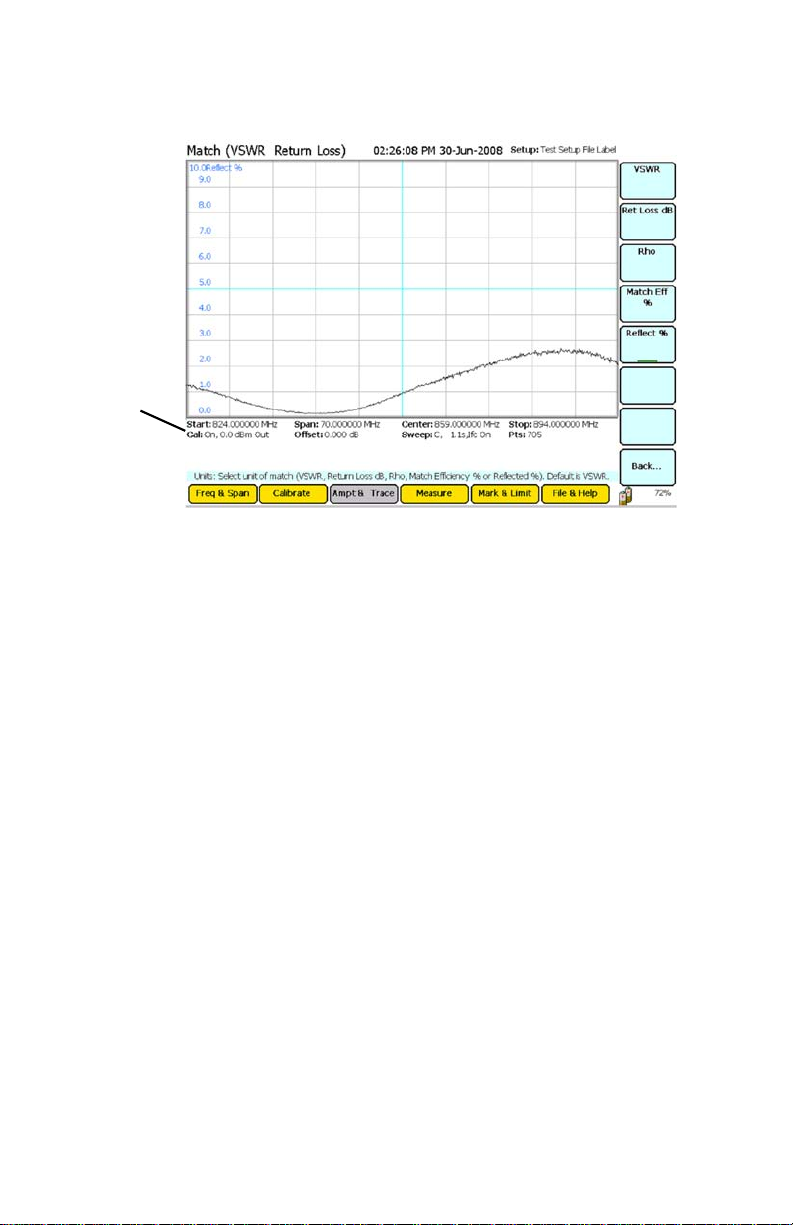
Figure 30 Example Match Measurement - Percent Reflected
Measurement
Settings
45
Page 68

Distance to Fault (DTF) Measurement
This measurement will display the distance to a fault in a given length of cable. The
standard settings for this measurement are Start & Stop Distances, Distance Units,
Cable Velocity Propagation & Loss, and Smoothing. These settings can be adjusted
using either the thumbwheel or keypad.
Note: Changing the frequency span or the max distance will automati-
cally turn calibration off. Always set the frequency span or max distance
before calibrating the unit. The maximum distance measured is determined by the frequency span, the velocity of propagation of the cable
(Vp), and the number of data points to measure these factors. This is discussed in the following paragraphs:
Distance - Normally when a frequency span is specified, the SignalHawk calculates
the maximum measurable distance. For this measurement, the distance to be
measured is entered, see “Start Distance” on page 47 and see “Stop Distance” on
page 48, and the SignalHawk calculates the frequency span. Use the DTF Wizard
to manually enter the cable length. See “Estimated Cable” on page 52.
Note: When the distance is entered manually, be sure to select the
data points before entering the max distance. See “Data Points” on
page 48.
Note: If a maximum distance is less than the total length of the cable
system, the trace may show a spike that is not a fault, but rather an
echo from the portion of the cable that is beyond the length chosen.
Such a spike is known as an alias. To avoid aliasing, always set the
Stop Distance to a value that is a few feet or meters greater than the
entire length of the cable system.
Data Points - If the number of data points increases, the measurable distance
increases. See “Data Points” on page 48.
Frequency Span - If the frequency span narrows, the measurable
distance increases.
Velocity of Propagation - The velocity of propagation is a characteristic of the cable
and is expressed as a percentage. Contact the cable manufacturer to get the velocity
of propagation value for the cable being used.
46
Page 69
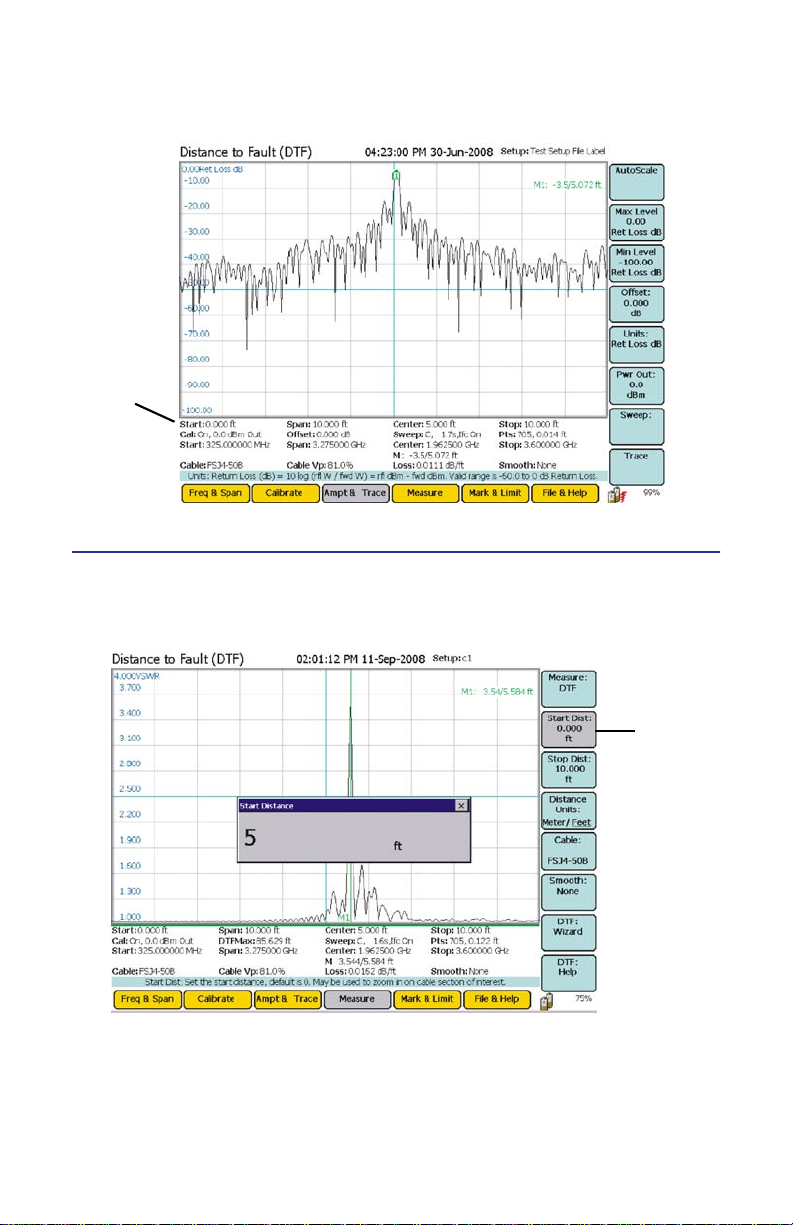
Figure 31 Example, Distance-to-Fault
Measurement
Settings
Start Distance
Sets the starting distance for a measurement within the cable system.
Figure 32 Example, Distance-to-Fault - Start Distance Setting
Setting
47
Page 70
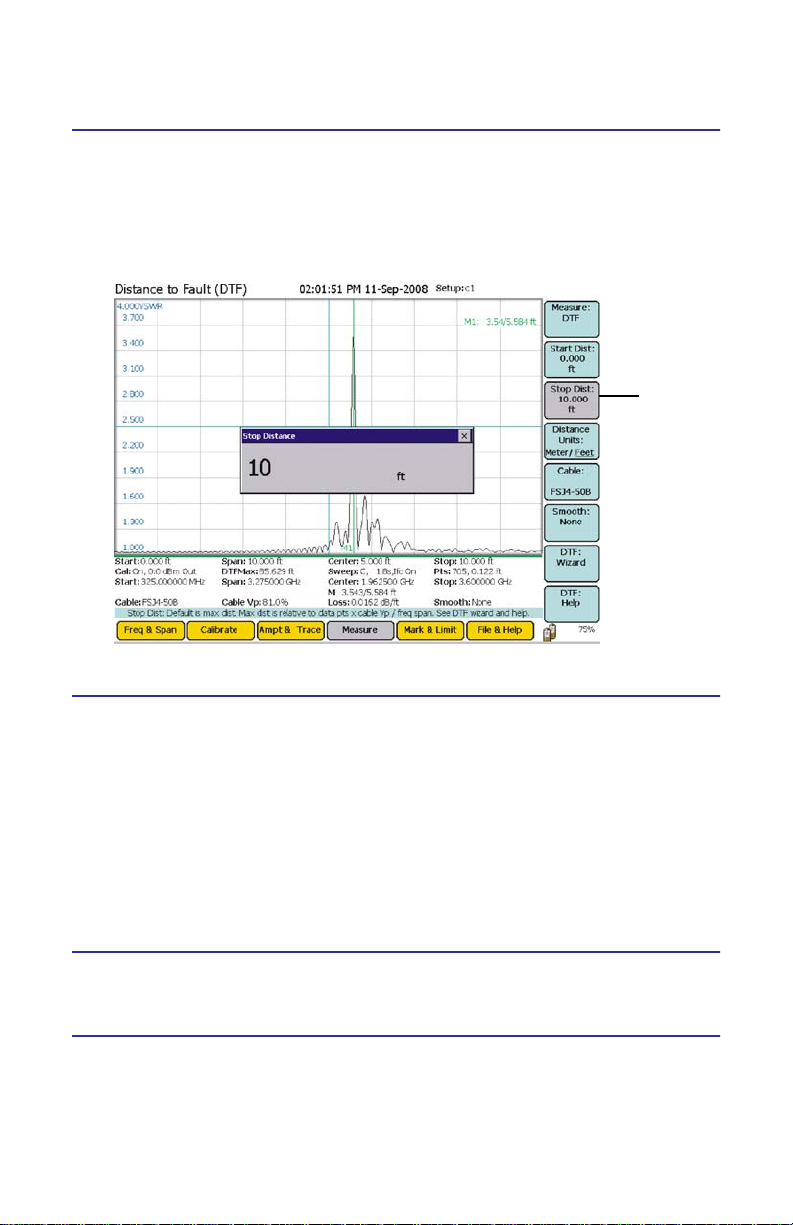
Stop Distance
Sets the stop distance for a measurement within the cable system.
Note: Set the Stop Distance to a value that is a few feet or meters greater
than the entire length of the cable system to avoid aliasing.
Figure 33 Example, Distance-to-Fault - Stop Distance Setting
Setting
Data Points
Note: This is not an option in the measurement, but affects it.
If the number of data points increases, the measurable distance increases (1409
points results in twice the distance of 705 points, and 11265 points results in sixteen times the distance of 705 points) (see “Amplitude” on page 137). When the
number of data points being measured changes, the software automatically computes the new maximum measurable distance. If a maximum distance is entered
manually using the DTF Wizard, be sure to select the data points before entering
the max distance. Changing data points does not turn calibration off.
Distance Units
Sets the measurement units. Toggles between Meters and Feet.
Cable
Sets the parameters of the cable being tested.
48
Page 71

Cable List
Select a specific cable from a list.
Note: Custom cables can be added to the list. See “Customizing Sig-
nalHawk Content” on page 129.
Figure 34 Example, Distance-to-Fault - Cable Setting - Cable List
Settings
Velocity
Sets the speed of the signal going through the cable being measured.
Note: Changing this setting cancels any selection on the Cable List
and changes that setting to “None.”
Figure 35 Example, Distance-to-Fault - Cable Setting - Velocity
Setting
49
Page 72

Loss
Applies an offset to compensate for cable loss.
Note: Changing this setting cancels any selection on the Cable List
and changes that setting to “None.”
Figure 36 Example, Distance-to-Fault - Cable Setting - Cable Loss
Settings
Smooth
Smoothes the trace line on the display. It can be set to one of four
tolerances: None, Low, Medium, and High.
Figure 37 Example, Distance-to-Fault - Smooth
50
Settings
Page 73

DTF Wizard
Note: Maximum allowed distance and resolution per point is a com-
plex function of the cable and frequency settings. Use the DTF wizard if
the SignalHawk is having issues resolving these functions.
When the DTF Wizard soft key is pressed, a window with a set of adjustable variables will open in the display. Left/right arrow keys change the fields, while up/
down arrow keys, the thumbwheel, and the number pad change each field’s
value.
The DTF Wizard takes the guesswork out of setting up a fault-location measurement by requiring knowledge of the type of cable used in the system, total length
to the antenna and the desired accuracy of the location of the fault. The DTF Wizard automatically calculates and sets the best parameters of stop distance points
and frequency settings.
A Cable List soft key is available. Pressing this will display a series of cables to
choose from. The settings for the selected cable will then be displayed in the
variable fields. The variables are:
Vp (Velocity)
Sets the speed of the signal going through the cable being measured.
Figure 38 Example, Distance-to-Fault - DTF Wizard - VP
Note: The wizard will automatically apply velocity and loss
to their fields.
51
Page 74
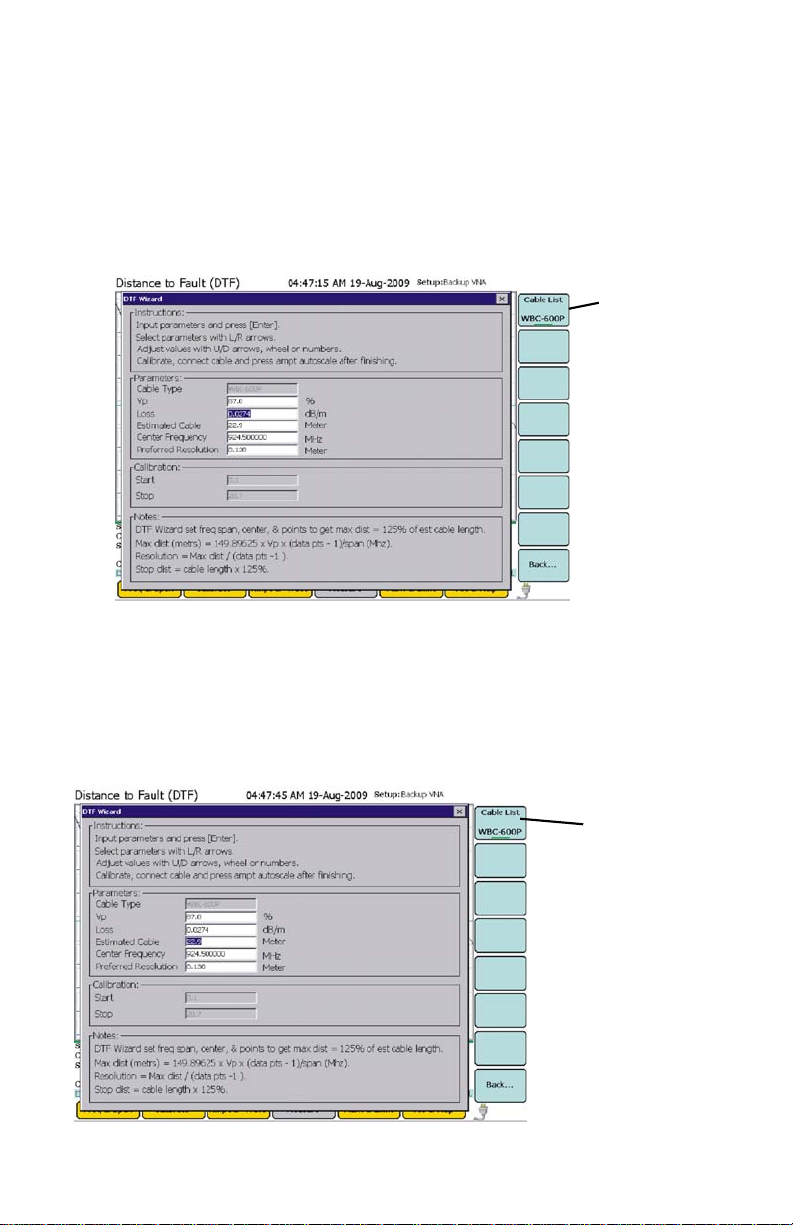
Loss
Offsets the signal to compensate for cable loss. Using the soft keys,
this can be set in either dB/m or dB/ft.
Note: The wizard will automatically apply velocity and loss to their
fields.
Figure 39 Example, Distance-to-Fault - DTF Wizard - Loss
Settings
Estimated Cable
Sets the length or, if length is unknown, the estimated length of the cable being tested.
Using the soft keys, this can be set in both Meter and Feet units.
Note: The stop distance automatically sets at125% of the entered
value to help prevent potential false spikes on the trace.
Figure 40 Example, Distance-to-Fault - DTF Wizard - Estimated Cable
52
Settings
Page 75
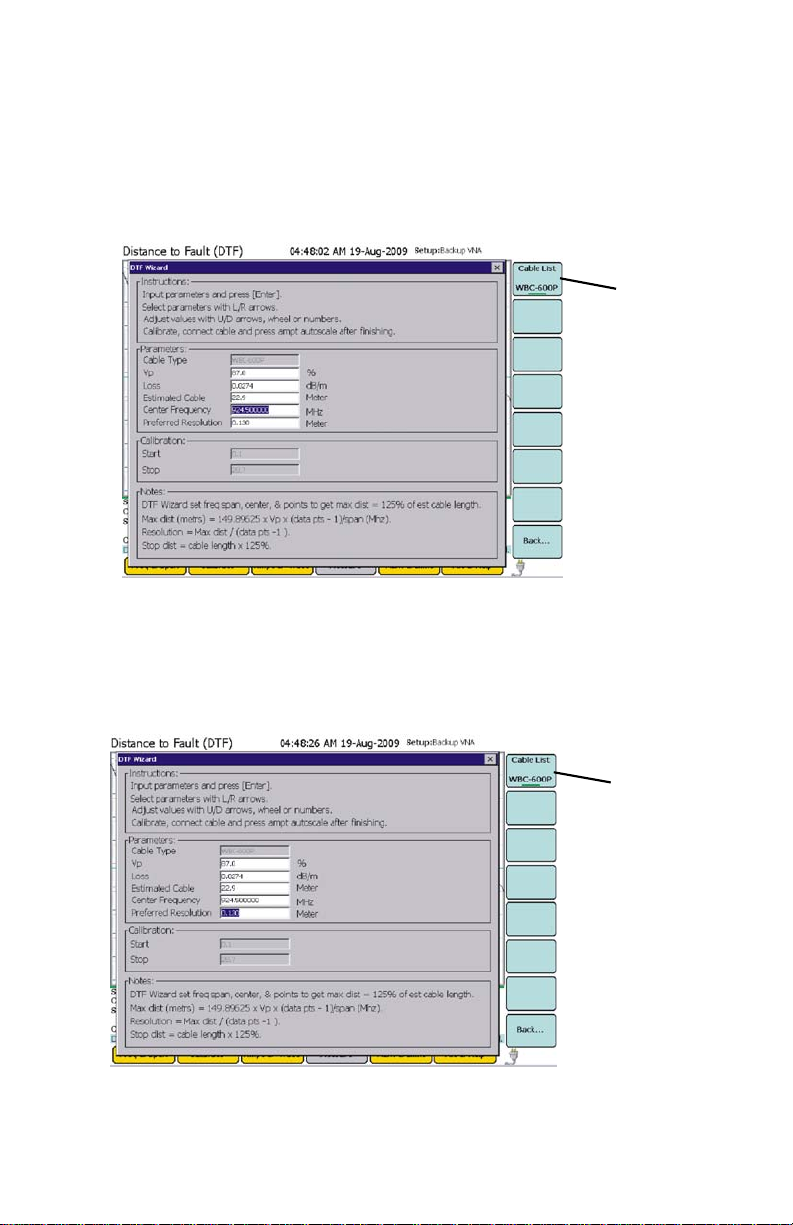
Center Frequency
Sets the center frequency of the trace to allow for the most accurate reading as
possible, whether testing antennas, filters and the like. Using the soft keys, this
can be set in Hz, kHz, MHz, and GHz.
Figure 41 Example, Distance-to-Fault - DTF Wizard - Center Frequency
Settings
Preferred Resolution
Sets the desired resolution, or distance each pixel of the display
covers, of the signal being tested. Using the soft keys, this can be set in Meters
and Feet.
Figure 42 Example, Distance-to-Fault - DTF Wizard - Preferred Resolution
Settings
Once all variables are set, press the enter key to begin Calibration. See “Calibrate Menu” on page 27.
53
Page 76
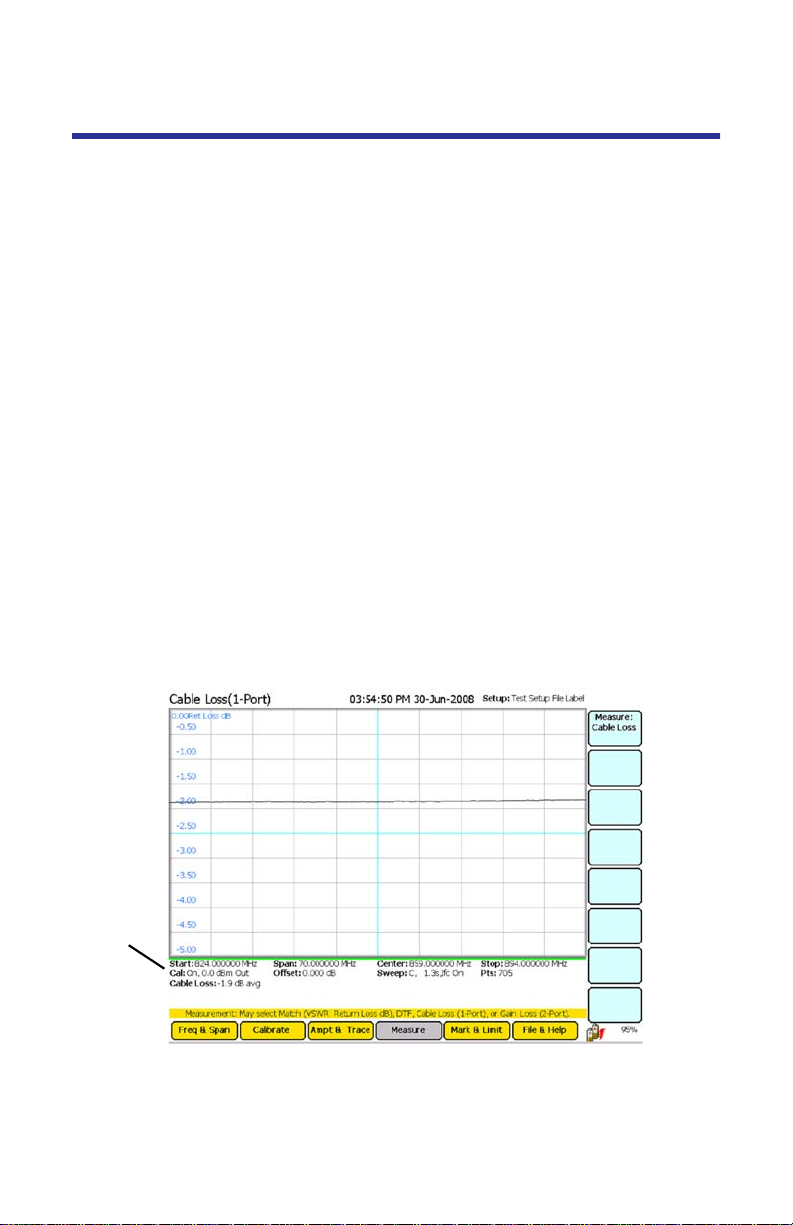
Cable Loss (1 Port) Measurement
This one-port reflection measurement measures the insertion loss of a cable. To
measure cable loss, make sure that the cable being tested is not terminated (not
connected to anything at the far end).
1. Ensure that the correct adapters, connectors, and a Bird Calibration Combination (cal combo) are used. The frequency band of the system will also be
needed.
2. If necessary, connect a phase-stable cable to the test port and
connect a Cal Combo to the other end of the cable.
3. Calibrate the SignalHawk. See “Calibrate Menu” on page 27.
Note: After calibration, with the load still connected, the output
must be below -25 dB. If it is not, there is a problem.
4. Remove the Cal Combo unit from the cable.
Note: Do not disconnect the phase stable cable if used.
5. Connect the cable to be tested to the phase stable cable or test port.
6. Connect Short calibration standard or Short connection on the Cal Combo
unit to the other end of the cable being tested.
Note: The cable loss as a function of frequency is displayed as the
average cable loss displayed in the footer.
Figure 43 Example Cable Loss
Measurement
Settings
54
Page 77
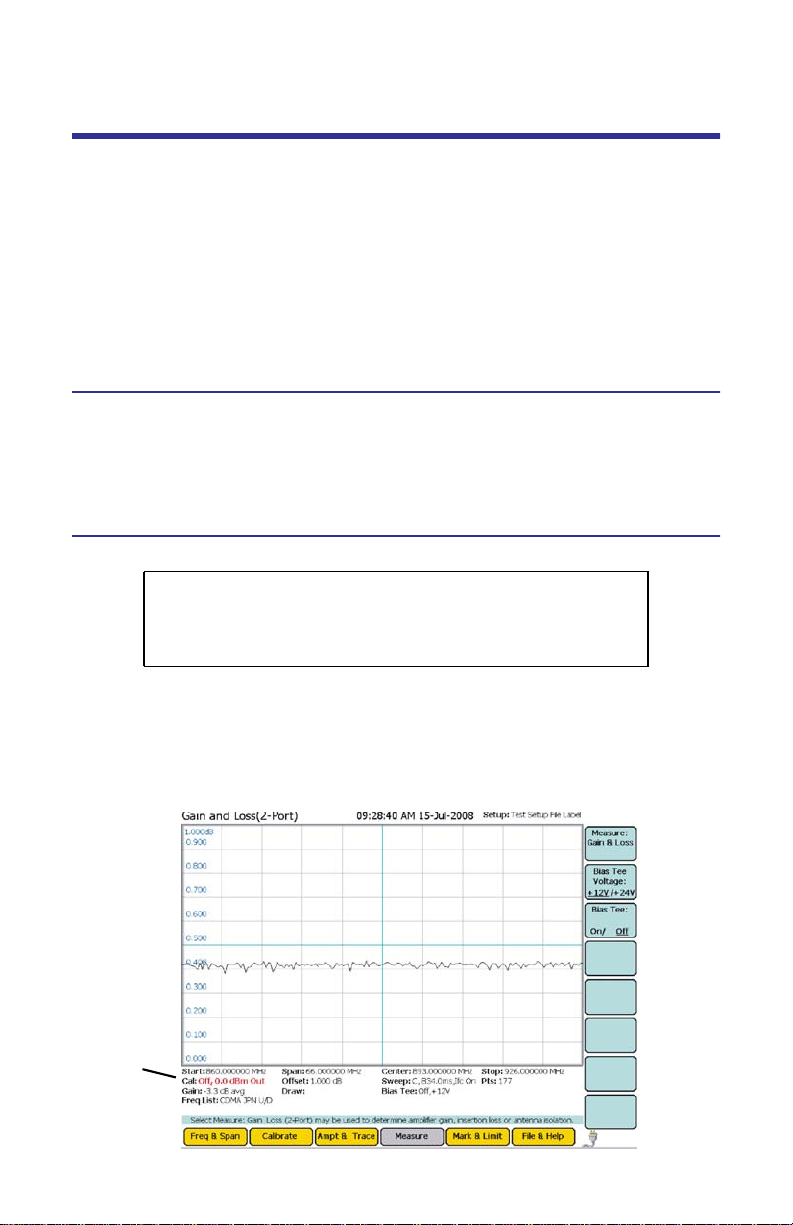
Gain & Loss (2 Port) Measurement
y
This two-port thru measurement is used to test the insertion gain and loss of a
cable. To run this measurement, connect the transmitter of the device being
tested to Port 1 and the receiver of the device to Port 2. Transmission loss or gain
will be negative if the device has a loss and positive if the device has a gain.
V
Transmitted
------------------------------ -=
V
Incident
Note: When measuring antenna isolation in the -80 to
-90 dB range, the IFBW setting needs to be 100 Hz.
Bias Tee Voltage
Adjusts the reading to compensate for any DC voltage added from a bias tee
attached to the RF line being tested. The SignalHawk puts a 12V or 24V power
supply voltage onto the RF line, so the same line is carrying RF data & power.
Then it measures how much current is being drawn from the line.
Bias Tee
CAUTION
Do not turn on a DC bias if the thru cable is attached from
the VNA In to the VNA Out. This will damage the VNA input
and destroy the unit.
Turns the Bias Tee compensator on and off. When this is on, it will display the
current draw from the bias tee on the bottom of the display.
Note: Overdrawing from the bias tee will cause an automatic shut
down of the bias tee. The current overdraw limit is 1,000 mA.
Figure 44 Example Gain & Loss
Measurement
Settings
55
Page 78

56
Page 79

Chapter 4 Spectrum Analyzer Settings
The use of proper settings is very important for obtaining the most accurate
information possible. The SignalHawk can be configured in various ways, allowing for a wide range of measurement capabilities.
Core Soft Key Functions
“Soft Keys” serve multiple functions on the SignalHawk. There are four core
functions:
1. On/Off Button - Push to toggle between activating or deactivating a function.
2. Pop-Up Menu Button - Push to open pop-up lists and drop menus. Use the
arrow key, wheel, etc. to select from the menu
(e.g. Freq list).
3. Highlight Button - Push to highlight editable items (e.g. Freq).
4. Trigger Event Button - Push to start a function (Full Span).
57
Page 80

Freq & Span Menu
Figure 45 Freq & Span Menu
In the Freq & Span Menu, the range of frequencies to be tested is specified. The
Spectrum Analyzer can sweep frequencies between 100 kHz and 3.6 GHz.
Frequencies can be selected at spans from 1 kHz up to the entire range of the
instrument.
Note: Information obtained from readings set below the minimum
rating may not be accurate.
These frequencies can be set to sweep by one of the following methods:
Set the Center Freq and Freq Span.
Set the Start Freq and Stop Freq.
Select the Full Span of the instrument.
Select a band from the Freq List.
The most common of these methods is to set the center frequency and a frequency span (a range) and let SignalHawk calculate the start and stop frequencies. Reducing the span (with RBW and VBW both on auto modes) will
usually speed up the sweep, provide more detail, and lower the noise floor.
Unless specified otherwise, set the center frequency to the center of the signal being measured.
58
Page 81

Start / Stop Freq and Center / Span
These settings control the frequency range being swept.
Note: “Center / Span” are used in this manual, but using “Start / Stop
Freq” achieves the same results.
When the soft key is pressed, the corresponding selection is highlighted. The following can then be performed:
Up/Down Arrow Keys: Increase and decrease the frequency or span in
small steps.
Left/Right Arrow Keys: Increase and decrease the frequency or span in
large steps.
Thumbwheel: Each click of the thumbwheel changes the frequency or
span by the value of the “Wheel Step” soft key.
Number Keys: Press any key to open a box to type the new frequency
into. If a mistake is made, press “Esc/Back.” When done, press enter
(to keep the same frequency units) or press the soft key corresponding
to the desired units.
Wheel Step
When a frequency function is active and the thumbwheel is turned, the value
will change in steps of the “Wheel Step”. After pressing the “Wheel Step” soft
key to highlight it, the following is enabled:
Up/Down Arrow Keys and Thumbwheel: Change the step value by 10
kHz per press of the arrow key or click of the thumbwheel.
Left/Right Arrow Keys: Change the step value by 1 MHz per press of
the arrow key.
Number Keys: Press any key to open a box to type the new frequency
into. When done, press enter (to keep the same frequency units) or
press the soft key corresponding to the desired units.
Full Span
Sets the Start Freq to 0 and the Stop Freq to the maximum frequency of the
unit.
Note: The accuracy spec does not apply below the minimum freq of
the unit (100 kHz). The start frequency can be set to 0 as a convenience.
Freq List
Opens a list of predefined frequency bands. Use the up/down arrows and thumbwheel to scroll to the desired band then press the “Select” soft key to use it.
Recently used bands are displayed at the top of the list.
59
Page 82

Note: Channelized bands are denoted on the Frequency List by a plus
sign (+).
Adding Custom Frequencies
See “Customizing SignalHawk Content” on page 129.
Figure 46 Example, Freq List
Recently Used Bands
60
Page 83
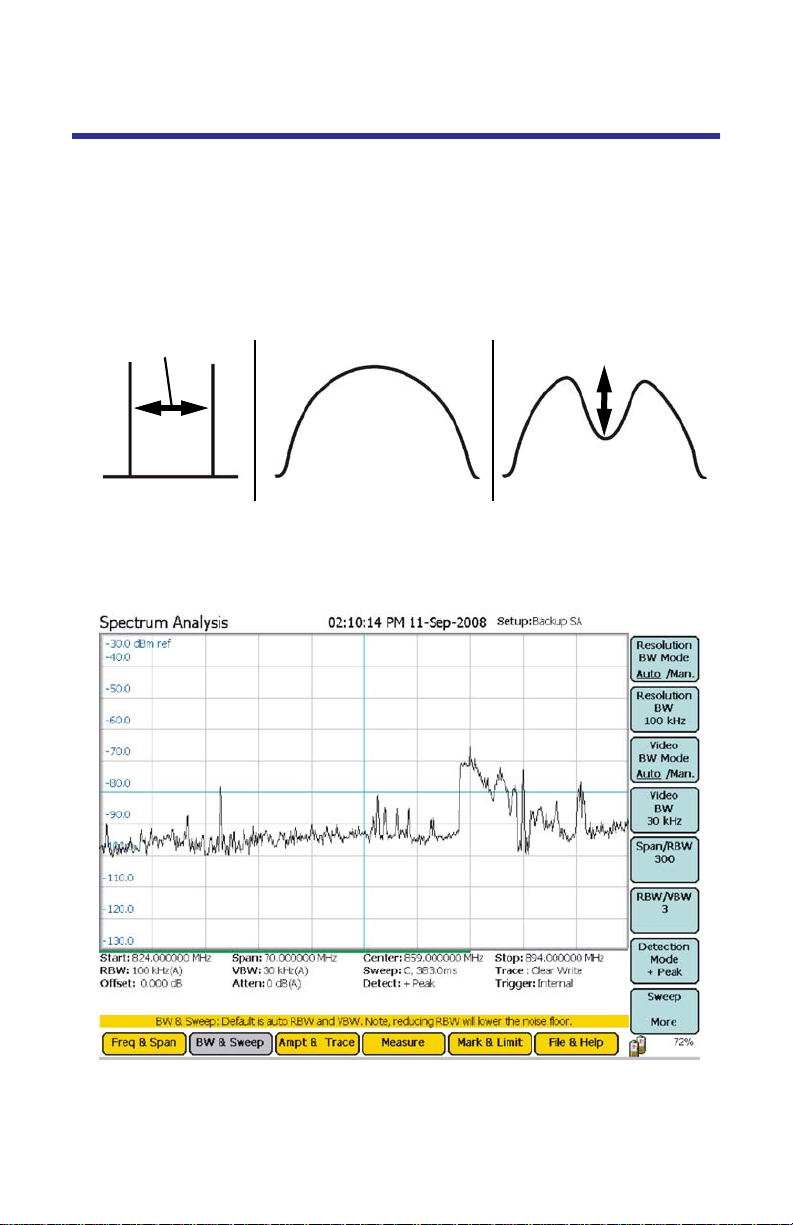
BW & Sweep Menu
The bandwidth menu includes functions that control sweep speed and accuracy.
It can also customize sweep triggers.
When two signals are separated by a freq distance equal to the Resolution BW
(RBW), a 3 dB dip between them will appear on the screen. This is the minimum
resolvable frequency spacing. The soft key legend displays the current value.
Figure 47 Signal Representation
Separation
3 dB
Actual Input
RBW > Separation
RBW = Separation
Lowering the RBW will lower the noise floor, which can make low-power signals
easier to see and make readings close to the noise floor more accurate.
Figure 48 Example, BW & Sweep Menu
Press the Resolution BW soft key then use the arrow keys or the thumbwheel to
enter the desired bandwidth.
61
Page 84

RBW goes from 100 Hz - 1 MHz in steps of 1 / 3 / 10 (e.g., 1 kHz to 3 kHz to 10 kHz
to 30 kHz, etc.)
Video Bandwidth (VBW) determines how much smoothing is performed on a
video converted signal before the trace is displayed.
Note: VBW goes from 10 Hz to 300 kHz.
Wide (high) VBW setting: Faster sweep times, but can obscure signal
details.
Narrow (lower) VBW setting: Better trace smoothing for signals pres-
ent in high noise levels.
As the VBW is reduced, longer sweep times will be necessary to obtain a measurement. To be useful, VBW must be narrower than RBW. No smoothing takes
place when VBW is greater than or equal to RBW.
Resolution BW Mode
Selects RBW mode and also toggles between automatic and manual control. In
automatic, RBW is controlled by the current span and the values of Span/RBW
and RBW/VBW. If the RBW is changed, the mode will switch to manual.
Auto RBW sets the RBW based upon the frequency span. When in Auto mode,
the RBW is set according to the nearest ratio of the Span/RBW selection. The
default ratio is 300. When the frequency span is reduced, the RBW will also be
reduced accordingly.
Example - When the span is changed to 3600 MHz, the RBW
will automatically be set to 1 MHz. When the span is reduced
to 100 MHz, the RBW will automatically reduce to 300 kHz.
Resolution BW
Click on the selection to highlight it. Then:
Up/Down Keys - Change the bandwidth incrementally.
Left/Right Keys - Change the bandwidth from min to max.
Thumbwheel - Change the bandwidth incrementally.
Video BW Mode
Selects VBW mode and also toggles between automatic and manual control. In
automatic, VBW is controlled by the current span and the values of Span/RBW
and RBW/VBW. If the VBW is changed, the mode will switch to manual.
62
Page 85

Auto VBW sets the VBW based upon the RBW value. When in Auto mode, the
VBW is set according to the nearest ratio as set using the VBW/RBW selection.
The default ratio is 3. As the RBW span is reduced the VBW will be reduced
accordingly.
Example - When the RBW is changed to 1MHz, the VBW
will automatically be set to 300kHz. When the RBW is
reduced to 30kHz, the VBW will automatically be set to
10kHz.
Video BW
Click on the selection to highlight it. Then:
Up/Down Keys - Change the bandwidth incrementally.
Left/Right Keys - Change the bandwidth from min to max.
Thumbwheel - Change the bandwidth incrementally.
Span/RBW
Press the Span/RBW soft key then use the arrow keys or the thumbwheel to enter the
desired ratio. Values range from 10 to 3600 in steps of one.
When RBW Mode is set to Auto, the ratio of frequency span to RBW determines how the RBW tracks the frequency span. This value is ignored when
RBW is set to Manual, in which the soft key legend displays the current value.
Up and Down Arrow Keys - Press these keys to increase or
decrease the ratio in steps of one.
Left and Right Arrow Keys - Press these keys to enter the minimum ratio
(left-arrow) or the maximum ratio (right-arrow).
Thumbwheel - Rotate the thumbwheel to increase or
decrease the ratio in steps of one.
RBW / VBW
Pressing this key brings up a list of allowed values for RBW / VBW. When VBW is set
to auto, the RBW is divided by this value and set as the VBW.
63
Page 86
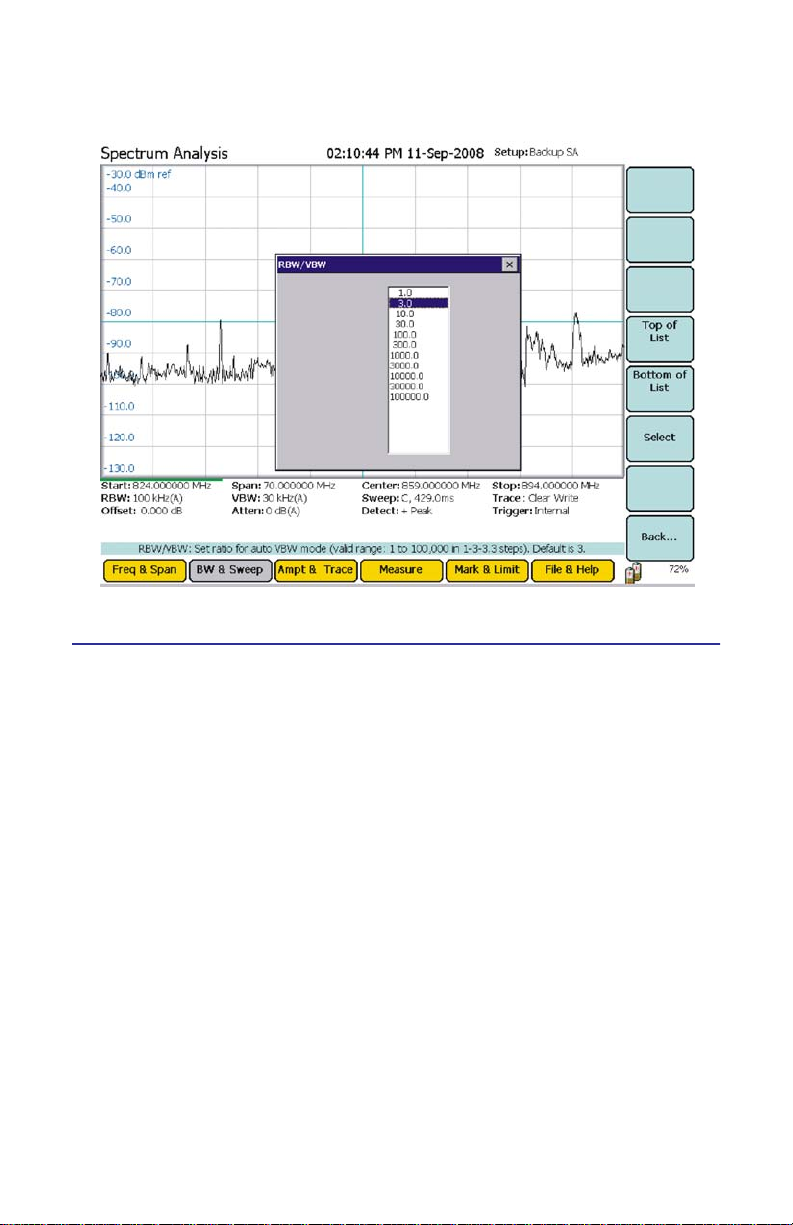
Figure 49 Example, RBW/VBW
Detection Mode
Depending on measurement settings, more data points are collected than there
are pixels on the screen. Detection modes allow the user to choose how the collected data in each pixel is represented.
+ Peak Detection
Returns the maximum value of the data collected for each display pixel. Recommended for pure sine waves or narrow bandwidth signals. In zero-span mode, it
acts like a peak detector and can be used to show AM band frequencies.
- Peak Detection
Returns the minimum value of the data collected for each display pixel. Recommended for displaying the difference between CW and pulsed signals.
Sample Detection
Returns a sample of the data collected for each display pixel. Use this method
for detecting noise-like signals.
Average Power
Returns the average of the data collected for each display pixel. Recommended
for noise-reduction.
64
Page 87

Figure 50 Example, Detection Mode
Sweep More
Sweep sets up the properties of individual sweeps that the SignalHawk performs. It can set whether the sweeping is continuous or
single, and the properties of video triggers (if enabled).
Continuous
Free Rep - Sweeps the measurement span continuously.
Figure 51 Example, Sweep More - Continuous Sweep
65
Page 88

Single
Performs a single sweep. Before a single sweep is triggered, the SignalHawk will
display the previous sweep. To begin a sweep, press the Manual Trigger soft
key. After the sweep finishes, it will display the results and stop sweeping.
Trigger - Sets the type of trigger that initiates a sweep. There are four types of
trigger to choose from:
Internal Continuous - Sweeps continuously and is controlled by the Sig-
nalHawk.
Internal Single - Sweeps once when triggered. Controlled by the Signal-
Hawk through the Arm Trigger soft key.
External Continuous - See “External Trigger” below.
External Single - See “External Trigger” below.
Note: Useful for signals that are time varying, such as ones that
change slow enough to trigger manually as well as carrier/interference ratios. See “Carrier-to-Interference Ratio” on page 94.
Arm Trigger - Manually initiates a sweep.
External Trigger
External - Low Level / High Level / Rise Edge / Fall Edge / Either Edge
Low Level - Triggers if input = 0 ± 0.5 V (TTL “Low”).
High Level - Triggers if input = 4.2 ± 0.8 V (TTL “High”).
Rise Edge - Triggers if the input goes from “Low” to “High”.
Fall Edge - Triggers if the input goes from “High” to “Low”.
Either Edge - Triggers if the input goes from either “High” to “Low” OR
“Low” to “High”.
Gate Delay
Length of wait after the trigger signal and before beginning a sweep. The range
is 100 μs to 1 s.
66
Page 89
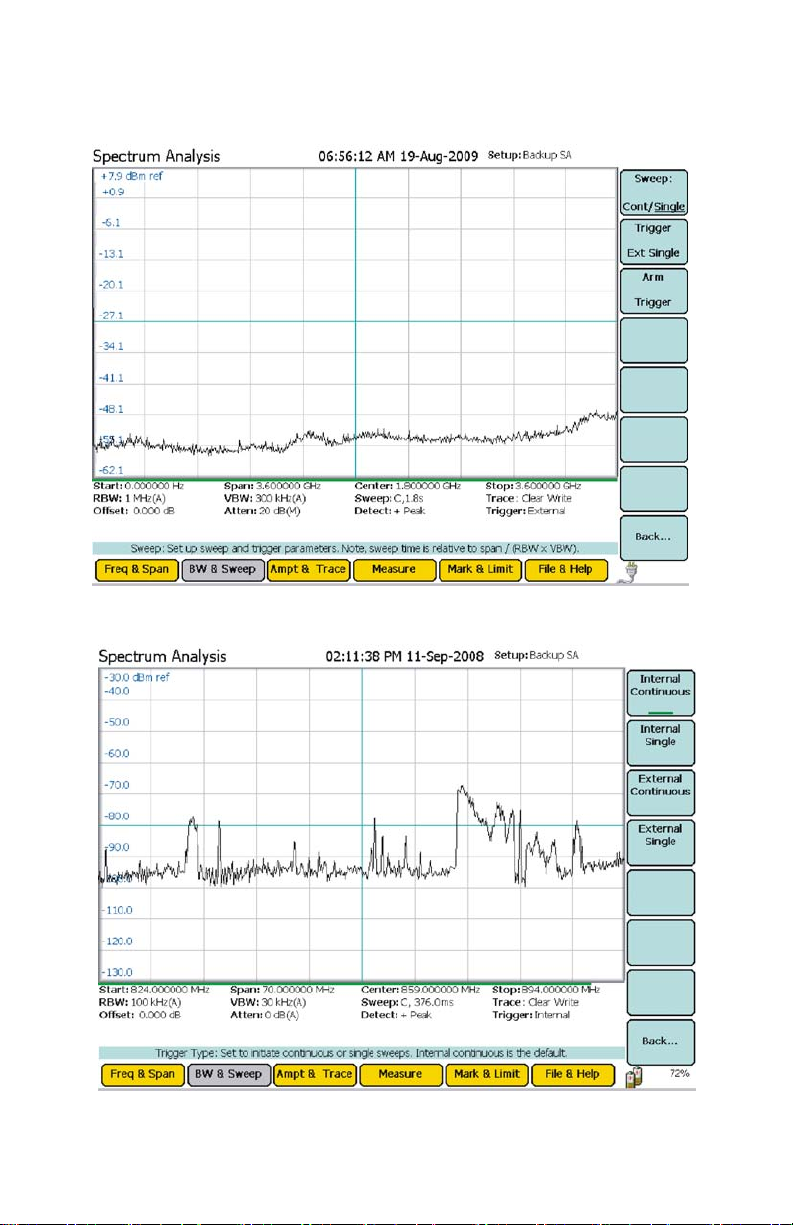
Figure 52 Example, Sweep More - Single
Figure 53 Example, Sweep More - Trigger
67
Page 90
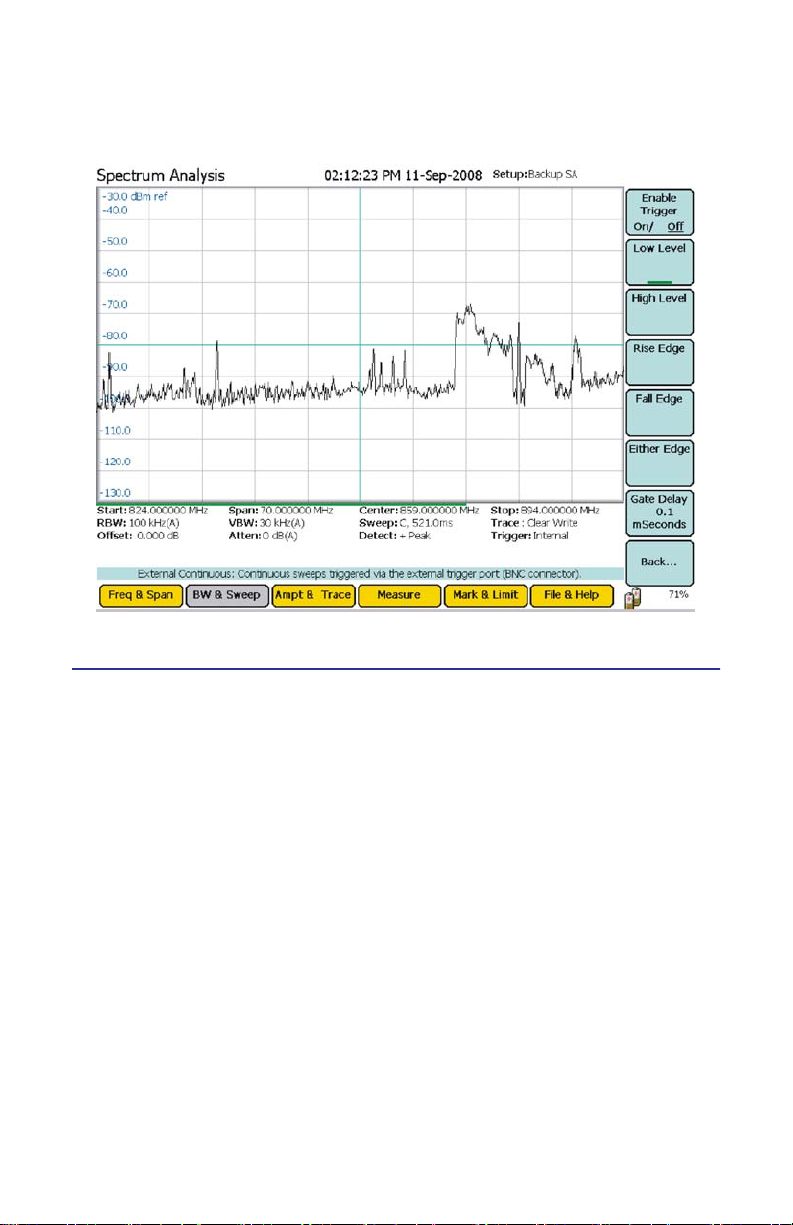
Figure 54 Example, Low Level / High Level / Rise Edge / Fall Edge /
Either Edge
Video
Note: This can only be used if the Time Domain measurement is
enabled. See “Time Domain (Zero Span)” on page 91.
Trigger control and sweeping both happen on the radio frequency
connector. Once a sweep is done, it will be displayed until a trigger condition
occurs again and it performs another sweep. This is used in zero-span mode.
In order to use this function, the trigger condition needs to be set up:
1. Monitor the RF data to determine the trigger condition.
2. Set the power level at center freq.
3. Set the trigger level:
High Level - Trigger if dBm rises ABOVE the power level.
Low Level - Trigger if dBm falls BELOW the power level.
4. Enable the trigger.
68
Page 91
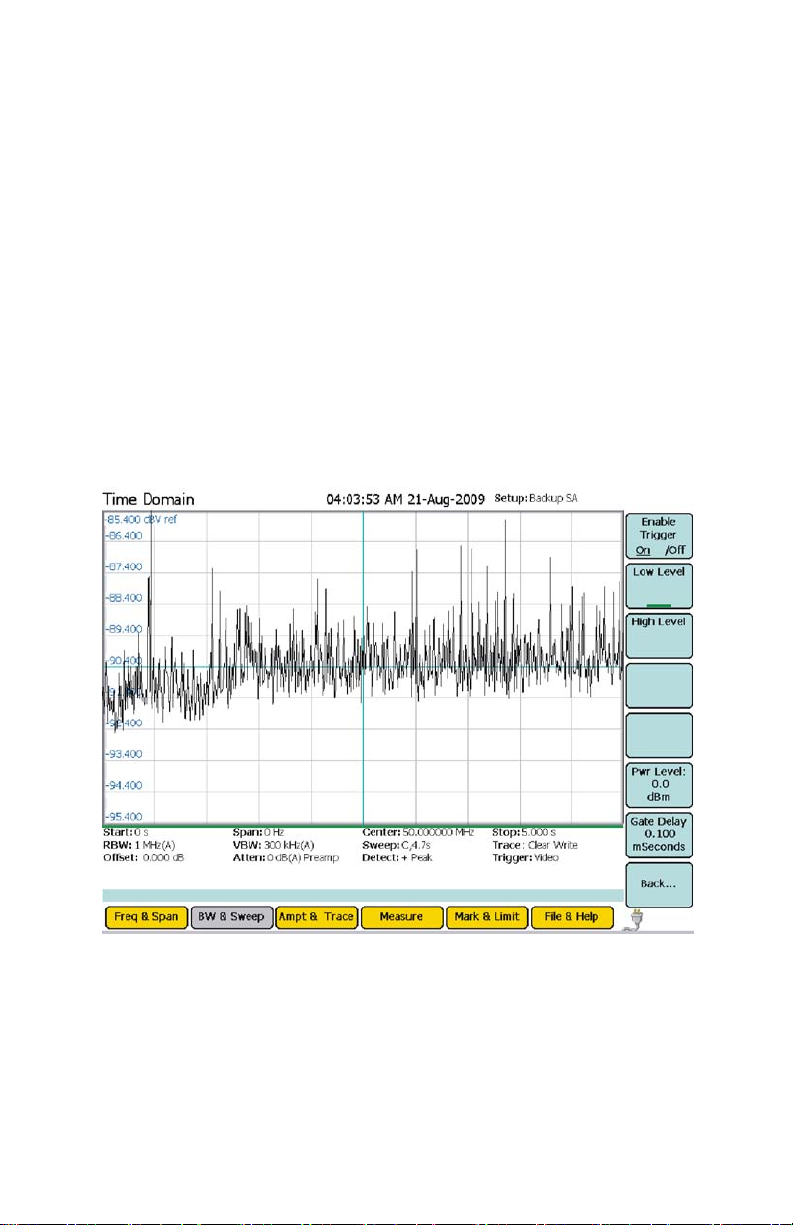
External - Low Level / High Level / Rise Edge / Fall Edge / Either Edge
Low Level - Triggers if input = 0 ± 0.5 V (TTL “Low”).
High Level - Triggers if input = 4.2 ± 0.8 V (TTL “High”).
Rise Edge - Triggers if the input goes from “Low” to “High”.
Fall Edge - Triggers if the input goes from “High” to “Low”.
Either Edge - Triggers if the input goes from either “High” to “Low” OR
“Low” to “High”.
Gate Delay
Length of wait after the trigger signal and before beginning a sweep. The range
is 100 μs to 1 s.
Figure 55 Example, Video
69
Page 92
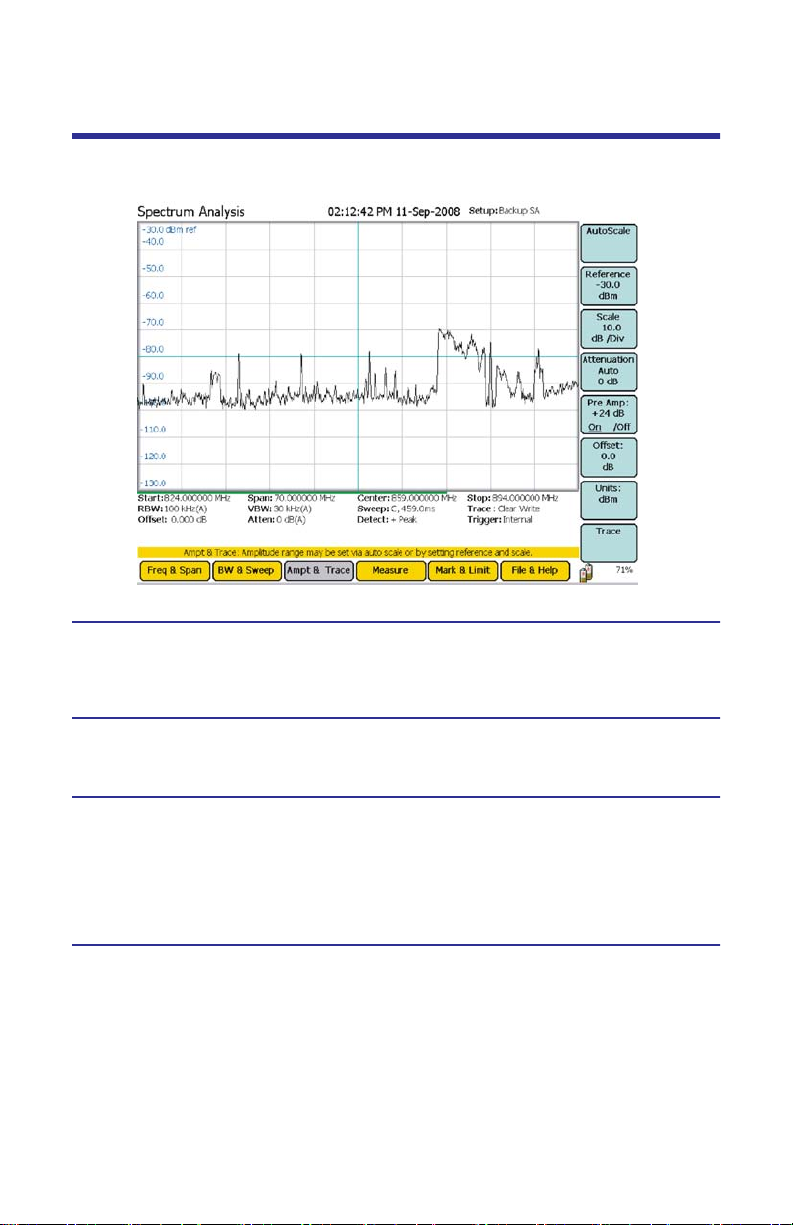
Ampt & Trace Menu
Figure 56 Example, Ampt & Trace Menu
Autoscale
Resizes the graph to fit the whole trace on the screen. This function changes the
reference and scale of a trace.
Reference
Sets the y-axis value at the top of the graph.
Scale
Sets the dB value of each partition of the graph on a scale from 1 to 15. The
graph is partitioned into 10 divisions, giving a set number of dB per division.
Note: This soft key is not displayed if the Units of measure is in Volt
or Watt. See “Units” on page 71.
Attenuation
Controls the built-in attenuator on the signal input. This reduces the amplitude of a
high-powered signal. The attenuation can be set to Auto, or at levels of 0, 10, 20,
and 30 dB. The reported value of the signal is automatically corrected for the
selected attenuation.
Note: When the Reference (see “Reference”) is set to a higher set-
ting, Attenuation will automatically set itself above this setting.
Example - When the Reference is set to 25 dBm, Attenuation
automatically sets itself to 30 dB and cannot be lowered.
70
Page 93

Preamp
Controls the built-in amplifier on the signal input. This lowers the noise floor,
allowing very low power signals be detected, by giving a 24 dB nominal gain boost.
Note: Attenuation is automatically disabled to 0 when Preamp is
activated.
Note: The preamp should not be used with input signals greater than
-30 dBm.
Offset
Shifts the signal to compensate for external factors (attenuation, couplers,
amplifiers, etc.). This allows for a true signal level reading.
1. Measure the total amount of loss for all attached signal devices.
2. Enter the measured amount as the Offset value or gain.
Example - The system has 10 dB of loss due the use of a coupler;
enter the value of 10 in the Offset. Offset range is -100 to +100.
Units
Sets the units to be displayed on the graph.
dBm
dBm 10 Log Power Watts30dB+=
dBuV
dBm dBuV 10
50log90––=
dBmV
dBm dBmV 10
50log 30––=
dBV
dBm dBV 10
50log 30+–=
Volts
Note: Selecting this unit will disable the Scale option. See “Scale” on
page 70.
dBm 20 Log Power Volts= 30dB+
Watts
Note: Selecting this unit will disable the Scale option. See “Scale” on
page 70.
Watts 10dBm 30–10=
71
Page 94

Trace
Opens a trace submenu with the following options:
Clear Write
Switches off the Average and Max Hold functions.
Max Hold
Holds and displays the highest point of any given sweep until Max Hold is turned
off.
Min Hold
Holds and displays the lowest point of any given sweep until Min Hold is turned
off.
Average
Displays the running average of multiple readings.
Note: This is used to smooth a signal and decrease noise amplitude.
Average Readings
Sets the number of average readings.
Note: The valid range is from 2 to 1024.
Reset Average
Resets the current running average of multiple readings.
Water Fall
See “Water Fall” on page 32.
72
Page 95
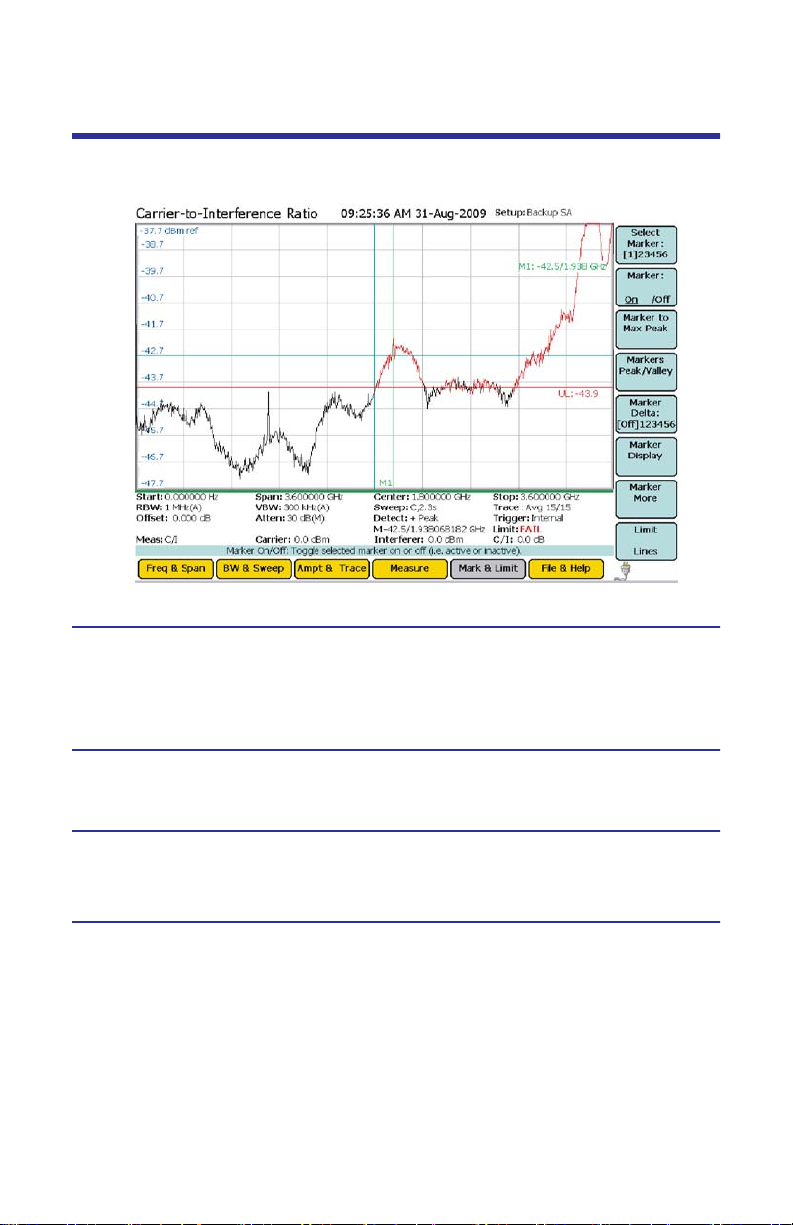
Mark & Limit Menu
Figure 57 Example, Mark & Limit Menu
Select Marker
Changes the active marker. There are six markers to choose from
(measurements that use some of the markers for data display have less selectable
markers). Pressing the soft key will cycle through each of the six markers.
Marker On / Off
Turns a Marker on and off.
Marker to Max Peak
Moves the active marker to the highest point on the trace.
Markers to Peak/Valley
Markers Detect
Toggles the functionality of the submenu between finding peaks or finding valleys.
Threshold Offset
Raises a signal above the noise floor. This filters out low level peaks allowing for
a clear reading.
73
Page 96

Marker to Max Peak or Marker to Min Valley
Sets the marker to the either the maximum peak or minimum valley depending on
the functionality chosen in Markers Detect. See “Markers Detect” on page 73.
Marker to Next Peak Left or Marker to Next Valley Left
Cycles the active marker to the left through the points on the trace either from
highest peaks or lowest valleys (see “Markers Detect” on page 73) progressing
to the left.
Marker to Next Peak Right or Marker to Next Valley Right
Cycles the active marker to the right through the points on the trace either from
highest peaks or lowest valleys (see “Markers Detect” on page 73) progressing
to the right.
All Markers to Max Peaks or All Markers to Min Valleys
Sets all the markers to either the maximum peaks or minimum valleys depending on the functionality chosen in Markers Detect. See “Markers Detect” on
page 73.
All Markers Off
Turns off all markers on the trace.
Marker Delta
Turns On/Off and displays the delta of the one to five markers.
Marker Display
Marker Type
Sets the current marker to either be displayed as a line or floating
numbered icon.
All Markers Type to Icon
Sets all markers to be displayed as floating numbered icons.
All Markers Type to Line
Sets all markers to be displayed as numbered lines.
Marker Display
Turns On/Off and sets the location of the delta display into one of the four corners of the screen.
Marker More
Sets the properties of active markers through the following attributes:
74
Page 97

RSSI (Received Signal Strength Indicator)
Turns the audio indicator On or Off (an electronic ping). See “Received Signal
Strength Indicator (RSSI)” on page 92.
Volume
Sets the volume of the electronic ping generated from the RSSI.
Marker Freq to Center
Moves the current marker to the center frequency.
Center Freq to Marker
Sets the center frequency to the frequency of the active marker.
Ref Level Ampt to Marker
Sets the top-line amplitude reference level to the amplitude of the active
marker.
Frequency Counter
Turns the Frequency Counter on or off. This enables the frequency read out of
all displayed markers to read the exact frequency of the peak within the pixel to
a resolution of 1 Hz.
Note: Signals that vary in frequency must be within the RBW to
obtain accurate results.
Limit Lines
Limit lines give notification of when a signal has reached or gone over a set measurement amount. Limit lines can be moved with arrow keys.
Note: All valid traces are black, and any part of any trace that is out-
side of a limit is red. Red indicates a failed limit.
Limit Upper/Lower
Pick between upper & lower limit line.
Limit On/Off
Pick between limit line on or off.
Limit Alarm On/Off
Pick whether a limit line fail makes the unit beep.
Select Line/Mask
Creates a specific set of limit lines and presents a list of these
predefined masks to choose from.
Note: Custom Masks can be saved to the Mask list. See “Customizing
SignalHawk Content” on page 129.
75
Page 98
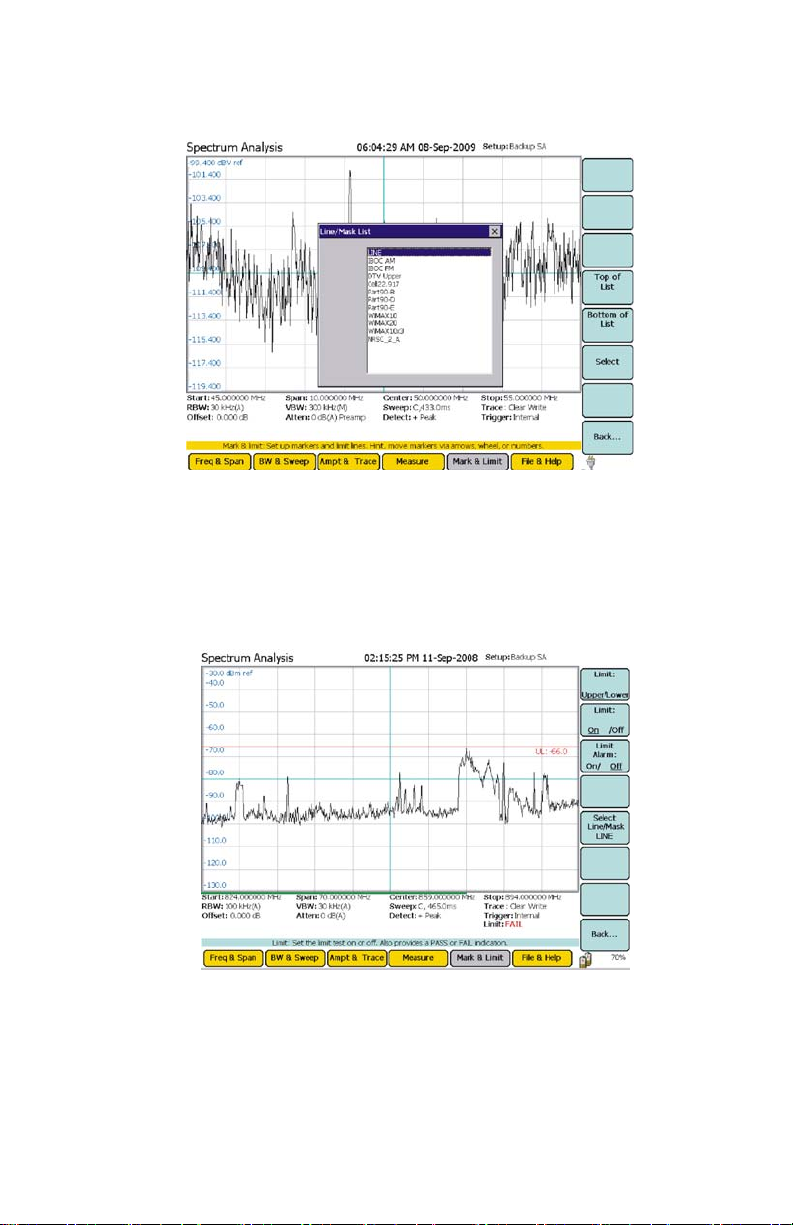
Figure 58 Example, Mask List
Once a mask is selected, it is controlled by the following options:
Freq Lock - Locks the mask onto the selected band even if the
frequency is changed.
EM to Max Peak - Sets mask’s reference level to the maximum peak in each
sweep.
Figure 59 Example, Limit Line Mask
76
Page 99

File & Help Menu
When the File & Help menu key is pressed, soft keys for saving the current trace,
selecting the utility option, activating the logging feature, and accessing help
features are enabled. A trace is saved as a file and stored in the internal memory
of the instrument. Using the PCTool utility that is supplied on the CD that ships
with the SignalHawk, stored files can be copied or moved from the internal
memory to an external storage device (e.g PC, thumbdrive, etc.).
Figure 60 Example, File & Help Menu
Quick Save
Saves the trace that is displayed on the screen.
To save the trace:
1. Press the File & Help menu key.
2. Press the Quick Save Trace soft key.
The trace is stored as a file in the internal memory of the instrument. Each quick
save is stored in a separate file that is named using the measurement and datetime file naming format: Measurement name(MM-DD HH-MM-SS).shf. Where
the first MM is the month, DD is the day, HH is the hour, the second MM is the
minute, and SS is the second of the time when the file was saved.
The PCTool utility (supplied on the CD that ships with the instrument), enables
copying and/or moving stored files from the internal memory to an external
storage device.
77
Page 100
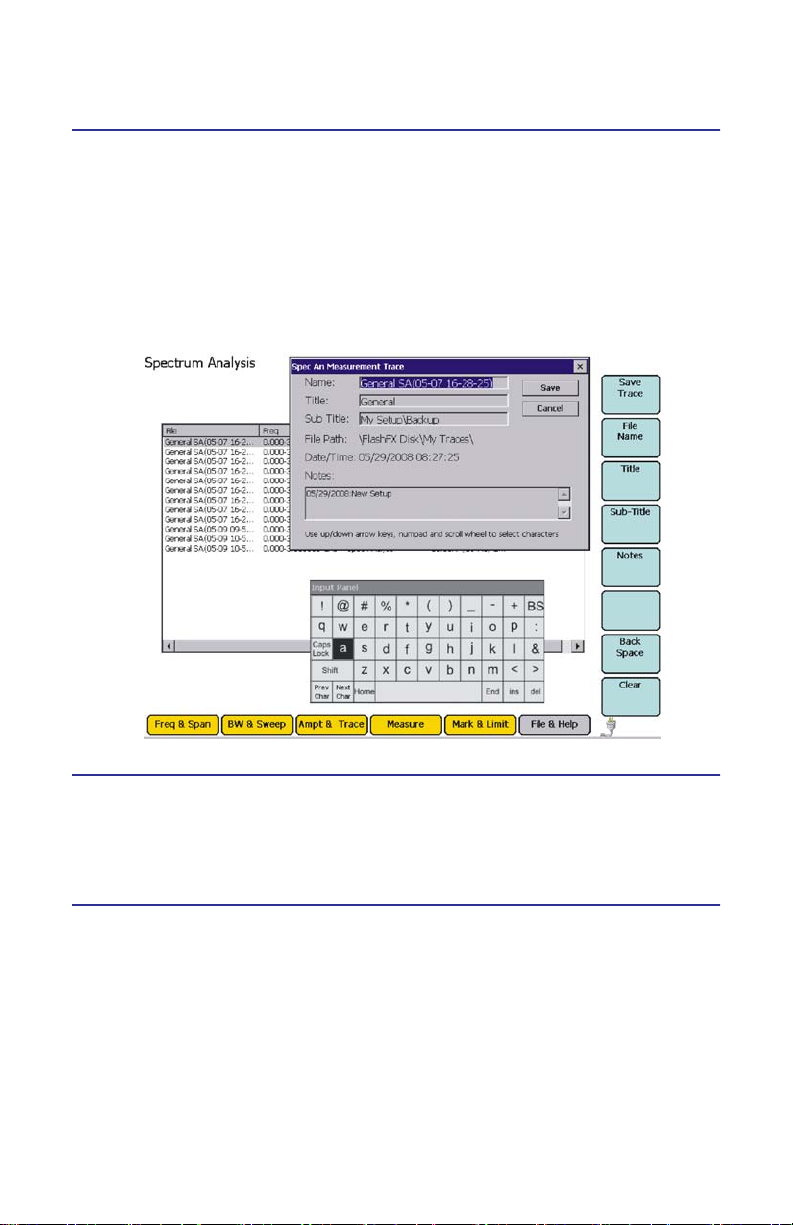
Label & Save Trace
Labels and saves the trace for future use.
1. Press the Save Trace soft key.
2. Enter a file name using the thumbwheel and arrow keys.
Note: Use the Up-and-down arrow keys to move vertically and the
wheel to move horizontally along the Input Panel. Use the rightand-left keys to toggle between the text fields (Name, Title, etc.).
Figure 61 Example, Save Trace
Log Traces
Press the soft key to turn this function on. Once on, it saves a sweep at a preset
sample rate.
Note: The sample rate can be set from 60 to 3600 seconds.
Recall Trace
Opens up a submenu with three options:
Recall Trace
Displays a saved trace on the screen.
Recall & Compare
Displays a saved trace overlapping the displayed trace on the screen.
Note: The Saved trace is orange. The current trace is black.
Clear Recalled Trace
Removes the recalled trace from the screen.
78
 Loading...