

Page 1

SITE ANALYZER™ XT
CABLE AND ANTENNA TESTER
FOR WIRELESS SYSTEMS
OPERATING INSTRUCTIONS
This is a preliminary manual. Specifications, limits, and text are subject to change
without notice. The information within this manual was as complete as possible
at the time of printing. Bird Electronic Corporation is not liable for errors.
©Copyright 2012 by Bird Electronic Corporation
Instruction Book Part Number 920-SA-XT Rev. P3
Site Analyzer is a trademark of Bird Electronic Corporation
Microsoft® and Windows® are registered trademarks
of the Microsoft Corporation
Page 2

16
Page 3
Safety Precautions
The following are general safety precautions that are not necessarily related to
any specific part or procedure, and do not necessarily appear elsewhere in this
publication. These precautions must be thoroughly understood and apply to all
phases of operation and maintenance.
WARNING
Keep Away From Live Circuits
Operating Personnel must at all times observe general safety precautions. Do
not replace components or make adjustments to the inside of the test
equipment with the high voltage supply turned on. To avoid casualties, always
remove power.
WARNING
Shock Hazard
Do not attempt to remove the RF transmission line while RF power is present.
WARNING
Do Not Service Or Adjust Alone
Under no circumstances should any person reach into an enclosure for the
purpose of service or adjustment of equipment except in the presence of
someone who is capable of rendering aid.
WARNING
Safety Earth Ground
An uninterruptible earth safety ground must be supplied from the main
power source to test instruments. Grounding one conductor of a two
conductor power cable is not sufficient protection. Serious injury or death can
occur if this grounding is not properly supplied.
WARNING
Resuscitation
Personnel working with or near high voltages should be familiar with modern
methods of resuscitation.
WARNING
Remove Power
Observe general safety precautions. Do not open the instrument with the
power on.
iii
Page 4
Safety Symbols
WARNING
Warning notes call attention to a procedure, which if not correctly
performed, could result in personal injury.
CAUTION
Caution notes call attention to a procedure, which if not correctly performed,
could result in damage to the instrument.
The caution symbol appears on the equipment indicating there is
important information in the instruction manual regarding that particular area
Note: Calls attention to supplemental information.
Warning Statements
The following safety warnings appear in the text where there is danger to operating and maintenance personnel, and are repeated here for emphasis.
WARNING
The SA-BATPAK is shipped charged. Be careful when removing the safety cap,
12VDC @ 2.0 AH/20 hour rate can be present inside the receptacle. Do not
touch the inside of the receptacle. The possibility of an electric shock exists.
On page 6.
WARNING
When using the AC adapter, only connect the plug to a properly grounded
receptacle. Serious injury or death can occur if grounding is not properly
installed.
On page 6.
WARNING
This equipment should not be connected to an antenna or operated during a
storm that has the potential to produce lightning.
The possibility exists for electrical shock.
On page 7.
iv
Page 5
Caution Statements
The following equipment cautions appear in the text and are repeated here for
emphasis.
CAUTION
+22 dBm max. input
Do not apply RF power to Antenna Test Port. Exceeding the maximum input
will damage the Site Analyzer.
On page 5, 13, 25, and 43.
CAUTION
Long-term storage of the external battery pack can affect battery
performance and reduce battery life. Do not store the external battery pack
for long periods of time without proper storage maintenance. Failure to
comply may result in reduced battery charge and shortened battery life.
On page 6.
CAUTION
When using a terminating power sensors, do not exceed 2 W average or 125
W peak power for 5 μs.
Doing so will render the sensor inoperative.
On page 43 and 46.
CAUTION
Harsh or abrasive detergents, and some solvents, can damage the display unit
and information on the labels.
On page 77.
v
Page 6

Safety Statements
USAGE
ANY USE OF THIS INSTRUMENT IN A MANNER NOT
SPECIFIED BY THE MANUFACTURER MAY IMPAIR THE
INSTRUMENT’S SAFETY PROTECTION.
USO
EL USO DE ESTE INSTRUMENTO DE MANERA NO
ESPECIFICADA POR EL FABRICANTE, PUEDE ANULAR LA
PROTECCIÓN DE SEGURIDAD DEL INSTRUMENTO.
BENUTZUNG
WIRD DAS GERÄT AUF ANDERE WEISE VERWENDET ALS VOM
HERSTELLER BESCHRIEBEN, KANN DIE GERÄTESICHERHEIT
BEEINTRÄCHTIGT WERDEN.
UTILISATION
TOUTE UTILISATION DE CET INSTRUMENT QUI N’EST PAS
EXPLICITEMENT PRÉVUE PAR LE FABRICANT PEUT
ENDOMMAGER LE DISPOSITIF DE PROTECTION DE
L’INSTRUMENT.
IMPIEGO
QUALORA QUESTO STRUMENTO VENISSE UTILIZZATO IN
MODO DIVERSO DA COME SPECIFICATO DAL PRODUTTORE
LA PROZIONE DI SICUREZZA POTREBBE VENIRNE
COMPROMESSA.
vi
Page 7

SERVICE
SERVICING INSTRUCTIONS ARE FOR USE BY SERVICE TRAINED PERSONNEL ONLY. TO AVOID DANGEROUS
ELECTRIC SHOCK, DO NOT PERFORM ANY SERVICING
UNLESS QUALIFIED TO DO SO.
SERVICIO
LAS INSTRUCCIONES DE SERVICIO SON PARA USO
EXCLUSIVO DEL PERSONAL DE SERVICIO CAPACITADO. PARA
EVITAR EL PELIGRO DE DESCARGAS ELÉCTRICAS, NO
REALICE NINGÚN SERVICIO A MENOS QUE ESTÉ
CAPACITADO PARA HACERIO.
WARTUNG
ANWEISUNGEN FÜR DIE WARTUNG DES GERÄTES GELTEN
NUR FÜR GESCHULTES FACHPERSONAL.
ZUR VERMEIDUNG GEFÄHRLICHE, ELEKTRISCHE SCHOCKS,
SIND WARTUNGSARBEITEN AUSSCHLIEßLICH VON
QUALIFIZIERTEM SERVICEPERSONAL DURCHZUFÜHREN.
ENTRENTIEN
L’EMPLOI DES INSTRUCTIONS D’ENTRETIEN DOIT ÊTRE
RÉSERVÉ AU PERSONNEL FORMÉ AUX OPÉRATIONS
D’ENTRETIEN. POUR PRÉVENIR UN CHOC ÉLECTRIQUE
DANGEREUX, NE PAS EFFECTUER D’ENTRETIEN SI L’ON N’A
PAS ÉTÉ QUALIFIÉ POUR CE FAIRE.
ASSISTENZA TECNICA
LE ISTRUZIONI RELATIVE ALL’ASSISTENZA SONO PREVISTE
ESCLUSIVAMENTE PER IL PERSONALE OPPORTUNAMENTE
ADDESTRATO. PER EVITARE PERICOLOSE SCOSSE
ELETTRICHE NON EFFETTUARRE ALCUNA RIPARAZIONE A
MENO CHE QUALIFICATI A FARLA.
vii
Page 8

UNITS ARE EQUIPPED WITH RECHAREABLE BATTERIES.
THESE ARE TO BE REPLACED BY AUTHORIZED SERVICE PERSONNEL ONLY!!!
LAS UNIDADES VIENEN EQUIPADAS CON BATERIAS
RECARGABLES.
¡¡¡Y SOLAMENTE EL PERSONAL DE SERVICIO AUTORIZADO
PUEDE REEMPLAZARLAS!!!
GERÄTE SIND MIT WIEDER AUFLADBAREN BATTERIEN
BESTÜCKT.
BATTERIEN SIND NUR VON QUALIFIZIERTEM SERICE
PERSONAL AUSZUWECHSELN!!!
CES DISPOSITIFS SONT ÉQUIPÉS DE BATTERIES
RECHARGEABLES.
SEUL LE PERSONNEL D’ENTRETIEN AUTORISÉ EST HABILITÉ
À LES REMPLACER !
LE UNITÀ SONO DOTATE DI BATTERIE RICARICABILI,
CHE DEVONO DA COME SPECIFICATO DAL PRODUTTORE LA
PROTEZIONE DI SICUREZZA POTREBBE VENIRNE
COMPROMESSA.
viii
Page 9

USE CORRECT VOLTAGE SETTING AND FUSE - SEE MANUAL.
UTILISER UNE TENSION ET UN FUSIBLE CORRECTS - CONSULTER
LE MODE D'EMPLOI.
USE LA INSTALACION Y FUSIBLE DE VOLTAJE CORRECTO - VEA
EL MANUAL.
AUSSCHLIESSLICH VORSCHRIFTSMÄSSIGE
WECHSELSPANNUNGS-EINSTELLUNG UND SICHERUNG
BENUTZEN - SIEHE DAZU HANDBUCH.
UTILLIZZARE TENSIONE E FUSIBLE ADATTI - FARE RIFERIMENTO
AL MANUALE.
ix
Page 10

BE SURE THE 115/230V AC VOLTAGE SELECTOR IS SET TO THE
PROPER LINE VOLTAGE, AND THE CORRECT AC LINE FUSE IS
INSTALLED BEFORE AC POWER IS APPLIED.
S'ASSURER QUE LE SÉLECTEUR DE TENSION 115/230V C.A. EST
BIEN RÉGLÉ POUR LA TENSION DU RÉSEAU ET QUE LE FUSIBLE
DE LIGNE C.A. CORRECT EST EN PLACE AVANT DE METTRE SOUS
TENSION C.A.
CERCIORESE QUE EL SELECTOR DE VOLTAJE DE 115/230V CA
ESTE COLOCADO A LA LINEA DE VOLTAJE APROPIADA Y QUE EL
FUSIBLE ESTE INSTALADO A LA LINEA CA ANTES DE APLICAR LA
CORRIENTE ALTERNA.
VOR EINSCHALTEN DER WECHSELSTROMZUFUHR
SICHERSTELLEN, DASS DER 115/230V WECHSELSPANNUNGSSELEKTOR AUF DIE VORSCHRIFTSMÄSSIGE
LEITUNGSSPANNUNG EINGESTELLT UND DIE RICHTIGE
WECHSELSTROM-HAUPTSICHERUNG EINGESETZT IST.
PRIMA DI EROGARE CORRENTE, ASSICURARSI CHE IL
SELETTORE DI VOLTAGGIO 115/230 V.C.A. SIA REGOLATO
CORRETTAMENTE E CHE IL FUSIBLE ADATTO ALLA LINEA DI
ALIMENTAZIONE C.A. SIA INSTALLATO.
x
Page 11

About This Manual
This manual covers the operating and maintenance instructions for the following models:
SA-3600XT SA-6000XT
Changes to this Manual
We have made every effort to ensure this manual is accurate. If you discover
any errors, or if you have suggestions for improving this manual, please send
your comments to our Solon, Ohio factory. This manual may be periodically
updated. When inquiring about updates to this manual refer to the part number
and revision on the title page.
Definitions
Measure Match Mode - The Match Measurement mode shows the resonant
frequencies for an antenna or filter. It also confirms that there are no impedance problems in the nonresonant components such as cables, connectors,
lightning protectors, and jumpers.
Fault Location Mode - The Fault Location mode shows the location of any
problems in the antenna system. This is shown in either feet or meters from the
cable end connected to the Site Analyzer.
Cable Loss Mode - The Cable Loss mode shows the insertion loss of a coaxial
cable. By comparing this with the manufacturer’s specs, it confirms that there
are no problems with the cable.
VSWR - VSWR units used to be the preferred way to measure an antenna sys-
tem. A good antenna has a VSWR of less than 1.5:1 at its operating frequency.
Return Loss - Return Loss measures, in dB, how much of a wave is reflected back to
the source. It is now the preferred method for measuring antenna systems. A good
antenna will have a return loss of –14 dB or less at the operating frequency. The more negative the reading, the better the antenna.
Markers - Markers are used to show the exact value at one point on the graph.
In Measure Match and Cable Loss modes, the marker displays the frequency
and loss (or VSWR). In Fault Location mode, the marker displays the distance
and loss.
Run / Hold - When HOLD is displayed, the unit makes a new sweep every few
seconds, and displays the latest sweep. When RUN is displayed, the unit will
only make a single sweep. The display will not update if the Site Analyzer is disconnected or if the cable is jiggled. This is usually preferred.
xi
Page 12

Equations
Fault Location
Resolution
Resolution
C
-------------------------------=
freq span 2
where C = speed of light (300 x 106 m / sec) or (9.84252 x 108 feet / sec)
Maximum Distance
Max distance resolution data points 1–=
Chapter Layout
Introduction — Describes the features of the Bird Site Analyzer and provides
power-up instructions.
Calibration — Lists the steps to calibrate the Site Analyzer, which must be
done before using Measure Match or Fault Location modes.
Measure Match Mode — Lists the steps to make match measurements, as
well as providing instructions for all functions available in Measure Match
mode.
Fault Location Mode — Lists the steps to make distance to fault measure-
ments, as well as providing instructions for all functions available in Fault Location mode.
Measure Power Mode — Lists the steps to make power measure-ments, as
well as providing instructions for all functions available in Measure Power
mode.
General Operation — Describes how to save and recall traces, set limit lines,
and other basic functions common to all modes of the Site Analyzer.
Utilities — Describes utilities to set up the Site Analyzer.
Computer Software — Provides installation instructions and lists the fea-
tures of the Bird Site Analyzer PC Software.
Maintenance — Lists routine maintenance tasks for the Site Analyzer, as well
as troubleshooting for common problems. Specifications and parts information
are also included.
xii
Page 13

Table of Contents
Safety Precautions . . . . . . . . . . . . . . . . . . . . . . . . . . . . . . . . . . . . . . . iii
Safety Symbols . . . . . . . . . . . . . . . . . . . . . . . . . . . . . . . . . . . . . . . . . . . . . . . . . . iv
Warning Statements . . . . . . . . . . . . . . . . . . . . . . . . . . . . . . . . . . . . . . . . . . . . . iv
Caution Statements . . . . . . . . . . . . . . . . . . . . . . . . . . . . . . . . . . . . . . . . . . . . . . v
Safety Statements . . . . . . . . . . . . . . . . . . . . . . . . . . . . . . . . . . . . . . . . . . . . . . . vi
About This Manual . . . . . . . . . . . . . . . . . . . . . . . . . . . . . . . . . . . . . . . xi
Changes to this Manual . . . . . . . . . . . . . . . . . . . . . . . . . . . . . . . . . . . . . . . . . . . xi
Definitions . . . . . . . . . . . . . . . . . . . . . . . . . . . . . . . . . . . . . . . . . . . . . . . . . . . . . xi
Equations . . . . . . . . . . . . . . . . . . . . . . . . . . . . . . . . . . . . . . . . . . . . . . . . . . . . . xii
Fault Location . . . . . . . . . . . . . . . . . . . . . . . . . . . . . . . . . . . . . . . . . . . . . . . xii
Resolution . . . . . . . . . . . . . . . . . . . . . . . . . . . . . . . . . . . . . . . . . . . . . . . . xii
Maximum Distance . . . . . . . . . . . . . . . . . . . . . . . . . . . . . . . . . . . . . . . . . xii
Chapter Layout . . . . . . . . . . . . . . . . . . . . . . . . . . . . . . . . . . . . . . . . . . . . . . . . xii
Chapter 1 Introduction . . . . . . . . . . . . . . . . . . . . . . . . . . . . . . . . . . . . . 1
Items Supplied . . . . . . . . . . . . . . . . . . . . . . . . . . . . . . . . . . . . . . . . . . . . . . . . . . 2
Items Not Supplied . . . . . . . . . . . . . . . . . . . . . . . . . . . . . . . . . . . . . . . . . . . . . . 2
Site Analyzer Features . . . . . . . . . . . . . . . . . . . . . . . . . . . . . . . . . . . . . . . . . . . . 3
General . . . . . . . . . . . . . . . . . . . . . . . . . . . . . . . . . . . . . . . . . . . . . . . . . . . . . 3
Antenna Test . . . . . . . . . . . . . . . . . . . . . . . . . . . . . . . . . . . . . . . . . . . . . . . . 3
Measure Match Mode . . . . . . . . . . . . . . . . . . . . . . . . . . . . . . . . . . . . . . . 3
Fault Location Mode . . . . . . . . . . . . . . . . . . . . . . . . . . . . . . . . . . . . . . . . 3
Measure Power Mode . . . . . . . . . . . . . . . . . . . . . . . . . . . . . . . . . . . . . . . 4
Power Supply . . . . . . . . . . . . . . . . . . . . . . . . . . . . . . . . . . . . . . . . . . . . . . . . . . . 5
Internal Battery . . . . . . . . . . . . . . . . . . . . . . . . . . . . . . . . . . . . . . . . . . . . . . 5
Adapters . . . . . . . . . . . . . . . . . . . . . . . . . . . . . . . . . . . . . . . . . . . . . . . . . . . . 6
External Battery Pack (Optional) . . . . . . . . . . . . . . . . . . . . . . . . . . . . . . . . 6
Charging the External Battery Pack . . . . . . . . . . . . . . . . . . . . . . . . . . . . . . 7
Using the External Battery Pack . . . . . . . . . . . . . . . . . . . . . . . . . . . . . . . . . 7
Power Up . . . . . . . . . . . . . . . . . . . . . . . . . . . . . . . . . . . . . . . . . . . . . . . . . . . . . . 7
System Information . . . . . . . . . . . . . . . . . . . . . . . . . . . . . . . . . . . . . . . . . . . 7
Site Analyzer User Keys . . . . . . . . . . . . . . . . . . . . . . . . . . . . . . . . . . . . . . . . . . . 7
Site Analyzer Display Screen . . . . . . . . . . . . . . . . . . . . . . . . . . . . . . . . . . . . . . 10
Display Description . . . . . . . . . . . . . . . . . . . . . . . . . . . . . . . . . . . . . . . . . . 10
Chapter 2 Calibration . . . . . . . . . . . . . . . . . . . . . . . . . . . . . . . . . . . . . 11
Calibration Accessories . . . . . . . . . . . . . . . . . . . . . . . . . . . . . . . . . . . . . . . . . . 11
Calibrating the Site Analyzer . . . . . . . . . . . . . . . . . . . . . . . . . . . . . . . . . . . . . . 11
xiii
Page 14

Chapter 3 Measure Match Mode . . . . . . . . . . . . . . . . . . . . . . . . . . . . 13
Determine the Power of the Component Being Tested . . . . . . . . . . . . . . . . 13
Selecting the Measure Match Mode . . . . . . . . . . . . . . . . . . . . . . . . . . . . . . . 13
Setting the Measurement Frequency . . . . . . . . . . . . . . . . . . . . . . . . . . . . . . 14
Setting a Custom Sweep Frequency . . . . . . . . . . . . . . . . . . . . . . . . . . . . . 14
Selecting a Sweep Frequency from a Band List . . . . . . . . . . . . . . . . . . . . 15
Selecting the Measurement Units . . . . . . . . . . . . . . . . . . . . . . . . . . . . . . . . . 15
Setting the Measurement Scale Limits . . . . . . . . . . . . . . . . . . . . . . . . . . . . . 16
Setting the Measurement Data Points . . . . . . . . . . . . . . . . . . . . . . . . . . . . . 17
Setting the Graph Display Type . . . . . . . . . . . . . . . . . . . . . . . . . . . . . . . . . . . 18
Set and Activate Acceptance Limits . . . . . . . . . . . . . . . . . . . . . . . . . . . . . . . . 19
Measure the Match of the Component . . . . . . . . . . . . . . . . . . . . . . . . . . . . . 19
Interpreting the Measurement . . . . . . . . . . . . . . . . . . . . . . . . . . . . . . . . . . . 20
Cable Loss Measurement . . . . . . . . . . . . . . . . . . . . . . . . . . . . . . . . . . . . . . . . 21
Setting Up a Cable Loss Measurement . . . . . . . . . . . . . . . . . . . . . . . . . . 21
Interpreting a Cable Loss Measurement . . . . . . . . . . . . . . . . . . . . . . . . . 22
Chapter 4 Fault Location Mode . . . . . . . . . . . . . . . . . . . . . . . . . . . . . 25
Determine the Power of the Component Being Tested . . . . . . . . . . . . . . . . 25
Selecting Fault Location Mode . . . . . . . . . . . . . . . . . . . . . . . . . . . . . . . . . . . . 26
Setting the Frequency Span and Max Distance . . . . . . . . . . . . . . . . . . . . . . . 26
Setting the Maximum Distance . . . . . . . . . . . . . . . . . . . . . . . . . . . . . . . . . . . 29
Setting the Cable Type . . . . . . . . . . . . . . . . . . . . . . . . . . . . . . . . . . . . . . . . . . 30
Setting a Custom Cable Type . . . . . . . . . . . . . . . . . . . . . . . . . . . . . . . . . . 30
Selecting a Cable Type from a Cable Type List . . . . . . . . . . . . . . . . . . . . 31
Setting the Distance and Units . . . . . . . . . . . . . . . . . . . . . . . . . . . . . . . . . . . . 31
Setting the Start and Stop Distance . . . . . . . . . . . . . . . . . . . . . . . . . . . . . 32
Setting the Distance Units . . . . . . . . . . . . . . . . . . . . . . . . . . . . . . . . . . . . 32
Setting the Scale & Unit of Measure . . . . . . . . . . . . . . . . . . . . . . . . . . . . . . . 33
Setting Fault Location Scale Units . . . . . . . . . . . . . . . . . . . . . . . . . . . . . . 33
Setting Fault Location Scale Limits Manually . . . . . . . . . . . . . . . . . . . . . 33
Setting Fault Location Auto Scale . . . . . . . . . . . . . . . . . . . . . . . . . . . . . . . 34
Set the Measurement Data Points . . . . . . . . . . . . . . . . . . . . . . . . . . . . . . . . . 35
Setting the Measurement Resolution . . . . . . . . . . . . . . . . . . . . . . . . . . . 35
Set the Graph Display Type . . . . . . . . . . . . . . . . . . . . . . . . . . . . . . . . . . . . . . . 36
Setting the Graph Display . . . . . . . . . . . . . . . . . . . . . . . . . . . . . . . . . . . . . 37
Set and Activate Acceptance Limits . . . . . . . . . . . . . . . . . . . . . . . . . . . . . . . . 37
Test for Fault Location . . . . . . . . . . . . . . . . . . . . . . . . . . . . . . . . . . . . . . . . . . . 39
Interpreting the Fault Location Measurement . . . . . . . . . . . . . . . . . . . . . . . 39
Chapter 5 Power Measure Mode . . . . . . . . . . . . . . . . . . . . . . . . . . . . 41
Connecting a Sensor . . . . . . . . . . . . . . . . . . . . . . . . . . . . . . . . . . . . . . . . . . . . 43
Display Description . . . . . . . . . . . . . . . . . . . . . . . . . . . . . . . . . . . . . . . . . . . . . 44
Setting the Full Scale Power . . . . . . . . . . . . . . . . . . . . . . . . . . . . . . . . . . . . . . 45
xiv
Page 15

Zeroing Bird Power Sensors . . . . . . . . . . . . . . . . . . . . . . . . . . . . . . . . . . . . . . 46
Choosing the Displayed Measurement . . . . . . . . . . . . . . . . . . . . . . . . . . . . . 48
Setting Units . . . . . . . . . . . . . . . . . . . . . . . . . . . . . . . . . . . . . . . . . . . . . . . . . . . 48
Changing the Mode for the Directional Power Sensor . . . . . . . . . . . . . . . . . 49
The 43 Peak Mode . . . . . . . . . . . . . . . . . . . . . . . . . . . . . . . . . . . . . . . . . . . 49
Recall Setups . . . . . . . . . . . . . . . . . . . . . . . . . . . . . . . . . . . . . . . . . . . . . . . . . . 50
Chapter 6 General Operation . . . . . . . . . . . . . . . . . . . . . . . . . . . . . . . 51
Setting a Limit Line . . . . . . . . . . . . . . . . . . . . . . . . . . . . . . . . . . . . . . . . . . . . . 51
Measurement Hold . . . . . . . . . . . . . . . . . . . . . . . . . . . . . . . . . . . . . . . . . . . . . 51
Activate Markers and Set Marker Style . . . . . . . . . . . . . . . . . . . . . . . . . . 52
Move Markers . . . . . . . . . . . . . . . . . . . . . . . . . . . . . . . . . . . . . . . . . . . . . . 53
Moving Markers . . . . . . . . . . . . . . . . . . . . . . . . . . . . . . . . . . . . . . . . . . . . . 53
Using Delta Markers . . . . . . . . . . . . . . . . . . . . . . . . . . . . . . . . . . . . . . . . . 54
Using Markers with Recalled Traces . . . . . . . . . . . . . . . . . . . . . . . . . . . . 55
Setting Display Smoothing . . . . . . . . . . . . . . . . . . . . . . . . . . . . . . . . . . . . . . . 55
Saving and Recalling Traces . . . . . . . . . . . . . . . . . . . . . . . . . . . . . . . . . . . . . . 56
Connecting a USB Flash Drive . . . . . . . . . . . . . . . . . . . . . . . . . . . . . . . . . . 57
Saving a Trace . . . . . . . . . . . . . . . . . . . . . . . . . . . . . . . . . . . . . . . . . . . . . . 58
Recalling a Saved Trace . . . . . . . . . . . . . . . . . . . . . . . . . . . . . . . . . . . . . . . 59
Viewing a Recalled Trace . . . . . . . . . . . . . . . . . . . . . . . . . . . . . . . . . . . . . 60
Deleting a Saved Trace . . . . . . . . . . . . . . . . . . . . . . . . . . . . . . . . . . . . . . . 62
Instrument Setups . . . . . . . . . . . . . . . . . . . . . . . . . . . . . . . . . . . . . . . . . . . . . . 62
Recalling a Saved Setup . . . . . . . . . . . . . . . . . . . . . . . . . . . . . . . . . . . . . . . 63
Deleting a Saved Setup . . . . . . . . . . . . . . . . . . . . . . . . . . . . . . . . . . . . . . . 64
Label Text . . . . . . . . . . . . . . . . . . . . . . . . . . . . . . . . . . . . . . . . . . . . . . . . . . . . . 64
Label Text Shortcuts . . . . . . . . . . . . . . . . . . . . . . . . . . . . . . . . . . . . . . . . . 64
Label Text Help . . . . . . . . . . . . . . . . . . . . . . . . . . . . . . . . . . . . . . . . . . . . . 65
Editing Label Text . . . . . . . . . . . . . . . . . . . . . . . . . . . . . . . . . . . . . . . . . . . 66
Quicktext for Trace Labels . . . . . . . . . . . . . . . . . . . . . . . . . . . . . . . . . . . . . . . 67
Adding Quicktext Elements . . . . . . . . . . . . . . . . . . . . . . . . . . . . . . . . . . . . 67
Using Quicktext . . . . . . . . . . . . . . . . . . . . . . . . . . . . . . . . . . . . . . . . . . . . . 68
Deleting Quicktext Elements . . . . . . . . . . . . . . . . . . . . . . . . . . . . . . . . . . 69
Chapter 7 Utilities . . . . . . . . . . . . . . . . . . . . . . . . . . . . . . . . . . . . . . . 71
Adjust Date and Time . . . . . . . . . . . . . . . . . . . . . . . . . . . . . . . . . . . . . . . . . . . 72
Return to Defaults . . . . . . . . . . . . . . . . . . . . . . . . . . . . . . . . . . . . . . . . . . . . . . 73
FM Modulation . . . . . . . . . . . . . . . . . . . . . . . . . . . . . . . . . . . . . . . . . . . . . . . . 74
Chapter 8 Computer Software . . . . . . . . . . . . . . . . . . . . . . . . . . . . . . 75
Features . . . . . . . . . . . . . . . . . . . . . . . . . . . . . . . . . . . . . . . . . . . . . . . . . . . . . . 75
Computer Requirements . . . . . . . . . . . . . . . . . . . . . . . . . . . . . . . . . . . . . . . . 75
xv
Page 16

Chapter 9 Maintenance . . . . . . . . . . . . . . . . . . . . . . . . . . . . . . . . . . . 77
Cleaning . . . . . . . . . . . . . . . . . . . . . . . . . . . . . . . . . . . . . . . . . . . . . . . . . . . . . . 77
Charging the Battery . . . . . . . . . . . . . . . . . . . . . . . . . . . . . . . . . . . . . . . . . . . . 77
External Battery Pack (Optional), Long-term Storage Maintenance . . . . . . 77
Troubleshooting . . . . . . . . . . . . . . . . . . . . . . . . . . . . . . . . . . . . . . . . . . . . . . . . 78
Replacing the Battery . . . . . . . . . . . . . . . . . . . . . . . . . . . . . . . . . . . . . . . . . . . 79
Customer Service . . . . . . . . . . . . . . . . . . . . . . . . . . . . . . . . . . . . . . . . . . . . . . . 81
Specifications . . . . . . . . . . . . . . . . . . . . . . . . . . . . . . . . . . . . . . . . . . . . . . . . . . 82
Antenna Testing . . . . . . . . . . . . . . . . . . . . . . . . . . . . . . . . . . . . . . . . . . . . . 82
Match Measurement . . . . . . . . . . . . . . . . . . . . . . . . . . . . . . . . . . . . . . . . 83
Distance to Fault (DTF) Measurement . . . . . . . . . . . . . . . . . . . . . . . . . . . 83
General . . . . . . . . . . . . . . . . . . . . . . . . . . . . . . . . . . . . . . . . . . . . . . . . . . . . 84
Parts List . . . . . . . . . . . . . . . . . . . . . . . . . . . . . . . . . . . . . . . . . . . . . . . . . . . . . . 87
Optional Equipment Available . . . . . . . . . . . . . . . . . . . . . . . . . . . . . . . . . . . . 87
Precision Adapters . . . . . . . . . . . . . . . . . . . . . . . . . . . . . . . . . . . . . . . . . . . 87
Armored (Phase Stable) Test Cables . . . . . . . . . . . . . . . . . . . . . . . . . . . . 87
Precision Open/Short/Load Combinations . . . . . . . . . . . . . . . . . . . . . . . 88
Accessories . . . . . . . . . . . . . . . . . . . . . . . . . . . . . . . . . . . . . . . . . . . . . . . . . 88
Power Sensors Supported . . . . . . . . . . . . . . . . . . . . . . . . . . . . . . . . . . . . . 88
Fault Location Distance Tables . . . . . . . . . . . . . . . . . . . . . . . . . . . . . . . . . . . . 91
Fault Location Distance - 238 Data Points . . . . . . . . . . . . . . . . . . . . . . . . 91
Fault Location Distance - 475 Data Points . . . . . . . . . . . . . . . . . . . . . . . . 92
Fault Location Distance - 949 Data Points . . . . . . . . . . . . . . . . . . . . . . . . 93
Limited Warranty . . . . . . . . . . . . . . . . . . . . . . . . . . . . . . . . . . . . . . . . . 95
xvi
Page 17

Chapter 1 Introduction
The Bird Site Analyzer is a multifunction test instrument for use in installation
and maintenance of wireless systems. The current product designation adds the
letters XT after the model number.
SA-3600XT
25 MHz – 3600 MHz
SA-6000XT
25 MHz – 6000 MHz
Antenna systems are tested by using a Site Analyzer to measure match conditions. Data points measured across a user-specified frequency band or distance
range are graphed on a 320 x 240 pixel display area. Transmitter systems are
tested by using a Site Analyzer and a Bird power sensor to measure RF power.
Data is displayed as power or match efficiency, depending upon the sensor.
1
Page 18
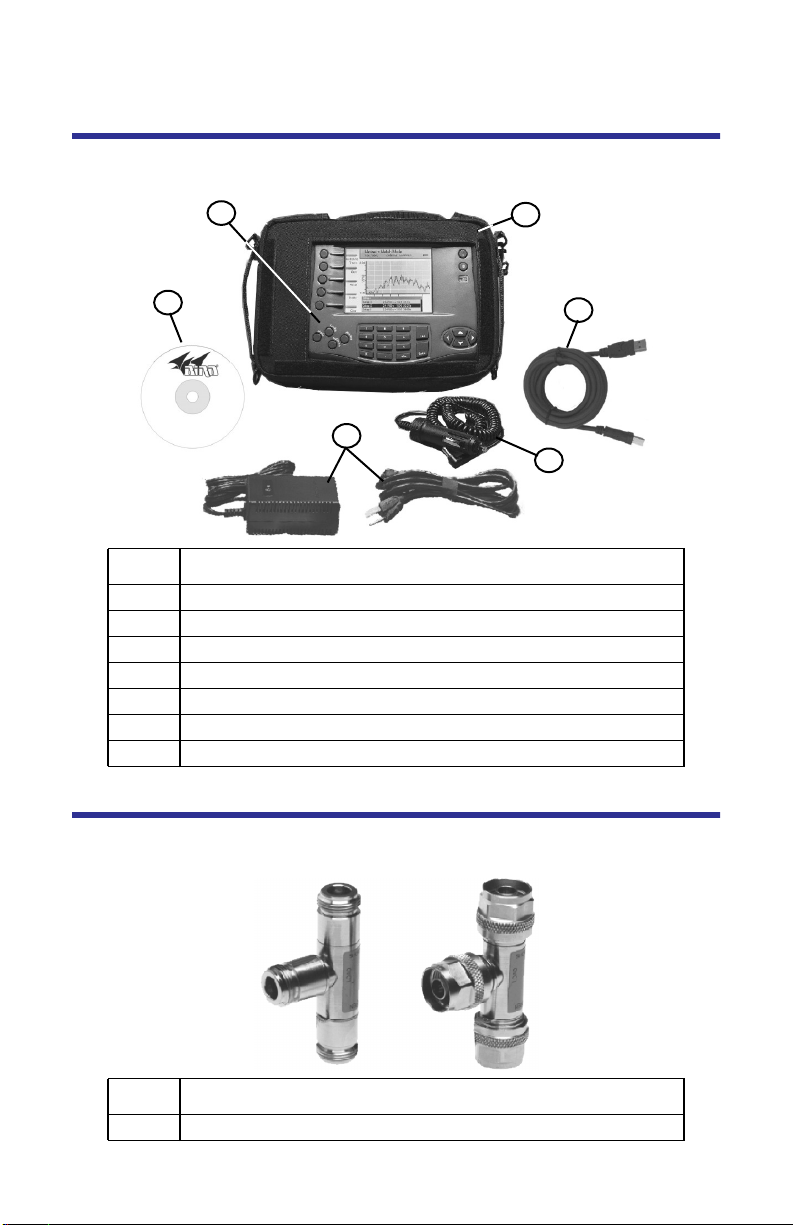
Items Supplied
Figure 1 Hardware and Software Supplied
1
3
4
2
6
5
Item Description
1 Site Analyzer (configured as one of the models described earlier).
2 Soft-Sided Carrying Case
3 PCTool Software
4 AC Power Adapter
5 Automobile Cigarette Lighter Adapter
6 USB Communications Cable
7 Instruction Manual CD (Not Shown)
Items Not Supplied
Figure 2 Hardware Not Supplied
Item Description
1 Calibration Combination (Cal Combo).
2
Page 19

Site Analyzer Features
General
Easy to operate and field ready for first-time, occasional, and experi-
enced users.
High-resolution color display.
Field replaceable Li-ion battery.
Automatic power down conserves battery life.
Operates in temperatures as low as 14°F (–10°C).
Antenna Test
Rejects on-channel interfering signals to +13 dBm.
Three user-selectable trace capture options: 238 data points per sweep,
475 data points per sweep, 949 data points per sweep.
Three graphic display formats: envelope, maximum, minimum.
Sweep measurement progress bar: indicates status of measurement
being taken.
Adjustable pass/fail limit with visual indicator.
64 MB of internal flash memory for storing thousands of traces and setups.
On-screen comparison between current measurement trace and
stored data traces – no PC required.
Pop-up menus contain over 70 cable types and 90 frequency band presets
depending upon the instrument model number.
X and Y scales and units are user adjustable.
Six markers for either direct or difference measurements. Can also
measure relative to limit line or recalled trace.
Measurement hold to temporarily store a trace.
Measure Match Mode
Fast swept measurement.
Frequency can be set using either Start/Stop or Center/Span frequen-
cies.
Measurement units can be Return Loss [dB], Cable Loss [dB], or VSWR [ratio].
Fault Location Mode
Transform Algorithm - Fast Fourier Transform (FFT) with three levels of
smoothing.
Distance units can be either feet or meters.
Measurement units can be Return Loss [dB] or VSWR [ratio].
3
Page 20
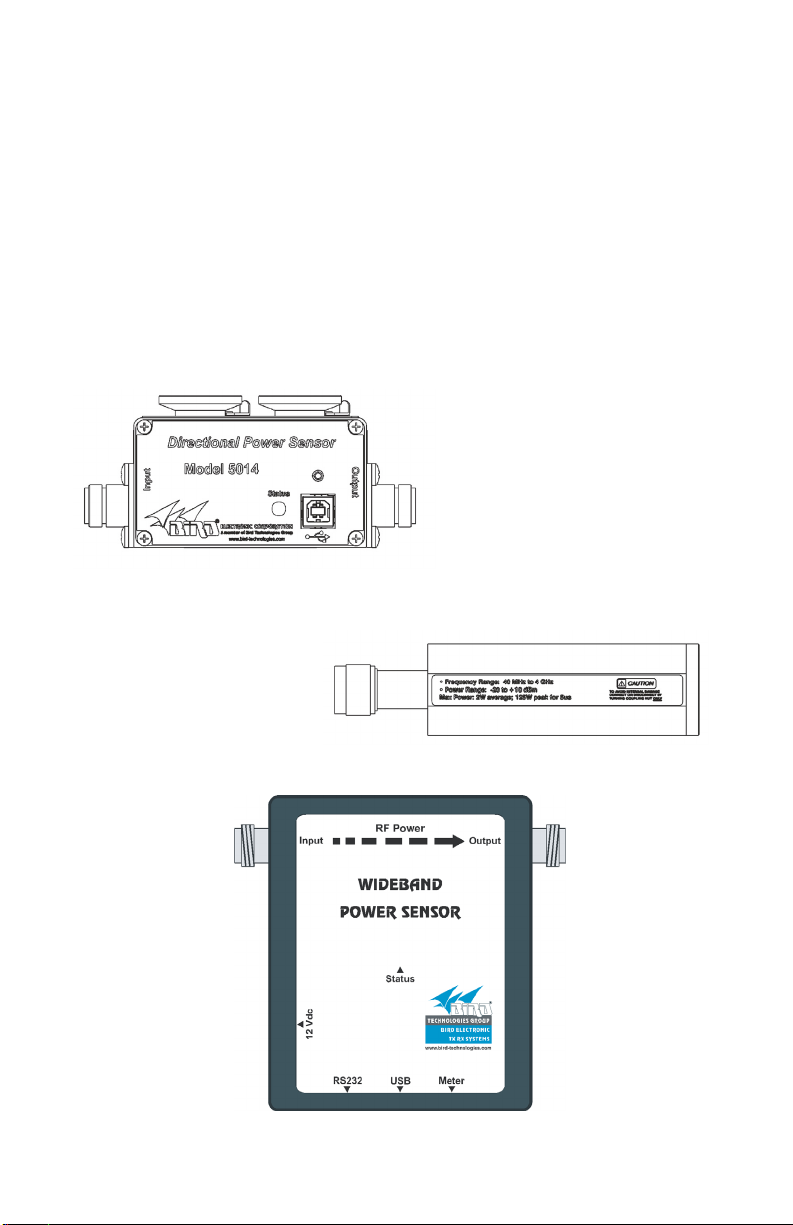
Transmitter Test
Measure Power Mode
Numerical readout and analog dial.
Can display either forward power, reflected power, or match efficiency
depending upon the sensor.
Power measurement units can be either Watts or dBm. Match units
can be VSWR, return loss, or % match efficiency.
Compatible with Bird Directional Power Sensors, Terminating Power
Sensors, and Wideband Power Sensors.
Figure 3 Bird Power Sensors
Directional Power Sensor
Terminating Power Sensor
Wideband Power Sensor
4
Page 21
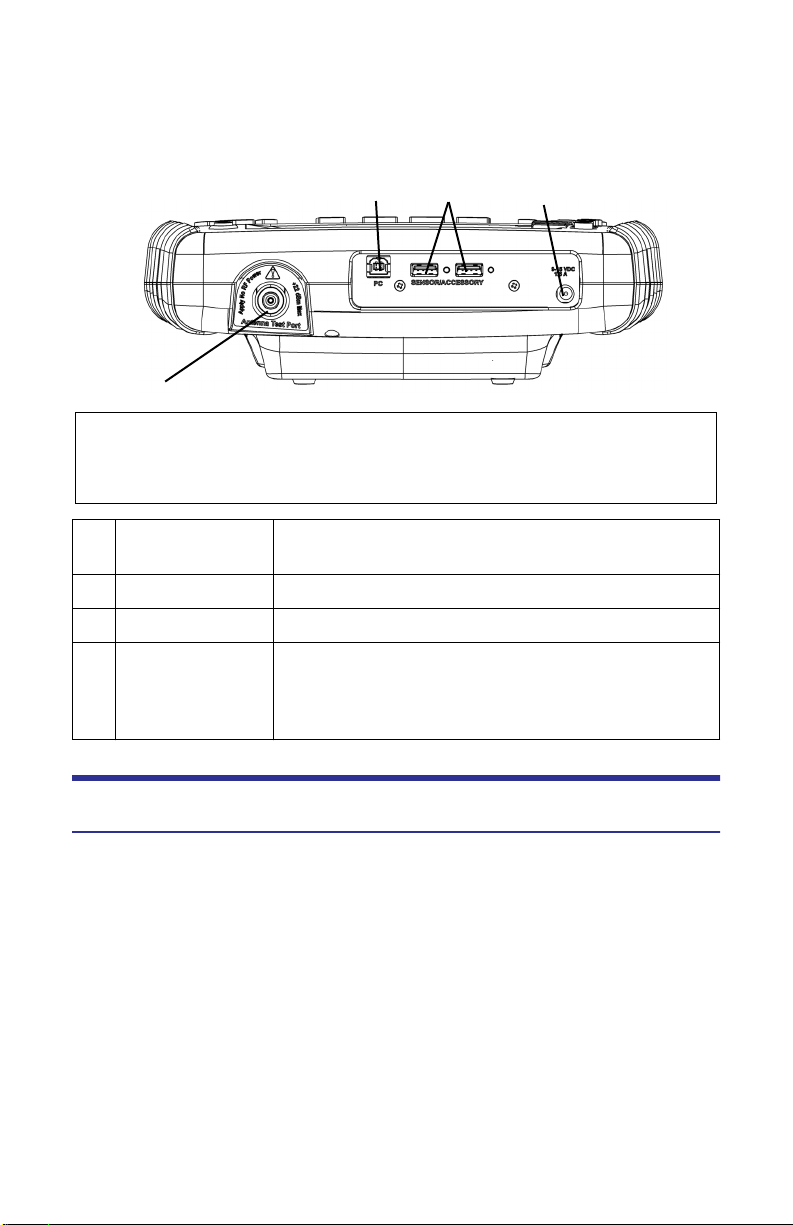
Connectors
Figure 4 Connector Diagram
2
1
CAUTION
+22 dBm max. input
Do not apply RF power to Antenna Test Port. Exceeding the maximum input
will damage the Site Analyzer.
34
1 Antenna Test
Port
2 USB 2.0 B Type There is one USB device port for connection to a PC.
3 USB 2.0 A Type There are two USB host ports.
4 DC Input Input for external power supplies. Plug either the AC
Female N connector for connecting to the antenna.
Use a phase-stable cable for best results.
power supply or the cigarette lighter adapter into the
DC input. The external supplies operate the unit and
charge the internal battery.
Power Supply
Internal Battery
The Bird Site Analyzer has an internal, rechargeable, lithium-ion battery pack. This
will operate the unit for a minimum of 5 hours of continuous usage.
Recharging time, from a full discharge, is approximately 4 hours.
Note: When the unit is received the battery may not be fully
charged. An AC adapter should be used when operating the unit for
the first time.
The battery symbol gauge indicates the approximate battery life
remaining. At ¼ charge the gauge also displays “LO”.
When using an external power source, a power cord symbol replaces
the battery symbol gauge.
5
Page 22
Adapters
WARNING
When using the AC adapter, connect the AC plug only to a properly grounded
receptacle. Serious injury or death can occur if not properly grounded.
The Bird Site Analyzer can be operated using an AC adapter or a 12V automobile
cigarette lighter adapter. Using these adapters will also charge the internal battery.
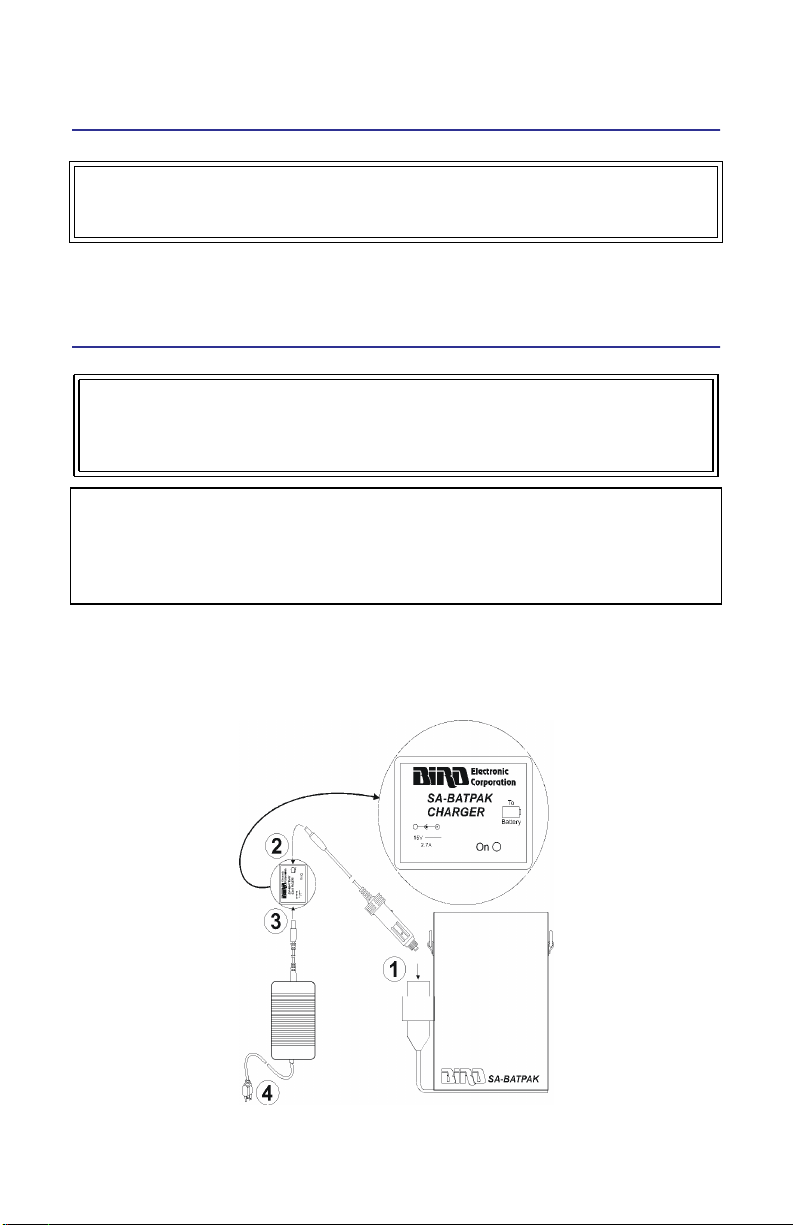
External Battery Pack (Optional)
WARNING
The SA-BATPAK is shipped charged. Be careful when removing the safety cap,
12VDC @ 2.0 AH/20 hour rate can be present inside the receptacle. Do not
touch the inside of the receptacle. The possibility of an electric shock exists.
CAUTION
Long-term storage of the external battery pack can affect battery performance
and reduce battery life. Do not store the external battery pack for long periods
of time without proper storage maintenance. Failure to comply may result in
reduced battery charge and shortened battery life.
The SA-BATPAK is an optional external battery pack. This will operate the unit
for approximately 1 to 2 hours. The liquid acid gel battery will fully charge, from
a full discharge, in about 6-8 hours.
Figure 5 External Battery Pack
6
Page 23

Charging the External Battery Pack
1. Plug the automobile cigarette lighter adapter into the external battery pack on
the side that says “To Battery”. See Figure 5.
2. Plug the other end of the cigarette lighter adapter into the charger adapter.
3. Plug the AC adapter into the charger adapter.
4. Plug the AC adapter into a properly grounded outlet.
Note: The charger’s “On” LED comes on and stays on until the charger is disconnected.
Using the External Battery Pack
1. Plug the automobile cigarette lighter adapter into the charged external battery pack.
2. Plug the other end of the cigarette lighter adapter into the DC input of the
Site Analyzer.
Power Up
For the first power-up and after a failure, reset the unit. See “Return to
Defaults” on page 73.
System Information
Before using the Site Analyzer, record the following system information:
Frequency Span — ex: 824-894 MHz (cellular band)
Cable Type — ex: LDF 7 - 50A
Approximate Cable Length — ex: 300 feet
Transmitter Power — ex: 50 W
WARNING
This equipment should not be connected to an antenna or operated during a
storm that has the potential to produce lightning. The possibility exists for
electrical shock.
Site Analyzer User Keys
There are two types of keys on the Site Analyzer. The first type, referred to as a hard
key, always has a particular function. The function of the key does not change and is
printed on the unit surface or on the key itself.
The second type is referred to as a softkey. The five keys at the left of the display are softkeys. Each softkey has a function which can vary depending upon
the operational mode. The function of the key will be identified at the left of the
display, next to the key.
See Figure 6 and its accompanying table for a description of user keys.
7
Page 24
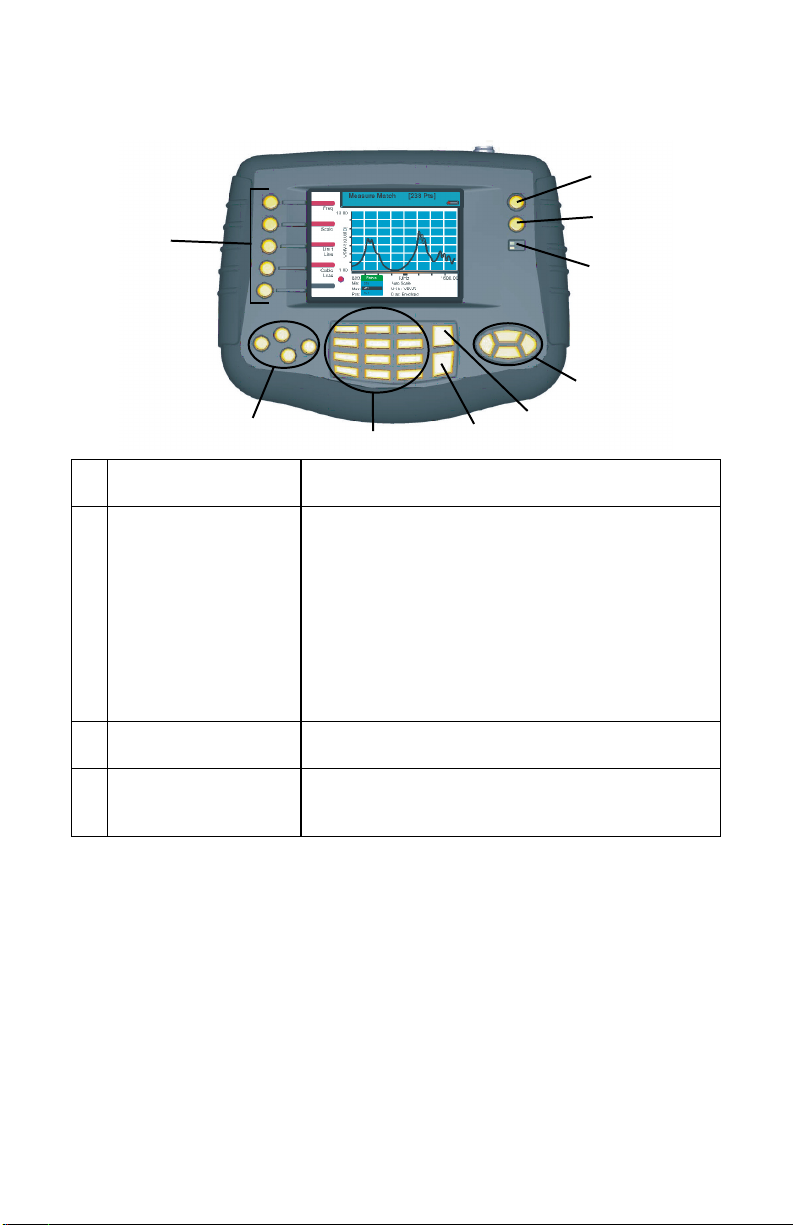
Figure 6 User Key Identification
9
8
1
7
6
2
3
1 Softkeys Activates the function described directly to the right
of the key.
2 Hard Keys
Mode
Activates the mode menu. Use this to select
Measure Match, Fault Location, Measure Power, or
Utilities mode.
Config
Activates the configuration menu for the current
mode. Use this to set variable parameters (e.g.
frequency band, distance, and units).
Calibrate
Marker
Activates the calibration menu.
Activates the marker menu. Use this to turn
markers on or off and to move the active marker.
3 Numeric Keys Enters numeric data into the selected item, or as
defined by the function description.
4 Enter Key During
List Selection
Data Entry
Selects the highlighted item in the list.
Exits data entry, changing the value.
5
4
8
Page 25

5 Escape Key During
Menu Use
Data Entry
6 Cursor Keys
Left Arrow During
Data Entry
Marker Use
All other times
Right Arrow During
Marker Use
All other times
Up Arrow During
Data Entry
Marker Use
Pressing the
Contrast Key
All other times
Down Arrow During
Data Entry
Marker Use
Pressing the
Contrast Key
All other times
7 Battery LED The yellow LED lights when the unit is powered
Backs up one menu level.
Exits data entry without changing the value.
Deletes previously entered data one character at a
time.
Moves active marker left one point at a time.
As defined by the function description.
Moves active marker right one point at a time.
As defined by the function description.
Increases the numeric value.
Moves the marker to the maximum trace value.
Increases the display contrast.
As defined by the function description.
Decreases the numeric value.
Moves the marker to the minimum trace value.
Decreases the display contrast.
As defined by the function description.
from an external DC power source. It blinks while
charging the internal battery. Once the battery is
fully charged the yellow LED stops blinking.
The green LED lights whenever the unit is on.
8 Contrast Key Hold while pressing the up/down arrow keys to
adjust the contrast of the display.
9 l/0 (On/Off) Turns the instrument on and off. The key must be
pressed for at least one-half (½) second.
9
Page 26
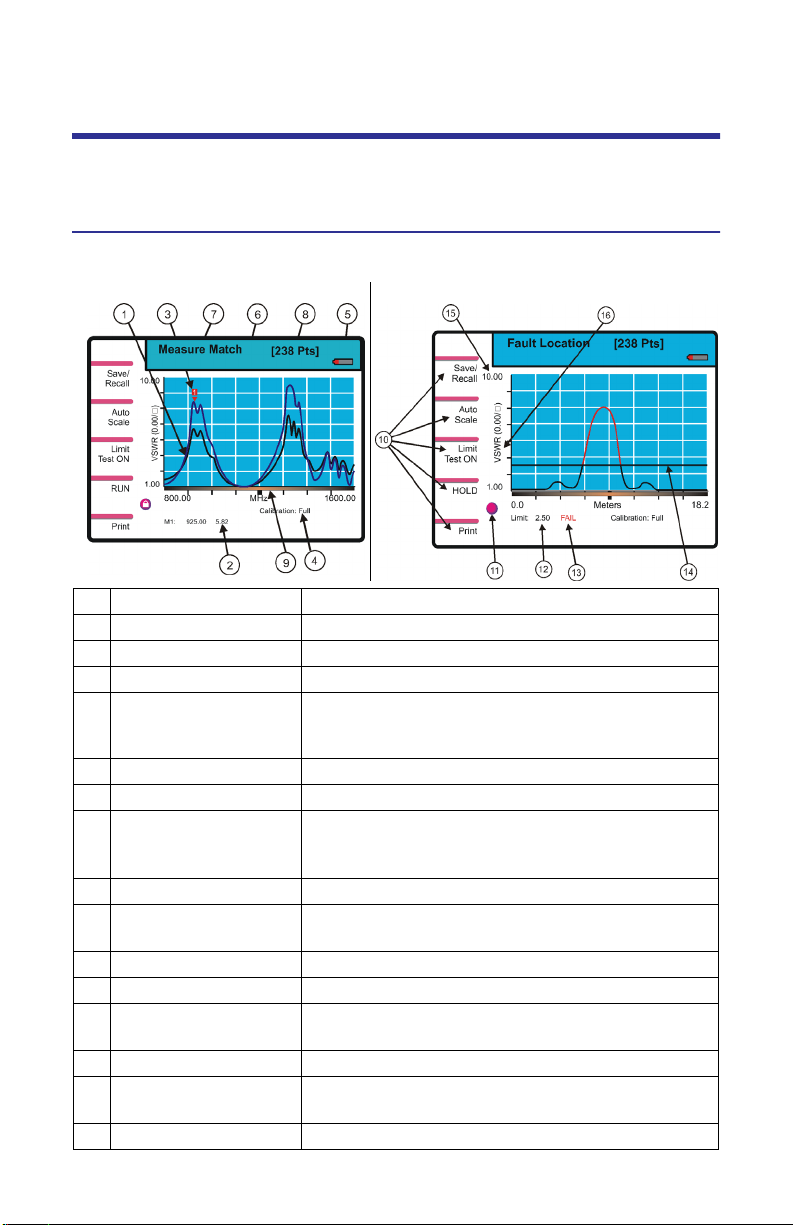
Site Analyzer Display Screen
See the following two figures and the accompanying table for a description of the
display screen components for Measure Match mode and for Fault Location mode.
Display Description
Figure 7 Displays
Measure Match Sample Display
1 Trace Graphic display of the measurement.
2 Marker Value Indicates the position and value of a trace point.
3 Marker Cursor Identifies the trace point displayed in the marker value.
4 Calibration Indicator Indicates the calibration status.
5 Battery Gauge Indicates whether the Site Analyzer is using the
6 Recalled Trace Name Indicates the name of a recalled trace.
7 Mode Indicator Name of the current mode.
8 Measurement Data
Points
9 Progress Bar Indicates data collection progress
10 Softkey Description Describes the function of the softkey to the left of
11 Indicator Ball Indicates if the trace is sweeping.
12 Limit Line Value Indicates the limit value.
13 Limit Test Indicator Displays FAIL if any part of the trace exceeds the
14 Limit Line A horizontal line that graphically displays the limit value.
15 Scale Indicates the minimum and maximum values
16 Units Indicates the measurement units for that axis.
internal battery or an external power supply, and
indicates the amount of battery life remaining.
Indicates the number of datapoints collected for each
trace. 238 = standard, 475 = twice as many data points
as 238, 949 = four times as many data points as 238.
the description.
limit value.
displayed on that axis.
Fault Location Sample Display
10
Page 27

Chapter 2 Calibration
Calibration Accessories
Calibration Combination (Cal Combo) which contains:
One 50 ohm load
One Open standard
One Short standard
Note: When using a test cable connected to the Site Analyzer, attach
the Cal Combo to the end of the cable during calibration.
Test Cable (optional) – A phase-stable cable will provide consistent,
reliable results.
Note: When using an extension cable, a phase stable cable is needed
to ensure performance and accuracy. Bird offers optional phase stable
cables that will not degrade the performance of the Site Analyzer.
Using a non-Bird phase stable cable may decrease and degrade the
accuracy of the system.
Calibrating the Site Analyzer
For best results, set the frequency and calibrate the Bird Site Analyzer immediately before taking measurements.
Note: When calibrated, the Site Analyzer’s main screen will display
“Calibration: FULL”. When uncalibrated, the Site Analyzer’s main
screen will display “Calibration: OFF”.
Note: Calibration is performed at the highest number of data points
(949 points) and the calibration graphs are displayed using the currently selected display method (envelope, maximum, or minimum).
1. Press the Calibrate key.
2. Connect the Cal Combo “Open” connector to the unit antenna port.
3. Press the Open softkey then wait for the unit to beep and display Done.
4. Connect the Cal Combo “Short” connector to the unit antenna port.
5. Press the Short softkey then wait for the unit to beep and display Done.
6. Connect the Cal Combo “Load” connector to the unit antenna port.
7. Press the Load softkey then wait for the unit to beep and display Done.
8. Remove the Cal Combo from the unit.
11
Page 28
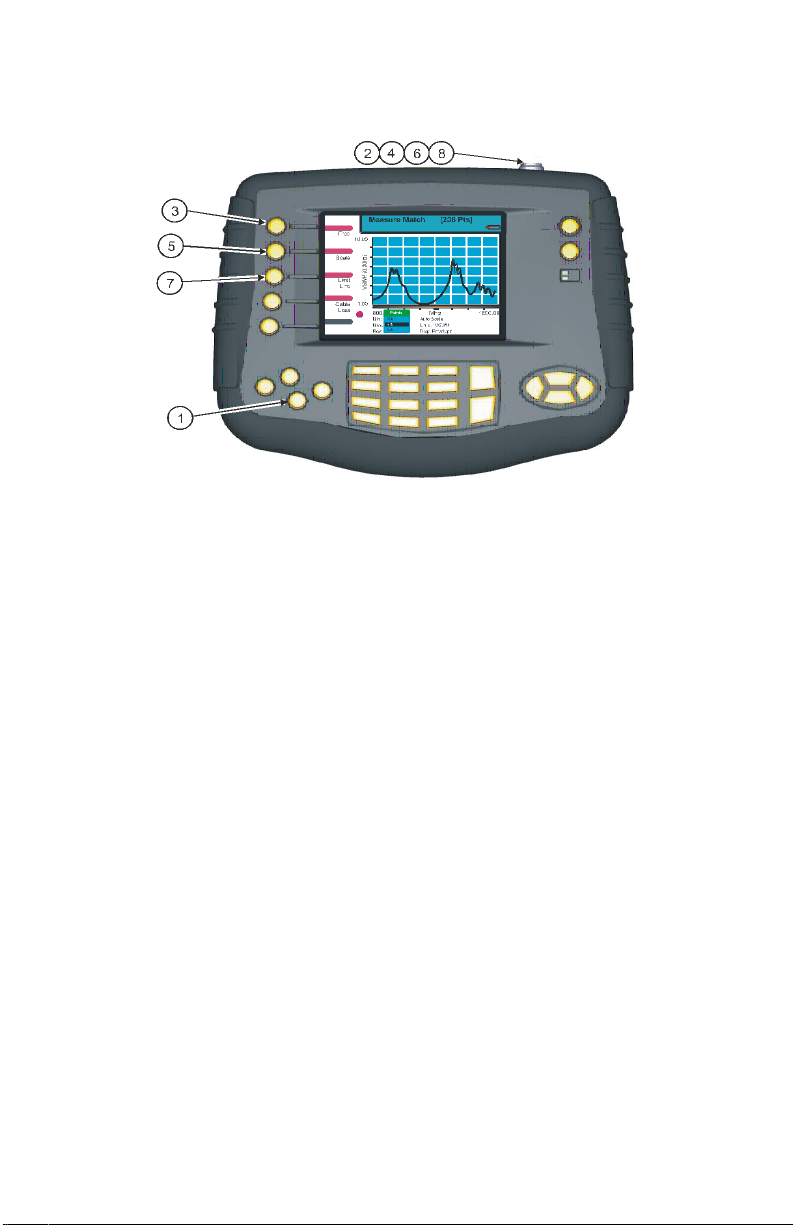
Figure 8 Calibrating the Site Analyzer
12
Page 29

Chapter 3 Measure Match Mode
Match measurement verifies and monitors the match conditions in the antenna
system at various frequencies. The results are shown on an x-y graph. Frequency
is shown on the x-axis and return loss, cable loss, or VSWR is shown on the y-axis.
Before making a match measurement, be sure to have a Bird Calibration Combination (Cal Combo) and all necessary cables and adapters of the correct size and
connector type.
This chapter describes how to make a match measurement and provides step by
step instructions. In addition, this chapter describes how to set and move markers. For information and instructions to save and recall traces, refer to Saving
and Recalling Traces, page 56.
To make a match measurement, follow the procedures in this chapter in the
order they are presented.
Determine the Power of the Component Being Tested
Use a service monitor, power meter, or spectrum analyzer to check that the component being tested does not have power greater than +22 dBm.
CAUTION
+22 dBm max. input
Do not apply RF power to Antenna Test Port. Exceeding the maximum input
will damage the Site Analyzer.
Selecting the Measure Match Mode
1. Press ON/OFF key for ½ second.
2. Press the Mode key.
3. Press the Measure Match key.
Figure 9 Selecting the Measure Match Mode
13
Page 30

Setting the Measurement Frequency
Frequencies can be set manually or chosen from a list of presets (band list). If
the start, stop, center, or span frequency is manually set, the band list will indicate “Custom”. Be sure to set the frequency to a value that is well beyond the
normal range of the antenna.
Example - For a 450 MHz antenna, set the start frequency
at 400 and the stop frequency at 500 MHz, for an 800 MHz
antenna, set the start frequency at 700 and the stop frequency at 1,100 MHz.
Note: Changing the frequency settings will automatically turn calibration off. Always set the frequency before calibrating the unit.
Note: If a frequency that is outside of the range of the Site Analyzer
is entered, the Site Analyzer will override the entry and set the minimum or maximum frequency of the model.
1. Enable the Measure Match Mode. See “Selecting the Measure Match
Mode” on page 13.
2. Do one of the following:
To set a Custom Sweep Frequency: See “Setting a Custom Sweep Fre-
quency” on page 14.
To select a Sweep Frequency: See “Selecting a Sweep Frequency from
a Band List” on page 15.
Setting a Custom Sweep Frequency
1. Press the Config key.
2. Press the Freq softkey.
3. Select Start, Stop, Center, or Span using the left or right scroll keys.
4. Enter a value.
5. Press Enter.
6. Press the Esc key to exit the configuration screen.
Figure 10 Setting a Custom Sweep Frequency
14
Page 31

Selecting a Sweep Frequency from a Band List
1. Press the Config key.
2. Press the Freq softkey.
3. Select Start, Stop, Center, or Span using the left or right scroll keys.
4. Open the band list menu using the up or down scroll keys.
5. Select the desired band using the up or down scroll keys.
6. Press the Enter key to accept the selection.
7. Press the Esc key to exit the configure screen.
Figure 11 Selecting a Sweep Frequency from a Band List
Selecting the Measurement Units
Select units before or after making a measurement. When making a match measurement, select one of three units for the Y (vertical) scale,
VSWR (ratio)
Rtn Loss (dB)
Cbl Loss (dB)
1. Enable the Measure Match Mode. See “Selecting the Measure Match
Mode” on page 13.
2. Set the frequency. See “Setting the Measurement Frequency” on page 14.
3. Calibrate the Site Analyzer. See “Calibration” on page 11.
4. Press the Config key.
5. Press the Scale softkey.
6. Select units by pressing the left or right scroll keys.
7. Open the units list menu by pressing the up or down scroll keys.
8. Select the desired units by pressing the up or down scroll keys.
9. Press the Enter key to accept the selection.
10. Press the Esc key to exit the configure screen.
15
Page 32

Figure 12 Setting Match Mode Measurement Units
Setting the Measurement Scale Limits
The minimum and maximum values on the Y (vertical) scale can be set manually
or choose Auto Scale and let the instrument select values that will display the
entire trace. Values cannot be entered that are outside of the limits of the
instrument (-60 and 0). If the expected results are unsure, set the minimum to –
60 dB and maximum to 0 dB or choose Auto Scale. Auto Scale is available on the
main screen as well as on the mode configure screens. The table below lists typical worst case values for selected measurements.
Component Return Loss Limits
Antenna at Resonance –14 dB
Connector –25 dB
Jumper –35 dB
Lightning Protector –25 dB
Transmission Line –30 dB
1. Enable the Measure Match Mode. See “Selecting the Measure Match
Mode” on page 13.
2. Set the frequency. See “Setting the Measurement Frequency” on page 14.
3. Calibrate the Site Analyzer. See “Calibration” on page 11.
4. Press the Config key.
5. Press the Scale softkey.
Note: To enter a manual value, skip this step.
6. Use the left or right scroll keys to select Auto Scale then press Enter.
7. Select Min, using the left or right scroll keys, then enter the value or enter –60
and press Enter.
Note: If Auto Scale is selected, skip this step.
8. Select Max, using the left or right scroll keys, then enter the value or enter –60
and press Enter.
Note: If Auto Scale is selected, skip this step.
9. Press the Esc key to exit the configure screen.
16
Page 33

Figure 13 Setting Match Mode Scale Limits
Setting the Measurement Data Points
Select the number of data points to take during a measurement. There are three
data point options, 238 points, 475 points, and 949 points. Increasing the number
of data points increases the measurable distance in distance-to-fault measurements and increases the detail in Measure Match mode measurements. When
saving a trace, the number of data points collected (238, 475, or 949) are saved.
The default number of data points is 238. Selecting 475 data points provides
twice as many measurement points as 238, but it takes approximately twice as
long for the trace to sweep and display. Selecting 949 data points provides four
times as many measurement points as 238, but it takes approximately four
times as long for the trace to sweep and display.
A progress bar, just below the x-axis, moves from left to right indicating the
progress of the sweep. When the progress bar reaches the right side of the
screen, the sweep is finished.
When the number of measurement data points are changed, the current trace
is erased and the Save softkey is disabled until the sweep finishes and the
screen displays the first new trace. If the Save softkey is pressed before the first
sweep has completed, the Save softkey icon (the red bar) will blink until the
sweep finishes and then the display will change to the Save and Recall screen (in
response to pressing the Save softkey).
1. Enable the Measure Match Mode. See “Selecting the Measure Match
Mode” on page 13.
2. Set the frequency. See “Setting the Measurement Frequency” on page 14.
3. Calibrate the Site Analyzer. See “Calibration” on page 11.
4. Press the Config key.
5. Press the Scale softkey.
6. Press the left or right scroll key to select Pts.
7. Press the up scroll key to open the selection list.
8. Press the up or down scroll key to select a data point option (238, 475, 949).
9. Press the Enter key to accept the selection and return to the configuration screen.
17
Page 34

Figure 14 Setting the Number of Measurement Data Points
Setting the Graph Display Type
When the Site Analyzer collects data during a sweep, the unit can specify that it measure 238 data points, 475 data points, or 949 data points. Selecting 475 data points
takes twice as much time to sweep as 238 points, and 949 points takes four times as
much time to sweep as 238 points.
The Site Analyzer display screen graph area can display only 238 points because of its
physical pixel limitations. However, if the trace contains 475 points or 949 points, all
points are represented on the display. There are three modes available to display the
data points for the trace: envelope, maximum, and minimum. For 238 data points,
there is no difference in the display for each of the three modes because each data
point occupies a separate pixel. For 475 data points and 949 data points, the envelope
mode displays all data points, the maximum mode displays only the highest (peak)
magnitude data point for each pixel, and the minimum mode displays only the lowest
(minimum) magnitude data point for each pixel.
Note: When saving (or downloading) a trace, all measured data points
(238, 475, 949) are saved (or downloaded). The display modes (envelope, maximum, minimum) are for the Site Analyzer display only and are
not saved (or downloaded) with the trace.
1. Enable the Measure Match Mode. See “Selecting the Measure Match
Mode” on page 13.
2. Set the frequency. See “Setting the Measurement Frequency” on page 14.
3. Calibrate the Site Analyzer. See “Calibration” on page 11.
4. Press the Config key.
5. Press the Scale softkey.
6. Press the left or right scroll key to select Disp.
7. Press the up scroll key to open the selection list.
8. Press the up or down scroll key to select a display type (envelope, maximum, minimum).
9. Press the Enter key to accept the selection and return to the configuration screen.
18
Page 35

Figure 15 Setting the Graph Display
Set and Activate Acceptance Limits
The limit line helps see failures. It appears as a horizontal line at the value
selected.
An acceptance limit line can be set to help visualize what part of the measurement trace is not acceptable. The part of the trace that is not acceptable will display in red. To view the limit line, the limit test must be ON. This feature is
available only in the Measure Match mode and the Fault Location mode.
1. Enable the Measure Match Mode. See “Selecting the Measure Match
Mode” on page 13.
2. Set the frequency. See “Setting the Measurement Frequency” on page 14.
3. Calibrate the Site Analyzer. See “Calibration” on page 11.
4. Follow the numbered steps in Figure 46, page 51 to turn ON the limit test
and set the limit line value.
Note: When setting a limit line value with the Limit Test turned OFF,
a line will not be displayed on the screen.
Measure the Match of the Component
1. Connect the Site Analyzer to the component being tested as follows:
Antenna – (if used) Connect the Phase Stable Cable directly to the
coaxial connector of the antenna. There should be no other transmission lines or jumpers connected.
Other Components – (Including Jumpers, Transmission Lines, Light-
ning Protectors, and RF Filters) Connect the Phase Stable Cable to one
end of the component. Connect the Calibration Combination Load to the
other end of the component.
2. Wait at least 10 seconds for the sweep to update.
3. When a trace is displayed on the screen, any of the following can be done:
Hold the trace. See “Measurement Hold” on page 51.
Add markers to the trace. See “Markers” on page 52.
Save the trace. See “Saving a Trace” on page 58.
19
Page 36

Interpreting the Measurement
The graph below shows a typical Match Measurement for an antenna system.
Figure 16 Measurement Screen
Parts of the sweep below the limit line are better than the limit.
Antennas and filters should be below the limit line for the entire band,
and above the limit line outside the band.
Other components should be flat and below the limit line across the
entire band.
20
Page 37

Cable Loss Measurement
Ensure that the cable being tested is unterminated (not connected to
anything at the far end).
Note: Cable loss is a measurement choice that is available in Measure Match (Configuration). It can also can be selected by choosing Cbl
Loss from Units when setting the Scale in Measure Match (Configure).
Check the power of cable to be tested. See “Determine the Power of
the Component Being Tested” on page 13.
Note: Ensure that the cable does not have power greater than +22
dBm.
Note: Ensure the unit is in either Measure Match or Fault Location
mode. Also ensure that the frequency band of the system is known.
Setting Up a Cable Loss Measurement
1. Press the Config key.
2. Press the Scale softkey.
3. Press the right or left scroll keys to select Units.
4. Press the up key to open the units list.
5. Press the up or down keys to select Cbl Loss.
6. Press Enter.
Figure 17 Set Up for Cable Loss Measurement
21
Page 38

Performing a Cable Loss Measurement
1. Enable the Measure Match Mode. See “Selecting the Measure Match
Mode” on page 13.
2. Select the Freq softkey.
3. Set the frequency start and stop to a range that is well beyond the normal
range of the antenna. See “Setting the Measurement Frequency” on
page 14.
Example - For a 450 MHz antenna, set the start frequency at
400 and the stop frequency at 500 MHz. For an 800 MHz
antenna, set the start frequency at 700 and the stop frequency
at 1,100 MHz.
4. Connect a phase stable cable to the Site Analyzer antenna test port.
5. Connect a Cal Combo to the other end of the cable.
6. Calibrate the Site Analyzer. See “Calibration” on page 11.
Note: After calibration, with the load still connected, the output
must below -25 dB. If it is not, there is a problem.
7. Remove the Cal Combo unit from the cable.
Note: Do not disconnect the phase stable cable from the Site Analyzer.
8. Connect the phase stable cable to one end of the cable under test.
9. Connect the Short connection on the Cal Combo unit to the other end of
the cable being tested.
10. Wait at least 10 seconds to allow the trace to update.
11. Hold the trace on the screen. See “Measurement Hold” on page 51.
12. Place a triangle-style marker (mark 1) at the minimum loss point within the
frequency band on the trace. See “Markers” on page 52.
13. Place a triangle-style marker (mark 2) at the maximum loss point within the
frequency band on the trace.
14. Save and label the trace, if appropriate. See “Saving a Trace” on page 58.
Interpreting a Cable Loss Measurement
The graph below shows a typical cable loss measurement. Note that the scale is
greatly reduced to show the cable’s variation across frequency.
22
Page 39

Figure 18 Cable Loss Measurement Screen
1. Take the average of M1 and M2.
Note: This is the average cable loss across the frequency band.
2. Compare the loss with the manufacturer’s specified loss for a cable of this
length.
Note: If they do not correspond, retake the measurement, then
check the cable for problems.
Note: Cable Loss for a good cable should be flat across the frequency
band.
23
Page 40

24
Page 41

Chapter 4 Fault Location Mode
Fault location identifies the position of impedance discontinuities (reflections)
within the antenna/feeder system. The measurement results are displayed on
an x-y graph. Distance from the Site Analyzer is shown on the x-axis, while relative magnitude of the discontinuity is shown on the y-axis.
Before making a fault location measurement, ensure that the following items
and information is present:
A Bird Calibration Combination (Cal Combo) calibration unit.
All necessary cables and adapters of the correct size and connector
type.
The velocity of propagation for the cable type being measured (obtain
from the cable manufacturer).
Number of data points to use in making the distance to fault measure-
ment (user choice).
This chapter describes how to make a fault location measurement and provides
step by step instructions. In addition, this chapter also describes how to set and
move markers. For information and instructions to save and recall traces, refer
to Saving and Recalling Traces, page 56.
Note: To make a fault location measurement, follow the procedures
in this chapter in the order they are presented.
Determine the Power of the Component Being Tested
Use a service monitor, power meter, or spectrum analyzer to check that the component being tested does not have power greater than +22 dBm.
CAUTION
+22 dBm max. input
Do not apply RF power to the Antenna Test Port. Exceeding the maximum
input will damage the Site Analyzer.
Note: Changing the frequency settings will automatically turn calibration off. Always set the frequency before calibrating the unit.
Note: If entering a frequency that is outside of the range of the Site
Analyzer, the Site Analyzer will override the entry and set the minimum or maximum frequency of the model.
25
Page 42

Selecting Fault Location Mode
1. Press ON/OFF key for ½ second.
2. Press the MODE key.
3. Press the Fault Location softkey.
Figure 19 Select Fault Location Mode
Setting the Frequency Span and Max Distance
Note: Changing the frequency span or the max distance will auto-
matically turn calibration off. Always set the frequency span or max
distance before calibrating the unit.
The maximum distance measured is determined by the frequency span, the
velocity of propagation of the cable (Vp), and the number of data points to measure (238, 475, or 949). These factors are discussed in the following paragraphs.
Max Distance - When specifying a frequency span, the Site Analyzer calcu-
lates the maximum measurable distance. If the maximum distance being measured is known, it can be entered instead of the frequency span; the Site
Analyzer calculates the frequency span. If a maximum distance is manually
entered, select the data points before entering the max distance
Note: If a maximum distance less than the total length of the cable
system is selected, the trace might show a spike that is not really a
fault, but rather an echo from the portion of the cable that is beyond
the maximum length. Such a spike is known as an alias. To avoid
aliasing, always set the maximum distance to a value that is a few
feet or meters greater than the entire length of the cable system.
26
Page 43

Data Points - Increasing the number of data points increases the measurable
distance (475 points results in twice the distance of 238 points, and 949 points
results in four times the distance of 238 points). When changing the number of
data points measured, the software automatically recomputes the new maximum measurable distance. If a maximum distance is entered manually, be sure
to select the data points before entering the max distance. Changing data points
does not turn calibration off.
Frequency Span - Narrowing the frequency span increases the measurable
distance (refer to the Fault Location Distance Tables, page 91).
Velocity of Propagation - The velocity of propagation is a characteristic of
the cable and is expressed as a percentage. Contact the cable manufacturer to
get the velocity of propagation value for the cable being used.
Setting the Frequency Span
For a given number of data points (238, 475, 949), entering a frequency span
causes the Site Analyzer to calculate and enter the maximum measurable distance and, conversely, entering a maximum distance causes the Site Analyzer to
calculate and enter the required frequency span.
There are two methods to determine the frequency span (for both methods, the
maximum distance, velocity of propagation, and number of data points need to
be known). Instructions for both methods are in Step 2 below:
See “Fault Location Distance Tables” on page 91.
Calculate the frequency span.
1. Enable the Measure Match Mode. See “Selecting the Measure Match
Mode” on page 13.
2. Determine the frequency span.
3. Choose how many data points are wanted to measure.
4. Choose a velocity propagation percentage that is closest to the cable in the
system. See “Fault Location Distance Tables” on page 91.
a. Read down the Vel Prop percentage column to determine the fre-
quency span or the maximum distance.
Note: When choosing a distance, choose one that is approximately
25% more than the tower height (or length of the cable system to be
tested).
Example - For a cable with a dielectric constant of 2.296,
the velocity percentage is 66%. If the cable system is 100
feet long, and 238 data points are chosen, then the Site
Analyzer should be set to a frequency span of 700 MHz. The
resolution of the graph will be 5.6 inches.
Note: To avoid potential false “spikes” (aliases) on the trace, be sure
to select a distance that is at least 25% greater than the length of the
cable system being tested.
27
Page 44

b. Do one of the following:
If the cable’s velocity of propagation and its length are known but they
are not on one of the tables, either enter the max distance into the
Site Analyzer or determine the approximate frequency span required
by using the following equation:
Freq Span =
where (# points - 1) is 237, 474, or 948
150relative velocity (%) # points 1–
-----------------------------------------------------------------------------------------------------------test length (m)
If a span greater than the current settings permit is entered, the span
will be set to the maximum allowable value.
Note: The center frequency is the center of the antenna’s frequency
range.
Note: To set the max distance, follow the numbered steps in
Figure 20 on page 28.
5. Press the Config key.
6. Press the Freq softkey.
7. For both Span and Center, scroll to select the item (Span or Center).
8. Enter the Span value determined from the table earlier.
9. Enter the value for the center frequency as determined in instruction Step 3.
10. Do one of the following:
After entering the Span value, press Enter.
After entering the Center value, press Enter.
11. Enable the Fault Location Mode. See “Selecting Fault Location Mode” on
page 26.
Figure 20 Setting the Frequency Span and the Center Frequency
28
Page 45

Setting the Maximum Distance
Note: Changing the frequency span or the max distance will auto-
matically turn calibration off. Always set the
frequency span or max distance before calibrating the unit.
1. Enable the Fault Location Mode. See “Selecting Fault Location Mode” on
page 26.
2. Press Enter, at the warning message, to accept the entry or Esc to cancel
the entry.
Note: When pressing Enter, the Site Analyzer will display the Calibration screen so the calibration process can begin.
3. Press the Config key.
4. Press the Distance softkey.
5. Press the right or left arrow keys to scroll to Max.
6. Enter a maximum distance value.
7. Press the Enter key after entering a value.
8. Press the Esc key to exit the configuration screen.
Figure 21 Setting the Maximum Distance
Figure 22 Changed Max Distance Warning Message
29
Page 46

Setting the Cable Type
Setting the cable type means that values for the velocity of propagation and the
cable loss are entered. The cable type can be set manually or choose from a list
of preset values. When manually entering a value for the velocity of propagation or cable loss, the Cable List entry becomes “Custom”.
Note: Changing the cable type or velocity of propagation will reset
the distance scale to the maximum possible distance. Always set the
cable type before setting the distance scale.
1. Enable the Fault Location Mode. See “Selecting Fault Location Mode” on
page 26.
2. Press the Config button.
3. Press the Cbl Type softkey.
4. Do one of the following:
To set a Custom Cable Type: See “Setting a Custom Cable Type” on
page 30.
To select a Sweep Frequency: See “Selecting a Cable Type from a Cable
Type List” on page 31.
Setting a Custom Cable Type
1. Scroll to select the item (Vel Prop or Loss).
Note: For both Vel Prop and Loss.
2. Enter the Vel Prop value or enter the Loss value.
3. Do one of the following:
Press Enter after entering the Vel Prop value.
Press Enter after entering the Loss value.
4. Press the Esc key to exit the configuration screen.
Figure 23 Setting a Custom Cable Type
30
Page 47

Selecting a Cable Type from a Cable Type List
1. Press the right or left scroll keys to select and open Cable List.
2. Press the up or down scroll keys to select an item on the list.
3. Press the Enter key to accept the selection.
4. Press the Esc key to exit the configuration screen.
Figure 24 Selecting the Cable Type from List
Setting the Distance and Units
The trace can display the entire length (distance) of the cable system being
measured or a smaller portion of the length for better detail.
If it is suspected that there might be a fault at a known distance along a cable,
set the display to show only that area by using the start and stop points. Think of
this as zooming in on a section of the cable. Both the start point (where to begin
the trace display) and the stop point (where to end the trace display) can be set.
Note: The stop point cannot be set to a value that is greater than the
maximum distance being measured.
Example - If a data point option, frequency span, and Vp
are selected and it results in a maximum distance of 100, a
stop point cannot be set to a value greater than 100 feet.
Follow the numbered steps in Figure 25, page 32 to set the start and stop distance.
For an antenna lead, typically set the start distance at 0, and the stop distance at a
few feet or meters greater than the tower height.
1. Press the Config key.
2. Press the Distance softkey.
31
Page 48

Setting the Start and Stop Distance
1. Press the right or left arrow keys to scroll to Start or Stop.
2. Enter a value for Start or Stop using the numeric key pad.
3. Press the Enter key after entering a value.
4. Press the Esc key to exit the configuration screen.
Figure 25 Setting the Start and Stop Distance
Setting the Distance Units
1. Press the left or right arrow keys to select Units.
2. Press the up or down arrow keys to select a unit from the list.
3. Press the Enter key.
4. Press the Esc key to exit the configuration screen.
Figure 26 Setting the Distance Units
32
Page 49

Setting the Scale & Unit of Measure
Set the display scale manually or by using Auto Scale. The display trace can be in
units of return loss [dB] or VSWR [ratio]. Activate Auto Scale from the configuration
screen or from the main Fault Location screen.
Setting Fault Location Scale Units
1. Press the Config key.
2. Press the Scale softkey.
3. Use the left or right scroll keys to select Units.
4. Use the up or down scroll keys to activate the units menu and to select the
units desired.
5. Press the Enter key.
6. Press the Esc key to exit the configure screen.
Figure 27 Setting Fault Location Scale Units
Setting Fault Location Scale Limits Manually
1. Press the Config key.
2. Press the Scale softkey.
3. Use the left or right scroll keys to select Min.
4. Use the keypad to enter the value or use –60 as a limit.
5. Press the Enter key.
6. Use the left or right scroll keys to select Max.
7. Use the keypad to enter the value or use 0 as a limit.
8. Press the Enter key.
9. Press the Esc key to exit the configure screen.
33
Page 50

Figure 28 Setting Fault Location Scale Limits Manually
Setting Fault Location Auto Scale
1. Press the Config key.
2. Press the Scale softkey.
3. Use the left or right scroll keys to select Auto Scale.
4. Press the Enter key.
5. Press the Esc key to exit the configure screen.
Figure 29 Setting Fault Location Auto Scale
34
Page 51

Set the Measurement Data Points
The SA-XT can select the number of data points to take during a measurement.
There are three data point options, 238 points, 475 points, and 949 points.
Increasing the number of data points increases the measurable distance in distance-to-fault measurements and increases the detail in Measure Match mode
measurements. When saving a trace, the number of data points collected (238,
475, or 949) are saved.
The default number of data points is 238. Selecting 475 data points provides
twice as many measurement points as 238, but it takes approximately twice as
long for the trace to sweep and display. Selecting 949 data points provides four
times as many measurement points as 238, but it takes approximately four
times as long for the trace to sweep and display.
A progress bar, just below the x-axis, moves from left to right indicating the
progress of the sweep. When the progress bar reaches the right side of the
screen, the sweep is finished.
When changing the number of measurement data points, the current trace is
erased and the Save softkey is disabled until the sweep finishes and the screen
displays the first new trace. If the Save softkey is pressed before the first sweep
has completed, the Save softkey icon (the red bar) will blink until the sweep finishes and then the display will change to the Save and Recall screen (in response
to pressing the Save softkey).
Setting the Measurement Resolution
1. Enable the Measure Match Mode. See “Selecting the Measure Match
Mode” on page 13.
2. Set the frequency. See “Setting the Measurement Frequency” on page 14.
3. Calibrate the Site Analyzer. See “Calibration” on page 11.
4. Enable the Fault Location Mode. See “Selecting Fault Location Mode” on
page 26.
5. Press the Config key.
6. Press the Scale softkey.
7. Use the left or right scroll keys to select Res.
8. Press the up scroll key to open the list.
9. Press up or down scroll key to select a data point option (238, 475, 949).
10. Press the Enter key to accept the selection and return to the configure
screen.
35
Page 52

Figure 30 Setting the Measurement Resolution
Set the Graph Display Type
When the Site Analyzer collects data during a sweep, it can be set to measure 238
data points, 475 data points, or 949 data points. Selecting 475 data points takes
twice as much time to sweep as 238 points, and 949 points takes four times as much
time to sweep as 238 points.
The Site Analyzer display screen graph area can display only 238 data points
because of its physical pixel limitations. However, if the trace contains 475 data
points or 949 data points, all points are represented on the display. There are
three modes available to display the data points for the trace - envelope, maximum, and minimum. For 238 data points, there is no difference in the display
for each of the three modes because each data point occupies a separate pixel.
For 475 data points and 949 data points, the envelope mode displays all data
points, the maximum mode displays only the highest (peak) magnitude data
point for each pixel, and the minimum mode displays only the lowest (minimum) magnitude data point for each pixel.
Note: When saving (or downloading) a trace, all measured data points
(238, 475, or 949) are saved (or downloaded). The display modes (envelope, maximum, minimum) are for the Site Analyzer display only and are
not saved (or downloaded) with the trace.
36
Page 53

Setting the Graph Display
1. Enable the Measure Match Mode. See “Selecting the Measure Match
Mode” on page 13.
2. Set the frequency. See “Setting the Measurement Frequency” on page 14.
3. Calibrate the Site Analyzer. See “Calibration” on page 11.
4. Enable the Fault Location Mode. See “Selecting Fault Location Mode” on
page 26.
5. Press the Config key.
6. Press the Scale softkey.
7. Press the left or right scroll key to select Disp.
8. Press the up scroll key to open the selection list.
9. Press the up or down scroll key to select a display type (envelope, maximum, minimum).
10. Press the Enter key to accept the selection and return to the configuration
screen.
Figure 31 Setting the Graph Display
Set and Activate Acceptance Limits
The limit line helps to set off those parts of a trace that are outside of the acceptance (limit) values. It appears as a horizontal line at the limit line value.
An acceptance limit line can be set to help visualize what part of the measurement trace is not acceptable. The part of the trace that is not acceptable will display in red. To view the limit line, the limit test must be ON. This feature is
available only in the Measure Match mode and the Fault Location mode.
37
Page 54

1. Enable either the Measure Match Mode, see “Selecting the Measure Match
Mode” on page 13.
2. Set the frequency. See “Setting the Measurement Frequency” on page 14.
3. Calibrate the Site Analyzer. See “Calibration” on page 11.
4. Enable the Fault Location Mode, if necessary. See “Selecting Fault Location
Mode” on page 26.
5. Press the Limit Test key to activate the limit line:
a. Test ON Aud (line and sound)
b. Test ON (line only)
c. Test OFF
Note: A limit line value can be set with the limit test turned OFF, but
will not see the line displayed.
6. Press the Config key.
7. Press the Limit Line softkey.
8. Use the keyboard to enter a limit value then press the Enter key.
9. Press the Esc key to exit the configuration screen.
Figure 32 Setting a Limit Line
38
Page 55

Test for Fault Location
1. Connect the Site Analyzer to the cable being tested.
Note: If the Site Analyzer is calibrated with a phase stable cable connected to its antenna port, do not remove the cable. Connect it to the
cable to be tested.
2. Wait at least 10 seconds for the sweep to update.
3. When a trace is on the screen, do any of the following:
Hold the trace. See “Measurement Hold” on page 51.
Add markers to the trace. See “Markers” on page 52.
Save the trace. See “Saving a Trace” on page 58.
Interpreting the Fault Location Measurement
The graph below shows a typical Fault Location measurement for an antenna
system. The table lists typical component return losses.
Figure 33 Fault Location Measurement Screen
Typical Component Return Loss
Antenna at Resonance –14 dB
Connector –25 dB
Jumper –35 dB
Lightning Protector –25 dB
Transmission Line –30 dB
39
Page 56

Each connector or jumper will show up as a spike. If it is larger than the
typical value, check the connector for damage.
Spikes where there are no components represent faults. Note the dis-
tance and check the line at that point for damage.
The largest spike is usually due to the antenna. Typically the trace after
the antenna can be ignored.
If a selected cable length that is less than the total length of the cable
system, the trace might show a spike that is not really a fault, but
rather an echo from the remaining portion of the cable that is beyond
the length chosen. Such a spike is known as an alias.
Note: To avoid aliasing, always set the measurement distance to a
value that is a few feet or meters greater than the entire length of the
cable system.
A large spike (fault) near the Site Analyzer will mask other faults farther
away. When a large spike near the Site Analyzer is found, fix it and then
repeat the Fault Location measurement.
40
Page 57

Chapter 5 Power Measure Mode
Note: The figures in this chapter do not show the entire Site Analyzer. The figures show only the screen image and the keys used to
accomplish a setup or measurement.
Note: Power measurement comes standard on all models.
This measurement verifies and monitors the condition of the transmitter system. Multiple measurement values can be simultaneously displayed, depending
on the sensor. One measurement is also displayed on an analog dial. Sensors
compatible with the Bird Site Analyzer include Directional Power Sensors, Terminating Power Sensors, and Wideband Power Sensors.
Press the keys indicated in the following figure to enter the Measure
Power mode.
Figure 34 Power Measure Mode
Press the
Mode key
Press from
Select Mode
41
Page 58

Figure 35 Connecting the SA to Measure Power
42
Page 59

Connecting a Sensor
See Figure 35 on page 42. When a sensor is properly connected, the status message (at the top of the screen) will change from “Waiting for Sensor” to “Sensor
Connected”. The warning screen will be replaced by the main display.
CAUTION
+22 dBm max. input
Do not apply RF power to Antenna Test Port. Exceeding the maximum input
will damage the Site Analyzer.
The antenna test port is used only for testing unpowered systems. For power
measurement, an external power sensor must be connected to the “Remote
Power Sensor” port. See Figure 35 on page 42.
CAUTION
When using a terminating power sensor, do not exceed 2 W average or 125 W
peak power for 5 μs. Doing so will render the sensor inoperative.
For best results with element-based sensors, connect the sensor and enter the
forward element’s power rating before taking any data. See Setting the Full Scale
Power, page 45.
43
Page 60

Display Description
Figure 36 Measure Power Screen Features
1
2
3
4
5
6
7
Note: Measure power sample display with a sensor properly connected.
Item Description Explanation
1 Sensor Status Indicates the connection status of the power
sensor.
2 Primary Measurement Identifies the measurement displayed on the
analog dial.
3 Primary Value Numeric display of the primary value.
4 Measurement Scale Indicates the dial’s full scale.
5 Dial Graphic display of the primary
measurement.
6 Secondary
Measurements
7 Secondary Value Numeric display of secondary values.
Identifies measurements not displayed on
the dial.
44
Page 61

Setting the Full Scale Power
For element-based sensors, enter the power rating listed on the forward element before making any measurements. Also, check that the rating of the
reflected element is 10% of the forward element.
Figure 37 Full Scale Power Meter
Press from
Measure
Power Mode
Scroll to Full
Scale
Enter the
forward
element
power
Note: The Bird Site Analyzer will automatically set the full scale power
for sensors that do not use elements, such as the TPS or WPS sensors.
45
Page 62

Zeroing Bird Power Sensors
CAUTION
When using terminating power sensors do not exceed 2 W average or 125 W
peak power for 5 μs. Doing so will render the sensor inoperative.
Over time, the sensor’s “zero value” (reading with no applied RF power) can
drift, making all readings inaccurate by this value.
Example - If the zero value is –2 μW, measuring a 5 mW
signal will give a reading of 4.998 mW, a 0.04% error. Periodically re-zero the sensor.
Note: This applies to TPS and WPS power sensors.
Note: For best results, make sure the sensor has been connected to
the Site Analyzer and the SA turned on for at least 5 minutes. Do not
apply RF power to the sensor during calibration.
Figure 38 Zeroing, Message 1
Press from
Measure
Power Mode
Press to
begin the
calibration
46
Page 63

Figure 39 Zeroing, Message 2
Press to
accept the
warning
Figure 40 Zeroing, Power Meter
Wait for
calibration
to finish
47
Page 64

Choosing the Displayed Measurement
The primary display shows one value on the large numerical display and the
pointer. Other measurements are displayed numerically below the dial.
Note: When using a terminating power sensor, only forward power
can be measured. Reflected power and match will not be displayed.
Figure 41 Match Screen
Toggle
between
Fwd, Refl,
and Match
Setting Units
Figure 42 Forward Screen
48
Page 65

Changing the Mode for the Directional Power Sensor
The DPS has three modes of operation: APM, 43Avg, and 43Peak. Bird 43 Elements
can measure average, peak, and average of max. and min. power. Bird APM Elements only measure average power.
Figure 43 DPS, Forward Screen
The 43 Peak Mode
When the DPS is in the 43Peak mode, the measurements change as shown below.
Note: When using the DPS in the 43Peak mode, the match units are
no longer needed and are greyed out.
Figure 44 DPS, Match Screen
Toggle
between
+Peak,
-Peak,
AvgPk
49
Page 66

Recall Setups
Power measurement setups can be created using the Bird Site Analyzer PCTool
Software, then stored in the Site Analyzer’s nonvolatile memory. These setups
store both the offset and the full scale power.
Figure 45 Setup Screens
Press from
Measure
Power Mode
Press to
display the
Power
Setup menu
Scroll to the
setup to be
The setup is
50
recalled
recalled
Page 67

Chapter 6 General Operation
Setting a Limit Line
1. While in the Measure Match mode or the Fault Location mode, press the
Limit Test key:
First press - Test ON Aud (line and sound)
Second press - Test ON (line only)
Third press - Test OFF
2. Press the Config key.
3. Press the Limit Line softkey.
4. Use the keyboard to enter a limit value of the choice or use the suggested
limits listed below (use the +/- key to enter a negative value) then press the
Enter key.
Antenna at resonance - 14 dB
Connectors - 25 dB
Jumpers - 35 dB
Lightning protector - 25 dB
Transmission lines - 30 dB
5. Press the Esc key to exit the configure screen
Figure 46 Setting a Limit Line
Measurement Hold
Measurement Hold stops updating the display at the end of the current sweep.
Press the Hold key to toggle the sweep hold off and on. A measurement is held
when there is a lock icon in the indicator ball. Measurement hold is available in Measure Match mode and Fault Location mode.
1. Press the Hold softkey to hold the measurement.
2. Press the Run softkey to resume sweeping.
3. The lock symbol indicates that the measurement is held.
51
Page 68

Figure 47 Measurement Hold
Markers
Up to six markers can be used and activated to visually indicate the trace value at
specific frequency points. All markers follow the current trace only. The site analyzer displays the frequency and signal value for each marker at the bottom of the
screen. Each marker is displayed as a triangle pointer or a vertical line through the
trace. The difference (delta) in frequency between two markers can also be displayed. Markers indicate VSWR to 0.01, and Return Loss or Cable Loss to 0.1 dB.
When both a recalled trace and the current measurement trace is both displayed at the same time, there is an additional marker option, single mode and
dual mode. In single mode, the markers function normally (indicating the frequency and value at the marker). In dual marker mode, select a marker using
the Mark softkey. At the bottom of the screen, the site analyzer will display the
marker number, the frequency, and the value of the current trace at the
marker. The difference in frequency and value between the current trace and
the recalled trace is also displayed. The difference in frequency is always 0.00
(zero). Only the first three markers (M1, M2, M3) are available in dual mode.
Activate Markers and Set Marker Style
1. Press the Marker key to enter marker setup.
2. Press the Mark softkey to select a marker (1-6).
3. Press the Active / Off key to turn ON the selected marker (active) or turn
OFF the selected marker (off).
4. Press the Type softkey to select triangle marker (mark 4 in the figure) or line
marker (mark 1 in the figure).
5. Repeat Step 2 through Step 4 to select and activate up to six markers and
set the mark style.
6. Press the Esc key to return to the test screen.
52
Page 69

Figure 48 Activate Marker and Set Style
Move Markers
The active markers can be moved by using the arrow scroll keys or by entering a
distance with the numeric key pad. All markers follow the current trace only.
If a trace is recalled and markers are desired to compare it to the current trace, select
the dual mode (see “Using Markers with Recalled Traces” on page 55). The marker will
move along the current trace (as described in the following paragraph) and compare
each data point at the marker frequency (on the current trace) to the first saved data
point in the recalled trace (other data points in the recalled trace are not compared).
Since traces can be created using different numbers of data points (238, 475, 949),
moving a marker along a 475 data point or 949 data point trace will appear different
from how the marker moves along a 238 data point trace. In a 238 data point trace,
when the right or left scroll keys are pressed, the marker moves with each key press.
In a trace with 475 data points, there are two data points at each pixel. When first
moving to a new pixel, the screen displays the value of the first data point that was
saved and when pressing the right scroll key the marker does not “move” but the
screen displays the value of the second data point. Pressing the right scroll key a
third time moves to the next frequency. Similarly in a trace with 949 data points,
there are four data points at each marker pixel. When first moving to a new frequency, the screen displays the value of the first data point that was saved and each
time the right scroll key is pressed the marker does not “move” but the screen displays the value of the next data point (in the order saved). Pressing the right scroll
key a fourth time moves to the next frequency.
Moving Markers
1. Press the Marker key to enter marker setup.
2. Press the Mark softkey to select a marker (1-6).
3. Press the right or left arrow keys to move the marker right or left, or enter a
frequency value on the keypad and press Enter.
4. Press the up arrow key to move the marker to the highest point on the trace.
5. Press the down arrow key to move the marker to the lowest point on the trace
6. Press the Esc key to return to the test screen.
53
Page 70

Figure 49 Moving Markers
Using Delta Markers
In the delta marker mode, only active markers will be visible. The delta marker
feature displays the difference (delta) in both frequency and value between the
selected marker and each active marker. If the limit line is active, the difference
between the selected marker and the limit line will be evident. The frequency
difference between the selected marker and the limit line will always be the frequency of the marker. All markers follow the current trace only.
Note: The delta marker feature compares points only on one trace,
and must have at least two active markers for the delta option to work.
Note: Ensure that unit is in either Measure Match mode or Fault
Location mode.
1. Press the Marker key to enter marker setup.
2. Press the Mark softkey to select an active marker (1-6).
3. Press the Delta softkey to cycle through the active markers and limit line (if active).
4. Press the Esc key to return to the test screen.
Figure 50 Delta Markers
54
Page 71

Using Markers with Recalled Traces
When a trace is recalled, the screen displays both the current trace and the
recalled trace and there is an additional marker option, single / dual mode. In single mode, the markers function normally; the site analyzer displays the frequency
and trace magnitude at each marker. In dual mode, the markers show the actual
magnitude of both traces and the difference in magnitude between the recalled
trace and the current reading. All markers follow the current trace only, and only
three markers are available in dual mode, M1, M2, and M3. When dual mode is
selected, the markers move as described in Move Markers, page 53.
1. Recall a trace. See “Recalling a Saved Setup” on page 63.
2. Press the Marker key.
3. Press the Mode softkey to select single mode or dual mode.
4. Select a marker to move.
5. Press the left or right scroll keys to move the marker.
6. Press the Esc key to return to the test screen.
Figure 51 Using Markers with Recalled Traces
Setting Display Smoothing
Smooth is an option that will digitally average the displayed trace. There are
three levels of smoothing: low, medium, and high. Figure 53, page 56 a trace
with high smoothing selected.
1. Press the Config key
2. Press the Smooth key:
First press - sets smoothing to Low
Second press - sets smoothing to Medium
Third press - sets smoothing to High
Fourth press - sets smoothing to None (off)
3. Press the Esc key to exit the configuration screen
55
Page 72

Figure 52 Setting Display Smoothing
Figure 53 Display with High Smoothing Selected
Saving and Recalling Traces
Note: This feature is only available if the unit is NOT connected to a
PC. If the unit is connected to a PC, this feature will be disabled.
Traces and instrument setups can be saved to and recalled from the memory in
the unit or on an external USB thumb drive. The Site Analyzer identifies saved
files with the frequency range used, a time-date stamp, and the number of data
measurement points.
Example - A trace filename might be labeled as “256000_07-JUN-2011_084413_475”, where 25-6000 is the
frequency range, 07-JUN-2011_084413 is the time-date
stamp, and 475 is the number of datapoints measured.
Descriptive labels (text and numbers) can also be added to the items. This section discusses saving and recalling traces, and creating and editing labels. Refer
to Saving a Setup, page 62 for information about saving instrument setups.
The trace files are approximately 26 KB for a 238 point sweep. Since
the SA-XT trace files are stored in a text-based CSV format they vary in
size a little from file to file.
Saved set ups are are appoximately 23 KB each.
56
Page 73

The internal memory available for storing traces and setups is limited. The 64
MB internal flash memory can store:
Up to 2,800 custom instrument setups
Up to 2,500traces at 238 data points
Up to 1,250at 475 data points
Up to 650 at 949 data points
Note: All of the stored traces do not need to be of the same number
of data points, therefore, the actual maximum number of traces saved
varies depending upon the number of data points in the traces.
Example - The Site Analyzer could store 140 traces with 238
data points plus 60 traces with 475 data points (which equals
approximately the same capacity as 120 traces with 238 data
points) plus 60 traces with 949 data points (which equals
approximately the same capacity as 240 traces with 238 data
points).
When the storage memory is full or cannot hold the trace being saved, the system displays a message stating that there is no more space and that the trace
needs to be saved at a lower number of data points (i.e. change the number of
data points in the Config menu), free space by deleting some traces, or connect
an external flash drive (see “Connecting a USB Flash Drive” on page 57).
Note: The amount of available storage is displayed at the bottom of
the Save/Recall screen.
Figure 54 Out of Memory Message
Connecting a USB Flash Drive
In addition to internal memory, a USB flash drive can also be connected to the unit and
utilized. The number of instrument setups and data traces able to be stored is dependant on the avaible memory on the flash drive.
1. Ensure the site analyzer is not connected to a PC.
2. Connect the flash drive to one of the type A USB ports.
3. Press the Save/Recall key.
57
Page 74

4. Do one of the following:
To save a trace, see “Saving a Trace” on page 58.
To recall a trace, see “Viewing a Recalled Trace” on page 60.
5. Press the Eject soft key to end USB operation.
6. Remove the USB drive.
Note: the light on the USB drive might still be lit after EJECT and it is
ok to remove it from the SA-XT.
Saving a Trace
Note: This feature is only available if the unit is NOT connected to a
PC. If the unit is connected to a PC, this feature will be disabled.
1. Press the Save/Recall softkey.
2. Press the Save softkey which automatically opens the text label screen.
Note: If the numeric shortcuts are off, press a number key once to
enter a number. If the shortcuts are on, press the key twice. Shortcuts
are turned off by default. Refer to Label Text Shortcuts, page 64 for
more information about numeric shortcuts.
Note: The items on the Save and Recall list are automatically sorted
by the text field using the order blank, numeric, alpha characters.
3. Enter the name of file.
Use the right and left scroll keys to select a character column.
Press the up and down scroll keys to move the text cursor to select a
character in the label text (type over function).
Press the softkey to enter the letter indicated at its right.
Press the Delete key to remove the character immediately at the left of
the text cursor.
4. Press the Enter key to accept the label text.
5. Press the Esc key to exit Save and Recall mode.
Figure 55 Save Trace Screen
58
Page 75

Figure 56 Text Label Screen
Recalling a Saved Trace
The recalled trace is drawn using the same display type (envelope, maximum,
minimum) as the trace currently being measured.
Ensure that the unit is in either Measure Match mode or Fault Location mode to
recall a saved trace.
1. Press the Save/Recall softkey
2. Press the up and down scroll keys to select a saved trace.
3. Press the Recall softkey or the Enter key to recall the selected trace.
4. Press the Save/Recall softkey then press the Esc key to remove a
recalled trace from the display.
Figure 57 Selecting and Recalling a Saved Trace
59
Page 76

Viewing a Recalled Trace
When a saved trace is recalled, it is displayed along with the trace currently being
measured (two traces on the screen). With a current and recalled trace, the display behaves as follows:
The frequency range will change to the settings of the recalled trace.
Recalled traces adopt the display type of the current trace (envelope,
maximum, minimum).
The resolution of the recalled trace does not affect the resolution of
the current trace.
Markers always follow the current trace, not the recalled trace.
When comparing the current trace to a recalled trace, each data point on
the current trace is compared to only the first data point on the recalled
trace (at the frequency of the marker).
The status box at the top of the screen displays the resolution and dis-
play type of the current trace on the top line and the label text of the
recalled trace on the bottom line.
Note: Calibration is automatically turned off if the recalled trace has
a different frequency range from the trace currently being measured.
To remove a recalled trace from the display:
1. Press the Save/Recall softkey.
2. Press the Esc key.
60
Page 77

Figure 58 Comparing Data Points in Dual Mode
61
Page 78

Deleting a Saved Trace
Note: Ensure that the unit is in either Measure Match mode or Fault
Location mode.
1. Press the Save/Recall softkey.
2. Press the up and down scroll keys to select an item to delete.
3. Press the Delete softkey to delete the selected item.
Note: The message “Are You Sure?” appears beside the softkey.
Press the Delete softkey a second time to confirm the delete or press
the Esc key to cancel the delete.
4. Press the Esc key to exit the Save and Recall list.
Figure 59 Selecting and Deleting a Saved Trace
Instrument Setups
Saving a Setup
The current setup parameters can be saved and recalled at a later time. When
recalling a saved setup, the saved values replace the current parameters. Saving
a setup captures the following values:
Scale Min Start Frequency Center Frequency Stop Distance
Scale Max Stop Frequency Span Frequency FM Status
Start Distance Units Calibration Coeff. Limit Line
Saving a setup also includes the internal temperature of the Site Analyzer and
the date and time of the save.
1. Press the Save/Recall softkey.
Note: Each entry on the saved setup list is identified by the frequency range used, a time-date stamp, and the number of data
measurement points.
Note: The items on the Save and Recall list are automatically sorted by the
text field using the order blank, numeric, alpha characters.
2. Press the Setup softkey.
3. Press the Save softkey.
Note: The newly saved setup appears on the list.
4. Press the Esc key to exit the Save and Recall screen.
62
Page 79

Figure 60 Saving a Setup
Recalling a Saved Setup
Ensure that the unit is in either Measure Match mode or Fault Location mode to
recall a setup.
1. Press the Save/Recall softkey
2. Press the Setup softkey.
3. Press the up and down scroll keys to select a setup to recall.
4. Press the Recall softkey.
Note: The selected setup parameters are recalled and replace the
current setup in the unit.
5. Press the Esc key to exit the Save and Recall screen.
Figure 61 Recalling a Saved Setup
63
Page 80

Deleting a Saved Setup
Note: Only in Measure Match mode or Fault Location mode can a
setup be deleted.
1. Press the Save/Recall softkey.
2. Press the Setup softkey.
3. Press the up and down scroll keys to select a setup to delete.
4. Press the Delete softkey.
Note: The message “Are Your Sure?” appears beside the softkey.
Press the Delete softkey a second time to confirm the delete or press
the Esc key to cancel the delete.
5. Press the Esc key to exit the Save and Recall screen.
Figure 62 Deleting a Saved Setup
Label Text
Label Text Shortcuts
Typically when entering or editing label text, use the right and left scroll keys to
select columns of letters. Using shortcuts allows selection of a column of letters
by pressing a number on the key pad. When shortcuts are enabled, each column
is identified by a number at the bottom. Press the number key once to select
the column, and twice to enter a number.
1. Press the Save/Recall softkey.
2. Press the Save softkey.
3. Press Config key to enter text label setup.
4. Press softkey to enable or disable shortcuts.
5. Press the Done softkey or Enter key to exit configure screen.
6. Press the Esc key two times to return to the test mode screen.
64
Page 81

Figure 63 Text Label Configuration
Label Text Help
The Site Analyzer has a built-in help screen that describes how to use the label
text feature. To access the label text help, ensure that the unit is in either Measure Match mode or Fault Location mode.
1. Press the Save/Recall softkey.
2. Press the Save softkey.
3. Press the Config key.
4. Press the Help softkey to open Help screen.
5. Press the Enter key to close Help screen.
6. Press the Esc key two times to exit the configure screen.
Figure 64 Text Label Help
65
Page 82

Editing Label Text
The label text can be changed on a saved item. Ensure that the unit is in either
Measure Match mode or Fault Location mode.
1. Press the Save/Recall softkey to display the list of saved items.
2. Press the up or down scroll key to select an item to edit.
3. Press the Label softkey (Figure 65, item 1) to enter the label text screen.
4. Follow the numbered steps in "Label Text Shortcuts" on page 64 to select,
delete, and enter characters.
5. Press the Enter key to save the changes.
Note: When changes to label text are made, the only typing option is
overstrike. The user can type over any character or space, but cannot
insert characters and have the remaining text move to the right.
Note: The system generated sequential number or the date-time
stamp and the resolution setting cannot be edited.
6. Press the Esc key to exit the Save and Recall screen.
Figure 65 Editing Label Text
66
Page 83

Quicktext for Trace Labels
Commonly used text elements (strings of characters) can be stored in Quicktext.
When entering a label, select pre-stored text elements from the Quicktext area
instead of typing each letter. Ensure that the unit is in either Measure Match mode
or Fault Location mode to use Quicktext.
Adding Quicktext Elements
The Quicktext column in the normal text entry screen displays only 15 characters. To view all characters in each Quicktext element, the View QText option
must be enabled.
1. Press the Save/Recall softkey.
2. Press the Label softkey.
3. Press the right scroll key to select the Quicktext column..
4. Press Enter to add the text in the edit line to the Quicktext list.
5. Select a Quicktext element to enter into the Label.
6. Press the Enter key when finished entering letters.
7. Press the Esc key to exit Quicktext.
Figure 66 Adding the Edit Line Text
67
Page 84

Using Quicktext
Ensure that the unit is in either Measure Match mode or Fault Location mode to
use Quicktext. Quicktext text elements are appended to the text on the edit
line.
1. Press the Save/Recall softkey.
2. Press the Label softkey.
3. Use the Delete softkey to delete unwanted text from the edit line.
4. Use the up or down scroll keys to position the text cursor where a Quicktext
element is to be inserted.
Note: Quicktext elements overwrite existing text from the insert cursor location to the right. Quicktext characters will overwrite only the
number of existing text characters that equals the number of characters in the Quicktext element.
Example - If the existing text on the edit line is “005
ANTENNA SITE THREE” and the user wants to insert the
Quicktext element TOWER starting at the “S” in the word
SITE, the user would position the insert cursor on the “S”
in SITE and then select and add TOWER from the Quicktext list. The resulting text on the edit line would be “005
ANTENNA TOWERTHREE” (five characters were
replaced starting at the cursor position).
5. Press the right scroll key to select the Quicktext column.
6. Press the up or down scroll keys to select a Quicktext text element.
7. Press the Enter key to insert the text element into the text on the edit line.
8. Press the Esc key to exit the label screen.
Figure 67 Inserting Quicktext Elements
68
Page 85

Deleting Quicktext Elements
1. Press the Save/Recall softkey.
2. Press the Label softkey.
3. Press the right scroll key to select the Quicktext column.
4. Press the up or down scroll keys to select a Quicktext text element.
5. Press the Delete softkey to delete the selected text element from the list.
6. Press the Esc key to exit the Quicktext list.
Figure 68 Selecting and Deleting Quicktext Elements
69
Page 86

70
Page 87

Chapter 7 Utilities
Note: The figures in this chapter do not show the entire Site Analyzer. For increased clarity, the figures show only the screen image and
the keys used to accomplish a setup or measurement.
These utilities adjust the Bird Site Analyzer’s date & time and return the unit to
default settings. To exit the Utility mode, press the Esc key or press the Mode key.
Figure 69 Utility Screen
Press the
Mode key
Press from
Select
Mode
71
Page 88

Adjust Date and Time
Figure 70 System Settings Screen
Press to
display the
system
settings
Figure 71 Date Screen
through the
date & time
Change the
date or time
72
Scroll
Page 89

Return to Defaults
All settings will be returned to the factory presets. Saved traces and setups will
not be affected. This function should be used after a unit failure and on the first
power up after a firmware upgrade.
Figure 72 Defaults Option Screen
Press to
return all
settings to
factory
presets
73
Page 90

FM Modulation
The Bird Site Analyzer uses FM modulation to improve its immunity to interfering signals. Under certain circumstances, such as while making cable loss or
other high reflection measurements with long cables, FM modulation may
reduce signal quality. In that case, the modulation should be turned off.
FM modulation is on by default, and will be turned back on whenever
the unit is reset to defaults.
FM modulation is automatically turned off while the unit is in Cable
Loss Mode and returned to its previous state on exiting Cable Loss
Mode.
Saving a setup saves the status of the FM modulation.
Figure 73 FM Modulation Screen
Toggle
between ON
and OFF
74
Page 91

Chapter 8 Computer Software
The Bird Site Analyzer Software is designed to help use the Site Analyzer more
effectively. It allows for use of a PC for archiving and analyzing measurement data.
For complete instructions refer to the help files included with the software.
Features
Multiple Document Interface - allows any number of trace documents
to be open simultaneously.
Intelligent drag-and-drop automatically converts traces to a common
scale for precise and reliable comparisons.
Documents can be viewed in the frequency or distance domains, or as
a Smith chart.
Data values can be read off the status bar as the mouse is moved along
the trace.
Compatible with other cable and antenna testers including the Bird AT
Series.
Automatic cursor calibration maintains accurate readouts of trace data
even if the x-axis changes.
Supports long file names for easy identification.
Computer Requirements
The computer system must meet the following requirements:
Windows XP or later operating system
75
Page 92

76
Page 93

Chapter 9 Maintenance
Cleaning
CAUTION
Harsh or abrasive detergents, and some solvents, can damage the display unit
and labels.
Clean the Bird Site Analyzer only with a soft cloth dampened with mild detergent
and water. Do not use any other type of cleaning solution.
Charging the Battery
The internal battery pack will automatically recharge when the Site Analyzer is
powered from the AC or cigarette lighter adapter. Recharging time, from a full
discharge, is approximately 4 hours.
External Battery Pack (Optional), Long-term Storage Maintenance
When the external battery pack is stored for long periods of time without
proper maintenance, it will lose its charge and also lose its ability to reach full
charge when put into service.
The maintenance procedure is to apply a one-hour “top off” charge at three
month intervals. Follow the battery charge procedures on page 7 for one hour
only. Do not over charge the battery in storage.
Note: If a battery has been stored for an extended period of time
without “top off” charging, perform a full charge followed by a full discharge. Repeat this cycle if necessary up to three times. If the battery
does not remain charged after three charge-discharge cycles, replace
the battery.
77
Page 94

Troubleshooting
Any service procedure not covered in this manual should be referred to an
authorized service facility.
Problem Possible Cause Possible Correction
Unit will not power up. Battery pack drained. Charge the battery pack.
See “Charging the Battery”
on page 77.
Battery pack unable to
keep a charge.
AC adapter is damaged. Replace the AC adapter.
Date and time appear,
hiding the display.
Fault Location trace
appears incorrect.
Erratic antenna test
measurements.
Softkeys beep when
pressed without
performing any function.
Keys do not respond. Unit is “Locked Up” Turn the unit off by holding
Limit line disappears in
Fault Location.
Recalled fault location
trace is invalid.
Unit beeps and turns off. Internal error. Turn the unit on and continue.
Trace drifts outside of
specifications.
Internal error. Press Mode, Utility, and
Scale too large. Press Auto Scale to make
Incorrect cable loss or
velocity of propagation.
Bad calibration combo. Use a different calibration
Context switching
operations taking place.
Limit line not drawing. Turn the limit line off and
No fault location
measurement made since
last full system initialization.
Unit was last shut down
because the battery was
too low to operate the unit.
Calibration lost. Calibrate the unit immediately.
78
Replace the battery pack. See
“External Battery Pack
(Optional), Long-term Storage
Maintenance” on page 77.
then Escape.
the scale smaller.
Check the cable loss and V
settings. See “Cable Loss
Measurement” on page 21.
combo.
Wait for screen changes to
complete before.
down the power button for at
least 5 seconds and then
releasing it. Once the unit
has powered down, turn it
back on.
Do a full system initialization:
a. Disconnect the AC adapter
b. Hold down the Contrast
key while turning the unit off.
c. Turn the unit back on.
then back on.
Change to Measure Match
Mode and then back to Fault
Location Mode.
Operate the unit from the AC
adapter.
See “Calibrating the Site
Analyzer” on page 11.
p
Page 95

Replacing the Battery
1. Lay the Site Analyzer, display side down, on a clean surface.
2. Remove four screws and the battery cover.
Note: Check the direction of the notch in the battery cover. It is
important to replace the cover the same way it was removed.
3. Remove the foam battery pad to access the battery wire.
Figure 74 Replacing the Battery
4. Disconnect and remove the old battery pack from the compartment.
5. Install the new battery.
Note: Ensure the battery connector is firmly connected to the circuit
board connector.
6. Place the battery in the battery compartment.
Note: Ensure the battery is flat in the compartment, and will not
damage any wires when the cover is installed.
7. Replace the battery cover and the screws.
8. Connect the AC adapter to the unit.
9. Apply power to the unit and verify that it operates properly.
10. Charge the battery if required.
.
79
Page 96

Firmware Update
The Site Analyzer uses flash-programmable ROM to store its operating program. To
update the instrument, SA Updater software must be installed on the PC. The SA
Updater software is available on the Bird web site.
Note: The firmware update process will restore default system settings. Setups and traces stored internally on the SA-XT will not be
erased, but as a precaution save your traces and setups to a PC
before updating the SA-XT firmware.
1. Turn the SA-XT off.
2. Attach the AC external power supply.
3. Connect the SA-XT to a PC via type A/B USB cable.
4. Hold down the power button for 6 seconds or more.
Note: The SA-XT will enumerate as a Mass Storage Device. It will
appear as a drive in Windows explorer with a drive label “SA-XT
Update”. The SA-XT LCD display will indicate that it is in firmware
update mode.
5. Go to the PC.
6. Copy the firmware image file to the SA-XT drive.
7. Disconnect the SA-XT from the PC.
Note: The SA-XT will now apply the firmware update.
8. Turn the SA-XT on.
Note: The SA-XT should power off automatically after the update
has been applied. If this does not happen, disconnect the external
power supply.
80
Page 97

Customer Service
Any maintenance or service procedure beyond the scope of those in this chapter should be referred to a qualified service center.
If you need to return the unit for any reason, request an RMA through the Bird
Technologies website (link shown below). All instruments returned must be
shipped prepaid and to the attention of the RMA number.
Bird Service Center
30303 Aurora Road
Cleveland (Solon), Ohio 44139-2794
Fax: (440) 248-5426
E-mail: bsc@bird-technologies.com
For the location of the Sales Office nearest you, visit our website at:
http://www.bird-technologies.com
81
Page 98

Specifications
Antenna Testing
Frequency Range
SA-3600XT
SA-6000XT
Frequency Resolution
25 – 800 MHz
800 – 3600 MHz
3600 – 6000 MHz
Number of Data Points 238 (default), 475, 949
Measurement Range and
Resolution
Return Loss
VSWR
Sweep Speed
238 data points
475 data points
949 data points
Measurement Uncertainty
(after 1 display refresh, 95% c.l.)
Return Loss
VSWR
Test Port
Connectors
Impedance
VSWR, Max
<300 MHz
300 - 6000 MHz
Maximum Input Signal
(Damage Level)
Output Power 0 dBm, nominal
Immunity to Interfering
Signals
*. When using Bird-specified calibration kit.
Measurement Accuracy (after 1 display refresh)
*
25 - 3600 MHz
25 - 6000 MHz
25 kHz
50 kHz
150 kHz
Range Resolution
0.0 to -60.0 dB 0.1 dB
1.00 to 99.99 0.01
2.1 seconds / sweep
3.6 seconds / sweep
6.8 seconds / sweep
Determined graphically from composite of source
VSWR, instrumentation error, & directivity.
Calculated from Return Loss.
Female N normally supplied
50 Ohms
2.10:1
1.35:1
+22 dBm
13 dB interferer at desired measurement
frequency
Return Loss Determined Graphically from composite of:
Connector Frequency Directivity Phase Instrumentation Open/Short
N 25-3600 MHz -42 dB 3 deg -35 dB ≤ 0.09 dB
N 3600 -6000 MHz -38 dB 3 deg
7/16 DIN 25-3600 MHz -40 dB 3 deg
7/16 DIN 3600 -6000 MHz -35 dB 3 deg
82
Page 99

Match Measurement
Frequency Range
SA-3600XT
SA-6000XT
Frequency Resolution
25 – 800 MHz
800 – 3600 MHz
3600 – 6000 MHz
Frequency Accuracy
Number of Data Points 238 (default), 475, 949
Measurement Range and
Resolution
Range
Return Loss
VSWR
Resolution
Return Loss
VSWR
Measurement Uncertainty
(after 1 display refresh)
Return Loss
*
25 – 3600 MHz
25 – 6000 MHz
25 kHz
50 kHz
150 kHz
± 100 kHz (25 MHz to 1 GHz)
± 50 ppm (1 GHz to 6 GHz)
0.0 to –60.0 dB
1.00 to 99.99
0.1 dB
0.01
*
Determined graphically from composite of source
VSWR, instrumentation error, and directivity.
See Figure 75 on page 86.
VSWR
*. Accuracy only guaranteed when using the Bird Calibration Combo
listed in this manual (see Appendix Head, page 91).
Calculated from Return Loss
Distance to Fault (DTF) Measurement
Mode
Resolution [R]
X-Axis
Internal
R 150
V
--------=
F
p
Note: Where R = Resolution (meters)
Vp = Velocity of Propagation
ΔF = Frequency Span (MHz)
Y-Axis
Range
X-Axis
Y-Axis
Accuracy
X-Axis
Y-Axis
Range 0.20 to 1.00, or 1 to 99%
V
p
Max Distance 1000 meters
0.1 dB, 0.01 VSWR
number of data points (238, 475, or 949) x R
0 to –60 dB
± 2% of full-scale range with V
Same as for Return Loss Measurements
p
= 1
83
Page 100

Power Measure Mode
Function
Specifications
Sensor Detection Automatically detect which sensor is connected
Displays readings from Power Sensors
Determined by sensor.
and display the appropriate measurement screen.
General
Model Numbers SA-3600XT (25 to 3600 MHZ)
Data Storage
Internal
64 Mb storage
capable of:
238 point traces
475 point traces
949 point traces
External
Display 5.7” QVGA, Color with backlight, Indoor/Outdoor
General Display
Requirements
IFBW Fixed
Interconnects / Interfaces
Antenna
Sensor
PC
Power Requirements
Internal
External DC
External AC
Housing PC/ABS housing, color is the same as existing SA-
Dimensions, Nominal 10.5” x 8.4” x 3.3”
Weight, Max 5.05 lbs.
Environmental
Specifications
Operating Temp
Storage Temp
Battery Charging Temp
Humidity
Altitude
Drop Test 1 meter drop in most severe position per EN 61010-1
SA-6000XT (25 to 6000 MHZ)
2,500
1,250
650
USB drive
viewable, sunlight readable
Include all functionality of existing SA product
N (F)
USB 2.0 Type A
USB 2.0 Type B
Lithium-ion rechargeable battery
5 hours minimum operating time
9 to 16 VDC, < 3 A
90 to 264 VAC @ 45 to 66 Hz, AC/DC adapter
required
6000EX for both models.
– 10 to +50°C (14 to 122°F)
– 40 to +80°C (– 40 to +176°F)
0° to +35° C (32° to 95° F)
95% maximum (non-condensing)
15,000 feet (4,500 m) max
84
 Loading...