

Page 1

SITE ANALYZER™
CABLE AND ANTENNA TESTER
FOR WIRELESS SYSTEMS
OPERATING INSTRUCTIONS
FOR MODELS
SA-1700EX, SA-1700EXP
SA-2500EX, SA-6000EX
©Copyright 2008 by Bird Electronic Corporation
Instruction Book Part Number 920-7002A600S Rev. J
Site Analyzer is a trademark of Bird Electronic Corporation
Microsoft® and Windows® are registered trademarks
of the Microsoft Corporation
Page 2

.
ii
Page 3
Remove Power
Safety Precautions
Observe general safety precautions. Do
the power on.
Safety Earth Ground
An uninterruptible safety earth ground must be supplied from the
main power source to the instrument.
two conductor power cable is not sufficient protection. Serious injury
or death can occur if this grounding is not properly installed.
Safety Symbols
WARNING
ing notes call attention to a procedure, which if not correctly
Warn
performed, could result in personal injury.
CAUTION
Caution notes call attention to a procedure, which if not correctly
performed, could result in damage to the instrument.
The caution symbol appears on the
there is important information in the instruction manual
regarding that particular area
not open the instrument with
Grounding one conductor of a
equipment indicating
Note: Calls attention to supplemental information.
Warning Statements
The following safety warnings appear in
ger to operating and maintenance personnel, and
for emphasis.
WARNING
The SA-BATPAK is shipped charged. Be careful when removing the
safety cap, 12Vdc @ 2.0 AH/20 hour rate can be present inside the
receptacle. Do not touch the inside of the receptacle.
The possibility of an electric shock exists.
the text where there is dan-
are repeated here
iii
Page 4

Bird Technologies
WARNING
This equipment should not be connected to an antenna or operated
during a storm that has the potential to produce lightning.
The possibility exists for electrical shock.
WARNING
When using the AC adapter, only connect the plug to a properly
grounded receptacle. Serious injury or death can occur if grounding
is not properly installed.
Caution Statements
The following equipment cautions appear in the text and are repeated
here for emphasis.
CAUTION
Harsh or abrasive detergents, and some solvents, can damage the
display unit and information on the labels.
CAUTION
Always turn off the SA before connecting or disconnecting a sensor.
CAUTION
When using a Bird 5011 or 5011-EF, do not exceed 2 W average or
125 W peak power for 5 µs.
Doing so will render the sensor inoperative.
CAUTION
+22 dBm max. input
Do not apply RF power to Antenna Test Port. Exceeding the
maximum input will damage the Site Analyzer.
iv
Page 5

CAUTION
Long-term storage of the external battery pack can affect battery
performance and reduce battery life. Do not store the external
battery pack for long periods of time without proper storage
maintenance (refer to External Battery Pack (Optional), Long-term
Storage Maintenance, page 125). Failure to comply may result in
reduced battery charge and shortened battery life.
v
Page 6
Bird Technologies
Safety Statements
USAGE
ANY USE OF THIS INSTRUMENT IN A MANNER NOT
SPEC
IFIED BY THE MANUFACTURER MAY IMPAIR
THE INSTRUMENT’S SAFETY PROTECTION.
USO
EL USO DE ESTE INSTRUMENTO DE MANERA NO
E
SPECIFICADA POR EL FABRICANTE, PUEDE ANULAR LA
PROTECCIÓN DE SEGURIDAD DEL INSTRUMENTO.
BENUTZUNG
WIRD DAS GERÄT AUF ANDERE WEISE VERWENDET ALS VOM
HERSTEL
LER BESCHRIEBEN, KANN DIE GERÄTESICHERHEIT
BEEINTRÄCHTIGT WERDEN.
UTILISATION
TOUTE UTILISATION DE CET INSTRUMENT QUI N’EST PAS
EXPL
ICITEMENT PRÉVUE PAR LE FABRICANT PEUT
ENDOMMAGER LE DISPOSITIF DE PROTECTION DE
L’INSTRUMENT.
IMPIEGO
QUALORA QUESTO STRUMENTO VENISSE UTILIZZATO IN
MODO DIVERSO DA C
OME SPECIFICATO DAL PRODUTTORE
LA PROZIONE DI SICUREZZA POTREBBE VENIRNE
COMPROMESSA.
SERVICE
SERVICING INSTRUCTIONS ARE FOR USE BY
SERV
ICE - TRAINED PERSONNEL ONLY. TO AVOID
DANGEROUS ELECTRIC SHOCK, DO NOT PERFORM
ANY SERVICING UNLESS QUALIFIED TO DO SO.
SERVICIO
LAS INSTRUCCIONES DE SERVICIO SON PARA USO
EXC
LUSIVO DEL PERSONAL DE SERVICIO CAPACITADO. PARA
EVITAR EL PELIGRO DE DESCARGAS ELÉCTRICAS, NO
REALICE NINGÚN SERVICIO A MENOS QUE ESTÉ
CAPACITADO PARA HACERIO.
WARTUNG
ANWEISUNGEN FÜR DIE WARTUNG DES GERÄTES GELTEN
NUR
FÜR GESCHULTES FACHPERSONAL.
ZUR VERMEIDUNG GEFÄHRLICHE, ELEKTRISCHE SCHOCKS,
SIND
WARTUNGSARBEITEN AUSSCHLIEßLICH VON
QUALIFIZIERTEM SERVICEPERSONAL DURCHZUFÜHREN.
vi
Page 7

ENTRENTIEN
L’EMPLOI DES INSTRUCTIONS D’ENTRETIEN DOIT ÊTRE
RÉSERVÉ AU PERSONNEL FORMÉ AUX OPÉRATIONS
D’ENTRETIEN. POUR PRÉVENIR UN CHOC ÉLECTRIQUE
DANGEREUX, NE PAS EFFECTUER D’ENTRETIEN SI L’ON N’A
PAS ÉTÉ QUALIFIÉ POUR CE FAIRE.
ASSISTENZA TECNICA
LE ISTRUZIONI RELATIVE ALL’ASSISTENZA SONO PREVISTE
ESCLUSIVAMENTE PER IL PERSONALE OPPORTUNAMENTE
ADDESTRATO. PER EVITARE PERICOLOSE SCOSSE
ELETTRICHE NON EFFETTUARRE ALCUNA RIPARAZIONE A
MENO CHE QUALIFICATI A FARLA.
vii
Page 8

Bird Technologies
About This Manual
Changes to This Manual
We have made every effort to ensure this manual is accurate. If you
discover any errors, or if you have suggestions for improving this man
ual, please send your comments to our Solon, Ohio factory. This manual may be periodically updated. When inquiring about updates to
this manual refer to the part number and revision on the title page.
Reference Card
The Reference Card contains minimum operational steps and the
order they should be performed. Use this manual for reference or if
further explanation of any step is required.
Chapter Layout
Introduction — Describes the features of the Bird Site Analyzer and
provides power-up instructions.
Calibration — Lists the steps to calibrate the Site Analyzer, which
must be done before using Measure Match or Fault Location modes.
-
Measure Match Mode — Lists the steps to make match measurements, as well as providing instructions for all functions available in
Measure Match mode.
Fault Location Mode — Lists the steps to make distance to fault measurements, as well as providing instructions for all functions available
in Fault Location mode.
Save and Recall — Describes how to save and recall traces and setups
in Measure Match or Fault Location modes.
Measure Power Mode — Lists the steps to make power measurements, as well as providing instructions for all functions available in
Measure Power mode.
Utilities — Describes utilities to set up the Site Analyzer.
Computer Software — Provides installation instructions and lists the
features of the Bird Site Analyzer PC Software.
viii
Page 9

Maintenance — Lists routine maintenance tasks for the Site Analyzer, as well as troubleshooting for common problems. Specifications
and parts information are also included.
Step By Step Guide — Identifies buttons and connectors on the Site
Analyzer, and explains the display. Also provides step by step instruc
tions for making the most common measurements.
-
ix
Page 10

Bird Technologies
x
Page 11

Table of Contents
Chapter 1 Introduction . . . . . . . . . . . . . . . . . . . . . . . . . . . . . . . . . . . . . 1
Items Supplied . . . . . . . . . . . . . . . . . . . . . . . . . . . . . . . . . . . . . . . . . . 1
Items Not Supplied. . . . . . . . . . . . . . . . . . . . . . . . . . . . . . . . . . . . . . . 2
Site Analyzer Features. . . . . . . . . . . . . . . . . . . . . . . . . . . . . . . . . . . . 2
General . . . . . . . . . . . . . . . . . . . . . . . . . . . . . . . . . . . . . . . . . . . . . 2
Antenna Test . . . . . . . . . . . . . . . . . . . . . . . . . . . . . . . . . . . . . . . . . 3
Measure Match Mode . . . . . . . . . . . . . . . . . . . . . . . . . . . . . . . . . 3
Fault Location Mode . . . . . . . . . . . . . . . . . . . . . . . . . . . . . . . . . . 4
Transmitter Test . . . . . . . . . . . . . . . . . . . . . . . . . . . . . . . . . . . . . . . 4
Measure Power Mode . . . . . . . . . . . . . . . . . . . . . . . . . . . . . . . . . 4
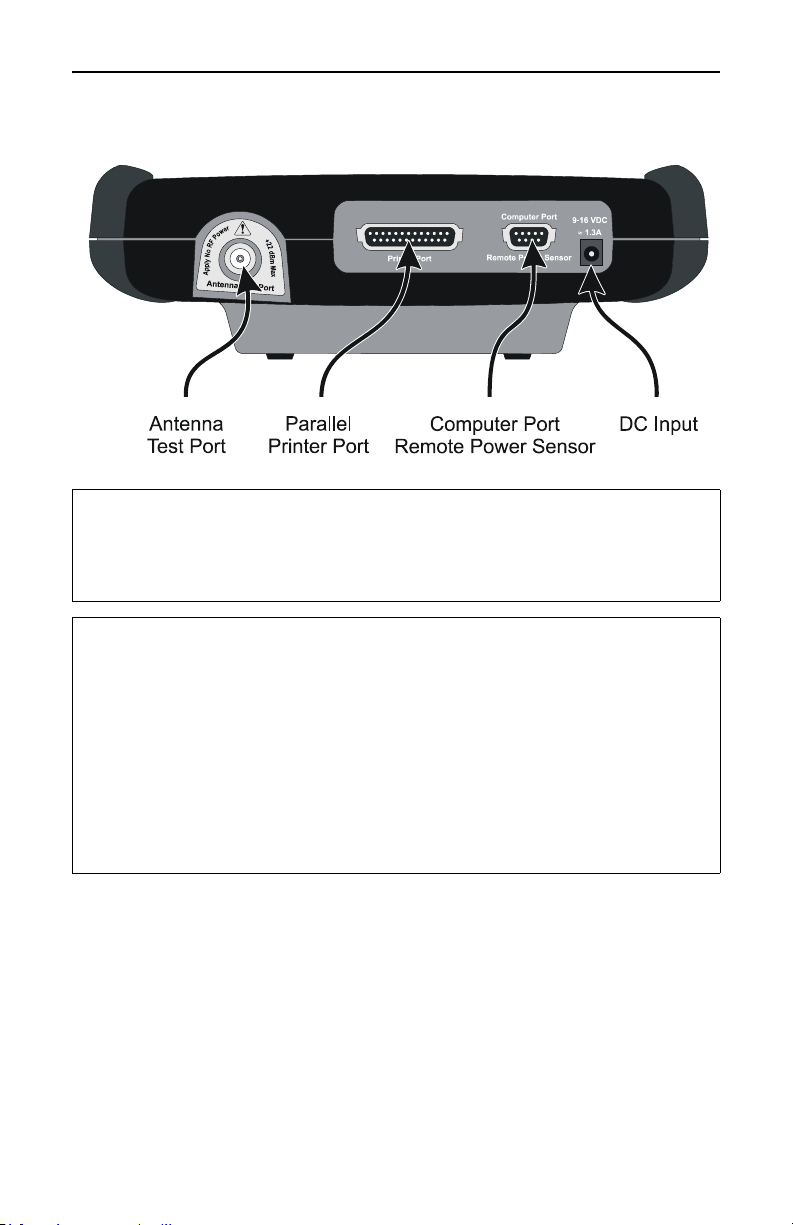
Connectors. . . . . . . . . . . . . . . . . . . . . . . . . . . . . . . . . . . . . . . . . . . . . 6
Power Supply. . . . . . . . . . . . . . . . . . . . . . . . . . . . . . . . . . . . . . . . . . . 6
Internal Battery. . . . . . . . . . . . . . . . . . . . . . . . . . . . . . . . . . . . . . . . 6
Adapters. . . . . . . . . . . . . . . . . . . . . . . . . . . . . . . . . . . . . . . . . . . . . 7
External Battery Pack (Optional) . . . . . . . . . . . . . . . . . . . . . . . . . . 7
To charge the external battery pack: . . . . . . . . . . . . . . . . . . . . . . . 8
To use the external battery pack with a Site Analyzer: . . . . . . . . . 8
Power Up . . . . . . . . . . . . . . . . . . . . . . . . . . . . . . . . . . . . . . . . . . . . . . 9
Self Test . . . . . . . . . . . . . . . . . . . . . . . . . . . . . . . . . . . . . . . . . . . . . 9
System Information . . . . . . . . . . . . . . . . . . . . . . . . . . . . . . . . . . . . 9
Site Analyzer User Keys . . . . . . . . . . . . . . . . . . . . . . . . . . . . . . . . . 10
Site Analyzer Display Screen. . . . . . . . . . . . . . . . . . . . . . . . . . . . . . 13
Display Description . . . . . . . . . . . . . . . . . . . . . . . . . . . . . . . . . . . 13
Chapter 2 Calibration . . . . . . . . . . . . . . . . . . . . . . . . . . . . . . . . . . . . . 15
Calibration Accessories . . . . . . . . . . . . . . . . . . . . . . . . . . . . . . . . . . 15
Calibrating . . . . . . . . . . . . . . . . . . . . . . . . . . . . . . . . . . . . . . . . . . . . 15
Chapter 3 Measure Match Mode . . . . . . . . . . . . . . . . . . . . . . . . . . . . 17
Determine the Power of the Component Being Tested . . . . . . . . . . 17
Select the Measure Match Mode . . . . . . . . . . . . . . . . . . . . . . . . . . . 18
Setting the Measurement Frequency . . . . . . . . . . . . . . . . . . . . . . . . 18
Calibrate the Site Analyzer . . . . . . . . . . . . . . . . . . . . . . . . . . . . . . . 21
Select the Measurement Units . . . . . . . . . . . . . . . . . . . . . . . . . . . . . 21
Set the Measurement Scale Limits . . . . . . . . . . . . . . . . . . . . . . . . . 23
xi
Page 12

Bird Technologies
Set the Measurement Data Points . . . . . . . . . . . . . . . . . . . . . . . . . . 25
Set the Graph Display Type . . . . . . . . . . . . . . . . . . . . . . . . . . . . . . . 27
Set and Activate Acceptance Limits. . . . . . . . . . . . . . . . . . . . . . . . . 29
Measure the Match of the Component. . . . . . . . . . . . . . . . . . . . . . . 31
Interpreting the Measurement . . . . . . . . . . . . . . . . . . . . . . . . . . . . . 32
Measurement Hold. . . . . . . . . . . . . . . . . . . . . . . . . . . . . . . . . . . . . . 33
Markers . . . . . . . . . . . . . . . . . . . . . . . . . . . . . . . . . . . . . . . . . . . . . . 34
Activate Markers and Set Marker Style . . . . . . . . . . . . . . . . . . . . 34
Move Markers . . . . . . . . . . . . . . . . . . . . . . . . . . . . . . . . . . . . . . . 36
Using Delta Markers. . . . . . . . . . . . . . . . . . . . . . . . . . . . . . . . . . . 38
Using Markers with Recalled Traces . . . . . . . . . . . . . . . . . . . . . . 39
Printing. . . . . . . . . . . . . . . . . . . . . . . . . . . . . . . . . . . . . . . . . . . . . . . 42
Cable Loss Measurement . . . . . . . . . . . . . . . . . . . . . . . . . . . . . . . . 43
Interpreting the Cable Loss Measurement. . . . . . . . . . . . . . . . . . . . 45
Chapter 4 Fault Location Mode . . . . . . . . . . . . . . . . . . . . . . . . . . . . . 47
Determine the Power of the Component Being Tested . . . . . . . . . . 47
Select Fault Location Mode . . . . . . . . . . . . . . . . . . . . . . . . . . . . . . . 48
What You Need to Know About
Setting the Frequency Span and Max Distance. . . . . . . . . . . . . . . . 49
Setting the Frequency Span . . . . . . . . . . . . . . . . . . . . . . . . . . . . . . 50
Setting the Maximum Distance . . . . . . . . . . . . . . . . . . . . . . . . . . . . 52
Calibrate the Site Analyzer . . . . . . . . . . . . . . . . . . . . . . . . . . . . . . . 53
Setting the Cable Type . . . . . . . . . . . . . . . . . . . . . . . . . . . . . . . . . . 53
Setting the Distance and Units. . . . . . . . . . . . . . . . . . . . . . . . . . . . . 56
Distance to Display on the Trace (start, stop) . . . . . . . . . . . . . . . 56
Setting the Scale & Unit of Measure . . . . . . . . . . . . . . . . . . . . . . . . 59
Set the Measurement Data Points . . . . . . . . . . . . . . . . . . . . . . . . . . 62
Set the Graph Display Type . . . . . . . . . . . . . . . . . . . . . . . . . . . . . . . 64
Set and Activate Acceptance Limits. . . . . . . . . . . . . . . . . . . . . . . . . 66
Test for Fault Location . . . . . . . . . . . . . . . . . . . . . . . . . . . . . . . . . . . 68
Interpreting the Fault Location Measurement . . . . . . . . . . . . . . . . . 68
Measurement Hold. . . . . . . . . . . . . . . . . . . . . . . . . . . . . . . . . . . . . . 69
Markers . . . . . . . . . . . . . . . . . . . . . . . . . . . . . . . . . . . . . . . . . . . . . . 70
Activate Markers and Set Marker Style . . . . . . . . . . . . . . . . . . . . 70
Move Markers . . . . . . . . . . . . . . . . . . . . . . . . . . . . . . . . . . . . . . . 72
Using Delta Markers. . . . . . . . . . . . . . . . . . . . . . . . . . . . . . . . . . . 74
Using Markers with Recalled Traces . . . . . . . . . . . . . . . . . . . . . . 75
xii
Page 13

Smooth. . . . . . . . . . . . . . . . . . . . . . . . . . . . . . . . . . . . . . . . . . . . . . . 76
Saving The Measurement . . . . . . . . . . . . . . . . . . . . . . . . . . . . . . . . 77
Printing. . . . . . . . . . . . . . . . . . . . . . . . . . . . . . . . . . . . . . . . . . . . . . . 77
Chapter 5 Save and Recall. . . . . . . . . . . . . . . . . . . . . . . . . . . . . . . . . 79
Save Trace. . . . . . . . . . . . . . . . . . . . . . . . . . . . . . . . . . . . . . . . . . . . 80
Label Text Shortcuts . . . . . . . . . . . . . . . . . . . . . . . . . . . . . . . . . . . . 82
Label Text Help . . . . . . . . . . . . . . . . . . . . . . . . . . . . . . . . . . . . . . . . 84
Changing (editing) Label Text . . . . . . . . . . . . . . . . . . . . . . . . . . . . . 85
Quicktext for Trace Labels . . . . . . . . . . . . . . . . . . . . . . . . . . . . . . . . 86
View Quicktext Elements . . . . . . . . . . . . . . . . . . . . . . . . . . . . . . . 86
Create Quicktext . . . . . . . . . . . . . . . . . . . . . . . . . . . . . . . . . . . . . 87
Use Quicktext. . . . . . . . . . . . . . . . . . . . . . . . . . . . . . . . . . . . . . . . 88
Delete Quicktext. . . . . . . . . . . . . . . . . . . . . . . . . . . . . . . . . . . . . . 90
Recall a Saved Trace. . . . . . . . . . . . . . . . . . . . . . . . . . . . . . . . . . . . 91
Delete a Saved Trace . . . . . . . . . . . . . . . . . . . . . . . . . . . . . . . . . . . 93
Save a Setup . . . . . . . . . . . . . . . . . . . . . . . . . . . . . . . . . . . . . . . . . . 94
Recall Setup. . . . . . . . . . . . . . . . . . . . . . . . . . . . . . . . . . . . . . . . . . . 96
Delete Setup . . . . . . . . . . . . . . . . . . . . . . . . . . . . . . . . . . . . . . . . . . 97
Chapter 6 Measure Power Mode . . . . . . . . . . . . . . . . . . . . . . . . . . . . 99
Connecting a Sensor . . . . . . . . . . . . . . . . . . . . . . . . . . . . . . . . . . . 100
Display Description . . . . . . . . . . . . . . . . . . . . . . . . . . . . . . . . . . . . 102
Setting the Full Scale Power . . . . . . . . . . . . . . . . . . . . . . . . . . . . . 103
Zeroing Bird Power Sensors . . . . . . . . . . . . . . . . . . . . . . . . . . . . . 104
Choosing the Displayed Measurement . . . . . . . . . . . . . . . . . . . . . 106
Setting Units. . . . . . . . . . . . . . . . . . . . . . . . . . . . . . . . . . . . . . . . . . 106
Changing the mode for the 5010B . . . . . . . . . . . . . . . . . . . . . . . . . 107
The 43Peak Mode . . . . . . . . . . . . . . . . . . . . . . . . . . . . . . . . . . . 107
Using the 5012 Wideband Power Sensor . . . . . . . . . . . . . . . . . . . 108
Changing the Measurement Type . . . . . . . . . . . . . . . . . . . . . . . 108
Choosing the Displayed Measurement . . . . . . . . . . . . . . . . . . 108
Function Descriptions. . . . . . . . . . . . . . . . . . . . . . . . . . . . . . . . . 109
Average Power . . . . . . . . . . . . . . . . . . . . . . . . . . . . . . . . . . . . 109
VSWR . . . . . . . . . . . . . . . . . . . . . . . . . . . . . . . . . . . . . . . . . . . 109
Video Filter . . . . . . . . . . . . . . . . . . . . . . . . . . . . . . . . . . . . . . . 110
Peak Envelope Power . . . . . . . . . . . . . . . . . . . . . . . . . . . . . . . 111
Burst Average Power. . . . . . . . . . . . . . . . . . . . . . . . . . . . . . . . 111
Crest Factor. . . . . . . . . . . . . . . . . . . . . . . . . . . . . . . . . . . . . . . 112
xiii
Page 14

Bird Technologies
Complementary Cumulative Distribution Function (CCDF) . . . 112
Setting the CCDF Limit . . . . . . . . . . . . . . . . . . . . . . . . . . . . . . 113
Setting the Offset . . . . . . . . . . . . . . . . . . . . . . . . . . . . . . . . . . . . . . 114
5011-EF . . . . . . . . . . . . . . . . . . . . . . . . . . . . . . . . . . . . . . . . . . . 114
Recall Setups. . . . . . . . . . . . . . . . . . . . . . . . . . . . . . . . . . . . . . . . . 116
Chapter 7 Utilities . . . . . . . . . . . . . . . . . . . . . . . . . . . . . . . . . . . . . . . 117
Adjust Date and Time . . . . . . . . . . . . . . . . . . . . . . . . . . . . . . . . . . 118
Return to Defaults . . . . . . . . . . . . . . . . . . . . . . . . . . . . . . . . . . . . . 119
FM Modulation . . . . . . . . . . . . . . . . . . . . . . . . . . . . . . . . . . . . . . . . 120
Printer . . . . . . . . . . . . . . . . . . . . . . . . . . . . . . . . . . . . . . . . . . . . . . 121
Chapter 8 Computer Software. . . . . . . . . . . . . . . . . . . . . . . . . . . . . 123
Features. . . . . . . . . . . . . . . . . . . . . . . . . . . . . . . . . . . . . . . . . . . . . 123
Computer Requirements . . . . . . . . . . . . . . . . . . . . . . . . . . . . . . . . 123
Chapter 9 Maintenance . . . . . . . . . . . . . . . . . . . . . . . . . . . . . . . . . . 125
Cleaning. . . . . . . . . . . . . . . . . . . . . . . . . . . . . . . . . . . . . . . . . . . . . 125
Charging the Battery . . . . . . . . . . . . . . . . . . . . . . . . . . . . . . . . . . . 125
External Battery Pack (Optional),
Long-term Storage Maintenance . . . . . . . . . . . . . . . . . . . . . . . . . . 125
Troubleshooting . . . . . . . . . . . . . . . . . . . . . . . . . . . . . . . . . . . . . . . 126
Battery Replacement . . . . . . . . . . . . . . . . . . . . . . . . . . . . . . . . . . . 128
Firmware Update . . . . . . . . . . . . . . . . . . . . . . . . . . . . . . . . . . . . . . 129
Upgrade to Model SA6000EX . . . . . . . . . . . . . . . . . . . . . . . . . . . . 129
Customer Service . . . . . . . . . . . . . . . . . . . . . . . . . . . . . . . . . . . . . 129
Service Facility . . . . . . . . . . . . . . . . . . . . . . . . . . . . . . . . . . . . . . 129
Sales Facilities . . . . . . . . . . . . . . . . . . . . . . . . . . . . . . . . . . . . . . 129
Specifications. . . . . . . . . . . . . . . . . . . . . . . . . . . . . . . . . . . . . . . . . 130
General . . . . . . . . . . . . . . . . . . . . . . . . . . . . . . . . . . . . . . . . . . . . . 131
Parts List . . . . . . . . . . . . . . . . . . . . . . . . . . . . . . . . . . . . . . . . . . . . 136
For EX Versions . . . . . . . . . . . . . . . . . . . . . . . . . . . . . . . . . . . . . 136
For Non EX Versions . . . . . . . . . . . . . . . . . . . . . . . . . . . . . . . . . 136
Optional Equipment Available . . . . . . . . . . . . . . . . . . . . . . . . . . . . 137
Hard Transit Case . . . . . . . . . . . . . . . . . . . . . . . . . . . . . . . . . . . 138
External Battery Pack. . . . . . . . . . . . . . . . . . . . . . . . . . . . . . . . . 138
Directional Power Sensor. . . . . . . . . . . . . . . . . . . . . . . . . . . . . . 138
Terminating Power Sensor. . . . . . . . . . . . . . . . . . . . . . . . . . . . . 138
Wideband Power Sensor . . . . . . . . . . . . . . . . . . . . . . . . . . . . . . 138
xiv
Page 15

Appendix . . . . . . . . . . . . . . . . . . . . . . . . . . . . . . . . . . . . . . . . . . . . . . . 139
Definitions . . . . . . . . . . . . . . . . . . . . . . . . . . . . . . . . . . . . . . . . . . . 139
Measure Match Mode . . . . . . . . . . . . . . . . . . . . . . . . . . . . . . . . 139
Fault Location Mode. . . . . . . . . . . . . . . . . . . . . . . . . . . . . . . . . . 139
Cable Loss Mode . . . . . . . . . . . . . . . . . . . . . . . . . . . . . . . . . . . . 139
VSWR . . . . . . . . . . . . . . . . . . . . . . . . . . . . . . . . . . . . . . . . . . . . 139
Return Loss . . . . . . . . . . . . . . . . . . . . . . . . . . . . . . . . . . . . . . . . 139
Markers . . . . . . . . . . . . . . . . . . . . . . . . . . . . . . . . . . . . . . . . . . . 140
Run / Hold . . . . . . . . . . . . . . . . . . . . . . . . . . . . . . . . . . . . . . . . . 140
Equations . . . . . . . . . . . . . . . . . . . . . . . . . . . . . . . . . . . . . . . . . . . . 140
Fault Location. . . . . . . . . . . . . . . . . . . . . . . . . . . . . . . . . . . . . . . 140
Resolution . . . . . . . . . . . . . . . . . . . . . . . . . . . . . . . . . . . . . . . . 140
Maximum Distance . . . . . . . . . . . . . . . . . . . . . . . . . . . . . . . . . 140
Fault Location Distance Tables . . . . . . . . . . . . . . . . . . . . . . . . . . . 140
Fault Location Distance - 238 Data Points . . . . . . . . . . . . . . . . . 141
Fault Location Distance - 475 Data Points . . . . . . . . . . . . . . . . . 142
Fault Location Distance - 949 Data Points . . . . . . . . . . . . . . . . . 143
xv
Page 16

Bird Technologies
xvi
Page 17

Chapter 1 Introduction
The Bird Site Analyzer is a multifunction test instrument for use in
installation and maintenance of wireless systems. Utilizing a univer
sal hardware and firmware concept, the same unit can be configured
into five model types that include both existing and new Bird Technol
ogy site analyzer models. The current product designation adds the
letters EX after the model number.
-
• SA-1700EX (25 MHz – 1700 MHz, no power measurement
capability)
• SA-1700EXP (25 MHz – 1700 MHz, with power measurement
capability)
• SA-2500EX (780 MHz – 2500 MHz, with power measurement
capability)
• SA-6000EX (25 MHz – 6000 MHz, with power measurement
capability)
Antenna systems are tested by using a Site Analyzer to measure
match conditions. Data points measured across a user-specified fre
quency band or distance range are graphed on a 238 pixel display
area. Transmitter systems are tested by using a Site Analyzer and a
Bird power sensor to measure RF power. Data is displayed as power or
match efficiency, depending upon the sensor.
-
-
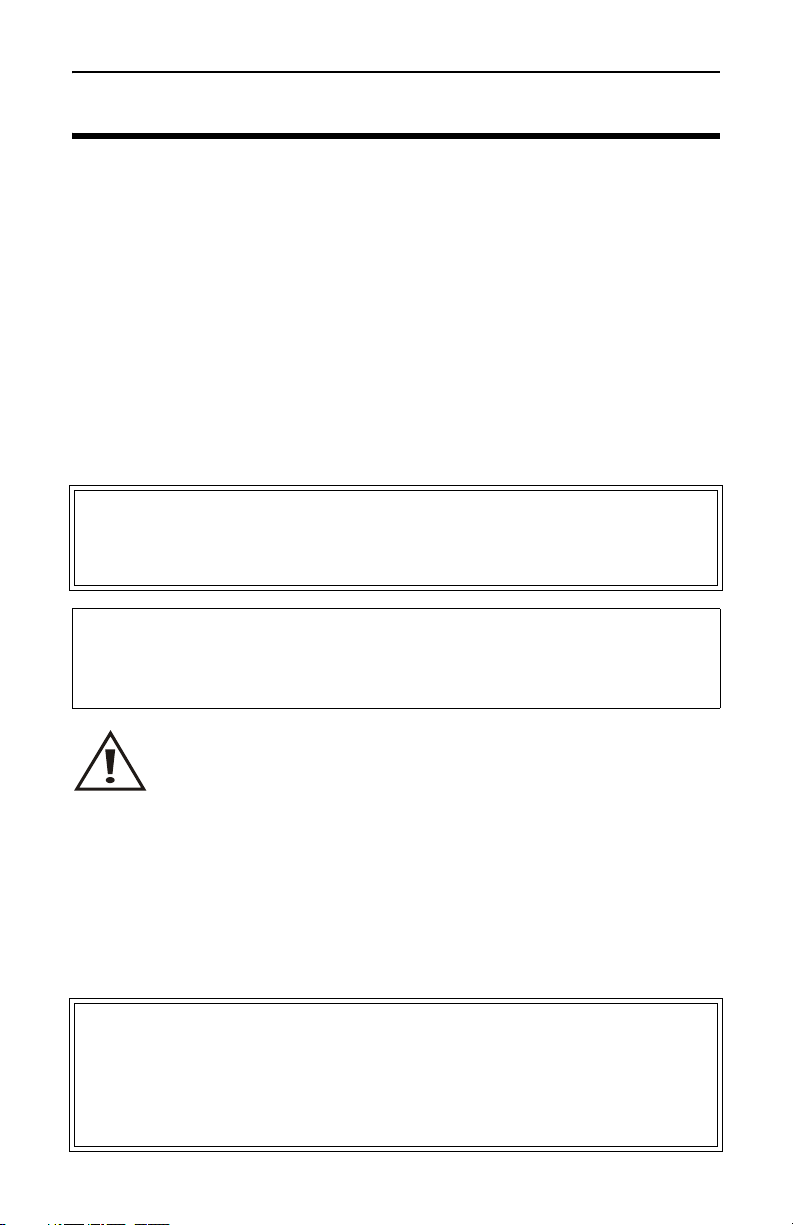
Items Supplied
1. Site Analyzer (configured as one of the models described earlier)
2. Soft-Sided Carrying Case
3. PCTool Software
4. AC Power Adapter
5. Automobile Cigarette Lighter Adapter
6. 9-Pin Serial Communications Cable
7. Instruction Manual (Not Shown)
8. Reference Card (Not Shown)
1
Page 18
Bird Technologies
Items Not Supplied
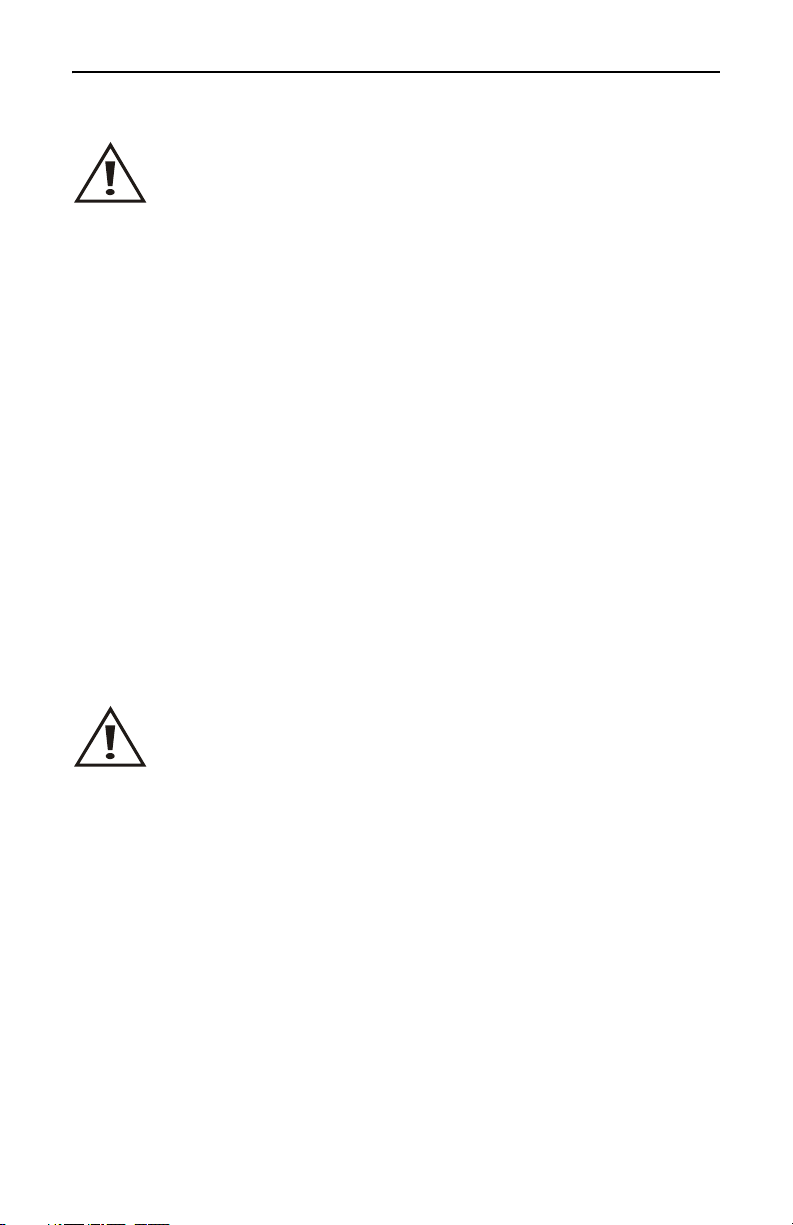
• Calibration Combination (Cal Combo)
Site Analyzer Features
General
• Easy to operate and field ready for first-time, occasional, and
experienced users.
• Step by step guide shows how to make some of the most com-
mon immurements.
• High-resolution color display.
• Field replaceable Li-ion battery.
• Automatic power down conserves battery life.
• Operates in temperatures as low as 14°F (–10°C).
2
Page 19

Introduction
Antenna Test
• Rejects on-channel interfering signals to +13 dBm.
• Three user-selectable trace capture options: 238 data points
per sweep, 475 data points per sweep, 949 data points per
sweep.
• Three graphic display formats: envelope, maximum, mini-
mum.
• Sweep measurement progress bar: indicates status of mea-
surement being taken.
• Stores up to 15 setups.
• Adjustable pass/fail limit with visual indicator.
• Stores up to 500 sets of measurement data (traces) at the
default setting of 238 data points to facilitate conversion
between Measure Match (Sweep) and Fault Location (DTF).
• Measurement data can be transferred to the Anritsu Site Mas-
ter Software Tools.
• On-screen comparison between current measurement trace
and stored data traces – no PC required.
• Pop-up menus contain over 70 cable types and up to 80 fre-
quency band presets depending upon the instrument model
number.
• X and Y scales and units are user adjustable.
• Six markers for either direct or difference measurements. Can
also measure relative to limit line or recalled trace.
• Measurement hold to temporarily store a trace.
• Printing capability. The Site Analyzer is compatible with all
printers that use HP PCL Level 3, including most HP printers.
Measure Match Mode
• Fast swept measurement.
• Frequency can be set using either Start/Stop or Center/Span
frequencies.
• Measurement units can be Return Loss [dB], Cable Loss [dB],
or VSWR [ratio].
3
Page 20
Bird Technologies
Fault Location Mode
• Transform Algorithm - Fast Fourier Transform (FFT) with
three levels of smoothing.
• Distance units can be either feet or meters.
• Measurement units can be Return Loss [dB] or VSWR [ratio].
Transmitter Test
Measure Power Mode
• Numerical readout and analog dial.
• Can display either forward power, reflected power, or match
efficiency depending upon the sensor.
• Power measurement units can be either Watts or dBm. Match
units can be VSWR, return loss, or % match efficiency.
• Compatible with Bird Directional Power Sensors, Terminating
Power Sensors, VSWR Alarms, and Broadcast Power Monitors.
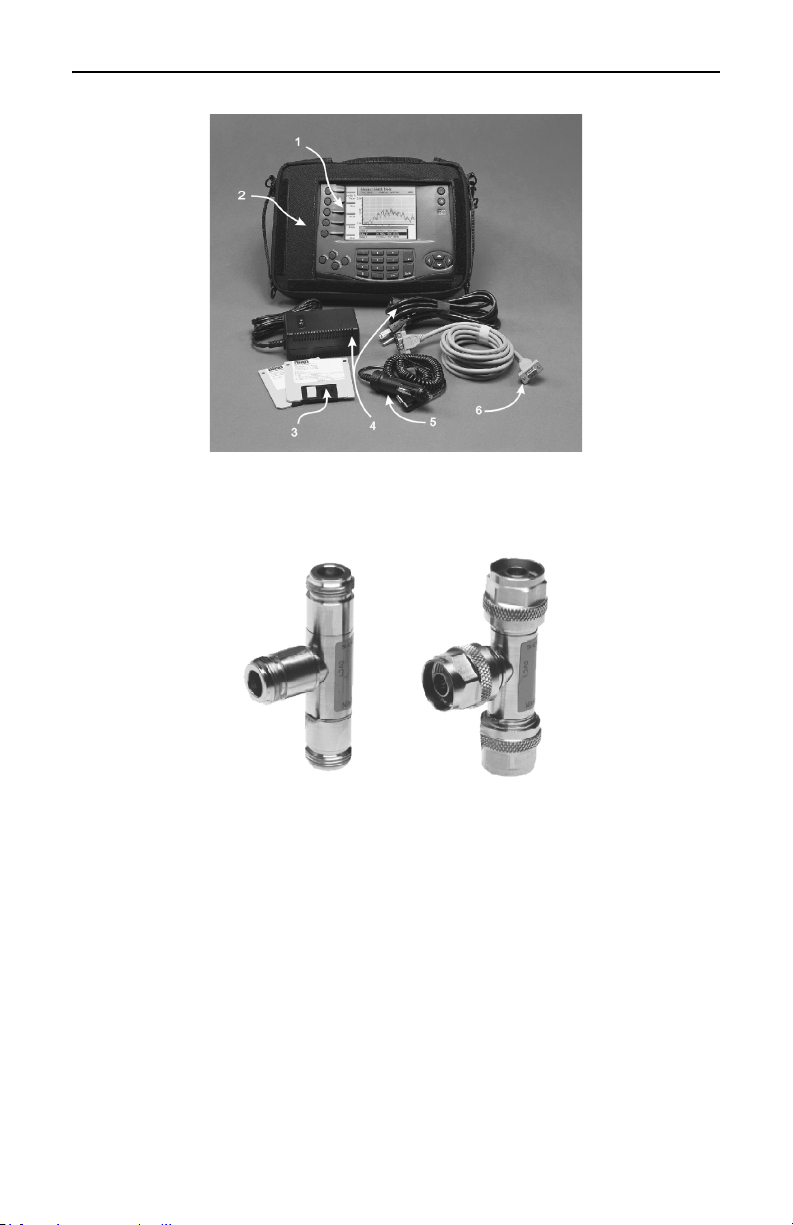
Bird 5010B
Directional
Power
Sensor
Bird 5011 or
5011-EF
Terminating
Power
Sensor
4
Page 21

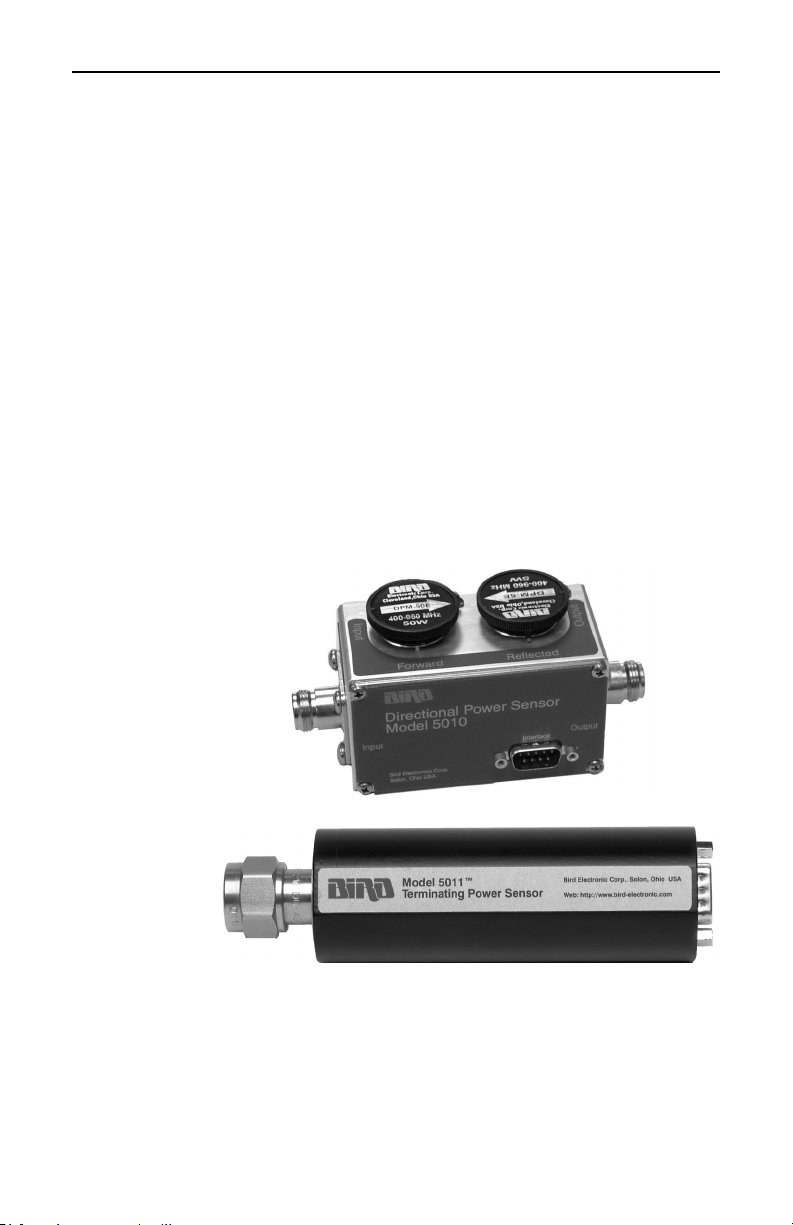
Bird 5012
Wideband
Power
Sensor
Introduction
5
Page 22
Bird Technologies
Connectors
CAUTION
+22 dBm max. input
Do not apply RF power to Antenna Test Port. Exceeding the
maximum input will damage the Site Analyzer.
Antenna Test Port Female N connector for connecting to the antenna.
Use a phase-stable cable for best results.
Parallel Printer Port 25-pin (DB25) parallel connector for connecting to
HP-type inkjet printers. Pinter cable not included.
Computer/Power
Sensor Port
9-pin RS-232 (DB9) serial connector for connecting
to a PC or to Bird power sensors.
DC Input Input for external power supplies. Plug either the
ac power supply or the cigarette lighter adapter
into the dc input. The external supplies operate the
unit and charge the internal battery.
Power Supply
Internal Battery
The Bird Site Analyzer has an internal, rechargeable, lithium-ion battery pack. This will operate the unit for a minimum of 3 hours of continuous usage. Recharging time, from a full discharge, is
approximately 4 hours.
Note: When the unit is received the battery may not be
fully charged. An ac adapter should be used when operating
the unit for the first time.
6
Page 23

Introduction
The battery symbol gauge indicates the approximate battery life remaining. At ¼ charge the gauge also displays “LO”. When using an external
power source, a power cord symbol replaces the battery symbol gauge.
Adapters
WARNING
When using the AC adapter, connect the AC plug
only to a properly grounded receptacle. Serious
injury or death can occur if not properly grounded.
The Bird Site Analyzer can be operated using an ac adapter or a 12V
automobile cigarette lighter adapter. Using these adapters will also
charge the internal battery.
External Battery Pack (Optional)
WARNING
The SA-BATPAK is shipped charged. Be careful
when removing the safety cap, 12VDC @ 2.0 AH/20
hour rate can be present inside the receptacle. Do
not touch the inside of the receptacle. The possibility
of an electric shock exists.
CAUTION
Long-term storage of the external battery pack can
affect battery performance and reduce battery life.
Do not store the external battery pack for long
periods of time without proper storage maintenance
(refer to External Battery Pack (Optional), Longterm Storage Maintenance, page 125). Failure to
comply may result in reduced battery charge and
shortened battery life.
The SA-BATPAK is an optional external battery pack. This will operate the unit for approximately 1 to 2 hours. The liquid acid gel battery
will fully charge, from a full discharge, in about 6-8 hours.
7
Page 24
Bird Technologies
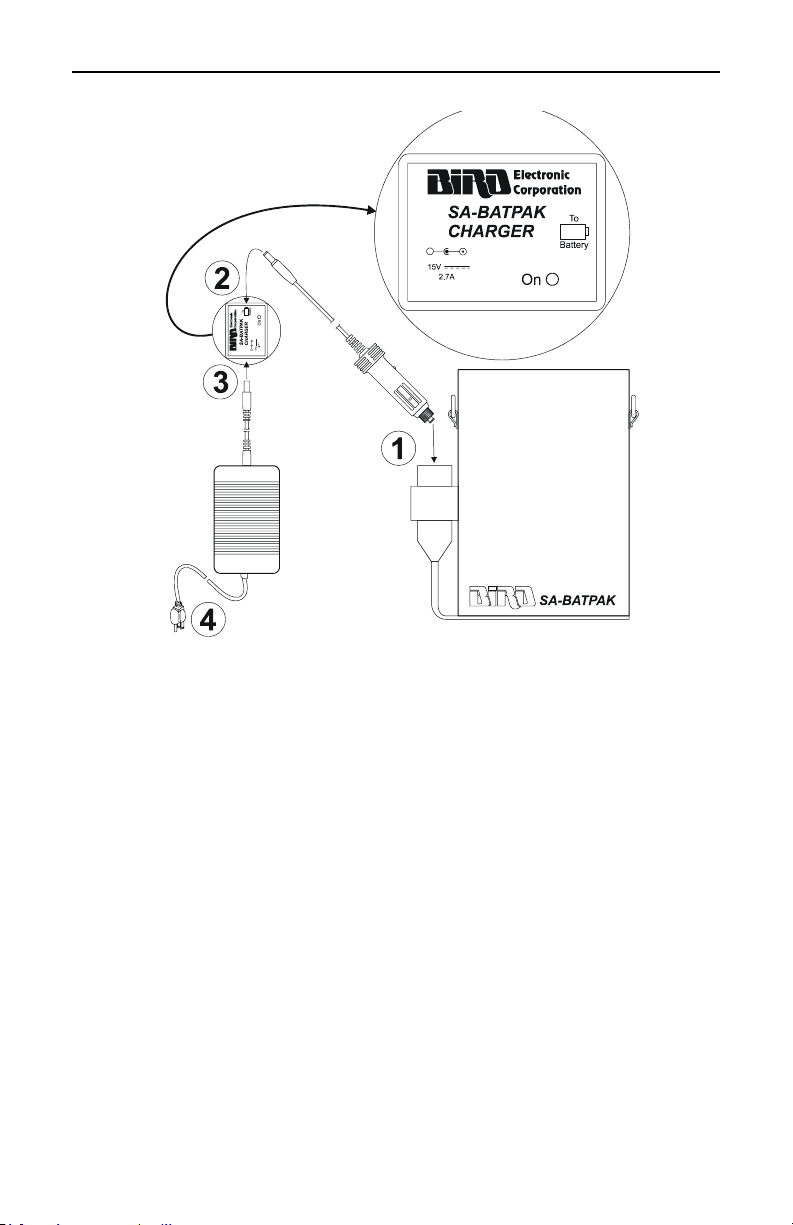
To charge the external battery pack:
1. Plug the automobile cigarette lighter adapter into the external
battery pack on the side that says “To Battery”. Refer to the figure
above.
2. Plug the other end of the cigarette lighter adapter into the charger
adapter.
3. Plug the ac adapter into the charger adapter.
4. Plug the ac adapter into a properly grounded outlet. The charger’s
“On” LED comes on and stays on until the charger is disconnected.
To use the external battery pack with a Site Analyzer:
1. Plug the automobile cigarette lighter adapter into the charged
external battery pack.
2. Plug the other end of the cigarette lighter adapter into the dc
input of the Site Analyzer.
8
Page 25

Introduction
n
Power Up
For the first power-up and after a failure, reset the unit (refer to
Return to Defaults, page 119).
Self Test
The unit performs an automatic self test at power up. If the self test
fails, refer to
tive action. If the problem persists, return the unit for service.
The self test screen also displays the software revision information as
shown below.
Troubleshooting, page 126 for possible causes and correc-
Model SA-6000EX, 25 - 6000 MHz
SN: 00000000
Feb 2005
22
Copyright © 1998 - 2005 by Bird Electronic Corporatio
System Information
Before you use the Site Analyzer, record the following system information:
• Frequency Span — ex: 824-894 MHz (cellular band)
• Cable Type — ex: LDF 7 - 50A
• Approximate Cable Length — ex: 300 feet
• Transmitter Power — ex: 50 W
WARNING
This equipment should not be connected to an
antenna or operated during a storm that has the
potential to produce lightning.
The possibility exists for electrical shock.
9
Page 26
Bird Technologies
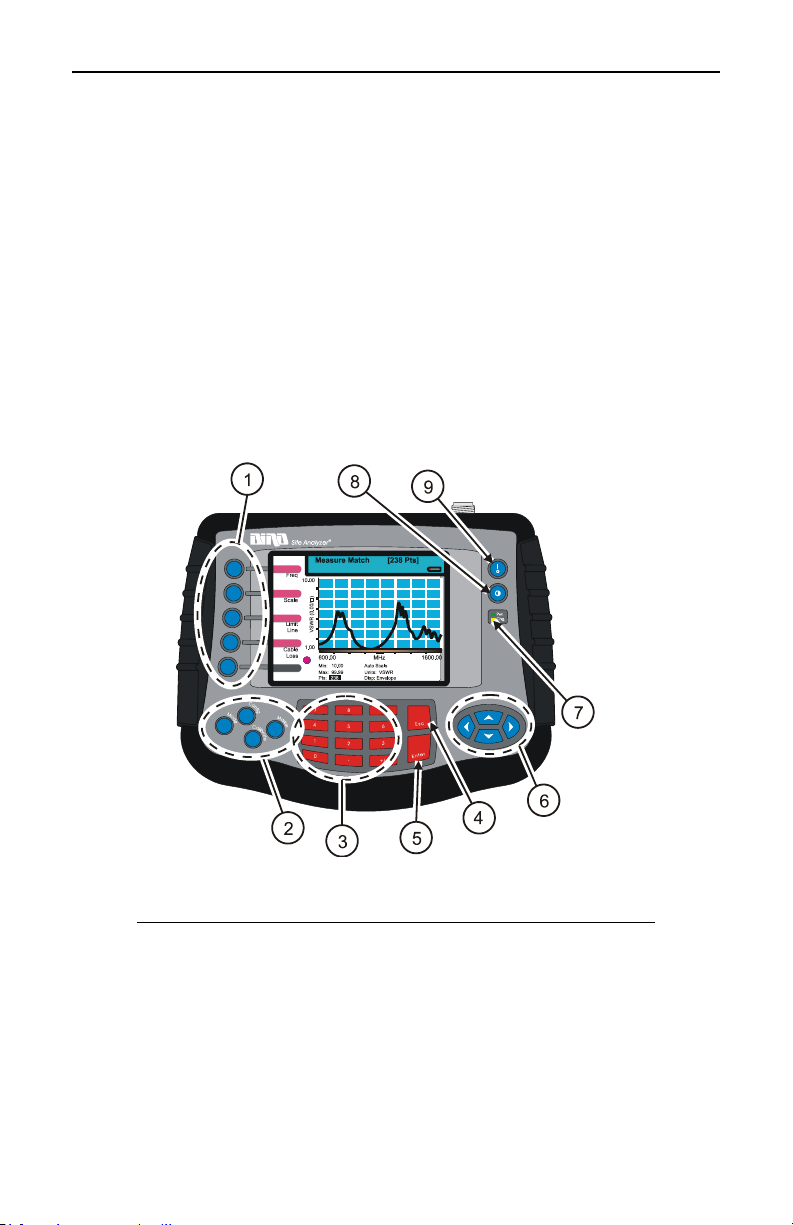
Site Analyzer User Keys
There are two types of keys on the Site Analyzer. The first type,
referred to as a hard key, always has a particular function. The func
tion of the key does not change and is printed on the unit surface or on
the key itself.
The second type is referred to as a softkey. The five keys at the left of
the display are softkeys. Each softkey has a function which can vary
depending upon the operational mode. The function of the key will be
identified at the left of the display, next to the key.
See Figure 1 and its accompanying table for a description of user keys.
Figure 1 User Key Identification
-
10
1. Softkeys Activates the function described
directly to the right of the key.
2. Hard Keys
Mode Activates the mode menu. Use this
to select Measure Match, Fault
Location, Measure Power, or
Utilities mode.
Config Activates the configuration menu for
the current mode. Use this to set
variable parameters (e.g. frequency
band, distance, and units).
Page 27

Introduction
Calibrate Activates the calibration menu.
Marker Activates the marker menu. Use this
to turn markers on or off and to
move the active marker.
3. Numeric Keys Enters numeric data into the
selected item, or as defined by the
function description.
4. Escape Key
During:
Menu Use Backs up one menu level.
Data Entry Exits data entry without changing
the value.
5. Enter Key
During
List Selection Selects the highlighted item in the
list.
Data Entry Exits data entry, changing the
value.
6. Cursor Keys
Left Arrow
During:
Data Entry Deletes previously entered data one
character at a time.
Marker Use Moves active marker left one point
at a time.
All other times As defined by the function
description.
Right Arrow
During:
Marker Use Moves active marker right one point
at a time.
All other times As defined by the function
description.
Up Arrow
During:
Data Entry Increases the numeric value.
Marker Use Moves the marker to the maximum
trace value.
11
Page 28

Bird Technologies
While pressing
Increases the display contrast.
the Contrast
key
All other times As defined by the function
description.
Down Arrow
During:
Data Entry Decreases the numeric value.
Marker Use Moves the marker to the minimum
trace value.
While pressing
Decreases the display contrast.
the Contrast
key
All other times As defined by the function
description.
7. Battery LED The yellow LED lights when the unit
is powered from an external dc
power source. It blinks while
charging the internal battery. Once
the battery is fully charged the
yellow LED stops blinking.
The green LED lights whenever the
unit is on.
8. Contrast Key Hold while pressing the up/down
arrow keys to adjust the contrast of
the display.
12
9. l/0 (On/Off) Turns the instrument on and off.
The key must be pressed for at least
one-half (½) second.
Page 29
Introduction
Site Analyzer Display Screen
See the following two figures and the accompanying table for a
description of the display screen components for Measure Match mode
and for Fault Location mode.
Display Description
Measure Match Sample Display
1. Trace Graphic display of the measurement.
2. Marker Value Indicates the position and value of a trace
3. Marker Cursor Identifies the trace point displayed in the
4. Calibration Indicator Indicates the calibration status.
5. Battery Gauge Indicates whether the Site Analyzer is
6. Recalled Trace Name Indicates the name of a recalled trace.
Fault Location Sample Display
point.
marker value.
using the internal battery or an external
power supply, and indicates the amount
of battery life remaining.
7. Mode Indicator Name of the current mode.
8. Measurement Data Points Indicates the number of datapoints
collected for each trace. 238 = standard, 475
= twice as many data points as 238, 949 =
four times as many data points as 238.
9. Progress Bar Indicates data collection progress
10. Softkey Description Describes the function of the softkey to
the left of the description.
13
Page 30

Bird Technologies
11. Indicator Ball Indicates if the trace is sweeping.
12. Limit Line Value Indicates the limit value.
13. Limit Test Indicator Displays FAIL if any part of the trace
exceeds the limit value.
14. Limit Line A horizontal line that graphically
displays the limit value.
15. Scale Indicates the minimum and maximum
values displayed on that axis.
16. Units Indicates the measurement units for that
axis.
14
Page 31

Chapter 2 Calibration
Calibration Accessories
• Calibration Combination (Cal Combo) which contains:
One 50 ohm load
One Open standard
One Short standard
• Test Cable (optional) – A phase-stable cable will provide con-
sistent, reliable results.
Note: When using a test cable connected to the Site Ana-
lyzer, attach the Cal Combo to the end of the cable during calibration.
Calibrating
For best results, set the frequency and calibrate the Bird Site Analyzer immediately before taking measurements.
Follow the numbered steps in Figure 2, page 16 to calibrate the Site
Analyzer.
Note: When calibrated, the Site Analyzer’s main screen
will display “Calibration: FULL”. When uncalibrated, the Site
Analyzer’s main screen will display “Calibration: OFF”.
Note: Calibration is performed at the highest number of
data points (949 points) and the calibration graphs are displayed using the currently selected display method (envelope,
maximum, or minimum).
15
Page 32

Bird Technologies
Figure 2 Calibrating the Site Analyzer
Step Action
16
1 Press the Calibrate key
2 Connect the Cal Combo “Open” connector to
the unit antenna port
3 Press the Open softkey then wait for the
unit to beep and display Done
4 Connect the Cal Combo “Short” connector to
the unit antenna port
5 Press the Short softkey then wait for the
unit to beep and display Done
6 Connect the Cal Combo “Load” connector to
the unit antenna port
7 Press the Load softkey then wait for the
unit to beep and display Done
8 Remove the Cal Combo from the unit
Page 33

Chapter 3 Measure Match Mode
Match measurement verifies and monitors the match conditions in the
antenna system at various frequencies. The results are shown on an xy graph. Frequency is shown on the x-axis and return loss, cable loss,
or VSWR is shown on the y-axis.
Before you make a match measurement, be sure that you have a Bird
Calibration Combination (Cal Combo) and all necessary cables and
adapters of the correct size and connector type.
This chapter describes how to make a match measurement and provides step by step instructions. In addition, this chapter describes how
to set and move markers. For information and instructions to save and
recall traces, refer to
To make a match measurement, follow the procedures in this chapter
in the order they are presented.
Determine the Power of the Component Being Tested
Use a service monitor, power meter, or spectrum analyzer to check that
the component being tested does not have power greater than +22 dBm.
Save and Recall, page 79.
CAUTION
+22 dBm max. input
Do not apply RF power to Antenna Test Port.
Exceeding the maximum input will damage the
Site Analyzer.
17
Page 34

Bird Technologies
Select the Measure Match Mode
Follow the numbered steps in Figure 3 to turn ON the Site Analyzer
and select the Measure Match mode.
Figure 3 Selecting the Measure Match Mode
Step Action
1 Turn On the Site Analyzer. Press ON/
OFF key for ½ second.
2 Press the MODE key
3 Press the Measure Match key
Setting the Measurement Frequency
You must be in the Measure Match mode to set a frequency.
Frequencies can be set manually or chosen from a list of presets (band
list). If the start, stop, center, or span frequency is manually set, the
band list will indicate “Custom”. Be sure to set the frequency to a
value that is well beyond the normal range of the antenna. For exam
ple, for a 450 MHz antenna, set the start frequency at 400 and the
stop frequency at 500 MHz, for an 800 MHz antenna, set the start fre
quency at 700 and the stop frequency at 1,100 MHz.
Note: Changing the frequency settings will automatically
turn calibration off. Always set the frequency before calibrating
the unit.
18
-
-
Page 35

Measure Match Mode
Note: If you enter a frequency that is outside of the range
of the Site Analyzer, the Site Analyzer will override your entry
and set the minimum or maximum frequency of the model.
1. Make sure that the unit is turned on and in the Measure Match
mode (refer to
2. Follow the numbered steps in Figure 4 on page 19 to set a custom
frequency or follow the steps in Figure 5 on page 20 to select from
a preset band list.
Figure 4 Setting a Custom Sweep Frequency
Select the Measure Match Mode, page 18).
Step Action
1Press the Config key
2Press the Freq softkey
3 Use the left or right scroll keys to select
Start, Stop, Center, or Span
4 Use the keypad keys to enter a value
and press Enter when finished.
5Press the Esc key to exit the configura-
tion screen
19
Page 36

Bird Technologies
Figure 5 Selecting a Sweep Frequency from a Band List
Step Action
1 Press the Config key
2 Press the Freq softkey
20
3 Use the left or right scroll keys to select
Start, Stop, Center, or Span
4 Use the up or down scroll keys to open the
band list menu
5 Use the up or down scroll keys to select the
desired band
6 Press the Enter key to accept the selection
7 Press the Esc key to exit the configure
screen
Page 37

Measure Match Mode
Calibrate the Site Analyzer
If you need to use an extension cable to connect the Site Analyzer to
the system, connect the extension cable to the antenna test port on the
Site Analyzer and then connect the Bird Cal Combo to the end of the
extension cable. Follow the calibration procedure in
Chapter 2, Calibration, page 15.
Note: When using an extension cable, you should use a
phase stable cable to ensure performance and accuracy. Bird
offers optional phase stable cables that will not degrade the performance of your Site Analyzer. Using a non-Bird phase stable
cable may decrease and degrade the accuracy of the system.
Select the Measurement Units
You can select units before or after making a measurement. When
making a match measurement, you can select one of three units for
the Y (vertical) scale,
• VSWR (ratio)
• Rtn Loss (dB)
• Cbl Loss (dB)
1. Make sure that the instrument is turned on and in the Measure
Match mode (refer to
2. Select Frequency (refer to Setting the Measurement Frequency,
page 18)
3. Make sure that the instrument is calibrated (refer to Calibration,
page 15).
4. Follow the numbered steps in Figure 6, page 22 to set
measurement units.
Select the Measure Match Mode, page 18)
21
Page 38

Bird Technologies
Figure 6 Setting Match Mode Measurement Units
Step Action
1 Press the Config key
2 Press the Scale softkey
3 Press the left or right scroll keys to select
Units
22
4 Press the up or down scroll keys to open the
units list menu
5 Press the up or down scroll keys to select
the desired units
6 Press the Enter key to accept the selection.
7 Press the Esc key to exit the configure
screen
Page 39

Measure Match Mode
Set the Measurement Scale Limits
You can manually set the minimum and maximum values on the Y
(vertical) scale or you can choose Auto Scale and let the instrument
select values that will display the entire trace. You cannot enter val
ues that are outside of the limits of the instrument (-60 and 0). If you
are unsure of the expected results, set the minimum to –60 dB and
maximum to 0 dB or choose Auto Scale. Auto Scale is available on the
main screen as well as on the mode configure screens. The table below
lists typical worst case values for selected measurements.
Component Return Loss Limits
Antenna at Resonance –14 dB
Connector –25 dB
Jumper –35 dB
Lightning Protector –25 dB
Transmission Line –30 dB
1. Turn on the instrument and enter the Measure Match mode (refer
to
Select the Measure Match Mode, page 18).
2. Select Frequency (Setting the Measurement Frequency, page 18)
3. Make sure that the instrument is calibrated (refer to Calibration,
page 15).
4. Follow the numbered steps in Fig. 7 to set the scale limits.
-
23
Page 40

Bird Technologies
Figure 7 Setting Match Mode Scale Limits
Step Action
1 Press the Config key
2 Press the Scale softkey
3 To enter a manual value, skip this step.
Use the left or right scroll keys to select
Auto Scale then press Enter
24
4 If you selected Auto Scale, skip this step.
Use the left or right scroll keys to select
Min then enter your value or enter –60 and
press Enter
5 If you selected Auto Scale, skip this step.
Use the left or right scroll keys to select
Max then enter your value or enter 0 and
press Enter
6 Press the Esc key to exit the configure
screen.
Page 41

Measure Match Mode
Set the Measurement Data Points
You can select the number of data points to take during a measurement. There are three data point options, 238 points, 475 points, and
949 points. Increasing the number of data points increases the mea
surable distance in distance-to-fault measurements and increases the
detail in Measure Match mode measurements. When you save a trace,
the number of data points collected (238, 475, or 949) are saved.
The default number of data points is 238. Selecting 475 data points
provides twice as many measurement points as 238, but it takes
approximately twice as long for the trace to sweep and display. Select
ing 949 data points provides four times as many measurement points
as 238, but it takes approximately four times as long for the trace to
sweep and display.
A progress bar, just below the x-axis, moves from left to right indicating the progress of the sweep. When the progress bar reaches the right
side of the screen, the sweep is finished.
When you change the number of measurement data points, the current trace is erased and the Save softkey is disabled until the sweep
finishes and the screen displays the first new trace. If you press the
Save softkey before the first sweep has completed, the Save softkey
icon (the red bar) will blink until the sweep finishes and then the dis
play will change to the Save and Recall screen (in response to you
pressing the Save softkey).
1. Turn on the instrument and enter the Measure Match mode (refer
to
Select the Measure Match Mode, page 18).
2. Select Frequency (refer to Setting the Measurement Frequency,
page 18)
3. Make sure that the instrument is calibrated (refer to Calibration,
page 15).
4. Follow the numbered steps in Figure 8, page 26 to set the number
of measurement data points.
-
-
-
25
Page 42

Bird Technologies
Figure 8 Setting the Number of Measurement Data Points
Step Action
1 Press the Config key
2 Press the Scale softkey
3 Press the left or right scroll key to select
Pts
26
4 Press the up scroll key to open the selec-
tion list
5 Press the up or down scroll key to select a
data point option (238, 475, 949)
6 Press the Enter key to accept the selection
and return to the configuration screen
Page 43

Measure Match Mode
Set the Graph Display Type
When the Site Analyzer collects data during a sweep, you can specify
that it measure 238 data points, 475 data points, or 949 data points.
Selecting 475 data points takes twice as much time to sweep as 238
points, and 949 points takes four times as much time to sweep as 238
points.
The Site Analyzer display screen graph area can display only 238
points because of its physical pixel limitations. However, if the trace
contains 475 points or 949 points, all points are represented on the
display. There are three modes available to display the data points for
the trace: envelope, maximum, and minimum. For 238 data points,
there is no difference in the display for each of the three modes
because each data point occupies a separate pixel. For 475 data points
and 949 data points, the envelope mode displays all data points, the
maximum mode displays only the highest (peak) magnitude data
point for each pixel, and the minimum mode displays only the lowest
(minimum) magnitude data point for each pixel.
Note: When you save (or download) a trace, all measured
data points (238, 475, 949) are saved (or downloaded). The display modes (envelope, maximum, minimum) are for the Site
Analyzer display only and are not saved (or downloaded) with
your trace.
1. Turn on the instrument and enter the Measure Match mode (refer
to
Select the Measure Match Mode, page 18).
2. Select Frequency (refer to Setting the Measurement Frequency,
page 18)
3. Calibrate the instrument (refer to Calibration, page 15).
4. Follow the numbered steps in Figure 9, page 28 to set the graph
display.
27
Page 44

Bird Technologies
Figure 9 Setting the Graph Display
Step Action
1 Press the Config key
28
2 Press the Scale softkey
3 Press the left or right scroll key to select
Disp
4 Press the up scroll key to open the selec-
tion list
5 Press the up or down scroll key to select a
display type (envelope, maximum, minimum)
6 Press the Enter key to accept the selection
and return to the configuration screen
Page 45

Measure Match Mode
Set and Activate Acceptance Limits
The limit line helps you see failures. It appears as a horizontal line at
the value you select.
You can set an acceptance limit line to help visualize what part of the
measurement trace is not acceptable. The part of the trace that is not
acceptable will display in red. To view the limit line, you must have
the limit test ON. This feature is available only in the Measure Match
mode and the Fault Location mode.
1. Turn on the instrument and enter the Measure Match mode (refer
to
Select the Measure Match Mode, page 18).
2. Select the frequency (refer to Setting the Measurement
Frequency, page 18).
3. Calibrate the unit (refer to Calibrate the Site Analyzer, page 21).
4. Follow the numbered steps in Figure 10, page 30 to turn ON the
limit test and set the limit line value.
Note: You can set a limit line value with the limit test
turned OFF, but you will not see a line displayed on the screen.
29
Page 46

Bird Technologies
Figure 10 Setting a Limit Line
Step Action
1 While in the Measure Match mode or the
Fault Location mode, press the Limit Test
key:
First press - Test ON Aud (line and sound)
Second press - Test ON (line only)
Third press - Test OFF
30
2 Press the Config key
3 Press the Limit Line softkey
4 Use the keyboard to enter a limit value of
your choice or use the suggested limits
listed below (use the +/- key to enter a negative value) then press the Enter key.
Antenna at resonance -14 dB
Connectors -25 dB
Jumpers -35 dB
Lightning protector -25 dB
Transmission lines -30 dB
5 Press the Esc key to exit the configure
screen
Page 47

Measure Match Mode
Measure the Match of the Component
1. Connect the Site Analyzer to the component being tested as follows:
• ANTENNA – (if used) Connect the Phase Stable Cable directly
to the coaxial connector of the antenna. There should be no
other transmission lines or jumpers connected.
• OTHER COMPONENTS – (Including Jumpers, Transmission
Lines, Lightning Protectors, and RF Filters) Connect the
Phase Stable Cable to one end of the component. Connect the
Calibration Combination Load to the other end of the component.
2. Wait at least 10 seconds for the sweep to update.
3. When you have a trace on the screen, you can do any of the
following:
• Hold the trace (refer to Measurement Hold, page 33)
• Add markers to the trace (refer to Markers, page 70)
• Save the trace (refer to Save Trace, page 80)
• Print the trace (refer to Printing, page 77)
31
Page 48

Bird Technologies
Interpreting the Measurement
The graph below shows a typical Match Measurement for an antenna
system.
1. Parts of the sweep below the limit line are better than the limit.
2. Antennas and filters should be below the limit line for the entire
band, and above the limit line outside the band.
3. Other components should be flat and below the limit line across
the entire band.
32
Page 49

Measure Match Mode
Measurement Hold
You must be in either Measure Match mode or Fault Location mode to
hold a trace.
The hold feature stops updating the display at the end of the current
sweep. Press the Hold softkey to hold the displayed trace and press
the Run softkey (the same key) to resume taking measurements. A
measurement is being held when there is a lock icon in the indicator
ball and the Hold softkey changes its name to Run.
If you press the Hold softkey while the unit is in the process of acquiring
data (sweeping), it will not hold the trace until the sweep has finished.
Follow the numbered steps in Figure 11, page 33 to activate or deactivate measurement hold.
Figure 11 Measurement Hold
Step Action
1 Press Hold key to hold the measurement;
press Run key to resume sweeping
2 Lock symbol indicates measurement is
held
33
Page 50

Bird Technologies
Markers
You must be in either Measure Match mode or Fault Location mode to
use markers.
You can activate and use up to six markers to visually indicate the trace
value at specific frequency points. All markers follow the current trace
only. The site analyzer displays the frequency and signal value for each
marker at the bottom of the screen. You can display each marker as a
triangle pointer or a vertical line through the trace. You can also display
the difference (delta) in frequency between two markers. Markers indi
cate VSWR to 0.01, and Return Loss or Cable Loss to 0.1 dB.
When you display both a recalled trace and the current measurement
trace at the same time, there is an additional marker option, single
mode and dual mode. In single mode, the markers function normally
(indicating the frequency and value at the marker). In dual marker
mode, you select a marker using the Mark softkey and, at the bottom
of the screen, the site analyzer displays the marker number, the fre
quency and value of the current trace at the marker, and the difference in frequency and value between the current trace and the
recalled trace. The difference in frequency is always 0.00 (zero). Only
the first three markers (M1, M2, M3) are available in dual mode.
-
-
Activate Markers and Set Marker Style
1. Be sure that you are in either Measure Match mode or Fault
Location mode.
2. Follow the numbered steps in Figure 12, page 35 to activate
markers and set their style.
34
Page 51

Figure 12 Activate Marker and Set Style
Step Action
Measure Match Mode
1 Press the Marker key to enter marker
setup
2 Press the Mark softkey to select a marker
(1-6)
3 Press the Active / Off softkey to turn ON
the selected marker (active) or turn OFF
the selected marker (off)
4 Press the Type softkey to select triangle
marker (4 in figure) or line marker (1 in
figure)
Repeat Step 2 through Step 4 to select and
activate up to six markers and set the
mark style
5 Press the Esc key to return to the test
screen
35
Page 52

Bird Technologies
Move Markers
You can move the active marker along the trace (frequency axis) by
using the left and right scroll keys or by entering a frequency with the
numeric key pad. All markers follow the current trace only.
If you have recalled a trace and you want to use markers to compare it
to the current trace, you need to select the dual mode (refer to
Using
Markers with Recalled Traces, page 39). The marker will move along
the current trace (as described in the following paragraph) and compare each data point at the marker frequency (on the current trace) to
the first saved data point in the recalled trace (other data points in the
recalled trace are not compared). For more information about compar
ing data points, refer to Using Markers with Recalled Traces, page 39.
Since traces can be created using different numbers of data points
(238, 475, 949), moving a marker along a 475 data point or 949 data
point trace will appear different from how the marker moves along a
238 data point trace. In a 238 data point trace, when you press the
right or left scroll keys, the marker moves with each key press. In a
trace with 475 data points, there are two data points at each pixel.
When you first move to a new pixel, the screen displays the value of
the first data point that was saved and when you press the right scroll
key the marker does not “move” but the screen displays the value of
the second data point. Pressing the right scroll key a third time moves
to the next frequency. Similarly in a trace with 949 data points, there
are four data points at each marker pixel. When you first move to a
new frequency, the screen displays the value of the first data point
that was saved and each time you press the right scroll key the
marker does not “move” but the screen displays the value of the next
data point (in the order saved). Pressing the right scroll key a fourth
time moves to the next frequency.
1. Be sure that you are in either Measure Match mode or Fault
Location mode.
2. Follow the numbered steps in Figure 13, page 37 to select and
move markers.
-
36
Page 53

Figure 13 Moving Markers
Measure Match Mode
Step Action
1 Press the Marker key to enter marker
setup
2 Press the Mark softkey to select a marker
(1-6)
3 Press the right or left arrow keys to move
the marker right or left, or enter a frequency value on the keypad and press
Enter
4 Press the up arrow keys to move the
marker to the highest point on the trace
5 Press the down arrow key to move the
marker to the lowest point on the trace
6 Press Esc to return to the test screen
37
Page 54

Bird Technologies
Using Delta Markers
In the delta marker mode, only active markers will be visible. The
delta marker feature displays the difference (delta) in both frequency
and value between the selected marker and each of the other active
marker. If the limit line is active, you will also see the difference
between the selected marker and the limit line. The frequency differ
ence between the selected marker and the limit line will always be the
frequency at the marker. All markers follow the current trace only.
-
Note: The delta marker feature compares points only on
one trace, and you must have at least two active markers for the
delta option to work.
To select and use delta markers, follow the numbered steps in
Figure 14 on page 38.
Figure 14 Delta Markers
38
Step Action
1 Press the Marker key to enter marker
setup
2 Press the Mark softkey to select an active
marker (1-6)
3 Press the Delta softkey to cycle through
the active markers and limit line (if active)
4 Press Esc to return to the test screen
Page 55

Measure Match Mode
Using Markers with Recalled Traces
When a trace is recalled, the screen displays both the current trace
and the recalled trace and there is an additional marker option, Single
Mode / Dual Mode. In single mode, the markers function normally; the
site analyzer displays the frequency and trace value at each marker.
In dual mode, the markers show the actual value of both traces and
the difference in value between the recalled trace and the current
trace. All markers follow the current trace only, and only three mark
ers are available in dual mode, M1, M2, and M3. When you select dual
mode, the markers move as described in
Move Markers, page 36. Each
time you press the right scroll key, the screen displays the next saved
data point of the current trace and compares it to the first data point
of the recalled trace (other data points of the recalled trace are
ignored).
Figure 15 on page 40 shows the data comparison graphically.
1. Be sure that you are in either Measure Match mode or Fault
Location mode.
2. Recall a trace (refer to Recall a Saved Trace, page 91).
3. Follow the numbered steps in Figure 16 on page 41 to set markers
on a recalled trace.
-
39
Page 56

Bird Technologies
Figure 15 Comparing Data Points in Dual Mode
40
Page 57

Figure 16 Using Markers with Recalled Traces
Step Action
1 Press the Marker key
Measure Match Mode
2 Select single mode or dual mode
3 Select a marker
4 Press the left or right scroll key to move the
marker
5 Press Esc to return to the test screen
41
Page 58

Bird Technologies
Printing
The Bird Site Analyzer can print the information displayed on the
screen to any HP Deskjet printer that supports the PCL Level 3 proto
col. To print the screen image, first hold the image (Measurement
Hold, page 33) then press the Print key (Figure 17, item 1).
Note: If you press the Print softkey when there is no
printer connected, the unit will try to print and then display
the word ERROR beside the softkey. To clear the error, select
Mode>Utility>Printer, then press the Printer softkey a second
time to reset the system.
Figure 17 Print the Screen Image
-
42
Page 59

Measure Match Mode
Cable Loss Measurement
To measure cable loss, make sure that the cable being tested is unterminated (not connected to anything at the far end).
Note: Cable loss is a measurement choice that is available
in Measure Match (Configuration). It can also can be selected
by choosing Cbl Loss from Units when you are setting the Scale
in Measure Match (Configure).
1. Check the power of cable to be tested (refer to Determine the
Power of the Component Being Tested, page 17). Make sure that
the cable does not have power greater than +22 dBm.
2. Make sure that you have the correct adaptors and connectors and
a Bird Calibration Combination (cal combo). Also make sure that
you know the frequency band of the system
3. Turn on the Site Analyzer and enter the Measure Match mode
(refer to
4. Follow the numbered steps in Figure 18 on page 44 to set up the
Site Analyzer to measure cable loss.
Select the Measure Match Mode, page 18).
43
Page 60

Bird Technologies
Figure 18 Set Up for Cable Loss Measurement
Step Action
1Press the Config key
2Press the Scale softkey
3 Press the right or left scroll keys to select Units
4 Press the up key to open the units list
5 Press the up or down keys to select Cbl Loss
and press Enter
5. Select the Freq softkey and set the frequency start and stop to a
range that is well beyond the normal range of the antenna (refer
to
Setting the Measurement Frequency, page 18).
Note: For example, for a 450 MHz antenna, set the start
frequency at 400 and the stop frequency at 500 MHz, for an 800
MHz antenna, set the start frequency at 700 and the stop frequency at 1,100 MHz.
6. Connect a phase stable cable to the Site Analyzer antenna test
port and connect a Cal Combo to the other end of the cable.
7. Calibrate the Site Analyzer (See Calibrate the Site Analyzer, page 21).
Note: After calibration, with the load still connected, the
output must below -25 dB. If it is not, there is a problem.
8. Remove the Cal Combo unit from the cable. Do not disconnect the
phase stable cable from the Site Analyzer.
44
Page 61

Measure Match Mode
9. Connect the phase stable cable to one end of the cable under test.
10. Connect the Short connection on the Cal Combo unit to the other
end of the cable being tested.
11. Wait at least 10 seconds to allow the trace to update.
12. Hold the trace on the screen (See Measurement Hold, page 33).
13. Place a triangle-style marker (mark 1) at the minimum loss point
within the frequency band on the trace (refer to
14. Place a triangle-style marker (mark 2) at the maximum loss point
within the frequency band on the trace.
15. If appropriate, save and label the trace (refer to Save Trace, page 80).
Markers, page 34).
Interpreting the Cable Loss Measurement
The graph below shows a typical cable loss measurement. Note that the
scale is greatly reduced to show the cable’s variation across frequency.
1. Take the average of M1 and M2. This is the average cable loss
across the frequency band.
2. Compare the loss with the manufacturer’s specified loss for a cable
of this length. If they do not correspond, retake the measurement,
then check the cable for problems.
3. The Cable Loss for a good cable should be flat across the frequency
band.
45
Page 62

Bird Technologies
46
Page 63

Chapter 4 Fault Location Mode
Fault location identifies the position of impedance discontinuities
(reflections) within the antenna/feeder system. The measurement
results are displayed on an x-y graph. Distance from the Site Analyzer
is shown on the x-axis, while relative magnitude of the discontinuity is
shown on the y-axis.
Before you make a fault location measurement, be sure that you have
the following items and information:
• A Bird Calibration Combination (Cal Combo) calibration unit
• All necessary cables and adapters of the correct size and con-
nector type.
• The velocity of propagation for the cable type you will measure
(obtain from the cable manufacturer)
• Number of data points to use in making the distance to fault
measurement (user choice)
This chapter describes how to make a fault location measurement and
provides step by step instructions. In addition, this chapter also
describes how to set and move markers. For information and instruc
tions to save and recall traces, refer to Save and Recall, page 79.
-
To make a fault location measurement, follow the procedures in this
chapter in the order they are presented.
Determine the Power of the Component Being Tested
Use a service monitor, power meter, or spectrum analyzer to check that
the component being tested does not have power greater than +22 dBm.
CAUTION
+22 dBm max. input
Do not apply RF power to the Antenna Test Port.
Exceeding the maximum input will damage the Site
Analyzer.
47
Page 64

Bird Technologies
Note: Changing the frequency settings will automatically
turn calibration off. Always set the frequency before calibrating
the unit.
Note: If you enter a frequency that is outside of the range
of the Site Analyzer, the Site Analyzer will override your entry
and set the minimum or maximum frequency of the model.
Select Fault Location Mode
1. Apply power to the Site Analyzer. Press and hold the ON/OFF key
for at least 1/2 second then wait for the unit to go through its
power-on initialization.
2. To select the Fault Location mode, follow the numbered steps in
Figure 19 on page 48.
Figure 19 Select Fault Location Mode
48
Step Action
1 Press the Mode key
2 Press the Fault Location softkey
Page 65

Fault Location Mode
What You Need to Know About Setting the Frequency Span and Max Distance
Note: Changing the frequency span or the max distance
will automatically turn calibration off. Always set the frequency span or max distance before calibrating the unit.
The maximum distance you can measure is determined by the frequency span, the velocity of propagation of the cable (Vp), and the
number of data points to measure (238, 475, or 949). These factors are
discussed in the following paragraphs.
Max DistanceWhen you specify a frequency span, the Site Analyzer
calculates the maximum measurable distance. If you know the maxi
mum distance you want to measure, you can enter it instead of the frequency span; the Site Analyzer calculates the frequency span for you.
If you manually enter a maximum distance, be sure to select the data
points before entering the max distance
-
Note: If you select a maximum distance less than the total
length of the cable system, the trace might show a spike that is
not really a fault, but rather an echo from the portion of the
cable that is beyond the length you chose. Such a spike is
known as an alias. To avoid aliasing, always set the maximum
distance to a value that is a few feet or meters greater than the
entire length of your cable system.
Data Points
the measurable distance (475 points results in twice the distance of
238 points, and 949 points results in four times the distance of 238
points) (refer to
data points measured, the software automatically recomputes the new
maximum measurable distance. If you manually enter a maximum
distance, be sure to select the data points before entering the max dis
tance. Changing data points does not turn calibration off.
Frequency SpanIf you narrow the frequency span you will increase
the measurable distance (refer to the
page 140).
Velocity of PropagationThe velocity of propagation is a characteristic
of the cable and is expressed as a percentage. Contact the cable manu
facturer to get the velocity of propagation value for the cable you are
using.
If you increase the number of data points you will increase
Equations, page 140). When you change the number of
Fault Location Distance Tables,
-
-
49
Page 66

Bird Technologies
Setting the Frequency Span
For a given number of data points (238, 475, 949), entering a frequency span causes the Site Analyzer to calculate and enter the maximum measurable distance and, conversely, ent
distance causes the Site Analyzer to calculate and enter the required
frequency span.
There are two methods you can use to determine the
(for both methods, you need to know the maximum distance, velocity
of propagation, and number of data points). Instructions for both
methods are in Step 2 below:
ering a maximum
frequency span
• Use the Fault Location Distance Tables, page 140.
• Calculate the frequency span.
1. Select Measure Match Mode (refer to Select the Measure Match
Mode, page 18).
2. Determine the frequency span. Choose how many data points you
want to measure
Distance and Resolution
propagation percentage that is closest to the cable in your system.
Read down the
frequency span or the maximum distance. When choosing a
distance, choose one that is approximately 25% more than your
tower height (or length of the cable system to be tested).
For example, for a cable with a dielectric constant of 2.296, the
v
elocity percentage is 66%. If the cable system is 100 feet long, and
you choose 238 data points, then the Site Analyzer should be set to
a frequency span of 700 MHz. The resolution of the graph will be
5.6 inches.
then, from the
table (page 140), choose a velocity
Vel Prop percentage column to determine the
appropriate Fault Location
Note: To avoid potential false “spikes” (aliases) on the
trace, be sure to select a distance that is at least 25% greater
than the length of your cable system.
If you know your cable’s velocity of propagation and its length but
the
y are not on one of the tables, you can either enter the max distance into the Site Analyzer or y
frequency span required by using the following equation:
Freq Span =
where (# points - 1) is 237, 474, or 948
If you enter a span greater than the current settings permit
span will be set to the maximum allowable value.
50
150()relative velocity (%) # points 1–()××
------------------------------------------------------------------------------------------------------------
ou can determine the approximate
test length (m)
, the
Page 67

Fault Location Mode
3. Enter the frequency span. Follow the numbered steps in Figure 20
on page 51 to enter the values you determined in Step 2.
4. Enter the center frequency. The center frequency is the center of
the antenna’s frequency range.
To set the max distance, follow the numbered steps in Figure 20 on
page 51.
Figure 20 Setting the Frequency Span and the Center Frequency
Step Action
1 Press the Config key
2 Press the Freq softkey
3 For both Span and Center, scroll to select
the item (Span or Center)
4 Enter the Span value determined from the
table earlier. Enter the value for the center
frequency as determined in instruction
Step 3.
5 After you enter the Span value, press Enter
After you enter the Center value, press
Enter
6 Press the Mode key
7 Press the Fault Location softkey
51
Page 68

Bird Technologies
Setting the Maximum Distance
Note: Changing the frequency span or the max distance
will automatically turn calibration off. Always set the
frequency span or max distance before calibrating the unit.
1. Select the Fault Location mode (Figure 19 on page 48).
2. Follow the numbered steps in Figure 21 on page 52 to enter the
maximum distance value.
3. At the warning message (Figure 22, page 53) press Enter to accept
your entry or Esc to cancel your entry. When you press Enter, the
Site Analyzer will display the Calibration screen so you can begin
the calibration process.
Figure 21 Setting the Maximum Distance
Step Action
1Press the Config key
2Press the Distance softkey
3 Press the right or left arrow keys to scroll to Max
4 Numeric key pad - enter a maximum distance value
5Press the Enter key after entering a value
6Press the Esc key to exit the configuration screen
52
Page 69

Fault Location Mode
Figure 22 Changed Max Distance Warning Message
Calibrate the Site Analyzer
If you need to use an extension cable or a phase stable cable, connect
that cable to the antenna test port on the Site Analyzer and then con
nect the Bird Calibration Combination to the end of the extension
cable. Follow the procedure in
Chapter 2, Calibration, page 15.
-
Note: After calibration, with the load still connected, the
output must be below –45 dB. If it is not, there is a problem. It is
common to see spikes from –60 to –45 dB. These can be ignored.
Remove the Cal Combo from the cable.
Setting the Cable Type
Setting the cable type means that you enter values for the velocity of
propagation and the cable loss. You can set the cable type manually or
choose from a list of preset values. When you manually enter a value
for the velocity of propagation or cable loss, the Cable List entry
becomes “Custom”.
Note: Changing the cable type or velocity of propagation
will reset the distance scale to the maximum possible distance.
Always set the cable type before setting the distance scale.
53
Page 70

Bird Technologies
1. Make sure that Fault Location mode is selected (refer to Select
Fault Location Mode, page 48).
2. To manually set the cable type, follow the numbered steps in
Figure 23. To select the cable type from a predefined list, follow
the steps in Figure 24.
Figure 23 Select Cable Type Manually
54
Step Value
1 Press the Config key
2 Press the Cbl Type softkey
3 For both Vel Prop and Loss, scroll to select
the item (Vel Prop or Loss)
4 Enter the Vel Prop value or enter the Loss
value
5 After you enter the Vel Prop value, press
Enter. After you enter the Loss value, press
Enter.
6 Press the Esc key to exit the configuration
screen
Page 71

Figure 24 Select Cable Type from List
Step Action
Fault Location Mode
1 Press the Config key
2 Press the Cbl Type softkey
3 Press the right or left scroll keys to select
Cable List
4 Press the up or down scroll keys to open
the cable list
5 Press the up or down scroll keys to select
an item on the list
6 Press the Enter key to accept the selection
7 Press the Esc key to exit the configuration
screen
3. Continue to the next topic in this section (Setting the Distance and
Units, page 56)
55
Page 72

Bird Technologies
Setting the Distance and Units
Distance to Display on the Trace (start, stop)
The trace can display the entire length (distance) of the cable system
you are measuring or a smaller portion of the length for better detail.
If you suspect that there might be a fault at a known distance along a
cable, you can set the display to show only that area by using the start
and stop points. Think of this as zooming in on a section of the cable.
You can set both the start point (where to begin the trace display) and
the stop point (where to end the trace display).
Note: You cannot set the stop point to a value that is
greater than the maximum distance you are measuring. For
example, if you have selected a data point option, frequency
span, and Vp that results in a maximum distance of 100 feet,
you cannot set a stop point to a value greater than 100 feet.
Follow the numbered steps in Figure 25, page 57 to set the start and
stop distance. For an antenna lead, you will typically set the start distance at 0, and the stop distance at a few feet or meters greater than
the tower height.
Follow the numbered steps in Figure 26, page 58 to set the distance
units.
56
Page 73

Figure 25 Setting the Start and Stop Distance
Step Action
Fault Location Mode
1Press the Config key
2Press the Distance softkey
3 Press the right or left arrow keys to scroll to Start or
Stop
4 Use the numeric key pad to enter a value for Start
or Stop.
5Press the Enter key after entering a value.
6Press the Esc key to exit the configuration screen
57
Page 74

Bird Technologies
Figure 26 Setting the Distance Units
Step Action
58
1 Press the Config key
2 Press the Distance softkey
3 Press the left or right arrow keys to select
Units
4 Press the up or down arrow keys to select a
unit from the list
5 Press the Enter key
6 Press the Esc key to exit the configuration
screen
Page 75

Fault Location Mode
Setting the Scale & Unit of Measure
You can set the display scale manually or by using Auto Scale. The
display trace can be in units of return loss [dB] or VSWR [ratio]. You
can activate Auto Scale from the configuration screen or from the
main Fault Location screen.
1. Follow the numbered steps in Figure 27 on page 59 to set the scale
units.
2. Follow the numbered steps in Figure 28 on page 60 to set the scale
limits.
3. Follow the numbered steps in Figure 29 on page 61 to set Auto
Scale from the Configuration screen
Figure 27 Setting Fault Location Scale Units
Step Action
1 Press the Config key
2 Press the Scale softkey
3 Use the left or right scroll keys to select
Units
4 Use the up or down scroll keys to activate the
units menu and to select the units you want.
5 Press the Enter key.
6 Press the Esc key to exit the configure screen
59
Page 76

Bird Technologies
Figure 28 Setting Fault Location Scale Limits Manually
Step Action
1 Press the Config key
60
2 Press the Scale softkey
3 Use the left or right scroll keys to select
Min.
4 Use the keypad to enter your value or use
–60 as a limit.
5 Press the Enter key
6 Use the left or right scroll keys to select
Max.
7 Use the keypad to enter your value or use 0
as a limit.
8 Press the Enter key
9 Press the Esc key to exit the configure
screen
Page 77

Figure 29 Setting Fault Location Auto Scale
Step Action
Fault Location Mode
1 Press the Config key
2 Press the Scale softkey
3 Use the left or right scroll keys to select
Auto Scale
4 Press the Enter key
5 Press the Esc key to exit the configure
screen
61
Page 78

Bird Technologies
Set the Measurement Data Points
You can select the number of data points to take during a measurement. There are three data point options, 238 points, 475 points, and
949 points. Increasing the number of data points increases the mea
surable distance in distance-to-fault measurements and increases the
detail in Measure Match mode measurements. When you save a trace,
the number of data points collected (238, 475, or 949) are saved.
The default number of data points is 238. Selecting 475 data points
provides twice as many measurement points as 238, but it takes
approximately twice as long for the trace to sweep and display. Select
ing 949 data points provides four times as many measurement points
as 238, but it takes approximately four times as long for the trace to
sweep and display.
A progress bar, just below the x-axis, moves from left to right indicating the progress of the sweep. When the progress bar reaches the right
side of the screen, the sweep is finished.
When you change the number of measurement data points, the current trace is erased and the Save softkey is disabled until the sweep
finishes and the screen displays the first new trace. If you press the
Save softkey before the first sweep has completed, the Save softkey
icon (the red bar) will blink until the sweep finishes and then the dis
play will change to the Save and Recall screen (in response to you
pressing the Save softkey).
1. Turn on the instrument and enter the Measure Match mode (refer
to
Select the Measure Match Mode, page 18).
2. Select Frequency (refer to Setting the Measurement Frequency,
page 18)
3. Make sure that the instrument is calibrated (refer to Calibration,
page 15).
4. Select the Fault Location mode (refer to Select Fault Location
Mode, page 48).
5. Follow the numbered steps in Fig. 30 to set the measurement
resolution.
-
-
-
62
Page 79

Figure 30 Setting the Measurement Resolution
Step Action
Fault Location Mode
1 Press the Config key
2 Press the Scale softkey
3 Use the left or right scroll keys to select Res
4 Press the up scroll key to open the list
5 Press up or down scroll key to select a data
point option (238, 475, 949)
6 Press the Enter key to accept the selection
and return to the configure screen
63
Page 80

Bird Technologies
Set the Graph Display Type
When the Site Analyzer collects data during a sweep, you can specify
that it measure 238 data points, 475 data points, or 949 data points.
Selecting 475 data points takes twice as much time to sweep as 238
points, and 949 points takes four times as much time to sweep as 238
points.
The Site Analyzer display screen graph area can display only 238 data
points because of its physical pixel limitations. However, if the trace
contains 475 data points or 949 data points, all points are represented
on the display. There are three modes available to display the data
points for the trace - envelope, maximum, and minimum. For 238 data
points, there is no difference in the display for each of the three modes
because each data point occupies a separate pixel. For 475 data points
and 949 data points, the envelope mode displays all data points, the
maximum mode displays only the highest (peak) magnitude data
point for each pixel, and the minimum mode displays only the lowest
(minimum) magnitude data point for each pixel.
Note: When you save (or download) a trace, all measured
data points (238, 475, or 949) are saved (or downloaded). The
display modes (envelope, maximum, minimum) are for the Site
Analyzer display only and are not saved (or downloaded) with
your trace.
1. Turn on the instrument and enter the Measure Match mode (refer
to
Select the Measure Match Mode, page 18).
2. Select Frequency (refer to Setting the Measurement Frequency,
page 18)
3. Make sure that the instrument is calibrated (refer to Calibration,
page 15).
4. Select the Fault Location mode (refer to Select Fault Location
Mode, page 48).
5. Follow the steps in Figure 31, page 65 to set the graph display.
64
Page 81

Figure 31 Setting the Graph Display
Step Action
Fault Location Mode
1 Press the Config key
2 Press the Scale softkey
3 Press the left or right scroll key to select
Disp
4 Press the up scroll key to open the selec-
tion list
5 Press the up or down scroll key to select a
display type (envelope, maximum, minimum)
6 Press the Enter key to accept the selection
and return to the configuration screen
65
Page 82

Bird Technologies
Set and Activate Acceptance Limits
The limit line helps to set off those parts of a trace that are outside of
the acceptance (limit) values. It appears as a horizontal line at the
limit line value.
You can set an acceptance limit line to help visualize what part of the
measurement trace is not acceptable. The part of the trace that is not
acceptable will display in red. To view the limit line, you must have
the limit test ON. This feature is available only in the Measure Match
mode and the Fault Location mode.
1. If needed, turn the unit on and select the Measure Match mode
(refer to
2. If needed, select the frequency (refer to Figure 4 on page 19 or
Figure 5 on page 20)
3. Make sure that the instrument is calibrated (refer to Calibration,
page 15).
4. Select the Fault Location mode (refer to Select Fault Location
Mode, page 48).
5. Follow the numbered steps in Figure 32, page 67 to turn ON the
limit test and set the limit line value.
Figure 3 on page 18).
66
Note: You can set a limit line value with the limit test
turned OFF, but you will not see the line displayed.
Page 83

Figure 32 Setting a Limit Line
Step Action
1 While in Fault Location mode, press the
Limit Test key to activate the limit line:
First press - Test ON Aud (line and sound)
Second press - Test ON (line only)
Third press - Test OFF
Fault Location Mode
2 Press the Config key
3 Press the Limit Line softkey
4 Use the keyboard to enter a limit value of
your choice then press the Enter key.
5 Press the Esc key to exit the configuration
screen
67
Page 84

Bird Technologies
Test for Fault Location
1. Connect the Site Analyzer to the cable being tested.
Note: If you calibrated the Site Analyzer with a phase sta-
ble cable connected to its antenna port, do not remove the cable.
Connect it to the cable to be tested.
2. Wait at least 10 seconds for the sweep to update.
When you have a trace on the screen, you can do any of the following:
• Hold the trace (refer to Measurement Hold, page 69)
• Add markers to the trace (refer to Markers, page 70)
• Save the trace (refer to Save Trace, page 80)
• Print the trace (refer to Printing, page 77)
Interpreting the Fault Location Measurement
The graph below shows a typical Fault Location measurement for an
antenna system. The table lists typical component return losses.
68
Typical Component Return Loss
Antenna at Resonance –14 dB
Connector –25 dB
Jumper –35 dB
Lightning Protector –25 dB
Transmission Line –30 dB
Page 85

Fault Location Mode
1. Each connector or jumper will show up as a spike. If it is larger
than the typical value, check the connector for damage.
2. Spikes where there are no components represent faults. Note the
distance and check the line at that point for damage.
3. The largest spike is usually due to the antenna. Typically the
trace after the antenna can be ignored.
4. If you have selected a cable length that is less than the total
length of the cable system, the trace might show a spike that is not
really a fault, but rather an echo from the remaining portion of the
cable that is beyond the length you chose. Such a spike is known
as an alias. To avoid aliasing, you should always set the
measurement distance to a value that is a few feet or meters
greater than the entire length of your cable system.
5. A large spike (fault) near the Site Analyzer will mask other faults
farther away. When you find a large spike near the Site Analyzer,
fix it and then repeat the Fault Location measurement.
Measurement Hold
Measurement Hold stops updating the display at the end of the current sweep. Press the Hold key to toggle the sweep hold off and on. A
measurement is held when there is a lock icon in the indicator ball.
Measurement hold is available in Measure Match mode and Fault
Location mode.
Follow the numbered steps in Figure 33, page 69 to turn measurement hold on or off.
Figure 33 Measurement Hold
Step Action
1 Press the Hold softkey to hold the measurement; press
the Run softkey to resume sweeping
2 The lock symbol indicates that the measurement is held
69
Page 86

Bird Technologies
Markers
You must be in either Measure Match mode or Fault Location mode to
use markers.
You can activate and use up to six markers to visually indicate the trace
value at specific frequency points. All markers follow the current trace
only. The site analyzer displays the frequency and signal value for each
marker at the bottom of the screen. You can display each marker as a
triangle pointer or a vertical line through the trace. You can also display
the difference (delta) in frequency between two markers. Markers indi
cate VSWR to 0.01, and Return Loss or Cable Loss to 0.1 dB.
When you display both a recalled trace and the current measurement
trace at the same time, there is an additional marker option, single
mode and dual mode. In single mode, the markers function normally
(indicating the frequency and value at the marker). In dual marker
mode, you select a marker using the Mark softkey and, at the bottom
of the screen, the site analyzer displays the marker number, the fre
quency and value of the current trace at the marker, and the difference in frequency and value between the current trace and the
recalled trace. The difference in frequency is always 0.00 (zero). Only
the first three markers (M1, M2, M3) are available in dual mode.
-
-
Activate Markers and Set Marker Style
1. Be sure that you are in either Measure Match mode or Fault
Location mode.
2. Follow the numbered steps in Figure 34 on page 71 to select and
activate markers.
70
Page 87

Figure 34 Activate Marker and Set Style
Fault Location Mode
Step Action
1 Press the Marker key to enter marker
setup
2 Press the Mark softkey to select a marker
(1-6)
3 Press the Active / Off key to turn ON the
selected marker (active) or turn OFF the
selected marker (off)
4 Press the Type softkey to select triangle
marker (mark 4 in the figure) or line
marker (mark 1 in the figure)
Repeat Step 2 through Step 4 to select and
activate up to six markers and set the
mark style
5 Press the Esc key to return to the test
screen
71
Page 88

Bird Technologies
Move Markers
You can move the active marker by using the arrow scroll keys or by
entering a distance with the numeric key pad. All markers follow the
current trace only.
If you have recalled a trace and you want to use markers to compare it
to the current trace, you need to select the dual mode (refer to
Using
Markers with Recalled Traces, page 39). The marker will move along
the current trace (as described in the following paragraph) and compare each data point at the marker frequency (on the current trace) to
the first saved data point in the recalled trace (other data points in the
recalled trace are not compared).
Since traces can be created using different numbers of data points
(238, 475, 949), moving a marker along a 475 data point or 949 data
point trace will appear different from how the marker moves along a
238 data point trace. In a 238 data point trace, when you press the
right or left scroll keys, the marker moves with each key press. In a
trace with 475 data points, there are two data points at each pixel.
When you first move to a new pixel, the screen displays the value of
the first data point that was saved and when you press the right scroll
key the marker does not “move” but the screen displays the value of
the second data point. Pressing the right scroll key a third time moves
to the next frequency. Similarly in a trace with 949 data points, there
are four data points at each marker pixel. When you first move to a
new frequency, the screen displays the value of the first data point
that was saved and each time you press the right scroll key the
marker does not “move” but the screen displays the value of the next
data point (in the order saved). Pressing the right scroll key a fourth
time moves to the next frequency.
1. Be sure that you are in either Measure Match mode or Fault
Location mode.
2. Follow the numbered steps in Figure 35 on page 73 to select and
move markers
72
Page 89

Figure 35 Moving Markers
Fault Location Mode
Step Action
1 Press the Marker key to enter marker
setup
2 Press the Mark softkey to select a marker
(1-6)
3 Press the right or left arrow keys to move
the marker right or left, or enter a frequency value on the keypad and press
Enter
4 Press the up arrow key to move the marker
to the highest point on the trace
5 Press the down arrow key to move the
marker to the lowest point on the trace
6 Press the Esc key to return to the test
screen
73
Page 90

Bird Technologies
Using Delta Markers
In the delta marker mode, only active markers will be visible. The
delta marker feature displays the difference (delta) in both frequency
and value between the selected marker and each active marker. If the
limit line is active, you will also see the difference between the
selected marker and the limit line. The frequency difference between
the selected marker and the limit line will always be the frequency of
the marker. All markers follow the current trace only.
Note: The delta marker feature compares points only on
one trace, and you must have at least two active markers for the
delta option to work.
1. Make sure that you are in either Measure Match mode or Fault
Location mode
2. To select and use delta markers, follow the numbered steps in
Figure 36 on page 74.
Figure 36 Delta Markers
74
Step Action
1Press the Marker key to enter marker setup
2 Press the Mark softkey to select an active
marker (1-6)
3 Press the Delta softkey to cycle through
the active markers and limit line (if active)
4 Press the Esc key to return to the test screen
Page 91

Fault Location Mode
Using Markers with Recalled Traces
When a trace is recalled, the screen displays both the current trace and
the recalled trace and there is an additional marker option, single
/ dual
mode. In single mode, the markers function normally; the site analyzer
displays the frequency and trace magnitude at each marker. In dual
mode, the markers show the actual magnitude of both traces and the
difference in magnitude between the recalled trace and the current
reading. All markers follow the current trace only, and only three mark
ers are available in dual mode, M1, M2, and M3. When you select dual
mode, the markers move as described in
Move Markers, page 72.
1. Be sure that you are in either Measure Match mode or Fault
Location mode.
2. Recall a trace (refer to Recalling a Saved Trace, page 92).
3. Follow the numbered steps in Figure 37 on page 75.
Figure 37 Using Markers with Recalled Traces
-
Step Action
1 Press the Marker key
2 Press the Mode softkey to select single
mode or dual mode
3 Select a marker to move
4 Press the left or right scroll keys to move
the marker
5Press the Esc key to return to the test screen
75
Page 92

Bird Technologies
Smooth
Smooth is an option that will digitally average the displayed trace.
There are three levels of smoothing, low medium, and high. Follow the
steps in
same trace with high smoothing selected.
Figure 38 Set Display Smoothing
Figure 38 to set smoothing. Figure 39, page 76 shows the
Step Action
1 Press the Config key
2 Press the Smooth key
First press - sets smoothing to Low
Second press - sets smoothing to Medium
Third press - sets smoothing to High
Fourth press - sets smoothing to None (off)
3 Press the Esc key to exit the configuration screen
Figure 39 Display with High Smoothing Selected
76
Page 93

Fault Location Mode
Saving The Measurement
You can save the trace and recall and review it at a later time (refer to
Save Trace, page 80).
Printing
The Bird Site Analyzer can print the information displayed on the
screen to any HP Deskjet printer that supports the PCL Level 3 proto
col. To print the screen image, first hold the image (Figure 33,
page 69) then press the Print softkey (Figure 40, item 1).
Note: If you press the Print softkey when there is no
printer connected, the unit will try to print and then display
the word ERROR beside the softkey. To clear the error, select
Mode>Utility>Printer, then press the Printer softkey a second
time to reset the system.
Figure 40 Print the Screen Image
-
77
Page 94

Bird Technologies
78
Page 95

Chapter 5 Save and Recall
Traces and instrument setups can be saved to and recalled from the
nonvolatile memory in the unit. The Site Analyzer identifies saved
items with a sequentially generated number, a time-date stamp, and
the number of data measurement points. For example, a trace might
be identified as “010 13-DEC-2004 10:47 475” where 010 is the
sequential number, 13-DEC-2004 10:47 is the time-date stamp, and
475 is the number of data points measured.
You can also add descriptive labels (text and numbers) to the items.
This section discusses saving and recalling traces, and creating and
editing labels. Refer to
saving instrument setups.
The memory available for storing traces and setups is limited. You can
store up to 15 custom instrument setups. The maximum number of
traces that you can store is limited to 500 at 238 data points or 250 at
475 data points or 125 at 949 data points. All of the stored traces do
not need to be of the same number of data points, therefore, the actual
maximum number of traces you can save varies depending upon the
number of data points in the traces. For example, you could store 140
traces with 238 data points plus 60 traces with 475 data (which equals
approximately the same capacity as 120 traces with 238 data points)
plus 60 traces with 949 data points (which equals approximately the
same capacity as 240 traces with 238 data points). When the storage
memory is full or cannot hold the trace you are trying to save, the sys
tem displays a message (Figure 41, page 80) stating that there is no
more space and that you need to save the trace at a lower number of
data points (i.e. change the number of data points in the Config menu)
or free space by deleting some traces.
Save a Setup, page 94 for information about
-
79
Page 96

Bird Technologies
Figure 41 Out of Memory Message
Save Trace
To save a trace, you must be in either Measure Match mode or Fault
Location mode
1. Press the Save/Recall softkey.
2. Press the Save softkey (Figure 42, page 81, item 1) which
automatically opens the text label screen (Figure 43, page 81).
3. Follow the numbered steps in Figure 43 on page 81 to enter a label
(file name) for the trace.
80
Note: If the numeric shortcuts are off, press a number key
once to enter a number. If the shortcuts are on, press the key twice.
Shortcuts are turned off by default. Refer to Label Text Shortcuts,
page 82 for more information about numeric shortcuts.
Note: The items on the Save and Recall list are automati-
cally sorted by the text field using the order blank, numeric,
alpha characters.
Page 97

Figure 42 Save Trace Screen
Figure 43 Text Label Screen
Save and Recall
81
Page 98

Bird Technologies
Step Action
1 Press the right and left scroll keys to select
2 Press a softkey to enter the letter indicated
3 Label name appears as characters are
4 Text cursor indicates where next character
5 Press the Delete key to remove the char-
6 Press the up and down scroll keys to move
7 Press the Enter key to accept the label text
8 Press the Esc key to exit Save and Recall
a character column
at its right
entered
will be entered
acter immediately at the left of the text
cursor
the text cursor to select a character in the
label text (type over function)
mode
Label Text Shortcuts
Typically when you enter or edit label text, you use the right and left
scroll keys to select columns of letters. Using shortcuts allows you to
select a column of letters by pressing a number on the key pad. When
you enable shortcuts, each column is identified by a number at the
bottom. When shortcuts are enabled, press the number key once to
select the column, and twice to enter a number.
To enable or disable shortcut keys, you must be in either Measure
Match mode or Fault Location mode.
1. Press the Save/Recall softkey.
2. Press the Save softkey.
3. Press the Config key.
4. Follow the numbered steps in Figure 44, page 83 to enable or
disable the label shortcuts.
82
Page 99

Figure 44 Text Label Configuration
Step Action
1 Press Config key to enter text label setup
Save and Recall
2 Press softkey to enable or disable shortcuts
3 Press the Done softkey or Enter key to exit
configure screen
4 Press the Esc key two times to return to the
test mode screen
83
Page 100

Bird Technologies
Label Text Help
The Site Analyzer has a built-in help screen that describes how to use
the label text feature. To access the label text help, you must be in
either Measure Match mode or Fault Location mode.
1. Press the Save/Recall softkey.
2. Press the Save softkey.
3. Press the Config key.
4. Follow the numbered steps in Figure 45, page 84 to display the
label text help screen.
Figure 45 Text Label Help
84
Step Action
1 Press the Help softkey to open Help screen
2 Press the Enter key to close Help screen
3 Press the Esc key two times to exit the
configure screen
 Loading...