

Page 1

Bird Diagnostic System
7001B200-1
®
©Copyright 2012
Instruction Book P/N 920-7001B200-1 Rev. A
Bird Diagnostic System is trademark of Bird Electronic Corporation.
by Bird Electronic Corporation
Page 2

I am not blank
Page 3

Safety Precautions
The following are general safety precautions that are not necessarily related to any specific
part or procedure, and do not necessarily appear elsewhere in this publication. These precautions must be thoroughly understood and apply to all phases of operation and maintenance.
WARNING
Keep Away From Live Circuits
Operating Personnel must at all times observe general safety precautions. Do not
replace components or make adjustments to the inside of the test equipment with the
high voltage supply turned on. To avoid casualties, always remove power.
WARNING
Shock Hazard
Do not attempt to remove the RF transmission line while RF power is present.
Capacitors can store a dangerous electrical charge. Avoid contact with all system
capacitors. If it is necessary to perform work near a system capacitor, be sure to discharge
the capacitor through a low resistance.
WARNING
Do Not Service Or Adjust Alone
Under no circumstances should any person reach into an enclosure for the purpose of
service or adjustment of equipment except in the presence of someone who is capable
of rendering aid.
WARNING
Safety Earth Ground
An uniterruptible earth safety ground must be supplied from the main power source to
test instruments. Grounding one conductor of a two conductor power cable is not
sufficient protection. Serious injury or death can occur if this grounding is not properly
supplied.
WARNING
Resuscitation
Personnel working with or near high voltages should be familiar with modern methods
of resuscitation.
WARNING
Remove Power
Observe general safety precautions. Do not open the instrument with the power on.
iii
Page 4
Safety Symbols
WARNING
Warning notes call attention to a procedure, which if not correctly performed could
result in personal injury.
CAUTION
Caution notes call attention to a procedure, which if not correctly performed could
result in damage to the instrument.
The caution symbol appears on the equipment indicating there is
important information in the instruction manual regarding that particular area.
Note: Calls attention to supplemental information.
Warning Statements
The following safety warnings appear in the text where there is danger to operating and maintenance personnel and are repeated here for emphasis.
Caution Statements
The following equipment cautions appear in the text whenever the equipment is in danger of
damage and are repeated here for emphasis.
CAUTION
Bending RF cables can cause damage. When routing RF cables, the minimum
bend radius is 2 inches (25.4 mm). Do not bend the cables more than the
minimum bend radius. Failure to comply may result in permanent damage to
the cable and reduced equipment performance.
See page 6.
iv
Page 5

Safety Statements
USAGE
ANY USE OF THIS INSTRUMENT IN A MANNER NOT SPECIFIED BY THE
MANUFACTURER MAY IMPAIR THE INSTRUMENT’S SAFETY PROTECTION.
USO
EL USO DE ESTE INSTRUMENTO DE MANERA NO ESPECIFICADA POR EL
FABRICANTE, PUEDE ANULAR LA PROTECCIÓN DE SEGURIDAD DEL
INSTRUMENTO.
BENUTZUNG
WIRD DAS GERÄT AUF ANDERE WEISE VERWENDET ALS VOM HERSTELLER
BESCHRIEBEN, KANN DIE GERÄTESICHERHEIT BEEINTRÄCHTIGT WERDEN.
UTILISATION
TOUTE UTILISATION DE CET INSTRUMENT QUI N’EST PAS EXPLICITEMENT
PRÉVUE PAR LE FABRICANT PEUT ENDOMMAGER LE DISPOSITIF DE
PROTECTION DE L’INSTRUMENT.
IMPIEGO
QUALORA QUESTO STRUMENTO VENISSE UTILIZZATO IN MODO DIVERSO DA
COME SPECIFICATO DAL PRODUTTORE LA PROZIONE DI SICUREZZA
POTREBBE VENIRNE COMPROMESSA.
v
Page 6

SERVICE
SERVICING INSTRUCTIONS ARE FOR USE BY SERVICE - TRAINED
PERSONNEL ONLY. TO AVOID DANGEROUS ELECTRIC SHOCK, DO NOT
PERFORM ANY SERVICING UNLESS QUALIFIED TO DO SO.
SERVICIO
LAS INSTRUCCIONES DE SERVICIO SON PARA USO EXCLUSIVO DEL
PERSONAL DE SERVICIO CAPACITADO. PARA EVITAR EL PELIGRO DE
DESCARGAS ELÉCTRICAS, NO REALICE NINGÚN SERVICIO A MENOS QUE
ESTÉ CAPACITADO PARA HACERIO.
WARTUNG
ANWEISUNGEN FÜR DIE WARTUNG DES GERÄTES GELTEN NUR FÜR
GESCHULTES FACHPERSONAL.
ZUR VERMEIDUNG GEFÄHRLICHE, ELEKTRISCHE SCHOCKS, SIND
WARTUNGSARBEITEN AUSSCHLIEßLICH VON QUALIFIZIERTEM
SERVICEPERSONAL DURCHZUFÜHREN.
ENTRENTIEN
L’EMPLOI DES INSTRUCTIONS D’ENTRETIEN DOIT ÊTRE RÉSERVÉ AU
PERSONNEL FORMÉ AUX OPÉRATIONS D’ENTRETIEN. POUR PRÉVENIR UN
CHOC ÉLECTRIQUE DANGEREUX, NE PAS EFFECTUER D’ENTRETIEN SI L’ON
N’A PAS ÉTÉ QUALIFIÉ POUR CE FAIRE.
ASSISTENZA TECNICA
LE ISTRUZIONI RELATIVE ALL’ASSISTENZA SONO PREVISTE
ESCLUSIVAMENTE PER IL PERSONALE OPPORTUNAMENTE ADDESTRATO.
PER EVITARE PERICOLOSE SCOSSE ELETTRICHE NON EFFETTUARRE
ALCUNA RIPARAZIONE A MENO CHE QUALIFICATI A FARLA.
vi
Page 7

About This Manual
This manual covers the operating and maintenance instructions for the following models:
7001B200-1
Changes to this Manual
We have made every effort to ensure this manual is accurate. If you discover any errors, or if you
have suggestions for improving this manual, please send your comments to our Solon, Ohio factory. This manual may be periodically updated. When inquiring about updates to this manual
refer to the part number and revision on the title page.
Contents
Chapter Layout
Introduction - Introduces the external features and functions of the unit, equipment pro-
vided, and options available.
Installation - Provides information about connecting the instrument to your equipment.
Operating Instructions - All instructions necessary to operate the equipment are contained
in this chapter.
Maintenance - Parts lists and repair instructions are also in this chapter.
DeviceNet - Covers the operation and programming nuances of DeviceNet.
vii
Page 8

Table of Contents
Safety Precautions . . . . . . . . . . . . . . . . . . . . . . . . . . . . . . . . . . . . . . . . . . . . . . . . . . . . . . . . iii
Safety Symbols . . . . . . . . . . . . . . . . . . . . . . . . . . . . . . . . . . . . . . . . . . . . . . . . . . . . . . . . . . . . . . . . . . . . iv
Warning Statements . . . . . . . . . . . . . . . . . . . . . . . . . . . . . . . . . . . . . . . . . . . . . . . . . . . . . . . . . . . . . . . . iv
Caution Statements . . . . . . . . . . . . . . . . . . . . . . . . . . . . . . . . . . . . . . . . . . . . . . . . . . . . . . . . . . . . . . . . iv
Safety Statements . . . . . . . . . . . . . . . . . . . . . . . . . . . . . . . . . . . . . . . . . . . . . . . . . . . . . . . . . . . . . . . . . . .v
About This Manual . . . . . . . . . . . . . . . . . . . . . . . . . . . . . . . . . . . . . . . . . . . . . . . . . . . . . . . .vii
Changes to this Manual . . . . . . . . . . . . . . . . . . . . . . . . . . . . . . . . . . . . . . . . . . . . . . . . . . . . . . . . . . . . .vii
Contents . . . . . . . . . . . . . . . . . . . . . . . . . . . . . . . . . . . . . . . . . . . . . . . . . . . . . . . . . . . . . . . . . . . . . . . . .vii
Chapter Layout . . . . . . . . . . . . . . . . . . . . . . . . . . . . . . . . . . . . . . . . . . . . . . . . . . . . . . . . . . . . . . . . .vii
Chapter 1 Introduction. . . . . . . . . . . . . . . . . . . . . . . . . . . . . . . . . . . . . . . . . . . . . . . . . . . . . . 1
Bird Diagnostic System (BDS) . . . . . . . . . . . . . . . . . . . . . . . . . . . . . . . . . . . . . . . . . . . . . . . . . . . . . . . . . 1
Standard Tracking Mode . . . . . . . . . . . . . . . . . . . . . . . . . . . . . . . . . . . . . . . . . . . . . . . . . . . . . . . . . . . . 1
Spectral Search (Sweep) Operating Mode . . . . . . . . . . . . . . . . . . . . . . . . . . . . . . . . . . . . . . . . . . . . . . 2
Arc Detection . . . . . . . . . . . . . . . . . . . . . . . . . . . . . . . . . . . . . . . . . . . . . . . . . . . . . . . . . . . . . . . . . . . . . . 2
BDS Sensors . . . . . . . . . . . . . . . . . . . . . . . . . . . . . . . . . . . . . . . . . . . . . . . . . . . . . . . . . . . . . . . . . . . . . . . 2
Items Supplied . . . . . . . . . . . . . . . . . . . . . . . . . . . . . . . . . . . . . . . . . . . . . . . . . . . . . . . . . . . . . . . . . . . . . 3
Communication Options . . . . . . . . . . . . . . . . . . . . . . . . . . . . . . . . . . . . . . . . . . . . . . . . . . . . . . . . . . . . . 3
Theory of Operation . . . . . . . . . . . . . . . . . . . . . . . . . . . . . . . . . . . . . . . . . . . . . . . . . . . . . . . . . . . . . . . . 3
Chapter 2 Installation. . . . . . . . . . . . . . . . . . . . . . . . . . . . . . . . . . . . . . . . . . . . . . . . . . . . . . . 5
Unpacking and Inspection . . . . . . . . . . . . . . . . . . . . . . . . . . . . . . . . . . . . . . . . . . . . . . . . . . . . . . . . . . . 5
Installing the Receiver . . . . . . . . . . . . . . . . . . . . . . . . . . . . . . . . . . . . . . . . . . . . . . . . . . . . . . . . . . . . . . 5
Installing the Sensor . . . . . . . . . . . . . . . . . . . . . . . . . . . . . . . . . . . . . . . . . . . . . . . . . . . . . . . . . . . . . . . . 6
Connecting the Sensor and Receiver Cables . . . . . . . . . . . . . . . . . . . . . . . . . . . . . . . . . . . . . . . . . . . . . 7
Installing the BDS Graphical User Interface Application . . . . . . . . . . . . . . . . . . . . . . . . . . . . . . . . . . . 7
Chapter 3 Operating Instructions. . . . . . . . . . . . . . . . . . . . . . . . . . . . . . . . . . . . . . . . . . . . . 9
Overview . . . . . . . . . . . . . . . . . . . . . . . . . . . . . . . . . . . . . . . . . . . . . . . . . . . . . . . . . . . . . . . . . . . . . . . . . 9
Setting Up the BDS . . . . . . . . . . . . . . . . . . . . . . . . . . . . . . . . . . . . . . . . . . . . . . . . . . . . . . . . . . . . . . . . . 9
Configuring Network Settings . . . . . . . . . . . . . . . . . . . . . . . . . . . . . . . . . . . . . . . . . . . . . . . . . . . . . 9
Restoring PC Network Connection to Use DHCP . . . . . . . . . . . . . . . . . . . . . . . . . . . . . . . . . . . . . . 9
Establishing a Connection to the BDS Receiver . . . . . . . . . . . . . . . . . . . . . . . . . . . . . . . . . . . . . . . . . 10
Connection Options . . . . . . . . . . . . . . . . . . . . . . . . . . . . . . . . . . . . . . . . . . . . . . . . . . . . . . . . . . . . 10
Applying Power . . . . . . . . . . . . . . . . . . . . . . . . . . . . . . . . . . . . . . . . . . . . . . . . . . . . . . . . . . . . . . . . 11
Controls and Indicators . . . . . . . . . . . . . . . . . . . . . . . . . . . . . . . . . . . . . . . . . . . . . . . . . . . . . . . . . . . . 12
Connector Panel . . . . . . . . . . . . . . . . . . . . . . . . . . . . . . . . . . . . . . . . . . . . . . . . . . . . . . . . . . . . . . . 12
Status LEDs . . . . . . . . . . . . . . . . . . . . . . . . . . . . . . . . . . . . . . . . . . . . . . . . . . . . . . . . . . . . . . . . . . . 13
BDS GUI Interface Detail . . . . . . . . . . . . . . . . . . . . . . . . . . . . . . . . . . . . . . . . . . . . . . . . . . . . . . . . . . . . 14
Menu Bar . . . . . . . . . . . . . . . . . . . . . . . . . . . . . . . . . . . . . . . . . . . . . . . . . . . . . . . . . . . . . . . . . . . . . 14
File . . . . . . . . . . . . . . . . . . . . . . . . . . . . . . . . . . . . . . . . . . . . . . . . . . . . . . . . . . . . . . . . . . . . . . . . . 14
Connection . . . . . . . . . . . . . . . . . . . . . . . . . . . . . . . . . . . . . . . . . . . . . . . . . . . . . . . . . . . . . . . . . . 14
Mode . . . . . . . . . . . . . . . . . . . . . . . . . . . . . . . . . . . . . . . . . . . . . . . . . . . . . . . . . . . . . . . . . . . . . . . 14
View . . . . . . . . . . . . . . . . . . . . . . . . . . . . . . . . . . . . . . . . . . . . . . . . . . . . . . . . . . . . . . . . . . . . . . . 15
Window . . . . . . . . . . . . . . . . . . . . . . . . . . . . . . . . . . . . . . . . . . . . . . . . . . . . . . . . . . . . . . . . . . . . . 15
Tools . . . . . . . . . . . . . . . . . . . . . . . . . . . . . . . . . . . . . . . . . . . . . . . . . . . . . . . . . . . . . . . . . . . . . . . 15
Help . . . . . . . . . . . . . . . . . . . . . . . . . . . . . . . . . . . . . . . . . . . . . . . . . . . . . . . . . . . . . . . . . . . . . . . . 15
Toolbars . . . . . . . . . . . . . . . . . . . . . . . . . . . . . . . . . . . . . . . . . . . . . . . . . . . . . . . . . . . . . . . . . . . . . . 16
Standard . . . . . . . . . . . . . . . . . . . . . . . . . . . . . . . . . . . . . . . . . . . . . . . . . . . . . . . . . . . . . . . . . . . . 16
Connection . . . . . . . . . . . . . . . . . . . . . . . . . . . . . . . . . . . . . . . . . . . . . . . . . . . . . . . . . . . . . . . . . . 16
Scan . . . . . . . . . . . . . . . . . . . . . . . . . . . . . . . . . . . . . . . . . . . . . . . . . . . . . . . . . . . . . . . . . . . . . . . . 16
Graph . . . . . . . . . . . . . . . . . . . . . . . . . . . . . . . . . . . . . . . . . . . . . . . . . . . . . . . . . . . .
Options . . . . . . . . . . . . . . . . . . . . . . . . . . . . . . . . . . . . . . . . . . . . . . . . . . . . . . . . . . . . . . . . . . . . . 16
. . . . . . . . . . 16
viii
Page 9

Status Bars . . . . . . . . . . . . . . . . . . . . . . . . . . . . . . . . . . . . . . . . . . . . . . . . . . . . . . . . . . . . . . . . . . . . 17
Main . . . . . . . . . . . . . . . . . . . . . . . . . . . . . . . . . . . . . . . . . . . . . . . . . . . . . . . . . . . . . . . . . . . . . . . . 17
View . . . . . . . . . . . . . . . . . . . . . . . . . . . . . . . . . . . . . . . . . . . . . . . . . . . . . . . . . . . . . . . . . . . . . . . . 17
Setting Up the BDS GUI Application . . . . . . . . . . . . . . . . . . . . . . . . . . . . . . . . . . . . . . . . . . . . . . . . . . . 17
Using Standard Tracking Mode . . . . . . . . . . . . . . . . . . . . . . . . . . . . . . . . . . . . . . . . . . . . . . . . . . . . . . 18
Setting the Minimum Configuration . . . . . . . . . . . . . . . . . . . . . . . . . . . . . . . . . . . . . . . . . . . . . . . 18
Acquiring Fresh Data . . . . . . . . . . . . . . . . . . . . . . . . . . . . . . . . . . . . . . . . . . . . . . . . . . . . . . . . . . . . 19
Stopping the Data Acquisition . . . . . . . . . . . . . . . . . . . . . . . . . . . . . . . . . . . . . . . . . . . . . . . . . . . . 19
Saving the Document . . . . . . . . . . . . . . . . . . . . . . . . . . . . . . . . . . . . . . . . . . . . . . . . . . . . . . . . . . . 19
Viewing the Data . . . . . . . . . . . . . . . . . . . . . . . . . . . . . . . . . . . . . . . . . . . . . . . . . . . . . . . . . . . . . . . 20
Table View\ . . . . . . . . . . . . . . . . . . . . . . . . . . . . . . . . . . . . . . . . . . . . . . . . . . . . . . . . . . . . . . . . . . 20
Time Plot View . . . . . . . . . . . . . . . . . . . . . . . . . . . . . . . . . . . . . . . . . . . . . . . . . . . . . . . . . . . . . . . 21
Reconstructed Waveform View . . . . . . . . . . . . . . . . . . . . . . . . . . . . . . . . . . . . . . . . . . . . . . . . . 21
Smith Chart View . . . . . . . . . . . . . . . . . . . . . . . . . . . . . . . . . . . . . . . . . . . . . . . . . . . . . . . . . . . . . 22
Using Spectral Search (Sweep) Mode . . . . . . . . . . . . . . . . . . . . . . . . . . . . . . . . . . . . . . . . . . . . . . . . . 22
Setting the Minimum Configuration . . . . . . . . . . . . . . . . . . . . . . . . . . . . . . . . . . . . . . . . . . . . . . . 22
Acquiring Fresh Data . . . . . . . . . . . . . . . . . . . . . . . . . . . . . . . . . . . . . . . . . . . . . . . . . . . . . . . . . . . . 22
Stopping Data Acquisition . . . . . . . . . . . . . . . . . . . . . . . . . . . . . . . . . . . . . . . . . . . . . . . . . . . . . . . 22
Saving the Document . . . . . . . . . . . . . . . . . . . . . . . . . . . . . . . . . . . . . . . . . . . . . . . . . . . . . . . . . . . 23
Viewing the Data . . . . . . . . . . . . . . . . . . . . . . . . . . . . . . . . . . . . . . . . . . . . . . . . . . . . . . . . . . . . . . . 23
Viewing Data in the Frequency Domain . . . . . . . . . . . . . . . . . . . . . . . . . . . . . . . . . . . . . . . . . . . 23
Viewing Data in a Table of Peaks . . . . . . . . . . . . . . . . . . . . . . . . . . . . . . . . . . . . . . . . . . . . . . . . 24
Viewing Captured Data Using MS Excel . . . . . . . . . . . . . . . . . . . . . . . . . . . . . . . . . . . . . . . . . . . . . . . . 25
CSV File Format Description . . . . . . . . . . . . . . . . . . . . . . . . . . . . . . . . . . . . . . . . . . . . . . . . . . . . . . 25
Scan Mode Options . . . . . . . . . . . . . . . . . . . . . . . . . . . . . . . . . . . . . . . . . . . . . . . . . . . . . . . . . . . . . . . . 27
Standard Tracking Mode Options . . . . . . . . . . . . . . . . . . . . . . . . . . . . . . . . . . . . . . . . . . . . . . . . . 27
Frequency Selection . . . . . . . . . . . . . . . . . . . . . . . . . . . . . . . . . . . . . . . . . . . . . . . . . . . . . . . . . . . 27
Analog I/O . . . . . . . . . . . . . . . . . . . . . . . . . . . . . . . . . . . . . . . . . . . . . . . . . . . . . . . . . . . . . . . . . . . 28
Averaging . . . . . . . . . . . . . . . . . . . . . . . . . . . . . . . . . . . . . . . . . . . . . . . . . . . . . . . . . . . . . . . . . . . 29
De-embedding . . . . . . . . . . . . . . . . . . . . . . . . . . . . . . . . . . . . . . . . . . . . . . . . . . . . . . . . . . . . . . . 30
Misc . . . . . . . . . . . . . . . . . . . . . . . . . . . . . . . . . . . . . . . . . . . . . . . . . . . . . . . . . . . . . . . . . . . . . . . . 31
Free Run . . . . . . . . . . . . . . . . . . . . . . . . . . . . . . . . . . . . . . . . . . . . . . . . . . . . . . . . . . . . . . . . . . . . 31
Trigger . . . . . . . . . . . . . . . . . . . . . . . . . . . . . . . . . . . . . . . . . . . . . . . . . . . . . . . . . . . . . . . . . . . . . . 32
Auto-Save . . . . . . . . . . . . . . . . . . . . . . . . . . . . . . . . . . . . . . . . . . . . . . . . . . . . . . . . . . . . . . . . . . . 32
Arc Detection . . . . . . . . . . . . . . . . . . . . . . . . . . . . . . . . . . . . . . . . . . . . . . . . . . . . . . . . . . . . . . . . 33
Spectral Search (Sweep) Mode Options . . . . . . . . . . . . . . . . . . . . . . . . . . . . . . . . . . . . . . . . . . . . 34
Sweep . . . . . . . . . . . . . . . . . . . . . . . . . . . . . . . . . . . . . . . . . . . . . . . . . . . . . . . . . . . . . . . . . . . . . . 34
Averaging . . . . . . . . . . . . . . . . . . . . . . . . . . . . . . . . . . . . . . . . . . . . . . . . . . . . . . . . . . . . . . . . . . . 35
Smoothing . . . . . . . . . . . . . . . . . . . . . . . . . . . . . . . . . . . . . . . . . . . . . . . . . . . . . . . . . . . . . . . . . . . 35
Peak Locator . . . . . . . . . . . . . . . . . . . . . . . . . . . . . . . . . . . . . . . . . . . . . . . . . . . . . . . . . . . . . . . . . 36
Graph Options . . . . . . . . . . . . . . . . . . . . . . . . . . . . . . . . . . . . . . . . . . . . . . . . . . . . . . . . . . . . . . . 36
Auto-Save & Arc Detection . . . . . . . . . . . . . . . . . . . . . . . . . . . . . . . . . . . . . . . . . . . . . . . . . . . . . 36
Chapter 4 Maintenance . . . . . . . . . . . . . . . . . . . . . . . . . . . . . . . . . . . . . . . . . . . . . . . . . . . . 37
Cleaning . . . . . . . . . . . . . . . . . . . . . . . . . . . . . . . . . . . . . . . . . . . . . . . . . . . . . . . . . . . . . . . . . . . . . . . . . 37
Updating BDS Software . . . . . . . . . . . . . . . . . . . . . . . . . . . . . . . . . . . . . . . . . . . . . . . . . . . . . . . . . . . . . 37
Troubleshooting . . . . . . . . . . . . . . . . . . . . . . . . . . . . . . . . . . . . . . . . . . . . . . . . . . . . . . . . . . . . . . . . . . 38
Health LED Codes . . . . . . . . . . . . . . . . . . . . . . . . . . . . . . . . . . . . . . . . . . . . . . . . . . . . . . . . . . . . . . 38
Specifications . . . . . . . . . . . . . . . . . . . . . . . . . . . . . . . . . . . . . . . . . . . . . . . . . . . . . . . . . . . . . . . . . . . . . 40
Voltage, Current and Phase Measurement Characteristics . . . . . . . . . . . . . . . . . . . . . . . . . . . . . . . . 41
Physical and Environmental . . . . . . . . . . . . . . . . . . . . . . . . . . . . . . . . . . . . . . . . . . . . . . . . . .
Indicators and Connectors . . . . . . . . . . . . . . . . . . . . . . . . . . . . . . . . . . . . . . . . . . . . . . . . . . . . . . . . . . 43
Data Outputs . . . . . . . . . . . . . . . . . . . . . . . . . . . . . . . . . . . . . . . . . . . . . . . . . . . . . . . . . . . . . . . . . . . . . 44
Tabular Display . . . . . . . . . . . . . . . . . . . . . . . . . . . . . . . . . . . . . . . . . . . . . . . . . . . . . . . . . . . . . . . . 44
Graphical Display . . . . . . . . . . . . . . . . . . . . . . . . . . . . . . . . . . . . . . . . . . . . . . . . . . . . . . . . . . . . . . . 44
. . . . . . . 42
ix
Page 10

Optional Accessories . . . . . . . . . . . . . . . . . . . . . . . . . . . . . . . . . . . . . . . . . . . . . . . . . . . . . . . . . . . . . . . 45
QC Connectors . . . . . . . . . . . . . . . . . . . . . . . . . . . . . . . . . . . . . . . . . . . . . . . . . . . . . . . . . . . . . . . . 45
Specifications, DeviceNet . . . . . . . . . . . . . . . . . . . . . . . . . . . . . . . . . . . . . . . . . . . . . . . . . . . . . . . . . . . 47
Protocol . . . . . . . . . . . . . . . . . . . . . . . . . . . . . . . . . . . . . . . . . . . . . . . . . . . . . . . . . . . . . . . . . . . . . . 47
Specification for DeviceNet "Custom Profile" . . . . . . . . . . . . . . . . . . . . . . . . . . . . . . . . . . . . . . . 47
DeviceNet Communication Interface Guide . . . . . . . . . . . . . . . . . . . . . . . . . . . . . . . . . . . . . . . . . . . . 48
Customer Service . . . . . . . . . . . . . . . . . . . . . . . . . . . . . . . . . . . . . . . . . . . . . . . . . . . . . . . . . . . . . . . . . 49
Chapter 5 DeviceNet . . . . . . . . . . . . . . . . . . . . . . . . . . . . . . . . . . . . . . . . . . . . . . . . . . . . . .51
Introduction . . . . . . . . . . . . . . . . . . . . . . . . . . . . . . . . . . . . . . . . . . . . . . . . . . . . . . . . . . . . . . . . . . . . . . 51
Definitions . . . . . . . . . . . . . . . . . . . . . . . . . . . . . . . . . . . . . . . . . . . . . . . . . . . . . . . . . . . . . . . . . . . . 51
Reference Documents . . . . . . . . . . . . . . . . . . . . . . . . . . . . . . . . . . . . . . . . . . . . . . . . . . . . . . . . . . 51
Open DeviceNet Vendor Association, Inc. (ODVA) . . . . . . . . . . . . . . . . . . . . . . . . . . . . . . . . . . . . 51
DeviceNet System Operation . . . . . . . . . . . . . . . . . . . . . . . . . . . . . . . . . . . . . . . . . . . . . . . . . . . . . . . . 51
MAC ID & Baud Rate Configuration . . . . . . . . . . . . . . . . . . . . . . . . . . . . . . . . . . . . . . . . . . . . . . . . 51
LED Operation . . . . . . . . . . . . . . . . . . . . . . . . . . . . . . . . . . . . . . . . . . . . . . . . . . . . . . . . . . . . . . . . . 52
DeviceNet Pin Assignment . . . . . . . . . . . . . . . . . . . . . . . . . . . . . . . . . . . . . . . . . . . . . . . . . . . . . . . . . . 53
DeviceNet Interface . . . . . . . . . . . . . . . . . . . . . . . . . . . . . . . . . . . . . . . . . . . . . . . . . . . . . . . . . . . . . . . 53
Overview . . . . . . . . . . . . . . . . . . . . . . . . . . . . . . . . . . . . . . . . . . . . . . . . . . . . . . . . . . . . . . . . . . . . . 53
Configuration . . . . . . . . . . . . . . . . . . . . . . . . . . . . . . . . . . . . . . . . . . . . . . . . . . . . . . . . . . . . . . . . . . 53
Initialization . . . . . . . . . . . . . . . . . . . . . . . . . . . . . . . . . . . . . . . . . . . . . . . . . . . . . . . . . . . . . . . . . . . 54
Group 2 Only Slave Operation . . . . . . . . . . . . . . . . . . . . . . . . . . . . . . . . . . . . . . . . . . . . . . . . . . . . 54
Certification . . . . . . . . . . . . . . . . . . . . . . . . . . . . . . . . . . . . . . . . . . . . . . . . . . . . . . . . . . . . . . . . . . . 54
BDS Object Model . . . . . . . . . . . . . . . . . . . . . . . . . . . . . . . . . . . . . . . . . . . . . . . . . . . . . . . . . . . . . . . . . 54
Overview . . . . . . . . . . . . . . . . . . . . . . . . . . . . . . . . . . . . . . . . . . . . . . . . . . . . . . . . . . . . . . . . . . . . . 54
Identity Object – Class Code: 1 (01HEX) . . . . . . . . . . . . . . . . . . . . . . . . . . . . . . . . . . . . . . . . . . . . . . . 55
Message Router Object – Class Code: 2 (02HEX) . . . . . . . . . . . . . . . . . . . . . . . . . . . . . . . . . . . . . . . . 56
DeviceNet Object – Class Code: 3 (03HEX) . . . . . . . . . . . . . . . . . . . . . . . . . . . . . . . . . . . . . . . . . . . . . 56
Assembly Object – Class Code: 4 (04HEX) . . . . . . . . . . . . . . . . . . . . . . . . . . . . . . . . . . . . . . . . . . . . . . 58
Assembly Instance 100 (64HEX) – BDS Standard Mode Data . . . . . . . . . . . . . . . . . . . . . . . . . . . 59
Assembly Instance 100 (64HEX) Attributes (Input Assembly) . . . . . . . . . . . . . . . . . . . . . . . . . . . 59
Assembly 100 (64HEX) Instance Byte Mapping . . . . . . . . . . . . . . . . . . . . . . . . . . . . . . . . . . . . . . 59
Assembly Sample Configuration and Byte Mapping . . . . . . . . . . . . . . . . . . . . . . . . . . . . . . . . . . 61
Assembly Byte Mapping Spreadsheet . . . . . . . . . . . . . . . . . . . . . . . . . . . . . . . . . . . . . . . . . . . . . . 61
Assembly Instance 101 (65HEX) – “Common Assembly Data” . . . . . . . . . . . . . . . . . . . . . . . . . . 62
Connection Object – Class Code: 5 (05HEX) . . . . . . . . . . . . . . . . . . . . . . . . . . . . . . . . . . . . . . . . . . . . 64
S-Device Supervisor – Class Code: 48 (30HEX) . . . . . . . . . . . . . . . . . . . . . . . . . . . . . . . . . . . . . . . . . . 66
Component Object – Class Code: 100 (64HEX) . . . . . . . . . . . . . . . . . . . . . . . . . . . . . . . . . . . . . . . . . . 67
S-Device Supervisor – Class Code: 48 (30HEX) . . . . . . . . . . . . . . . . . . . . . . . . . . . . . . . . . . . . . . . . . . 68
Component Object – Class Code: 100 (64HEX) . . . . . . . . . . . . . . . . . . . . . . . . . . . . . . . . . . . . . . . . . . 69
Application Object – Class Code: 101 (65HEX) . . . . . . . . . . . . . . . . . . . . . . . . . . . . . . . . . . . . . . . . . . 70
Attenuation Control Object – Class Code: 104 (68HEX) . . . . . . . . . . . . . . . . . . . . . . . . . . . . . . . . . . . 71
Standard Mode Object – Class Code: 105 (69HEX) . . . . . . . . . . . . . . . . . . . . . . . . . . . . . . . . . . . . . . 72
Standard Mode Data Structures . . . . . . . . . . . . . . . . . . . . . . . . . . . . . . . . . . . . . . . . . . . . . . . . . . 75
Fundamental – Search frequency selection parameters . . . . . . . . . . . . . . . . . . . . . . . . . . . . . . . 75
VIMeas – Single BDS V & I measurement result. . . . . . . . . . . . . . . . . . . . . . . . . . . . . . . . . . . . . . 79
Data Types . . . . . . . . . . . . . . . . . . . . . . . . . . . . . . . . . . . . . . . . . . . . . . . . . . . . . . . . . . . . . . . . . . . . . . . 80
Constants And Data Structures . . . . . . . . . . . . . . . . . . . . . . . . . . . . . . . . . . . . . . . . . . . . . . . . . . . . . . 81
Limited Warranty . . . . . . . . . . . . . . . . . . . . . . . . . . . . . . . . . . . . . . . . . . . . . . . . . . . . . . .
x
. .83
Page 11

xi
Page 12

List of Tables
Table 3-1 Standard Tracking Mode CSV Format Description . . . . . . . . . . . . . . . . . . 25
Table 3-2 Spectral Search Mode CSV Format Description . . . . . . . . . . . . . . . . . . . . 26
Table 3-3 Arc Detect CSV Format Description . . . . . . . . . . . . . . . . . . . . . . . . . . . . . . 26
Table 5-1 Network Status LED Operation (NET) . . . . . . . . . . . . . . . . . . . . . . . . . . . . . 52
Table 5-2 Module Status LED Operation (MOD) –
Corresponds to the Status attribute of the Identity Object . . . . . . . . . . . 53
Table 5-3 Group 2 Only Slave Operation . . . . . . . . . . . . . . . . . . . . . . . . . . . . . . . . . . 54
Table 5-4 Identity Class Attributes (Instance 0) . . . . . . . . . . . . . . . . . . . . . . . . . . . . . 55
Table 5-5 Identity Instance Attributes (Instance 1) . . . . . . . . . . . . . . . . . . . . . . . . . . 55
Table 5-6 Identity Status Word . . . . . . . . . . . . . . . . . . . . . . . . . . . . . . . . . . . . . . . . . . 55
Table 5-7 Identity Common Services . . . . . . . . . . . . . . . . . . . . . . . . . . . . . . . . . . . . .55
Table 5-8 Identity Object Instances . . . . . . . . . . . . . . . . . . . . . . . . . . . . . . . . . . . . . . 55
Table 5-9 Message Router Class Attributes (Instance 0) . . . . . . . . . . . . . . . . . . . . . . 56
Table 5-10 Message Router Instance Attributes (Instance 1) . . . . . . . . . . . . . . . . . . 56
Table 5-11 Message Router Common Services . . . . . . . . . . . . . . . . . . . . . . . . . . . . . 56
Table 5-12 Message Router Object Instances . . . . . . . . . . . . . . . . . . . . . . . . . . . . . . 56
Table 5-13 DeviceNet Class Attributes (Instance 0) . . . . . . . . . . . . . . . . . . . . . . . . . . 56
Table 5-14 DeviceNet Instance Attributes (Instance 1) . . . . . . . . . . . . . . . . . . . . . . . 57
Table 5-15 DeviceNet Common Services . . . . . . . . . . . . . . . . . . . . . . . . . . . . . . . . . . 57
Table 5-16 DeviceNet Object Instances . . . . . . . . . . . . . . . . . . . . . . . . . . . . . . . . . . . 57
Table 5-17 Assembly Class Attributes (Instance 0) . . . . . . . . . . . . . . . . . . . . . . . . . . 58
Table 5-18 Assembly Instance 100 (64HEX) Data Attribute Mapping . . . . . . . . . . . 61
Table 5-19 Assembly Instance 101 (65HEX) Instance Attributes . . . . . . . . . . . . . . . 63
Table 5-20 Assembly Instance 101 (65HEX) Instance Component Mapping . . . . . . 64
Table 5-21 Assembly Common Services . . . . . . . . . . . . . . . . . . . . . . . . . . . . . . . . . . . 64
Table 5-22 Assembly Object Instances . . . . . . . . . . . . . . . . . . . . . . . . . . . . . . . . . . . .64
Table 5-23 Connection Class Attributes (Instance 0) . . . . . . . . . . . . . . . . . . . . . . . . . 64
Table 5-24 Connection Instance Attributes (Instance 1) . . . . . . . . . . . . . . . . . . . . . . 65
Table 5-25 Connection Common Services . . . . . . . . . . . . . . . . . . . . . . . . . . . . . . . . . 66
Table 5-26 Connection Object Instances . . . . . . . . . . . . . . . . . . . . . . . . . . . . . . . . . . 66
Table 5-27 Device Supervisor Class Attributes (Instance 0) . . . . . . . . . . . . . . . . . . . 66
Table 5-28 S-Device Supervisor Instance Attributes . . . . . . . . . . . . . . . . . . . . . . . . . 66
Table 5-29 S-Device Supervisor Common Services . . . . . . . . . . . . . . . . . . . . . . . . . . 67
Table 5-30 S-Device Supervisor Object Instances . . . . . . . . . . . . . . . . . . . . . . . . . . . 67
xii
Page 13

Table 5-31 Component Object Class Attributes (Instance 0) . . . . . . . . . . . . . . . . . . 67
Table 5-32 Component Object Instance Attributes . . . . . . . . . . . . . . . . . . . . . . . . . . 67
Table 5-33 Component Object Common Services . . . . . . . . . . . . . . . . . . . . . . . . . . . 67
Table 5-34 Component Object Instances . . . . . . . . . . . . . . . . . . . . . . . . . . . . . . . . . . 67
Table 5-35 S-Device Supervisor Class Attributes (Instance 0) . . . . . . . . . . . . . . . . . 68
Table 5-36 S-Device Supervisor Instance Attributes . . . . . . . . . . . . . . . . . . . . . . . . . 68
Table 5-37 S-Device Supervisor Common Services . . . . . . . . . . . . . . . . . . . . . . . . . . 68
Table 5-38 S-Device Supervisor Object Instances . . . . . . . . . . . . . . . . . . . . . . . . . . . 68
Table 5-39 Component Object Class Attributes (Instance 0) . . . . . . . . . . . . . . . . . . 69
Table 5-40 Component Object Instance Attributes . . . . . . . . . . . . . . . . . . . . . . . . . . 69
Table 5-41 Component Object Common Services . . . . . . . . . . . . . . . . . . . . . . . . . . . 69
Table 5-42 Component Object Instances . . . . . . . . . . . . . . . . . . . . . . . . . . . . . . . . . . 69
Table 5-43 Application Object Class Attributes (Instance 0) . . . . . . . . . . . . . . . . . . 70
Table 5-44 Application Object Instance Attributes . . . . . . . . . . . . . . . . . . . . . . . . . . 70
Table 5-45 Application Object Common Services . . . . . . . . . . . . . . . . . . . . . . . . . . . 70
Table 5-46 Application Object Instances . . . . . . . . . . . . . . . . . . . . . . . . . . . . . . . . . . 71
Table 5-47 Attenuation Control Class Attributes (Instance 0) . . . . . . . . . . . . . . . . . 71
Table 5-48 Attenuation Control Instance Attributes . . . . . . . . . . . . . . . . . . . . . . . . . 71
Table 5-49 Attenuation Control Common Services . . . . . . . . . . . . . . . . . . . . . . . . . . 71
Table 5-50 Attenuation Control Object Instances . . . . . . . . . . . . . . . . . . . . . . . . . . . 71
Table 5-51 Standard Mode Class Attributes (Instance 0) . . . . . . . . . . . . . . . . . . . . . 72
Table 5-52 Standard Mode Instance Attributes . . . . . . . . . . . . . . . . . . . . . . . . . . . . 74
Table 5-53 Standard Mode Common Services . . . . . . . . . . . . . . . . . . . . . . . . . . . . . . 74
Table 5-54 Standard Mode Object Instances . . . . . . . . . . . . . . . . . . . . . . . . . . . . . . . 75
Table 5-55 HarmSel – Harmonic Component
Selection Bitfield (16-bit WORD) . . . . . . . . . . . . . . . . . . . . . . . . . . . . . . . 76
Table 5-56 DACSel – DAC Selection Parameters . . . . . . . . . . . . . . . . . . . . . . . . . . . . 77
Table 5-57 DeeSegment – Transmission Line Segment
De-embedding Parameters . . . . . . . . . . . . . . . . . . . . . . . . . . . . . . . . . . . . 78
Table 5-58 DeeOpts - De-embedding Options Bitfield (8-bit BYTE) . . . . . . . . . . . . . 78
Table 5-59 CIP™ Elementary Data Types . . . . . . . . . . . . . . . . . . . . . . . . . . . . . . . . . . 80
Table 5-60 DATE_AND_TIME Encoding . . . . . . . . . . . . . . . . . . . . . . . . . . . . . . . . . . . 80
Table 5-61 SHORT_STRING Encoding . . . . . . . . . . . . . . . . . . . . . . . . . . . . . . . . . . . . . 80
Table 5-62 SHORT_STRING Example . . . . . . . . . . . . . . . . . . . . . . . . . . . . . . . . . . . . . . 80
Table 5-63 BDS System Status Bitfield . . . . . . . . . . . . . . . . . . . . . . . . . . . . . . . . . . . . 81
Table 5-64 Output Formats . . . . . . . . . . . . . . . . . . . . . . . . . . . . . . . . . . . . . . . . . . . . . 82
xiii
Page 14

xiv
Page 15

Chapter 1 Introduction
Bird Diagnostic System (BDS)
The Bird Diagnostic System (BDS) is a broadband (1 MHz to 500 MHz) RF monitoring and diagnostic system designed
to be used in a 50 or non-50 ohm environment. It is comprised of three components:
• In-line RF sensor
• A receiver that processes the real-time sensor data
• A cable that connects the sensor to the receiver
The sensor, which consists of passive, temperature stable components, is inserted into an RF delivery system where
it couples voltage and current signals and sends that data to the receiver through the cable assembly. The receiver
converts the incoming analog signal to digital data and then processes the data and makes it available to the communication port. The user’s system communicates with the receiver through the communication port.
There are two modes of operation:
• Standard Tracking Mode
• Spectral Search (Sweep) Mode
In both operating modes, there are two data monitoring modes:
• Low resolution data monitoring (8 bit ADC)
• High resolution data monitoring (12 bit ADC)
The BDS also has the capability to locate arc transients. These operating modes are explained in the following sections.
Standard Tracking Mode
In the Standard Tracking mode, the BDS collects voltage and current information for user specified fundamental frequencies. Up to five fundamental frequencies can be specified to monitor. For each fundamental frequency, up to 15
harmonic frequencies can also be monitored (in addition to the fundamental) and a subset of up to 6 mixing products can also be monitored. The BDS reports voltage amplitude, current amplitude, and phase information as a data
set for each specified fundamental frequency.
Example - Select 2 MHz as the first fundamental frequency (F1) and 13.56 MHz as the second fundamental frequency (F2), and specify two harmonics for F1 (H1 and H2) and one harmonic for F2 (H1), the results
would be grouped as a set for each fundamental frequency as shown in the following table (note that H0 is
the same as the fundamental frequency and that N represents the N
Dataset Fundamental Harmonic Data
1 F1 (2MHz) H0 (F1) 2.0MHz, V,I,phase
F1 (2MHz) H1 (2F1) 4.0MHz, V,I,phase
F1 (2MHz) H2 (3F1) 6.0MHz, V,I,phase
F2 (13.56MHz) H0 (F2) 13.56MHz, V,I,phase
F2 (13.56MHz) H2 (3F2) 40.68MHz, V,I,phase
…… … …
N F1 (2MHz) H0 (F1) 2.0MHz, V,I,phase
F1 (2MHz) H1 (2F1) 4.0MHz, V,I,phase
F1 (2MHz) H2 (3F1) 6.0MHz, V,I,phase
F2 (13.56MHz) H0 (F2) 13.56MHz, V,I,phase
F2 (13.56MHz) H2 (3F2) 40.68MHz, V,I,phase
:
th
data set).
1
Page 16
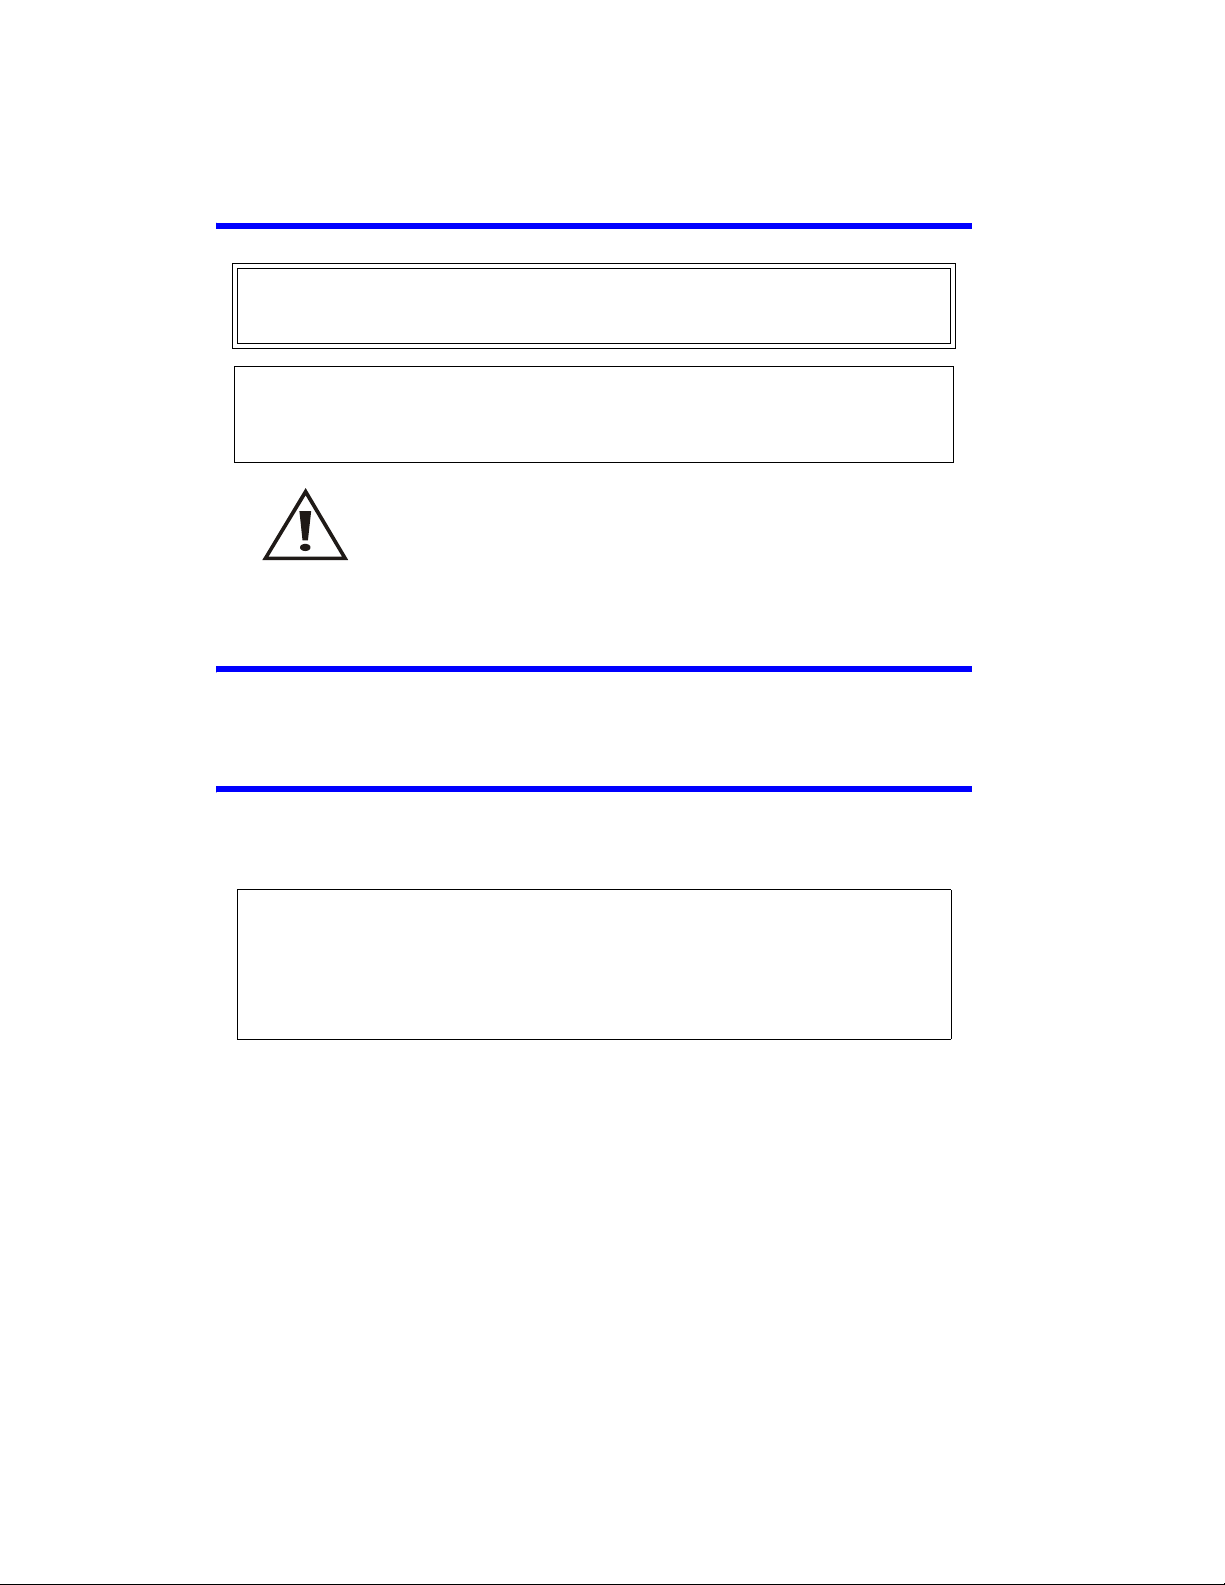
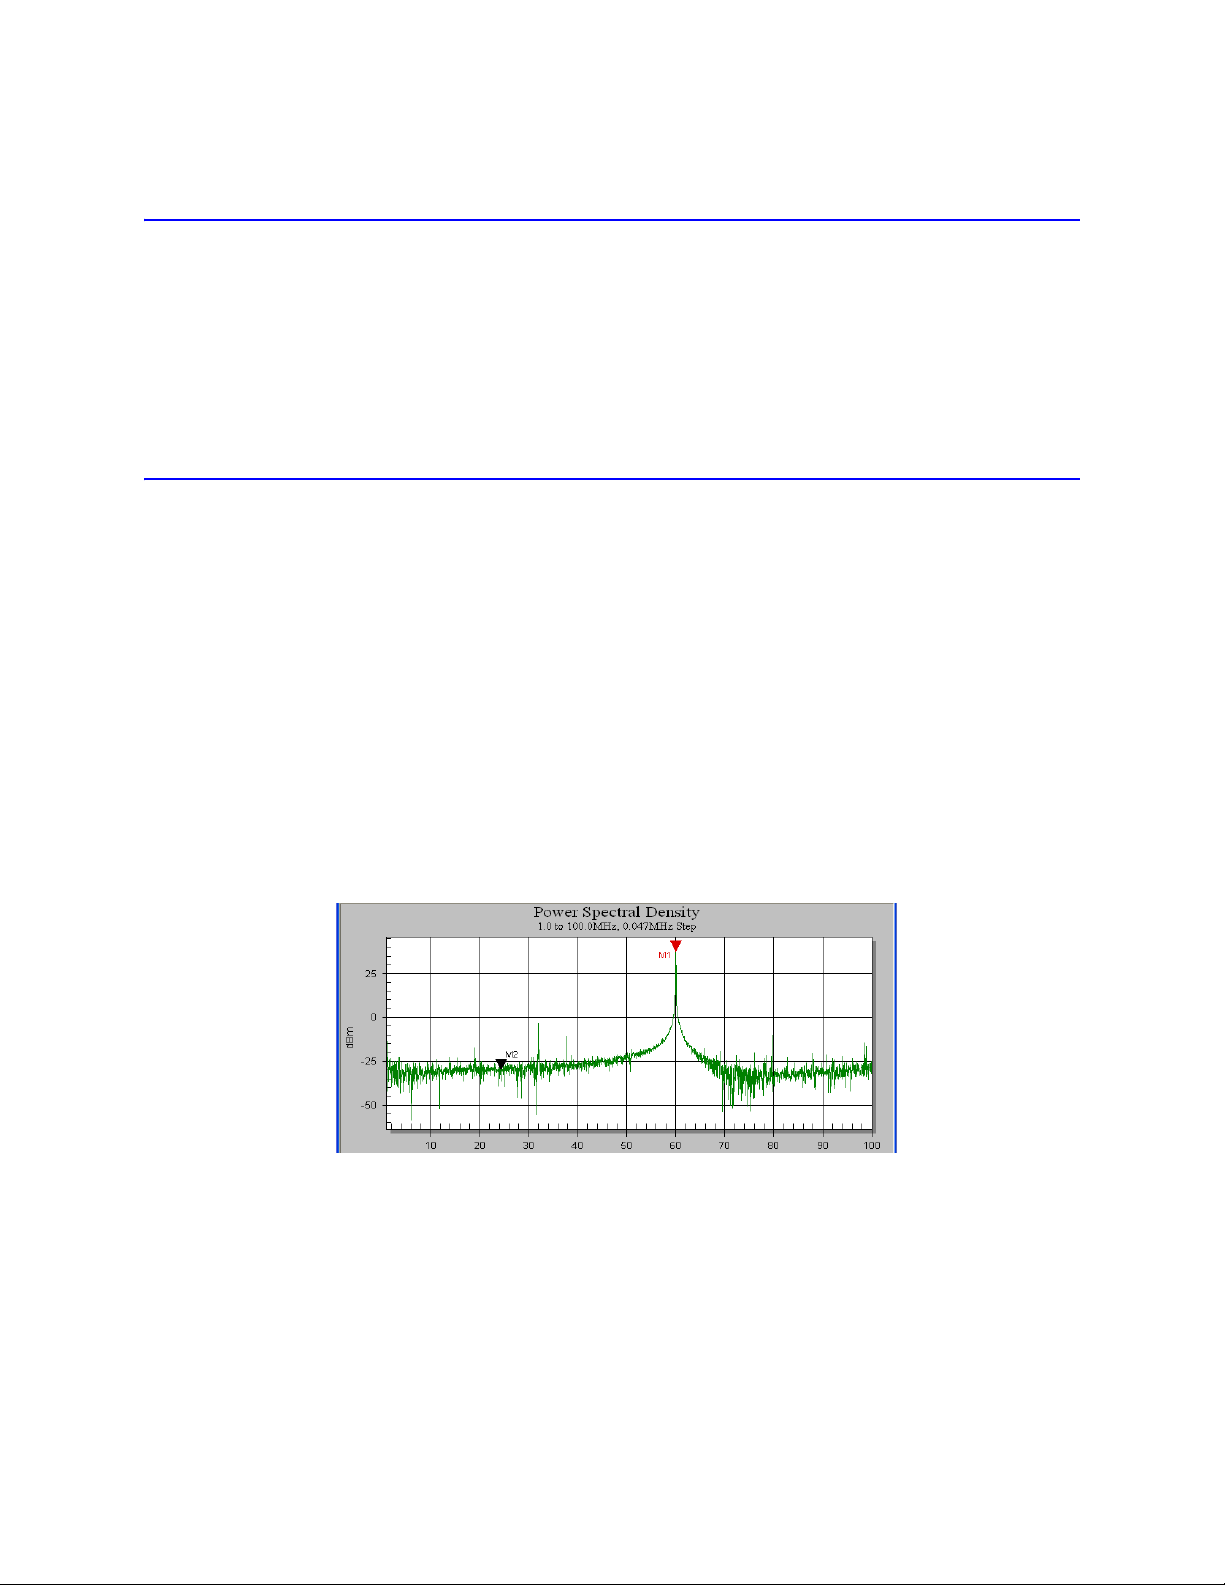
Spectral Search (Sweep) Operating Mode
The Spectral Search (Sweep) Mode is used to get an overall view of the spectral components in a given frequency band. It
sweeps across a frequency band, from start to stop frequency, displaying the amplitude at each frequency step.
The user defines the frequency band by entering a start frequency, a stop frequency, and a step increment. The BDS
produces power spectral density information for each detected frequency in the band in accordance with the step
increment value (Fig. 1).
Figure 1 Spectral Search (Sweep) Operating Mode
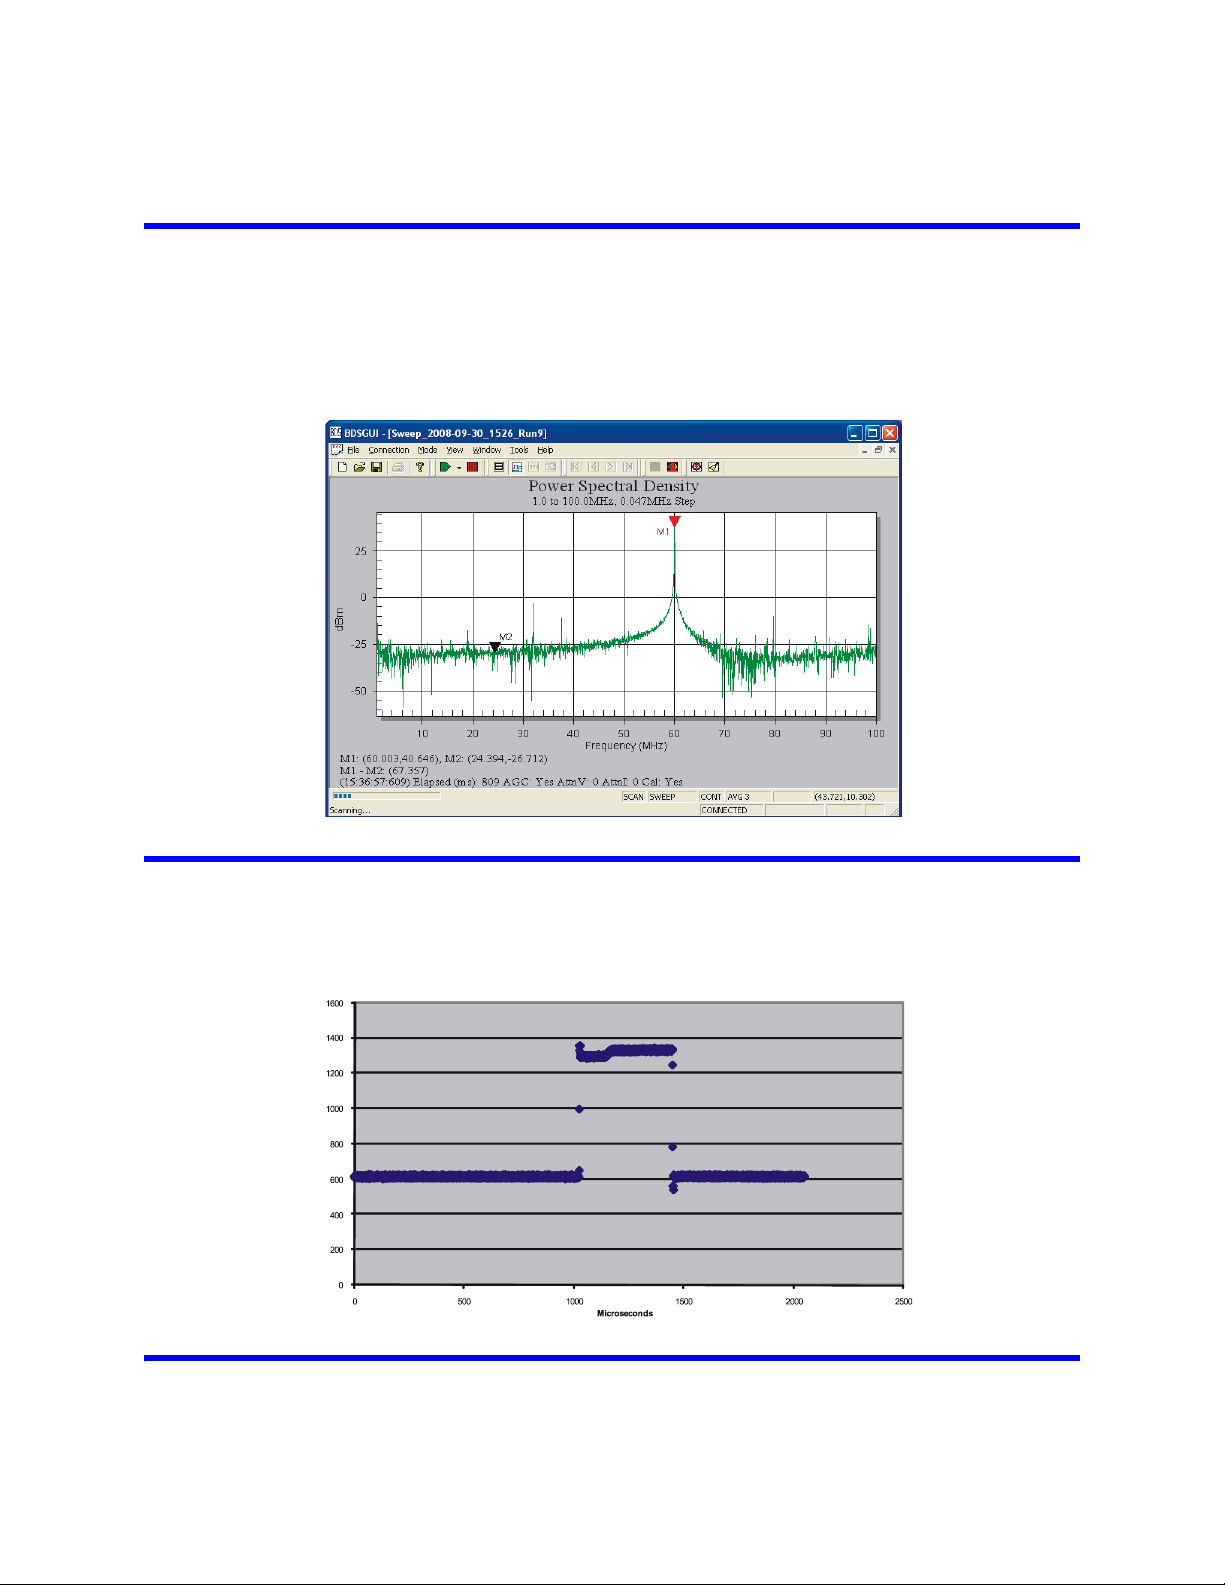
Arc Detection
The BDS has the ability to locate and report arc/transient events. The user can define the parameters of what a transient
may look like in their system, specifying arc length, and impulse change in dB. This feature is available in both Standard
Tracking and Spectral Search modes and in both 12-bit and 8-bit resolution.
Figure 2 Typical Arc Detection Image
.
BDS Sensors
The BDS requires a non-intrusive passive RF sensor. The sensor is purchased separately based upon the specifications of the end user’s requirements.
2
Page 17
Items Supplied
p vi θcos××=
Z vi÷θ∠=
• Receiver unit
• Instruction Manual
• BDS GUI Software
Communication Options
The Bird Diagnostic System offers the following methods of communication:
• BDS GUI
• DeviceNet
• Customer defined
Theory of Operation
The Bird Diagnostic System (BDS) is a real-time RF measurement system that consists of a sensor, a sensor cable, and a
receiver. The sensor is mounted in the host system’s RF delivery system where it simultaneously measures voltage and
current (both magnitude and phase of each) and sends the data to the receiver. Each component of the BDS (sensor,
sensor cable, receiver) is calibrated separately and contains its own calibration constants which permits interchangeability without recalibration. A sensor, sensor cable, or receiver can be replaced with minimal loss of accuracy.
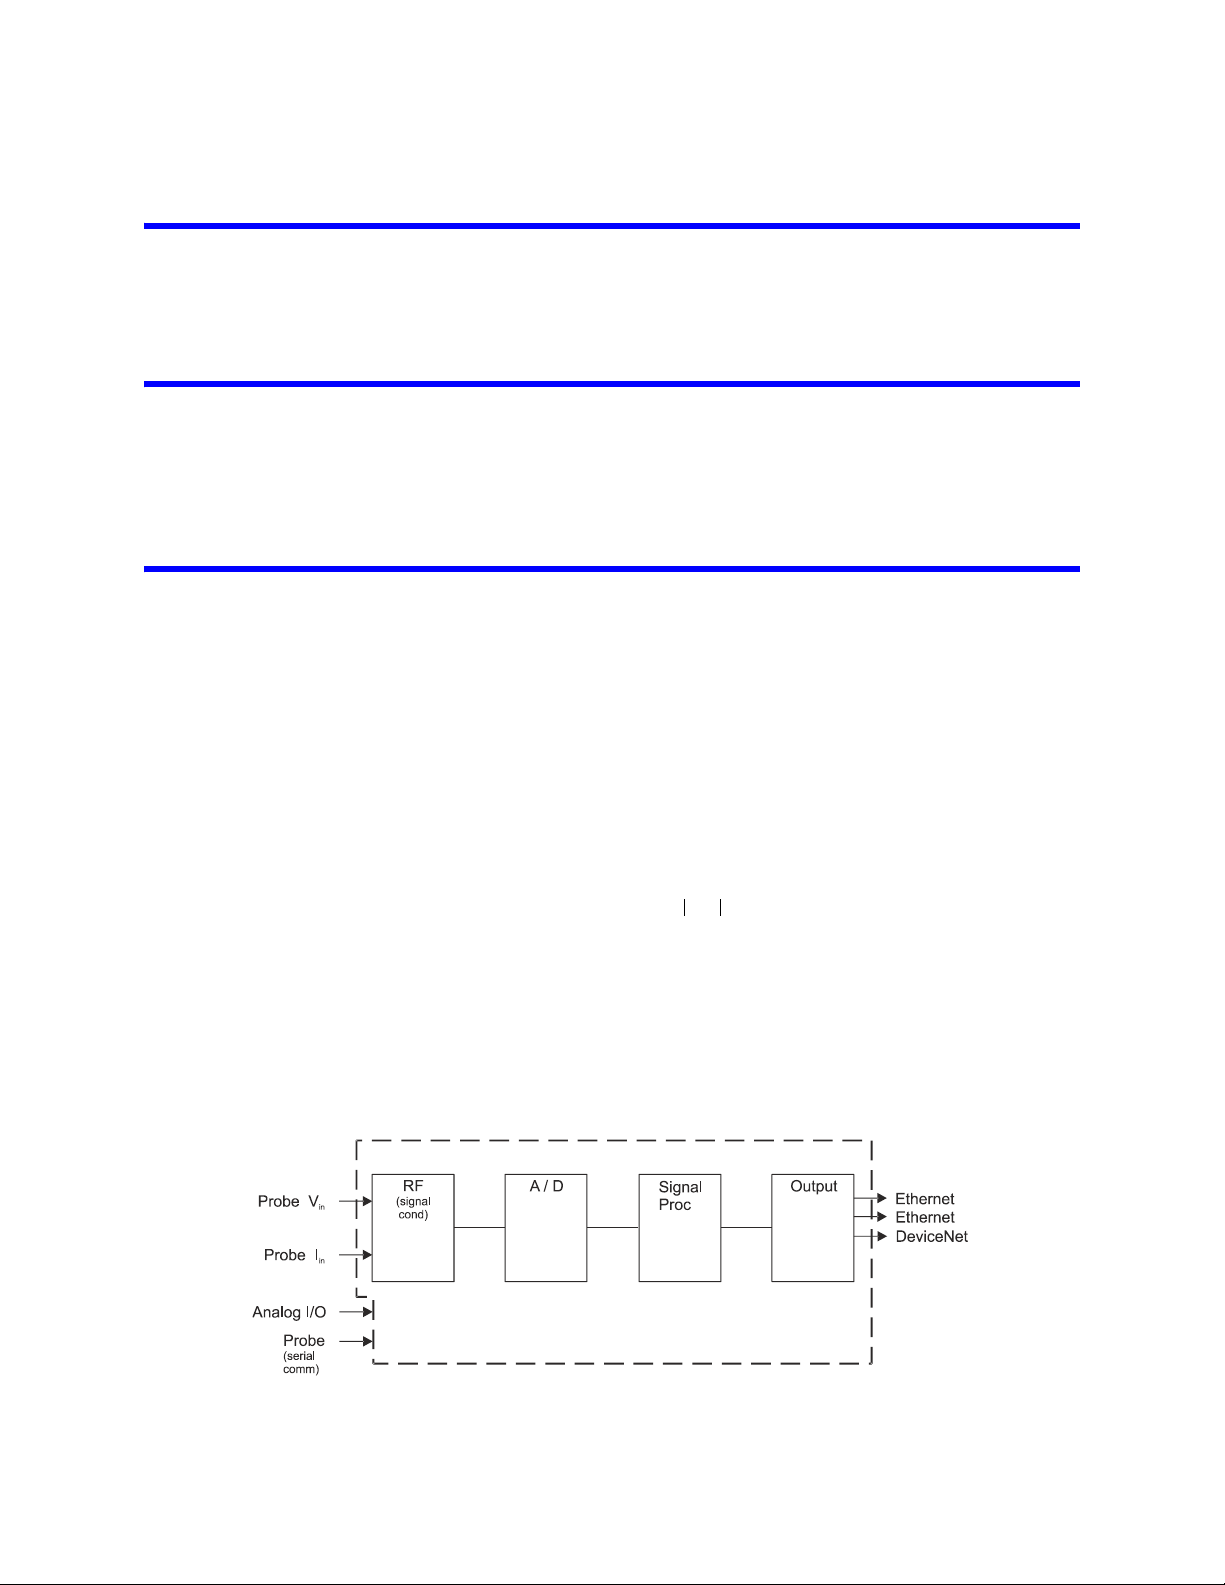
The receiver processes the sensor data and makes it available to the communication ports. The receiver consists of RF input
conditioning circuits, A/D converters, a high-speed signal processor, and input / output connectors (Figure 3, page 3).
The A/D converters convert the analog RF signal to digital information for processing; the high-speed signal processor converts the signal from the time domain to the frequency domain while maintaining the correct phase relationship of each harmonic to its fundamental frequency.
The output of the BDS contains information about the RF including up to five fundamental frequencies (amplitude of
both voltage and current and their phase for each fundamental frequency) and up to 15 overtones for each fundamental frequency (amplitude of both voltage and current and their phase for each harmonic, and also the phase relationship of each harmonic to the voltage component of its specific fundamental frequency). With this data set (voltage,
current, and phase), power ( ) and impedance ( ) can be determined for each fundamental and harmonic frequency.
Users can choose number of fundamental frequencies (up to five) and associated harmonics (up to 15 for each fundamental frequency) that are acquired and processed. Choosing a small number of fundamental and harmonic frequencies reduces the computing time and, therefore, provides output data faster than choosing a larger number of
fundamental and harmonic frequencies. See “Frequency Tracking” on page 40.
The host system can communicate with the BDS receiver through any of the methods outlined in Communication
Options, page 3.
Figure 3 Bird Diagnostic System Block Diagram
3
Page 18

4
Page 19
Chapter 2 Installation
Unpacking and Inspection
1. Carefully inspect shipping container for signs of damage.
2. Do one of the following:
• If the shipping container is damaged, do not unpack the unit. Immediately notify
the shipping carrier and Bird Electronic Corporation.
• If the shipping container is not damaged, unpack the unit. Save shipping materi-
als for repackaging.
3. Inspect unit for visual signs of damage.
Note: If there is damage, immediately notify the shipping carrier and Bird Electronic Corporation.
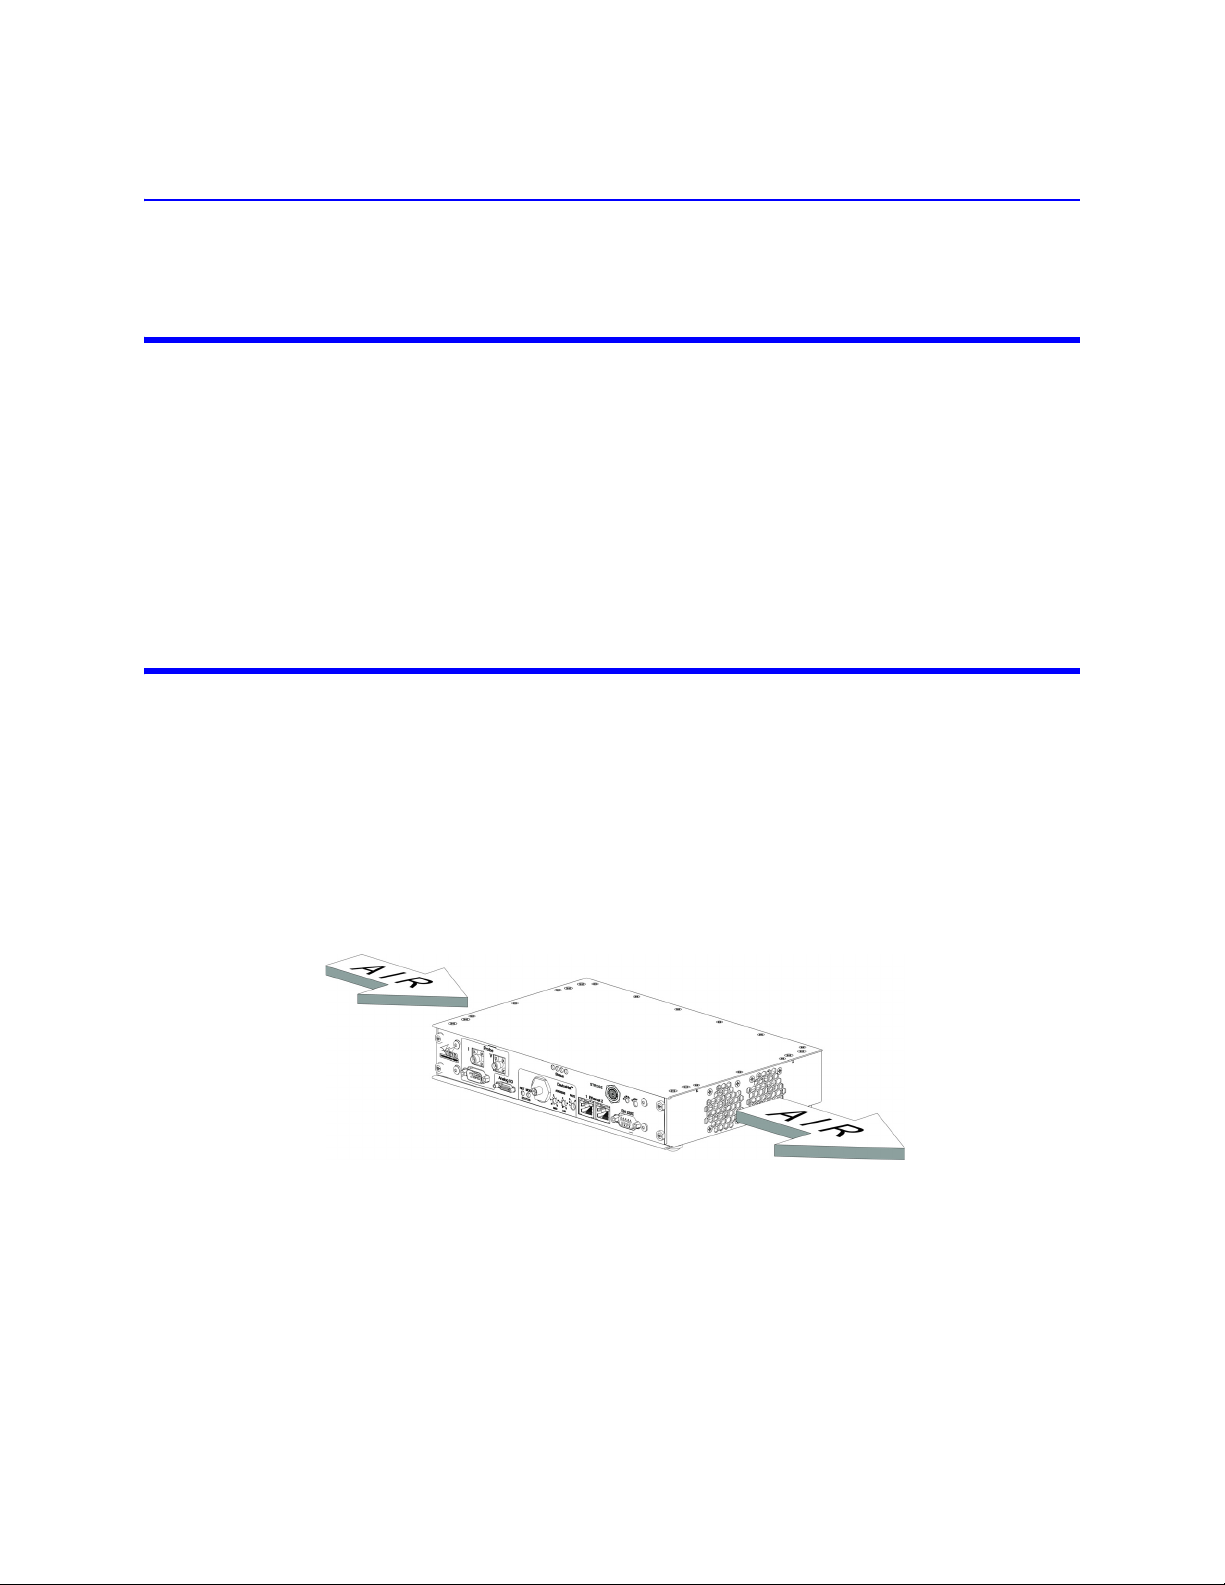
Installing the Receiver
The receiver has cooling fans inside and air vents on both ends of the case. For proper operation, be sure to install
the receiver in a location that permits free air flow around and through the unit (Figure 1).
Place the receiver in a suitable location within the length of the cables from the sensor. The receiver can be installed
free standing or secured in place using the six mounting holes in the bottom of the case. To secure the receiver in
place, first remove the four rubber feet then secure the unit using 6-32 screws that will not extend inside the
receiver case more than one inch (1.0 in or 25.4 mm). (Figure 2).
The BDS receiver requires an external +24 V DC power source for operation. The operating voltage is supplied
through the Power In +24V connector located on the reat side of the reciever.
Figure 1 Receiver Air Flow Path
5
Page 20
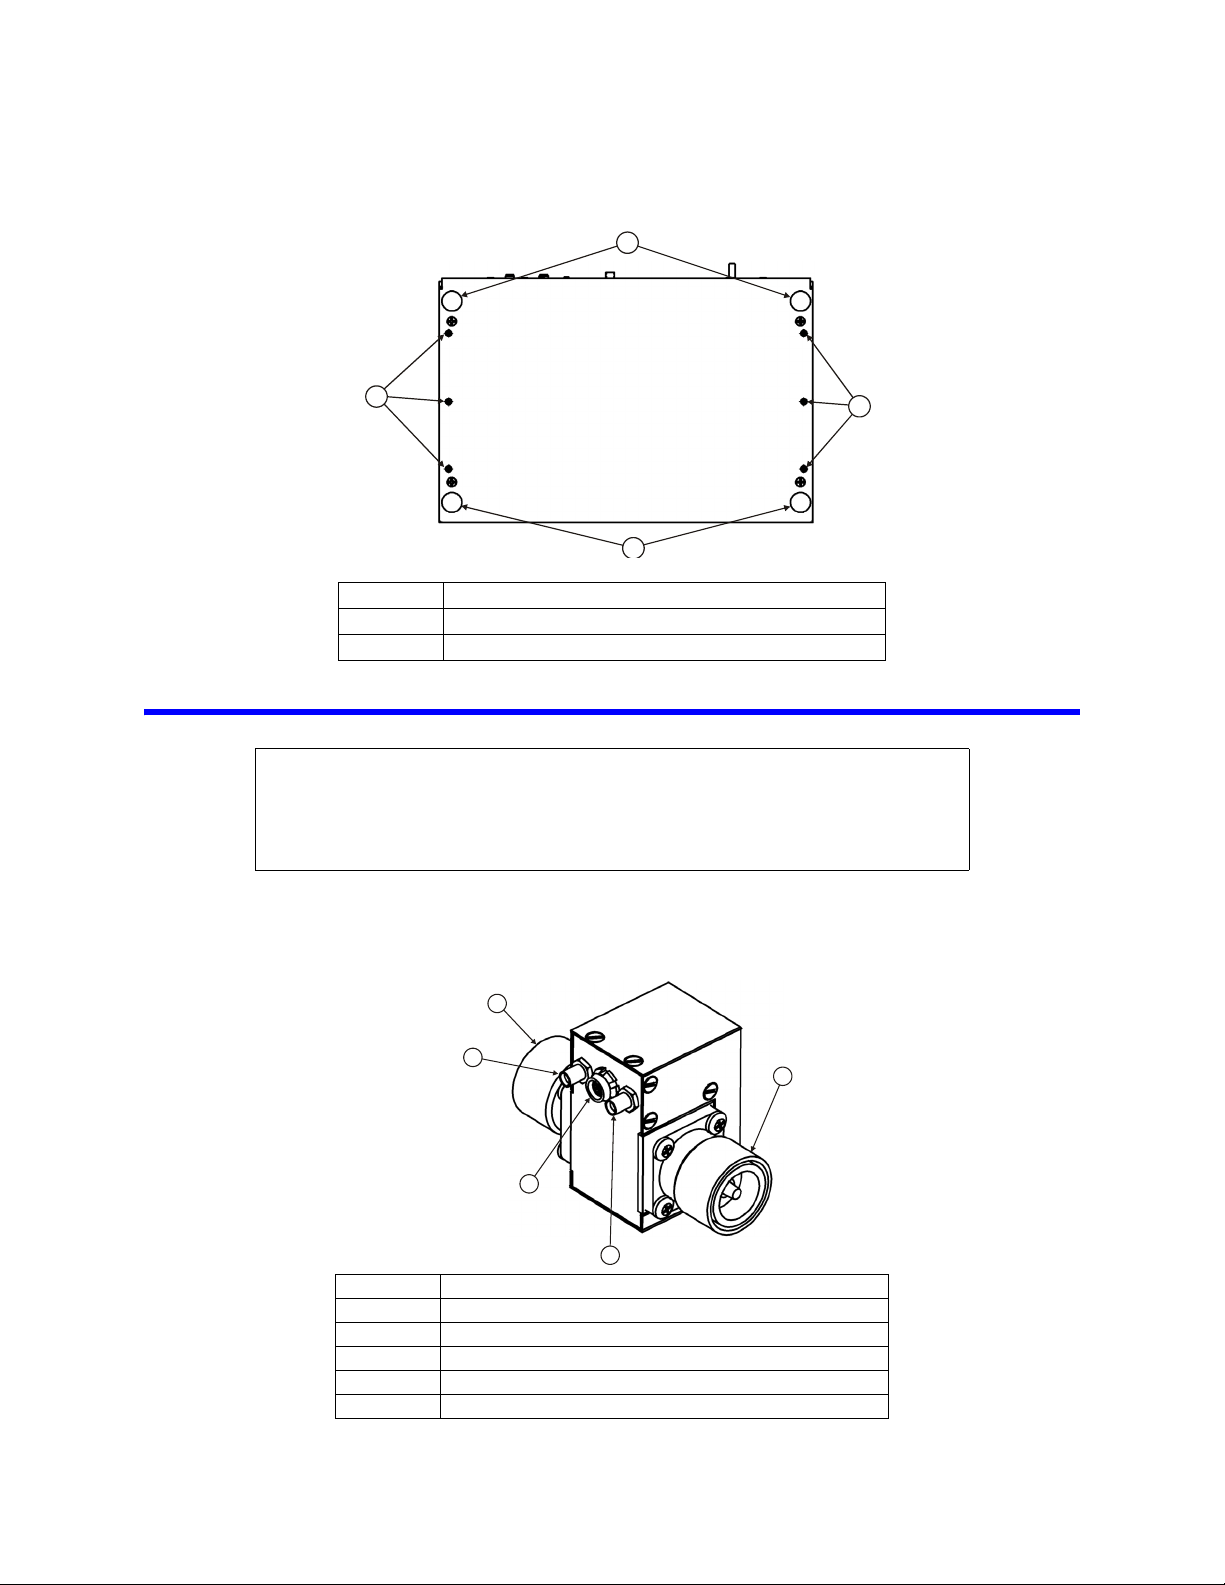
Figure 2 BDS Receiver Mounting Holes
1
1
2
2
1
2
5
3
4
Note: Standard BDS
sensor shown.
Item Description
1 Mounting feet, rubber
2 Mounting holes, 6-32 threaded
Installing the Sensor
Bending RF cables can cause damage. When routing RF cables, the minimum
bend radius is 2 inches (25.4 mm). Do not bend the cables more than the
minimum bend radius. Failure to comply may result in permanent damage to the
CAUTION
cable and reduced equipment performance.
1. Connect the sensor RF In connector to the feed side of the host RF source cable.
2. Connect the sensor RF Out connector the load side of the host RF source cable.
Figure 3 Sensor Cable Connections
Item Description
1 RF output connector
2 RF input connector
3 Current connector, SMA standard polarity
4 Temperature / data connector, 7 pin
5 Voltage connector, SMA reverse polarity
6
Page 21
Connecting the Sensor and Receiver Cables
1. Connect the current and voltage cables to the sensor (Figure ).
2. Torque the SMA connectors to 1.55 Nm (±0.15 Nm).
Note: The SMA connector on the current sensor cable has a standard center
conductor and the SMA connector on the voltage sensor cable has a reverse
polarity center conductor.
3. Connect the temperature/data cable to the sensor.
4. Connect the current and voltage data cables to the receiver (Figure on page 7).
Torque the SMA connectors to 1.55 Nm (±0.15 Nm).
5. Connect the temperature / data cable to the receiver.
6. Connect the external power supply (24 VDC) to the Power connector on the rear of
the receiver. Refer to Appendix 8 for pinout data for the DeviceNet connector.
7. Apply power to the power supply and verify that the Power On LED on the receiver
lights.
8. Verify communication with the host computer.
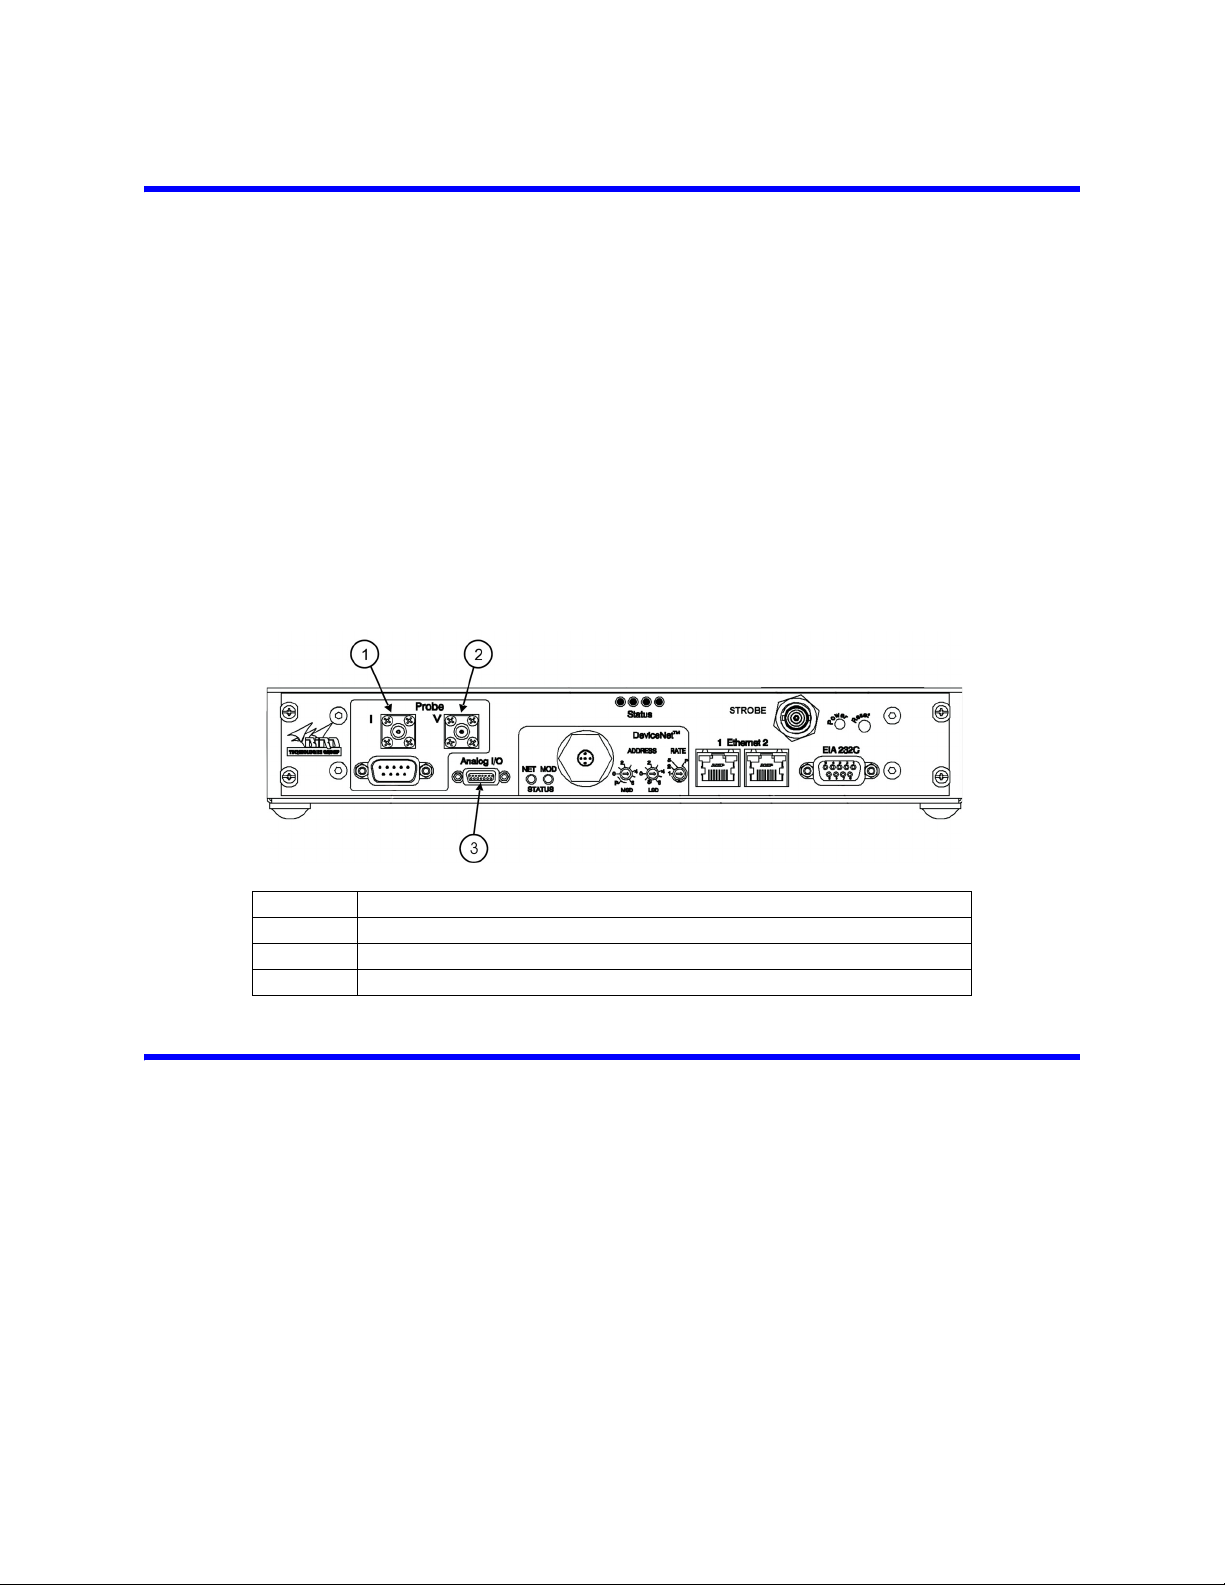
Figure 4 Receiver Cable Connections from Sensor
Item Description
1 Current sensor connector
2 Voltage sensor connector
3 Sensor temperature / data connector (DB-9)
Installing the BDS Graphical User Interface Application
1. Run “7001A242-X_BDSGUI_setup-X.exe”.
Note: This will create a short under the start menu folder “Start Bird->Bird
Technologies Group->BDS GUI.”
2. Copy the shortcut onto the PC’s desktop (optional).
7
Page 22

8
Page 23

Chapter 3 Operating Instructions
Overview
The BDS GUI is used to configure the BDS receiver and obtain measurement data from the system. There are two
modes of operation: Standard Tracking and Spectral Search. In addition, the BDS provides arc/transient detection
capability that is available in both operating modes.
There are two sampling resolutions for all modes: 8-bit, 1G sample/second, and 12-bit, 200M sample/second.
• The 12-bit sampling mode allows for a 1-100 MHz tracking range with a wider dynamic range, higher accu-
racy, and better repeatability than the 8-bit mode.
• The 8-bit mode allows for a wider tracking range of 1-500MHz at the expense of narrower dynamic range
and less repeatability as compared to 12-bit mode.
The BDS accurately measures voltage (V), current (I) and phase (P) in both Standard Tracking and Spectral Search operating
modes. The BDS GUI uses these three basic parameters to derive other quantities such as power and impedance.
Setting Up the BDS
Configuring Network Settings
Note: These instructions apply to a Windows XP PC.
1. Connect an Ethernet cable to Port 1 on the BDS receiver front panel.
2. Select “Start->Control Panel->Network Connections” from Windows XP
3. Double-click your local area connection and click the "Properties" button.
4. Scroll down and double-click "Internet Protocol (TCP/IP)".
5. Select "Use the following IP address".
6. Enter the following settings:
• IP address: 192.168.0.100
• Subnet mask: 255.255.255.0
• (Gateway is ignored)
7. Click the "OK" button for the "Internet Protocol (TCP/IP) Properties" dialog.
8. Click the "OK" button to apply the connection properties.
Note: The BDS Web UI can reconfigure its network settings, such as reassigning IP addresses, defining a domain name, and enabling DHCP. Refer to the BDS
“Quick Start Guide” for instructions on the BDS Web UI.
Restoring PC Network Connection to Use DHCP
1. Follow steps 1-3 above.
2. Select "Obtain an IP Address Automatically".
3. Click the "OK" button for the "Internet Protocol (TCP/IP) Properties" dialog.
4. Click the "OK" button to apply the connection properties.
9
Page 24
Establishing a Connection to the BDS Receiver
These instructions cover connecting to the receiver using a direct PC-to-receiver Ethernet connection on port 1 (left port).
1. Connect an Ethernet cable connected from the PC to port 1 on receiver.
Note: It does not have to be a crossover cable, the BDS will auto-negotiate the
hardware.
2. Apply power to the BDS receiver.
3. Confirm that the yellow LED (the one on right) of port 1 is illuminated.
4. Wait for the BDS to finish booting.
Note: The four status LED’s on the front panel will all turn green when the BDS
is ready (GGGG).
Note: If there is not a probe connected, the following pattern will be displayed:
GGGY. Any other pattern indicates a possible system failure. See “Status LEDs”
on page 13 for more information.
5. Using the BDS GUI, Select “Connection->New…” from the main menu.
6. Enter the following IP address of port 1 in the “Address:” field: 192.168.0.151
7. Click the “Connect” button.
Note: “CONNECTED” should be displayed in the left-most indicator field of the
main status bar at the bottom of the application window.
Note: The BDS GUI will save your connection settings as defaults. If disconnected from the receiver, a connection can be reestablished by either clicking the
“Connection” icon, using “Connection->Open”, or simply by starting a data
acquisition. This also works on subsequent launches of the BDS GUI application.
For more information see the "Connection Options" on page 10.
There are two modes of operation with the Bird GUI: Standard Tracking and Spectral Search (Sweep). In addition, the
BDS also has arc detection capability that is available in both operating modes. In all modes data is captured in 12-bit
hi-resolution (Hi-res) or in 8-bit low-resolution (Low-res).
Connection Options
The BDS GUI communicates with the receiver over Ethernet. In order to establish a connection to the BDS receiver you
first need to make sure that the receiver must be on the subnet (it has an IP address that is addressable by the PC).
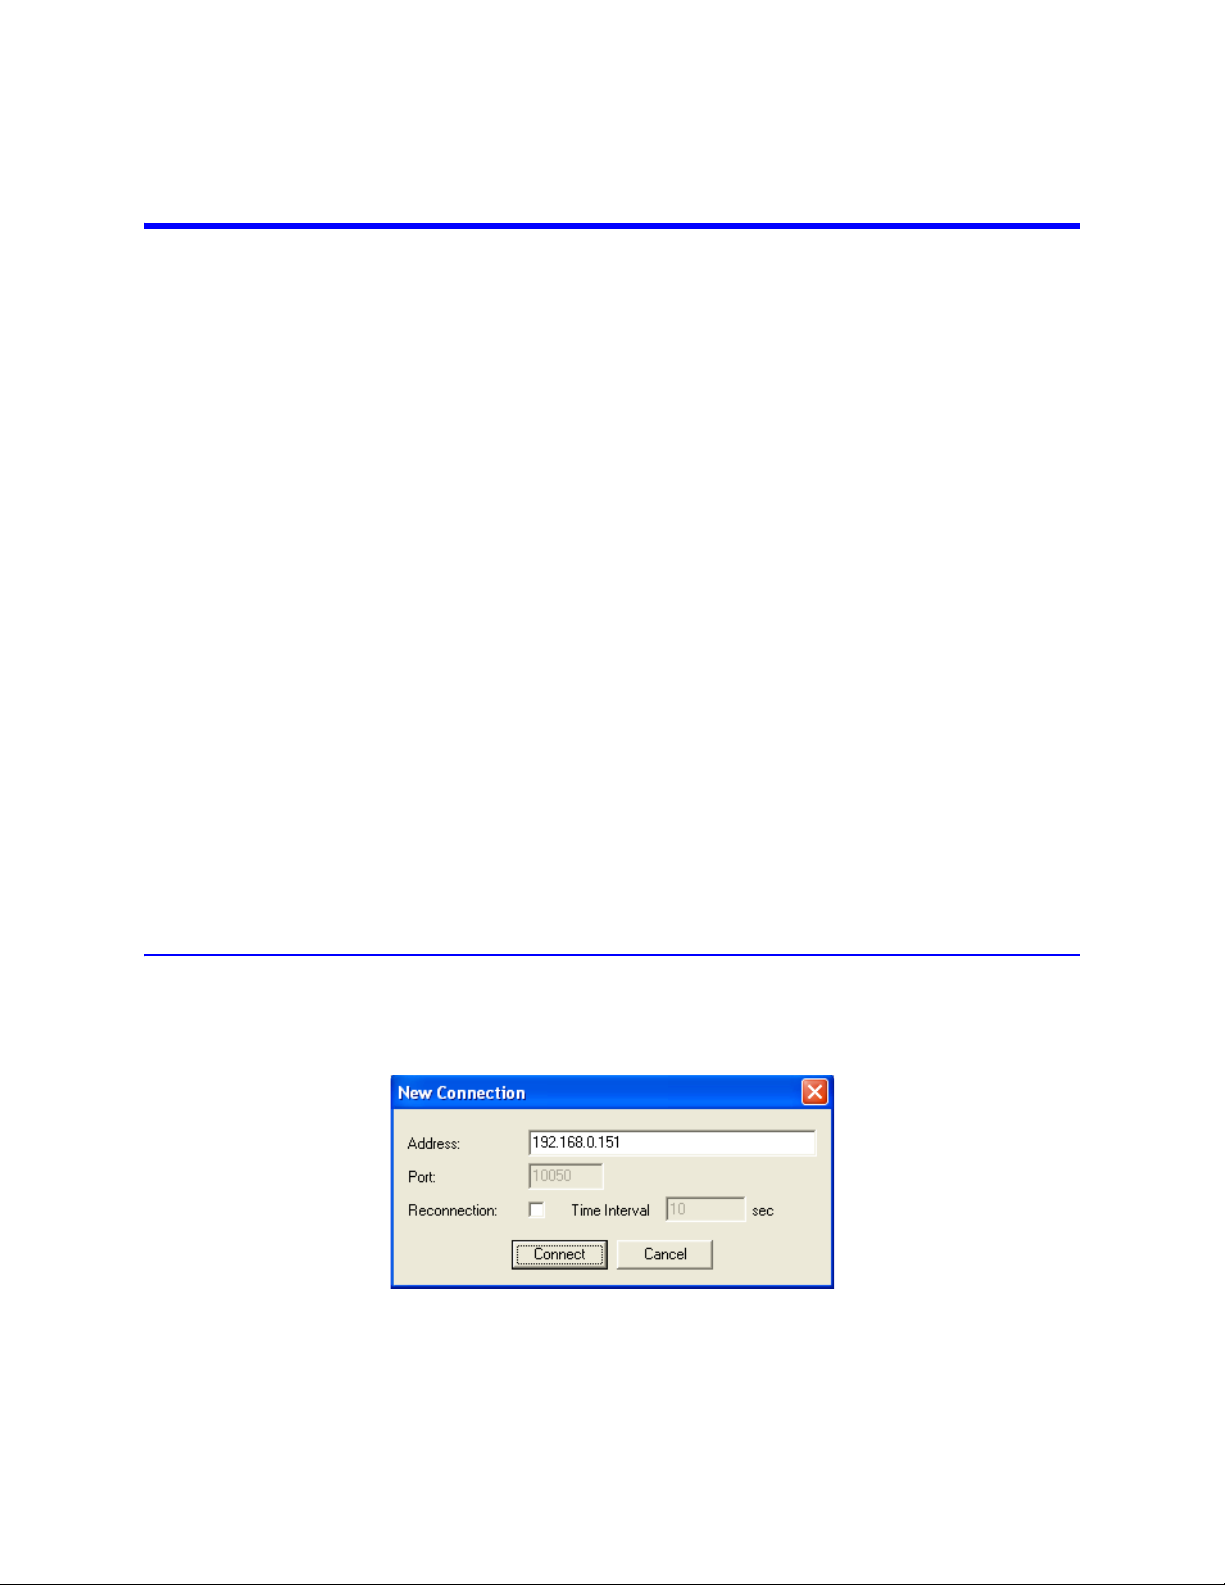
Figure 1 Connection Dialog
Address - The IP address or host name of the BDS receiver.
Note: Default IP addresses:
•Ethernet Port 1 (left): 192.168.0.151
•Ethernet Port 2 (right): 10.10.0.29
10
Page 25

Port - The TCP/IP socket port (always 10050).
Reconnection - Mark this checkbox to have the BDS GUI automatically reconnect when it loses connection with
the receiver or if a connection fails.
Timer Interval - The time in seconds to wait before the next reconnection attempt is made.
Connect button – Establishes a connection with the receiver at the given address. Closes the dialog and saves the
settings to the system registry.
Cancel button – Exits the dialog without applying the connection.
Applying Power
The Bird Diagnostic System receiver requires an external customer supplied 24 VDC power source capable of delivering 1 amp. DC power is delivered through the Power In connector.
11
Page 26
Controls and Indicators
Connector Panel
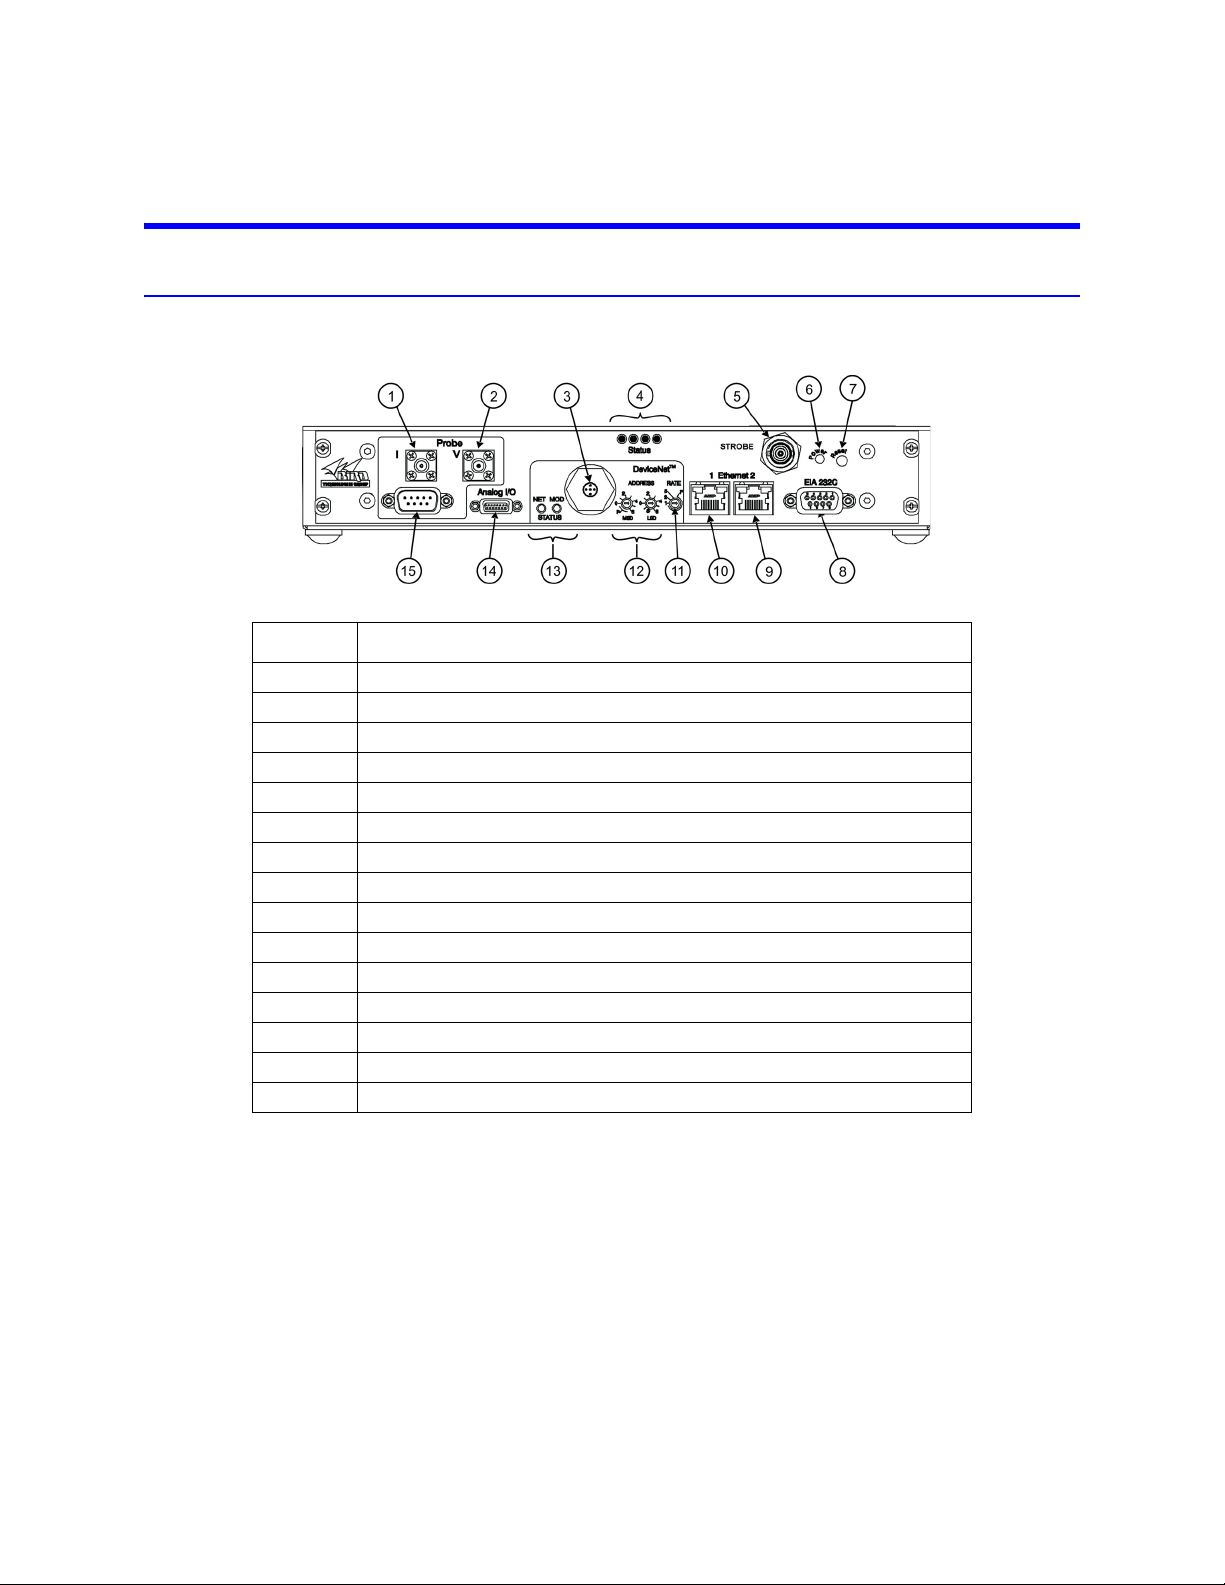
Figure 2 Connector Panel
Item Description
1 Current sensor connector
2 Voltage sensor connector
3 DeviceNet connector
4Status LEDs
5 Strobe Connection
6 Power LED
7 Reset Button
8 RS-232 connector (DB-9)
9 Ethernet Connection (Port 2)
10 Ethernet Connection (Port 1)
11 Devicenet buad rate switch (not available on all models)
12 Devicenet address switches (not available on all models)
13 Devicenet status LEDs (not available on all models)
14 Analog I/O connector (DB-15)
15 Sensor temperature / data connector (DB-9)
12
Page 27

Status LEDs
The receiver has four status LEDs. Each LED can have four conditions, off (O), on green (G), on yellow (Y), and on red
(R). The four letters in the LED code column are arranged left-to-right as viewed on the instrument. The letters indicate the condition of each LED. The meaning of the code is in the description column.
Code Description
OOOO No power applied
RRRR CPU Exception to unknown vector
OROR RAM Failure
ORRO Bootloader checksum failure
ORRR Kernel Failure
OOOR CPU Fault - Illegal instruction
OORO CPU Fault - Address error
OORR CPU Fault - Unimplemented A-line
OROO CPU Fault - Unimplemented F-line
YYOO Bootloader RAM test pass
YYYO Bootloader loaded
YYYY Bootloader running
GYYY Operating system loaded
GGYY Operating system running
GGGY Main applications running, but calibration data has not
been loaded (the probe is disconnected).
GGGG System is ready with all components connected and
all calibration data loaded.
YGGY Loading FPGA image.
RYYY DSP Error – general or initialization failure.
YRYY DSP error – DCM lock failure.
YYRY DSP error – PLL lock failure.
YRRY DSP error – heartbeat flat-line. DSP stopped
producing data.
YYYR Fatal application software error – unrecoverable
exception caught.
RYRY Fatal application software error – assertion failure.
YRYR Fatal application software error – segmentation fault.
YYRR Fatal application software error – bus error.
13
Page 28
BDS GUI Interface Detail
Menu Bar
File
Provides standard file operations for opening and saving BDS Documents.
New – Creates a new BDS document.
Note: The new document will inherit the properties of the previous document, including measurement and
scan options.
Open… - Opens a BDS document from a file.
Note: This will currently open “BDS Capture Files” and not CSV files.
Close – Closes the active document.
Note: This will stop data acquisition (if running).
Save – Saves the active BDS document in the previously selected format (BDS or CSV).
Note: This will stop data acquisition (if running).
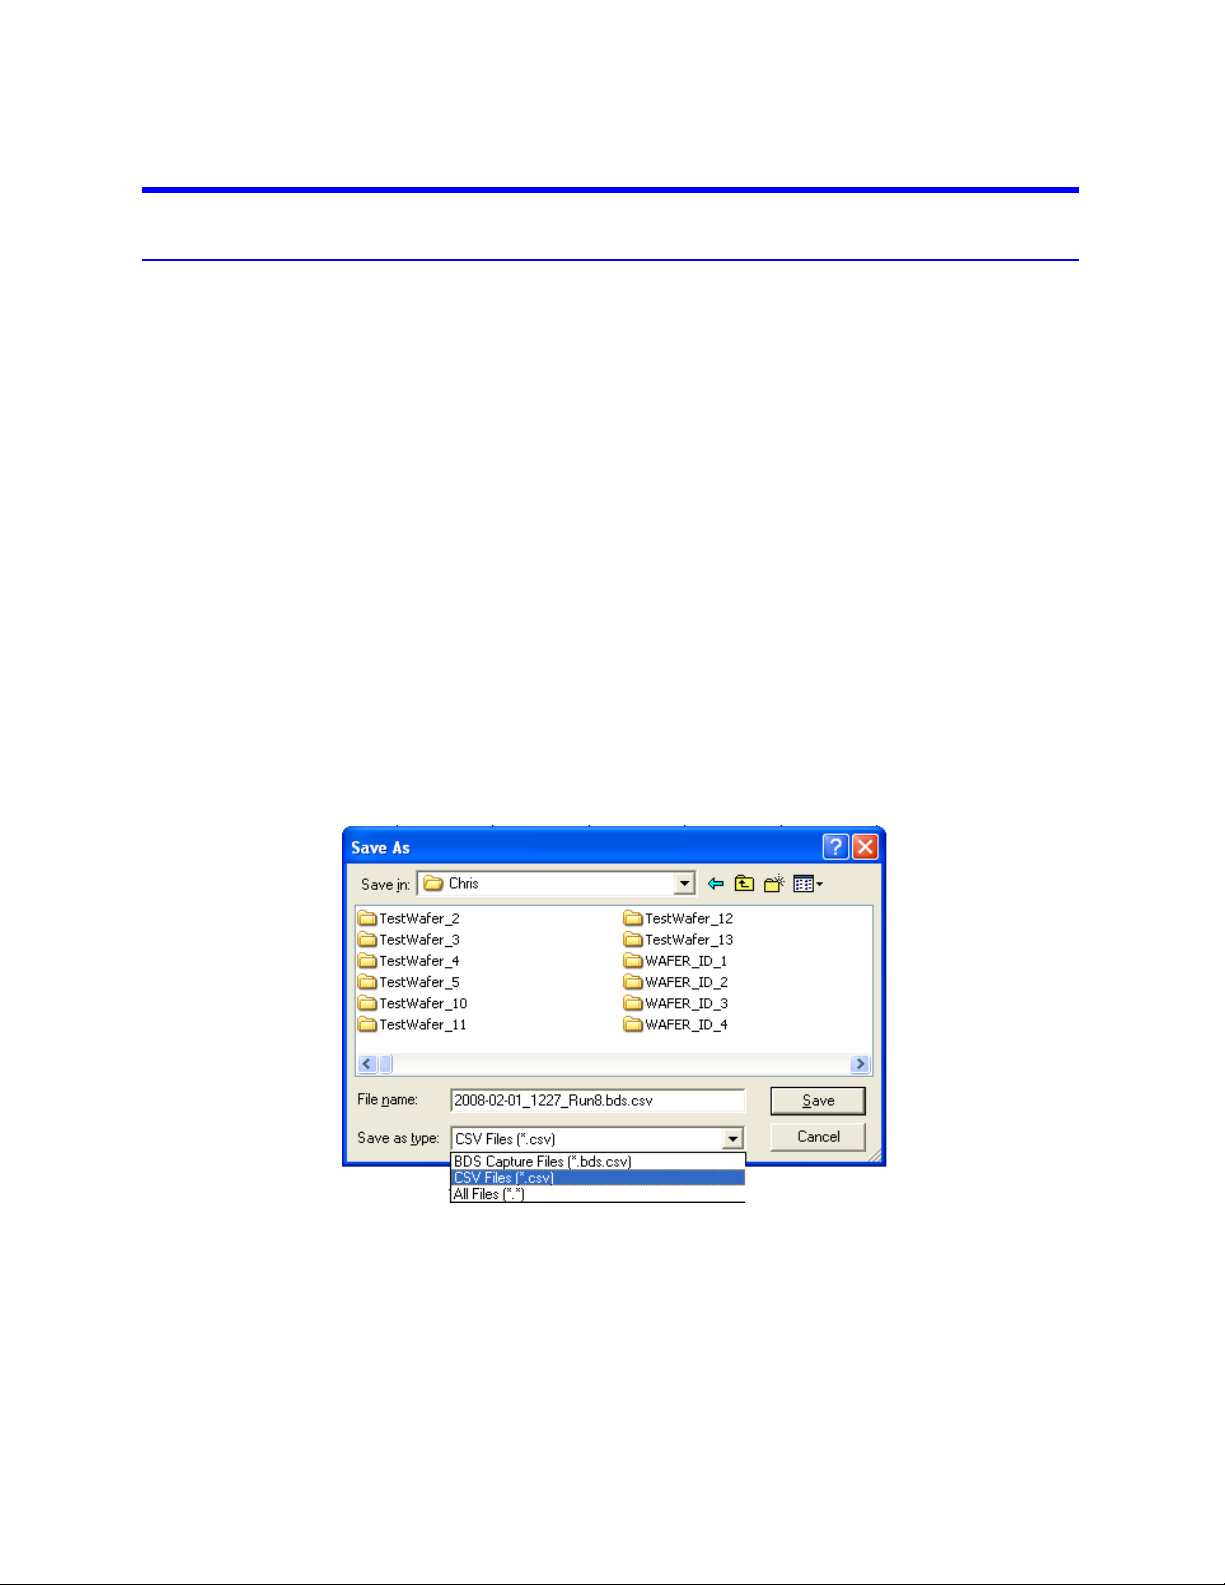
Save As… Saves the active BDS document in a number of formats. See Figure 3.
Note: This will stop data acquisition (if running).
Recent Document List - List of recently opened documents.
Exit – Closes the BDSGUI application.
Note: Automatically stops data acquisition and disconnects from the BDS receiver.
Figure 3 Save As Menu Option
Connection
New… - Displays the “Connection Options” dialog (see Connection Options).
Close – Closes the current connection to the BDS receiver.
Mode
Offers menu items for configuring and operating a Mode. This menu is context-sensitive to the currently active
mode (Tracking or Spectral Search).
Start Free Run / Start Sweep – Starts an acquisition.
Start Trigger – Starts an acquisition based on an event trigger (Tracking Mode only).
14
Page 29

Stop – Stops data acquisition.
Halt Mode – Stops the BDS measurement process for the active mode.
Switch To->Tracking Mode – Changes the active mode to Standard Tracking Mode.
Switch To->Spectral Search Mode – Changes the active mode to Spectral Search (Sweep) Mode.
Gain Ctrl… - Displays the “Gain Control” dialog (see Gain Control Options).
Options… - Displays the options dialog for the active mode.
View
Offers menu items for selecting a new view of a BDS document, configuring a view, or showing toolbars. The menu is
context-sensitive to the currently active mode (Tracking or Spectral Search).
Standard Tracking Mode View Menu Items:
Table – Display the document data in tabular format.
Time Plot – Display the document data plotted on a graph over time.
Waveform – Show the most recent dataset as a reconstructed waveform.
Note: Relative phase information must be requested to display data in this view. Relative phase is
requested by selecting the “Enable relative phase measurements” option in the Standard Tracking Mode
options.
Dataset… - Display the “Dataset Number” dialog, allowing the user to show data for a single measurement.
Spectral Search Mode View Menu Items:
Peaks – Display a table of peaks that have been located in the sweep data.
Sweep – Display amplitude over frequency.
Markers… - Display the “Markers” dialog, allowing the user to enable/disable markers and set their positions on
the graph.
View Menu Items Shared between both Operating Modes:
Toolbars – Display or hide the various toolbars.
Status Bar – Display or hide the main status bar.
Options… - Launch the “Display Options” dialog (see Display Options).
Window
Presents standard window menu options.
New Window – Creates a new View window from the active window.
Cascade – Aligns windows on top of one another.
Tile – Aligns windows in a tile pattern so that no windows overlap.
Arrange Icons
Active Window
Tools
Provides some supplemental applets.
Arc Data Viewer… - Displays the “Arc Detect Data Archive” dialog, allowing the user to download Arc Detect cap-
ture files that are stored on the receiver.
Help
Show Help – Shows this help document.
About - Displays the “About” dialog, showing the application version and date information.
15
Page 30
Toolbars
Toolbar icons are described from left to right.
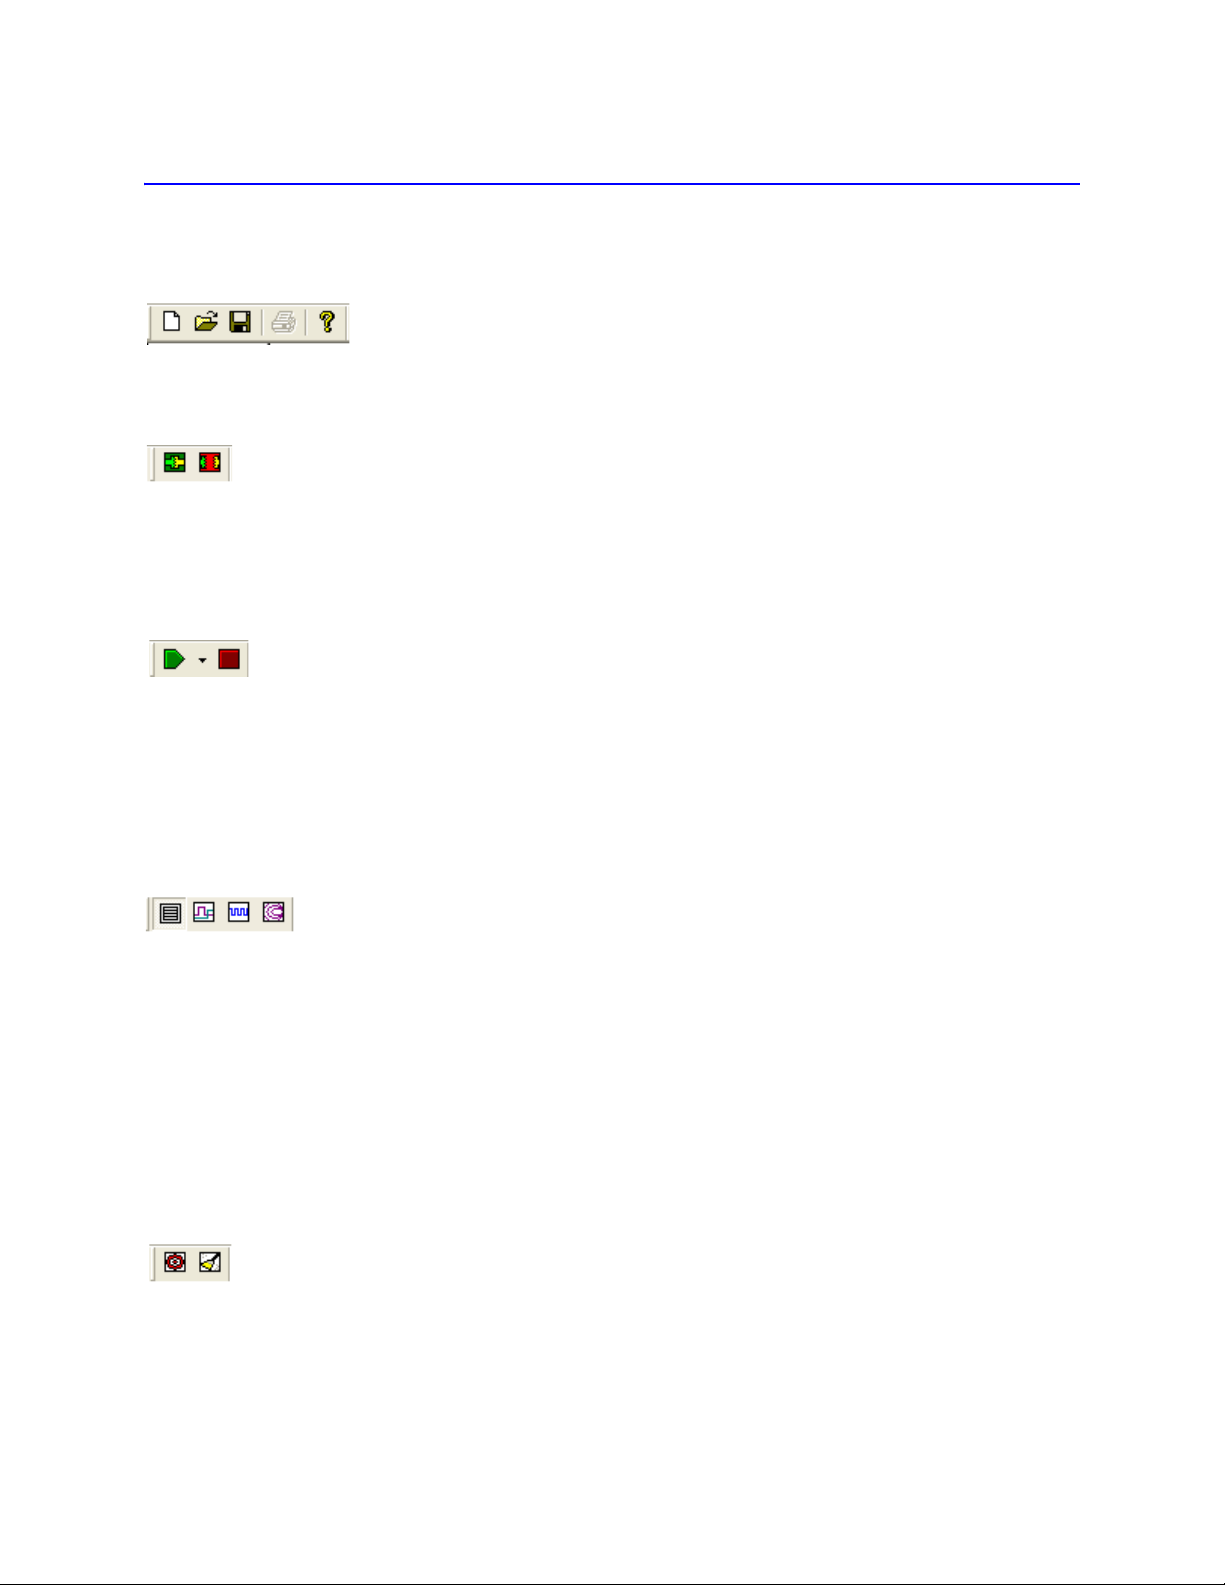
Standard
Standard Windows file save and load buttons.
Connection
Connect – Click the green button on the left to connect to the BDS receiver using the IP Address of the receiver
saved in the system registry.
Disconnect – Click the red button on the right to close your connection to the BDS receiver.
Scan
Start Button – Starts a new data acquisition (Free Run, Trigger, or Sweep). Pressing the green button will start the
data acquisition, or selecting from the drop-down arrow will start a specific scan mode.
Note: This has the same functionality as the “Mode->Start” menu items.
Stop Button – Pressing the red button will stop data acquisition.
Note: This has the same functionality as the “Mode->Start” menu items.
Graph
Table – Press the left button to show the document data in tabular format.
Time Plot – Press the middle-left button to show the document data plotted on a graph over time.
Note: That this will display a “Sweep View” if in Spectral Search mode.
Waveform – Press the middle-right button to show the most recent dataset as a reconstructed waveform.
Note: This view does not apply while in Spectral Search mode.
Smith Chart – Press the right button to show collected data as a Smith chart. Smith chart data is plotted normal-
ized to 50 Ohms.
Note: This view does not apply while in Spectral Search mode.
Options
Standard Tracking Mode Options –Press the red reticule icon the left to display the Standard Tracking Mode
options dialog.
Spectral Search Mode Options –Press the broom icon on the right to display the Spectral Search (Sweep)
Mode options dialog.
16
Page 31
Status Bars
Main
The main status bar is a standard window status bar displaying a status message (to the left) and keyboard indicator
fields (CAP, INS, NUM).
In addition to the standard keyboard indicators, this status bar also displays the connection status and input overload conditions.
• If the BDSGUI is connected, then “CONNECTED” is displayed in the left-most indicator field,
• If the BDSGUI is not connected, then “DISCONNECTED” is displayed.
• When an overload condition is detected on the voltage and/or current channel, then “OVERLOAD” is dis-
played in the indicator field to the right of the connection indicator.
View
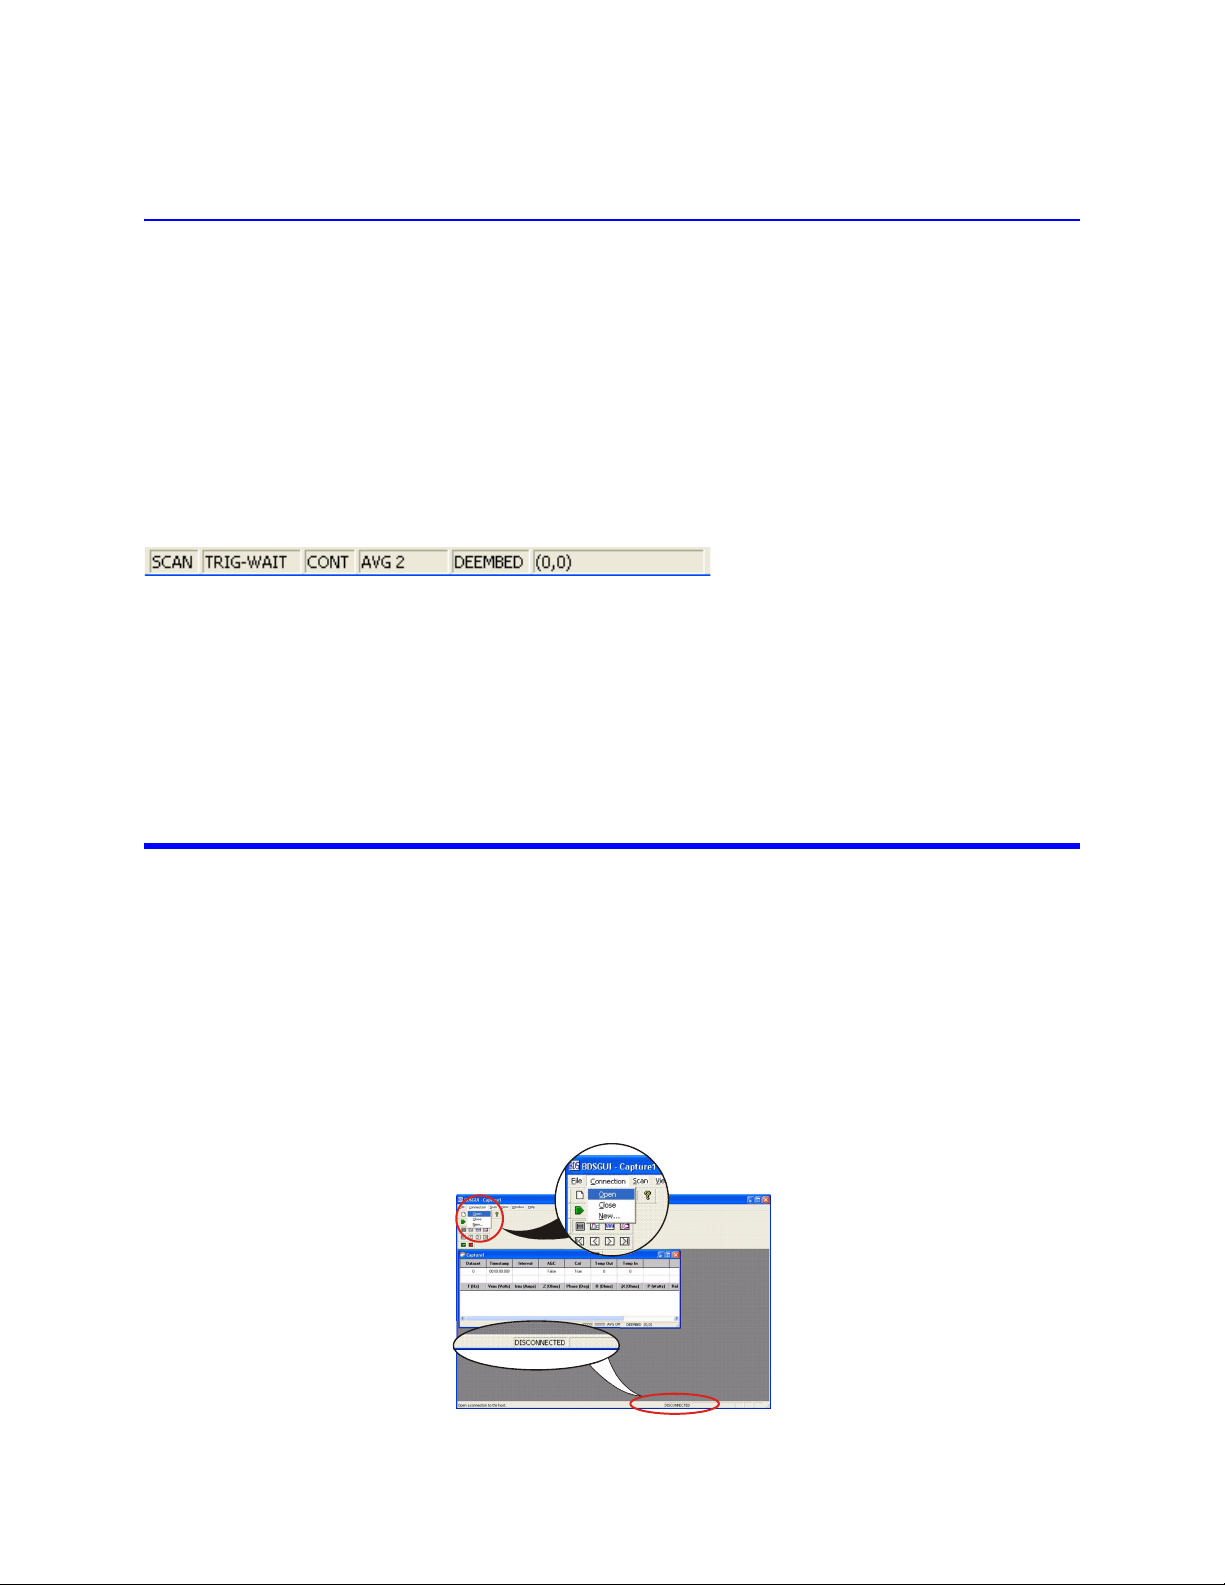
Each view window has it’s own status bar. The view status bar has five indicator fields (from left to right):
Scan – Displays “SCAN” if the document is collecting data from the BDS. Empty if not collecting.
Scan Mode – Displays the current scan mode for the document – “FREE”, “TRIGGER”, or “SWEEP”.
Continuous – Displays “CONT” while collecting data in “Continuous Scan” mode.
Cal Requested – Displays “CAL” if corrected readings are requested for this document. Empty if non-corrected
readings are requested.
De-embedding – Displays “DEEMBED” if impedance de-embedding is enabled for this view. Empty if impedance
de-embedding is disabled.
Setting Up the BDS GUI Application
The BDS GUI application obtains data from the host application. To do this perform the following:
1. Ensure the all hardware is connected.
2. Ensure network connections are correct. See “Configuring Network Settings” on
page 9.
3. Select and configure an operating mode (Standard Tracking or Spectral Search
(Sweep)).
4. Select Connection>Open from the main menu.
5. Verify that CONNECTED is displayed in the main status bar at the bottom of the window.
Note: The BDS GUI will automatically connect to the host on the start of a new scan if you skip this step.
Figure 4 Connecting the BDS GUI to a Receiver
17
Page 32

Using Standard Tracking Mode
To collect data in the Standard Tracking Mode, the minimum configuration you need is to specify at least one fundamental frequency, the number of data sets to acquire, and then start a Free Run scan.
There are many settings and options available in the Standard Mode of operation.
For more information about Standard Tracking Mode options, refer to "Spectral Search (Sweep) Mode Options" on
page 34.
Setting the Minimum Configuration
Note: The minimum configuration is one fundamental frequency and no harmonics or IMD.
1. At the Main menu, select “Mode->Options…” or click the red reticule icon in the
“Options” toolbar. The Standard Tracking Mode Configuration dialog box opens.
2. Click on the “Frequency Selection” tab to bring it to the foreground.
Figure 5 Frequency Selection
18
3. Enter a frequency of choice (custom frequency) into the “Fundamental” field or
select a frequency from the list of fundamental frequencies then click the “Add>>”
button to add your selection to the Selected Frequencies list at the right.
Note: If harmonics are desired for this fundamental frequency, click on each
“H” button that represents the harmonics you desire (e.g. H1, H2, H3, H7, H12).
Note: To remove a frequency or harmonic from the Selected Frequency list,
select it then click the “<<Remove” button.
4. Add more fundamental frequencies and harmonics as desired. When you are finished adding frequencies and harmonics, click the “Apply” button.
5. Click the “Free Run” tab to bring it to the foreground.
6. In the “No. Datasets” field, enter the number of datasets to capture.
7. Do one of the following:
Page 33

• Select the “Continuous Scan” check box for the data acquisition to continue
uninterrupted.
Note: In Continuous Scan, when the specified number of data sets has been
captured, the system will discard the oldest data set and store the newest data
set (first-in-first-out method) so that you will always have the specified number
of data sets.
• Do not select Continuous Scan for the data acquisition to stop only after the speci-
fied number of data sets or after the specified Run Time expires.
8. Click the Apply button to apply the values and keep the dialog box open or click the
“OK” button to apply the values and close the dialog box.
Acquiring Fresh Data
Select "Mode->Start Free Run" from the main menu to start the data acquisition.
Note: Clicking the green Run button on the “Scan” toolbar will also start an acquisition.
Stopping the Data Acquisition
The data acquisition can be stopped by doing one of the following at any time:
• Select the "Mode->Stop" from the main menu.
• Press the red Stop button from the "Scan" tool bar.
Saving the Document
Select "File->Save As…" from the main menu.
Note: If the data will be analyzed using another application such as MS Excel or MATHCAD, it’s recommended that the document is saved in the “true” CSV file format. The “true” CSV format saves the data in a
format that is more easily interpreted than the “BDS Capture Files” format.
• Select “CSV Files (*.csv)” from the “Save as type:” drop-down list.
Note: The file format can also be selected in the auto save options. Auto save options can be set up by
selecting “Mode->Options…” from the main menu.
Figure 6 Saving the Document in Standard Trackng Mode
19
Page 34

Viewing the Data
Data can be viewed while it’s being collected or after a data acquisition completes. The data is displayed in the following formats:
• Table
• Time plot
• Reconstructed waveform
• Smith chart
These views can be accessed and switched at any time by:
• Selecting a different view using the buttons on the View tool bar (Figure ).
• Right-clicking anywhere on a view and choosing from the pop-up menu.
• Selecting View and your choice from the main menu.
Note: View options are available by selecting “View->Options…” from the main menu or by right clicking
anywhere on a view and selecting “Options…” from the pop-up menu.
Tab l e Vie w \
Figure 7 Data in Tabular Format and View Selection Buttons
The table view displays the most recently collected dataset in tabular form. The fields are described in detail below:
• Dataset - The dataset number - a count of how many datasets have been received for the document.
• Timestamp - The time the dataset was captured from the BDS receiver.
• Elapsed (ms) - The time (in milliseconds) between measurement datasets, giving an indication of data
update rate.
• AGC - Automatic gain control indicator.
Note: Displays “Yes” if automatic gain control is used or “No” if manual gain control is used.
• Cal – Measurement calibration indicator.
Note: Displays “Yes” if the displayed measurement dataset has been calibrated or “No” if it has not been
calibrated.
Note: Check the probe connection to the receiver if the BDS GUI is indicating that the measurements are
not being calibrated.
• Arc - Arc detected during the displayed measurement cycle.
Note: This will display “No” if no transient event has been detected or “Yes” with a red background if a
transient has been detected during the measurement cycle.
The data table displays the following information for each harmonic component returned in the dataset:
• F (Hz) - The estimated frequency in Hz. This is the frequency reported by the BDS receiver.
20
Page 35

• Vrms (Volts) - RMS voltage reading.
PV
rmsIrms
×()Phase()cos=
• Irms (Amp) - RMS current reading.
• Z (Ohms) - Impedance magnitude in Ohms. Note: Z=V/I.
• Phase (Deg) - The phase in degrees.
• R (Ohms) – Resistance in Ohms - the real part of impedance (in rectangular coordinates).
• jX (Ohms) – Reactance in Ohms - the imaginary part of impedance (in rectangular coordinates).
• P (Watts) - Power in Watts.
Note:
• Rel P (dBc) - Power relative to the carrier in dBc.
• Rel Ph – Phase relative to the fundamental in degrees.
Note: This is only reported if relative phase is enabled. See “Enable relative phase measurements” in Standard Tracking Mode Options.
• Attn V (dB) - The attenuation applied (in dB) to the voltage channel during this frequency measurement.
• Attn I (dB) - The attenuation applied (in dB) to the current channel during this frequency measurement.
Time Plot View
Figure 8 Data Viewed in Time Plot Format
Note: The Time Plot view displays each dataset over time. The dataset number is displayed on the X-axis.
Reconstructed Waveform View
Figure 9 Data Viewed As a Waveform
Note: The Waveform view displays a single waveform of a fundamental tone constructed from the harmonic components captured. Waveform reconstruction is only possible if relative phase is enabled. See
“Enable relative phase measurements” in Standard Tracking Mode Options.
21
Page 36

Smith Chart View
Figure 10 Data Viewed in a Smith Chart
Note: The Smith Chart view displays data normalized to 50 Ohms (a value of 1 on the horizontal axis represents 50 Ohms).
Using Spectral Search (Sweep) Mode
To collect data in the Spectral Search Mode you can simply use the default sweep configuration and then start a Sweep.
There are many settings and options available in the Spectral Search Mode of operation.
For more information about Spectral Search Mode options, refer to Spectral Search Mode Options.
Setting the Minimum Configuration
Note: The minimum Spectral Search Mode configuration is a 12-bit Uniform sweep of 1-100MHz.
1. At the main menu, select “Mode->Switch To->Spectral Search Mode”.
2. Select “Mode->Options…” from the main menu or click the broom icon in the
“Options” toolbar. The Sweep Mode Configuration dialog box opens.
3. Click on the “Sweep” tab to bring it to the foreground.
4. Click the “More Options >>” button.
5. Click the “Default Settings” button.
6. Click the “OK” button to apply the settings and close the dialog.
Acquiring Fresh Data
Select "Mode->Start Sweep" from the main menu to start the data acquisition.
Note: Clicking the green Run button on the “Scan” toolbar will also start an acquisition.
Stopping Data Acquisition
The data acquisition can be stopped at any time by performing one of the following:
• Select "Mode->Stop" from the main menu
• Use the red Stop button from the "Scan" tool bar.
22
Page 37
Saving the Document
1. Select "File->Save As…" from the main menu.
Note: If the data will be analyzed using another application such as MS Excel
or MATHCAD, it’s recommended that the document is saved in the “true” CSV
file format. The “true” CSV format saves the data in a format that is more easily
interpreted than the “BDS Capture Files” format.
2. Select “CSV Files (*.csv)” from the “Save as type:” drop-down list.
Note: The file format can also be selected in the auto save options. Auto save
options can be set up by selecting “Mode->Options…” from the main menu.
Viewing the Data
Data can be viewed while it’s being collected or after a data acquisition completes. The data is displayed in the following formats:
• Frequency-Domain View
• Table o f Peaks
These views can be accessed and switched at any time by:
• Selecting a different view using the buttons on the View tool bar.
• Right-clicking anywhere on a view and choosing from the pop-up menu.
• Selecting View and your choice from the main menu.
Note: View options are available by selecting “View->Options…” from the main menu or by right clicking
anywhere on a view and selecting “Options…” from the pop-up menu.
Viewing Data in the Frequency Domain
Figure 11 Viewing Data in the Frequency Domain
Note: Each data point is displayed as amplitude over frequency, with frequency on the x-axis.
Amplitude display formats can switched by right-clicking on the graph and selecting one of the format types from
the pop-up window:
• Voltage
• Current
• Impedance
• Watts
• dBm.
Note: Format type can also be selected from the Spectral Search Options.
23
Page 38

Marker Usage - Up to 2 markers can be used to view data point details or deltas between 2 data points on the
graph. The active marker, the one with user input focus, is in red and the inactive marker is in black.
Marker Keys:
• Up Arrow – Place the active marker at the maximum value (the highest peak).
• Left Arrow – Move the active marker to the previous point. Tap to move one point at a time or hold to
incrementally skip points.
• Right Arrow – Move the active marker to the next point. Tap to move one point at a time or hold to incre-
mentally skip points.
• E – On/Off – Enable or disable the active marker.
• P – Cycle through peaks, placing the active marker at the next peak.
• 1 – Activate (and enable) marker number 1.
• 2 – Activate (and enable) marker number 2.
Viewing Data in a Table of Peaks
The peak table view displays the peak values most recently located in the sweep in a tabular form. The fields are:
• Sweep - The sweep number - a count of how many sweep have been made since the acquisition was
started.
• Timestamp - The time the sweep dataset was captured from the BDS receiver.
• Elapsed (ms) - The time (in milliseconds) between sweeps, giving an indication of data update rate.
• AGC - Automatic gain control indicator.
Note: Displays “Yes” if automatic gain control is used or “No” if manual gain control is used.
• Cal – Measurement calibration indicator.
Note: Displays “Yes” if the sweep data has been calibrated or “No” if it has not been calibrated.
Note: Check the probe connection to the receiver if the BDS GUI is indicating that the measurements are
not being calibrated.
• Arc – Arc detected during the displayed measurement cycle.
Note: This will display “No” if no transient event has been detected or “Yes” with a red background if a
transient has been detected during the measurement cycle.
• Peak – The peak number. Peaks are listed in ascending order (highest to lowest).
• F (Hz) – The frequency of the peak in Hz.
Selected amplitude. One of the following:
• Vrms (Volts) – RMS voltage.
• Irms (Amps) – RMS current.
• Z (Ohms) – Impedance in Ohms.
• P (Watts) – Power in Watts.
• P (dBm) – Power in dBm.
24
Page 39

Viewing Captured Data Using MS Excel
It is recommended that the data being viewed is saved in the “true” CSV file format. The “true” CSV format saves the
data in a format that is more easily interpreted than the “BDS Capture Files” format. See “Saving the Document” on
page 19 in Using Standard Tracking Mode or see “Saving the Document” on page 23 in Using Spectral Search (Sweep)
Mode for more information.
CSV File Format Description
Header fields are listed in the first row in the file. Measurement data is listed in all subsequent rows. A comma separates each field or data point.
Table 3-1 Standard Tracking Mode CSV Format Description
Column Header Description
1 Step Internal Bird use.
2 Time(ms) The time in milliseconds from the beginning of the file.
3 Arc Arc detection status. 0 if no transient was detected during
the measurement cycle or 1 if a transient was detected.
4 F1_Freq_0 Frequency in MHz for the 1
5 F1_V_0 RMS Voltage for the 1
6 F1_I_0 RMS Current for the 1
7 F1_Ph_0 Phase in radians for the 1st fundamental (overtone H0).
8 F1_PhRel_0 Relative phase in radians for the 1
Note: Relative phase is only saved in this column if it is enabled.
9 F1_Freq_1 Frequency in MHz for the 1
fundamental (overtone H1).
10 F1_V_1 RMS Voltage for the 1
(overtone H1).
11 F1_I_1 RMS Current for the 1
(overtone H1).
12 F1_Ph_1 Phase in radians for the 1
(overtone H1).
13 F1_PhRel_1 Relative phase in radians for the 1
fundamental (overtone H1). Note: Relative phase is only
saved in this column if it is enabled.
…
N Fn_V_m RMS Voltage for the m
(overtone Hm).
N+1 Fn_I_m RMS Current for the m
(overtone Hm).
N+2 Fn_Ph_m Phase in radians for the m
fundamental (overtone Hm).
N+3 Fn_PhRel_m Relative phase in radians for the m
fundamental (overtone Hm). Note: Relative phase is only
saved in this column if it is enabled.
N+4 to
IMD All intermods are listed after the harmonics.
end-of-row
st
fundamental (overtone H0).
st
fundamental (overtone H0).
st
fundamental (overtone H0).
st
fundamental (overtone H0).
st
harmonic of the 1st
st
harmonic of the 1st fundamental
st
harmonic of the 1st fundamental
st
harmonic of the 1st fundamental
st
harmonic of the 1st
th
harmonic of the Nth fundamental
th
harmonic of the Nth fundamental
th
harmonic of the Nth
th
harmonic of the Nth
25
Page 40

Table 3-2 Spectral Search Mode CSV Format Description
Column Header Description
1 Frequency (Hz) Frequency reported for the step point in Hz.
2 RMS Voltage RMS Voltage reported for the step point.
3 RMS Current RMS Current reported for the step point.
4 Phase (R) Phase in radians for the step point.
5 AttnV Attenuation applied to the voltage channel while measuring
6 AttnI Attenuation applied to the current channel while measuring
the point.
the point.
Table 3-3 Arc Detect CSV Format Description
Column Header Description
1 Voltage ADC Voltage ADC counts. Range: 0-127 for 8-bit, 0-2047 for 12-bit
mode.
2 Current ADC Current ADC counts. Range: 0-127 for 8-bit, 0-2047 for 12-bit
mode.
3 Voltage Attn Attenuation applied to the voltage channel in dB.
4 Current Attn Attenuation applied to the current channel in dB.
5 Timestamp Timestamp of the when the arc event occurred.
6 ADC Mode The ADC mode (8-bit or 12-bit).
7 Desc Description of the event, if any.
8 Step Internal Bird use.
9 Temp In Unused. Always set to 0.
10 Temp Out Unused. Always set to 0.
11 Num Points The number of points contained in the file. 0-4096 for 8-bit. 0-
2048 for 12-bit.
12 Sample Rate The peak sampling rate in nanoseconds.
13 Arc Length The maximum pulse length in nanoseconds.
14 Trigger Delay
(Counts)
Trigger delay as a percentage.
26
Page 41

Scan Mode Options
Standard Tracking Mode Options
Frequency Selection
The Frequency Selection page is used to define a set of frequencies for the BDS to monitor while in Frequency Tracking Mode.
Note: All options including harmonic and intermod selection, tolerance, filter width, and tracking quality,
apply to a fundamental frequency.
Figure 12 Frequency Selection Dialog
Resolution - This field is always set to use “Auto”. Auto mode will automatically decide which converter to use
based on the selected frequency list.
• The 12-bit converter is used if all frequencies in the list are less than 100 MHz.
• The 8-bit converter is used if all frequencies in the list are greater than 100 MHz.
• A switching algorithm is used for a frequencies list that contains frequencies ranging from 1-500 MHz.
Fundamental - Enter a custom generator frequency or select from the list of generator frequencies commonly
used in the semiconductor industry.
Note: Select all other options for the fundamental before adding it to the list of selected frequencies.
Options include harmonic selection, intermod selection, and tolerance settings.
F2 Frequency - Select another fundamental from the list to use as the “F2” frequency in an intermodulation prod-
uct.
Note: The F2 frequency must have already been added to the selected frequencies list.
Note: An intermod is combination of two frequencies in the form: IMD = F1+nF2, where n is one of {-3,-2,-
1,1,2,3}.
Intermod - Select the number of intermodulation products reported for the fundamental. Up to 6 IMD products can
be selected for a fundamental (3 pairs):
• F1 +1/-1 F2 (2 IMD products).
• F1 +2/-2 F2 (4 IMD products).
• F1 +3/-3 F2 (6 IMD products).
27
Page 42

Toler a n ce - The Tolerance field defines the tracking filter window as a percentage from the center of the funda-
mental frequency. This gives the frequency range of a generator for a frequency.
Example - For a 2 MHz generator that moves from 1.8 to 2.2 MHz, you would enter a tolerance of at least 10%. The input value range for this field is 0.1 to 20%. The maximum tolerance for a frequency is limited based on the following formula: 5/frequency in MHz * 100.
Filter Width & Track Quality - These are advanced parameters used to fine-tune the frequency tracking algorithm.
Note: It is recommended that these settings are kept at their default values of 0.1 and 0.01%, respectively.
Filter Width is used to widen or narrow the filters used to determine frequency lock.
Note: Filter Width ranges from 0.01 to 2.56%.
Note: Defaults for Filter Width: 0.1%.
Track Quality is used to adjust lock speed at the expense of accuracy. The higher the value, the lower the quality and
the lower the frequency accuracy.
Note: Track Quality ranges in value from 0.01 to 0.256%.
Note: Default for Track Quality: 0.01%.
Selected Frequencies - Displays all frequencies that have been added to the measurement configuration. Fre-
quencies are listed in MHz. Column headers (from left to right):
• Fundamental in MHz
• Harmonic (overtone) number (0-15)
• Intermod number (-3 to 3, 0 means no IMD)
• Frequency in MHz.
Clicking on a fundamental in the list will highlight all frequencies for the fundamental.
Note: Harmonics or IMD frequencies can be clicked on individually.
Note: Clicking the “<< Remove” button will remove the highlighted frequencies from the list.
Analog I/O
The Analog I/O page provides options for configuring the DAC outputs and analog inputs.
Figure 13 Analog I/O Dialog
28
Page 43

Analog I/O Spec - :
1
2
3
4
56
7
8
9
10
11
12 13
14
15
• Two analog inputs, 0 to 10V full-scale, 10K ohm input resistance.
Note: Can be assigned to any of the analog outputs or used for set-point or power threshold adjustment.
• Five individual outputs, 0-10 V DC full-scale, 1000 Ohm source impedance.
• Analog I/O DB15 header pin descriptions:
Analog I/O Head Pin Description
Pin 1 ADC 1
Pin 2 ADC 0
Pin 3 GND
Pin 4 DAC 4
Pin 5 DAC 3
Pin 6 DAC 2
Pin 7 DAC 1
Pin 8 DAC 0
Pin 9 - 15 GND
Enable Analog I/O - Enables/Disables analog I/O.
DAC Channel - Selects the DAC channel to configure and enable. All settings listed on the page pertain to the
selected DAC. There are 5 DAC channels, labeled “DAC0” – “DAC4”.
Equation - Allows a user to enter an equation that is processed by the receiver. The equation can be as basic as a
voltage output or as complex as the functions and controls allow. Measurement results can be included in the equation, as well as the readings from ADC0 & 1.
Note: The result of the equation is scaled according to the minimum and maximum value and voltage settings. The DAC is programmed with the resulting voltage level.
Note: Update rate of the analog I/O is based on the measurement cfg (frequency selector). The DACs are
updated after a measurement set is available and the result of the equation is ready.
Averaging
The BDS offers two types of data averaging for Standard Tracking Mode: Simple (Fixed) or Moving. Both averaging
modes will reduce signal-to-noise ratio in a measurement. Averaging is performed in the receiver.
Figure 14 Averaging Dialog
29
Page 44

A simple average will take a number of measurements and then compute and report the average value after the
number of measurements has been sampled. This averaging mode will increase the data update rate by the number
of averages requested.
Example - If the data update rate for 1 measurement dataset is 10ms, then it will take
about 40ms to average 4 measurements and produce the result. A user can average up to 16
measurements using Simple averaging.
The Moving average mode averages data over time using a sliding filter window. The average window size is specified as a power of 2 ranging from 2 to 128 measurements.
The difference between Moving and Simple averaging is that the moving average doesn’t wait for the buffer to fill
before computing a result, it simply adds a new measurement to the buffer and computes and reports the result. It
removes the oldest measurement if the buffer is full before adding the new measurement. This provides little impact
the data update rate, depending on the measurement set.
The “V/I Noise Threshold” parameter is used to determine when to clear the filter buffer – when the signal (voltage
or current) exceeds this threshold the buffer is cleared to provide a fast response to the measurement system.
De-embedding
De-embedding is used to mathematically rotate the measurement plane from the center of the BDS probe toward
either the load or the signal source. In doing so, it adjust measurements made by BDS probe in order to get a reading
at a different segment of a line section.
Figure 15 De-embedding Dialog
The de-embedding algorithm accounts for losses in the RF delivery system.
The de-embedding options allow users flexibility to enter segment parameters in different formats to match segment spec or data sheets.
• Line section impedance is entered as either inductance and capacitance or Z0 in Ohms.
• Dielectric is entered as either propagation velocity as a fraction of the speed of speed of light or in Er.
• Loss can be entered as Ohms, dB, or Nepers.
30
Page 45
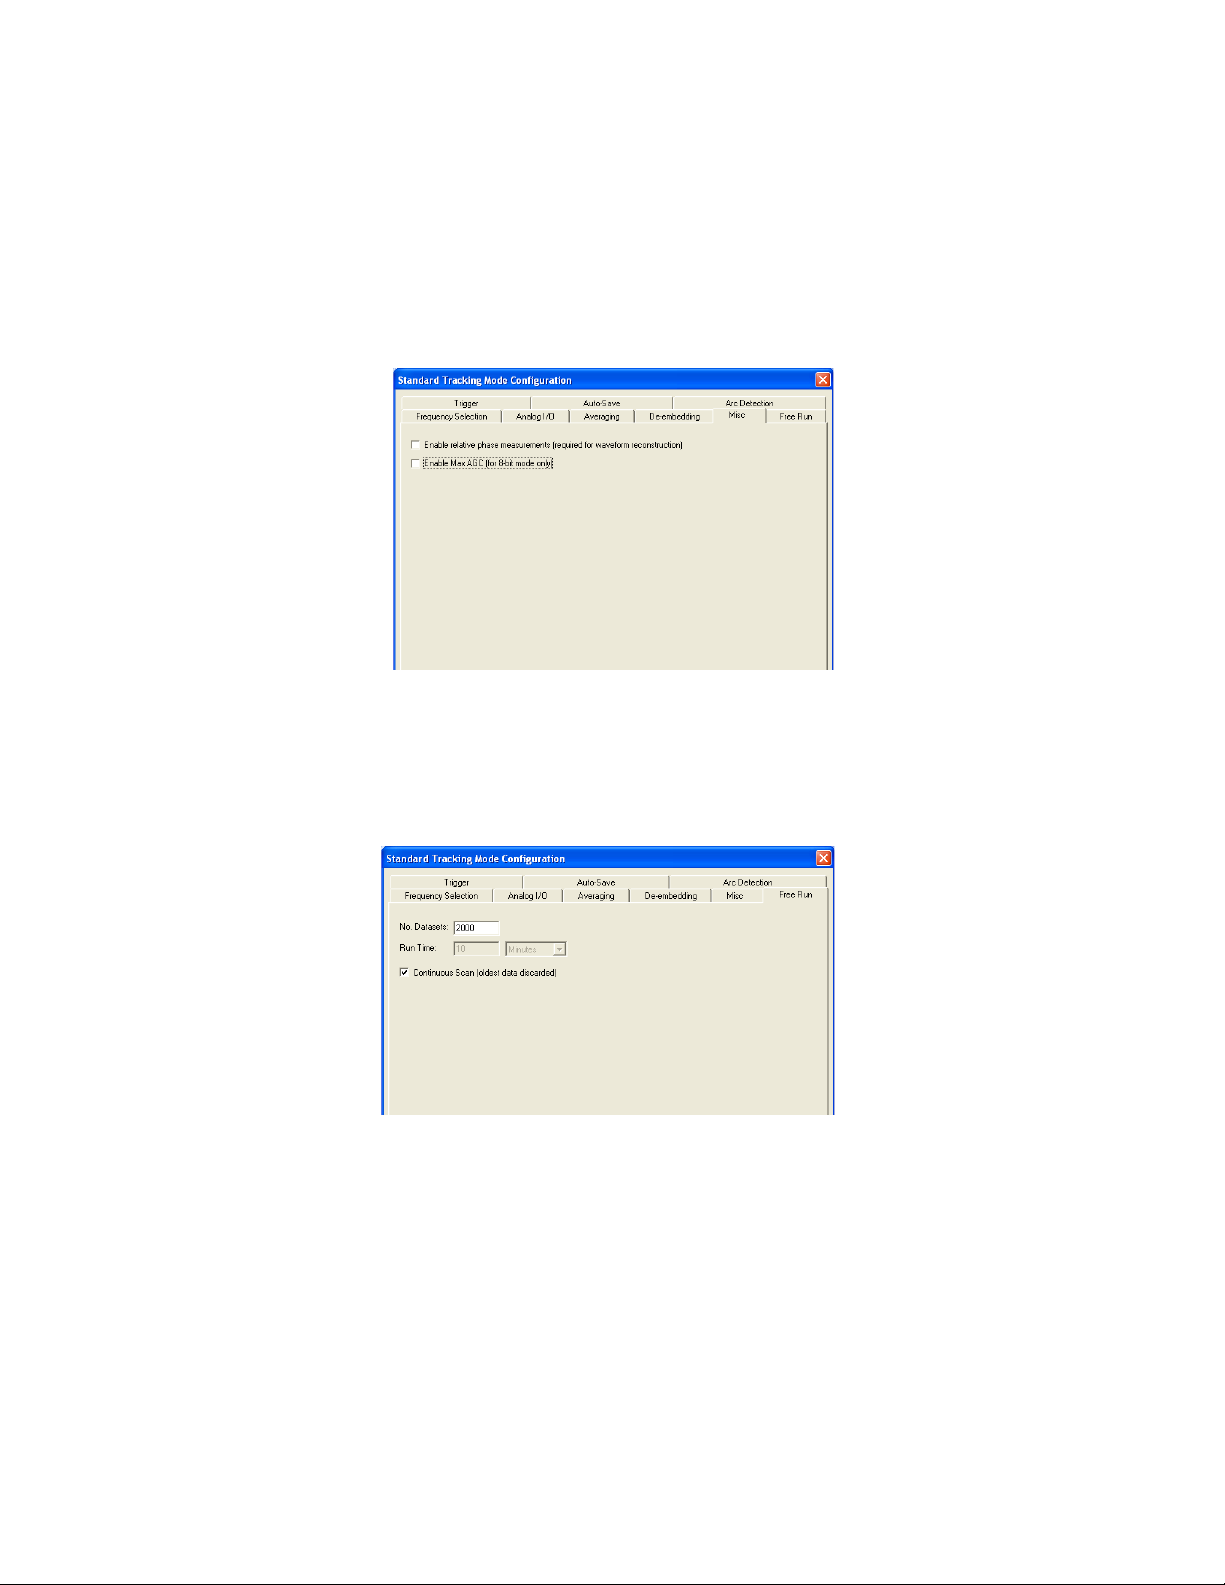
Misc
Enable relative phase measurements (required for waveform reconstruction)
This option is used to enable relative phase calculations. Relative phase is the phase of a harmonic relative to its fundamental tone. It is required for waveform reconstruction.
Figure 16 Misc Dialog
Note: Relative phase calculations add significant processing time and will slow down the data update.
Enable Max AGC (for 8-bit mode only) - An advanced option used to lock the attenuators to the highest of the
voltage or current channel so that they are at the same level.
Free Run
Figure 17 Free Run Dialog
Use the Free Run scan mode to scan for data until the specified number of datasets have been collected or a timer
expires, whichever happens first.
If the “Continuous Scan” check box is checked, then data is scanned continuously and the timer is ignored. In Continuous Scan, when the indicated number of datasets has been collected, the oldest data will be discarded to make
room for new data.
Example - If the “No. Dataset” field is set to 2000 and “Continuous Scan” is checked; the
BDS GUI will continuously scan for fresh data. After 2000 datasets are captured; the oldest datasets are discarded to make room for new datasets.
31
Page 46

Tri gge r
Figure 18 Free Run Dialog
Use the Trigger scan mode to wait for an event to occur before collecting data. Select the threshold unit(s) and levels. A trigger event will occur when any of the selected Voltage, Current, or Delivered Power thresholds are
detected. Pre- and post-event windows can be specified to include data that is captured before and after the trigger
event. The Trigger Capture Limits are included to limit the number of datasets acquired, similar to the Free Run limits.
Auto-Save
Figure 19 Auto-Save Dialog
The BDS GUI can be configured to automatically save data at the end of a data acquisition. The auto-save options
allows specifying the folder where the data is saved and also the file format to save it in. The file naming options are
used to produce consistent file names that have a unique timestamp and run number.
Note: File naming is required for auto-save.
32
Page 47

Arc Detection
Arc Detection is used to identify and report transient events in an RF delivery system. The options available in the
“Arc Detection” page are used to specify an arc event and also instruct the BDS how to store the results.
Figure 20 Arc Detection Dialog
Enable Arc Detection- Turns on and off arc detection.
Sample Rate - Period used for peak/magnitude sampling (down-sampled from actual ADC rate).
Note: Range: 50ns to 4us. Default is 1us (1MHz).
Arc Length - Arc Length defines the maximum window that the trailing edge of an arc "pulse" must occur in. An
arc is detected if it has a pulse width less than or equal to the arc length.
Example - A 400us arc length will detect arcs with pulse widths of 400us, 300us, or less,
but not 401us or 500us. Range is 500ns to 2.044ms (depending on Sample Rate).
Note: Default is 400us.
Tri gge r Delay - The Trigger Delay parameter determines how the pre/post recording time is set. It is entered in
the BDS GUI as the percentage of the buffer to report after the falling edge of the arc event. The delay equates to a
time based on the sample period.
Example - For the 8-bit ADC with a sample rate of 1us and a Trigger Delay of 75% would
equal 3.072 ms worth of data post-trigger and 1.024 ms worth pre-trigger.
Min ADC Level - Min ADC Level specifies the minimum count level to accept an arc event. This is used to prevent
spurious arc events, especially events reported when measuring the noise floor. The value is entered as a percentage
of full-scale.
Note: Range is 0-100%. Default is 50%.
Note: At least 8% is recommended to avoid false positives while measuring the noise floor.
Power Threshold - The Power Threshold parameter is used to define the minimum pulse amplitude that must be
detected before reporting an arc event.
Note: Thresholds include: 6 dB, 4 dB, 2 dB, & 1 dB. Default is 6 dB.
Example - If the 6 dB level is selected, only pulses with amplitudes of 6 dB or greater over
the base signal are reported as arc events. A 4 dB pulse will not be reported when the 6 dB
level is selected.
Log data to BDS Receiver - This option will log the arc results data to the BDS receiver in non-volatile storage.
The “Arc Data Viewer” can be used to retrieve the data from the receiver after it has been collected.
Note: The “Arc Data Viewer” is launched from the main menu under “Tools-> Arc Data Viewer…”.
Log Data to PC Immediately - This will log the arc results data to a specified folder on your PC upon detection of
a transient event.
33
Page 48

Spectral Search (Sweep) Mode Options
Sweep
The “Sweep” page provides options for defining the frequency band.
Figure 21 Arc Detection Dialog
Resolution - Select the sweep resolution as 8-bit or 12-bit.
• 8-bit resolution allows a sweep range of 10 kHz to 500 MHz.
• 12-bit resolution allows a sweep range of 10 kHz to 100 MHz.
Frequency Step Size - This allows for the selection of either a uniform step size where each step is the same or
scale that has the frequencies increasing exponentially. The “Exponentially increasing” option will provide higher
resolution (the steps are tighter) at the lower frequencies in the sweep. It is useful for better quality scans of the
lower frequencies.
No. Points - The number of points in the sweep can be specified and keep it fixed with the “Fixed” option.
• If “Fixed” is not checked, then the number of points will be automatically determined based on the start,
stop, & step.
• If “Fixed” is checked, then the number of points will remain the same, but the step will change to accom-
modate the sweep.
Start & Stop - Defines the frequency band to sweep over.
Step - The frequency used as the increment when sweeping from the start to the stop frequency.
Note: This is only used for a “Uniform” step size.
Filter Resolution - Filter Resolution allows control over the resolution of the DFT filters for a higher or lower reso-
lution picture.
Note: The value is entered as a frequency for uniform step size. It is entered as a percentage of the step for
an exponentially increasing step scale.
Continuous Sweep - Checking this checkbox will instruct the BDS to keep sweeping across the frequency band.
Note: This option is required to use sweep data averaging. Not checking this option will instruct the BDS to
stop sweeping once it completes a single band sweep.
34
Page 49

Default Settings - Clicking this button will restore the default sweep settings.
• Resolution: 12-bit
• Frequency Step Size: Uniform
• No. Points: 2100 (Fixed)
• Start Frequency: 1 MHz
• Stop Frequency: 100 MHz
• Frequency Step: 47.165 kHz
• Filter resolution equals frequency step: Checked
• Continuous Sweep: Checked
Averaging
Controls the number of sweeps to average. Sweeps are averaged successively as they are made available, so the signal-to-noise ratio improves over time. Up to 100 sweeps can be averaged. Sweep data averaging is only available
when the “Continuous Sweep” option is checked.
Figure 22 Averaging Dialog
Smoothing
Enabling smoothing will filter out noise by averaging a specified number of neighboring points.
Figure 23 Smoothing Dialog
Smoothing Window Size - Determines how many points to average before and after a center point.
Smoothing Passes - Takes multiple passes thought the sweep data, applying the same smoothing filter on each pass.
Note: Smoothing can be used in combination with data averaging. In can also be used on a single sweep
(“Continuous Sweep” can be enabled or disabled) or even be changed while sweeping.
35
Page 50

Peak Locator
This page controls the peak locator algorithm that runs on each set of sweep data.
Figure 24 Smoothing Dialog
No. Peaks - Specify the number of peaks to locate and define the noise threshold in dB that defines a peak.
Peak Threshold - Sets the peak threshold.
Note: Increasing this may help avoid false positives.
Peak Lock - Displays all previous peaks on the graph, overlaying the most recent sweep data.
Graph Options
This page provides display options for the frequency-domain sweep view.
Figure 25 Graph Options
Display Units - Allows the user to switch amplitude display formats:
• Voltage
• Current
• Impedance
• Watts
• dBm
Note: The format type can also be selected by right-clicking on the graph and selecting one of these format
types from the pop-up window.
Annotate Peaks - This option will display the peak frequencies on the graph.
Auto-Save & Arc Detection
These pages are identical to "Auto-Save" on page 32 & "Arc Detection" on page 33 in the Standard Tracking Mode
Options section. They share the same settings stored in the system registry.
36
Page 51

Chapter 4 Maintenance
This chapter describes routine maintenance, along with troubleshooting instructions for the Bird Diagnostic System
(BDS). For service beyond this level, return the unit to a qualified service center.
The BDS requires only simple, routine maintenance.
• Wipe off dust and dirt regularly.
• Check the connectors and cables for damage.
• Clean the connector contacts with alcohol or dry cleaning solvent.
Cleaning
To clean the Bird Diagnostic System receiver, use only a soft cloth dampened with mild detergent and rinse with
water. Clean the sensor with alcohol or a dry cleaning solvent that leaves no residue.
Updating BDS Software
Note: Port 1 of the receiver has the default IP address of 192.168.0.151. See “Configuring Network Set-
tings” on page 9.
1. Connect an Ethernet cable to Port 1 (on the left).
2. Power up the receiver (takes a couple minutes).
3. Open Internet Explorer
4. Select “Tools->Internet Options…” from the main menu.
5. Click the “Connections” tab.
6. Click the “LAN Settings…” button near the bottom.
7. Ensure the following checkboxes are deselected (see figure below).
• “Automatically detect settings”
• “Use automatic configuration script”
• “Use a proxy server for your LAN. …”
Figure 26 LAN Settings
8. Click “OK”.
37
Page 52

9. Click “OK”.
10. In the Address bar, enter the following: http://192.168.0.151
Note: The BDS Web UI home page should come up.
11. Click “Login”.
12. Enter the following:
• Username: admin
• Password: admin
13. Click “Updates”.
14. Use the “Browse” button to select the file with the “tar.gz.bdsu” file extension.
15. Click the “Apply Update” button to upload the file.
Note: For older system you may have to check the “Upload” checkbox for “File
System Upload” and then select the file with the “Browse” button.
Figure 27 Web Update
Note: It may take a couple minutes to upload the file to the BDS.
16. Disconnect power from the receiver and then reconnect power to apply the update.
Troubleshooting
This manual cannot list all malfunctions that may occur, or corrective actions. If a malfunction is not listed or is not
corrected by the listed corrective actions, contact a qualified service center.
Health LED Codes
These 4 LEDs are located on the receiver’s front panel.
Note: O = Off, R = Red, G = Green, Y = Yellow
38
Page 53

Code Description Action
OOOO No power applied. Reboot the receiver by
RRRR CPU exception to unknown vector.
OROR RAM Failure
ORRO Bootloader checksum failure.
ORRR Kernel failure.
OOOR CPU Fault – Illegal instruction.
OORO CPU Fault – Address error.
OORR CPU Fault – Unimplemented A-line.
OROO CPU Fault – Unimplemented F-line.
YYOO Bootloader RAM test pass. These LED codes are normally
YYYO Bootloader loaded.
YYYY Bootloader running.
GYYY Operating system loaded.
GGYY Operating system running.
GGGY Main applications running, but calibration
data has not been loaded (the probe is
disconnected).
GGGG System is ready with all components
connected and all calibration data loaded.
YGGY Loading FPGA image. This code is normally displayed
RYYY DSP error – general or initialization failure. Update the firmware.
YRYY DSP error – DCM lock failure. Reboot the receiver by
YYRY DSP error – PLL lock failure.
YRRY DSP error – heartbeat flat-line. DSP stopped
producing data.
YYYR Fatal application software error –
unrecoverable exception caught.
RYRY Fatal application software error – assertion
failure.
YRYR Fatal application software error –
segmentation fault.
YYRR Fatal application software error – bus error.
disconnecting power and then
reconnecting power.
displayed during receiver boot-up.
If the BDS reports any one of
these codes for an indefinite
amount of time reboot the
receiver by disconnecting power
and then reconnecting power.
Attach the probe to the receiver
and wait approximately 1 minute.
No action. Ready for use.
during receiver boot-up. Update
the firmware if the BDS reports
this code for an indefinite
amount of time.
disconnecting power and then
reconnecting power.
Update the firmware and/or
reboot the receiver by
disconnecting power and then
reconnecting power.
39
Page 54

Specifications
Frequency range 1 - 500 MHz (sensor dependent)
Frequency resolution 100 Hz
Frequency accuracy ± 1 kHz
Frequency Tracking For frequency-agile applications, the frequency must
Harmonics 15 maximum (in addition to the fundamental), up to
Intermodulation Products Up to 6 IMD frequencies per fundamental, 3 “minus”
Number of fundamental
frequencies (F
Analog inputs Two analog inputs (0 - 10 Vdc full-scale, 10k ohm
Analog outputs Five individual outputs (0 - 10 Vdc full-scale, 1000
Digital outputs Voltage, current, phase, frequency, impedance, and
Data update rate Data rate is dependant on system configuration
Interfaces DeviceNet, Ethernet
RF power, max 10 kW (maximum power is limited by the size of the
RF connector Custom or Bird QC (maximum power is limited by the
Operating power Single Receiver: 11- 25 VDC, 3 - 1.4 A
Parameter Specification
be stable for at least 12.5 ms for 8-bit measurements
and 30 ms for 12-bit measurements in order to
receive valid data. During frequency changes data
drop-outs will occur.
500 MHz, Sensor Dependent
and 3 “plus” (measurement dependent).
F1-3F2, F1-2F2, F1-F2
F1+3F2, F1+2F2, F1+F2
Up to 5
)
0
resistance). Can be assigned to any of the analog
outputs or used for set-point or power threshold
adjustment.
ohm source impedance representing voltage, current,
phase, impedance - with or without externally
supplied variables applied).
power at frequencies selected by the user. See Table
1.
(Typical data rate for 1 fundamental, 15 harmonics,
auto-ADC mode, and no averaging is 60 Hz. Typical
data rate for 3 fundamentals, 45 harmonics, auto-ADC
mode, and no averaging is 24 Hz. Data rate can vary
significantly depending on configuration, network
traffic, and host performance.)
sensor line section and connectors)
size of the sensor line section and connectors)
40
Page 55

Voltage, Current and Phase Measurement Characteristics
Parameter Voltage Current Phase Angle
Measurement
Range
RF: 1 to 3000 Vrms
(Maximum power is
limited by the size of
the sensor line section
and connectors. See
sensor specification
document.)
0.1 to 100 Arms
(Maximum power is
limited by the size of
the sensor line section
and connectors. See
sensor specification
document.)
Resolution IEEE 754 Single Precision Floating Point
Uncertainty
1 - 100 MHz
(At customer
o, ± 0.2 V or 2% of
for F
reading, whichever is
greater
o, ± 0.02A or 2%
for F
of reading, whichever
is greater
specified
frequencies.)
Uncertainty
100 - 500 MHz
(At customer
n, ± 0.4 V or 4% of
for F
reading, whichever is
greater
(95% confidence
interval)
for Fo, ± 0.3 V or 3%
of reading, whichever
is greater
n, ± 0.04A or 4%
for F
of reading, whichever
is greater
(95% confidence
interval)
for Fo, ± 0.03 A or 3%
of reading, whichever
is greater
specified
frequencies.)
for Fn, ± 0.6 V or 6%
of reading, whichever
is greater
(95% confidence
interval)
for Fn, ± 0.06 A or 6%
of reading, whichever
is greater
(95% confidence
interval)
–180° to +180°
Absolute Angle:
o = 10V, 1A: ±1°
for F
o < 10V, 1A: ±4°
for F
n = 10V, 1A: ±2°
for F
n < 10V, 1A: ±6°
for F
(95% confidence
interval)
Absolute Angle:
for Fo = 10V,1A: ±2°
for Fo < 10V,1A: ±8°
for Fn = 10V,1A: ±4°
for Fn < 10V,1A: ±12°
(95% confidence
interval)
Receiver
Temperature
Derating from 25 ° C
± 0.05% / °C ± 0.05% / °C ± 0.1% / °C
41
Page 56

Physical and Environmental
Parameter Specification
Dimensions & Weight
Cable, RF/Data
Single Receiver
Multi-Receiver Chassis
Tem per atur e
Receiver Operating
Receiver Storage
Cable Operating
Cable Storage
Sensor Operating
Sensor Storage
Humidity 85% Non-condensing
Air Pressure 745 mbar (equivalent to 2,500 m / 8,200 ft. max altitude)
Safety Standards NRTL listed for UL61010B-1 Safety requirements for test and
EMC Standards FCC Part 18 (47 CFR 18) - Industrial, Scientific, and Medical
Packaging ASTM D 4169 Standard practice for performance testing of
1, 2, 3, 3.5 and 5 meter and 12 inch lengths
11” Width x 7-1/8” Depth x 2” Height, 3.1 lb (1.4 kg)
2 Receivers: 12 ¼ “ Width x 12 ½ “ Depth x 4” Height
4 Receivers: 9 ¼ “ Width x 12 ½ “ Depth x 12 ¼ “ Height
7 Receivers: 13 ½ “ Width x 12 ½ “ Depth x 12 ¼ “ Height
9 Receivers: 17 ¾ “ Width x 12 ½ “ Depth x 12 ¼ “ Height
9 Receivers rack mount: 19” Width x 12 ½ “ Depth x 12 ¼ “ Height
+20 to +40 °C (68 to 104 °F)
–20 to +80 °C (–4 to +176 °F)
0 to +100 °C (32 to 212 °F)
-20 to +100 °C (-4 to 212 °F)
Refer to sensor specification
Refer to sensor specification
measurement equipment.
SEMI S2 EHS Guideline for Semiconductor Manufacturing
Equipment (Only for items over and above UL61010B-1)
Equipment EMC
EN61000-6-2 Electromagnetic Compatibility (EMC): Generic
standards - immunity standard for industrial environments
EN61000-6-4 (Group 2, Class A) Electromagnetic
Compatibility (EMC): Generic standards - emission standard
for industrial environments
shipping containers and systems
42
Page 57

Indicators and Connectors
Indicator & Connector Specification
Calibrated Cable Set
Temperature/Data
Cable,Sensor
Interface
Temperature/Data
Cable, Receiver
Interface
Fischer WSO 102 A056-150 Connector
9-Pin D-Sub
Voltage Cable
Current Cable
Sensor
Voltage Output
Current Output
Temperature/Data
Output
Receiver
Voltage Input
Current Input
Temperature/Data
Input
Status Display
Ethernet
DeviceNet
Analog Input/Output
Power Indicator
RP-SMA, male (reverse polarized)
SMA, male
RP-SMA, female (reverse polarized)
SMA, female
Fischer DBPU102A056-1.30
RP-SMA, female (reverse polarized)
SMA, female
9-pin D-sub
Four, Tri-color LEDs for health, two for DeviceNet Status
Two RJ-45 10/100 Connectors with LED status
Lumberg RSWF5-PCB 5-pin Circular Connector
High Density D-Sub, 15-pin
LED, Green
Reset
Power
Recessed Push button
CPC 4-Pin Circular Connector
43
Page 58

Data Outputs
VI⁄
θ
V
rmsIrms
×()
yxb+()acos=
θ
Z
Tabular Display
Parameter Definition Symbol Unit
Frequency Fundamentals (Fo),Harmonics (F1, F1 …F15), and IMD Fn Hz
Voltage RMS voltage Vrms Volts
Current RMS current I
Impedance Magnitude of Impedance, Z Ohms
Phase Angle Phase between V and I
Power Average Power cosine ( ) P Watts
Relative Power Harmonic power relative to the fundamental power dBc Decibels
Relative Phase Phase between harmonic and F
0. n Degrees
Graphical Display
Parameter Definition Symbol Unit
Voltage Waveform Voltage waveform versus time, V(t) vs. t V(t) Volts
Current Waveform Current waveform versus time, I(t) vs. t I(t) Amps
Impedance Waveform Impedance waveform versus time, vs. t Z(t) Ohms
Power Waveform Power waveform versus time, P(t) vs. t P(t) Watts
Voltage Magnitude Plot Voltage magnitude of a selected frequency vs. t V(f) Volts
Current Magnitude Plot Current magnitude of a selected frequency vs. t I(f) Amps
Impedance Plot Impedance magnitude of selected frequency vs. t Z(f) Ohms
RMS Power Plot RMS power of a selected frequency vs. t. P(f) Watts
Phase Angle Plot Phase angle between V and I of selected frequency vs. t ?(f) Degrees
Power Spectral Density Relative power versus frequency dBr Decibels
rms Amps
n Degrees
44
Page 59

Optional Accessories
QC Connectors
Connector Description
4240-002 7/8 in. swivel flange EIA
4240-012 M LT/assy
4240-018 QC F-LT
4240-025 QC M-LC
4240-031 QC F-LC
4240-050 QC F-UHF
4240-062 QC F-N
4240-062-2 QC F-N, silver plated
4240-062-3 QC F-N, gold contact
4240-063 M-N assembly
4240-063-3 M-N, gold plated pin
4240-075 QC F-LC bulkhead
4240-080 QC assembly
4240-090 QC F-SC
4240-096 1-5/8, fixed flange EIA
4240-100 QC F-C
4240-110 QC M-C
4240-125 QC F-BNC
4240-132 QC M-BNC
4240-138 M-LC UG156A/U
4240-149 QC F-LC UG157B/U
4240-156 F-TNC
4240-160 QC M-TNC
4240-165 QC adapter coupling block
4240-179 QC M-UHF
4240-180 QC connector, coplanar
4240-187 Adapter, unflanged
4240-194 Adapter, 3-1/8 flanged
4240-201 Adapter, QC 7/8 in.
4240-208 1-5/8 swivel flanged EIA
4240-244 Adapter, rt. angle, QC to QC
4240-254 GR
4240-260 Adapter, QC 1-5/8 in.
4240-268 QC HN(f)
4240-278 QC M-HN
4240-318 QC M LC
4240-334 QC M-SMA
4240-336 F-SMA
4240-344 7/16 IEC coaxial
4240-346 Mini F-UHF
45
Page 60

Connector Description
4240-353 QC M-SC
4240-363 IEC 7/16, plug
4240-365 M-IEC 7/16 in.
4240-366 Socket, IEC 13/30
4240-370 QC M-SQ
4240-371 QC F-SQ
4240-372 QC F-SQS
4240-373 QC F-QDS/UL
4240-374 QC M-QDS/UL
4240-375 QC M-SQS polarized
4240-376 QC M-QRM F
4240-377 QC M-QRM F
4240-378 QC M-QRM M polarized
4240-400 Adapter kit, RF interseries
4240-401 Adapter kit, RF interseries
4240-402 M-N connector
4240-403 F-N connector
4240-404 M-BNC connector
4240-405 F-BNC connector
4240-406 M-TNC connector
4240-407 F-TNC connector
4240-408 M-UHF connector
4240-409 F-UHF connector
4240-410 M-SMA connector
Cable Sets
The three cables that carry voltage, current, and data from the sensor to the receiver are combined to form a
molded cable set with three connectors on each end. The voltage and current conductors are available in either a
straight connector or a right angle connector. These cable sets may be ordered in the lengths listed in this table.
Part No. Description
7001A040-55-2M BDS RF/Data Cable Set, 2m straight conn
7001A040-55-5M BDS RF/Data Cable Set, 5m straight conn
46
Page 61

Specifications, DeviceNet
Protocol
DeviceType 0x00 - Generic Device
Protocol DeviceNet, Group 2 slave only
Cable Lengths 125kbps: 500m (1650ft)
Data Rates: 125kbps, 250kbps, 500kbps.
MAC ID (address 00-63)
Network Size Up to 64 nodes per segment.
Specification for DeviceNet "Custom Profile"
250kbps: 250m (825ft)
500kbps: 100m (330ft)
The rotary switch labeled "DATA RATE" located on the back
panel sets the data rate.
The two (2) rotary switches labeled "ADDRESS" located on
the back panel sets the MAC ID (MSD and LSD).
Network and Module Status LEDs are available on the back
Explicit Peer-to-Peer
Messaging
I/O Peer-to-Peer Messaging no
Configuration
Consistency Value
Faulted Node Recovery no
Master / Scanner no
I/O Slave Messaging
Bit Strobe:
Polling:
Cyclic:
Change of State
(COS):
Configuration Methods
Hardware Switches
EDS
Parameter Object
Custom Software
Materials
Mechanical Data
Electrical Data
*
Contact
Insert
Shell
Coupling nut
1
Protection
O-ring
Insertion force
Withdrawal force
1
Contact resistance
Current rating
Working voltage
Dielectric withstanding
voltage
Insulation resistance
no
no
no
yes
no
no
yes
yes
no
no
Solid, machined brass Gold over nickel plating per DeviceNet spec
Nylon, black
Brass, nickel plated
Brass, nickel plated
IP68, NEMA 6P (fully locked)
Viton
< 2.0n, 0.45lbs.
> 0.5N, 0.11lbs.
< 5mOhms
3A
250 VAC
2 KVAC eff/60 seconds VDE 0110
> 109 Ohms
* DeviceNet connector
47
Page 62

Connector Specifications
1
2
3
4
5
Connector Type: DeviceNet 5-pin shielded micro-style male connector.
Figure 28 DeviceNet Connector Pin Assignment
Item Description
1Drain
2V +
3V –
4CAN_H
5CAN_L
DeviceNet Communication Interface Guide
To obtain the full DeviceNet Interface guide, please log onto our website at:
www.bird-technologies.com/bds
48
Page 63

Customer Service
Any maintenance or service procedure beyond the scope of those in this chapter should be referred to a qualified
service center.
If you need to return the unit for any reason, request an RMA through the Bird Technologies website (link shown
below). All instruments returned must be shipped prepaid and to the attention of the RMA number.
Bird Service Center
30303 Aurora Road
Cleveland (Solon), Ohio 44139-2794
Fax: (440) 248-5426
E-mail: bsc@bird-technologies.com
For the location of the Sales Office nearest you, visit our website at:
http://www.bird-technologies.com
49
Page 64

50
Page 65

Chapter 5 DeviceNet
Introduction
Definitions
• Network Host – The DeviceNet network master. Commonly a scanner card in a Programmable Controller.
• Network Slave – A DeviceNet device implementing sever functionality in a DeviceNet system.
• PLC – Programmable Logic Controller – refers to the DeviceNet Network Host.
Note: See Appendix A for data type definitions.
Reference Documents
• CIP Library Volume 3 “DeviceNet Adaptation of CIP” Edition 1.2
• CIP Library Volume 1 “Common Industrial Protocol (CIP™)” Edition 3.0
Open DeviceNet Vendor Association, Inc. (ODVA)
ODVA is an independent supplier organization that manages the DeviceNet specification and supports the worldwide growth of DeviceNet.
ODVA on the web: http://www.odva.org/
DeviceNet System Operation
MAC ID & Baud Rate Configuration
Three rotary switches are used to configure the MAC ID (Node Address) and Baud Rate (Data Rate) of the device. The
rotary switches are defined as follows:
Figure 1 MAC ID Rotary Switch Layout
51
Page 66

Rotary switches S2 (MSD) and S3 (LSD) are used to select the DeviceNet MAC ID (Node Address). The valid range of
addresses is: 0-63. Switch combinations that produce an address greater than 63 will force the device into a “MAC ID
software configuration mode”. While in the “MAC ID software configuration mode” the device MAC ID will be set to
the last MAC ID that the device was powered up at and will allow software configuration tools to modify the value of
the MAC ID.
Figure 2 Baud Rate Rotary Switch Layout
The S1 rotary switch (DATA RATE) is used to select the DeviceNet baud rate. The following is a valid range of baud
rates:
• 0 – 125kbps
• 1 – 250kbps
• 2 – 500kbps
• 3 and above – “Baud Rate software configuration mode”
All values above 2 will force the device into a “Baud Rate configuration mode”. While in the “Baud Rate configuration mode” the device baud rate will be set to the last baud rate the device was powered up at and will allow software configuration tools to modify the value of the baud rate.
LED Operation
Two LED’s are provided on the front panel of the BDS: Network Status and Module Status. See the figure below.
Figure 3 LED Labeling
Table 5-1 Network Status LED Operation (NET)
LED Color LED State Description
None Off No power applied to device.
Red Solid Unrecoverable fault detected.
Flashing Output error or configuration error
(recoverable fault).
Green Solid Normal runtime operation.
Flashing Device is idle or not allocated to a
master.
52
Page 67

Table 5-2 Module Status LED Operation (MOD) –
Corresponds to the Status attribute of the
Identity Object
LED Color LED State Device State Description
None Off Power Off No power applied to device.
Red Flashing Minor Fault Unrecoverable fault detected.
Solid Unrecoverable
Fault
Output error or configuration error
(recoverable fault).
Green Flashing Device
Self-Test
Solid Device
Operational
Normal runtime operation.
Device is idle or not allocated to a
master.
DeviceNet Pin Assignment
The BDS uses a micro-style 5-pin male connector. See the figure below for pin assignments.
Figure 4 DeviceNet Pin Assignment
Pin Function Color
1Drain Bare
2V+ Red
3V- Black
4CAN_HWhite
5 CAN_L Blue
DeviceNet Interface
Overview
DeviceNet™ is an open industrial network that is used to connect industrial I/O devices (such as sensors and limit
switches) to controllers (such as PLC’s). It is a digital, multi-drop network based on CAN (Controller Area Network)
and CIP™ (Common Industrial Protocol). DeviceNet is a very robust protocol designed to meet the strict reliability
and performance requirements of the industrial environment.
Configuration
The BDS supports the standard DeviceNet MAC ID (Node Address) and Baud Rate (Data Rate) selections. The MAC ID
and Baud Rate and be selected from the rotary switches on the front panel or through DeviceNet configuration software. See section 3.2 for details.
All configuration data is saved in non-volatile memory.
53
Page 68

Initialization
The BDS supports standard duplicate MAC ID detection processing during power on initialization.
Group 2 Only Slave Operation
The BDS supports allocation of the DeviceNet Group 2 Master/Slave connection set through the Group 2 Unconnected message port.
Table 5-3 Group 2 Only Slave Operation
Group Identifier Bits Message Type
1 01111xxxxxx Slave’s I/O Poll Response Acknowledge Message
2 10xxxxxx011 Slave’s Explicit / Unconnected Response Message
2 10xxxxxx100 Master’s Explicit Request Messages
2 10xxxxxx101 Master’s I/O Poll Command Message
2 10xxxxxx110 Group2 Only Unconnected Explicit Request
Messages
2 10xxxxxx111 Duplicate MAC ID Check Messages
Certification
This unit is to be tested and certified as an ODVA compliant device.
BDS Object Model
Overview
The following sections outline the DeviceNet Object Model for the BDS. The Object Model describes BDS configuration parameters and how data is produced over the network. The following table is a list of standard CIP and application-specific objects. Application-specific objects have class codes of 100 (64HEX) and above.
Object Class Class Code Number of Instances
Identity 1 (01HEX) 1
Message Router 2 (02HEX) 1
DeviceNet 3 (03HEX) 1
Assembly 4 (04HEX) 2
Connection 5 (05HEX) 2
S-Device Supervisor 48 (30HEX) 1
Component 100 (64HEX) 1
Application 101 (65HEX) 8
Attenuation Control 104 (68HEX) 1
Standard Mode 105 (69HEX) 5
54
Page 69

Identity Object – Class Code: 1 (01HEX)
Table 5-4 Identity Class Attributes (Instance 0)
Attrib Rule NV Name Data Type Description Value
1 Get NV Revision UINT Revision level of this object. 1
Table 5-5 Identity Instance Attributes (Instance 1)
Attrib Rule NV Name Data Type Description Value
1 Get NV Vendor ID UINT Identification of each
2 Get NV Device
Type
3 Get NV Product
Code
4 Get NV Revision STRUCT of: Revision Firmware
Major
Revision
Minor
Revision
5 Get NV Status WORD Device status See Status Word
6GetNVSerial
Number
7 Get NV Product
Name
UINT Indication of general
UINT Identification of a
USINT Major Revision
USINT Minor Revision
UDINT Serial number of device. BDS system
SHORT_ST
RING
vendor by number
type of product
particular product of an
individual vendor
Human readable
description.
1000
0
1
revision
S/N
“Bird Diagnostic
System (BDS)”
Table 5-6 Identity Status Word
Bit Bit = 0 Bit = 1
0 Not Owned Owned
1 Unused Unused
2 No configuration since the last out-of-box reset.
The device still has factory default settings.
3-15 Unused Unused
The device has been configured
since last out-of-box reset.
Table 5-7 Identity Common Services
Identity Object Instances
Service
Code
14
(0EHEX)
Class Instance Service Name Description of Service
Yes Yes Get_Attribute_Single Returns the contents of the
specified attribute.
Table 5-8 Identity Object Instances
Instance Name Description
1 Identity BDS Identity instance.
55
Page 70

Message Router Object – Class Code: 2 (02HEX)
Table 5-9 Message Router Class Attributes (Instance 0)
Attrib Rule NV Name Data Type Description Value
1 Get NV Revision UINT Revision level of this object. 1
Table 5-10 Message Router Instance Attributes (Instance 1)
Attrib Rule NV Name Data Type Description Value
1 Get NV Object
List
Number UINT Number of
Classes ARRAY
STRUCT
of:
of:UINT
Table 5-11 Message Router Common Services
Service
Code
14 (0x0E) Yes Yes Get_Attribute_Single Returns the contents of the
Class Instance Service Name Description of Service
Table 5-12 Message Router Object Instances
Instance Name Description
1 BDS Message Router BDS Message Router instance.
DeviceNet Object – Class Code: 3 (03
HEX
A list of supported
objects.
supported classes
in the classes array.
List of supported
class codes.
specified attribute.
)
10
01h,02h,03h,04h,05
h,30h,64h,65h,68h,
69h
56
Table 5-13 DeviceNet Class Attributes (Instance 0)
Attrib Rule NV Name
1 Get NV Revision UINT Revision level of this
Data
Typ e
Description Value
object.
1
Page 71

Table 5-14 DeviceNet Instance Attributes (Instance 1)
Attrib Rule NV Name
1Get/
Set
2Get/
Set
3Get/
Set
4Get/
Set
5 Get Allocation
6 Get NV MAC ID
7GetNVBaud rate
8 Get NV MAC ID
9GetNVBaud rate
NV MAC ID USINT Node address 11 (0x0B)
NV Baud Rate USINT Baud Rate 2
NV Bus Off
Interrupt
NV Bus Off
Counter
Info
NV Allocation
Choice
NV Master’s
MAC ID
Switch
Changed
switch
change
switch value.
switch value.
Data
Type
BOOL Defines how CAN
USINT The number of times CAN
STRUCT
of:
BYTE Allocation choice byte. 0xFF
USINT MAC ID of master
BOOL The node address
BOOL The baud rate switch
USINT Actual value of the
USINT Actual value of the
Description Value
Rotary Switch
factory set
Rotary Switch
factory set
0 (default)
handles BUS OFF
interrupt.
0 (default)
went into BUS OFF state.
0
(from Allocate service).
0
switches have changed
since last power-up/reset
0
has changed since last
power-up/reset.
11
node address switches.
2
baud rate switch.
Table 5-15 DeviceNet Common Services
Service
Code
14 (0x0E) Yes Yes Get_Attribute_
16 (0x10) No Yes Set_Attribute_
75 (0x4B) No Yes Allocate_Master/
76 (0x4C) No Yes Release_Group2
Class Instance Service Name Description of Service
Returns the contents of the specified
Single
Single
Slave_Connection
_Set
_Identifier_Set
attribute.
Modifies an attribute.
Requests the use of the Predefined
Master/Slave Connection Set.
Indicates that the specified Connections
within the Predefined Master/Slave
Connection Set are no longer desired.
These Connections are to be released
Table 5-16 DeviceNet Object Instances
Instance Name Description
1 BDS DeviceNet BDS DeviceNet instance.
57
Page 72

Assembly Object – Class Code: 4 (04
Table 5-17 Assembly Class Attributes (Instance 0)
HEX
)
Attrib Rule NV Name
1 Get NV Revision UINT Revision level of this
2 Get NV Max Instance UINT Maximum instance
100 Set/
Set
101 Get V Input Assembly
102 Get V Num
103 Get V System Status DWORDBDS system status
104 Get V Timestamp DATE_
V Input Assembly
Instance ID
Size
Measurements
Data
Type
USINT Selected input
UINT Selected input
USINT The total number of V
AND_
TIME
Description Value
object.
number.
assembly instance
ID. Changing the
value of this attribute
will also change the
value of the “Input
Assembly Size”
attribute.
assembly size in
bytes – the number of
bytes produced by
the BDS for the
selected assembly.
Setting the “Input
Assembly Instance
ID” attribute will
change this value.
Setting the “Num
Fundamentals” or
“Fundamental
Selection” attributes
from the “Standard
Mode” class will also
change this value.
& I measurements
contained in the
selected input
assembly instance.
This value is based
on the “Standard
Mode” configuration.
bitfield.
Note: Changing any
attributes in the
“Standard Mode” or
“Application” classes
will reset the status
(to a value of 0).
Data acquisition
timestamp.
2
101
One of the
following:
HEX
HEX
)
)
100 (64
101 (65
Default: 101
Based on the
Input
Assembly
Instance ID
attribute and
the Standard
Mode object
configuration.
Inst 100: 102760
Inst 101: 96
Default: 96
bytes
Based on
Standard
Mode object
configuration.
Min: 0
Max: 110
Default: 0
See “BDS
System Status
Bitfield” in the
Appendix for
status bit
descriptions.
A value of 0
means nothing
to report.
58
Page 73

Assembly Instance 100 (64
) – BDS Standard Mode Data
HEX
This instance of the Assembly object is used to get all data produced by the BDS while running in the “Standard
Operating Mode”, including harmonics and intermods. The Standard Mode Data instance is selected by setting the
“Input Assembly Instance ID” to 100 (64
on the Standard Mode configuration set using the class-level and instance attributes of the Standard Mode Object
(Class Code 105 (69
HEX
)).
). The number of bytes produced per assembly object instance depends
HEX
Assembly Instance 100 (64
) Attributes (Input Assembly)
HEX
Min number of bytes produced: 10 (No measurement data)
Max number of bytes produced: 2,760 (5 fundamentals w/ 15 harmonics & 6 intermods each).
Attrib Rule NV Name
3 Get V Measurement
Assembly 100 (64
Dataset
) Instance Byte Mapping
HEX
Data
Typ e
ARRAY
of:
USINT
Description Value
A complete measurement
dataset that includes status,
timestamp, attenuation
applied, and measurement
data for each selected
frequency component.
See Assembly
Instance Byte
Mapping. And
Standard Mode
object.
The byte mapping below describes the “full measurement suite” scenario of a configuration with 5 fundamentals
with 15 harmonics and 6 intermodualtion products each (a total of 110 measurements). Each instance has a 10-byte
dataset header followed by the measurement data. Use the “Num Measurements” class-level attribute to read the
number of measurements contained. Note that the measurement data is grouped by fundamental frequency.
59
Page 74

Insta
nce
100
(64
HEX
Type Byte Bit 7 Bit 6 Bit 5 Bit 4 Bit 3 Bit 2 Bit 1 Bit 0
Input 0 BDS System Status
)
4-9 Timestamp
10-34 F1 Harmonic data H0
35-59 F1 Harmonic data H1
……
385-
409
410-
434
435-
459
460-
484
485-
509
510-
534
535-
559
560-
584
585-
609
……
935-
959
960-
984
……
1085-
110 9
……
2210-
2234
2235-
2259
……
2585-
2609
2610-
2634
……
2735-
2759
F1 Harmonic data H15
Intermod 1 (F1 – 3F2)
Intermod 1 (F1 – 2F2)
Intermod 1 (F1 – F2)
Intermod 1 (F1 + F2)
Intermod 1 (F1 + 2F2)
Intermod 1 (F1 + 3F2)
F2 Harmonic data H0
F2 Harmonic data H1
F2 Harmonic data H15
Intermod 2 (F1 – 3F2)
Intermod 2 (F1 + 3F2)
F5 Harmonic data H0
F5 Harmonic data H1
F5 Harmonic data H15
Intermod 5 (F1 – 3F2)
Intermod 5 (F1 + 3F2)
60
Page 75

Assembly Sample Configuration and Byte Mapping
This is an example demonstrating how data is produced with the following Standard Mode object configuration.
2 Fundamental frequencies: 2MHz and 13.56MHz. 2MHz will look at 2 harmonics: 1 and 2, 13.56MHz will look at 1
harmonic: 2. No intermodualtion products are selected.
Standard Mode Object Configuration
Num Fundamentals (class attribute 103) = 2
Fundamental 1 = {2MHz, H0, H1, H2}
Fundamental 2 = {13.56MHz, H0, H2}
With the above configuration, Assembly instance 100 (64HEX) will produce a total of 5 measurements (125 bytes). This
data will have the following byte map:
Instance Type Byte Bit 7 Bit 6 Bit 5 Bit 4 Bit 3 Bit 2 Bit 1 Bit 0
100
(64
HEX
Input 0 BDS System Status
)
4-9 Timestamp
10-34 F1 Harmonic data H0
35-59 F1 Harmonic data H1
60-84 F1 Harmonic data H2
85-109 F2 Harmonic data H0
110-
134
F2 Harmonic data H2
Assembly Byte Mapping Spreadsheet
An MS Excel spreadsheet is provided to help produce a byte map based on a given configuration. It uses macros, so
you will have to enable macros before usage. It will produce a new worksheet with a table similar to the one in the
above sections (4.5.2.2 & 4.5.2.3).
Table 5-18 Assembly Instance 100 (64
) Data Attribute
HEX
Mapping
Data
Class
Compon
ent
Name
BDS
System
Status
TimestampAssembly
F1
Harmonic
data H0
F1
Harmonic
data H1
Name Number Name Number
Assembly
Object
Object
Standard
Mode
Object
Standard
Mode
Object
4 (04
4 (04
103
(69
103
(69
Instance
Number
) 0 System
HEX
)0 Timestamp104 DATE_AN
HEX
1 Measure
)
HEX
1 Measure
)
HEX
Attribute
Status
ments[0]
ments[1]
Data
Type
103 DWORD
D_TIME
3 STRUCT
of:
VIMeas
3 STRUCT
of:
VIMeas
……
61
Page 76

Data
Compon
ent
Name
Class
Attribute
Instance
Name Number Name Number
Number
Data
Type
F1
Harmonic
data H15
F2
Harmonic
data H0
……
F5
Harmonic
data H0
Intermod
1 (F1 –
3F2)
Intermod
1 (F1 +
3F2)
……
Intermod
2 (F1 3F2)
……
Standard
Mode
Object
Standard
Mode
Object
Standard
Mode
Object
Standard
Mode
Object
Standard
Mode
Object
Standard
Mode
Object
103
(69
103
(69
103
(69
103
(69
103
(69
103
(69
HEX
HEX
HEX
HEX
HEX
HEX
1Measure
)
2Measure
)
5Measure
)
1 Intermods
)
1 Intermods
)
2 Intermods
)
ments[15]
ments[0]
ments[0]
[0]
[5]
[0]
3 STRUCT
of:
VIMeas
3 STRUCT
of:
VIMeas
3 STRUCT
of:
VIMeas
5 STRUCT
of:
VIMeas
5 STRUCT
of:
VIMeas
5 STRUCT
of:
VIMeas
Intermod
5
(F1 –3F2)
Standard
Mode
Object
Assembly Instance 101 (65
103
(69
HEX
) – “Common Assembly Data”
HEX
5 Intermods
)
[0]
5 STRUCT
of:
VIMeas
This instance of the Assembly object is used to get data produced by the BDS while running in the “Standard Operating Mode” in a simple format. The Standard Mode Data instance is selected by setting the “Input Assembly Instance
ID” to 100 (64
ber of valid measurements contained in this assembly is determined by the settings of the Application object. The
). The “Application” object (class ID=101(65
HEX
)) is used to configure the Standard Mode. The num-
HEX
instance produces a total of 96 bytes.
62
Page 77

Table 5-19 Assembly Instance 101 (65
) Instance Attributes
HEX
Instance Type Byte bit 7 bit 6 bit 5 bit 4 bit 3 bit 2 bit 1 bit 0
101
(0x65)
Input 0-1 Frequency1 V rms
2-3 Frequency1 I rms
4-5 Frequency1 Phase
6-7 Frequency1 Del. Power
8-9 Frequency1 R
10-11 Frequency1 X
12-13 Frequency2 V rms
14-15 Frequency2 I rms
16-17 Frequency2 Phase
18-19 Frequency2 Del. Power
20-21 Frequency2 R
22-23 Frequency2 X
24-25 Frequency3 V rms
26-27 Frequency3 I rms
28-29 Frequency3 Phase
30-31 Frequency3 Del. Power
32-33 Frequency3 R
34-35 Frequency3 X
36-37 Frequency4 V rms
38-39 Frequency4 I rms
40-41 Frequency4 Phase
42-43 Frequency4 Del. Power
44-45 Frequency4 R
46-47 Frequency4 X
48-49 Frequency5 V rms
50-51 Frequency5 I rms
52-53 Frequency5 Phase
54-55 Frequency5 Del. Power
56-57 Frequency5 R
58-59 Frequency5 X
60-61 Frequency6 V rms
62-63 Frequency6 I rms
64-65 Frequency6 Phase
66-67 Frequency6 Del. Power
68-69 Frequency6 R
70-71 Frequency6 X
72-73 Frequency7 V rms
74-75 Frequency7 I rms
76-77 Frequency7 Phase
78-79 Frequency7 Del. Power
80-81 Frequency7 R
82-83 Frequency7 X
84-85 Frequency8 V rms
86-87 Frequency8 I rms
88-89 Frequency8 Phase
90-91 Frequency8 Del. Power
92-93 Frequency8 R
94-95 Frequency8 X
63
Page 78

Table 5-20 Assembly Instance 101 (65
Component Mapping
) Instance
HEX
Data Component Object
Frequency i * V rms Application 101(0x65) i * V rms 2(0x02) UINT
Frequency i * I rms Application 101(0x65) i * I rms 3(0x03) UINT
Frequency i * Phase Application 101(0x65) i * Phase 4(0x04) INT
Frequency i *
Del.Power
Frequency i * R Application 101(0x65) i * R 6(0x06) UINT
Frequency i * X Application 101(0x65) i * X 7(0x07) INT
Application 101(0x65) i * Del.
ClassIDInstance
ID
Attribute
Power
AttributeIDData
Type
5(0x05) INT
* - Instance ID (i) is a value ranging 1-8.
Table 5-21 Assembly Common Services
Service
Code
14 (0x0E) Yes Yes Get_Attribute_Single Returns the contents of the
16 (0x10) Yes Yes Set_Attribute_Single Modifies an attribute.
Class Instance Service Name Description of Service
specified attribute.
Table 5-22 Assembly Object Instances
Instance Name Description
100 Std Mode Data Provides full functionality to access BDS Standard
Mode data in floating-point.
101 Common Data Simplified set of Standard Mode data in fixed-point
format.
Connection Object – Class Code: 5 (05
Table 5-23 Connection Class Attributes (Instance 0)
Attrib Rule NV Name Data Type Description Value
1 Get NV Revision UINT Revision level of this object. 1
64
HEX
)
Page 79

Table 5-24 Connection Instance Attributes (Instance 1)
Attrib Rule NV Name
Data
Type
Instance 1
(Explicit)
1 Get NV State USINT 3 = Established
(default)
2 Get NV Instance
Type
3 Get NV Transport
USINT 0 (Explicit
Message)
USINT 83
HEX
Trigger
4 Get NV Produced
Connection
ID
5 Get NV Consumed
Connection
ID
6 Get NV Initial
UINT 10xxxxxxx011
xxxxxx =
Node Address
UINT 10xxxxxxx100
xxxxxx =
Node Address
USINT 21
HEX
Comm.
Character
7 Get NV Produced
UINT 96 96
Connection
Size
8 Get NV Consumed
UINT 0 0
Connection
Size
9Get/
Set
NV Expected
Packet
UINT 0x09C4 (default)
2500 ms
Rate
12 Get NV Watchdog
USINT 1 (default) 0 = Timeout
Timeout
Action
13 Get NV Produced
UINT 0 (default) 4
Connection
Path
Length
14 Get NV Produced
Connection
Path
15 Get NV Consumed
ARRAY
Empty (default)
of:
USINT
UINT 0 (default) 0
Connection
Path
Length
16 Get NV Consumed
Connection
Path
17 Get NV Production
inhibit time
ARRAY
Empty (default)
of:
USINT
UINT 0 (default) No
inhibit time
Data Value
Instance 2 (Polled)
1 = Configuring
1 (Poll Message)
82
or 83
HEX
01111xxxxxx
BIN
xxxxxx =
Node Address
10xxxxxxx101
BIN
xxxxxx =
Node Address
01
HEX
0
0 (default) No inhibit
time
HEX
BIN
BIN
65
Page 80

Table 5-25 Connection Common Services
Service
Code
05 (0x05) Yes Yes Reset Used to reset the Inactivity/Watchdog
14 (0x0E) Yes Yes Get_Attribute_
16 (0x10) No Yes Set_Attribute_
Class Instance
Service
Name
Single
Single
Table 5-26 Connection Object Instances
Instance Name Description
1 Explicit Explicit Messaging connection instance.
2 Polled Polled I/O Messaging instance.
S-Device Supervisor – Class Code: 48 (30
Table 5-27 Device Supervisor Class Attributes (Instance 0)
Description of Service
Timer associated with a Connection
Object. When a Connection in the Timed
Out or Deferred Delete state receives a
Reset request it also transitions back to
the Established state.
Returns the contents of the specified
attribute.
Modifies an attribute.
)
HEX
Attrib Rule NV Name Data Type Description Value
1 Get NV Revision UINT Revision level of this object. 2
Table 5-28 S-Device Supervisor Instance Attributes
Note: This implementation is missing attributes required by the SEMI spec.
Attrib Rule NV Name Data Type Description Value
1 Get NV Number of
Attributes
2 Get NV Attribute List Array of:
17 Get/
Set
18 Get NV Clock Power
V Time DATE_AND_
Cycle Behavior
USINT Number of Attributes
supported by the
object instance
List of attributes
USINT
TIME
USINT Describes the
supported by the
object instance
The value of the
device’s internal
real-time clock.
behavior of the
device’s internal
real-time clock (the
Time attribute)
during a power cycle
4
1,2,17,18
Set by Master
on device
power up.
0 = [default]
clock always
resets during
power cycle
66
Page 81

Table 5-29 S-Device Supervisor Common Services
Service
Code
14 (0x0E) Yes Yes Get_Attribute_Single Returns the contents of the
16 (0x10) Yes Yes Set_Attribute_Single Modifies an attribute.
Class Instance Service Name Description of Service
Table 5-30 S-Device Supervisor Object Instances
Instance Name Description
1 BDS Supervisor BDS S-Device Supervisor instance.
Component Object – Class Code: 100 (64
Table 5-31 Component Object Class Attributes (Instance 0)
Attrib Rule NV Name Data Type Description Value
1 Get NV Revision UINT Revision level of this object. 1
2 Get NV Max Instance UINT Maximum number of
6 Get NV Max Class
Attribute ID
7 Get NV Max Instance
Attribute ID
UINT Highest possible class-level
UINT Highest possible instance-
HEX
specified attribute.
)
1
available instances.
7
attribute ID value.
*
level attribute ID value.
Table 5-32 Component Object Instance Attributes
Attrib Rule NV Name
1 Get NV Model Type SHORT_
2 Get NV Serial Number SHORT_
3 Get NV Calibration
Date
Data
Type
STRING
STRING
DATE_
AND_
TIME
Description
Component model
type.
Component serial
number.
Component
calibration date and
time info.
Semantics of
Value
Model type string.
0-128 chars.
Serial number.
0-128 chars.
CIP timestamp
data type with
date and time.
Table 5-33 Component Object Common Services
Service
Code
14 (0x0E) Yes Yes Get_Attribute_Single Returns the contents of the
Class Instance Service Name Description of Service
specified attribute.
Table 5-34 Component Object Instances
Instance Name Description
1 BDS Info BDS component info.
67
Page 82

S-Device Supervisor – Class Code: 48 (30
Table 5-35 S-Device Supervisor Class Attributes
(Instance 0)
HEX
)
Attrib Rule NV Name
1 Get NV Revision UINT Revision level of this
Data
Type
Description Value
object.
Table 5-36 S-Device Supervisor Instance Attributes
Note: This implementation is missing attributes required by the SEMI spec.
Attrib Rule NV Name
1 Get NV Number of
Attributes
2 Get NV Attribute List Array of:
17 Get/
Set
18 Get NV Clock Power
VTime DATE_AN
Cycle Behavior
Data
Type
USINT Number of Attributes
USINT
D_TIME
USINT Describes the behavior of
Description Value
supported by the object
instance
List of attributes
supported by the object
instance
The value of the device’s
internal real-time clock.
the device’s internal realtime clock (the Time
attribute) during a power
cycle
2
4
1,2,17,1
8
Set by
Master
on
device
power
up.
0 =
[default]
clock
always
resets
during
power
cycle
68
Table 5-37 S-Device Supervisor Common Services
Service
Code
14 (0x0E) Yes Yes Get_Attribute_
16 (0x10) Yes Yes Set_Attribute_
Class Instance
Service
Name
Single
Single
Description of Service
Returns the contents of the specified
attribute.
Modifies an attribute.
Table 5-38 S-Device Supervisor Object Instances
Instance Name Description
1 BDS Supervisor BDS S-Device Supervisor instance.
Page 83

Component Object – Class Code: 100 (64
Table 5-39 Component Object Class Attributes (Instance 0)
Attrib Rule NV Name Data Type Description Value
1 Get NV Revision UINT Revision level of this object. 1
2 Get NV Max Instance UINT Maximum number of
6 Get NV Max Class
Attribute ID
7 Get NV Max Instance
Attribute ID
UINT Highest possible class-level
UINT Highest possible instance-
Table 5-40 Component Object Instance Attributes
HEX
)
1
available instances.
7
attribute ID value.
*
level attribute ID value.
Attrib Rule NV Name Data Type Description
1 Get NV Model
Type
2GetNVSerial
Number
3 Get NV Calibration
Date
SHORT_STRING Component
model type.
SHORT_STRING Component serial
number.
DATE_AND_TIME Component
calibration date
and time info.
Semantics of
Value
Model type
string. 0-128
chars.
Serial number.
0-128 chars.
CIP timestamp
data type with
date and time.
Table 5-41 Component Object Common Services
Service
Code
14 (0x0E) Yes Yes Get_Attribute_Single Returns the contents of the
Class Instance Service Name Description of Service
specified attribute.
Table 5-42 Component Object Instances
Instance Name Description
1 BDS Info BDS component info.
69
Page 84

Application Object – Class Code: 101 (65
Table 5-43 Application Object Class Attributes (Instance 0)
Attrib Rule NV Name Data Type Description Value
1 Get NV Revision UINT Revision level of this object. 1
2 Get NV Max Instance UINT Maximum number of
6 Get NV Max Class
Attribute ID
7 Get NV Max Instance
Attribute ID
UINT Highest possible class-level
UINT Highest possible instance-
Table 5-44 Application Object Instance Attributes
HEX
)
1
available instances.
7
attribute ID value.
*
level attribute ID value.
Attrib Rule NV Name Data Type Description
1Get/
Set
2 Get NV V rms UINT RMS voltage. See below.
3 Get NV I rms UINT RMS current. See below.
4 Get NV Phase INT Phase in degrees. See below.
5 Get NV Del. Power INT Delivered power in Watts. See below.
6 Get NV R UINT Resistance (Real part of
7 Get NV X INT Reactance (Imaginary
NV Frequency UINT Search frequency. See below.
impedance).
part of impedance).
Semantics
of Value
See below.
See below.
Attribute Name Quantity Description
1 Frequency 0.00 to 655.35 [MHz] (resolution, 0.01MHz)
2 V rms 0 to 65535 [V] (resolution, 1V)
3 I rms 0.0 to 6553.5 [A] (resolution, 0.1A)
4 Phase -3276.8 to 3276.7 [Degrees] (resolution, 0.1
5 Del. Power -32768 to 32767 [W] (resolution, 1W)
6 R 0.01 to 655.35 [Ohms] (resolution, 0.01Ω)
7 X -327.68 to 327.67 [Ohms] (resolution, 0.01Ω)
O
)
Note: Above value range shows concept of Data Type. They do not describe the actual dynamic range of
the BDS.
70
Table 5-45 Application Object Common Services
Service
Code
14 (0x0E) Yes Yes Get_Attribute_Single Returns the contents of the
Class Instance Service Name Description of Service
specified attribute.
Page 85

Table 5-46 Application Object Instances
Instance Name Description
1 Frequency 1 Frequency 1 selection and results.
2 Frequency 2 Frequency 2 selection and results.
3 Frequency 3 Frequency 3 selection and results.
4 Frequency 4 Frequency 4 selection and results.
5 Frequency 5 Frequency 5 selection and results.
6 Frequency 6 Frequency 6 selection and results.
7 Frequency 7 Frequency 7 selection and results.
8 Frequency 8 Frequency 8 selection and results.
Attenuation Control Object – Class Code: 104 (68
Table 5-47 Attenuation Control Class Attributes
(Instance 0)
Attrib Rule NV Name Data Type Description Value
1 Get NV Revision UINT Revision level of this object. 1
Table 5-48 Attenuation Control Instance Attributes
Attrib Rule NV Name
1Get/
Set
2Get/
Set
3Get/
Set
VIs AGC
Enabled
V Voltage
Attn
V Current
Attn
Data
Type
BOOL Automatic gain control
USINT Voltage channel
USINT Current channel
Description
enabled. Attenuation
applied automatically
when enabled.
attenuation for manual
gain control. Ignored
when AGC is enabled.
attenuation for manual
gain control. Ignored
when AGC is enabled.
HEX
)
Semantics of
Value
TRUE to enable
automatic gain
control. FALSE for
manual gain.
Default: TRUE
Value range: 030dB.
Default: 0
Value range: 030dB.
Default: 0
Table 5-49 Attenuation Control Common Services
Service
Code
14 (0x0E) Yes Yes Get_Attribute_Single Returns the contents of the
16 (0x10) No Yes Set_Attribute_Single Modifies an attribute.
Class Instance Service Name Description of Service
specified attribute.
Table 5-50 Attenuation Control Object Instances
Instance Name Description
1 Attenuation Single attenuation control object instance shared by
all operating modes.
71
Page 86

Standard Mode Object – Class Code: 105 (69
Table 5-51 Standard Mode Class Attributes (Instance 0)
HEX
)
Attrib Rule NV Name
1 Get NV Revision UINT Revision level of this
2GetNVMax
Instance
100 Get/
Set
101 Get/
Set
102 Get/
Set
103 Get/
Set
104 Get/
Set
NV ADC Mode USINT ADC mode selection. This
NV Num
Fundament
als
NV Sample
Period
NV Average
Window
Size
NV DAC
Selection
Data
Type
UINT Maximum instance
USINT The number of
UDINT Sample period in
USINT Data averaging
Array of:
Struct of:
DACSel
Description
object.
number.
changes the
measurement resolution.
Note: Frequency
selection depends on the
ADC mode selected. 8-bit
range is 1-500MHz. 12-bit
range is 1-100MHz.
fundamental frequencies
to include in the
measurement. This will
select instances 1-5 to
include in the
measurement. Set this
parameter after the
“Fundamental Selection”
instance attribute has
been configured.
milliseconds. The
requested time to
produce a new dataset.
parameters.
This determines the
exponential moving
average window size and
also enables or disables
data averaging.
The value of this attribute
is a power of 2.
An array of DACSel
structures. Each DACSel
instance contains DAC
(Digital-to-Analog
Converter) configuration
parameters. This array
always holds 5 DACSel
structures.
Semantics
of Value
1
5
One of the
following
values:
0 – 8-bit ADC.
1 – 12-bit
ADC.
Default: 0 (8bit)
Range: 0-5
A value of 0
will not select
any
frequencies
and will not
produce a
measurement.
Default: 0
A sample
period in
milliseconds.
Default: 0
Range: 0-8
Window size =
x
2
Where x is
one of the
following
values:
0 = Averaging
disabled.
1 = 2 points.
2 = 4 points.
3 = 8 points.
8 = 256 points.
Default: 0
See DACSel
structure
definition.
72
Page 87

Attrib Rule NV Name
105 Get/
Set
106 Get/
Set
107 Get/
Set
150 Get/
Set
151 Get/
Set
152 Get/
Set
NV De-
embedding
Opts
NV Num De-
embedding
Segments
NV De-
embedding
Segments
NV Max AGC
Mode
Enabled
NV Avg Perc
Change
NV Phase
Reporting
Data
Type
BYTE De-embedding options
USINT The number of segments
Array of:
Struct of:
DeeSeg
ment
BOOL Enables/disables the Max
UINT The percentage of change
USINT Phase reporting options.
Description
bitfield.
to use in the deembedding calculation.
This is also the number of
the valid segments to use
from the following Deembedding Segments list.
An array of DeeSegment
structures. Each
DeeSegment instance
contains de-embedding
parameters for a
transmission line segment.
This array always holds 10
DeeSegment structures.
AGC mode. If enabled
and AGC is enabled, the
BDS will fix both voltage
and current attenuators to
the highest reported
attenuation.
of the most recent
measurement (V, I, or
phase) from the previous
measurement. Value is in
tenths of a percent. If the
most recent measurement
exceeds this value, then
data averaging is reset.
This will change the way
that phase values are
reported in each
measurement result.
Semantics
of Value
See DeeOpts
bitfield
description.
Default: 0
Default: 0
See the
DeeSegment
data structure.
TRUE –
Enables Max
AGC mode.
FALSE –
Disables.
Default:
FALSE
Hidden
attribute for
diagnostic
purposes only!
Value is in
tenths of a
percent.
Default: 20
(2%)
Hidden
attribute for
diagnostic
purposes only!
0 – Phase
only.
1 – V phase
and I phase.
2 – Phase and
relative phase.
3 – V phase
and I phase
with relative
phase
embedded.
Default: 0
Hidden
attribute for
diagnostic
purposes only!
73
Page 88

Attrib Rule NV Name
153 Get/
Set
NV Is
Calibration
Disabled
Table 5-52 Standard Mode Instance Attributes
Data
Type
BOOL Option to turn off
Description
measurement calibration.
Semantics
of Value
FALSE for
calibrated
data (default),
TRUE for raw
data
(diagnostic).
Default:
FALSE
Hidden
attribute for
diagnostic
purposes only!
Attrib Rule NV Name
1Get/
2 Get V Num
3 Get V Measurements Array of:
4 Get V Num Intermods USINT The number of
5 Get V Intermods Array of:
NV Fundamental
Set
Selection
Measurements
Data
Type
STRUCT
of:
Fundame
ntal
USINT The number of voltage
STRUCT
of:
VIMeas
STRUCT
of:
VIMeas
Description
Fundamental frequency
and harmonic
component selection.
and current harmonic
component
measurements
contained in the
following array.
Voltage and current
harmonic component
measurements.
intermodulation products
contained in the
following array.
Voltage and current
intermodulation product
measurements.
Table 5-53 Standard Mode Common Services
Semantics
of Value
See the
Fundamenta
l structure.
Value range:
0-16
See VIMeas
structure.
Value range:
0-6
See VIMeas
structure.
74
Service
Code
14 (0x0E) Yes Yes Get_Attribute_Single Returns the contents of the
16 (0x10) Yes Yes Set_Attribute_Single Modifies an attribute.
Class Instance Service Name Description of Service
specified attribute.
Page 89

Table 5-54 Standard Mode Object Instances
Instance Name Description
1 Fundamental 1 Fundamental frequency 1 configuration & data.
2 Fundamental 2 Fundamental frequency 2 configuration & data.
3 Fundamental 3 Fundamental frequency 3 configuration & data.
4 Fundamental 4 Fundamental frequency 4 configuration & data.
5 Fundamental 5 Fundamental frequency 5 configuration & data.
Standard Mode Data Structures
The following subsections define the data structures used while running in the “Standard Operating Mode”.
Fundamental – Search frequency selection parameters
This structure is used to specify a fundamental frequency to include in the search/track algorithm in the “Standard Operating Mode”. Individual harmonic components are specified as well as IMD mixing products. Structure size = 12 bytes.
Fundamental
Name Data Type Description Byte
Frequency UDINT Center fundamental frequency value in Hz.
Value range: 1-500,000,000Hz in 8-bit ADC
mode, 1-100,000,000Hz in 12-bit mode. A
value of 0 indicates an invalid frequency.
Default: 0
Harmonic
Selection
Tolerance USINT Frequency error tolerance value in 0.1% steps
Filter Width USINT Tracking filter width in 0.01% steps.
WORD Harmonic selection bitfield. Each set bit (1)
selects a harmonic. Harmonics are zerobased, with H0 as the fundamental and H1 as
st
harmonic. See the HarmSel bitfield for
the 1
details.
Default: 1 (fundamental)
from the center frequency. Error tolerance
value. E.g. a value of 50 would indicate a +/5% allowable tracking window.
Note: tolerance is based on the fundamental
frequency.
Max Tolerance (in 0.1% steps) = (5/MHz) *
1000
Default: 50 (5% tolerance)
This is an advanced parameter used to finetune tracking performance. Setting to 0 will use
the default value of 10 (0.1%).
Default: 10 (0.1% width)
0
4
6
7
75
Page 90

Fundamental
Name Data Type Description Byte
Tracking
Quality
Intermod F2USINT The frequency number of the “F2” frequency to
Intermod
Selection
Tune USINT Frequency tuning control. This will determine
USINT Tracking quality value in 0.001% steps.
This is an advanced parameter used to finetune tracking performance. Setting to 0 will use
the default value of 10 (0.01%).
Default: 10 (0.01% quality)
use when computing intermodulation products.
One of the following values (ranging 0-5):
0 – No intermods requested.
1 – 5 – Fundamental frequency to use as the
F2 fundamental.
Default: 0
USINT The intermodulation products to produce. One
of the following values (0-3):
0 – No intermods requested.
1 – 1 “plus” and 1 “minus” product.
2 – 2 “plus” and 2 “minus” products.
3 – 3 “plus” and 3 “minus” products.
Default: 0
how the BDS locks onto a frequency. One of
the following values (ranging 0-2):
0 – Voltage channel used for fundamental
tracking.
1 – Current channel used for fundamental
tracking.
2 – Channel auto-select (default).
Default: 2
8
9
10
11
76
Table 5-55 HarmSel – Harmonic Component Selection
Bitfield (16-bit WORD)
Bit 1514131211109876543210
Field H15H14H13H12H11H10H9H8H7H6H5H4H3H2H1X
Note: H = Harmonic number. H0 = Fundamental frequency, H1 = 1st harmonic, H15 = 15th harmonic. Bit 0
(H0, the fundamental) is always set (1); therefore the fundamental frequency is always selected.
Page 91

Table 5-56 DACSel – DAC Selection Parameters
Note: Structure size = 6 bytes.
Name Data Type Description Byte
Fund Number USINT The fundamental frequency index. This will also be
used as the “F1” frequency for intermods. One of
the following values (ranging 0-5):
0 – No fundamental selected (and no DAC output
selected).
1 – 5 – The selected fundamental.
Default: 0
F2 Fund USINT The frequency number of the “F2” frequency to use
when computing intermodulation products. One of
the following values (0-5):
0 – No intermods requested.
1 – 5 – Fundamental frequency to use at the F2
fundamental.
Default: 0
Harmonic USINT Harmonic index value to send out the DAC. This is
ignored if an intermod is selected (with Intermod).
One of the following values (0-15):
0 – The fundamental.
1 – The first harmonic.
…
15 – The fifteenth harmonic.
Default: 0
Intermod SINT Intermodulation product to send out the DAC.
One of the following values:
rd
“minus” intermod.
-3 – 3
nd
-2 – 2
-1 – 1
0 – No intermod selected.
1 – 1
2 – 2
3 – 3
Default: 0
Units USINT Output units. See Output Units for a list of values.
Default: 0 (Vrms)
DAC Output USINT DAC output selection. The DAC to send the signal
out of. One of the following values (0-5):
0 – Invalid – no DAC selected.
1 – 5 The DAC to use as the output.
Default: 0
“minus” intermod.
st
“minus” intermod.
st
“plus” intermod.
nd
“plus” intermod.
rd
“plus” intermod.
0
1
2
3
4
5
77
Page 92

Table 5-57 DeeSegment – Transmission Line Segment
De-embedding Parameters
Note: Structure size = 20 bytes.
DeeSegment – Transmission Line De-embedding Parameters
Name Data Type Description Byte
Loss REAL Line section loss in Ohms/cm.
Default: 0 (No loss)
Reserved REAL Parameter used for internal system use. 4
Length REAL Segment length in cm. Note: a length of 0 is
invalid.
Default: 0
Line Impedance REAL Line section impedance (Z0) in Ohms.
Default: 50
Phase Velocity REAL Velocity of propagation (in fraction of Speed of
light). A typical value is 0.7.
Default: 1
0
8
12
16
Table 5-58 DeeOpts - De-embedding Options Bitfield (8-
bit BYTE)
DeeOpts – De-embedding Options Bitfield
Bit76543210
FieldDirectionxxxxxxEnable
Bit Field Description Bit Clear (0) Bit Set (1)
0 Enable Enables/Disables
de-embedding.
1 Direction Direction of rotation. Rotates towards load. Rotates towards RF
Disables de-embedding. Enables de-
embedding.
source.
78
Page 93

VIMeas – Single BDS V & I measurement result.
The BDS produces one of these structures per frequency measurement. These structures are grouped together by
fundamental frequency to compose a complete measurement dataset. The number of measurements reported per
dataset depends on the class-level configuration attributes of the Standard Mode object. Structure size = 25 bytes.
VIMeas – Single BDS V & I Measurement Result.
Name Data Type Description Byte
Fundamental
Num
Harmonic
Num
Intermod
Num
Voltage Attn USINT Voltage channel attenuation used (in dB). Value
Current Attn USINT Current channel attenuation used (in dB). Value
Frequency UDINT Estimated fundamental frequency value in Hz.
Voltage REAL Voltage magnitude (in Vrms). 9
Current REAL Current magnitude (in Firms). 13
Phase REAL Phase between voltage and current channels in
Relative
Phase
USINT Fundamental frequency index number.
One of the following values (ranging 0-5):
0 – Invalid measurement.
1 – 5 – The selected fundamental index/instance
ID.
USINT Harmonic frequency index number.
One of the following values (ranging 0-15):
0 – The fundamental.
1 – The first harmonic.
…
15 – The fifteenth harmonic.
SINT Intermodulation product number.
One of the following values:
rd
“minus” intermod.
-3 – 3
nd
-2 – 2
-1 – 1
0 – No intermod.
1 – 1
2 – 2
3 – 3
“minus” intermod.
st
“minus” intermod.
st
“plus” intermod.
nd
“plus” intermod.
rd
“plus” intermod.
range 0-30dB.
range 0-30dB.
Value range: 1-499,999,999Hz in 8-bit ADC mode,
1-99,999,999Hz in 12-bit mode. 0 is an invalid
frequency.
radians. Always between
-PI and +PI.
REAL The phase relative to the fundamental frequency in
radians. Always between
-PI and +PI. This is used to reconstruct a
waveform.
0
1
2
3
4
5
17
21
79
Page 94

Data Types
Table 5-59 CIP™ Elementary Data Types
Data Type Name Data Type Description
BOOL 8-bit OCTET. Logical Boolean with values TRUE (1) and FALSE (0).
SINT Signed 8-bit integer value.
INT Signed 16-bit integer value.
DINT Signed 32-bit integer value.
USINT Unsigned 8-bit integer value.
UINT Unsigned 16-bit integer value.
UDINT Unsigned 32-bit integer value.
REAL 32-bit floating-point value.
BYTE Bit string (8-bits).
WORD Bit string (16-bits).
DWORD Bit string (32-bits).
SHORT_STRING Character sting (1 byte per character, 1 byte length indicator).
DATE_AND_TIME Date and time of day.
Table 5-60 DATE_AND_TIME Encoding
Octet
(Byte)
st
1
nd
2
rd
3
th
4
th
5
th
6
Number
0LSB –
Time
1LSB –
Time
2LSB –
Time
3LSB –
Time
0LSB –
Date
0LSB Date
Note: Range of Date: D#1972-01-01, the start of the Coordinated Universal Time (UTC) era, to D#2151-0606 (a total range of 65536 days).
Note: Range of Time: TOD#00:00:00.000 to TOD#23:59:59.999 to a resolution of 1 millisecond.
Note: DATE_AND_TIME is from DT#1972-01-01-00:00:00.000 to DT#2151-06-06-23:59:59.999.
Table 5-61 SHORT_STRING Encoding
Data Type Description
Struct of:
USINT Character count – the number of characters contained in the string.
ARRAY of:
SINT
String data.
Contents Character Count String data
0LSB 0LSB
Table 5-62 SHORT_STRING Example
Character
Count
5 ‘H’ ‘E’ ‘L’ ‘L’ ‘O’
0LSB 1LSB 2LSB 3LSB 4LSB
80
Page 95

Constants And Data Structures
Table 5-63 BDS System Status Bitfield
Bit3130292827262524
DSP Unit DSP
ERR
Bit2322212019181716
XXArc
Bit1514131211 10 9 8
V Low F5
Range
Bit76543210
XXXXAGC OffDeembedAvgIdle
Note: If all bits are 0, then all is well – no status to report.
Note: Status bitfield descriptions – describes the state when the bit is set (1).
Bit Name Description
0 Idle The BDS is in the Idle Run Mode. Not running or collecting any data.
1 Avg Data averaging enabled.
2 De-embed Measurement de-embedding enabled.
3 AGC Off Auto gain control disabled.
8 No Time Set The Date and Time attribute of the BDS Host Configuration
class has not been set.
9 DAQ Timeout Data acquisition timeout – data not produced in the time
requested.
10 F1 Range Frequency 1 range error.
11 F2 Range Frequency 2 range error.
12 F3 Range Frequency 3 range error.
13 F4 Range Frequency 4 range error.
14 F5 Range Frequency 5 range error.
15 V Low Low voltage signal warning.
16 I Low Low current signal warning.
17 V Over Over range detected on the Voltage channel.
18 I Over Over range detected on the Current channel.
19 Probe Disconnect The BDS probe has been disconnected from the receiver box.
20 Not Cal Data not calibrated.
21 Arc Detected Arc transient event detected.
24 PLL8 8-bit PLL lock error.
25 PLL12 12-bit PLL lock error.
26 DCM0 DCM (Digital Clock Manager) 0 lock lost.
27 DCM1 DCM (Digital Clock Manager) 1 lock lost.
28 DCM2 DCM (Digital Clock Manager) 2 lock lost.
29 DCM3 DCM (Digital Clock Manager) 3 lock lost.
30 DSP ERR DSP/FPGA internal error.
31 DSP Init DSP/FPGA initialization error.
X Bit reserved for future use.
DCM3 DCM2 DCM1 DCM0 PLL12 PLL8
Detected
F4
Range
Not Cal Probe
Disconnect
F3
Range
F2 Range F1
I Over V Over I Low
Range
DAQ
Timeout
No Time
Set
81
Page 96

Table 5-64 Output Formats
Value Name Description
0Vrms Voltage RMS.
1 Irms Current RMS.
2 Vpk Peak Voltage.
3 Ipk Peak Current.
4 Phase R Phase in radians.
5 Phase D Phase in degrees.
6 Relative Phase R Relative phase in radians.
7 Relative Phase D Relative phase in degrees.
8 Watts Power in Watts.
9 Vars Power in Vars.
10 dBm Power in dBm.
11 dBc Power relative to carrier (in dBc).
12 Impedance Mag Impedance magnitude.
13 Resistance Resistance – real part of impedance in rectangular
coordinates.
14 Reactance Reactance – imaginary part of impedance in rectangular
coordinates.
82
Page 97

Limited Warranty
All products manufactured by Seller are warranted to be free from defects in material and workmanship for a period
of one year, unless otherwise specified, from date of shipment and to conform to applicable specifications, drawings, blueprints and/or samples. Seller’s sole obligation under these warranties shall be to issue credit, repair or
replace any item or part thereof which is proved to be other than as warranted; no allowance shall be made for any
labor charges of Buyer for replacement of parts, adjustment or repairs, or any other work, unless such charges are
authorized in advance by Seller.
If Seller’s products are claimed to be defective in material or workmanship or not to conform to specifications, drawings, blueprints and/or samples, Seller shall, upon prompt notice thereof, either examine the products where they
are located or issue shipping instructions for return to Seller (transportation-charges prepaid by Buyer). In the event
any of our products are proved to be other than as warranted, transportation costs (cheapest way) to and from
Seller’s plant, will be borne by Seller and reimbursement or credit will be made for amounts so expended by Buyer.
Every such claim for breach of these warranties shall be deemed to be waived by Buyer unless made in writing
within ten days from the date of discovery of the defect.
The above warranties shall not extend to any products or parts thereof which have been subjected to any misuse or
neglect, damaged by accident, rendered defective by reason of improper installation or by the performance of
repairs or alterations outside of our plant, and shall not apply to any goods or parts thereof furnished by Buyer or
acquired from others at Buyer’s request and/or to Buyer’s specifications. Routine (regularly required) calibration is
not covered under this limited warranty. In addition, Seller’s warranties do not extend to the failure of tubes, transistors, fuses and batteries, or to other equipment and parts manufactured by others except to the extent of the original manufacturer’s warranty to Seller.
The obligations under the foregoing warranties are limited to the precise terms thereof. These warranties provide
exclusive remedies, expressly in lieu of all other remedies including claims for special or consequential damages.
SELLER NEITHER MAKES NOR ASSUMES ANY OTHER WARRANTY WHATSOEVER, WHETHER EXPRESS, STATUTORY, OR
IMPLIED, INCLUDING WARRANTIES OF MERCHANTABILITY AND FITNESS, AND NO PERSON IS AUTHORIZED TO
ASSUME FOR SELLER ANY OBLIGATION OR LIABILITY NOT STRICTLY IN ACCORDANCE WITH THE FOREGOING.
83
Page 98

84
 Loading...