

Page 1

TurboScan Manual
For Version 2.0.3
Page 2

T
T
T
u
u
u
r
b
o
S
c
a
n
U
s
e
r
M
a
n
u
a
l
r
b
o
S
c
a
n
U
s
e
r
M
a
r
b
o
S
c
a
n
U
s
e
r
M
a
n
n
u
u
a
a
l
l
2
Page 3

T
u
r
b
o
S
c
a
n
U
s
e
r
M
a
n
u
a
l
T
u
r
b
o
S
c
a
n
U
s
e
r
M
a
T
u
r
b
o
S
c
a
n
U
s
e
r
Contents
1. INTRODUCTION............................................................................................................7
1.1. TURBOSCAN ...............................................................................................................7
1.2. CHECKLIST..................................................................................................................7
1.3. CONTACT DETAILS ......................................................................................................7
2. SYSTEM REQUIREMENTS..........................................................................................8
3. WARRANTY....................................................................................................................8
4. SOFTWARE LICENCE AGREEMENT.......................................................................8
Software Licence Agreement.................................................................................9
5. INSTALLATION............................................................................................................10
6. TURBOSCAN SCREEN................................................................................................11
7. TURBOSCAN MENU BAR...........................................................................................12
7.1. FILE ..........................................................................................................................12
7.1.1. Statistics...........................................................................................................12
7.1.2. Reorganize Database.......................................................................................12
7.1.3. Print.................................................................................................................12
7.1.4. Exit...................................................................................................................12
7.2. SCAN.........................................................................................................................12
7.2.1. Start..................................................................................................................12
7.3. MANAGEMENT..........................................................................................................12
7.3.1. Masks...............................................................................................................12
7.3.2. Historical Database.........................................................................................12
7.3.3. Methods............................................................................................................13
7.3.4. Comments.........................................................................................................13
7.3.5. Patient Journal.................................................................................................13
7.4. OPTIONS....................................................................................................................13
7.4.1. User Data.........................................................................................................13
7.4.2. Interface...........................................................................................................13
7.4.3. Language..........................................................................................................13
7.4.4. Form Selection.................................................................................................14
7.4.5. Change Mask...................................................................................................14
7.4.6. Change Method................................................................................................14
7.4.7. Single Analysis.................................................................................................15
7.4.8. Automatic Numbering......................................................................................15
7.4.9. Calibrate Scanner............................................................................................16
7.4.10. Reset Calibration.............................................................................................16
7.4.11. Display Calibration.........................................................................................16
7.5. HELP .........................................................................................................................16
7.5.1. Index.................................................................................................................16
7.5.2. About................................................................................................................16
M
a
n
n
u
u
a
a
l
l
8. TURBOSCAN BUTTON BAR......................................................................................17
8.1. SCAN.........................................................................................................................17
8.1.1. Scanner............................................................................................................17
8.2. ANALYSE...................................................................................................................24
8.2.1. SCAN AND ANALYSE ....................................................................................24
3
Page 4
T
u
r
b
o
S
c
a
n
U
s
e
r
M
a
n
u
a
l
T
u
r
b
o
S
c
a
n
U
s
e
r
M
a
T
u
r
b
o
S
c
a
n
U
s
e
r
8.2.1.1. Automatically create mask...........................................................................24
8.2.1.2. Select saved mask.........................................................................................28
8.2.1.3. Method selection..........................................................................................28
8.2.1.4. Analysis........................................................................................................29
8.2.1.5. Patient Data.................................................................................................33
8.2.2. PRINT ...........................................................................................................36
8.2.2.1. Prepare to print............................................................................................36
8.2.2.2. Start print process........................................................................................37
8.2.2.3. Printing restrictions.....................................................................................38
8.2.3. EXIT ...........................................................................................................38
8.2.4. JOURNAL ......................................................................................................39
8.2.5. STATISTICS ...................................................................................................42
8.2.5.1. Prepare Statistics.........................................................................................42
8.2.5.2. Statistical parameters..................................................................................42
8.2.5.3. Statistical analysis of precision and accuracy.............................................43
8.2.6. MANAGE CONTROL SERA ............................................................................45
8.2.6.1. Use of control sera.......................................................................................45
M
a
n
n
u
u
a
a
l
l
8.2.7. MANAGE MASKS ..........................................................................................48
8.2.7.1. Create new mask..........................................................................................48
8.2.7.2. Load existing mask.......................................................................................52
8.2.7.3. Change existing mask..................................................................................52
8.2.8. DATABASE SEARCH .....................................................................................54
8.2.8.1. Search criteria.............................................................................................54
8.2.8.2. Selection.......................................................................................................55
8.2.9. MANAGE METHODS .....................................................................................57
8.2.9.1. Create new default method..........................................................................57
8.2.9.2. Create new position-dependent method.......................................................58
8.2.9.3. Albumin factor.............................................................................................59
8.2.9.4. Brightness....................................................................................................59
8.2.9.5. Band-finding................................................................................................60
8.2.9.6. Amido Black.................................................................................................61
8.2.9.7. Send curve....................................................................................................61
8.2.9.8. A/G ratio......................................................................................................62
8.2.9.9. Change method............................................................................................63
8.2.9.10. Switch method..............................................................................................63
8.2.9.11. Delete method..............................................................................................63
8.2.10. PATIENT JOURNAL .......................................................................................64
8.2.11. COMMENTS DATABASE ................................................................................64
8.2.11.1. Enter and save new comments.....................................................................64
8.2.11.2. Select comments...........................................................................................65
8.2.11.3. Change comments........................................................................................65
8.2.11.4. Delete comments..........................................................................................66
8.2.11.5. Closing Enter Comments.............................................................................66
8.2.12. USER DATA .................................................................................................66
8.2.13. INTERFACE ...................................................................................................67
4
Page 5

T
u
r
b
o
S
c
a
n
U
s
e
r
M
a
n
u
a
l
T
u
r
b
o
S
c
a
n
U
s
e
r
M
a
T
u
r
b
o
S
c
a
n
U
s
e
r
8.2.14. LANGUAGE .................................................................................................67
9. ROUTINE PROGRAM RUN........................................................................................69
10. TURBOSCAN COMMUNICATION.......................................................................70
10.1. CONVENTIONS.......................................................................................................70
10.2. ASCII DATA TRANSFER BY FILE............................................................................71
10.2.1. Import file (host to TurboScan)........................................................................71
10.2.2. Export file (TurboScan to host)........................................................................71
10.3. DATA TRANSFER WITHOUT CURVE DATA...............................................................72
10.3.1. Data transfer host to TurboScan......................................................................72
10.3.2. Data transfer TurboScan to host.....................................................................72
10.4. DATA TRANSFER WITH CURVE DATA .....................................................................73
10.4.1. Data transfer host to TurboScan......................................................................73
10.4.2. Data transfer TurboScan to host......................................................................73
11. IMPORTANT NOTES ON PC HARDWARE........................................................75
11.1. SAFETY CONNECTOR FOR PRINTER INTERFACE......................................................75
11.2. GRAPHICS CARD WITH 3D ACCELERATION............................................................75
I. HARDWARE NOT SUPPLIED BY BIOTEC-FISCHER......................................................77
M
a
n
n
u
u
a
a
l
l
APPENDIX..............................................................................................................................79
I. EXAMPLE OF DATA TRANSFER WITH CURVE PROFILE (8 ANALYSES)..............................79
5
Page 6

T
T
T
u
u
u
r
b
o
S
c
a
n
U
s
e
r
M
a
n
u
a
l
r
b
o
S
c
a
n
U
s
e
r
M
a
r
b
o
S
c
a
n
U
s
e
r
M
a
n
n
u
u
a
a
l
l
6
Page 7

1. Introduction
1.1. TurboScan
Congratulations on purchasing one of the premium densitometer
systems on the market.
The foundations of the TurboScan densitometer were laid back in 1985
when BIOTEC-FISCHER GmbH already had a densitometer system
based on image processing (VID 1D/2D). It was another 12 years
before the market for routine analyses in clinical chemistry would be
ready for a densitometer system based on image processing. This was
precisely when BIOTEC-FISCHER GmbH launched the TurboScan
densitometer. You have now purchased the result of over 25 years’
experience in the field.
Since TurboScan was launched in 1997 a great deal has changed and
there have been many advances. This TurboScan version you now
have is the most modern densitometer system in existence for routine
use.
T
T
T
u
u
u
r
b
o
S
c
a
n
U
s
e
r
M
a
n
u
a
l
r
b
o
S
c
a
n
U
s
e
r
M
a
r
b
o
S
c
a
n
U
s
e
r
M
a
n
n
u
u
a
a
l
l
1.2. Checklist
The items delivered can vary, depending on the size of your order.
Products supplied as standard for a complete densitometer workstation
with PC are listed below:
• PC with keyboard and mouse
• TFT monitor
• Colour printer
• Flatbed scanner with transmitted-light unit
• TurboScan Installations CD
• TurboScan copy protection
• Positioning template for flatbed scanner
1.3. Contact details
If you have any queries about the software or installation, please
contact your local dealer or:
BIOTEC-FISCHER GmbH
Daimlerstrasse 6
35447 Reiskirchen
Germany
Tel: +49 (0)6408/6072
Fax: +49 (0)6408/64165
e-mail: [email protected]
7
Page 8

T
u
r
b
o
S
c
a
n
U
s
e
r
M
a
n
u
a
l
T
u
r
b
o
S
c
a
n
U
s
e
r
M
a
T
u
r
b
o
S
c
a
n
U
s
e
r
2. System requirements
Users who wish to use their own hardware should ensure that the minimum
hardware requirements are met.
PC: Intel Celeron 1.7 GHz processor speed or compatible AMD
processor
Memory: 512 MB RAM
Hard disk: 20 GB
USB interface: 2 x USB 2.0
Operating system: Windows XP with SP2, Windows 2000
Keyboard: Standard keyboard set to the appropriate language
Mouse: Standard 2-button mouse with scroll wheel
Monitor: 15’“ TFT
Printer: Any (colour printer or b&w printer are possible)
Scanner: Please ask BIOTEC-FISCHER about the up-to-date model
in use. You are strongly recommended to use this
scanner.
M
a
n
n
u
u
a
a
l
l
3. Warranty
The functioning of the TurboScan software has been thoroughly tested. If any
faults in the programming are identified, these will be remedied as quickly as
possible. An appropriate bugfix is free to TurboScan users. The warranty period is
two years from the date of purchase.
Problems that are not based on programming faults do not affect the company’s
obligation to rectify, exchange or redeem the product.
Failure of TurboScan to operate correctly on the hardware provided by the user
does not constitute a fault in the software.
Assistance in resolving the problem can be obtained from the contact address
given under 1.3. As a matter of course BIOTEC-FISCHER GmbH also offers an
on-site service.
4. Software licence agreement
Like any software, TurboScan is subject to special conditions of use which the
TurboScan user accepts when installing the software on a PC. The licence
agreement is reprinted here for information purposes 1.
1
The current version, which may vary from the version printed here, is the valid licence agreement.
8
Page 9

T
u
r
b
o
S
c
a
n
U
s
e
r
M
a
n
u
a
l
T
u
r
b
o
S
c
a
n
U
s
e
r
M
a
T
u
r
b
o
S
c
a
n
U
s
e
r
Software Licence Agreement
This is a legal agreement between you (hereafter called User) and BIOTEC-FISCHER GmbH
(hereafter called BIOTEC-FISCHER GmbH) which contains the Licence for this software
program TurboScan (hereafter called PROGRAM).
Use of the program indicates your consent to the conditions and obligations contained in this
Agreement between the User and BIOTEC-FISCHER GmbH.
1. The copyright and all other rights existing in connection with the program and all relevant
documents are the property of BIOTEC-FISCHER GmbH or the originally authorized person
or organization (hereafter called originally authorized person) and entitle BIOTEC-FISCHER
GmbH to use the program. The User shall not be entitled to any rights other than those set
out in this Agreement.
2. BIOTEC-FISCHER GmbH grants the User a non-transferable, non-exclusive right to use
the program. “Use” covers the complete or partial storage of the program on the User’s own
PC and execution of the program for the sole purpose of utilizing the functions for which the
program is intended.
3. The User shall not transfer the aforementioned licence to a third party nor permit third
parties to use the program, unless the User has obtained prior written permission to transfer
the program from BIOTEC-FISCHER GmbH.
4. The User is NOT entitled to strip, decompile, derive or merge the program with other
software, to copy, translate, adapt, alter or modify (wholly or in part) the program.
Backtranslation of the program into the form of a source program or into other display forms
is equally not permitted.
5. THE PROGRAM IS SUPPLIED “AS-IS” WITHOUT EXPRESS OR IMPLIED
GUARANTEES. FURTHERMORE NO GUARANTEE IS MADE OF ITS USABILITY FOR A
SPECIFIC PURPOSE NOR THAT THE PROGRAM IS ERROR-FREE. LIABILITY FOR ANY
HARMFUL EFFECTS (E.G. CAUSED BY VIRUS TRANSMISSION) ON OTHER
PROGRAMS OR DEVICES OF THE USER SHALL BE CONFINED TO GROSS
NEGLIGENCE AND INTENT. LIABILITY FOR CONSEQUENTIAL DAMAGE IS EXCLUDED.
6. In the event of a dispute arising between the User and a third party because of use of the
program, which results from an infringement of copyright, patent law or any other property
right, the User undertakes to settle the dispute at his own cost and shall not assert any
claims against BIOTEC-FISCHER GmbH or the originally authorized person.
7. Should it become known that the User has infringed these conditions, BIOTEC-FISCHER
shall withdraw the licence from the User. Withdrawal of the licence has no bearing on
payments or claims for damages. As a consequence of withdrawal of the licence, the User
shall be obliged to delete the entire program including all copies thereof with immediate
effect.
M
a
n
n
u
u
a
a
l
l
9
Page 10

T
u
r
b
o
S
c
a
n
U
s
e
r
M
a
n
u
a
l
T
u
r
b
o
S
c
a
n
U
s
e
r
M
a
T
u
r
b
o
S
c
a
n
U
s
e
r
5. Installation
To install, insert the Installations CD in the appropriate CD/DVD drive. Installation
starts automatically on computers running under XP with standard set-up. If not,
select the CD/DVD drive via Windows Explorer and manually run the executable
file by double-clicking the left mouse button.
Installation of TurboScan is virtually automatic. The following components will be
installed:
• TurboScan software
• BDE database machine
• driver for copy protection
Once installation of the BDE database machine is finished, TurboScan installation
can be completed and the system restarted. An Incomplete Installation of the
BDE database machine will prevent TurboScan from functioning properly. After
the computer is restarted, the copy protection should be connected to the chosen
USB port of the computer.
Note for users with their own hardware setup
Please note: in principle, the driver programs should be installed before the
device is connected up. If not, there is a possibility of malfunction.
M
a
n
n
u
u
a
a
l
l
10
Page 11
T
u
r
b
o
S
c
a
n
U
s
e
r
M
a
n
u
a
l
T
u
r
b
o
S
c
a
n
U
s
e
r
M
a
T
u
r
b
o
S
c
a
n
U
s
e
r
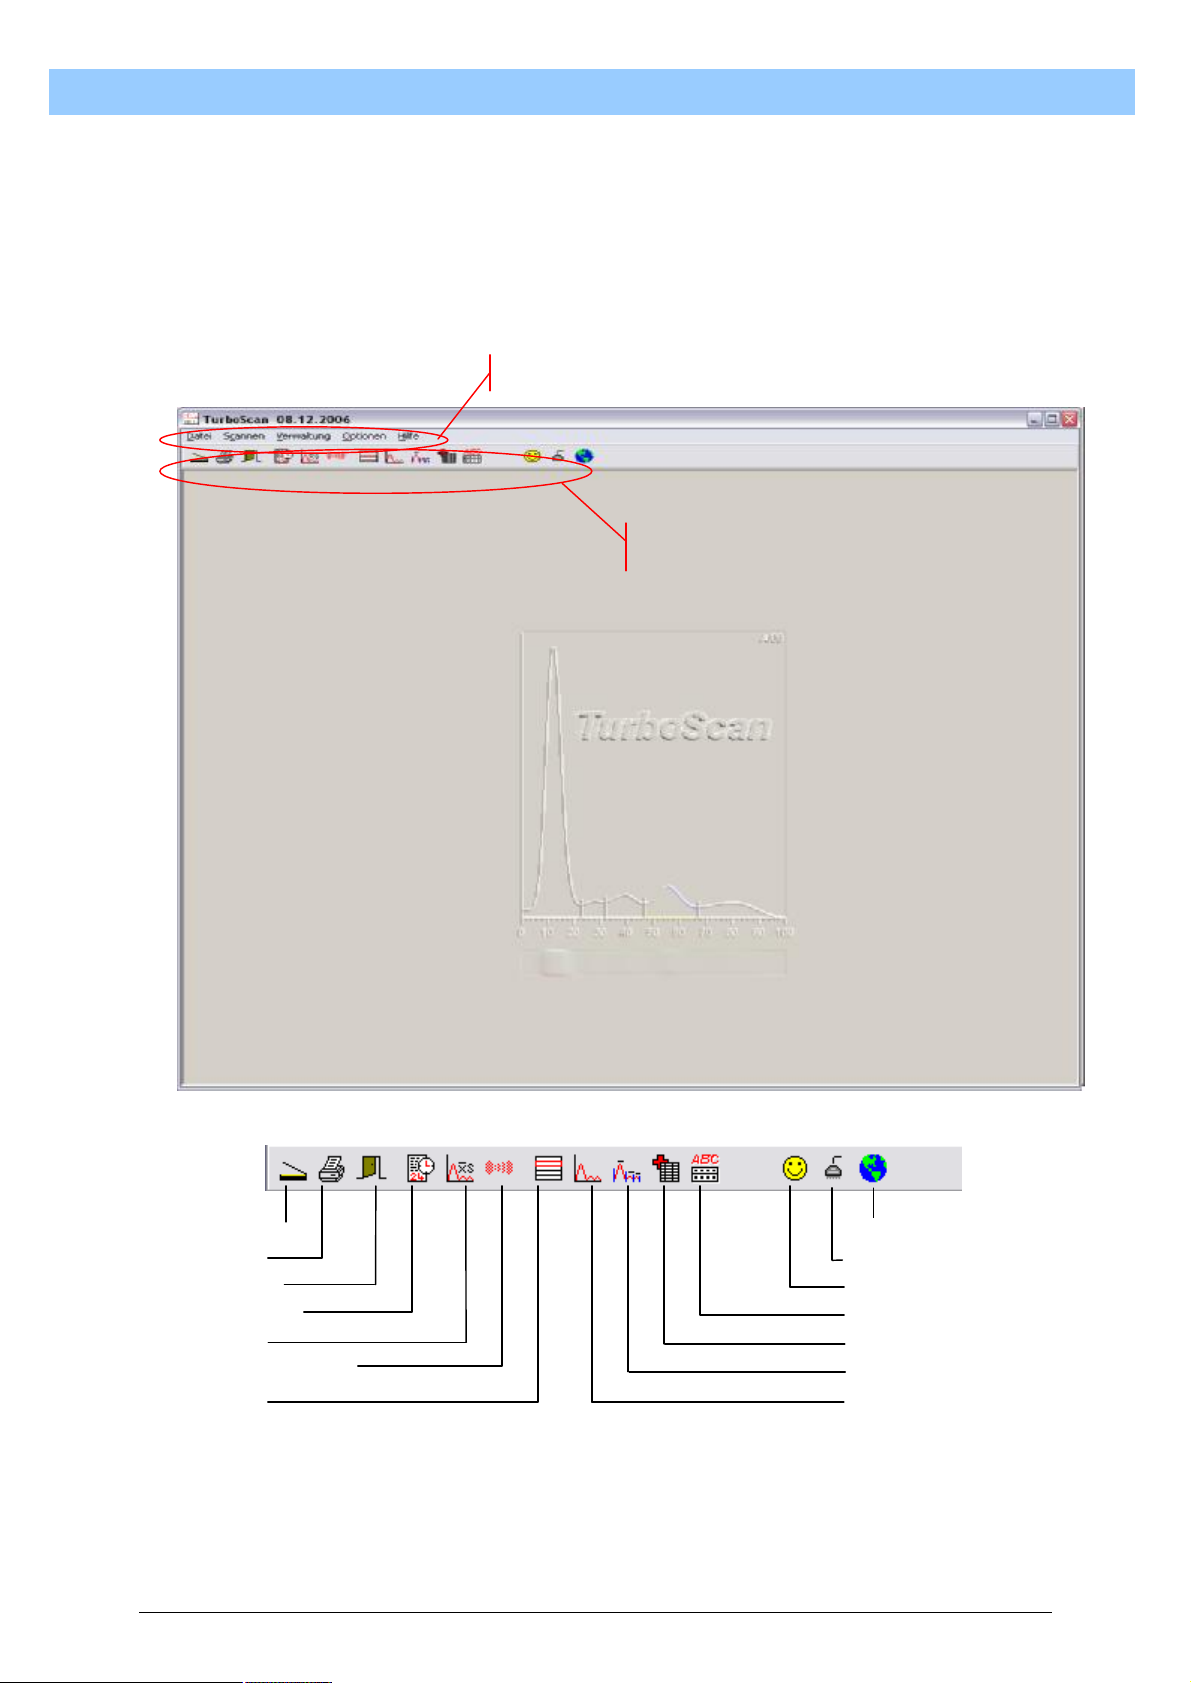
6. TurboScan screen
When the TurboScan software is launched, the following window appears on the
screen:
button bar
M
a
n
n
u
u
a
a
l
l
Scan Language
Print Interface
Exit User Data
Journal Comments
Statistics Patient Journal
Reference Sera Methods
Masks History
11
Page 12

T
u
r
b
o
T
u
r
T
u
r
7. TurboScan menu bar
7.1. File
7.1.1. Statistics
The menu selection Statistics opens the menu window for calculating
statistical values. See 8.2.5 for detailed description.
7.1.2. Reorganize Database
From time to time it is necessary to reorganize the data in the database.
This makes sense if data are added to or deleted from a database over a
long period of time. Within a database, a data record is given a status for
“deleted”. This record remains in the database until reorganization is
carried out. It is only then that the data are actually deleted from the
database. Data records with the status “deleted” are assessed by
TurboScan as no longer existent and are thus no longer displayed. The
status of the reorganization process is indicated by a progress bar in the
TurboScan main window.
b
b
o
o
S
S
S
c
c
c
a
a
a
n
n
n
U
U
U
s
e
r
M
a
n
u
a
l
s
e
r
M
a
s
e
r
M
a
n
n
u
u
a
a
l
l
7.1.3. Print
Selecting this submenu opens the Print Preview window. See 8.2.2 for
detailed description.
7.1.4. Exit
Selecting this menu item exits the TurboScan program. All unsaved data
will be lost and cannot be recovered when the program is restarted.
7.2. Scan
7.2.1. Start
This submenu launches the scanning process to record a new image. See
8.2.1 for detailed description.
7.3. Management
7.3.1. Masks
Using Mask Management, different reading tracks can be created and
written into a database table. See 8.2.7 for detailed description.
7.3.2. Historical Database
All patient data, if entered, are collected in the Historical Database. This
database table can be searched for data records using various criteria.
See 8.2.8 for detailed description.
12
Page 13
7.3.3. Methods
Using Method Management, different methods can be created and written
into a database table. See 8.2.9 for detailed description.
7.3.4. Comments
TurboScan offers you the option of making your own comments for the
printout. These comments can later be retrieved from the database and
assigned to an analysis. See 8.1.11 for detailed description.
7.3.5. Patient Journal
The Patient Journal is used to record patient data. See 8.2.10 for detailed
description.
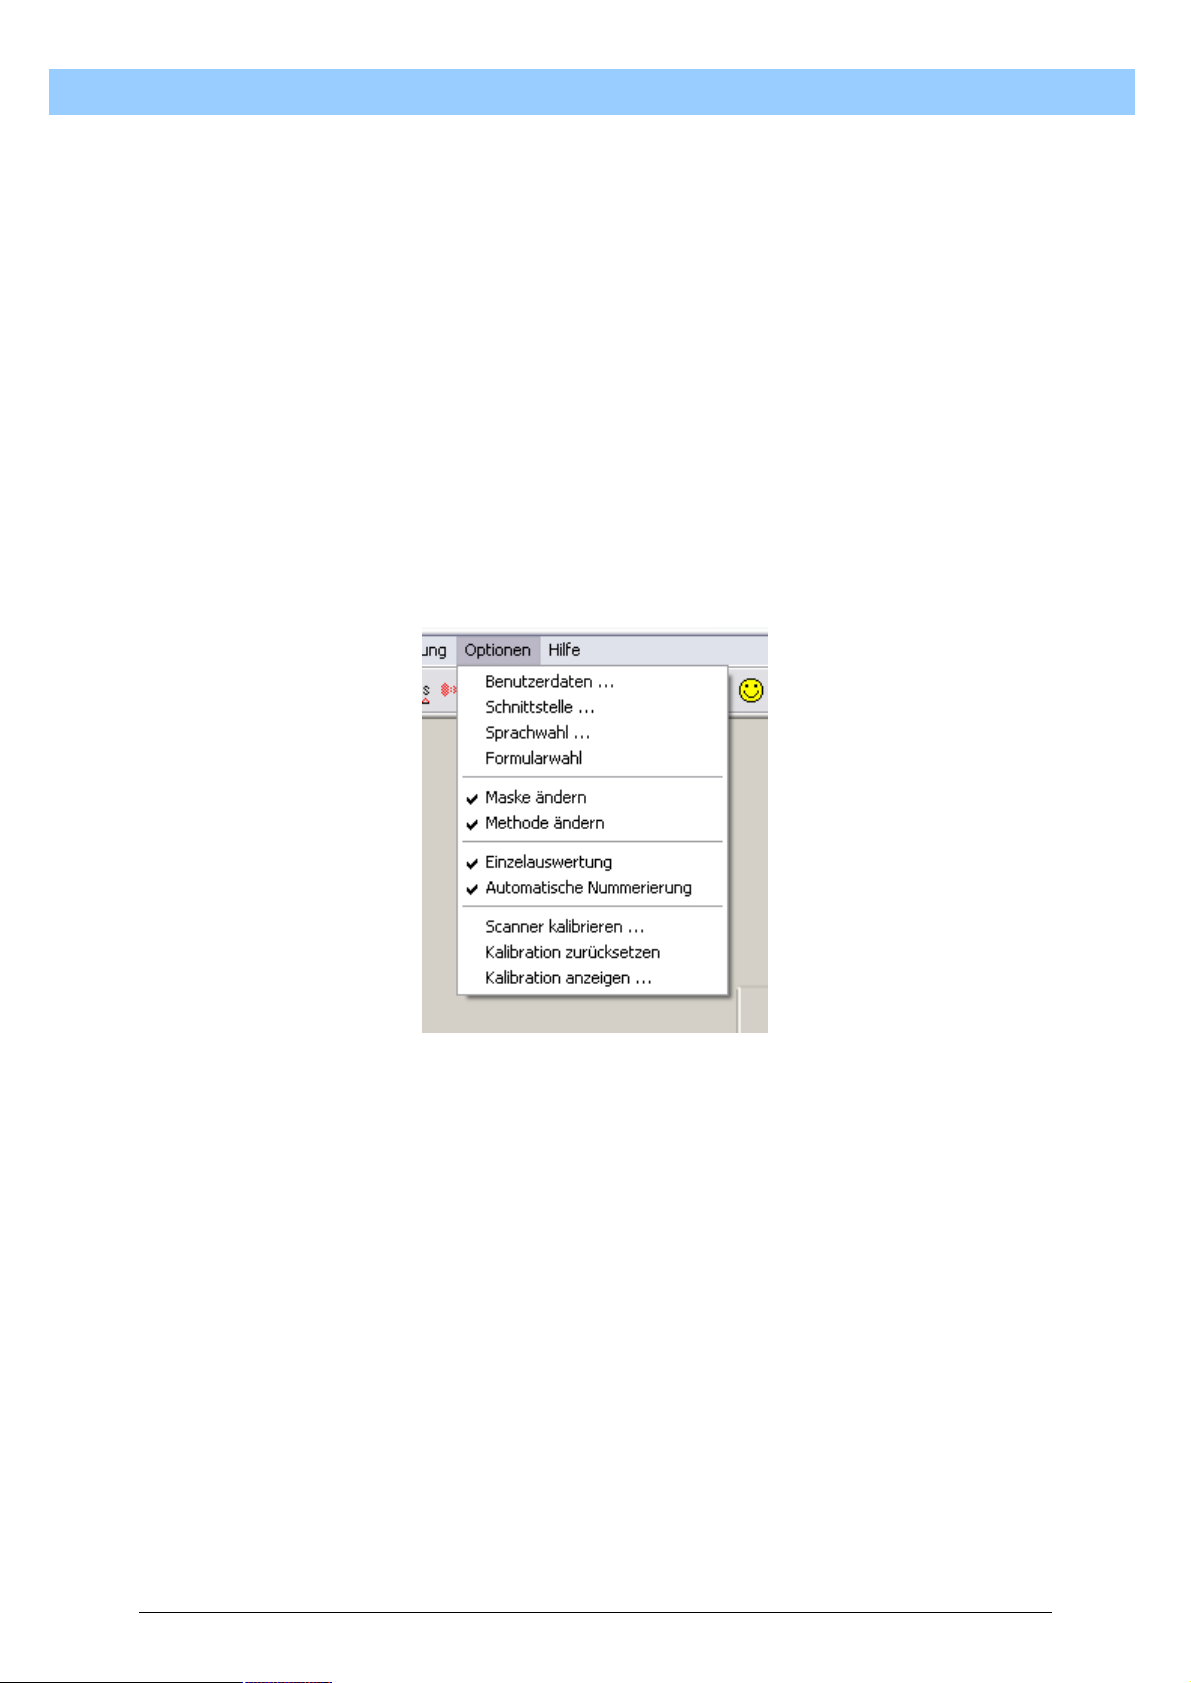
7.4. Options
T
T
T
u
u
u
r
b
o
S
c
a
n
U
s
e
r
M
a
n
u
a
l
r
b
o
S
c
a
n
U
s
e
r
M
a
r
b
o
S
c
a
n
U
s
e
r
M
a
n
n
u
u
a
a
l
l
7.4.1. User Data
The User Data are used to identify the laboratory which analysed the
electrophoreses. These data are reproduced on the printouts. See 8.2.12
for detailed description.
7.4.2. Interface
If the laboratory’s own DP is used for managing patient data, this can
communicate directly with the TurboScan analysis software. This is where
the appropriate port for communication is selected. See 8.2.13 for detailed
description.
7.4.3. Language
TurboScan is sold very successfully worldwide. With this function, the
appropriate language can be selected. See 8.2.14 for detailed description.
13
Page 14
T
u
r
T
T
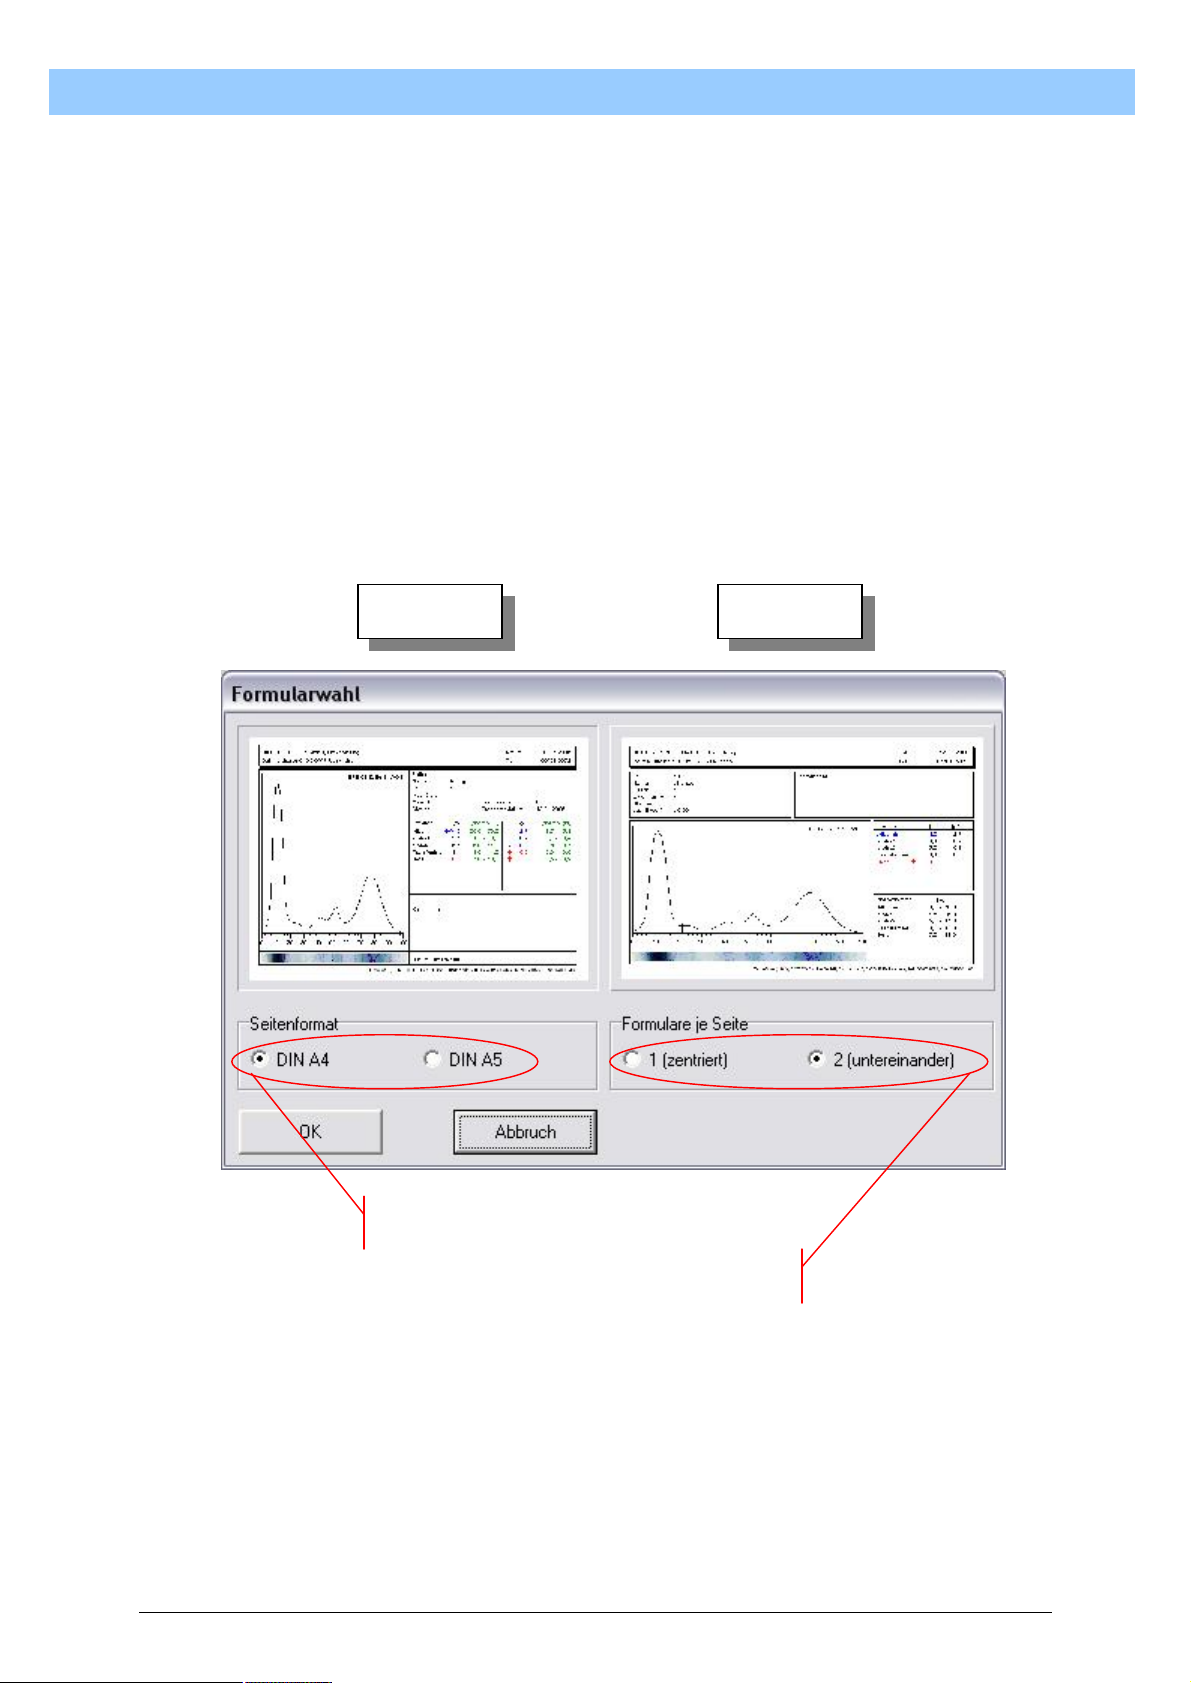
7.4.4. Form Selection
TurboScan offers you the option of selecting between 6 different printouts
of the results. There are two print layouts for different paper formats
available. The opening window shows the two print layouts as a graphic. A
single click of the left mouse button on the desired layout immediately
activates that layout. The desired paper format can be selected using the
radio buttons. The following combinations for print setup are possible:
• single print on DIN A5 landscape
• double print on DIN A4 portrait
• single print on DIN A4 portrait centred
The selection is applied immediately after the layout and paper format
have been set.
b
u
r
b
u
r
b
Layout 1 Layout 2
o
o
o
S
S
S
c
c
c
a
a
a
n
n
n
U
U
U
s
e
r
M
a
n
u
a
l
s
e
r
M
a
s
e
r
M
a
n
n
u
u
a
a
l
l
paper format selection
print setup selection
7.4.5. Change Mask
Masks are the arrangement of the different reading tracks. Depending on
the object used, you may store as many masks as you wish for correct
analysis. See 8.2.7 ff. for detailed description.
7.4.6. Change Method
Methods are the definition of specific electrophoreses with the relevant
names of the fractions and the corresponding normal ranges. TurboScan
14
Page 15

T
u
r
b
o
S
c
a
n
U
s
e
r
M
a
n
u
a
l
T
u
r
b
o
S
c
a
n
U
s
e
r
M
a
T
u
r
b
o
S
c
a
n
U
s
e
r
allows you to store as many methods as you like and assign these to the
analyses, if required. See 8.2.9 ff. for detailed description.
7.4.7. Single Analysis
Single Analysis is linked directly to the mask. TurboScan provides the
possibility of mask-dependent management of the Patient Journal. If there
is a mask comprising 10 electrophoresis tracks and this menu item has
been enabled, only patient data for these 10 tracks on the mask can be
input. From a list (which is transmitted by data transfer, where appropriate)
only the first 10 data records are accepted. Even when patient data are
entered manually, only as many data can be input as there are tracks on
the mask. However, this only applies to the mask that is automatically
loaded at program startup. This rule does not apply to masks that are
automatically created.
Thus a loaded mask may have 10 tracks, for instance, but the
automatically created mask only has 8. Ten patient data can hence be
input into the Patient Journal, even though only 8 tracks have been
analysed. Vice versa, it can also happen that the loaded mask has only 8
tracks while the automatically created mask found 10 tracks. Nevertheless
only 8 patient data will be input.
If Single Analysis is not enabled, there is unlimited entry of patient data. A
checkmark in front of the menu item indicates that Single Analysis is
enabled. If there is no checkmark in front of the menu item, it is not
enabled.
To enable or disable Single Analysis, single-click the left mouse button on
this menu item. The status changes from ON to OFF with every mouse
click.
Single Analysis is only intended for special cases in which the number of
electrophoreses to be analysed does not change.
This menu item should not be enabled as a default setting.
M
a
n
n
u
u
a
a
l
l
7.4.8. Automatic Numbering
Automatic Numbering undertakes the identification of individual samples. If
the user does not carry out his own identification of the samples,
TurboScan will do this automatically. Every sample is automatically
assigned a number, which provides a means of retrieving the analysed
samples on the actual day. The automatic ID is made up of 11 digits, the
first 4 denoting the year the data record was placed in the database, digits
5 + 6 the month, 7 + 8 the day and the last 3 digits the serial number.
It makes sense to use Automatic Numbering if you do not plan to use any
sample identification method of your own.
Automatic Numbering is enabled and disabled by single-clicking the left
mouse button on the menu item. Automatic Numbering status is shown by
a checkmark in front of the menu item. If there is a checkmark, sample ID
15
Page 16
T
u
r
b
o
S
c
a
n
U
s
e
r
M
a
n
u
a
l
T
u
r
b
o
S
c
a
n
U
s
e
r
M
a
T
u
r
b
o
S
c
a
n
U
s
e
r
is managed automatically by TurboScan. If there is no checkmark, sample
ID must be managed by the user.
7.4.9. Calibrate Scanner
Scanner calibration is not necessary for standard applications. This
calibration should only be used for images and analyses in colour spaces
that differ from the standard. Further instructions can be obtained from
BIOTEC-FISCHER GmbH, on request.
7.4.10. Reset Calibration
Resetting calibration restores the settings to the standard colour space.
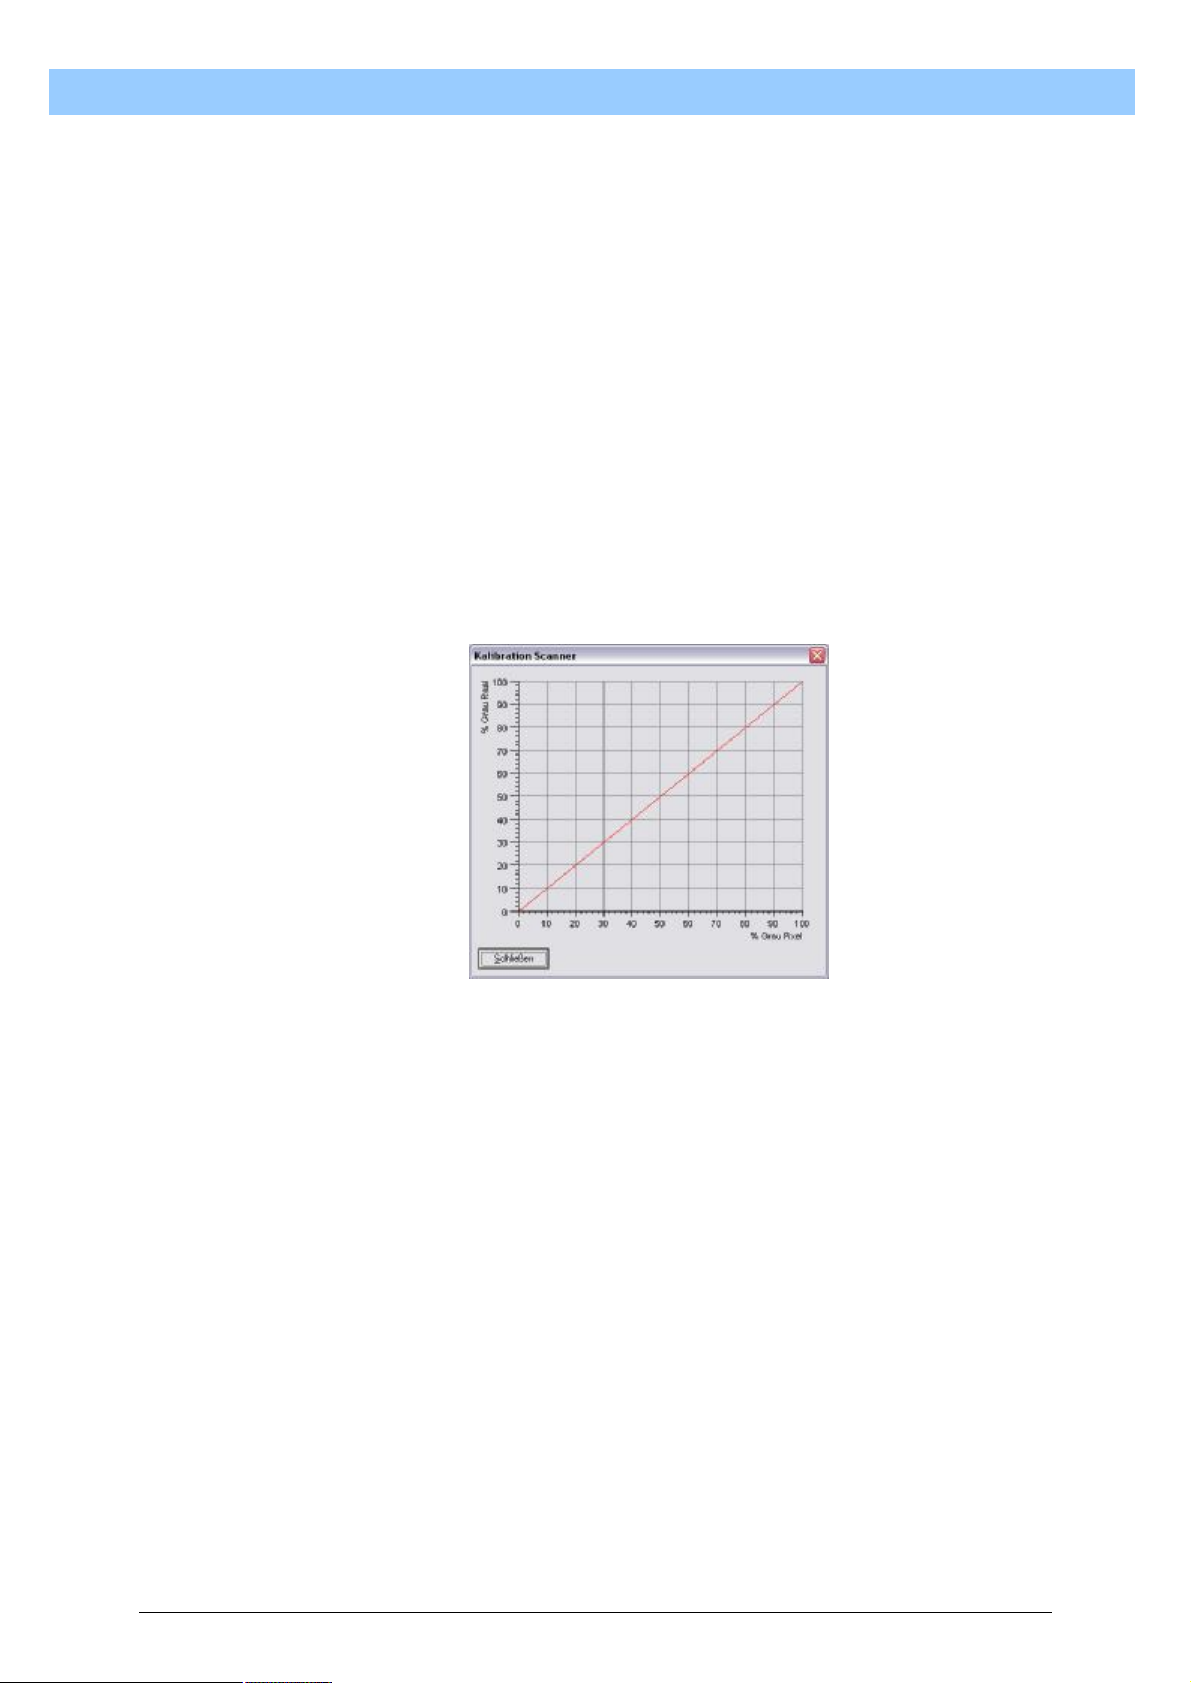
7.4.11. Display Calibration
This menu item displays a graph of the current calibration status. The
default setting shows a graph with a linear function.
M
a
n
n
u
u
a
a
l
l
7.5. Help
7.5.1. Index
Selecting this menu item accesses the current manual for help on using
TurboScan.
7.5.2. About
When this menu item is selected, general information about the program is
displayed. This includes the version number of the current program, the
current serial number and a contract address for questions about
TurboScan.
16
Page 17

T
u
r
b
o
S
T
u
r
u
b
r
b
T
8. TurboScan Button Bar
8.1. Scan
8.1.1. Scanner
Symbol displayed:
8.1.1.1. Capture image window
Single-clicking the left mouse button starts the procedure to record a new
image. First the “Scanned image” window opens and shows the last image
scanned.
o
o
S
S
c
c
c
a
a
a
n
n
n
U
U
U
s
e
r
M
a
n
u
a
l
s
e
r
M
a
s
e
r
M
a
n
n
u
u
a
a
l
l
The button bar at the head of this window can be used to reprocess the
current image. However, this is not usually necessary. The following
illustration shows the functions of the individual buttons:
1 2 3 4 5 6 7 8 9 10 11 12 13
1. Show whole image
2. Show image at maximum width
3. Show image at maximum length
4. Fit image to window
5. Original view of image
6. Rotate image clockwise 90°
7. Rotate image counterclockwise 90°
17
Page 18
T
u
r
b
o
S
c
a
n
U
s
e
r
M
a
n
u
a
l
T
u
r
b
o
S
c
a
n
U
s
e
r
M
a
T
u
r
b
o
S
c
a
n
U
s
e
r
8. Rotate image 180°
9. Rotate image around longitudinal axis
10. Rotate image around transverse axis
11. Cut out the selected section. To select the section, press and hold
the left mouse button. Display the required area by dragging the
mouse over it. The area is fixed when the mouse button is released.
When the function button is pressed to cut out the section of the
image, the area within the frame is cut out and saved as a new
image. The original image is overwritten in the process.
This process cannot be reversed.
12. Zoom in
13. Zoom out
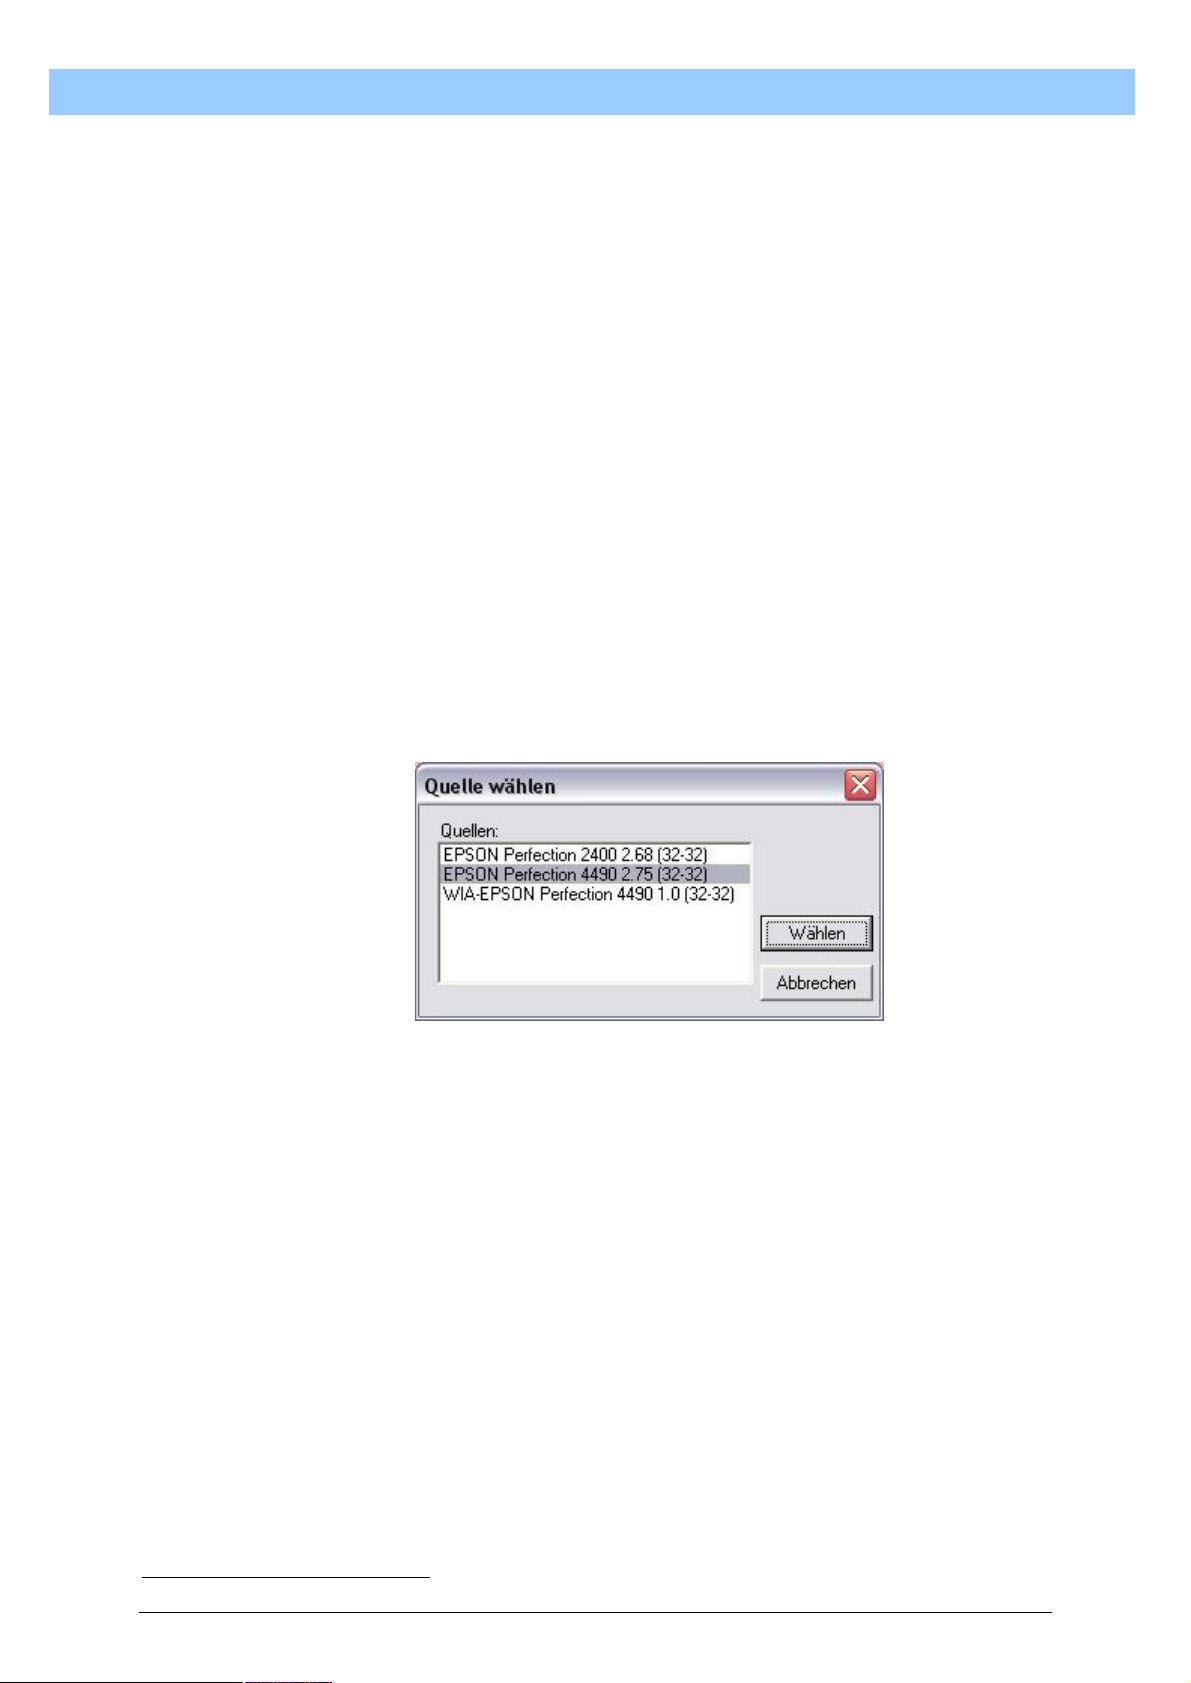
8.1.1.2. TWAIN device selection
In order to start recording, the scanner software supplied by the scanner
manufacturer should be started on a TWAIN interface basis. Move the
mouse pointer onto the TWAIN button and single-click the left mouse
button. This opens the window for selecting connected TWAIN devices. To
select the desired TWAIN device, position the mouse on the required
device and single-click the left mouse button on the selected device. To
accept the selected device, click on the “Select” button.
M
a
n
n
u
u
a
a
l
l
8.1.1.3. EPSON scanner settings2
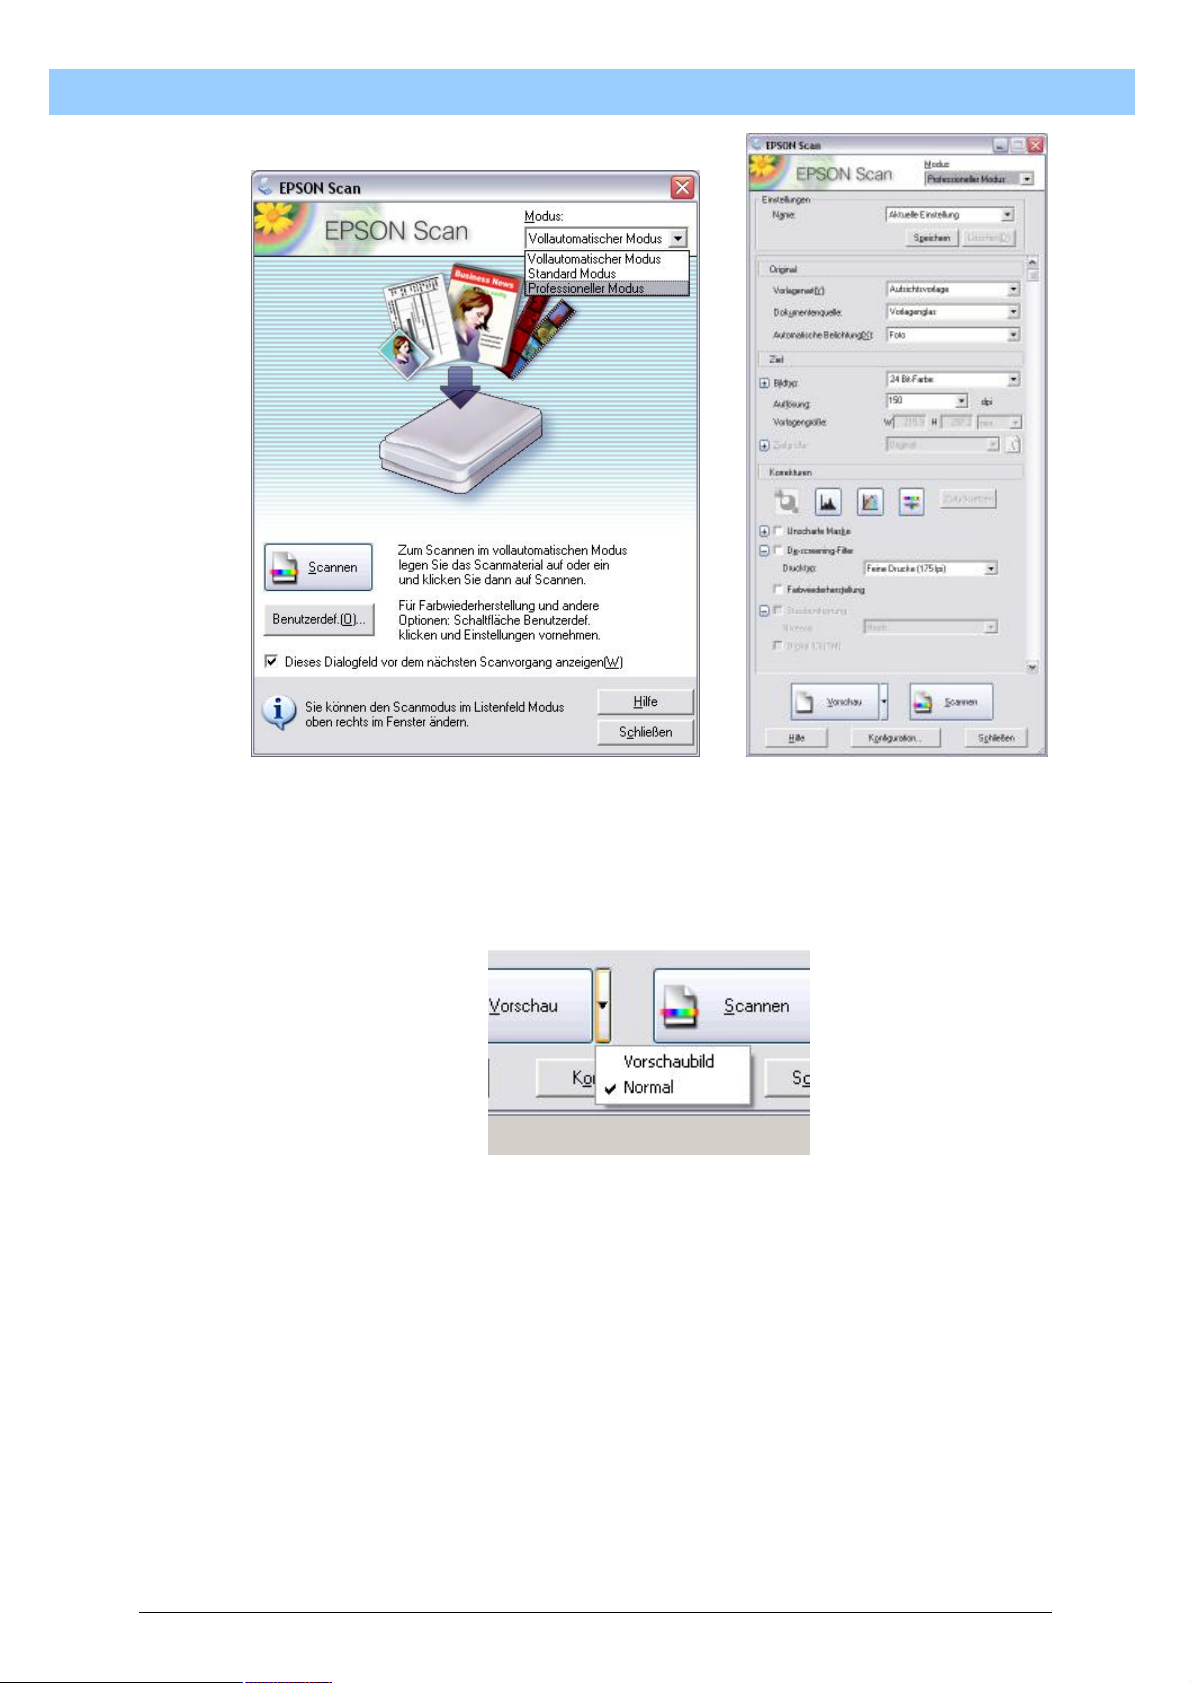
8.1.1.3.1. Scanning mode
When the EPSON TWAIN software is first started up, the system is set up
so that the scanning process runs in automatic mode. When the scanning
window can be seen on the screen, a selection popup appears in the top
part of the screen, which displays “Automatic Mode”. To change this
selection, click on the downward arrow of the dropdown menu and select
“Professional Mode”.
2
Example: scanner model EPSON perfection 4490
18
Page 19
T
T
T
u
u
u
r
b
o
S
c
a
n
U
s
e
r
M
a
n
u
a
l
r
b
o
S
c
a
n
U
s
e
r
M
a
r
b
o
S
c
a
n
U
s
e
r
M
a
n
n
u
u
a
a
l
l
The window closes and Professional Mode is displayed. To show the
preview image correctly, click on the arrow next to the “Preview” button.
From the self-opening pop-up, select “Normal” with a single click of the left
mouse button.
8.1.1.3.2. Basic setting for TurboScan
Use of the scanner is optimized for scanning photographs (negatives and
positives) and transparencies. However, use of the flatbed scanner here
requires different conditions for correct analysis of electrophoreses. To
achieve these conditions, a few settings need to be adjusted to match the
required conditions.
First decide on the area to be scanned. To do this, single-click the left
mouse button on “Preview”.
The scanner is started up and it scans an overview image, which is
displayed in a window on the right next to the Settings window. The
overlaid glass plate is displayed at the same time.
19
Page 20
T
u
r
b
o
S
c
a
n
U
s
e
r
M
a
n
u
a
l
T
u
r
b
o
S
c
a
n
U
s
e
r
M
a
T
u
r
b
o
S
c
a
n
U
s
e
r
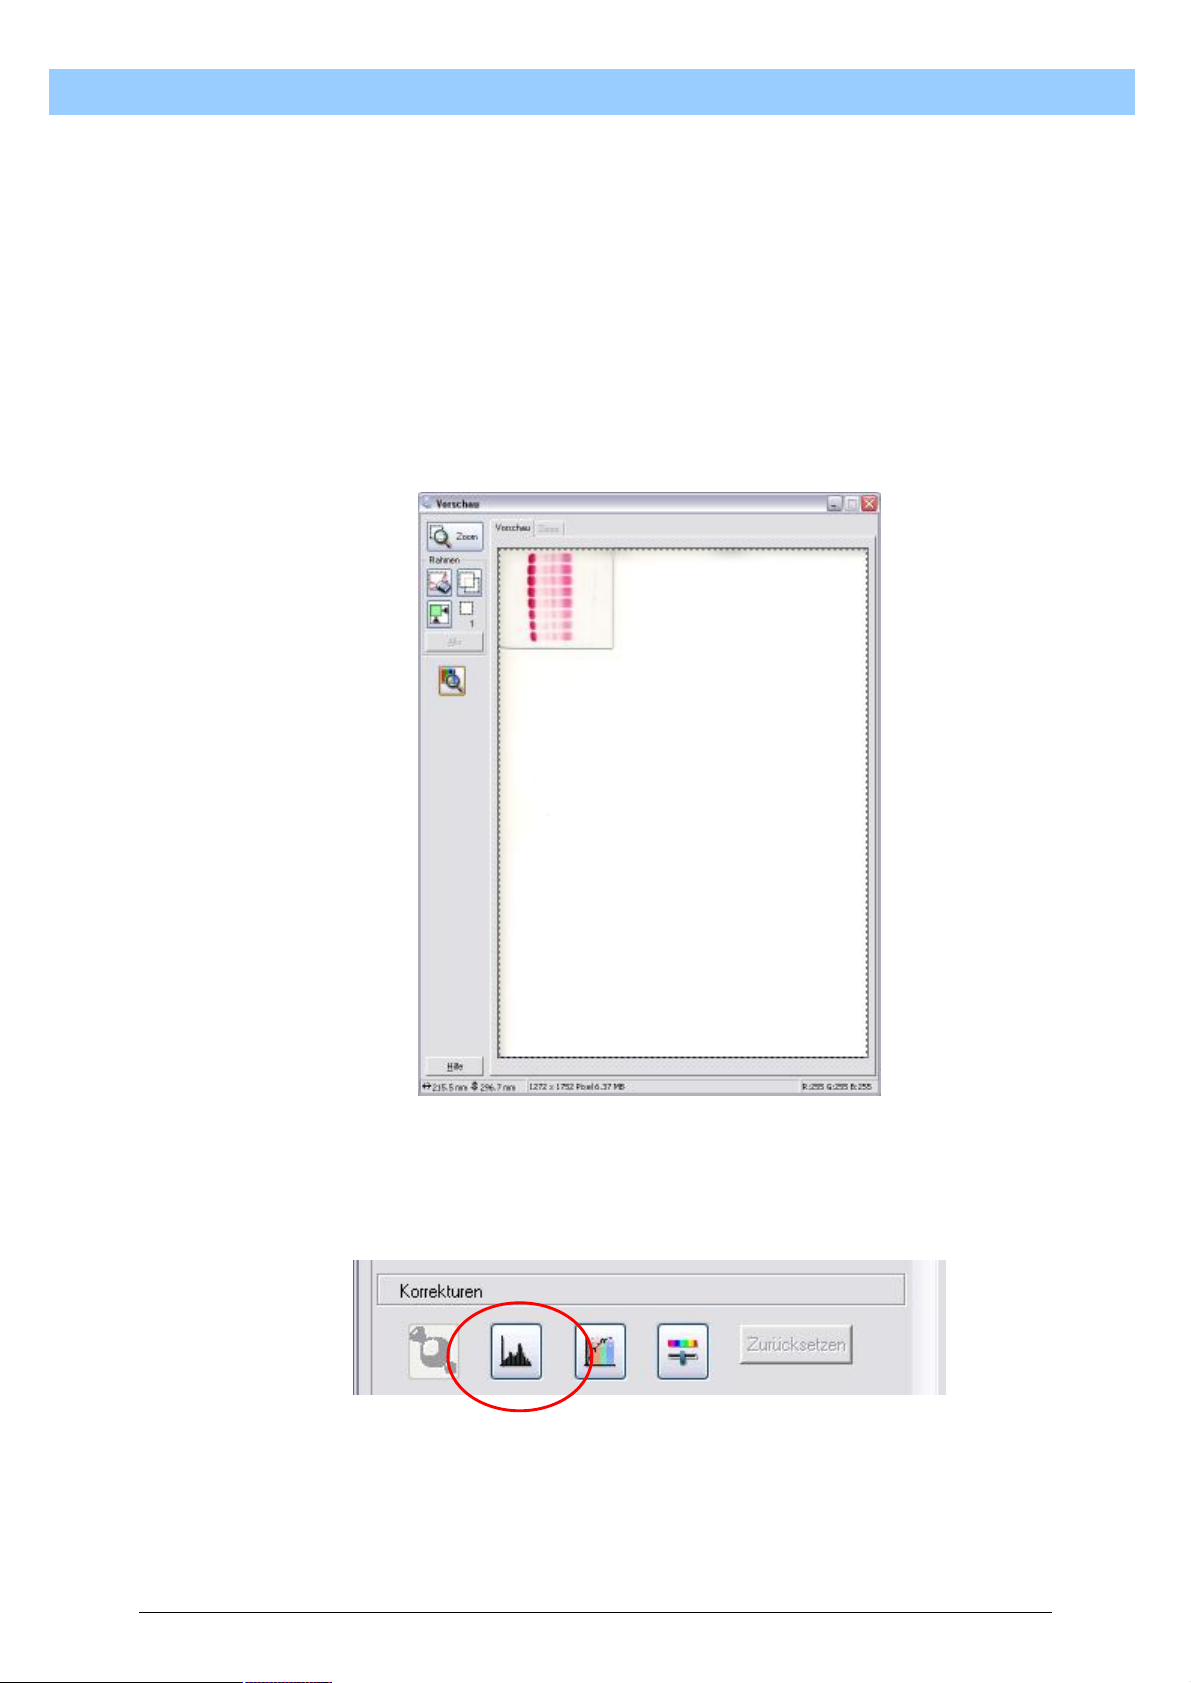
For problem-free routine work, the glass plate always needs to be placed
back in the same position. You can use an overlay template (example
available as a pdf file) for this purpose or always place the glass plate back
at zero on the scanner (as in this example). If using several glass plates,
the use of an overlay template is strongly recommended.
Before the technical scanning data can be adjusted, a scanning area has
to be defined. To do this, move the mouse pointer onto the top left point.
To select the area, press and hold the left mouse button, then drag the
mouse pointer down to the bottom right-hand corner. To fix the selection,
now release the left mouse button again. The selection is indicated by a
dashed line. This now frames the whole preview area.
M
a
n
n
u
u
a
a
l
l
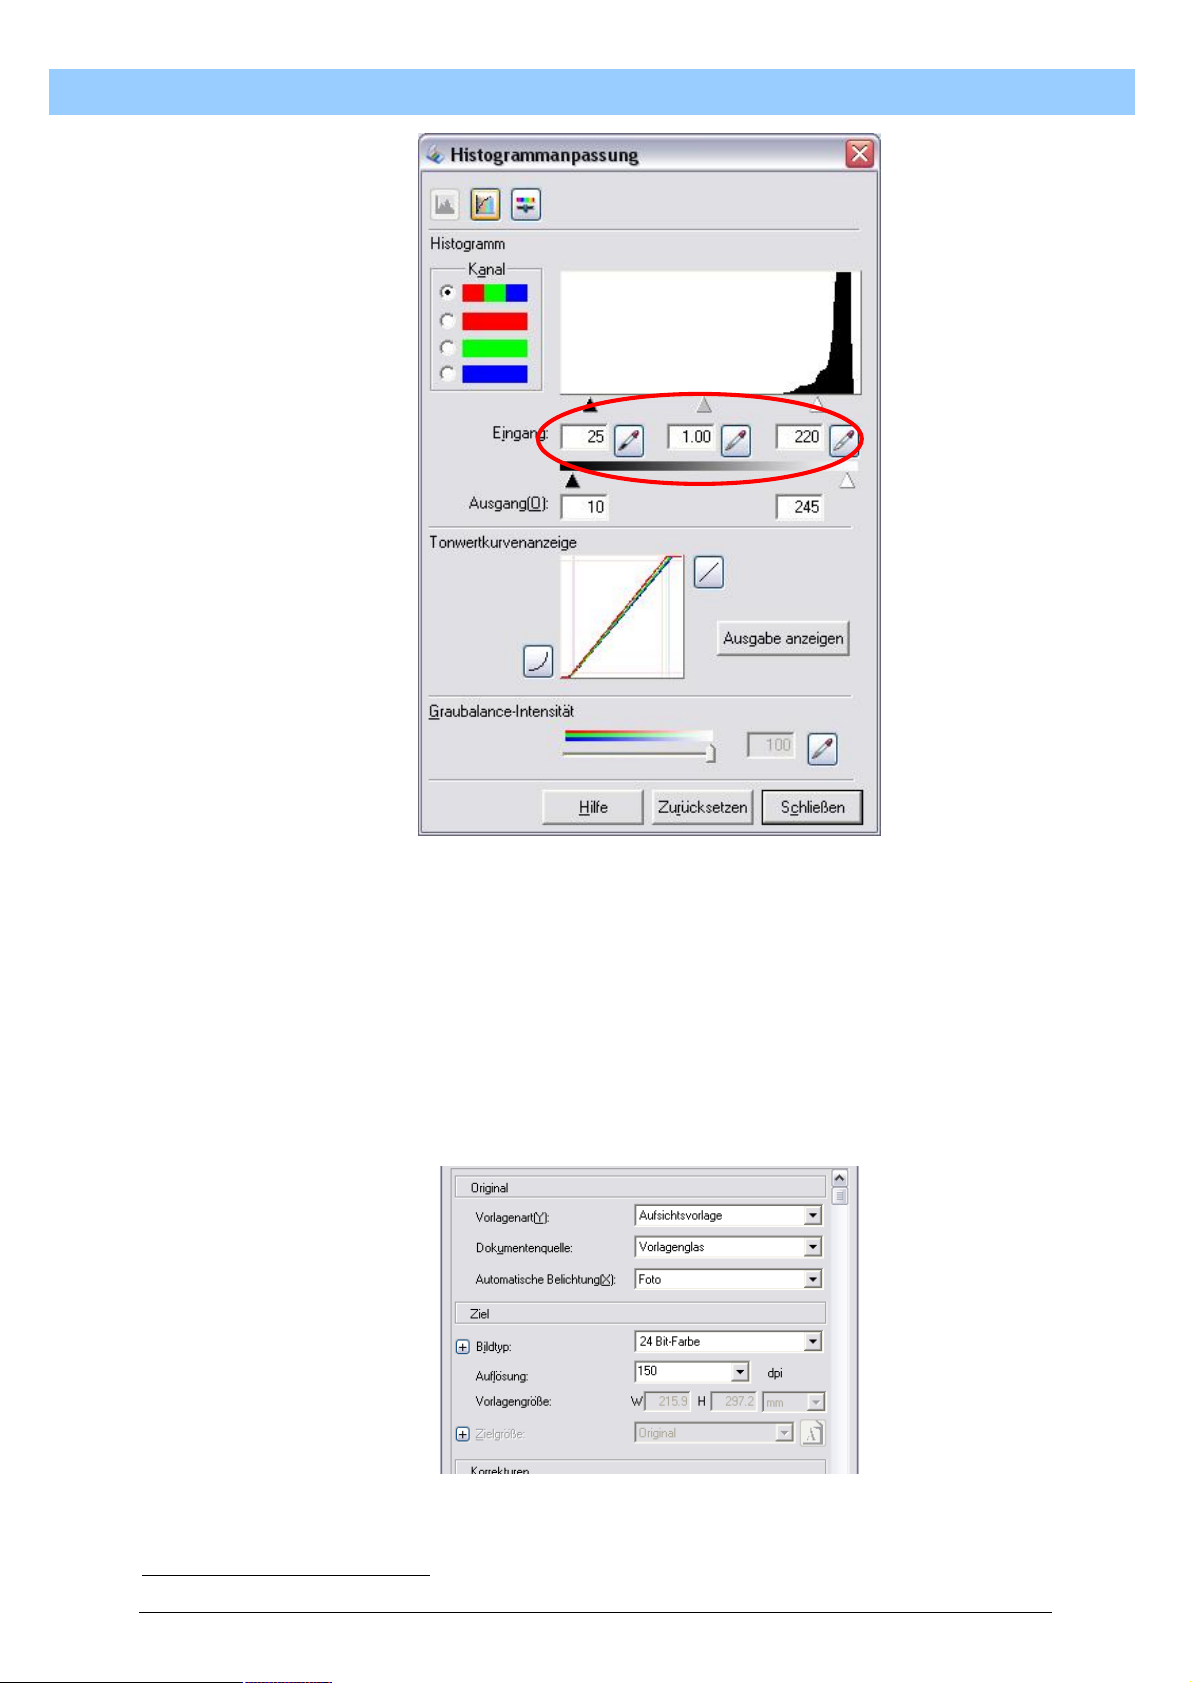
Next a histogram adjustment is necessary for the scanned images. To do
this, single-click the left mouse button on the button for Histogram
Adjustment.
The window that opens after selection shows the current histogram.
20
Page 21
T
T
T
u
u
u
r
b
o
S
c
a
n
U
s
e
r
M
a
n
u
a
l
r
b
o
S
c
a
n
U
s
e
r
M
a
r
b
o
S
c
a
n
U
s
e
r
M
a
n
n
u
u
a
a
l
l
For Ponceau S-stained gels and for Amido Black-stained gels, the
following values3 should be entered: Input: 25 / 1.00 / 220 from left to right;
Output 10 / 245 from left to right.
No further settings in the Histogram Adjustment are required.
In order to keep these entries, press the “Close” button.
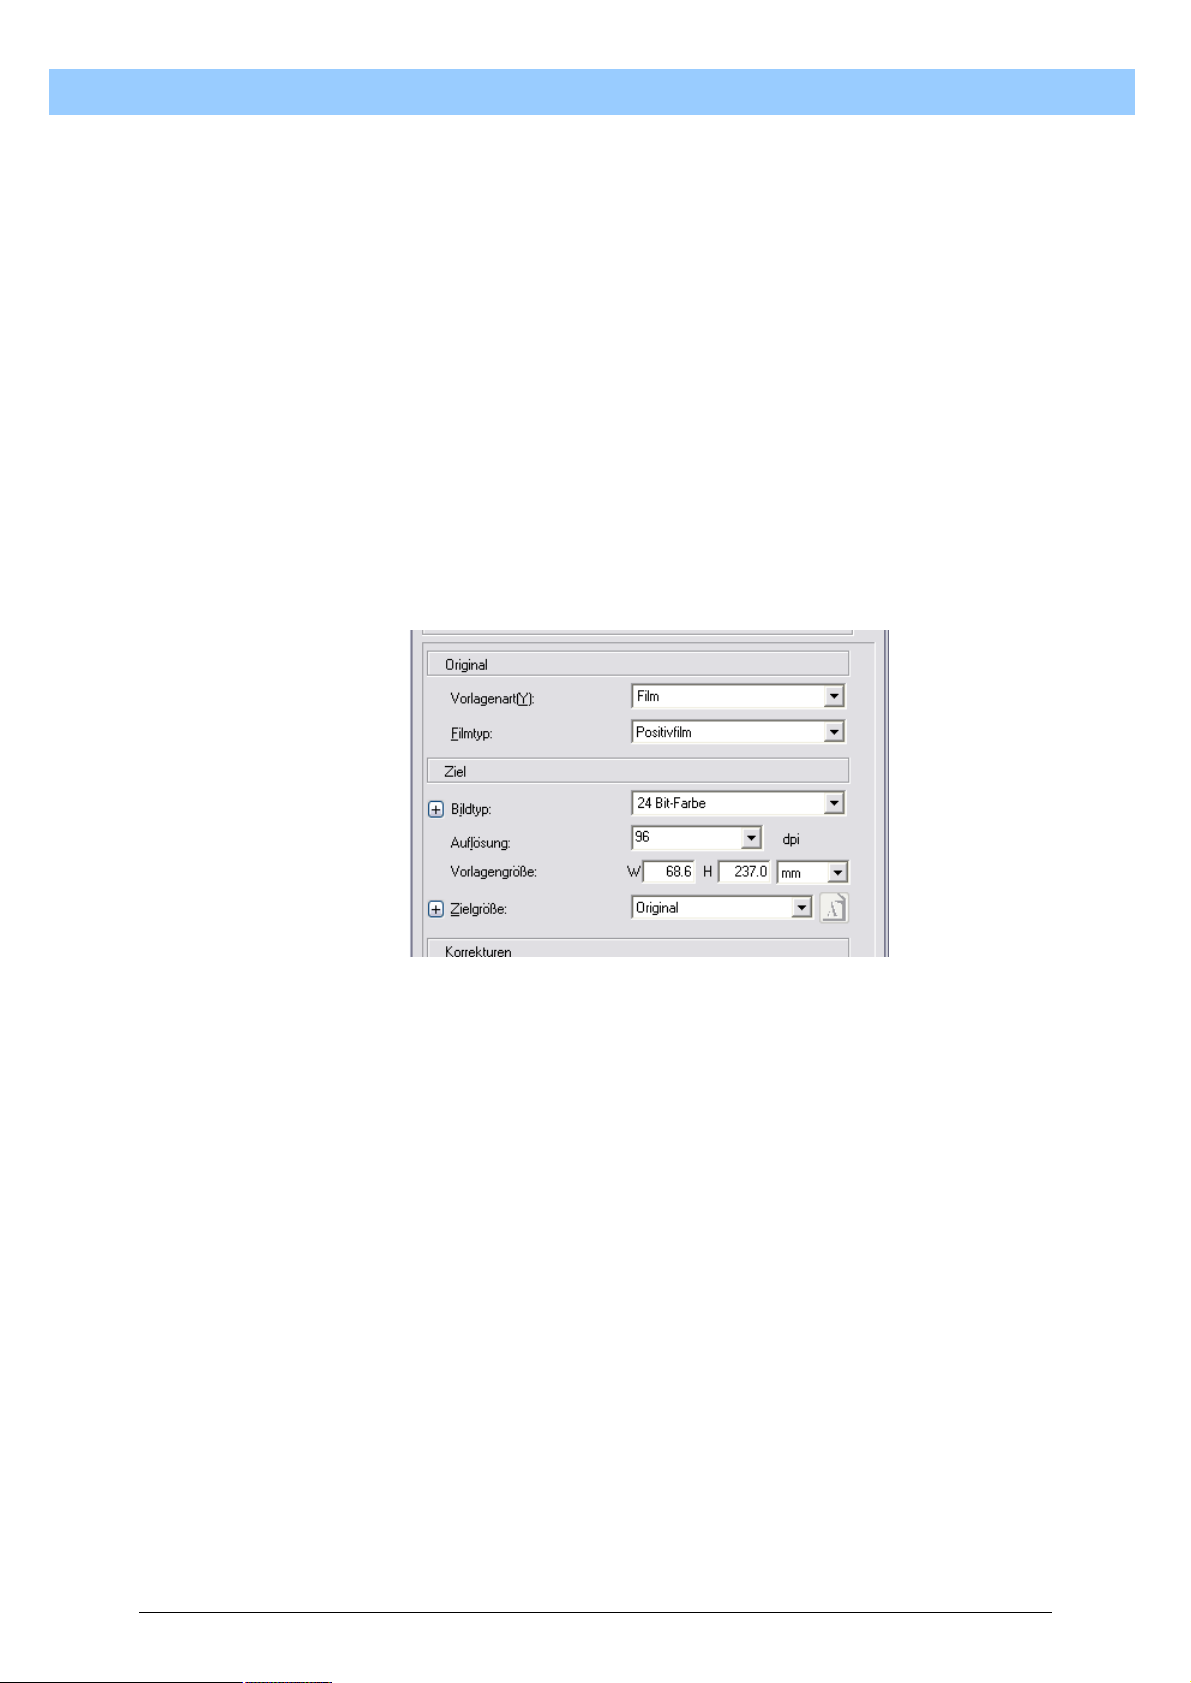
Now the type of original, document source and automatic exposure in dpi
still have to be set. The required settings can be read from the following
illustration:
For Standard Serum Protein Electrophoreses with the Ponceau S staining
method, the following settings are used:
3
Values may vary, depending on the system used.
21
Page 22
T
u
r
b
o
S
c
a
n
U
s
e
r
M
a
n
u
a
l
T
u
r
b
o
S
c
a
n
U
s
e
r
M
a
T
u
r
b
o
S
c
a
n
U
s
e
r
Original
Type of original: reflection original
Document source: off-the-glass
Automatic exposure: photo
Target
Image type: 24-bit colour
Resolution: 150 dpi
Amido Black-stained gels are measured in transmission mode. To do this,
detach the white covering upwards from the inside of the cover. For
analyses in transmission mode, the use of a positioning template is
strongly recommended.
Type of original, document source, automatic exposure as well as image
type and resolution should be entered as displayed below:
M
a
n
n
u
u
a
a
l
l
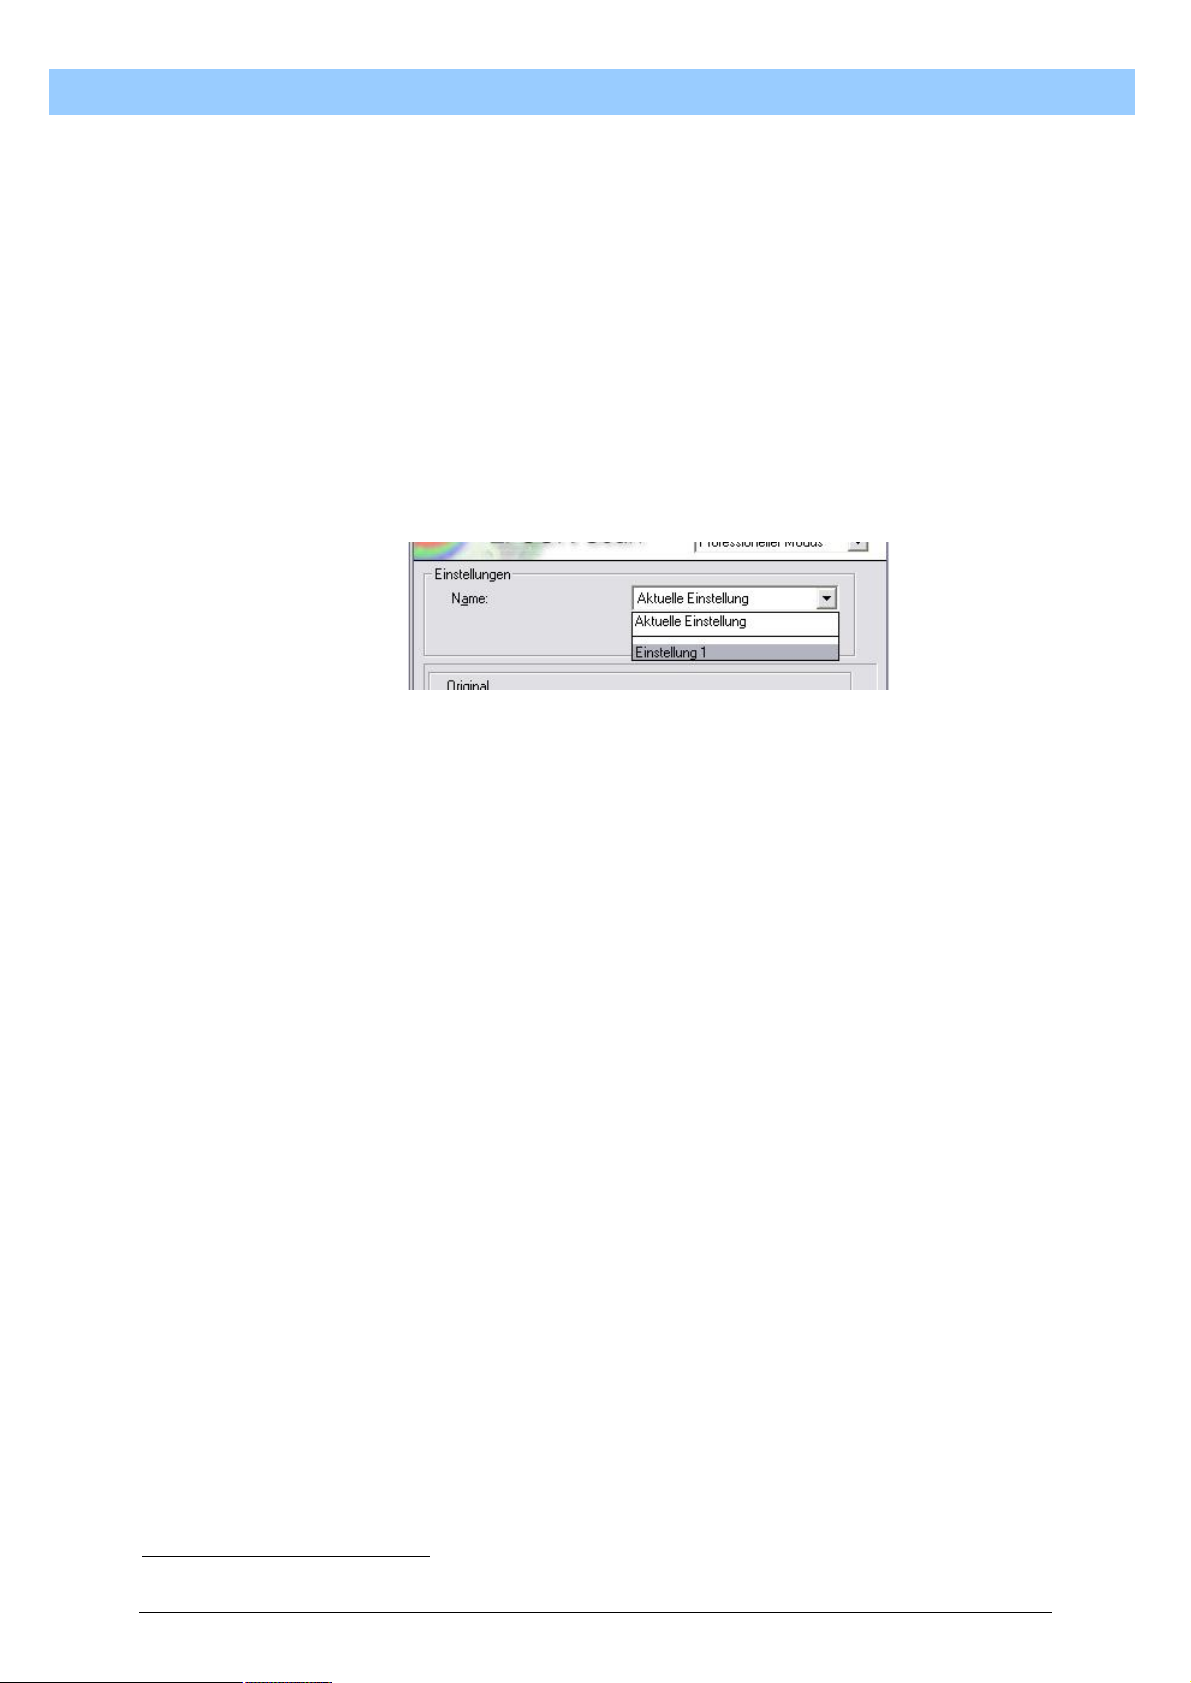
For Standard Serum Protein Electrophoreses with the Amido Black
staining method, the following settings are used:
Original
Type of original: film
Film type: positive film
Target
Image type: 24-bit colour
Resolution 96 dpi
Once all the default values have been entered, these can be saved onto
the hard disk.
22
Page 23
T
u
r
b
o
S
c
a
n
U
s
e
r
M
a
n
u
a
l
T
u
r
b
o
S
c
a
n
U
s
e
r
M
a
T
u
r
b
o
S
c
a
n
U
s
e
r
8.1.1.3.3. Save settings
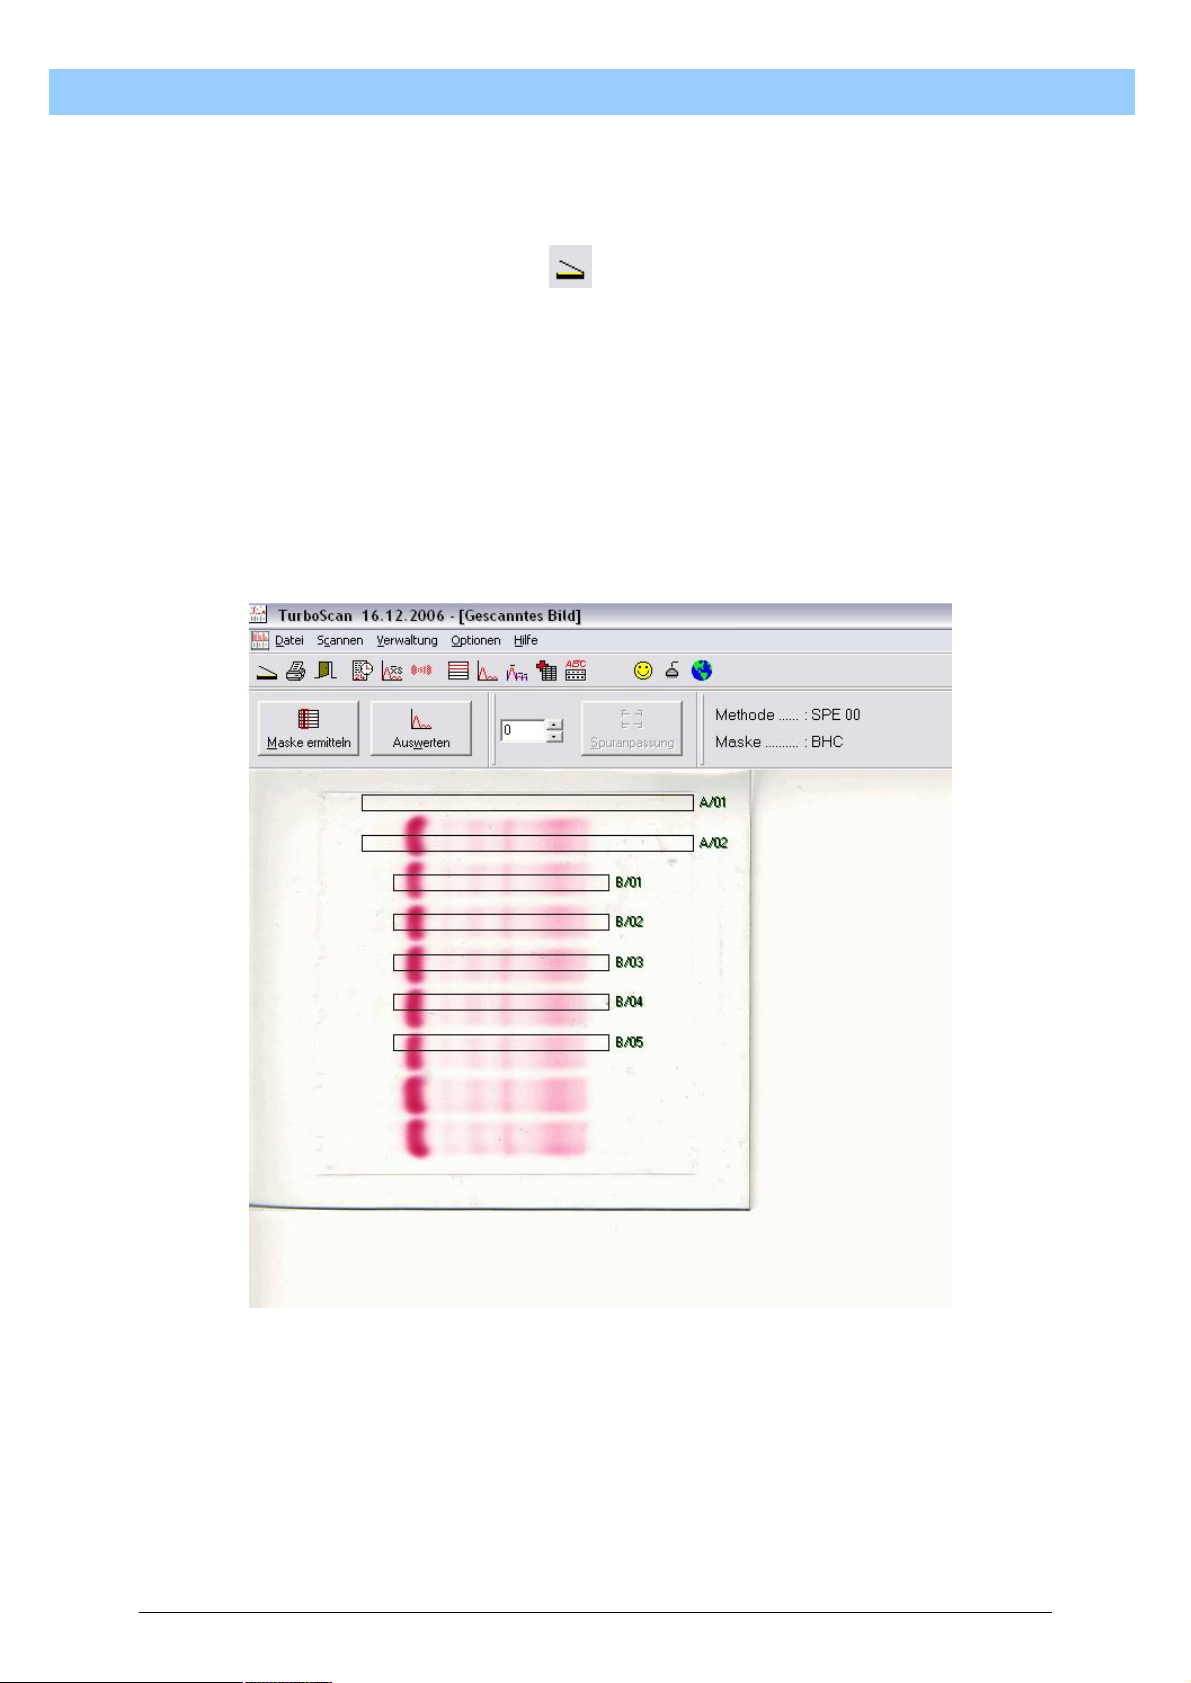
To save what is now the current setting, click on the left mouse button on
the “Save” button in the top part of the Scan window. The data record is
now saved under the name “Setting 1”4.
8.1.1.3.4. Restore default settings
If you need to restore the current default settings, you simply have to click
on the downward arrow in the popup window in the top part of the Scan
window and single-click the left mouse button on the saved setting you
wish to select. This deletes all the current settings and activates the
settings you have selected.
M
a
n
n
u
u
a
a
l
l
8.1.1.3.5. Image scanning for Ponceau S-stained objects
You can start working with TurboScan once all the default settings have
been made. For serum protein electrophoreses stained with Ponceau-S
Red, work in reflection mode. To do this, place the glass plate onto the
positioning template, if necessary, or at the zero point of the scanner (in
this case the top right-hand corner of the scanner). The glass plate should
be positioned so that the albumin bands show on the right and the first
electrophoresis track comes to lie at the top edge5. Close the scanner
cover. With the window still open for Professional Mode, single-click the left
mouse button on “Scan”. The scanner is now set in motion and records the
object placed on the flatbed.
8.1.1.3.6. Image scanning for Amido Black-stained objects
For Amido Black-stained gels, follow the same procedure as for Ponceau
S-stained gels. The difference is that, as previously mentioned, scanning
should be done in transmission mode. For Amido Black gels with weak
staining, the reflection mode may also be used.
4
The name may change, depending of the number of settings already stored.
5
The positioning of the electrophoreses may change on alternative scanner models.
23
Page 24
8.2. Analyse
8.2.1. Scan and Analyse
After the image has been scanned, the TWAIN window of the scanner
closes automatically. The TurboScan window “Capture image” reappears
with the image just scanned. If necessary, sections can be selected or the
image can be rotated at this stage. Single-click the left mouse button on
“OK” to confirm the image and hence transfer the image for analysis.
The Scanned image window opens in maximized mode. If a mask has
been activated, the last-used mask appears screened over the image. If
the positioning of the glass plate is identical, the mask can be used without
any correction.
T
T
T
u
u
u
r
b
o
S
c
a
n
U
s
e
r
M
a
n
u
a
l
r
b
o
S
c
a
n
U
s
e
r
M
a
r
b
o
S
c
a
n
U
s
e
r
M
a
n
n
u
u
a
a
l
l
8.2.1.1. Automatically create mask
If you have originals where the content is constantly changing, it makes
sense to use the automatic track search. When setting up an object type
for the first time, automatic track search can also be used for one-off
definition.
24
Page 25
T
u
r
b
o
S
c
a
n
U
s
e
r
M
a
n
u
a
l
T
u
r
b
o
S
c
a
n
U
s
e
r
M
a
T
u
r
b
o
S
c
a
n
U
s
e
r
8.2.1.1.1. Mask arrays
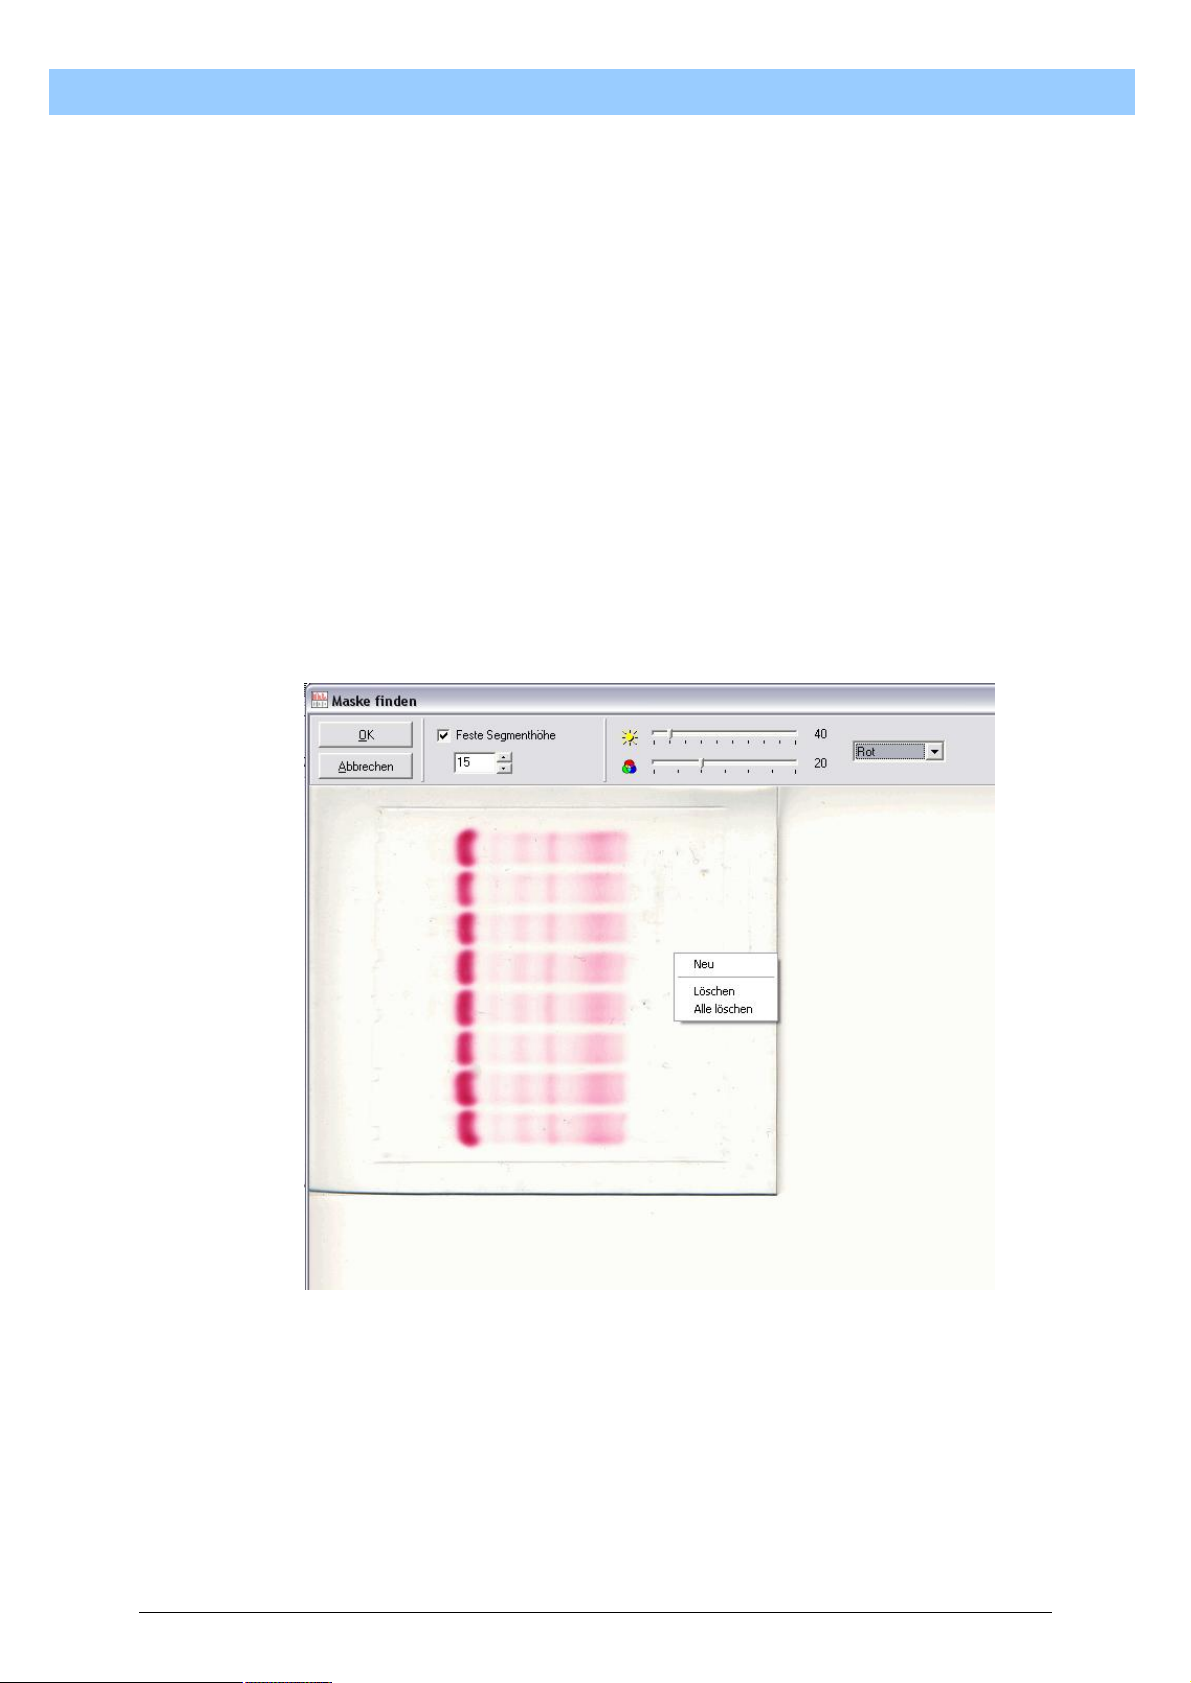
To start the automatic mask-finding procedure, single-click the left mouse
button on “Get mask”. This opens the “Find mask” window, which shows
the current recording and a few functions for automatic track-finding. The
fixed segment height indicates how wide each track to be read should be.
This is identical for all tracks. If this function is disabled, each track is
located individually in the current track width. The “brightness” and “colour
intensity” slide controls are used for fine-tuning the track recognition.
However, the program offers default settings which are optimized for
standard staining methods. These can be selected in the popup selection
window.
As the first step in mask creation, an area should be selected within which
the TurboScan software is to search the tracks. Single-click the right
mouse button inside the image to select this area. A small menu opens
right next to the mouse pointer. Single-click the left mouse button on the
first menu entry “New” to activate input mode. This is shown by the mouse
pointer changing from the standard arrow shape into a cross-shaped
cursor.
M
a
n
n
u
u
a
a
l
l
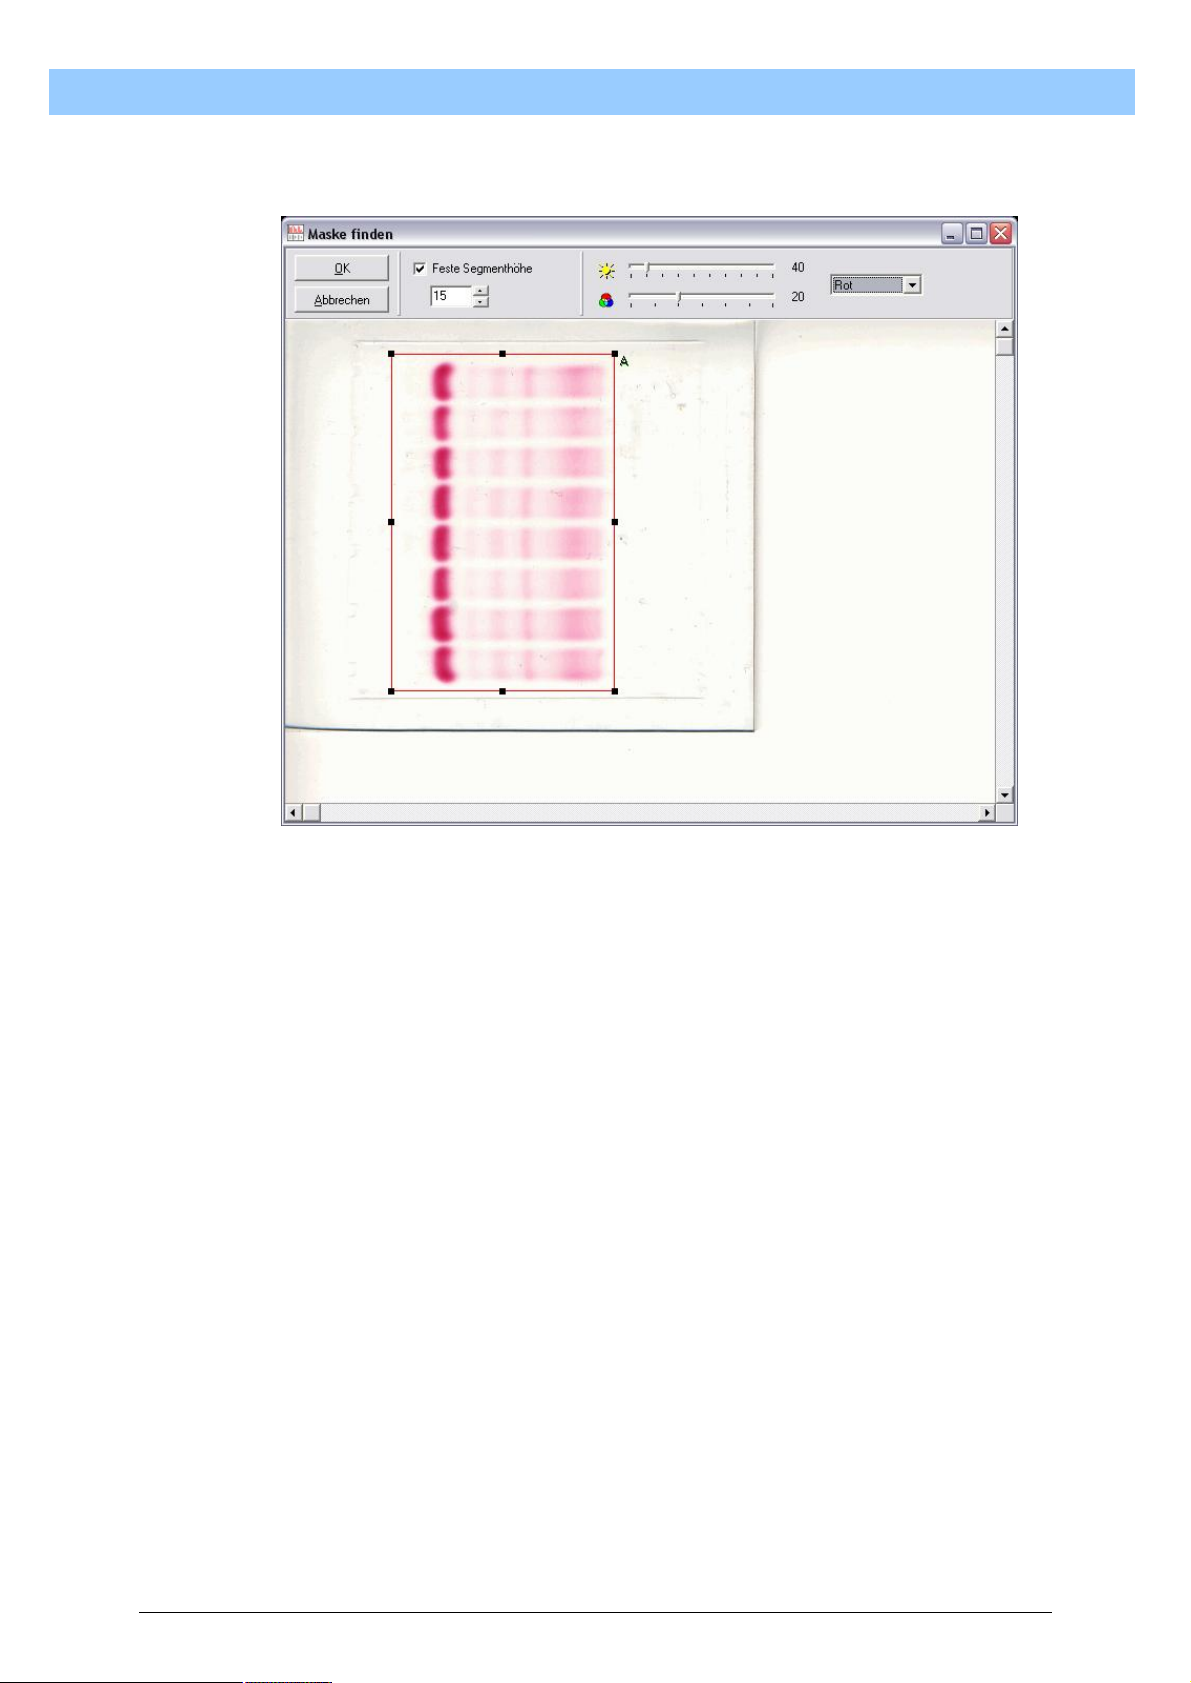
To select the desired area, position the cursor on the left above the tracks.
Now press and hold the left mouse button. Drag the mouse to move the
cursor into a position on the right below the electrophoreses. All the
electrophoresis tracks should be located within the rectangle you have
selected. Now release the left mouse button so that the position of the
rectangle remains fixed. An identification letter appears at the top right-
25
Page 26
T
u
r
b
o
S
c
a
n
U
s
e
r
M
a
n
u
a
l
T
u
r
b
o
S
c
a
n
U
s
e
r
M
a
T
u
r
b
o
S
c
a
n
U
s
e
r
hand corner of the rectangle to enable you to distinguish different areas
later.
M
a
n
n
u
u
a
a
l
l
For correct track-finding, the frame needs to be positioned in the upper and
lower border area against the background colour. If this is not the case,
tracks may be incorrectly found.
8.2.1.1.2. Segment width
For subsequent adjustment of the area, the black squares can be located
with the mouse pointer. The pointer changes into double arrows indicating
the direction in which a change can be made. Press and hold the left
mouse button to change the frame in the directions indicated by the double
arrow. Release the left mouse button to fix the frame in its new position.
Single-clicking the left mouse button on “OK” will start calculation of the
tracks. The “Find mask” window closes automatically and the “Scanned
image” window reappears with the newly calculated tracks.
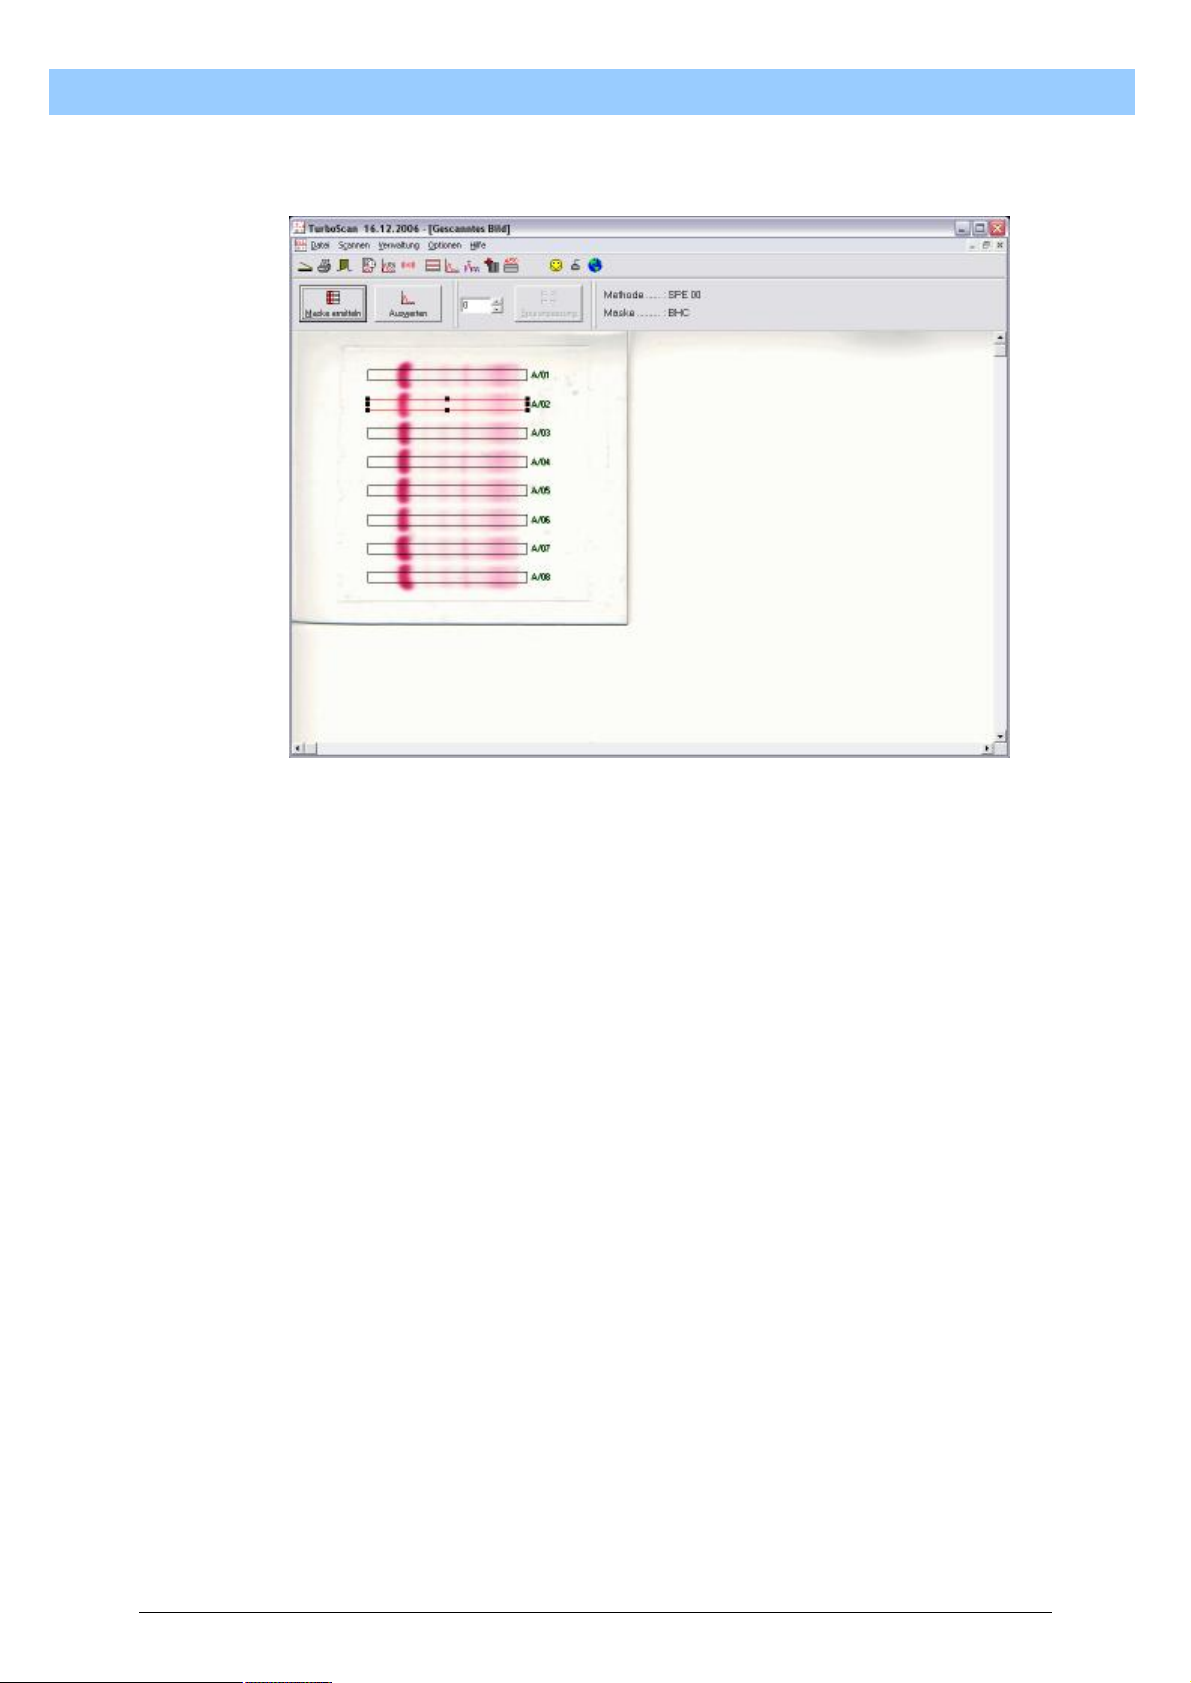
8.2.1.1.3. Correction of mask segments
Normally no correction of the automatically located tracks is required.
However, if tracks from a stored mask are used, there is a possibility that
the tracks will have to be corrected slightly.
The procedure is identical to that of segment correction for automatic trackfinding (see 8.2.1.1.2). However, before the correction can be made, the
track to be changed must be activated. To do this, position the mouse point
within the track to be changed and single-click the left mouse button. The
frame of the track turns red and the black correction squares appear at the
26
Page 27
T
u
r
b
o
S
c
a
n
U
s
e
r
M
a
n
u
a
l
T
u
r
b
o
S
c
a
n
U
s
e
r
M
a
T
u
r
b
o
S
c
a
n
U
s
e
r
corners and in the middle of the sides. The correction can now be done as
described above.
M
a
n
n
u
u
a
a
l
l
8.2.1.1.4. Save mask
As the original objects do not normally change, it is enough to have the
tracks found automatically once when the TurboScan software is installed
and to save these tracks in a database. The advantage is that the
appropriate mask is already loaded every time you start the TurboScan
software and the analysis can be carried out immediately.
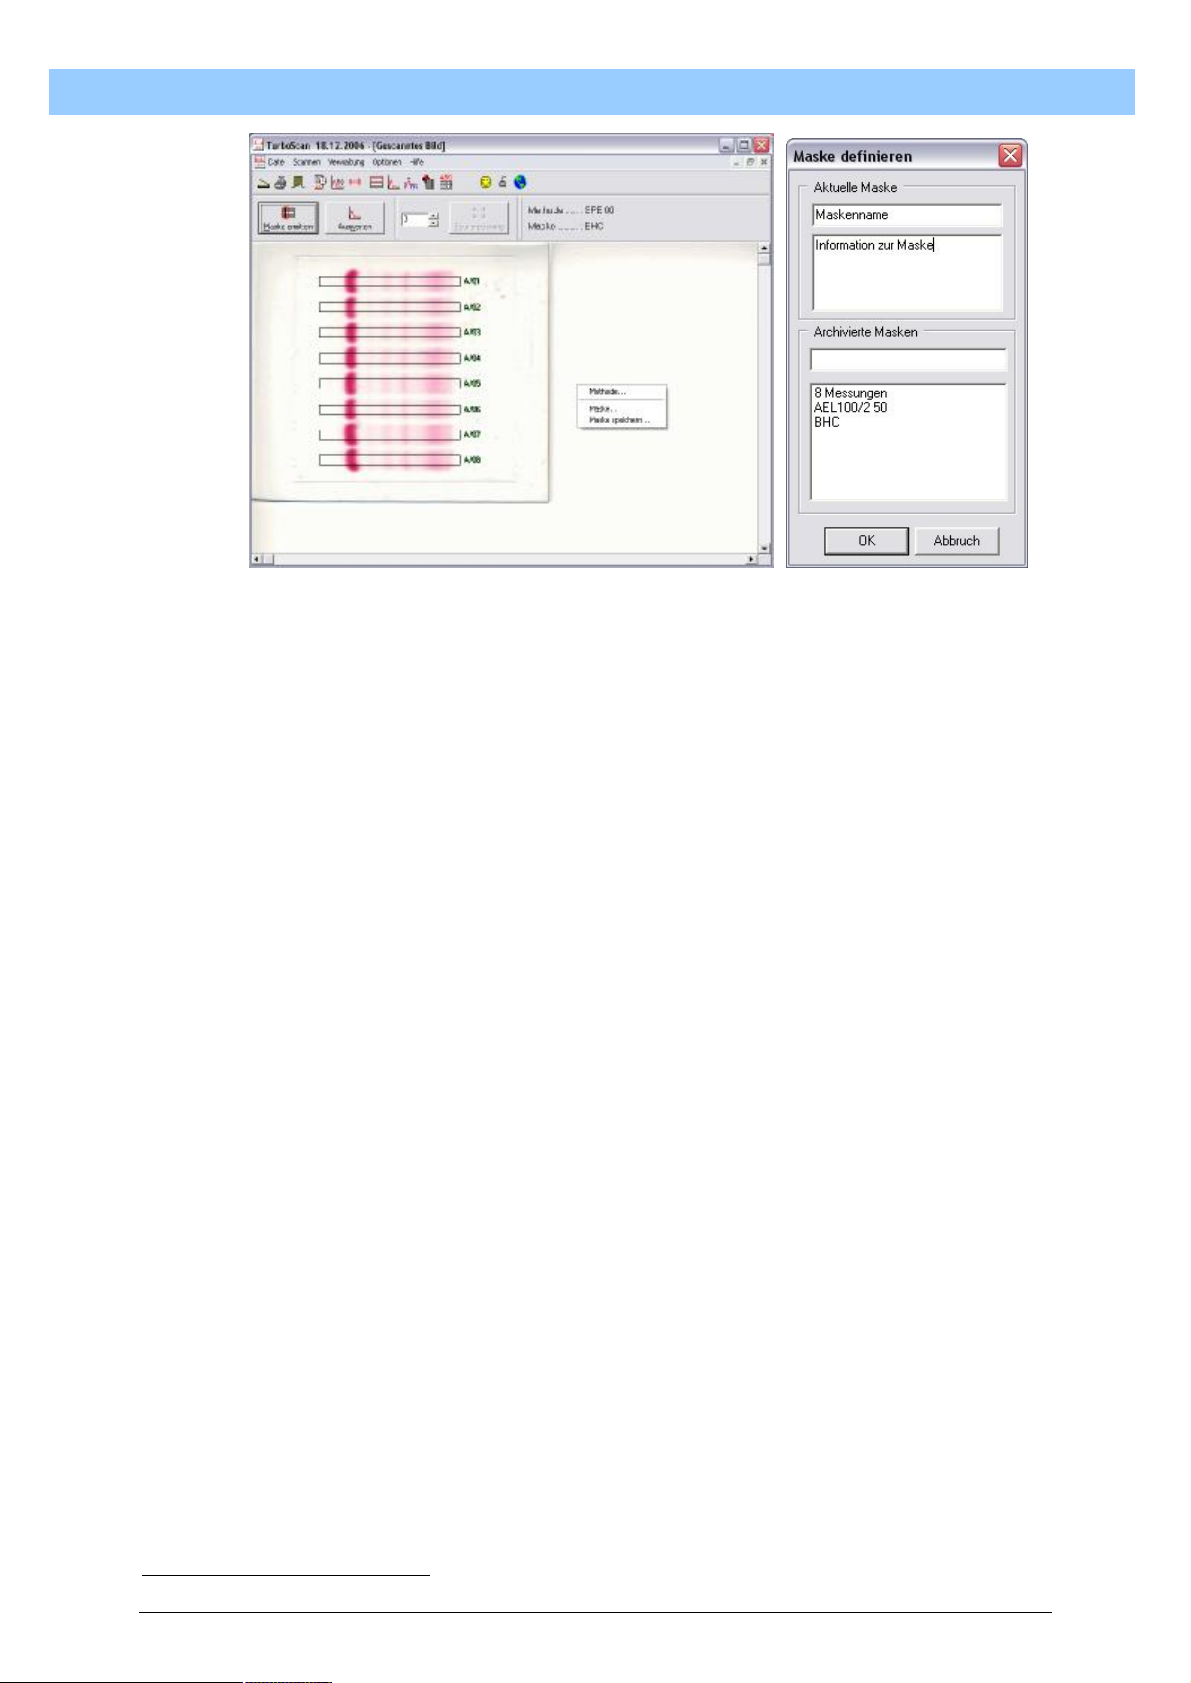
To save the current mask single-click the right mouse button in the
“Scanned image” window. A small menu appears with the mouse pointer.
Single-click the left mouse button while the pointer is positioned on the
selected menu item “Save mask”: this brings up the reduced window
“Define mask”. To input data, activate the “Current mask” field in the top
part of the window. To do this, position the mouse pointer in the top narrow
entry field and single-click the left mouse button. You can now enter the
mask name via the keyboard. For more detailed information, such as
selected scanning resolution, number of tracks, electrophoresis equipment
used or similar, press the Tab key on the keyboard to skip to the entry field
underneath. The desired or necessary information can now be entered via
the keyboard.
When you single-click the left mouse button on “OK”, the current mask
under the name you have just given it, together with the relevant
information, is included in the Masks Database.
27
Page 28
T
u
r
b
o
S
c
a
n
U
s
e
r
M
a
n
u
a
l
T
u
r
b
o
S
c
a
n
U
s
e
r
M
a
T
u
r
b
o
S
c
a
n
U
s
e
r
From the time it is saved, this mask is accepted as a default mask and
automatically loaded after program start-up.
M
a
n
n
u
a
l
u
a
l
8.2.1.2. Select saved mask
In laboratories with several different analyses, it may be necessary to use
different equipment for electrophoresis. This may require a change of
mask. Once a mask has first been set up (8.2.1.1 ff. and 8.2.7.ff) and
saved, it can be retrieved from the database at any time and used as a
default mask. To do this, get the menu on screen as described under
8.2.1.1.4 and activate the selection “Mask”. The enlarged or the reduced
selection window for Masks will appear, depending on the setting in the
menu item Options.
The currently saved masks are displayed in the bottom left array of the
enlarged window or in the bottom array of the reduced “Define mask”
window. Double-click the left mouse button with the pointer positioned on a
saved mask and the corresponding additional information will appear in the
top array. Single-click the left mouse button on “OK” and the information
displayed in the top array is. [.....]*
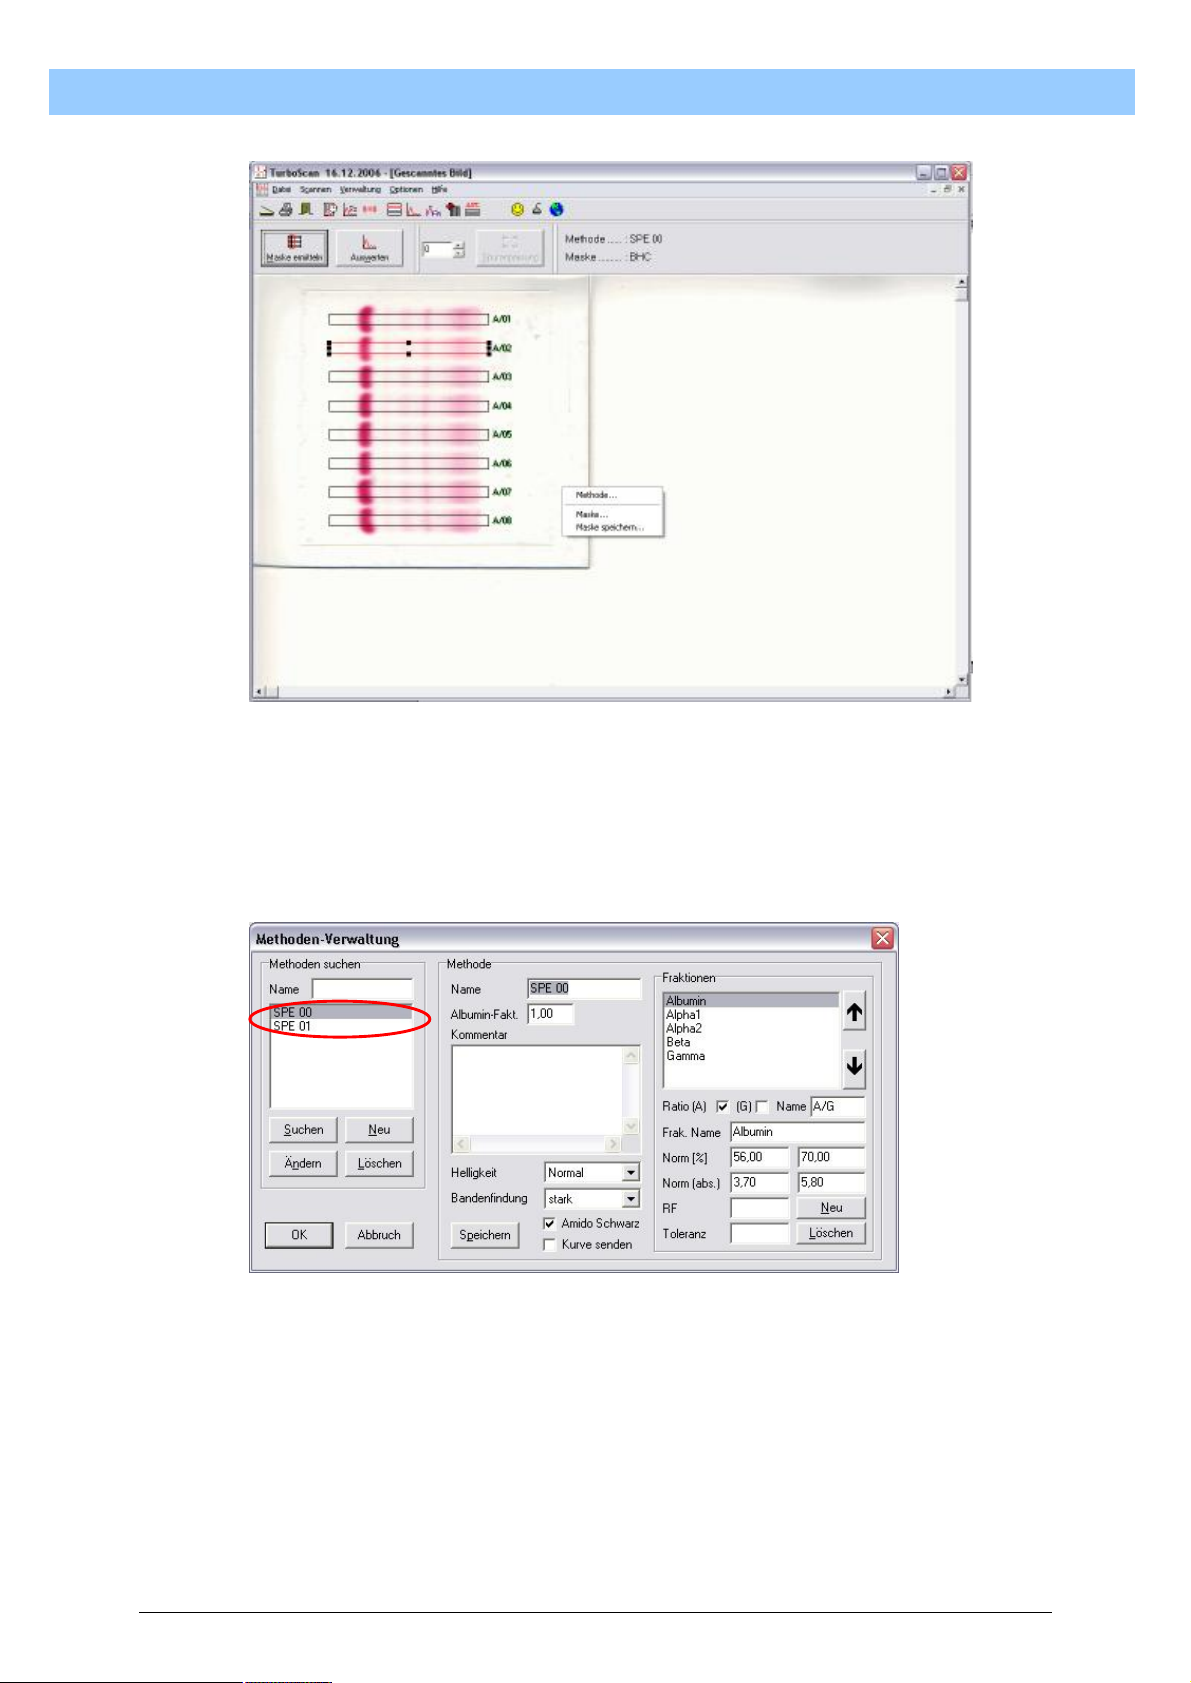
8.2.1.3. Method selection
Depending on the analysis requirements, it may be possible for the type of
electrophoresis to change. For example, it may be necessary to switch the
method from serum protein to lipoproteins or haemoglobins. To switch the
method, single-click the right mouse inside the image in the “Scanned
image” window. This opens a small menu. To select the menu point
“Method”, move the mouse pointer onto the menu item and single-click the
left mouse button.
*
TRANSLATOR’S NOTE: Sentence is incomplete in the German.
28
Page 29
T
u
r
b
o
S
c
a
n
U
s
e
r
M
a
n
u
a
l
T
u
r
b
o
S
c
a
n
U
s
e
r
M
a
T
u
r
b
o
S
c
a
n
U
s
e
r
M
a
n
n
u
u
a
a
l
l
Once the menu point has been selected, the Method Management window
appears. All the methods saved up to this point will appear in the left-hand
array. To switch method, now simply select the desired method by
positioning the mouse pointer on the desired method and single-clicking
the left mouse button. Now click “OK” to include the selection in the
analysis.
8.2.1.4. Analysis
After selecting the correct method, you can now start the analysis. To do
this, simply single-click the left mouse button in the “Scanned image”
window. TurboScan takes the current mask and analyses it.
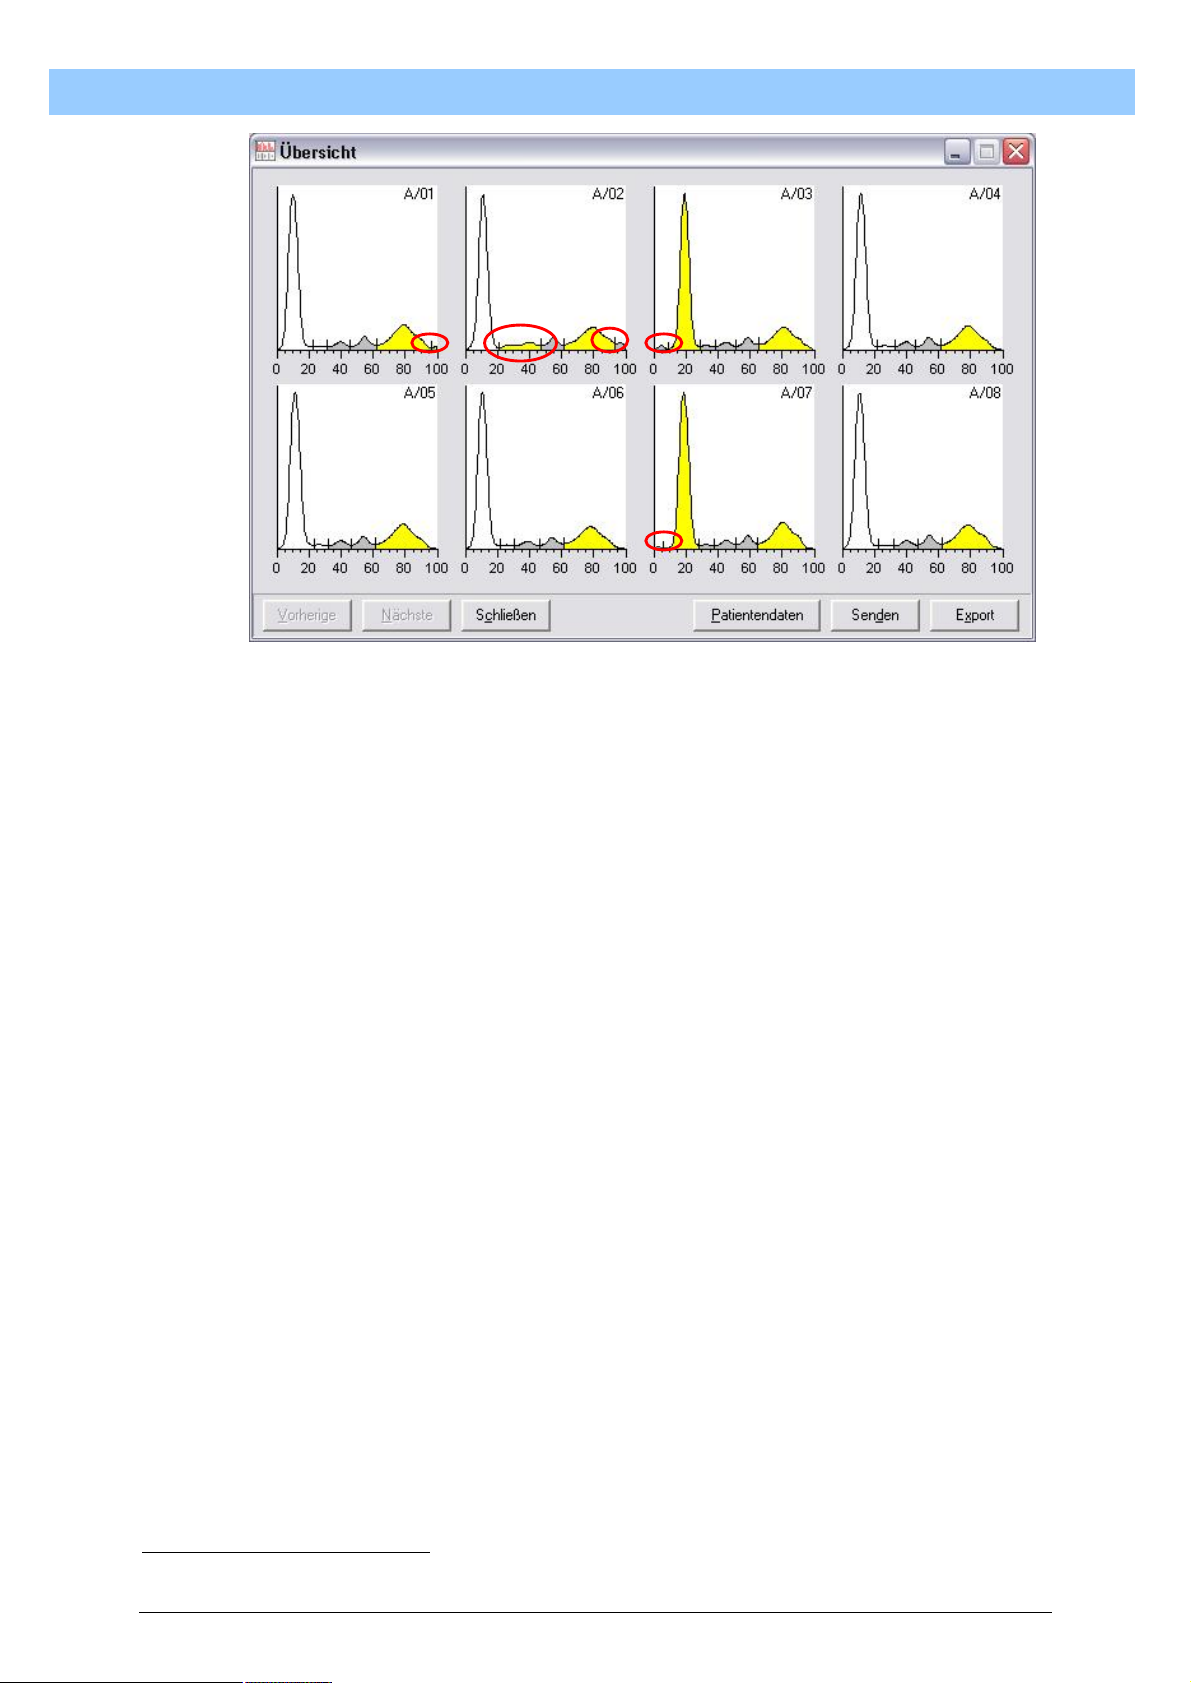
After the calculations are completed, the individual curve profiles are
presented in an overview window. Possible corrections may already be
identified here. The first 8 curves together with the calculated minimum
marks are displayed in the overview window. You will be able to see from
this whether all the marks are correct and fully plotted.
29
Page 30
T
u
r
b
o
S
c
a
n
U
s
e
r
M
a
n
u
a
l
T
u
r
b
o
S
c
a
n
U
s
e
r
M
a
T
u
r
b
o
S
c
a
n
U
s
e
r
8.2.1.4.1. Correct minimums
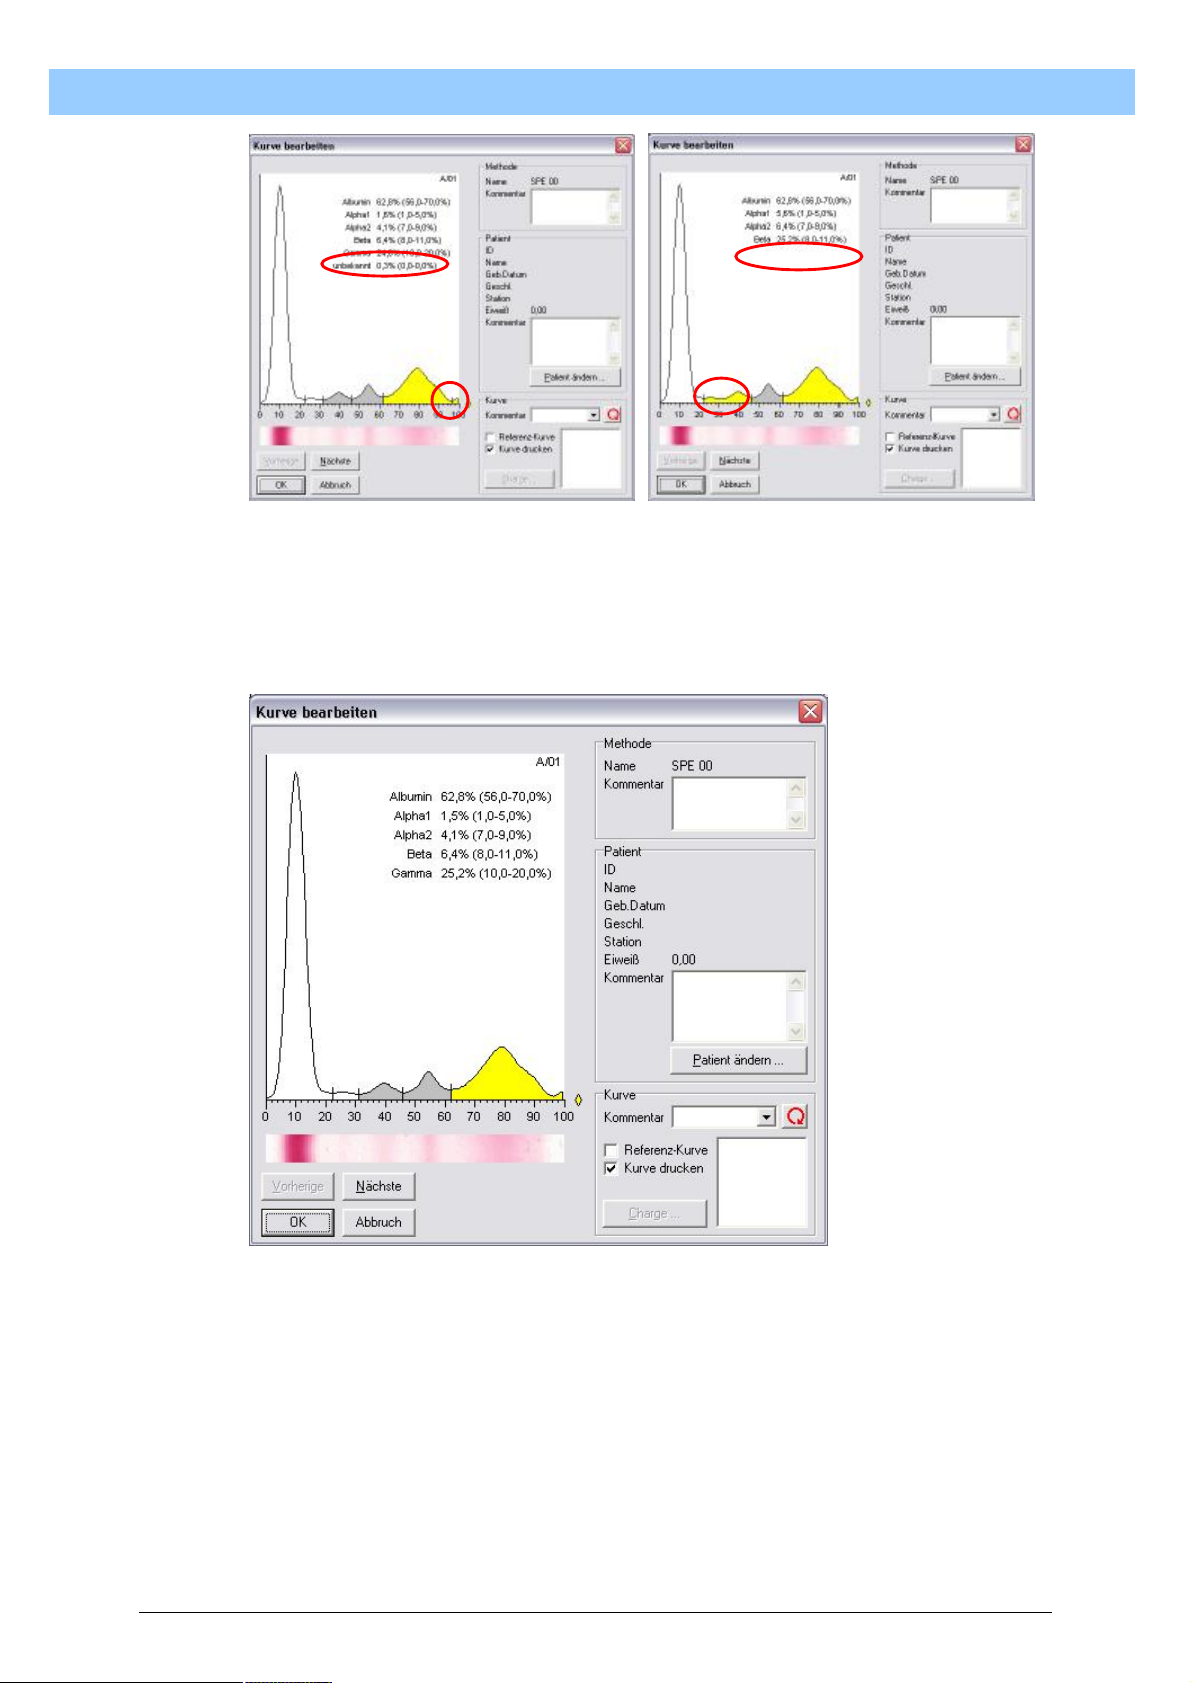
In order to correct any incorrectly placed minimum marks, you must switch
to Correction mode. To do this, move the mouse pointer onto the curve
profile that needs to be corrected. Double-click the left mouse button to
open the correction window for the selected curve. Within the graph of the
curve profile, the mouse pointer changes to a cross.
• To delete a minimum mark, position the vertical line of the mouse
pointer as accurately as possible over the minimum mark to be
deleted. The delete process is executed with a double click on the
left mouse button. When double-clicking, make sure you do not
move the mouse. If you do, the minimum mark will not be deleted. In
this situation, Windows assumes that you are making two separate
mouse clicks at different positions.
• To set a minimum mark, place the vertical line of the mouse pointer
as accurately as possible at the point where the new minimum mark
is to appear. The setting process is executed with a double click on
the left mouse button. When double-clicking, make sure you do not
move the mouse. If you do, the minimum mark will not be deleted.*
In this situation, Windows assumes that you are making two
separate mouse clicks at different positions.
M
a
n
n
u
u
a
a
l
l
TRANSLATOR’S NOTE: The German (..wird keine Löschung der Minima Marke vorgenommen) should
probably read “...wird kein Setzen der Minima vorgenommen” = the minimum mark will not be set.
30
Page 31
T
u
r
b
o
S
c
a
n
U
s
e
r
M
a
n
u
a
l
T
u
r
b
o
S
c
a
n
U
s
e
r
M
a
T
u
r
b
o
S
c
a
n
U
s
e
r
Depending on the defined method, a correction will be needed if a fraction
is displayed with the name “unknown”. If this happens, it means that a
minimum mark lies too much on the curve.
Conversely, if not all minimum marks are set, not all named fractions will
appear in the list.
M
a
n
n
u
u
a
a
l
l
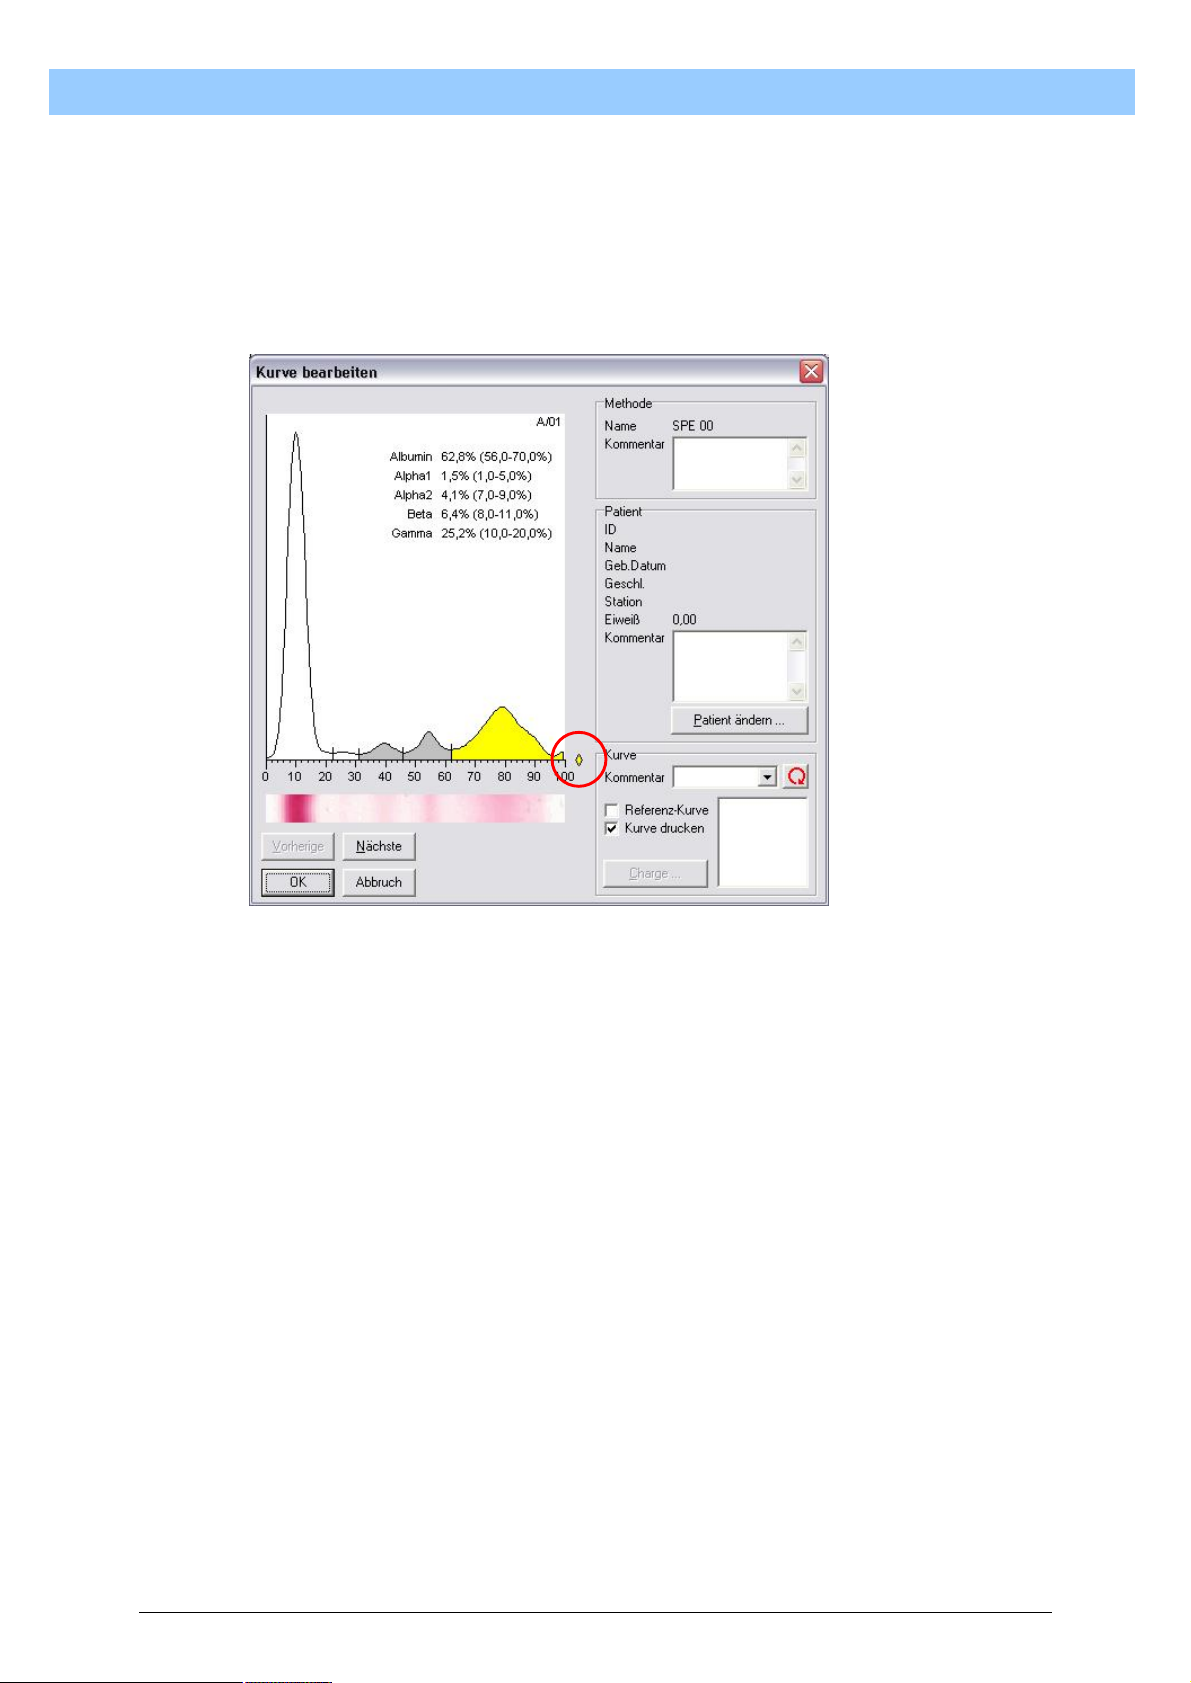
8.2.1.4.2. Baseline correction
Although TurboScan optimizes the baseline, it may be necessary to correct
the baseline. The baseline can be moved up or down parallel to the X-axis.
To move the baseline, move the mouse pointer onto the diamond shape on
the right next to the X-axis. Now press and hold the left mouse button.
Moving the mouse up or down will drag a horizontal line with it, which
represents the new baseline.
As soon as the left mouse button is released, the new baseline stays in
that position. The position can now be confirmed or rejected via a query
window. If the baseline is confirmed, the curve profile will be “cropped” at
31
Page 32
T
u
r
b
o
S
c
a
n
U
s
e
r
M
a
n
u
a
l
T
u
r
b
o
S
c
a
n
U
s
e
r
M
a
T
u
r
b
o
S
c
a
n
U
s
e
r
that point. The lower part of the curve profile will be deleted and the upper
part of the curve profile will be replotted on the X-axis.
Once this change is confirmed with the OK button in the correction window,
the change is irreversible.
If you no longer want the baseline correction you have just made, click with
the left mouse button on “Cancel” in the correction window. All changes to
all the curves up to that point will be rejected.
M
a
n
n
u
u
a
a
l
l
8.2.1.4.3. Comments
TurboScan gives you the option of including your own comments on the
printout. The field in the bottom right section of the correction window can
be used to do this. In the “Comments” section there is an entry field where
free text can be entered. To activate the entry, position the mouse pointer
in the field and single-click the left mouse button. A vertical line will blink in
the entry field. You can now enter whatever comments you wish via the
keyboard.
The entry is immediately active. This means that, as soon as another
function is executed or a button is activated in the window, the text is
confirmed as it is.
To delete the entry, activate the entry field as described above. You can
now select the text and delete it with the “Del” key.
32
Page 33
T
T
T
u
u
u
r
b
o
S
c
a
n
U
s
e
r
M
a
n
u
a
l
r
b
o
S
c
a
n
U
s
e
r
M
a
r
b
o
S
c
a
n
U
s
e
r
M
a
n
n
u
u
a
a
l
l
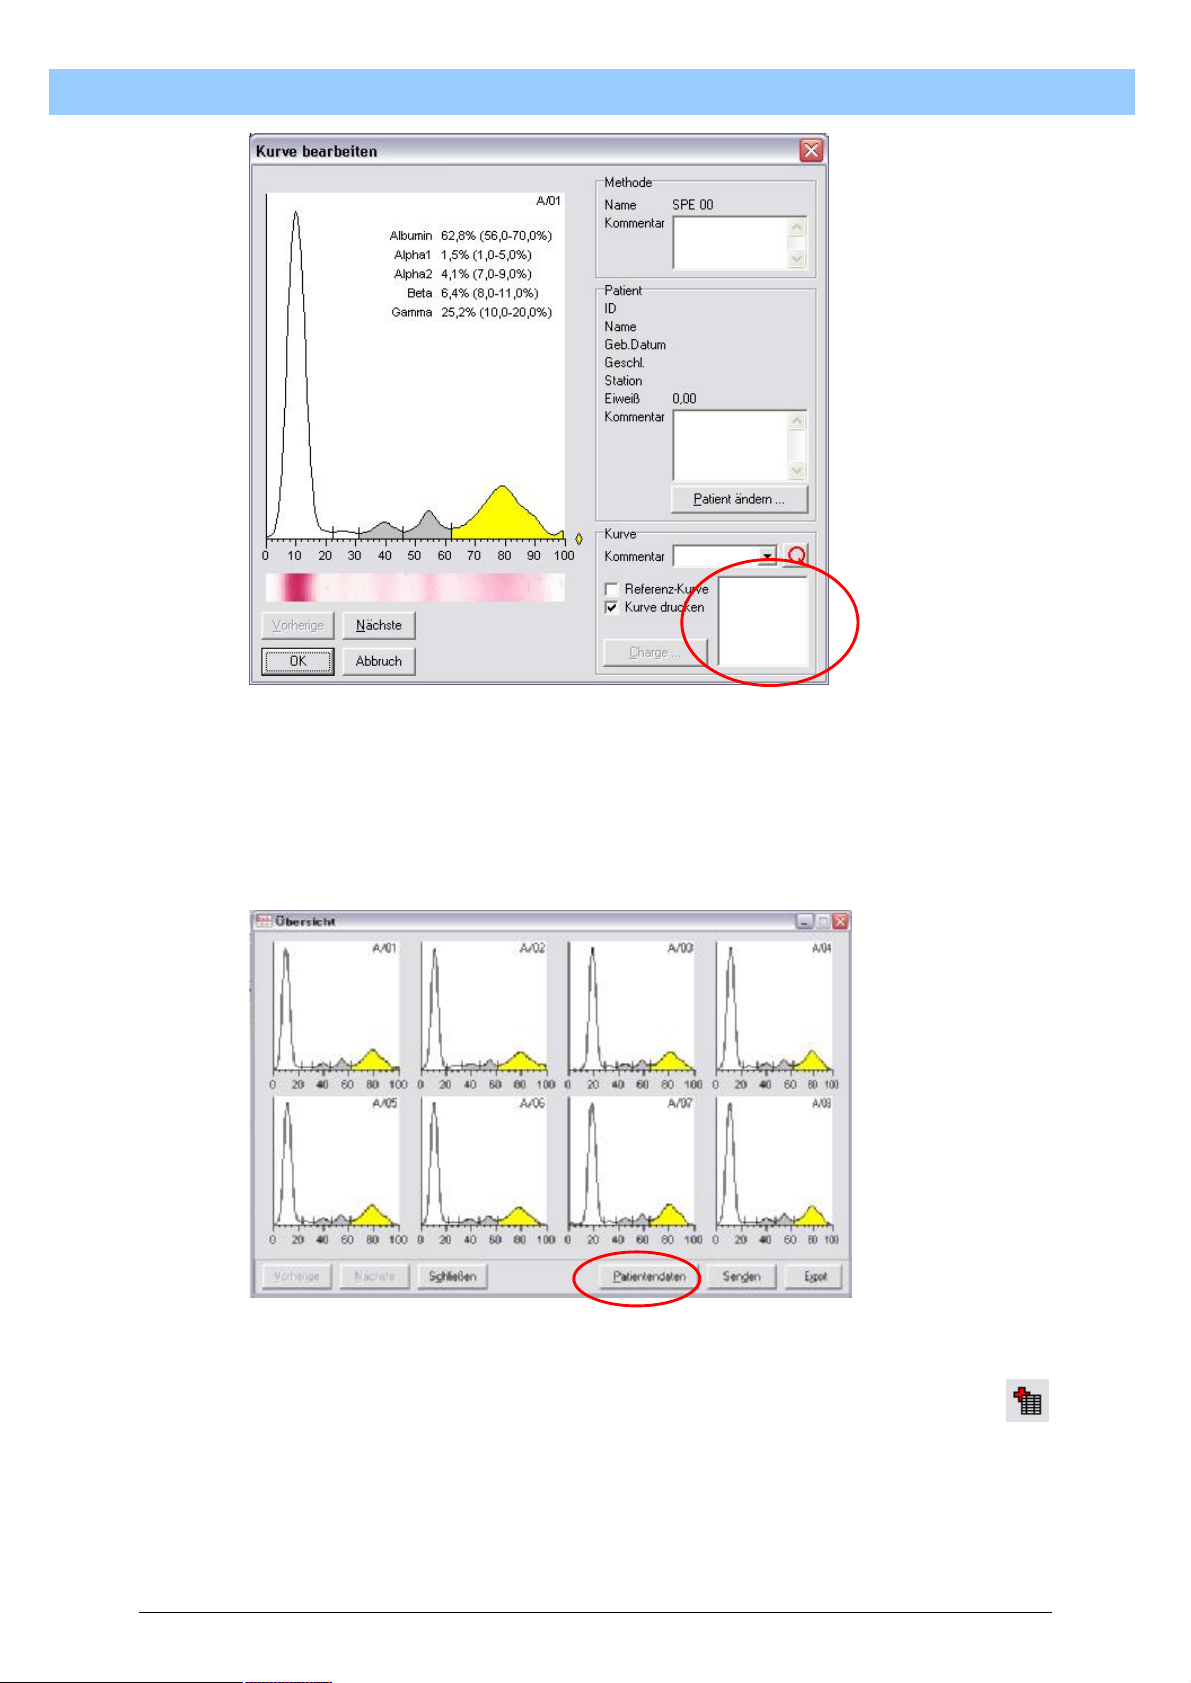
8.2.1.5. Patient Data
After any corrections have been made to the curve profiles, the patients’
information can be entered into TurboScan. To do this, single-click the left
mouse button on “Patient Data” in the overview window.
The patient data can either be entered before or after analysis of the
electrophoreses.
For entry before analysis, single-click the left mouse button on the
symbol in the header bar.
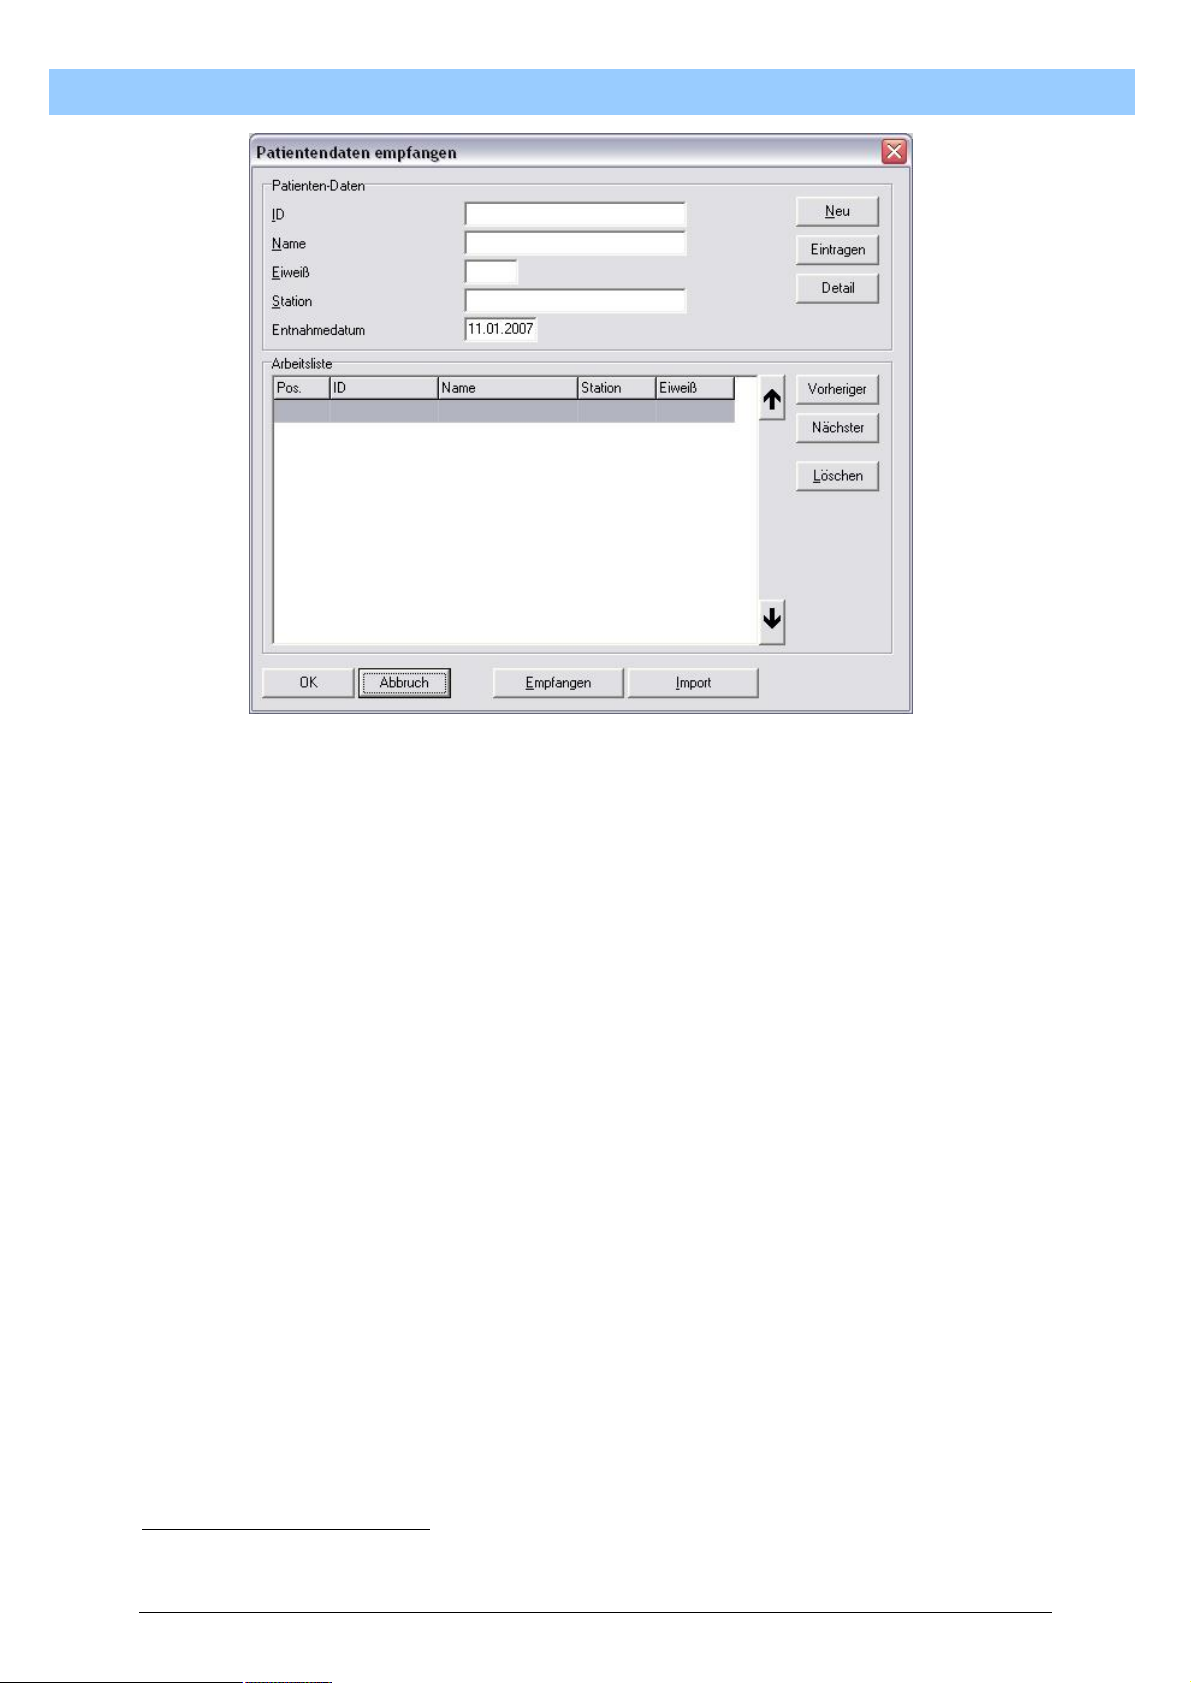
8.2.1.5.1. Patient Data entry
The Patient Journal window opens.
33
Page 34
T
T
T
u
u
u
r
b
o
S
c
a
n
U
s
e
r
M
a
n
u
a
l
r
b
o
S
c
a
n
U
s
e
r
M
a
r
b
o
S
c
a
n
U
s
e
r
M
a
n
n
u
u
a
a
l
l
The are 3 possible methods of data entry available:
• via the keyboard
• via ASCII file
• via direct connection to a host
The options via ASCII file transfer and direct connection to a host are
described in more detail in section 10 “TurboScan Communication”.
To start data entry, position the mouse pointer on the entry field “ID”6 and
single-click the left mouse button. A vertical cursor appears, which
indicates readiness for an entry to be made in the Patient ID field.
You can now start entering data via the keyboard. The information required
appears on the left next to the entry fields.
Use the Tab key to move to the next entry field, as usual in Windows7.
The fields requiring entries have the following content:
ID : Clear identification of the sample
Name : Identification of persons by their name
Protein : The value for the total protein sample
Department : Department or place where the patient is located
6
If automatic Patient ID allocation is enabled as described under 7.4.8, entry starts in the “Name”
field.
7
Key with the arrows pointing to left and right on the keyboard
34
Page 35
T
u
r
b
o
S
c
a
n
U
s
e
r
M
a
n
u
a
l
T
u
r
b
o
S
c
a
n
U
s
e
r
M
a
T
u
r
b
o
S
c
a
n
U
s
e
r
Collection date: The day the blood sample was collected, where this is
not the same as the day of electrophoresis. This date is
crucial to subsequent searches in the historical
database for electrophoreses which were performed on
a specific day.
Pressing the Tab key in the “Collection date” field moves the tab stop to
the “Enter” button. Confirm the patient’s entry by pressing the ENTER key
on the keyboard. The data record just defined appears in the list below the
entry field. If the ENTER key is pressed again, the cursor moves again into
the “ID” or “NAME” field in the case of automatic numbering.
Repeat this process until all the patient data have been entered. The list is
confirmed with the OK button and is cached for any subsequent
corrections that may be necessary.
The Patient Journal window re-closes.
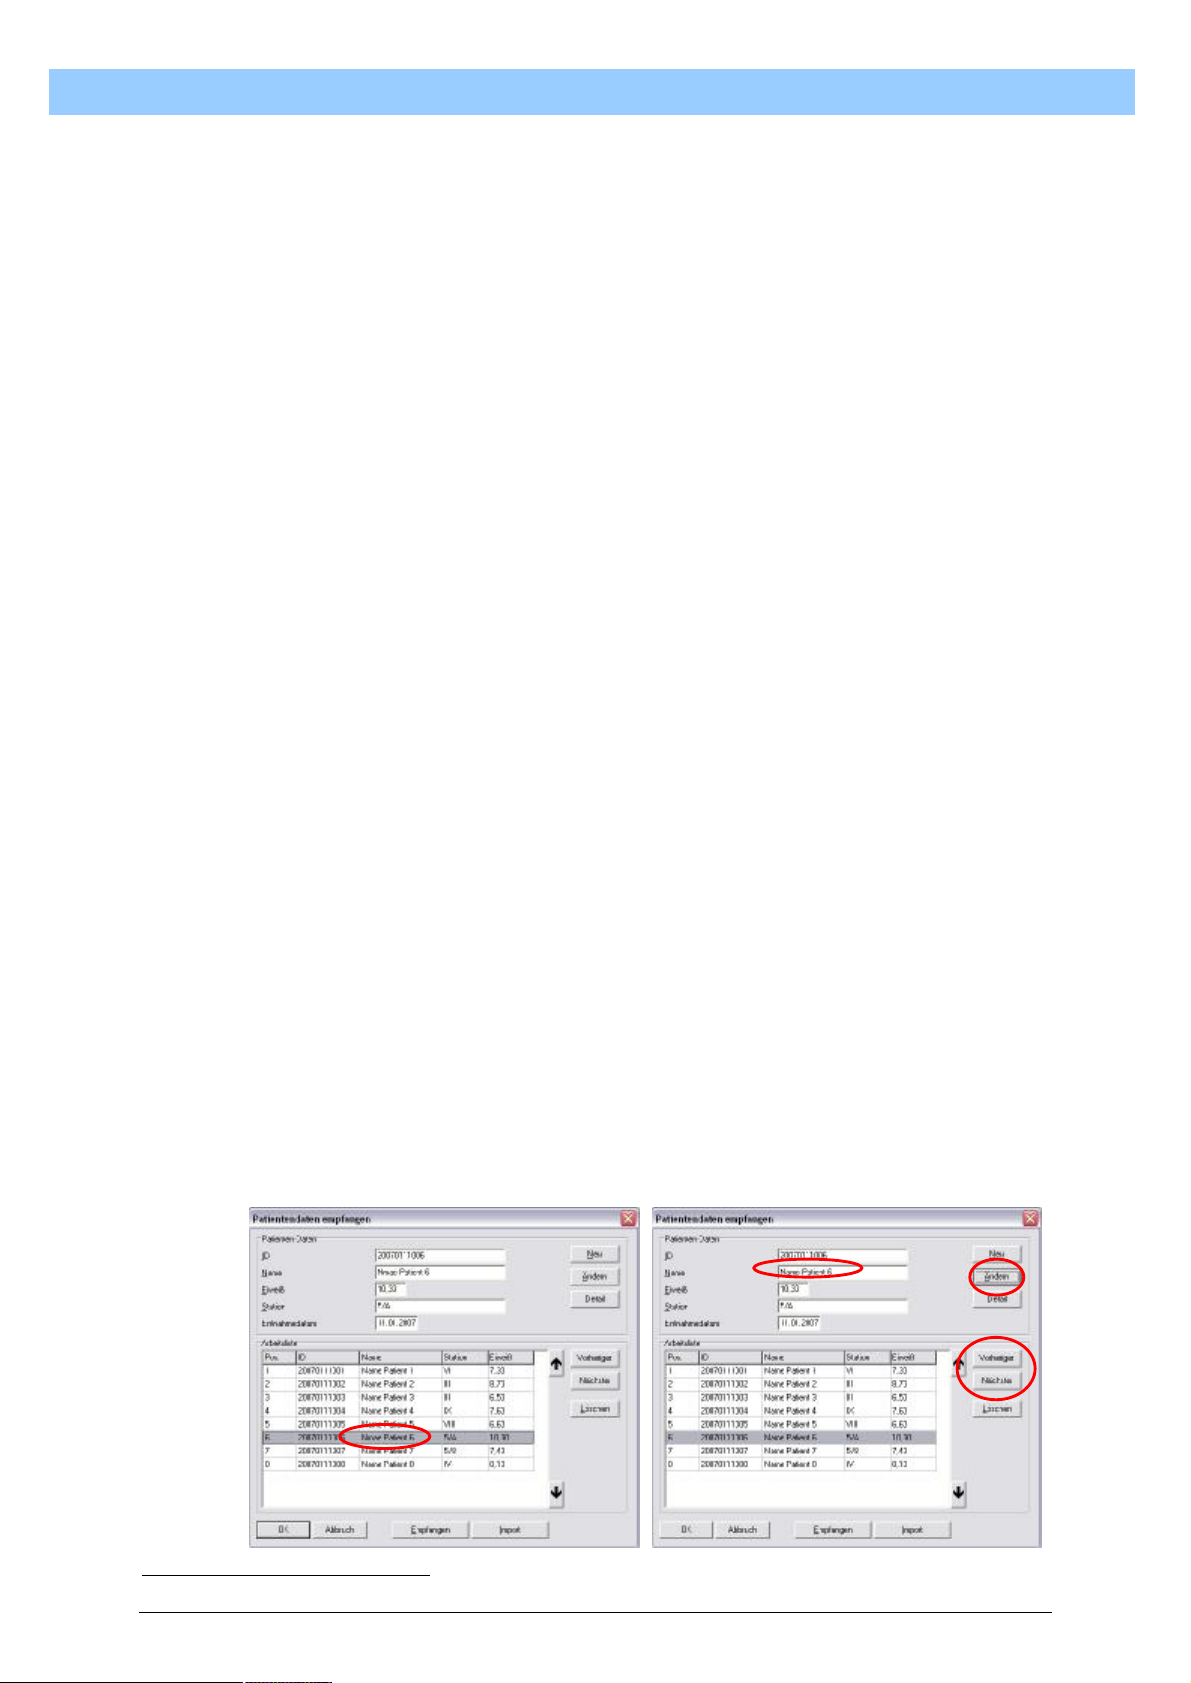
8.2.1.5.2. Patient Data correction
If you need to correct the content of one or more patient data, it can easily
be done. Open the window for inputting the Patients Journal, as described
above. Highlight the data record to be corrected by positioning the mouse
pointer on the appropriate line in the list and pressing the left mouse
button. Now the top entry section is filled with the data from the selected
line. Any entry field8 can be changed, as required. Confirm the changes by
single-clicking the left mouse button on “Change” while the mouse pointer
is positioned over the “Change” button. Any data record can subsequently
be changed. The next data record to be changed can selected directly with
the mouse or via the “Previous” or “Next” data record buttons. It is also
possible to delete individual data records in this mode. The data record to
be deleted should be highlighted as described above. Clicking the left
mouse button on “Delete” when the mouse pointer is positioned on the
“Delete” button will release the selected data record to be deleted.
However, before the data record is deleted, the query “Delete this record
only?” appears. Answer the query by clicking on “YES” if only this data
record is to be deleted. If you click on “NO”, not only the selected data
record but the whole list will be deleted. The “Cancel” button interrupts the
delete process and no change will be made to the list.
M
a
n
n
u
u
a
a
l
l
8
The “ID” field is blocked in the case of automated Patient ID and cannot be changed.
35
Page 36
T
u
r
b
o
S
c
a
n
U
s
e
r
M
a
n
u
a
l
T
u
r
b
o
S
c
a
n
U
s
e
r
M
a
T
u
r
b
o
S
c
a
n
U
s
e
r
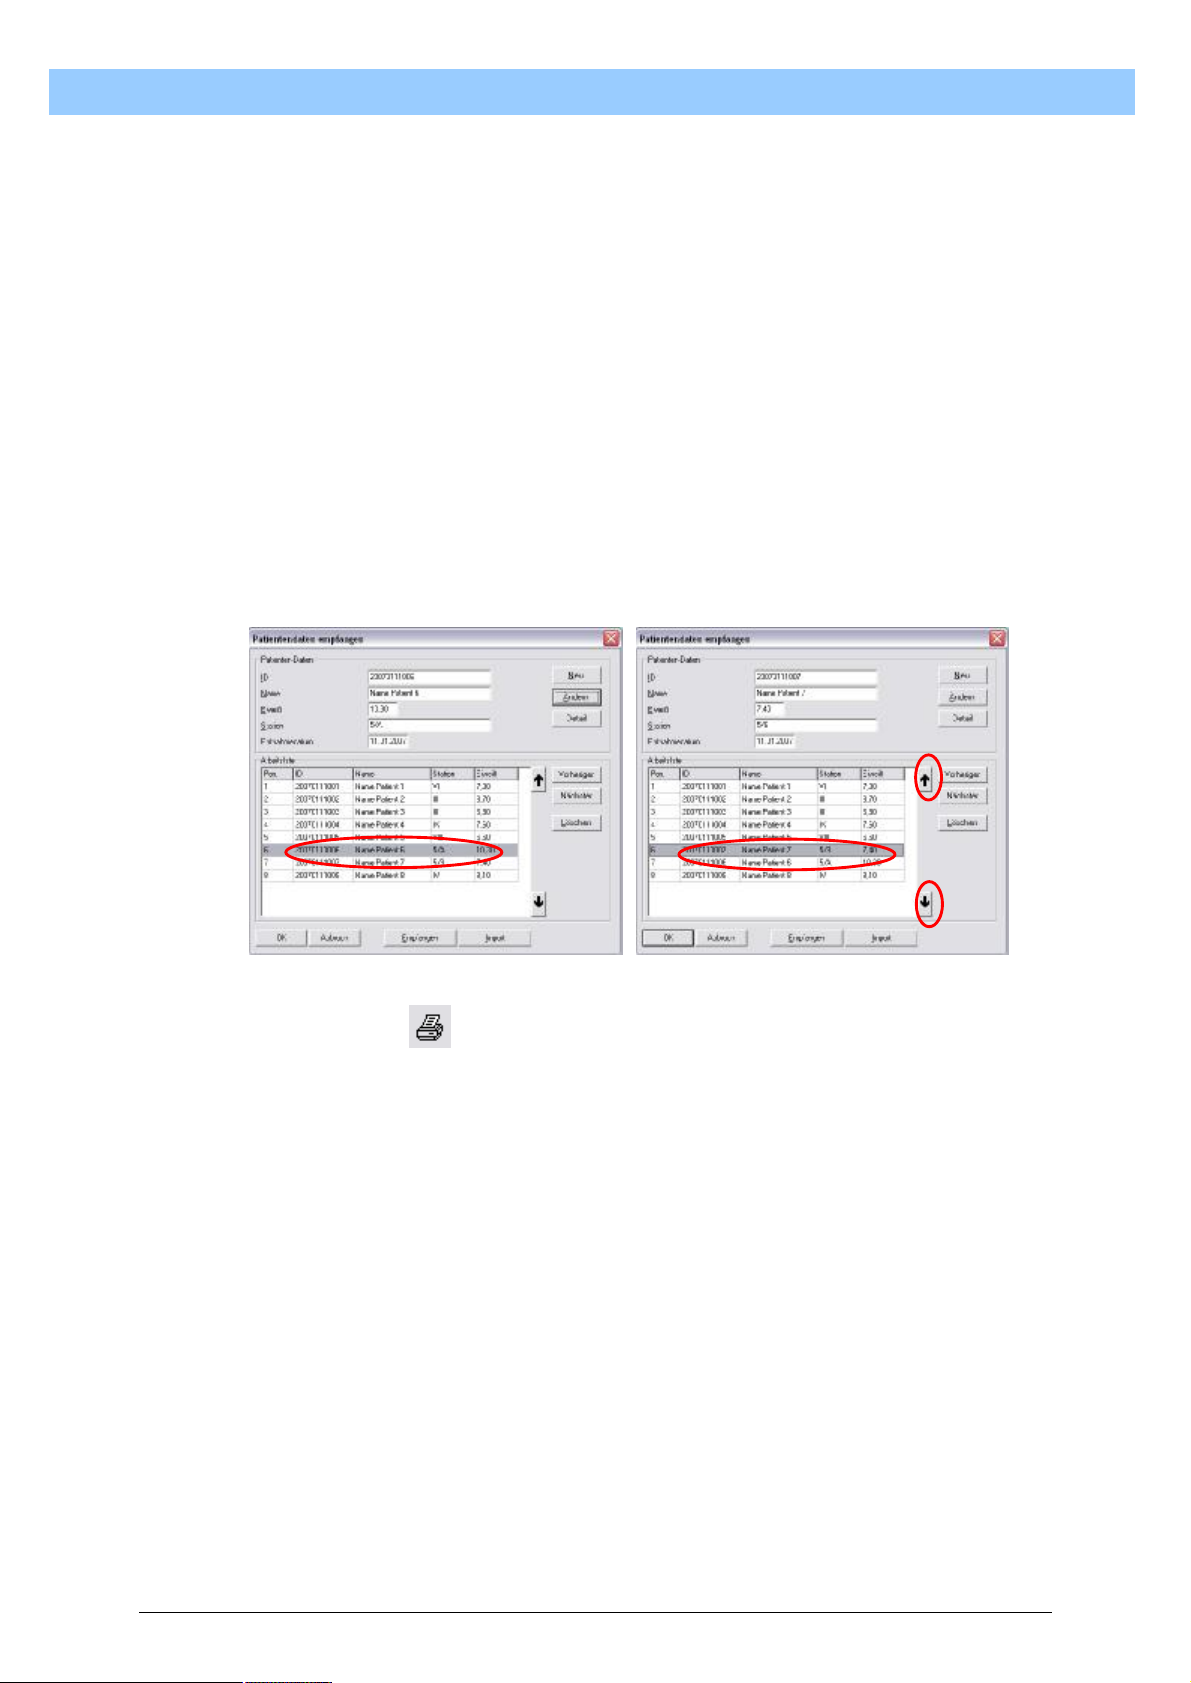
8.2.1.5.3. Correction of patient data – list sequence
It can sometimes happen that the work list does not coincide with the
sequence of the electrophoreses. TurboScan allows you to bring the list
sequence in line with the actual sequence of electrophoreses. In the
following example, samples 6 and 7 were transposed in the
electrophoresis.
To correct the list, select the data record in the patient list that is in the
wrong position by positioning the mouse pointer on the data record and
single-clicking the left mouse button. After selection, click on one of the
arrows at the right edge next to the list. Every time you click on the arrow,
the selected data record moves down or up one position, depending on the
direction of the arrow. When you have finished correcting the position,
confirm the corrected list by pressing the “OK” button.
This process can be repeated as often as you like.
M
a
n
n
u
u
a
a
l
l
8.2.2. Print
In most cases it is necessary to put the results onto paper so that the
analysis can be attached to the patient’s medical records.
8.2.2.1. Prepare to print
Printing can only take place if the curves and patient data are in the
TurboScan memory. This is always the case if the overview window
appears with the 8 curves. To make sure that the curve data have also
been assigned to the patient data, you must have clicked on “Patient data”
in the overview window at least once and re-closed the entry window for
the patient data with the “OK” button. You can check whether data have
been assigned by double-clicking the left mouse button while the mouse
pointer is positioned on one of the curve profiles in the overview window.
This opens the correction window. The patient data are displayed on the
right side of the correction window. If no data are displayed there, no
assignment of the patient data has taken place. If this is the case, you
must perform the above procedure.
36
Page 37
T
u
r
b
o
S
c
a
n
U
s
e
r
M
a
n
u
a
l
T
u
r
b
o
S
c
a
n
U
s
e
r
M
a
T
u
r
b
o
S
c
a
n
U
s
e
r
8.2.2.2. Start print process
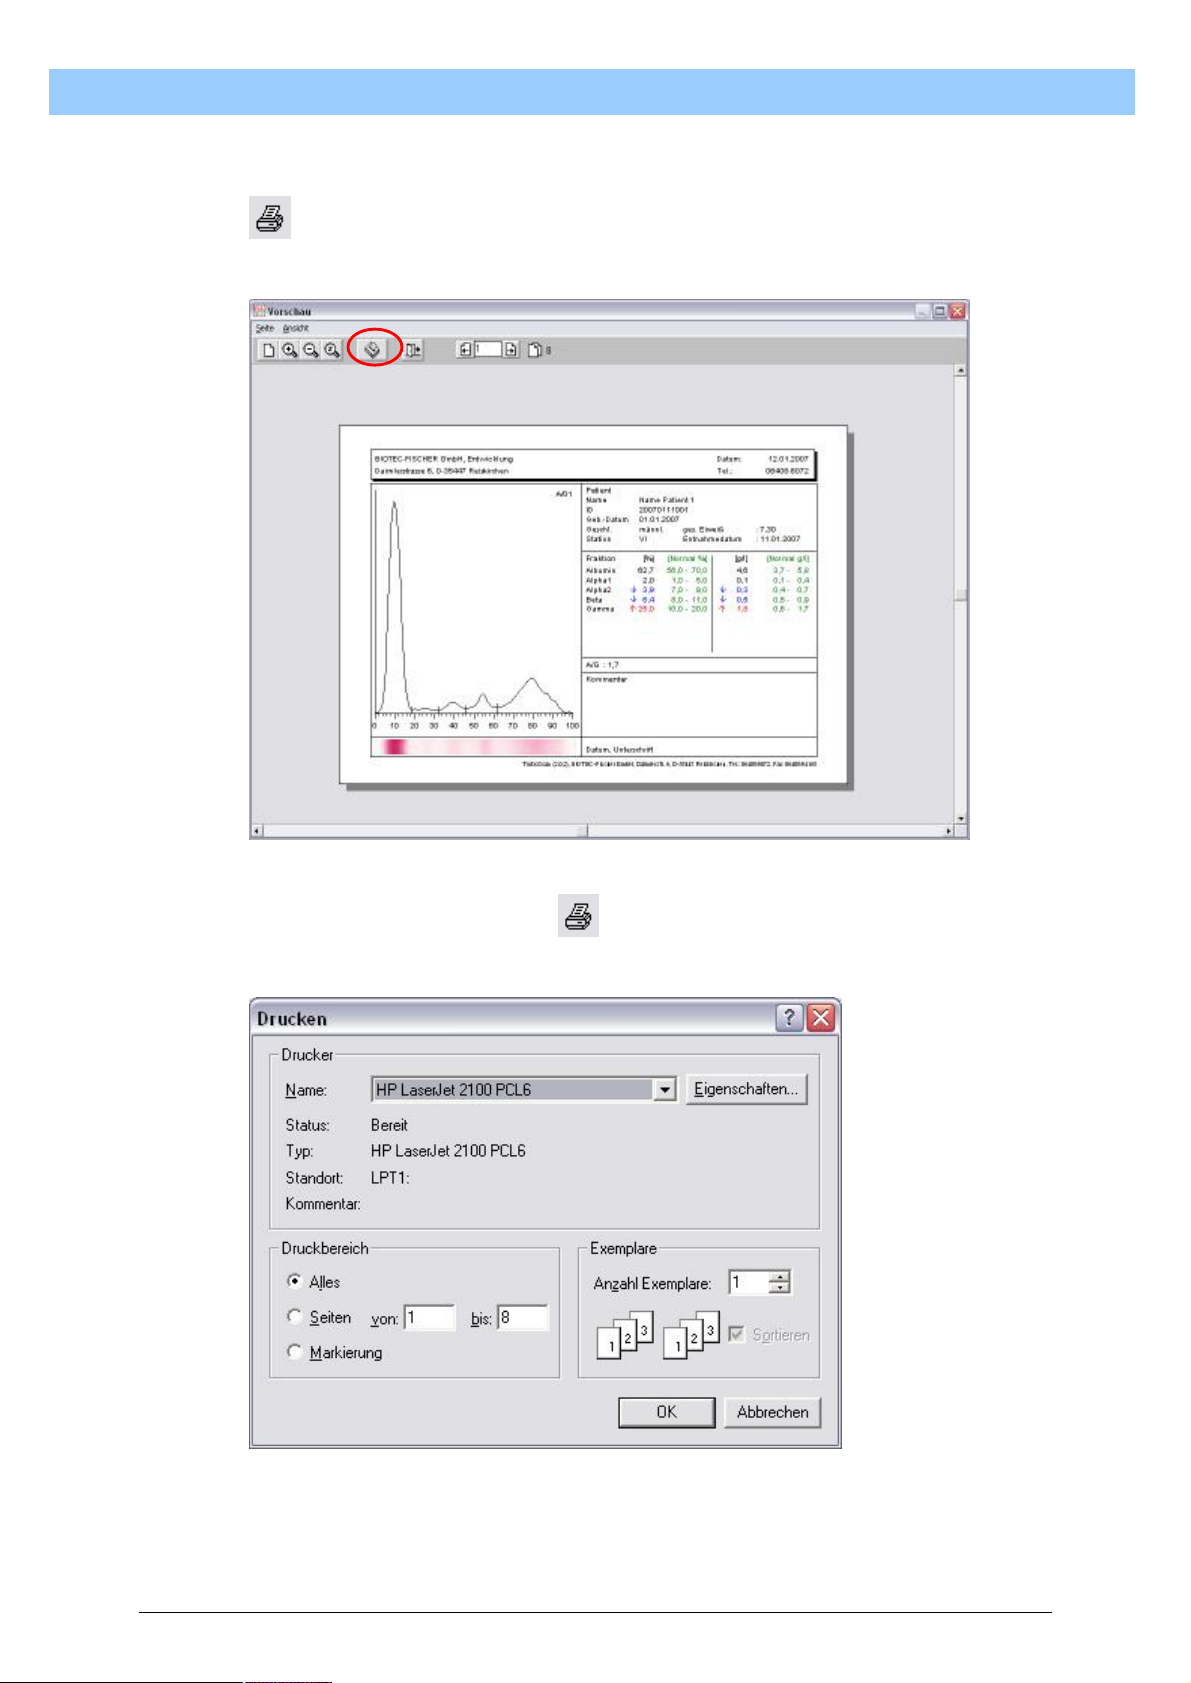
Launch the printing process by single-clicking the left mouse button on
. This opens the “Print Preview” window. Here the original printout is
displayed on the screen.
M
a
n
n
u
u
a
a
l
l
Pressing the printer button in the Print Preview window starts the
printer dialogue. Pressing “OK” starts printing of all the curves.
37
Page 38
T
u
r
b
o
S
c
a
n
U
s
e
r
M
a
n
u
a
l
T
u
r
b
o
S
c
a
n
U
s
e
r
M
a
T
u
r
b
o
S
c
a
n
U
s
e
r
8.2.2.3. Printing restrictions
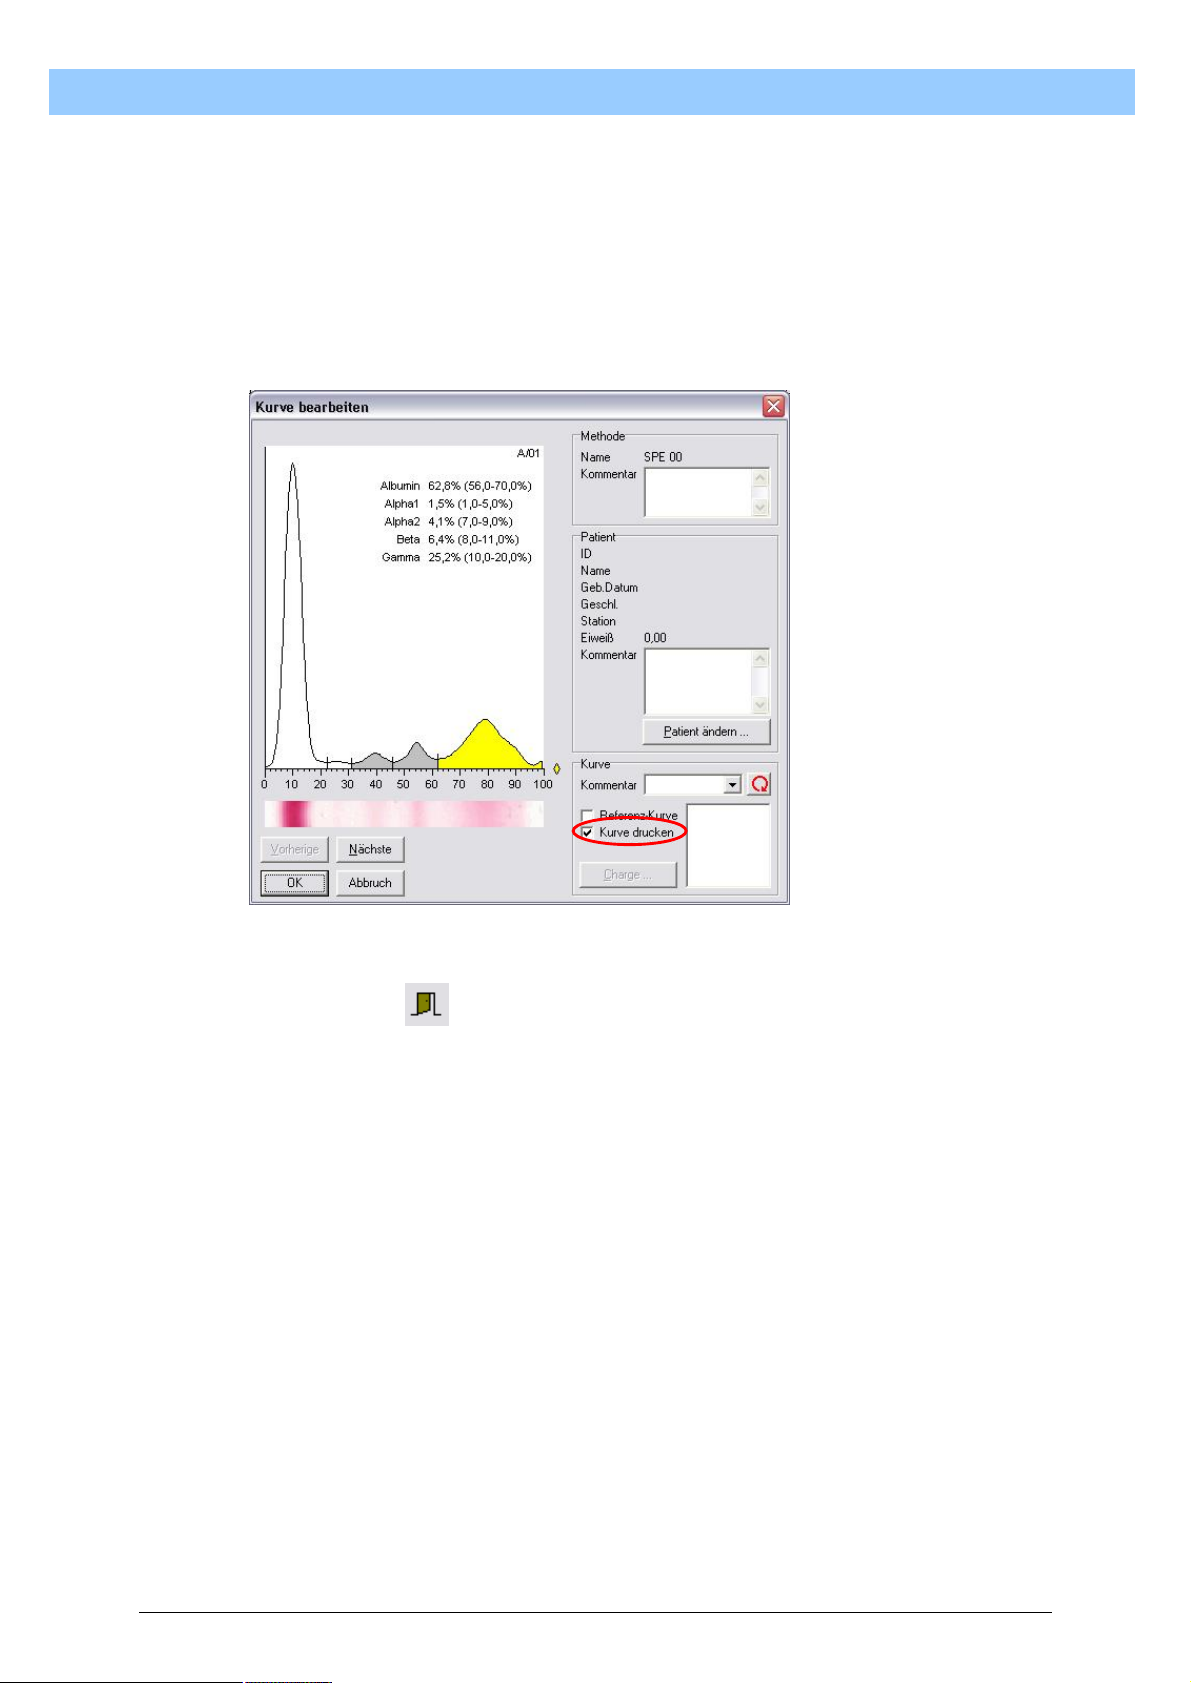
Individual curves can be excluded from the printing. This is always
necessary if an electrophoresis appears to be impossible to analyse or
implausible.
For this purpose, Print Enable should be removed in the correction
window. To do this, click on the checkmark in the “Print curve” box. The
checkmark is now deleted. This curve will not be included in the printing
process and therefore will not be printed out.
M
a
n
n
u
u
a
a
l
l
8.2.3. Exit
The Exit button is used to end the TurboScan program. Use this key when
analysis of the electrophoreses for that day is completed.
38
Page 39
T
u
r
b
o
S
c
a
n
U
s
e
r
M
a
n
u
a
l
T
u
r
b
o
S
c
a
n
U
s
e
r
M
a
T
u
r
b
o
S
c
a
n
U
s
e
r
8.2.4. Journal
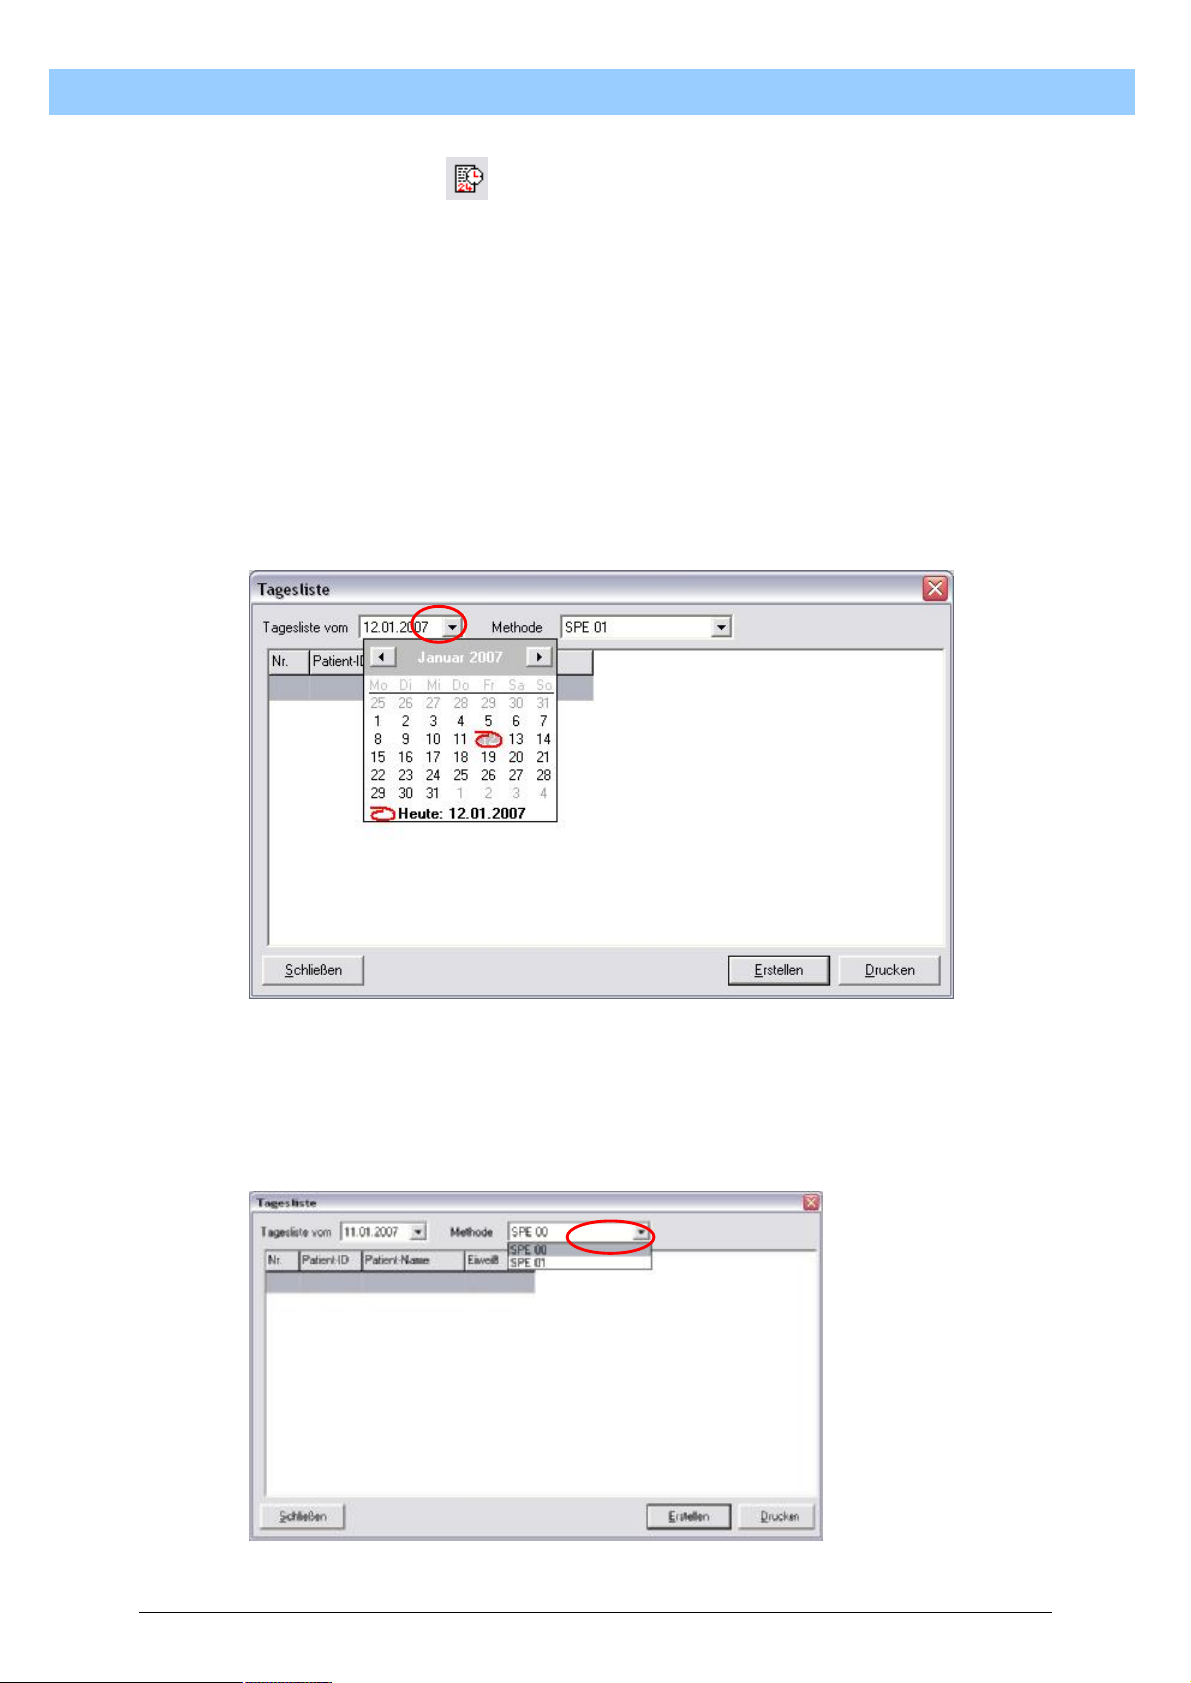
TurboScan can display all the analyses in one day in a “Journal” to provide
a summary view. The journal contains only the key data of the analyses
which were performed on a specific day by a specific method.
Open the Journal window by single-clicking the left mouse button on the
“Journal” button while the mouse pointer is on the Journal symbol. To
generate the journal, the required day must first be selected. There is a
selection popup in the top section which is opened by single-clicking the
left mouse button on the downward-pointing triangle at the right edge of the
display. A month’s calendar page appears from which the desired date can
be selected.
M
a
n
n
u
u
a
a
l
l
The correct method now needs to be selected to obtain the desired journal.
To do this, single-click the left mouse button on the downward-pointing
triangle at the right edge of the display to open the method selection popup
window. All the methods available in the database will appear. Single-click
the left mouse button on the desired method.
39
Page 40
T
u
r
b
o
S
c
a
n
U
s
e
r
M
a
n
u
a
l
T
u
r
b
o
S
c
a
n
U
s
e
r
M
a
T
u
r
b
o
S
c
a
n
U
s
e
r
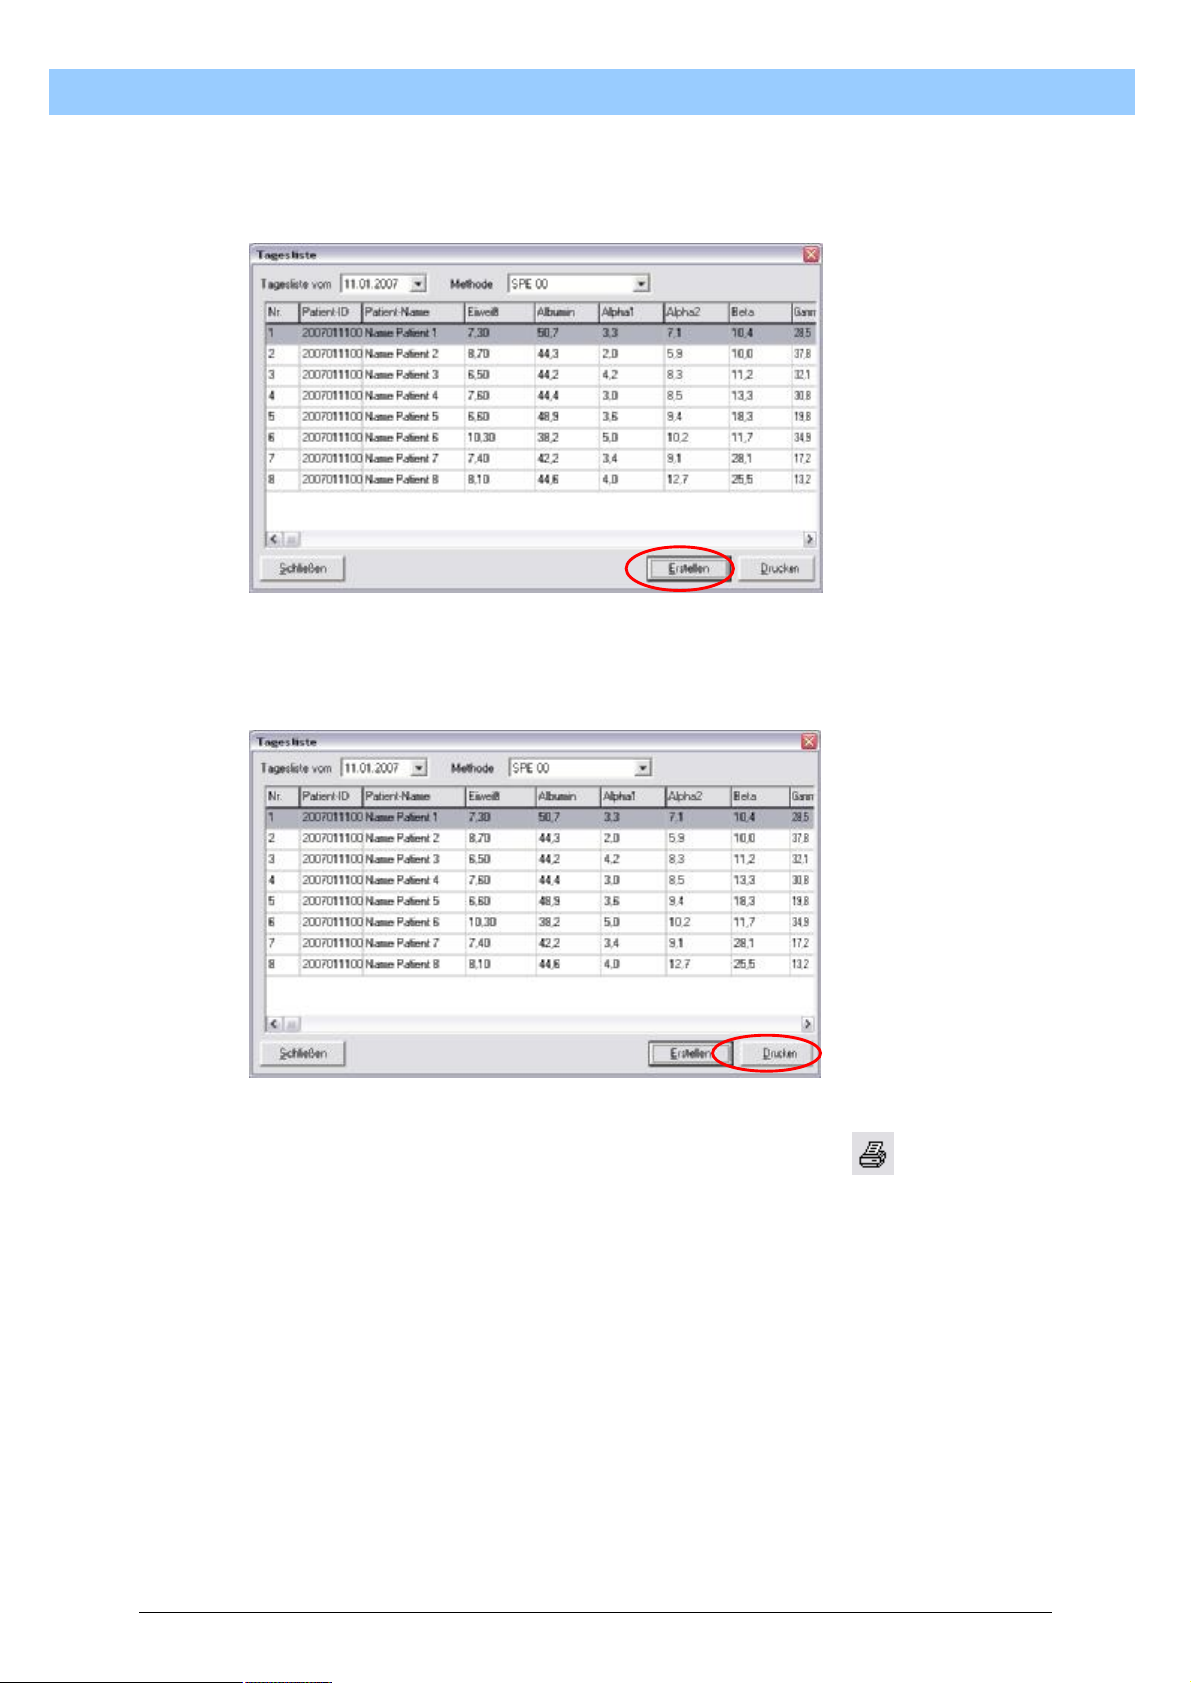
To create the journal with the conditions just selected, single-click the left
mouse button on “Create” while the mouse pointer is positioned on the
button.
Once created, the journal can be printed out. To start the printout, singleclick the left mouse button on “Print” at the bottom right of the Journal
window. This opens the Print Preview window.
M
a
n
n
u
u
a
a
l
l
In the Print Preview window, click on the printer symbol again to open
the printer control window. Press the “OK” button and the journal will be
printed.
40
Page 41
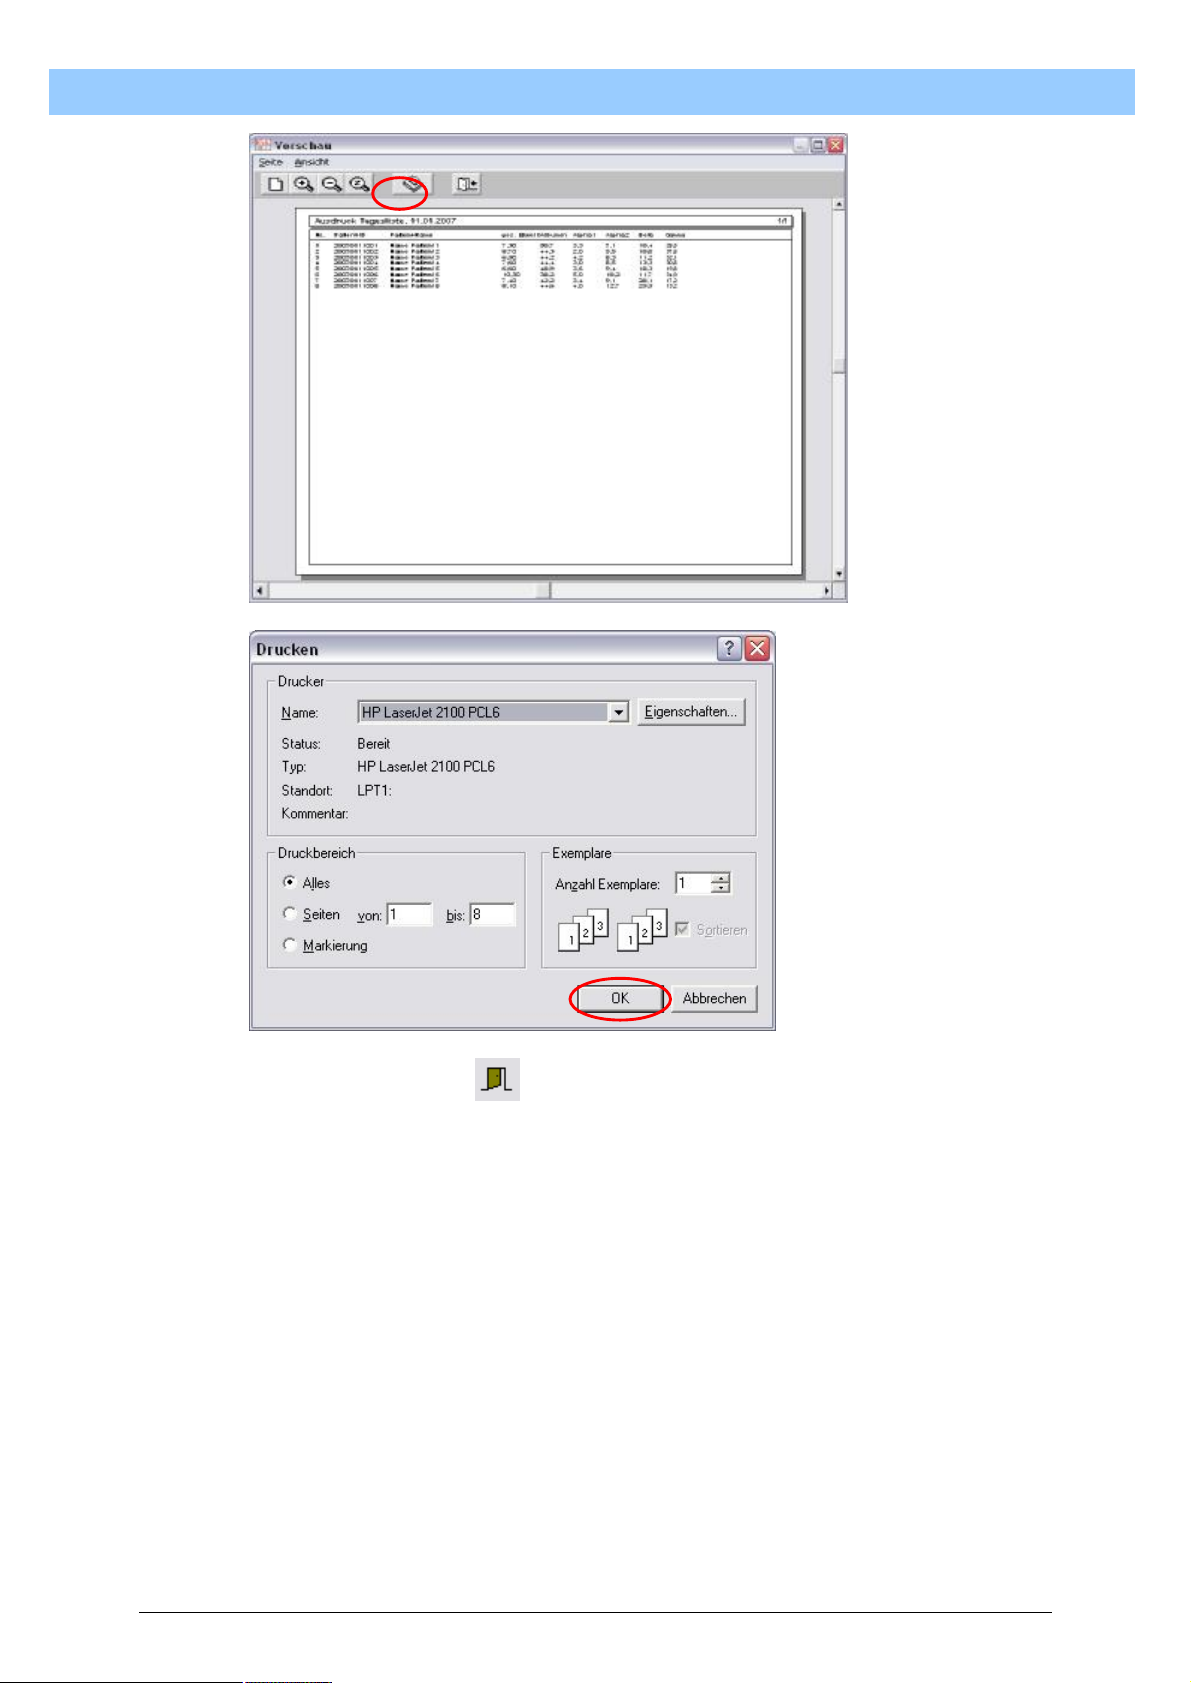
T
u
r
b
o
S
c
a
n
U
s
e
r
M
a
n
u
a
l
T
u
r
b
o
S
c
a
n
U
s
e
r
M
a
T
u
r
b
o
S
c
a
n
U
s
e
r
M
a
n
n
u
u
a
a
l
l
Clicking on the Exit button in the “Print Preview” window will re-close
this window. Single-clicking the left mouse button on “Close” in the
“Journal” window will close that window. Printing of the journal is
completed.
41
Page 42
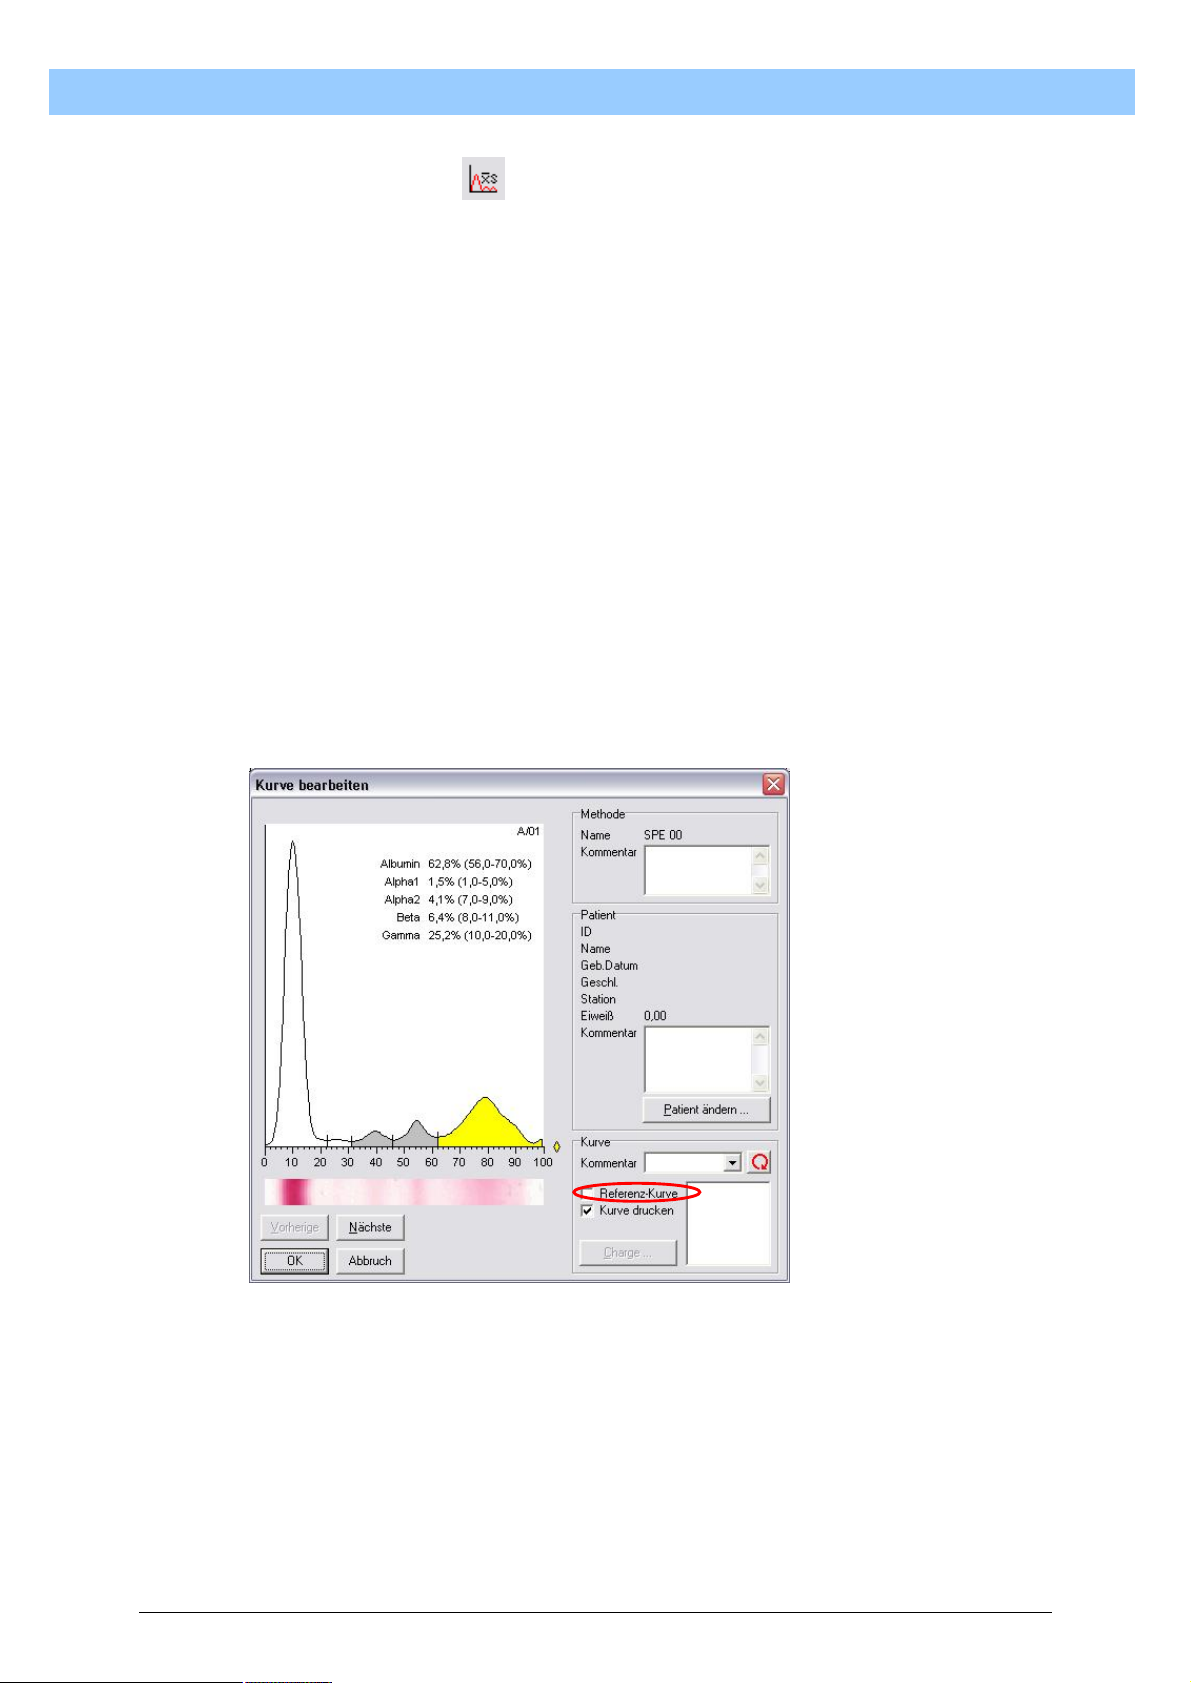
T
u
r
b
o
S
c
a
n
U
s
e
r
M
a
n
u
a
l
T
u
r
b
o
S
c
a
n
U
s
e
r
M
a
T
u
r
b
o
S
c
a
n
U
s
e
r
8.2.5. Statistics
To maintain the highest possible quality of electrophoresis and analysis,
TurboScan offers Statistics which have now become standard in
laboratories. The precision of the electrophoreses and their accuracy can
be ascertained and graphically presented with these Statistics.
8.2.5.1. Prepare Statistics
To be able to perform the statistics, data must be made available, based
on which the statistics can be generated. To be able to make a reliable
statistical statement, it is necessary to include electrophoresis control
material at regular intervals. Depending on the frequency of
electrophoreses, one track with control material can be loaded with every
electrophoresis run. To allow this track to be included in the statistics
properly, this track must be checkmarked as a track with control material.
This is done in the electrophoresis correction window. In the bottom right
section “Curve” there is a checkbox called “Reference curve”. If there is a
checkmark alongside this box, the current curve is enabled for the statistics
function and will be included in the calculation.
M
a
n
n
u
u
a
a
l
l
8.2.5.2. Statistical parameters
The statistics can be calculated from a freely definable period for each
individual batch. Precision is calculated, which is a measure of the
reproducibility of the system used. At the same time, accuracy is
determined, which provides information about the correct setting of the
electrophoresis system, measured by the given values of a control which
has been used.
42
Page 43
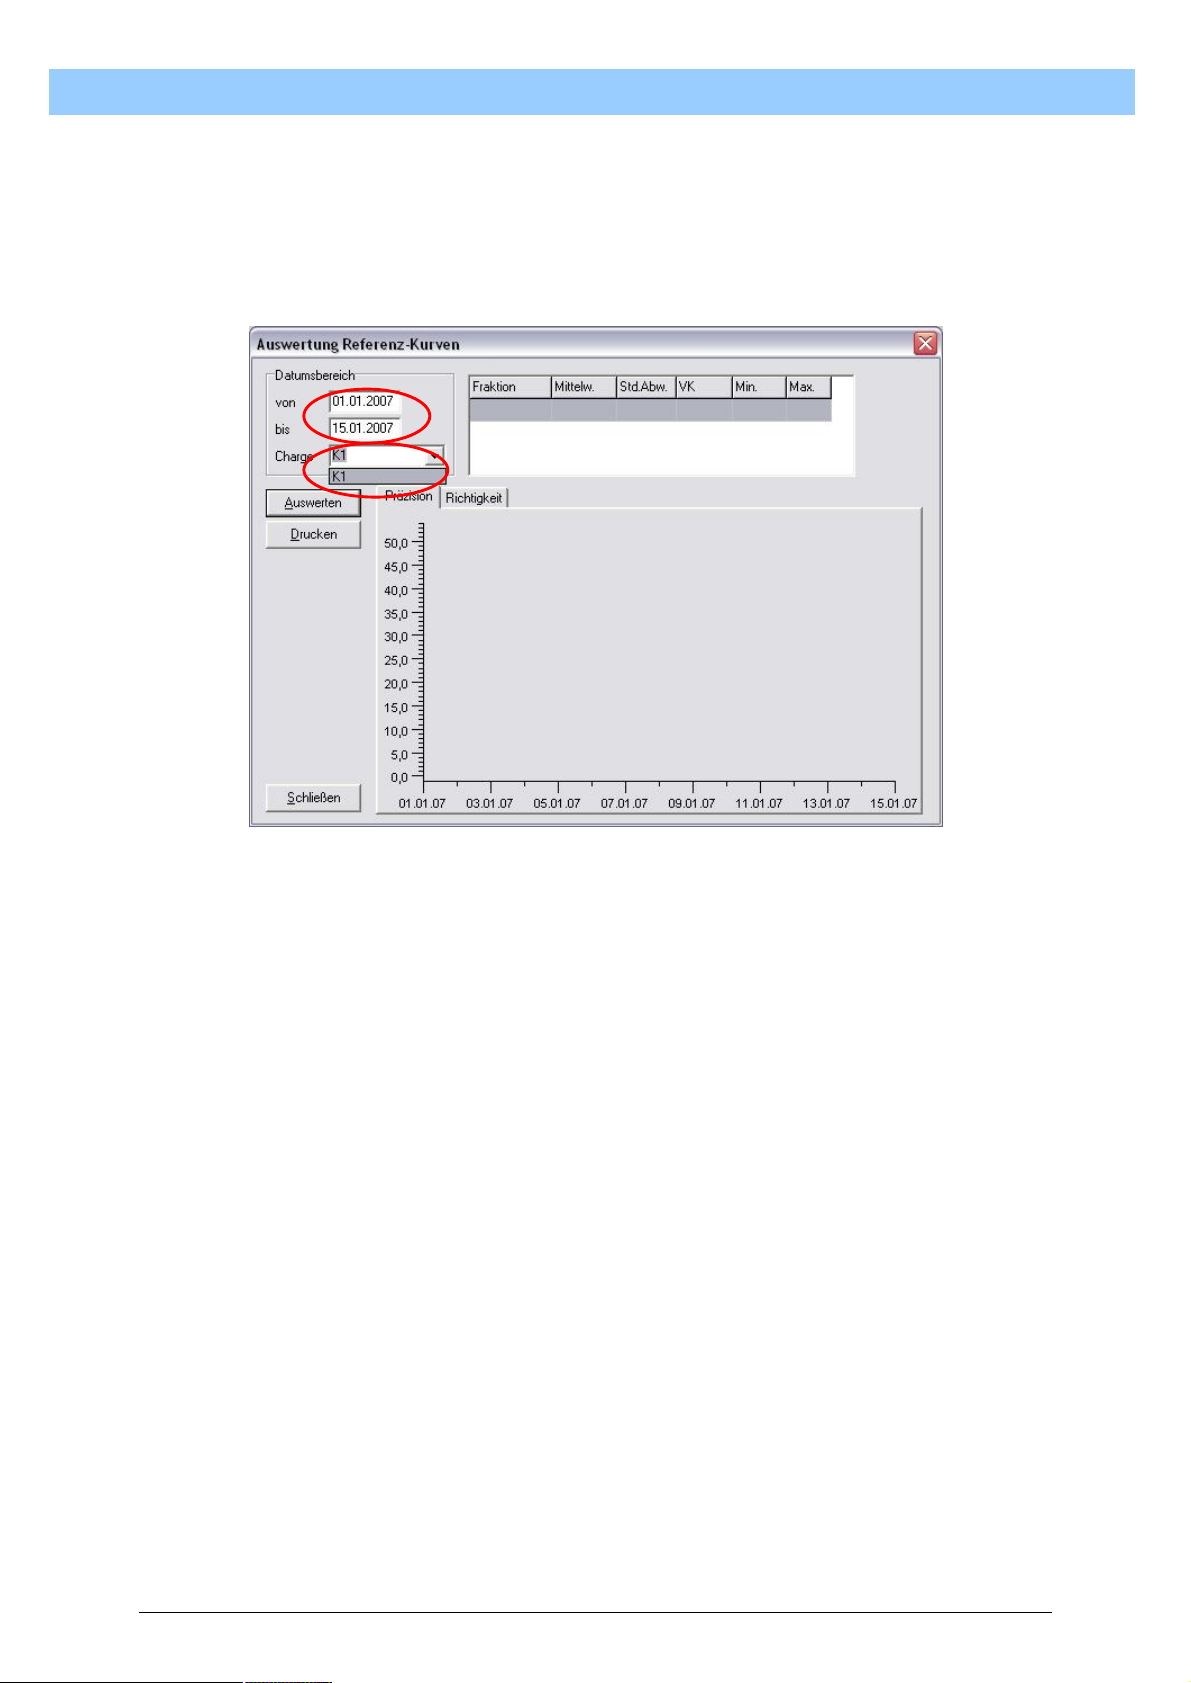
T
u
r
b
o
S
c
a
n
U
s
e
r
M
a
n
u
a
l
T
u
r
b
o
S
c
a
n
U
s
e
r
M
a
T
u
r
b
o
S
c
a
n
U
s
e
r
The time setting is entered in the top left section. Here the start time and
end time of the statistical period are specified. To ensure correct
calculation of the statistics, there must be values with controls during the
displayed period.
In the same section, select the desired batch from the selection list popup
by single-clicking the left mouse button on the downward-pointing triangle,
then positioning the mouse pointer on the required batch.
M
a
n
n
u
u
a
a
l
l
8.2.5.3. Statistical analysis of precision and accuracy
Once the necessary parameters have been selected as described under
8.1.6.2, the analysis can be started. To do this, in the Statistics window
single-click the left mouse button when the mouse pointer is positioned on
“Analyse”.
The values are immediately calculated in the specified period with the
specified batch and the results are graphically displayed in the window.
43
Page 44
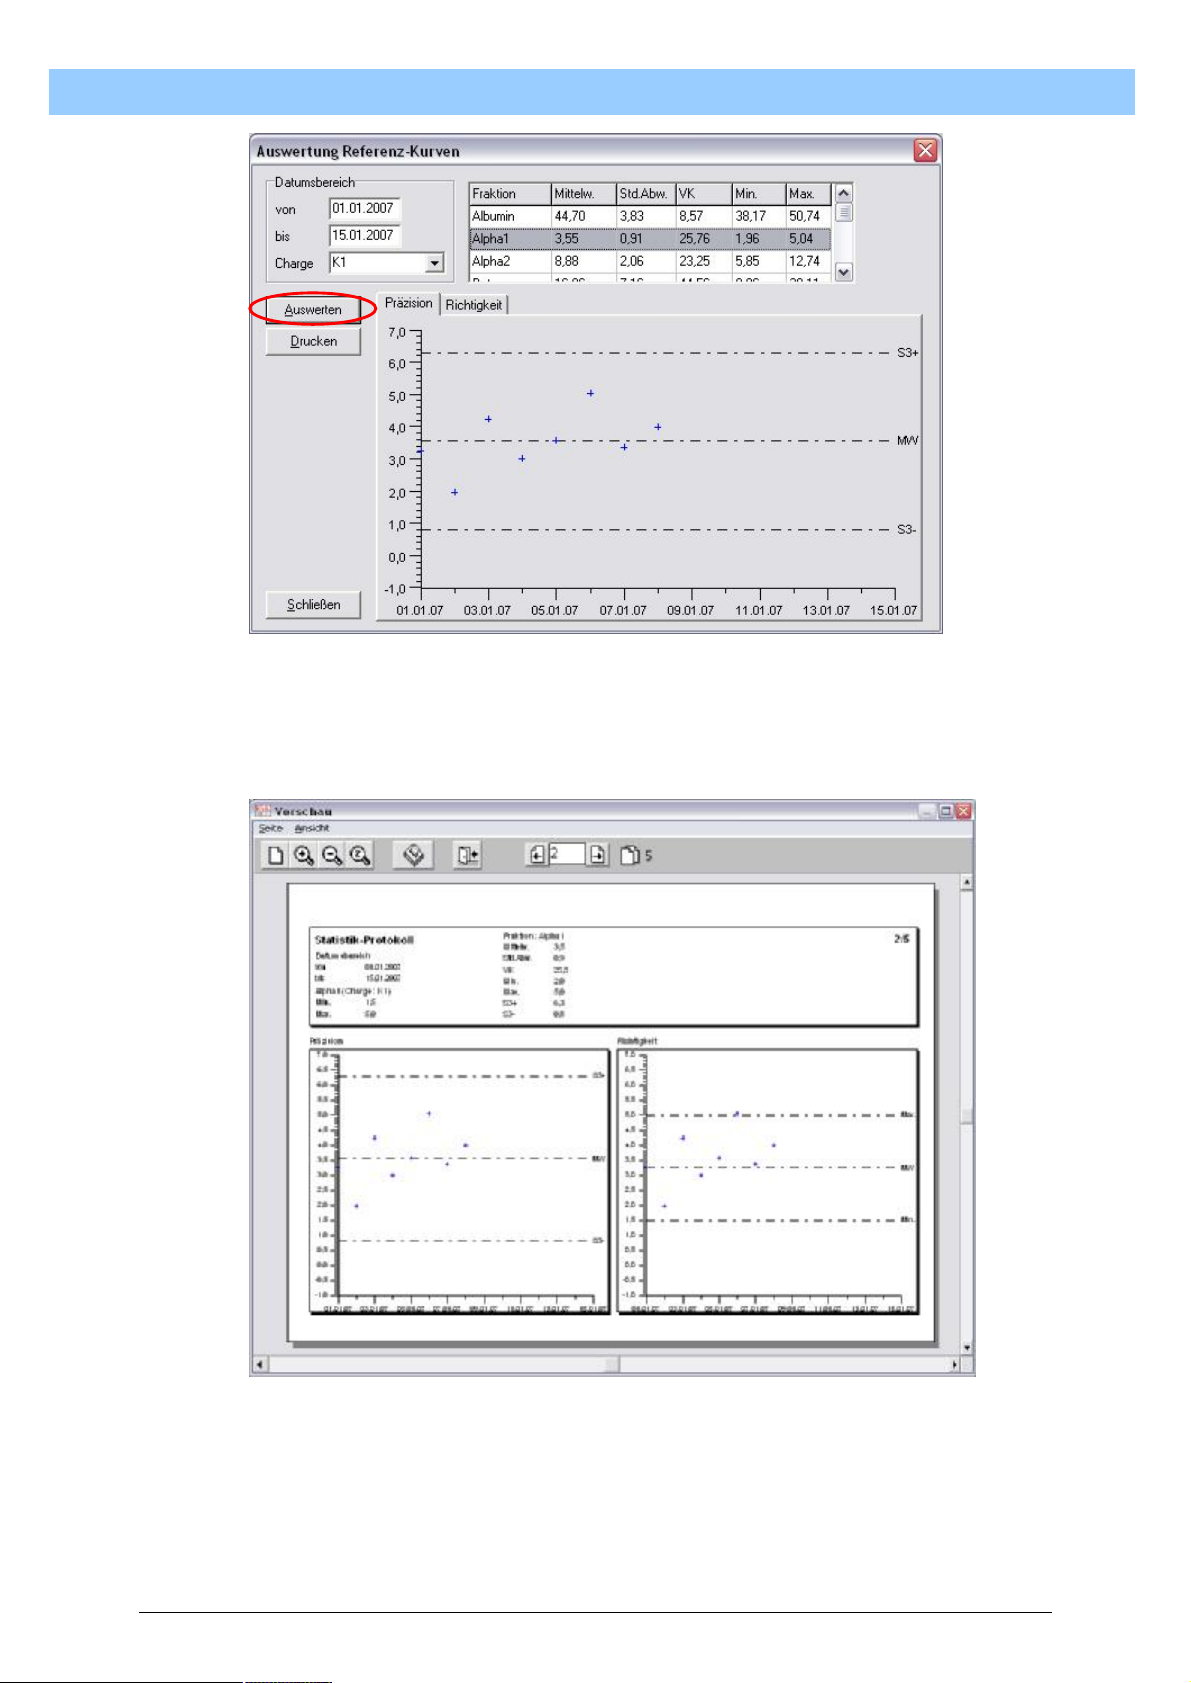
T
u
r
b
o
S
c
a
n
U
s
e
r
M
a
n
u
a
l
T
u
r
b
o
S
c
a
n
U
s
e
r
M
a
T
u
r
b
o
S
c
a
n
U
s
e
r
To print out the statistics, single-click the left mouse button on “Print”. The
Print Preview window opens, which shows the Print original. A data sheet
is printed for each band defined in the method.
M
a
n
n
u
u
a
a
l
l
44
Page 45
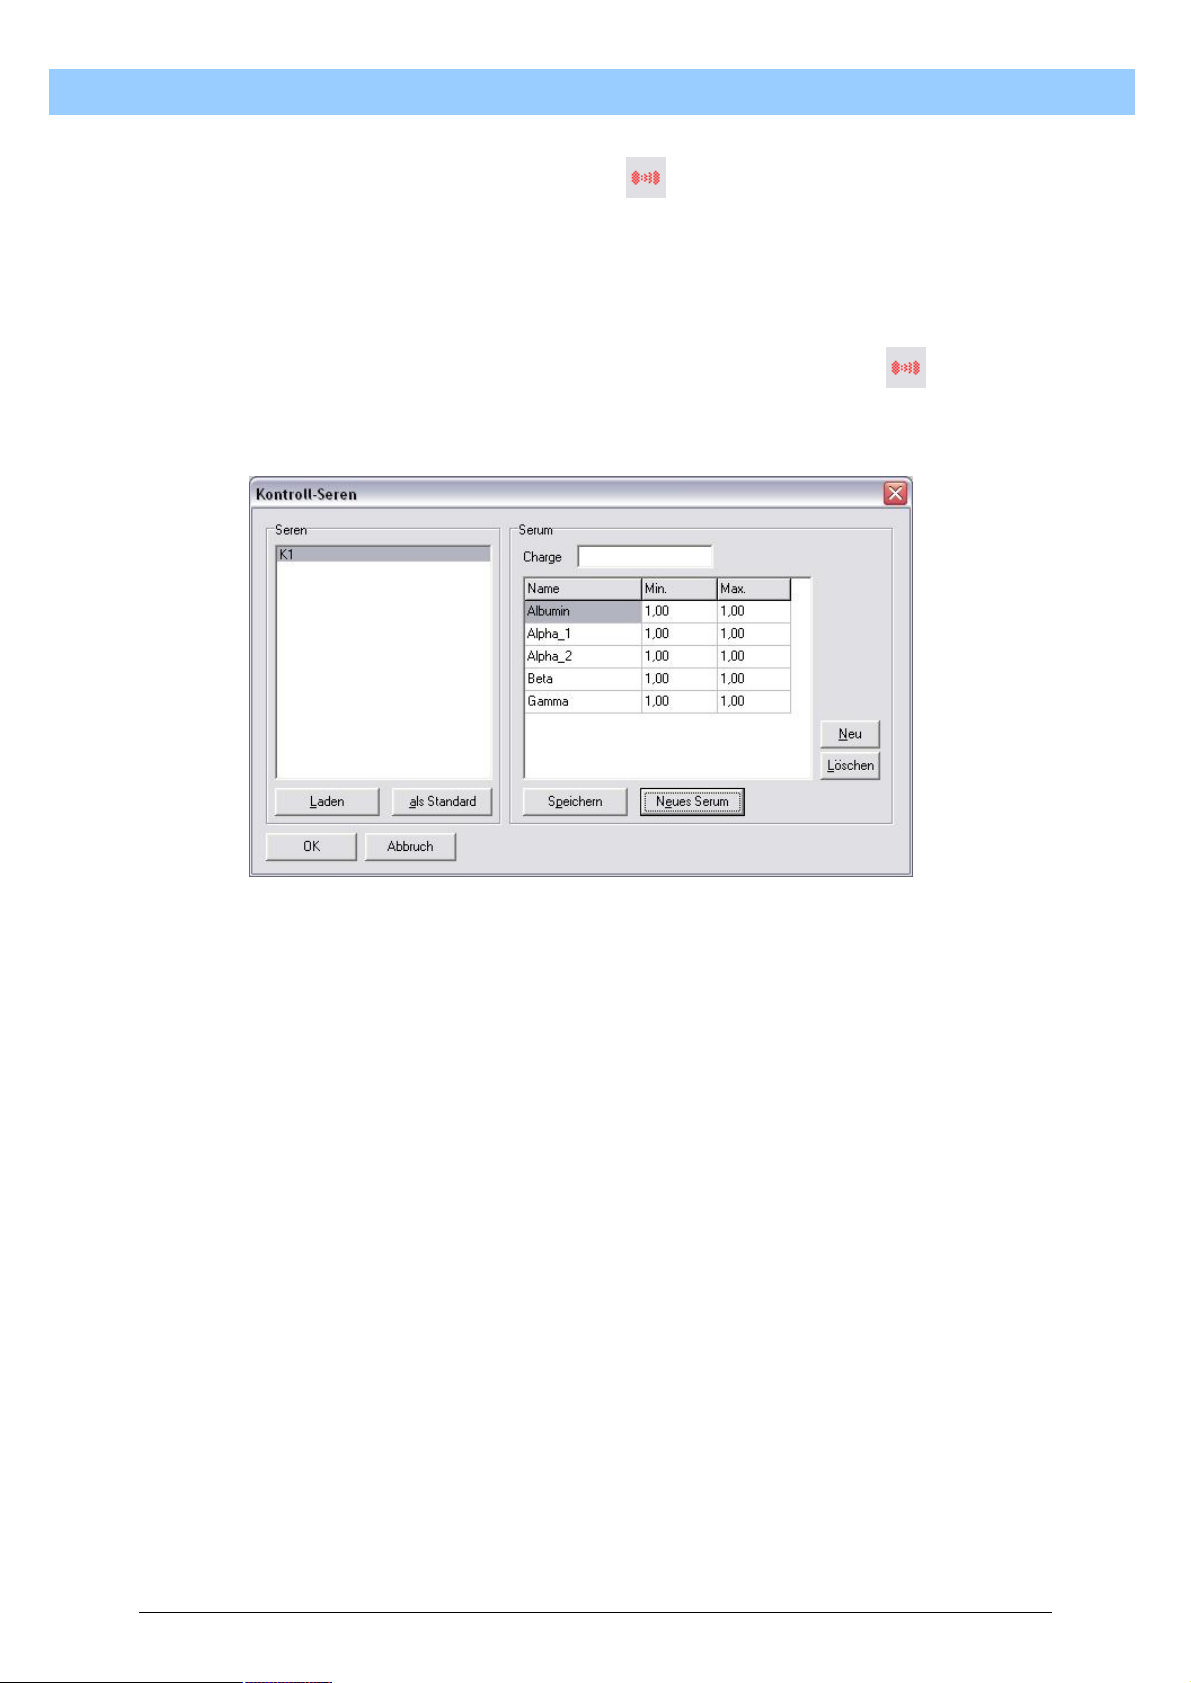
T
u
r
b
o
S
c
a
n
U
s
e
r
M
a
n
u
a
l
T
u
r
b
o
S
c
a
n
U
s
e
r
M
a
T
u
r
b
o
S
c
a
n
U
s
e
r
8.2.6. Manage Control Sera
In order to calculate the accuracy in the statistics, it may be necessary to
disclose TurboScan preset data for each individual band. This can be done
in the window for managing control sera.
To define control sera, single-click the left mouse button on as soon as
the mouse pointer is over the symbol. The entry window for Control Sera
opens.
M
a
n
n
u
u
a
a
l
l
First the control serum should be given a clear name. It is sensible to use
an abbreviation for the control in combination with the current batch
number. This entry is limited to 10 digits. Single-click the left mouse button
on the “Batch” entry field as soon as the mouse pointer is positioned in the
entry field.
The fractions Serum Protein Electrophoresis are given as preset in the
“NAME” field. However, these can be overwritten during entry. The values
in the “MIN” and “MAX” columns should be those given in the packing
leaflet of the control used, where the value given in the “MIN” field is the
lowest and the value in the “MAX” field the highest value given for the
relevant fraction. Once the data have been entered, save the entry just
made by single-clicking the left mouse button when the mouse pointer is
on the Save key. The data are now stored in the database and can be
used.
The selected data record with the control values is loaded into the main
memory using the “Load” button. This button is mainly used for correcting
the curves.
8.2.6.1. Use of control sera
To assign the control values to an analysis, the current curve must be
selected as a reference curve in the correction window. To do this, in the
45
Page 46
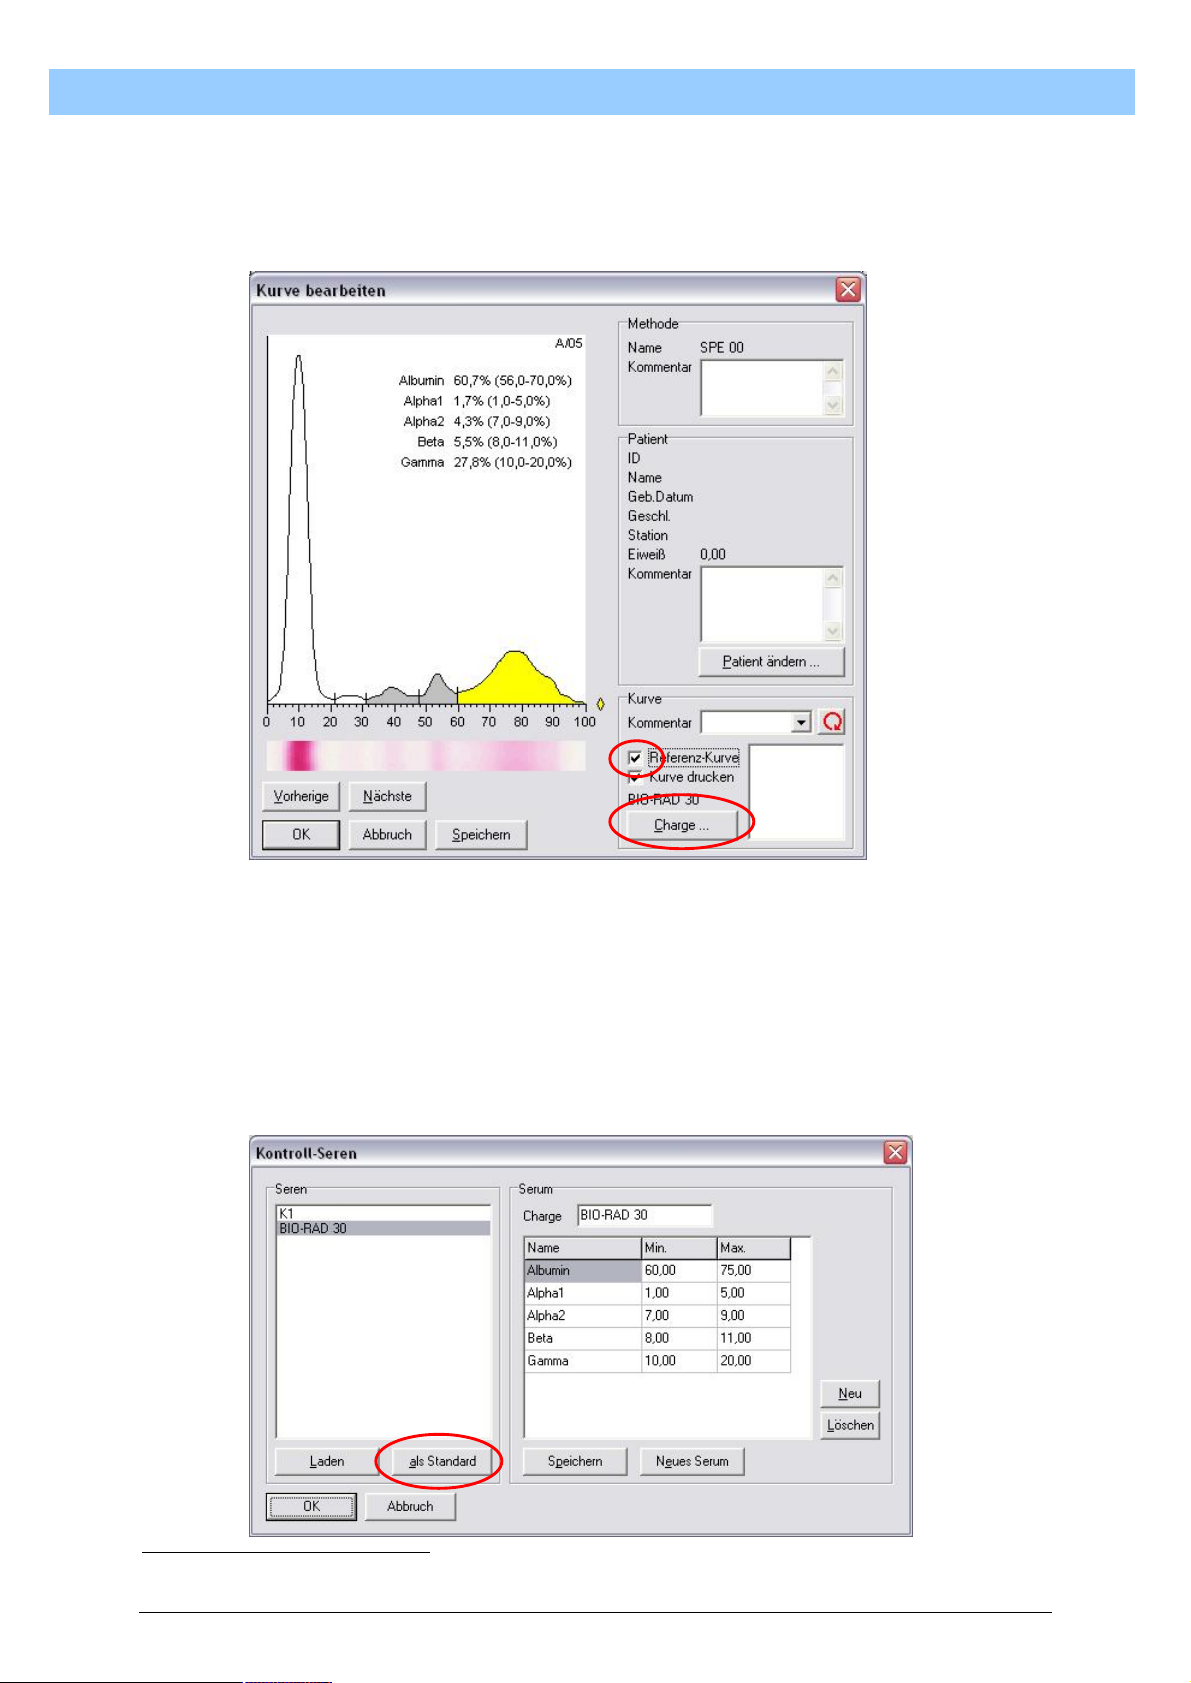
T
u
r
b
o
S
c
a
n
U
s
e
r
M
a
n
u
a
l
T
u
r
b
o
S
c
a
n
U
s
e
r
M
a
T
u
r
b
o
S
c
a
n
U
s
e
r
“Curve” section check the box for Reference sera* by single-clicking the left
mouse button. Now the “Batch” key is enabled for selecting the set of
values for the current analysis. Next single-click the left mouse button
when the mouse pointer is positioned on the “Batch” key.
M
a
n
n
u
u
a
a
l
l
The window for managing the control sera opens. Single-click the left
mouse button on the control used to select it. Single-clicking the left mouse
button on “OK” will load the set of values of the selected control and assign
them to the current curve. In the curve correction window, the name of
assigned set of values is displayed above the “Batch” button.
If you are only working with a control, the selected set of values can be
loaded automatically as default by pressing the “...as default” button when
the “Batch” button is activated in the correction window.
*
TRANSLATOR’S NOTE: In the graphic of the software, the checkbox is actually named “Referenz-Kurve”,
i.e. Reference curve.
46
Page 47
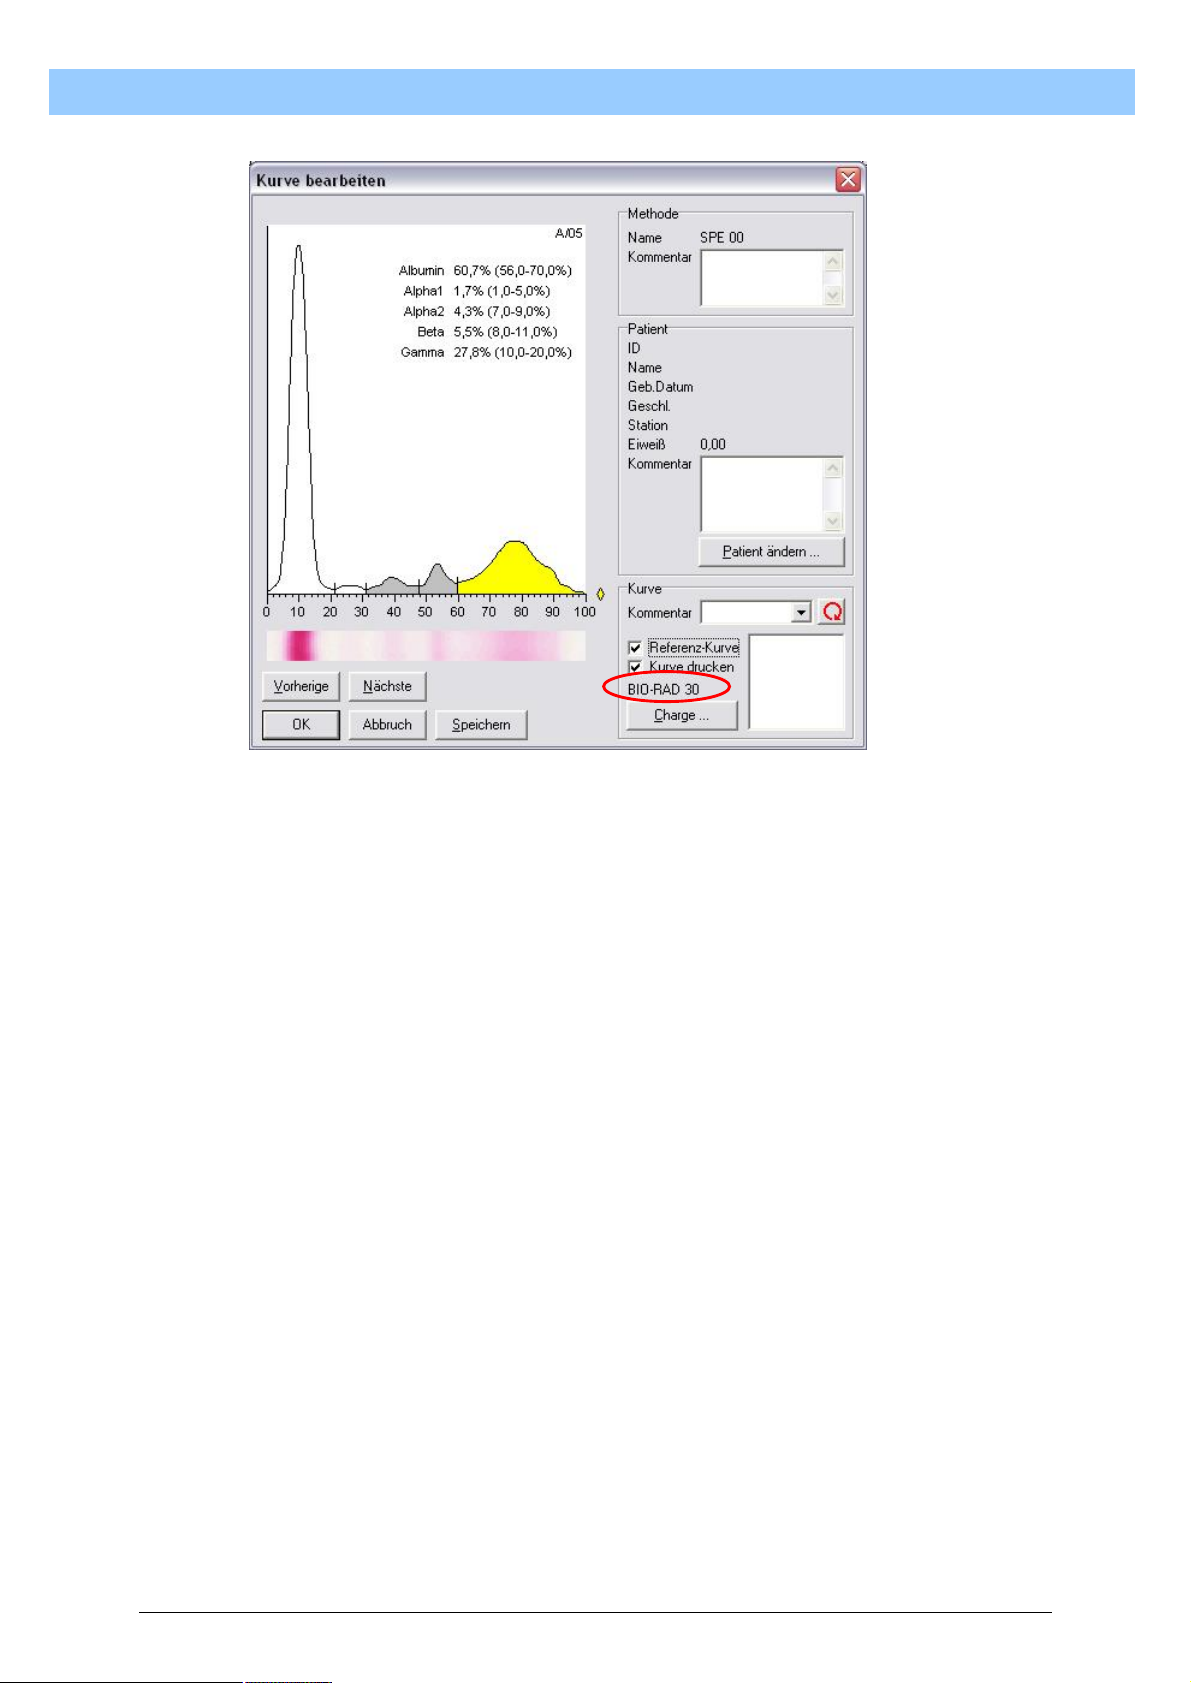
T
u
r
b
o
S
c
a
n
U
s
e
r
M
a
n
u
a
l
T
u
r
b
o
S
c
a
n
U
s
e
r
M
a
T
u
r
b
o
S
c
a
n
U
s
e
r
M
a
n
n
u
u
a
a
l
l
47
Page 48
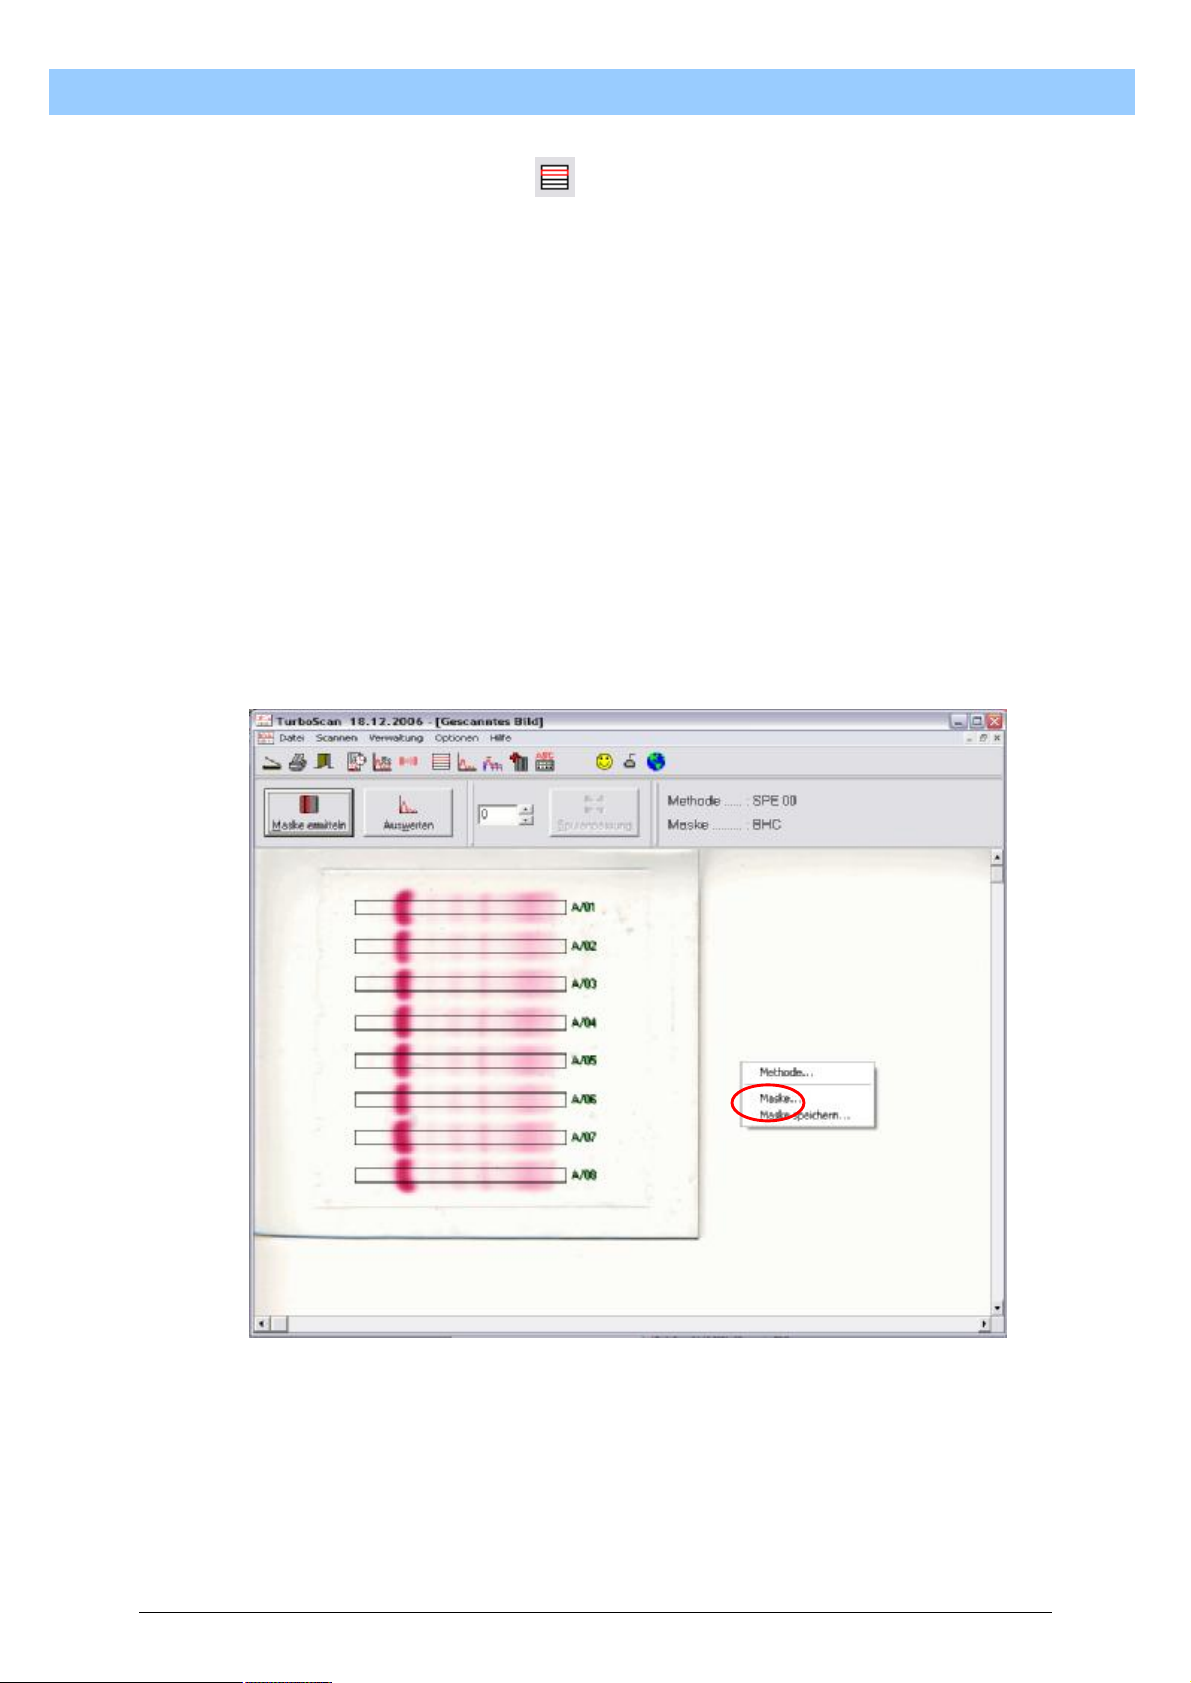
T
u
r
b
o
S
c
a
n
U
s
e
r
M
a
n
u
a
l
T
u
r
b
o
S
c
a
n
U
s
e
r
M
a
T
u
r
b
o
S
c
a
n
U
s
e
r
8.2.7. Manage Masks
TurboScan not only offers you the option of finding the tracks automatically
for analysis, but also defining these manually and saving them in a suitable
data record. This procedure should always be chosen if an automatic track
search is impeded so much by external circumstances (such as lowcontrast staining) that a reasonable automatic search cannot be carried
out.
There are no limitations on flexibility within the scanned area.
8.2.7.1. Create new mask
To create a new mask, an image must first be recorded with the object to
be analysed (see 8.1.1.3.5 or 8.1.1.3.6). After recording and confirmation
of the image in the “Capture image” window, single-click the right mouse
button. A small menu appears next to the mouse pointer. Position the
mouse pointer on menu item “Mask” and single-click the left mouse button.
M
a
n
n
u
u
a
a
l
l
The window for creating, processing or deleting masks opens.
Firstly single-click the left mouse button on the “New mask” button. The
entry fields in the “Current mask” section and the mask in the “Segment in
mask” section are cleared.
48
Page 49
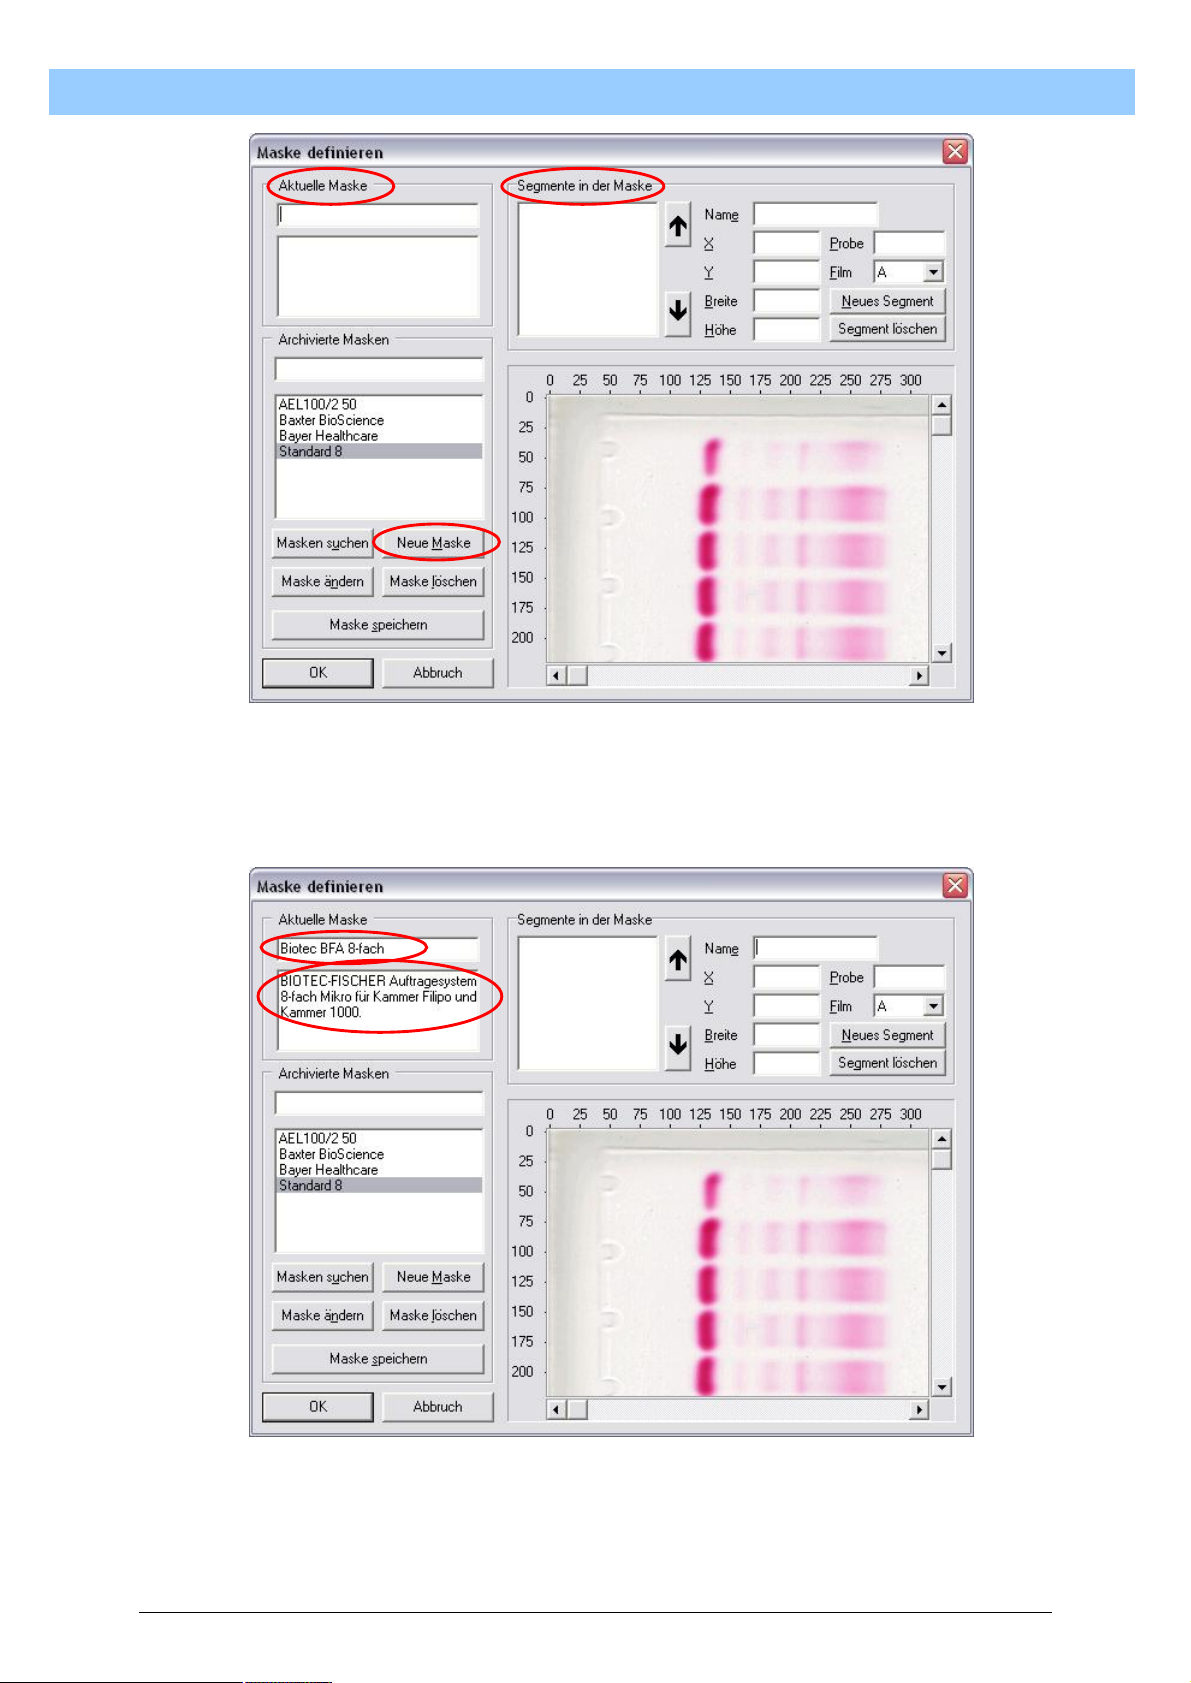
T
T
T
u
u
u
r
b
o
S
c
a
n
U
s
e
r
M
a
n
u
a
l
r
b
o
S
c
a
n
U
s
e
r
M
a
r
b
o
S
c
a
n
U
s
e
r
M
a
n
n
u
u
a
a
l
l
Next the name of the new mask should be entered. The name of the mask
should be selected so that it can immediately be linked to the scanned
object. A more detailed description can be given in the Comments field
under the name.
Then the coordinates of the segments for the mask can be defined. The
name of the segment, the coordinates and the sample number as well as
object name are needed to do this.
The segment name identifies each segment clearly. In other words, when
allocating the name, make sure that it is unambiguous and is not entered
49
Page 50
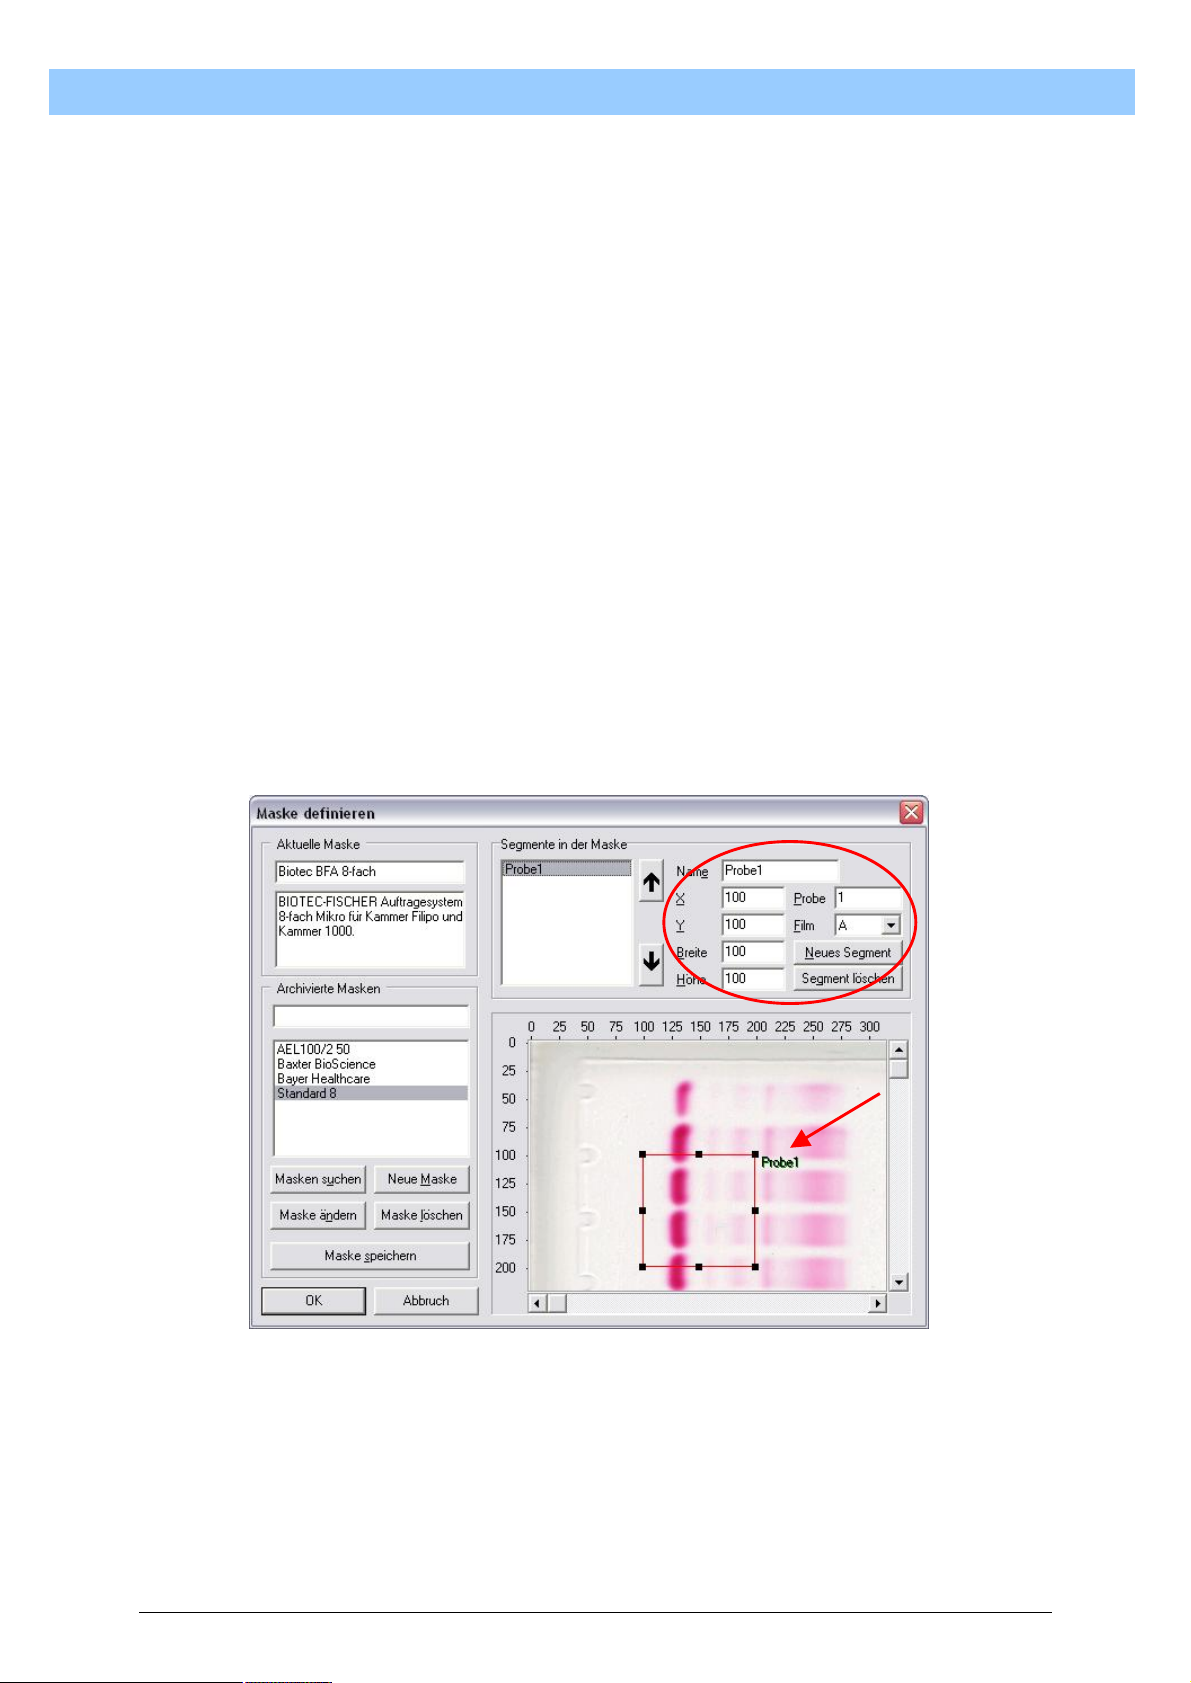
T
u
r
b
o
S
c
a
n
U
s
e
r
M
a
n
u
a
l
T
u
r
b
o
S
c
a
n
U
s
e
r
M
a
T
u
r
b
o
S
c
a
n
U
s
e
r
several times. If this happens, TurboScan will not save the “incorrect”
segment. It has been found helpful to use a short identifier followed by a
numerator.
Example: Patient 1 or Track 1 or T1
Patient 2 .... Track 2 .... T2 ....
Although the coordinates can be read from the axis caption, the accuracy
of hitting a point is not very high. It is better to work intuitively here.
In order to work intuitively, a starting basis first has to be created. To do
this, enter the following values:
Name: Sample1
X: 100
Y: 100
Width: 100
Height: 100
Sample: 1
Film: A
After entering these values, single-click the left mouse button on “New
segment”. The above values are now incorporated and the first track is
entered in the image.
M
a
n
n
u
u
a
a
l
l
Sample number and object name, here called “Film”, help to make it easier
to assign the individual tracks to the image later.
The reading track just created now has to be placed in the correct position
and be given the correct dimensions so that an analysis can take place.
Activate the first track by single-clicking the left mouse button when the
mouse pointer is positioned inside the track. To move the track, position
the mouse pointer inside the track and press and hold the left mouse
button. Now move the track so that the top left corner of the track comes to
50
Page 51
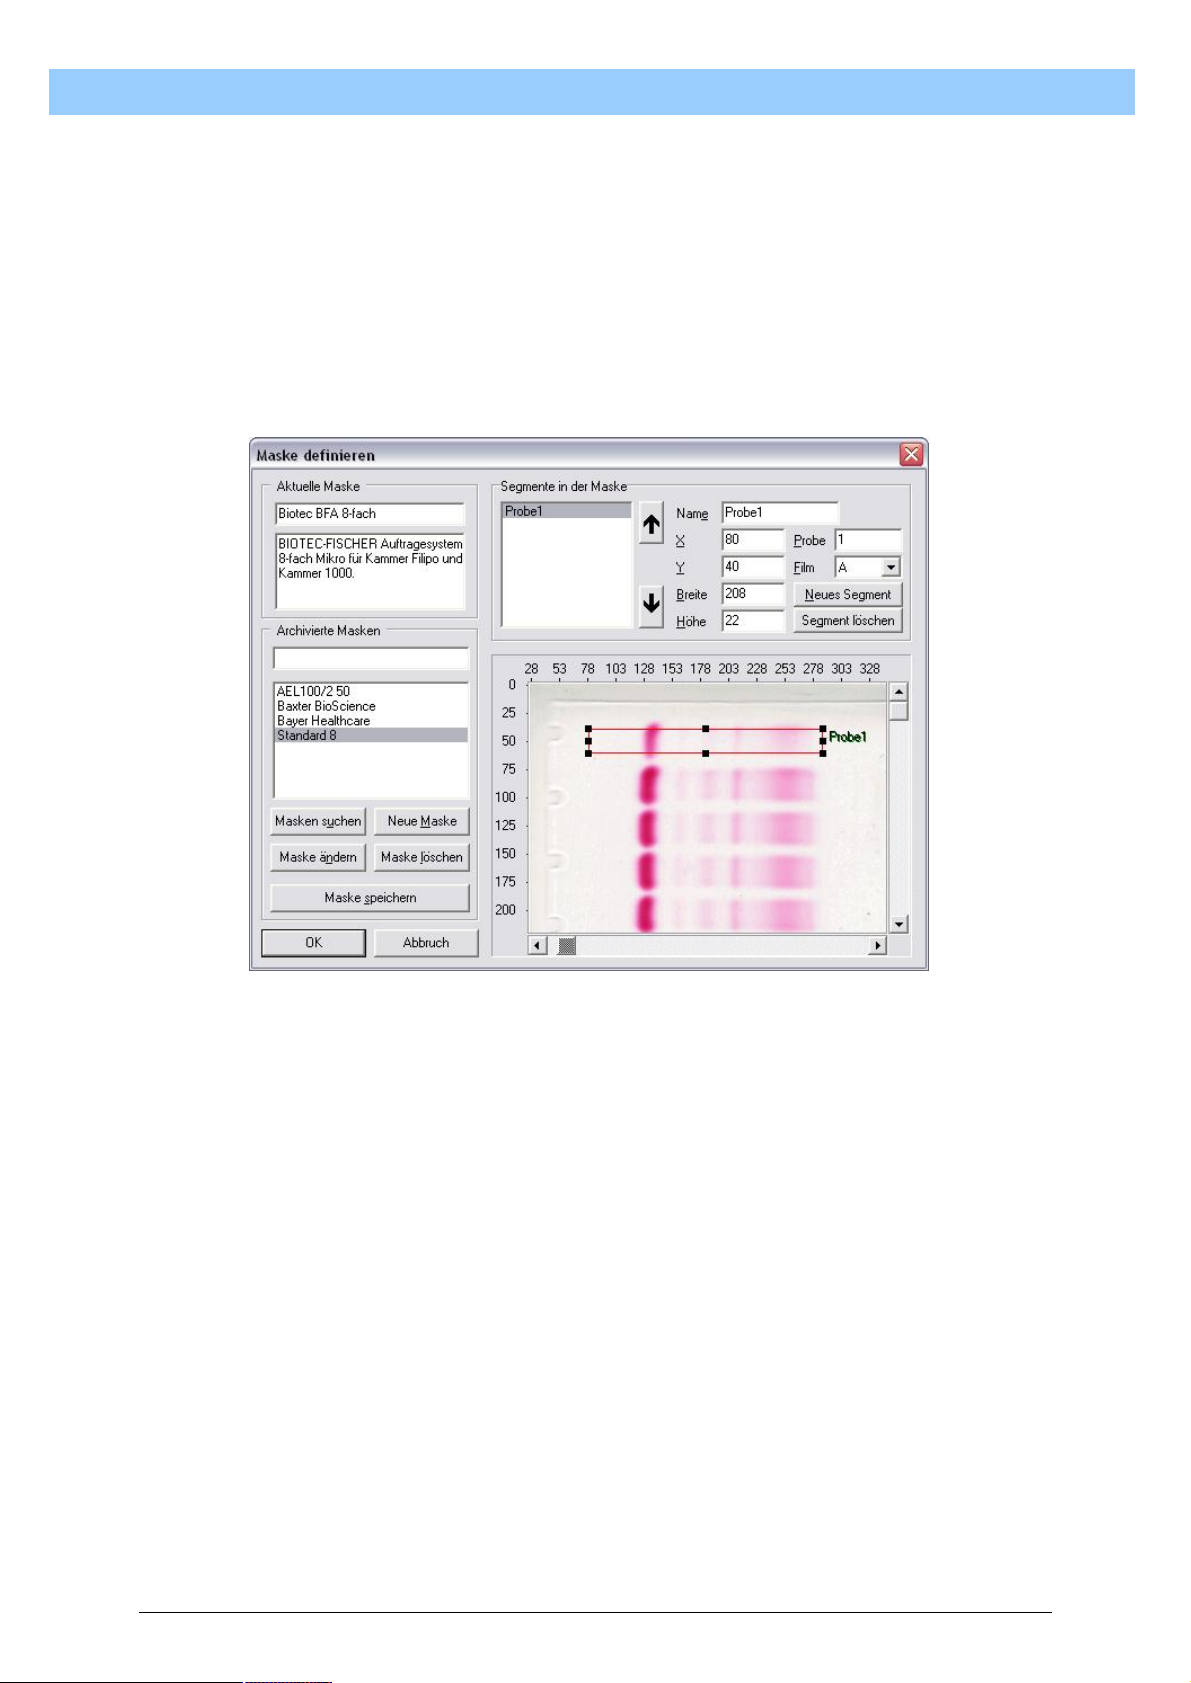
T
u
r
b
o
S
c
a
n
U
s
e
r
M
a
n
u
a
l
T
u
r
b
o
S
c
a
n
U
s
e
r
M
a
T
u
r
b
o
S
c
a
n
U
s
e
r
lie just in front of the albumin and the top horizontal line ends at the track.
Now the left mouse button can be released. The track is now fixed in the
position. To correct the width and height, position the mouse pointer on the
bottom right black box. The mouse pointer changes shape to a doublearrow pointing diagonally from top left to bottom right. When the mouse
pointer takes on this shape, press and hold the left mouse button. The
width and height of the track can now be changed. Position the bottom
right corner so that it comes to lie just behind the gamma fraction and the
bottom horizontal line ends at the track. The values for X, Y, width and
height in the display will change interactively.
M
a
n
n
u
u
a
a
l
l
For the rest of the tracks to be defined, simply change the fields for Name,
Sample and Y. For the second track this would mean:
Name: Sample2
Y: 80
Sample: 2
All other values remain unchanged. As a result of this change, a new track
with the name Sample2 is positioned and displayed in parallel below the
first track with the same width.
51
Page 52
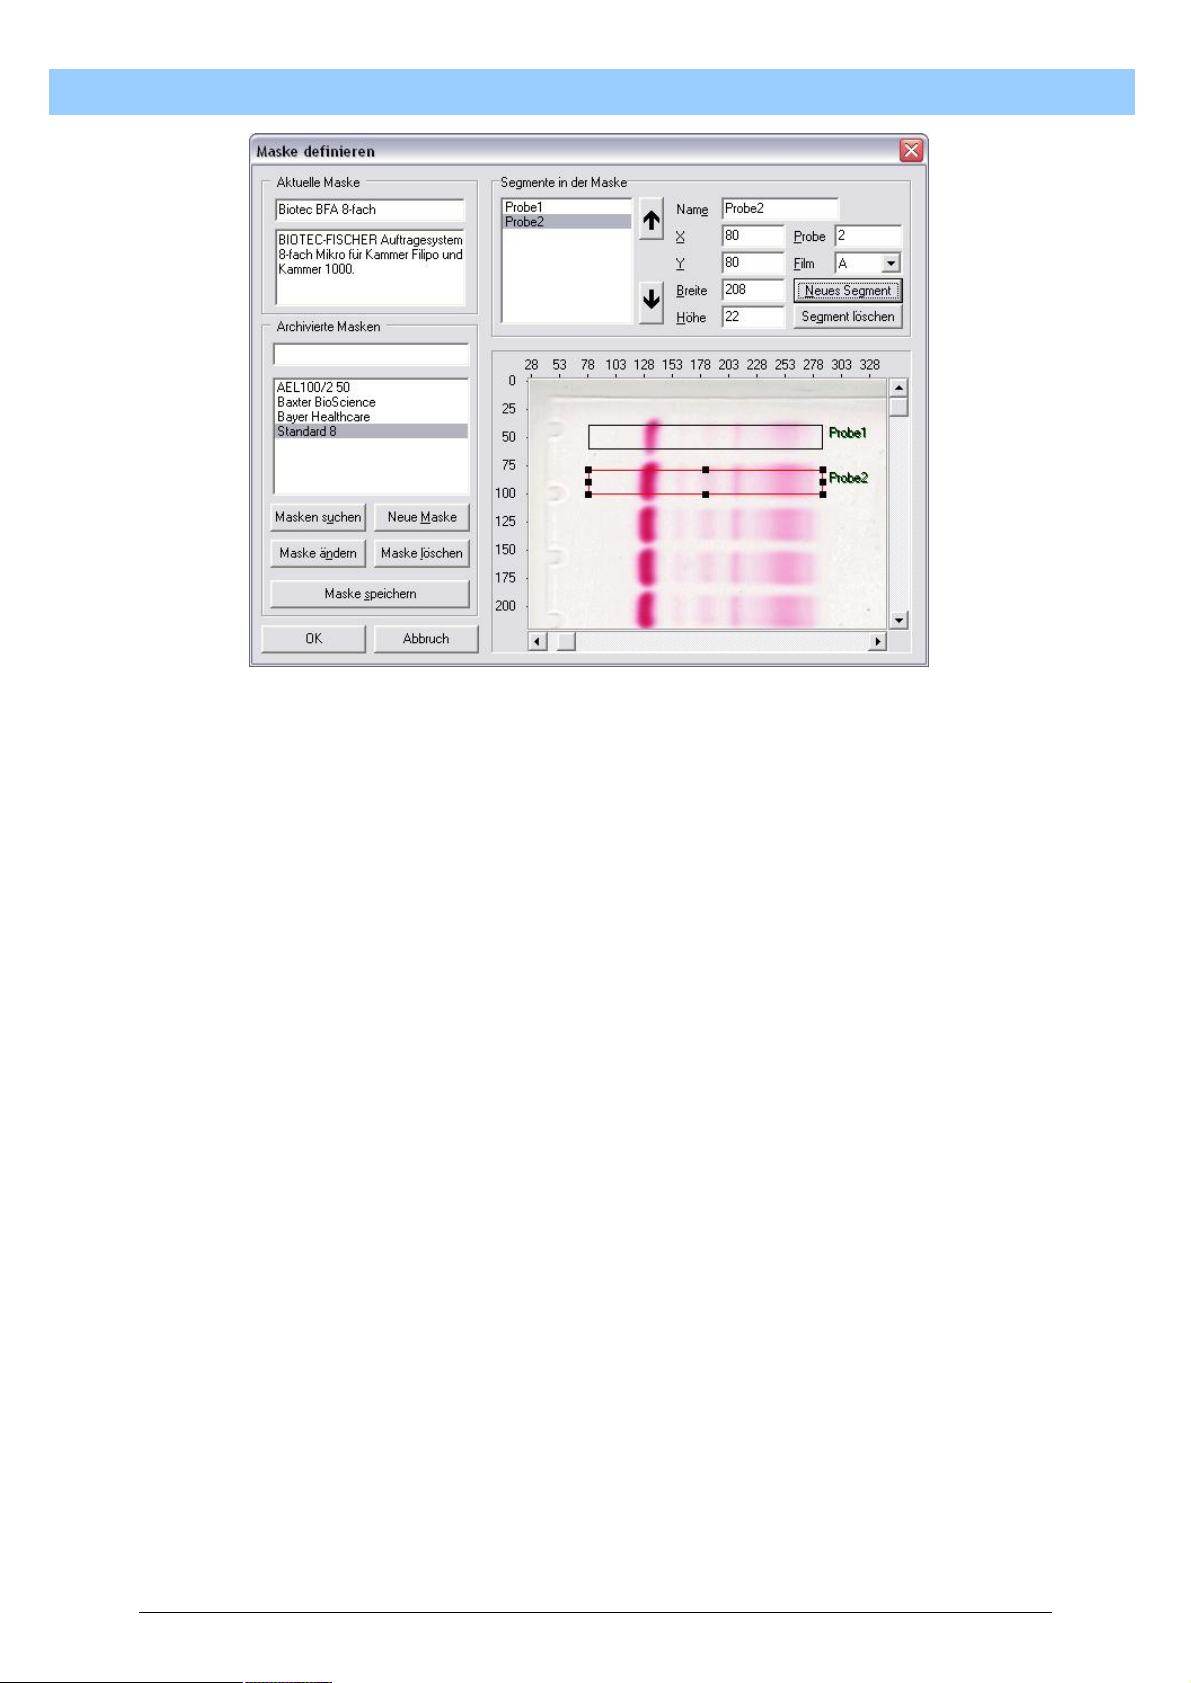
T
u
r
b
o
S
c
a
n
U
s
e
r
M
a
n
u
a
l
T
u
r
b
o
S
c
a
n
U
s
e
r
M
a
T
u
r
b
o
S
c
a
n
U
s
e
r
All other tracks are defined by changing the Name, Y and Sample fields.
Tip: The difference in the Y-value from the first to the second track can
normally be applied to all the other tracks. As the difference between the
first and second Y- value is 40, the third track will have a Y-value of 120,
the fourth track a Y-value of 160, etc.
After all the tracks have been defined, position the mouse pointer on “Save
mask” and single-click the left mouse button. The mask is now saved.
You can save as many different masks as you like for subsequent use.
M
a
n
n
u
u
a
a
l
l
8.2.7.2. Load existing mask
As described initially under 8.2.7.1, open the window for managing masks.
In the left section of the mask management window, the name of the mask
to be activated can now be selected by positioning the mouse pointer on
the name and single-clicking the left mouse button. Click on “OK” to
confirm the selection just made, which is then incorporated into the
program. The mask management window is closed and the mask just
selected is active. This mask is now automatically loaded and displayed at
every startup of the program. Every mask newly selected in this way
automatically becomes the default mask.
8.2.7.3. Change existing mask
As described initially under 8.2.7.1, open the window for managing masks.
In the left section of the mask management window, the name of the mask
to be changed can now be selected by positioning the mouse pointer on
the name and double-clicking the left mouse button. The matching values
52
Page 53

T
u
r
b
o
S
c
a
n
U
s
e
r
M
a
n
u
a
l
T
u
r
b
o
S
c
a
n
U
s
e
r
M
a
T
u
r
b
o
S
c
a
n
U
s
e
r
for the mask just selected are displayed in the right section “Segment in
mask”. Changes can now be made as described under 8.2.7.1. If no new
name is entered for the mask, the existing mask will be overwritten with the
new data.
M
a
n
n
u
u
a
a
l
l
53
Page 54
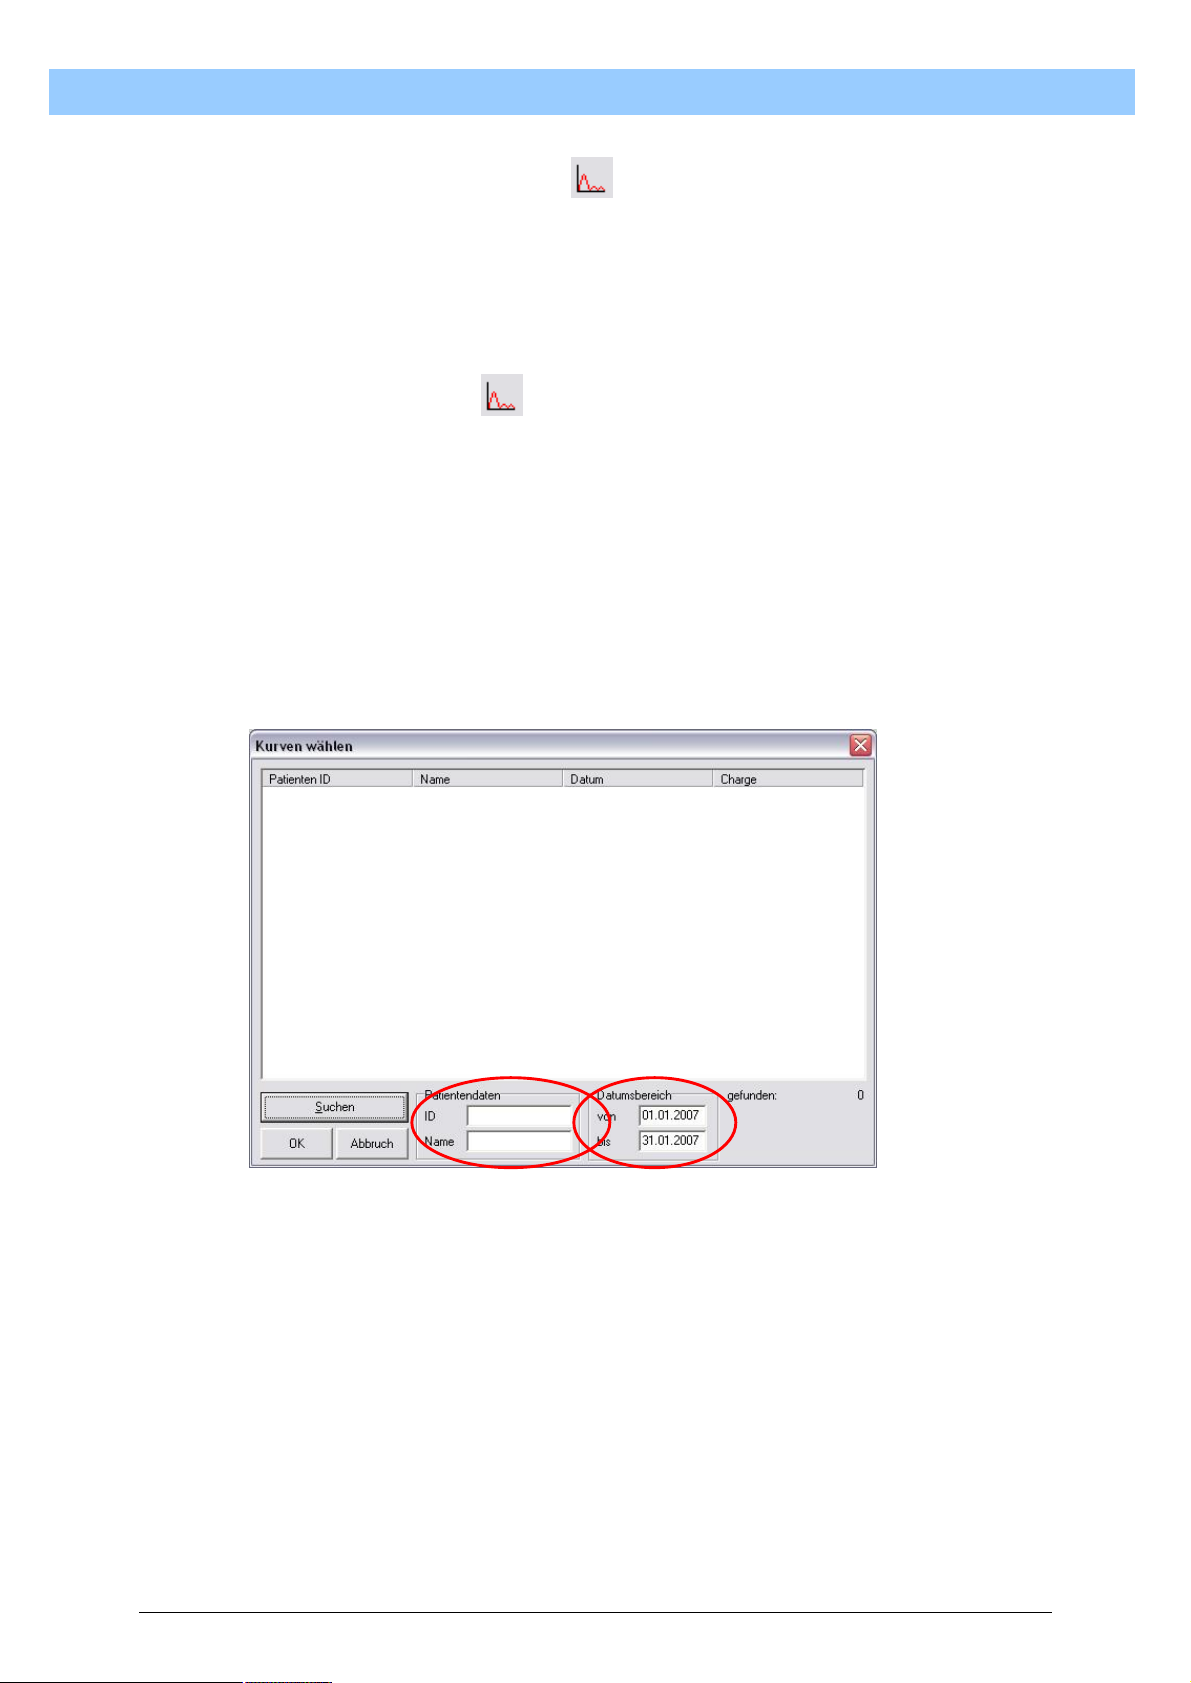
T
u
r
b
o
S
c
a
n
U
s
e
r
M
a
n
u
a
l
T
u
r
b
o
S
c
a
n
U
s
e
r
M
a
T
u
r
b
o
S
c
a
n
U
s
e
r
8.2.8. Database Search
The database search is used to find analyses from the past or to find
analyses of a specific patient from a specific period or some other kind of
search for analyses previously performed.
To open the dialogue, single-click the left mouse button on the symbol for
sample management . The window for searching by analysis opens.
8.2.8.1. Search criteria
So that the search can be designed to meet requirements, information
limiting the search needs to be entered. TurboScan automatically presets
today’s date as a search criterion, but any date can be entered in the date
fields. Make sure that the start date is before the end date. As an additional
criterion, the database can also be searched by patient ID or by name. You
can also combine all 3 criteria in your search.
M
a
n
n
u
u
a
a
l
l
Start the search by single-clicking the left mouse button on “Search”.
If no matches with the specified criteria are found in the database,
TurboScan displays a message on the screen that there are no data
records with the given criteria.
If the search is successful, the found data records are shown in tabular
form in the display array.
54
Page 55
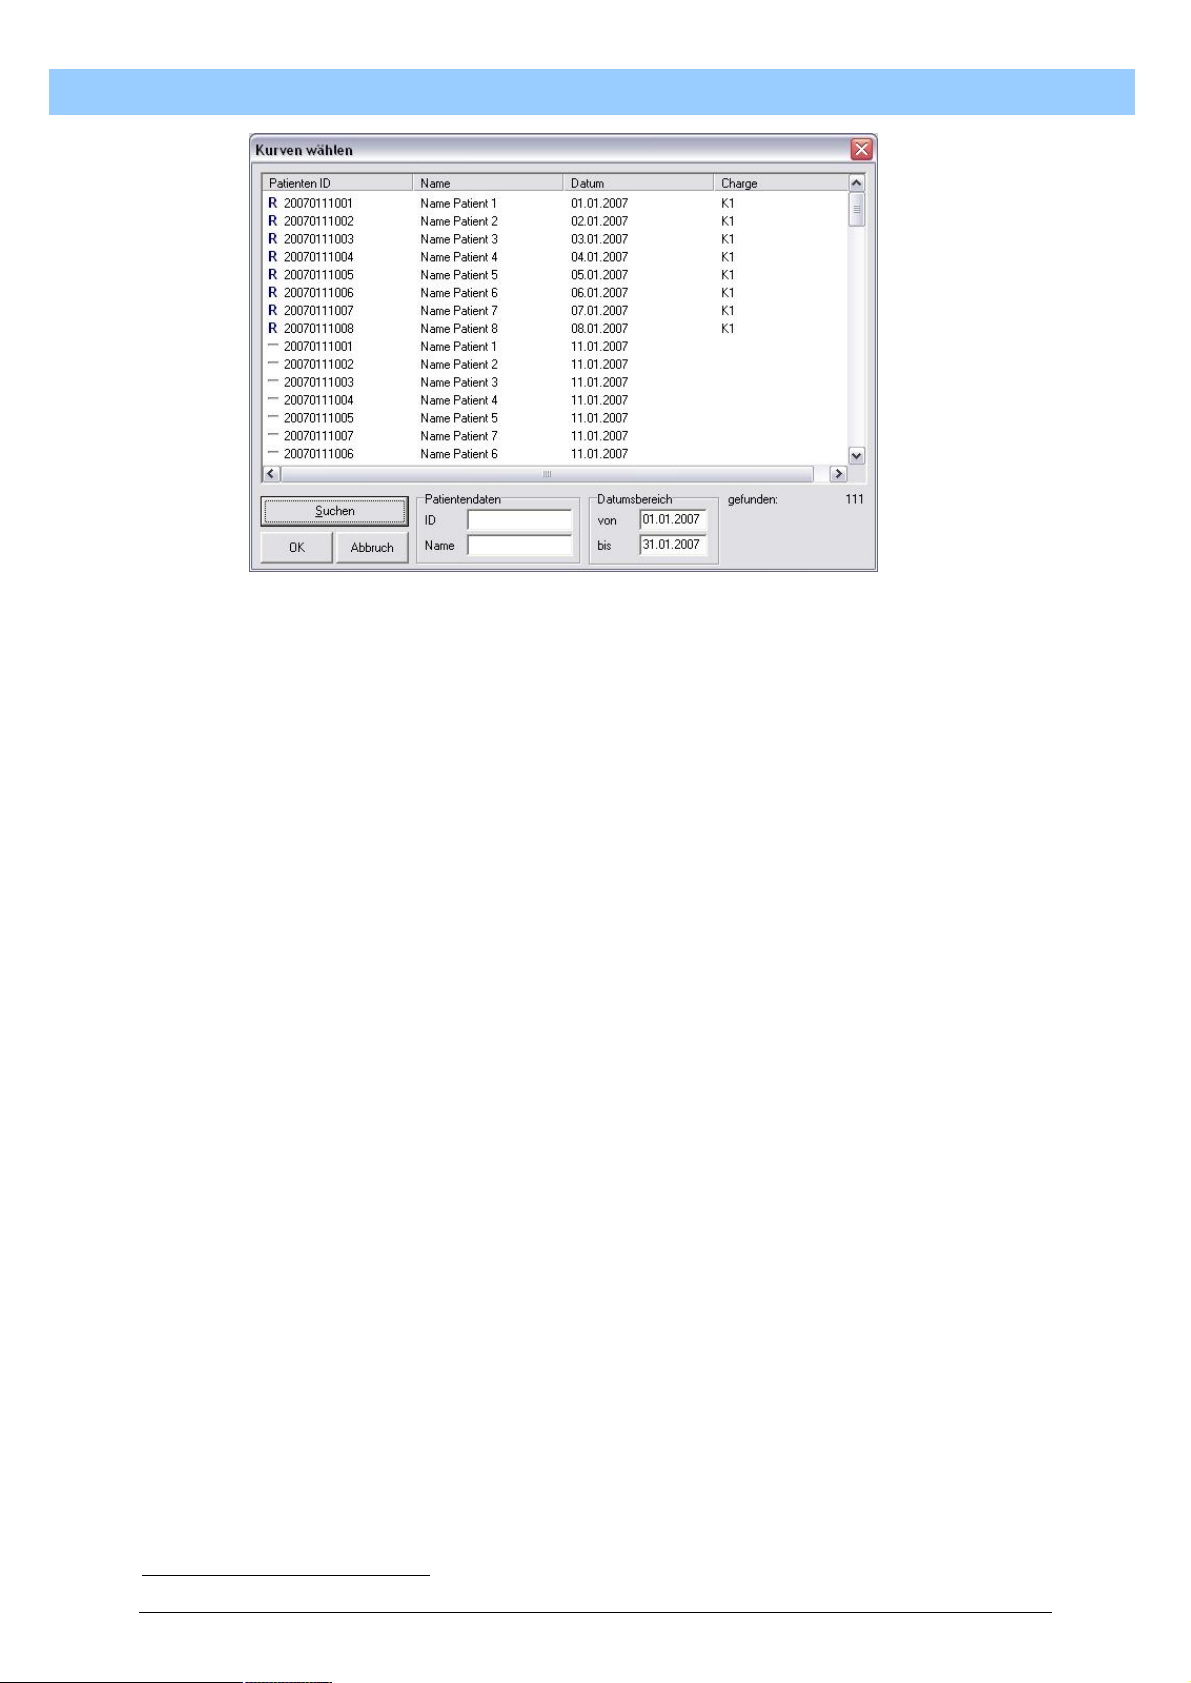
T
u
r
b
o
S
c
a
n
U
s
e
r
M
a
n
u
a
l
T
u
r
b
o
S
c
a
n
U
s
e
r
M
a
T
u
r
b
o
S
c
a
n
U
s
e
r
8.2.8.2. Selection
8.2.8.2.1. Grouped selection
After the found data have been displayed, the whole list or just individual
data records from the list can be selected and loaded into the main
memory.
To select the whole list, first position the mouse pointer on the first line of
the list window and single-click the left mouse button. This will have
highlighted the first data record. Now position the mouse pointer on the last
position in the list. Select the last entry in the list while pressing the Shift
key9 at the same time. This will select all the data records. Groups within
the list can be selected in this way. Always select the first and last data
record in a group, as described above.
If the list is longer than the window can display, a scroll bar appears on the
right of the list, which you can use to scroll to the last data record. To do
this, position the mouse pointer on the slider of the scroll bar, press and
hold the left mouse button. Moving the mouse downwards will move the list
down as well. Now you can release the mouse button.
8.2.8.2.2. Single selection
Single selection involves taking single data records out of the displayed
list. To do this, each data record has to be selected separately. To carry
out a single selection, for each data record selected, click the left mouse
button with the mouse pointer on the relevant data record while pressing
the “Ctrl” key on the keyboard.
M
a
n
n
u
u
a
a
l
l
9
Key for capital letters
55
Page 56
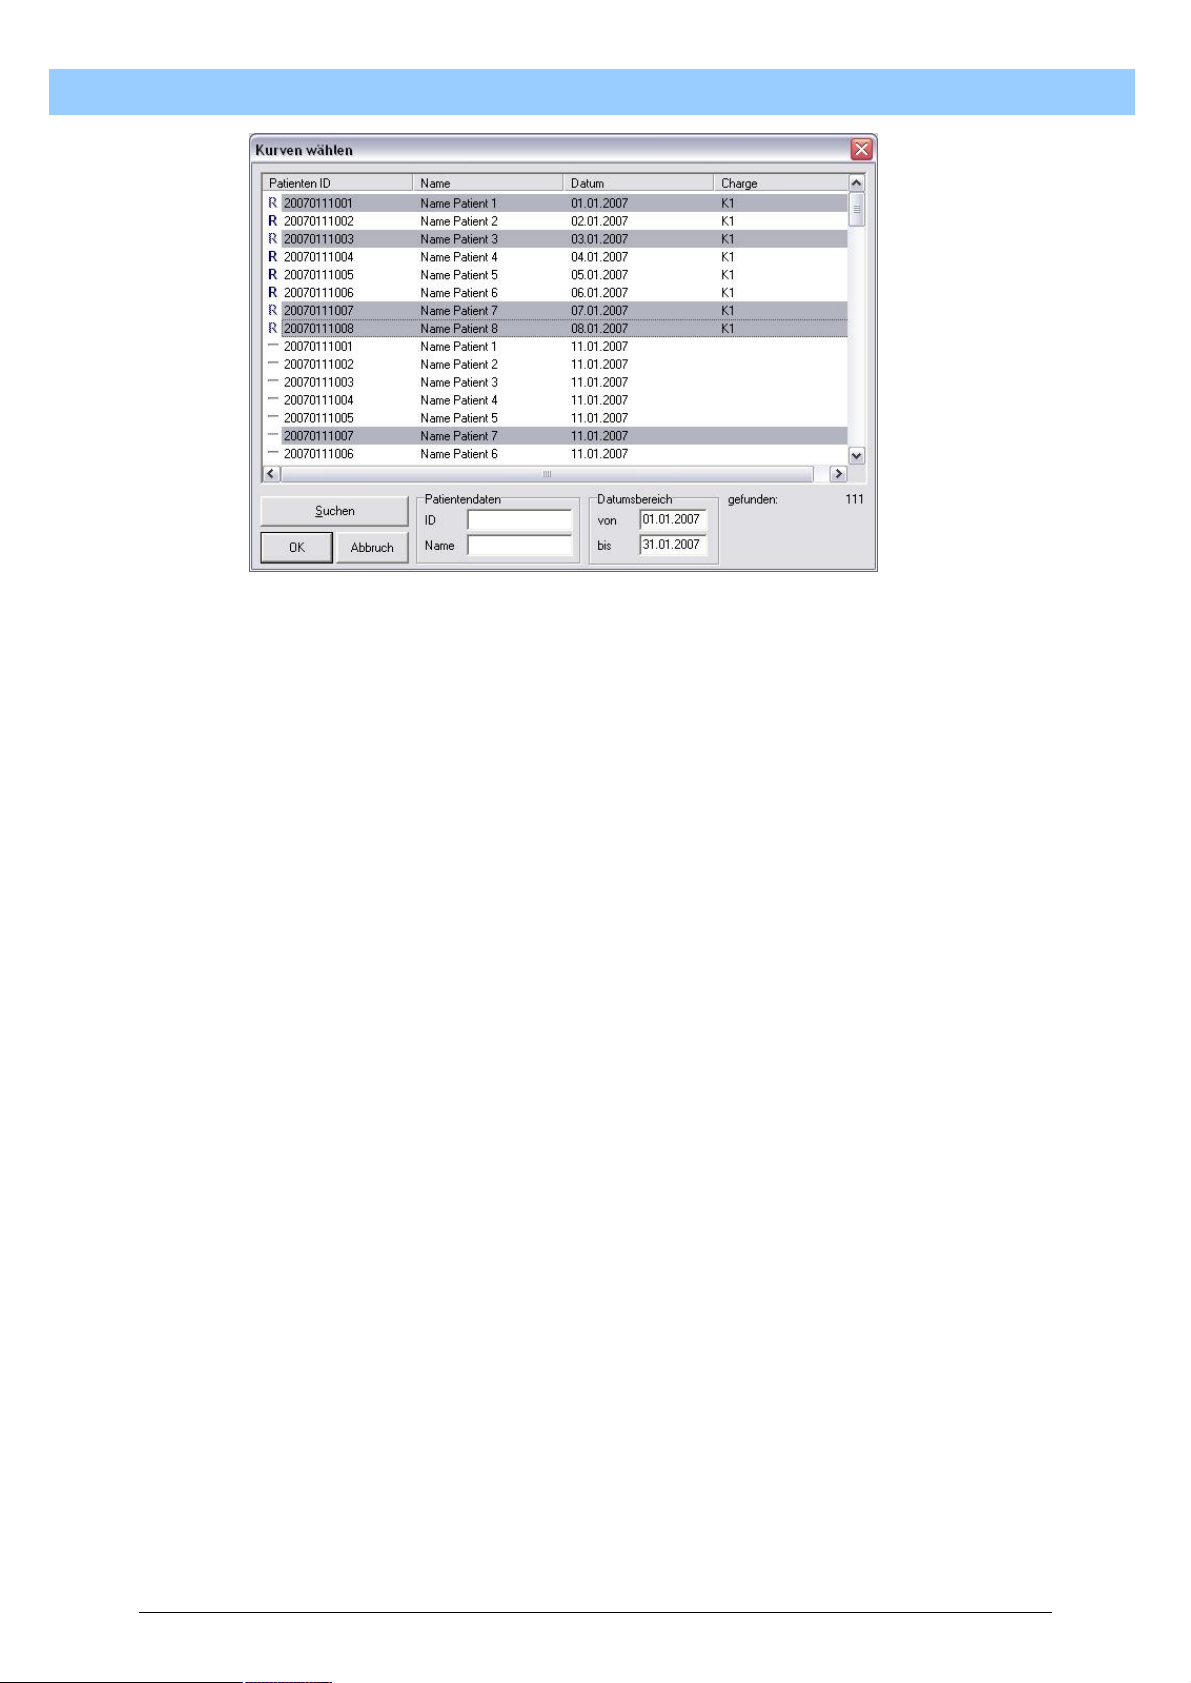
T
u
r
b
o
S
c
a
n
U
s
e
r
M
a
n
u
a
l
T
u
r
b
o
S
c
a
n
U
s
e
r
M
a
T
u
r
b
o
S
c
a
n
U
s
e
r
After the data records have been selected, confirm the selection with the
“OK” button. The data are retrieved from the database and loaded into the
main memory. The data will be available there for subsequent printing, for
example.
M
a
n
n
u
u
a
a
l
l
56
Page 57
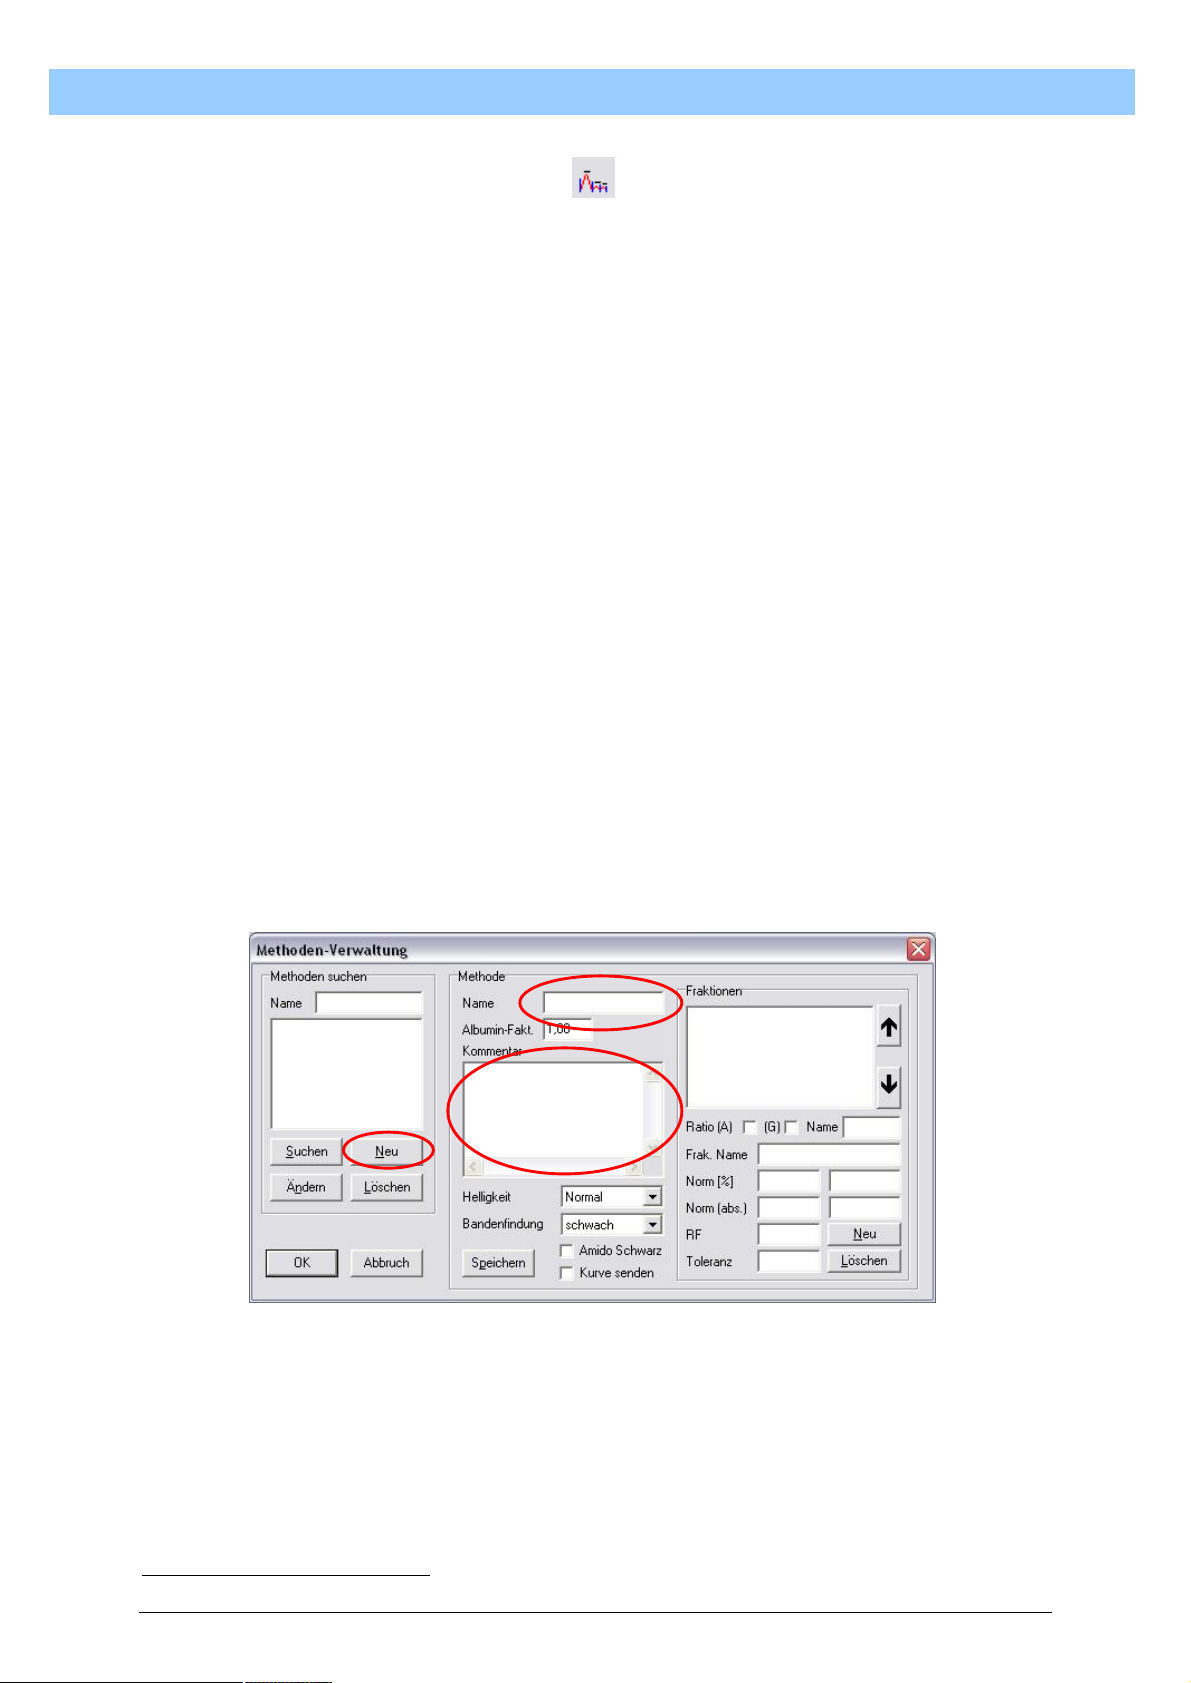
T
u
r
b
o
S
c
a
n
U
s
e
r
M
a
n
u
a
l
T
u
r
b
o
S
c
a
n
U
s
e
r
M
a
T
u
r
b
o
S
c
a
n
U
s
e
r
8.2.9. Manage Methods
TurboScan allows you to save electrophoresis methods in a database. This
applies to the currently known methods but equally to any that are not yet
known at present.
The Method does not specify the procedure but the designation of known
fractions linked to a specific procedure. For example, Serum Protein
Electrophoresis: this is performed according to specific instructions and the
appearance is always the same. The first fraction to appear is albumin,
followed by the globulins alpha 1, alpha 2, beta and gamma. This
sequence is always the same in the routine procedure.
To open the Manage Methods window, position the mouse pointer on the
Manage Methods symbol and single-click the left mouse button. This
opens the Manage Methods window.
8.2.9.1. Create new default method
To create a new method, position the mouse pointer on “New” and singleclick the left mouse button. Then the first step is to enter the name of the
new method in the top entry field in the “Method” section. Make sure that
the name of the method identifies the nature of the electrophoresis as
much as possible. This will simplify selection of the method later. The entry
area field the method name can be used for additional information. The
first line of the comments field is included in the eventual printout to
document the method used before identification of the track.
M
a
n
n
u
u
a
a
l
l
After the name of the method has been entered, the method has been
identified on the printout and an additional short description has been
given, you can now move over to entering the individual fractions. Position
the mouse pointer in the “Fract.name” entry field and single-click the left
mouse button to start the entry.
Enter the name of the fraction for this method in the “Fract.name” field.
Based on the example of Serum Protein Electrophoresis, this would be
Albumin10. In the “Norm[%]” fields: enter the minimum value of the normal
10
Variations in subsequent electrophoreses of serum proteins are possible.
57
Page 58
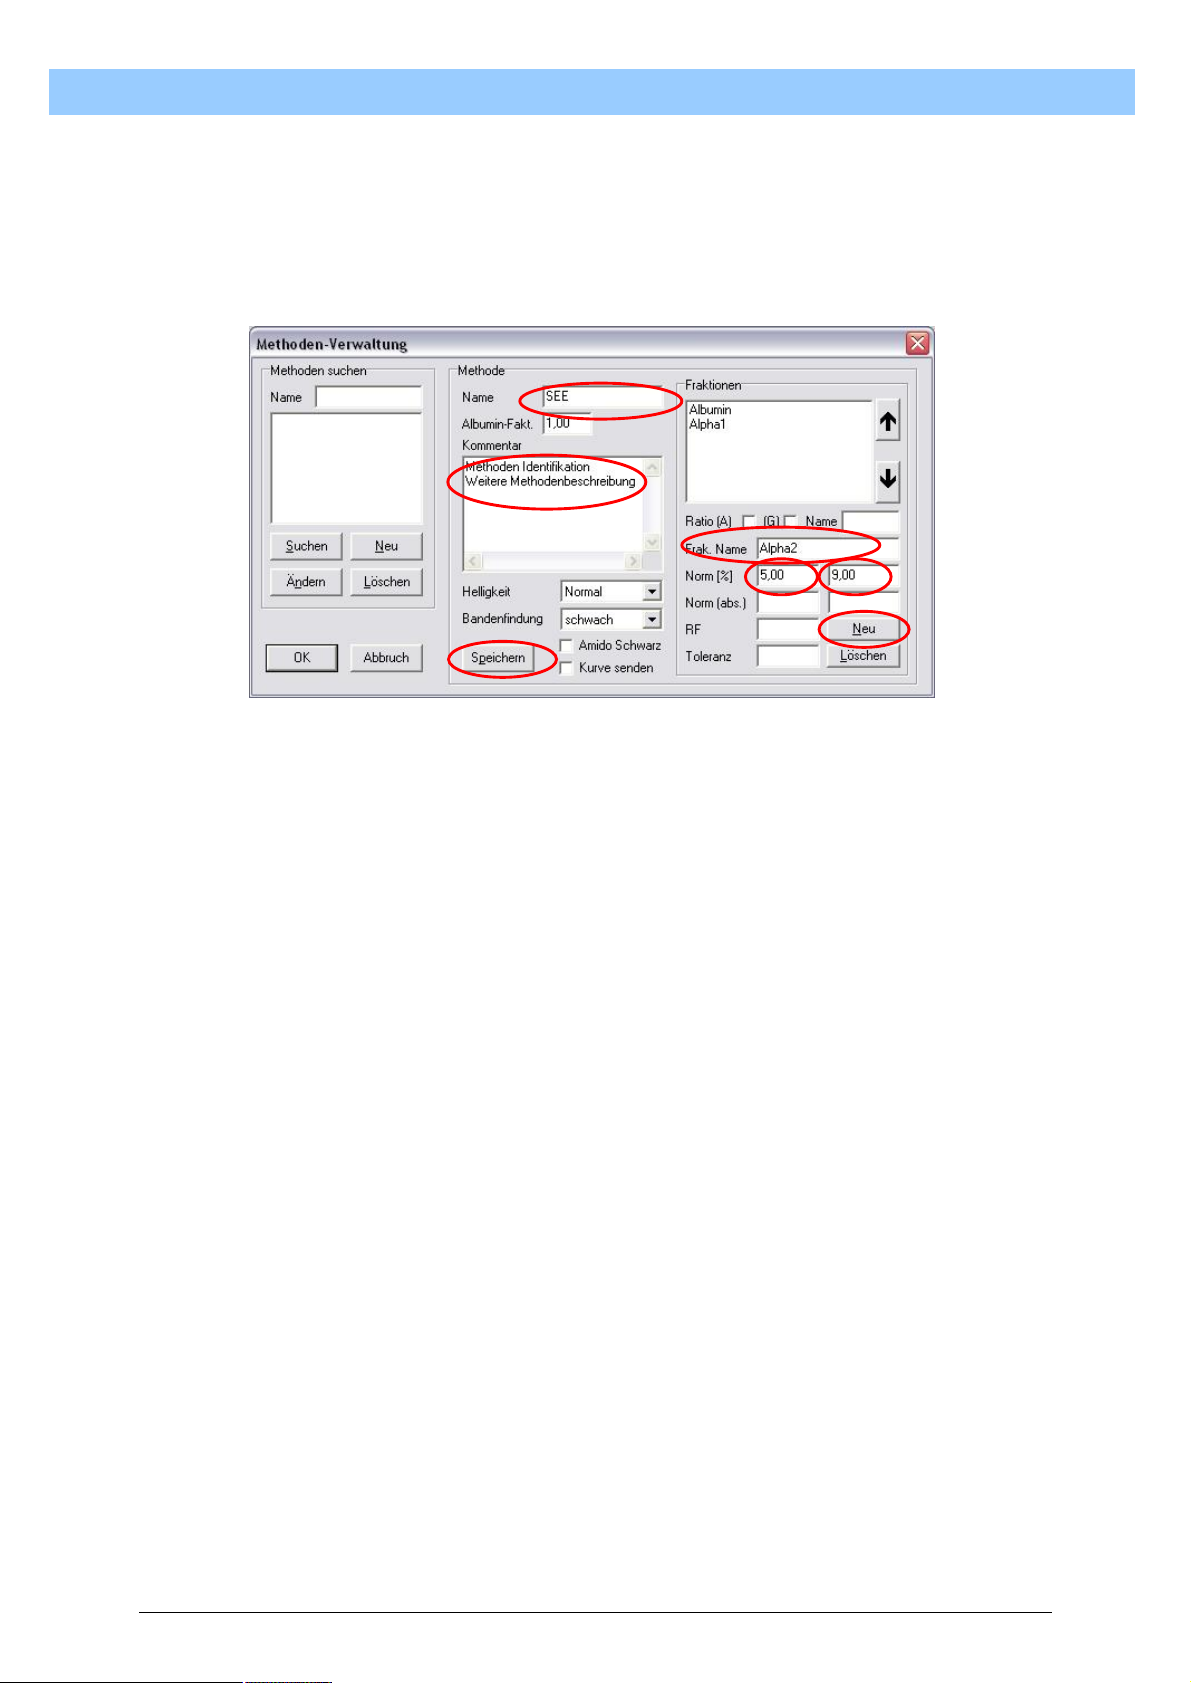
T
u
r
b
o
S
c
a
n
U
s
e
r
M
a
n
u
a
l
T
u
r
b
o
S
c
a
n
U
s
e
r
M
a
T
u
r
b
o
S
c
a
n
U
s
e
r
range for relative percentages in the left-hand field and the maximum value
in the right-hand field. In the “Norm[abs.]” fields: enter the minimum and
maximum normal values for the absolute total protein of the relevant
fraction. The entries in the “Fract.name”, “Norm[%]” and “Norm [abs.]”
fields should be repeated for each fraction and confirmed by clicking on
“New” in the “Method” section.
M
a
n
n
u
u
a
a
l
l
Before saving, take note of sections 8.2.9.3 – 8.2.9.8.
Once all the information has been entered, single-click the left mouse
button on “Save”. The method is now stored in the database and can be
activated at any time.
8.2.9.2. Create new position-dependent method
Methods with position-dependent fractions should always be chosen if the
appearance or absence of a fraction denotes a normal or pathological
condition. In contrast to the normal method, where the sequence of the
fractions is always identical, this entry offers a higher degree of flexibility.
A new method with position-dependent fractions is created as described
under 8.2.9.1. In addition to this information, the “RF” and “Tolerance”
fields are completed.
The “RF” field denotes the position at which a fraction always appears. The
% measure on the X-axis is made use of here (see illustrations in
8.2.1.4.1). From the example of the illustrated curve profiles, it can be seen
that the albumin fraction is always at the 10% position of the development
distance. This value, 10%, is entered in the “RF” field for the fraction
albumin. As the fraction albumin is not always found exactly at the 10%
position of the development distance, but can also be found at the 8% or
14% positions, an appropriate tolerance value should be entered in the
“Tolerance” field. If the value 5 is entered, for example, it means all
fractions that are within the range of 10% ± 5%, hence 5% - 15%, are
declared as albumin.
These entries are made for each fraction. Thus each fraction is correctly
named in the correct position, whether or not it actually appears.
58
Page 59
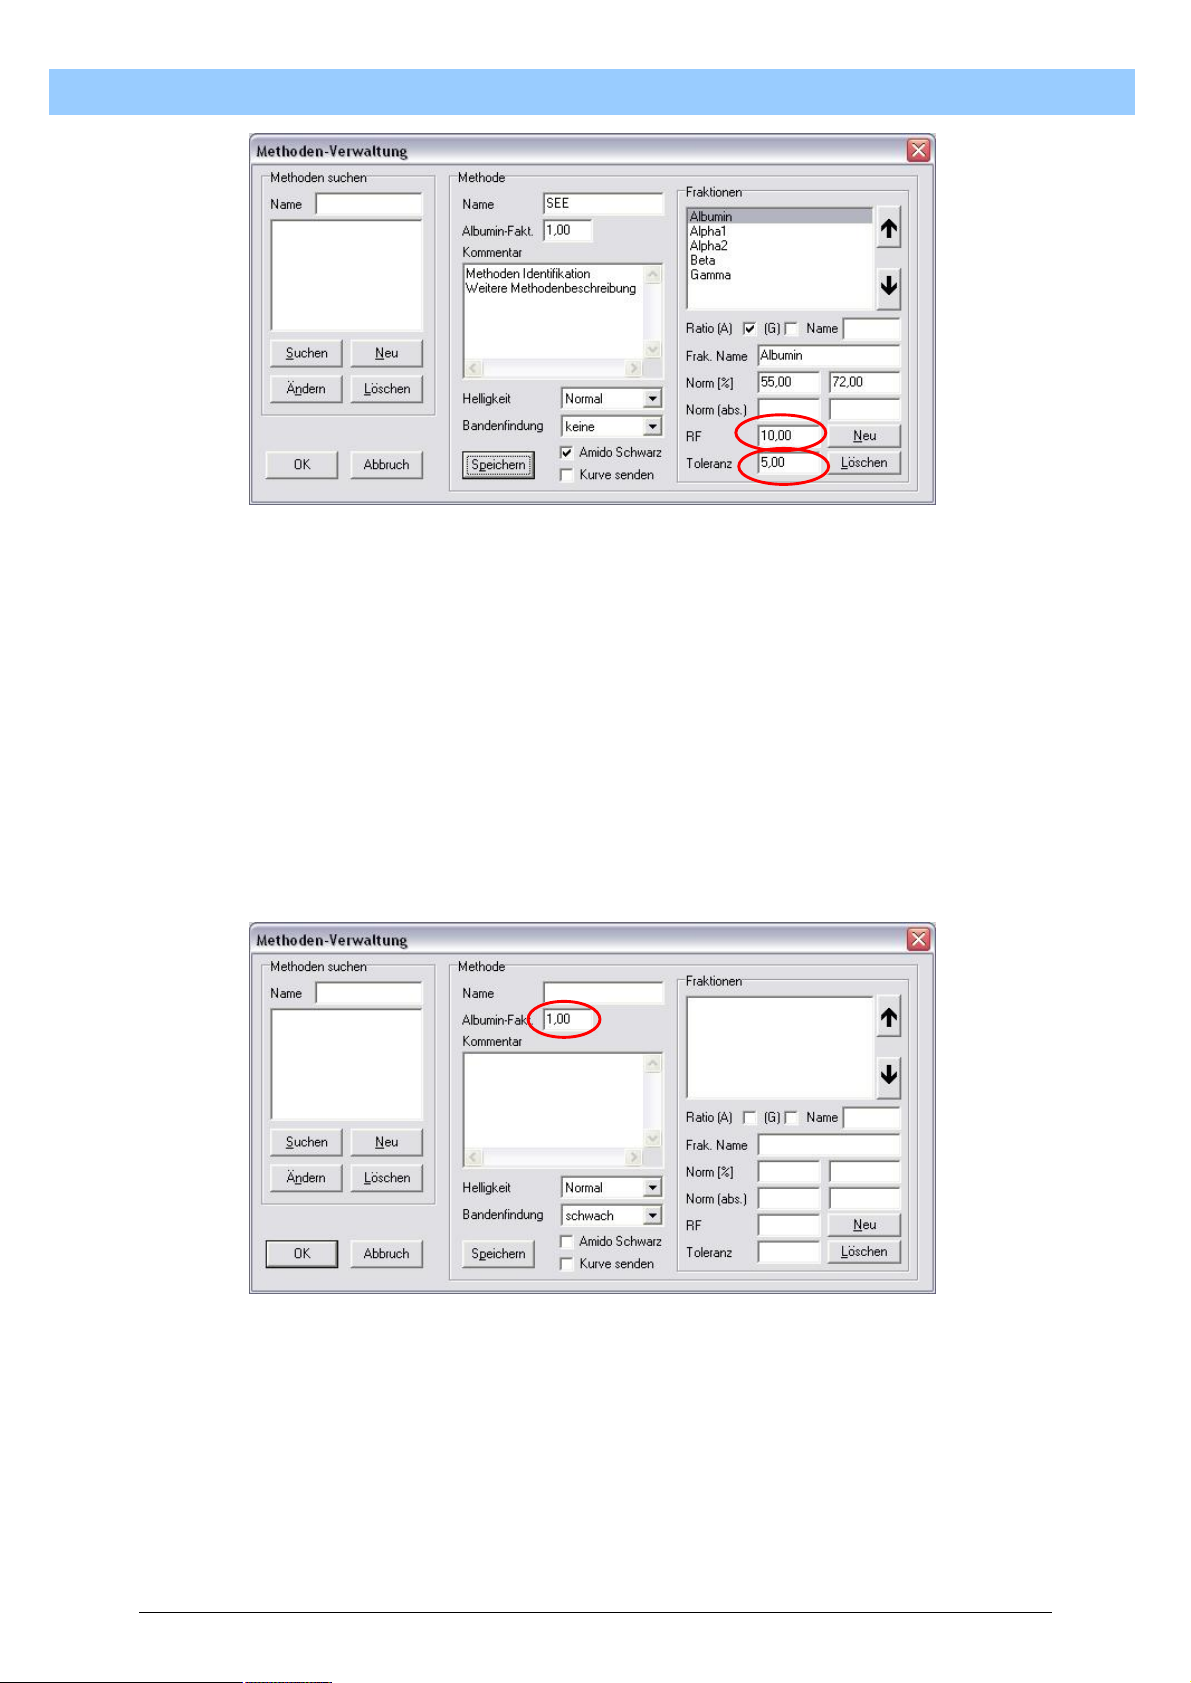
T
u
r
b
o
S
c
a
n
U
s
e
r
M
a
n
u
a
l
T
u
r
b
o
S
c
a
n
U
s
e
r
M
a
T
u
r
b
o
S
c
a
n
U
s
e
r
8.2.9.3. Albumin factor
The albumin correction factor originates from the early times of paper
electrophoresis. This made up for the fact that the maximum extinction of
the albumin band could not be determined. To compensate for this
shortcoming, a mathematical method was used to calculate the correct
ratio of albumin to globulins.
This factor is still used today for correction of the A/G ratio. The factor 1.00
stands for no correction. If the value is reduced, the ratio shifts in favour of
the globulins. If the value is increased, the ratio shifts in favour of albumin.
M
a
n
n
u
u
a
a
l
l
8.2.9.4. Brightness
Depending on the staining method and recording quality, there may be
fluctuations in the staining of the electrophoresis image recorded. If very
bright images are being recorded, the “Bright” setting should be selected.
Accordingly, the “Dark” setting should be selected for very dark images
with a lot of background. For standardized images, the setting should be
“Normal”.
Make the brightness selection by positioning the mouse pointer on the
small downward-pointing triangle and single-clicking the left mouse button.
59
Page 60
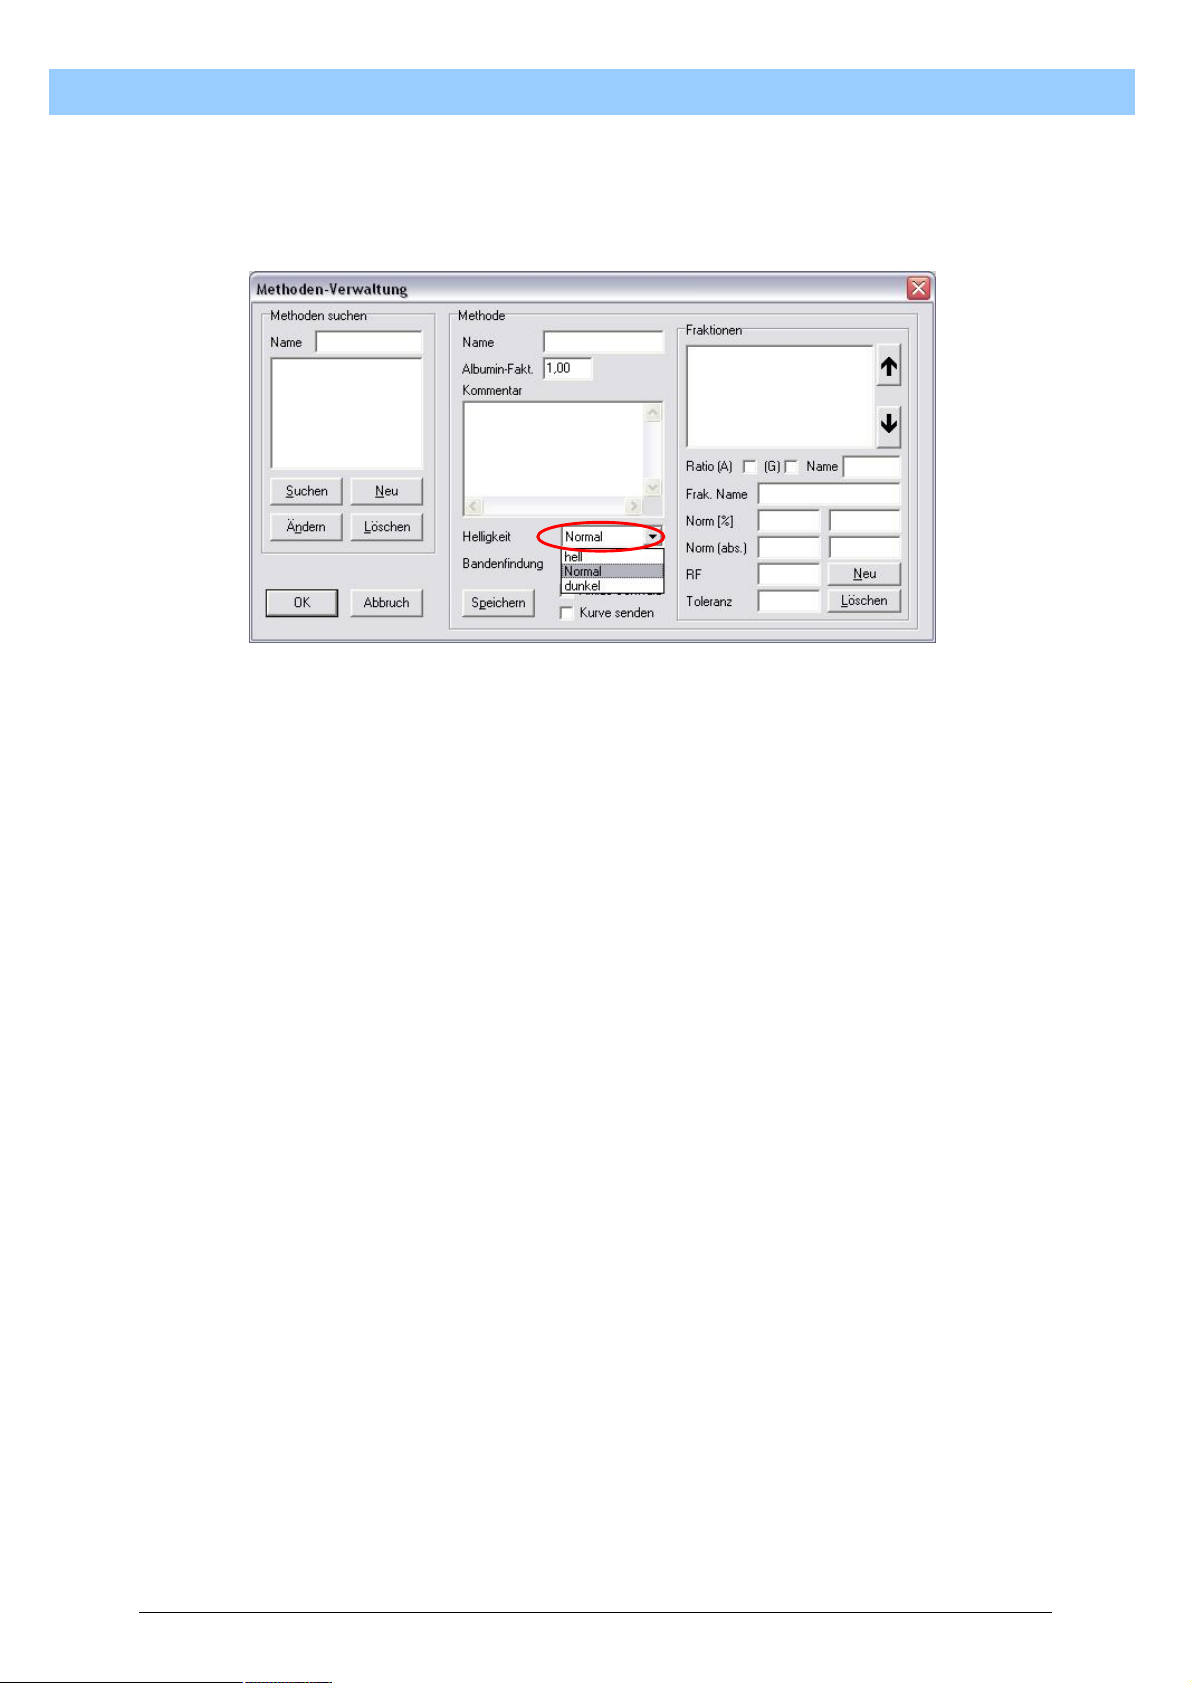
T
u
r
b
o
S
c
a
n
U
s
e
r
M
a
n
u
a
l
T
u
r
b
o
S
c
a
n
U
s
e
r
M
a
T
u
r
b
o
S
c
a
n
U
s
e
r
A popup window with the selection options Bright / Normal / Dark will now
open. Position the mouse pointer on the chosen option and single-click the
left mouse button. The setting is now pre-selected. To save this setting in
the database, finally single-click on “Save” with the left mouse button.
M
a
n
n
u
u
a
a
l
l
8.2.9.5. Band-finding
TurboScan offers the option of automatic band-finding. The advantage is
that a fairly large area is automatically cropped before the first fraction
appears. This means the first fraction to appear is always displayed at the
start of the curve profile. There are 3 selection options available: none /
weak / strong.
“None” should always be used for methods in which the first fraction may
not even appear. If automatic detection were carried out and the first
fraction were missing, the subsequent fraction would be erroneously
accepted as the first fraction. On the “none” setting, the whole input
scanning area is included in the curve profile unchanged.
The “weak” and “strong” settings merely denote the sensitivity of the
automatic band-finding. Barely visible fractions are recognized with the
“weak” setting. On the “strong” setting, the fraction must already be
strongly stained to be recognized as the first fraction. Any noise before the
fraction is ignored.
60
Page 61
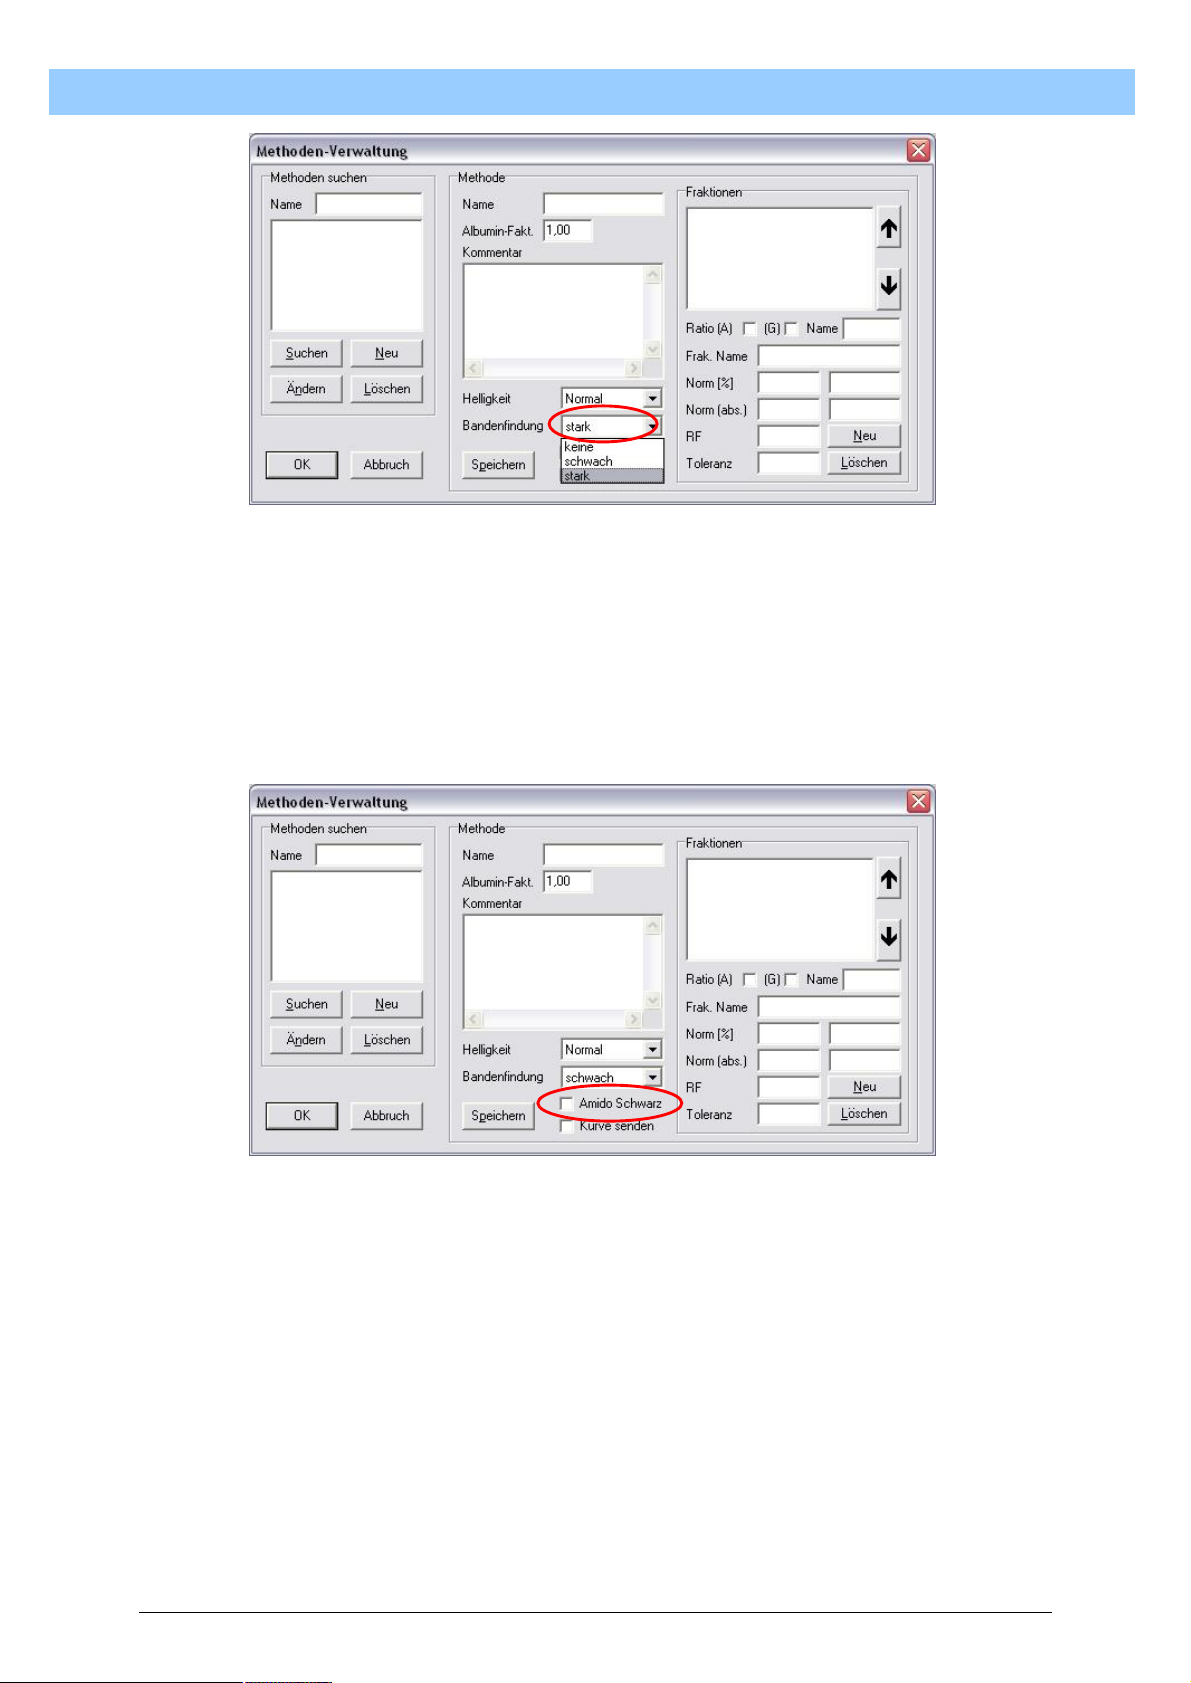
T
u
r
b
o
S
c
a
n
U
s
e
r
M
a
n
u
a
l
T
u
r
b
o
S
c
a
n
U
s
e
r
M
a
T
u
r
b
o
S
c
a
n
U
s
e
r
8.2.9.6. Amido Black
The “Amido Black” option is used to correct the background within the
track. If this box is not checked, no background correction will take place.
This is noticeable as an altered curve profile and hence altered data. On
the standard setting, “Amido Black” should be enabled.
M
a
n
n
u
u
a
a
l
l
8.2.9.7. Send curve
TurboScan offers as standard two protocols (see section 10. ff) for
transferring data by direct communication from workstation to host and
back. One protocol involves the transfer of patient data without curve
profile and the second protocol contains patient data with curve profile. If
“Send curve” is selected, the second protocol with curve profile is
automatically transmitted. If “Send curve” is not selected, no curve profile
will be transmitted.
Since the protocols differ considerably in structure, you should discuss
beforehand with your LIS supplier the extent to which the LIS is able to
process the data of curve profiles.
61
Page 62
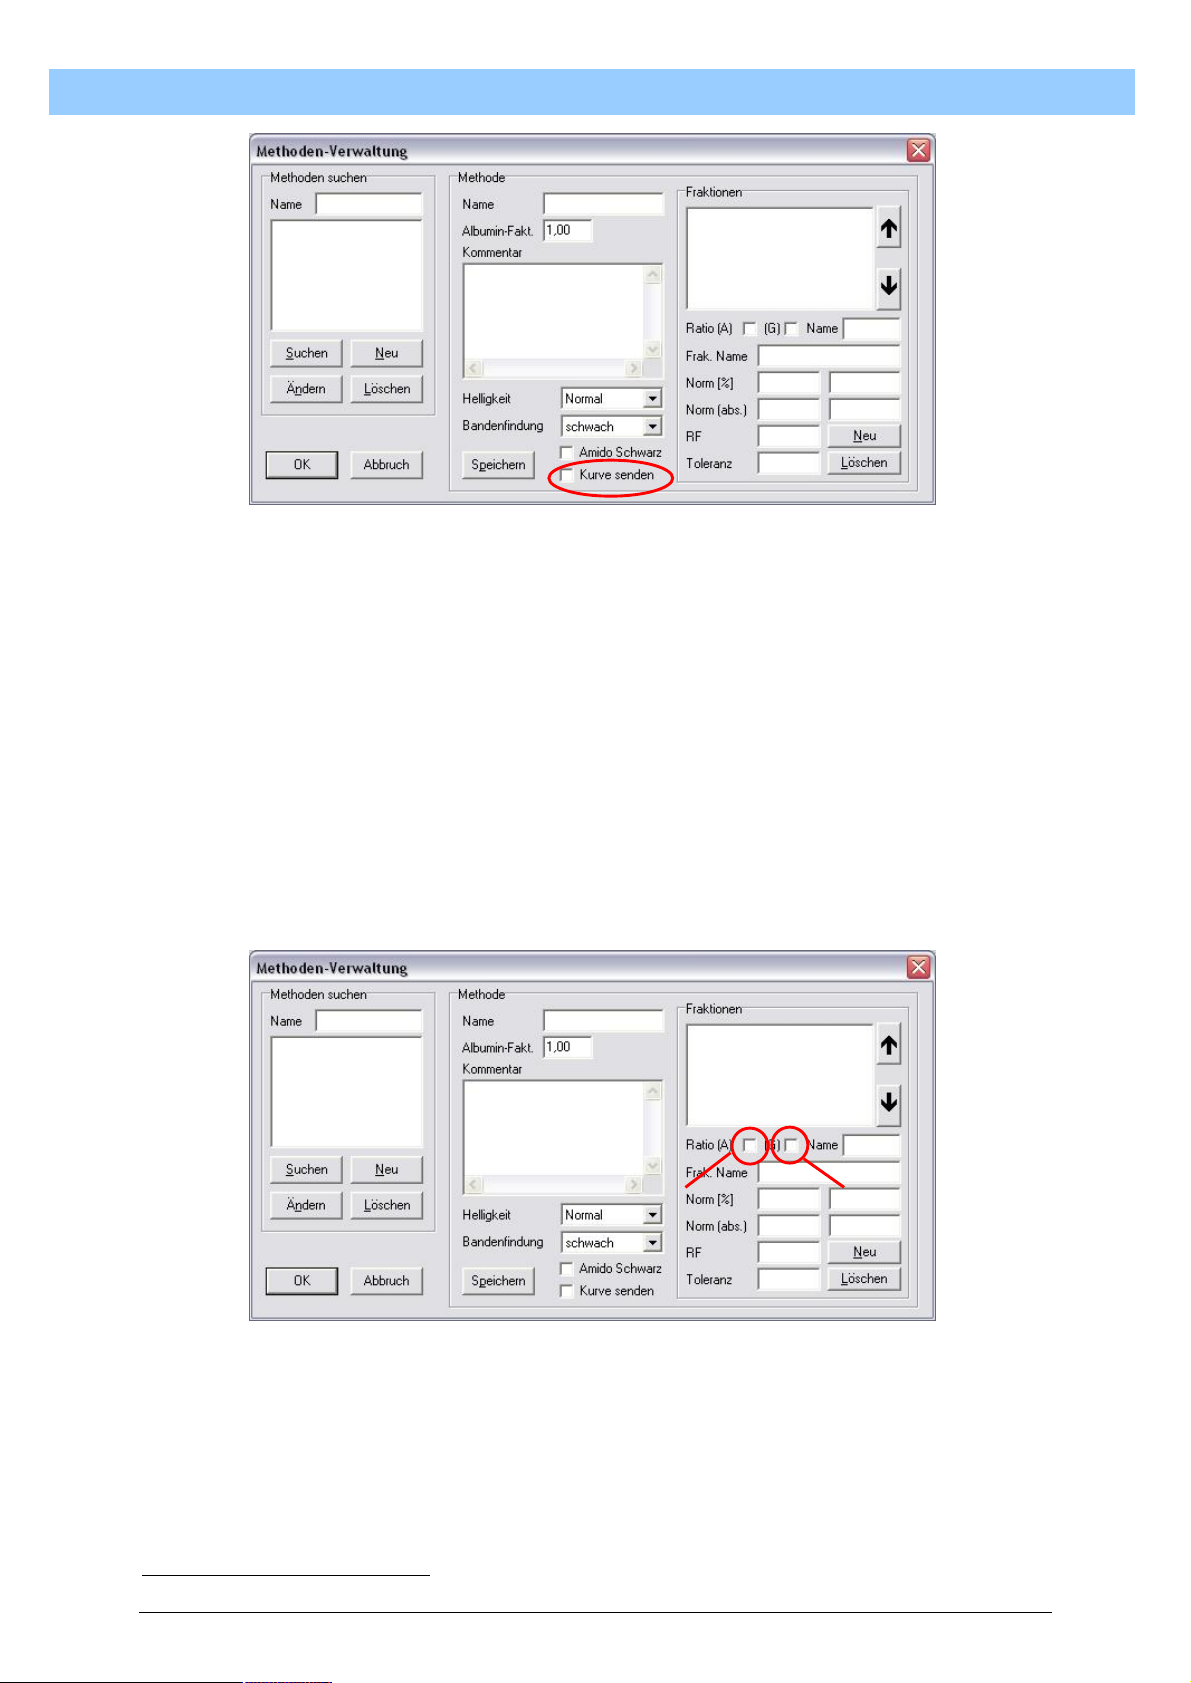
T
Dividend
u
r
b
o
S
c
a
n
U
s
e
r
M
a
n
u
a
l
T
u
r
b
o
S
c
a
n
U
s
e
r
M
a
T
u
r
b
o
S
c
a
n
U
s
e
r
8.2.9.8. A/G ratio
The A/G ratio denotes the relationship between the albumin and the
globulins for serum protein electrophoresis: purely mathematically, the
albumin is divided by the total of globulins. To achieve this, each fraction
(here based on the example of serum protein electrophoresis) has to be
defined as the dividend or divisor11. Albumin becomes the dividend and
globulins alpha1, alpha2, beta and gamma the divisor. The dividend is set
in the left-hand checkbox and the divisor on the right of the ratio section. It
is not absolutely essential to include all fractions in the calculation. For
instance, out of 3 fractions of lipoprotein fractions, only 2 might be
calculated for the ratio of LDL to HDL. The VLDL fraction would then be
ignored in the calculation.
M
a
n
n
u
u
a
a
l
l
Divisor
To make sure the printout of the calculation can be clearly assigned, the
ratio can be given a name in the “Name” entry field. For serum protein
electrophoresis, it is “A/G” which can be entered here.
11
Dividend stands above the fraction bar, the divisor below; the result is called the quotient.
62
Page 63
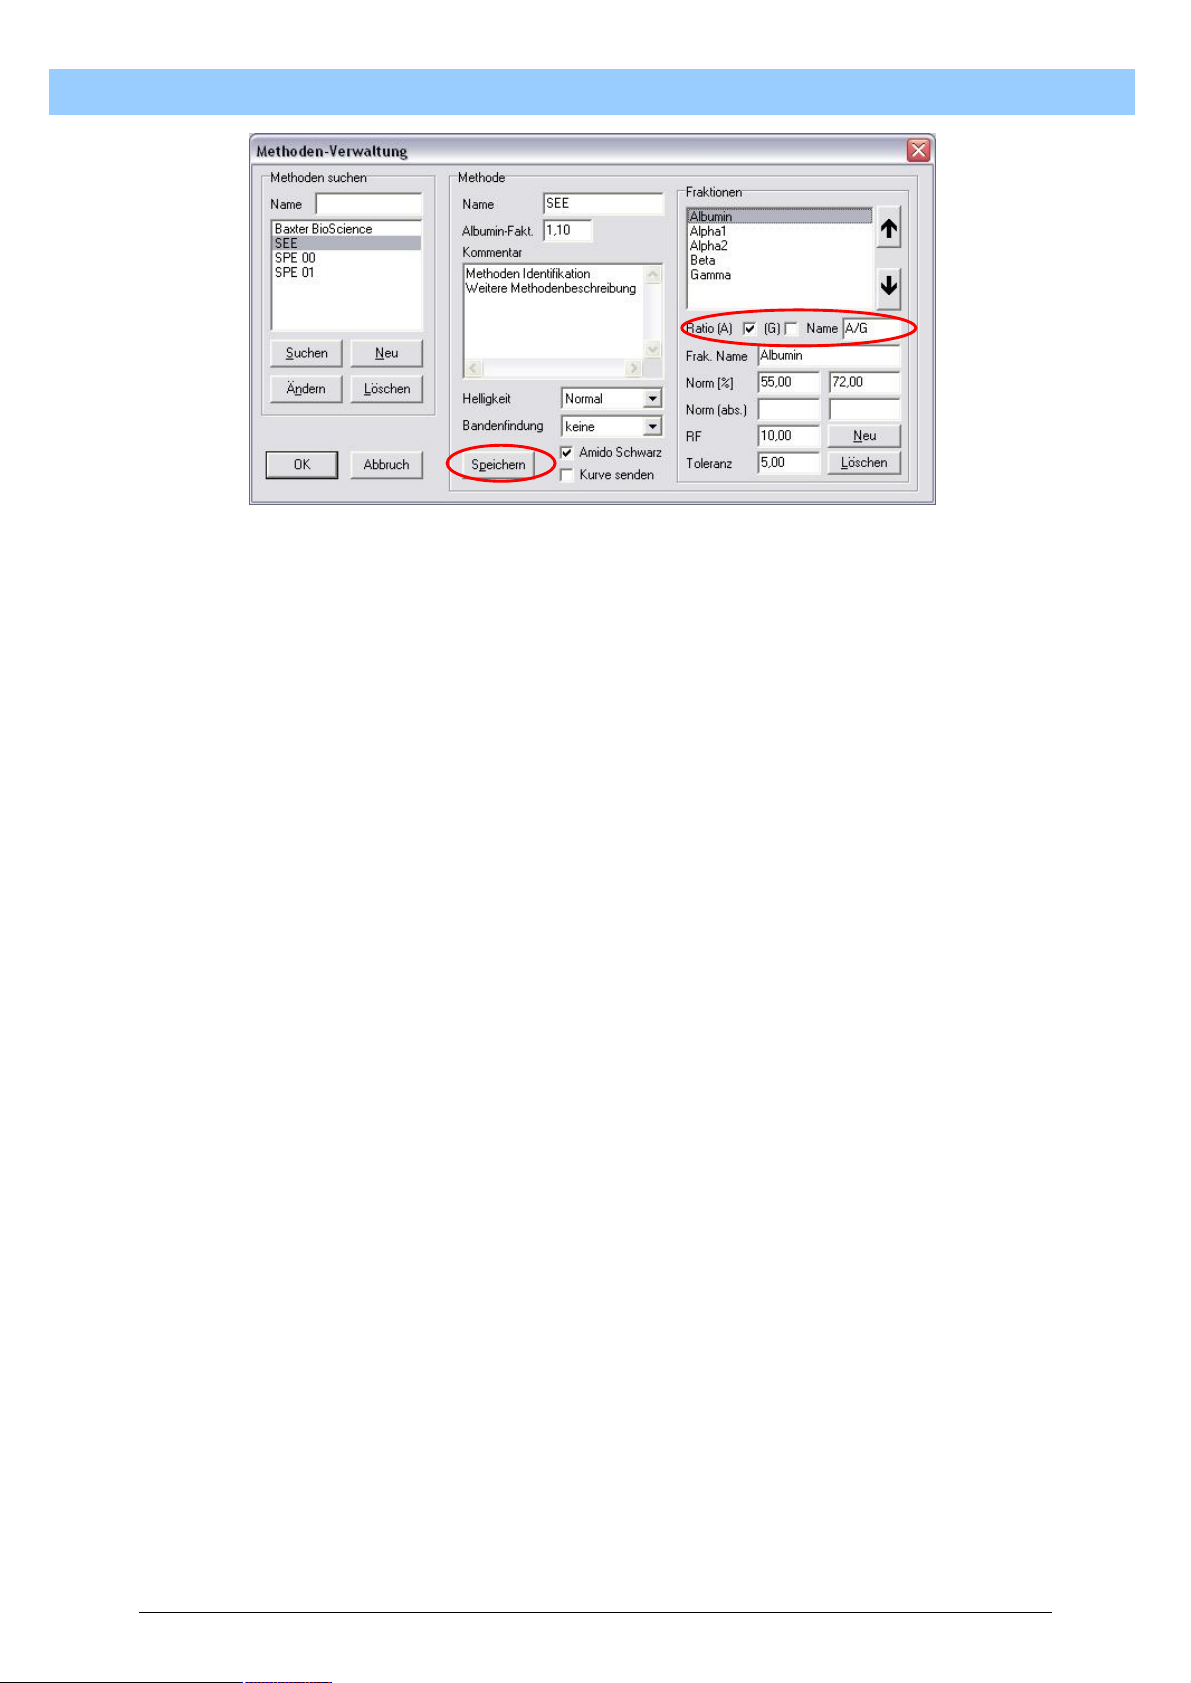
T
u
r
b
o
S
c
a
n
U
s
e
r
M
a
n
u
a
l
T
u
r
b
o
S
c
a
n
U
s
e
r
M
a
T
u
r
b
o
S
c
a
n
U
s
e
r
To activate the relevant field as the dividend or divisor, position the mouse
pointer on the appropriate field and single-click the mouse button. The box
now shows a checkmark. To enter the name, position the mouse pointer
on the Name entry field and single-click the left mouse button. Now enter
the description via the keyboard. To integrate the entry into the method,
single-click the left mouse button on “Save”.
M
a
n
n
u
u
a
a
l
l
8.2.9.9. Change method
The method is changed in the same way as creating a new method, except
that the individual fields already have a default value.
To select the method to be changed, position the mouse pointer on the
desired method and double-click the left mouse button. Enter the relevant
values for the selected method in the “Method” section. The current
method can now be altered as previously described in 8.2.9.1 ff. The
change can be saved via the “Change” button or directly via the “Save”
button.
8.2.9.10. Switch method
To switch from the current method, position the mouse pointer on the
method to be activated and singe-click the left mouse button. Confirm the
entry by single-clicking the left mouse button on “OK”. The method just
selected is active and is automatically loaded with the next startup of the
TurboScan program.
8.2.9.11. Delete method
To delete a method, position the mouse pointer on the method to be
deleted and single-click the left mouse button. Confirm the entry by singleclicking on “Delete” with the left mouse button. The method just selected is
deleted and can no longer be selected.
63
Page 64
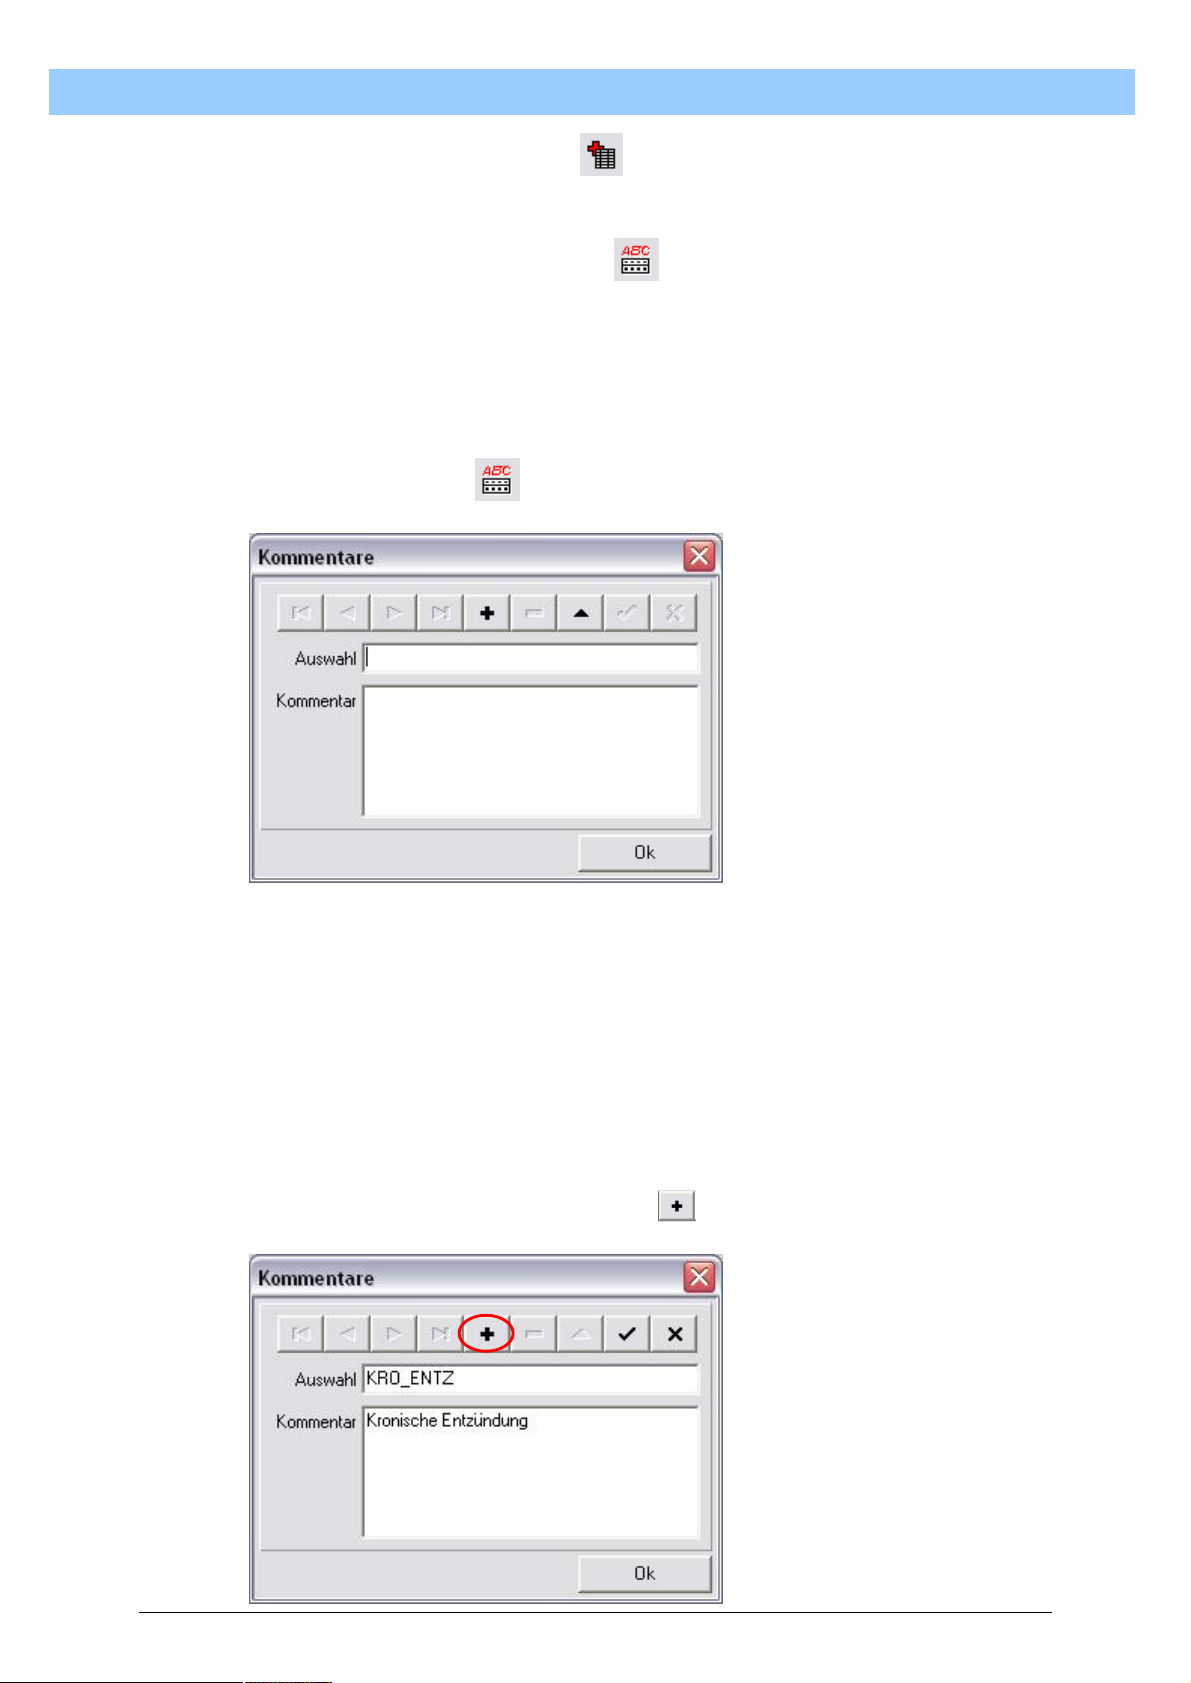
T
u
r
b
o
S
c
a
n
U
s
e
r
M
a
n
u
a
l
T
u
r
b
o
S
c
a
n
U
s
e
r
M
a
T
u
r
b
o
S
c
a
n
U
s
e
r
8.2.10. Patient Journal
See (8.2.1.5.1 ff.)
8.2.11. Comments Database
The Comments database helps to predefine comments on individual
electrophoreses that constantly recur. The comments entered here are
available for later output on the print form and are displayed in the
Comments field.
Open the dialogue window for processing comments by single-clicking the
left mouse button on .
M
a
n
n
u
u
a
a
l
l
8.2.11.1. Enter and save new comments
To add new comments to the database, you first need to enter a selection
ID code in the “Selection” field. To do this, position the mouse pointer on
the “Selection” entry field and single-click the left mouse button. You can
now enter the title of the comments. To enter the actual comments,
position the mouse pointer inside the “Comments” entry field and singleclick the left mouse button. You can now enter the actual comments. To
confirm the comments, single-click on with the left mouse button.
64
Page 65
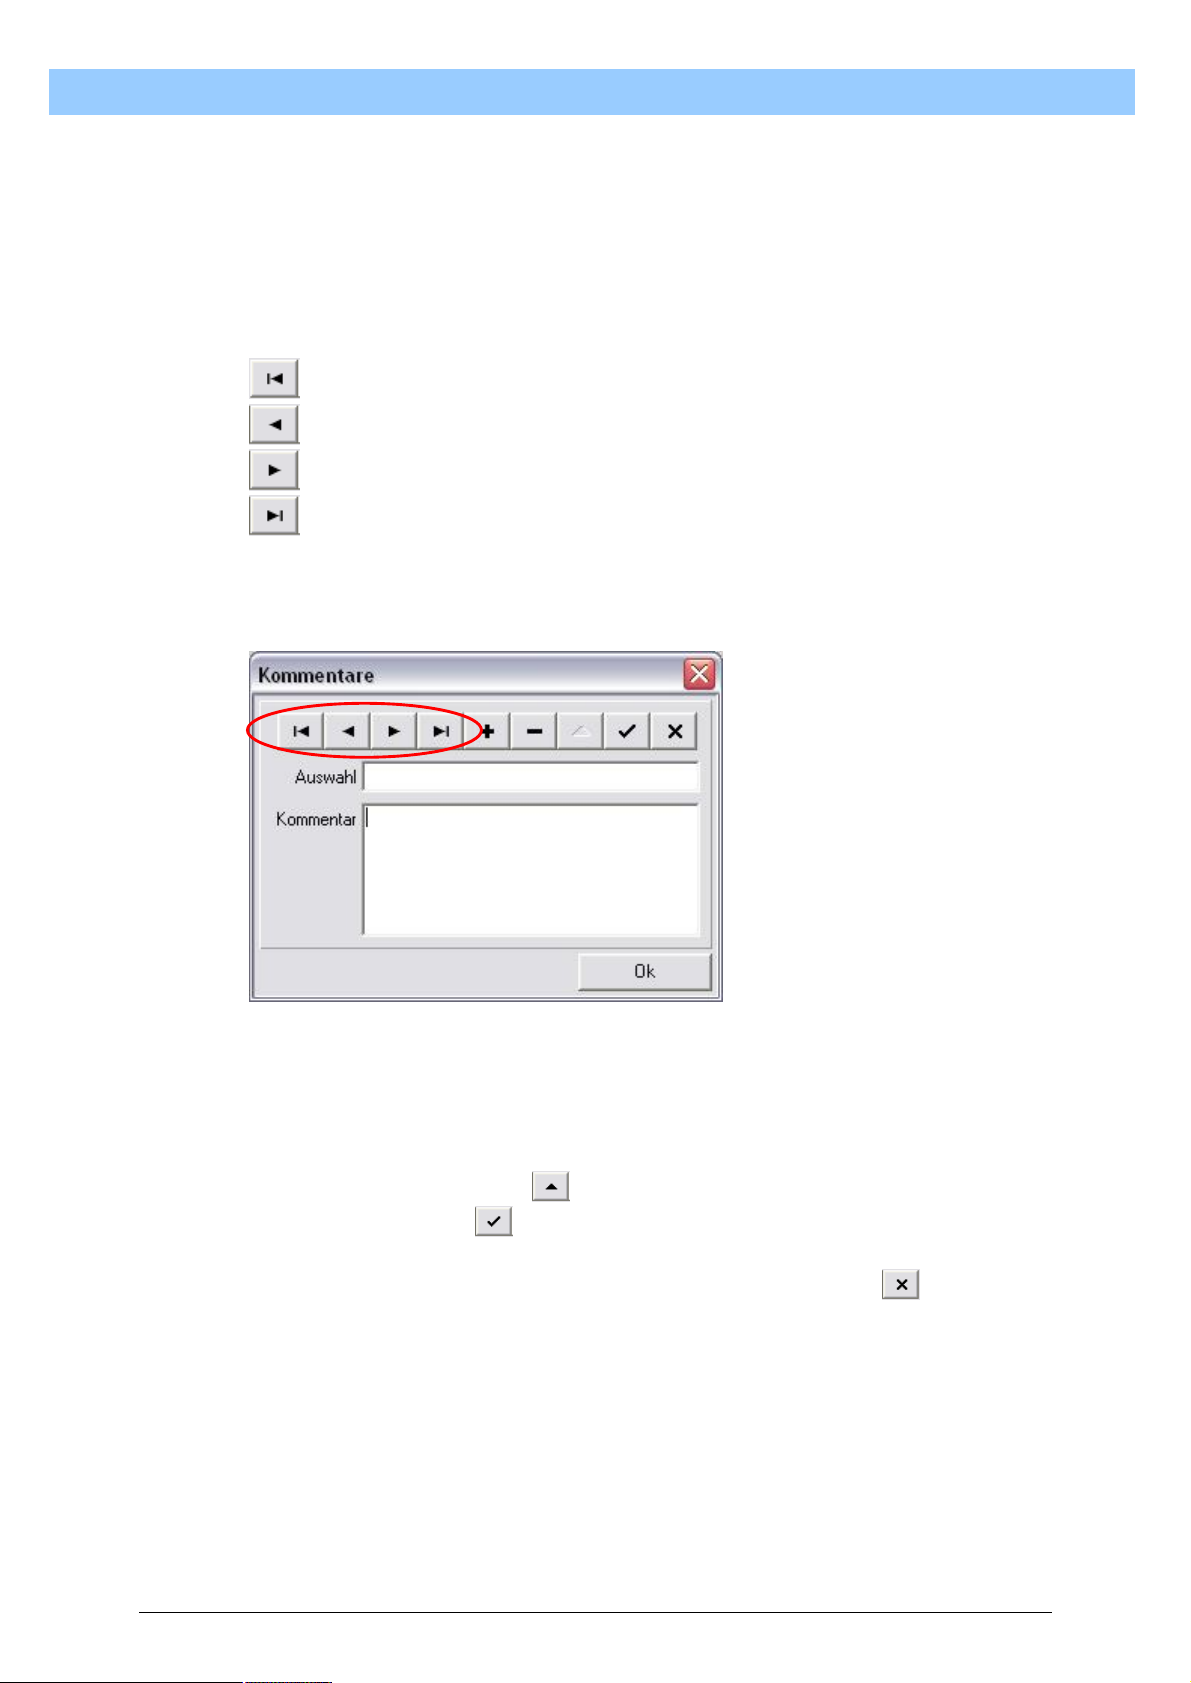
T
u
r
b
o
S
c
a
n
U
s
e
r
M
a
n
u
a
l
T
u
r
b
o
S
c
a
n
U
s
e
r
M
a
T
u
r
b
o
S
c
a
n
U
s
e
r
8.2.11.2. Select comments
If there are several comments in the database, these can be displayed
individually via the navigation buttons. The following functions are available
for navigation:
skip to first data record
skip to previous data record
skip to next data record
skip to last data record
The current data record is displayed with its ID code in the Selection field
and with the comments text in the “Comments” field.
M
a
n
n
u
u
a
a
l
l
8.2.11.3. Change comments
Comments can be altered directly via the display in the “Comments” field
or by first clicking on the button. To accept changes, single-click the
left mouse button on .
Corrections that have not yet been accepted with the confirmation button,
can be reversed by single-clicking the left mouse button on .
65
Page 66
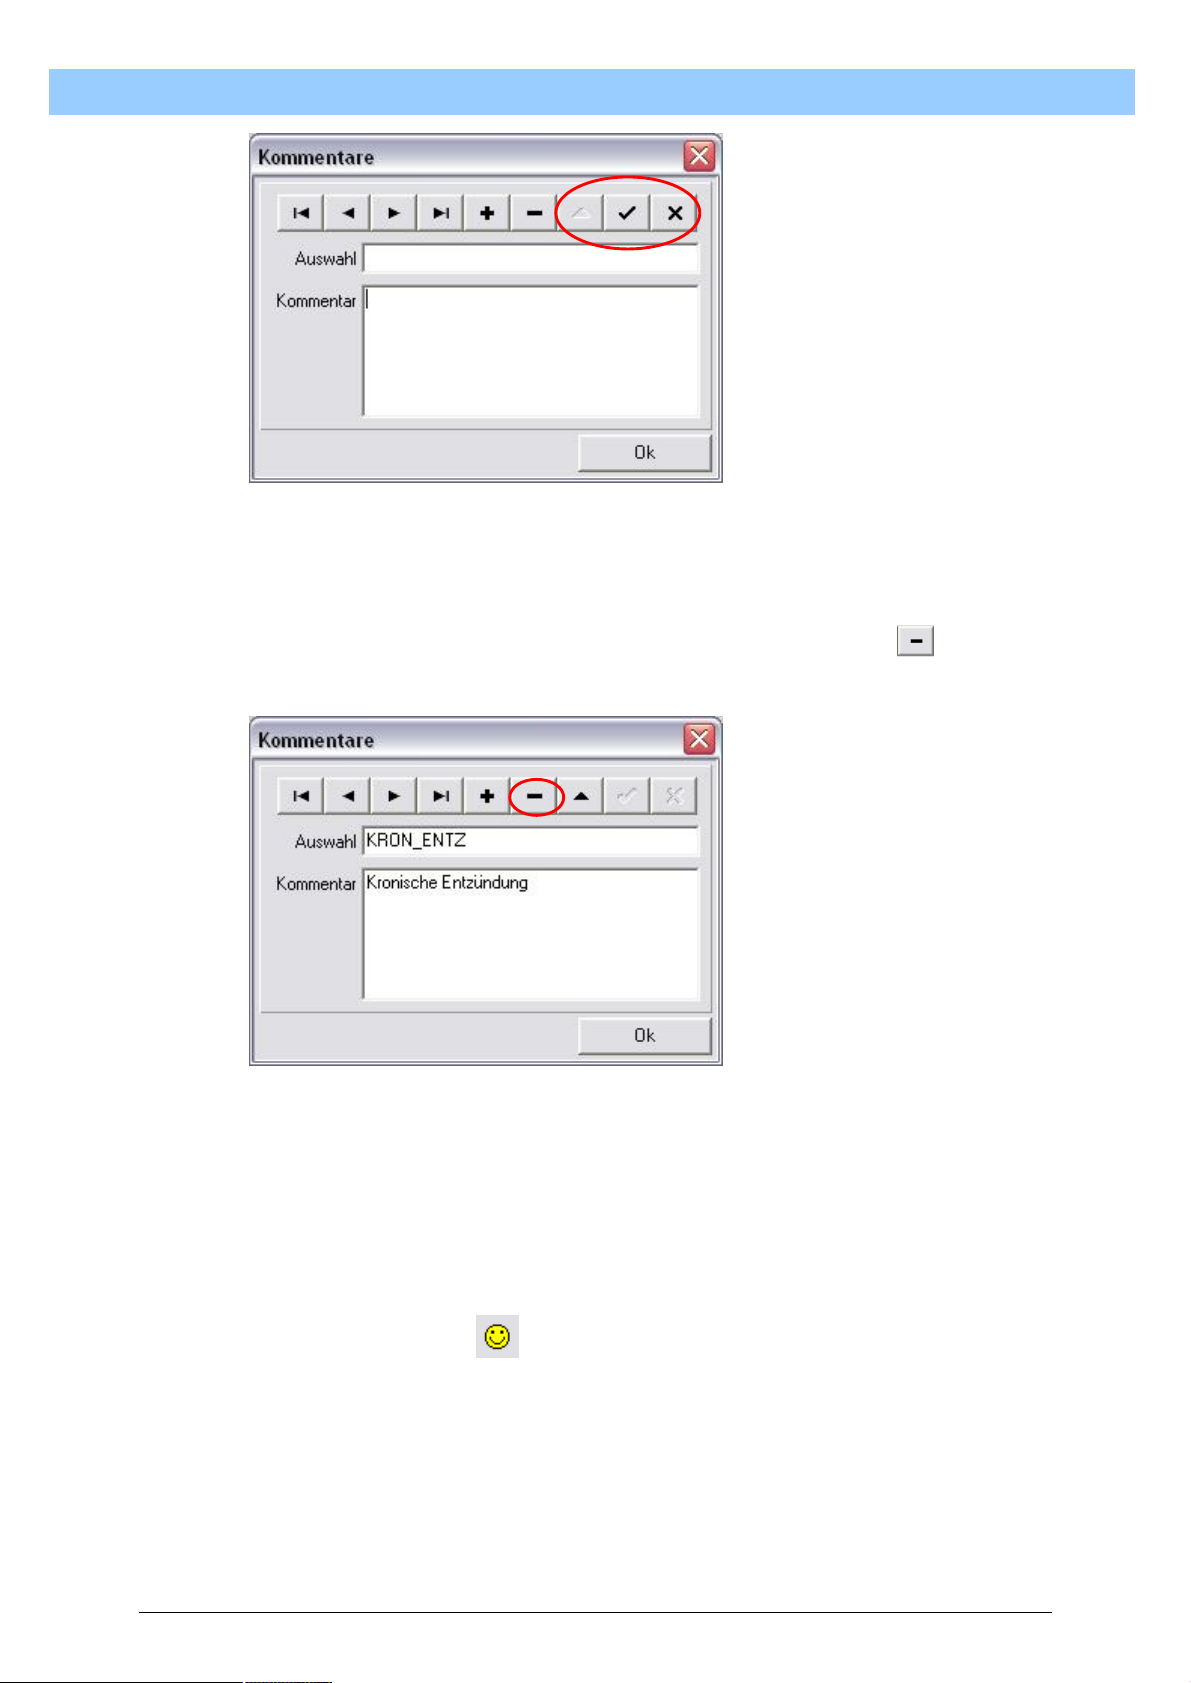
T
u
r
b
o
S
c
a
n
U
s
e
r
M
a
n
u
a
l
T
u
r
b
o
S
c
a
n
U
s
e
r
M
a
T
u
r
b
o
S
c
a
n
U
s
e
r
8.2.11.4. Delete comments
To delete a comment, select the data record to be deleted using the
navigation buttons. Single-clicking the left mouse button on will delete
the current data record from the database.
M
a
n
n
u
u
a
a
l
l
8.2.11.5. Closing Enter Comments
Enter Comments is closed by single-clicking the left mouse button on “OK“.
The window for managing comments closes.
8.2.12. User Data
Entering User Data helps to identify the printout. The data given in User
Data are displayed in the header of each report.
66
Page 67
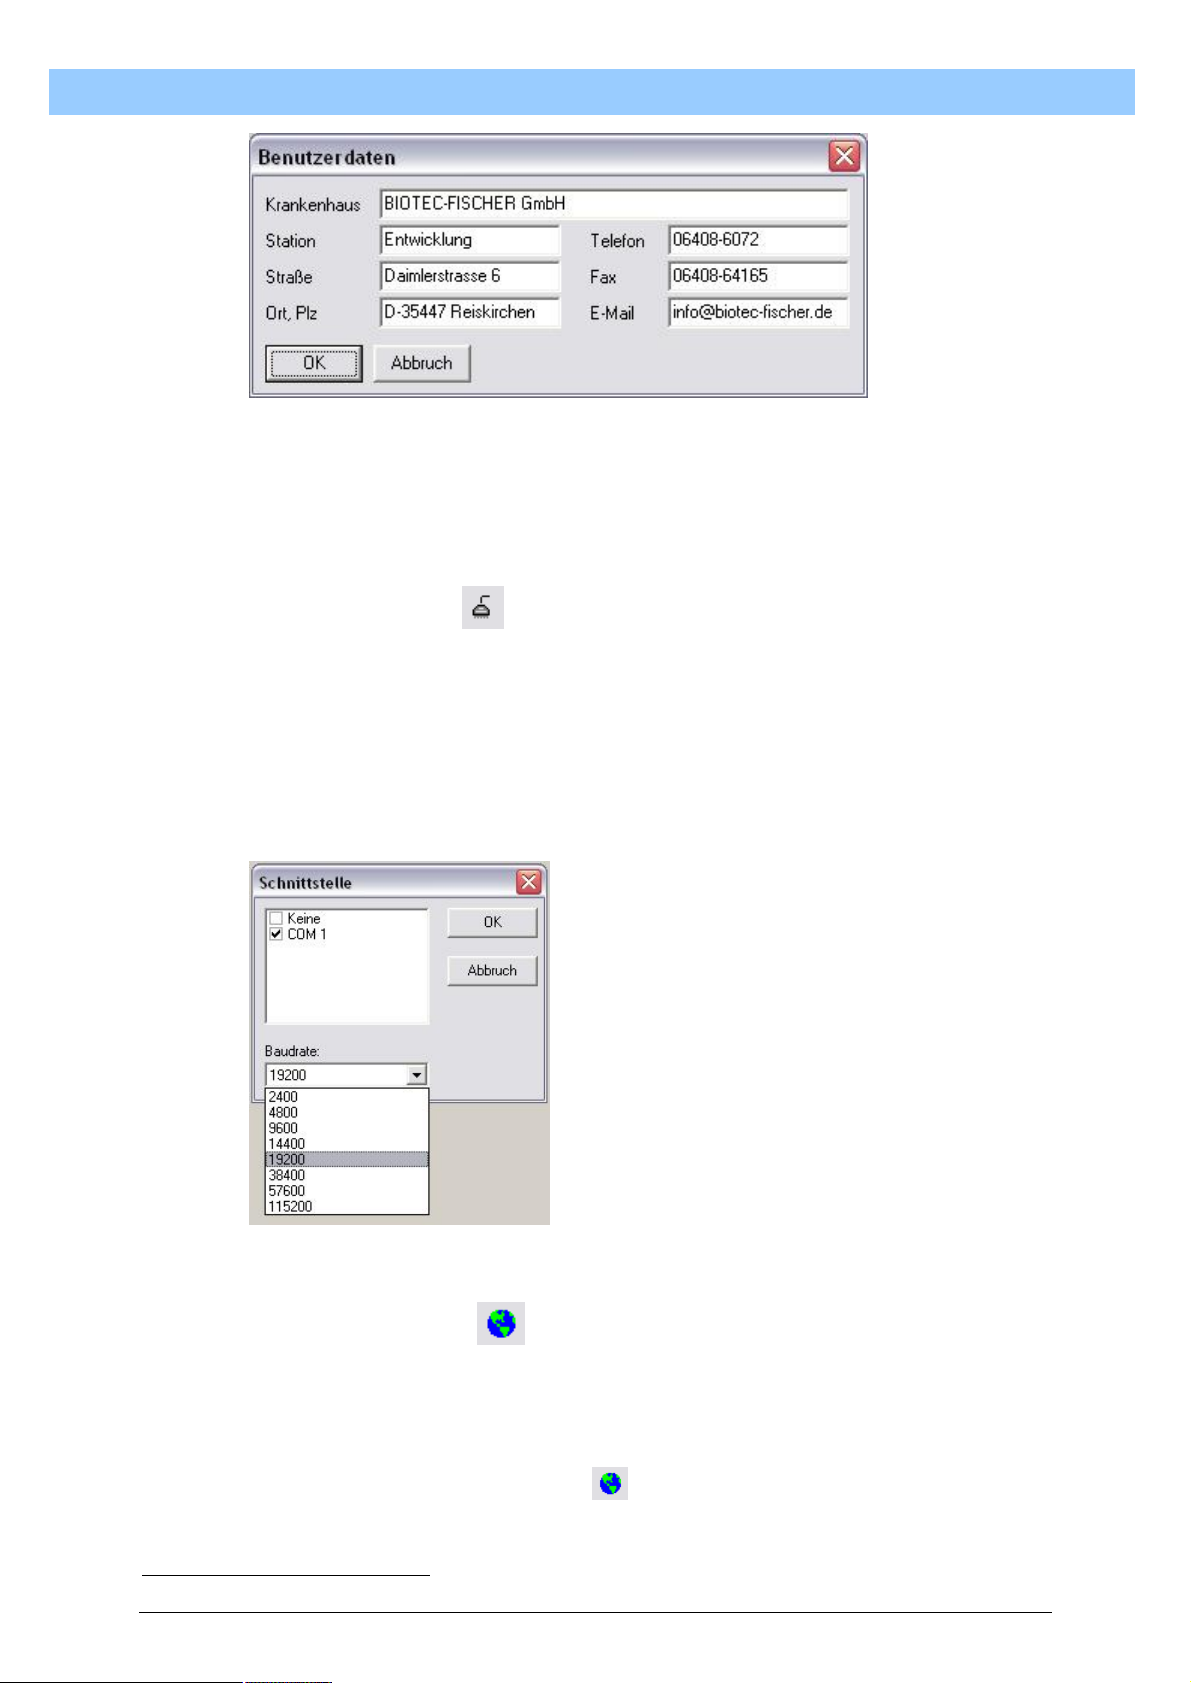
T
As a
serial interface is provided for data
transfer, the transfer rate is limited to the
down menu. The
usual transfer speed is 9600. However, a
higher data transfer rate should not pose
any problems for TurboScan. A
of up to 115200 baud
u
r
b
o
S
c
a
n
U
s
e
r
M
a
n
u
a
l
T
u
r
b
o
S
c
a
n
U
s
e
r
M
a
T
u
r
b
o
S
c
a
n
U
s
e
r
To enter data, position the mouse pointer on the “Hospital” entry field and
single-click the left mouse button. The entry can now be made via the
keyboard. To skip to the next field, press the “Tab” key12 on the keyboard.
Confirm the entry by single-clicking the left mouse button on “OK”.
8.2.13. Interface
The interface is used for direct communication with an external HOST PC.
So that the systems are able to communicate with each other, the
workstation interface and the speed of data transfer must first be
established. The speed of data transfer should be agreed beforehand with
the LIS manufacturer. The workstation interface to be used will depend on
the hardware being used.
M
a
n
n
u
u
a
a
l
l
values given in the drop-
transmission speed
has been tested.
8.2.14. Language
TurboScan is sold worldwide. In order to guarantee the greatest possible
service and usability, all the texts and messages have been translated into
several different languages. To select the appropriate language, single-
click the left mouse button on . This opens the window for language
12
The key on the left of the keyboard with two arrows pointing in opposite directions
67
Page 68
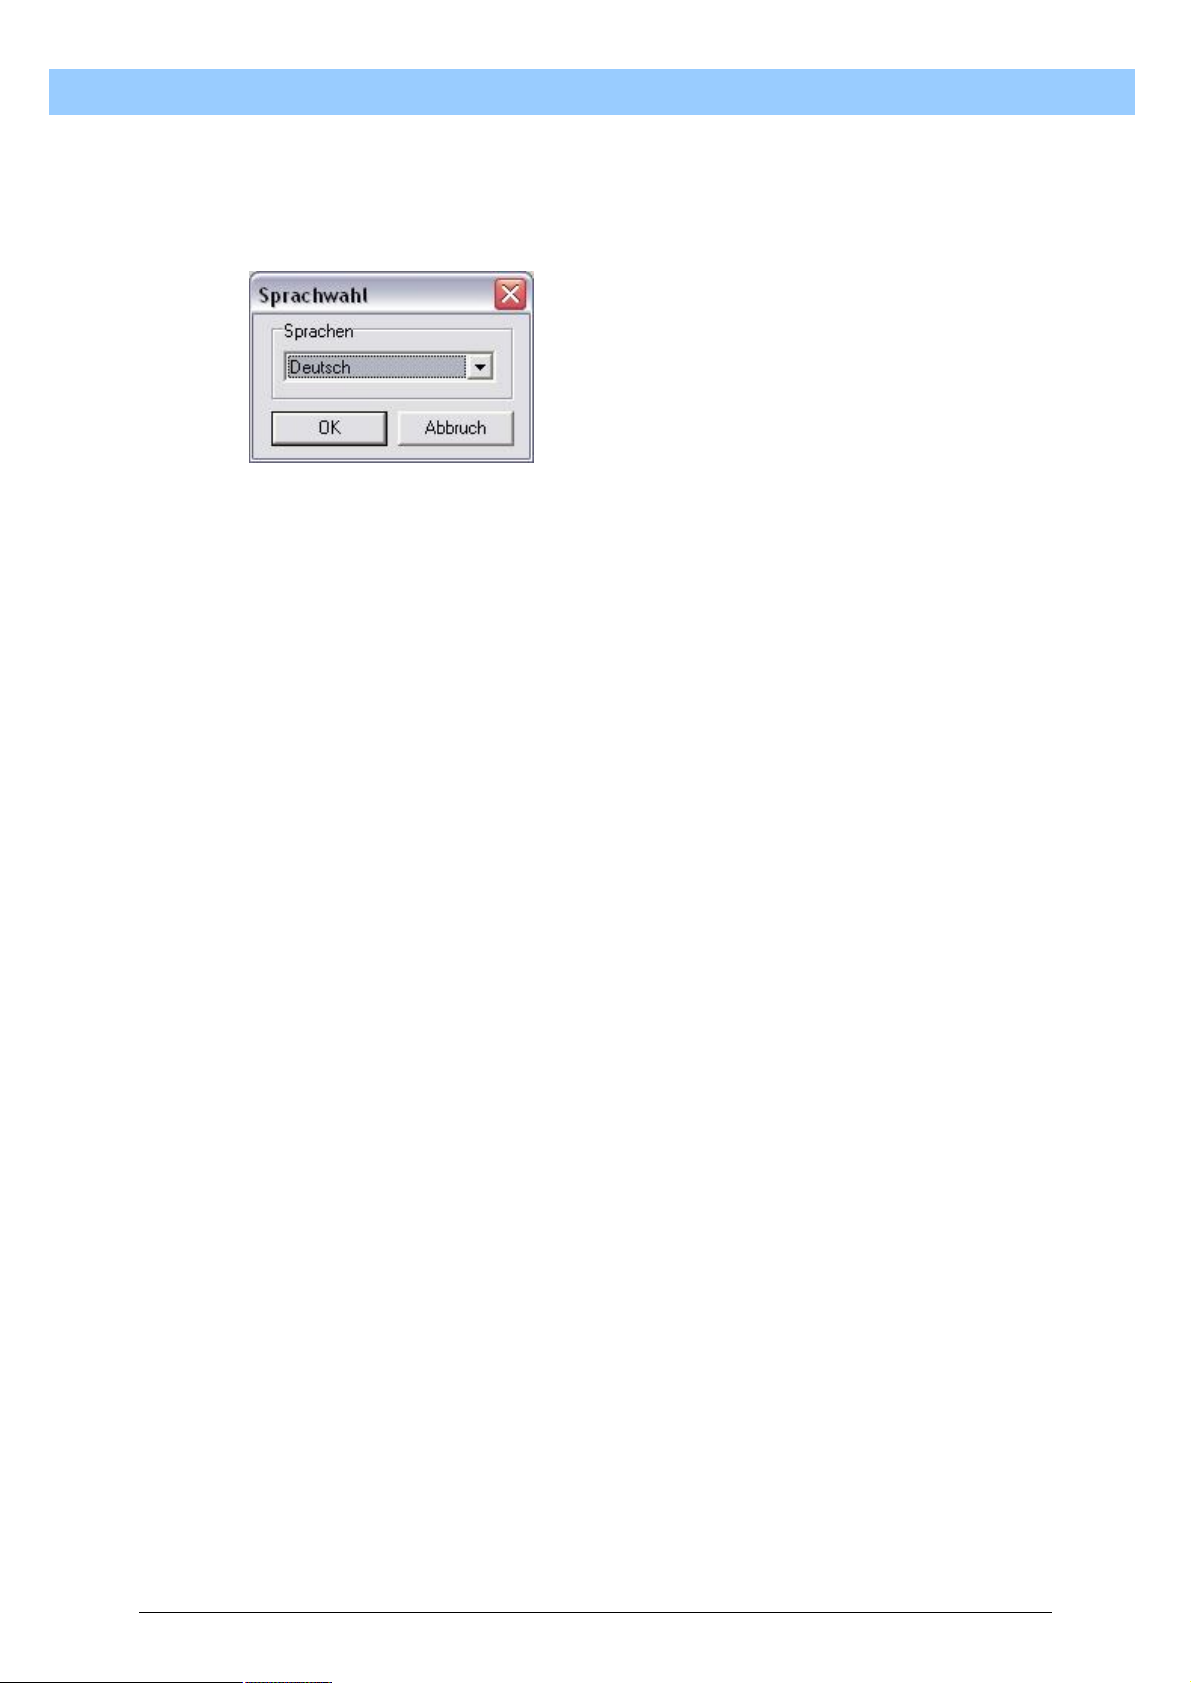
T
u
r
b
o
S
c
a
n
U
s
e
r
M
a
n
u
a
l
T
u
r
b
o
S
c
a
n
U
s
e
r
M
a
T
u
r
b
o
S
c
a
n
U
s
e
r
selection. You can directly change the operating language of TurboScan
by opening the drop-down menu and selecting the language
No guarantee can be given that languages written with non-Latin letters will
function perfectly.
M
a
n
n
u
u
a
a
l
l
68
Page 69

T
u
r
b
o
S
T
u
r
u
b
r
b
T
9. Routine program run
The routine program run is intended to show how to handle TurboScan
during normal operation. This does not include a description of the
individual menu items. It is assumed that TurboScan has already been
started and the Welcome image is appearing on the screen.
1. Place objects in the flatbed scanner
2. Press the “SCAN“ button
3. Press the “TWAIN” button
4. Press “Scan” in the TWAIN window
5. Confirm the image with “OK”
6. Press “Acquire mask”
7. Pull frame around the electrophoresis
8. Confirm with “OK”
9. Press the “Analyse” button
10. Double-click on a curve profile in the summary window
11. Correct the minimum marks, if necessary
12. Accept corrections with “OK”
13. Press “Patient data”
14. Enter the patient data
15. Confirm the patient data with “OK”
16. Press the “Print” button
17. Press the “Print” button in the summary window
18. Start Print Jobs by pressing “OK”
19. Close the Print Preview window
20. Press “Exit” in the summary window
o
o
S
S
c
c
c
a
a
a
n
n
n
U
U
U
s
e
r
M
a
n
u
a
l
s
e
r
M
a
s
e
r
M
a
n
n
u
u
a
a
l
l
69
Page 70

T
u
r
b
o
S
c
a
n
U
T
u
r
b
o
S
c
a
T
u
r
b
o
S
10. TurboScan communication
10.1. Conventions
Data transfer takes place in two directions: patient data are transferred
from the host to the PC; analysis data are sent back from the PC. In each
case, a communication process is initiated by the PC, the host is
constantly on stand-by.
A communication process is initiated by the PC sending a defined byte to
the host and the host then sending the appropriate response. All user data
are sent as ASCII characters.
The following parameters are used for serial communication:
l baud rate 2400 - 115200
l 8 data bits
l no parity
l 1 stopbit
Date format
A date is always transmitted without date separators but with leading
zeros; the set sequence for date information is DDMMYYYY. This means
that each side can work with whichever date separator is applicable,
without influencing the other side.
Examples:
Sender Sent
01.03.2007 01032007
1.3.07 01032007
1 March 07 01032007
3/1/2007 01032007
Format for floating-point values
Numerical values, e.g. for the information ‘Total Protein’ of a patient, are
always multiplied by 1000 on the sender’s side and the numerical value (as
an ASCII sequence) is then sent without decimal separators. The recipient
side converts the received ASCII sequence into a numerical value and
divides it again by 1000. This means that each side can work with
whichever decimal separator is applicable without influencing the other
side.
Examples:
Sender Sent
10.362 10362
0.023 23
42 42000
c
a
n
n
U
U
s
s
s
e
e
e
r
M
a
n
u
a
l
r
M
a
M
a
n
n
r
u
u
a
a
l
l
70
Page 71

T
u
r
b
o
S
c
a
n
U
s
T
u
r
b
o
S
c
a
n
T
u
r
b
o
S
c
Sex
The sex of a patient is transmitted as 1 character. Only the following are
permitted:
m/M male
f/F female
blank or x/X sex not known
10.2. ASCII data transfer by file
10.2.1. Import file (host to TurboScan)
ASCII file, 1 patient per line, all fields separated by tabulator (ASCII 9),
each line closed with <CR><LF>. Blank lines within the file are ignored.
<ID> Tab <NAME> Tab <DateBirth> Tab <PROTEIN> Tab <DEPT> Tab
<SEX> <CR><LF>
The date of birth is given in the format DDMMYYYY (no date separators).
The ‘Protein’ figure is multiplied by 1000 by the host, then divided by 1000
again when input (no decimal separators).
The following characters are permitted for indicating the patient’s sex:
<F> = female,
<M> = male,
<> = undefined
a
n
U
U
e
s
e
s
e
r
M
a
n
u
a
l
r
M
a
M
a
n
n
r
u
u
a
a
l
l
10.2.2. Export file (TurboScan to host)
ASCII file, 1 sample per line, all fields separated by tabulator (ASCII 9),
each line closed with <CR><LF>.
Samples to which no patient is assigned are not exported.
<Patient ID> Tab <No. fractions> Tab
for each fraction the following fields:
<Fraction name> Tab <Fraction percentage> Tab
<Method name>
The ‘Fraction percentage’ number is multiplied by 1000 by the PC and
stored in the file without decimal separators. The host has to divide this
figure by 1000 again to reach the percentage figure again.
71
Page 72

T
u
r
b
o
S
c
a
n
U
s
e
r
T
u
r
b
o
S
c
a
n
U
T
u
r
b
o
S
c
a
n
10.3. Data transfer without curve data
10.3.1. Data transfer host to TurboScan
The patient data for the current work list are transferred, the sequence of
the data records matching the sequence of the patients in the work list.
PC: [ENQ] (request byte)
HOST: [ACK] (start data transfer)
[STX] - data record - [ETX]
[STX] - data record - [ETX]
...
[STX] - data record - [ETX]
[EOT] (end data transfer)
The structure of a single data record (per patient) is as follows:
[STX] Patient ID [LF]
Patient name [LF]
Date of birth (see above for format) [LF]
Protein (see above for format) [LF]
Department [LF]
Sex (see above for format)
[ETX]
On the PC a report is issued each time (data received error-free / with
errors).
If the data are correctly received at the PC, the data are automatically
assigned to the samples in the correct sequence.
NOTE:
The upper limit of 50,000 characters applies to transfer from host to PC.
U
s
s
e
e
M
r
M
r
M
a
a
a
n
n
n
u
u
u
a
a
a
l
l
l
10.3.2. Data transfer TurboScan to host
Once the data received from the host are assigned to the individual
samples and the samples have been re-corrected (if necessary), the
analysis results can be sent back from the PC to the host.
PC: [SOH] (request byte)
HOST: [ACK] (signals readiness)
PC: [ACK] (start data transfer)
[STX] - data record - [ETX]
[STX] - data record - [ETX]
...
[STX] - data record - [ETX]
[EOT] (end data transfer)
HOST: [ACK]/[NAK] (acknowledgement byte positive /
negative acknowledgement)
72
Page 73

T
u
r
b
o
S
c
a
n
U
s
e
T
u
r
b
o
S
c
a
n
T
u
r
b
o
S
c
The structure of a single data record (per sample) is as follows:
[STX] Patient ID [LF]
Number of fractions (without multiplication by 1000!) [LF]
for each fraction the following data:
Name of fraction [LF]
calculated value for fraction (see above for format) [LF]
Method name [ETX]
On the PC, once transmission is completed, a report is issued on whether
the transmission was positively or negatively acknowledged by the host.
NOTE:
The upper limit of 50,000 characters applies to transfer from PC to host.
Data on samples to which a patient has not yet been assigned on the PC
will not be sent back to the host because these data cannot be assigned
by the host.
10.4. Data transfer with curve data
a
n
U
U
r
s
e
r
s
e
r
M
M
M
a
a
a
n
n
n
u
u
u
a
a
a
l
l
l
10.4.1. Data transfer host to TurboScan
10.4.2. Data transfer TurboScan to host
Once the data received by the host have been assigned to the individual
samples and the samples have been re-corrected (if necessary), the
analysis results can be sent back from the PC to the host.
PC: [SOH] (request byte)
HOST: [ACK] (signals readiness)
PC: [ACK] (start data transfer)
[STX] - data record - [ETX]
HOST: [ACK]
PC: [STX] - data record - [ETX]
HOST: [ACK]
PC: [STX] - data record - [ETX]
HOST: [ACK]
....
HOST: [ACK]
PC: [EOT] (end data transfer)
HOST: [ACK]/[NAK] (acknowledgement byte positive /
negative acknowledgement)
The structure of a single data record (per sample) is as follows:
[STX] Patient ID [LF]
Number of fractions (without multiplication by 1000!) [LF]
for each fraction the following data: Name of fraction [LF]
Method name [LF]
for each fraction the following data: calculated value of fraction
(multiplied by 1000) [LF]
Number of minimum marks [LF]
73
Page 74

T
u
r
b
o
S
c
a
n
U
s
e
r
M
a
n
u
a
l
T
u
r
b
o
S
c
a
n
U
s
e
r
M
a
T
u
r
b
o
S
c
a
n
U
s
e
r
per minimum mark minimum mark position (X-values) [LF]
Number of measuring points (number of X-values) [LF]
per X-value measuring point (Y-values) (multiplied by 1000) [LF]
[ETX]
On the PC, once transmission is completed, a report is issued on whether
the transmission was positively or negatively acknowledged by the host.
NOTE:
Data on samples to which a patient has not yet been assigned on the PC
will not be sent back to the host because these data cannot be assigned
by the host.
M
a
n
n
u
u
a
a
l
l
74
Page 75
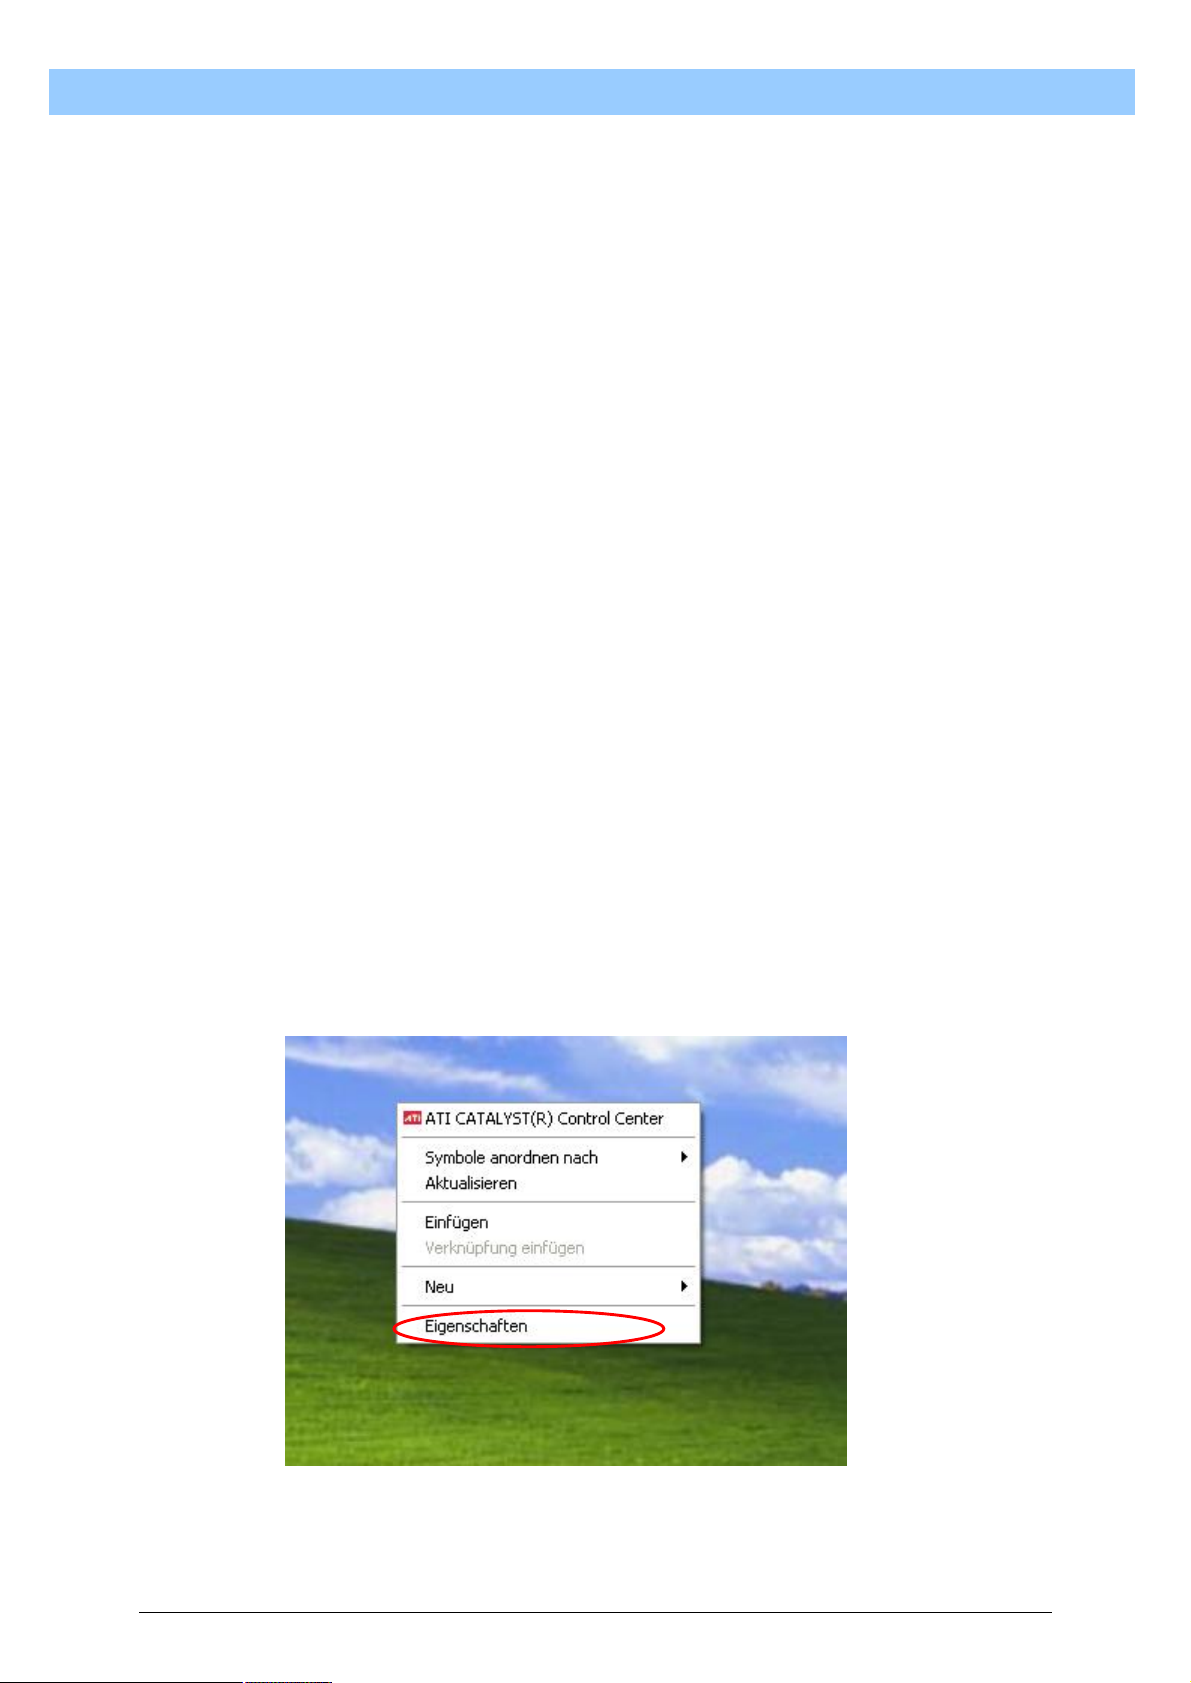
T
u
r
b
o
S
c
a
n
U
s
e
r
T
u
r
b
o
S
c
a
n
U
T
u
r
b
o
S
c
a
n
11. Important notes on PC hardware
11.1. Safety connector for printer interface
A standard PC as described in section 2 is used to operate TurboScan. For
existing systems that have a copy protection connector for the printer
interface, it is essential to ensure that the printer interface (set in BIOS) is
set to SPP or EPP.
The ECP setting may cause problems. It is possible that the safety
connector might not be recognized or the printer might not function
properly.
11.2. Graphics card with 3D acceleration
Thanks to the play instinct of human beings, the development of imaging
components in PCs has advanced rapidly. Of course, this is not without its
repercussions for all the other programs being using on a PC. TurboScan
is also affected by this. Depending on the manufacturer and type of
graphics card, it can happen that graphic images generated by TurboScan
are partly destroyed by smoothing and 3D filtering. This is mainly evident in
the correction window of the curve profiles. The curves are partly broken or
completely absent.
To prevent this problem caused by the graphics card, the performance of
the graphics card must be restricted via a setting in Windows XP. This is
done as follows:
1. Position the mouse pointer on an empty area of the Desktop and
single-click the right mouse button. A menu opens on the Desktop.
U
s
s
e
e
M
r
M
r
M
a
a
a
n
n
n
u
u
u
a
a
a
l
l
l
75
Page 76
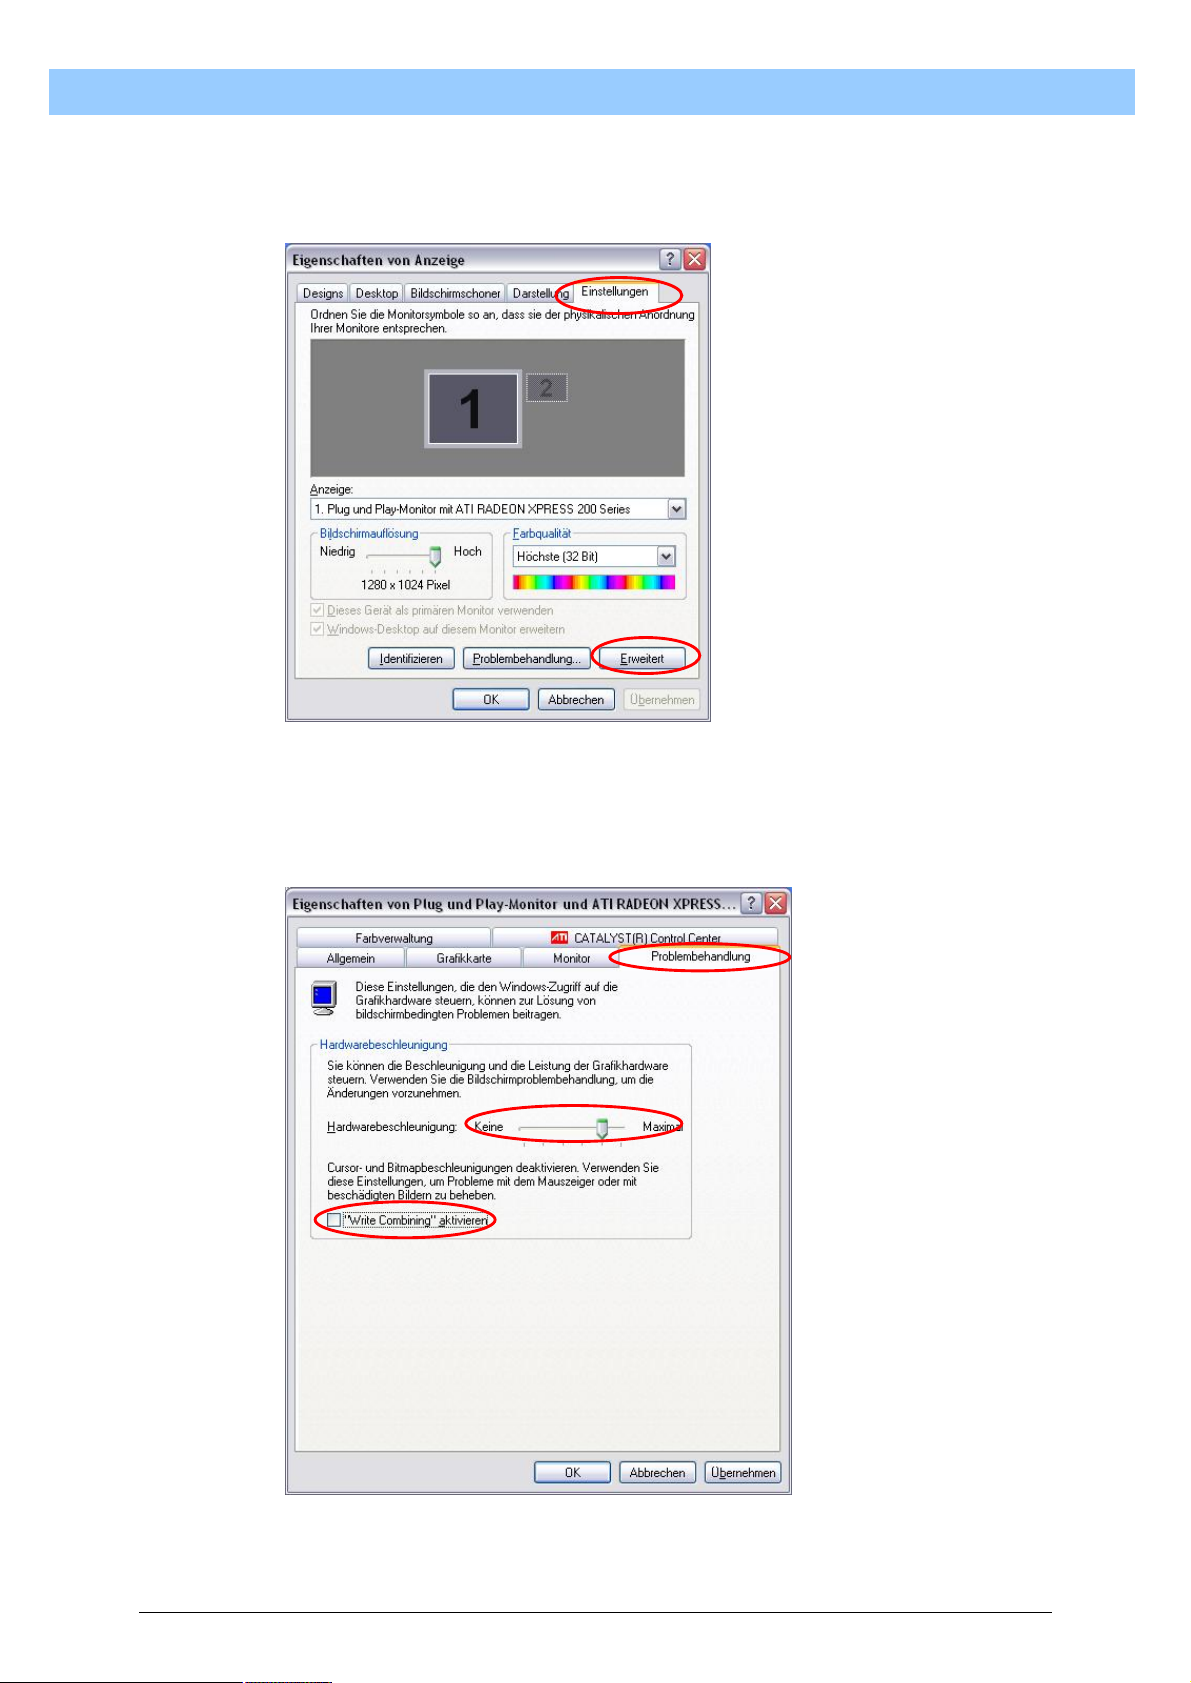
T
u
r
b
o
S
c
a
n
U
s
e
r
M
a
n
u
a
l
T
u
r
b
o
S
c
a
n
U
s
e
r
M
a
T
u
r
b
o
S
c
a
n
U
s
e
r
2. Select the menu item “Properties”. The “Display Properties” menu
opens.
M
a
n
n
u
u
a
a
l
l
Click on the “Settings” tab for the correct selection.
3. Click on “Advanced”. The menu for the graphics card advanced settings
opens.
Select the “Troubleshoot” tab. If enabled, the “Enable write combining”
setting should be disabled and the slide control for “Hardware
acceleration” should be moved at least 1 level further to the left.
76
Page 77

T
u
r
b
o
S
c
a
n
U
s
e
r
M
a
n
u
T
u
r
b
o
S
c
a
n
U
s
e
r
M
T
u
r
b
o
S
c
a
n
U
s
e
4. Confirm this setting with the “OK” button.
Once you have performed the above steps, all existing problems in
displaying the curve profile caused by the graphics card should be
remedied and all images should appear normal again.
I. Hardware not supplied by BIOTEC-FISCHER
In principle, you may assume that each of the hardware items described in
section 2. can be used with TurboScan. However, since there are
countless combinations of a wide variety of hardware and it is impossible
to test absolutely every combination, BIOTEC-FISCHER GmbH clearly
cannot guarantee that hardware not supplied by BIOTEC-FISCHER will
also function perfectly. Our Technical Customer Services will be happy to
offer you their expertise. Problems can be discussed and may even be
resolved over the telephone. If necessary, you can also order an on-site
service.
a
r
M
a
n
n
u
u
a
a
a
l
l
l
77
Page 78

T
u
r
b
o
S
c
a
n
U
s
e
r
M
a
n
u
a
l
T
u
r
b
o
S
c
a
n
U
s
e
r
M
a
T
u
r
b
o
S
c
a
n
U
s
e
r
M
a
n
n
u
u
a
a
l
l
78
Page 79
T
u
r
b
o
S
c
a
n
U
s
e
r
M
a
n
u
a
l
T
T
u
u
r
b
o
S
c
a
n
U
s
e
r
M
a
r
b
o
S
c
a
n
U
s
e
r
M
a
n
n
u
u
a
a
l
l
Appendix
I. Example of data transfer with curve profile (8 analyses)
= patient ID with leading control characters
= number and name of the individual fraction with followed values
= name of method
= positions of minimum marks
= number of X-values and Y-value per X-position of the curve
••1234
567890
5
Albumin
56697
Alpha1
6130
Alpha2
11461
Beta
10493
Gamma
15217
SPE 02
6
0
38
57
85
106
161
162
900
907
958
1097
1394
1974
2856
4251
6466
10011
15174
22440
31932
43175
54935
65930
75204
81695
85313
87072
87857
88151
88231
88178
87821
86638
83634
77747
69171
58759
47379
36373
27031
19994
15081
11838
9896
8779
8403
8450
8880
9485
10142
10719
11109
11243
11146
10870
10355
9562
8651
7960
7516
7132
6807
6594
6472
6381
6411
6520
6584
6745
7024
7361
7718
8200
8874
9613
10446
11364
12308
13253
14033
14724
15297
15717
15901
15896
15734
15370
14886
14484
13933
13232
12644
12479
12695
13348
14441
15985
17816
19660
21199
21946
21755
20519
18294
15818
13323
10964
9106
7845
7145
6632
6334
6265
6251
6371
6612
6781
6863
6951
7006
7072
7167
7299
7418
7618
7909
8178
8405
8677
8971
9391
9861
10176
10425
10674
10926
11172
11485
11754
11937
12036
12076
12100
12093
11999
11853
11600
11227
10916
10374
9644
8949
8352
7677
6911
6187
5496
4758
4035
3313
2686
2257
1901
1470
1055
675
466
276
0
••1234
567891
79
Page 80
5
Albumin
62781
Alpha1
4271
Alpha2
9894
Beta
8830
Gamma
14222
SPE 02
6
0
38
56
87
107
164
165
679
734
850
1060
1372
1882
2643
3848
5784
9004
14118
21603
31282
42821
54888
66162
75417
81249
83804
84661
84904
84950
84743
83525
80060
73845
64644
53279
41244
30308
21464
14838
10579
8004
6521
5475
4866
4646
4616
4627
4689
4991
5506
5996
6237
6266
6260
6217
6005
5507
4963
4527
4100
3716
3553
3499
3493
3498
3522
3592
3745
3981
4193
4412
4654
4926
5215
5606
5975
6216
6512
7025
7577
8154
8763
9143
9283
9325
9335
9338
9339
9339
9340
9333
9246
8921
T
T
T
u
u
u
r
b
o
S
c
a
n
U
s
e
r
M
a
n
u
a
l
r
b
o
S
c
a
n
U
s
e
r
M
a
r
b
o
S
c
a
n
U
s
e
r
8776
8629
8589
8382
8039
7569
7027
6555
6230
5845
5359
4764
4057
3599
3192
2687
2276
1987
1716
1454
1258
960
509
190
68
0
••1234
567893
5
Albumin
61723
Alpha1
4720
Alpha2
10557
Beta
9067
Gamma
13932
SPE 02
6
0
39
58
90
110
166
167
152
189
297
454
698
8450
8360
8465
8681
9209
9999
11330
12681
13660
14349
14257
13496
12425
10925
9248
7636
6293
5220
4571
4097
3811
3687
3696
3803
3890
4059
4284
4449
4584
4641
4710
4824
4928
5066
5257
5425
5695
5989
6147
6230
6297
6433
6700
7096
7492
7816
8143
8484
8637
8786
8983
9046
8953
M
a
n
n
u
u
a
l
a
l
993
1399
2240
3600
5886
9449
14750
22677
33119
45003
57012
67539
75248
79331
80785
81207
81316
81342
81344
81262
80544
77573
70984
61702
50046
37898
27291
18987
13271
9528
7281
6047
5390
5044
5017
5190
5386
5684
6162
6648
7017
7180
7171
7007
6643
6067
5429
4973
4637
4281
3875
3621
3448
3392
3411
3523
3776
4106
4332
4468
4577
4662
4853
5173
5495
5900
6479
6997
7318
7753
8476
9238
9804
10221
10468
10619
10649
10644
10586
10401
10147
9989
9730
9445
9206
9141
9359
10024
11052
12410
13812
14936
15722
15779
15133
13855
12006
10078
8172
6795
5636
4997
4703
4532
4414
4374
80
Page 81
4413
4502
4572
4617
4637
4660
4717
4832
4972
5064
5217
5446
5690
5972
6298
6670
7010
7279
7387
7417
7417
7428
7491
7626
7946
8292
8577
8732
8783
8807
8708
8545
8416
8253
8010
7709
7497
7338
7078
6551
5812
5186
4601
4079
3593
3030
2471
2001
1493
1152
890
668
547
T
T
T
444
299
120
••1234
567894
5
Albumin
65797
Alpha1
3958
Alpha2
9825
Beta
8557
Gamma
11760
SPE 02
6
0
40
57
89
111
165
166
729
800
909
1047
1308
1658
2260
3260
4887
7581
11714
17958
26965
38128
49844
61686
72047
78973
81665
82480
82695
82747
82723
82231
79599
72741
62182
49430
u
u
u
r
b
o
S
c
a
n
U
s
e
r
M
a
n
u
a
l
r
b
o
S
c
a
n
U
s
e
r
M
a
r
b
o
S
c
a
n
U
s
e
r
9098
9012
8716
8296
7921
7575
7256
6993
6948
7208
7762
8477
9258
10146
11302
12150
12400
11971
11095
9863
8676
7281
6010
4913
4149
3656
3389
3304
3281
3275
3274
3274
3278
3301
3354
3421
3452
3489
3680
3912
4033
4139
4304
4527
4838
5042
5215
5453
5717
5911
6081
6183
6283
37105
26650
18462
12977
9497
7219
5725
4832
4482
4376
4359
4363
4350
4379
4567
5043
5581
5824
5948
5824
5441
4905
4488
4079
3624
3366
3261
3193
3155
3107
3154
3214
3248
3287
3282
3283
3326
3507
3827
4101
4325
4596
5020
5524
5992
6289
6708
7388
7925
8348
8716
9031
9109
M
a
n
n
u
a
u
a
6476
6676
6705
6763
6883
6901
6805
6706
6551
6462
6432
6311
6007
5542
5232
4842
4194
3584
3269
2996
2617
2166
1781
1457
1269
1122
968
759
485
378
265
0
••1234
567895
5
Albumin
59231
Alpha1
5678
Alpha2
10805
Beta
9662
Gamma
14621
SPE 02
6
0
38
58
89
110
165
l
l
166
1116
1189
1284
1448
1757
2145
2915
4213
6022
9034
14024
21205
31063
42850
55202
66621
75896
82109
84624
85404
85614
85665
85662
85439
84088
79926
72449
62557
50989
39416
29044
20833
15023
11268
8900
7549
6894
6551
6500
6670
6925
7300
7764
8280
8572
8674
8678
8529
8098
7465
6856
6312
81
Page 82
5946
5574
5129
4740
4493
4383
4334
4354
4426
4592
4827
5064
5342
5597
5820
6056
6380
6761
7276
7913
8400
8791
9362
10177
10869
11381
11764
11909
11868
11729
11566
11391
11185
10942
10585
10105
9727
9662
9958
10720
11610
12857
14549
16041
16937
17327
17031
16081
14382
12271
10320
8624
7233
6226
5654
5370
5116
4981
4953
5012
5223
5442
5593
5697
5807
5858
5868
5905
5968
6033
6195
6431
6692
7020
7362
7701
8007
8243
8465
8604
8688
8782
9018
9373
9569
9640
9725
9646
9446
9262
9164
9069
9032
8909
8775
8639
8313
7710
6893
6148
5544
5091
4566
3833
3191
2607
T
T
T
u
u
u
r
b
o
S
c
a
n
U
s
e
r
M
a
n
u
a
l
r
b
r
b
o
o
S
c
a
S
c
a
2183
1972
1726
1450
1179
825
438
0
••1234
567896
5
Albumin
59664
Alpha1
5638
Alpha2
11317
Beta
9066
Gamma
14313
SPE 02
6
0
37
56
88
107
164
165
1096
1168
1311
1513
1855
2317
3137
4712
7301
11536
18202
27438
39386
52523
64899
75251
81996
84639
85443
85656
85708
85716
85636
n
n
U
U
s
s
e
r
e
r
84929
81919
74985
65017
53150
41019
30259
21651
15470
11369
8941
7596
6962
6727
6720
6875
7075
7443
7971
8359
8575
8649
8663
8609
8340
7777
7039
6406
5930
5510
5028
4623
4437
4393
4407
4477
4615
4846
5193
5458
5642
5760
5878
6130
6544
6950
7469
8113
8547
9003
9744
10532
11175
M
M
a
a
n
n
u
u
a
l
a
l
11636
11926
12081
12096
12026
11872
11496
11101
10759
10287
9707
9187
8991
9300
10104
11194
12626
14385
15876
16705
17086
16876
15953
14200
11872
9723
8069
6755
5828
5201
4795
4555
4564
4616
4638
4705
4834
4917
5072
5287
5502
5622
5692
5775
5813
5839
5930
6180
6535
6836
7149
7520
7891
8230
8489
8619
8674
8734
8807
8840
8908
8919
8833
8829
8797
8757
8707
8685
8657
8542
8239
7736
7011
6280
5679
5197
4781
4190
3502
2979
2483
2116
1798
1463
1244
994
686
370
0
••1234
567897
5
Albumin
62023
Alpha1
4887
Alpha2
10621
Beta
8725
Gamma
13841
SPE 02
6
0
37
82
Page 83
56
88
108
163
164
465
498
605
781
1029
1369
2025
3101
4985
7978
12975
20683
31106
43191
55813
67329
76523
82099
84563
85400
85638
85665
85357
83872
79922
72845
62550
50619
38625
27953
19479
13755
10026
7743
6582
5916
5577
5459
5479
5584
5719
6027
6469
6780
6940
6969
6853
6480
5948
5451
4866
4369
4105
3894
3605
3388
3340
3438
3676
3916
4044
4118
4189
4307
4635
5182
5522
5684
5812
6149
6678
7320
7962
8337
8774
9425
10002
10319
10406
10404
10364
10131
9709
9153
8706
8494
8383
8256
8192
8412
9005
10199
11562
13024
14410
15232
15113
14079
12537
10812
8866
T
T
T
u
u
u
r
b
o
S
c
a
n
U
s
e
r
M
a
n
u
a
l
r
b
o
S
c
a
n
U
s
e
r
M
a
r
b
o
S
c
a
n
U
s
e
r
2438
1967
1626
1389
1188
957
690
375
129
0
••1234
567898
5
Albumin
62753
Alpha1
4967
Alpha2
10582
Beta
8927
Gamma
12667
SPE 02
6
0
36
53
84
105
158
159
1046
1109
1251
1469
1849
2437
3261
4686
7179
11401
18112
27567
39467
52442
64972
75037
81630
85118
86570
87112
87254
7368
6097
5203
4577
4128
3837
3683
3662
3756
3971
4122
4207
4342
4505
4677
4795
4846
4906
4983
5119
5340
5496
5597
5683
5844
6112
6520
6999
7462
7788
8028
8245
8376
8436
8420
8394
8377
8394
8403
8398
8362
8287
8121
7729
7249
6741
6182
5581
5072
4661
4099
3442
2973
M
a
n
n
u
u
a
l
a
l
86969
85140
79908
71040
59533
46970
34888
24661
17055
12133
9149
7387
6243
5632
5409
5352
5411
5623
5986
6435
6832
7278
7808
7924
7415
6718
5933
5397
5068
4708
4377
4097
3963
4007
4115
4209
4223
4265
4422
4616
4765
4927
5185
5439
5732
6212
6679
7219
7788
8329
8961
9474
9747
9878
9941
9896
9838
9778
9625
9326
8937
8465
8093
8029
8321
8999
9987
11261
12607
13717
14342
14248
13410
11922
10116
8398
7027
5840
5002
4476
4178
4024
4017
4033
4019
4124
4217
4258
4408
4585
4628
4696
4842
4940
4999
5071
5192
5344
5508
5755
6028
6205
6399
6647
6867
7105
83
Page 84

7303
7543
7803
7965
8010
7980
7868
7711
7505
7338
7228
7039
T
T
T
u
u
u
r
b
o
S
c
a
n
U
s
e
r
M
a
n
u
a
l
r
b
o
S
c
a
n
U
s
e
r
M
a
r
b
o
S
c
a
n
U
s
e
r
3900
3449
3057
2670
2320
2008
6690
6231
5841
5432
4914
4373
M
a
n
n
u
u
a
l
a
l
1672
1252
841
566
389
226
100
0
84
Page 85

 Loading...