

Page 1
IEC-60268-16 rev. 4 & rev. 5
IEC-61672 Class 2 / ANSI S1.4 Type 2
IEC-61260 Class 0
ISO-3382-2
ANSI S12.2 / ISO-1996
Bedrock SM30/SM50/SM90
Operating manual
Page 2

Page 3

Contact information and support
The Bedrock SMxx devices (SM30, SM50, SM90) are designed and manufactured by Embedded Acoustics B.V. in the Netherlands.
The manufacturer can be contacted at the following address:
Bedrock Audio BV
Ampèreweg 18
2627 BG DELFT
The Netherlands
www.bedrock-audio.com
Phone: +31 88 8770700
Fax: +31 88 8770799
Email: [email protected]
Updates of the system’s firmware and documentation are released online :
www.bedrock-audio.com/support
NOTE: All screenshots and product pictures shown in this manual correspond to the
SM50 with hardware platform 1.1B running firmware version 2.4. If you are using a different device model or a different firmware version, the screenshots may not fully correspond
to what is being displayed on your device’s screen.
Where this manual refers generically to the Bedrock SMxx, the corresponding text applies to all device models starting with the letters “SM” (i.e. SM30, SM50 and SM90).
All functions and features of the SM30 are identical to the SM50, with the exception of
the STIPA modules (which are not featured on the SM30). The SM90 hardware differs
from the other two models: it complies with Type 1/ Class 1 requirements (compared to
Type 2 / Class 2 for the other models).
© Bedrock Audio BV, 2013-2019. All rights reserved.
Bedrock Audio and Embedded Acoustics are registered trademarks.
Document version 2.4.0 release date April 2019. Applies to models: SM30, SM50 and
SM90. Speech intelligibility related functions not supported on SM30
3
Page 4

Contents
Contact information and support 3
1. Introduction 6
2. SMxx versions and features 7
3. How to use this manual 8
New in firmware version 2.4 8
4. General use and safety precautions 9
4.1. Safety precautions when charging 9
4.2. Safety precautions related to connectors 10
5. Getting started 11
5.1. Preparing and booting the SMxx 11
5.2. The SMxx main menu 11
5.3. Customizing the main menu 13
5.4. Warning dialogs 13
5.5. Layout of the user interface 14
5.6. Some more tips and tricks 15
6. Speech intelligibility measurements 16
6.1 Quick STIPA (not featured on the Bedrock SM30) 16
6.2 STIPA pro (not featured on the Bedrock SM30) 20
6.3 Full STI (not featured on the Bedrock SM30) 24
6.4 Speech Level Meter (not featured on the Bedrock SM30) 27
7. Level and spectrum 28
7.1 SPL meter 28
7.2. LAEQ logging 31
7.3. Real-Time Analyzer (RTA) 35
7.4. Fast Fourier Transform analyzer 37
7.5. Statistical acoustics (percentiles) 39
7.6. RTA logging (button) 41
8. Room acoustics 42
8.1. Reverberation Time meter (RT60) 42
8.2. Noise curves 49
9. Electro-acoustics 52
9.1. Oscilloscope 52
9.2. AC Volt meter 53
9.3. Electric in RTA and FFT 54
9.4. Polarity 54
10. Other modules and control modes 56
10.1. Calibration 56
10.2. Settings 58
10.3. Status 62
10.4. USB audio device mode 63
Page 5

11. Accessing saved measurements from a PC 64
11.1. Connect USB cable 64
11.2. Copy your measurement data 64
11.3. Resetting measurement number series 65
11.4. About the file format 65
11.5. Downloading recorded audio 65
11.6. Further use of USB 65
12. Remote control from a PC 66
12.1. Remote duplication of the SMxx screen (Remote display) 66
12.2. The Bedrock remote control API 68
13. Power and charging 70
13.1. Charging instructions 70
13.2. Power saving recommendations 71
13.3. Use of power banks and external battery packs 71
14. Cleaning, maintenance and calibration 72
Battery disposal 72
15. Product warranty 73
16. Firmware updates 75
17. Buttons, icons and symbols 76
18. Technical specifications 80
Linear range (31 Hz - 4k - 8k - 12.5kHz) 81
19. Troubleshooting 82
LED states 83
Firmware update error codes 83
EC declaration of conformity 84
Annex A. Correction factors for SPL measurements (IEC-61672) 85
Annex B. Manufacturer’s instructions for periodic testing according to IEC-61672-3. 98
Annex C. Manufacturer’s instructions for periodic validation of STI test functions 100
5
Page 6
1. Introduction
Congratulations on purchasing your Bedrock measuring instrument! The SMxx product
line comprises a series of flexible, all-round acoustic analyzers: the SM30, SM50 and SM90.
The features of each of these instruments are listed in section 2 of this manual.
Using the SMxx is quite easy, thanks to its touch-screen operation and intuitive menu
structure. Most users will get the hang of doing measurements with the SMxx without
spending too much time with this manual. Nonetheless, we strongly recommend that you
do read chapters 1-5 of this manual before using your SMxx for the first time, in order to
get acquainted with the various features of the device, as well as the procedures for charging
and maintenance. With a little care, you can expect years and years of reliable and troublefree operation from the SMxx.
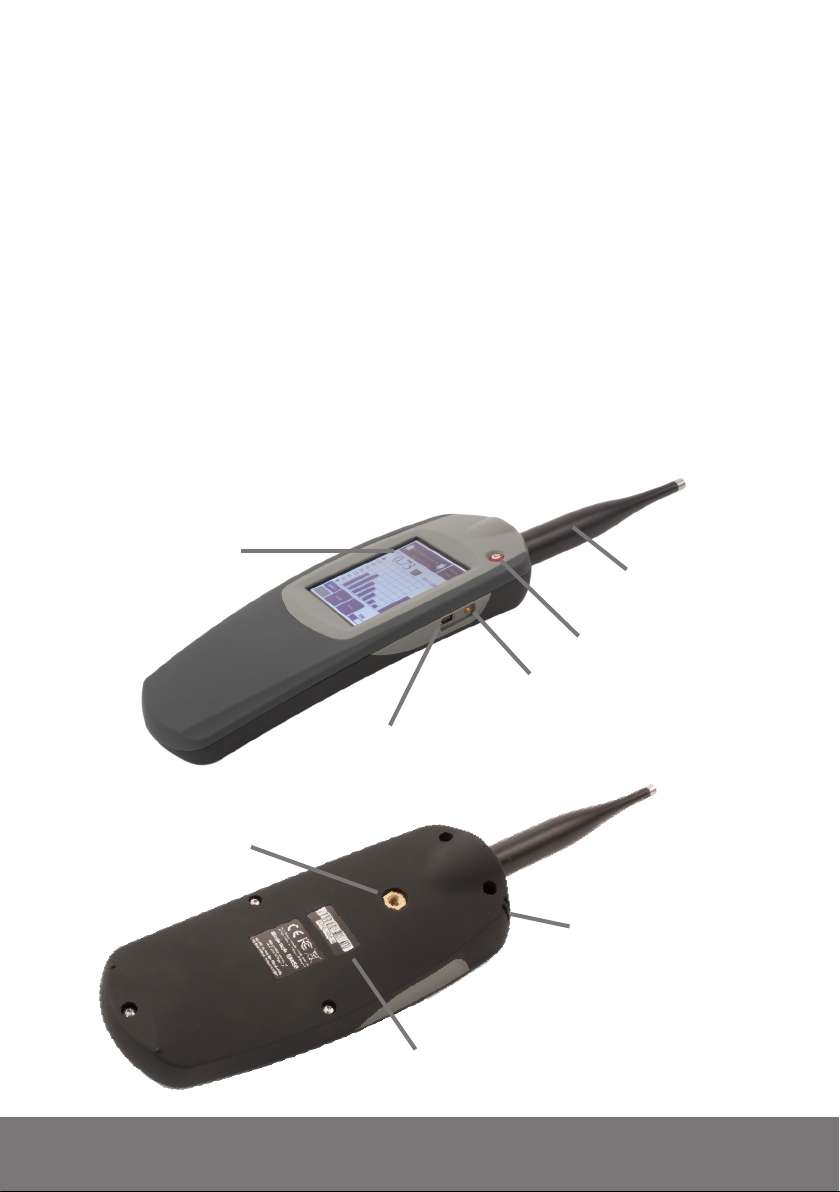
Touch screen
Class 2 / type 2
microphone
Power button
Tripod mount
USB charge & data
port
Serial number
Charge status LED
Hook for
carrying cord
Model shown is
Bedrock SM50
Page 7

2. SMxx versions and features
The SM30, SM50 and SM90 share a common hardware platform, with some differences
between the different versions of the device:
• The SM30 and SM50 comply with class 2 / type 2 (Group X) of IEC-61672:2013 and
ANSI S1.4. The SM90 complies with class 1 / type 1.
• The SM50 and SM90 feature speech intelligibility measurement functions. The SM30
does not include any of the modules related to speech intelligibility.
The table below lists all of the functions and modules
Modules and features SM30 SM50 SM90
Speech intelligibility
STIPA measurements (IEC-60268-16) - • •
Full STI measurements (IEC-60268-16) - • •
Speech Level measurements (IEC-60268-16) - • •
Level & spectrum
SLM: Sound Level Meter (IEC-61672 / ANSI S1.4) class 2 class 2 class 1
LAEQ logging (long term monitoring) • • •
RTA: Realtime Analyzer, 1/1, 1/3, 1/6 and 1/12 oct. • • •
RTA logging: long term monitoring of RTA spectra • • •
FFT: Fast Fourier Transform spectral analyzer • • •
L% - statistical acoustics (percentile levels) such as L10 and L90 • • •
Room Acoustics
RT60: Reverberation Time measurements (ISO-3382-2), IR-based and interrupted noise • • •
Noise curves (NR, NC, etc - ISO-1996, ANSI S12.2) • • •
Electro-acoustics
Oscilloscope (time domain inspection of signals) • • •
AC Voltmeter (measure RMS, dBU, dBV) • • •
RTA (Real-Time analyzer) for electric input signals • • •
FFT (Fast Fourier Transform) for electric input signals • • •
Polarity - check polarity of loudspeakers • • •
Other options and features
Recording calibrated audio • • •
Remote operation as USB audio device • • •
Remote control via PC • • •
Availability of remote control API for third-party applications • • •
Download of measured data via USB • • •
User-configurable home menu • • •
Free firmware upgrades • • •
7
Page 8

3. How to use this manual
Depending on how you plan to use your Bedrock SMxx, not all information in this manual
may be equally interesting or relevant. If you are new to the Bedrock SMxx, we strongly
recommend that you read the following chapters:
• Chapter 4: General use and safety precautions
• Chapter 5: Getting started
• Chapters on the measurement modules that you plan to use first
• Chapter 13: Power and charging
• Chapter 14: Cleaning, maintenance and calibration
We recommend reading the chapters on the various measurement modules as you plan to
use them. As some of the modules implement complex measurement procedures, using
those modules may require you to spend some time with this manual, and possibly also
third-party source of information (such as online tutorials and course manuals).
The following sections should be read if you are experiencing issues with your device or if
you need to upgrade your firmware:
• Before getting support from your Bedrock audio vendor, please consult the
Troubleshooting section (chapter 19)
• Consult the section on Firmware updates (chapter 16) before trying to in-
stall new firmware on your device. Failure to follow firmware update instructions precisely may render your device permanently inoperable and
voids your warranty.
Towards the end of this manual, you will find detailed information in tables and appendices that may not be needed for everyday use of the device. In particular, these appendices
contain procedures for periodic testing, as needed by 3rd party labs for calibration and (re-)
certification of your instrument.
New in firmware version 2.4
If you have previously used the Bedrock SMxx but have recently upgrade to firmware 2.x.x
we recommend that you read the “Getting started” section to get acquainted with the new
structure of the Home menu (which is now user-configurable). New modules introduced
in FW2.x.x are: Speech Level Meter, Full STI, AC Volt meter, Noise Curves and RTA logging. Functionality of RT60 has been enhanced, and a remote control API for 3rd party
apps is now available. Full STI and Speech Level Meter are not available to SM30 users.
Page 9

4. General use and safety precautions
Your Bedrock SMxx is a sophisticated electronic measuring instrument that should be used,
maintained and stored with care:
• We recommend that you always use a lanyard to secure your device against
dropping, by suspending it around your neck or wrist. If you use a tripod
to mount the device during measurements, we recommend that you use a
sturdy model with a sufficiently wide base.
• Do not expose the device itself, the measuring microphone or charger to
rain, moisture or liquids of any kind. Take special care to prevent liquids to
permeate into the device through the connectors or along the display bezel.
• Do not operate at ambient temperatures above 35oC/95F.
• Do not use close to flames or open fire.
• Do not use in environments where flammable or explosive materials may
also be used.
• Do not keep the device powered on while unattended for prolonged periods
of time.
• Use the charger only with the international adapter suitable for your region.
• Make sure that the device is switched off before transportation and storage.
• During transportation and storage, keep the device in a suitable casing or
container – preferably its original case. The device needs to be protected
from shocks and vibration (due to transportation or falling), excessive temperatures, liquids and moisture, and any other external conditions that
could do damage to the device. Care should be taken that other objects cannot come into direct contact with the display during transportation.
4.1. Safety precautions when charging
The Bedrock SMxx is a battery-powered rechargeable device, with an internal low selfdischarge NiMH battery pack. This battery pack is designed for many years of operation,
and therefore cannot be swapped out by the user. Recharging takes place through the mini
USB connector found on the left side of the device.
The device is charged through the USB connector using high currents of
up to 1500 mA. While being charged, it will heat up. DO NOT CHARGE
THE DEVICE WHILE IT IS INSIDE A CLOSED CONTAINER (BOX,
BRIEFCASE, ETC.). Please make sure that the device can shed excess heat
while charging.
9
Page 10
The supplied charger includes adapters for use worldwide, and operates on
a wide AC voltage range of 100 – 240V. Do not use the charger if the casing
appears cracked or broken, or if it has been exposed to fluids or moisture.
Contact with components inside the charger while this is plugged in may
result in serious injury or death.
4.2. Safety precautions related to connectors
The Bedrock SMxx features a USB connector and an XLR connector (to
which the microphone is attached). If you connect external devices to these
connectors, please ensure that these connections are protected against overvoltage and power surges. The voltage supplied to the USB port may not
exceed 5.5V. As the USB power circuitry is connected to the battery pack,
excessive voltage applied to the USB port may cause the battery pack to
catch fire or explode.
The XLR connector supplies 48V phantom power to the microphone. This
phantom voltage can be switched on and off through the hardware settings
menu. IMPORTANT: connecting equipment not designed for 48V phantom power to the XLR connector (with phantom power switched on) may
permanently damage the connected device and/or the SMxx. The manufacturer explicitly denounces responsibility for any damages to third-party
hardware resulting from exposure to the Bedrock SMxx’s phantom power.
The “AC Volt meter” function of the device is intended for measuring audio
output levels of amplifiers and other audio equipment. NEVER connect the
XLR input pins to AC voltages over 40V; do NOT try to measure the AC
mains with your SMxx.
Page 11
5. Getting started
You will most likely receive your Bedrock SMxx with sufficiently charged batteries to start
the device and get acquainted with its features. We do recommend that you fully charge the
device using the supplied charger before you start your first serious measurement session.
Leave the device on the charger until it finished its charge cycle. This may take up to 6
hours; many users opt for overnight charging.
All rechargeable batteries slowly lose charge during storage, the batteries in
the Bedrock SMxx are no exception. When you take out the device after it
has been on the shelf for more than a few weeks, always fully charge the
batteries first. The battery charge indicator may not be accurate after longer
periods of storage.
5.1. Preparing and booting the SMxx
Connect the microphone to the instrument using the XLR connector at the top of the device. Next, power on the device by pressing the red power button once.
Note: the power button is also used to power the device off. If you press the button while the
device is in operation, you will see a dialog window asking confirmation before powering
off. If the power button is kept pressed for 10 seconds in the “power on” state, the device
will be forced into the “off ” condition. This can be used to reset the device if it becomes
unresponsive (keep pressed to 10 seconds to switch off, then press again to restart).
5.2. The SMxx main menu
The Bedrock SMxx will boot into the main menu. You can launch its various measurement
modules from this menu.
When you first start the device, it may boot up showing a warning, reminding you to recharge the battery after storage. This is normal; it just means
that the device has detected that it has been in storage for some time before
it was shipped to you.
The main menu is where all the available modules are shown, and where you can choose
which module to launch. New modules are regularly added through firmware updates
that are made available through the Bedrock website. If your device is running a different
firmware version than the version on which this manual is based (version 2.0), you may see
a different selection of modules appear in the menu than the ones found in this manual.
Small differences in appearance also exist between different SMxx models.
11
Page 12
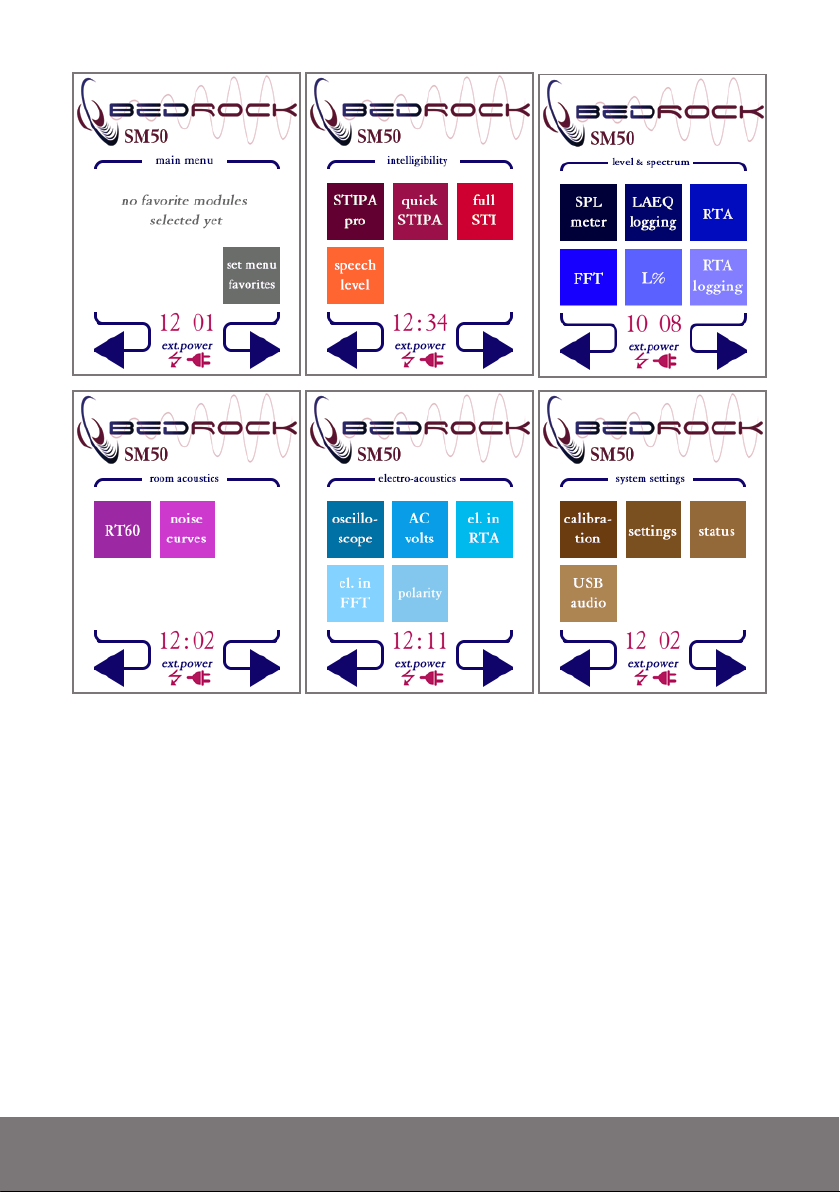
Set menu favorites
STIPA pro
Quick STIPA
Full STI
: measure STI based on the complete 14x7 MTF-matrix
Speech level
SPL meter
LAEQ logging
RTA logging
FFT
: Fast Fourier Transform spectral analyzer
L%
: calculate statistical levels such as L10 and L95 (percentiles)
RTA
: Real-time analyzer
RT60
: Reverberation Time meter
Noise curves
cilloscope
Polarity
AC Volts
: Inspect audio waveforms in real time
: Check loudspeaker polarity
: Measure output levels of audio equipment in dBU, dBV and Vrms
el.in RTA, el.in FFT
Calibration
Settings
: change the system’s hardware configuration
Status
: general information on the measurement system
USB audio
: press to select favorite modules to appear on this page
: app that gives you access to all STI measurement details
: simple app to quickly do STIPA measurements
: measure speech level corrected for pauses (IEC-60268-16)
: Sound Pressure Level meter module
: long-term monitoring and logging of sound levels
: Long-term monitoring of spectra
: Measure curve-based spectral single-number ratings (NR, NC, etc).
: RTA and FFT for electric input signals via XLR
: calibrate the SMxx and its microphone
: use the SMxx as a calibrated audio device from Windows
Os-
Page 13
The menu consists of multiple screens, through which you can flip back and forth. A small
digital clock and the battery/power status are always shown on the bottom of the screen.
NOTE: the screenshots shown here apply to the SM50/SM90. The “speech intelligibility”
screen is not present on the SM30.
5.3. Customizing the main menu
Notice that it is possible to select your own “favorites” to appear on the first page of the
main menu. This is done for added convenien; if you place your most frequently used
modules here (up to five), you will not have to browse through the entire menu too often.
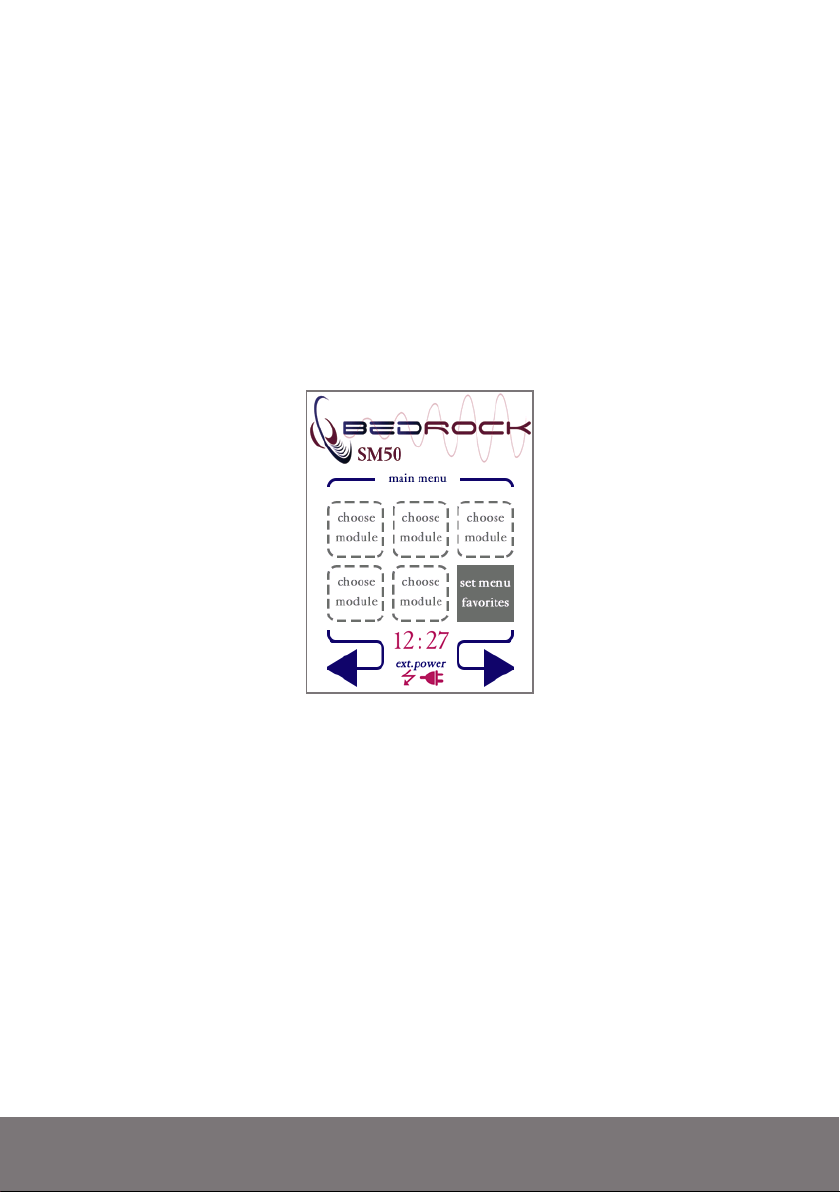
After you press “set menu favorites,” you can select any of the 5 positions on the screen to
place a module
Appearance of the main menu page after pressing “set menu favorites.”
After selecting a position (tap “choose module” in the location you wish to place a module),
you can browse through the available modules. To clear a position where your previously
placed a module, select the “choose module” placeholder from the list. You can place, remove and change modules in this menu screen as often as you like.
Apart from the modules listed here in the main menu, the SMxx has specific operating
modes triggered by the USB port: charging, data transfer and remote control. All modules
and USB operating modes will be explained in detail in separate sections of this manual.
5.4. Warning dialogs
Whenever you start the device, a self-diagnostic program is run. Among other things, this
program monitors the health of the battery pack. The statistics of the battery pack are
logged whenever the device is used; these logs are inspected whenever the device boots.
13
Page 14
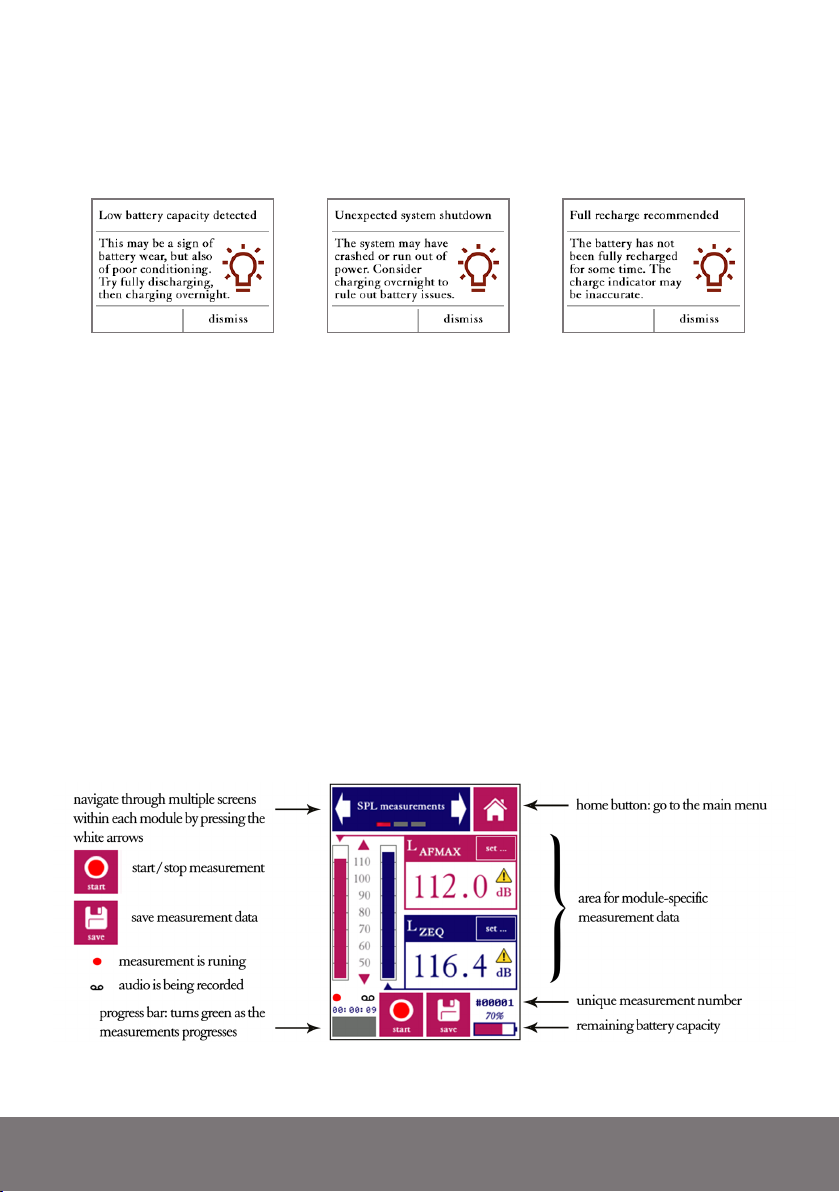
If the self-diagnostic program detects any inconsistencies in the battery logs, it displays a
warning. These warnings are usually no reason for immediate concern. Mostly, they serve
to provide information to you as a user that helps you to prolong the lifespan of your battery pack and to optimize the accuracy of the battery charge indicator (always shown at the
bottom right of the screen).
Examples of warnings reported by the self-diagnostic program when the SMxx is booted.
Ignoring the battery warnings will most likely lead to inconsistencies in the battery charge
indicator (showing up either too full or too empty, or causing the indicator to make sudden
jumps). If this should happen, the best remedy is always to fully charge the device, then
fully discharge the device, and then fully charge it again. Note that the complete charge
cycle may take 5 hours or more. We recommend that you always leave the device connected
to the charger until the charge cycle finishes (perhaps overnight). The charge cycle is completed if the LED on the side of the device stops blinking green/amber.
5.5. Layout of the user interface
The various measurement modules share a common user interface: most buttons and captions can be found in the same location throughout all modules. The graph below explains
the most common icons and buttons.
Page 15

5.6. Some more tips and tricks
Boot straight into your last-used module. The device boots up into the module from
which the device was last shut down. This is very convenient if you want to (temporarily)
turn the device off between measurements to conserve the batteries; you don’t have to go
through the menu each time. You can return main menu at any time by tapping the “home”
button, found at the top right of the screen in each module.
Add text annotations to your measurements. Measurements made by the SMxx are
uniquely identified by a serial number. However, as time passes by you may have a hard
time remembering which measurement #000422 was exactly. A short text such as “1st floor,
office 103” may jog the memory. It is now possible to add a short text note to every measurement, by means of an on-screen keyboard. You will have to set “Text annotations ON”
in the settings module. Whenever you save a measurement, a keyboard will now pop up.
Record the audio of all of your measurements. Also from the settings menu, you can set
the device to record audio (in .wav format) for all of your measurements. These .wav files
are calibrated so that full scale corresponds to 150 dB SPL. You can play them back with
any audio player, although they may have to be amplified to be heard at a satisfactory level
(Windows is not set up to expect 32 bit audio files).
Back up your data via USB. All of your measurement data (and recorded audio) can be
copied to a PC using the supplied USB cable. The SMxx simply presents itself as a mass
storage device; see chapter 11 of this manual for the details. A word of warning: if your
computer is set up to display hidden files, be careful not to change, move or delete any files
from the SYSTEM folder.
Use a USB power bank for lengthy measuring sessions. Depending on the type and intensity of use, most users get between 6 and 8 hours of use out of a single battery charge.
The battery is designed to last through the day during a typical measuring campaign. The
battery is drained most quickly during the actual measurements, when all pre-amplifiers
and the phantom power are fired up. When measuring continuously, expect the battery to
last 3 to 3.5 hours. If this is not enough, we recommend using a (generic) USB power bank,
connected via the USB port of the device. These devices are effective and inexpensive, and
will last you multiple days. To save power, set the display to a low brightness setting and
turn it off in between measurements.
15
Page 16
6. Speech intelligibility measurements
6.1 Quick STIPA (not featured on the Bedrock SM30)
The Quick STIPA module is intended to do simple and straightforward STI measurements using the STIPA test signal. A comprehensive explanation of the STI method is
beyond the scope of this device manual; there are several online and offline resources that
provide guidance and information on doing STI measurements, such as our own white
paper on this topic.
In this section of the manual, we will briefly explain how to set up your equipment for
measuring the STI. The Quick STIPA module makes the process as simple as possible.
For any STI measurement, you need a source of the STIPA test signal as well as an STI
analyzer. In your case, the analyzer is your Bedrock SMxx. You can choose whatever type of
STIPA signal source that suits your application best (TalkBox, media player or otherwise).
The Embedded Acoustics reference STIPA test signal is included with the SMxx (on a
USB flash drive) and can also be downloaded from the Bedrock website, free of charge. We
supply IEC-60268-16 rev.4 and rev.5 test signals, fully compliany and compatible with all
STIPA meters that conform with the standard.
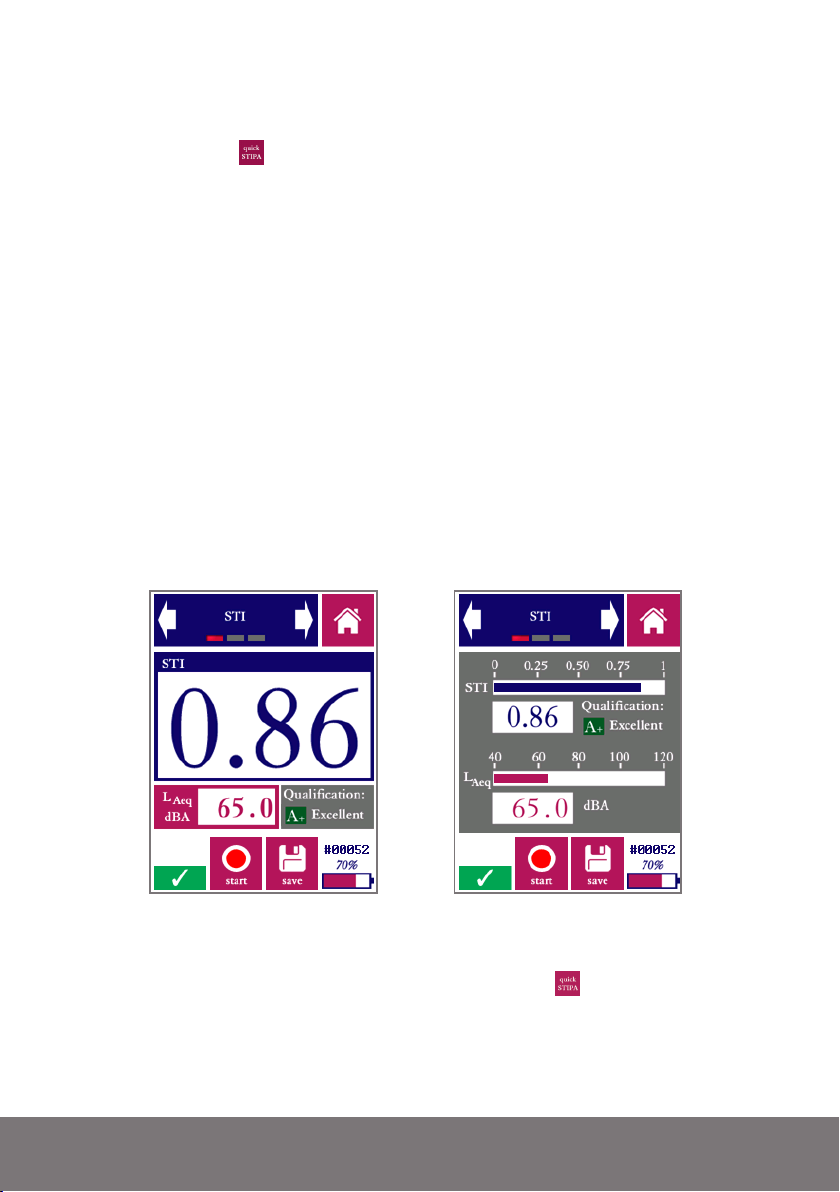
Measurement screen of the Quick STIPA module, in digit mode (left) and bar mode (right)
In order to carry out an STI measurement, complete the following steps:
• Power on your Bedrock SMxx and go to Quick STIPA
• Now start playback of the STIPA test signal through the channel or system
which you intend to test.
Page 17

• Note that the STI that you will now measure, will characterize all parts of
your transmission path, from playback device up to the microphone of your
Bedrock SMxx.
• Tap “Start”
• Wait for 18 seconds while the measurement takes place. Make sure that
signal playback is not interrupted, and that the acoustic environment is stable and free from impulsive sounds (such as door slams). Note: the STIPA
pro module uses a longer measurement time of 25s. A measuring time of 18s is
a reasonable minimum, within the range allowed by the standard, to arrive at
accurate results.
• You will see that the STI on your screen stabilizing towards its end value.
• Optionally, you can press “save” ( ) once the measurement is finished to
store the data, to be browsed or downloaded to PC later. A measurement
number is assigned to each saved measurement. This number is displayed
at the bottom right of the screen (preceded by a “#” character), above the
battery indicator.
The steps described above are essentially the entire procedure. If you are new to STIPA
measurements, please consult tutorials and standards to make informed decisions about the
STIPA signal playback level, measuring positions, number of repeated measurements, etc.
The Quick STIPA module also shows some additional measurement information:
• The A-weighted sound pressure level
• The qualification band (a letter between A and U) that is used in some
standards and defined in IEC 60268-16 rev. 4.
• A label (“bad”-”excellent”) that characterizes intelligibility based on the
STI
The arrows in the blue bar on the top of the display can be used to navigate through the
different screens for each module. The Quick STIPA module has three screens: “STI”,
“settings”, and “browse measurements”.
The “settings” screen gives some options to control the appearance of your measurement
results:
• Choose between presentation of the STI in large digits or as a bar plot
• Choose whether or not you want to see the qualification bands displayed
The “browse measurements” screen allows you to review earlier (saved) measurements
without having to download your data to a PC first.
• Use the blue buttons at the bottom of the screen to scroll back and forth
through your saved measurements.
• Note that the measurement number displayed above the battery indicator
corresponds to the measurement currently shown on the screen.
17
Page 18
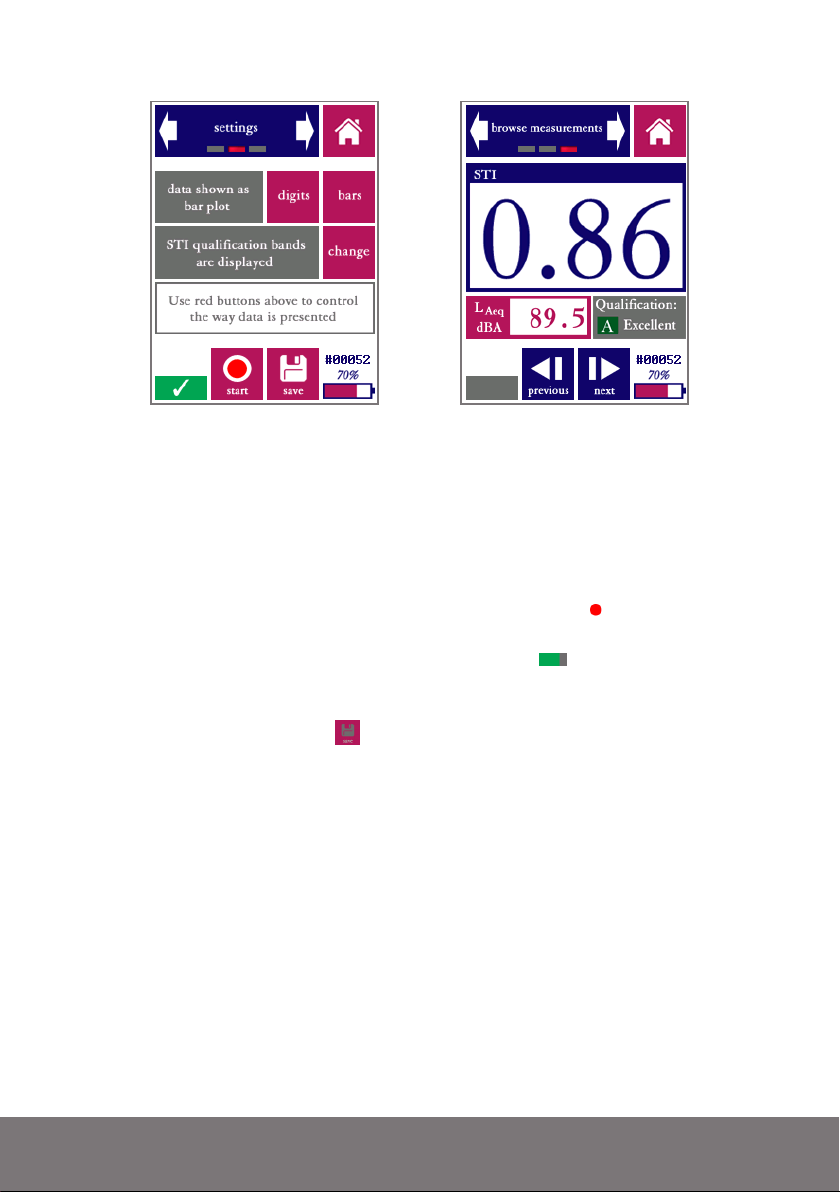
“Settings” screen and “browse measurements” screen. The latter screen is nearly identical to the
STI measurement screen, but with previous/back buttons instead of start/stop and save buttons.
Reviewing larger numbers of STIPA measurements by using the “browse measurements”
screen will be inefficient; we recommend downloading the data to a PC for this. Please refer
to the section “accessing saved measurements through a PC.”
Please take note of the following features of the Quick STIPA module:
• On the bottom left of the screen, a red “recording dot” ( ) is displayed
whenever a measurement is running. Below this red dot, the progress of the
current measurement is indicated by a progress bar ( ).
• The “save” button is only operational when new (unsaved) measurement
data is available from a finished measurement. If this is not the case, the
save icon is colored gray ( ).
• The qualification band (a letter between A and U) is just a different way to
represent the STI number; it is fully redundant. We currently recommend
working only with the STI value itself, unless the use of qualification bands
is explicitly required.
• The Bedrock SMxx calculates a heuristic reliability metric for each STI
measurement. If the measurement is found to be unreliable (e.g. due to
disturbance by impulsive sounds), then a red cross is displayed across the
STI value. Crossed-out STI values are more often seen at the beginning of
measurements, when the calculation has not ran long enough to compute
a reliable STI. As soon as the cross disappears, the STI value can be trusted
to be within the usual STI measurement error of 0.03.
Page 19
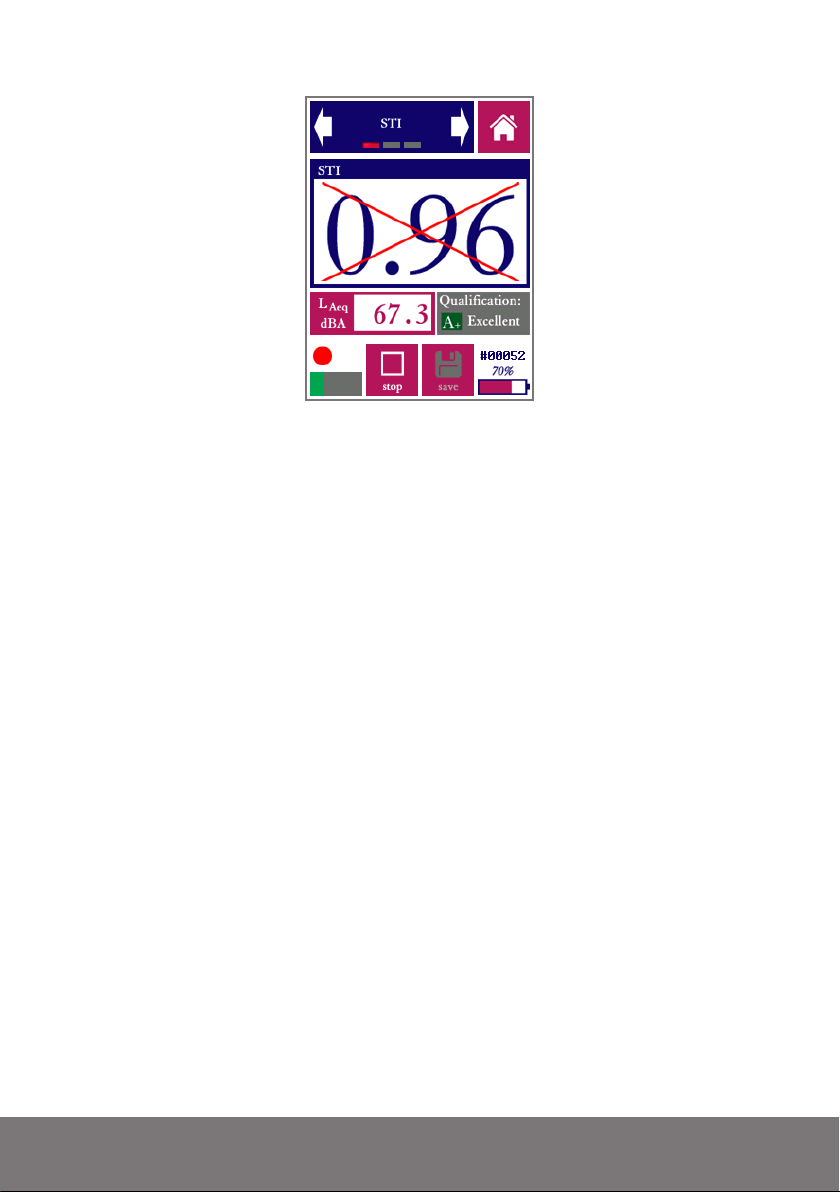
A crossed-out STI value means that the measurement is not (yet) sufficiently reliable
19
Page 20
6.2 STIPA pro (not featured on the Bedrock SM30)
The STIPA pro module is also used to measure the Speech Transmission Index, but unlike
the quick STIPA module, it also comprises features that allow you to analyze and manipulate your measurement data in greater detail. It also uses a somewhat longer measurement
time (25s instead of 18s for Quick STIPA), for improved measurement accuracy.
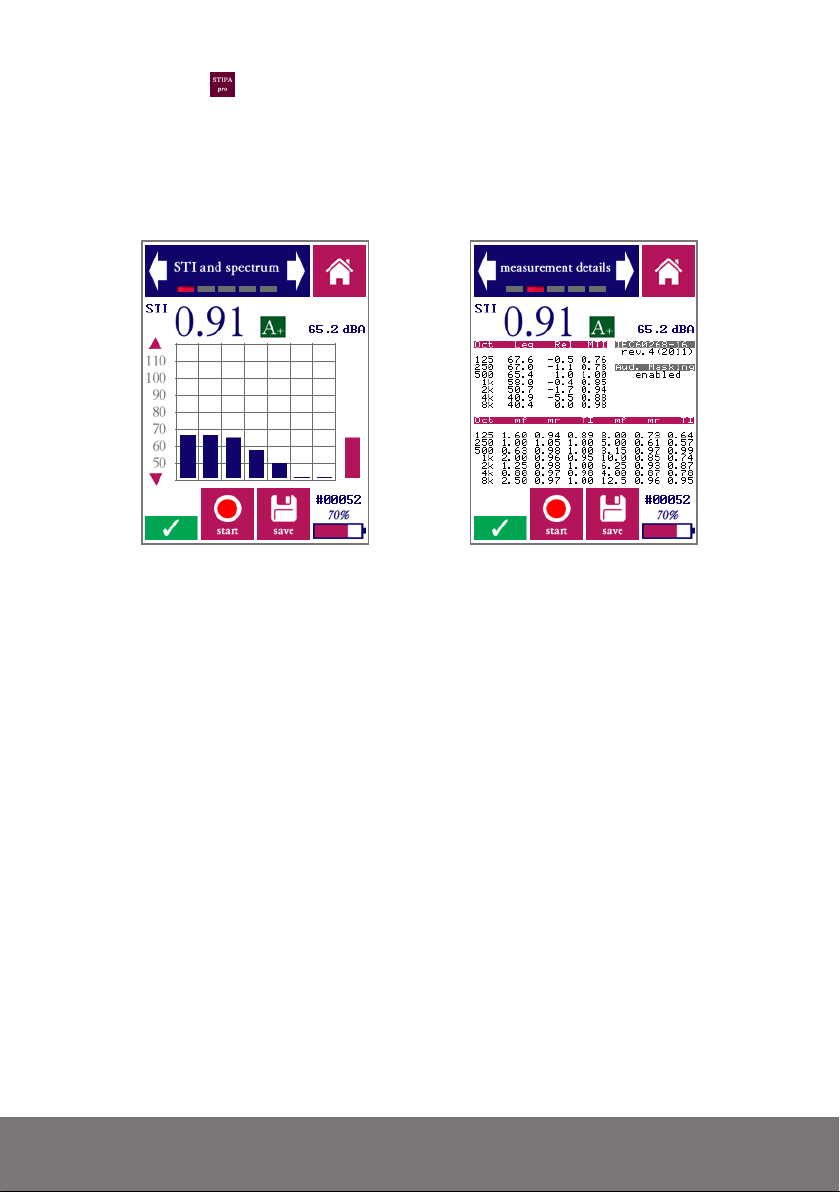
“STI and spectrum” and “measurement details” screen in the STIPA pro module
The STIPA pro module has five screens:
STI and spectrum
Measurement details:
Settings
: configure the STIPA pro module.
Additive noise:
Browse measurements:
Measurements are usually started from the “STI and spectrum” or the “measurement details” screen. STI measurements are set up and started in the same way as when using the
Quick STIPA module (see above). However, in the STIPA pro module, more details about
the measurement are shown, and the user has more elaborate options to configure the
measurement. Measurements are started, stopped and saved in the same way as with the
Quick STIPA module (by using the buttons at the bottom of the screen).
The “STI and spectrum” screen shows not only the current STI value and the A-weighted
sound pressure level, but it also shows an octave band spectrum of the measured signal in
the 7 octave bands from 125 Hz to 8 kHz. The STI analysis is carried out in these octave
bands. The scale of the octave band spectrum plot can be modified by tapping on the triangular arrows to the left of the plot.
: display measured STI, octave spectrum and dBA level
display all measurement details including the MTF
enter and enable/disable a noise spectrum to add to data
review saved measurements
Page 21
The “measurement details” screen shows all the diagnostic details of an individual STI
measurement:
• OCT: The octave center frequency (Hz)
• REL: The octave band levels relative to the STIPA signal spectrum (this is
effectively the frequency transfer function of the tested channel in octaves).
• MTI: Modulation Transfer Index. This quantifies the contribution to the
overall STI from each octave band.
• mr: the m-values (modulation transfer function in octave band OCT for
modulation frequency mf). These m-values are uncorrected, not adjusted
for masking effects and additive noise. Since the STIPA signal features two
modulation frequencies per octave band, there are also two m-values per
octave band. The modulation frequencies are also shown (mf)
• TI: the Transmission Index per octave band for each modulation frequency
These measurement details will enable more experienced operators to determine not only
the speech intelligibility of the tested channel, but also the causes of intelligibility reduction
induced by the channel.
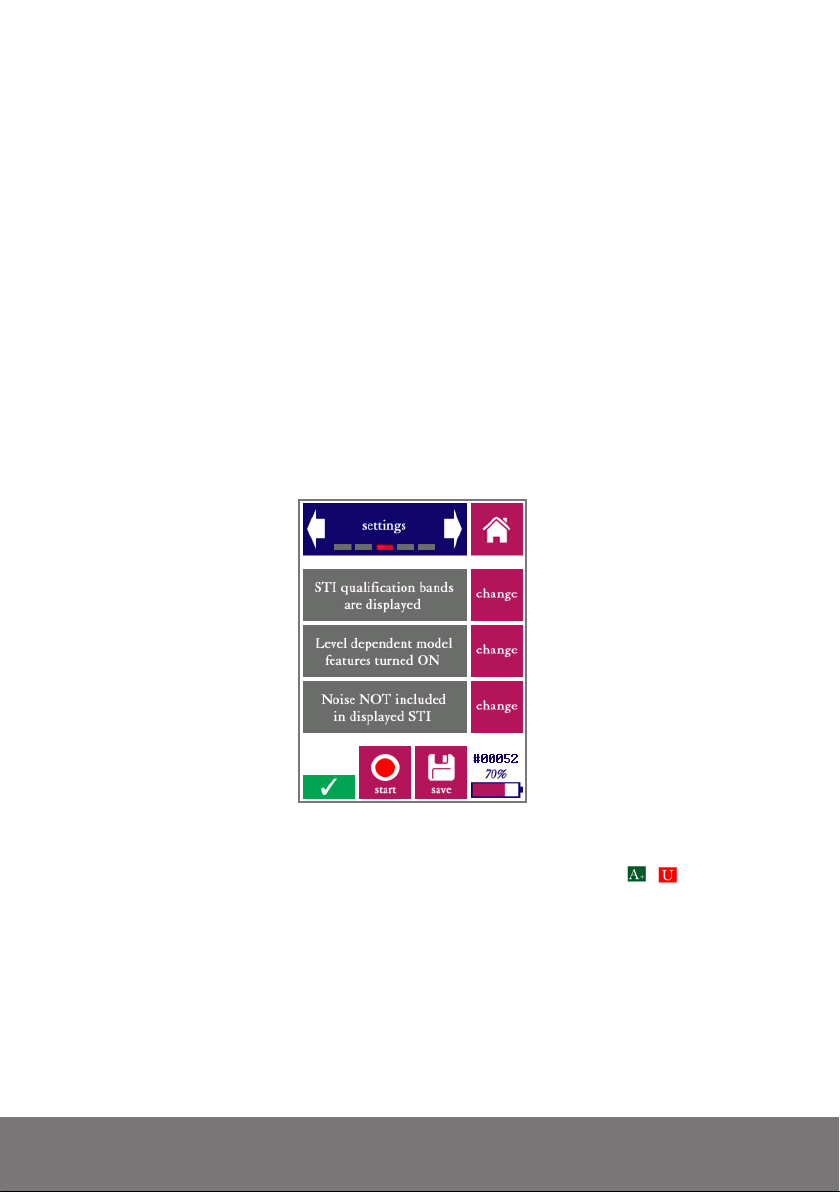
Settings screen
The settings screen gives the user three options:
• Choose whether or not to display STI qualification bands ( - ) as
standardized in IEC-60268-16. We recommend using these only if it is
explicitly required.
• Choose to enable or disable the level dependent model features: level-de-
pendent masking and the speech reception threshold. For standard measure-
ments, these features should be turned ON. Only when all-electric transmission chains are tested (without any acoustics involved) should these features
be turned off, since there is no acoustic level reference in those cases.
• Choose whether or not to (computationally) add noise to the measurement.
21
Page 22
There are two ways to include the influence of background noise in your STI measurement:
• Simply do your measurement in the actual noise environment. The STI
method is designed to incorporate the effects of any noise present during
the measurement representatively in the measured STI. This approach
works well if the noise field is stable and free from fluctuating and impulsive components.
• If you have the option to physically “turn the noise off,” then it is often
more accurate to add the noise computationally in a so-called post-hoc calculation. The SM50 does this for you, if you enter the noise spectrum in
the “additive noise” screen and change the setting to “Noise included in
displayed STI.”
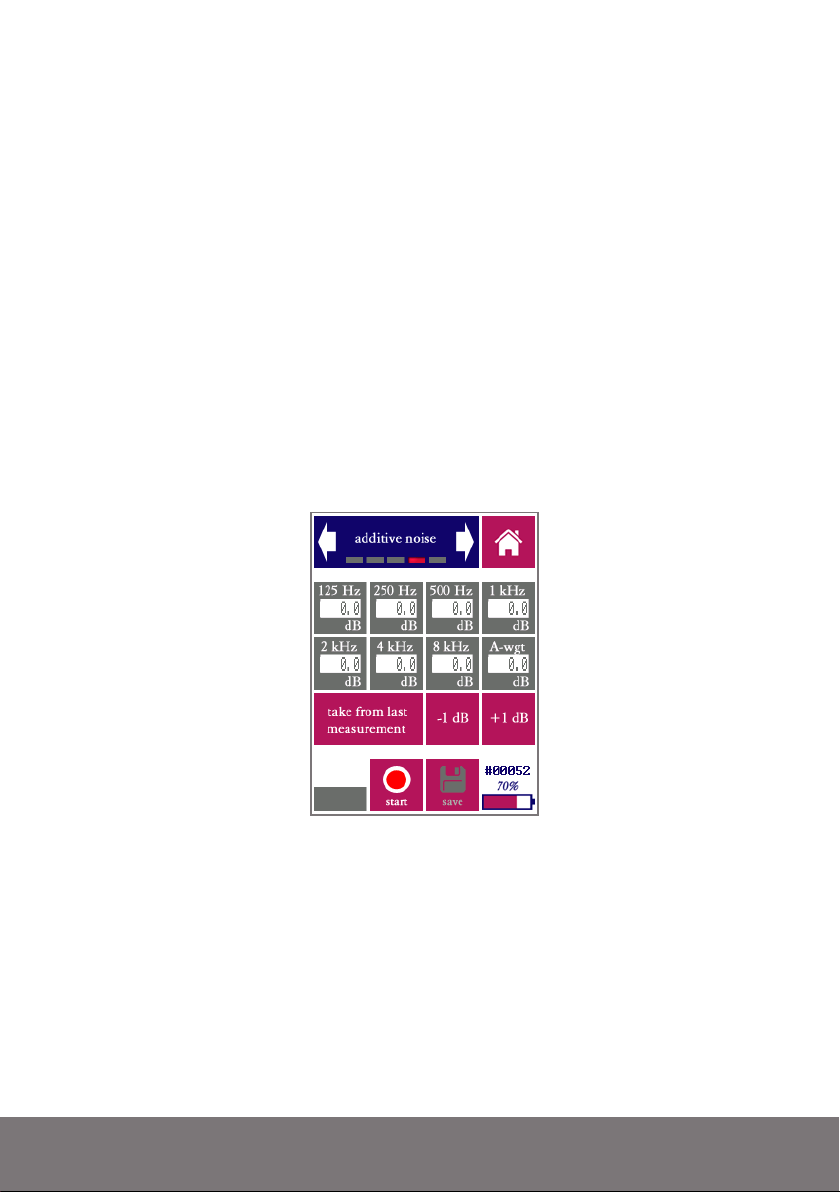
If you wish to add noise computationally, the screen “additive noise” should be used to enter the noise spectrum. Note that the noise spectrum that you enter is only used if you also
select the corresponding option in the settings menu: entering the spectrum is not enough,
you also need to turn the additive noise feature on via the settings screen.
Additive noise screen
A few remarks about adding noise computationally:
• If you add noise computationally, all displayed STI values will be affected
until you turn the additive noise feature off again. The main display field
will now show the STI including the effect of noise.
• At the same time, the noise-free STI (as directly measured) is shown beside
the indication “no noise:”
• Whenever additive noise feature is enabled, the label “N!” is shown next to
the main STI display field. This is just a reminder that the displayed value
includes the effects of (computationally added) noise.
Page 23

• To enter a specific noise spectrum, simply tap each octave band field on the
“additive noise” screen and enter the corresponding octave band level
• Alternatively, you can do a measurement (without STIPA signal playing!) of
the current background noise. Although the STI value will be meaningless,
the noise spectrum will be measured accurately. Save the measurement, and
then press “take from last measurement” ( ) on the “additive noise”
screen. The spectrum now represents the noise spectrum just measured.
• If you enter an A-weighted value after pressing the “A-wgt” field, all bands
will be increased with an equal amount until the A-weighted level is
matched. This is a quick way to lower or increase the overall level, and
also to generate a pink noise spectrum of a given A-weighted level (as the
default spectrum shown is pink).
• The buttons “-1 dB” and “+1 dB” adjust the levels in all bands by 1 dB.
You can browse through all measurements saved earlier in the “browse measurements”
screen. The following tips and pointers may be useful to remember when browsing STI
measurements with Quick STIPA and STIPA Pro:
• Measurements saved in Quick STIPA can be browsed in STIPA pro, and
vice versa. The measurement numbering range is shared between these
modules. This means that you can use STIPA pro to investigate measurements done with Quick STIPA in more detail using the browsing screen in
STIPA pro.
• The settings you choose in STIPA pro (additive noise, level dependent
masking) affect the current measurement, but also affect which data is
shown in the measurement browser. This means that you can always enter
a noise spectrum and see how this affects measurements you did earlier
on. Similarly, you can go back later on and see what affect level dependent
masking has for a certain measurement.
• All data for each measurement is always saved - including any data not
actually shown during the measurement itself, including the time and date.
• Measurements can also be retrieved over USB; please refer to the section
“accessing saved measurements on a PC” for further instructions. For larger
numbers of measurements, processing of these saved data files (e.g. through
worksheet software) may be more efficient than inspection through the
measurement browser.
• If you wish to reset the measurement number (restarting at number 1), you
need to connect the device to a PC. Remove all measurement files (.CSV)
from the directory STIPA, as well as the file _INDEX.DAT.
23
Page 24

6.3 Full STI (not featured on the Bedrock SM30)
The Speech Transmission Index (STI) can be measured by means of various test methods.
The STIPA method, as implemented by the Quick STIPA and STIPA pro modules, is a fast
and efficient version of the STI originally developed for public address systems. Although
fast and robust, STIPA has its limitations: only 2 modulation frequencies are measured per
octave band, whereas the complete Speech Transmission Index measurement scheme calls
for 14 modulations per octave band. This means that STIPA is undersampled in the modulation domain. For many systems, the measured STI is not (or hardly) affected. However,
some cases call for “Full STI” measurements:
• Whenever echoes are present (delayed loudspeakers, large halls and cathedrals)
• When tested systems or channels feature complex combinations of distortion factors.
Full STI measurements were available in commercial measuring tools up to the late 1990s,
but have subsequently been absent from the market for two decades. The fact that a full
STI measurement used to take around 15 minutes made Full STI measurements entirely
impractical. Also, the introduction of STIPA around 2002 made a reasonable alternative
available.
The Full STI module now available on the SMxx fully implements every aspect of the
Speech Transmission Index model, making it the most universally applicable speech intelligibility metric to date:
• Fully compliant with the Full STI definition according to IEC-60268-16
• Computes the complete 14x7 Modulation Transfer Function matrix
• Uses an efficient algorithm that completes the measurement in approx. 1 minute
• Implements the direct measurement method as defined in IEC-60268-16
The “direct method” (in which a modulated test signal is presented to the channel under
test), as implemented here, has crucial advantages over the “indirect method” (where the
STI is estimated based on a measured impulse response). The indirect method implicitly
assumes that the channel under test is a linear time-invariant system. Whenever electroacoustic components are involved, the tested channel never fully satisfies the linearity requirement. Indirect estimates are notoriously inaccurate in many real-life scenarios, but
have nonetheless been used extensively, for lack of alternatives based on the direct method
(such as this module).
The Full STI module implements a novel measurement algorithm, that leverages the advanced signal processing capabilities of the SMxx. This algorithm, which is documented
separately in an Embedded Acoustics white paper, has: he following characteristics:
Page 25
• A novel test signal is used, which repeats 7 different patterns (segments) in a circular
fashion.
• Each pattern roughly follows the approach of STIPA: each octave band is simultaneously modulated with 2 modulation frequencies.
• Each pattern takes approx. 9 seconds to complete. The whole measurement is completed in 65 seconds.
• The patterns are set up in such a way that all modulation frequencies (out of the set
of 14) have been used in each octave band once the full 65 second cycle is completed.
Hence, all 14 modulation frequencies are tested in all 7 octave bands.
• The first phase of a new measurement is a synchronization phase, during which the
analysis algorithm determines when to expect transitions between patterns.
The Full STI test signal is included on the flashdrive bundled with the SMxx, and will be
available on the Bedrock BTB65 Talkbox starting May 2017. Note that the Full STI signal
is copyrighted material; all audio files of the signal released by Embedded Acoustics are
watermarked. Use of the signal other than directly with the SMxx requires a license from
Embedded Acoustics.
The measurements themselves are no more difficult or complex to carry out than STIPA
measurements. The procedure is largely the same; only the duration is longer and the results are more univerally representative of true speech intelligibility.
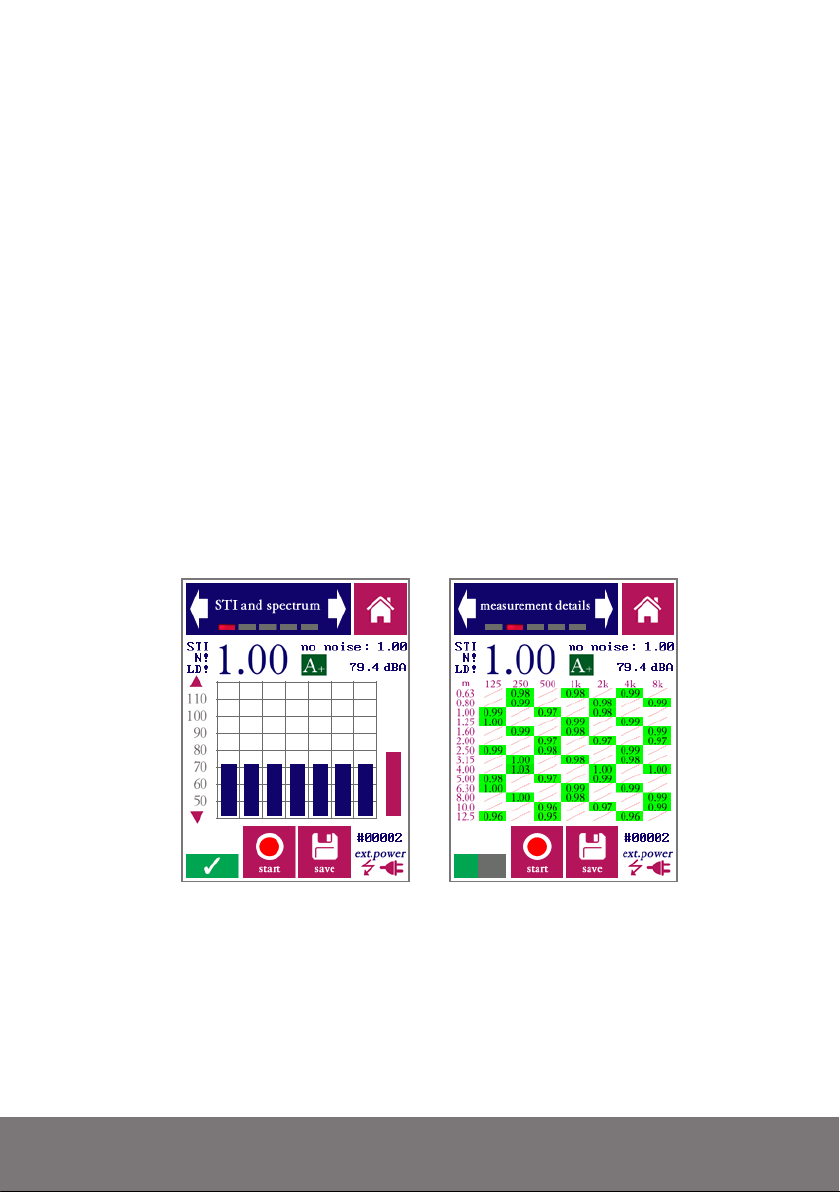
Full STI measurement result (left) and MTF details (right)
The Full STI module has the same overall design as the STIPA pro module, including
the option to computationally add noise. The main difference is the second screen, which
visually represents the Modulation Frequency Transfer (MTF) matrix as it gradually fills
up during the measurement. The user has the option to stop the measurement before the
full cycle has completed, shortening the duration of the measurement. This makes sense
if the STI remains stable across multiple phases of the signal. The result of a prematurely
25
Page 26

ended Full STI measurement can be thought of as a compromise in between STIPA and
Full STI.
Please refer to the section on the STIPA pro module (6.3) for a description of the various
features and controls of the module (additive noise, qualifications bands, disabling leveldependent masking, etc).
Page 27
6.4 Speech Level Meter (not featured on the Bedrock SM30)
In the context of speech intelligibility measurements, special care is needed when determining the sound pressure level of running speech. As human talkers use their articulators
to form speech utterances, they alternately produce high-intensity bursts of acoustic energy
and naturally occurring pauses. Across the length of a spoken sentence, periods of silence
roughly account for half of the total time (length) of the sentence. Those pauses do not
necessarily contribute to the intelligibility of the sentence, but they do have an influence on
the overall (equivalent continuous) sound pressure level of the sentence. There is a firmly
established relation between speech-to-noise ratio (SNR) and speech intelligibility - but
how do we determine the speech level to calculate (SNR)?
It has been shown that removing the pauses from speech increases the correlation between
SNR and subjective speech intelligibility. In the 1990s, a method was developed within European ESPRIT project 2589 (SAM) to assess speech levels while removing the influence
of natural pauses. This method is known as Speech Level Meter (SLM) and is included in
IEC-60268-16 as part of a normative annex (Annex J). This Speech Level Meter module is
a direct implementation of this method.
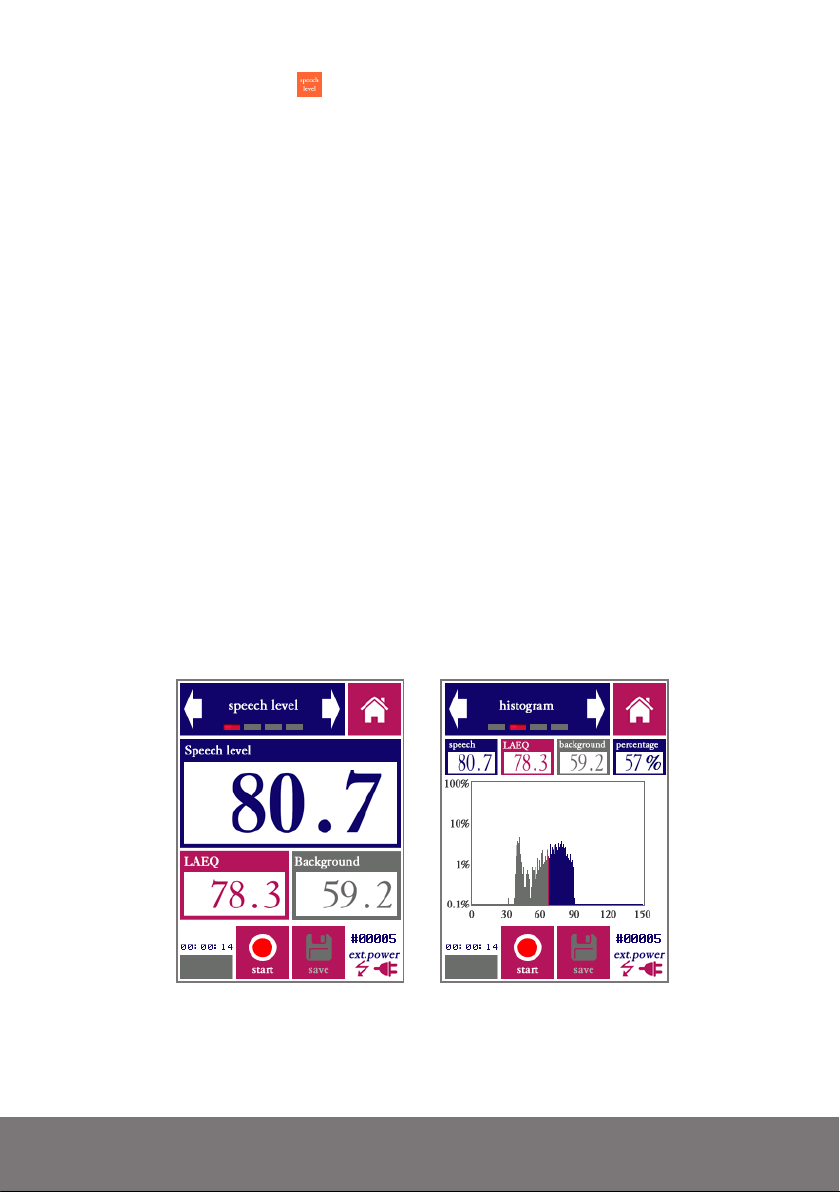
The procedure consists of the compilation of a level histogram, which normally reveals
a bimodal distribution: a low-level mode which represents the background noise, and a
higher-level mode which represents speech. The RMS of speech and background noise can
be calculated separately by summing the two modes in the histogram separately. The criterion for separating the two modes is a threshold that is set 14 dB below the SPL presumed
to correspond to speech.
Estimated speech level (left) and histogram on which the estimate is based (right)
To use the Speech Level Meter, simply carry out a measurement while sampling running
speech. The SPL of speech and background noise are calculated, as well as the total LAeq.
27
Page 28
7. Level and spectrum
7.1 SPL meter
The Bedrock SMxx, as a Sound Pressure Level meter (also known as SPL meter or SLM)
complies either with IEC 61672 Class 2 and ANSI S1.4 Type 2 (SM30 and SM50) or IEC
61672 Class 2 and ANSI S1.4 Type 1 (SM90). It is classified as a group X instrument.
The SPL meter modules features three screens: SPL measurements, settings and browse
measurements.
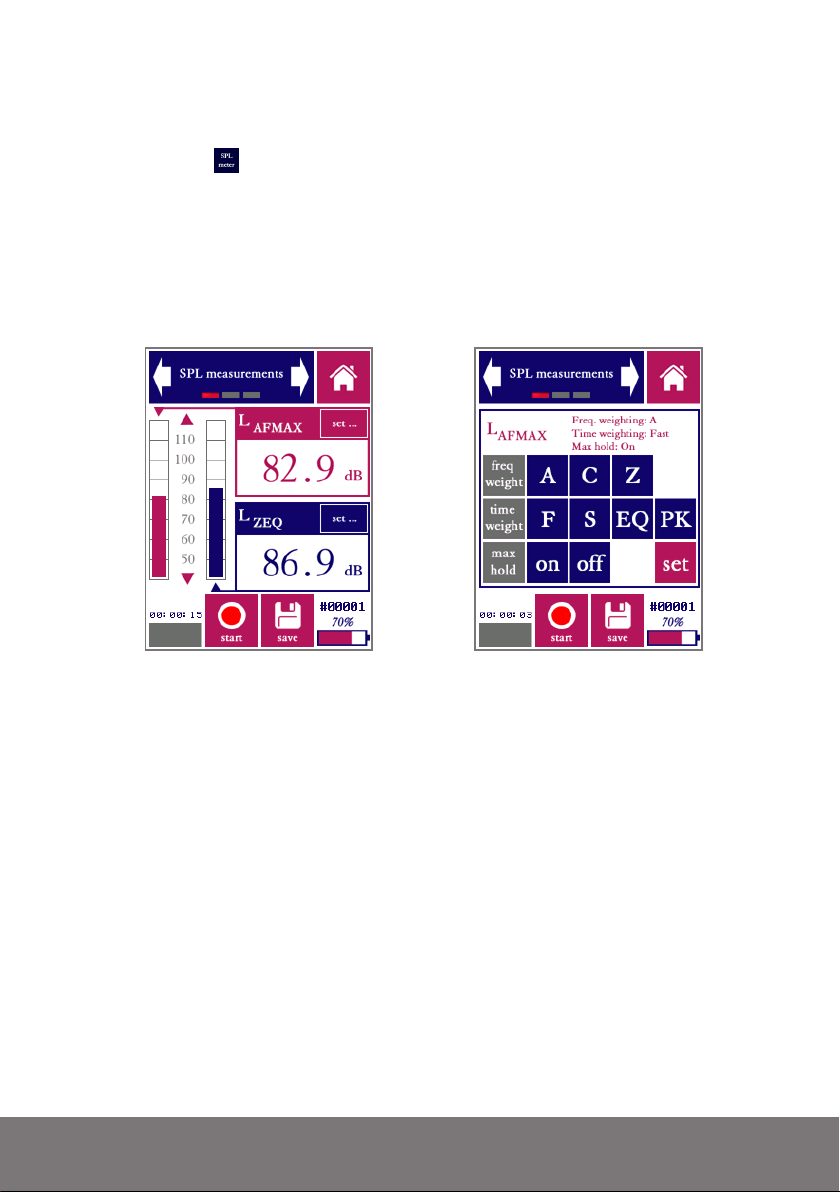
SPL measurements screen, during measurement (left) and with settings keyboard showing
(right)
The following sound pressure level measurement settings are supported:
• Time weighting: Fast (F) and Slow (S)
• Frequency weighting: Z (linear, unweighted), A-weighted, C-weighted
• Max hold (holds and displays the maximum level during the measurement
interval; used with either Fast or Slow time weighting)
• Equivalent continuous (EQ): computes the time-integrated level over the
measurement interval; the level shown corresponds to the level of a continuous signal containing the same amount of energy as the measured signal.
• Peak values (PK): the highest instantaneous value within an interval
Note that MAX and PK are not the same; MAX represents the highest measurement over
a short time averaging period (either FAST or SLOW), and PK represents the highest
instantaneous value in the signal (even if this is a peak of very short duration). The SMxx
allows PK measurements in combination with any frequency weighting, but only LCPK
is commonly used.
Page 29
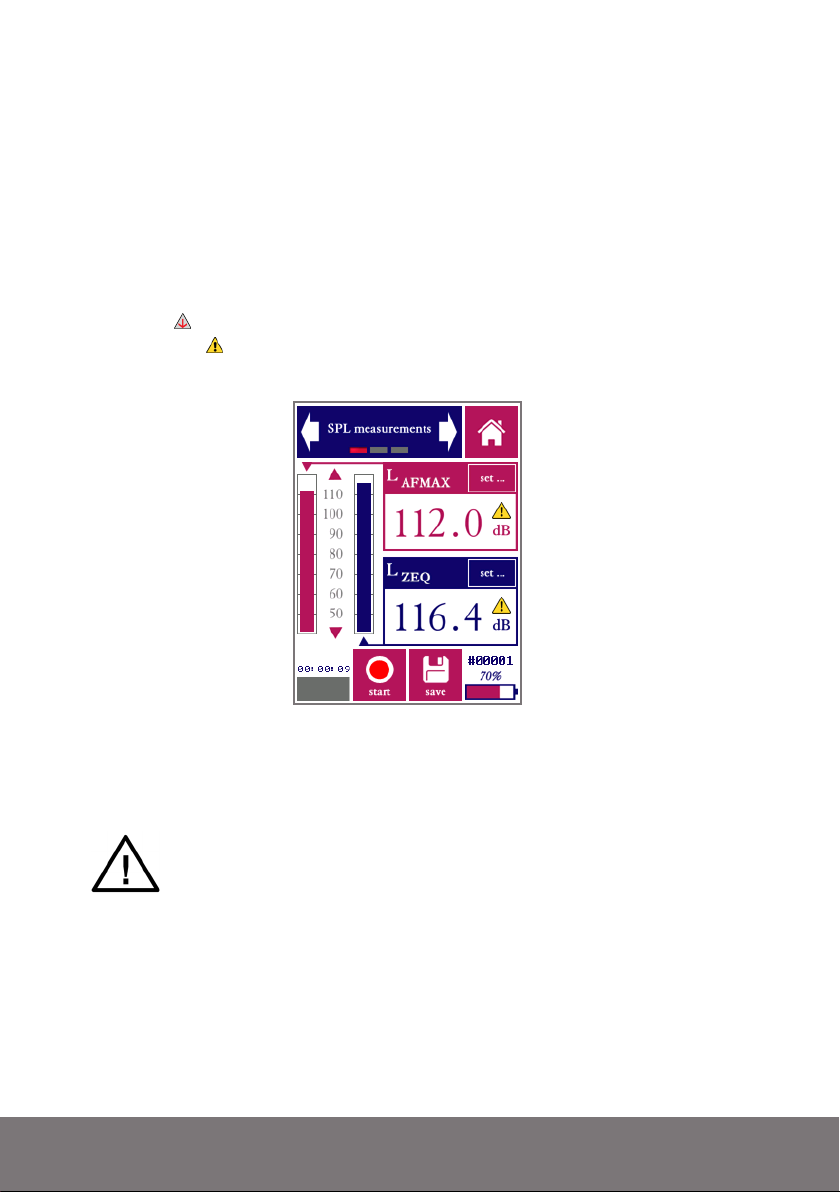
Once a measurement has started, each combination of the above settings is measured simultaneously. However, not all of these combinations are displayed: only two level measurements are displayed at the same time. Each of these two levels is shown in its own bar
graph and its own digit field. The red graph corresponds to the red field, the blue bar graph
to the blue field. You are free to select which level to display in each of the two fields. Tap
the “set” button in the level field to choose time weighting, frequency weighting, max hold
and time integration settings for the corresponding field.
The SMxx will warn you if the signal level is outside the linear range of the microphone.
This occurs if the signal level is too low in comparison to the noise floor of the microphone
(underrange ) or if it approaches the maximum acoustic level that the microphone can
handle (overload ). Both types of range warnings are shown as a warning label next to the
corresponding measurement value.
Range warnings are shown in both level fields if the signal level is either too low or too high
(such as in this example).
The limiting factor for the overall dynamic range of the measuring system is
usually the microphone. If the standard microphone is replaced by a microphone of a different type, the displayed overload and underrange warnings
may not be reliable. Please check the Bedrock audio online support pages
to find out for which microphone types (besides the standard microphone)
range warnings are supported. If you replace the microphone, it may be necessary to patch the system firmware with a specific update package.
For MAX, EQ and PK measurements, the range warnings will be displayed from the moment the underrange or overload condition occurs until the measurement is restarted. For
FAST and SLOW measurements, the range warning will disappear once the overload/
underrange condition has passed.
29
Page 30

The settings screen in the SPL module allows you to set the measurement time. Once you
press start, the measurement will run for as many seconds as you choose here. You may also
choose to let measurements run continuously; you then determine the measurement time
manually, by choosing the moment you press “stop.”
The SPL meter module also features are measurement browser, that lets you review previously saved sound pressure level measurements. Note that the measurement browser will
not display FAST or SLOW values, only MAX, EQ and PK. The reason for this is that
FAST and SLOW values are fluctuating measures; these are not single values characterizing the measuring interval corresponding to any measurement number, and therefore
cannot be displayed except in real-time, during the measurement itself.
A few things to note about SPL measurements and the SPL meter module:
• By definition, “max hold”, “EQ” and “PK” are mutually exclusive settings.
• The elapsed measurement time is shown above the progress bar. If the
measurement interval is set to “continuous,” the measurement will run until it is manually stopped. Note that, in practice, the maximum measuring
time is limited by:
• The batter y. When measuring continuously, the battery is drained
relatively quickly (within 3-4). For longer measurements, we recommend using the charger or an external power bank.
• Internal data storage, especially if you are recording all measurement audio (per the option in the “Settings” module). When recording audio, the internal storage fills up in about 5 hours.
• When you press “save,” data from the current measurement is stored. Results based on all time and frequency weightings are saved; not just the
results that are currently displayed. However, as remarked above, since the
instantaneous levels fluctuate throughout the measurement, these cannot
be saved as a single number representing the entire measurement interval.
So for each saved measurement, just the maximum level (max hold) and
equivalent continuous level (EQ) and Peak level (PK) are saved.
• As a logical consequence, the measurement browser can only display Max
Hold, EQ and PK results from earlier measurements. If you set a display
field to show instantaneous values, the measurement browser will leave this
display field blank.
• You can use the measurement browser to go back to earlier measurements,
and see what the level is with different time- and frequency weightings
applied.
• The measurement numbers form a separate consecutive series for each
module. That means that the same measurement number might occur
multiple times (once for each module; e.g. number #0002 might exist for
SPL as well as RTA, STIPA, etc.)
Page 31
7.2. LAEQ logging
The LAEQ logging module is intended for long-term monitoring and logging applications.
When running this module, the Bedrock SMxx keeps track of how the equivalent-continuous A-weighted sound pressure level (LAEQ) develops over time. This is displayed on the
device and also logged, for download to a PC later on. Other frequency weightings (C,Z)
are also applied, and the corresponding levels are logged - but only LAEQ is displayed.
This module can be used for several purposes:
• monitoring of environmental noise sources
• monitoring and logging of sound levels at music venues
• measuring sound levels of multiple events across a large time span
Instantaneous and time-averaged data are shown on the display. If you enter a level limit,
a warning (“traffic light”) will be displayed to indicate whether the limit is currently being
exceeded. The log file is automatically saved, and can be used to demonstrate that (legal)
limits were not exceeded.
The LAEQ logging app measures three different metrics:
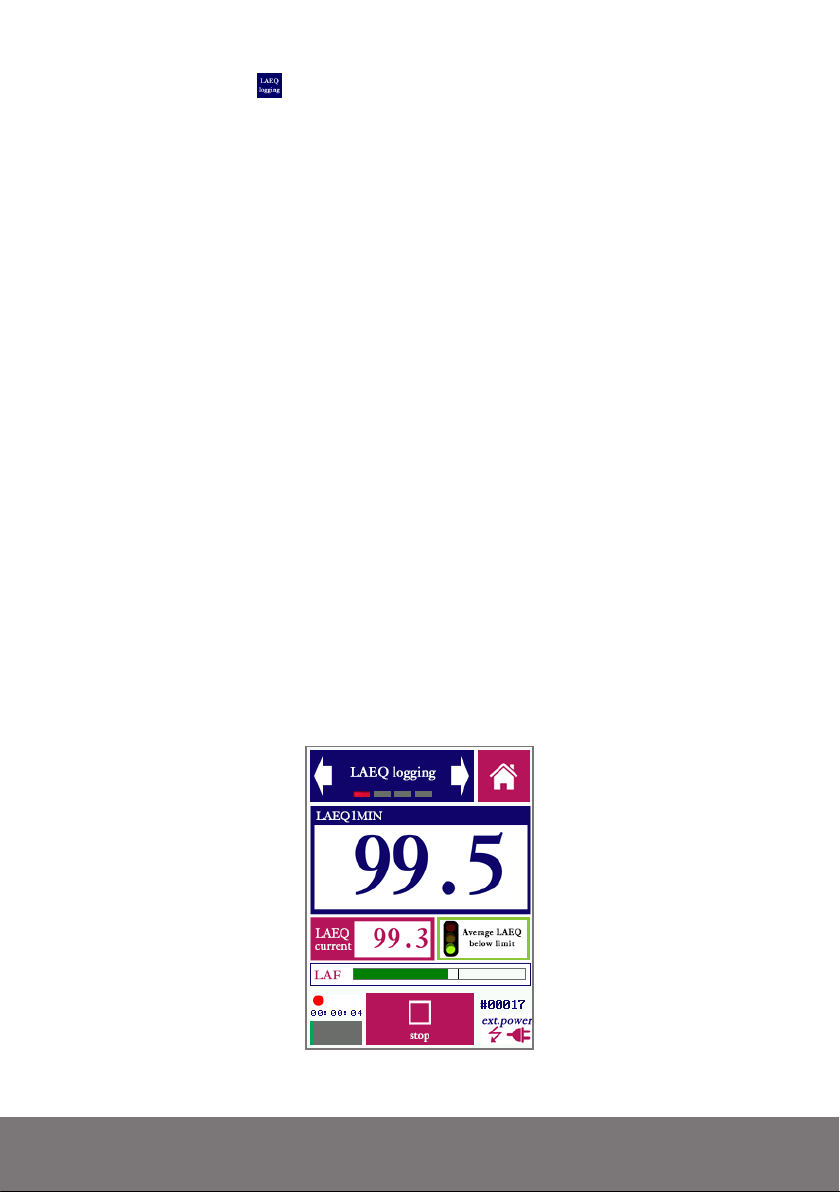
• The LAEQ during a short time period between 1 and 60s. This is level (“LAEQ cur-
rent”) can be thought of as the current contribution to the overall sound exposure.
• The LAEQ across a longer time span (1-60 minutes), calculated as a movering aver-
age of a series over shorter time periods (i.e. a moving average of the series of “LAEQ
current” measurements). For example: the average LAEQ across a time span of 15
minutes is indicated as LAEQ15MIN.
• The current instantaneous level with FAST time weighting (LAF). This measure is
not logged; it is only displayed as in the form of a bar plot, to obtain a quick impression
of how the instantaneous level at any moment is affecting the LAEQ.
The LAEQ module showing the moving average LAEQ across 15 minutes.
31
Page 32
The LAEQ logging module has a start/stop button similar to all other modules, but unlike other modules, it has no “save” button. Since this module is specifically intended for
logging purposes, all data is always saved to a text file. Whenever a new measurement is
started, the measurement number is automatically incremented and a new file is opened.
This means that data is never inadvertently discarded (e.g. by forgetting to press save after
a lengthy session).
LAEQ logging sessions can run for a long time, up to many days. Before starting
a long session, always check if there is enough free storage on the device. When
recording audio (an option available through the settings module), the memory
fills up in 3-4 hours. We recommend disabling audio recording on long sessions.
The log files of sessions that span multiple days are split up. Every day at precisely midnight, the log file is closed and a new file is opened.
As an example (for the purposes of this manual), we will assume that time averaging takes
place over a window of 15 minutes, resulting in LAEQ15MIN (which is a commonly used
setting for sound exposure monitoring at music venues). However, note that the averaging
time can be adjusted to any period between 1 and 60 minutes.
The LAEQ15MIN as displayed on the screen is the moving average of a series of “LAEQ
current” measurements. The shorter the time period used for LAEQ current, the more
values are used to compute LAEQ15MIN (and the longer your log file will become, since a
line is written for every LAEQ current period). If you choose a short period for LAEQ current then you will be able to determine fluctuations in the measured level more accurately,
but you may end up with a lot of data to sort through. There is a trade-off; the optimal
choice depends on the application.
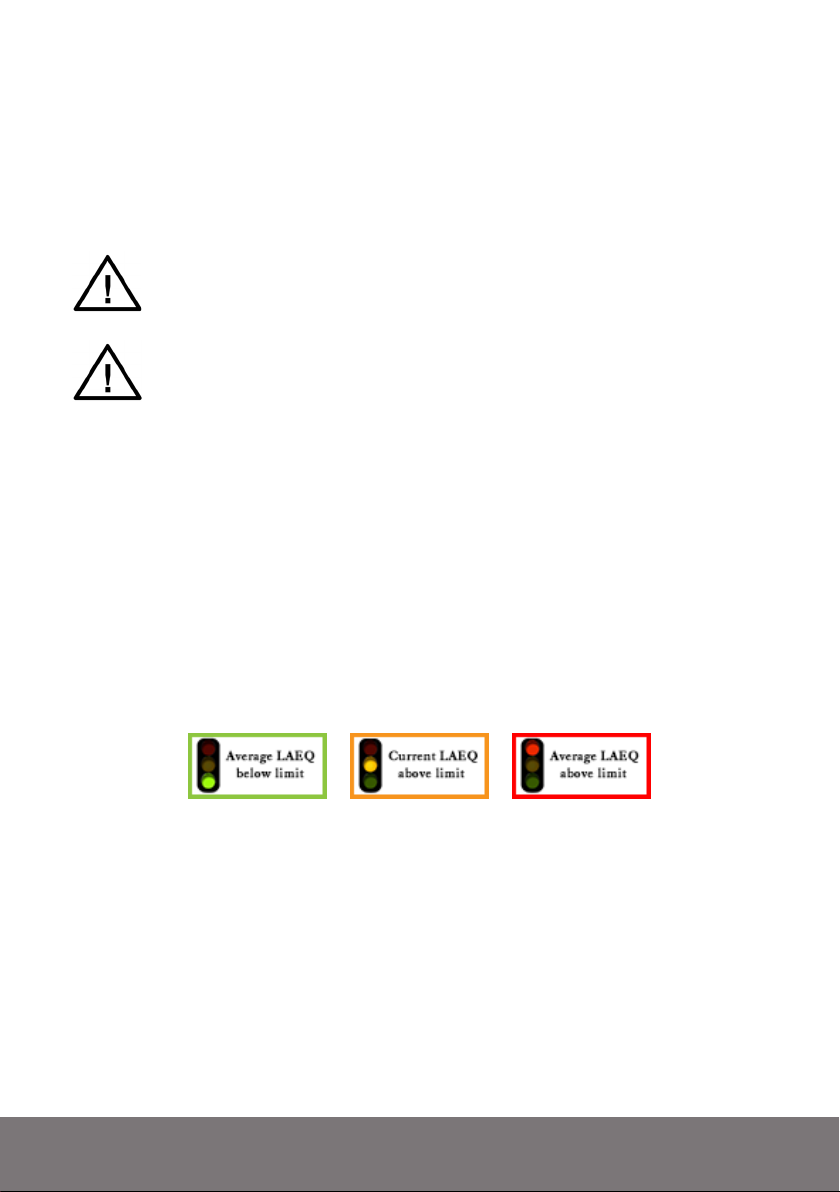
“Traffic light” indicating whether the limit is being exceeded.
If the LAEQ15MIN exceeds the preset level limit, the traffic light indicator will turn red. If
the LAEQ15MIN is still below the limit, but LAEQ current exceeds the limit, this implies
that the LAEQ15MIN will eventually reach the limit if the current levels do not go down.
In that case, the traffic light will be yellow/orange. If the LAEQ15MIN as well as the current value are below the limit, then the traffic light shows green.
The first screen of the LAEQ monitoring module (see previous page) gives the levels in
large digits, and creates a quick overview. The second screen (see next page) shows a graph
of the running series of “LAEQ current” measurements, which gives a good feel of how
the overall level is developing.
Page 33
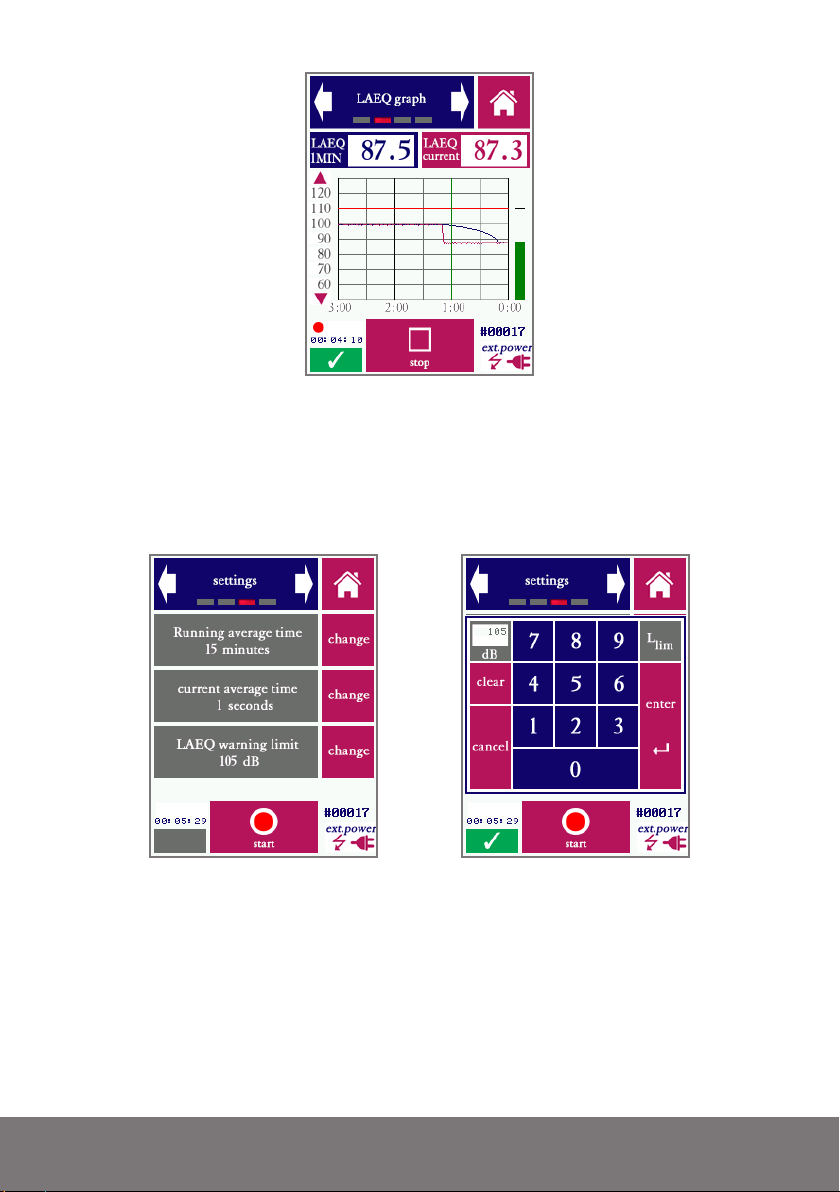
Screen 2 of the LAEQ module, showing a graph of how the average LAEQ is developing.
In cases where the operator has control over the measured sound level (i.e. through control
of a PA installation), and is using the Bedrock SMxx to make sure that the level is kept
below the limit, the graph gives a useful insight into how much “room” there is below the
limit. In cases where noise events (such as train passage) are monitored, the graph shows a
recent history of events.
Settings screen; the right picture shows the keyboad that appears when the “change” button is
pressed to adjust the warning limit
As with all modules, the LAEQ logging module has a screen which can be used to set all
parameters (in this case: LAEQ averaging time (1-60 minutes), current intervals (1-60 seconds) and the level limit. Values are entered through a keyboard that appears upon pressing
“Change.”
33
Page 34
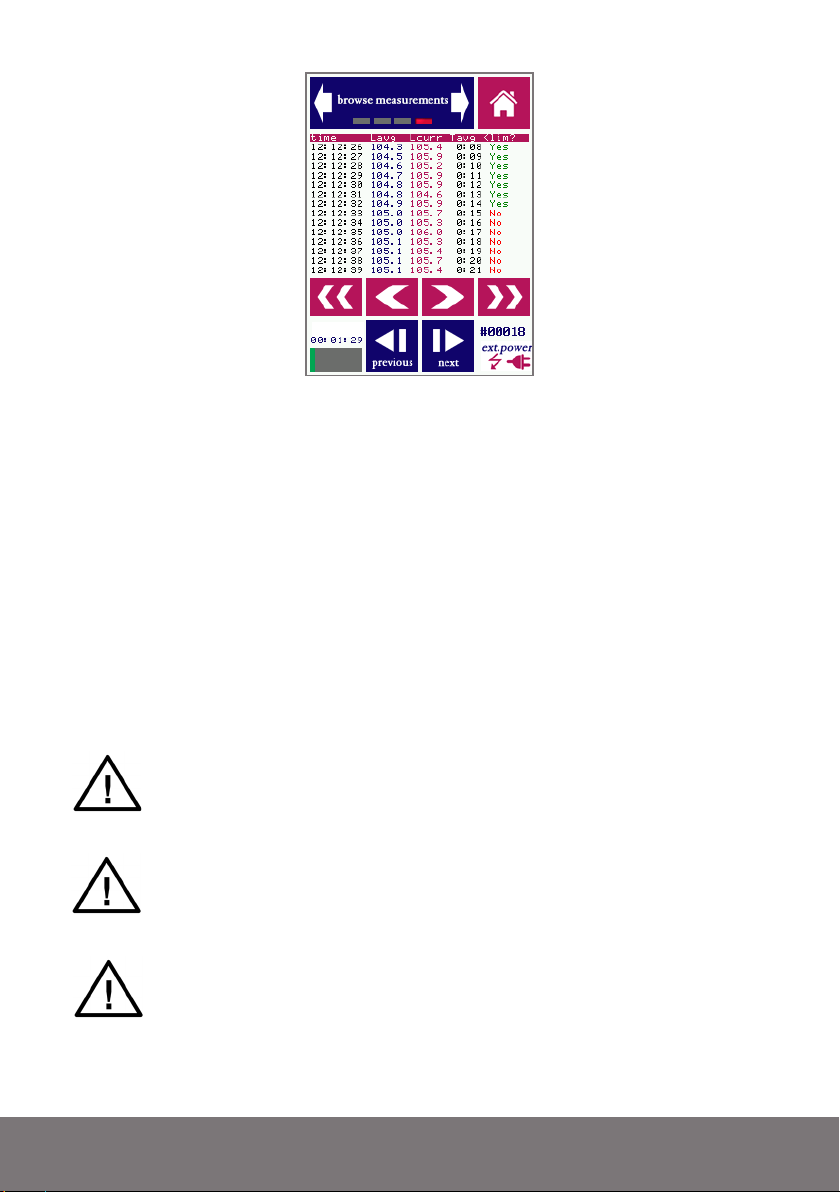
Browsing through measurement data
Browsing through measurement data works a little differently than in other modules, since
the amount of data associated with a measurement file can be very large. In many cases, it
will not be practical to inspect the data from the device itself, and data will be downloaded
to a PC first.
The blue buttons are used to browse through all earlier log files stored on the device. Note
that each file may span anywhere between a few seconds and many hours, depending on
how much time elapsed until the “stop” button was pressed. Within each file, you can scroll
through the data with the red arrow buttons (single arrow to scroll line-by-line, double
arrow to quickly scroll page-by-page). Each line shows the time, the current level for the
corresponding measurement interval, the average LAEQ and an indication whether or not
the limit was exceeded.
Long sessions may be broken into multiple files by pressing stop and (immediately) again start. If the device crashes unexpectedly (e.g. in case of power failure), there is a chance that (part) of the log file may be lost. By breaking the
session up in multiple files, the risk of losing data is reduced.
For long sessions (>3 hours), you will need to power the device from an external
power source (such as a PC, power bank or the USB charger). A new log file is
automatically started once every 24 hours, at midnight exactly.
Note that the log file contains more information than shown on the device. In
particular, not just the time but also the date is stored, and also C- and Z-weighted levels. Make sure that the date and time are set correctly (though the settings
module).
Page 35
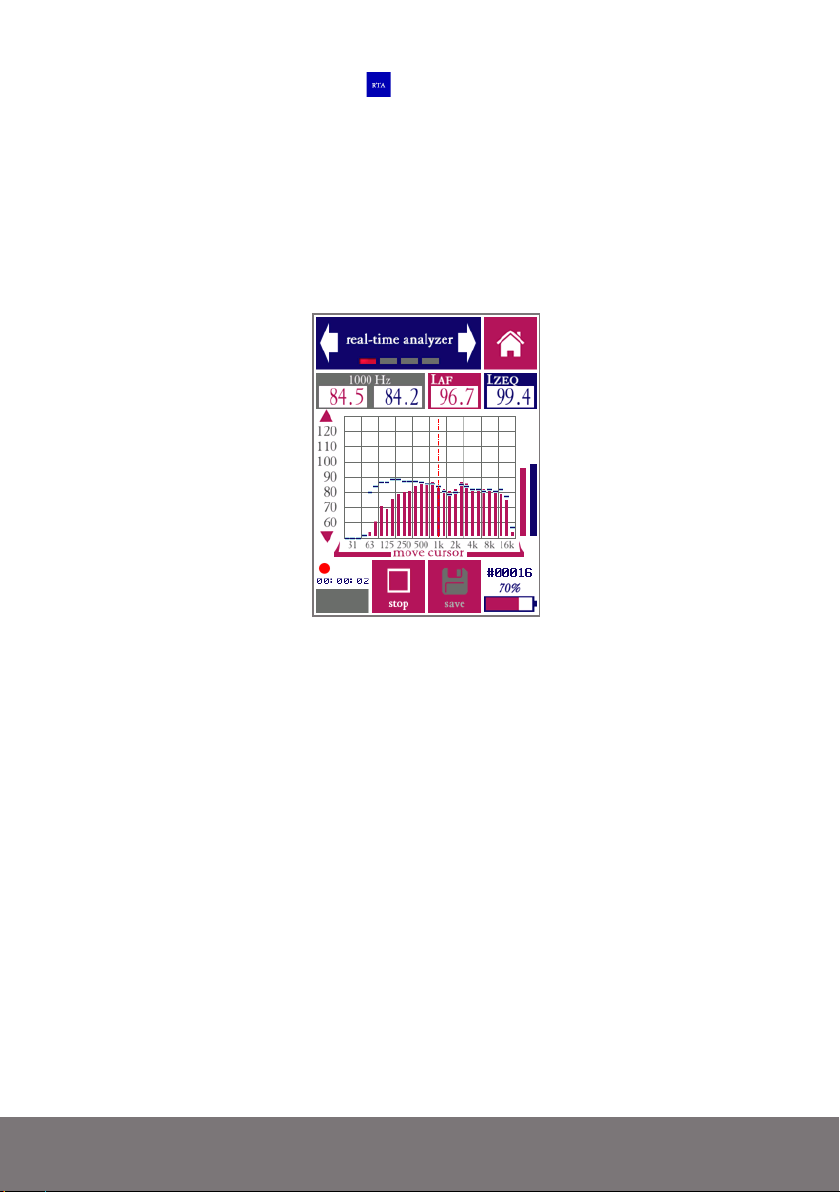
7.3. Real-Time Analyzer (RTA)
The RTA module is intended for frequency analysis in the range from 20 Hz to 20 kHz.
The bandwidth of the frequency bands can be set to 1/1, 1/3, 1/6 or 1/12 octaves. We recommend 1/1 or 1/3 octave analysis for most uses, unless a finer frequency resolution is needed.
The operation is generally similar to the SPL module, but instead of just the overall signal
level, a frequency analysis (into separate frequency bands according to IEC-61260:2014
class 1) is also shown.
RTA main measurement screen (1/3 octave band mode)
The RTA module has the ability to present two different spectral views at the same time,
differing in frequency weighting (A, C or Z) and time averaging and integration (FAST,
SLOW, MAX, or EQ). The main spectrum is presented in red bars, while a second (auxiliary) spectrum is shown in blue lines. The corresponding broadband levels are also shown,
to the right of the spectrum.
While the spectrum graph already gives a first impression of the spectral content of the
measured signal, you may wish to read the exact value in each band. This is done by placing
the cursor (dashed line) over the band of interest. The cursor can be moved left and right
by pressing on the left or right side of the frequency axis (or the area of the graph above
the axis). The values for the selected band are shown in the grey field on the top left of the
screen (main weighting shown in read, aux weighting in blue - same color as the spectrum
bars).
The “measuring time” screen can be used to set the duration of a measurement to a fixed
value. The measurement can also be set to run until stopped manually. The “settings”
screen allows you to switch frequency resolution, and to change the weightings for the
main and auxiliary spectrum views.
35
Page 36

By pressing the “save” ( ) button in the main measurement screen, you store the current
measurement on the devices internal storage, using the measurement number indicated
above the battery indicator.
Some remarks about the RTA module:
• By definition, “max hold” and “EQ” are mutually exclusive settings.
• The elapsed measurement time is shown above the progress bar. If the
measurement interval is set to “continuous,” the measurement will run until it is manually stopped. The progress bar itself is not used when measuring continuously.
• Once saved, measurements can only be retrieved with the same frequency
resolution (i.e., a measurement carried out with 1/1 octaves cannot be retrieved as an 1/3 or 1/6 octave band spectrum).
• However, data recalled through the measurement browser are shown with
the frequency weightings selected at the time the measurement is recalled
- even if these are different from the settings that were in effect during the
measurement. This allows you to inspect the effect of frequency weightings
on all measurements saved previously
• Note that the spectrum and its corresponding broadband level are affected
by the same time- and frequency weightings. In other words, if the main
spectrum is A-weighted, then the level shown in the red field is also Aweighed (and vice versa). If you wish to display a Z-weighted spectrum and
an A-weighted level at the same time, you need to display these in different
channels (main and aux).
• The measurement numbers form a separate consecutive series for each
module. That means that the same measurement number might occur
multiple times (once for each module; e.g. number #0002 might exist for
SPL as well as RTA, STIPA, etc.)
• The filters comply with the requirements of IEC-61260-1:2014 class 1 and
IEC-61260:1995 class 0.
Page 37
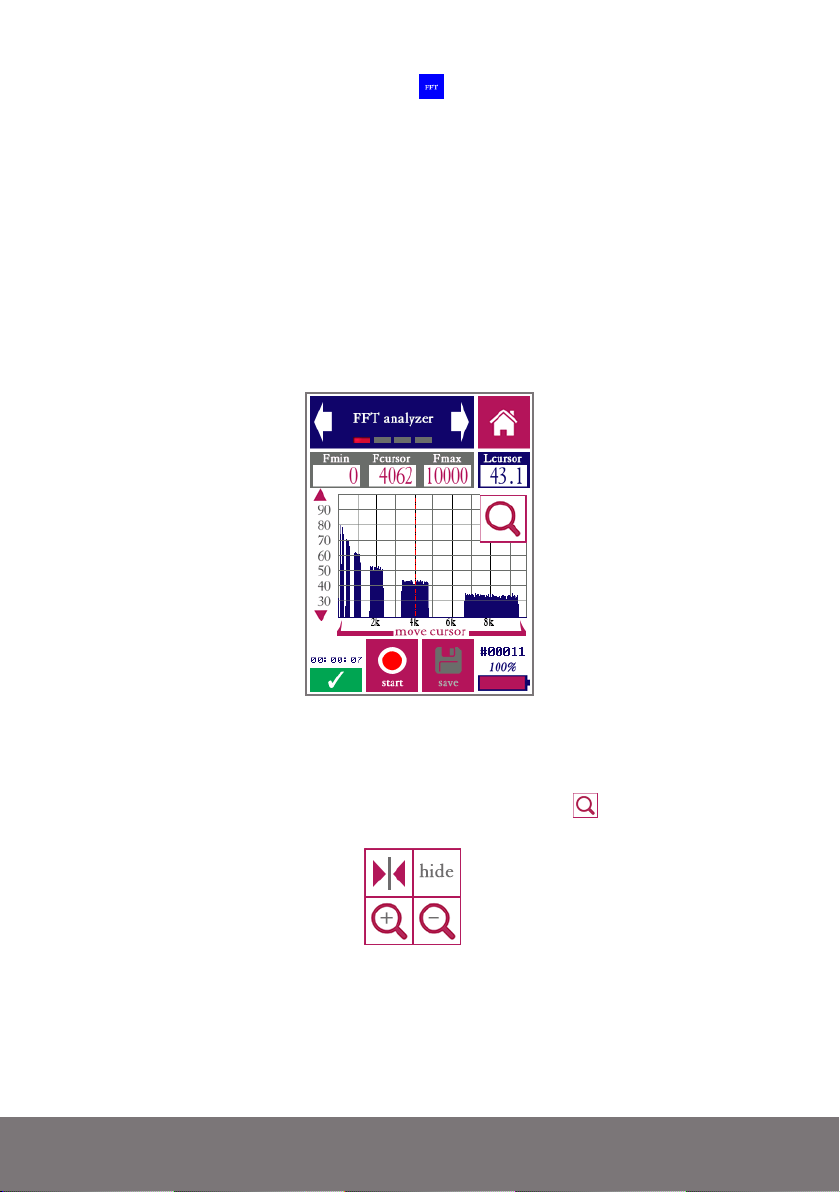
7.4. Fast Fourier Transform analyzer
The FFT module allows you to perform spectral analyses with a much higher frequency
resolution that the RTA module. This is very useful if you are looking to identify the exact
frequency and level of certain signal components, or if you want to study the harmonic
structure of sounds.
The maximum frequency resolution of the FFT analysis, with supported window sizes of
up to 32768 samples, approaches 1 Hz. This means that the analysis contains more data
and more detail than can be shown on the display at once. In order to deal with this, the
FFT module features a zoom function to zoom in on part of the spectrum. Also, the full
details of every measurement can be retrieved through USB by saving measurements.
FFT measurement screen
The general “look and feel” of the measurement screen is similar to the RTA module, but
with a few differences. First of all, in line with the normal conventions, frequency weightings are not supported by the FFT module. Secondly, a button at the top right-hand
side of the graph can be tapped to reveal a small keyboard with zooming options:
These controls are used to zoom in or zoom out along the frequency axis, and to center
the display around the current cursor position. By pressing “hide” the zoom controls are
collapsed again. The zoom controls are used together with the cursor to focus on any region
of interest in the spectrum.. The cursor, shown as a vertical red line, can be moved by
tapping the arrows below the frequency axis or by tapping directly on the graph.
37
Page 38

The minimum and maximum frequency that can currently be displayed are indicated at
the top of the screen, as well as the exact frequency at the cursor position and the level at
the cursor position.
The second screen of the FFT module allows you to set an integration time for the FFT
analysis. If the integration time is set to “infinite,” then the instantaneous spectrum is
shown. The graph on the display will show rapid fluctuations. In general, the longer the
integration time that is chosen, the more accurate the spectrum.
The third screen of the FFT module (“settings”) is where the parameters of the FFT algorithm are controlled.
The window size determines the frequency resolution of the FFT analysis. The number
of spectral lines is exactly half the window size. At the maximum window size (32768),
the audible frequency range is analyzed in16384 spectral lines. Shorter windows offer less
detail, but the analysis runs quicker allowing for shorter integration times to arrive at the
same accuracy.
The type of window to be applied can also be set in the graphics screen. Each type of window (blackman, hamming, rectangular, etc) is associated with a specific set of advantages
and disadvantages relating to the FFT analysis. We recommend studying the literature on
spectral analysis, or one of the many available online resources, to choose the window that
best suits your application.
For most non-critical applications, the settings selected by default (hamming window with
a window size of 8192 samples) are a suitable choice.
Some remarks about the FFT module:
• The elapsed measurement time is shown above the progress bar. If the integration time is set to “continuous,” the instantaneous spectrum will be
shown.
• The FFT module is recommended whenever a high frequency resolution
is needed. To obtain standardized spectral measurements, where the exact
levels at standardized frequencies are of prime interest, 1/3 or 1/1 octave
band measurements through the RTA module are the best choice.
• Saved data can be retrieved over USB and imported in MS Excel or any
other program capable of dealing with .csv formatted data. This is the same
as all other modules. However, the FFT module is capable of producing
much more data (up to 32768 data points and frequencies for a single measurement). Not all spreadsheet programs may be able to import that many
columns, which is why the data is organized in rows rather than columns.
Page 39
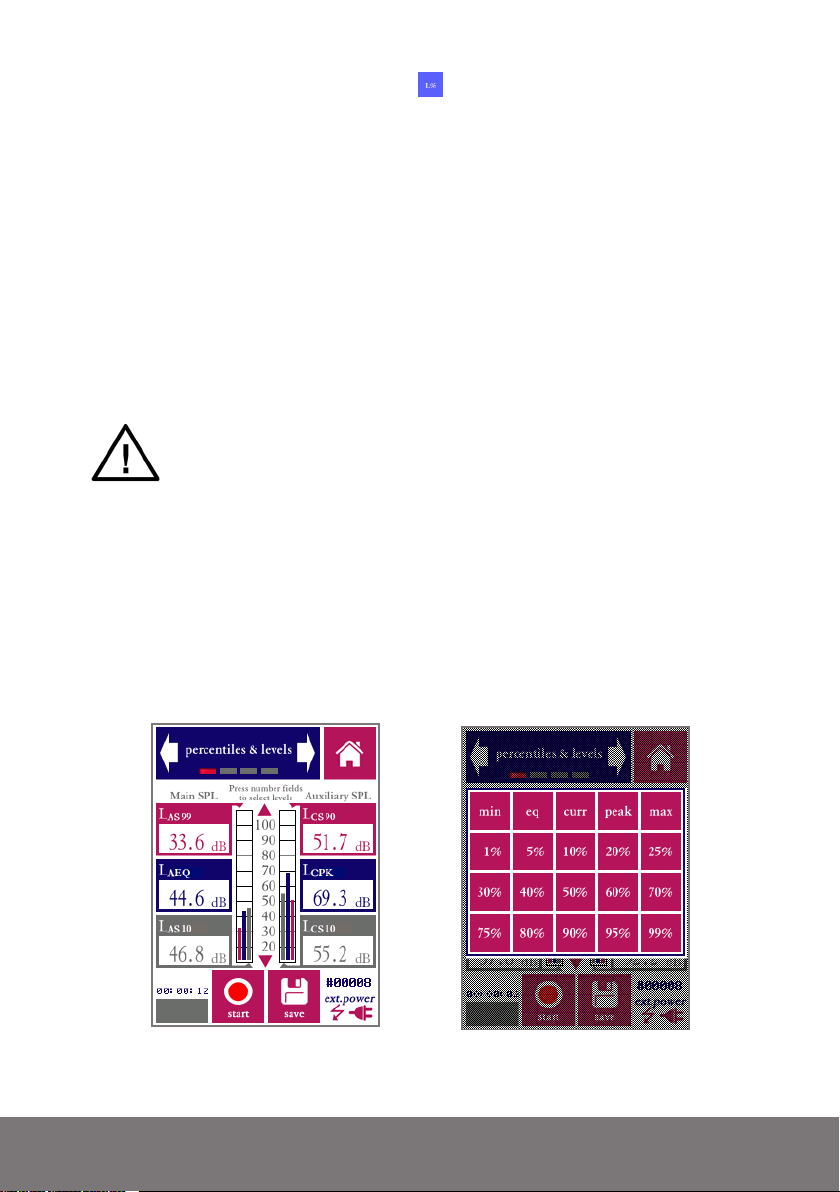
7.5. Statistical acoustics (percentiles)
This module is designed to create insight into the statistical distribution of sound levels
during the measurement period. In particular, it give percentile levels: the level exceeded
during the measurement period for a specific percentage of the time. Percentile levels are
commonly indicated with letter L (for level) followed by the percentile threshold, e.g. L95
being the level that is exceeded 95% of the time during the measurement period. and L10
the level that is exceeded only 10% of the time. Logic dictates the L95 normally has a lower
value than L10; for a perfectly steady-state signal, L95 and L10 will both be equal to LEQ.
The L% module offers the same frequency weightings and time averaging options as the
“standard” sound level meter module (A, C, Z; FAST, SLOW).
The operation and specifications of sound level meters are very specifically
and precisely determined by IEC-61672-1:2013. However, there is currently no international standard that governs how the additional parameters
that come into play with percentile-levels should be chosen. Implementations by various manufacturers, while these appear to be consistent on the
surface, may differ. The procedure adopted by the Bedrock SMxx is explicitly defined further on in this chapter.
The module is capable of simultaneously measuring and displaying sound pressure levels
with six different sets of settings: three displayed on the left (“main”) and three displayed
on the right (“auxiliary”).
Percentile settings (including Min, Max, EQ, Peak, Current) can be chosen by pressing the
level field, in which case a keyboard appears
Statistical acoustics module, showing levels for six different sets of settings (left). The percentile
selections can be chosen through a keyboard that appears when pressing the level fields (right).
39
Page 40

The frequency weighting and time averaging options are selected in the third screen of the
module, in the same fashion as the standard sound pressure level module. Two sets of time
and frequency settings can be chosen (main and aux), respectively corresponding to the
three fields on the left side and right side of the first screen. The measuring time is set on
the second screen, in the same way as all other modules.
Note that each level measurement is defined by three different settings:
• Frequency weighing (A, C, Z)
• Time averaging (FAST, SLOW)
• Statistic (MAX, MIN, CURR, PEAK, EQ, or any percentile between 1 and 99%)
Not all implementations of percentile level measurements explicitly allow time
averaging settings to be chosen. The time averaging window is then (often implicitly) set by the manufacturer of the device. The length of the time window
may vary widely, from less than a millisecond to several seconds. If the standards and documentation that you are using to guide your measurements are unclear on the topic of time averaging, we recommend choosing FAST. The time
averaging window is then set to 125 ms and opt for a measurement duration of
60 seconds or longer.
The percentile levels are computed according to the following procedure:
• A level measurement takes place across audio frames of 512 samples, at a sampling rate
of 48 kHz. A computation takes place after the acquisition of every new audio frame
(so 93.75 times per second).
• For each channel (Main and Aux), the frequency-weighted and time-averaged level is
calculated and rounded to 0.1 dB.
• A level histogram is compiled with bins (categories) that are 0.1 dB wide. Each meas-
urement is sorted into this histogram. I.e., 93.75 measurements per second are added
to the histogram.
• The percentile levels are calculated from the histogram by determining which level
constitutes the threshold which is exceeded more than the chosen percentile (e.g. for
L95 more than 95% of the samples in the histogram exceed the threshold level).
• Max and Min are respectively the highest and lowest bin in the histogram for which
data is recorded. EQ is the energetic average across all measurements. By selecting
CURR, the current level is shown according to the selected time averaging option
(FAST or SLOW).
Page 41
7.6. RTA logging
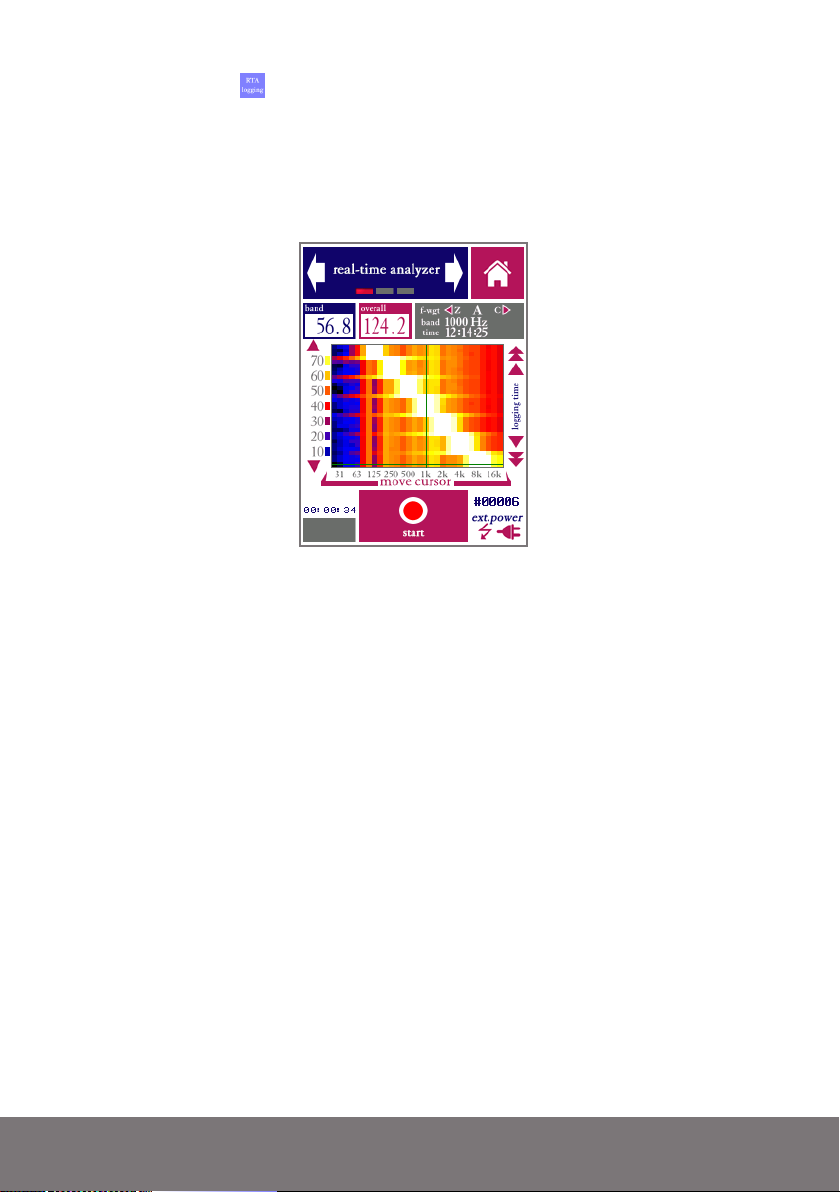
The RTA logging module is intended for long-term monitoring of the spectral characteristics of sounds. It logs the spectrum in 1/1, 1/3, 1/6 or 1/12 octaves, as well as the A, C and
Z-weighted equivalent continuous levels. The averaging window can be set to any value
between 1 second and 999 seconds.
RTA main measurement screen (1/3 octave band, 1 second averaging)
On the main screen of the RTA logging module, logged data is represented in the form of
a spectrogram. The horizontal axis is the spectral axis (bandwidth between 1/12 and 1/1
octave), the vertical axis is the time axis. The latest spectrum is added consecutively to the
bottom of the screen. The measured level is indicated by means of color, according to the
legend displayed on the left side of the screen.
The RTA logging module does not feature a “save” button. Measurement data is automatically logged to an output file after every averaging interval.
Once logging is started, the logging will continue indefinitely unless it is stopped again
manually (through the “Stop” button) or until the battery runs out. For long term-logging,
we recommend connecting the instrument to an external power supply.
A new log file is automatically started every day at midnight.
41
Page 42
8. Room acoustics
8.1. Reverberation Time meter (RT60)
The reverberation time (or RT60) is among the most commonly specified acoustic measures. Unfortunately, reverberation time measurements are also among the most complex
to carry out accurately. RT60 measurements are prone to errors, which cannot always be
detected by the measuring device.
If you are new to measuring reverberation times, we recommend that you read
this section of the manual carefully, and preferably also consult external literature and training materials on reverberation time measurements.
Standardized procedures for measuring the reverberation time of a room are specified in
ISO-3382-2. Generally speaking, there are two different ways to measure RT60: the impulse response method and the interrupted noise method. Both methods are standardized
through ISO-3382-2. The impulse response method uses a carefully controlled, known
test stimulus of short duration (sweeps, chirps, pseudo-noise sequences or gunshot-like
impulsive sounds). By normalizing the recorded sound in a room relative to the source
signal, the impulse response of the room is obtained. From this impulse response, the RT60
is calculated.
Starting with firmware version 2.4.0, the impulse response method (which previously not
supported) has also been implemented on the SMxx. The test signal to be used is a loud,
short impulsive sound (such as the sound from a starter gun). Do not use sweeps or chirps
as your test stimulus.
If you are using impulsive noise as your test stimulus, even the slightest movement of the microphone during the test may render the measurement inaccurate. The use of a tripod is absolutely necessary.
The interrupted noise method, which is also supported by the Bedrock SMxx, measures
the decay of the sound field if a sound source is suddenly switched off. This method is
more robust against slight inaccuracies or inconsistencies in the placement of sound source
and microphone. In small rooms, no other tools than the Bedrock BTB65 talkbox and the
SMxx may be needed. In larger rooms, a larger (spherical) loudspeaker and amplifier will
be needed. For the interrupted noise method, the following steps are taken in preparation:
• Place a source of continuous sound (preferably pink noise) in the room for
which the RT60 needs to be measured.
• Place the Bedrock SMxx at some distance from the source (stay clear from
walls and other flat surfaces)
Page 43
• Start the RT60 module; select IN (Interrupted Noise) in the settings screen.
• Go to the main measurement screen and press “arm.”
• To trigger the measurement, shut off the noise source.
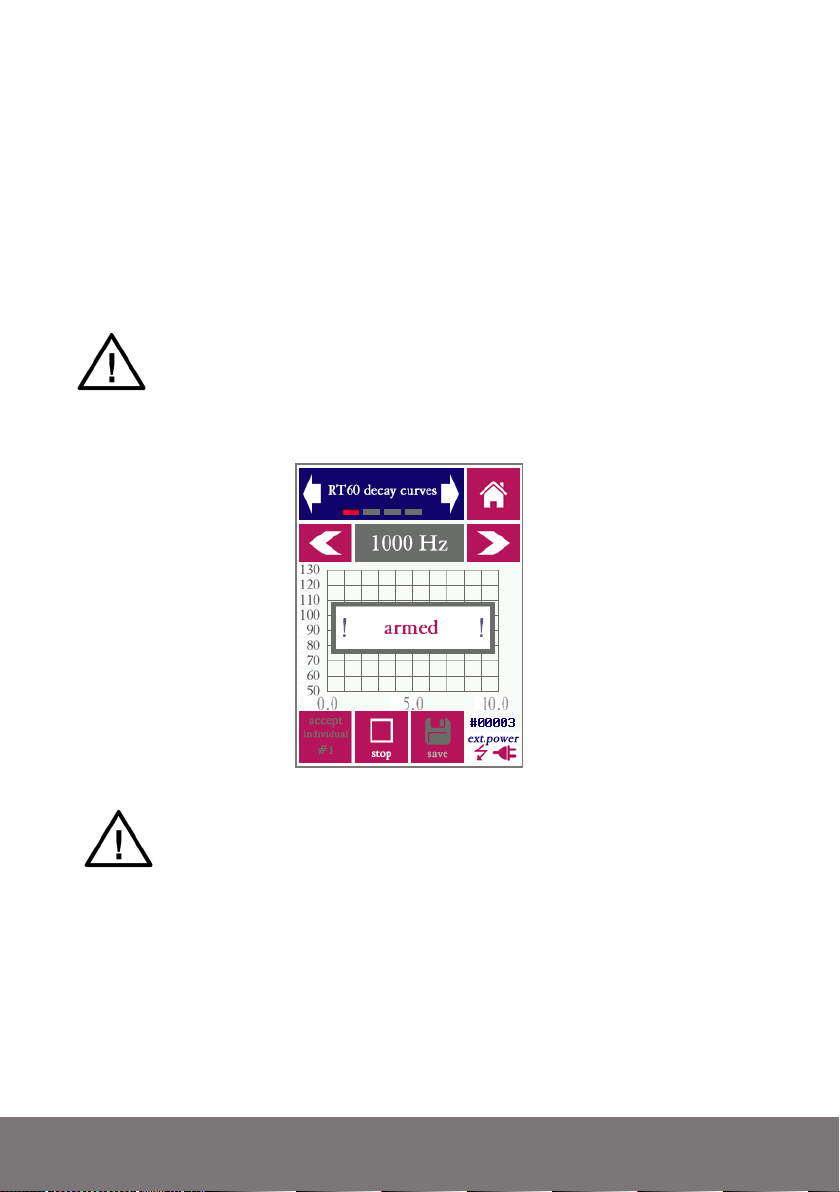
Once the device has been armed, it will start measuring the ambient noise field. At this
stage the device is continuously sampling the audio, but the RT60 measurement itself has
not yet been started. The device is merely detecting the moment a noise source has been
shut off (in case the interrupted noise method is being used) or the occurence of an impulsive sound (in case the impulse method is used).
Make sure to select the correct method in the settings screen of the module (IN
for interrupted noise, IR for impulse-response based measurements (e.g. with a
starter gun). The description of the module in this section of the manual will be
based on the interrupted noise method. We will indicate the differences for the
IR method at the end of the section
RT60 measurement screen, armed for measurement, but before a measurement has started
Make sure that the external sound source is always switched on BEFORE you
arm the SMxx for a measurement by pressing “arm”
Once the beginning of the energy decay curve has been detected, the device starts measuring. By definition, no RT60 results can be calculated until the measurement and analysis
are completely finished. While the device is acquiring measuring data, the following screen
is displayed:
43
Page 44
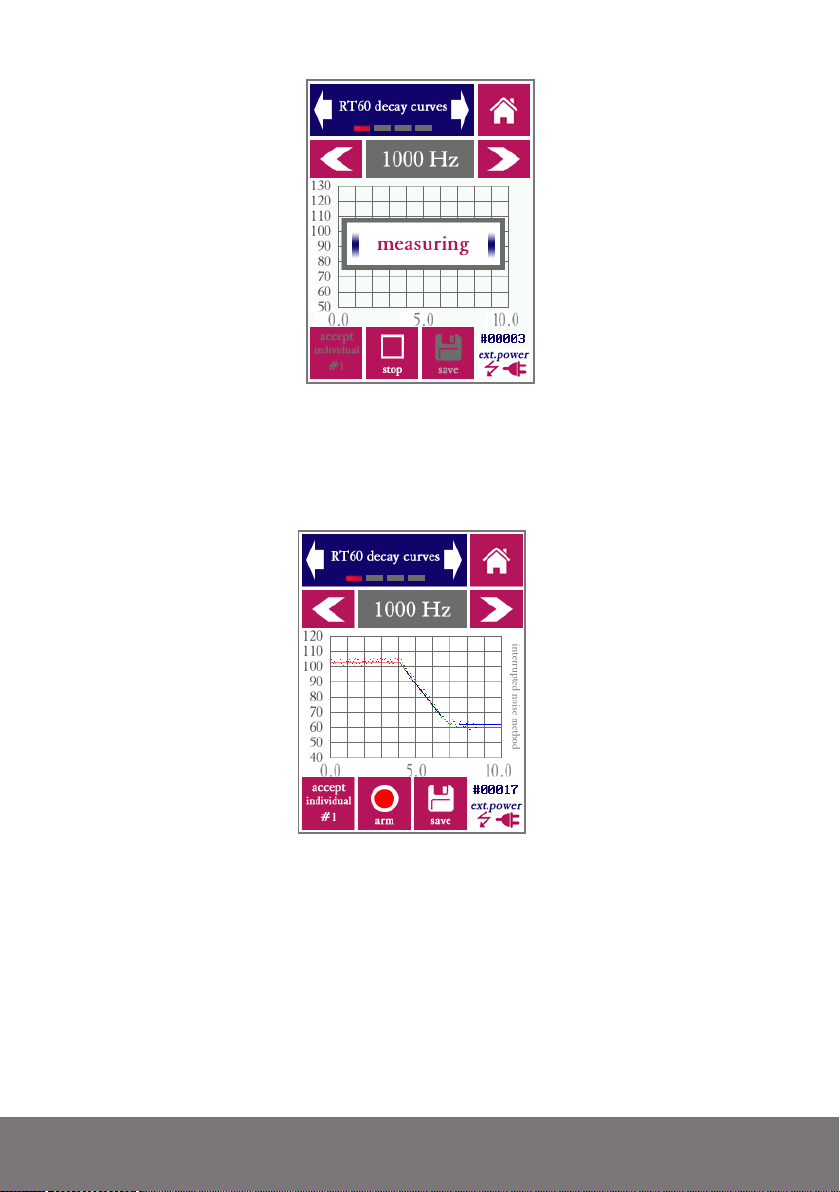
RT60 measurement screen, while the measurement is running and data is being acquired
Once the measurement is completed, the energy decay curves are plotted. Use the arrows to
cycle through the frequency bands (note that you can choose whether to measure in 1/1 or
1/3 octave bands through the “settings” screen).
RT60 decay curves plotted once the measurement is completed (interrupted noise method)
Inspect the decay curves to visually verify that the measurement is correct. An incorrect
measurement (which should be rejected) may become apparent in any of the following
ways:
• The plotted data points do not reflect the expected linear decay of energy:
the level does not decrease linearly over time. If this happens, the triggering
process may have been disrupted.
• The linear decay cur ve that is fitted (drawn line) does not match the displayed data points. E.g., the starting point of the decay curve may be off.
Page 45
• The signal-to-noise ratio (difference between the steady-state noise signal
and the system noise floor) is insufficient.
From the decay curves, three different reverberation time metrics are calculated:
• The EDT (Early Decay Time), based on the first 10 dB of decay
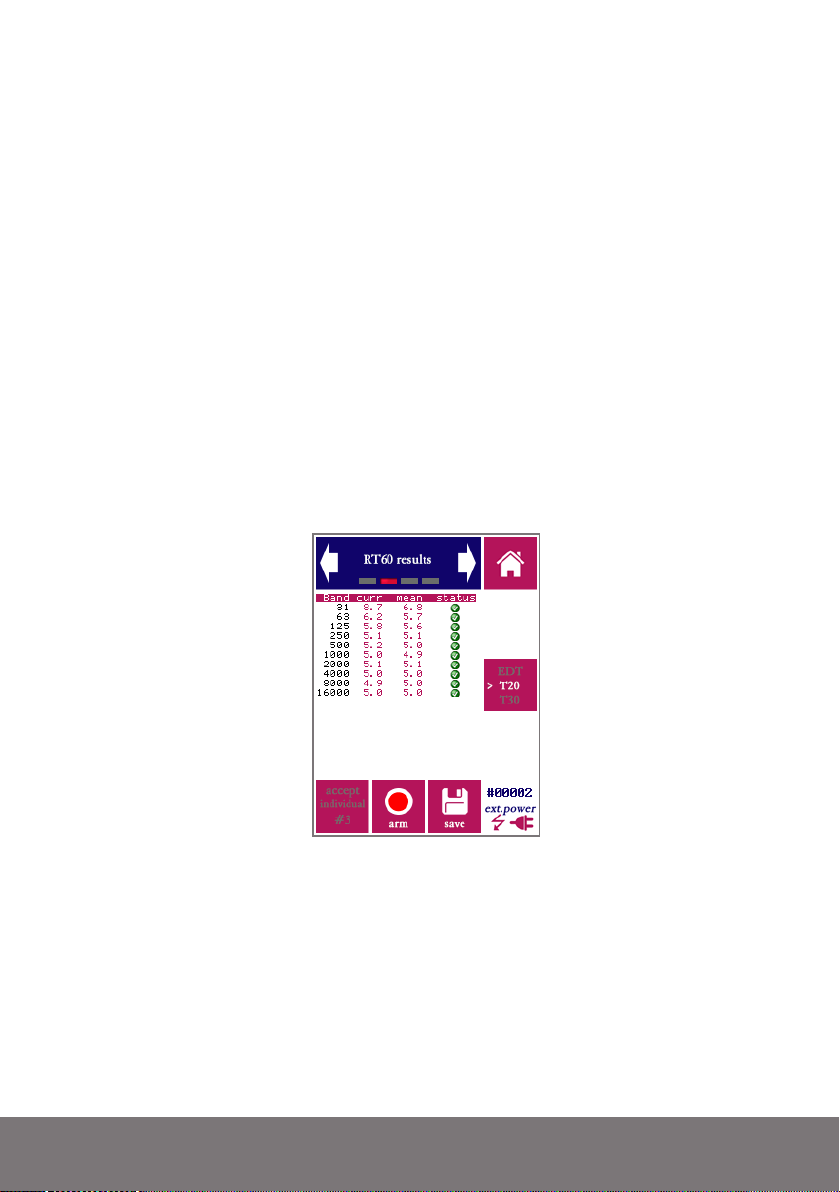
• The T20, based on the section of the decay curve between -5 dB and -25 dB
• The T30, based on the section of the decay curve between -5 dB and -35 dB
Each of these three metrics has its own linear decay curve fit through the data points. The
values of the EDT, T20 and T30 can be seen on the second screen of the RT60 module.
Note that the reverberation time usually differs significantly between different frequency
bands. Also note that (although respectively measured over 10, 20 and 30 dB of decay) the
values of EDT, T20 and T30 are always extrapolated to 60 dB of decay; hence the name
T60: the time it takes for the energy to decay to a level 60 dB below the starting level.
Cycle through EDT, T20 and T30 using the button on the right. Note that each of these
three metrics is always calculated and saved for each measurement, even if only one metric
at a time is displayed on the screen at a time.
RT60 measurement results.
Quite often, a single RT60 measurement is insufficient to obtain a stable result. Many application standards require that data from multiple measurements are averaged. Sometimes
the position of the noise source and/or measurement microphone must be changed in between measurements.
The averaging of multiple measurements is supported in the following way:
• When browsing through save measurements (in the “browse measurements” screen), you will see the mean data from each measurement series.
45
Page 46

• On the bottom left of the screen you will find an “accept individual” button, which is not usually present in other measurement modules. Use this
to commit a measurement to memory, if you are satisfied (upon inspection
of the decay curves) that the measurement is valid.
• Once your first (valid) measurement is finished, press “accept individual”
• The letters and the numeral “#1” are now greyed out on the accept button.
• Now repeat the test procedure as many times as required, pressing “accept”
after each measurement. The serial number is incremented after each individual measurement.
• Data from up to 20 individual measurements can be kept in the device
memory at the same time.
• In the “RT60 measurement details” screen, you can inspect the latest individual measurement as well as the mean across all measurements.
• Once you are satisfied with the overall (mean) results, press the “Save” button (to the right of the “arm” button). Mean data from all measurements
are now permanently saved and the temporary memory is reset.
The capability of averaging measurement data adds complexity to the user interface, but
averaging is sometimes essential to arrive at valid end results. Note that averaging takes
place on the level of the individualy measured data points along the decay curve (so not just
across individually measured reverberation times).
In the table on the measurement details screen, a column is shown that indicates the status
(reliability) of the current average measurement for the corresponding frequency:
• A green checkmark indicates a healthy, reliable measurement. The
RT60 measurement data may be presumed accurate with a margin of error
of at most 0.1 seconds.
• A yellow exclamation point indicates that the measurement accuracy
cannot be guaranteed. This may have various causes. For example, the
signal-to-noise ratio may be insufficient (not enough dynamic range between the steady-state noise signal and the noise floor with the noise source
switched off). This may also happen if the signal fluctuates more than expected for a given frequency band and the resulting linear decay fit is poor.
• A red cross indicates that the result is statistically deemed unreliable. In
order to obtain a reliable result in the corresponding frequency band, averaging across more individual measurements (adding to the overall measurement time) is needed. If the red cross persists upon averaging across
multiple measurements, disregard the corresponding frequency band or
repeat the entire measurement series.
Page 47

It is good practice (and a formal requirement for many applications) to average across as
many measurements as needed to obtain a green cross next to all relevant frequency bands.
Never rely on results from RT60 measurements until you have checked the reported status per individual frequency band. Note that in some rooms it may
be difficult, if not impossible, to obtain reliable results for the lowest frequency
bands.
Please take note of the following practical tips and pointers for RT60 measurements:
• Do not place the measurement microphone and noise source too close to
each other; if possible, estimate the reverberation radius in the room, and
make sure that the microphone is as far outside the speaker’s reverberation
radius as possible.
• When using the interrupted noise method, make sure that your noise
source is capable of producing levels far above the ambient noise floor in
the room, and above the electronic noise floor of the device. Ambient levels
of 90 dB(A) and higher are often needed. The SNR must be at least 50
dB in all relevant frequency bands. A spherical loudspeaker configuration
playing pink or white noise is the preferred source of measurement noise.
If you are using a single, non-spherical loudspeaker, avoid placement of the
microphone on the loudspeaker axis. Even though the microphone is omnidirectional, avoid pointing the microphone straight at the loudspeaker.
• When using the impulse response method, use a starter gun or “clapper”
that is capable of producing high level impulsive sounds.
• Eliminate sources of background noise.
• The state of all doors, windows and other separations should be fixed (open
or closed) throughout the measurements. The opening of doors and windows changes the reverberation time.
• Do not walk around when the measurement is running, especially not in
the immediate surroundings of the noise source.
• The signal-to-noise ratio requirements for RT60 measurements are sometimes difficult to meet. Especially for T30 measurements, it may be necessary to play back the test stimulus (interrupted noise) at high sound pressure levels.
• If your signal-to-noise ratio is insufficient for reliably measuring the higher
frequency bands, consider switching over to white noise (instead of the
commonly used pink noise) as a source stimulus.
If you are having trouble getting acceptable measurement data (green balls with check
marks next to your measurement data), it may help to study the exact reasons why your
measurement data is marked for rejection.
47
Page 48
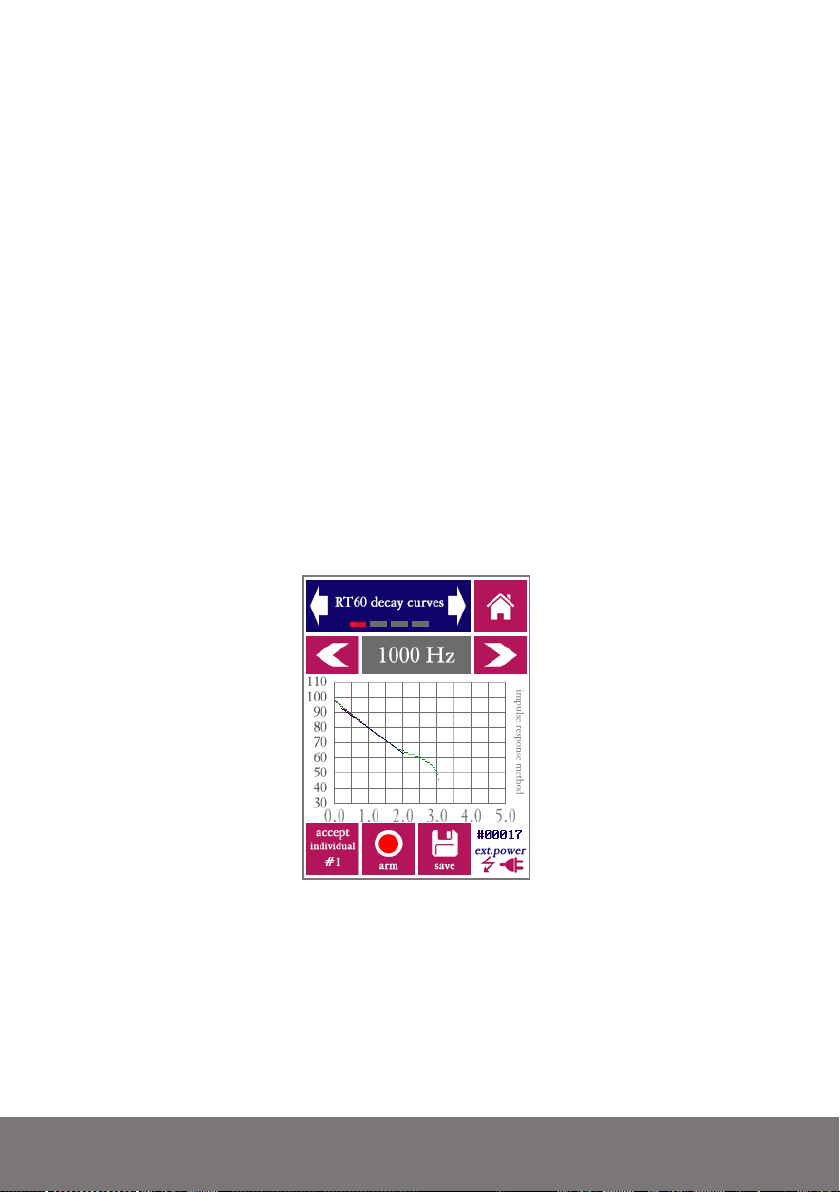
Along with each measurement value, the reliabily status is display (acceptable, warning,
error). The stored data for each measurement (downloadable via USB) contains more details on the exact motivation for the indicated reliability status. This is indicated with the
following letter codes:
- d: no data was present (error)
- r: not enough range (warning)
- b: bandwidth-time product too low (error)
- n: snr too low (warning)
- s: start time before knee point of the decay curve (warning)
- c: correlation of the decay curve fit is low (warning or acceptable, depending on value)
Multiple letter codes may be stored with a single measurement value.
The description in this section was based on the interrupted noise method. The procedure
is similar for the IR-based method: after pressing “arm,” generate the impulsive sound (fire
a starter gun) to automatically trigger the measurement.
Note that the method used is indicated alongside the decay graph (in gray vertical text).
RT60 decay curves plotted once the measurement is completed (impulse response method)
Page 49

8.2. Noise curves
The “noise curves” module implements a series of measurement methods to evaluate noise
levels, based on sets of standardized spectral curves. The objective of these methods is to
set criteria in terms of a single-number rating, while taking the spectral characteristics of
noise into account.
The following methods are implement
Noise Rating (NR). This is an ISO-standardized (ISO-1996) method. Although the
method is being pushed into the background by successive updates to the relevant standards, it is still seeing a fair amount of use, in particular in Europe.
Noise Criteria (NC). This method is frequently used in the United States, mostly for
evaluating background sound in buildings and for specification of desired levels in advance
of construction. Different versions of the NC have been in circulation since the 1950s; the
SMxx implements the version standardized through ANSI S12.2:2008.
Preferred Noise Criterion (PNC). This is a variant of NC, not included in ANSI S12.2,
but proposed originally by Beranek et al (1973) to yield a better correspondence with perceived annoyance by putting more emphasis on the lowest frequency bands and highest
frequency bands.
Balanced Noise Criterion (NCB). Standardized through ANSI S12.2:1995, similar in purpose and application to NC; apparently intended upon its introduction to replace NC.
Room Criteria (RC). This method is primarily used to quantify noise from HVAC systems
in buildings. In addition to the single number rating (e.g. RC-35) a spectral classification of
the signal is also given: Neutral (N), Hiss (H), Rumble (R) and Rattle and Vibration (RV).
Room Criteria mark II (RCII). Updated version apparently intended to eventually replace
RC curves.
The Room Noise Criterion (RNC) method is currently not implemented on the SMxx.
Each method has its own series of preferred limits, depending on the purpose of the room
in which it is measured. ANSI S12.2 contains table of recommend maximum NC and RC
values, and additional information is available through an abundance of online resources.
A full list of these recommend limits is beyond the scope of this manual.
As part of the calculations, various intermediate metrics are calculated including the Speech
Interference Level (SIL).
49
Page 50
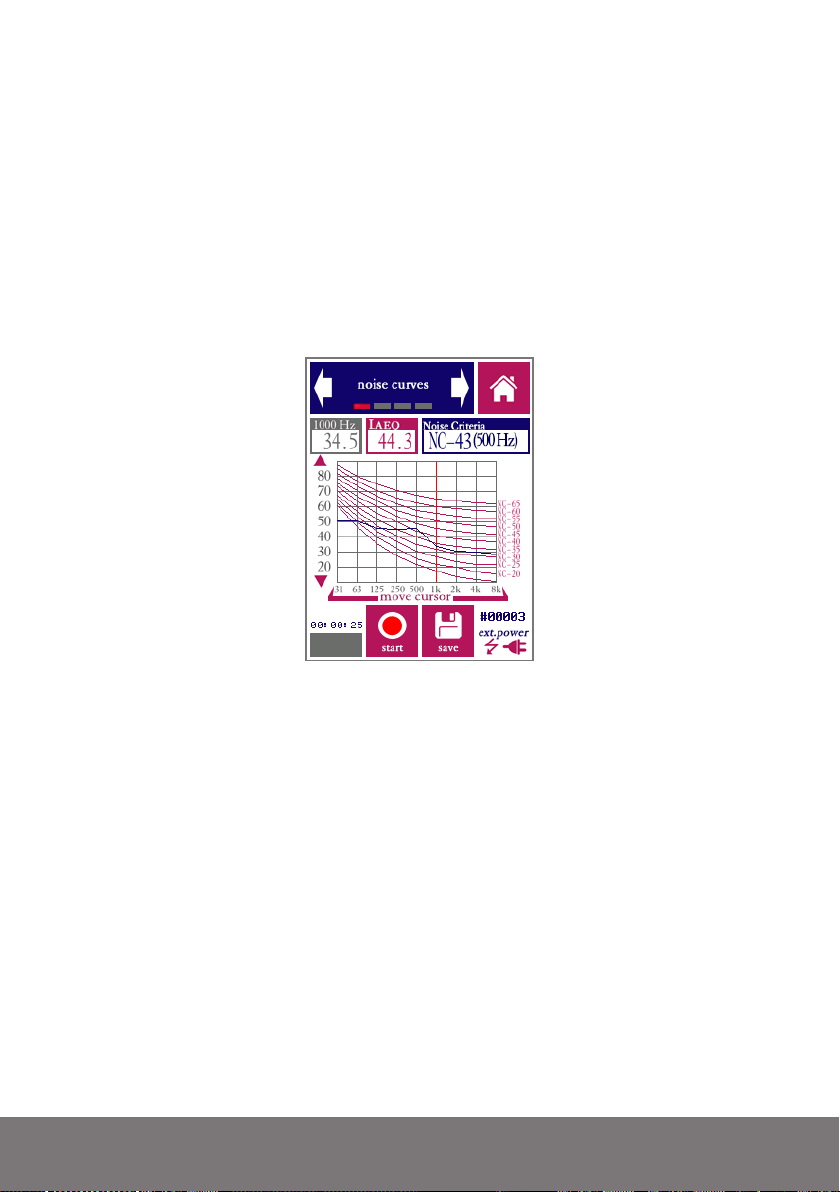
Each method uses its own procedure for rating noise spectra based on the series of curves
associated with the method. The so-called “tangency method” plays a central role for
NC and related measures; the rating is effectively determined by the highest NC curve
“touched” by the spectrum. The frequency band that touches the highest curve (the most
dominant noise band) is indicated as part of the rating, e.g: NC-53(125Hz).
A full description of the rating procedures is beyond the purpose of this manual. Please
consult the corresponding standards for this information.
Carrying out a Noise Curves measurement is similar to an SPL or RTA measurement: set
the duration of the measurement and other parameters, and start the measurement.
Noise curves. In this example, the curves and rating for NC are displayed
During a measurement, the reference noise curves are shown as red lines. The actual measured spectrum is shown as a blue line. The cursor can be moved around to read the SPL at
any of the frequencies. The rating is shown, as well as the LAeq level.
Only one Noise Curves metric can be displayed at a time, but all metrics are calculated for
every measurement. If a measurement is saved, the saved file contains data for all noise
curve metrics. If you wish to evaluated more than one noise curve metric without measuring more than once, this can be done as follows:
• Select the first type of curves you wish to evaluate (e.g. NC)
• Carry out the measurement.
• Save the results
• Now change to another type of curves (e.g. NCB)
• Go to the measurement browser screen. NCB data will now be displayed
• Repeat this procedure to inspect results for further metrics (RC, RCII, etc).
Page 51
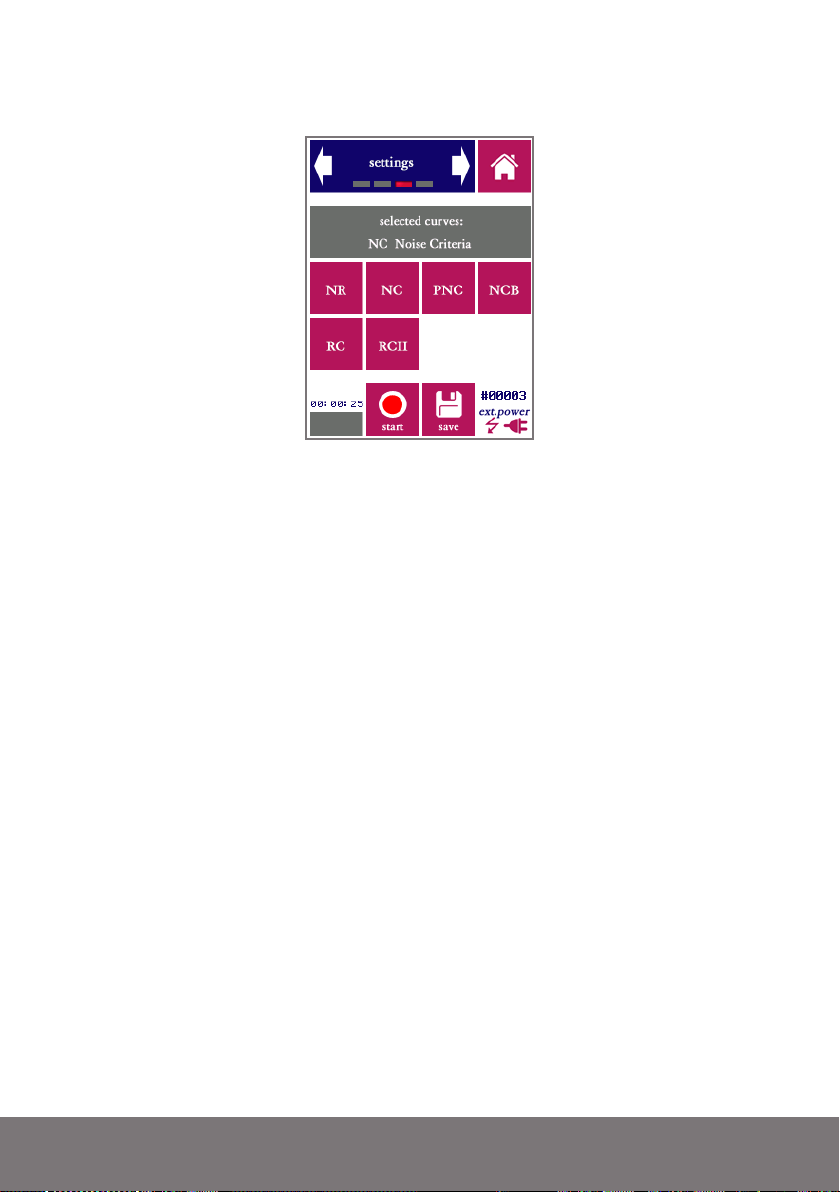
The second screen of the module is used to set the duration of the measument. Selecting
curves (and the associated rating method) is done in the third screen of the module.
Choose from the available noise curve metrics
51
Page 52
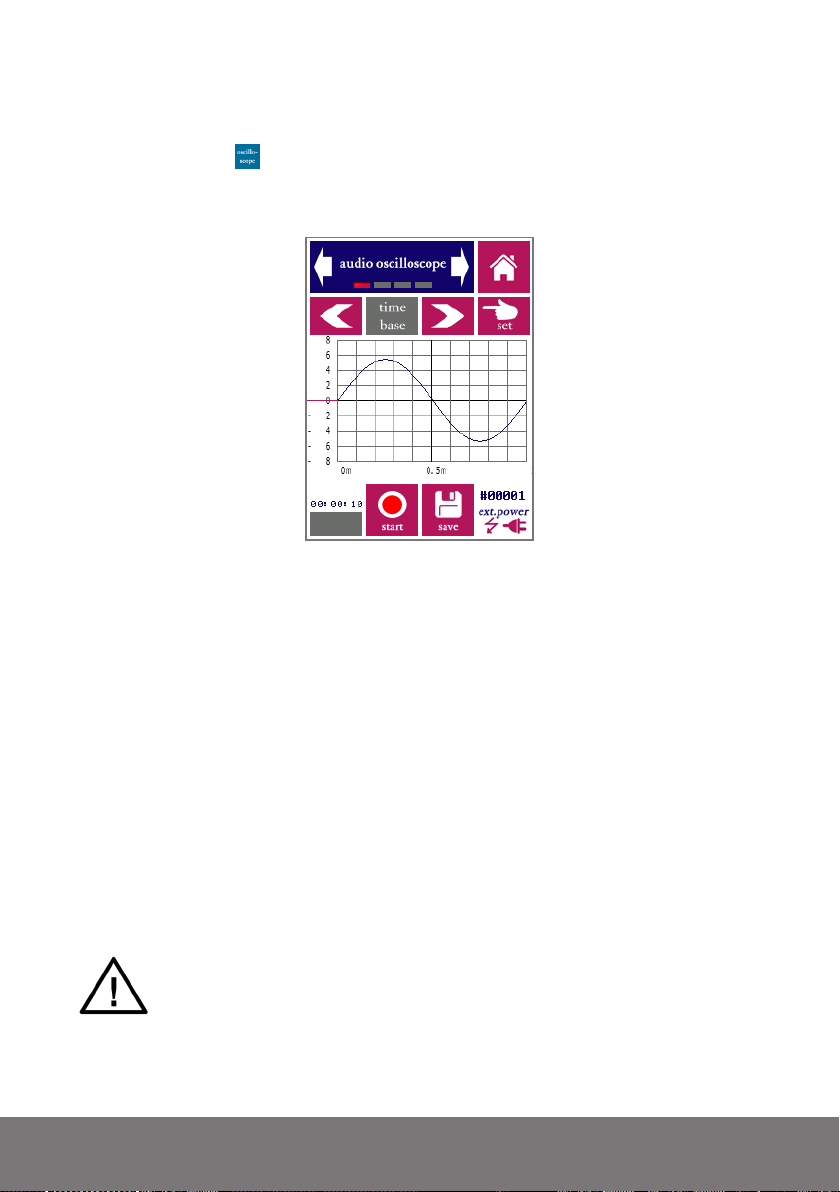
9. Electro-acoustics
9.1. Oscilloscope
The oscilloscope module is intended to quickly inspect acoustic signals, in particular periodic signals, in the time domain.
Sine wave with a frequency of 1000Hz as seen through the oscilloscope module
Directly from the first screen of the module (see above), you can control the horizontal scale
(time base) and vertical scale of the graph, as well as the trigger mode. Select which setting
you want to adjust, and press “set.” Then choose the intended setting; by pressing “back”
you can go back to reach the other settings again. Under trigger mode, you can set the level
and slope (rising/falling). Red lines by the vertical axis indicate the trigger level.
Additional settings can be accessed through separate screens of the oscilloscope module.
These include the measuring time, the choice whether or not to apply linear interpolation on the data, enabling or disabling frame averaging, and a choice between acoustic
and electric measurements. If you are measuring sounds (with the microphone mounted),
choose “acoustic.” The amplitude scale will be expressed in the unit Pascal (Pa). If you
are measuring without microphone, but directly into the XLR input, select “electric.” The
vertical scale will be expressed in Volts (V). Similar to any other oscilloscope, the settings
for the time based and sensivity are expressed relative to the division lines on the screen (s/
div, V/div, Pa/div).
Remember to turn of the 48V phantom power through the settings menu if you
intend to do electric measurements. Note that the input impedance of the XLR
input is (nominally) 2 kOhms.
The basic operation of the oscilloscope module is similar to the common (hardware) oscilloscopes that many engineers are familiar with. Note that the frequency response of the
system is limited to audio frequencies (up to 20 kHz).
Page 53
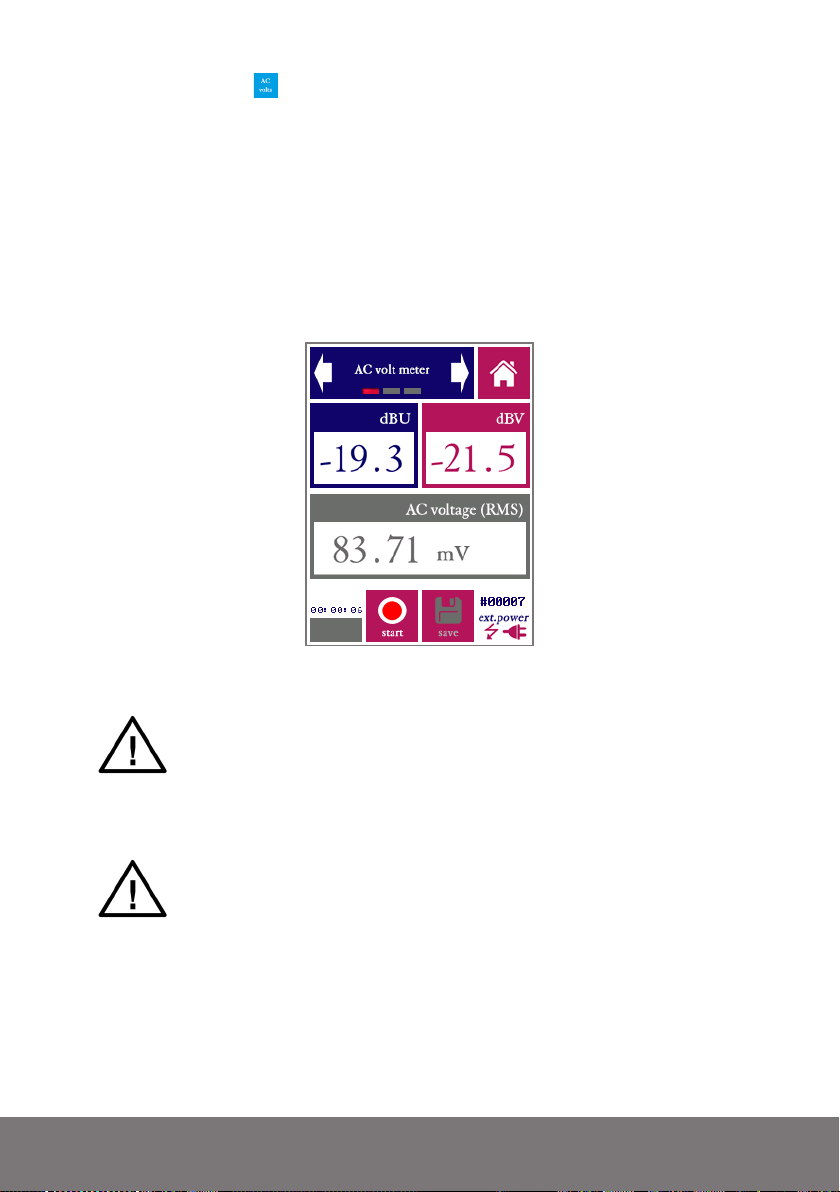
9.2. AC Volt meter
The AC Volt meter module is a simple tool to quickly assess the output level of line-level
audio equipment. The line output of a device is connected directly to the XLR input of
the SMxx (after removing the microphone). The SMxx then measures the signal level and
expresses it in the following three units:
• V rms
• dBU
• dBV
AC Volt meter
The XLR connector supplies 48V phantom power to the microphone. This
phantom voltage can be switched on and off through the hardware settings
menu. IMPORTANT: connecting equipment not designed for 48V phantom power to the XLR connector (with phantom power switched on) may
permanently damage the connected device and/or the SMxx. Disable phantom power before connecting to external equipment.
The “AC Volt meter” function of the device is intended for measuring audio
output levels of amplifiers and other audio equipment. NEVER connect the
XLR input pins to AC voltages over 40V; do NOT try to measure the AC
mains with your SMxx.
53
Page 54
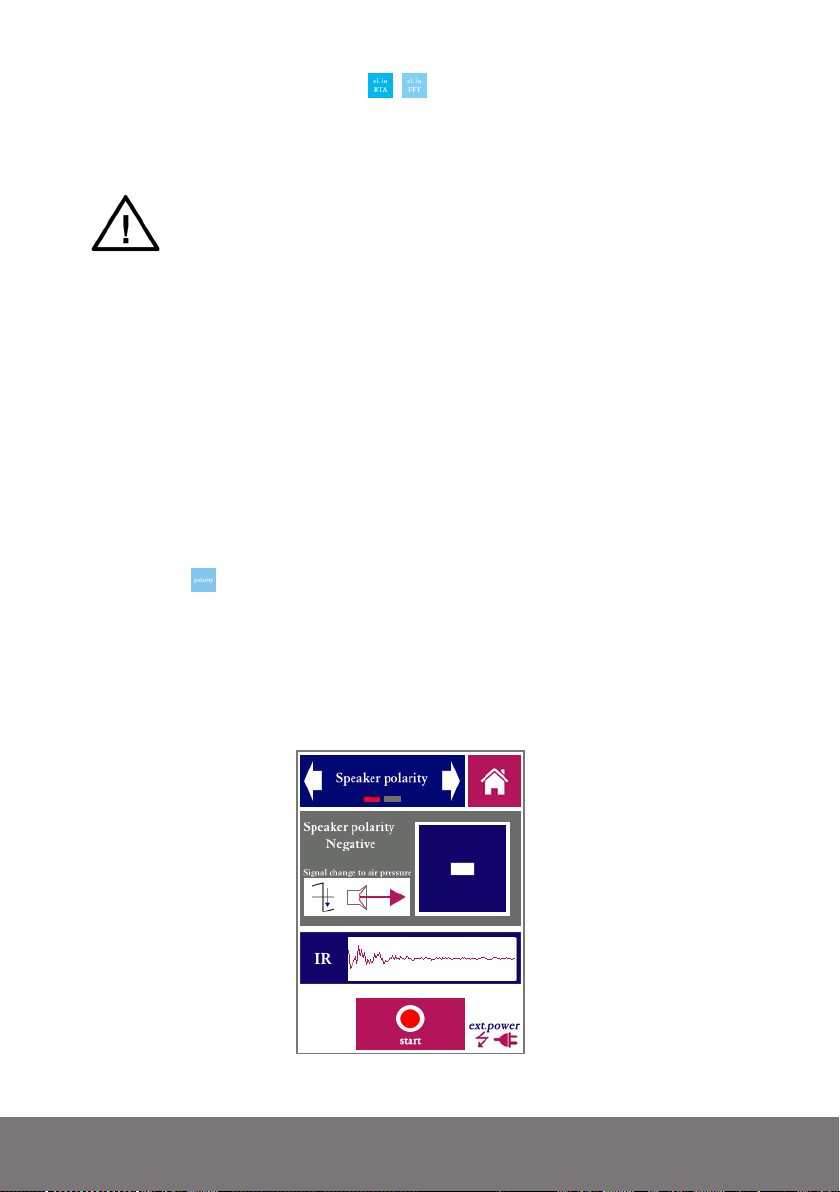
9.3. Electric in RTA and FFT
Dedicated versions of the real-time analyzer (RTA) and FFT analyzer are provided specifically for analysis of electric signals through the XLR input.
The precautions mentioned above (in section 9.2) also apply here: be careful
to protect the XLR input from voltages higher than 40V, and make sure to
switch of the phantom power in the settings menu.
The RTA and FFT intended for electric input signals are used in exactly the same way as
the “ordinary” RTA and FFT (see sections 7.3 and 7.4), with one difference: the displayed
levels are relative to an electric reference signal instead of the acoustic reference of 2.10-5 Pa.
The electric reference can be set to display all levels in dBU, dBV or dBuV (corresponding
to reference levels of , respectively, 0.7746 V, 1.0000 V and 1.000*10
-6
V).
Note that saved results are stored in separate folders (named eRTA and eFFT), separately
from results for acoustic measurement data. The SMxx is calibrated for electric inputs to
the XLR, completely separately from its acoustic calibrations. The electric calibration factor
can be adjusted in the “Calibration” module.
9.4. Polarity
The polarity module is intended to check the polarity of loudspeakers. Polarity is important
in all systems featuring more than one loudspeakers; inconsistent wiring may lead polarity
inversions, with adverse consequences for the level and quality of sound. Note that inversion of the polarity by itself is usually not a concern, as long as the polarity remains consistent among all loudspeakers within the same space.
Loudspeaker polarity
Page 55

Polarity measurements make use of test signals, usually saw-tooth wave patterns that either
rapidly rise or decline in level. A test signal is provided on the flashdrive bundled with the
SMxx and also available for download from the Bedrock audio website. The same test signal is featured on the BTB65 TalkBox (depending on the firmware version and production
date of the talkbox). This default test signal is a sawtooth with a slow incline and a rapid
descent and a period of 20 Hz. The module can also be configured for custom test signals,
with a user defined period and up/down characteristic.
The polarity module is a configuration aid only; it does not have options to save data as
most measurement modules do. The module is operated as follows:
• play the test signal continuously over the sound system under test
• start the measurement on the SMxx
• bring the measuring microphone up close to the loudspeaker (typically 0.5 to 1m, depending on the acoustics of the room and the configuration of the loudspeaker). A
little experimentation may be needed to determine the optimal measuring distance.
• The module shows a + or - sign to indicate the signal polarity, alongside a graphical
representation of the loudspeaker cone movement in response to the test signal
• A graphical representation of the impulse response is also shown.
It can be difficult to obtain consistent readings for multi-way loudspeakers; it may be necessary to measure op close to each of the drivers.
55
Page 56
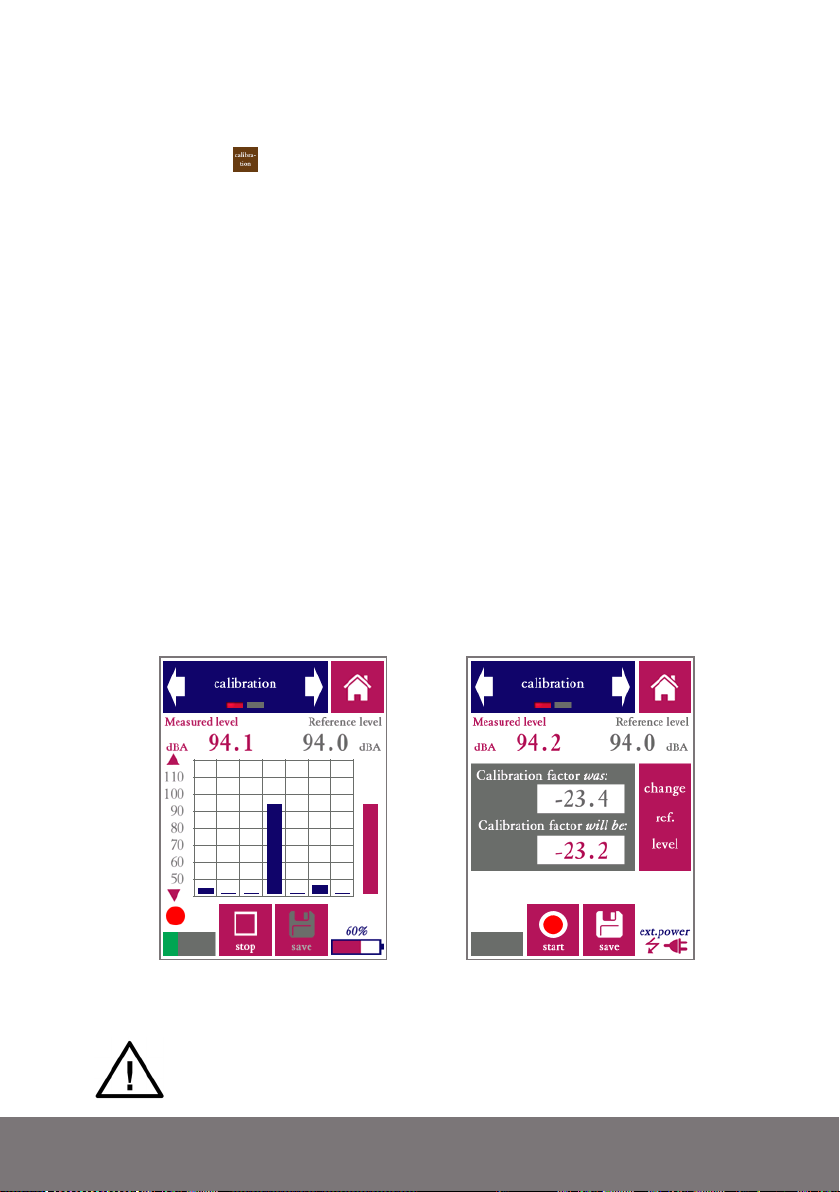
10. Other modules and control modes
10.1. Calibration
The Bedrock SMxx, the instrument itself as well as the microphone, is calibrated before
leaving the factory. A calibration certificate is included with the device. However, it is recommended that you carry out your own “user calibrations” from time to time, especially
under the following conditions:
• You are using the device considerably above or below room temperature
• You are planning to use the device again after a prolonged period of storage
• You are planning to do measurements for which a high degree of accuracy
is required, e.g. certification measurements
Reference sources (calibrators) are available from a number of vendors. These generate a
test tone which is adaptively adjusted to a fixed, accurately know signal level (usually 94.0
dB). This makes calibration relatively easy: insert the microphone tip into the port of the
calibrator, using an adapter with suitable dimensions for the microphone tip. The device
should now measure the nominal signal level produced by the calibrator. For the SM30/
SM50, Class 2/Type 2 calibrators are recommended (such as the Cirrus CR:514), for the
SM90 we recommend a Class 1 /Type 1 calibrator (e.g. the Cirrus CR:515).
The Bedrock SMxx can be calibrated with any stable sound source of a known reference
level. This can be a calibrator, but a other non-fluctuating sound field will also work.
Calibration module while measuring a 1 kHz calibration tone (left) and once the calibration
factor has been calculated at the end of the procedure (right).
When calibrating the SM90 with BAMT1 microphone, correct the nominal
value of the calibrator (typically 94.0 dB) with -0.1 to account for the free
field response and other correction factors.
Page 57
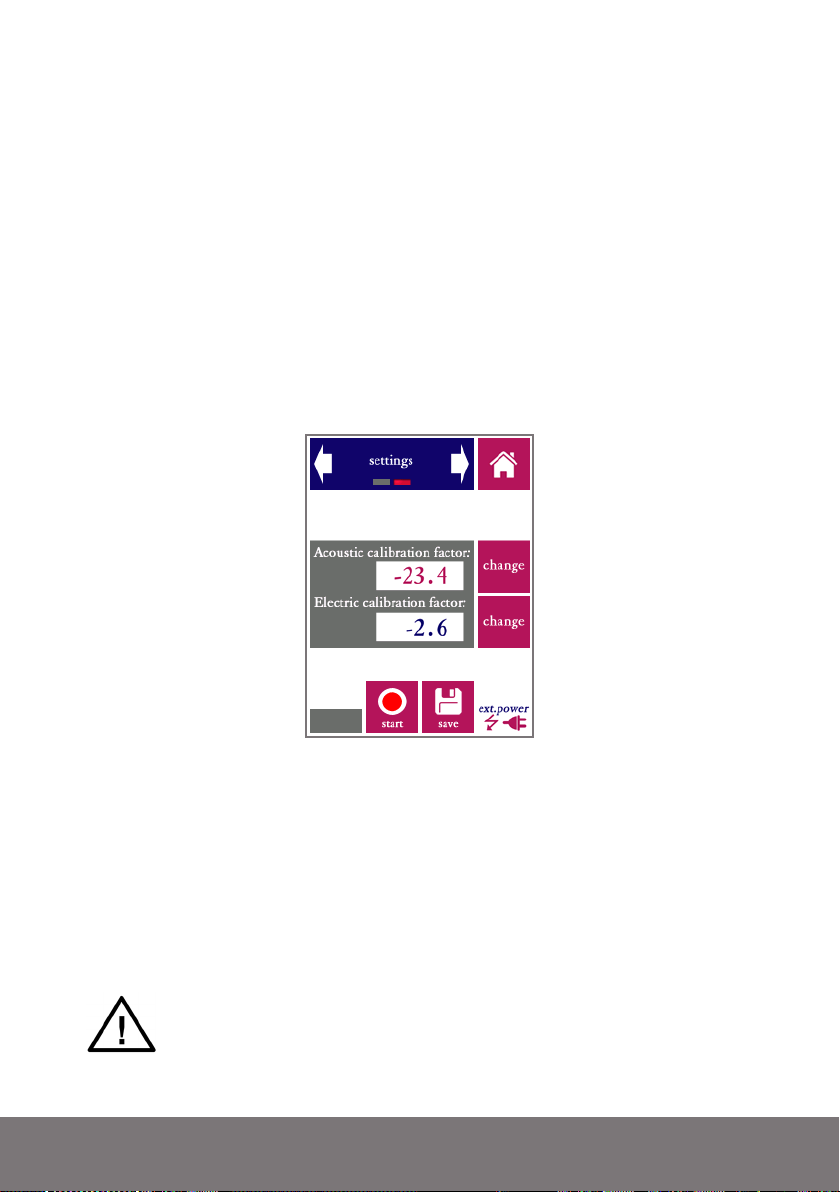
To start calibrating, apply the calibrator to the microphone and press “start.” Do not worry
if the reference level shown is incorrect; you can change this after the measurement. An
octave band spectrum will be shown while the equivalent-continuous A-weighted sound
level is measured. Once this measurement is finished, the Bedrock SMxx will show the
results.
The new calibration factor (sensitivity adjust) of the device is shown, as well as the original calibration factor as currently used in the device. The differences between the old and
new value are typically small (less than 5 dB), unless you have connected a different signal
source or microphone than the device is currently calibrated for.
If you already know the calibration factor for your microphone, you can enter it manually.
The second screen of the calibration module has two editable fields: “acoustic calibration
factor” and “electric calibration factor.” The acoustic calibration factor is the same parameter that is normally measured with a calibrator.
The second screen lets you enter calibration factors manually.
The electric calibration factor cannot be determined automatically with a calibrator; it can
only be changed by hand. This parameter modifies the sensitivity of the XLR input for
electric measurements (e.g. AC Volt measurements). Recalibration should rarely, if ever, be
needed; exercise great caution when adjusting this value.
We recommend that you verify any new calibration in the SPL meter module. Re-apply
your calibration signal source, and check that the correct reference level is measured.
Once you press “save,” the measured calibration factor is committed permanently to the device’s non-volatile memory. This overrides earlier calibrations. Do not manually change calibration factors unless you are absolutely
certain that this is what you need to do. All measurements will be affected.
57
Page 58
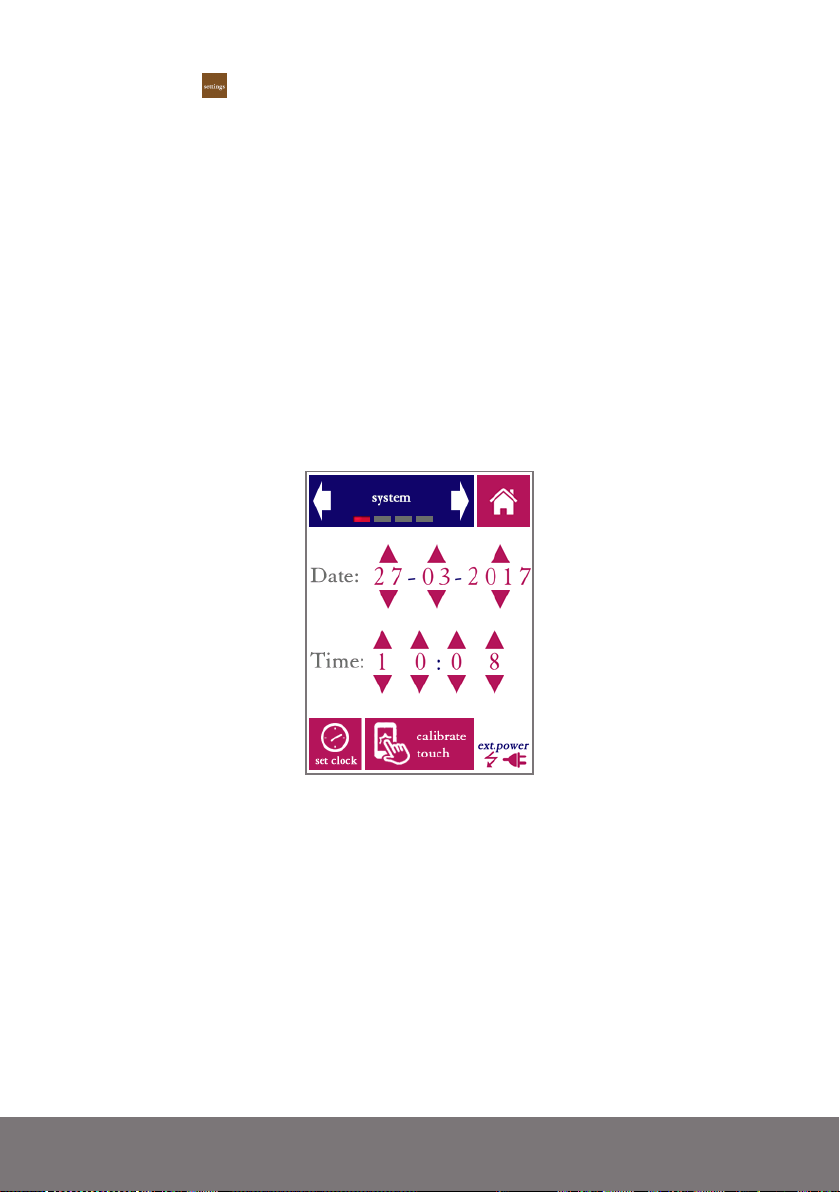
10.2. Settings
The settings module allows you to configure the overall settings of the device, in addition
to the module-specific settings found in each module. The following attributes can be set:
• Time and date (time in 24h format and date in DD-MM-YYY format)
• Calibration of the touch screen digitizer (use with caution)
• Phantom power to the microphone
• Microphone type selection
• Microphone pre-amplifier gain (measuring range)
• Time interval before the backlight automatically switches off to save power
• Brightness of the display (not available on early versions of the SM50)
• Recording of audio during measurements (on / off)
• Text annotations with each measurement (on / off)
The system date and time are changed by means of the arrows (up/down). Note that your
changes are not applied until you press “set clock.”
Date and time in the settings module
The Bedrock SMxx has an internal real-time clock that keeps running even when the device is powered off. The clock needs to be adjusted if the battery has been depleted completely, for instance when the device has not been used for a very long time. The system
date and time are used for time-stamping the saved data. If you download measurement
data over USB, the file creation date/time are only accurate if the internal real-time clock of
the device was updated to the right date and time.
Use the “calibrate touch”function if the response of the touch screen appears to be inaccurate. Calibration takes place by pressing exactly on the indicated marks near the corners
of the screen. Note that touch calibration is needed very rarely; do not activate this function
unless you are experiencing a reduced accuracy of the touch screen digitizer.
Page 59
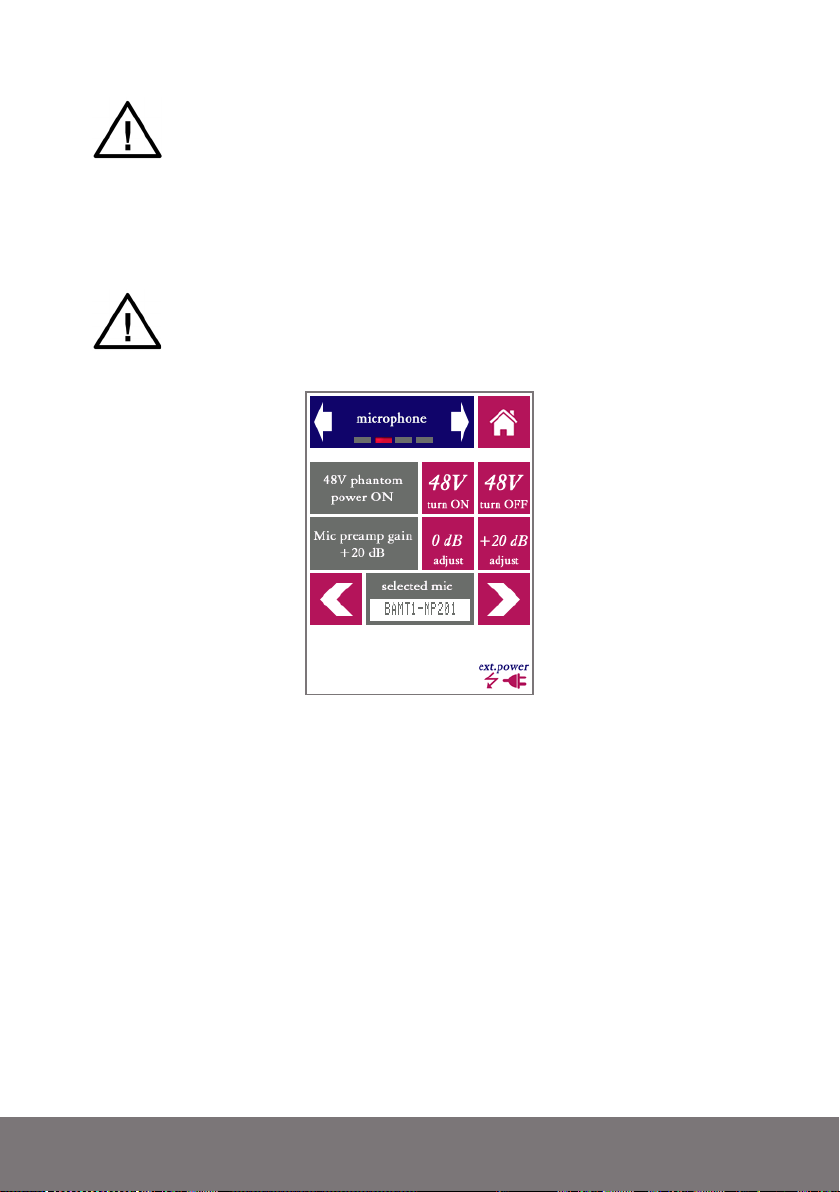
We strongly recommend that you use a stylus for calibration, to obtain calibration settings that are as accurate as possible. Note that false responses
during the calibration procedure (tapping completely in the wrong place)
may render the touch screen unusable.
From the “microphone” screen, the 48V phantom power can be switched on and off. If the
SM50 is used with its own (bundled) microphone, phantom power should be switched on.
Turn the phantom power off when measuring (line) levels from external electronic devices.
IMPORTANT: connecting equipment not designed for 48V phantom
power to the SM50 XLR connector (with phantom power switched on) will
permanently damage the connected device. Use this setting with discretion.
When in doubt, turn the phantom power off.
The microphone and preamp settings: turning phantom power on/off, selecting the preamp
gain (measuring range), selecting the microphone type, and selecting free field or diffuse field
measurements.
The internal microphone amplifier of the SMxx features an adjustable gain setting. Adjustment of the pre-amp gain is rarely needed, since the system has a wide (linear) dynamic
range. However, if you wish to connect an external signal source which operates at much
higher signal levels than the standard microphone, you can choose adjust the internal preamp gain, by choosing between 0 dB and +20 dB (default). Note that recalibration may
be needed when changing the pre-amp gain, even if the device adjusts the displayed level
range automatically. With the standard microphone, this setting should be +20 dB.
Different models of the SMxx ship with different microphone/preamp types. Each microphone model has its specific underrange/overload limits in each of the two measuring
ranges (0 and +20 dB). By selecting the correct type of microphone here, the parameters
of the device are set to the right values.
59
Page 60
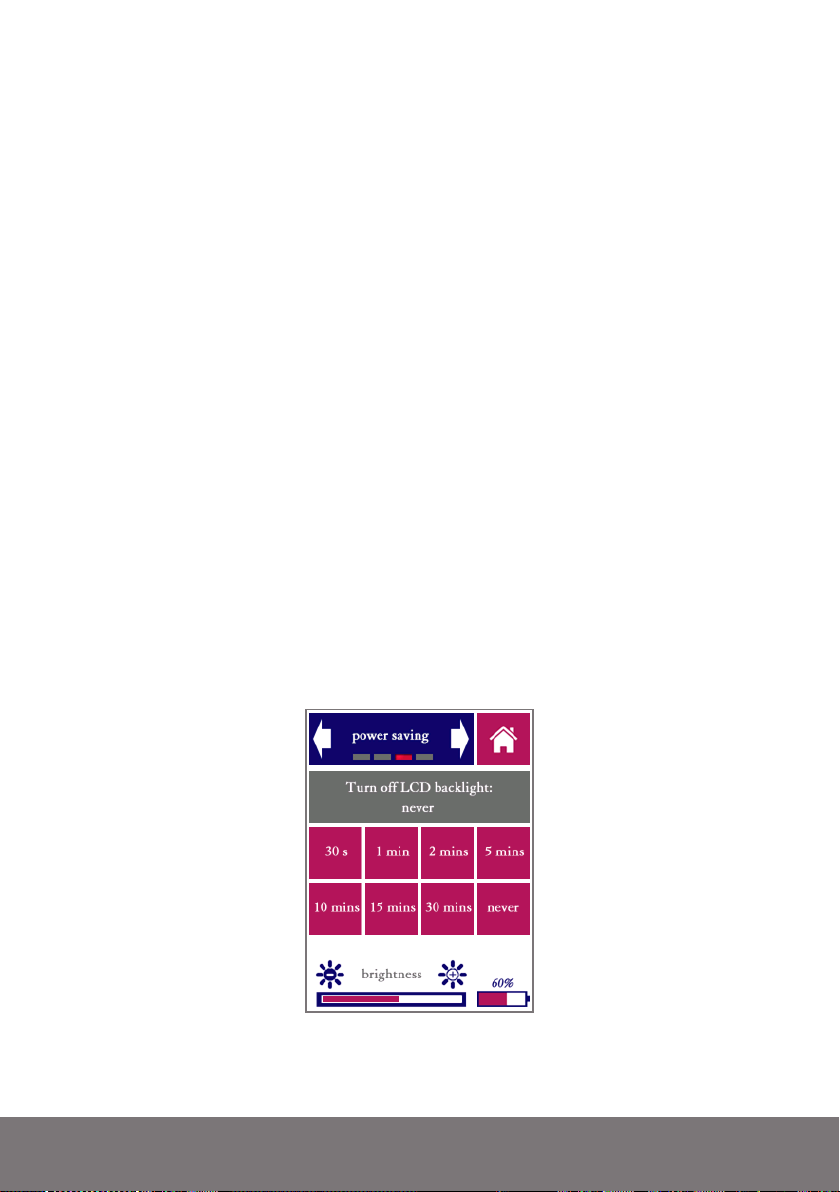
The following microphones are shipped standard with each of the SMxx device models:
• SM30: BAMT2
• SM50: BAMT2
• SM90: BAMT1-MP201 (BAMT1 with MP201 capsule)
The BAMT1-MP309 combination is a high-end class 2 / type 2 alternative sold with the
SM30 and SM50 devices, for specific applications where there is a requirement to have
periodic tests done by an accredited laboratory according to IEC-61672-3. Many accredited labs require the microphone capsule to be removable (which is not the case with the
BAMT2).
Always make sure that the microphone selected here matches the microphone mounted
on the device. The option “XLR electric in” is used when no microphone is used, but the
signal come from an external source into the XLR connector. This option sets the overload/
underrange settings to the limits of the internal preamp electronics, and sets all free-field/
diffuse field corrections to zero.
If you plan to use a third-party microphone with your SMxx, you will need to obtain a
so-called “mic.ini” file for that particular microphone. Please contact support if you need
access to third-pary microphone data (if available).
The microphone can be configured for “Free field” or “Diffuse field” conditions. The
BAMT1 and BAMT2 microphones are free field microphones by design; when setting the
device to “Diffuse field,” the appropriate corrections are applied.
The settings menu also features a screen that lets you configure the power saving settings
of the device.
Power saving settings (backlight time-out and display brightness).Note that backlight bright-
ness can not be set on some Bedrock SM50 (devices with serial numbers starting with SM50A).
Page 61
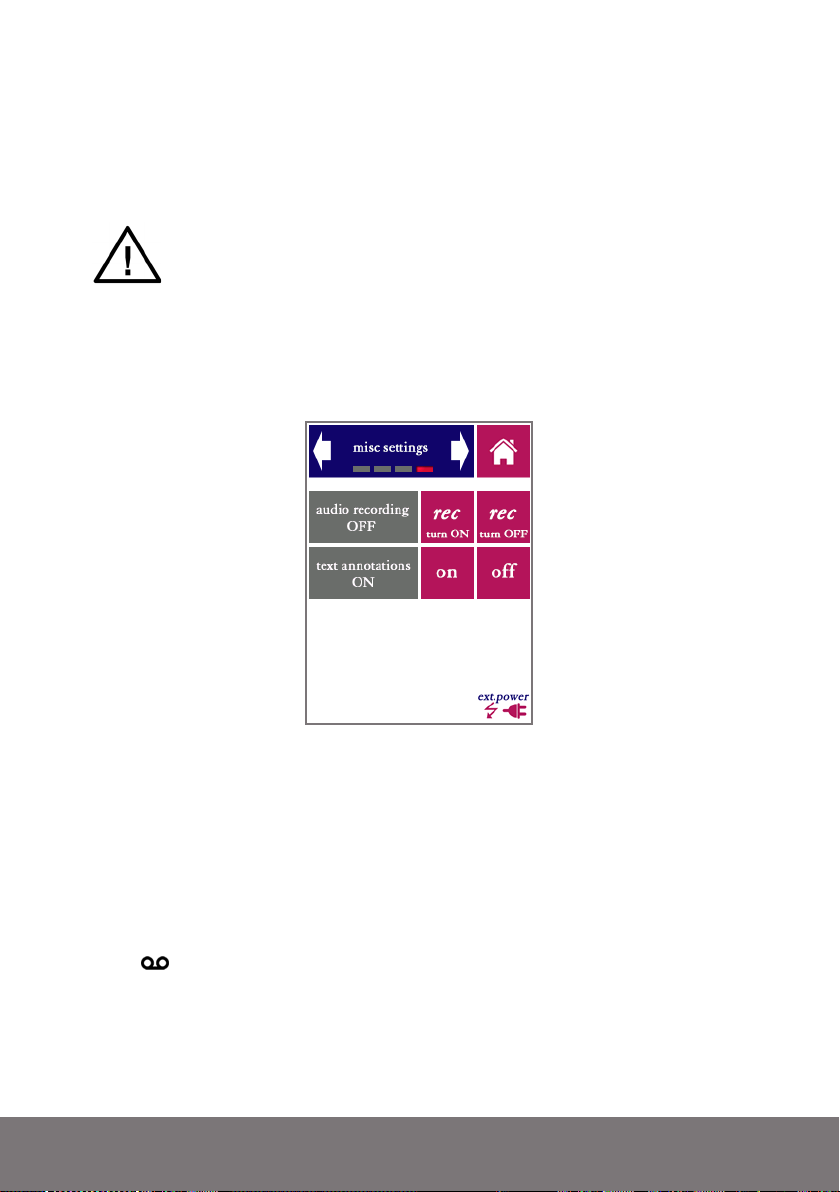
The backlight time-out makes the backlight automatically switch off if the touch screen has
not been touched for a while. This time-out can be set between 30 seconds and 30 minutes,
or the backlight can be set to never turn off at all.
The backlight time-out option saves a considerable amount of battery power. But keep in mind that it will cause the screen to black out without turning
the device off. Don’t forget to turn the device off when you finish working;
the fact that the screen is dark does not necessarily mean that the device is
turned off. To turn the backlight back on again after a time-out, press the
power button. The touch screen will not respond to presses while the backlight is turned off, but measurements will continue to run.
With the exception of some versions of the SM50, the brightness of the backlight can be
adjusted. This gives you the option to save power when using the device in conditions with
low ambient light levels (indoors).
Audio recording and text annotations.
The fourth screen of the settings module (“misc settings”) contains two settings: audio
recording and text annotations.
With audio recording set to ON, the audio of each and every measurement is recorded onto
the internal storage of the SM50 in .wav format, calibrated to 150 dB SPL at full scale. Note
that this uses up significant amounts of storage space. Once enabled from the settings tab,
audio will be stored whenever saving a measurement from any module, until audio recording is turned off again from the settings menu. If audio is being recorded, a tape recorder
symbol ( )will be shown above the progress meter during measurements.
With “text annotations” set to ON, the user is prompted to type a short text note whenever
a measurement is saved. After pressing the “save” button (in any of the modules), a text
keyboard will appear.
61
Page 62

Each annotation will be saved into a text file (.txt) with the same number as the corresponding measurement. It is still possible to save the file without entering a text note; simply press
“enter” on the keyboard without typing any text.
If a text note was save with a measurement, a little text balloon( )will show up when
browsing through saved measurements (bottom left of the screen, at the position of the
progress bar). The text annotation is displayed if this balloon icon is pressed.
Text annotations can be enabled and disabled at any time; all text notes previously made
will be kept. This option is disabled by default. The main drawback of enabling this option is that additional user interaction (typing a note) is needed whenever a measurement
is saved.
10.3. Status
System status information can be read using the status module. If you contact Embedded Acoustics for technical support, you will be asked to provide some of the information
displayed here (such as the firmware version and hardware revision). The current capacity
of the battery pack is also shown here, as well as the number of charge cycles to date, he
remaining data storage capacity and several other statistics related to the battery pack.
The status module is not used to make changes to the system, but just to retrieve system
information.
The following information is displayed:
Mainboard serial: unique ID of the device mainboard
Mainboard revision: hardware revision ID of mainboard
Software version: version of current firmware (all modules)
SPL version: version of SPL firmware (IEC-61672)
Software ID: identifier for the type of firmware needed
Disk space free: free storage in MB
Battery capacity: total capacity in mAh, taking battery wear into account
Charge cycles: number of times the battery has been charged
Incomplete cycles: number of interrupted charge cycles
Self-discharge: estimated self-discharge while not used
Charges since cal: number of charges since the battery gauge was
last calibrated
Page 63
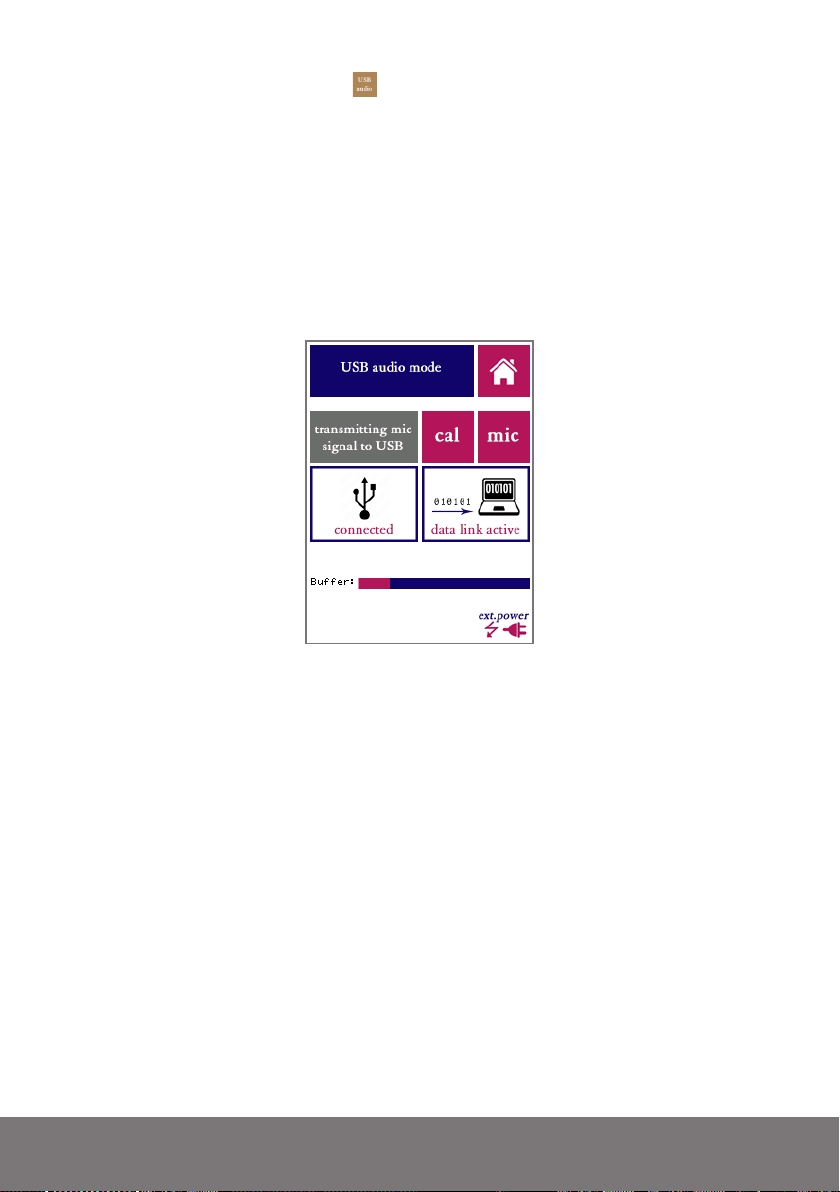
10.4. USB audio device mode
When starting this module, a special mode of the device is activated, in which it performs
no other tasks than simply streaming audio to a PC while applying the SMxx’s level calibration. This is done in the form of a single-channel stream, at a fixed bandwidth of 48 kHz
and a bit depth of 32 bits. All current versions of MS Windows should recognize the SMxx
while operating in this mode as a “USB audio device” and may also indicate that it is an
“omnidirectional microphone.” Once the device is detected by Windows, make sure that
the software that you intend to use is also configured for the device. A small Windows test
application is included on the USB flash drive that came bundled with your Bedrock SMxx.
The SM50 display while in USB audio mode
Once the device is connected via USB (and the PC has recognized it as an audio device), an
indication showing “USB connected” will appear. Once data starts streaming, an animated
picture and the message “data link active” will indicate that data is being transferred. This
will happen once an application initiates streaming audio from the Bedrock SMxx.
The audio signal is scaled so that full scale corresponds to 150 dB (e.g, a signal with a level
of 94 dB will correspond to a level of -56dB relative to full scale). Windows drivers and applications may digitally adjust the level by applying software-based volume settings. If left
unadjusted, the volume of the signal when directly played back on the PC may be quite low.
This is done on purpose, so that high levels of up to 150 dB can be accommodated. Given
the fact that 32-bit audio has a dynamic range of 192 dB, this does not affect the integrity of
even the lowest-level signals. The entire dynamic range of the Bedrock SMxx is available
digitally. If the audio is too soft, simply adjust the volume control on the PC.
If you want to explicitly calibrate your windows software to work with the Bedrock SMxx,
press the “cal” button to generate a synthetic 1000Hz sine at 94.0 dB. If you calibrate your
software to this level, then all audio measured by the SMxx will be registered at the correct
levels in your software as well. Press “mic” to return to normal operation.
63
Page 64
11. Accessing saved measurements from a PC
11.1. Connect USB cable
When you connect the Bedrock SMxx to the USB port of a PC or Mac, a dialog window
will appear on the device, asking if you wish to start data transfer. If the SMxx is powered
off when you connect it through USB, it will power on automatically.
The Bedrock SMxx will present itself to the USB host as a mass storage device. This allows
you to access the internal file system of the SMxx. You will see these directories/folders:
• UPDATES: place update packages here to update the firmware upon re-
boot
• CALIBR: Calibration data is saved here
• LOG: System logs are stored here (e.g. battery life cycle management)
• SPL, STIPA, RTA, FFT, RT60, LAEQ, SCOPE, USBAUDIO, NOISE-
CUR, ACV, SPEECHLM: folders where measurement data and recorded
audio from each of the measurement modules is stored.
• SYSTEM: system files (NOTE: this directory is hidden)
IMPORTANT: access to the SMxx system files is made possible so that you
can easily backup and restore the device. However, keep in mind that some
of the internal software of the SMxx is run directly from the files displayed
here. If you remove or change any of these files, your device will not work
properly anymore.
Changes to files in the hidden system folder may render the device inaccessible through USB, making it impossible to repair or update the system
firmware through the normal procedure. The instrument may have to be
returned to the factory to reinstall the firmware. Please note that service nec-
essary due to changes applied to files in the “system” folder is not covered by
warranty.
11.2. Copy your measurement data
In order to process and analyze your measurement data further, copy all results files from
the Bedrock SMxx to a local folder on your PC. The measurement files are saved in .csv
format. These files can be imported in almost all worksheet applications, such as Microsoft
Excel. MS Excel templates for downloading and processing your measurement data are
provided on the flashdrive included with your device. These will allow you to analyze the
data further, and pre-process the data for the purpose of reporting. User manuals for these
templates are embedded in the MS Excel files themselves.
Page 65

11.3. Resetting measurement number series
Even if you completely remove the measurements from the device, the SMxx will continue
the measurement numbering series where it left off. In order to prevent duplicate numbers,
the counter is not automatically reset. If you wish to reset it manually (restarting at number 1), you need to remove all .csv files. as well as the file named _INDEX.DAT. Every
directory that holds measurement data (SPL, RTA, STIPA, etc) has its own measurement
number sequence and its own _INDEX.DAT.
11.4. About the file format
Note that the .csv format is not a formal standard; differences in interpretation of the .csv
file format exist even between different versions of MS Excel. This results in the fact that
the output files from the SMxx may be imported very easily in some versions of Excel, and
may require more attention in other versions of Excel. If you are having problems importing the output files into Excel, import the files as “text files” rather than .csv. It may help to
rename the files to another extension than .csv (e.g. .txt).
11.5. Downloading recorded audio
If the “record audio” option is turned on in the system settings, then all audio recordings
are saved in the same folders as the .csv files with measurement data. The following applies
to stored audio recordings:
• Audio is stored in .wav format (single-channel 48 kHz floating point PCM),
which is easily read by many applications
• The audio is normalized to exactly 150.0 dB at full scale. Different audio
players may show the value of full scale differently; often full scale is normalized to a value of 1.
• Note that the level calibrations are implicitly preserved by this normaliza-
tion relative to full scale. This allows for easy further processing by acoustic
analysis software.
• Stored audio files take up considerable amounts of storage space (about
700 MB per hour). This fills up the storage capacity of the device relatively
quickly.
• On a related note, keep in mind that downloading large amounts of re-
corded audio data to a PC over the USB2.0 interface will take some time.
11.6. Further use of USB
Firmware updates are also done by connecting the SMxx via USB. Instructions on how to
perform firmware updates are given in the chapter 16 of this manual.
65
Page 66

12. Remote control from a PC
In certain situations you may wish to control your Bedrock SMxx remotely from a PC. To
achieve this, there are two ways: our Remote Display application and our Remote Control
API.
12.1. Remote duplication of the SMxx screen (Remote display)
To duplicate the SMxx screen on a PC, keep the Bedrock SMxx connected via USB, and
run the “Remote Display” application on Windows. This application should theoretically
work on any 64-bit version of Windows, but in practice many installs of Windows 7 have
issues dealing with serial connections. We currently only support Windows 10.
A self-extracting installer of the application is included on the flashdrive bundled with your
device, and can also be downloaded from our website.
The remote display application does exactly what the name says: you will get the exact
same controls that you have on the Bedrock SMxx device itself, but the entire display is
simply moved to a window on your PC.
The Remote Display application needs to have the exact same firmware version that your Bedrock SMxx is running on. If the firmware version differs,
RemoteDisplay will prompt you to find the correct .EAP firmware package
on your local computer, or automatically download it from the internet.
The remote display application does precisely what the name says: you will get the exact
same controls that you have on the Bedrock SMxx device itself, but the entire display is
simply moved to a window on your PC.
When you first run the application, you will have to choose the correct COM port (as assigned by Windows to the SMxx). If you select the wrong port, or if you want to change the
COM port setting later on, press TAB from within the Remote Display application. You can
now select any of the available COM ports on your PC.
The resolution of the display is 240x320 pixels. You can stretch the window of the Remote
Display application to enlarge it. It may be convenient to use an enlarged version of the
display (e.g. in classroom settings), but while increasing the size, the resolution remains
240x320. It is therefore normal for the enlarged display to look somewhat blurry.
All functions on touch screen on the SMxx are temporarily disabled as soon as a connection to the Remote Display application is made. Touch the display to return control to the
Bedrock SMxx.
Page 67
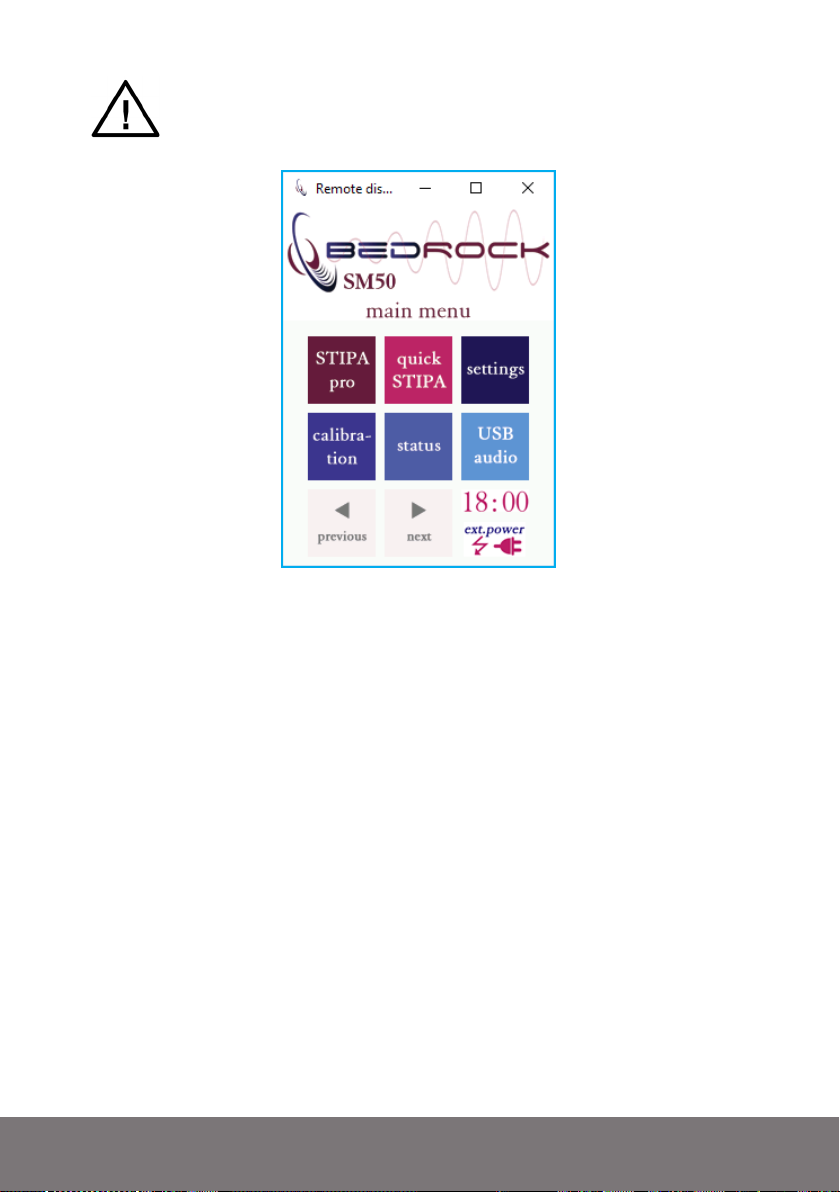
Always make sure that you are using high-quality USB cables, especially
when operating with a long cable between the Bedrock SMxx and your PC.
Most USB connection issues are traced back to poor quality cables.
The main menu from the Bedrock SM50, as accessed through the Remote Display application
under Windows 10.
If the remote display application is not working, check the following:
• The firmware package running on your SMxx must be present in the application data
folder of the remote display application, e.g:
C:\Users\<yourusername>\Appdata\local\roaming\RemoteDisplay\
Substitute your actual username in place of <yourusername>. The precise path depends on your version of Windows and your device settings. The .EAP package for
the firmware on the connected device (the same file used to update the firmware on
the SMxx) must be in the application data folder, or the application will not run. Note
that RemoteDisplay will prompt you if it does not have the correct firmware available,
and offers you the option to download it from the internet (directly from the Bedrock website). You will need an internet connection to use this option. Alternatively,
download the firmware update manually and select “Browse local” to find the .EAP
package on your local disk.
• The correct COM-port must be selected. Press TAB to choose from the COM-ports
detected on your device. If you only see low numbers (e.g. just COM1 and COM2),
then Windows may not have found the USB virtual COM-port associated with your
SMxx. Try reconnecting the SMxx.
•
67
Page 68

• It is possible to connect multiple SMxx devices at the same time, but note that there is
no way to identically match up each RemoteDisplay Window with the corresponding
SMxx. You will have to carefully keep track of this manually.
The Remote Display application is useful for manually controlling devices from a distance.
For more advanced applications, such as automated processing of larger tasks using your
own custom code, we recommend using our remote control API.
12.2. The Bedrock remote control API
Each Bedrock SMxx device that is connected to USB attempts to set up a USB-CDC serial
connection with its host. This allows you to connect to the SMxx from your own software.
Our remote control API is available upon request, free of charge, for every user of a Bedrock
SMxx device. A full description of the API is well beyond the scope of this manual. We will
briefly describe the characteristics of the API here. For sample code and documentation,
please contact [email protected].
Through serial commands, you can control virtually every function and control that the
user also has control over via the display. You can launch and terminate modules, set parameters and start and stop measurements at will. Measurement results can be read by a
host application, or results can be saved on the SMxx and then retrieved by accessing the
SMxx as a mass storage device.
Since all calls are implemented as commands sent over a serial connection, in principle
the SMxx could be controlled via a simple terminal program. A list of serial commands is
provided as part of the API. Using these commands, remote control can be implemented
on any platform, in any programming language, as long as the host device implements
USB-CDC.
Most commands (such as commands for starting and stopping measurements, or requesting software versions) are the same across all modules. On top of these generic commands
there are module-specific commands for each module.
To further simplify the development of dedicated control software by the end user a C#
library is provided that implements the serial commands.
Page 69

This page is intentionally left blank
69
Page 70

13. Power and charging
13.1. Charging instructions
We recommend that you charge your Bedrock SMxx only with the USB charger and the
USB cable supplied with the instrument. Alternatively, you can charge the device through
any external USB charger with a charge current of 1500 mA or higher. Some PCs allow
increased charge currents to be drawn from their USB ports (sometimes through special
ports marked “Boost” or “Charge”). These can then also be used to charge the instrument.
Note: the instrument will NOT charge from a standard USB port on a PC
or Mac. The current supplied through a computer USB port is normally insufficient to charge the device. The fact that the device may be powered from
such a USB port does not necessarily mean that there is sufficient current
left to also charge the battery.
The Bedrock SMxx has internal charge circuitry that optimizes your charge time while
safeguarding the life span of your battery pack. Also if you are not using the device for a
prolonged period, you can safely keep it connected to a charger.
A few charging tips:
• A LED next to the USB shows the charge status. While blinking (alter-
nating between green and orange), the battery is still charging. The LED
burns constant green as soon as the battery is full.
• If you find, over time, that the batter y capacity is reduced significantly com-
pared to its original capacity, we recommend that you fully discharge the
batteries, and then fully recharge them. If necessary, this procedure may be
repeated a few times.
• If the battery charge indicator appears to become inaccurate (e.g., the bat-
tery is drained quickly from the point that the indicator still shows 50%
charge), it also helps to completely discharge and recharge the battery.
• It is normal for the total batter y capacity to slowly decrease over time. Af-
ter 500 charge/recharge cycles, the battery capacity is normally at 80% to
90% of its original capacity, depending on the way the device is used and
recharged.
• If you start using the SMxx after a long period of storage, we recommend
that you first top off the charge before using the instrument. You may also
want to check if the date and time settings were preserved.
Page 71

• It is not possible to charge the batteries while measuring. Once you connect
the charger, the instrument will ask whether you want to go into charge
mode or operate on external power. If you answer “external,” then the batteries will not be charged. The current from the charger will be used to
power the instrument, so that the batteries are not depleted.
• We advise to use discretion when powering the instrument externally from
an AC source while measuring. The instruments’ measuring electronics
are highly sensitive; the digital charging circuitry may have an impact on
the noise floor of the pre-amplifier and microphone, while noise and hum
from the AC charger may also be inserted. Although the electronics have
been protected against such sources of interference, we recommend that
you verify that electronic noise does not affect the measurement.
The self-diagnostic program that runs whenever the Bedrock SM50 boots up performs a
series of checks on the battery pack, which may result in one or more warning dialogs being
displayed. Please refer to the section “Getting started” for more details.
13.2. Power saving recommendations
How long the device can be used on a single charge depends on the mode and intensity of
use. Power conservation settings can be controlled from the device’s “hardware settings”
menu. With its default settings, approximately 350 STIPA measurements can be carried
out over the course of an 8 hour day without recharging.
Some ways to extend the battery life:
• Switch off the device when you do not plan to use it for a while
• Choose conser vative power settings in the hardware menu. The LCD back-
light is a considerable factor in the overall drain on the battery.
• Disable “pre-amp phantom power” if you use a microphone that does not
need it.
13.3. Use of power banks and external battery packs
For very long measurement sessions, the battery capacity of the internal battery may be
insufficient. If you cannot spare the time to recharge in the middle of your session, we
recommend that you use an external USB battery pack (aka power bank). Even though the
SMxx has been certified to comply with applicable EMC standards, also when connected
to an AC source, the signal quality is always slightly better when powered from batteries.
When you connect the SMxx to an external battery pack, a dialog will appear asking you
whether you want to charge the device or operate on external power. We recommend that
you do not recharge the internal battery from the power bank, so choose “external.” The
internal battery will then not be charged, nor discharged, while measuring. Note that the
battery pack should have an output current rating of at least 1500 mA.
71
Page 72

14. Cleaning, maintenance and
calibration
With normal use, no further maintenance is needed beyond normal cleaning periodic recalibration of the device. We recommend that you have the device checked and calibrated
at our factory or at an external calibration specialist at least once every 2 years.
We recommend having the battery pack replaced after approx. 500 charge/recharge cycles,
or once every 4 years.
We recommend that you clean the instrument with a soft cloth. LCD display cleaner can be
used to clean the touch screen, provided that the following precautions are taken:
• Do not spray cleaner directly onto the display
• Only use cleaning liquids specifically intended for LCD screens
Battery disposal
The device contains a 4.8v rechargeable NiMH battery pack. At the end of
the life cycle of this product, care should be taken to dispose of this battery
pack responsibly, in compliance with rules and regulations for recycling of
batteries that apply in your region. MAKE SURE THAT THIS BATTERY
PACK IS REMOVED BEFORE DISPOSING OF THE DEVICE. If you
are unable to remove the battery pack yourself (by unscrewing the back lid
of the device), make sure that you mention the presence of an NiMH battery
pack when handing in the entire device for recycling.
Page 73

15. Product warranty
The device is covered by a full-service, worldwide pick-up & return warranty until 24
months after the date of purchase. Please direct all warranty claims to:
Embedded Acoustics BV
Ampèreweg 18
2627 BG DELFT
THE NETHERLANDS
[email protected]
Please email us and wait for our response (typically within a business day) before shipping
your hardware back. We may ask you to fill out an RMA form, and we will supply you with
a reference number for your warranty claim. If you can provide a complete statement of the
problems you are experiencing, this will help us solve your hardware issues as soon as possible. Always provide the ID number of your device (found on the bar code label on the back
of the device), your name and address, and your date of purchase. If you did not purchase
directly from the Bedrock webshop, also include dated proof of your purchase.
In general, our warranty programme covers all defects except for those resulting from accidents, misuse (including improper electrical connections) and improper maintenance. The
following is explicitly excluded from product warranty:
• Any damage resulting from dropping, falling or excess vibration
• Any damage done by liquids, including damage resulting from excessive
use of screen cleaning liquids
• Any damage resulting from incorrect electric connections to the device
through the USB and/or audio connectors
• Any damage done by power surges or overvoltage on the USB power supply
and/or audio connector
• Any mechanical damages to the display caused by mechanical forces ap-
plied to the screen surface, such as scratches.
• Any damage resulting from attempted changes to the system firmware, in-
cluded changes to the files in the “system” folder.
• Normal wear and tear
The following voids warranty:
• Repair attempts by an unauthorized party
• Replacement of battery packs by an unauthorized party
• Removal of product stickers, tamper proof seals, bar codes or serial numbers
• Attempts to install firmware from any other source than the manufacturer,
or firmware intended for a different device model.
73
Page 74

Malfunctions that are found to result from any of the above conditions are not covered by
warranty. Repairs will take place only at the expense of the owner. If claimed under warranty, an examination fee may be charged and transportation costs will be charged to the
owner.
Please do not attempt to open your Bedrock SMxx yourself, as there are no user-serviceable
parts inside. If you do see a legitimate need to open the device yourself, please contact warranty@bedrock-audio first, so we can discuss preserving your warranty rights. Please be
aware that the product is protected by tamper-proof seals.
A worldwide pick-up&return service is included in the warranty. This means that we will
have the defective unit picked up at your location at no charge, provided that it is presented
in its original equipment case, packed in a cardboard box with suitable cushioning material.
Page 75

16. Firmware updates
Firmware updates are released through our website Bedrock-audio.com. Before updating
your firmware, always check:
• If the update you downloaded is intended for your device type (the SM30/
SM50/SM90)
• If you have sufficient battery charge to complete the update cycle without
interruption
Interrupting the power supply during the update process may render your device unusable.
If this happens, try to repeat the update procedure. If this does not work, or if you can no
longer access the device through USB, please contact [email protected].
Executing a firmware update is easy:
• Choose and download the correct firmware update package from
www.bedrock-audio.com/support
• Connect the device to any PC or Mac through USB
• When prompted on the LCD screen, choose “connect through USB”
• The SMxx’s internal file system can now be accessed from your computer
in the same way as any mass storage device
• Copy the firmware updated package to the folder named “updates”
• Now restart the device using its power button
The firmware update procedure will automatically start. You will be able to see the progress
of the update procedure on the LCD display. The update may take up to 45 minutes, depending on the size of the update package.
Never interrupt the firmware update procedure. Make sure that the device
is fully charged or connected to a stable power source before starting the
update procedure. Please be aware that the update procedure may take a
significant amount of time, depending on the update package that you are
installing.
Never try to install an update package intended for a different device model.
The update package will most likely not install; if it does, it will render your
device inoperable. Damage sustained through attempts to install incorrect
firmware update packages is not covered by warranty.
75
Page 76
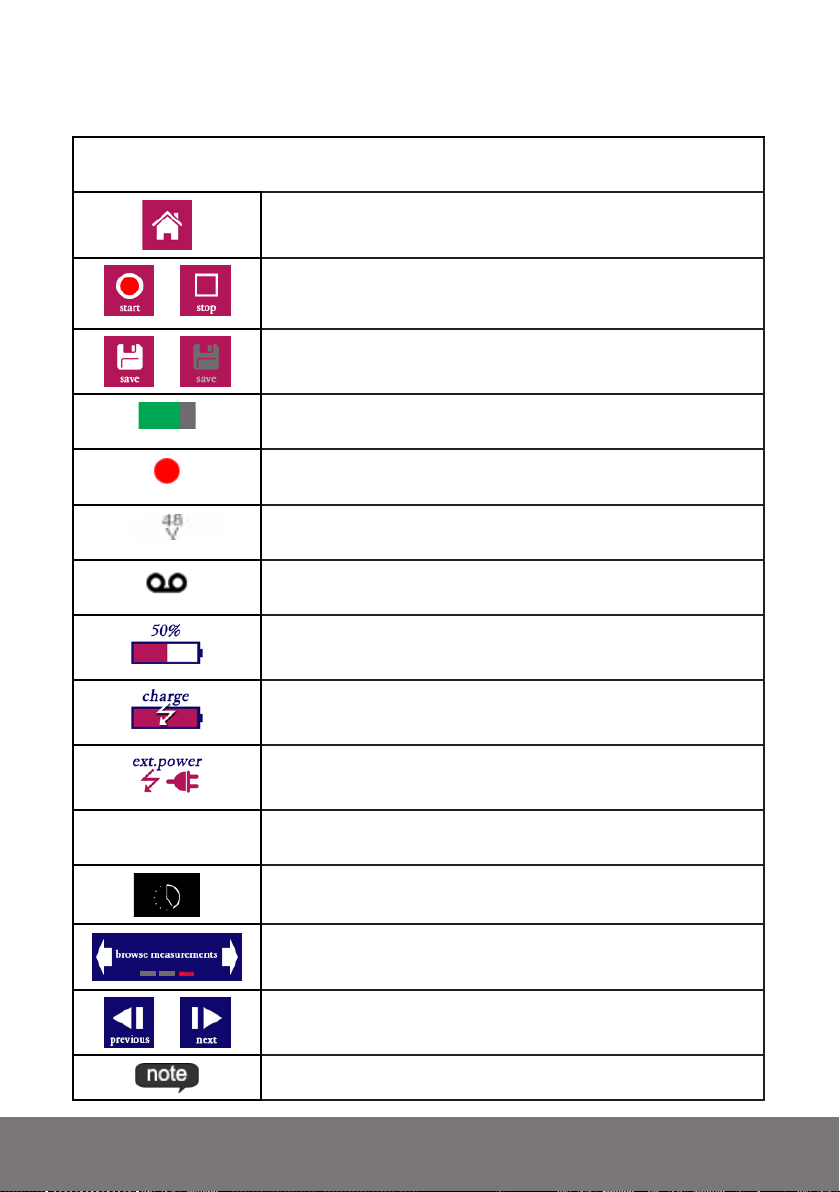
17. Buttons, icons and symbols
Common buttons, icons and symbols shared between modules
Home
Sends you back to the main menu of the SM50
/
/
#0001
Start /stop measurement
Save button
Disabled if grey (no data to save)
Progress meter. Shows progress of current measurement (fully
green = finished)
Measurement running
Showing while recording is running
This is showing if phantom power is enabled in “settings”
Turns from grey to black is phantom power is active
Audio recording indicator
Showing if audio recording is enabled (NB: tap “save” to store)
Remaining battery charge
Battery charging
Operating on external power
Measurement number
Serial number of current measurement
Instrument busy
Occurs when switching modules
Menu navigation. Tap arrows to flip through menus (red block
indicates position of current menu within menu structure).
/
Browse forward / backward through stored measurements
Text annotation stored for this measurement. Press to read
Page 77
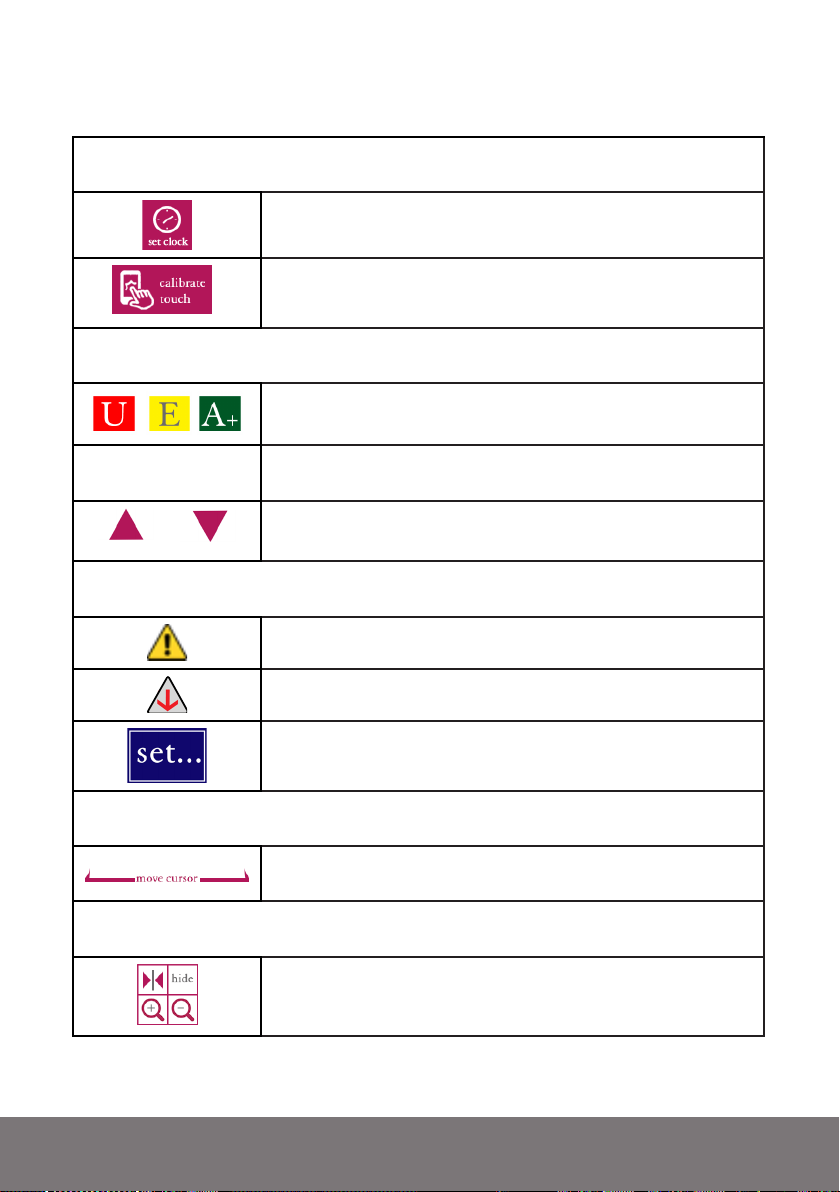
Settings module
Set system clock
First adjust the date and time; then tap this button to confirm
Calibrate touch screen
Tap this button to initiate touch calibration procedure
Quick STIPA / STIPA pro module
Qualification label U-A
N!
as defined in IEC-60268-16 (derived directly from STI)
STI shown includes the effect of “additive noise” according to
the noise spectrum entered in the “additve noise” menu
/
SPL meter module
RTA meter module
FFT module
Adjust graph scale up / down
Overload indicator
Underrange indicator
Set time and frequency weightings. Settings keyboard appears
upon tapping this button
Move cursor through frequency bands. Tap left to move to lower
frequencies, right to move to higher frequencies.
Zoom controls, which appear if the magnifying glass icon on
the chart is pressed. Zoom in (+) or out (-), and center around
the current cursor position. Tap “hide” to collapse.
77
Page 78
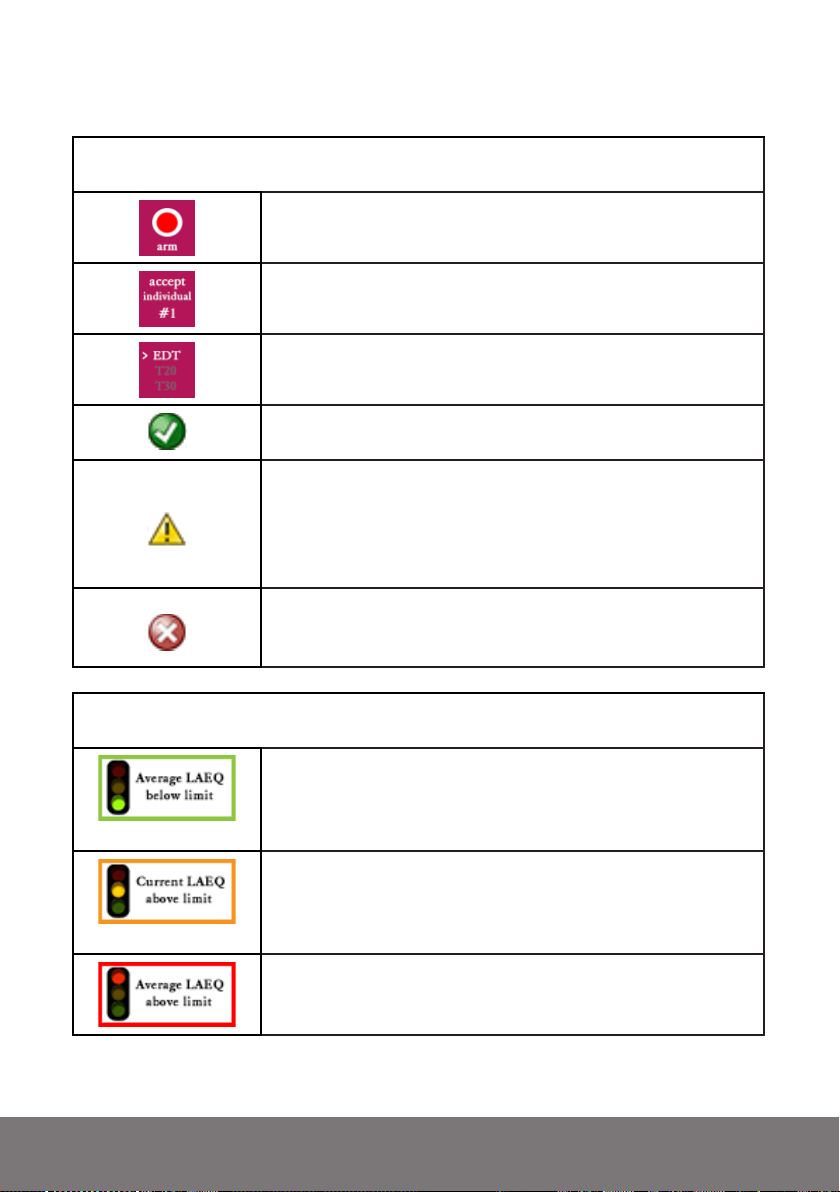
RT60 module
LAEQ logging module
Press button to arm the instrument. The measurement is then
automatically triggered once the energy level drops.
Press to accept the current individual measurement, and to
incorporate data from this measurement into the overall mean.
Select which reverberation metric to display (EDT, T20 or
T30). Press multiple times to cycle through the options.
The reverberation time measured in this frequency band is
consistent and reliable. Measurement error <= 0.1s
The reverberation time measured in this frequency band
may not be fully reliable; the signal-to-noise ratio is less than
required, or the energy decay curve is not be sufficiently linear.
The result will be indicative of the true reverberation time, but
the measurement accuracy is not guaranteed.
On theoretical grounds, or based on the measurement data,
the reverberation time measured in this frequency band is
considered unreliable.
The A-weighted equivalent-continuous sound level (LAEQ)
is below the preset limit. This is true when considering the
current (short) period (<1min) as well as when considering the
running average (typically 15 minutes).
The running average is still below the limit, but the current level
exceeds the limit. The running average will soon exceed the
limit as well, unless the sound level is reduced in the upcoming
period.
The running LAEQ average exceeds the limit.
NOTE: this table does not describe all buttons and functions. Generally, buttons will be
marked with captions that explain their function.
Page 79
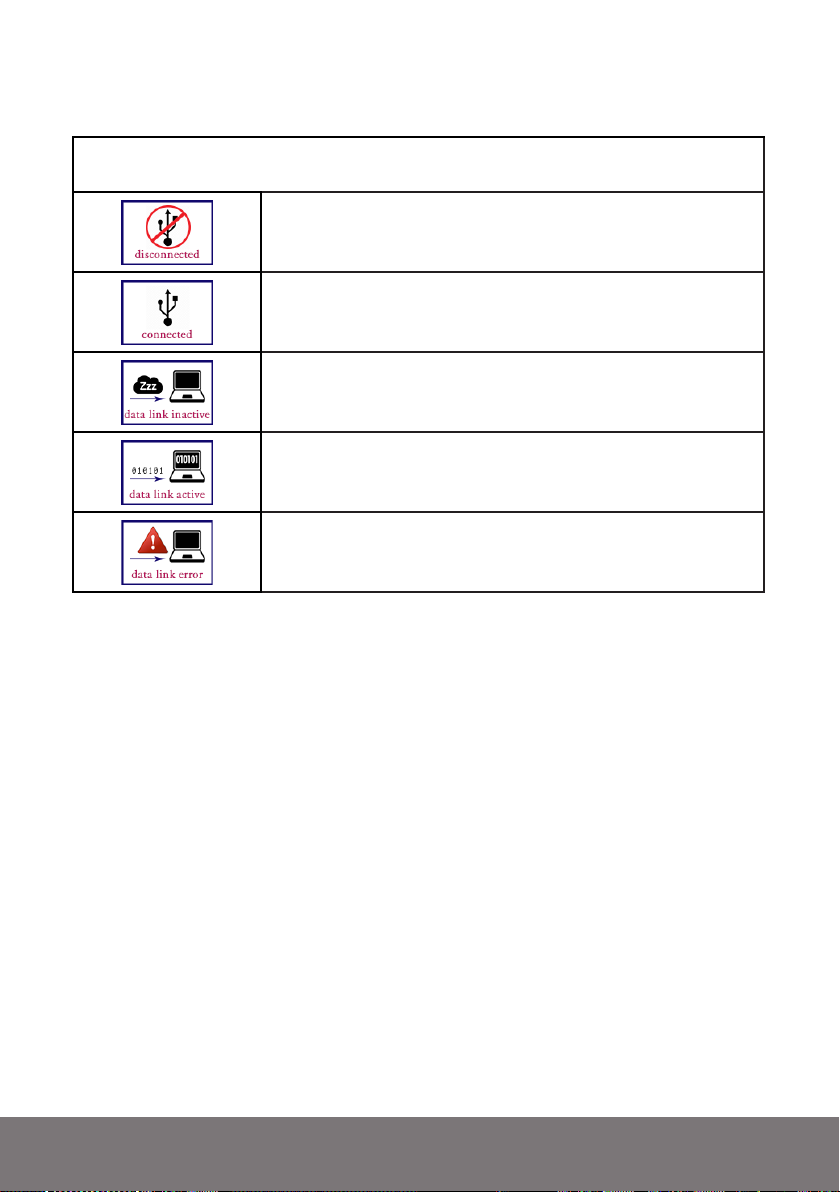
USB audio mode
USB is not connected.
USB is physically connected. A data connection with Windows
audio drivers may or may not have been established
The USB data link is inactive. No audio is streaming
The USB data link is active and audio is being streamed digitally to your computer
An error occurred while setting up the data link
79
Page 80

18. Technical specifications
Functionality
Standards compliance
RTA filter specifications (IEC-61260)
Acoustic specs device
Microphone specs
(SM30/SM50)
Microphone specs
(SM90)
Speech Transmission Index (STIPA and Full STI)*
Speech Level Meter (IEC-60268-16)*
Sound Pressure Level meter (A, Z, slow, fast, Leq, pk)
LAEQ logging and long-term monitoring
1/1, 1/3, 1/6 and 1/12 octave RTA
RTA logging
FFT analyzer
RT60 reverb time measurements
Noise curves (NR, NC, PNC, NCB, RC, RCmarkII)
Oscilloscope
AC volt meter (Vrms, dBU, dBV)
USB audio device mode
Remote operation via USB
* not featured on SM30
IEC 60268-16 rev. 4, IEC 61260 (class 0), ISO 3382-2, ANSI S12.2,
ISO-1996
SM30/SM50: IEC-61672 Group X Class 2; ANSI S1.4 Type 2
SM90: IEC-61672 Group X Class 1; ANSI S1.4 Type 1
Class 1 1/1, 1/3, 1/6 and 1/12 octave filters (base 10)
Effective noise floor: < 25 dB(A) for class I devices (SM90) or <30
dB(A) for class II devices (SM30/SM50).
Upper limit peak range: 124 dB (highest range, 20 Hz - 20 kHz)
Linear range: See separate table below
Maximum permissible sound pressure level is 155 dB
Maximum electric input signal is 30 Vpp
Microphone type BAMT2, 48V phantom powered
1/4” omnidirectional free-field microphone
Conforms with class 2 / type 2 requirements
30 mV/Pa sensitivity
Microphone type BAMT1-MP201, 48V phantom powered
1/2” omnidirectional free-field microphone
Detachable IEC 61094-4 Type WS rear-vented mic capsule
Capsule housing alloy, diaphragm nickel
Conforms with class 1 / type 1 requirements
Capacitance 16 pF
50 mV/Pa sensitivity
Dynamic range (3% distortion limit) > 146 dB
Temperature Coefficient: -0.012 dB/°C
Pressure Coefficient (250 Hz): - 0.004 dB/kPa
Display
Resistive LCD touch screen
320x240 pixels, 65k colors
Luminance typ. 250 Cd/m2
Durability: 100k finger slides, 1M taps
Page 81
Data storage
Environmental
Power
Start-up period
Overload and underrange indicators
Electromagnetic
compatibility
Mechanical specs
Bundled items
4 GB internal storage for data and firmware
Accessible from PC through USB (mass storage mode)
Temperature: 5 -35oC (41-95F)
Relative humidity: 0% - 95% (non-condensing)
NiMH battery pack 4.8V nominal, typ. 2500 mAh
Typical battery lifetime >4h
Max. charge current 1.8A
The SMxx is ready for measurements 20 seconds after powering up
Overload and underrange conditions are indicated with the resp.
icons as shown in section 17 of this manual. Icons will show when
levels outside the linear range are measured (See table below).
Complies with EN 61326-1:2006 - EN 61326-1:2006
FCC part 15 compliant (class A device)
Size approx. 210 x 85 x 55 mm (excl. microphone)
Weight 530 g (including microphone)
Rear-mounted tripod adapter
Hook for carrying cord
Carrying case, measuring instrument, microphone, USB charger,
int. charger adapters (US, EU, UK, AU), USB charging/data cable, manual, carrying cord, USB flash drive with test signals and
software tools.
Linear range (31 Hz - 4k - 8k - 12.5kHz)
Upper and lower limits of linear range (dB
SPL)
Low range (+20 dB)
High range (0 dB)
Reference range
A C Z A C Z
BAMT1 - MP201 25-117 23-115 26-118 40-130 38-128 41-131
BAMT1-MP309 27-117 25-115 28-118 40-128 38-126 41-129
BAMT2 30-120 28-118 31-121 46-122 44-122 47-123
Upper and lower limits
of linear range (dBuV)
Low range (+20 dB)
Reference range
High range (0 dB)
A C Z A C Z
Electrical input (XLR) 21-119 19-117 22-120 37-132 35-130 38-133
81
Page 82

19. Troubleshooting
Problem Possible cause Solution
System does not power on after
pressing power button
System does not recharge after
connecting through USB
Display shows error messages
(green or red text).
Battery lifetime is too short Battery not fully charged
Battery indicator is inaccurate Battery charge measurement
Device warms up during use Lack of ventilation Warming up of the device
Device not recognized by PC
when connected through USB
Display backlight turns off, no
response to touch screen
Device “hangs,” becomes unresponsive, or will not power
up after resetting, and/or LED
next to USB port burns red.
Battery empty Connect wall charger for at
least 30 minutes
Charge current too low Use bundled wall charger and
USB cable; standard PC USB
ports do not supply enough
current to charge
Error on display processor or in
communication between DSP
and display processor
Battery is worn
system poorly calibrated (e.g.
due to self-discharge after prolonged shelving)
Driver problem
Device in measurement mode
Backlight time-out event Adjust backlight time-out in
Internal software problem Keep the power button pressed
If the problem persists, contact
support.
Keep device on charger until it
completes its charge cycle.
Have battery replaced after.
500 charge cycles or 4 years.
Completely drain the battery,
and then fully recharge. Repeat
if necessary.
to temperatures of approx.
35C/95F is normal. If the device runs considerably hotter
than that, check ventilation
and contact support if the
problem persists
Update PC drivers (SM50 is
approached as a mass storage
device)
Select USB data transfer mode
when dialog window appears
on the SM50 screen
power saving settings. Pressing
power button turns the display
back on
for 10s. This forces the device
to shut down. Then press the
power button again to restart.
If the problem persists, contact
support
Page 83

LED states
LED state Meaning
Burning green Device operating
Blinking red/green Device charging
Burning or blinking red DSP crash. Hard reset needed (keep power button pressed 10s)
Blinking red when booting System files missing or corrupt. System folder or system files
may have been moved, changed or deleted.
Firmware update error codes
LED state Meaning
Error 17
Error 18
Error 19
Error 20
Not a valid file. The update package failed to produce
the correct checksum during the file verification procedure. This is usually caused by a corrupted or incomplete
package download. If this error persists on Windows 7,
try this:
- Find the drive letter for the SMXX, and right click.
Choose “properties”
- Go to the hardware tab. Click on “properties”
- Click “change settings”
- Go to the “policies” tab
- Select “Better performance” instead of “Quick removal”
File transfer failure. The transfer of one of the packed
files failed. This may have various causes, but most likely
it is a (possibly temporary) issue with the internal file system. If you keep getting this error, please contact support.
Update package does not match device type. The update
package copied to your device is intended for a different
model. Please download an update package for your device model and try again.
The update package does not contain device type info.
The update package copied to your device does not contain device type information. Most likely, you are trying
to install an older firmware version on a newer device.
Try installing a package for version 1.8.0 or higher. If you
urgently need to roll back to an older firmware version,
contact support.
83
Page 84

This Declaration of
Embedded Acoustics BV
C
Ye ar of In trod uc tion
EC declaration of conformity
EC Declaration of Conformity
Conformity is suitable
to the European
Standard
EN 45014 General
Criteria for supplier's
Declaration of
Conformity.
The basis for the
criteria has been found
in international
documentation,
particularly in ISO/IEC,
Guide 22, 1982,
Information on
man ufactur er's
Declaration of
Conformity with
st andards or
other technical
specifications
We,
(Sup plier' s name )
Molengra affs ingel
N/A Delft
N/A
(Sup plier' s addre ss)
Declare under our sole responsibility that the product:
SM50
(Name, type or model, batch or serial number, possibly source and number of items)
To which this declaration relates is in conformity with European Harmonised Standards as published in:
Official Journal
of the EC, Issue:
(Issue of publication of the list of harmonised standards)
The compliance of the product has been based on the following standards:
Bedrock SM50 STIPA meter
N/ A
EN 61326:2006 [EMC - Emissions]
EN 61326:2006 [EMC - Immunity]
EUT is suitable to be applied in residential and light industrial environments
(Title and or number and date of issue of the applied stand ard(s ))
Following the provisions of the Directives (if applicab le):
EMC-directive 2004/108/EC
(Reference of appropriate directive)
These co nclusions ar e based on test r eports:
20 13
on the market
Report number: 2316/SM50/EMC
ce-test,
qualified testing bv
Kiotoweg 363 3047 BG Rotterdam
(Test report number, date and name of test house)
Delft, 2013-10-21
(Place and date of issue)
(name of responsible for CE-marking) (signature or responsible person)
S. van Wijngaarden …………………………….
.
Page 85

Annex A. Correction factors for SPL
measurements (IEC-61672)
All of the microphone types distributed with the SMxx are designed as free-field microphones. The BAMT1 modules feature detachable 1/2” capsules, whereas the BAMT2 has
a fixed 1/4” microphone. In this annex, data for each of the microphones are provided that
may be needed in any of the following cases:
• In case you are an end user who wishes to manually correct measurements for maximum accuracy. End users of the Bedrock SMxx who aim to achieve the highest possi-
ble accuracy may correct free field measurements with the (typical) free-field response
of the applied microphone. Similarly, they may wish to correct for the frequency-dependent effect of the windscreen or for reflections against the instrument body.
• In case you are a test lab and need to perform periodic tests according to IEC-61672-
3. This standard defines the procedures for periodic testing of acoustic measuring in-
struments, in particular when used for measuring sound pressure levels. IEC-61672-3
requires the free field response to fall within certain tolerance limits, after application
of correction factors provided by the manufacturer. Those correction factors are given
in this Annex for each type of microphone offered with Bedrock instruments.
The following microphone data are provided for all microphone types that are available
with the Bedrock SMxx:
• Typical free field response. Since our microphones are free-field microphones, the
free field response should ideally be zero for all frequencies, but in practice small deviations occur, particular at higher frequencies.
• Typical actuator response. Calibration labs that use electrostatic actuators to verify
the microphone response need the free-field to actuator corrections specified in this
Annex.
• Typical pressure field response. Test labs that use a the multi-frequency calibrator for
periodic testing (such as the B&K4226) need to apply the free-field to pressure field
corrections specified in this Annex.
• Effects of reflections from the instrument body. Reflected sound from the instrument
body have a small but measurable impact on the measured sound field. The overall response, including these effects, needs to fall within the tolerance limits of IEC-61672-3
during periodic testing.
• Effects of wind screens. The 32mm wind screens supplied with the BAMT1 and
BAMT2 microphones have a measurable impact on the microphone response. If these
windscreens are included in the scope of periodic testing, the overall response (including wind screens) needs to fall within the tolerance limits.
85
Page 86

A1. BAMT1-MP201 microphone
The BAMT1-MP201 is the default microphone-preamp combination bundled with the
Bedrock SM90. The MP201 is a high-precision Class I / Type I free field microphone capsule.
A1.1. Typical free field response and actuator to free field corrections for the
BAMT1-MP201.
The typical free field response of the MP201 capsule is specified in this section. The MP201
(including grid) was measured by the manufacturer at 0 degrees incidence, based on average values of microphone capsules against a B&K 4180 response using a B&K 4228 Pistonphone. Microphones were mounted on M201 preamp. The typical actuator reponse was
determined using a GRAS RA0015 and a GRAS 14AA. The measurement uncertainty is
+/- 0.2 dB.
We specify three series of measurements results in this paragraph, marked as columns (1),
(2) en (3) in the table below. A description of the data in these columns, and their uses for
measurement and calibration, is given below.
• Column (1) is the typical free-field response of the microphone. To enhance the accuracy of free-field measurements, users may subtract the typical free field response values in dB from the measured sound pressure levels
per frequency band.
• The typical free field response of column (1) is also used for periodic electric testing according to 61672-3. In that case, the typical free field response
(1) is added to the measurement values to obtain an equivalent acoustic
sound pressure level when the capsule is removed and an electrical test signal is applied at the microphone preamplifier input using a 16 pF coupler.
• The typical actuator response of column (2) is not usually applied directly,
but was measured to be able to calculate the actuator to free-field corractions of column (3)
• For periodic acoustic or actuator testing according to 61672-3, the actuatorto-free-field correction of column (3) is added to the measurement values
to obtain an equivalent acoustic sound pressure level when the capsule is
measured using an electrostatic actuator. The actuator-to-free-field is in
literature also often referred to as the free field correction.
Page 87

BAMT1MP201
Frequency
20 Hz 0.0 0.0 0.0
25 Hz 0.0 0.0 0.0
31.5 Hz 0.0 0.0 0.0
40 Hz 0.0 0.0 0.0
50 Hz 0.0 0.0 0.0
63 Hz 0.0 0.0 0.0
80 Hz 0.0 0.0 0.0
100 Hz 0.0 0.0 0.0
125 Hz 0.0 0.0 0.0
160 Hz 0.0 0.0 0.0
200 Hz 0.0 0.0 0.0
250 Hz 0.0 0.0 0.0
315 Hz 0.0 0.0 0.0
400 Hz 0.0 0.0 0.0
500 Hz 0.0 0.0 0.0
630 Hz 0.0 0.0 0.0
800 Hz 0.1 0.0 0.1
1 kHz 0.2 0.0 0.2
1.25 kHz 0.2 -0.1 0.3
1.6 kHz 0.3 -0.1 0.4
2 kHz 0.3 -0.2 0.5
2.5 kHz 0.3 -0.3 0.6
3.15 kHz 0.3 -0.5 0.8
4 kHz 0.3 -0.7 1.0
5 kHz 0.4 -1.1 1.5
6.3 kHz 0.4 -1.8 2.2
8 kHz 0.4 -2.9 3.3
10 kHz 0.4 -4.2 4.6
12.5 kHz 0.5 -6.0 6.5
16 kHz -0.2 -8.2 8.0
20 kHz -2.2 -11.2 9.0
(1) Typical free
field response
(2) Typical
actuator
response
(3) Actuator to
free field
correction
87
Page 88
A1.2. Typical pressure field to free field corrections for the BAMT1-MP201
The correction factors below are added to the measured values to arrive at the expected
free field sound pressure level measurement when using the B&K4226 multi-frequency
calibrator.
Frequency BAMT1-MP201
31.5 Hz 0.3
63 Hz -0.1
125 Hz -0.1
250 Hz -0.1
500 Hz -0.1
1 kHz -0.06
2 kHz 0.1
4 kHz 1.0
8 kHz 2.5
16 kHz 5.0
A1.3. Reflections from the instrument body when using the BAMT1-MP201
If the microphone is fitted directly on top of the SMxx, without any length of XLR cable
inbetween, then reflections from the instrument body will affect measurements. The table
below gives the effect of those reflections per octave band. To avoid these reflections, use a
cable with a minimum length of 1 meter.
Frequency BAMT1-MP201
31.5 Hz -0.02
63 Hz 0.00
125 Hz 0.00
250 Hz 0.02
500 Hz 0.03
1 kHz -0.01
2 kHz 0.02
4 kHz 0.01
8 kHz 0.04
16 kHz -0.01
Page 89

A1.4. Effect of the 32mm windscreen with the BAMT1-MP201
A 32mm-1/2” windscreen is supplied standard with each SMxx fitted with a BAMT1 microphone. The effect of this windscreen per octave band is given in the table below.
Frequency Windscreen effect
31.5 Hz 0.0
40 Hz 0.0
50 Hz 0.0
63 Hz 0.0
80 Hz 0.0
100 Hz 0.0
125 Hz 0.0
160 Hz 0.0
200 Hz 0.0
250 Hz 0.0
315 Hz 0.0
400 Hz 0.0
500 Hz 0.0
630 Hz 0.0
800 Hz 0.1
1 kHz 0.1
1.25 kHz 0.1
1.6 kHz 0.1
2 kHz 0.2
2.5 kHz 0.2
3.15 kHz 0.3
4 kHz 0.5
5 kHz 0.6
6.3 kHz 0.8
8 kHz 0.7
10 kHz 0.3
12.5 kHz -0.2
16 kHz -0.5
20 kHz -0.4
89
Page 90

A2. BAMT1-MP309 microphone
The BAMT1-MP309 is an alternative class 2 microphone-preamp combination offered for
use with the Bedrock SMxx. The MP309 is a high-end Class II / Type II free field microphone capsule.
A2.1. Typical free field response and actuator to free field corrections for the
BAMT1-MP309.
The typical free field response of the MP201 capsule is specified in this section. The MP201
(including grid) was measured by the manufacturer at 0 degrees incidence, based on average values of microphone capsules against a B&K 4180 response using a B&K 4228 Pistonphone. Microphones were mounted on M201 preamp. The typical actuator reponse was
determined using a GRAS RA0015 and a GRAS 14AA. The measurement uncertainty is
+/- 0.2 dB.
We specify three series of measurements results in this paragraph, marked as columns (1),
(2) en (3) in the table below. A description of the data in these columns, and their uses for
measurement and calibration, is given below.
• Column (1) is the typical free-field response of the microphone. To enhance the accuracy of free-field measurements, users may subtract the typical free field response values in dB from the measured sound pressure levels
per frequency band.
• The typical free field response of column (1) is also used for periodic electric testing according to 61672-3. In that case, the typical free field response
(1) is added to the measurement values to obtain an equivalent acoustic
sound pressure level when the capsule is removed and an electrical test signal is applied at the microphone preamplifier input using a 16 pF coupler.
• The typical actuator response of column (2) is not usually applied directly,
but was measured to be able to calculate the actuator to free-field corractions of column (3)
• For periodic acoustic or actuator testing according to 61672-3, the actuatorto-free-field correction of column (3) is added to the measurement values
to obtain an equivalent acoustic sound pressure level when the capsule is
measured using an electrostatic actuator. The actuator-to-free-field is in
literature also often referred to as the free field correction.
Page 91

BAMT1MP309
Frequency
20 Hz 0.0 0.0 0.0
25 Hz 0.0 0.0 0.0
31.5 Hz 0.0 0.0 0.0
40 Hz 0.0 0.0 0.0
50 Hz 0.0 0.0 0.0
63 Hz 0.0 0.0 0.0
80 Hz 0.0 0.0 0.0
100 Hz 0.0 0.0 0.0
125 Hz 0.0 0.0 0.0
160 Hz 0.0 0.0 0.0
200 Hz 0.0 0.0 0.0
250 Hz 0.0 0.0 0.0
315 Hz 0.0 0.0 0.0
400 Hz 0.0 0.0 0.0
500 Hz 0.0 0.0 0.0
630 Hz 0.0 0.0 0.0
800 Hz 0.1 0.0 0.1
1 kHz 0.1 -0.1 0.2
1.25 kHz 0.2 -0.1 0.3
1.6 kHz 0.2 -0.2 0.4
2 kHz 0.2 -0.3 0.5
2.5 kHz 0.2 -0.4 0.6
3.15 kHz 0.2 -0.6 0.8
4 kHz 0.1 -0.9 1.0
5 kHz 0.1 -1.4 1.5
6.3 kHz 0.2 -2.0 2.2
8 kHz 0.4 -2.9 3.3
10 kHz 0.6 -4.0 4.6
12.5 kHz 1.2 -5.3 6.5
16 kHz 1.1 -6.9 8.0
20 kHz -0.4 -9.4 9.0
(1) Typical free
field response
(2) Typical
actuator
response
(3) Actuator to
free field
correction
91
Page 92
A2.2. Typical pressure field to free field corrections for the BAMT1-MP309
The correction factors below are added to the measured values to arrive at the expected
free field sound pressure level measurement when using the B&K4226 multi-frequency
calibrator.
Frequency BAMT1-MP309
31.5 Hz 0.3
63 Hz -0.1
125 Hz -0.1
250 Hz -0.1
500 Hz -0.1
1 kHz -0.06
2 kHz -0
4 kHz 0.5
8 kHz 1.8
16 kHz 4.8
A2.3. Reflections from the instrument body when using the BAMT1-MP309
If the microphone is fitted directly on top of the SMxx, without any length of XLR cable
inbetween, then reflections from the instrument body will affect measurements. The table
below gives the effect of those reflections per octave band. To avoid these reflections, use a
cable with a minimum length of 1 meter.
Frequency BAMT1-MP309
31.5 Hz -0.02
63 Hz 0.00
125 Hz 0.00
250 Hz 0.02
500 Hz 0.03
1 kHz -0.01
2 kHz 0.02
4 kHz 0.01
8 kHz 0.04
16 kHz -0.01
Page 93

A2.4. Effect of the 32mm windscreen with the BAMT1-MP309
A 32mm-1/2” windscreen is supplied standard with each SMxx fitted with a BAMT1 microphone. The effect of this windscreen per octave band is given in the table below.
Frequency Windscreen effect
31.5 Hz 0.0
40 Hz 0.0
50 Hz 0.0
63 Hz 0.0
80 Hz 0.0
100 Hz 0.0
125 Hz 0.0
160 Hz 0.0
200 Hz 0.0
250 Hz 0.0
315 Hz 0.0
400 Hz 0.0
500 Hz 0.0
630 Hz 0.0
800 Hz 0.1
1 kHz 0.1
1.25 kHz 0.1
1.6 kHz 0.1
2 kHz 0.2
2.5 kHz 0.2
3.15 kHz 0.3
4 kHz 0.5
5 kHz 0.6
6.3 kHz 0.8
8 kHz 0.7
10 kHz 0.3
12.5 kHz -0.2
16 kHz -0.5
20 kHz -0.4
93
Page 94

A3. BAMT2 microphone
The BAMT2 is the standard microphone-preamp combination bundled with the Bedrock
SM30 and SM50 The BAMT2 is a highly stable 1/4” Class II / Type II electret microphone.
A3.1. Typical pressure field to free field corrections for the BAMT2
The correction factors below are added to the measured values to arrive at the expected
free field sound pressure level measurement when using the B&K4226 multi-frequency
calibrator.
Frequency BAMT2
31.5 Hz -0.3
63 Hz -0.3
125 Hz -0.3
250 Hz -0.4
500 Hz -0.2
1 kHz 0.0
2 kHz -0.5
4 kHz -1.2
8 kHz -6.5
16 kHz -5.5
A3.2. Typical free field response for the BAMT2
The typical free field response of the BAMT2 microphone is specified in this section. Note
that it is not feasible to perform actuator measurements with the BAMT2, as the microphone capsule is not detacheable. For instructions on how to perform periodic calibrations
according to IEC-61672-3, which calls for a modified procedure for non-detacheable microphones, please refer to our manufacturer’s instructions in Annex B.
The table below specifies the typical free-field response of the BAMT2 microphone. The
typical free field response of the BAMT2 was measured by the manufacturer at 0 degrees
incidence, based on average values of microphone capsules against a B&K 4180 response
using a B&K 4228 Pistonphone.
Page 95
BAMT2
Frequency
25 Hz -0.45
31.5 Hz -0.05
40 Hz 0.2
50 Hz 0.4
63 Hz 0.5
80 Hz 0.6
100 Hz 0.65
125 Hz 0.65
160 Hz 0.65
200 Hz 0.65
250 Hz 0.6
315 Hz 0.5
400 Hz 0.4
500 Hz 0.3
630 Hz 0.2
800 Hz 0.15
1 kHz 0
1.25 kHz -0.2
1.6 kHz -0.4
2 kHz -0.6
2.5 kHz -0.65
3.15 kHz -0.6
4 kHz -0.5
5 kHz -0.45
6.3 kHz -0.15
8 kHz 0.05
10 kHz 0.25
12.5 kHz 0.05
16 kHz -0.7
20 kHz -2.15
(1) Typical free
field response
95
Page 96

A3.3. Effect of the 32mm windscreen with the BAMT2
A 32mm-1/4” windscreen is supplied standard with each SMxx fitted with a BAMT2 microphone. The effect of this windscreen per octave band is given in the table below.
Frequency Windscreen effect
31.5 Hz 0.0
40 Hz 0.0
50 Hz 0.0
63 Hz 0.0
80 Hz 0.0
100 Hz 0.0
125 Hz 0.0
160 Hz 0.0
200 Hz 0.0
250 Hz 0.0
315 Hz 0.0
400 Hz 0.0
500 Hz 0.0
630 Hz 0.0
800 Hz 0.0
1 kHz 0.0
1.25 kHz 0.1
1.6 kHz 0.1
2 kHz 0.1
2.5 kHz 0.2
3.15 kHz 0.3
4 kHz 0.5
5 kHz 0.7
6.3 kHz 0.8
8 kHz 0.7
10 kHz 0.4
12.5 kHz 0.3
16 kHz 0.2
20 kHz -0.2
Page 97

97
Page 98

Annex B. Manufacturer’s instructions for
periodic testing according to IEC-61672-3.
B.1. Insertion of electrical signals for models with BAMT1 microphones
Periodic testing of the Bedrock SMxx in its capacity as a Sound Level Meter is to take place
in accordance with the procedures as described in IEC-61672-3:2014. This standard requires the manufacturer to specify a means of inserting electrical signals.
For models featuring a BAMT1 microphone (BAMT1-MP201 or BAMT1-MP309), the
procedure to enable insertion of electrical signals is to fit an adapter on the BAMT1 preamplifier (replacing the microphone capsule) with a capacitance that matches the MP201
and MP309 capsule (16 pF + 2 pF). These are available from multiple vendors (contact
Bedrock Audio for more information).
B.2. Insertion of electrical signals for models with BAMT2 microphones
For models featuring a BAMT2 microphone, a different procedure must be adopted, since
the BAMT2 does not feature a detachable capsule. The BAMT2 is an electret microphone
and preamplifier assembly; as a whole, this assembly is colloquially called “the microphone.” The BAMT2 is removable from the device, allowing insertion of electrical signals
into the system via the XLR connector. This enables test labs to carry out tests for which
insertion of electrical signals is needed, in accordance with IEC-61672-3:2014.
For electrical insertion of signals into the XLR input, a test interface for the XLR input is
available through Embedded Acoustics (article number 20179842). This interface matches
the BAMT2 in signal level and impedance, and allows input of electrical test signals via a
BNC connector.
B.3. Microphone response measurements
Microphone response measurements can be done using either of two methods:
• Using the the B&K 4226 Multi-frequency calibrator (set to pressure field calibration
mode), taking free-field to pressure field corrections given in Annex A into account.
Add these factors to the response measured with the mulittone calibrator to obtain the
free-field response.
• Using an eletrostatic actuator (GRAS RA0015, GRAS 14AA or equivalent) taking actuator to free-field corrections given in Annex A into account. Add these factors to the
response measured with the actuator to obtain the free-field response.
Page 99

B.4. Reference range and range adjustment
The reference range is the +20 dB range. Once a range is selected through the “settings”
module, no range adjustments take place during measurements and the SMxx acts as a single range instrument. Adjustment of the display range within the modules themselves does
not have an impact on the measurement range, just on which range of values are displayed
in graphs on the display.
B.5. Reference range for linearity measurements
The linearity of the SMxx is to be evaluated in the range 30 - 120 dB.
B.6. Wind spheres
The wind spheres are not part of the standard configuration and need not be considered for
periodic testing. Wind sphere corrections are provided in Annex A for information purposes
only.
99
Page 100

Annex C. Manufacturer’s instructions for
periodic validation of STI test functions
The STI test functions of the SMxx (STIPA and full STI) are based on algorithmic calculations of spectral and temporal signal patterns measured by the device’s electro-acoustic
front-end. The manufacturer has taken great care to ensure that the STI implementations
are fully compliant with IEC-60268-16, and certifies compliance.
The nature of the STI algorithms is such that no degradation of the precision and accuracy
of the measurent over time is to be expected, except when caused by one of the following
factors:
• The frequency transfer function of the acoustic front-end (flatness) is modified and no
longer compliant with class 2 requirements according to IEC-61672.
• The sensitivity of the acoustic front-end has changed so that the measured octave band
leves are not longer sufficiently accurate. The A-weighted level must remain within 0.5
dB of its nominal value (level calibration).
Generally speaking, as long as the SMxx complies with requirements of IEC-61672, there
is no concern regarding its compliance with 61628-16 (given the fact that the device type
and algorithms have previously been shown to comply). For additional assurance a short
series of tests can be done, as part of periodic check-ups of the device, to further ensure the
continued validity and accuracy of the SMxx as a speech intelligibility meter. These tests
are presented below.
Note that these tests are not suitable for verification of new implementations of the STI,
in which case specific test vectors are needed to check proper implementation of the algorithms underlying the STI. The tests described here, in the form of checklists, are intended
to periodically check STI meters for which the manufacturer has previously demonstrated
compliance to IEC-60268-16.
In order to carry out the verification tests a Bedrock BTB65 TalkBox is needed, as well as
a passive attenuator (or set of attenuators) that can be adjusted to 20, 40 and 60 dB of attenuation.
 Loading...