

Page 1

xKit Operation Manual
XKIT USER MANUAL
THD MODULE INTRODUCTION
SERVOTEST
NOV/2025
Page 2

xKit Operation Manual
Contents
1 Module Introduction ....................................................................................................... 3
1.1 Function Introduction .............................................................................................. 3
1.2 Main Interface ......................................................................................................... 3
2 Main Interface Introduction ............................................................................................ 4
2.1 Main Menu .............................................................................................................. 4
2.1.1 File .................................................................................................................... 4
2.1.2 Setting ............................................................................................................... 5
2.1.3 File Function Button ......................................................................................... 6
2.1.4 Save To Plot ..................................................................................................... 6
2.1.5 Plot .................................................................................................................... 6
2.1.6 Show Time History Snapshot ......................................................................... 10
2.2 Channel List .......................................................................................................... 11
2.3 Parameter Settings & Results ................................................................................ 12
2.4 Distortion ............................................................................................................... 13
2.5 Cross Coupling ...................................................................................................... 14
2.6 Uniformity ............................................................................................................. 15
2.7 Plot Result ............................................................................................................. 16
Page 3
xKit Operation Manual
1 Module Introduction
1.1 Function Introduction
THD is a module used to analyze the experimental data, which can automatically
extract the experimental data, and obtain the results of distortion, coupling residue and
uniformity after analysis. In addition, the experimental data can be quickly organized
into tables, and the analysis results can be read and stored, reducing the workload of
converting experimental data into reports and improving standardization.
1.2 Main Interface
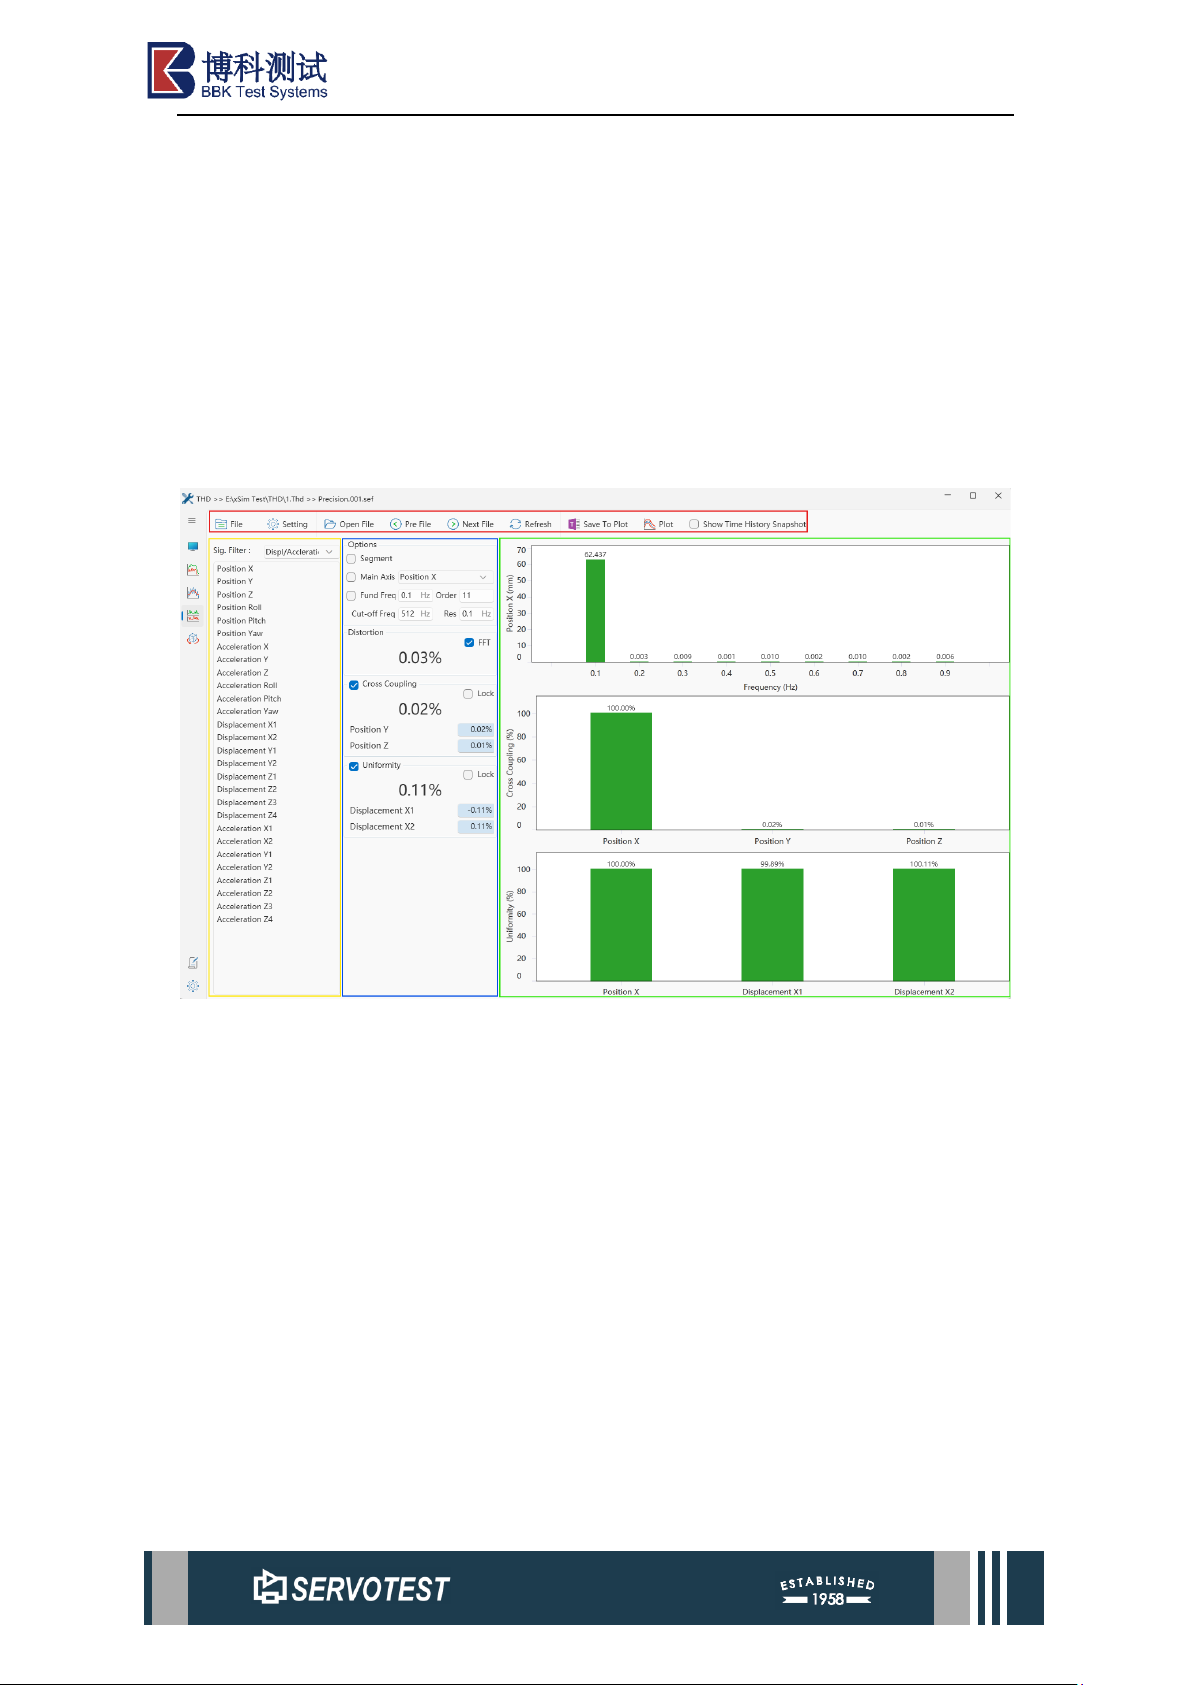
Figure 1-1 Main Interface
The red area is the menu bar, which contains all the function menu items of the
current THD. The yellow area shows the channel list, and the blue area is the indicator
calculation result and parameter settings. The green area is the graph area, showing the
detailed results of the calculation.
Page 4
xKit Operation Manual
2 Main Interface Introduction
The main interface of the THD module is divided into four parts, as shown in
Figure 1-1.
2.1 Main Menu
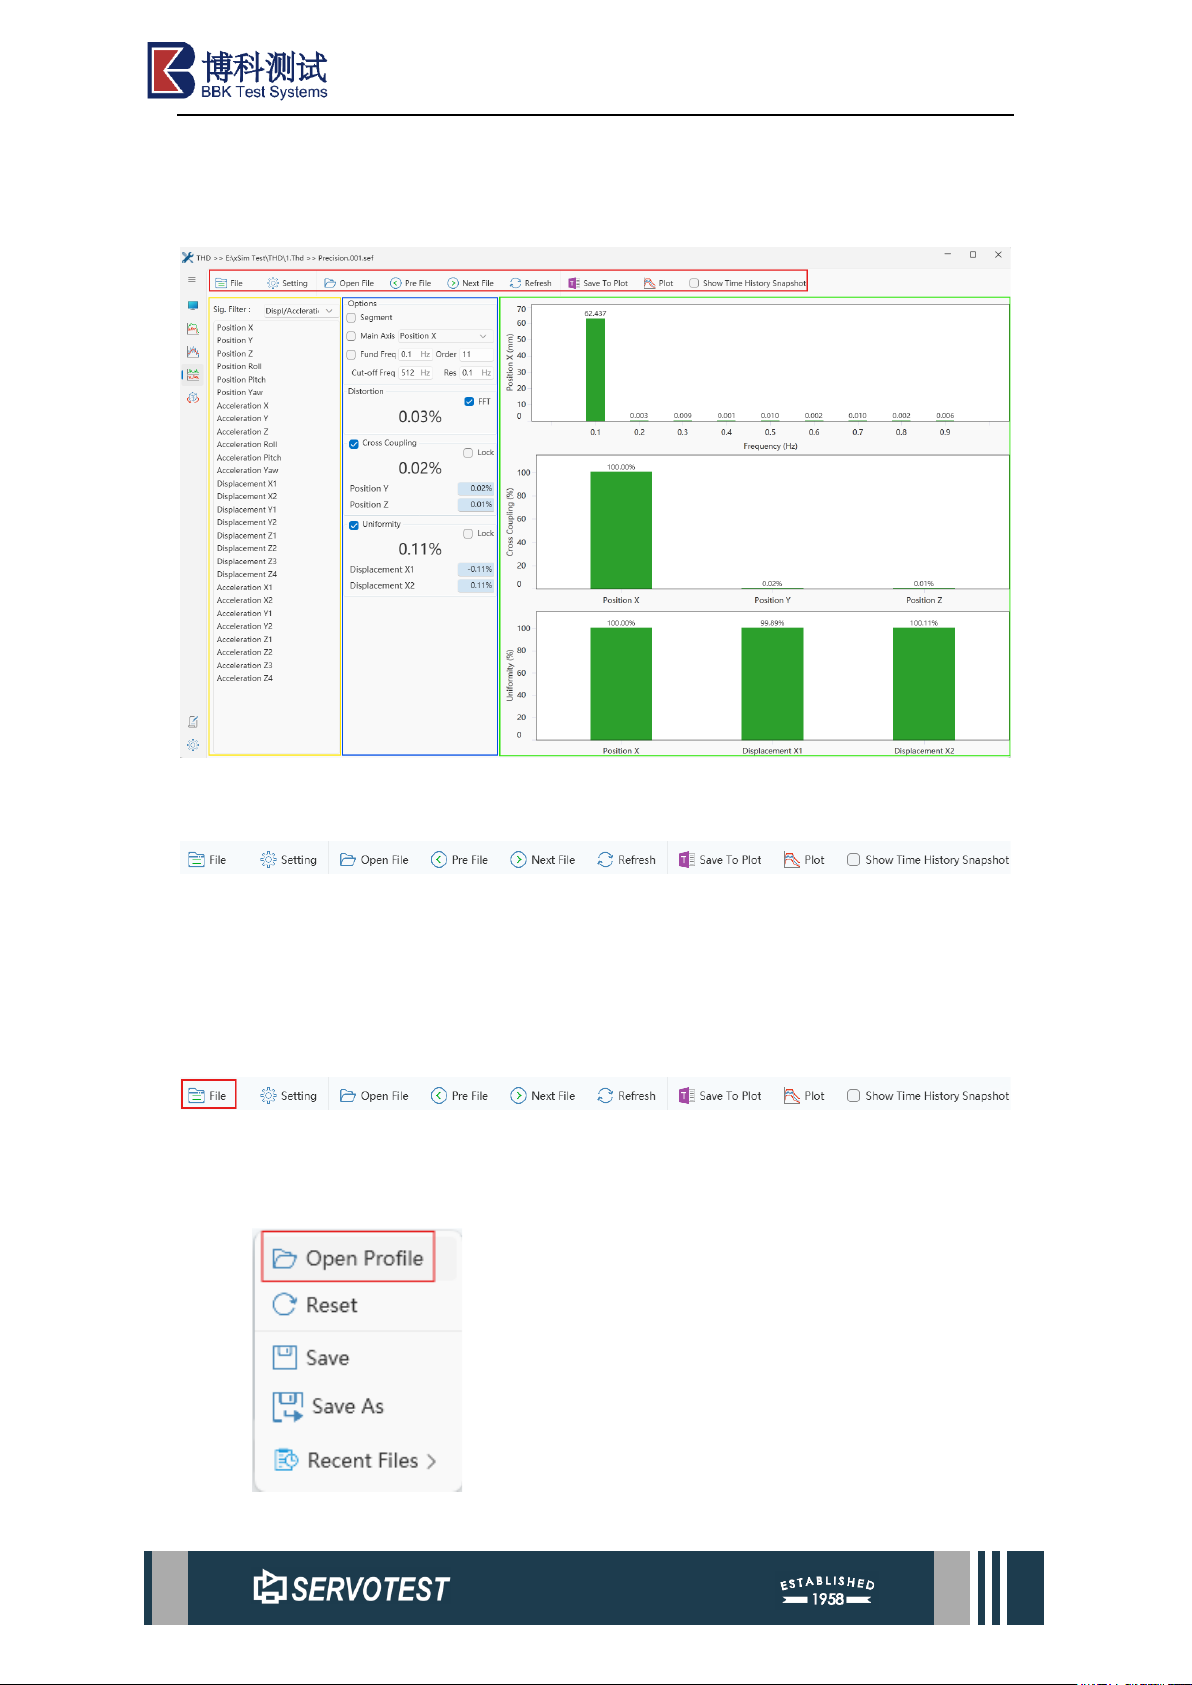
Figure 2-1 Main Menu
The main menu comprises six sections: File, Settings, Sef File Switch, Data Save,
Plot, and Time History Snapshot.
2.1.1 File
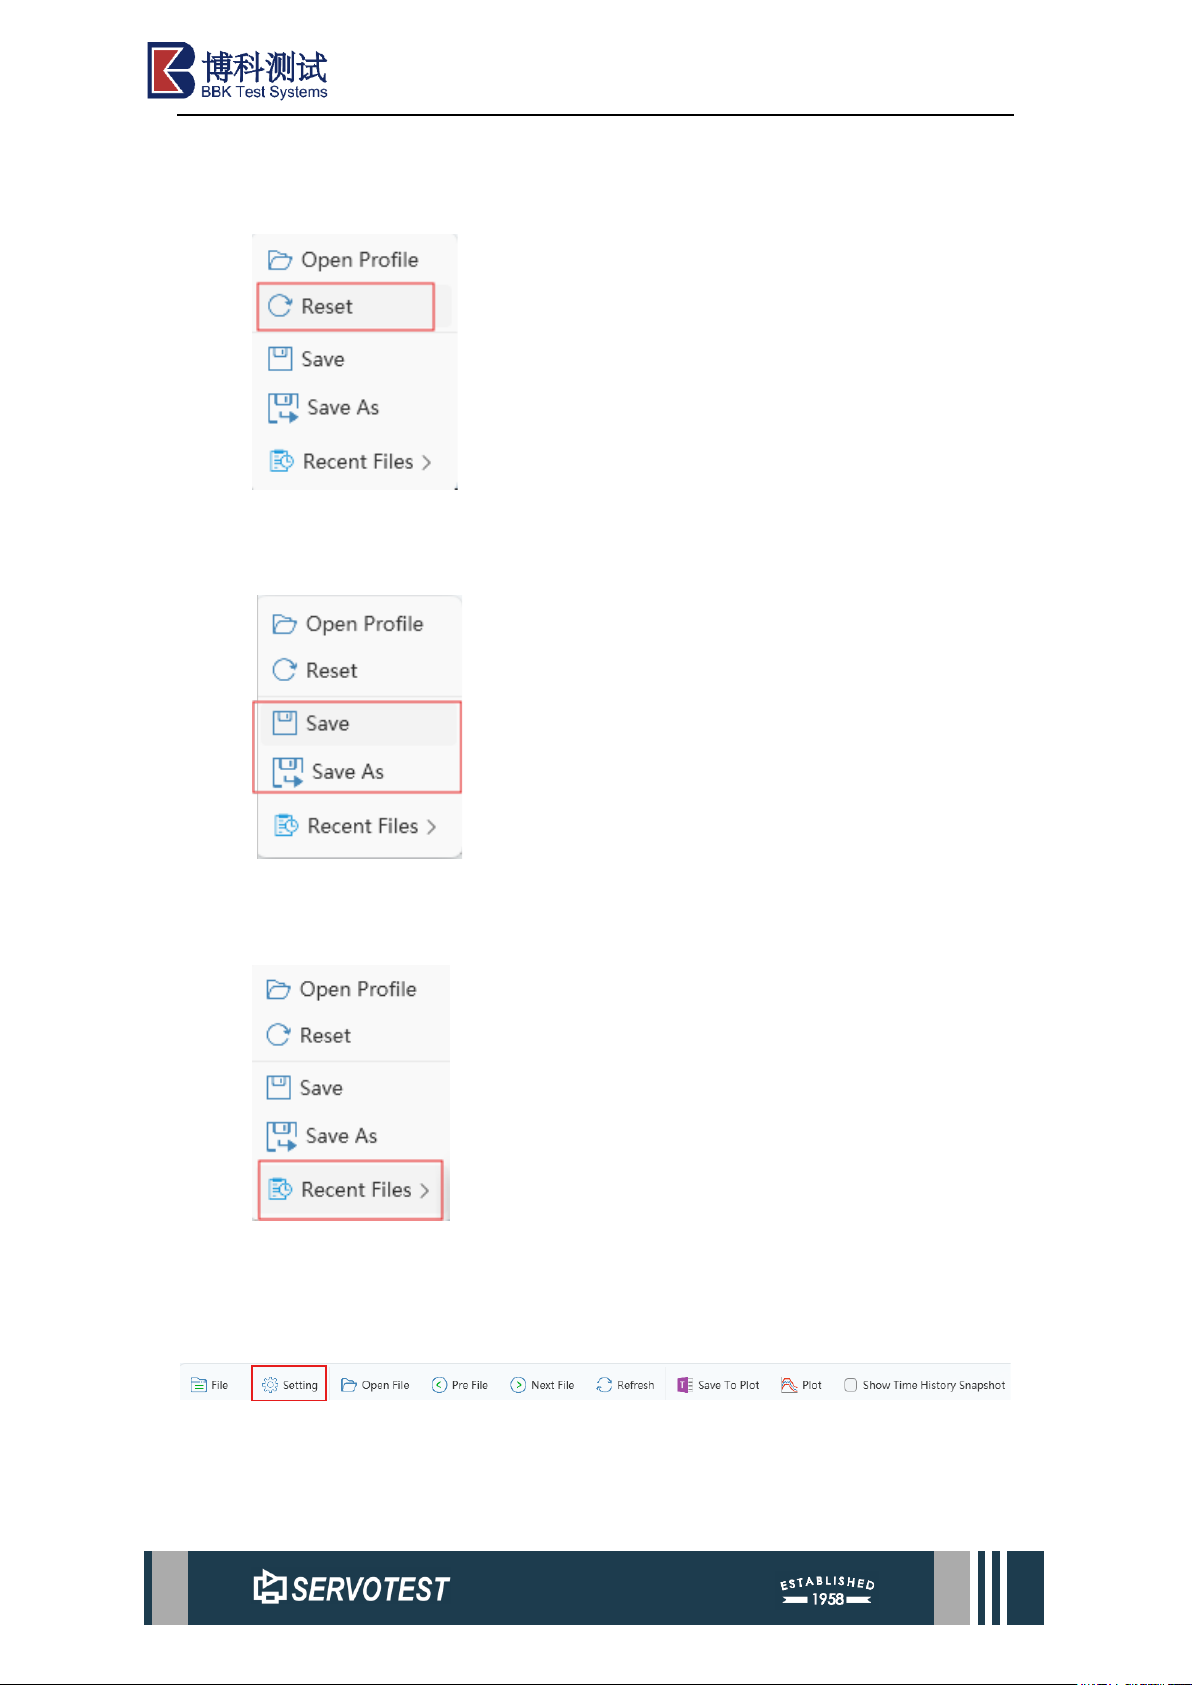
File settings include select, open, reset, and save file functions.
2.1.1.1 Open File
Page 5
xKit Operation Manual
Open a saved file.
2.1.1.2 Reset
Reset all configurations as default.
2.1.1.3 Save
Save the file or save it as a file, with "*" means the current file is not saved.
2.1.1.4 Select Recent File
Files can display the most recently used files, The number of displayed files and
the number of saved files can be adjusted in the options, up to a maximum of 10 files.
2.1.2 Setting
The general Settings include four parts: system Settings, software language
switching, software help menu, and software information menu. Except for the
Page 6
xKit Operation Manual
language switching and drawing data deletion functions, all other functions are not
available.
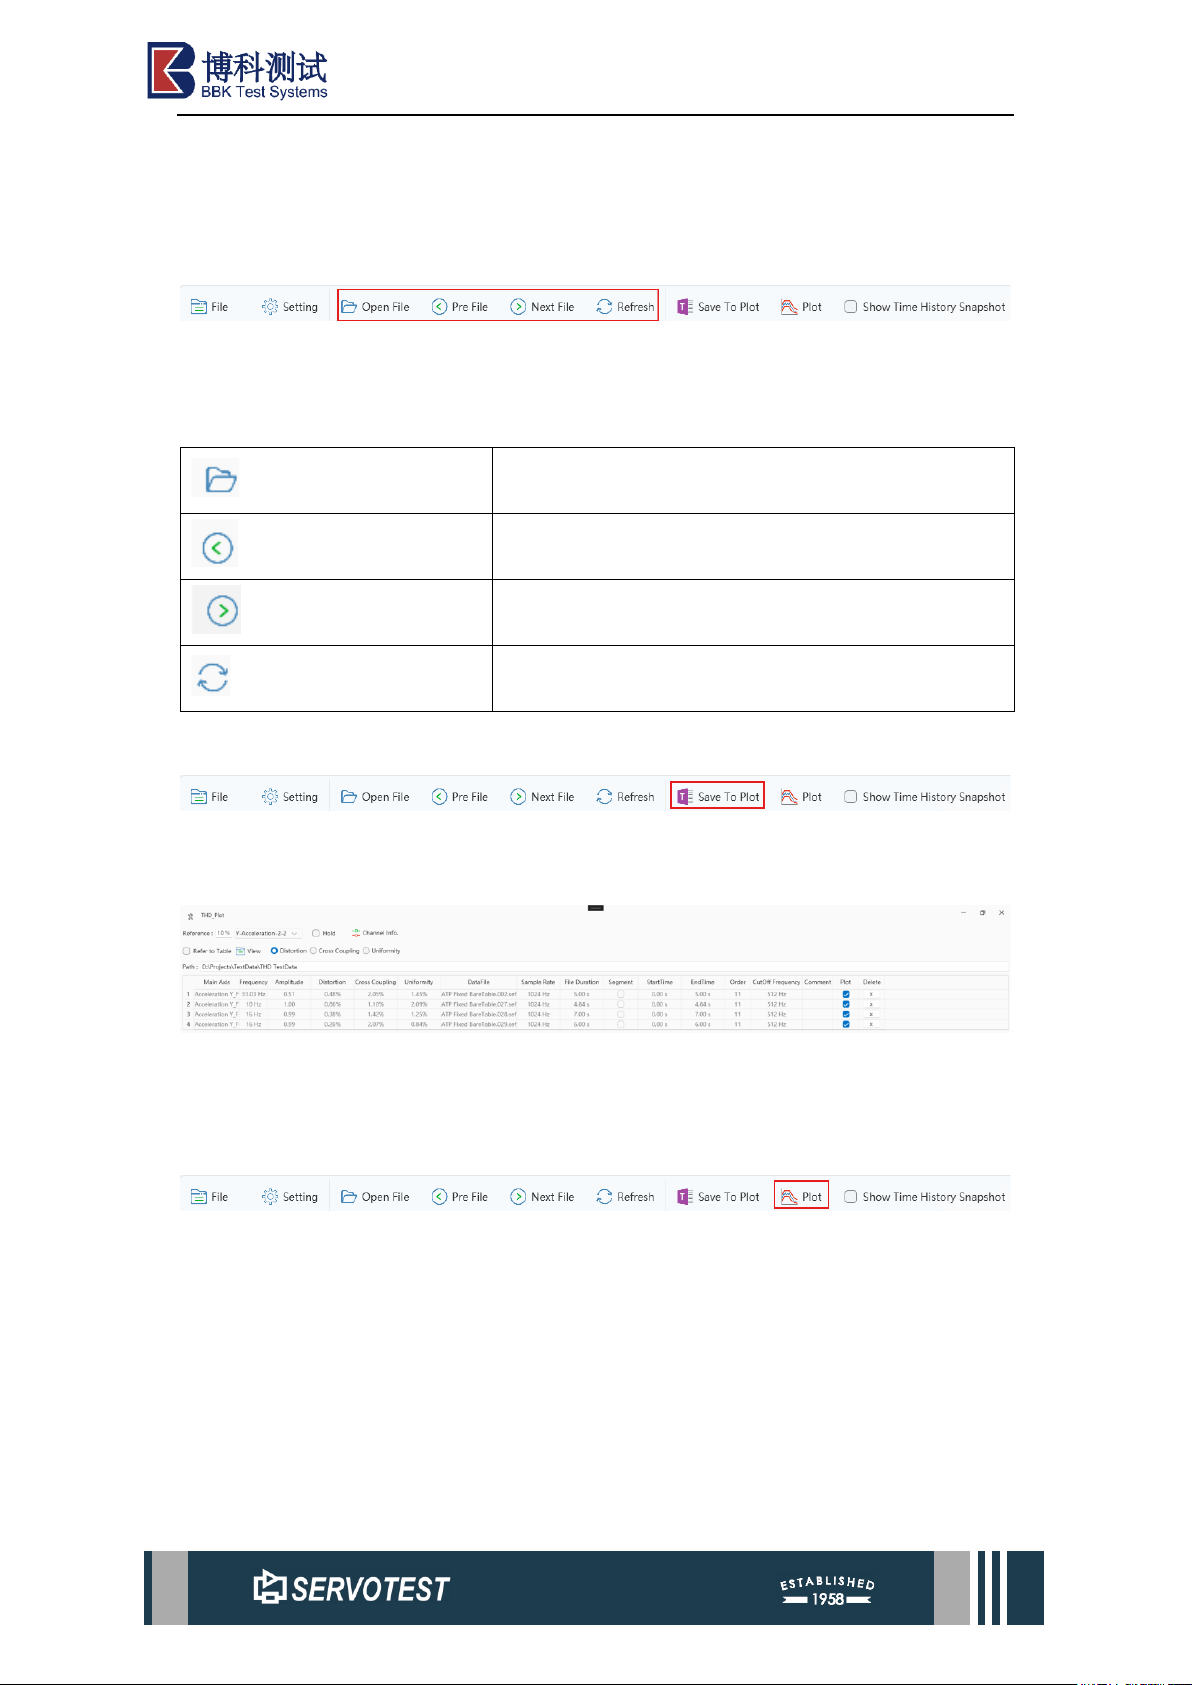
2.1.3 File Function Button
Note: The theoretical duration of the files processed by THD cannot exceed 29s,
otherwise a warning window will pop up.
Table 2-1 2.1.3 File Function Button
Open File
Open the sef file.
Pre File
Open the previous file, in numerical order.
Next File
Open the next file, in numerical order.
Refresh
Reopen file.
2.1.4 Save To Plot
Saving to the chart preserves the calculated results. Once saved, the stored data
can be viewed in the graphing interface, as shown below.
As shown in the figure above, ‘Path’ denotes the path to the data file within the
data list.
2.1.5 Plot
After selecting the signal, click “Plot” to open the plotting window and plot the
selected signal.
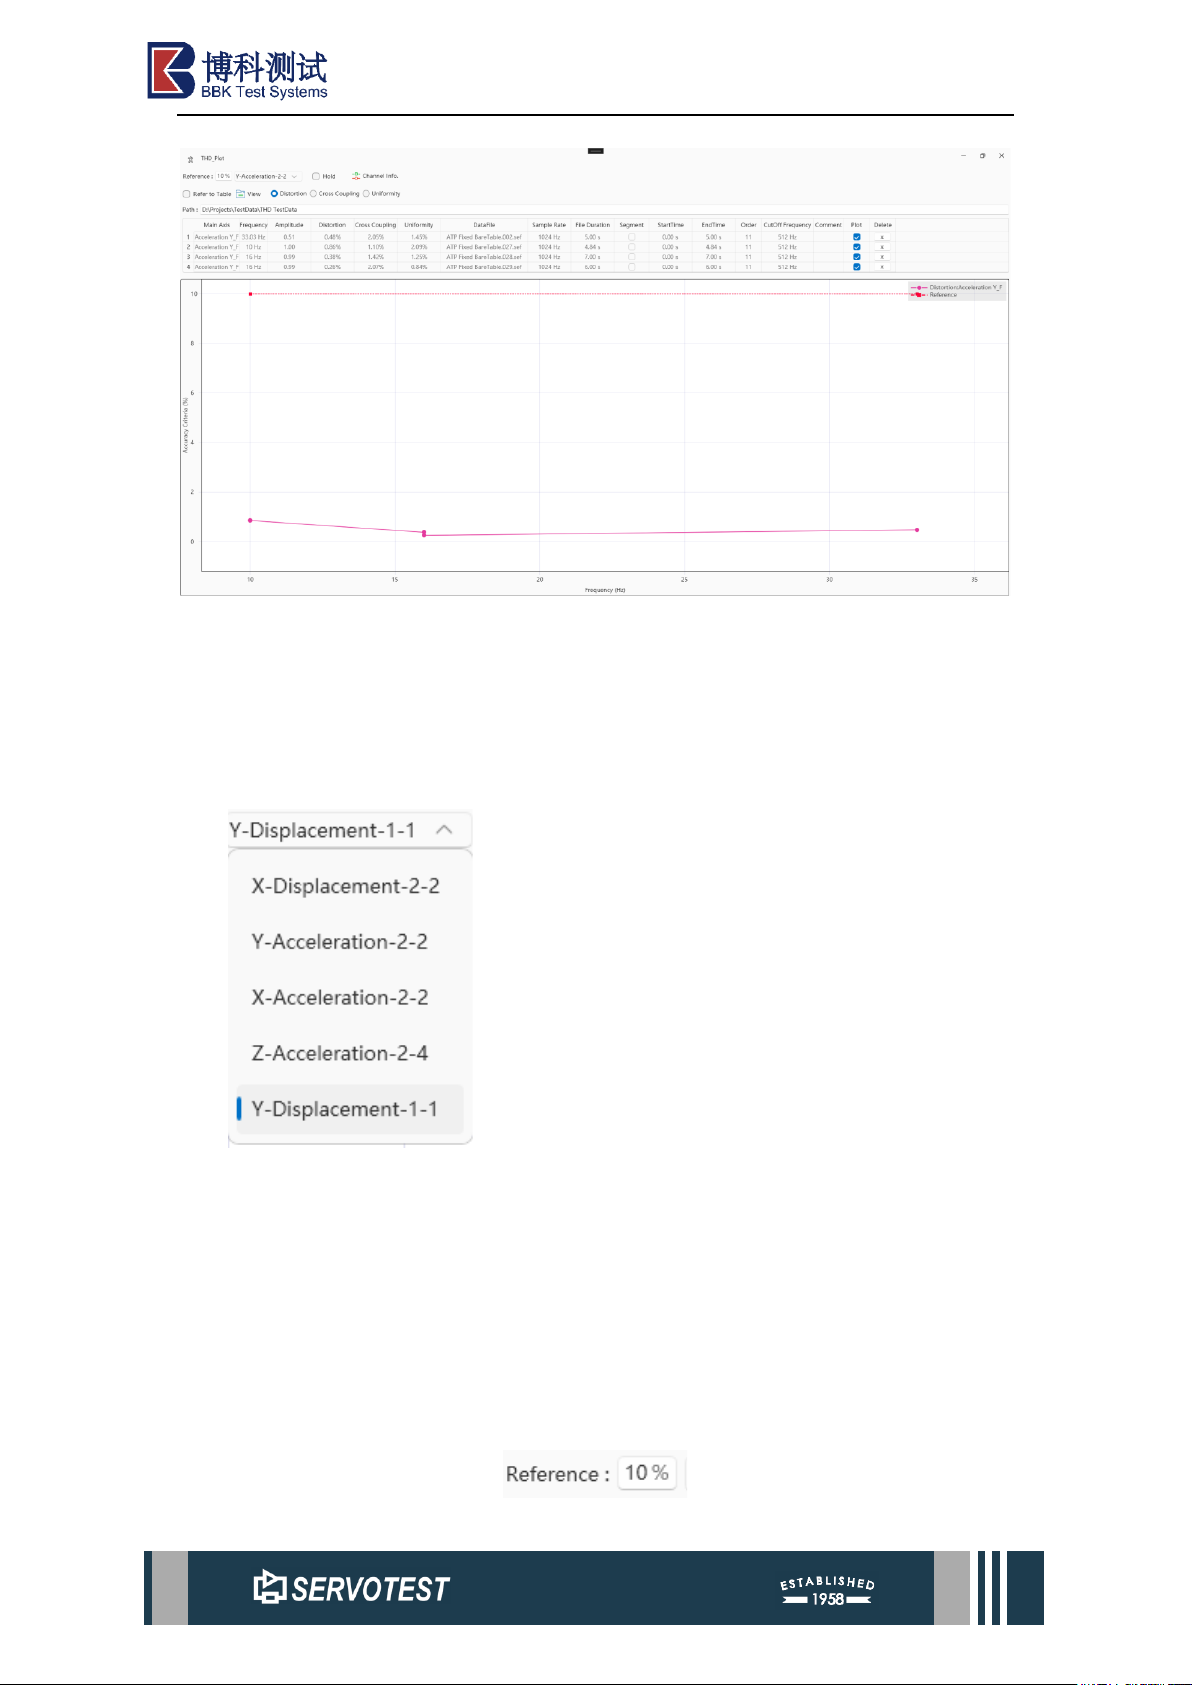
The red line in the figure below represents the reference line, set to 10% by default.
Page 7
xKit Operation Manual
Figure 2-2 Plot
As shown in the above Figure (Figure 2 2 Plot), the plotting interface mainly
includes six parts: data classification, reference line setting, retention of the current plot,
deletion of plotting data, display of data list, and plotting Settings.
2.1.5.1 Type of Data
The subgroups in the datalog file are shown here, usually automatically grouped
by acceleration and displacement.
2.1.5.2 Custom Reference
There are two methods for setting reference lines:
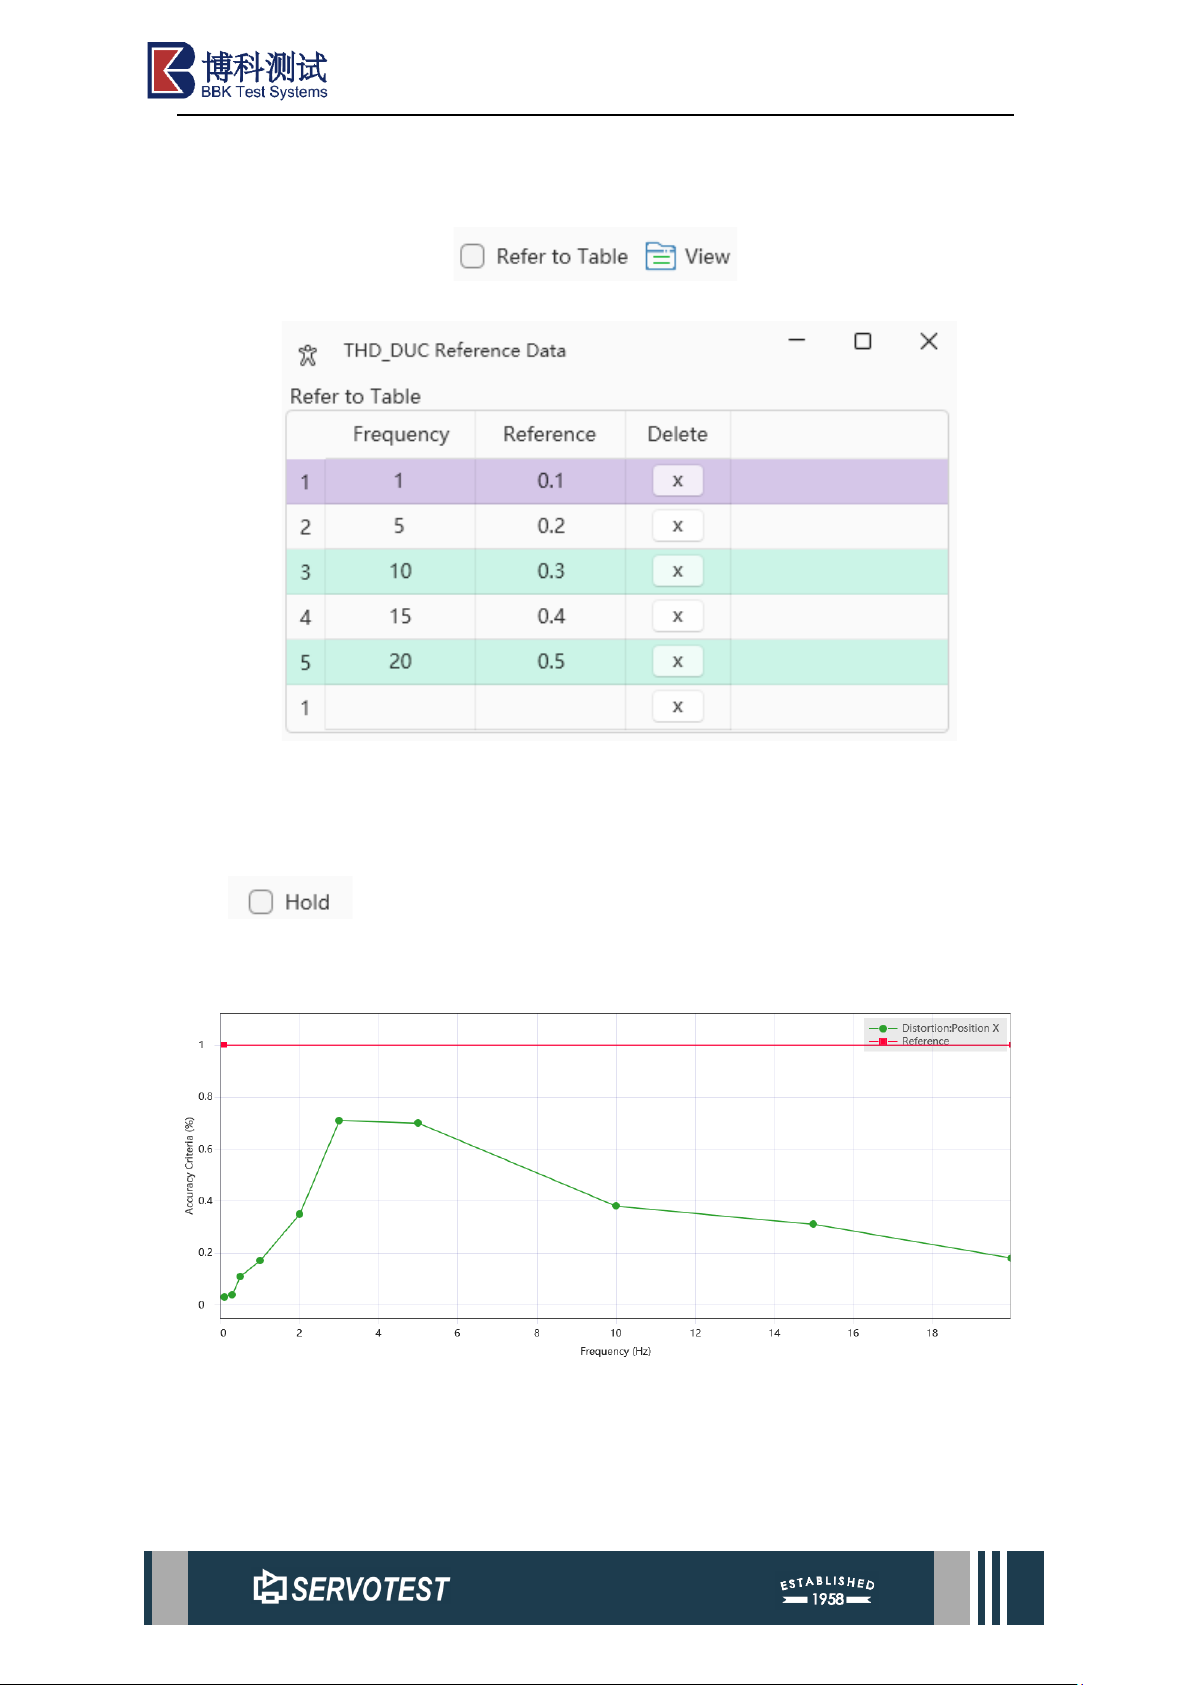
(1) Deselect the ‘Custom Reference (Refer to Table)’ checkbox and select the
“Reference” option to input values in the corresponding edit box for reference line
configuration.
Figure 2-3 Method One
Page 8
xKit Operation Manual
(2) Select the ‘Custom Reference (Refer to Table)’ checkbox. Upon doing so, click
‘View’ to open the custom reference line data window for data configuration.
Figure 2-4 Method Two
Figure 2-5 View
Note: ‘0.1’ indicates a data point at 1Hz, with the reference line set to ‘10%’.
2.1.5.3 Hold
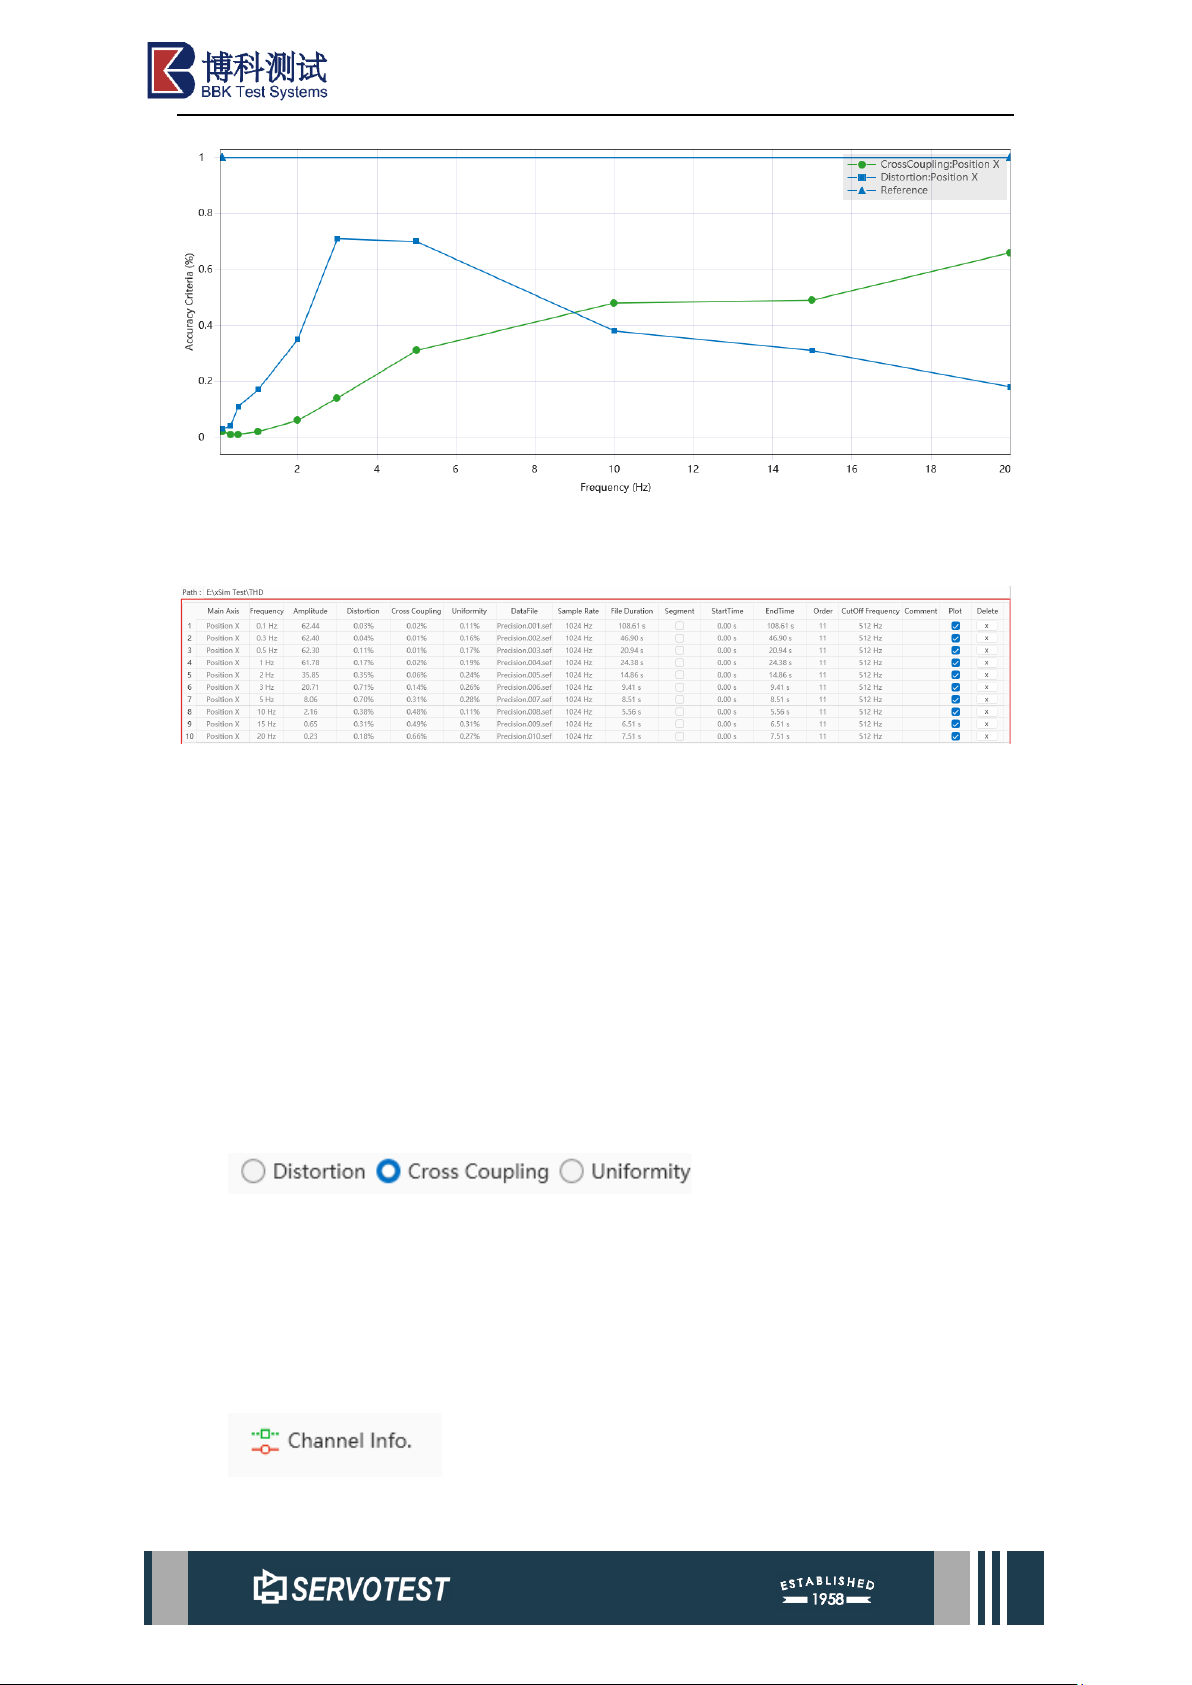
Check "Keep the current drawing (Hold)", when the signal data is drawn again,
the currently drawn data will not be cleared.
Figure 2-6 Tick Hold before
Page 9
xKit Operation Manual
Figure 2-7 Tick Hold after
2.1.5.4 Data List
Figure 2-8 Save Result
The data in the data list comes from the content of the saved file. The saved file
can be opened and viewed with an xml editor. In addition, comments can be added to
the data. The Plot option can choose to draw the included data points when drawing the
graph.
Note: If data is deleted from the data list without saving, this merely removes the
data from the drawing interface; the actual .Thd file will still retain this data. To
permanently delete the data, after clicking “Delete”, you must subsequently click “Save”
on the THD main interface.
2.1.5.5 Plot Settings
Click on ‘Distortion, Coupling Residual, Uniformity’ to switch the displayed data
metric plots. Please note that after switching data categories, you must switch the
current plotting option once for the corresponding curves in the plotting area to refresh.
Otherwise, the plotting area will not update.
2.1.5.6 Delete the drawing data
Page 10
xKit Operation Manual
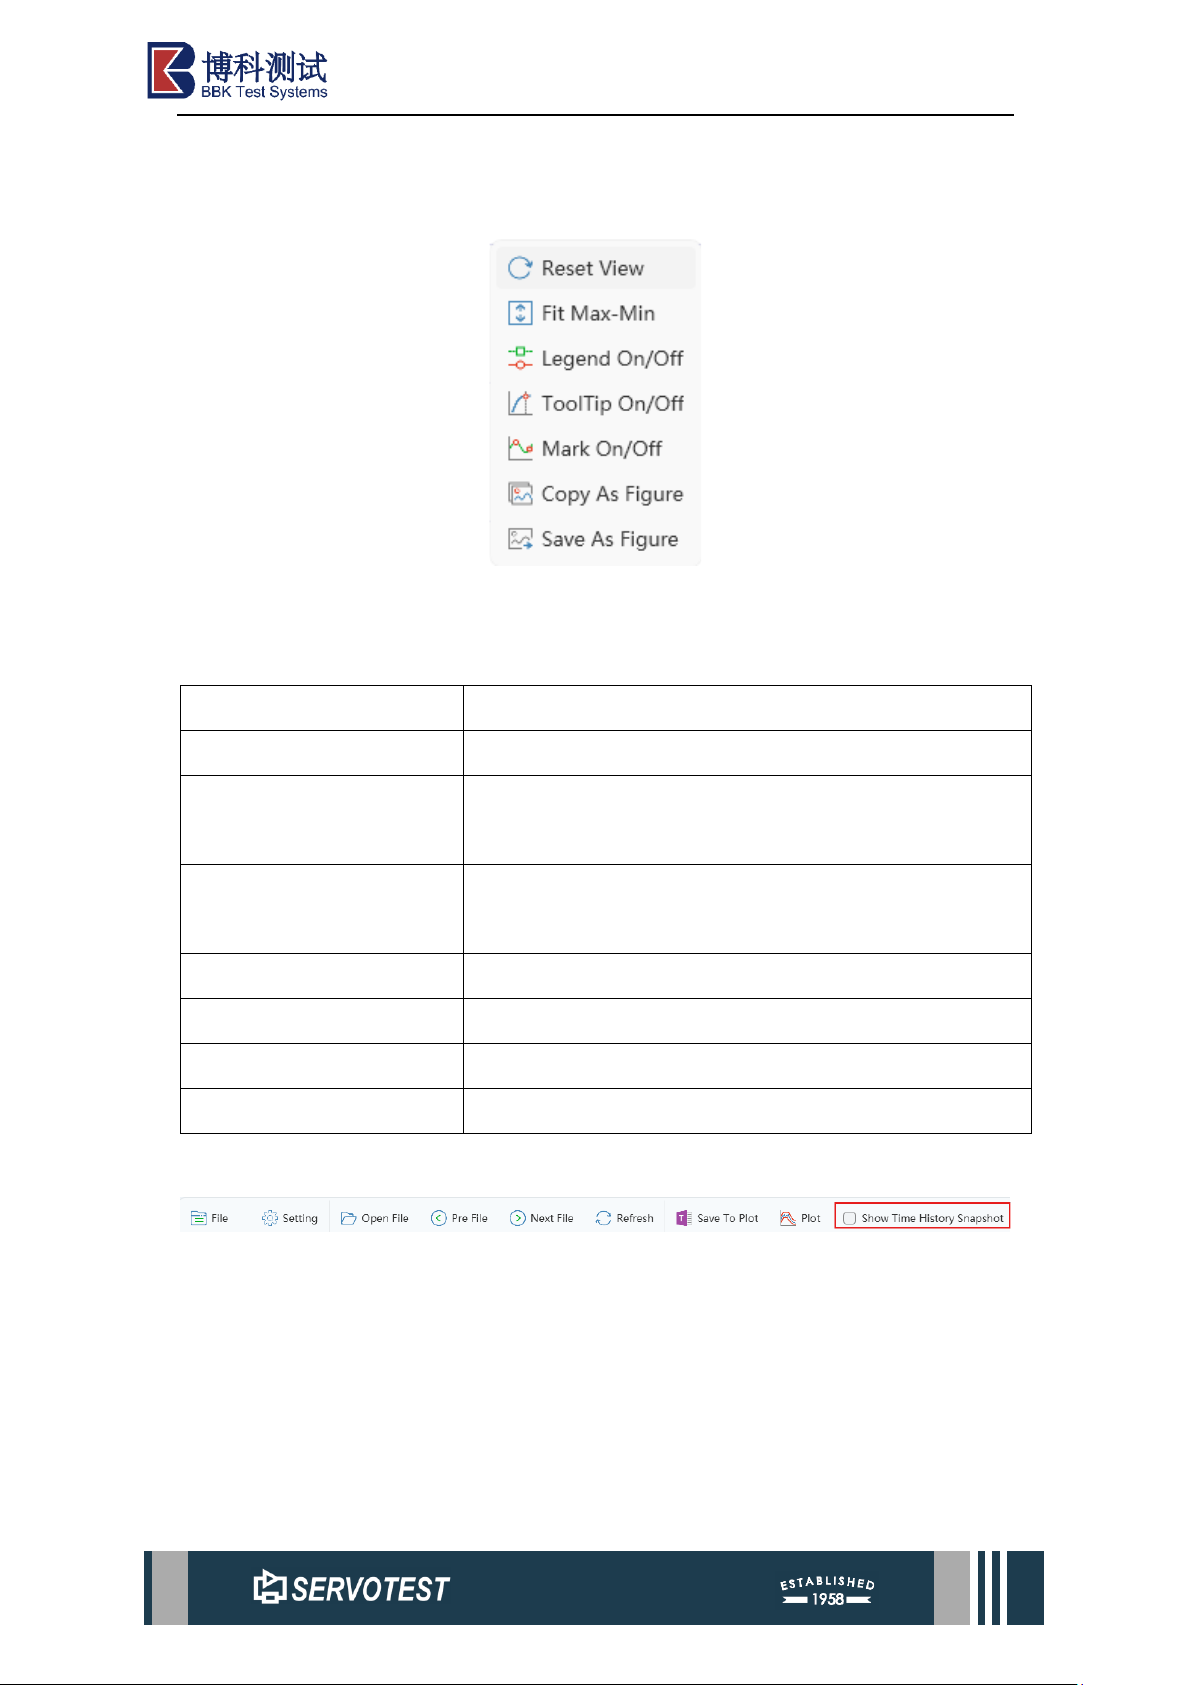
All the drawing data is cached here. You can click on any piece of data to perform
the deletion operation.
Figure 2-9 Right-click Menu
Right-click the drawing area to call out the menu options as shown above.
Table 2-2 Right-click Menu
Parameter
Describe
Reset View
Reset the coordinate range of the drawing area.
Fit Max/Min
Automatically adjust the Y-axis coordinate range to the
range of the data, and the X-axis is not affected.
Legend On/Off
Option to turn on or off the legend in the upper right
corner.
ToolTip On/Off
Turn on or off the function switch of mouse display data.
Mark On/Off
Toggle the display of individual data points on or off.
Copy as Figure
Copy the image to the clipboard.
Save as Figure
Save as image file.
2.1.6 Show Time History Snapshot
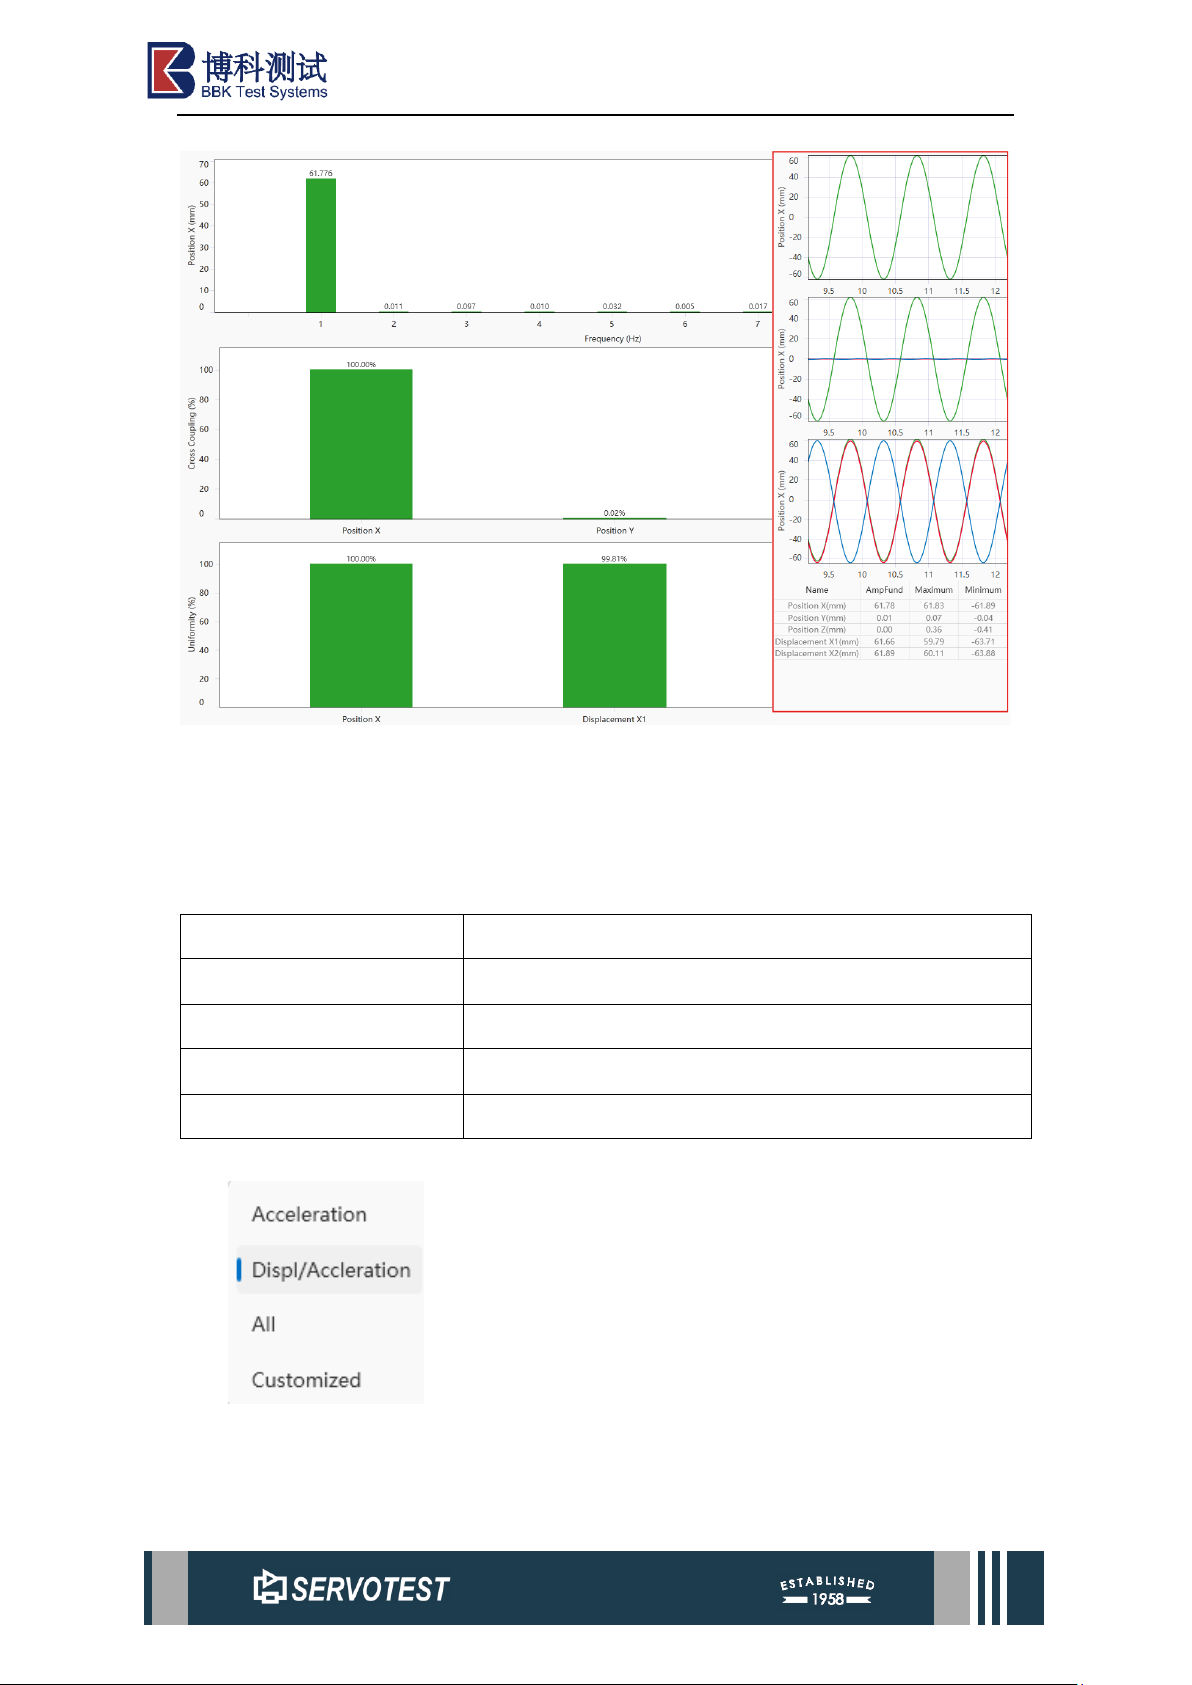
Tick the box labelled ‘Show Time History Snapshot’ to display the concealed
signal data chart on the right. The three charts on the right, from top to bottom, represent
signal data for the primary oscillation direction, residual analysis of coupling, and
uniformity analysis respectively. Note that the signal data (Figure 2-10 Show Time
History Snapshot) displays data from the middle three stable cycles extracted from the
signal.
Page 11
xKit Operation Manual
Figure 2-10 Show Time History Snapshot
Double-clicking the plot area on the right will display the full time-domain plot.
Pressing Ctrl and left-clicking the mouse will display the full time-domain plot for that
signal channel in the xDap window.
Table 2-3 Table data
Parameter
Describe
Name
Signal Channel Name.
AmpFund
Signal channel amplitude at fundamental frequency.
Maximum
Maximum amplitude of the signal channel.
Minimum
Minimum amplitude of the signal channel.
2.2 Channel List
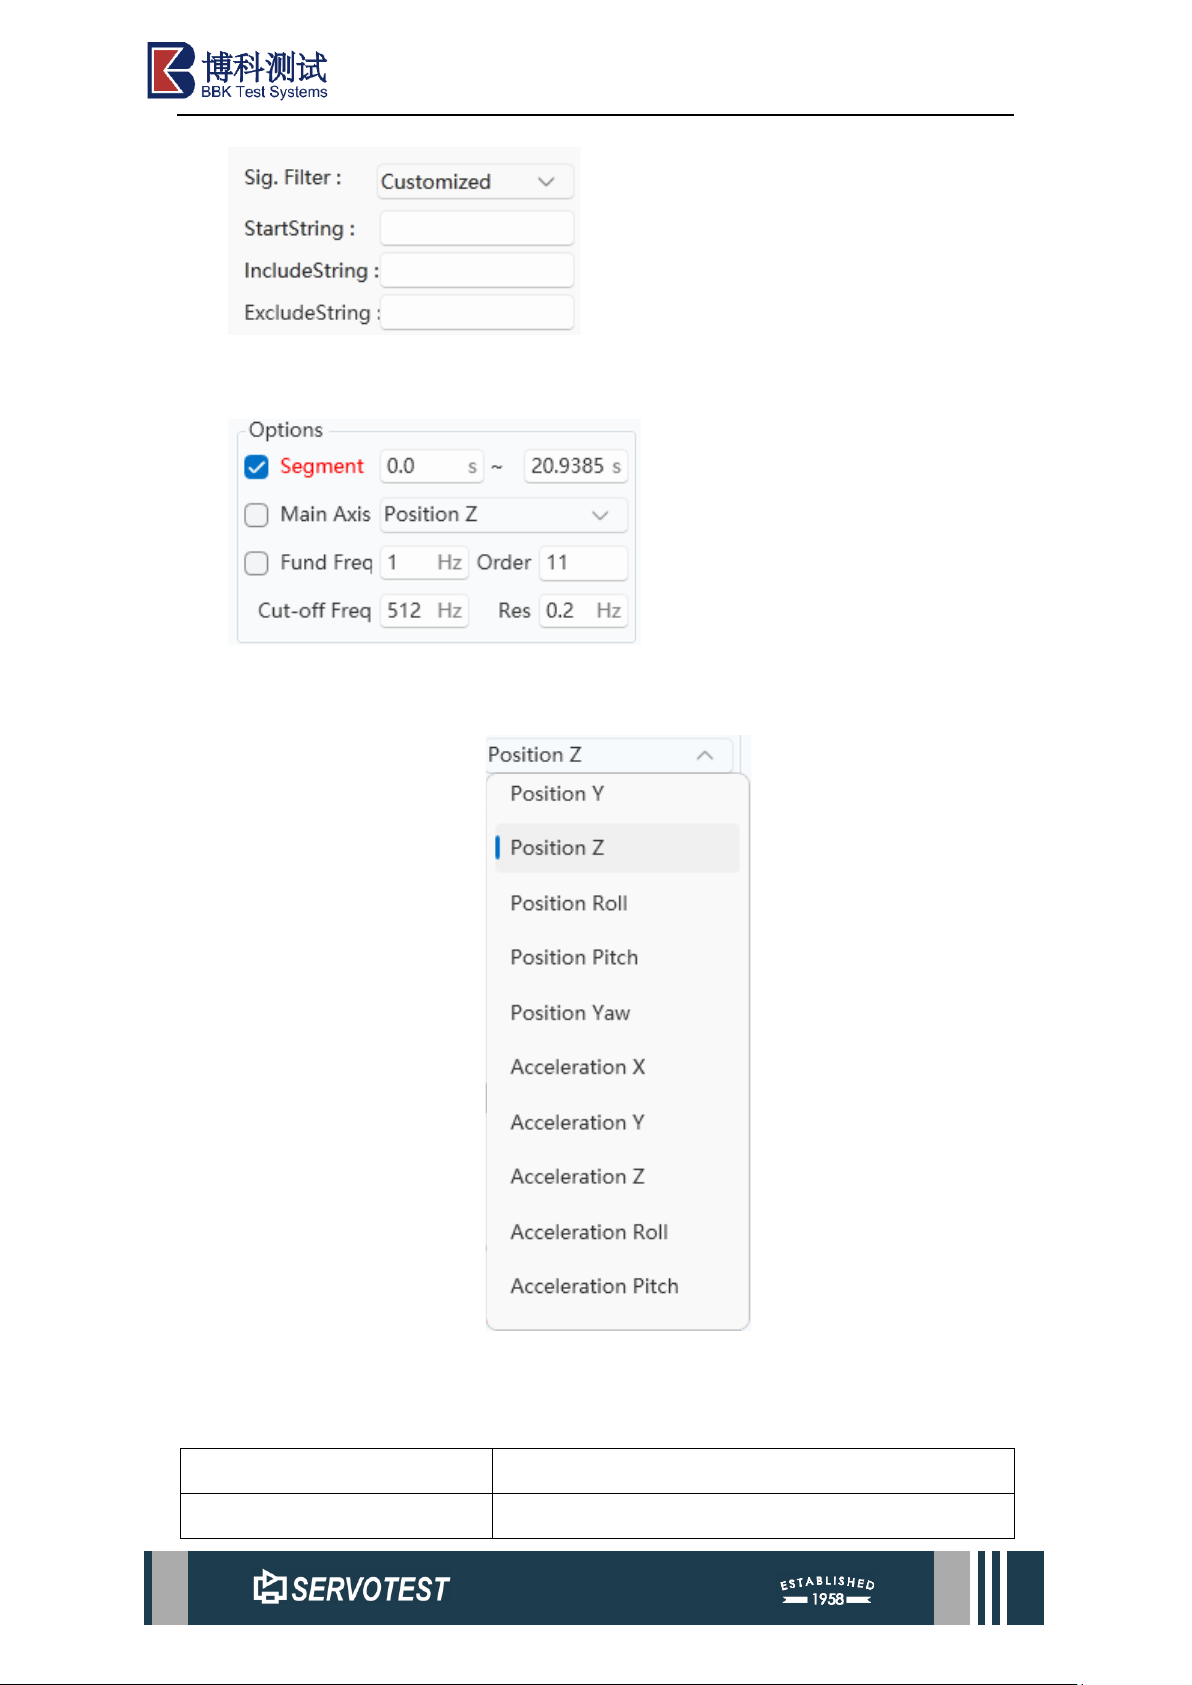
Change the channels to be analyzed here, and use filters to quickly differentiate
between velocity and acceleration channels.
Page 12
xKit Operation Manual
Click “Customized” to precisely filter the required analysis channels.
2.3 Parameter Settings & Results
This section includes settings for all analysis. The drop-down menu is shown in
the figure below.
Figure 2-11 Main Axis Menu
Table 2-4 Parameter Settings
Parameter
Describe
Segment
Tick the “Segment” checkbox to define the required
Page 13
xKit Operation Manual
calculation period according to your specific
computational requirements.
Main Axis
By default, it is automatically selected, when the
main axis selection box is checked, the main
vibration direction (main axis) is no longer
automatically switched.
Fund Frequency
By default, it will be set automatically. When the
fundamental frequency selection box is selected, the
fundamental frequency will not change
automatically.
Cut-off Frequency
Set the maximum display frequency of FFT results.
Order
Indicates the maximum number of displayed
histograms, range [1,11].
Resolution
Select the corresponding level when the data is lower
than 1Hz, FFT resolution values include 0.1Hz,
0.2Hz, 0.5Hz, 1Hz.
Note: Once parameter settings are complete, press Enter to apply.
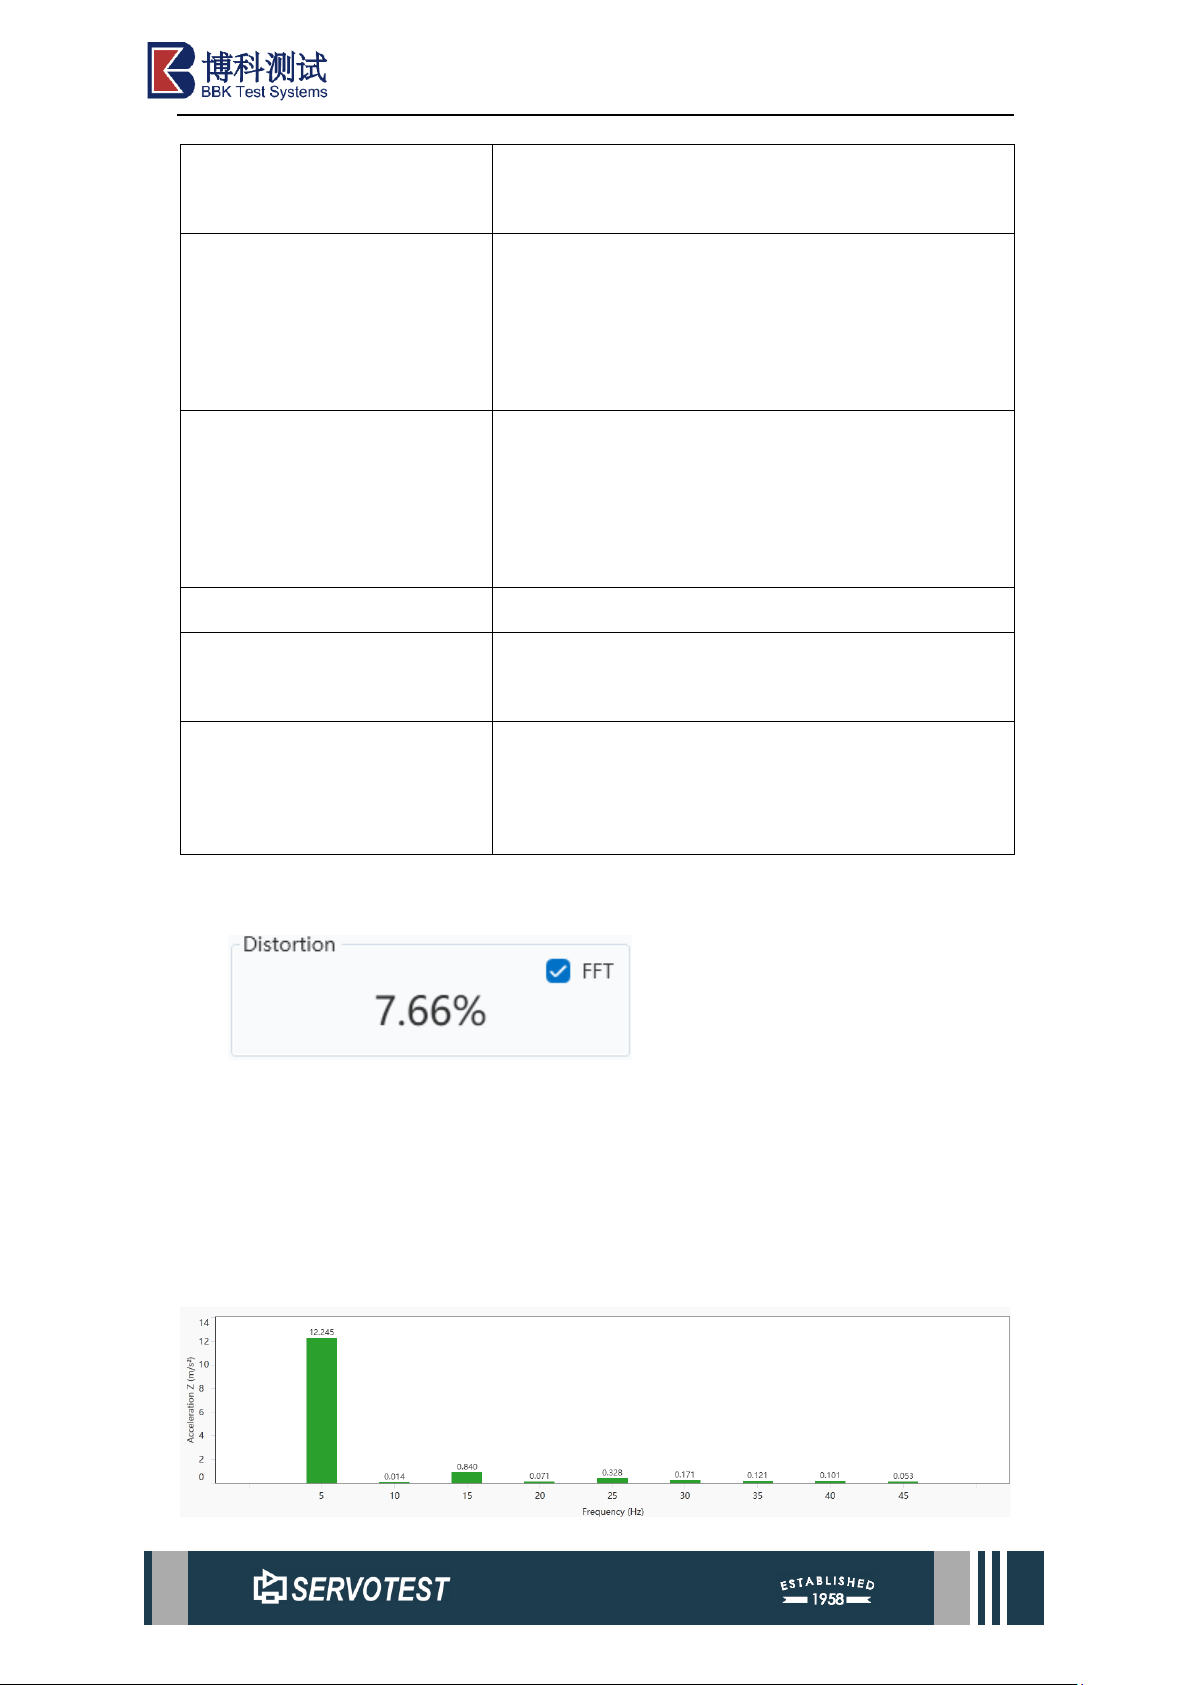
2.4 Distortion
Distortion: used to display the result of distortion, the data result corresponds to
the chart in the first row of the first column of the chart area, the percentage of the
distortion result exceeds 30%, it is displayed in red, and clicking will display it in the
xDap window FFT results.
The FFT selection box is used to select the frequency domain resolution and time
domain resolution calculation, if not selected, it means the time domain.
Page 14
xKit Operation Manual
Figure 2-12 Distortion
2.5 Cross Coupling
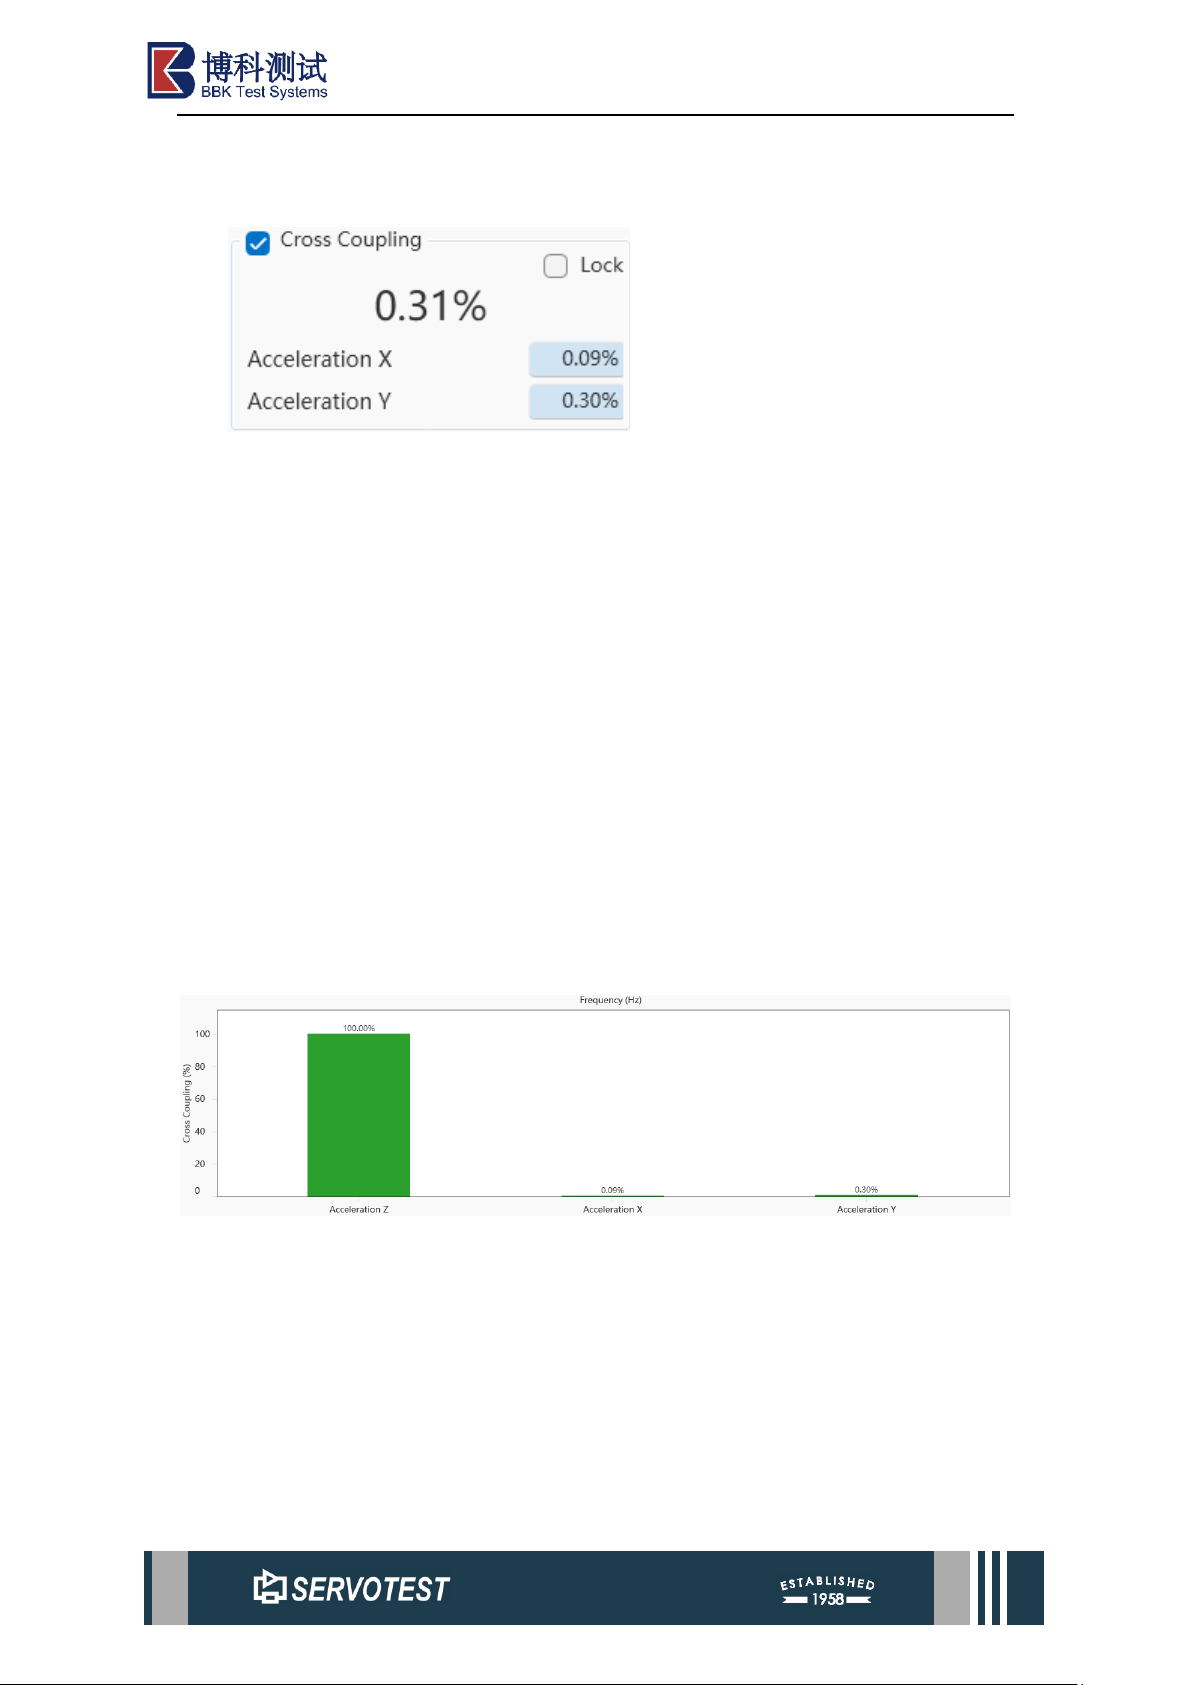
Cross Coupling: used to display the Cross Coupling results, including the signal
currently selected for Cross Coupling analysis. Signal selection can be completed by
dragging the mouse. Dragging directly to the existing signal will replace the signal.
Hold down "Ctrl" and drag to insert the signal. The selected signal coupling result
corresponds to the chart in the first column and the second row of the chart area, and
the signal data corresponds to the chart in the second column and the second row. If the
percentage of Cross Coupling results exceeds 30%, it will be displayed in red. Clicking
will display the selected signal and main axis signal data in the xDap window.
Cross Coupling checkbox indicates whether the current module is enabled. The
default selected state denotes availability; deselecting it disables cross coupling
calculations, hides the corresponding parameters, and conceals the associated graph.
Lock: By default, THD automatically sets the corresponding cross coupling
residual signal when switching data files (.sef). When Lock is selected, the signal
remains unchanged upon switching data files (.sef).
Figure 2-13 Cross Coupling
Page 15
xKit Operation Manual
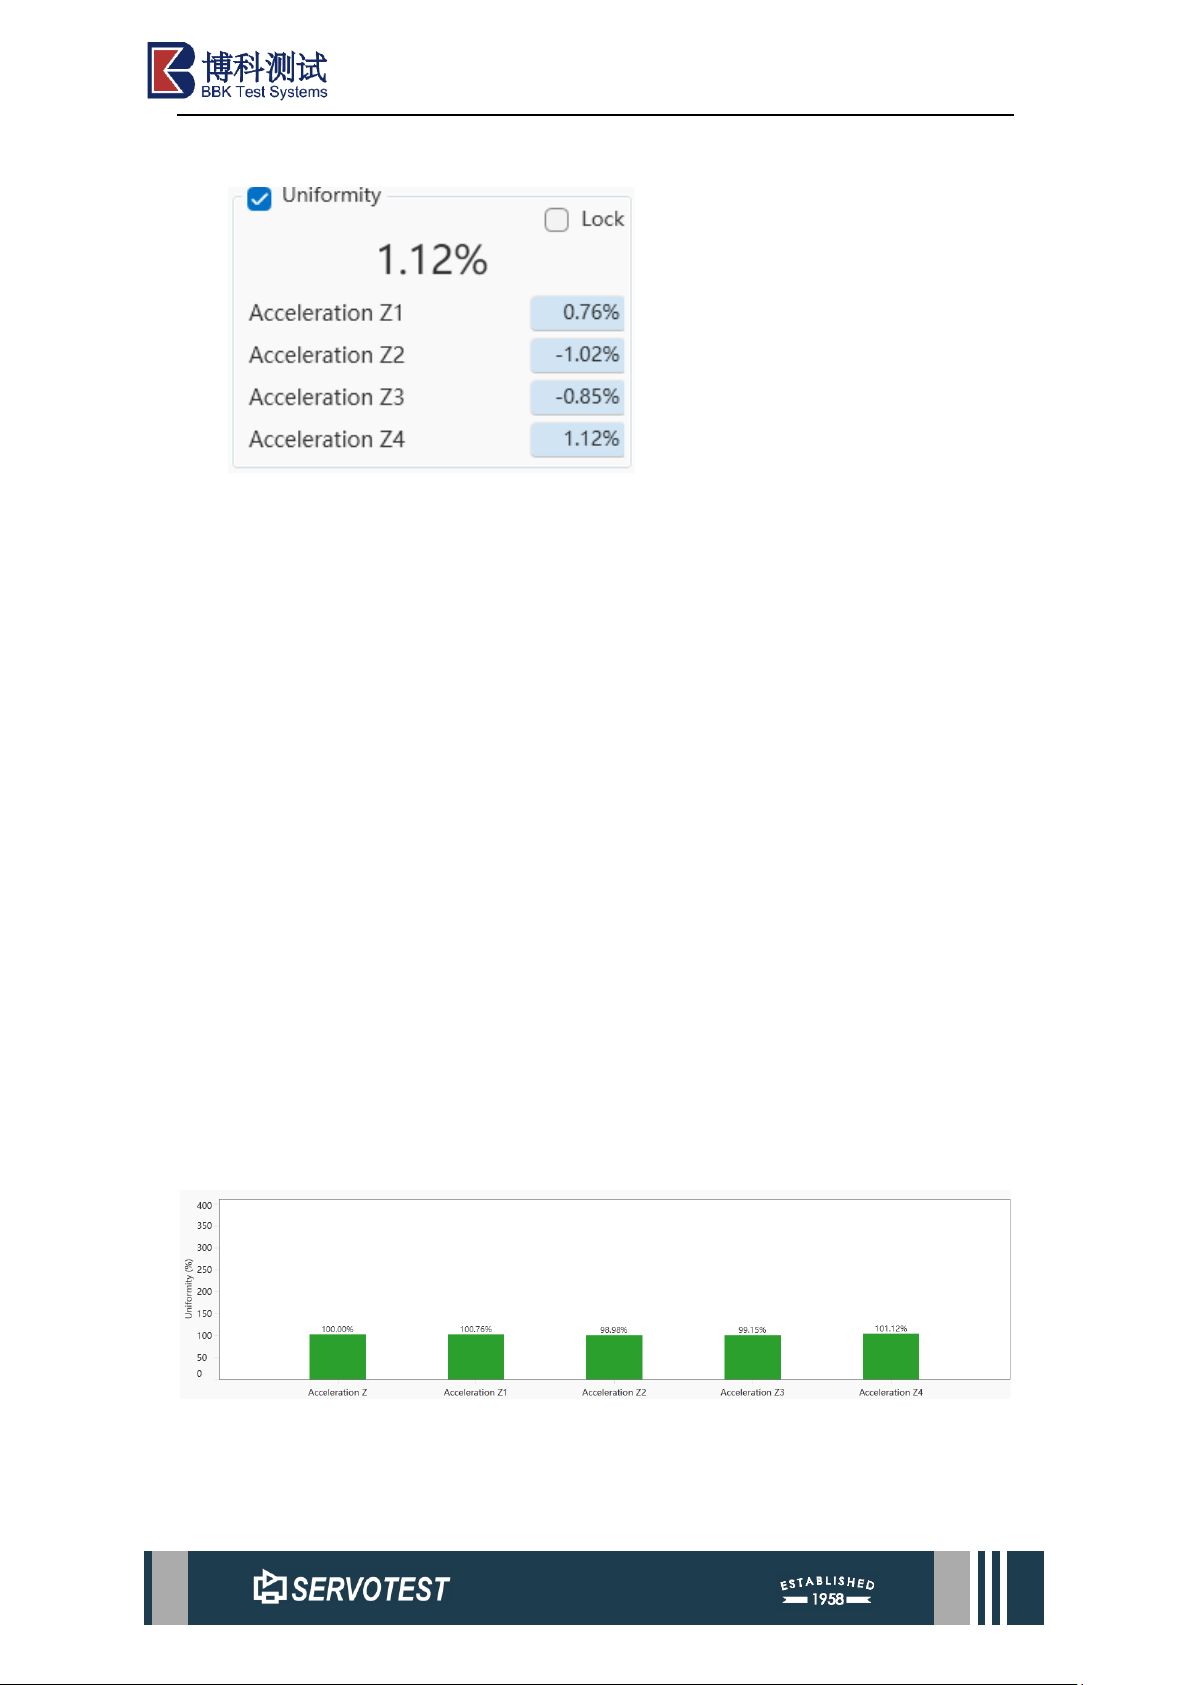
2.6 Uniformity
Uniformity: It is used to display the signal uniformity results, including the
currently selected signal, the same Cross Coupling operation, the signal selection can
be completed by dragging the mouse, directly dragging to the existing signal will
replace the signal, hold down "Ctrl”, and drag Insert signal. The chart area
corresponding to the selected signal uniformity result is the chart in the first column
and the third row, and the signal data corresponds to the chart in the second column and
the third row. The uniformity result percentage exceeding 30% will be displayed in red,
and clicking will display the selected signal and main axis signal data in the xDap
window.
Uniformity checkbox indicates whether the current module is enabled. The default
checked state signifies availability; if unchecked, uniformity calculations are disabled
and this parameter area is hidden, with the corresponding chart also concealed.
Lock: By default, THD automatically sets the corresponding uniformity signal
when switching data files (.sef). When Lock is selected, the signal remains unchanged
upon switching data files (.sef).
Note: The charts that display the signal are all intercepted and displayed with the
data of the three periods in the middle of the signal. After resetting the parameters, click
the refresh button to calculate and analyze again.
Figure 2-14 Uniformity
Page 16

xKit Operation Manual
2.7 Plot Result
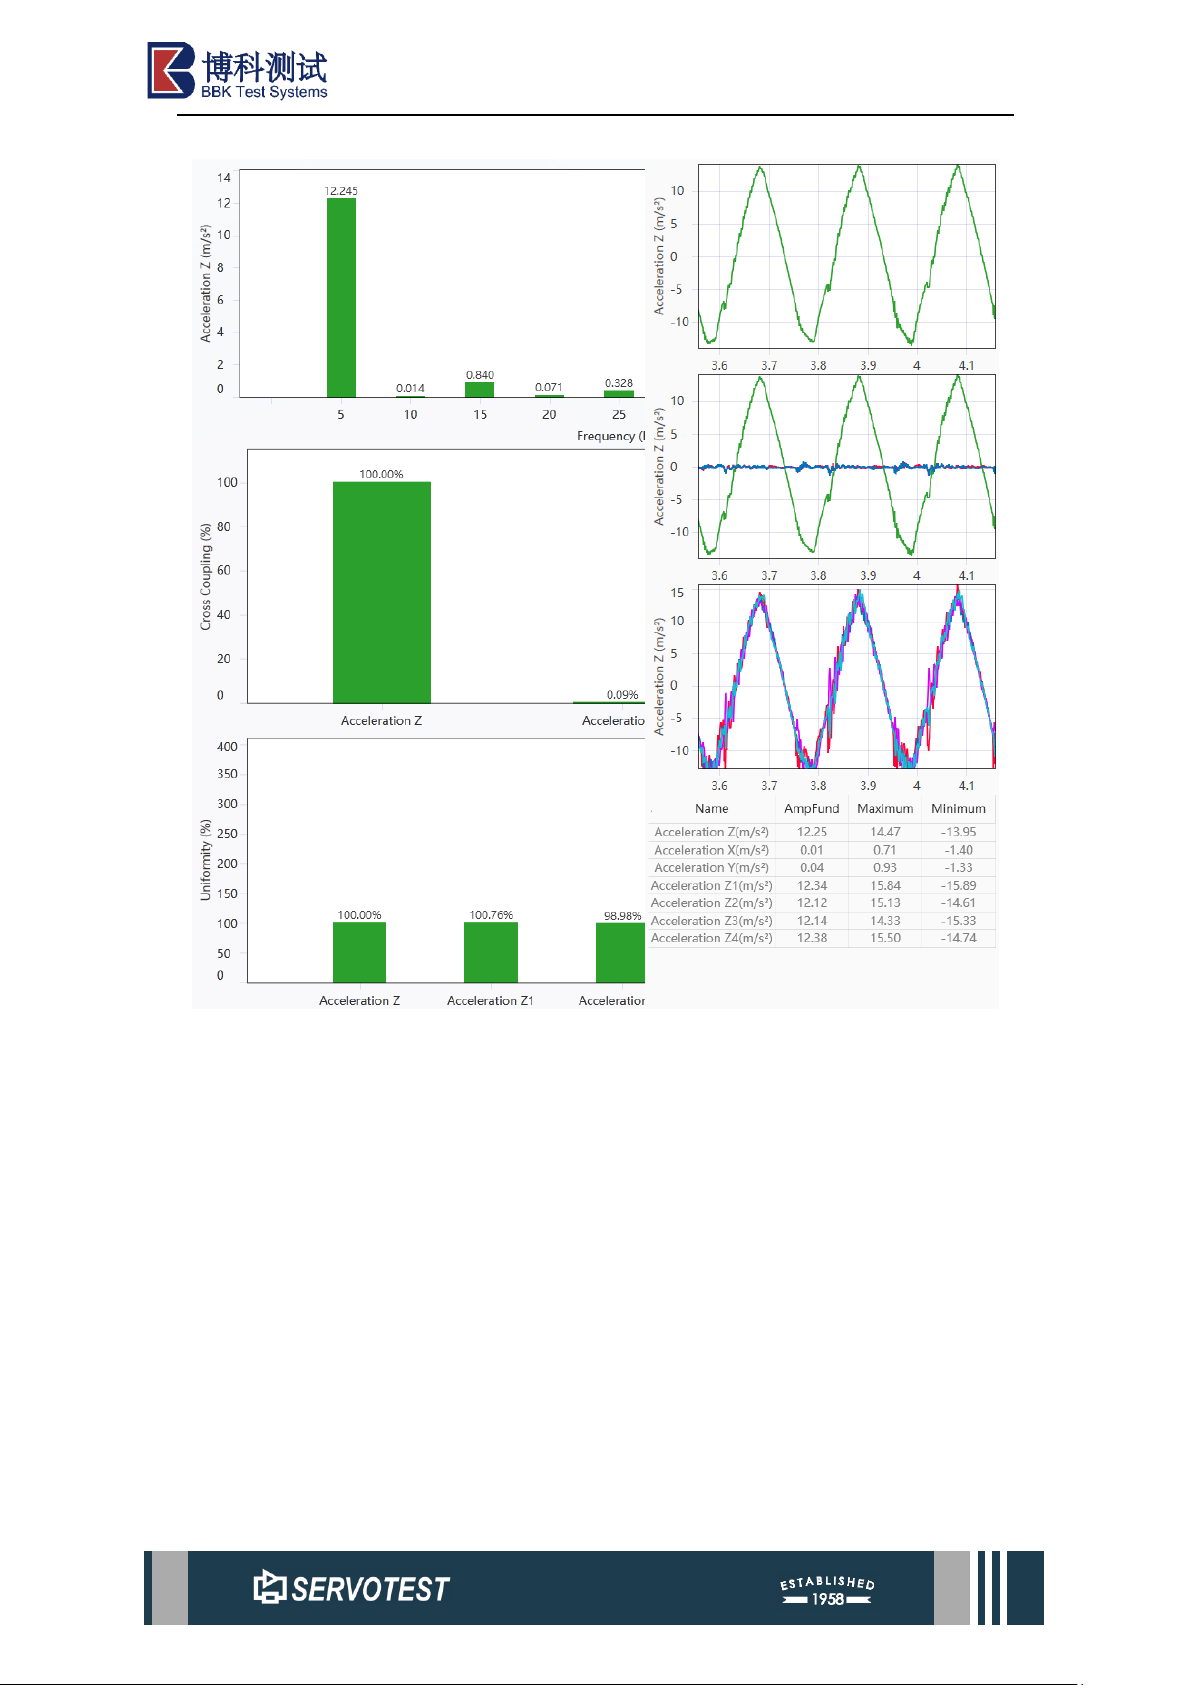
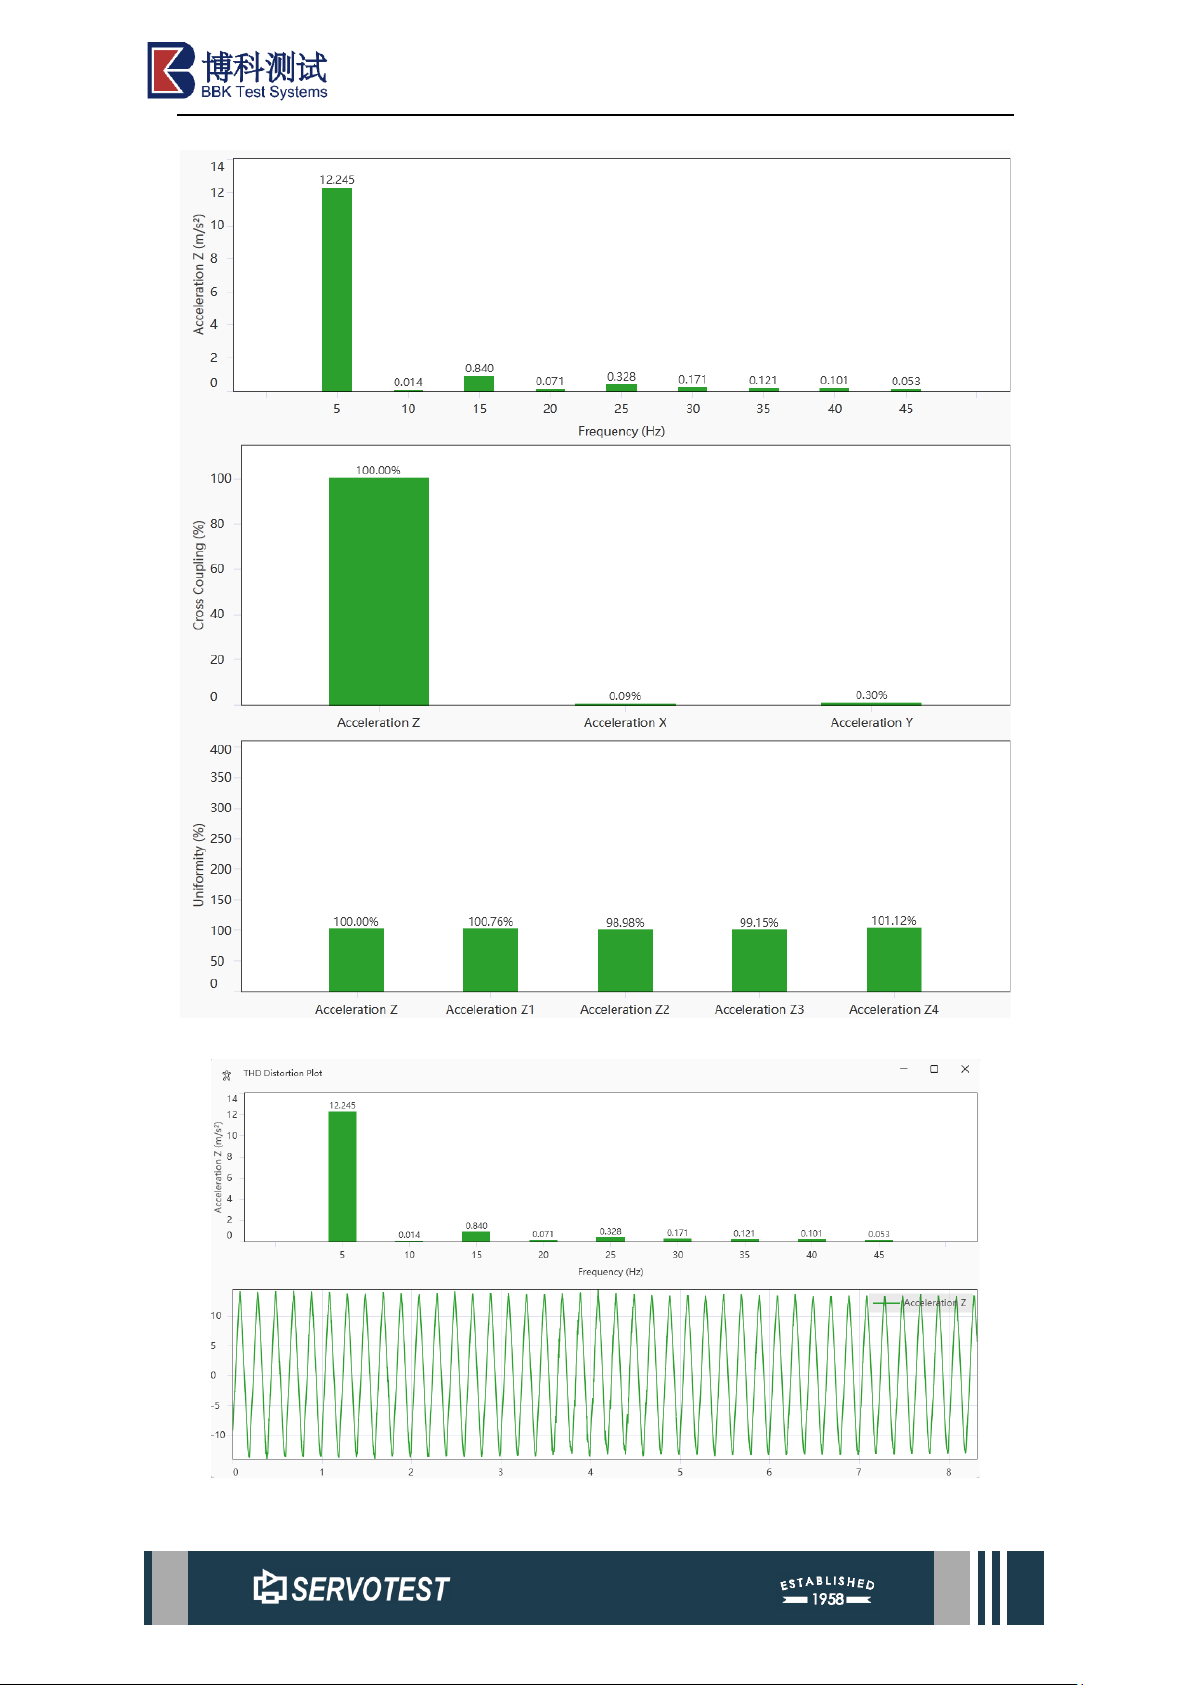
As shown in the figure below, the chart area of the THD main interface consists
of 6 charts, and the second column of charts is docked and hidden by default. Tick the
box labelled ‘Show Time History Snapshot’ to expand the chart (Figure 2-15 Expanded
Chart). The 6 charts represent the distortion results, signal cross coupling results, signal
uniformity results, main axis signal data, cross coupling analysis signal data, and
uniformity analysis signal data from top to bottom, and from left to right. Note: The
signal data are all data showing the three stable periods in the middle of the intercepted
signal.
All charts have double-click events, and the distortion result chart double-clicks
to display the distortion result and the main axis signal data in a new chart (Figure 2-17
Independent Window); the cross coupling result chart double-clicks to display the
coupling residual result and signal data; the uniformity result chart Double-click to
display the uniformity results and signal data; the above three charts on the left double-
click to pop up the form charts when copying a single time-domain chart, and other
double-click new charts to display their own data results.
Page 17
xKit Operation Manual
Figure 2-15 Expanded Chart
Page 18
xKit Operation Manual
Figure 2-16 Plot Result
Figure 2-17 Independent Window
 Loading...