

Page 1
Page 2

SEC2000 Operating Manual
Operating Manual
Notice
- Information in this manual is subject to change without notice ALS shall not have either liability or responsibility
to any person or entity with respect to any incidental or consequential loss or damages connected with the
information contained in this manual.
- Windows, W indows 2000, W indows XP and Windows 7 are either registered trademarks or trademarks of
Microsoft Corporation.
December 2010
SEC2000 Spectra System
www.als-japan.com
2
Page 3

SEC2000 Operating Manual
Miniature Spectrophotometer
Operating Manual
- SEC2000 Detector
- SEC2000 light Source
- Visual Spectra 2.1
- Cuvette Holder
- Accessories
Thank you for purchasing SEC2000 miniature spectrophotometer. The Palm sized compact
design and diverse applications using optical sensing system will make SEC2000 revolutionize
analytical instrument markets. SEC2000 interfaces PC via USB and the Visual Spectra 2.1, the
software, is compatible with Windows 2000, Windows XP, 7 and 8. With the versatile spectrum
display function and Time Serious Acquisition, the intensity change monitoring of the certain
wavelength according to the time, SEC2000 is suitable for not only optical and chemical
analyses but also environmental and process monitoring. Also it can be applied to display and
plasma research, color related industry, medical diagnosis, etc.
This manual contains general configuration, functions, and operating instructions of SEC2000. If
you have any technical problems or question, please feel free to contact us.
We always make our effort to be the world’s best company in the analysis system market with
continuous commitment to make the world’s best product.
Customer Service
BAS Inc.
TEL : +81-3-3624-0331 FAX : +81-3-3624-3387
E-Mail : [email protected] Homepage : http://www.bas.co.jp/
SEC2000 Spectra System
www.als-japan.com
3
Page 4
SEC2000 Operating Manual
Caution
ALS provides one year guarantee for SEC2000 from the purchasing.
However, if the problem is caused as not paying attention to below, the cost can be
charged to a user.
Precaution for Installation/Maintenance
▪ Do not expose the instrument to direct the sunlight.
▪ Avoid installing the instrument in wet locations and area with heat sources.
▪ Do not place the instrument in dusty place.
▪ Do not install the instrument close to magnets.
▪ Select a safe location for the instrument.
▪ Make sure the space of the instrument on a work desk and away from the areas
where object could fall and damage the instrument.
▪ The optimal operating conditions are 5 ~ 35 °C and 30 ~ 70% RH.
Safety
To prolong the life of the system, please follow these precautions:
▪ Pack the system when it is not in use for extended periods of time.
▪ Do not clean the system with harsh solvents (benzene, thinner, alcohol, etc.).
▪ Do not spray the water to clean the instrument.
▪ Make sure the cables are not twisted or bent.
▪ Do not pull the cables with fierce force.
▪ Do not dismantle and modify the system.
SEC2000 Spectra System
www.als-japan.com
4
Page 5
SEC2000 Operating Manual
C
ontents
1. Introduction
1-1. Standard Composition
1-2. Operating Principle
1-3. System Overview
1-4. Application
2. SEC2000
2-1. Composition
2-2. Specifications
3. Installation
3-1. System Requirement
3-2. Software & Diver Installation
3-3. Connect SEC2000 to the PC
4. Operation
4-1. Connection
4-2. Program Start
4-3. Software Operation
5. Measurement
5-1. Calibration
5-2. Dark and Reference Measurements
5-3. Sample Measurement
5-4. Absorbance/ Transmittance
Measurement
5-5. Reflectance Measurement
5-6. Irradiance Measurement
5-7. Time Series Acquisition
6. Analysis
6-1. Overlay
6-2. Quantitative Analysis
7. Multi-Channel
8. Trigger
6
6
7
7
8
10
10
10
11
11
11
15
17
17
18
19
31
31
31
36
32
34
36
38
44
44
51
58
61
SEC2000 Spectra System
www.als-japan.com
5
Page 6
SEC2000 Operating Manual
1. Introduction
1-1. Standard Composition
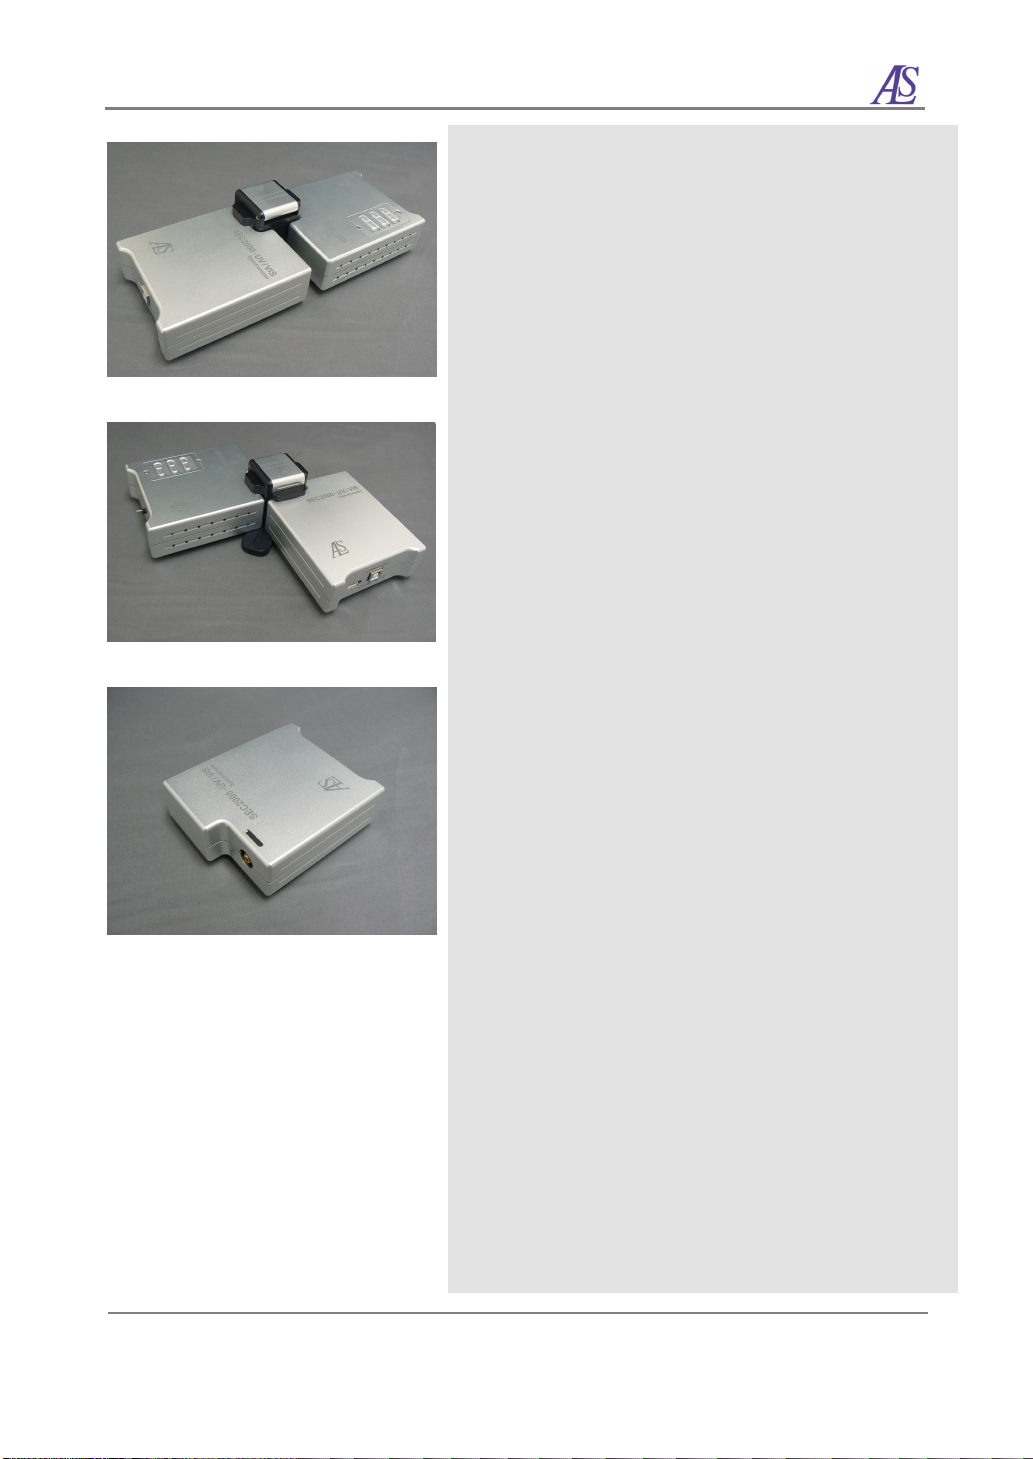
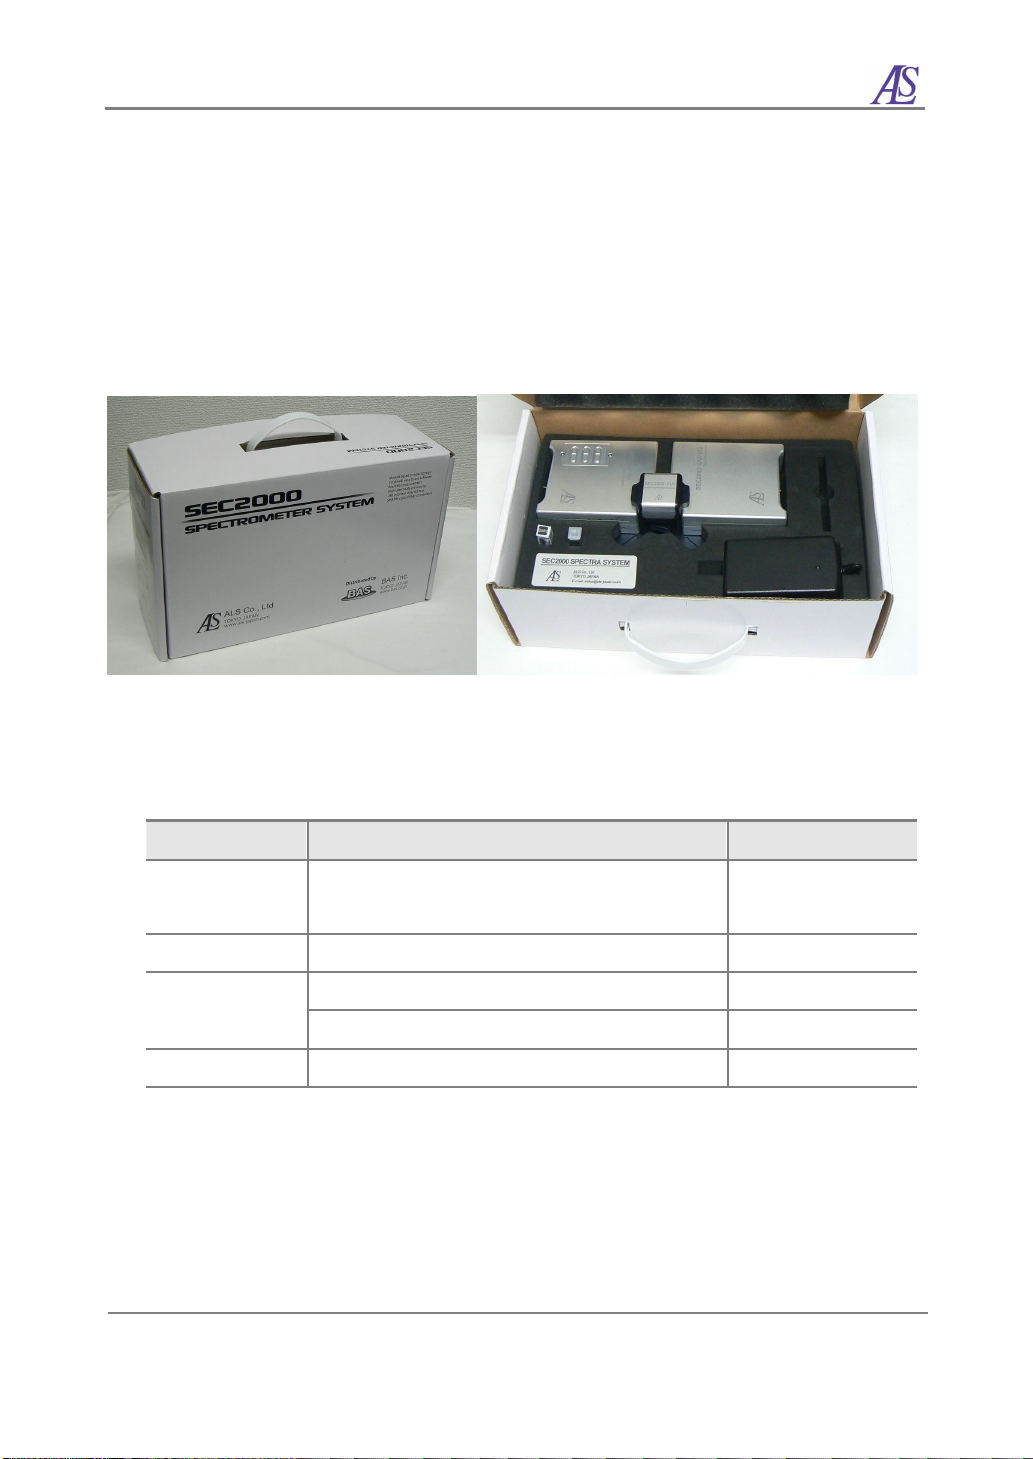
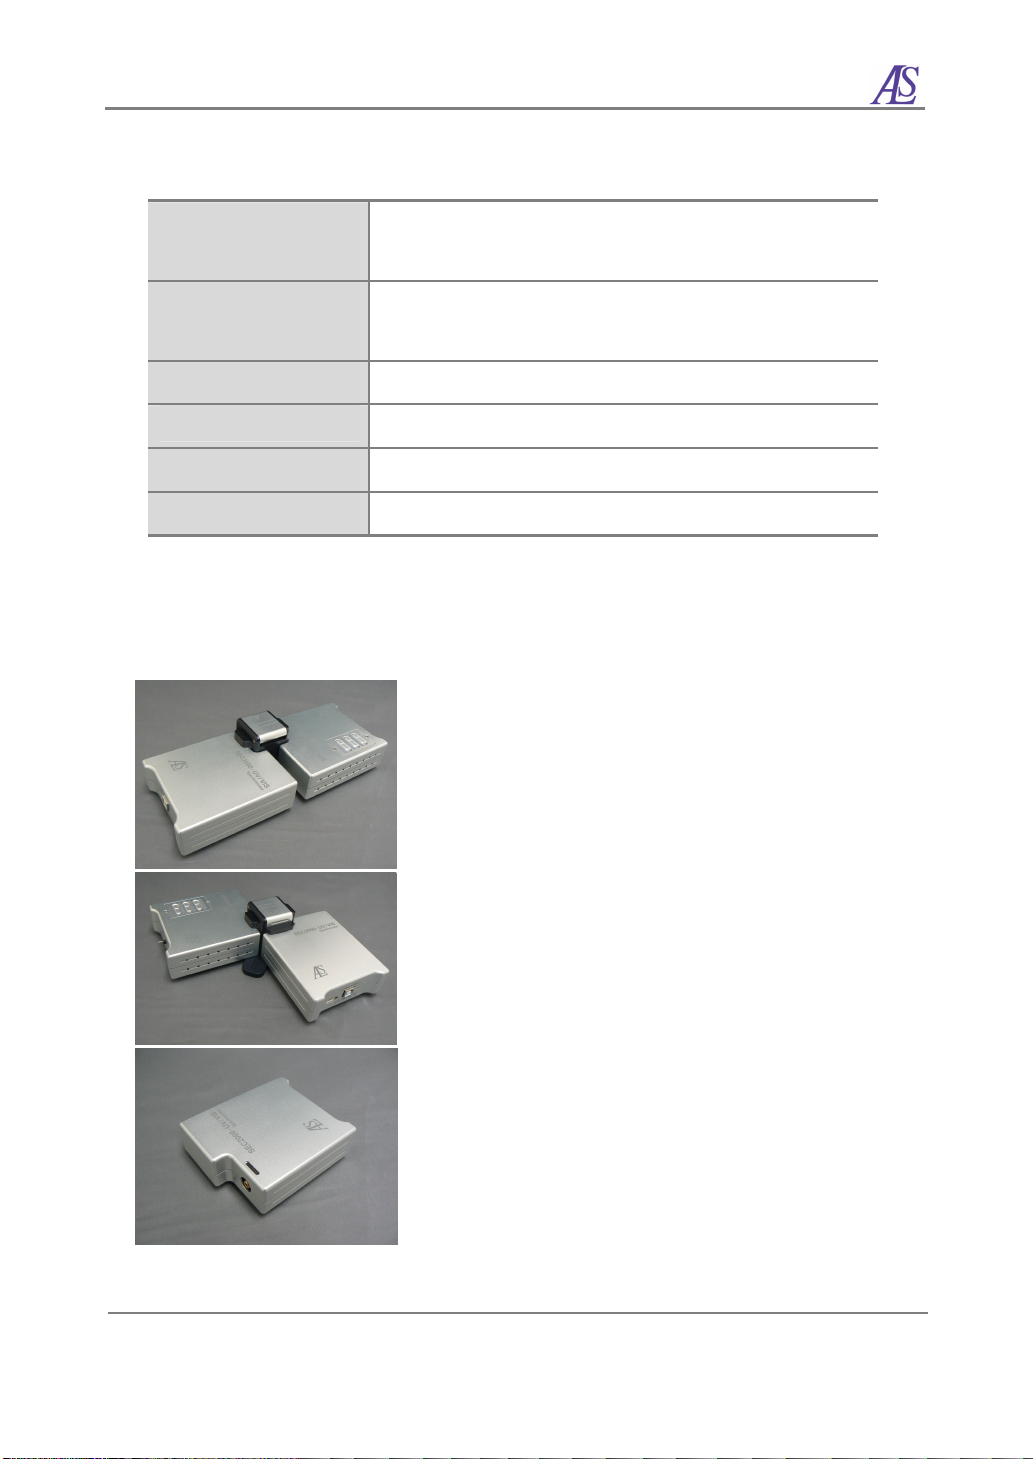
Typical Miniature Spectrophotometer consists of four basic elements: SEC2000
(detector), Visual Spectra 2.1 (program software), SEC2000-TH (light source for Visible-
Near infrared) or SEC2000-DH (light source for UV-Visible), and SEC2000-CUV
(cuvette holder).
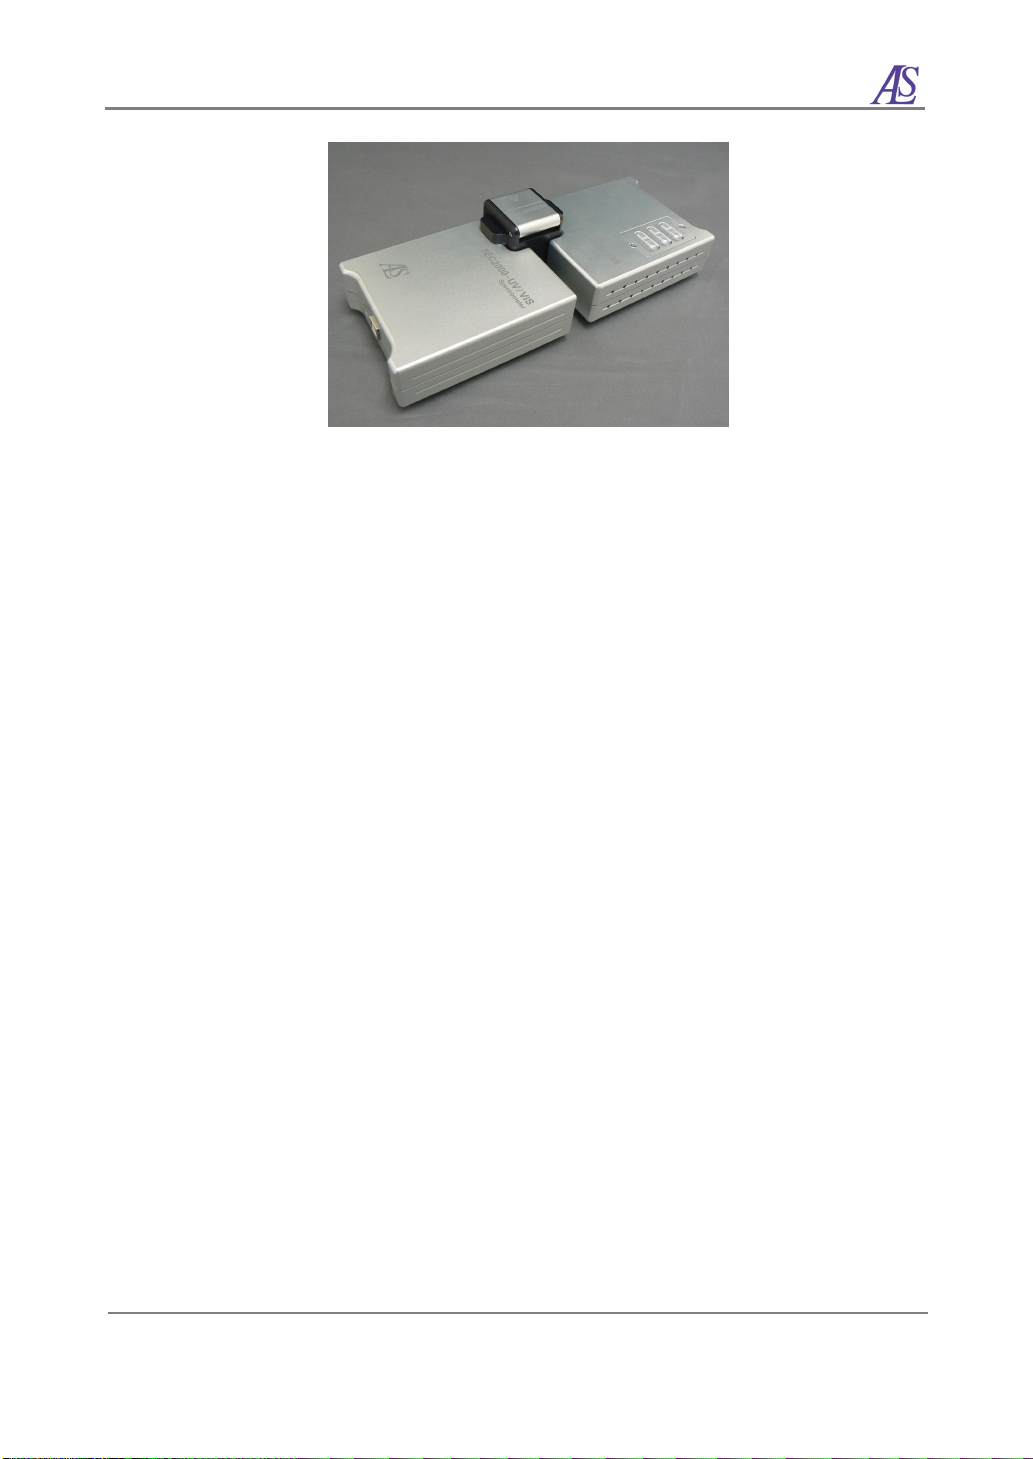
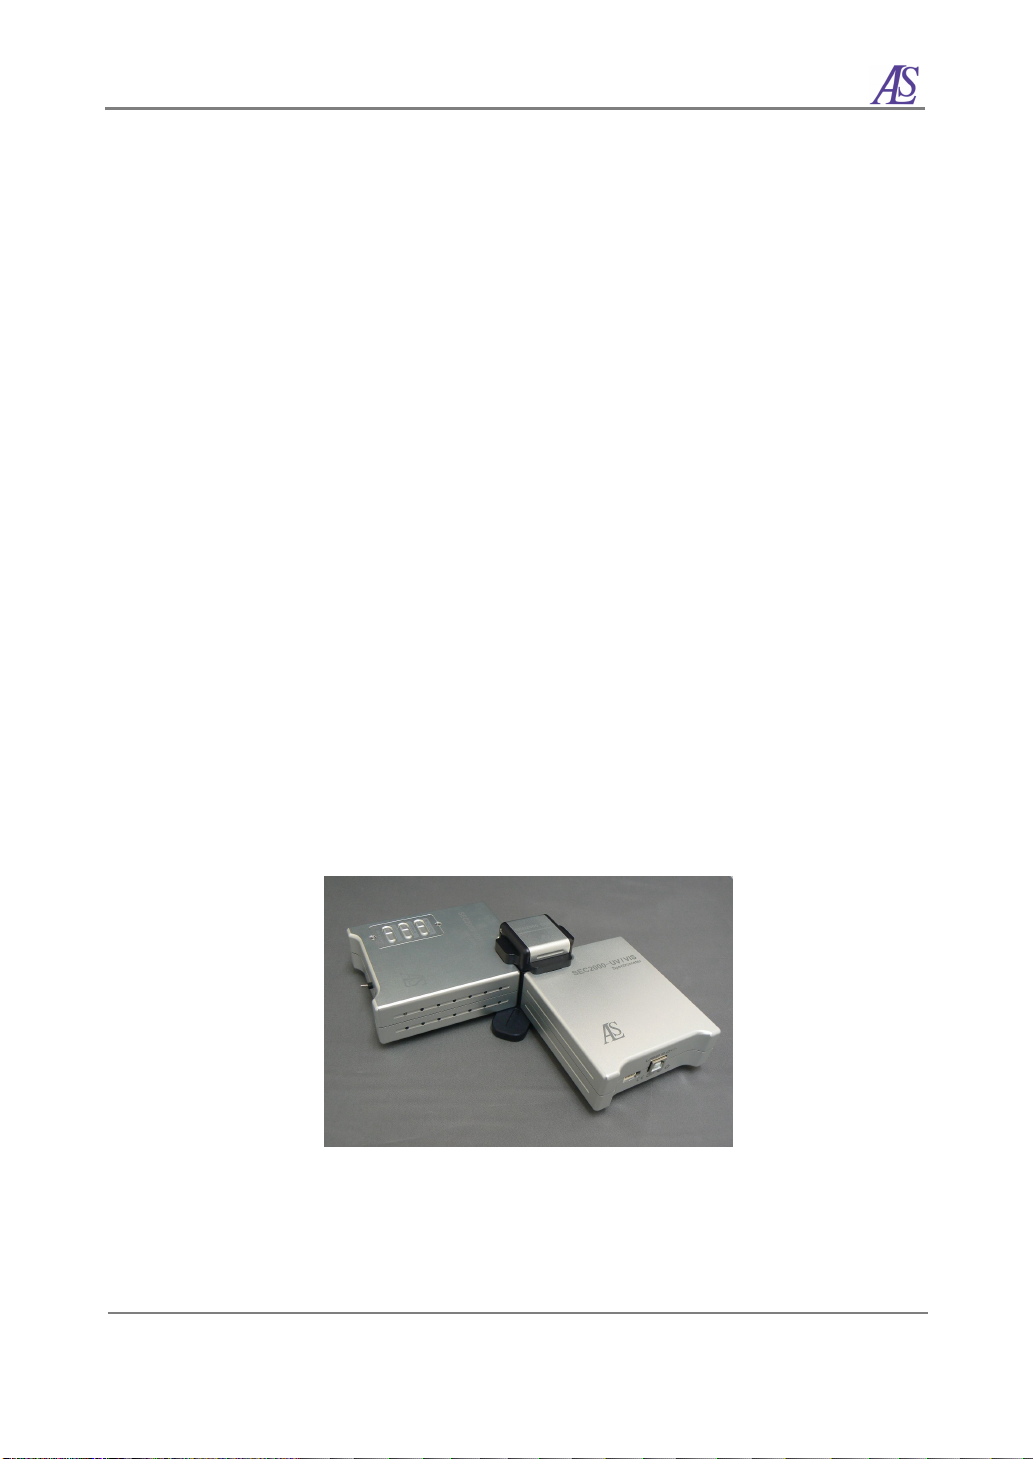
<Fig. 1-1-2> SEC2000 UV-Visible Spectrometer
<Table 1-1-1>
Item Description Item Code
Detector SEC2000 Spectrometer
Software Visual Spectra 2.1 Visual Spectra 2.1
Tungsten-Halogen Lamp (for Visible) SEC2000-TH
Light Source
Deuterium & Tungsten Halogen Lamp (for UV-Visible) SEC2000-DH
Cuvette holder 3-Way Holder SEC2000-CUV
SEC2000-UV/VIS
SEC2000-VIS/NIR
SEC2000 Spectra System
www.als-japan.com
6
Page 7

SEC2000 Operating Manual
1-2. Operating Principle
The light or excitation source sends light to the Cuvette holder containing sample. The
light interacts with the sample. The light is collected by the spectrometer and the spectral
information is sent to SEC2000. The energy is transmitted through Cuvette holder and is
dispersed via a fixed grating across a linear charge-coupled device (CCD) array detector.
A/D converter transforms the analog data collected from the spectrometer into digital
information. This is passed to the software, providing the user with application-specific
information.
1-3. System Overview
1-3-1. Features
Detector
CCD array detector provides the ability to acquire a full spectrum. In the same time, it
takes a scanning unit to sample a single wavelength. The result is a flexible, low-cost
spectrometer with no moving parts and a compact design with a familiar optical design
- diffraction grating (symmetrical optical bench) – and reconfigures it for an optical
bench small enough to fit into the palm of your hand.
Light Source
We offer a complete line of light sources for visible applications. This modular
approach – components are easily mixed and matched – offers remarkably flexible
applications.
1-3-2. Use
SEC2000 provides quantitative and qualitative analytical techniques for the
absorbance and transmittance of visible light especially useful for chemiluminescence,
electroluminescence and photoluminescence that are measured without light source.
1-3-3. Specifications
A miniature spectrometer, SEC2000 couples a reasonable cost and high-performance
with 2,048-element linear CCD-array detector. Thanks to a modular approach, the
components are easily mixed and matched, which offers remarkably flexible
applications.
SEC2000 Spectra System
www.als-japan.com
7
Page 8
SEC2000 Operating Manual
<Table 1-3-1>
Wavelength range
Resolution
Sensor
Grating
Physical dimension
Integration time
1-4. Application
1-4-1. System Modes
400 nm ~ 1000 nm (VIS/NIR)
200 nm ~ 900 nm (UV/VIS)
~2.3 nm (50 m slit, default)
~1.2 nm (25 m slit, option)
Silicon Charge Coupled Device (Si-CCD)-2,048 pixels
600 lines/mm
35 x 98 x 250 mm
12~13 scans/second
Absorbance/Transmittance Mode
Reflectance/Fluorescence Mode
Irradiance Mode
<Fig. 1-4-1>
SEC2000 Spectra System
www.als-japan.com
8
Page 9
SEC2000 Operating Manual
1-4-2. Application Fields
Type Application Fields
Concentration of chemicals (solution)
<Table 1-4-1>
Abs./Trans.
Reflectance
Emission
(Irradiance)
Scattering
Polymer extrusion processes
DNA quantification
Freshness testing
Film thickness/composition (Quality control)
Activation energy of photo catalytic species
Textile quality control
Astronomy (e.g., spectra of hale-Bopp, plasma monitoring)
Metal in situ Monitoring
Luminescence (PL, EL), LED & Laser wavelength
Oil concentrations of Oil/water System
Raman Spectroscopy
Physical transition phenomena (e.g., melting point, glass-
transition crystallize temperature)
Marine organisms
Biology (DNA, Protein, Cell proliferation assay, Histamine -
analysis, Algae monitoring)
Fluorescence
Reflection
Index
SEC2000 Spectra System
www.als-japan.com
Environmental fields (Waste water analysis, Ground water trace
studies, Hydrocarbon detection, Dissolved oxygen)
Plant efficiency (Plant physiology, Plant breeding, Horticulture,
Agronomy, Agrochemicals, Pollution studies, Forestry, Ecology)
Tissue diagnosis
Concentration in solution
9
Page 10
SEC2000 Operating Manual
2. SEC2000
2-1. Composition
Product: SEC2000 spectra system
Power source: 12 V adaptor/ input free volt
Interface cable: USB cable
Software: Visual Spectra 2.1
2-2. Specifications
<Table 2-2-1>
Platform
Optical design
Grating
Detector
Slit
Resolution
Portable size (35 x 98 x 250 mm)
Diffraction grating (symmetrical optical bench)
Compact design
Standard 600 lines/mm
Blazed at 500 nm (VIS/NIR), 400 nm (UV/VIS)
2,048 element linear silicon CCD array
14 m x 200 m per element
Sensitivity: 86 photons/count
Well depth: 16,000 photons
Supply voltage: 5V DC (supply with USB port)
Integration time: 1 msec ~ 10 sec
Maximum clock frequency: 2 MHz
Current consumption: 10 mA
Standard 50 m (in width)x1 mm
0.8 ~ 8 nm FWHM (standard 2.3 nm)
Fiber optic connector
SEC2000 Spectra System
www.als-japan.com
SMA 905
10
Page 11
SEC2000 Operating Manual
3. Installation
3-1. System Requirement
The minimum recommended PC configuration is:
1. CPU :Intel Pentium 4 1.5Ghz / AMD XP 1500 ; Memory: 2GB (winXP)/3GB (win7
32bit)/8GB (win7 64bit)
2. Operating system (OS): windows XP(service pack 3)、windows 7 (service pack 1)
3-2. Software & Diver Installation
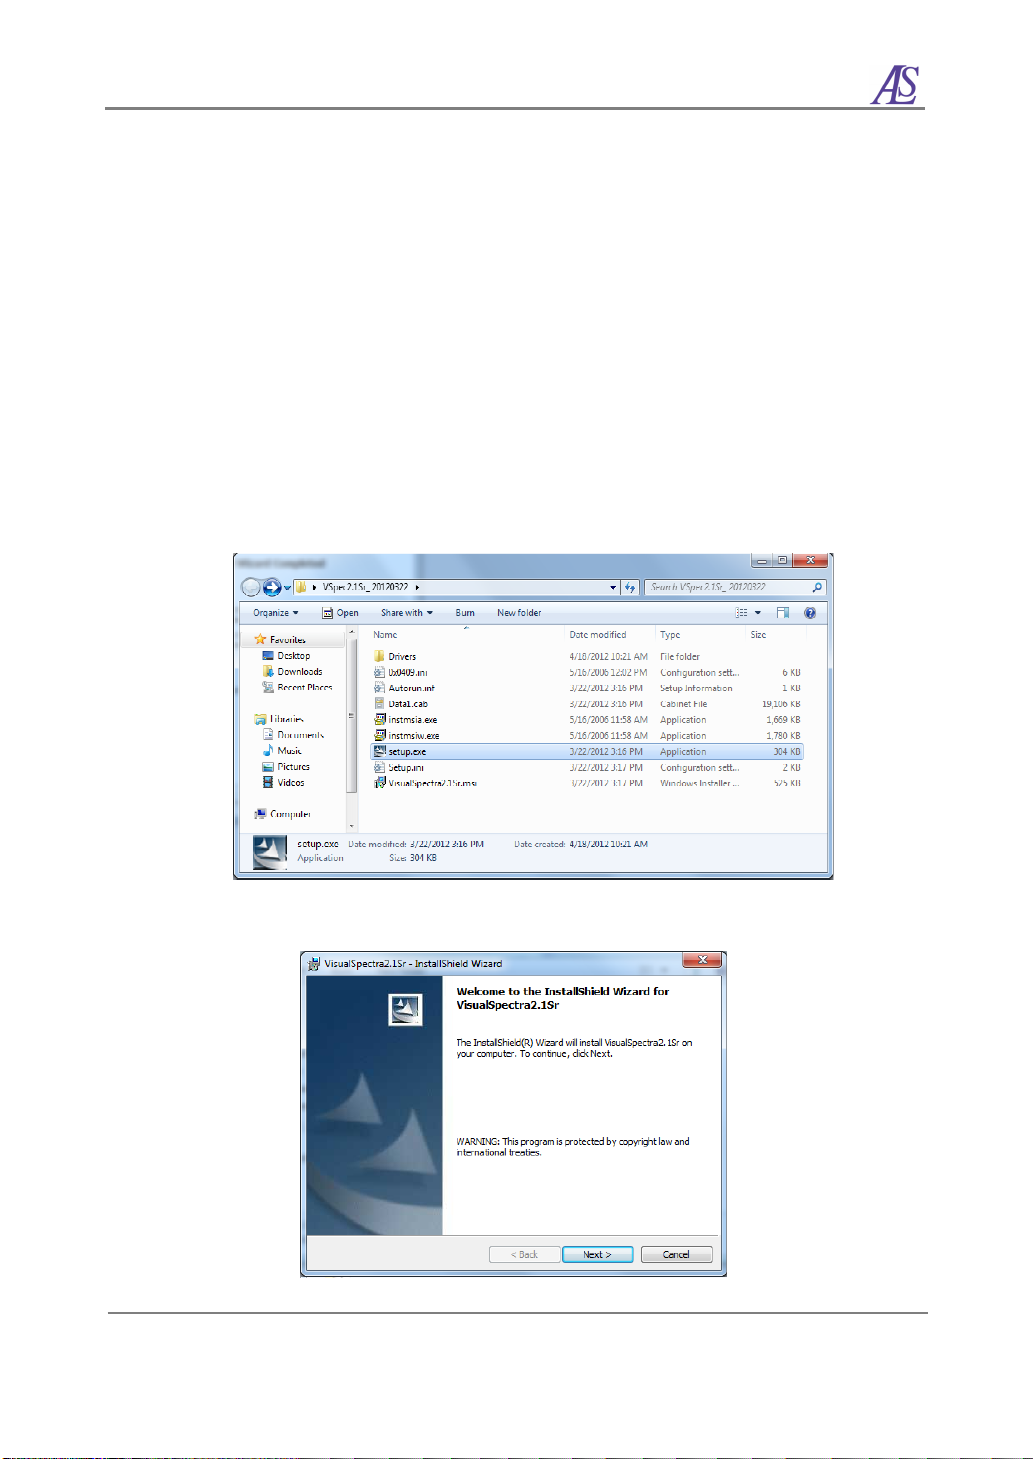
Open the VSpec2.1Sr software folder and click setup.exe as shown in Fig.3-2-1. Follow the
instructions of the setup program.
<Fig. 3-2-1>
First click Next in the window shown in Fig. 3-2-2.
<Fig. 3-2-2>
SEC2000 Spectra System
www.als-japan.com
11
Page 12
SEC2000 Operating Manual
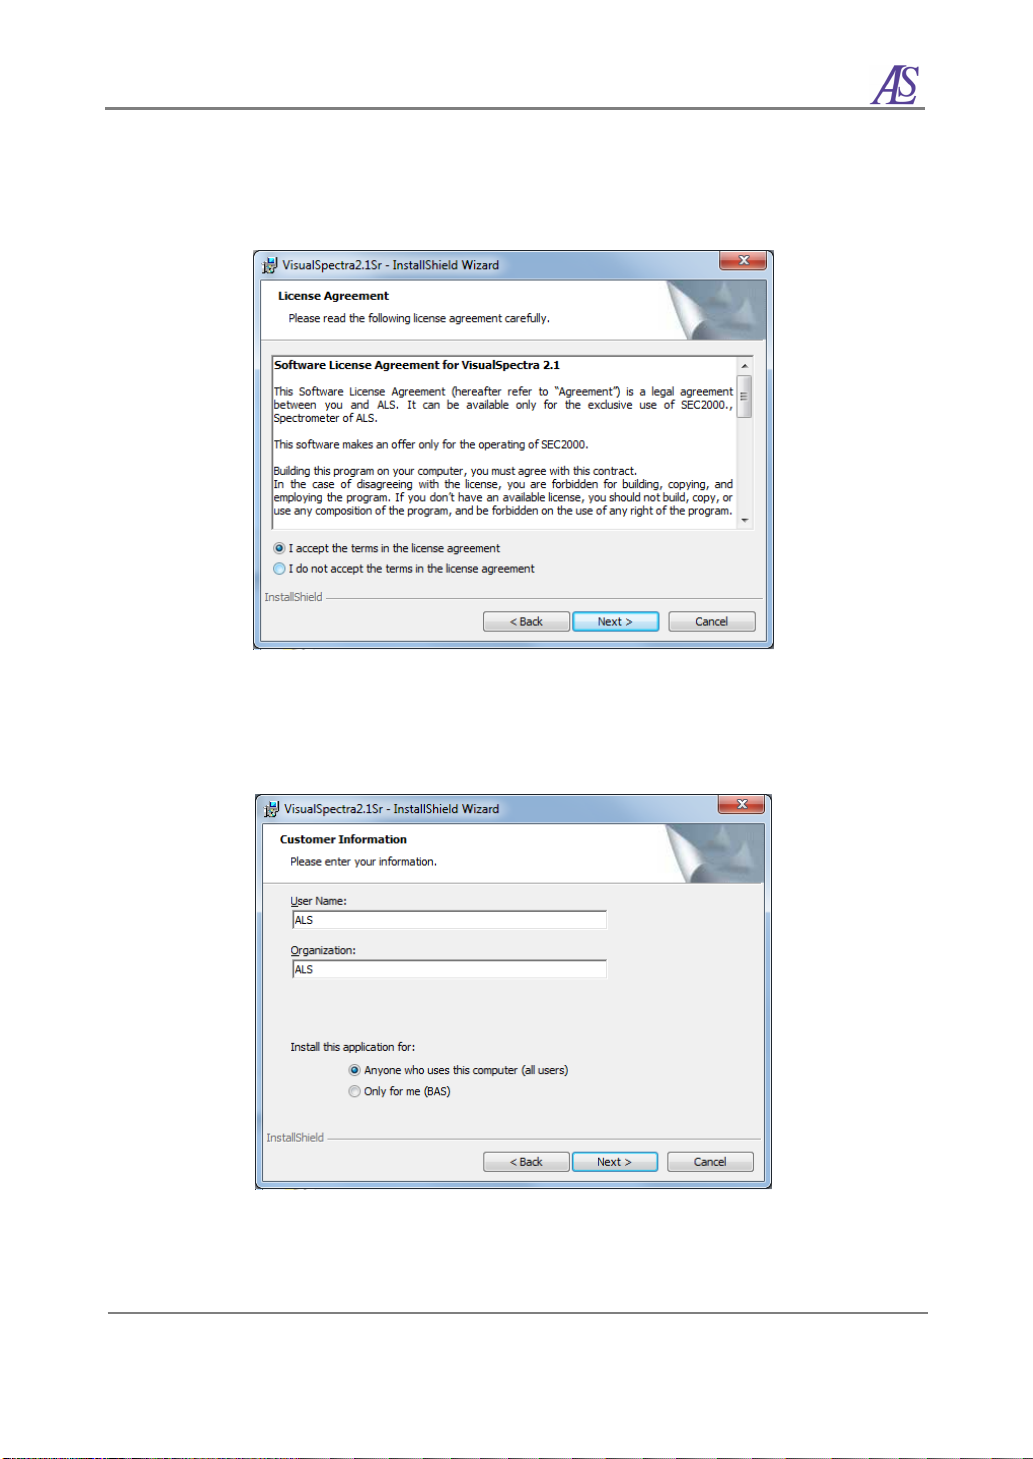
When you have finished reading the License Agreement, select I accept the terms in the
license agreement and click Next ( Fig. 3-2-3).
<Fig. 3-2-3>
Fill in the User Name and Organization, you can use the option to make this program
available to everyone or personal. Click Next to move on.
<Fig. 3-2-4>
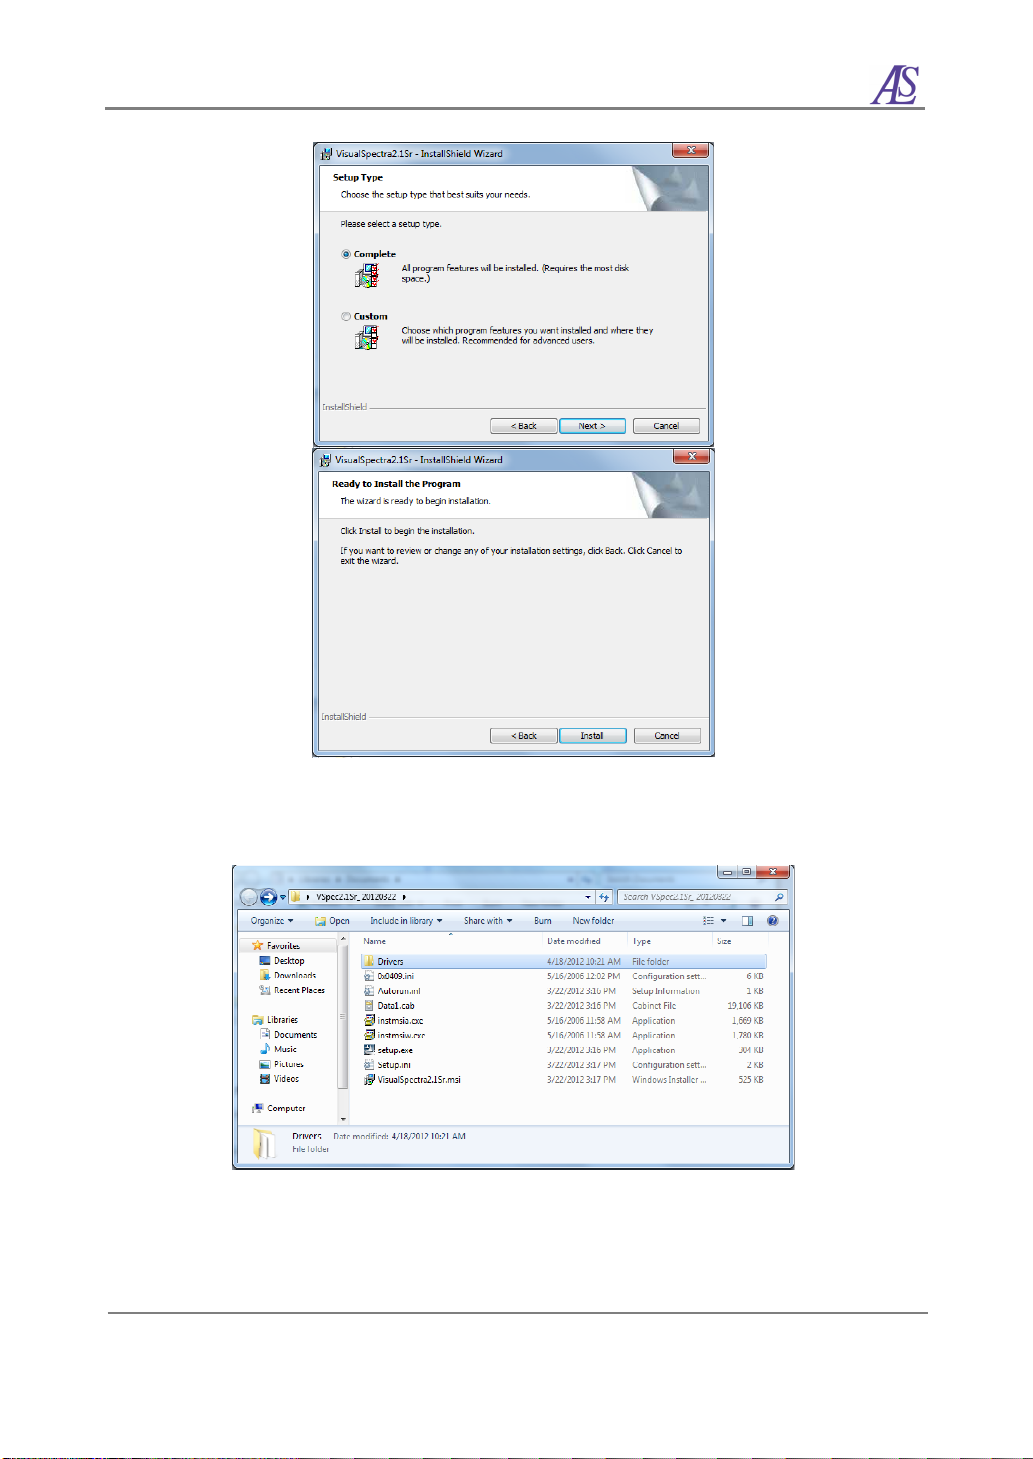
Please select the Complete setup type, and click Next. If you are satisfied with your
installation, select Install. The icon of Visual Spectra 2.1 is created on your computer screen.
SEC2000 Spectra System
www.als-japan.com
12
Page 13
SEC2000 Operating Manual
<Fig. 3-2-5>
Next, you should install the diver of the hardware. Open the Divers folder from the
VSpec2.1Sr software source folder.
<Fig. 3-2-6>
SEC2000 Spectra System
www.als-japan.com
13
Page 14
SEC2000 Operating Manual
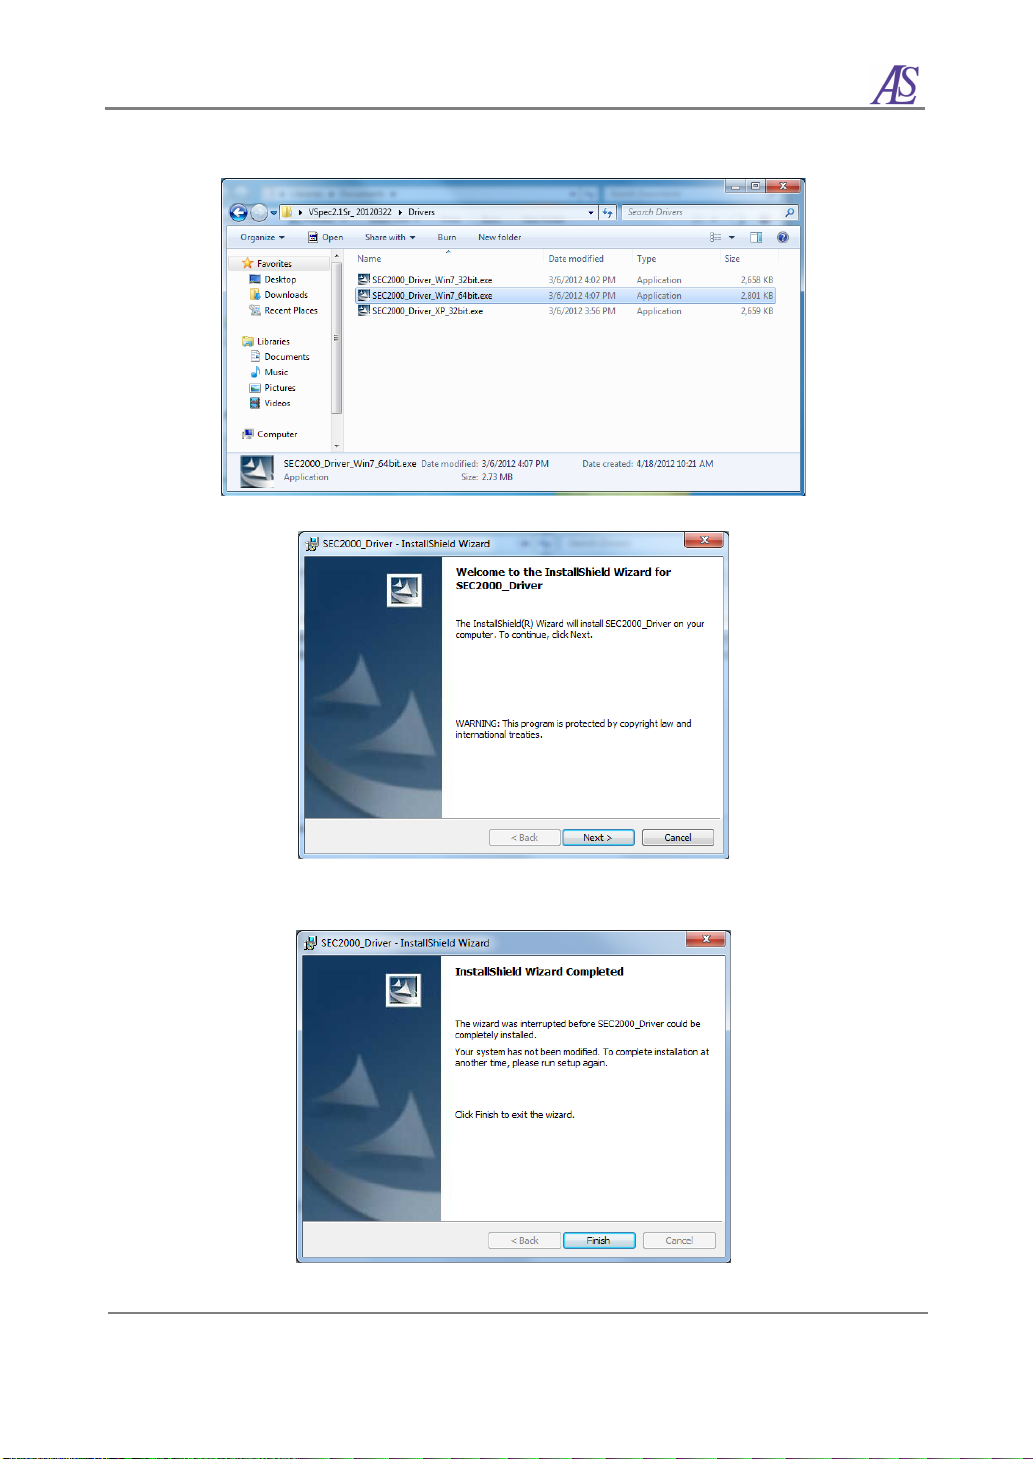
Select the suitable diver and click the program, follow the InstallShield Wizard to install the diver.
<Fig. 3-2-7>
<Fig. 3-2-8>
Clicking Finish to complete installation of the diver as shown in Fig 3-2-9.
<Fig. 3-2-9>
SEC2000 Spectra System
www.als-japan.com
14
Page 15
SEC2000 Operating Manual
3-3. Connect SEC2000 to the PC
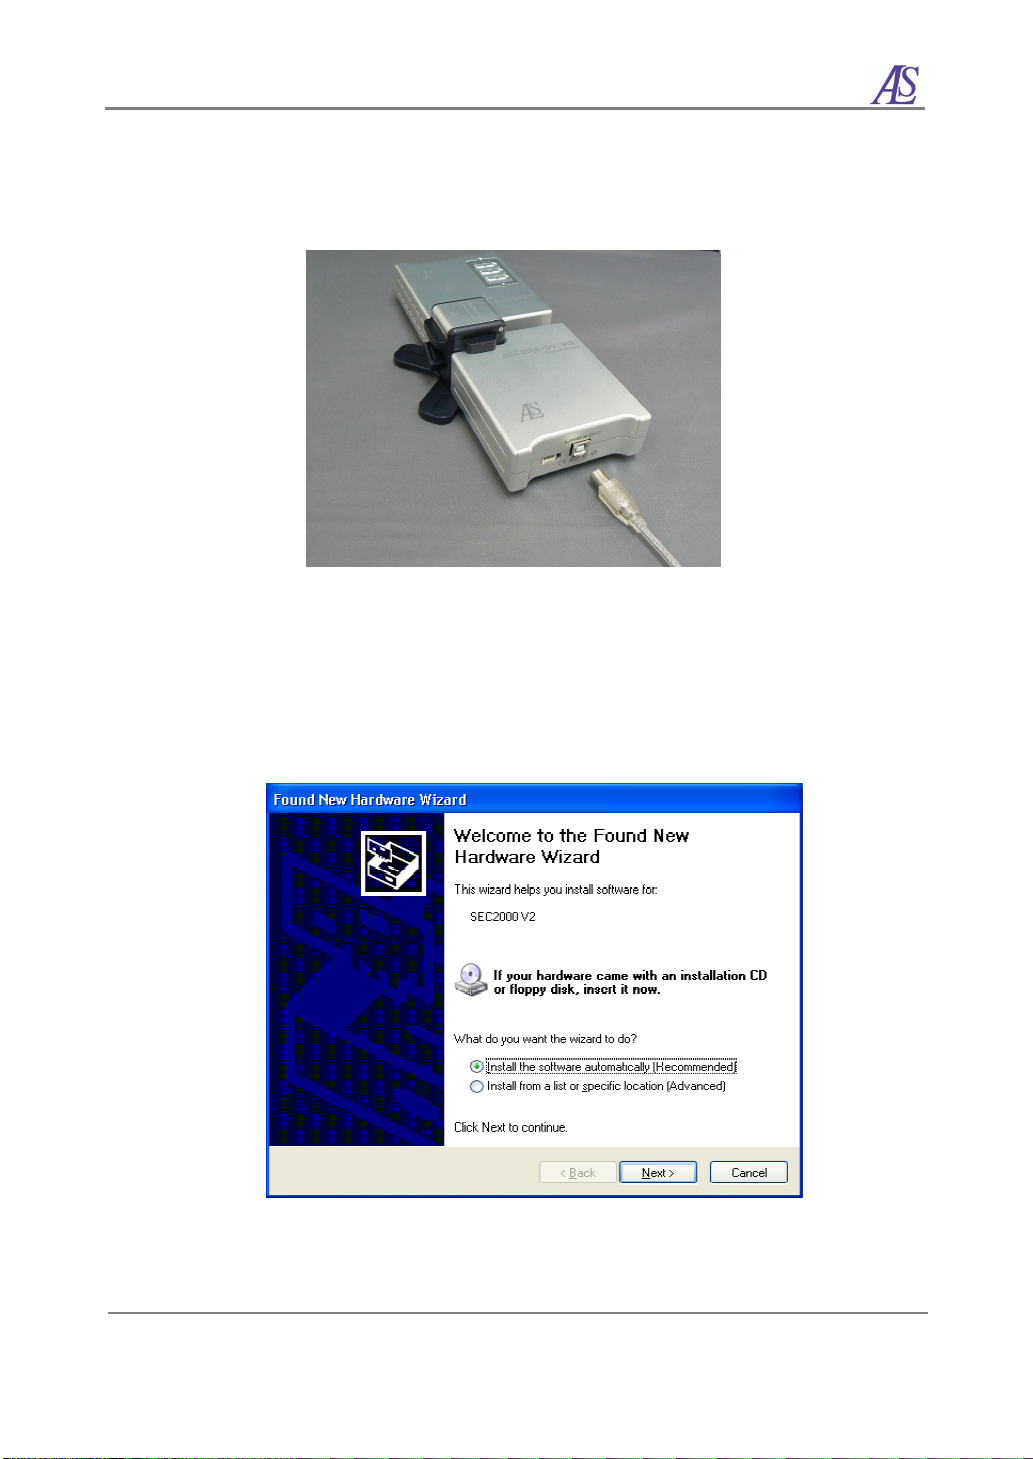
Using the enclosed USB cable, connect SEC2000 to the PC as shown in Fig.3-3-1.
<Fig. 3-3-1>
3-3-1. Windows XP
The computer automatically recognizes the USB interface. In the Found New
Hardware Wizard screen, check Install the software automatically
(Recommended) and click the Next.
<Fig. 3-3-2>
SEC2000 Spectra System
www.als-japan.com
15
Page 16
SEC2000 Operating Manual
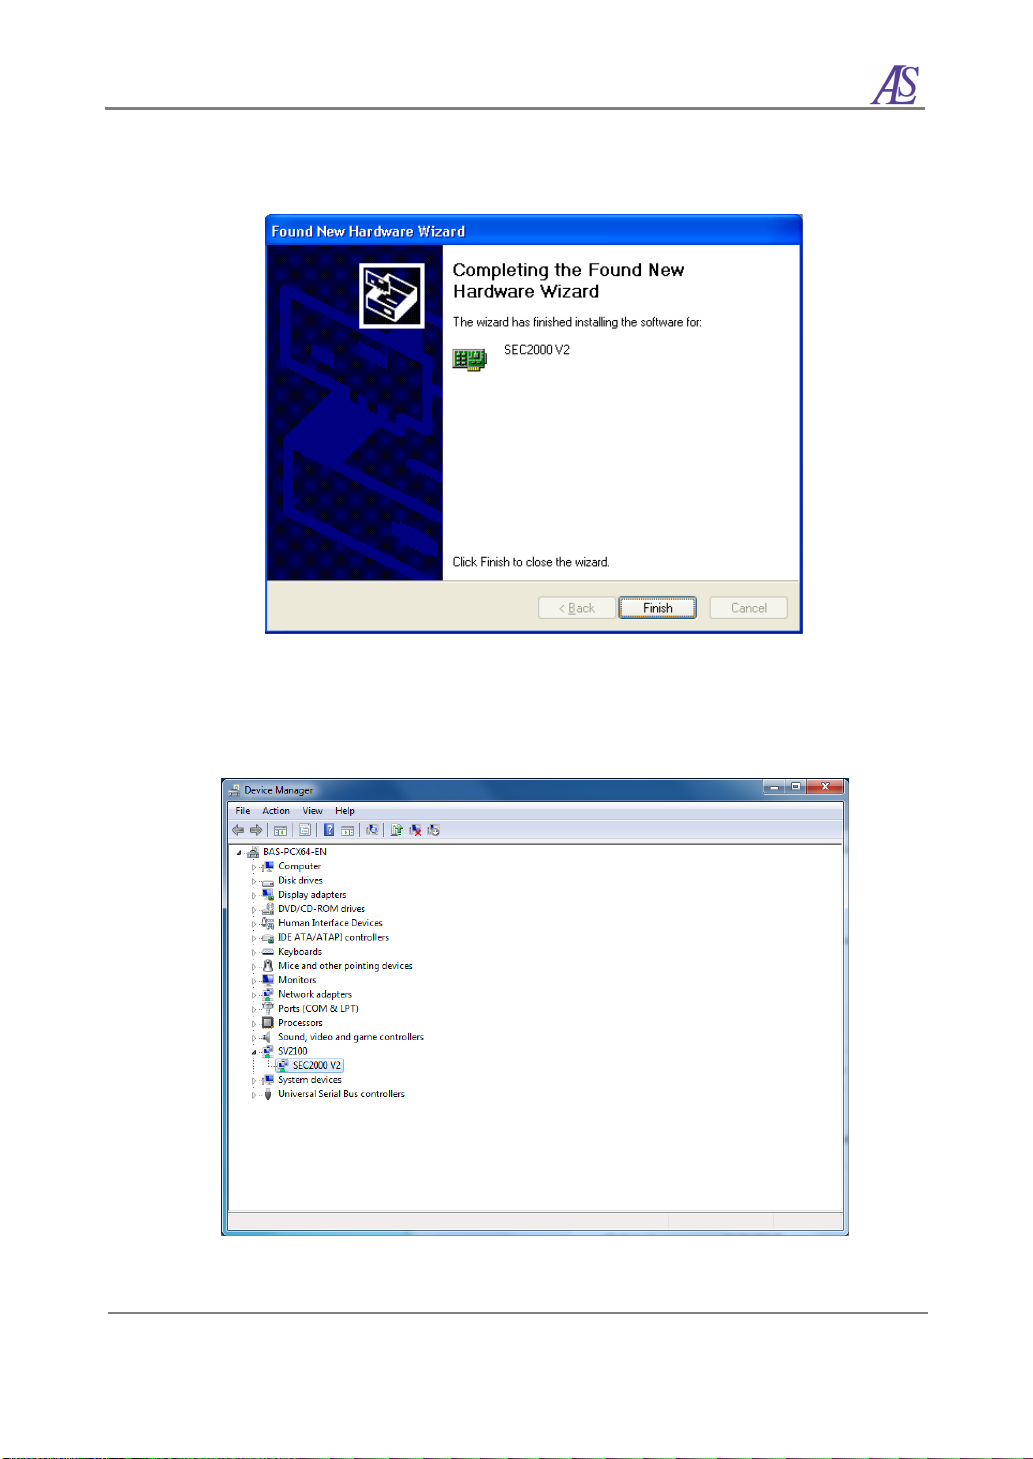
When the Hardware installation is completed, click the Finish.
<Fig. 3-3-3>
3-3-2. Windows 7
The PC will recognize SEC2000 and you can start to operate the spectrometer.
<Fig. 3-3-4>
SEC2000 Spectra System
www.als-japan.com
16
Page 17
SEC2000 Operating Manual
4. Operation
4-1. Connection
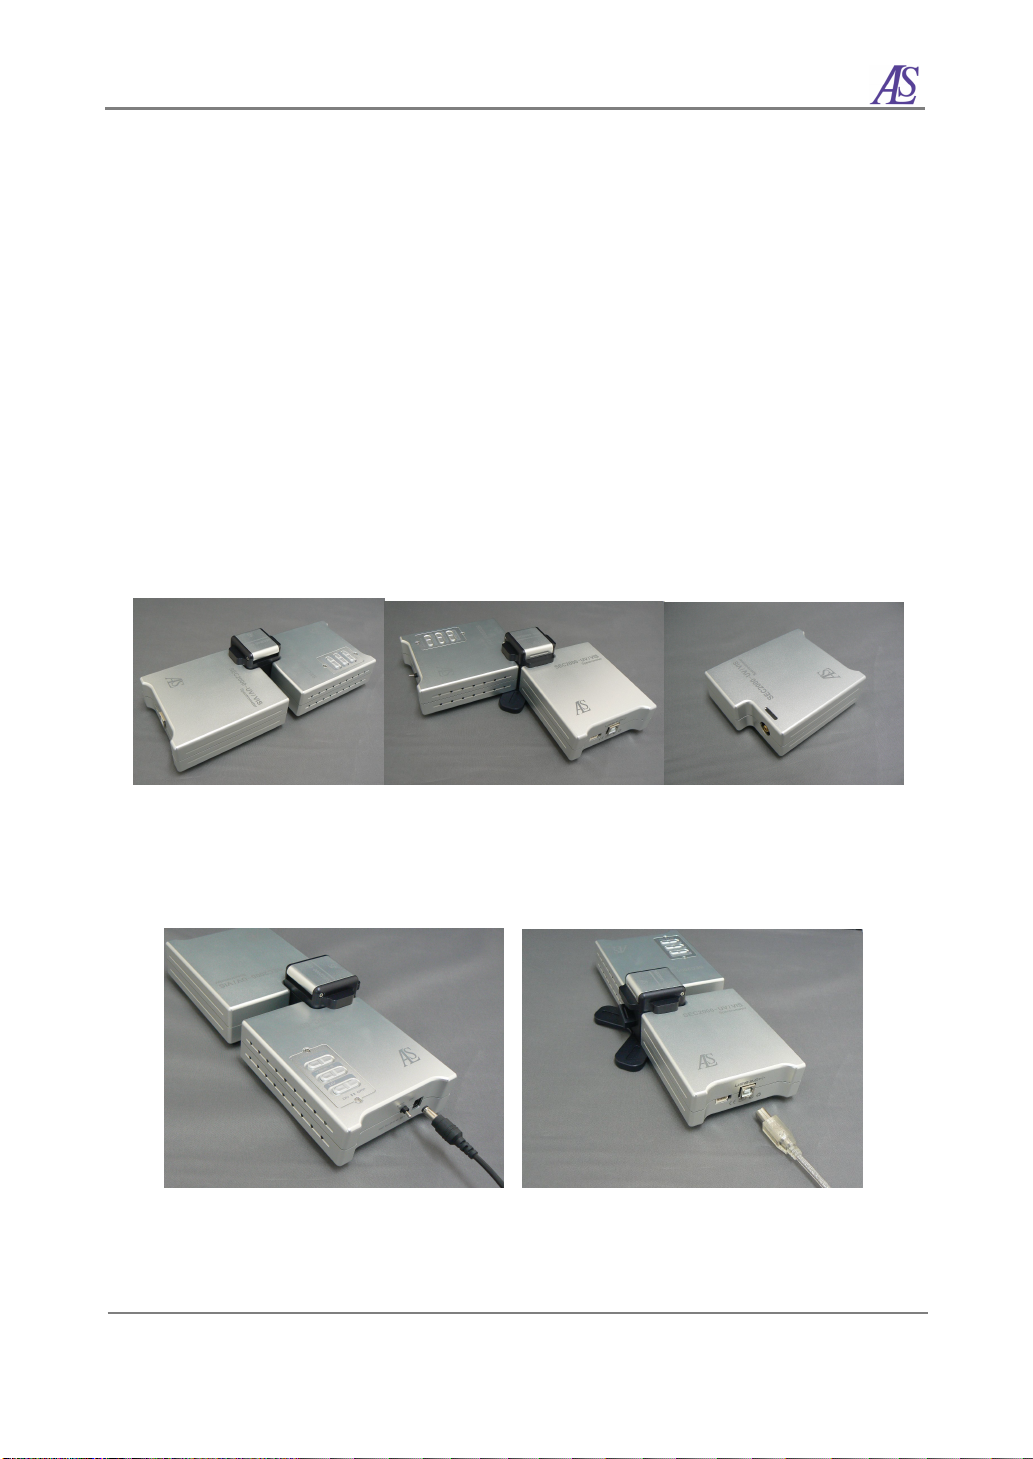
SEC2000 consists of a light source, cuvette holder, detector and other accessories. The
pre-set mode is for measuring absorbance or transmittance. It looks like a straight bar in
the order of light source, cuvette holder, and detector, as shown in Fig. (a). To measure
a reflectance spectrum, reconfigure it, as shown in Fig. (b). To measure an irradiance
spectrum, remove light source, as shown in Fig. (c) of Fig. 4-1-1.
Note: When changing the combination of the device, the position of the light source and
detector are also changed slightly. The spectral shape of the light source in Scope mode
may be changed, due to changes of the intensity of the UV lamp and the VIS lamp. This
will not affect the measurement.
(a) (b) (c)
<Fig. 4-1-1>
Connect the Spectra System detector to a USB interface of the computer using the enclosed
USB cable and plug in the enclosed electrical cord to Light Source. Then turn on the light.
<Fig. 4-1-2>
SEC2000 Spectra System
www.als-japan.com
17
Page 18
SEC2000 Operating Manual
4-2. Program Start
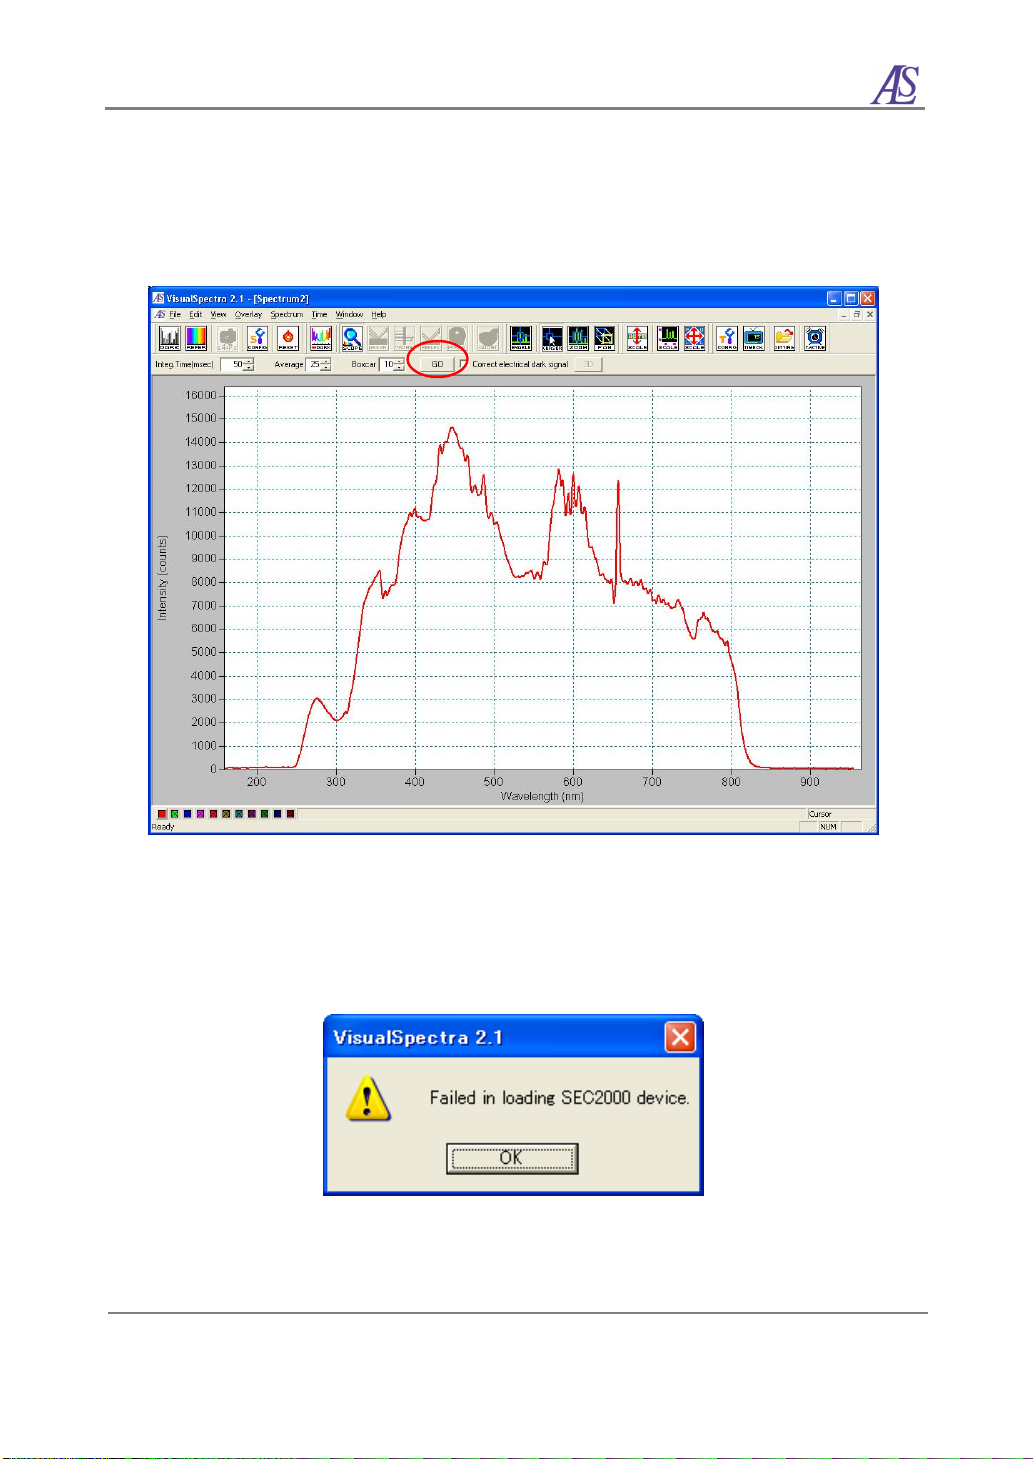
Start the Visual Spectra 2.1 program and click the GO icon. The trace line will appear, when
the Spectrometer (SEC2000) has been connected properly with the computer.
<Fig. 4-2-1>
If the Spectra System driver is not installed properly or the USB connection fails between
Spectra System and your computer, Failed in loading SEC2000 device message will
appears. In this case, check the USB connection or reinstall the USB driver.
<Fig. 4-2-2>
SEC2000 Spectra System
www.als-japan.com
18
Page 19
SEC2000 Operating Manual
on
4-3. Software Operation
4-3-1. Menu Descriptions
From the Main Menu bar, the following selections will produce the following drop-down
options.
① File
- Open
Dark (Ctrl+D) A Dark spectrum (*. dark) is read and displayed on Overlay1.
Sample Dark
Reference (Ctrl+R)
Sample (Ctrl+O)
Processed
Settings
- Save
Dark Save the current dark spectrum as a file (*.dark).
Sample Dark Save the current sample dark spectrum as a file (*.spldark)
Reference Save the current reference spectrum as a file (*. refer).
Sample Save the Master Trace’s data as a file (*.sample).
A sample dark spectrum (*.spldark) is read and displayed on
Overlay1.
A reference spectrum (*.refer) is read and displayed on Overlay
2.
A sample spectrum (*.sample) is read and displayed
Master Trace.
Read the processed (absorbance/ transmittance/ irradiance)
spectrum to Master Trace.
It is activated when the dark and reference spectra are opened.
Set for a measuring spectrum and read the graphical view
setting file (*.ini).
Save the Master Trace’s data to file (processed spectrum,
Processed
Establish
environment
SEC2000 Spectra System
www.als-japan.com
saved as *.absorb/ *.trans/ *.irrad.).
It is activated when the dark and reference spectra are saved.
Establish environment for a measuring spectrum and save the
graphical view setting file (*.ini).
19
Page 20
SEC2000 Operating Manual
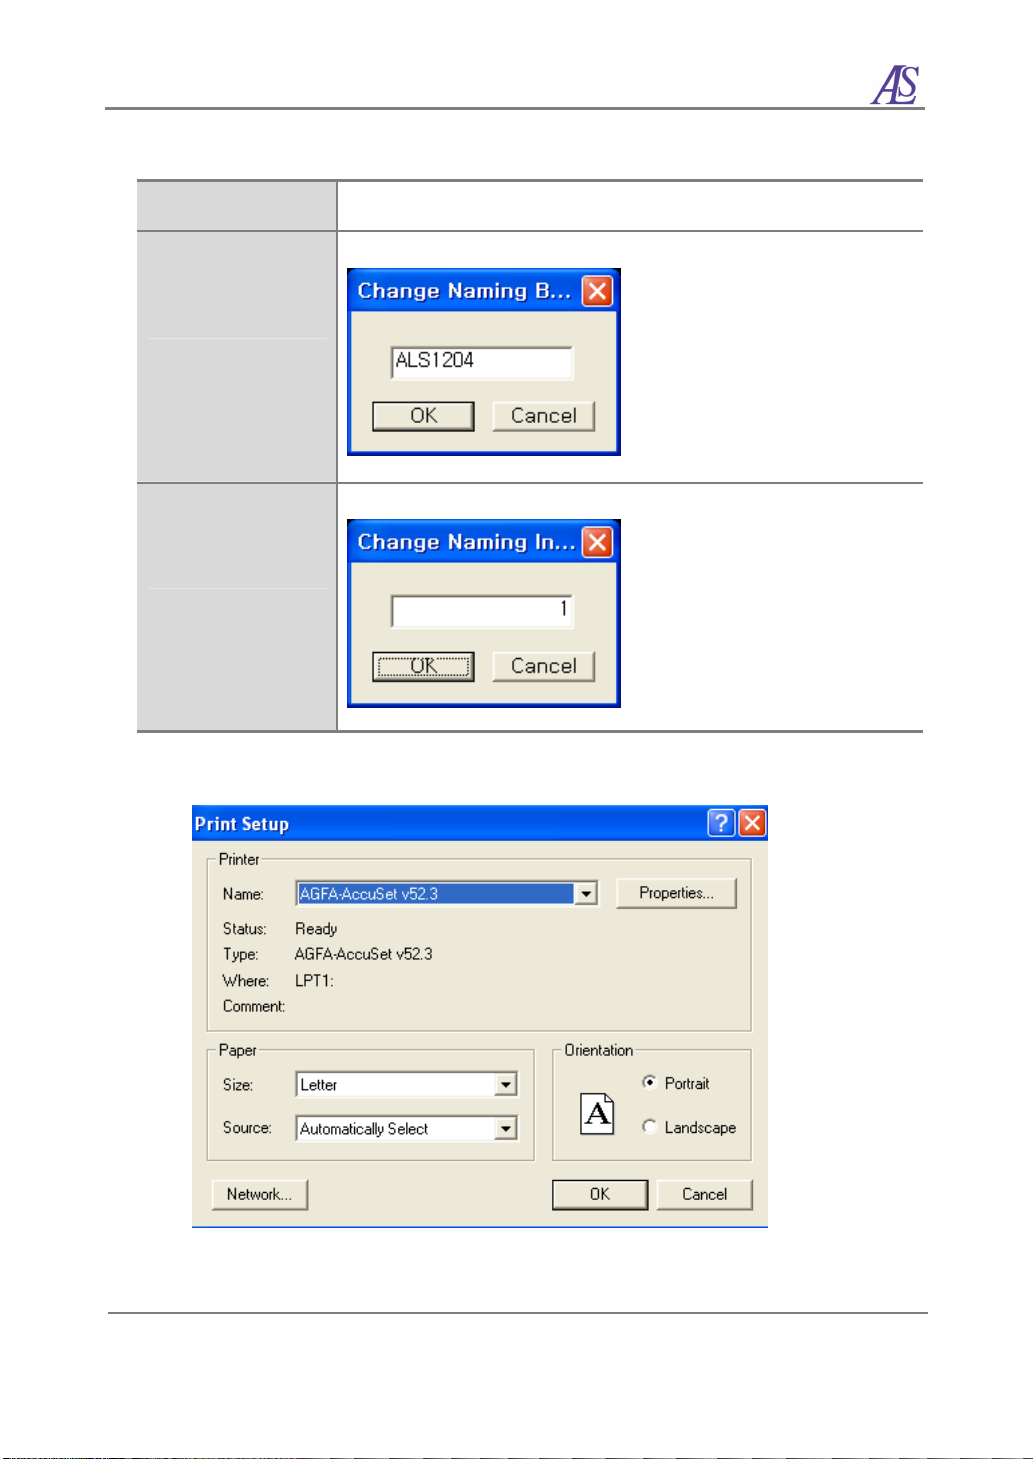
- Auto Increment
Enable
Base Name
Starting Index
Generates a filename automatically for saved spectra.
Set the base name for auto incremented files.
Ex. of file name: ALS1204,date→20110112, etc.
Set the starting index for auto incremented files.
Ex. of file name: ALS1204-1, ALS1204-2, etc.
- Print Setup Select and configure a printer for graphical spectrum printing
<Fig. 4-3-1>
SEC2000 Spectra System
www.als-japan.com
20
Page 21
SEC2000 Operating Manual
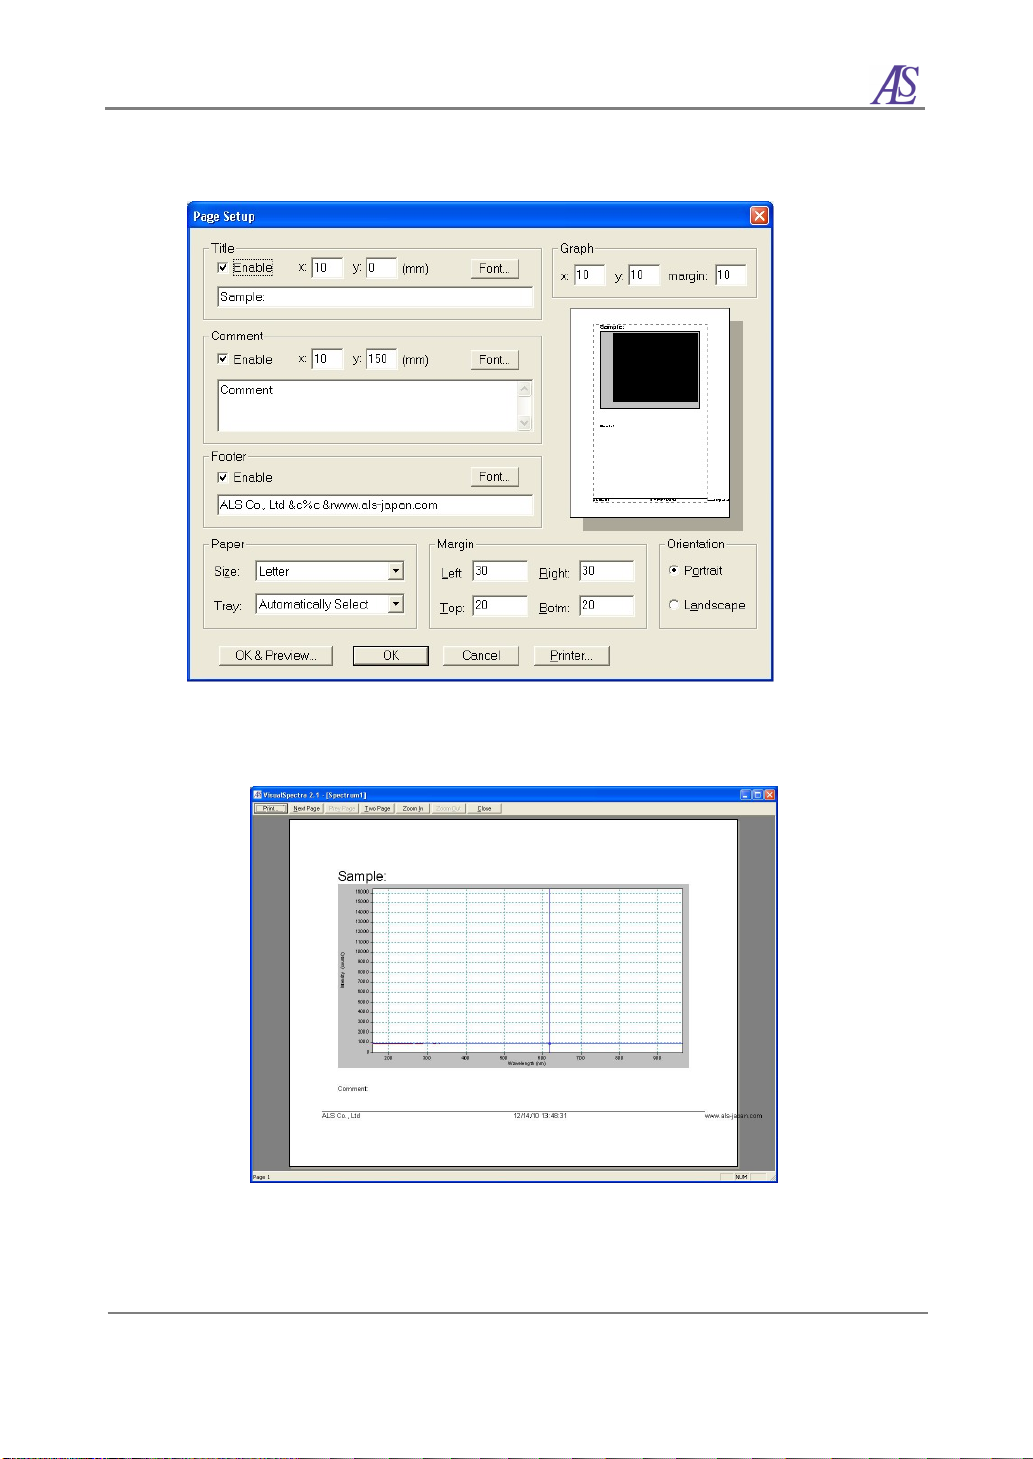
- Page Setup Write Title, Comment and Footer for printing graphical spectrum.
<Fig. 4-3-2>
- Print Preview Preview the graphical spectra printing.
<Fig. 4-3-3>
- Print (Ctrl+P) Print current graphical spectra.
- Exit End program.
SEC2000 Spectra System
www.als-japan.com
21
Page 22
SEC2000 Operating Manual
② Edit
- Copy Graph (Ctrl+C) Copy current graphical spectrum to a temporary site.
- Copy Data Copy current data to a temporary site.
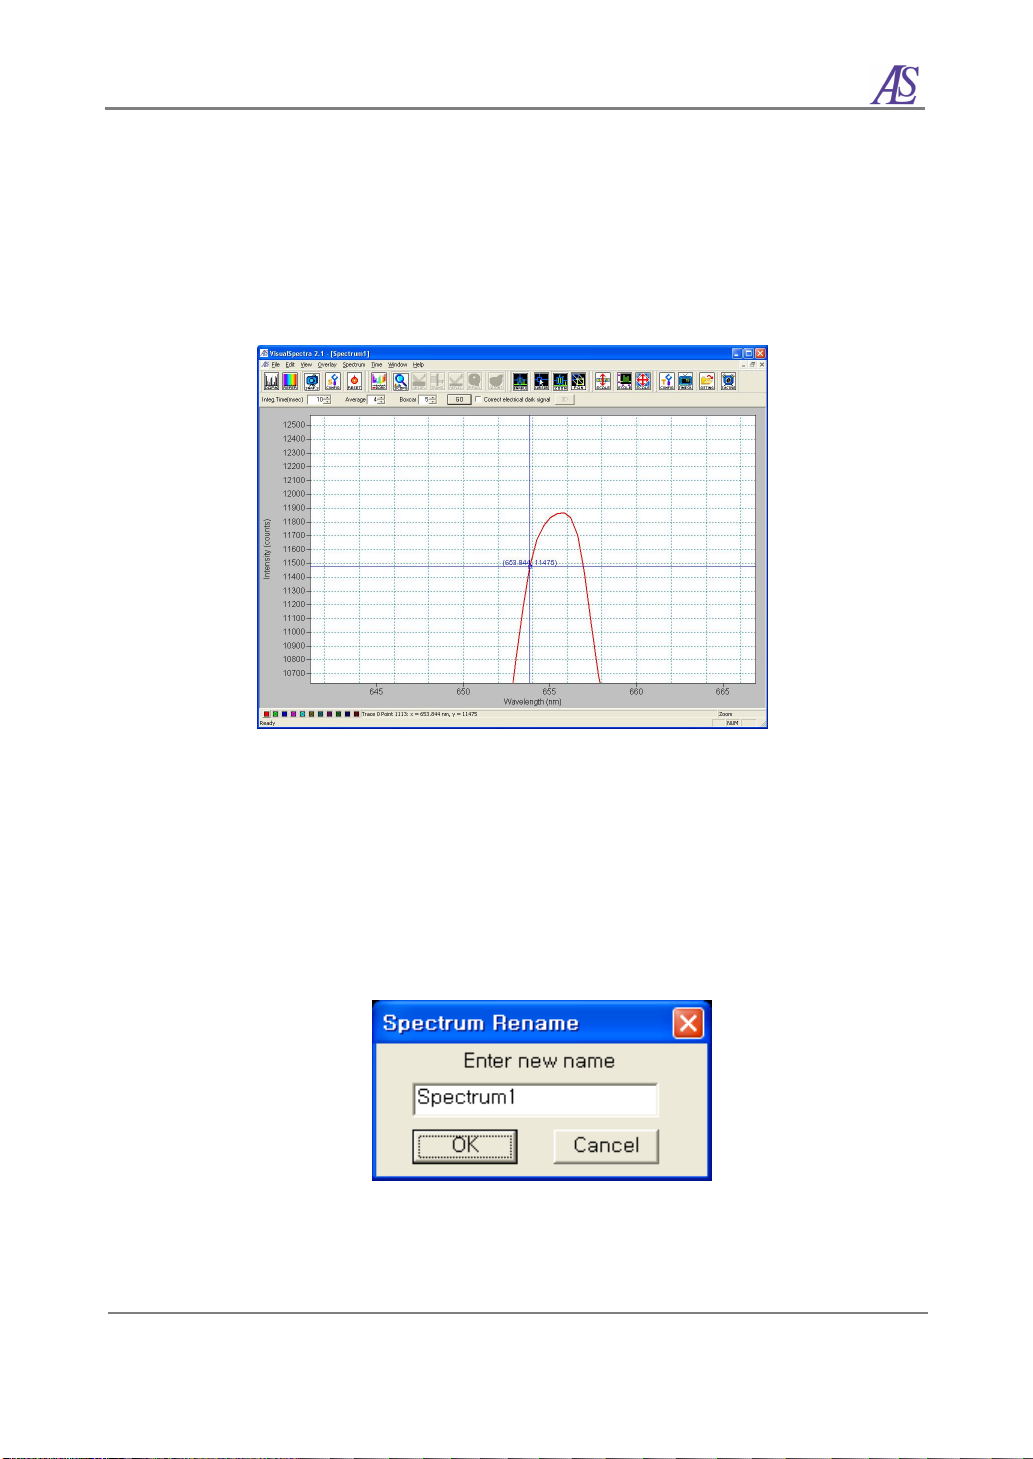
- Add Marker (Ctrl+A) Make a marker for current graphical spectrum.
<Fig. 4-3-4>
- Erase Marker (Ctrl+E) Erase a maker that is located near a current cursor.
- Erase All Markers Erase all markers.
③ View
- Rename Window Rename a graphical spectrum window.
<Fig. 4-3-5>
SEC2000 Spectra System
www.als-japan.com
22
Page 23
SEC2000 Operating Manual
- Mouse Tracking
Cursor
Zoom
Pan
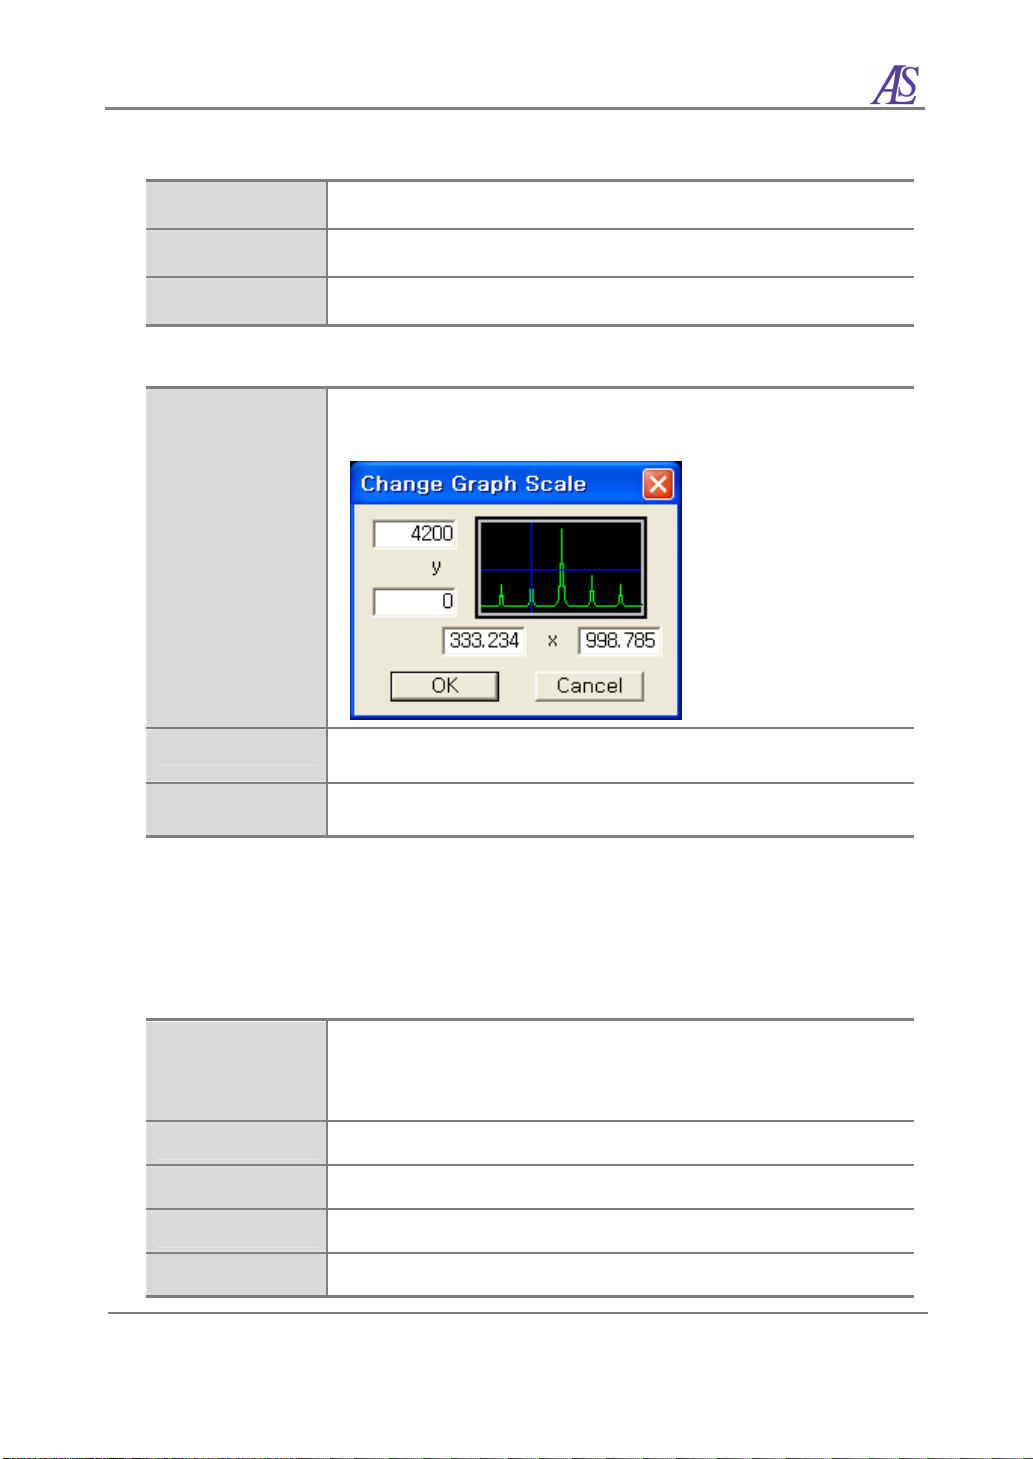
- Spectrum Scale
Auto Scale
Change Scale
Change mouse status to cursor.
Change mouse status to Expand/Reduce.
Change mouse status to drawing.
Adjusts the scale of the spectrum in the current spectral
window so that the peaks fill the display vertically.
Adjusts the scale of the spectrum optionally.
Full Scale
- Cursor Display Enable or disable the display of cursor for the spectral window.
- Grid Display Enable or disable the display of grid for the spectral window.
- Marker Display Enable or disable the display of maker for the spectral window.
- Color
Trace
Background
Frame
Cursor
Grid
SEC2000 Spectra System
www.als-japan.com
Adjusts the scale for all data to be displayed.
Master: Choose a master color for the spectral windows.
Overlay1~10: Choose each overlay for the spectral windows.
Choose a background color for the spectral window.
Choose a frame color for the spectral window.
Choose a cursor color for the spectral window.
Choose a grid color for the spectral window.
23
Page 24
SEC2000 Operating Manual
Text
Tick
Marker
Default
- Main Status bar Toggle the status bar display in the main visual spectral
- Spectrum Tool bar Toggle the tool bar display in the main visual spectral
Choose a text color for the spectral window.
Choose a tick color for the spectral window.
Choose a marker color for the spectral window.
Return all colors to the original.
window.
window.
<Fig. 4-3-6>
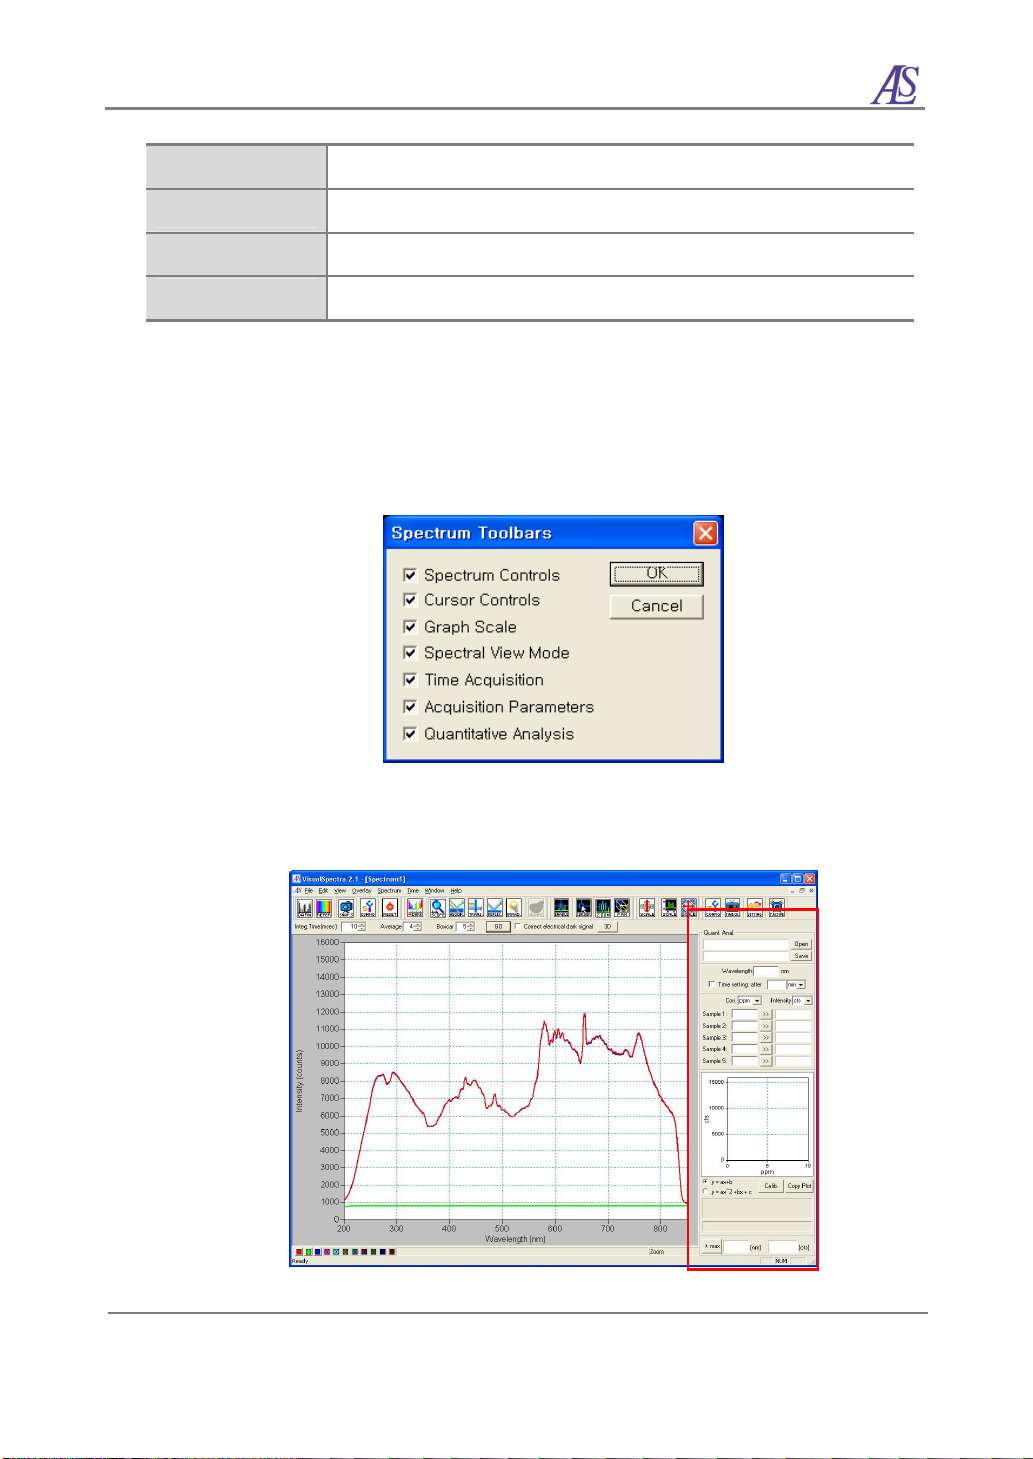
If the“Quantitative Analysis” is checked, the window will be displayed on the right
side of the main window as below figure.
<Fig. 4-3-7>
SEC2000 Spectra System
www.als-japan.com
24
Page 25
SEC2000 Operating Manual
④ Overlay
- Spectrum
- Time Series
- Add Overlay 1 ~ 10 Display the data for each spectral window (1 ~ 10).
- Clear Clear selected overlay data from the spectral window.
- Add Overlays (Multiple Selection) Display several data at the same time.
- Clear All Clear all overlay data from the spectral window.
⑤ Spectrum
- Config. Spectrometer Confirm the parameters of spectrometers for
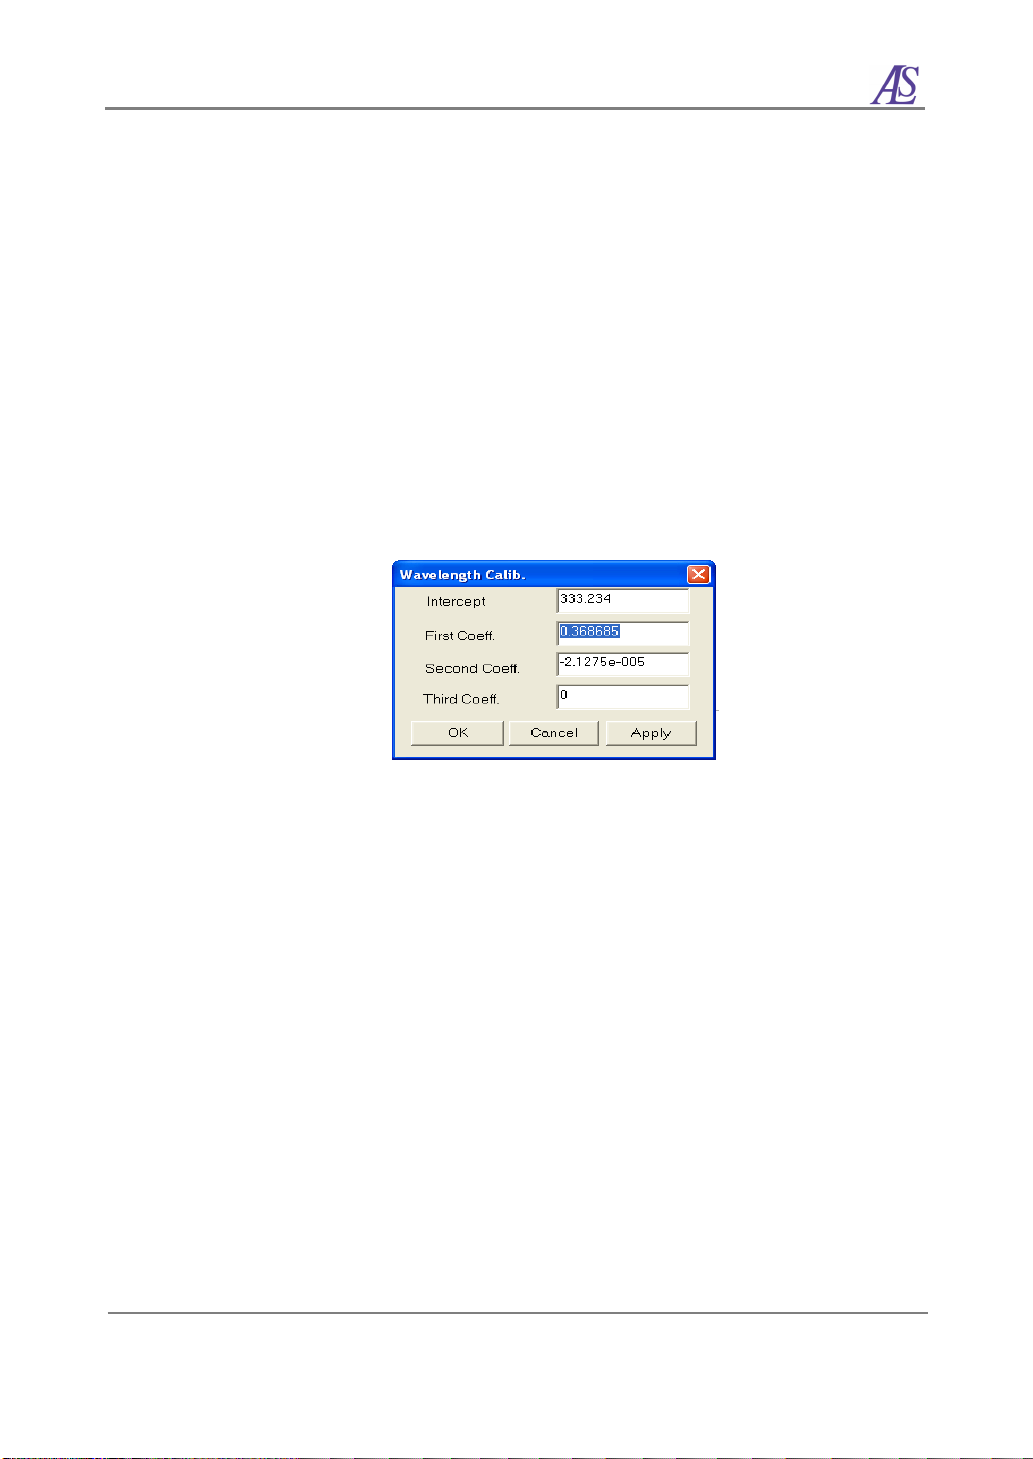
wavelength calibration.
<Fig. 4-3-8>
- Reset Spectrometer This function cannot be used for user.
- Calib. Spectrometer This function cannot be used for user.
- Store Dark Save the spectrum measurement result as dark spectrum to
memory and display on overlay 1.
- Store Reference Save the spectrum measurement result as reference
spectrum to memory and display on overlay 2.
- Snapshot Halt data acquisition and take a snapshot of activity in the
spectral window.
- Scope Mode Present the data in scope mode.
- Scope Mode Minus Dark Switch the current spectral window into scope mode
and subtract the stored dark spectrum.
- Absorbance Mode Display data in absorbance mode. Please save the Dark
and Reference spectra before using this function.
- Transmittance Mode Display data in transmittance mode. Please save the
SEC2000 Spectra System
www.als-japan.com
25
Page 26
SEC2000 Operating Manual
Dark and Reference spectra before using this function.
- Reflectance Mode Display data in reflectance mode. Please save the Dark
and Reference spectra before using this function.
- Relative Irradiance Mode Display data in relative irradiance mode. Please
save the Dark and Reference spectra before using this
function.
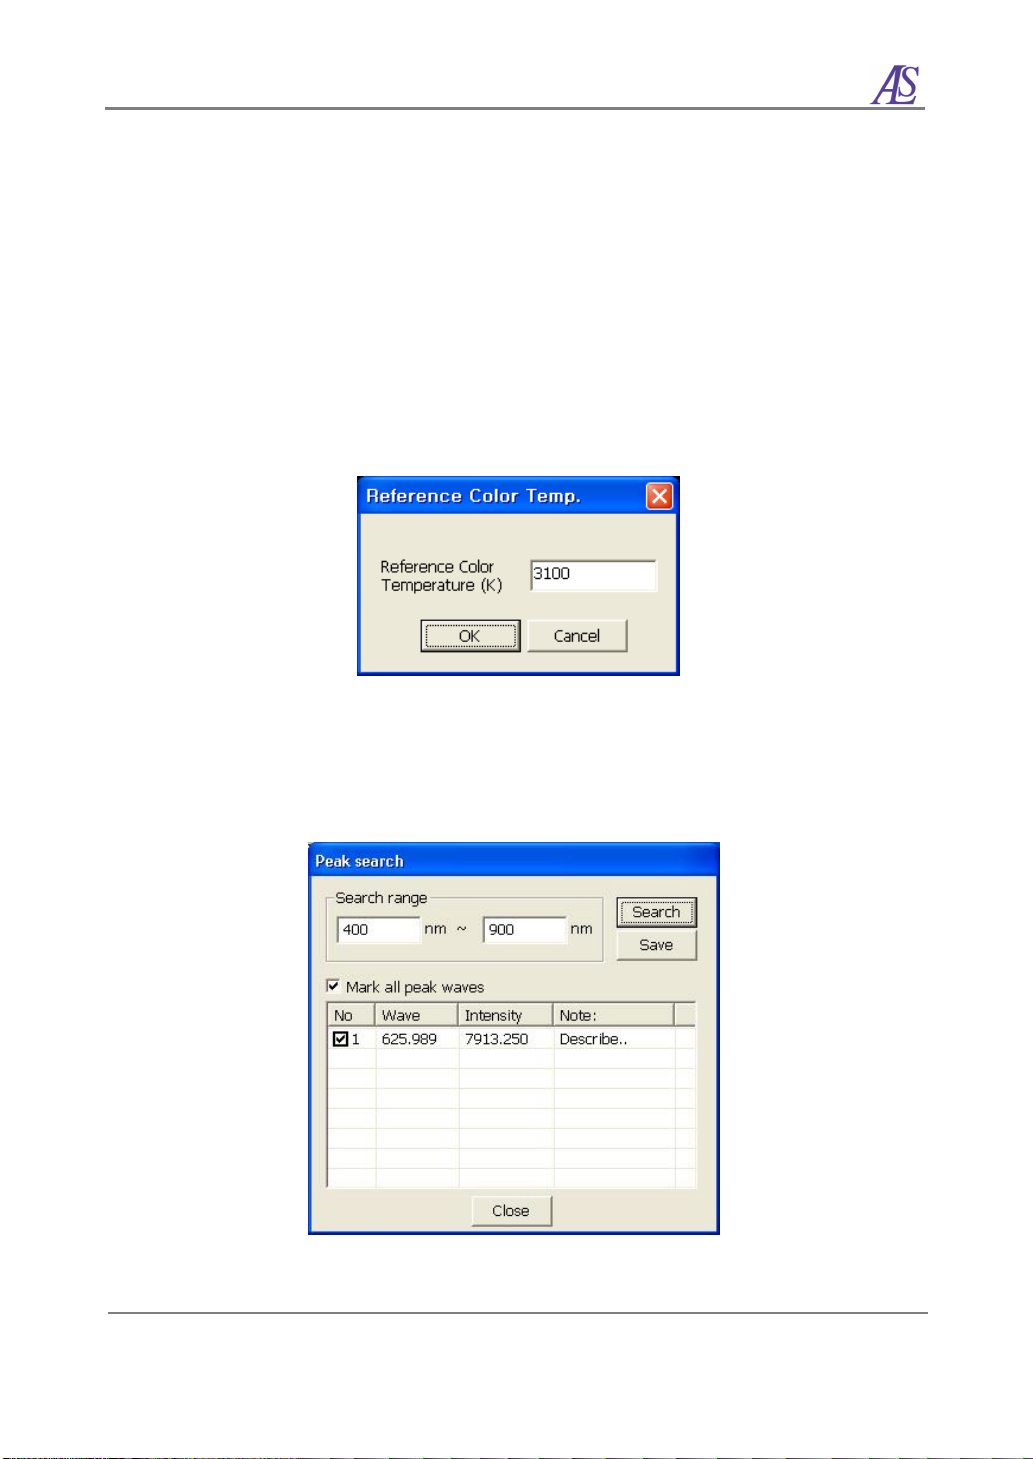
- Reference Color Temp. Input the color temperature (K) of your blackbody
reference lamp used for relative irradiance measurements.
<Fig. 4-3-9>
- Quantitative Analysis It is effective only on absorbance mode.
- Peak Search Search peaks in the specified range. Click Save, the peak data
will be saved as *.csv file.
<Fig. 4-3-10>
SEC2000 Spectra System
www.als-japan.com
26
Page 27
SEC2000 Operating Manual
⑥ Time Time course measurements of the specific wavelength or full spectrum
change is performed.
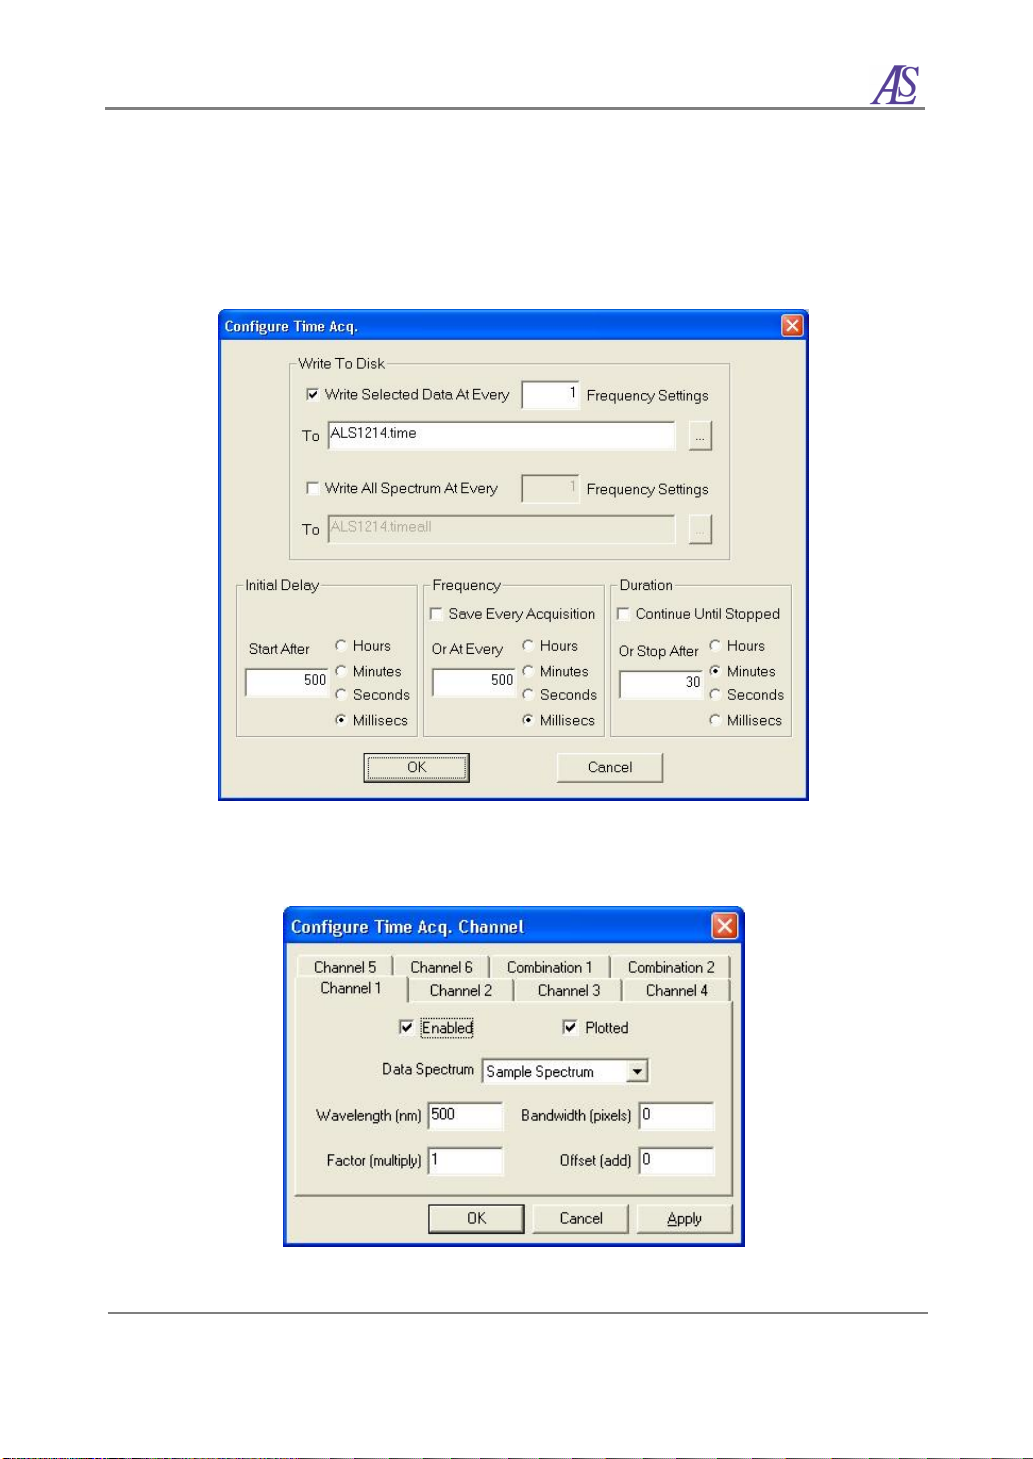
- Configure Time Acquisition Configure and establish the parameters for time
acquisition process.
<Fig. 4-3-11>
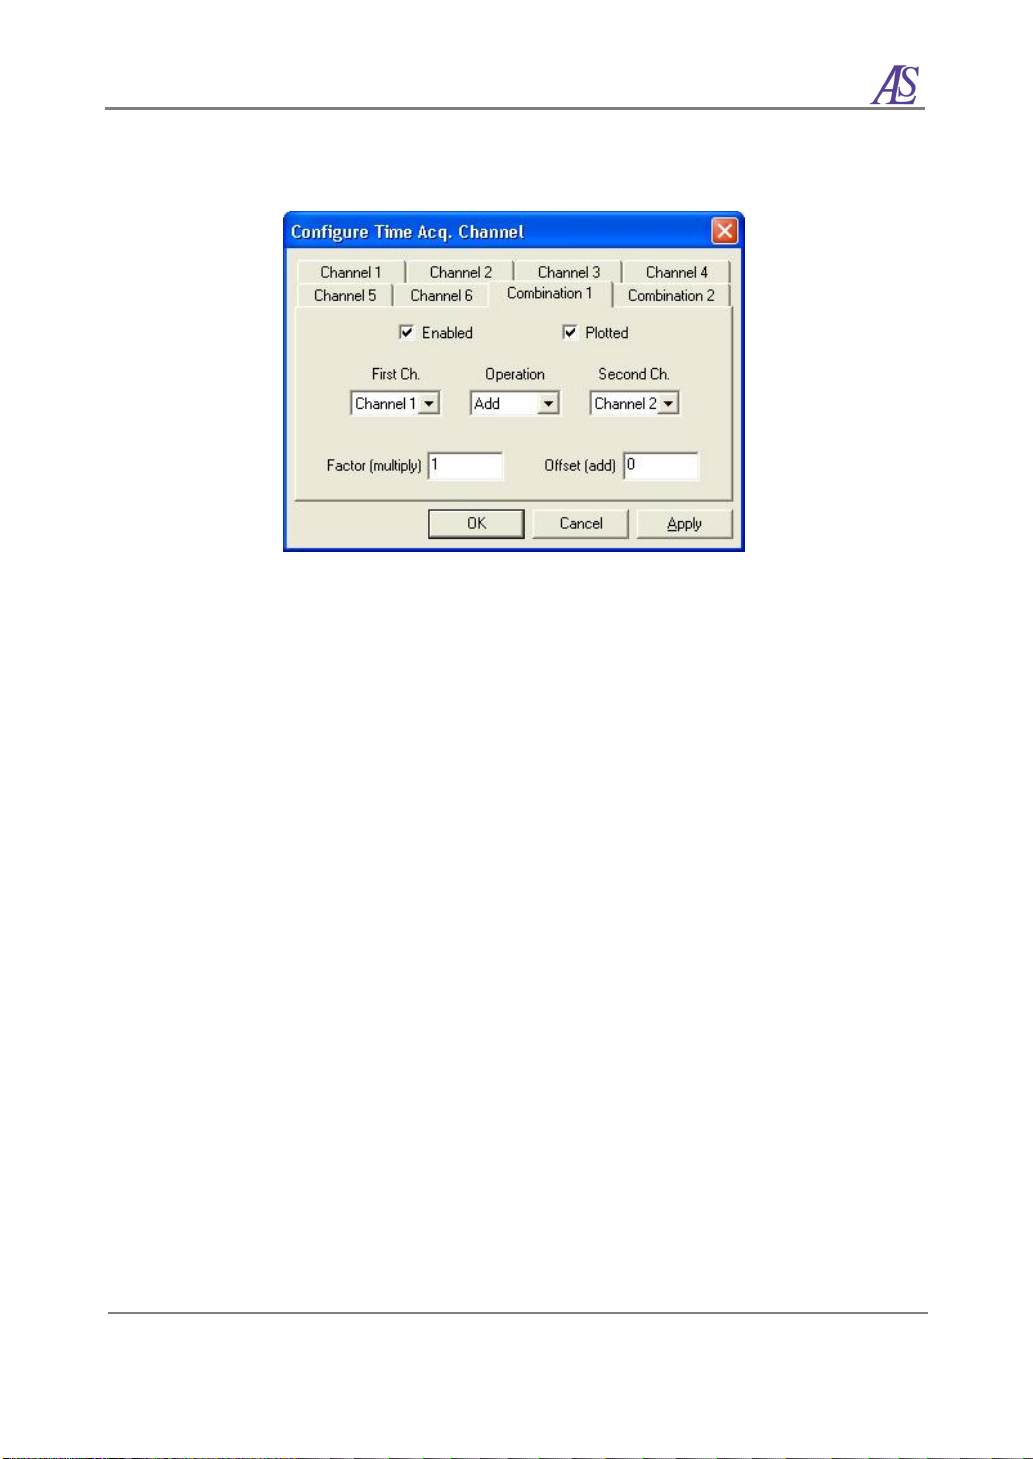
- Configure Time Acq. Channel Set up the channels for time acquisition process.
Six specific wavelengths can be set up from channel 1 to channel 6.
<Fig. 4-3-12>
SEC2000 Spectra System
www.als-japan.com
27
Page 28
SEC2000 Operating Manual
Combination 1 and 2 can perform operation among channel 1 ~ channel 6.
- Restore Parameters
<Fig. 4-3-13>
Select and open a file with the complete set of time acquisition parameters,
including the configuration settings for Time Acq. Channel.
- Save Parameters
Save a complete set of time acquisition parameters, including the configuration
settings for Time Acq. Channel.
- Activate Activate the time acquisition mode.
⑦ Window
- Cascade Arrange all spectral windows in a horizontally overlapping design.
- Tile Arrange all spectral windows side by side.
⑧ Help
- Help Topics Present the user manual for the system.
- About Visual Spectra 2.1 Present the version information of Visual Spectra 2.1.
SEC2000 Spectra System
www.als-japan.com
28
Page 29
SEC2000 Operating Manual
4-3-2. Functions
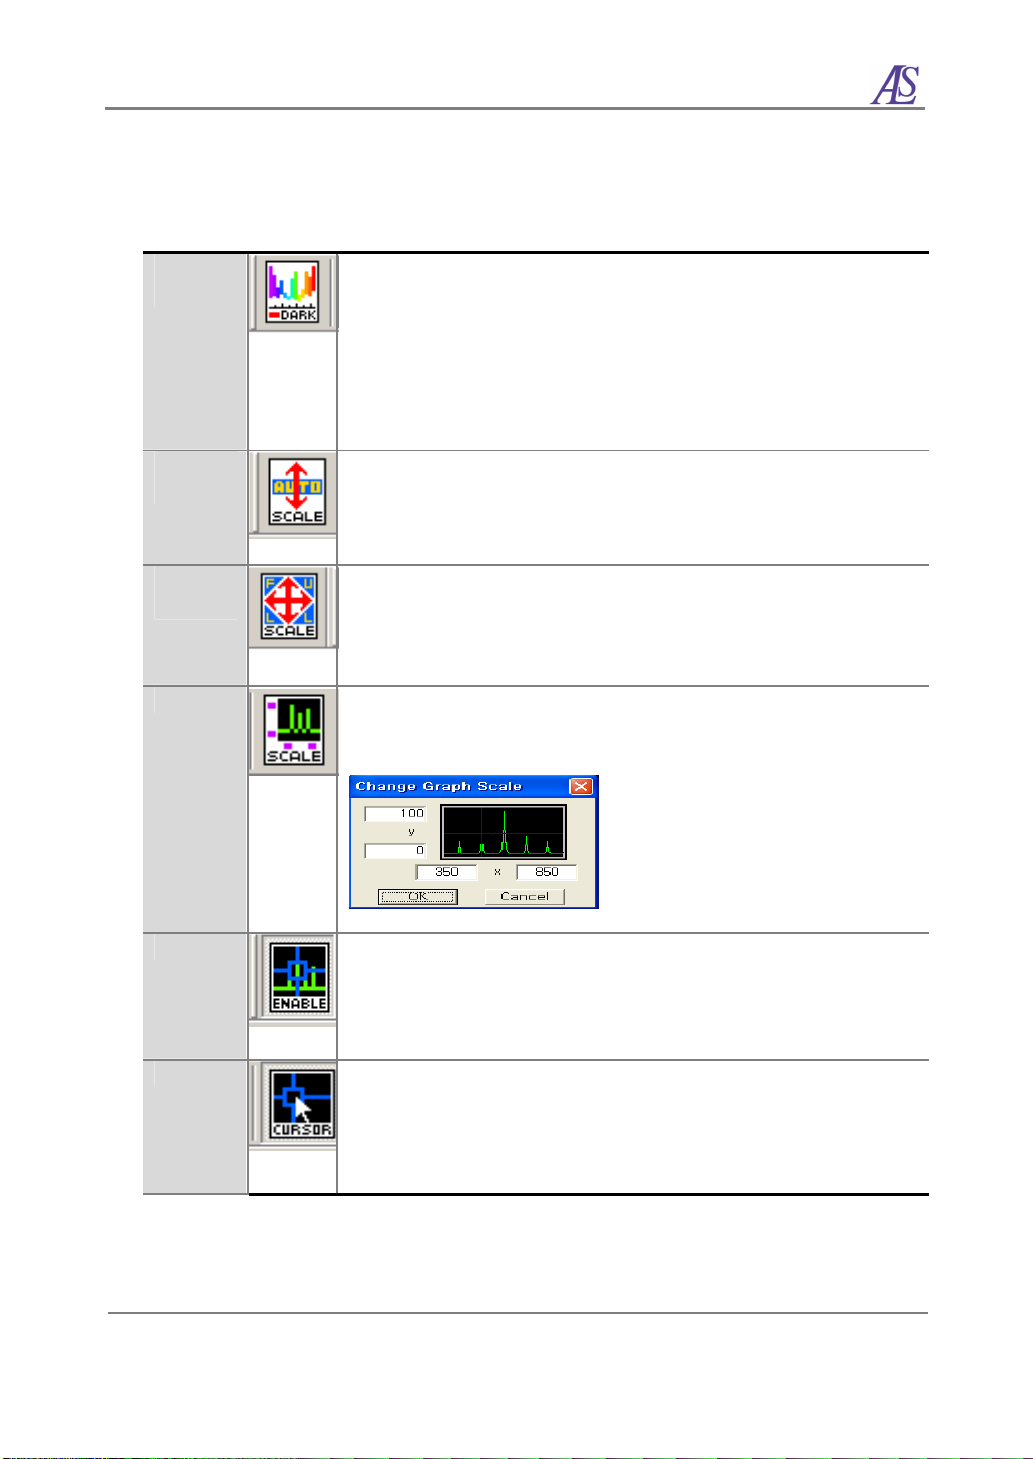
① Icons
Minus
Dark
Select this icon if the baseline of the resulting graph is unstable
based on the present Y coordinate, or to adjust the Y coordinate
based on the dark level. If this icon is clicked, the baseline will
be forced to be Y (Intensity) = 0 which will be reflected in the
graph. Though this function is used for adjusting an unstable
distribution of a spectrum, you must pay attention to the fact that
it is based on the original data when saved as a file.
Auto
Scale
Full
Scale
Scale
Enable
For a detailed view, select this button to enlarge the Ycoordinate into full screen. The X-coordinates may be enlarged
beyond the edge of the screen in this mode.
This icon displays the X-axis and Y-axis in a full screen.
For a detailed view, this mode allows the user to examine the graph
with the X-axis and Y-axis scaled to the user’s preference. Simply
input the upper range of each axis accordingly.
This function provides the coordinate of a particular peak or
point. After choosing “ENABLE” icon, select the target point.
Then the result will be recorded on the point that the mouse
indicates.
Cursor
With this function selected, clicking on a point will provide the
coordinate information (Wavelength, Intensity) shown on the
status bar at the bottom of the screen. In accordance with the
movement of the mouse, new coordinate information will be
shown.
SEC2000 Spectra System
www.als-japan.com
29
Page 30
SEC2000 Operating Manual
Zoom
Pan
Snap
Shot
② Integration Time, Average, & Boxcar
Integration
Time
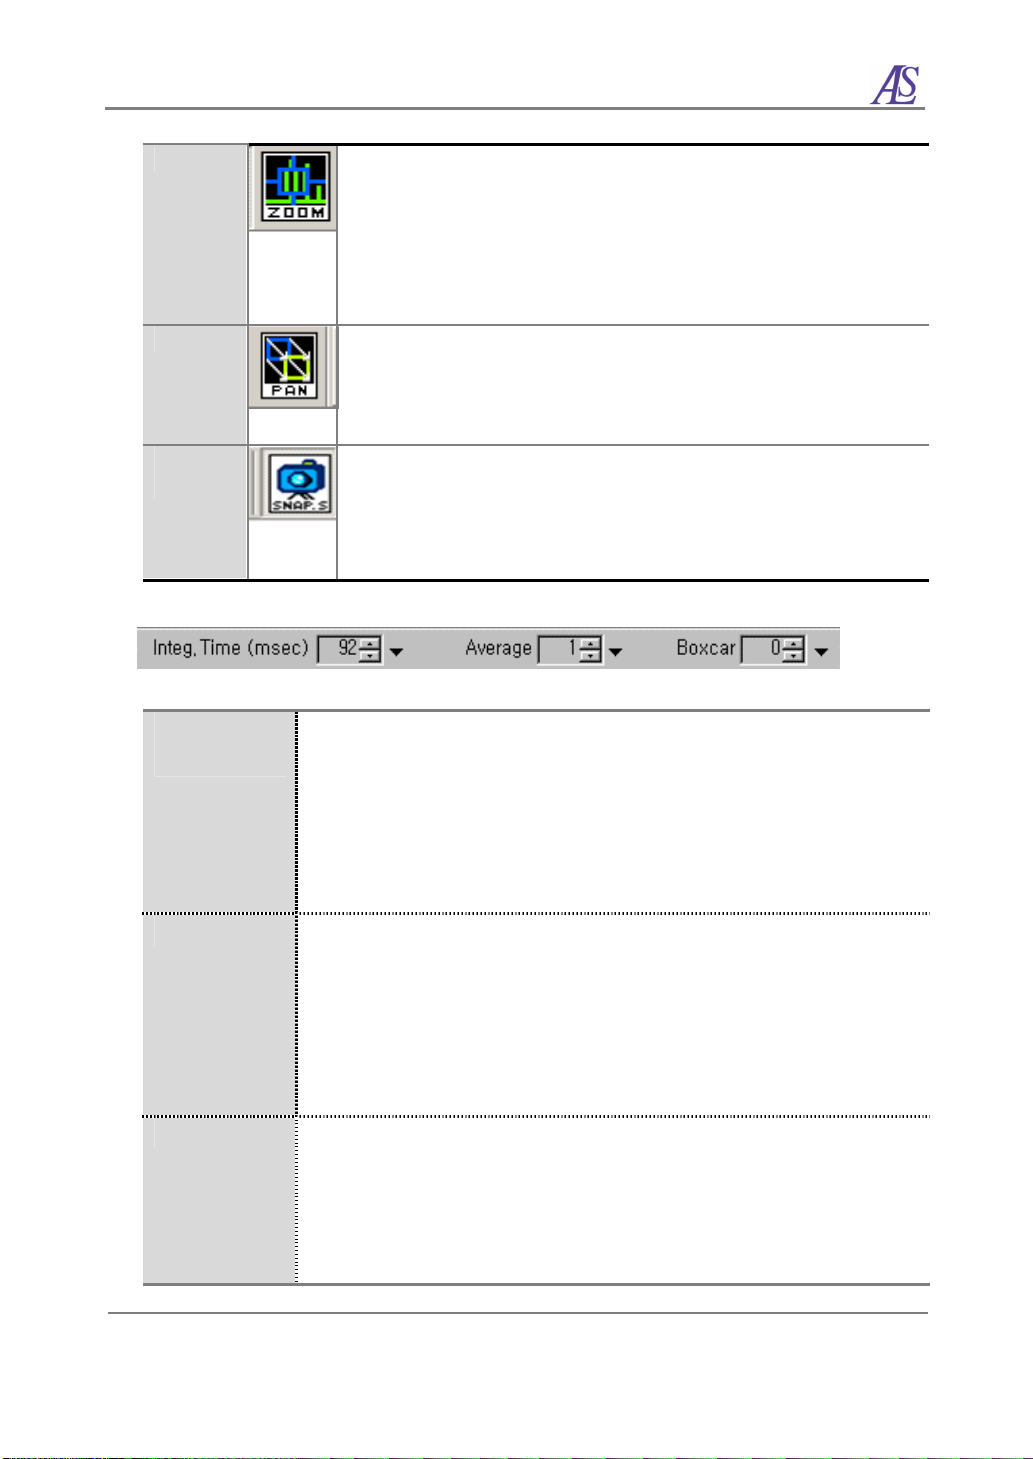
This shows an enlarged image of the desired region. You can
observe the graph by zooming in and out of spectrum with the
method mentioned in the “Full scale”. After choosing the
“Zoom” button, click and drag the cursor over the desired
region with the left button of the mouse pressed, and then you
can see the detailed graph in the scoped area.
To see a broader spectrum, choose the “PAN” button. Click and
drag the graph, then X-axis and Y-axis also change following the
graph movement.
Snap Shot makes real-time values halt. When the “SNAP.S”
button is clicked, the window will be stopped and all other
icons wil l bec om e inactiv at ed. I f yo u c l ic k “SNAP.S ”
button again, the icons become active.
Function of spectral signal amplifying. The larger the number, the larger
the signal (increase in detection sensitivity).
If the signal intensity exceeds 16,000 counts, the signal will be saturated
and not be detected. Therefore, the signal should be adjusted below
16,000 counts. In case that the concentrations between samples have
large difference, make the integration time as low as possible.
<Fig. 4-3-14>
Average Function of spectral signal stabilizing. The higher the figure, the more the
signal is stabilized. When the figure is too high, it is hard to get real-time
data. Decide the least figure so the spectral signal of sample does not
move up and down too much. If the real time values of the sample
concentration continue to change very frequently, lower this function to
meet your experiment.
Boxcar Function of spectral signal smoothing. The higher the figure, the more the
signal smoothes. If the figure is too high, the limit of resolution lowers.
Decide the lowest figure so the spectral signal does not vary much. When
you want to separate intensities of more than two nearby wavelengths,
lower this function to meet your experiment.
SEC2000 Spectra System
www.als-japan.com
30
Page 31
SEC2000 Operating Manual
5. Measurement
5-1. Calibration
All spectrometers are delivered to the user after an initial calibration but some can drift
slightly over a period of time and depending on the environment (If the mirror and
diffraction grating are not aligned, please contact us.).
It can be confirmed by the following way whether wavelength calibration is need. Open
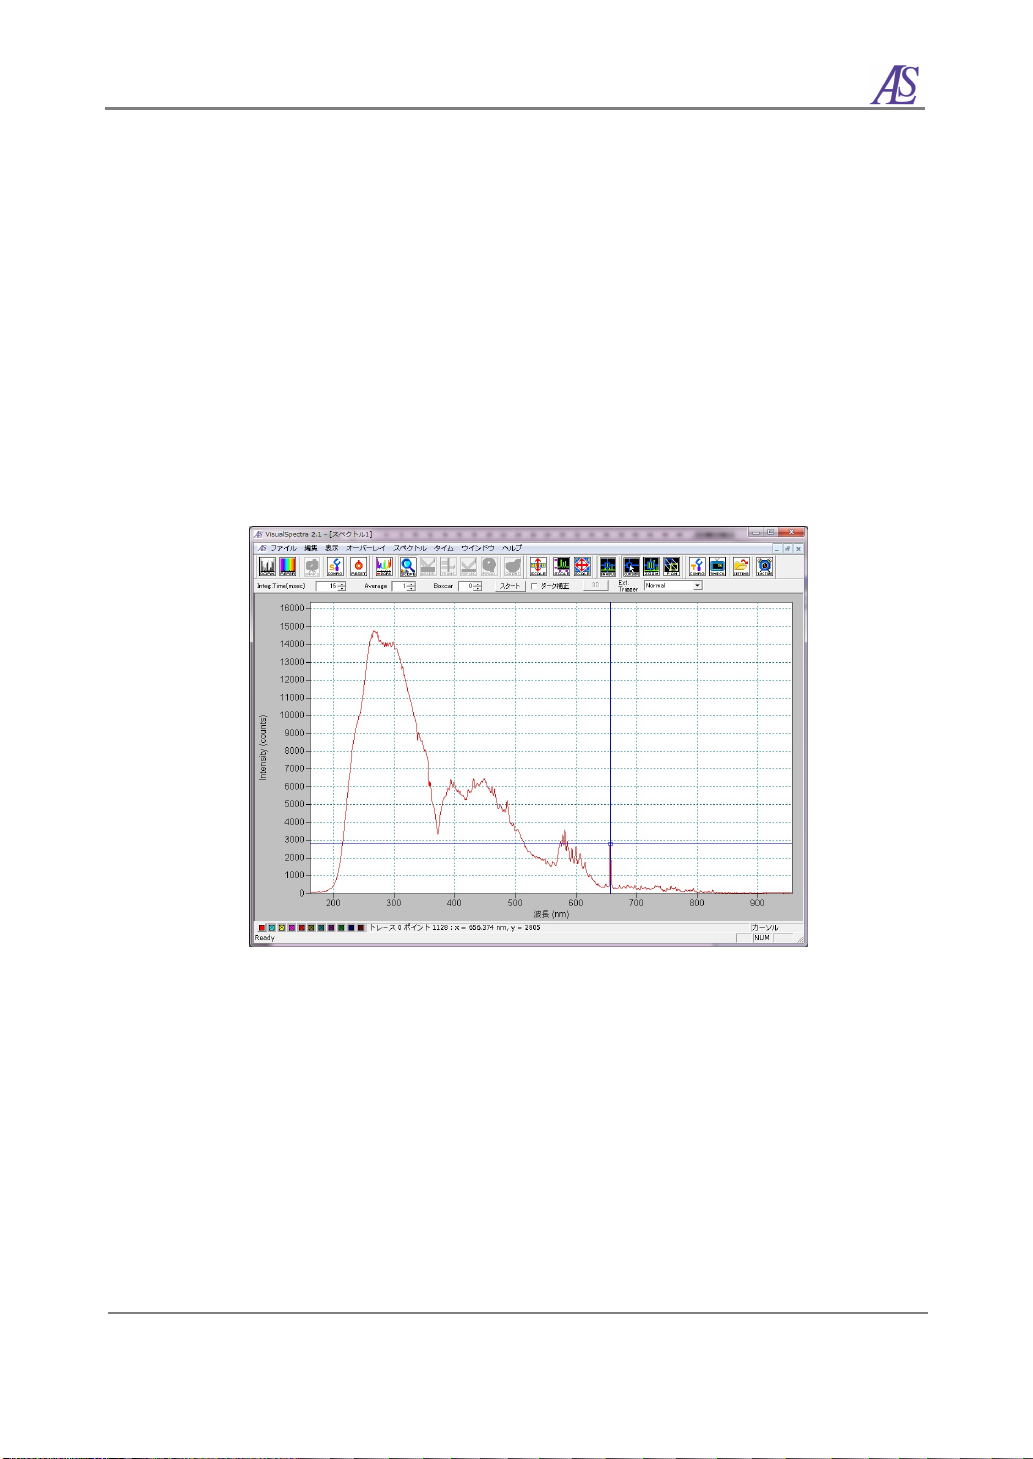
the software and turn on the UV lamp. Confirm the following peaks in scope mode. As
shown in Fig. 5-1-1, sharp peaks at 656 nm labeled Dα, are the feature peaks of the
deuterium arc lamp. The wavelength calibration is required when the feature peaks is
gap.
<Fig. 5-1-1> Emission spectrum of the ultraviolet deuterium arc lamp showing characteristic
hydrogen Balmer lines.
5-2. Dark and Reference Measurements
When Dark and Reference are measured, continue with the experiment applying the
same Integration Time value. To block the light towards the detector SEC2000, close the
shutter of the light source.
① The power supply is switched on and turned ON the UV lamp and halogen lamp.
Wait for 20 to 30 minutes until UV lamp is stabilized.
② Put the reference sample into the cuvette holder, and open the light source shutter
SEC2000 Spectra System
www.als-japan.com
31
Page 32

SEC2000 Operating Manual
fully.
③ Adjust the Integration Time to control the maximum value of the Y axis of the graph
(less than 16000).
④ By clicking the “Reference” icon in the program, the spectrum is obtained at the
maximum light intensity. Save the reference spectrum by
“File”/”Save”/”Reference”.
⑤ Close the light source shutter, and click the “Dark” icon in the program to obtain a
spectrum under the minimum conditions without light. Save the dark spectrum by
“File”/”Save”/”Dark”.
⑥ Scope mode is the basic measurement mode. After measuring the spectrum in
Dark and Reference, the “Absorbance”, “Transmittance”, “Reflectance” and
“Irradiance” measurement mode icons become active.
5-3. Sample Measurement
Apply the same condition with which the Reference was measured (the shutter open &
the same Integration Time). Put the sample into the cuvette holder, and close the cover.
Save the sample spectrum by “File”/ ”Save”/ ”Sample”.
5-4. Absorbance/Transmittance Measurement
Absorbance/Transmittance spectra are used to measure how much light is absorbed by
a sample. For most samples, absorbance is linearly related to concentration of the
substance. The software calculates absorbance (A) using Beer’s law and shows the
relationship between absorbance and concentration as below equation:
A=bc
Where A is the absorbance of the solution, is the molar absorptivitymol-1cm-1, b
is the pathlength of radiation through the absorbing medium (cm) and c is the
concentration (mol/L) of the solution.
The absorbance is measured with the following procedure.
SEC2000 Spectra System
www.als-japan.com
32
Page 33
SEC2000 Operating Manual
<Fig 5-4-1>
① First, the light source and detector of SEC2000 are set as shown in Fig. 5-4-1.
② The power supply is switched on and turned ON the UV lamp and halogen lamp.
Wait for 20 to 30 minutes until the lamps are stabilized.
③ Open the software and click “Go” icon, the spectrum signal will appear. On Scope
Mode, put the reference sample into the cuvette holder, and open the light source
shutter fully.
④ Adjust the Integration Time to control the maximum value of the Y axis of the graph
(less than 16,000).
⑤ By clicking the “Reference” icon in the program, the spectrum is obtained at the
maximum light intensity. Save the reference spectrum by “File”/”Save”/
“Reference”.
⑥ Close the light source shutter (Do not close the power switch), and click the “Dark”
icon in the program to obtain a spectrum under the minimum conditions without
light. Save the dark spectrum by “File”/”Save”/”Dark”.
⑦ Put the sample into the cuvette holder, and open the light source shutter fully. Click
the “Absorbance Mode”/”Transmittance Mode” icon to change the Mode. Store
the spectrum by “File”/”Save”/”Processed” or “Sample” to save an absorbance or
transmittance spectrum.
Notes
When absorbance/transmittance is saved by “File”/”Save”/”Processed”, the data of
absorbance/transmittance is displayed only absorbance/transmittance mode. However,
if absorbance/transmittance is saved “File”/”Save”/“Sample”, the saved data is
convertible for other mode.
SEC2000 Spectra System
www.als-japan.com
33
Page 34
SEC2000 Operating Manual
5-5. Reflectance Measurement
Reflection is the change in direction of a wave front at an interface between two
dissimilar media so that the wave front returns into the medium from which it originated.
The reflection of light may be Specular (that is, mirror-like) or Diffuse (that is, not
retaining the image, only the energy) depending on the nature of the interface. The
glossier the surface is, the closer to specular reflection it is.
Reflection is expressed as a percentage (%r) of reflective light quantity from a standard
reference substance:
%r = {(S-D)/(R-D)}100 (%)
Where r is the reflectance of the sample, S is the reflect light amount which means
applied light to the sample surface; R is the reflect light amount which applied light to the
standard reflective material surface; D is the amounts of dark light when light intercepts.
5-5-1. Reflectance Measurement 1
In this measurement, the shape of the sample should be board like and it can be set into
the cuvette holder at 45 degrees.
The reflectance is measured with the following procedure.
<Fig. 5-5-1> Configuration example of reflectance measurement.
① First, the light source and detector of SEC2000 are set as shown in Fig. 5-5-1.
② The power supply is switched on and turned ON the UV lamp and halogen lamp.
SEC2000 Spectra System
www.als-japan.com
34
Page 35
SEC2000 Operating Manual
Wait for 20 to 30 minutes until the lamps are stabilized.
③ Open the software and click “Go” icon, the spectrum signal will appeared. On
Scope Mode, put the standard reflective material into the cuvette holder, and open
the light source shutter fully.
④ Adjust the Integration Time to control the maximum value of the Y axis of the graph
(less than 16,000).
⑤ By clicking the “Reference” icon in the program, the spectrum is obtained at the
maximum light intensity. Save the reference spectrum by “File”/”Save”/
“Reference”.
⑥ Close the light source shutter (Do not close the power switch), and click the “Dark”
icon in the program to obtain a spectrum under the minimum conditions without
light. Save the dark spectrum by “File”/”Save”/”Dark”.
⑦ Put the sample into the cuvette holder, and open the light source shutter fully. Click
the “Reflectance Mode” icon to change the Mode. Save the spectrum by
“File”/”Save”/”Processed” or “Sample”.
5-5-2. Reflectance Measurement 2
In this measurement, the Reflection probe is used.
The reflectance is measured with the following procedure.
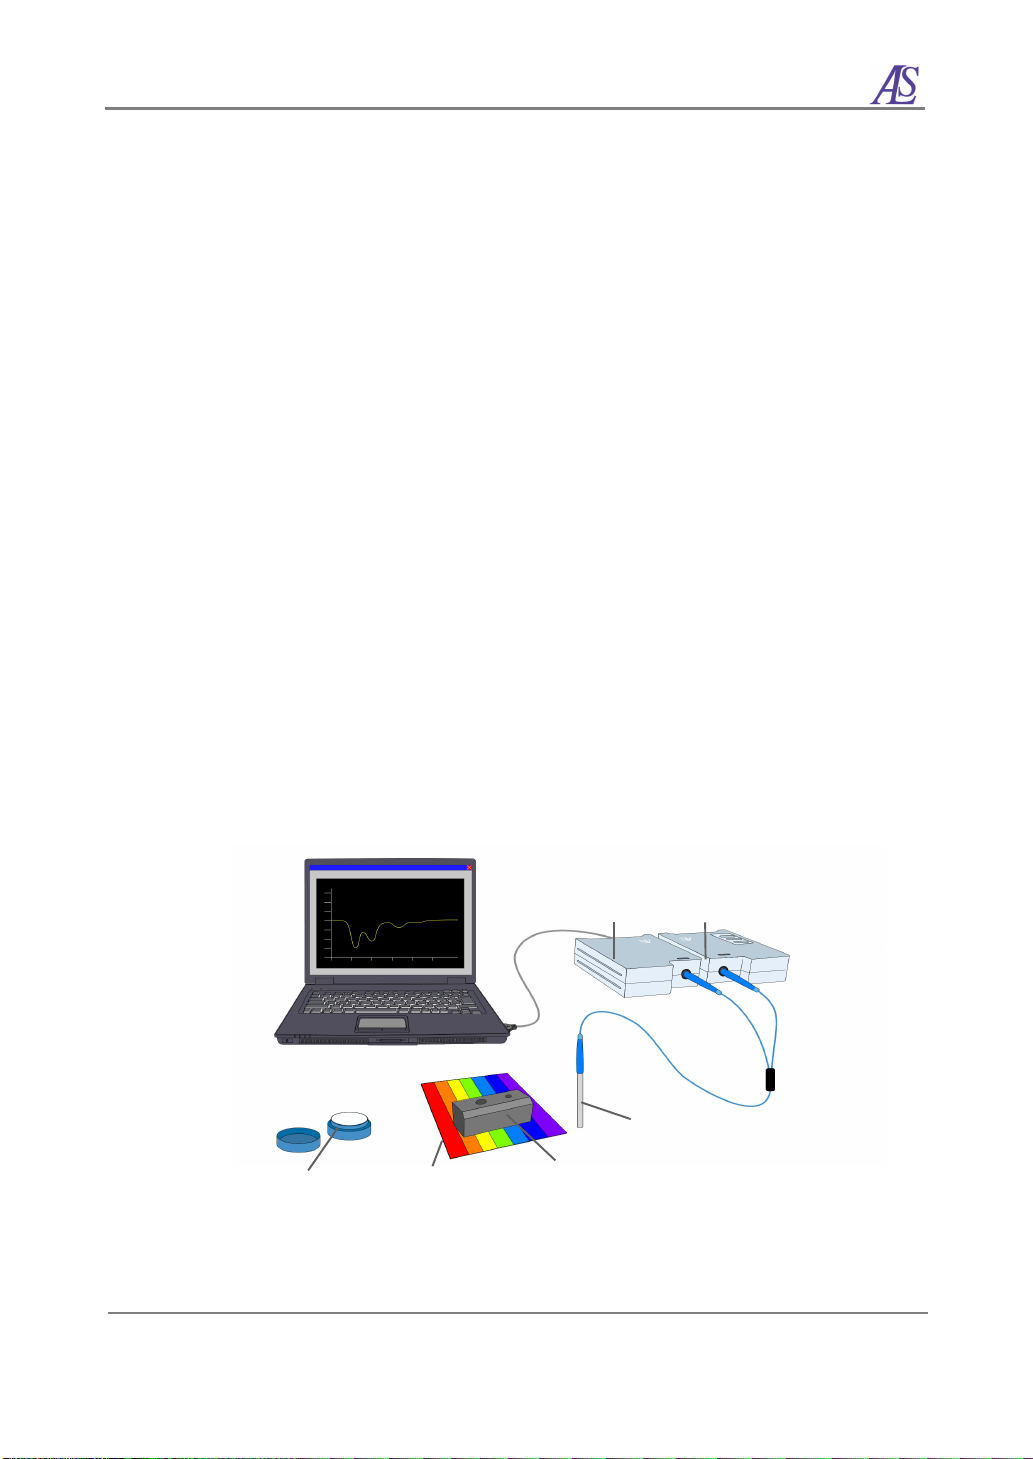
Reflectance Standard
<Fig. 5-5-2> Configuration example of reflectance measurement using reflection probe.
Computer
Sample
SEC2000-UV/VIS SEC2000-D
Reflection Probe
Probe holder
SEC2000 Spectra System
www.als-japan.com
35
Page 36

SEC2000 Operating Manual
① First, the light source and detector of SEC2000 are set as shown in Fig. 5-5-2.
② The power supply is switched on and turned ON the UV lamp and halogen lamp.
Wait for 20 to 30 minutes until the lamps are stabilized.
③ Open the software and click “Go” icon, the spectrum signal will appeared. On
Scope Mode, open the light source shutter. Put the reflection probe to the
standard reflective material. Move the probe tip to adjust the reflection light
intensity to maximum. Fix the probe tip to holder by screw, and then the distance
from the tip to measurement surface is fixed.
④ Adjust the Integration Time to control the maximum value of the Y axis of the
graph (less than 16,000).
⑤ By clicking the “Reference” icon in the program, the spectrum is obtained at the
maximum light intensity. Save the reference spectrum by “File”/”Save”/
”Reference”.
⑥ Close the light source shutter (Do not close the power switch), and click the
“Dark” icon in the program to obtain a spectrum under the minimum conditions
without light. Save the dark spectrum by “File”/”Save”/”Dark”.
Put the reflection probe to sample surface, and open the light source shutter fully.
Click the “Reflectance Mode” icon to change the Mode. Save the spectrum by
“File”/”Save”/”Processed” or “Sample”.
5-6. Irradiance Measurement
Have you ever seen the colors of light emitted by the sun, fluorescent lights, white
lights and lamps? These colors look white to our eyes. Red, yellow and green traffic
signal colors are radiation of light. The material emitting light is called the light source.
The emission of light by the light source is called Luminescence.
How is the color of the light source generated? Shall we perform experiments for the
Luminescence Spectrum of the light?
5-6-1. Relative irradiance measurement
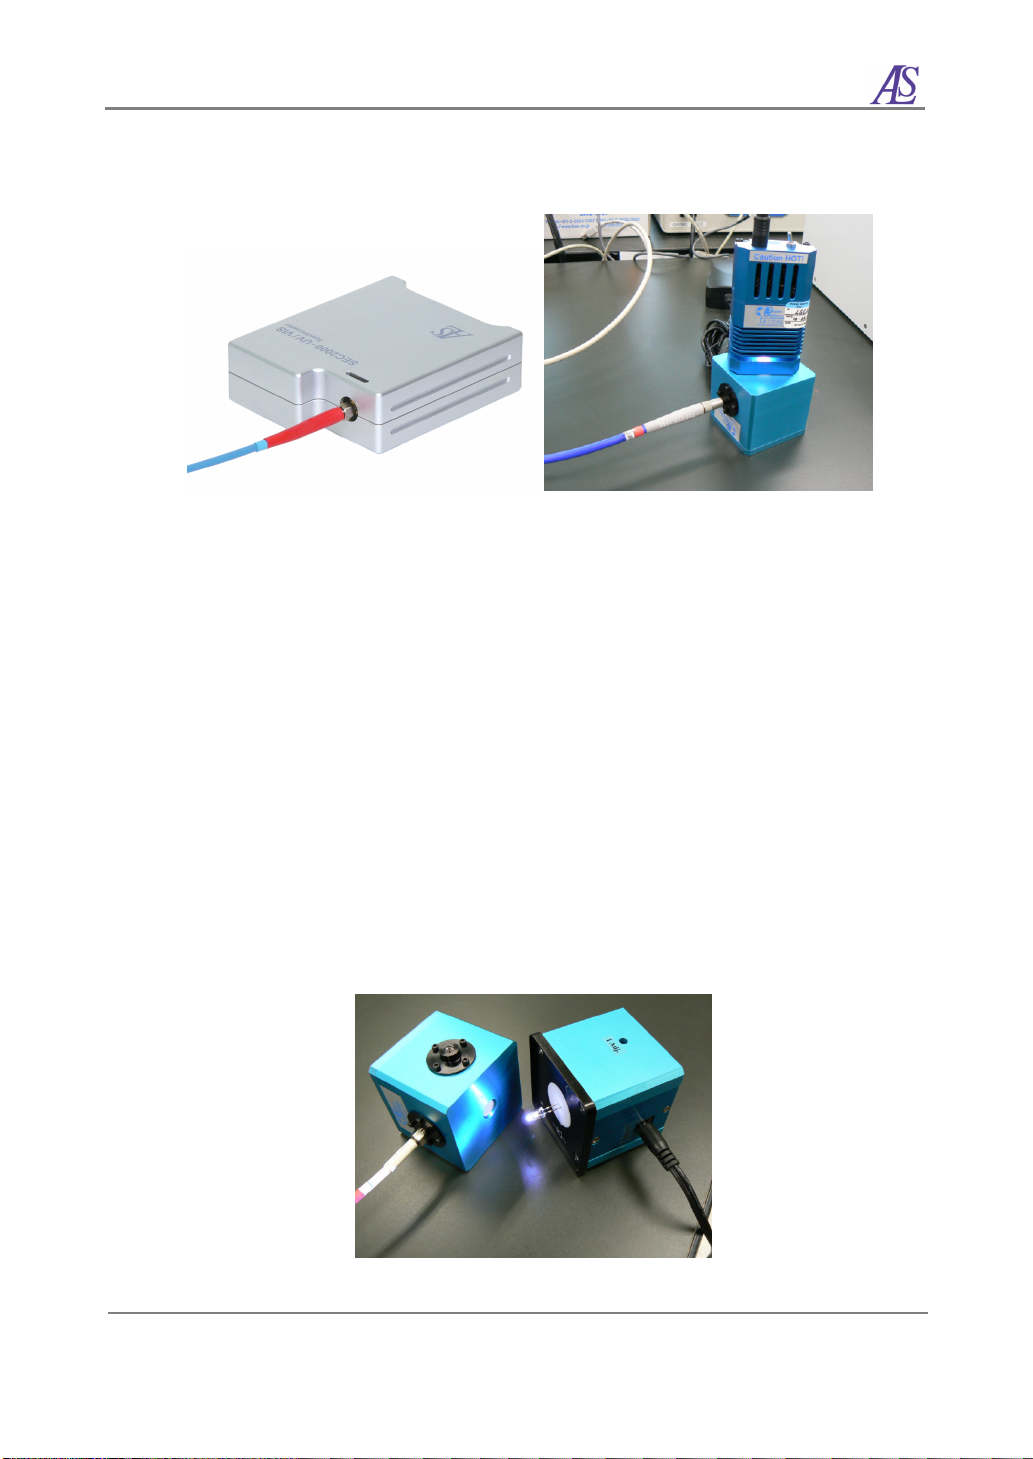
① First, connect the detector of SEC2000 and integrating sphere by optical fiber. Set
the standard light source to integrating sphere as shown in Fig. 5-6-1.
② Turn on the power of the standard light source. Wait for 20 to 30 minutes until the
SEC2000 Spectra System
www.als-japan.com
36
Page 37
SEC2000 Operating Manual
lamps are stabilized.
③ Open the software and click “Go” icon, the spectrum signal will appear.
<Fig. 5-6-1> Configuration example of relative irradiance measurement.
④ “Spectrum”/” Reference Color Temp.” Input the color temperature (K) of the
standard light source used for relative irradiance measurements.
⑤ On Scope Mode, Adjust the Integration Time to control the maximum value of the
Y axis of the graph (less than 16,000).
⑥ By clicking the “Reference” icon in the program, the spectrum is obtained at the
maximum light intensity. Save the reference spectrum by “File”/ ”Save”/
“Reference”.
⑦ Close the light source shutter (Do not close the power switch), and click the “Dark”
icon in the program to obtain a spectrum under the minimum conditions without
light. Save the dark spectrum by “File”/”Save”/”Dark”.
⑧ Connect a luminescence sample to integrating sphere (set a LED bulb to
integrating sphere), Click the “Irradiance Mode” icon to change the Mode.
<Fig. 5-6-2> Relative irradiance measurement of LED bulb.
SEC2000 Spectra System
www.als-japan.com
37
Page 38
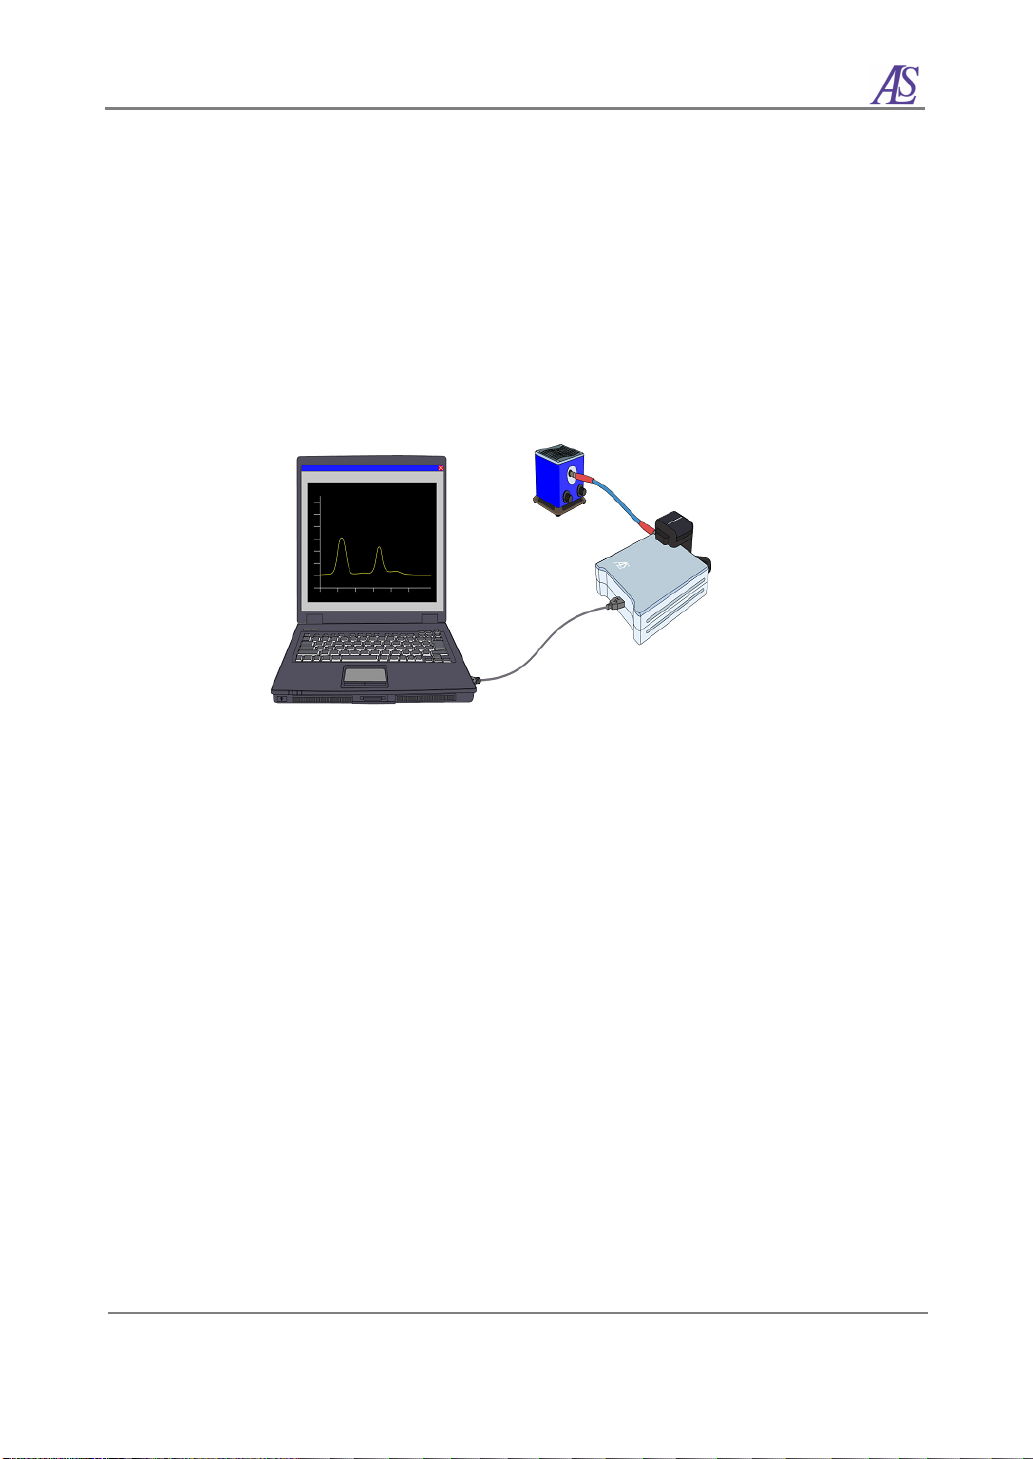
SEC2000 Operating Manual
⑨ Save the spectrum by “File”/”Save”/”Processed” or “Sample”.
5-6-2. Fluorescence / luminescence-spectrum measurement
In this measurement, the detector of SEC2000 and cuvette holder are used.
① First, connect the detector of SEC2000, cuvette holder and light source by optical
fiber as shown in Fig. 5-6-3.
<Fig. 5-6-3> Configuration example of fluorescence measurement.
② Put the sample into the cuvette holder and close the cover of cuvette holder.
③ Open the software and click “Go” icon, the spectrum signal will appear.
④ Turn on the power of the excitation light source. On Scope Mode, it shows the
fluorescence of the sample. Adjust the Integration Time to control the maximum
value of the Y axis of the graph (less than 16,000).
Computer
High power LED
Optical fiber
Cuvette Holder
Detector
⑤ Save the spectrum by “File”/”Save”/ “Sample”.
⑥ When you measure a luminescence spectrum, please set a luminescence sample
to detector (intercepting a surrounding light), and continue the procedure①∼④,
Save the luminescence spectrum by “File”/”Save”/ “Sample”.
5-7. Time Series Acquisition (TSA)
Time Series Acquisition is monitoring of the intensity change of absorbance,
transmittance and radiation illumination. Time course of chemical and physical changes
of the sample is measured. This function is applicable to a chemical substance,
SEC2000 Spectra System
www.als-japan.com
38
Page 39
SEC2000 Operating Manual
environment and process management.
The measurement can be carried out in Scope, Absorbance, Transmittance and
Reflectance modes. Doing time series acquisition measurement, please follow the
steps:
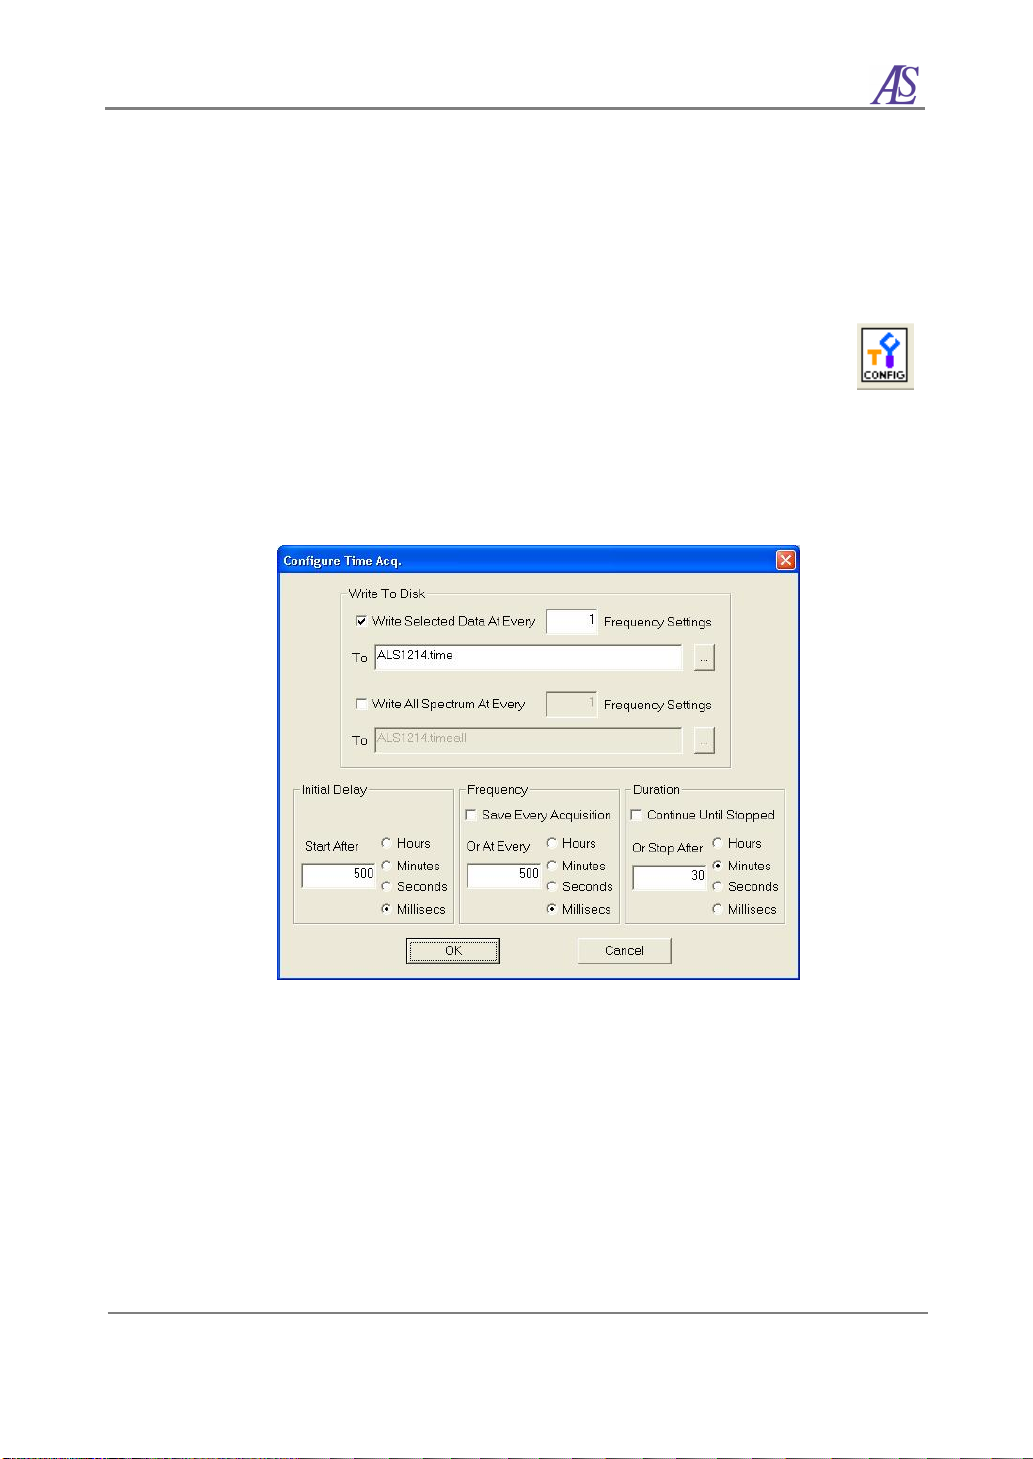
First, open “Menu”/”Time”/”Configure Time Acquisition”, or click the
icon.
The following window will appear. Configure and establish the parameters for time
acquisition process.
<Fig. 5-7-1>
SEC2000 Spectra System
www.als-japan.com
39
Page 40
SEC2000 Operating Manual
Write to Disk
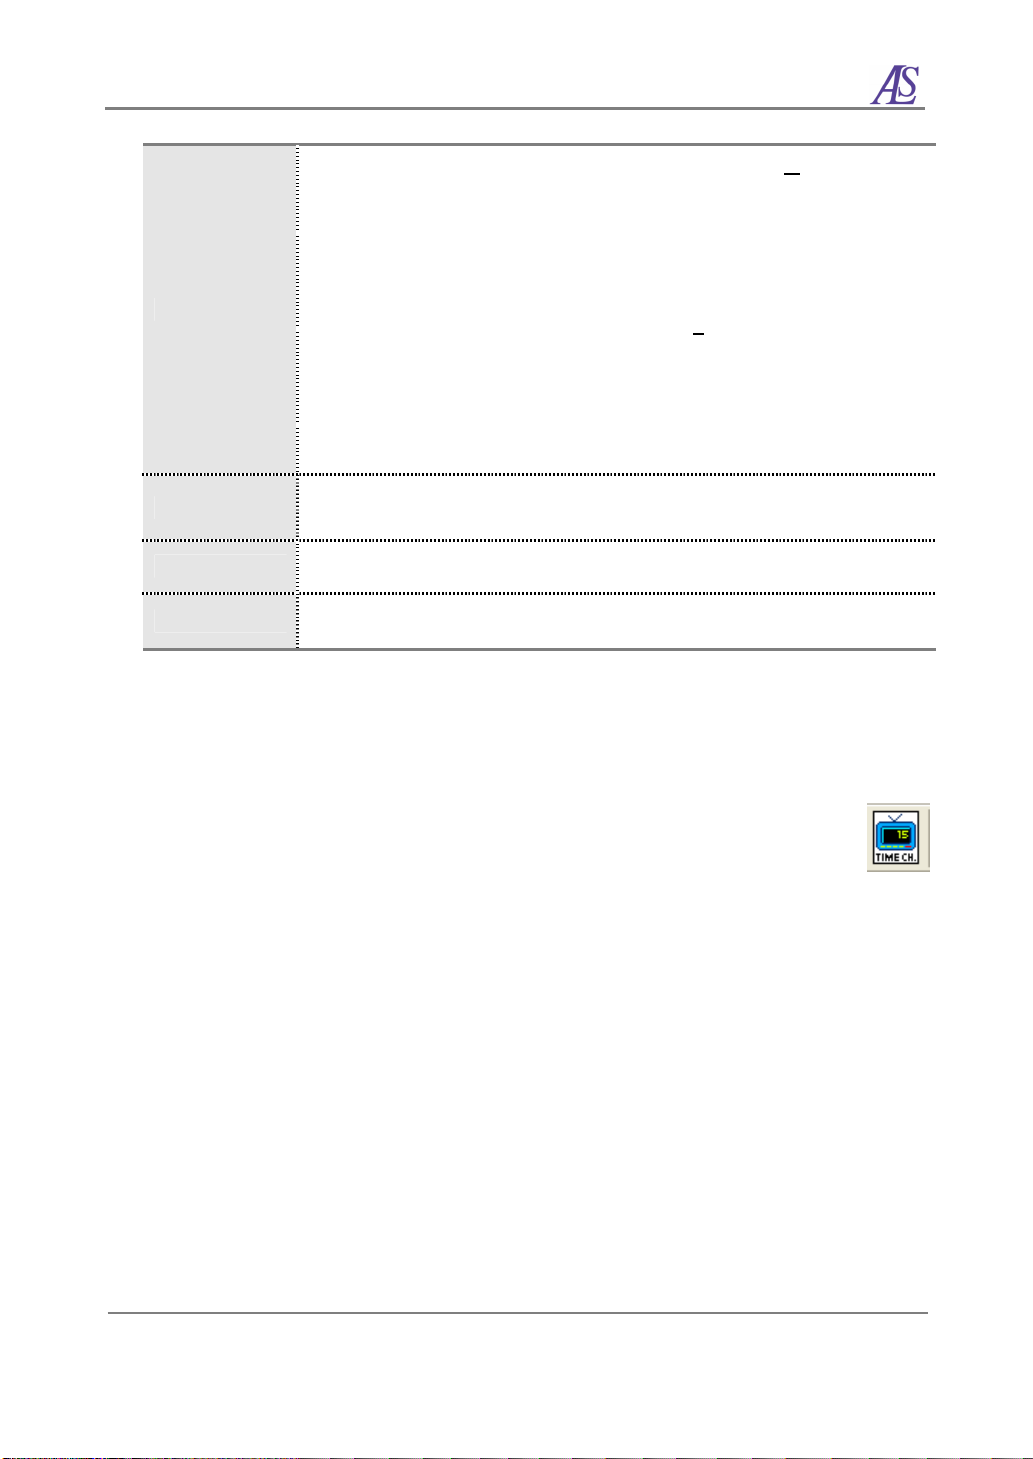
-Check the “ Write Selected Data At Every 1 Frequency
Settings”, and configure the file name and folder to store the specific
wavelength intensity by fixed time interval. You need to complete
“Configure Time Acq. Channel” also. Please refer the step ⑦ to
configure the channels.
-Check the “Write All Spectrum At every 1 Frequency Settings”,
and configure the file name and folder to store the full spectrum by
fixed time interval.
If you only want to store the full spectrum, there is no need to set up
the “Configure Time Acq. Channel”.
Initial Delay
Frequency
Duration
Write the folder and file name for the time series acquisition process.
Enter the “Initial Delay” to set starting time.
Enter the “Frequency” to set the data collection frequency.
Enter the “Duration” to set the data collection period.
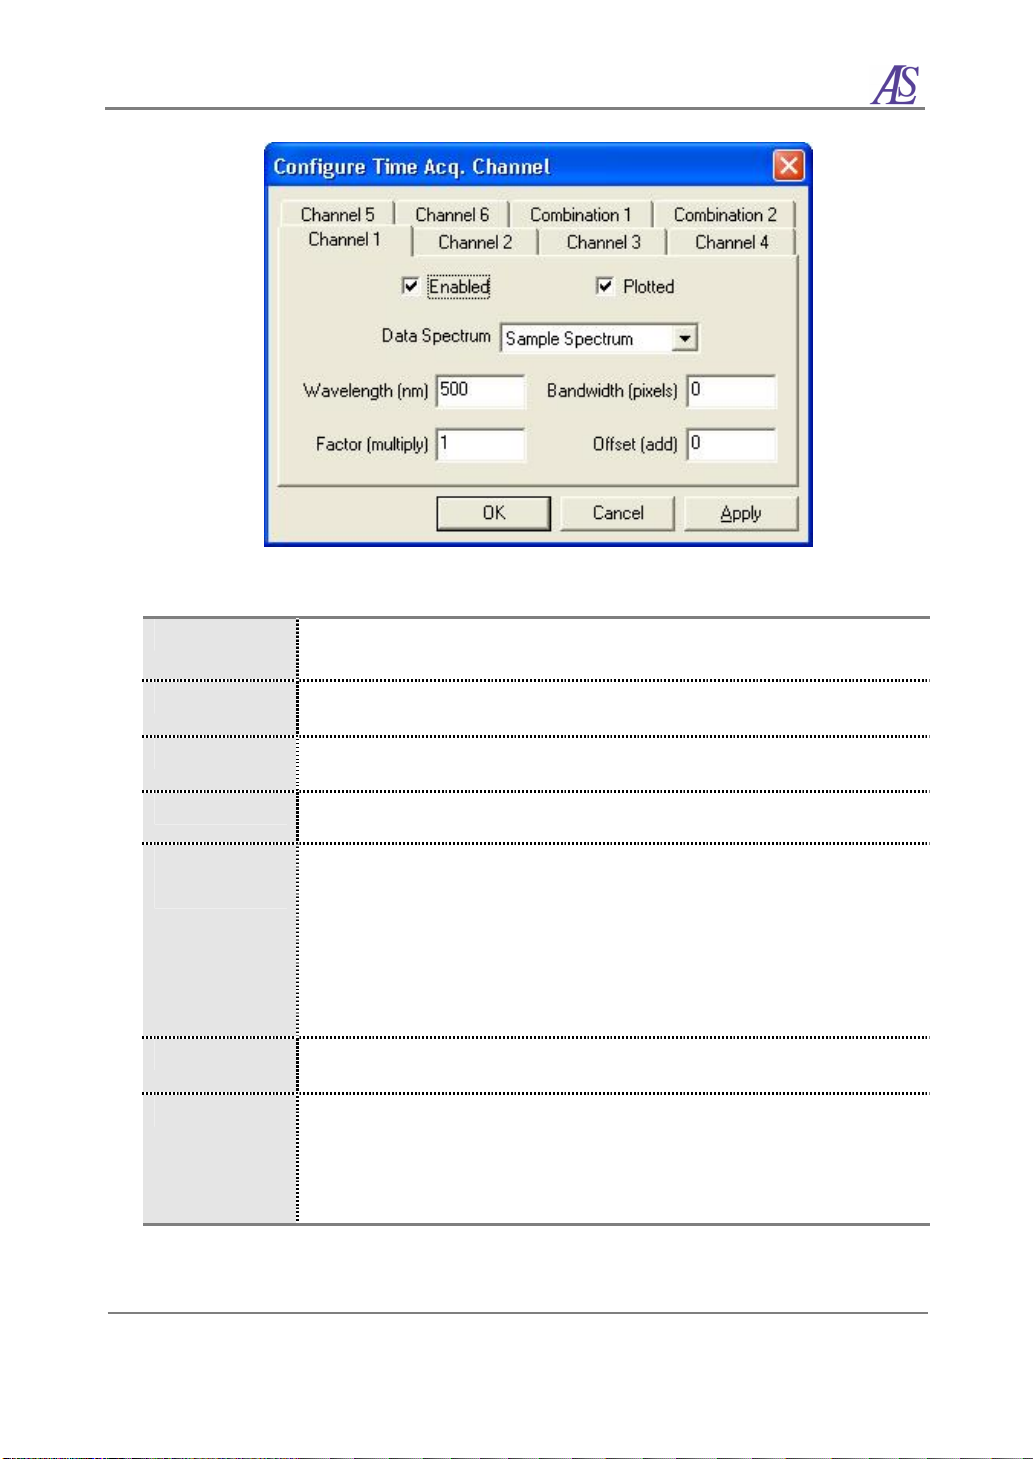
Open “Menu”/”Time”/”Configure Time Acquisition Channel”, or click the
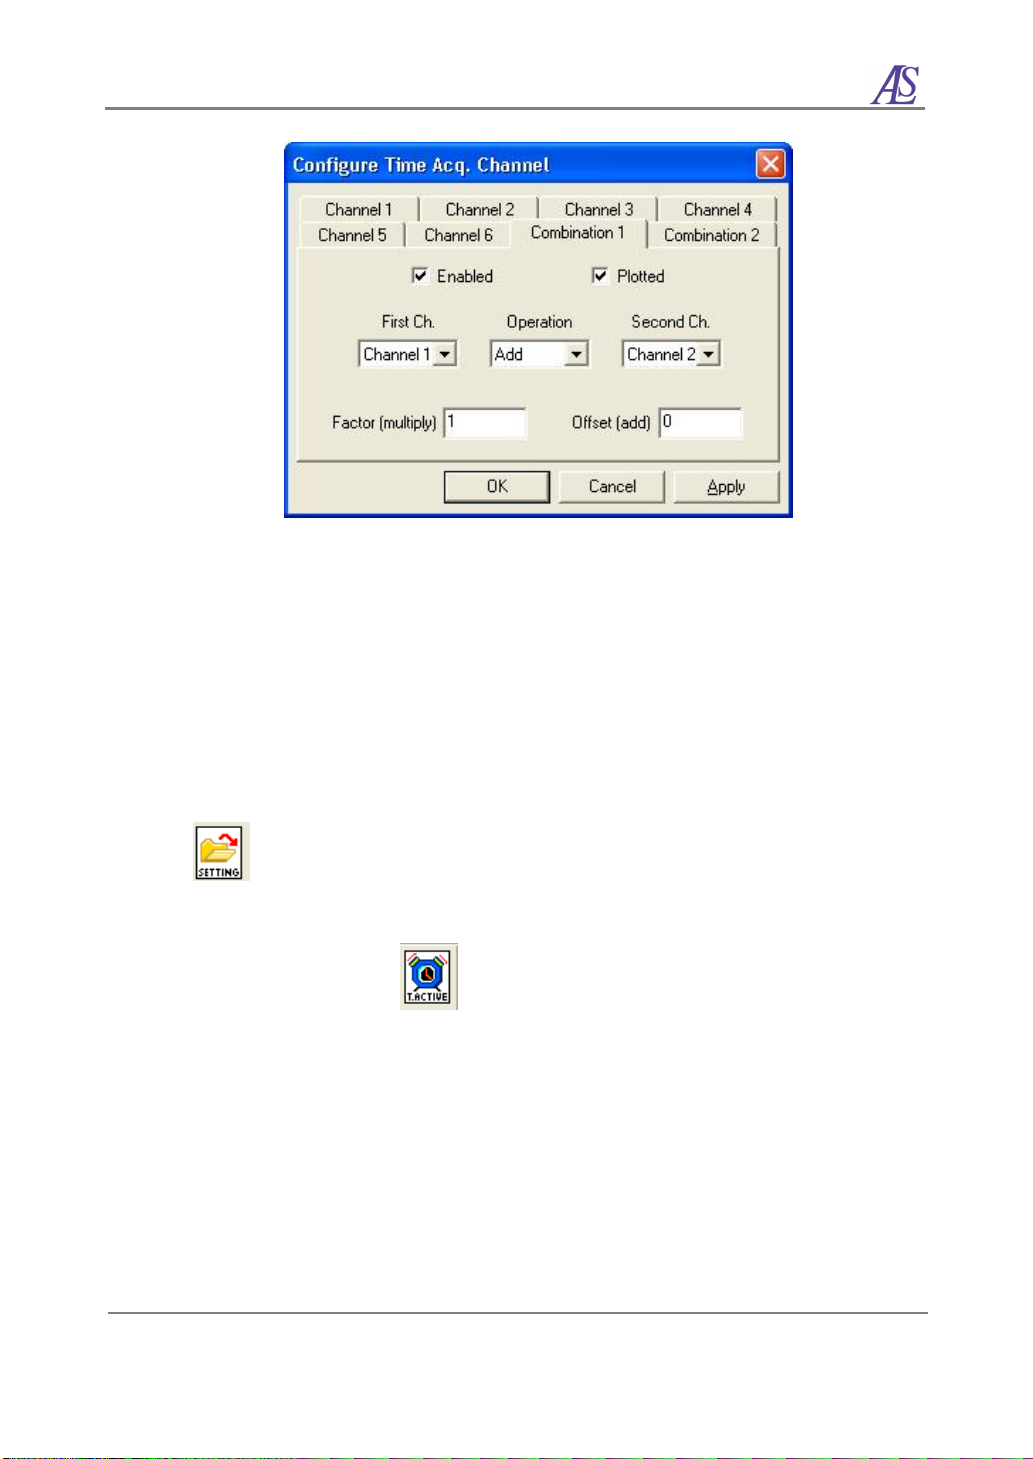
icon. In this window you can configure the wavelength channels. Six specific
wavelengths can be set up from channel 1 to channel 6.
Set the start time of the measurement (After pushing the play button).
The measurement will start after “Initial Delay” time.
Set the time interval. Larger than 100 ms.
Set the period of measurement.
SEC2000 Spectra System
www.als-japan.com
40
Page 41
SEC2000 Operating Manual
<Fig. 5-7-2>
Enabled
Plotted
Data Spectrum
Wavelength Please input the wavelength (nm) to measure by channel 1.
Bandwidth
(pixels)
Factor
Offset When the plots are overlapped with one another as a result of setting
Check the “Enabled” to active the “Channel 1”.
Check the “Plotted” to plot the data on window.
Choose the spectrum type. Sample/Dark/Reference spectrum.
Decide the wavelength bandwidth to calculate peak area from the
measured values. In this case, note that the unit is not nm but pixels
(3 pixels≈1 nm). Since the value of peak area is bigger than the
value of peak height, the plot range is beyond the Y-coordinate limit
on the graph. It is better to make the bandwidth value 0 (zero) except
in case that the measured values should be shown with peak area.
The measured value is multiplied by the number in “Factor”.
up several Channels at the same time, fill one figure in “Offset” and
increase the plot value. Fill it with real value only when the plots are
overlapped.
Combinations 1 and 2 can perform operation among channel 1 ~ channel 6.
SEC2000 Spectra System
www.als-japan.com
41
Page 42
SEC2000 Operating Manual
<Fig. 5-7-3>
The parameters of step -can be saved by “Manu”/”Time”/”Save Parameter”.
Next time, when you want to collect the data at the same condition, you should
open the parameters by “Manu”/”Time”/”Save Re-memory Parameter” or click
icon to.
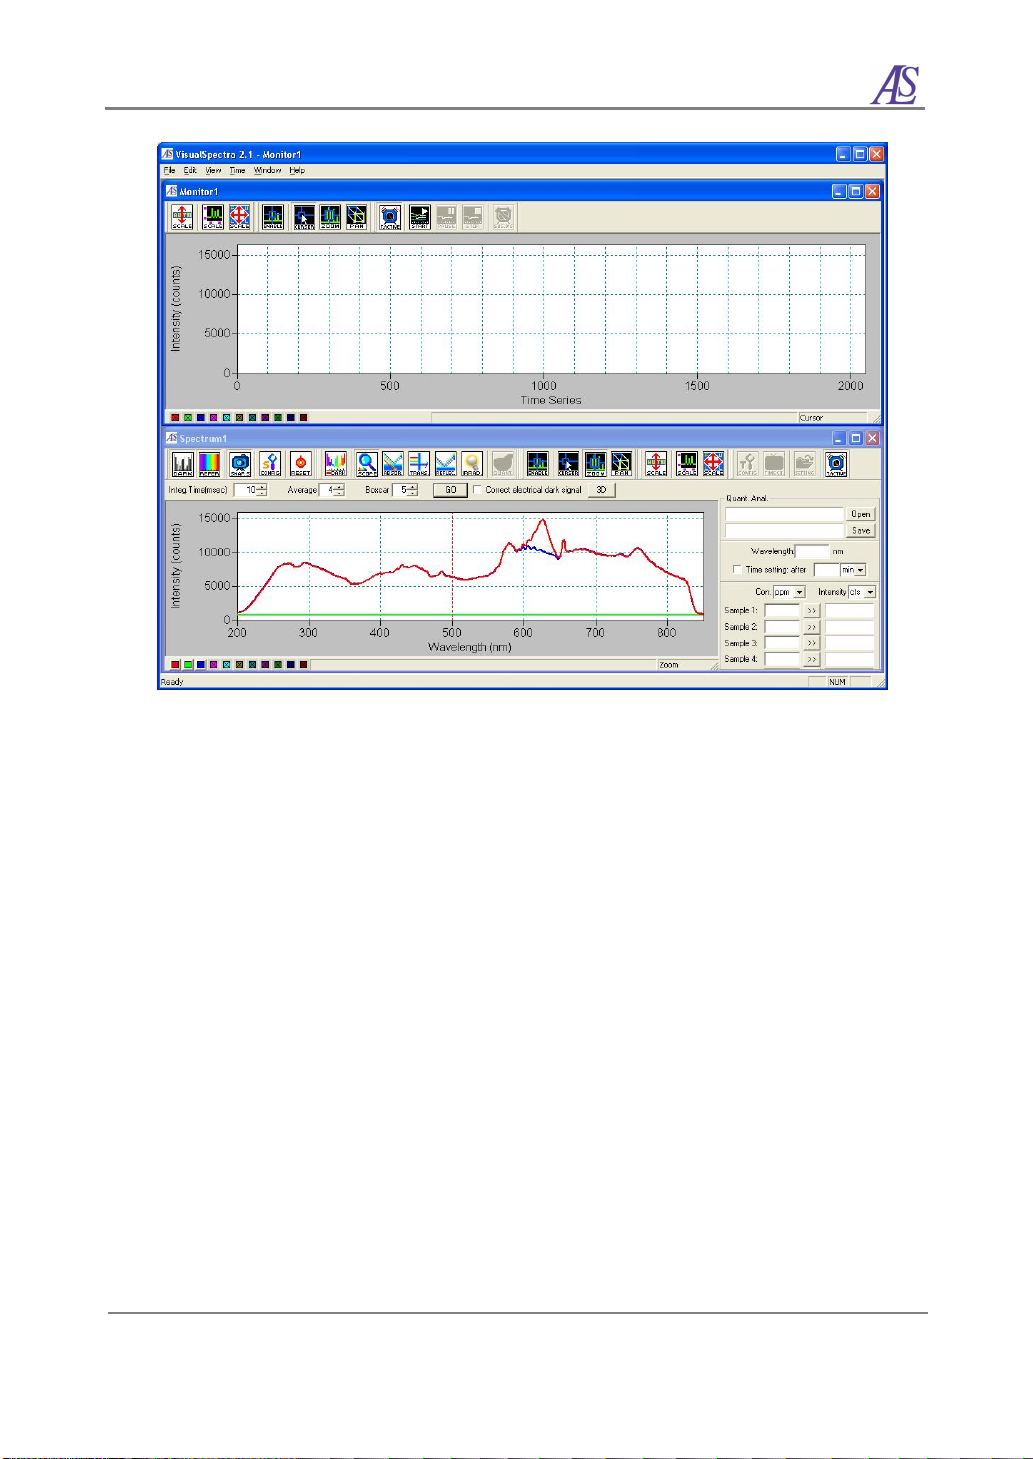
After configuring the channel parameters, open “Time”/” Activate Time
Acquisition” or click icon to active the following window. The upper
window ”Monitor 1” is for channel monitoring. The lower window ”Spectrum 1” is
for original spectrum. Click the start “►” icon of “Monitor 1”, then the data
collection will be carried out on the set-up conditions.
SEC2000 Spectra System
www.als-japan.com
42
Page 43
SEC2000 Operating Manual
<Fig. 5-7-4>
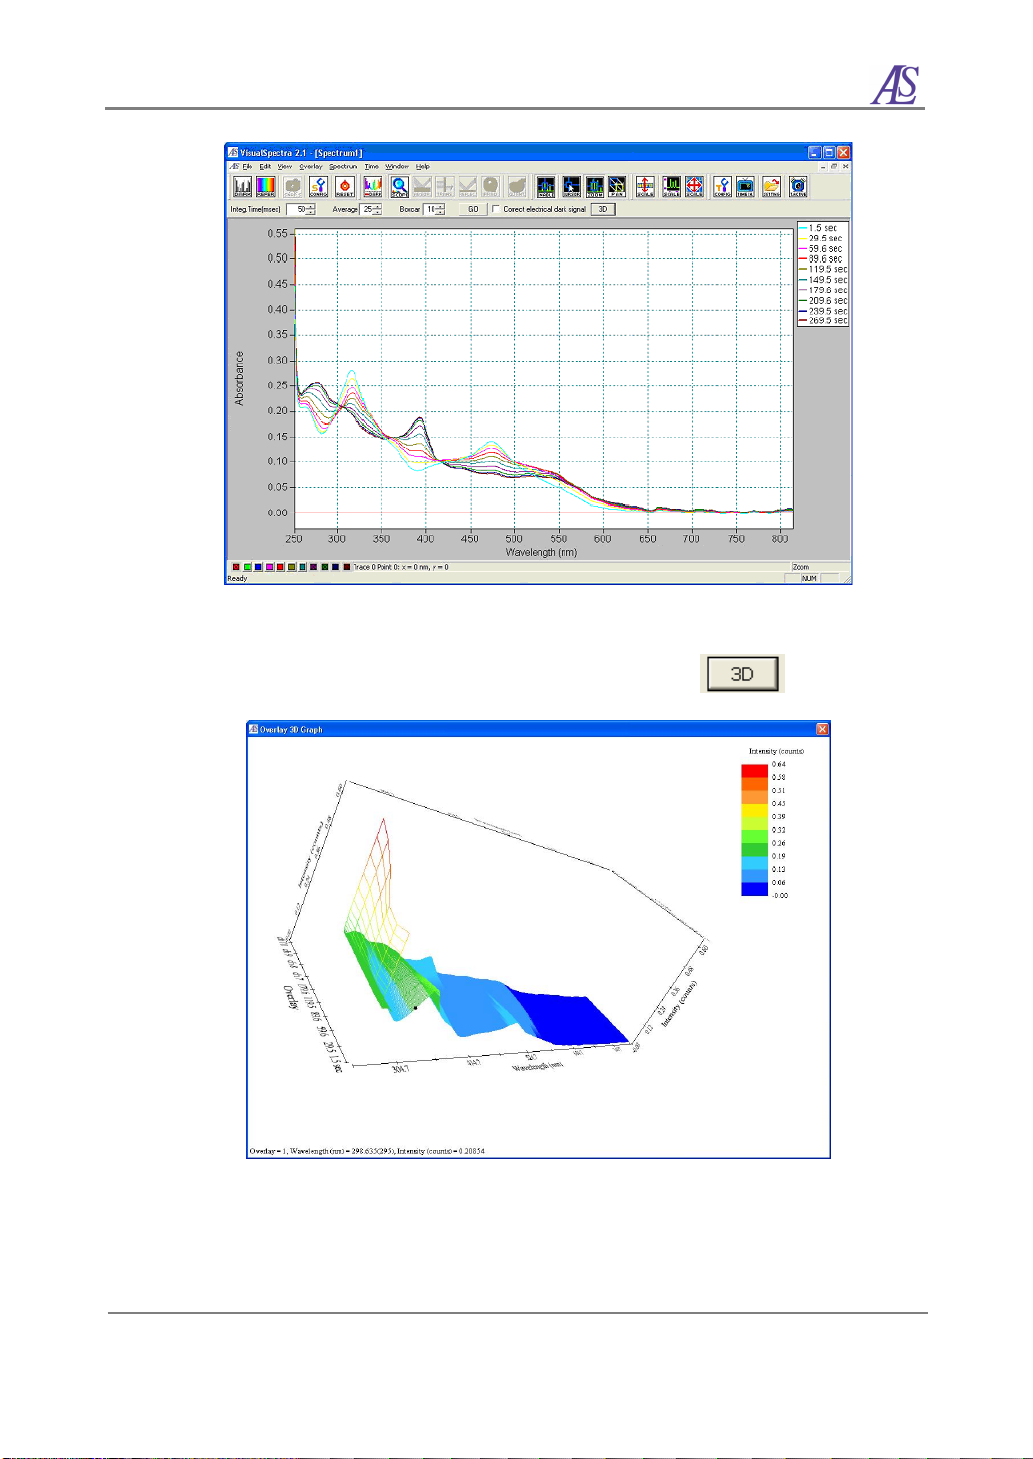
The saved full spectrum files can be displayed using “Overlay”/”Time
series”/”Add overlay (Multiple Selection)”
SEC2000 Spectra System
www.als-japan.com
43
Page 44
SEC2000 Operating Manual
<Fig. 5-7-5>
The data can be displayed by 3D figure after clicking the icon.
<Fig. 5-7-6>
SEC2000 Spectra System
www.als-japan.com
44
Page 45
SEC2000 Operating Manual
6. Analysis
6-1. Overlay
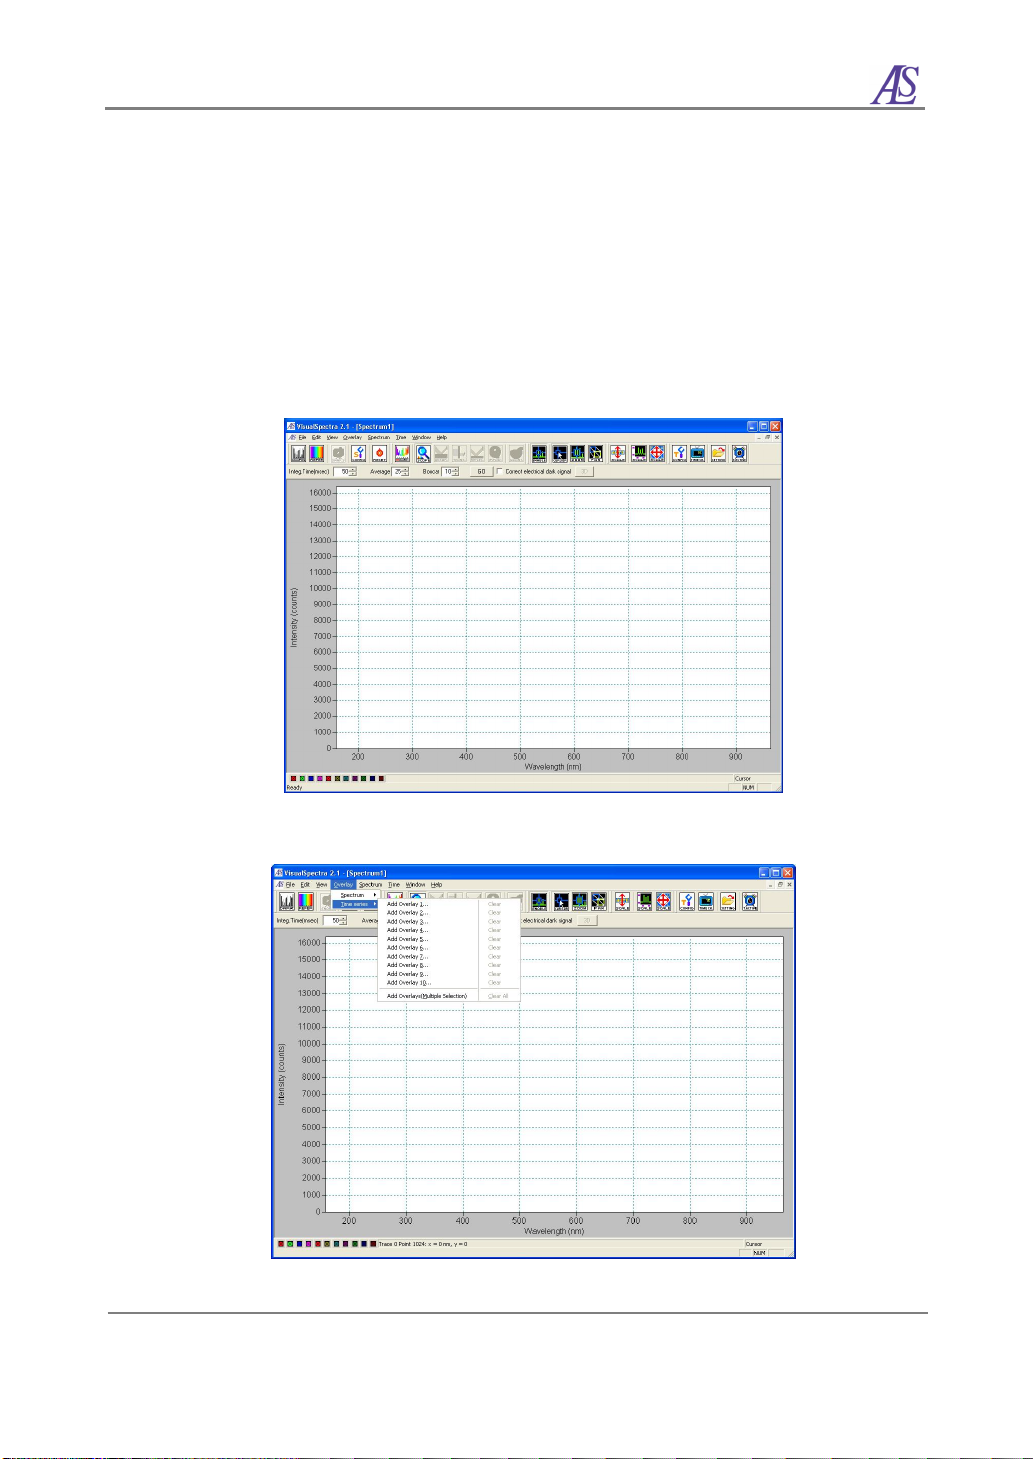
Data can be overlaid on software for analysis. The overlay method is different according to
the type of the data. Please proceed to the following steps to concrete your data.
6-1-1. Overlay of Time Series data
Open the software.
<Fig. 6-1-1>
Open a “*.timeall“ data by “Overlay”/”Time series”/”Add Overlay”.
<Fig. 6-1-2>
SEC2000 Spectra System
www.als-japan.com
45
Page 46
SEC2000 Operating Manual
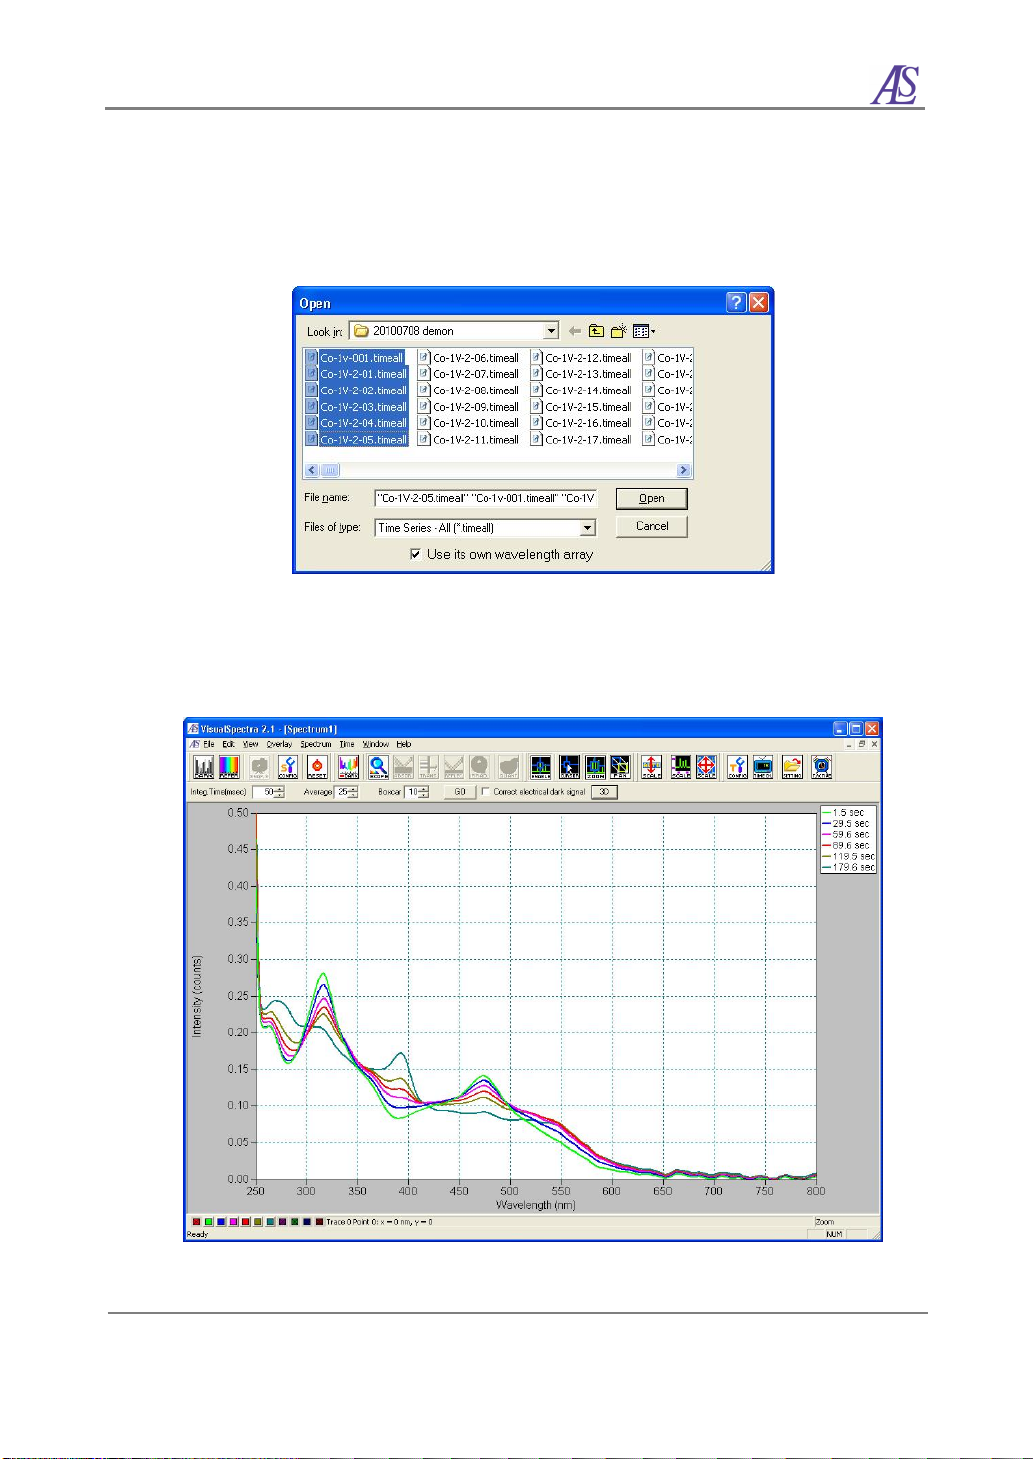
Fig.6-1-3 shows opening data by “Add Overlay (Multiple Selection)”. You may
overlay 10 files at the same time.
<Fig. 6-1-3>
Adjust the scale, specify the optimal range, and then the data are displayed. The
legend is shown in the right side of the graph. The data name is shown at the time
of the measurement of the time course.
<Fig. 6-1-4>
SEC2000 Spectra System
www.als-japan.com
46
Page 47
SEC2000 Operating Manual
6-1-2. Overlay of Sample data
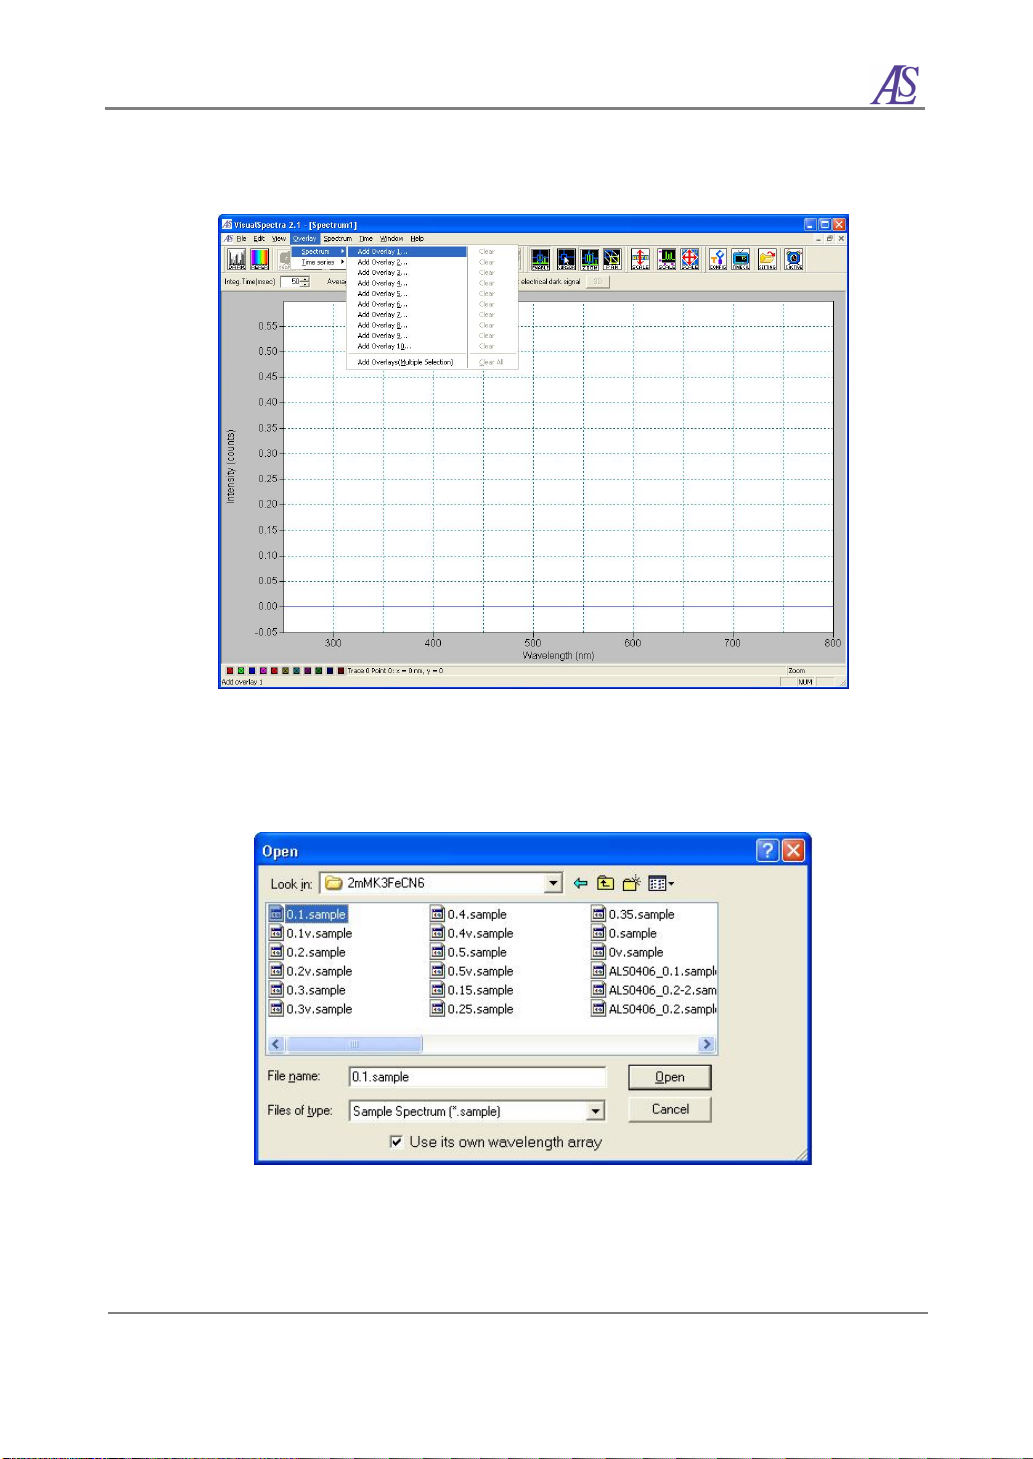
⑥ Open a “*. sample“ data by “Overlay”/”Spectrum”/”Add Overlay”.
<Fig. 6-1-5>
⑦ Fig. 6-1-6 shows opening data by “Add Overlay (Multiple Selection)”. You may
overlay 10 files at the same time.
<Fig. 6-1-6>
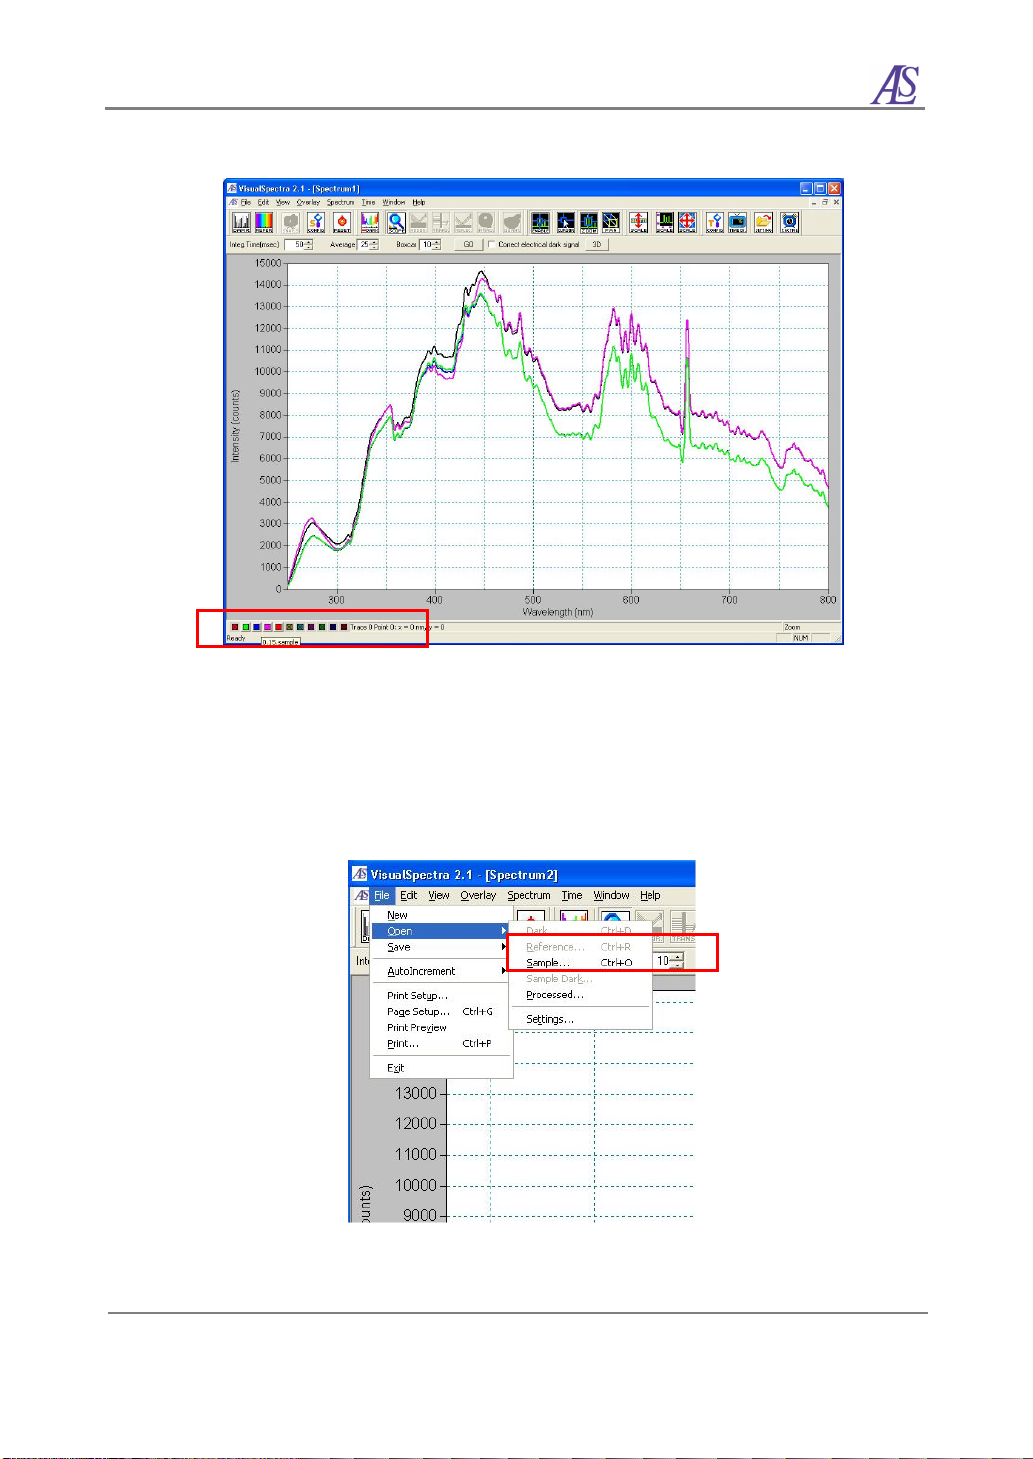
⑧ Adjust the scale, specify the optimal range, and then the data are displayed. There
is no legend. Place your mouse on the lower left color icon (11 pieces), and then
SEC2000 Spectra System
www.als-japan.com
47
Page 48
SEC2000 Operating Manual
the data name for every overlay color will be shown.
<Fig. 6-1-7>
6-1-3. Overlay of Processed data
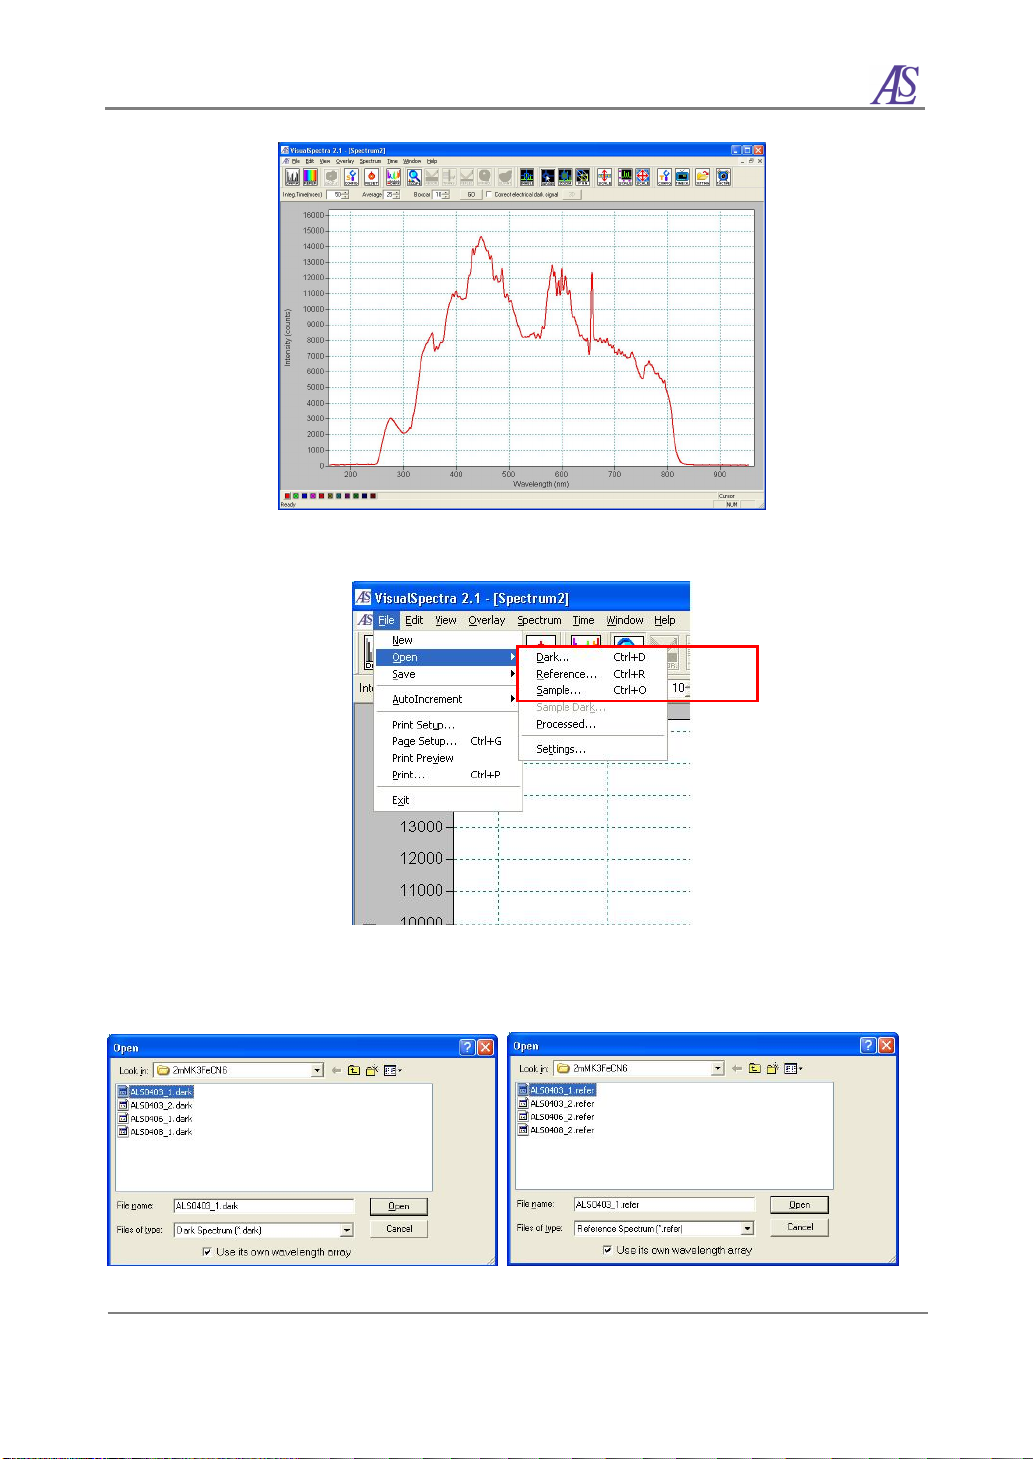
To overlay a processed data (*.absorb/*.trans/*.refl/*.irrad), you must install the
Dark and Reference data first. Open any sample data by “File”/”Open/ ”Sample”.
<Fig. 6-1-8>
SEC2000 Spectra System
www.als-japan.com
48
Page 49
SEC2000 Operating Manual
<Fig. 6-1-9>
"Dark" and "Reference" which were shown by gray become effective.
<Fig. 6-1-10
Open the dark data saved in the same condition as saving processed data, by
“File”/”Open”/”Dark”. Then open the reference data.
<Fig. 6-1-11>
SEC2000 Spectra System
www.als-japan.com
49
Page 50
SEC2000 Operating Manual
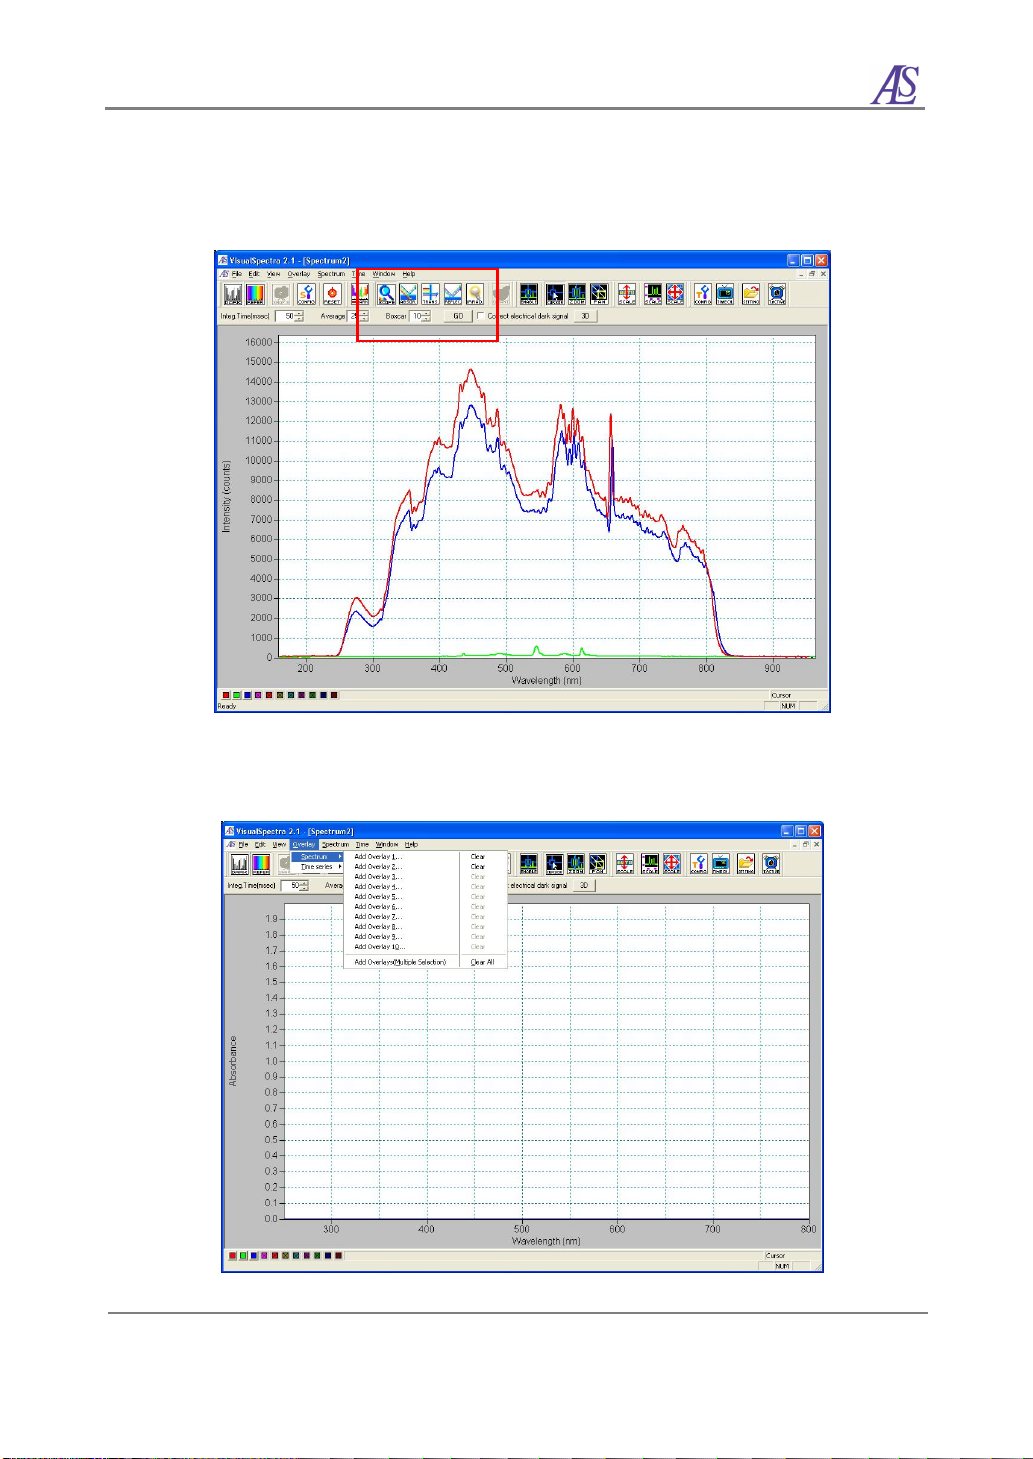
Dark and reference spectra are automatically overlaid to Overlay1 and 2. The
icons of Absorbance/ Transmittance/ Reflectance/ Irradiance become
effective.
<Fig. 6-1-12>
Change the mode to Absorbance Mode. Then overlay a “*.absorb” data by
“Overlay”/”Spectrum”/”Add Overlay”.
<Fig. 6-1-13>
SEC2000 Spectra System
www.als-japan.com
50
Page 51
SEC2000 Operating Manual
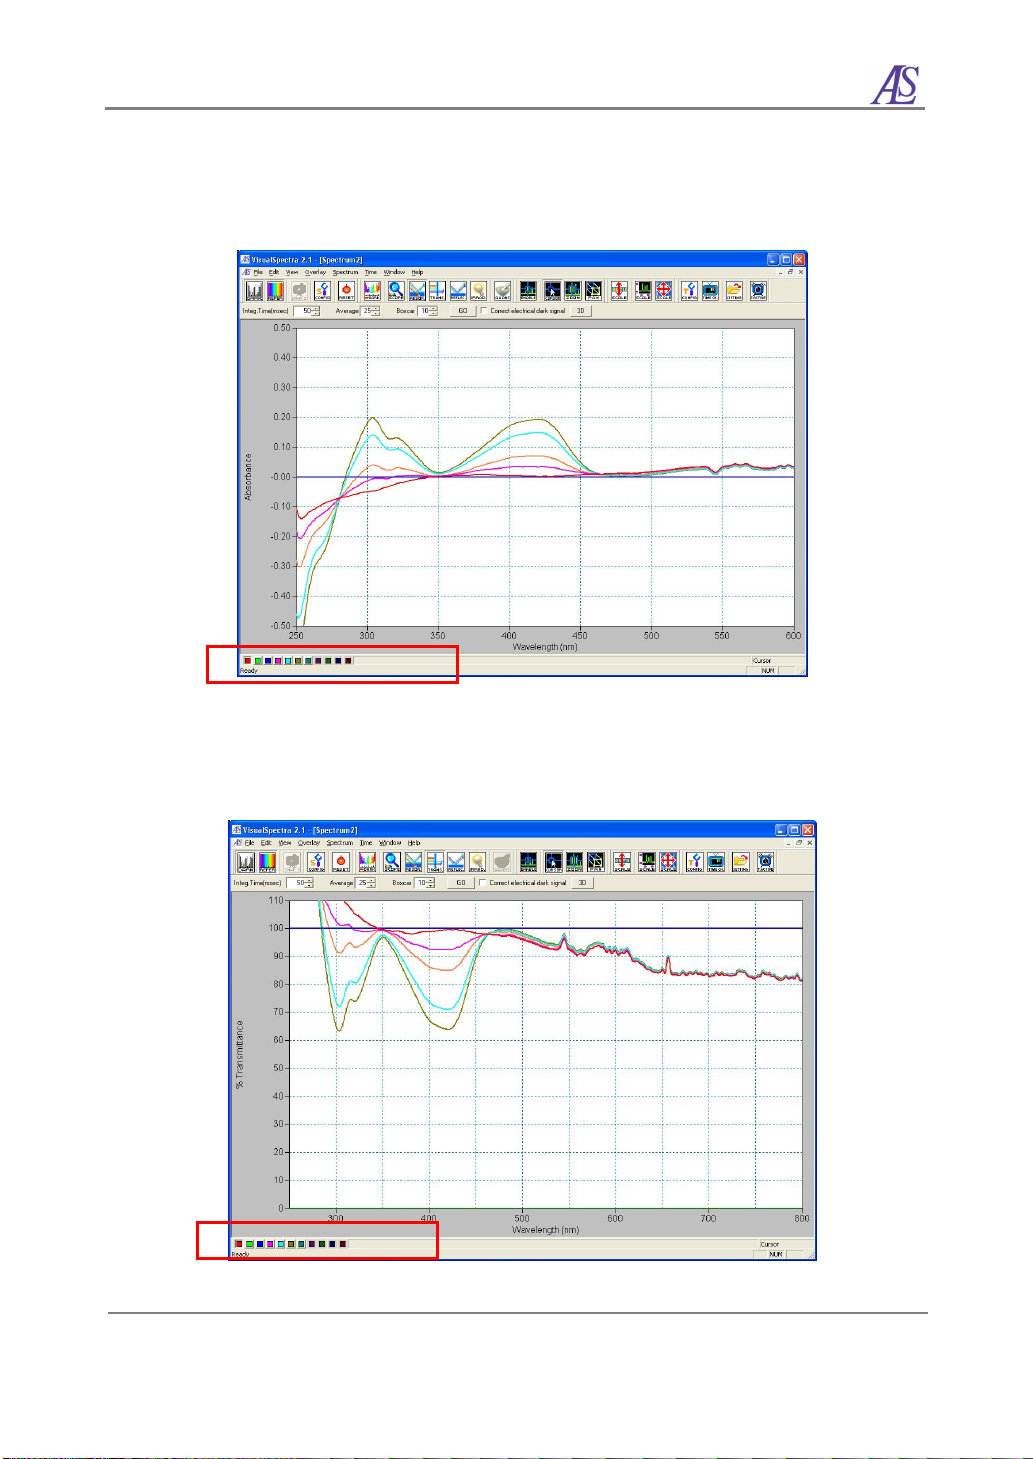
Adjust the scale, specify the optimal range, and then the data are displayed.
There is no legend. Place your mouse on the lower left color icon (11 pieces),
and then the data name for every overlay color will be shown.
<Fig. 6-1-14>
To overlay a *.trans/*.refl/*.irrad data, same to the step , change the mode to
Transmittance/Reflectance/Irridiance Mode, and then overlay the data by
“Overlay”/ ”Spectrum”/ ”Add Overlay”.
<Fig. 6-1-15>
SEC2000 Spectra System
www.als-japan.com
51
Page 52
SEC2000 Operating Manual
6-2. Quantitative Analysis with Calibration Method
6-2-1. Calibration method by calculating the absorbance area
The measuring results are quantitatively analyzed by using the absorbance area of the
selected wavelength range after calibrating the baseline. It is possible only in
absorbance mode.
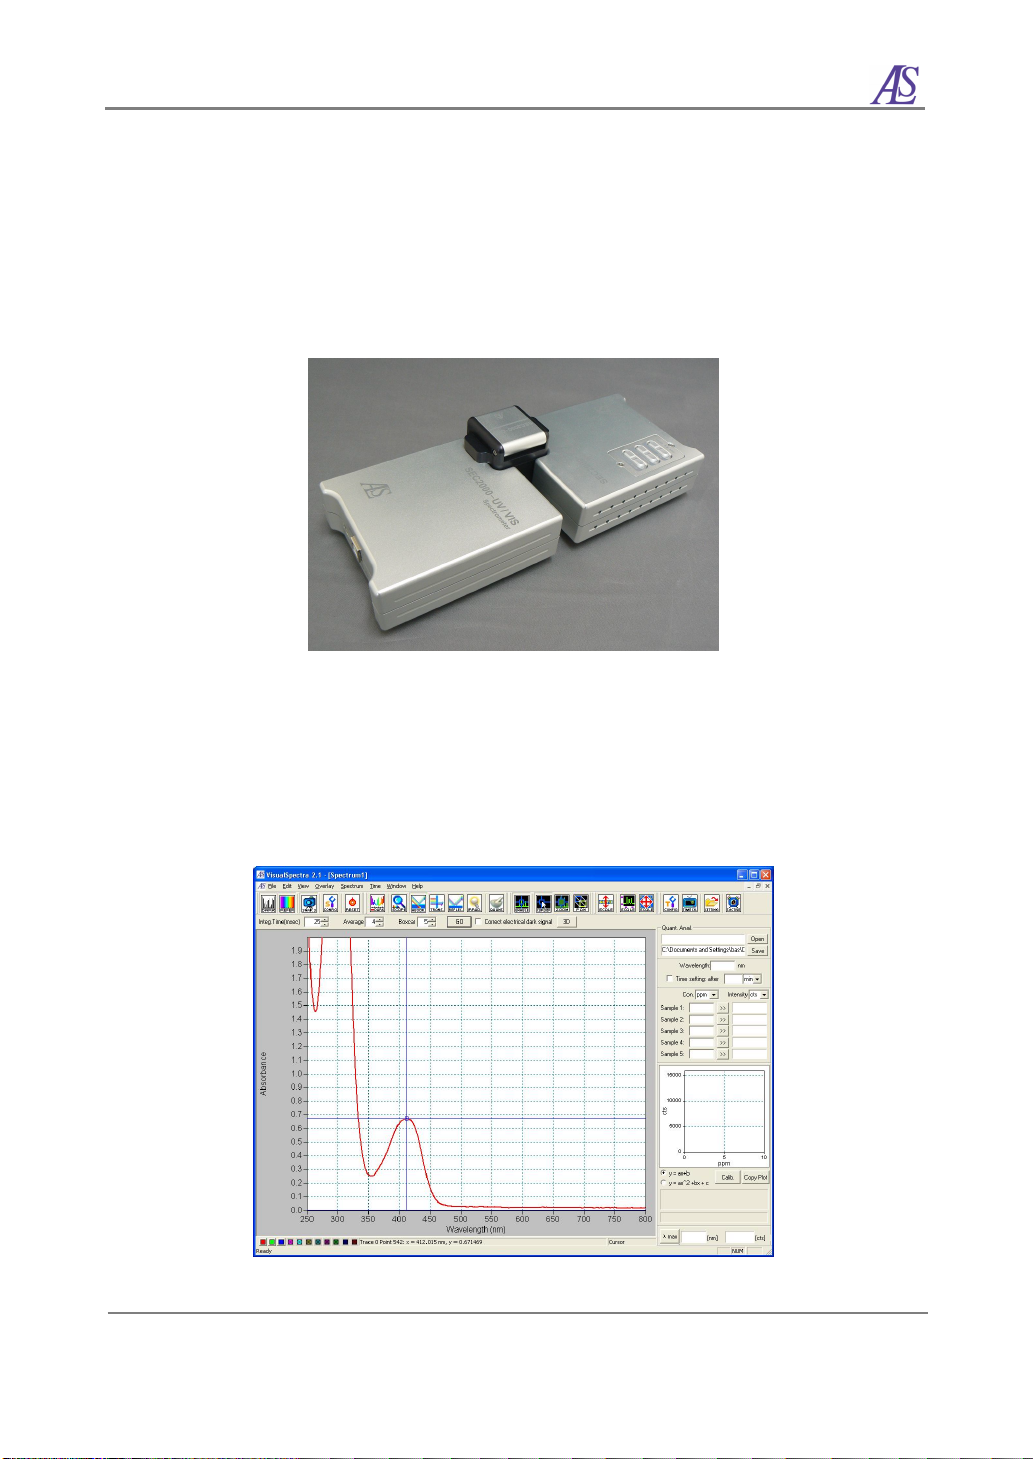
① Set the spectrometer system as shown in Fig. 6-2-1.
<Fig. 6-2-1> Configuration for an absorbance experiment.
② A reference spectrum and a dark spectrum are measured in the same procedure as
absorbance measurement. Put a standard sample into the cuvette holder in
absorbance mode, then the screen will become as Fig. 6-2-2. The following
procedures make 1 mM potassium ferricyanide as an example.
<Fig. 6-2-2> Absorbance of 1 mM K3Fe(CN)6 solution.
SEC2000 Spectra System
www.als-japan.com
52
Page 53
SEC2000 Operating Manual
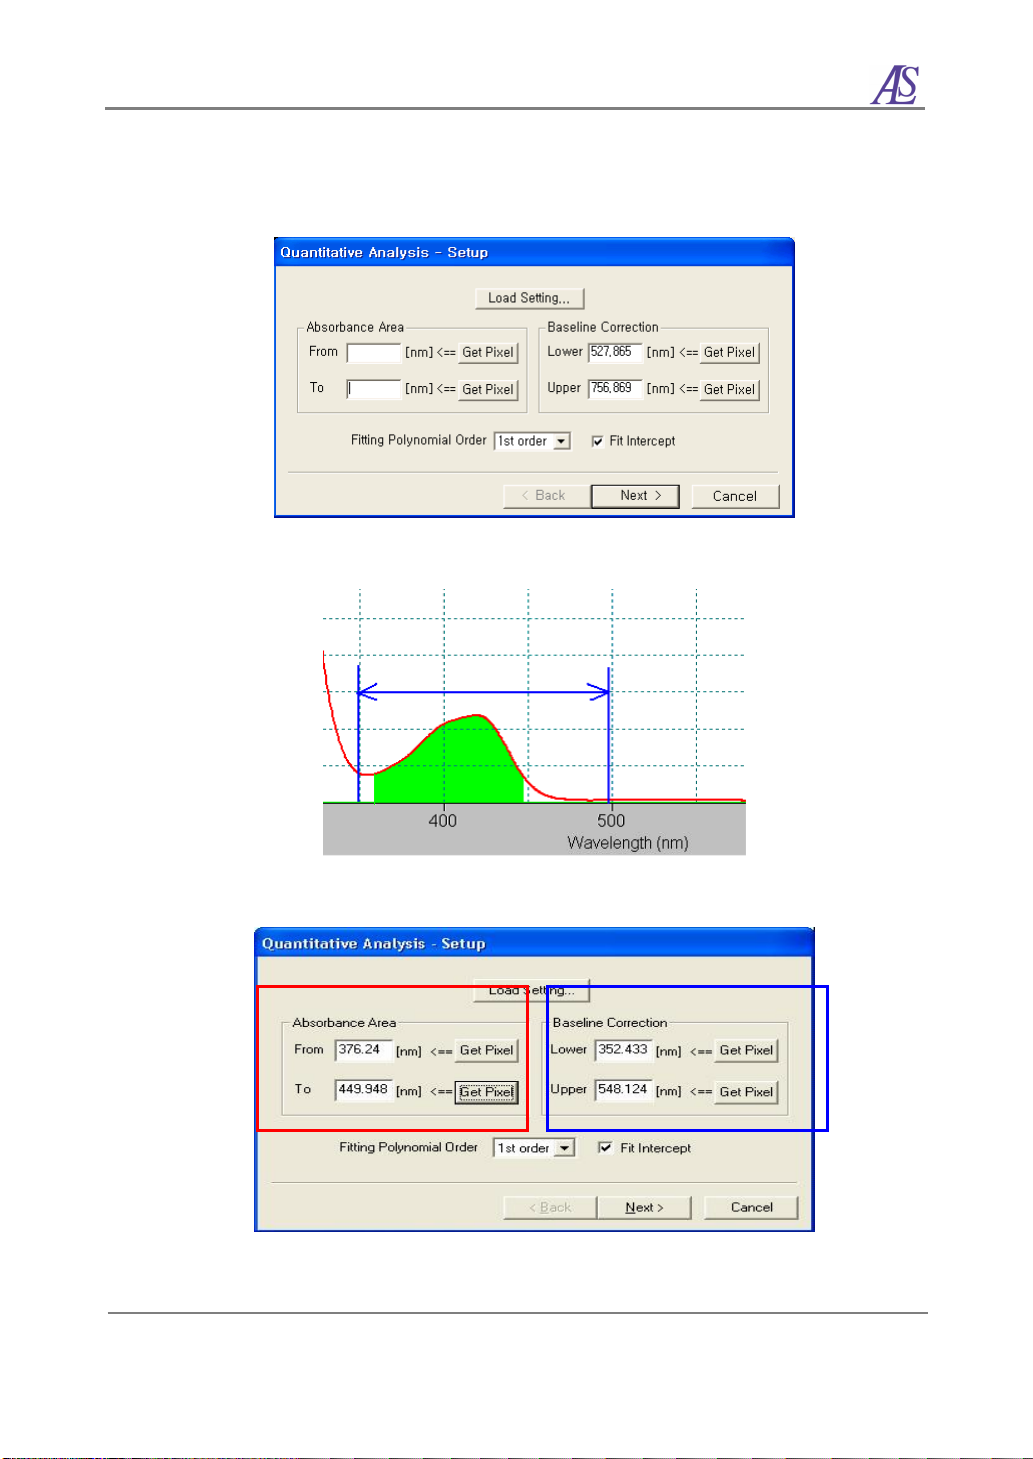
③ Click “Spectrum” / ”Quantitative Analysis”, then the “Quantitative Analysis-
Setup” window will be displayed.
<Fig. 6-2-3>
④ Set the ”Baseline Correction” range according to Fig. 6-2-4.
Baseline Correction range
Absorbance Area
<Fig. 6-2-4>
⑤ Set the ”Absorbance Area” according to Fig. 6-2-4. Click “Next”.
④ ⑤
<Fig. 6-2-5> Selection of wavelength range for the absorbance area and
Baseline Correction.
SEC2000 Spectra System
www.als-japan.com
53
Page 54
SEC2000 Operating Manual
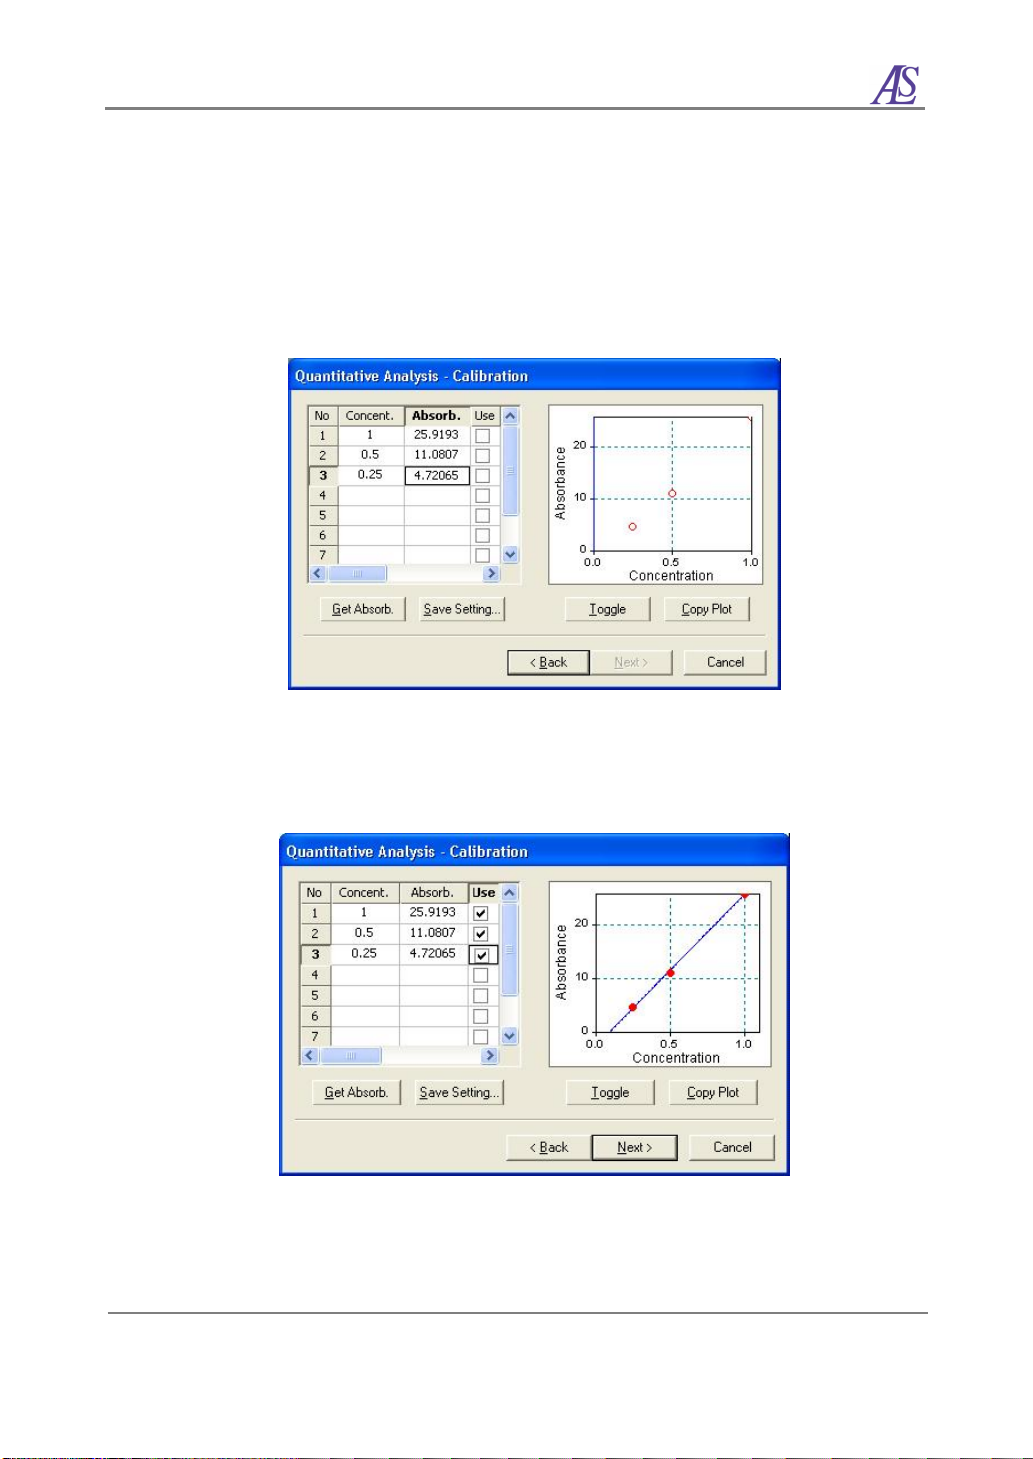
⑥ On the step of ”Quantitative Analysis- Calibration”, to measure the absorbance of
the standard material with known concentration, put a standard sample into the
cuvette holder, and input data in “Concent.” Column. Move your mouse to
“Absorb.” column, and click “Get Absorb.” icon to calculate the area of the
standard sample (get a calibration line with at least three different concentrations of
standard material).
<Fig. 6-2-6> Absorbance of K3Fe(CN)6 solutions (Concentration: 1, 0.5 and 0.25 mM).
⑦ Click “Use”, then calibration line is obtained as shown in Fig. 6-2-7.
<Fig. 6-2-7> Calibration line with three different concentrations.
The standard samples are shown in closed circle.
SEC2000 Spectra System
www.als-japan.com
54
Page 55
SEC2000 Operating Manual
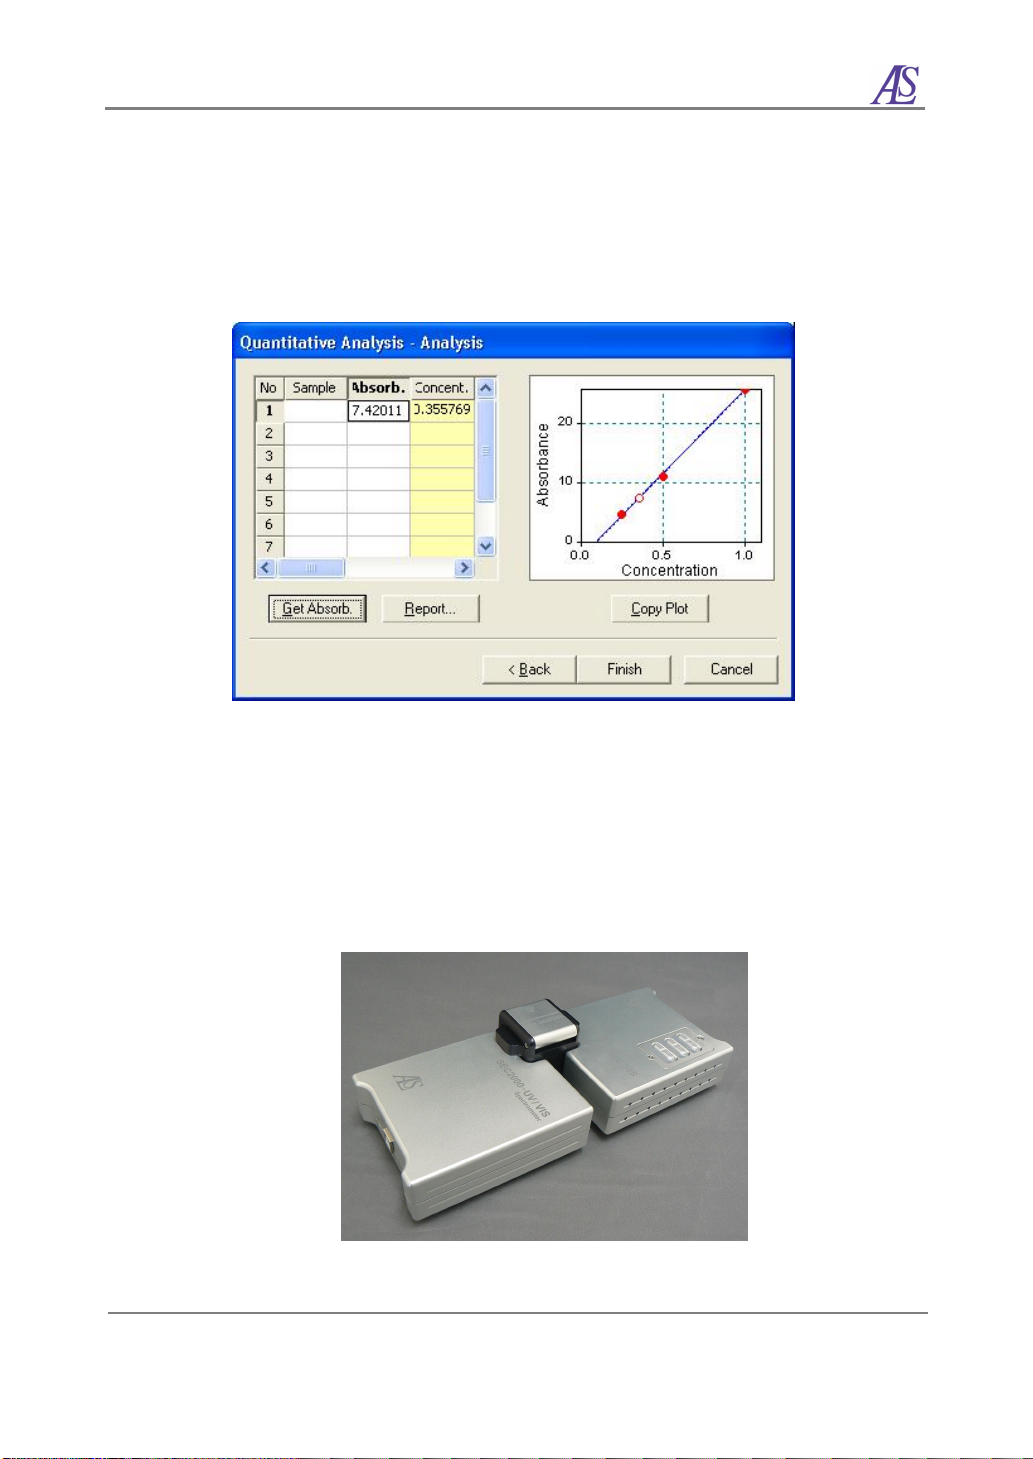
⑧ Click “Next”, on the step of ”Quantitative Analysis-Analysis”, to measure the
absorbance with unknown concentration of sample, put a sample into the cuvette
holder, move your mouse to “Absorb.” column, and click “Get Absorb.” Icon. Then
the concentration of the unknown sample will be calculated and shown in
“Concent.” column.
<Fig. 6-2-7> Quantitative analysis with calibration method.
The unknown concentration of the sample is shown in open circle.
6-2-2. Calibration method by calculating the peak absorbance.
Analyze the concentration of a sample by making calibration line with the peak
absorbance of standard solutions. It is possible only in absorbance mode.
① Set the spectrometer system as shown in Fig. 6-2-8.
<Fig. 6-2-8> Configuration for an absorbance experiment
SEC2000 Spectra System
www.als-japan.com
55
Page 56
SEC2000 Operating Manual
② A reference spectrum and a dark spectrum are measured in the same procedure
as absorbance measurement. Put a standard sample into the cuvette holder in
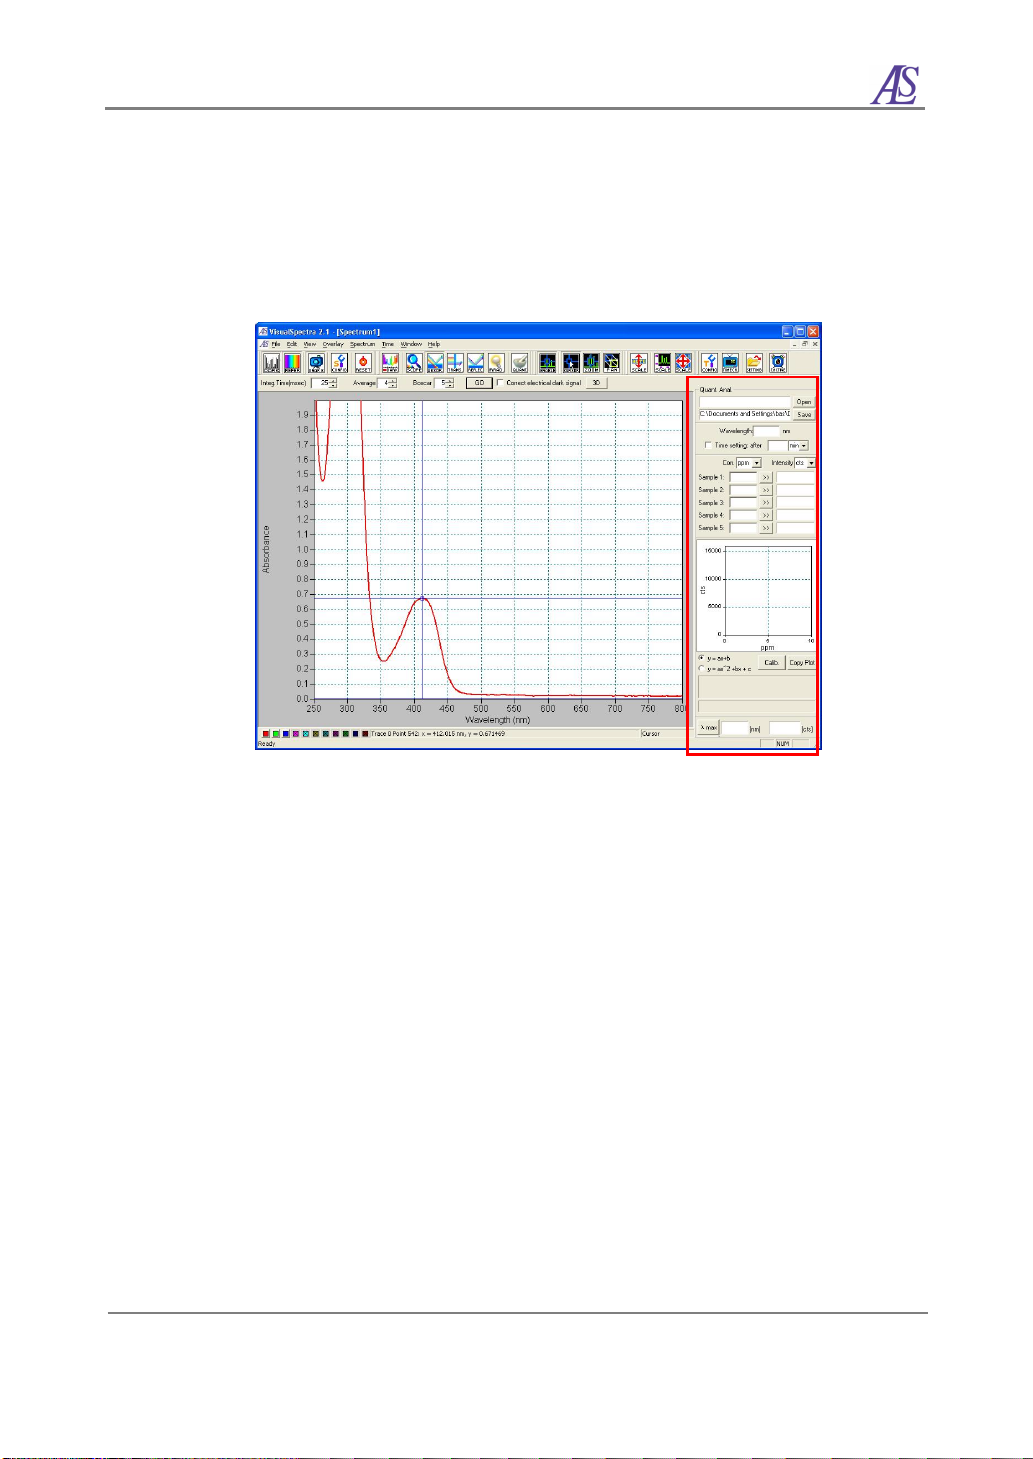
absorbance mode, the screen will become as Fig. 6-2-9. The following
procedures make 1 mM potassium ferricyanide as an example.
<Fig. 6-2-9> Absorbance of 1 mM K3Fe(CN)6 solution.
③ Open the “Quantitative Analysis” window by “View”/“Spectrum Tool Bar”/
check the “Quantitative Analysis”. The window of “Quantitative Analysis” is
shown on the right side of the main screen (Fig. 6-2-9).
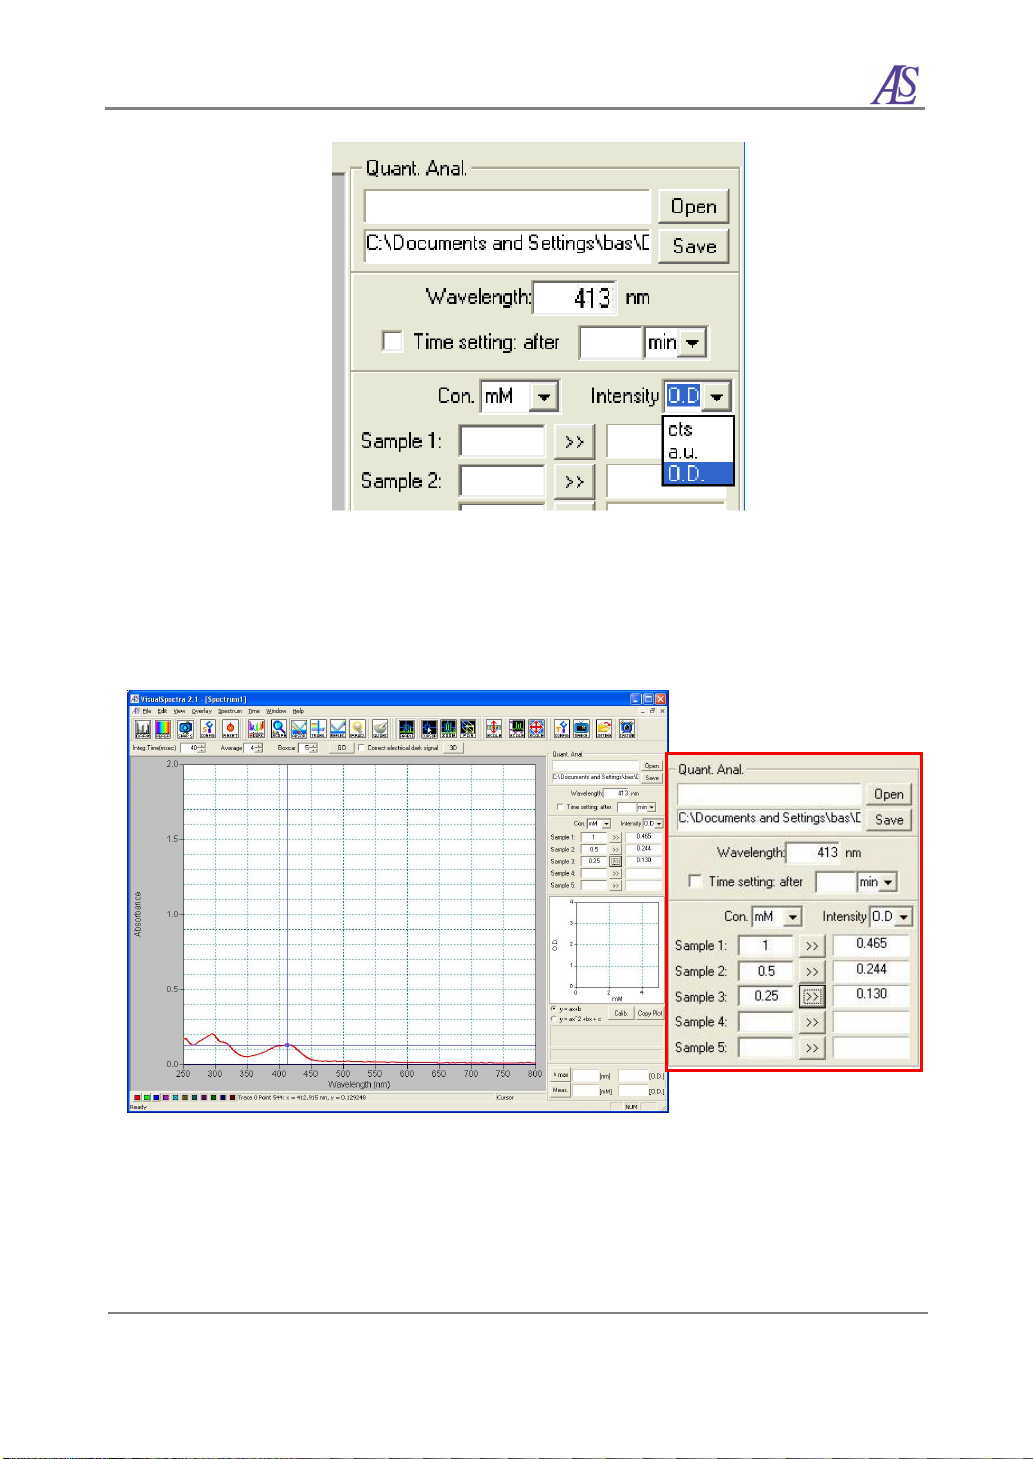
④ Set parameters (Fig. 6-2-10)
Set the file name and folder of saving calibration curve by “Save”.
Set the peak wavelength of the sample by “Wavelength_ nm”, we set 413 nm
for the ferricyanide.
Set the unit of solution concentration by “Con.”, we choose “mM”.
Set the unit of absorbance by “Intensity”, we choose “O.D. ”.
SEC2000 Spectra System
www.als-japan.com
56
Page 57
SEC2000 Operating Manual
<Fig. 6-2-10>
⑤ Input the standard concentration of “Sample 1” to “Sample 5”, and click “>>” The
vertical axis of the peak is read.
<Fig. 6-2-11>
⑥ Change the standard, and get the peak absorbance of each concentration.
SEC2000 Spectra System
www.als-japan.com
57
Page 58
SEC2000 Operating Manual
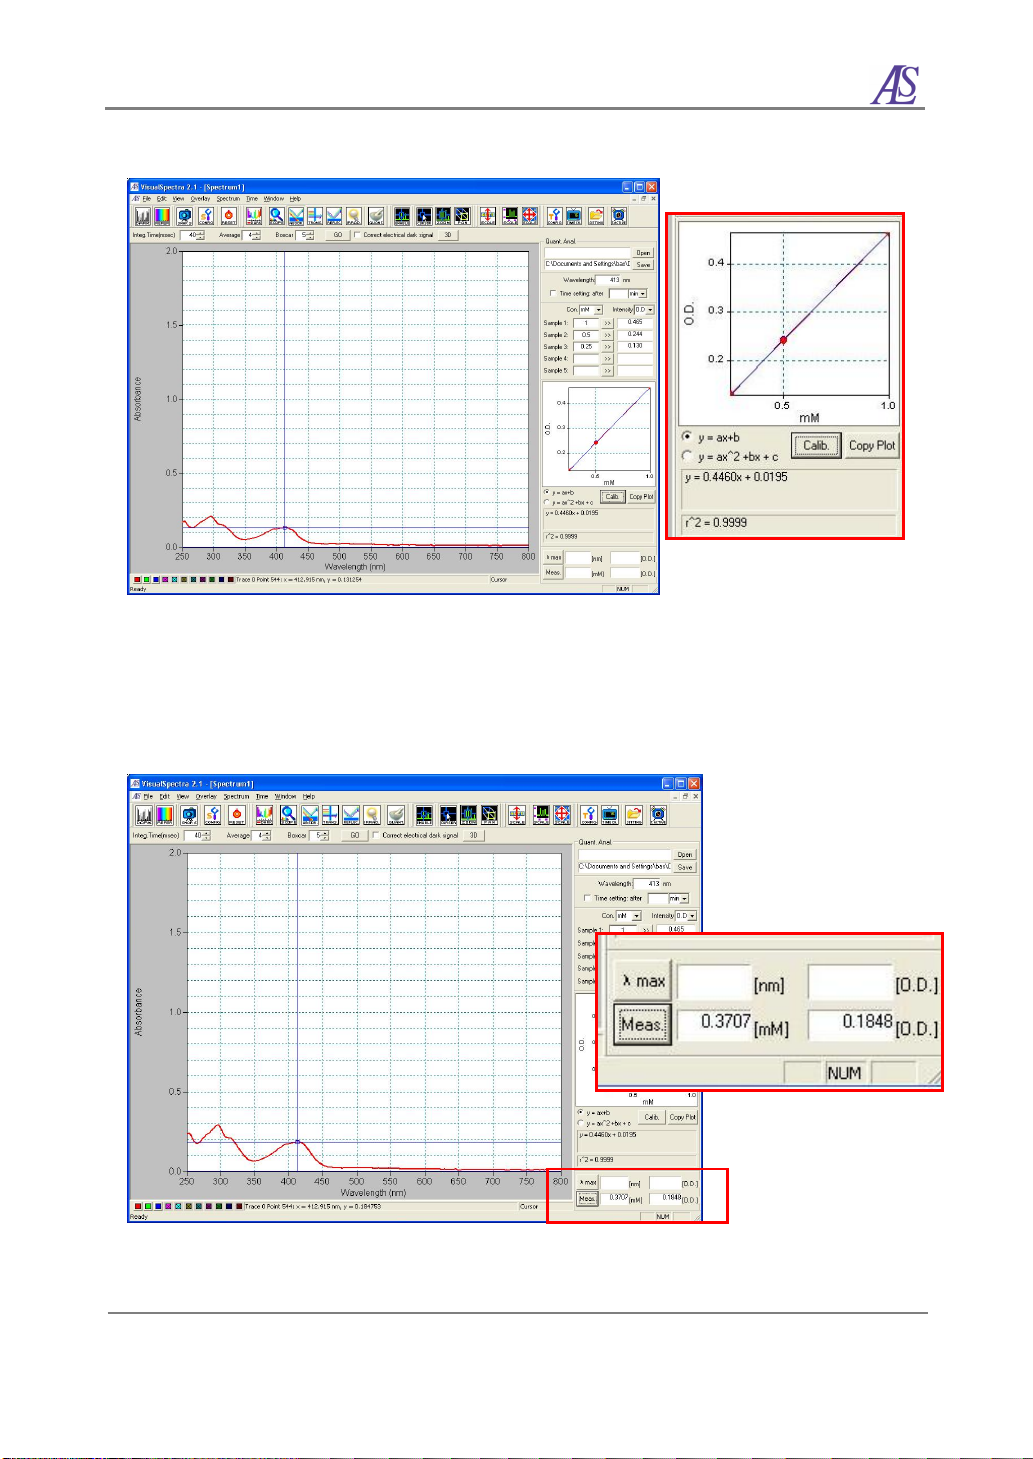
⑦ Click “Calib.”, then the calibration curve is shown in the graph (Fig. 6-2-12).
<Fig. 6-2-12> Calibration line with three different concentrations.
⑧ Put an unknown sample into the cuvette holder, and click “Meas.” icon. The peak
absorbance of the sample is measured and displayed in “O.D.”, and the
concentration is displayed in “ mM” as following Fig. 6-2-13.
<Fig. 6-2-13>
SEC2000 Spectra System
www.als-japan.com
58
Page 59
SEC2000 Operating Manual
7. Multi-Channel
7-1. Purpose of Multi-Channel
This function is designed for you to use several spectrometers on one PC. You can use
five spectrometers at the same time.
7-2. Configure the software
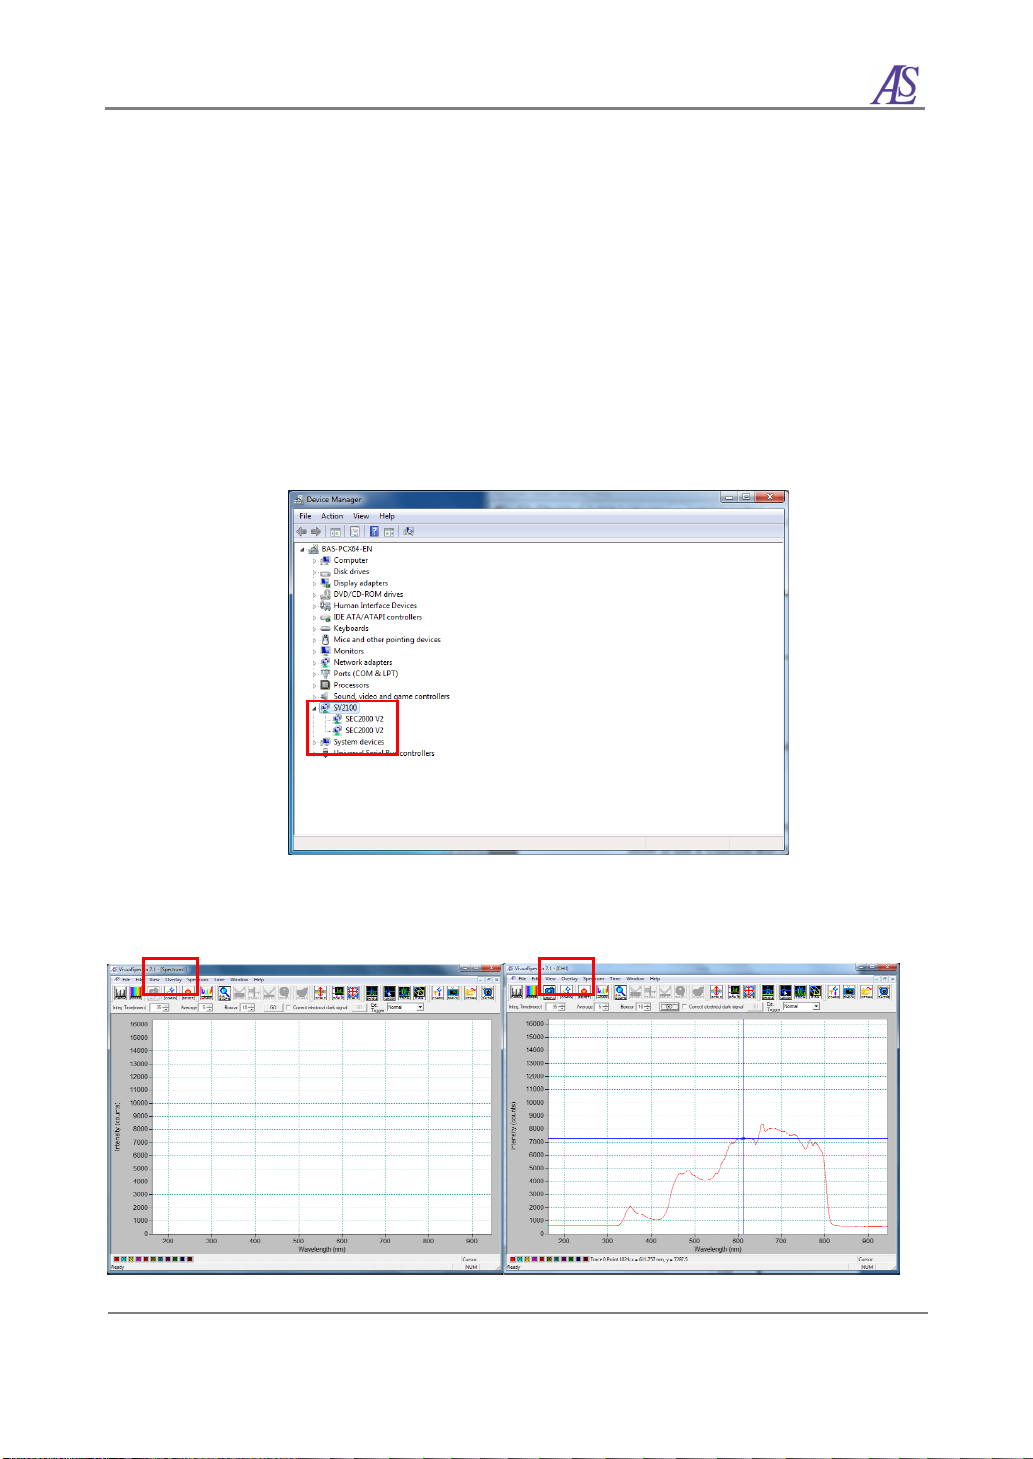
① Connect the spectrometers to PC with USB cables. Using a notebook PC, you had
better to use a USBHUB with the power supply to connect the spectrometers. And
you can confirm the connection from “Device Manager” as shown in Fig.7-2-1.
<Fig.7-2-1>
② Open the software, it shows as [Spectrum1]. Click the “GO” icon, the
spectrometer set as [CH1] becomes effective (Fig.7-2-2).
<Fig.7-2-2>
SEC2000 Spectra System
www.als-japan.com
59
Page 60
SEC2000 Operating Manual
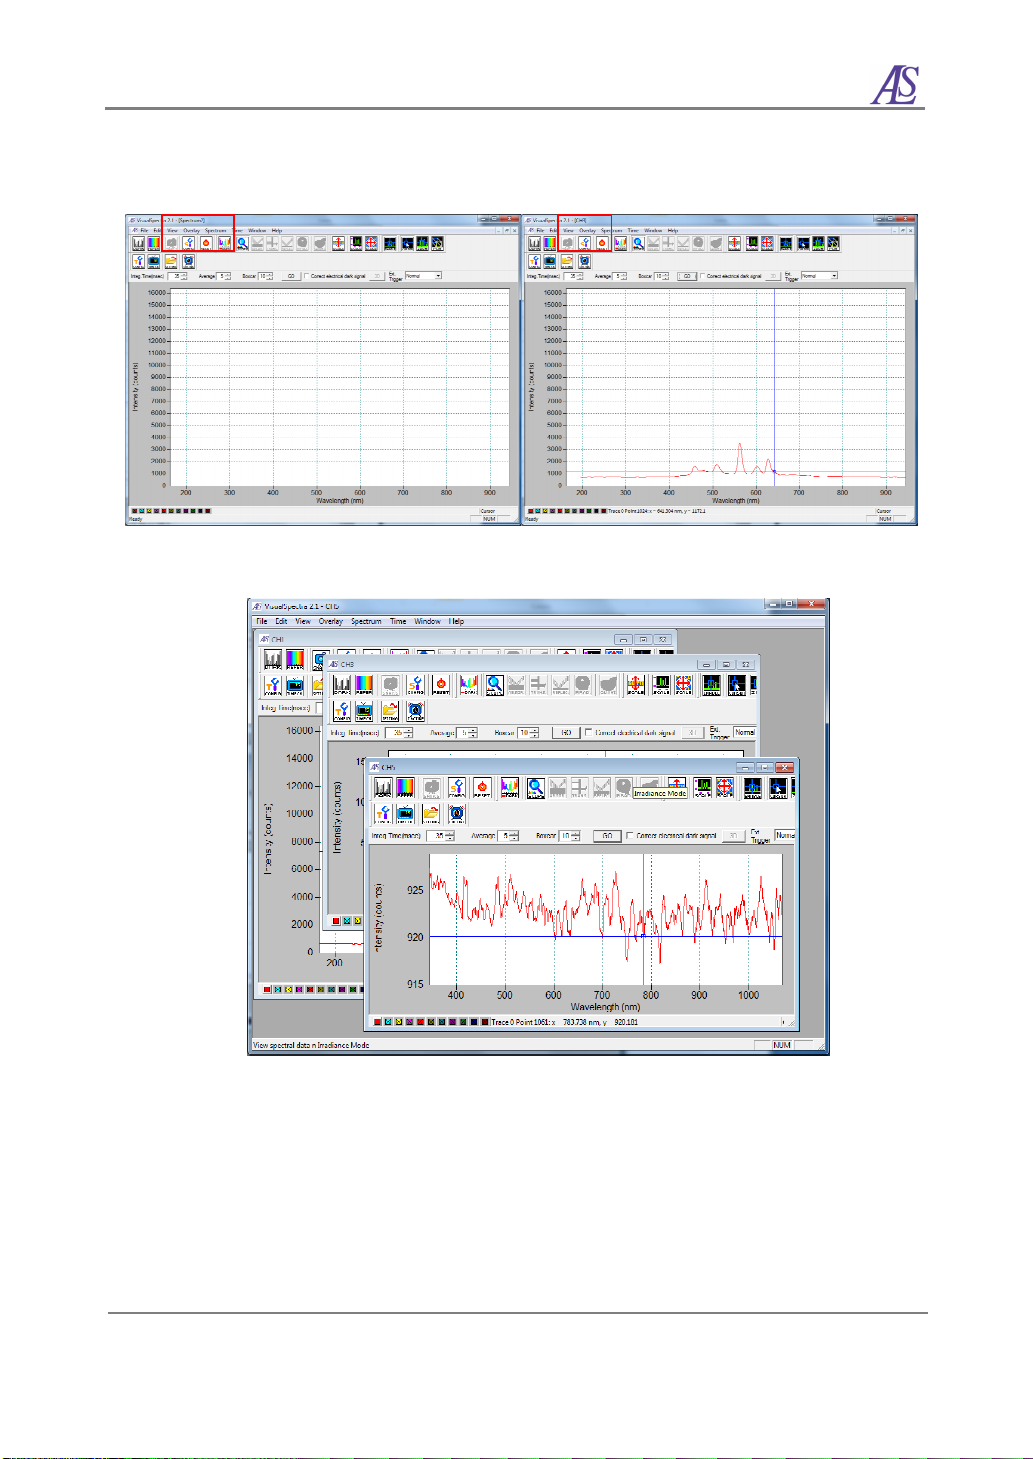
③ Click “File”/ ”New”, you can open a new window shown as [Spectrum2]. Click the
“GO” icon, the spectrometer set as the next [CH*] becomes effective (Fig.7-2-3).
<Fig.7-2-3>
④ Regulate each window to suitable size.
<Fig.7-2-4>
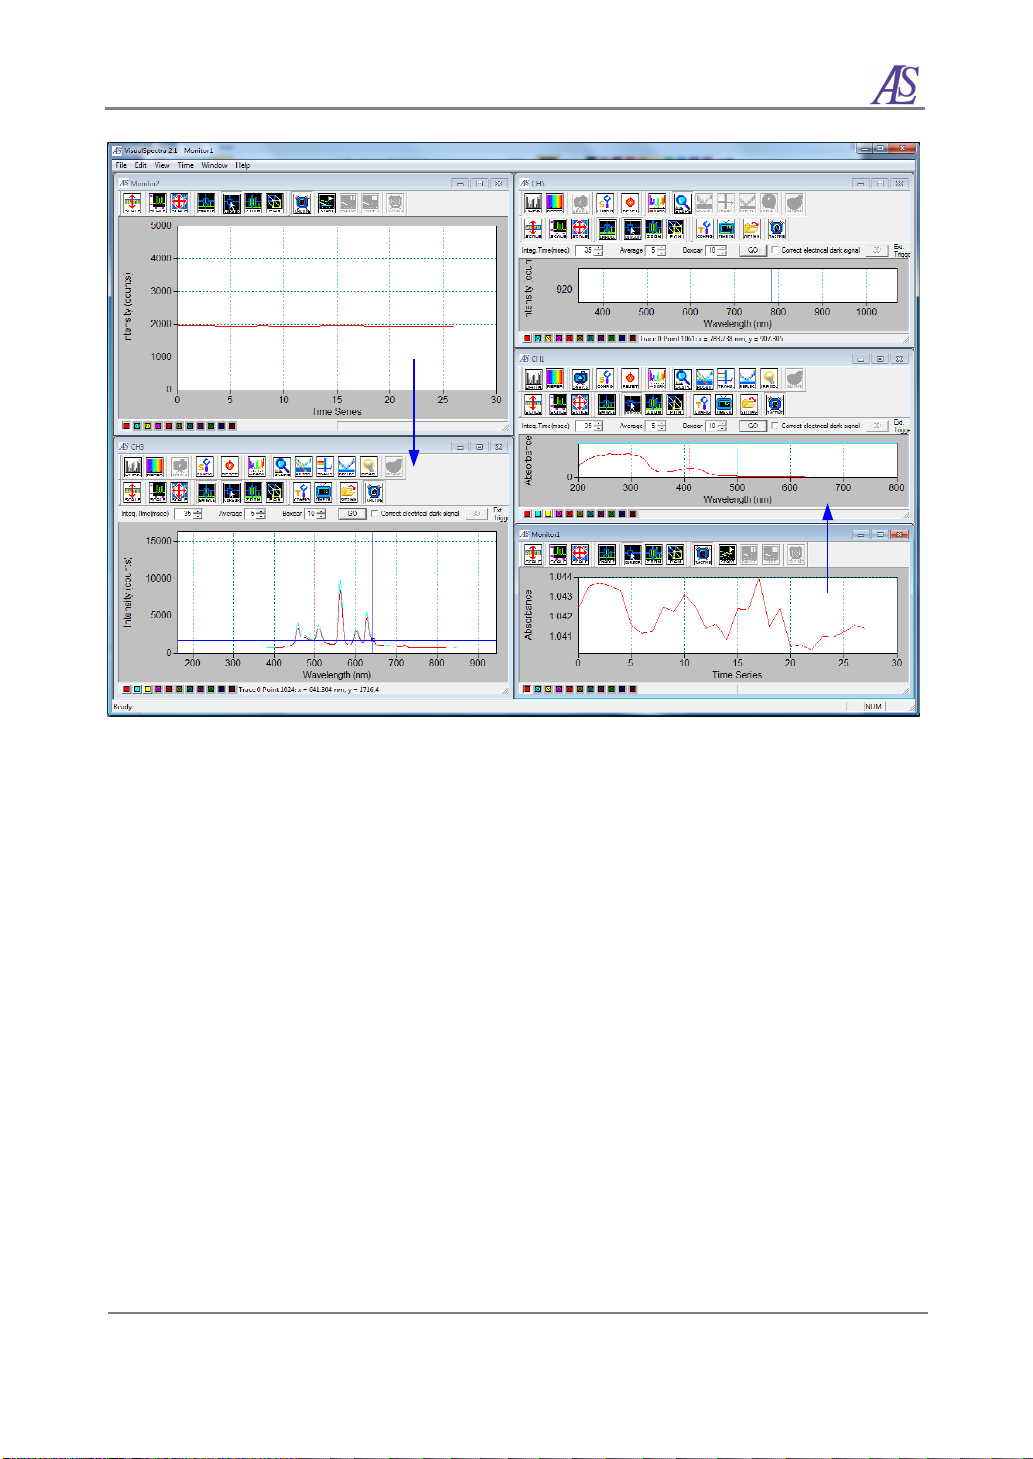
⑤ The time course measurement for each channel is displayed as [Monitor1] and
[Monitor2]. It indicates opening number in turn, but not corresponds to Channel
number. As shown, for example, in Fig. 7-2-5, Monitor1 corresponds to CH1, and
Monitor2 corresponds to CH3.
SEC2000 Spectra System
www.als-japan.com
60
Page 61
SEC2000 Operating Manual
<Fig.7-2-5>
SEC2000 Spectra System
www.als-japan.com
61
Page 62
SEC2000 Operating Manual
8. Trigger
8-1. External trigger
It is a new developed function for external trigger to synchronize spectrum
measurement with other measurements (for example, electrochemistry measurement).
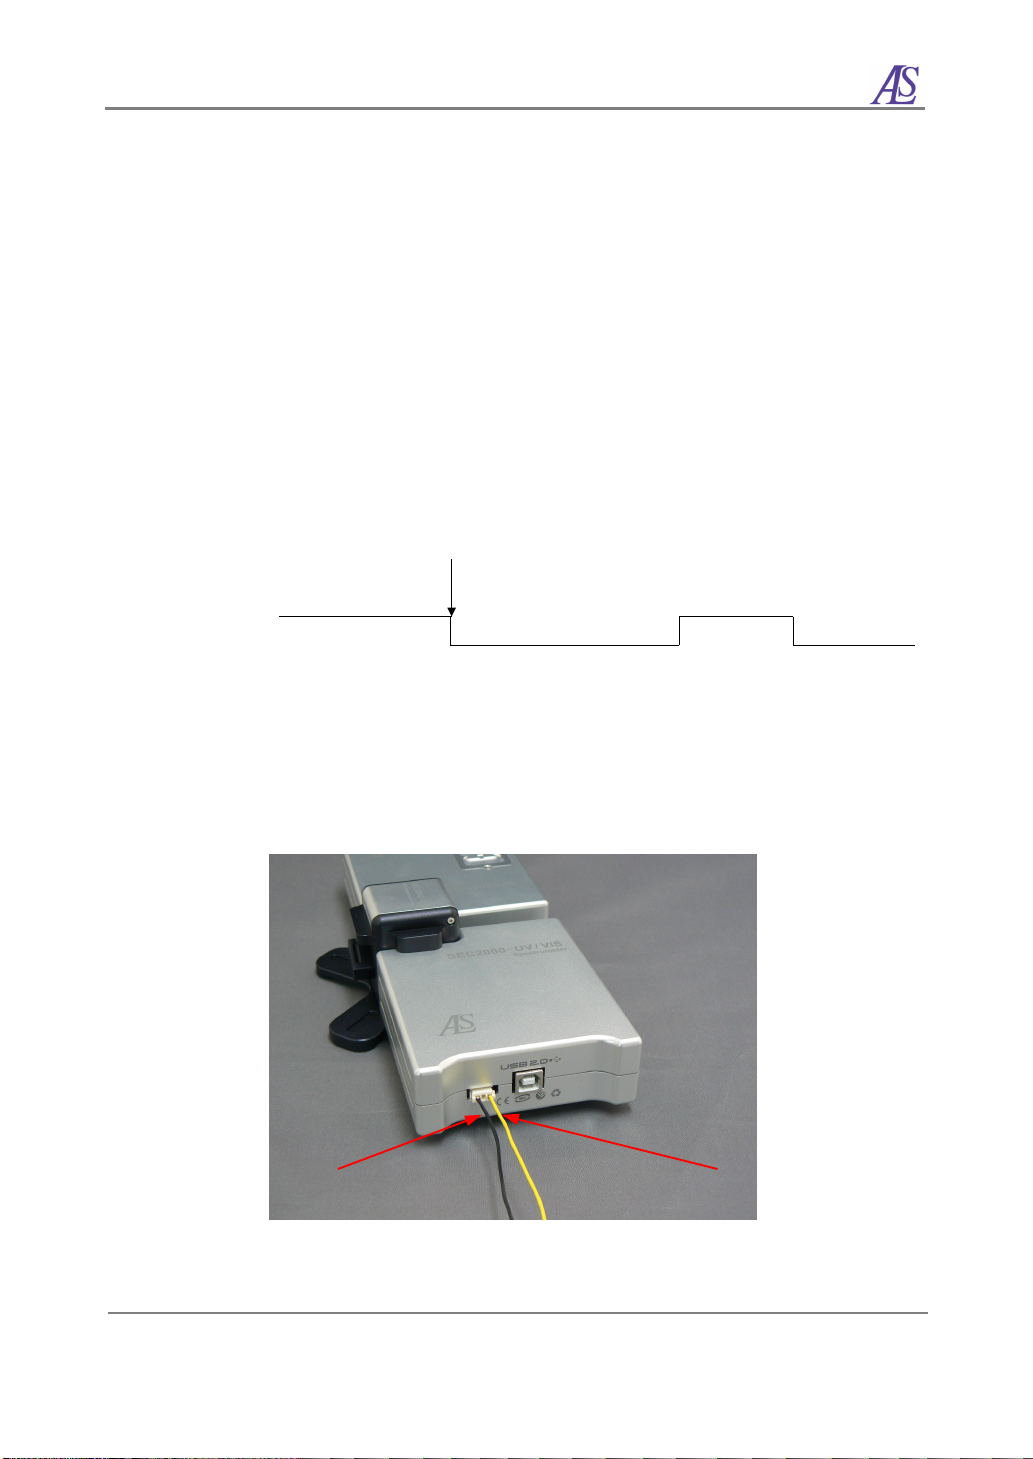
Start the spectrum measurement by an external TTL signal. Fig.8-1-1 shows the signal
chart of Low Level mode. When the external signal (Trigger In) changes from 5 V to 0 V,
the spectrum measurement starts. There are High Level mode also. It's signal chart is
reversed to the Low Level mode. The follow procedure describes the operation on the
Low Level mode.
CCD data request Trigger off : S/W off command
5 V
Trigger on
H/W
Trigger in
0 V
<Fig. 8-1-1 External Trigger Signal: Low level>
8-2. External trigger
Fig.8-2-1 shows the Trigger In connector. The black wire is for Ground (GND)
and the yellow wire is for Trigger In.
GND Trigger In: 5 V
<Fig. 8-2-1 External Trigger connector>
SEC2000 Spectra System
www.als-japan.com
62
Page 63
SEC2000 Operating Manual
8-3. Procedure of the software setting
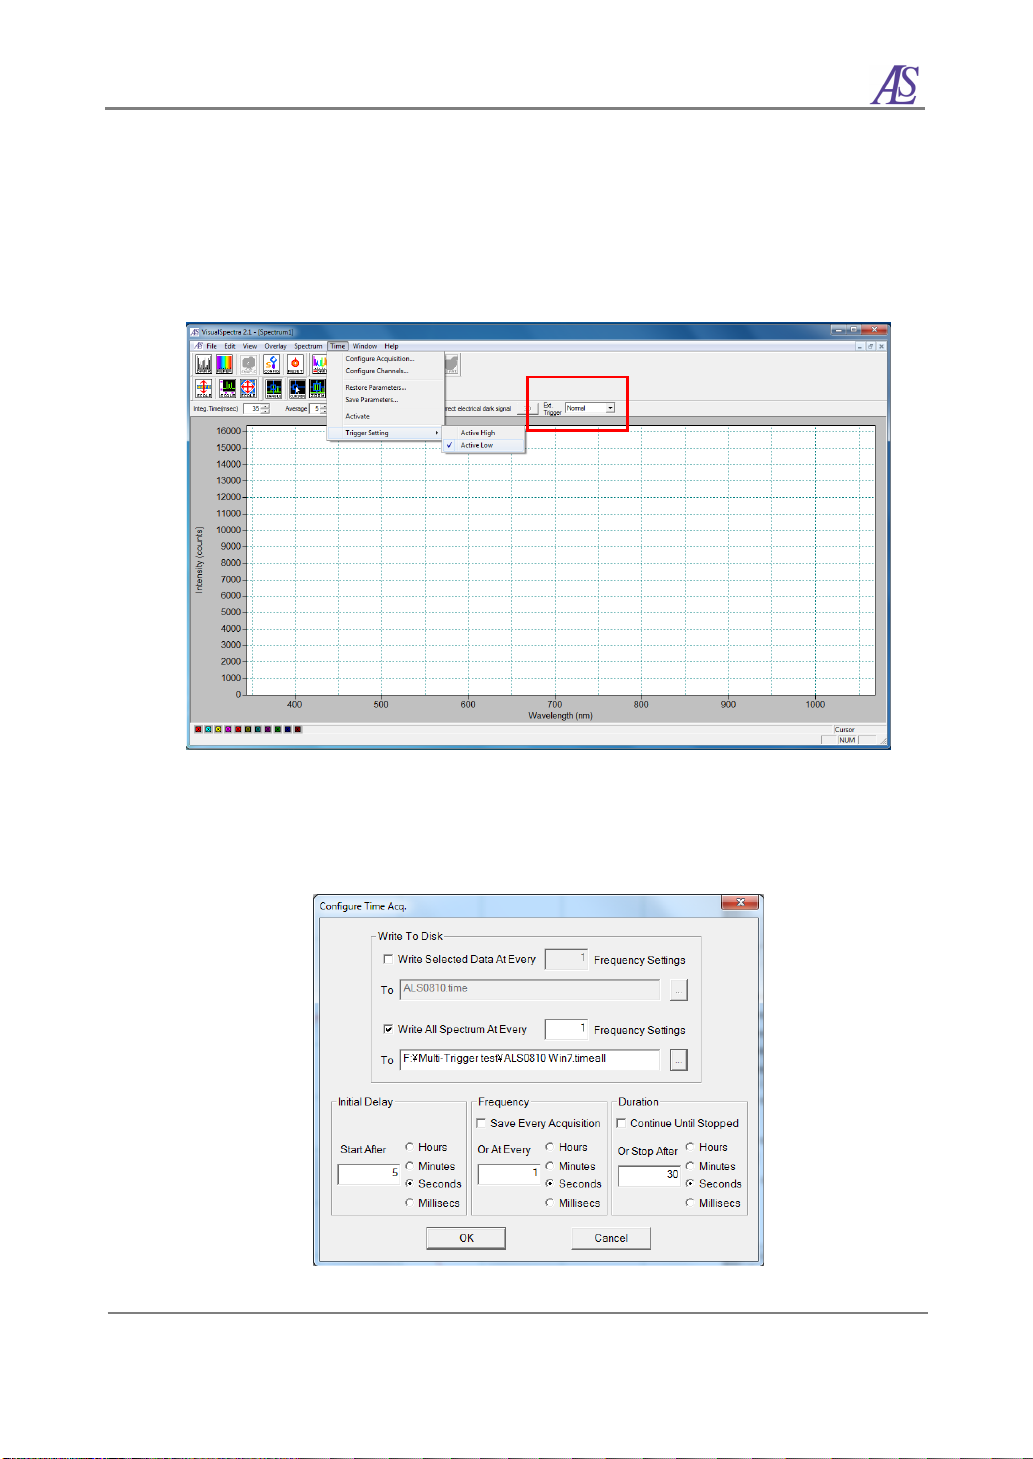
① Open the software, and save the “Reference” and “dark” spectra as common.
② Choose the trigger mode from “Time” / “Trigger Setting” / “Active high”
or “Active low”. We introduce you the Setting of Trigger with the absorbance
measurement as an example.
<Fig. 8-3-2 >
③ Set the “Configure Time Acquisition” (Fig. 8-3-3) at “Ext. Trigger” “Normal”
condition(Fig.8-3-2). The detail of Time acquisition setting is described in 5-7.
of the Chapter 5.
<Fig. 8-3-3 >
SEC2000 Spectra System
www.als-japan.com
63
Page 64
SEC2000 Operating Manual
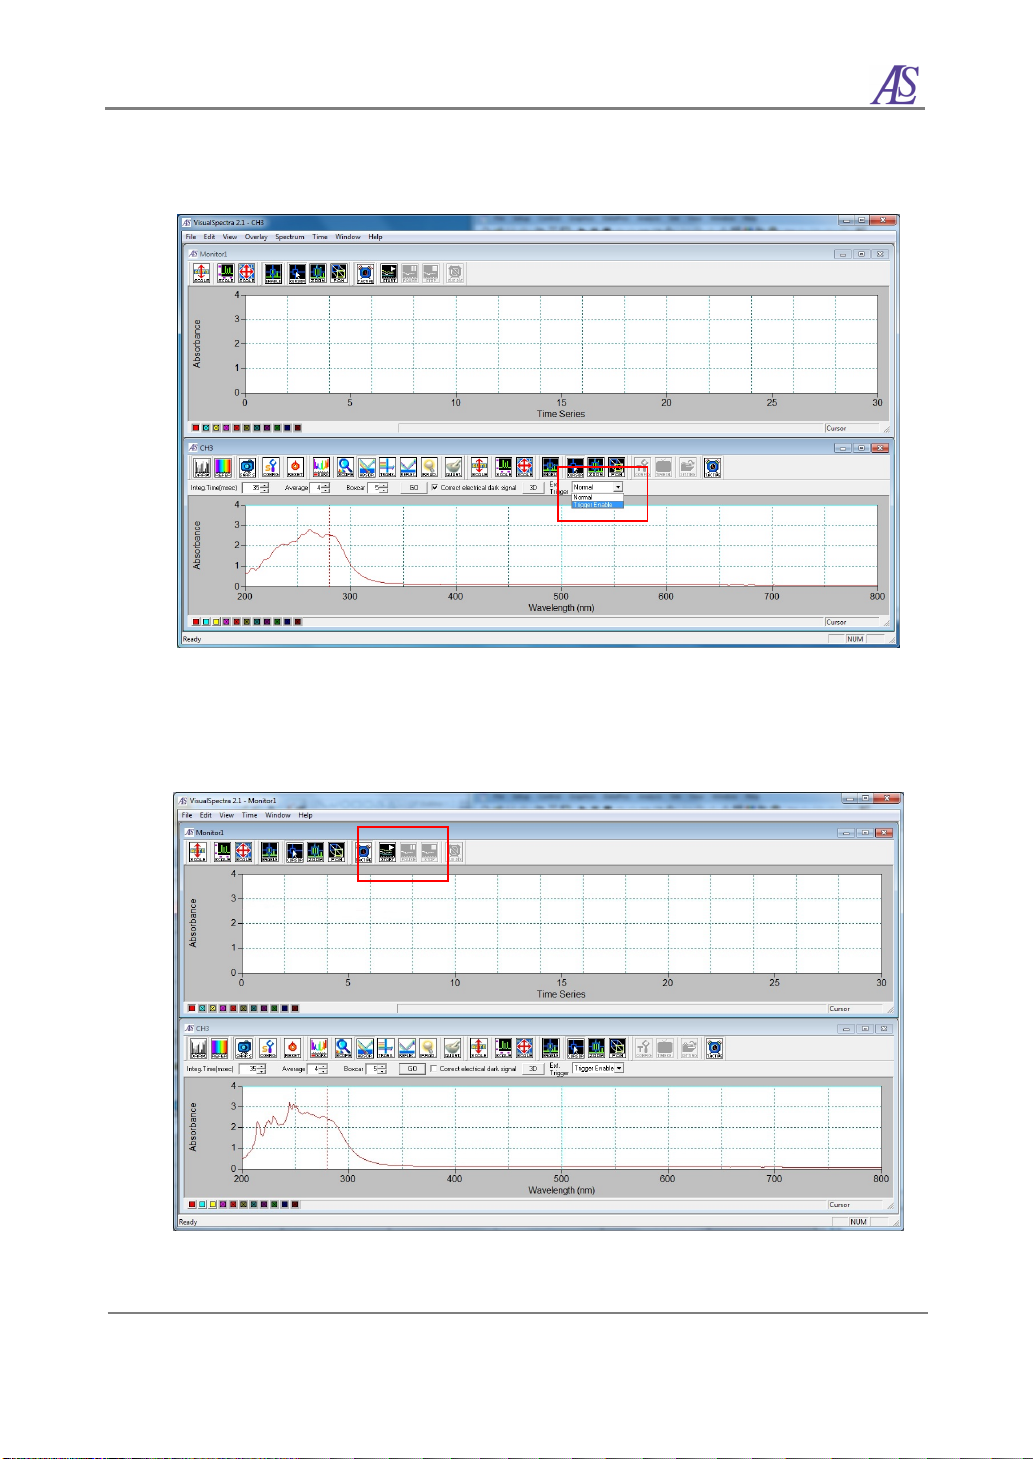
④ Change the “Ext. Trigger” to “Trigger Enable”. The signal of the lower spectrum
screen in Fig.8-3-4 is stopped.
<Fig. 8-3-4 >
⑤ Click the “START” icon in the Monitor1 screen. During this time the external TTL
is 5 V. Waiting for the change of the external TTL, all screens are on standby, and
the spectrum is in condition of the stop state (Fig. 8-3-5).
<Fig. 8-3-5 >
SEC2000 Spectra System
www.als-japan.com
64
Page 65
SEC2000 Operating Manual
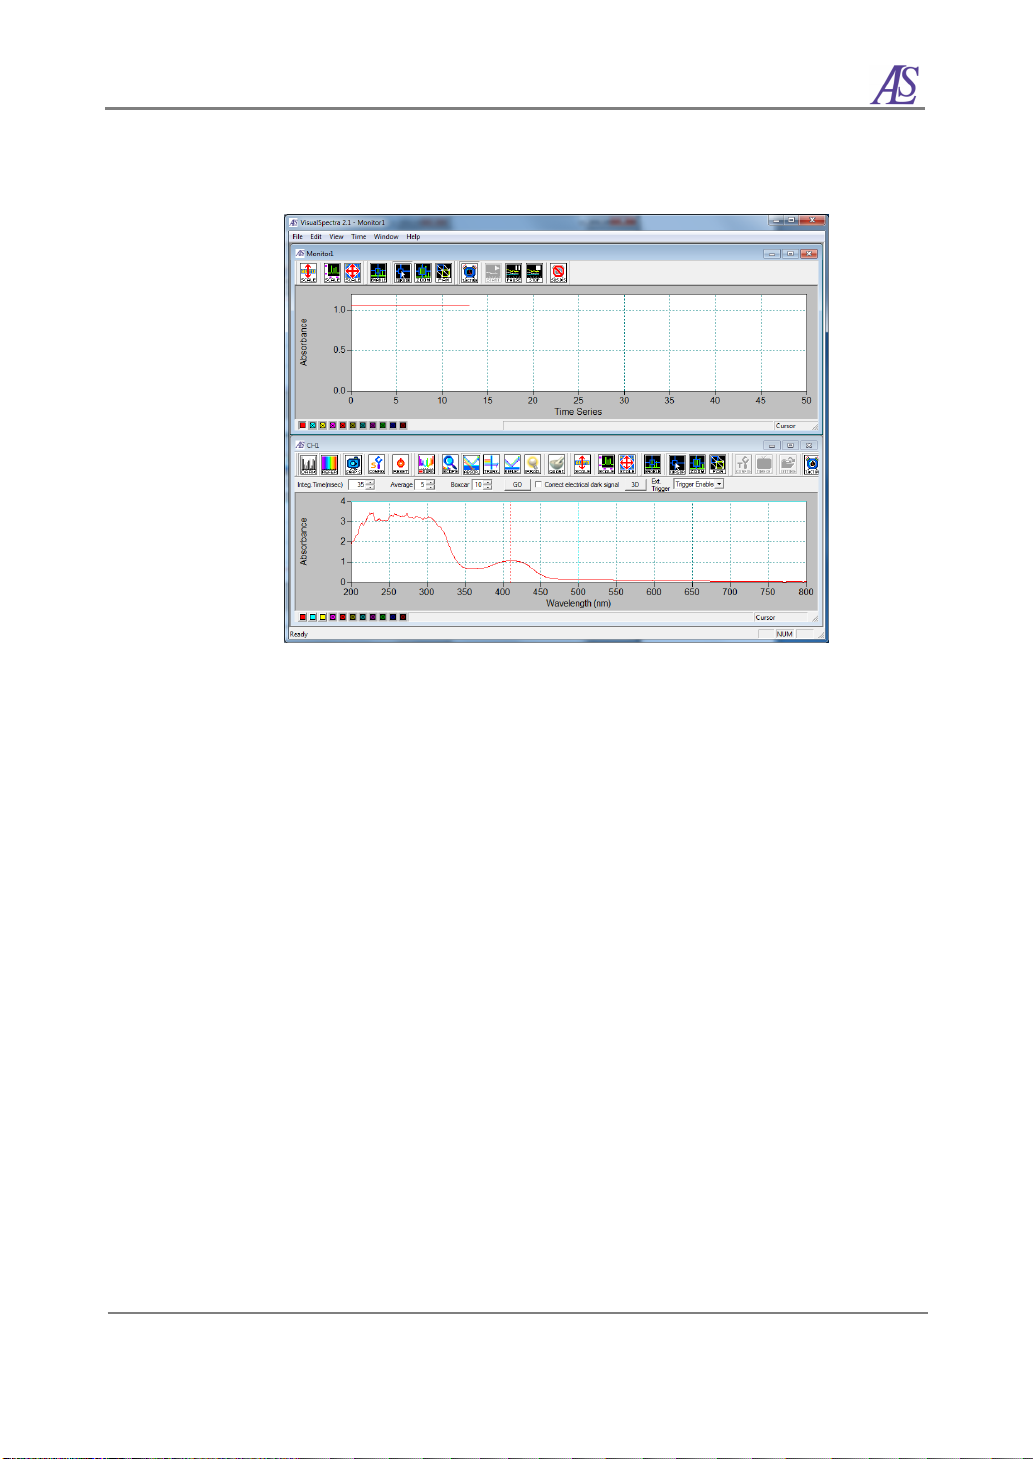
⑥ When the external TTL changes from 5 V to 0 V, the spectrum measurement is
begun, and the spectrum and the monitor screens start to move (Fig. 8-3-6).
<Fig. 8-3-6 >
⑦ To stop the monitor, you can configure the “Duration” or click the “STOP” icon in
the Mornotor1 screen.
SEC2000 Spectra System
www.als-japan.com
65
Page 66

SEC2000 Operating Manual
SEC2000 Spectra System
www.als-japan.com
66
 Loading...