

Page 1
OPERATION MANUAL
TEMPERATURE / HUMIDITY
DATA LOGGER
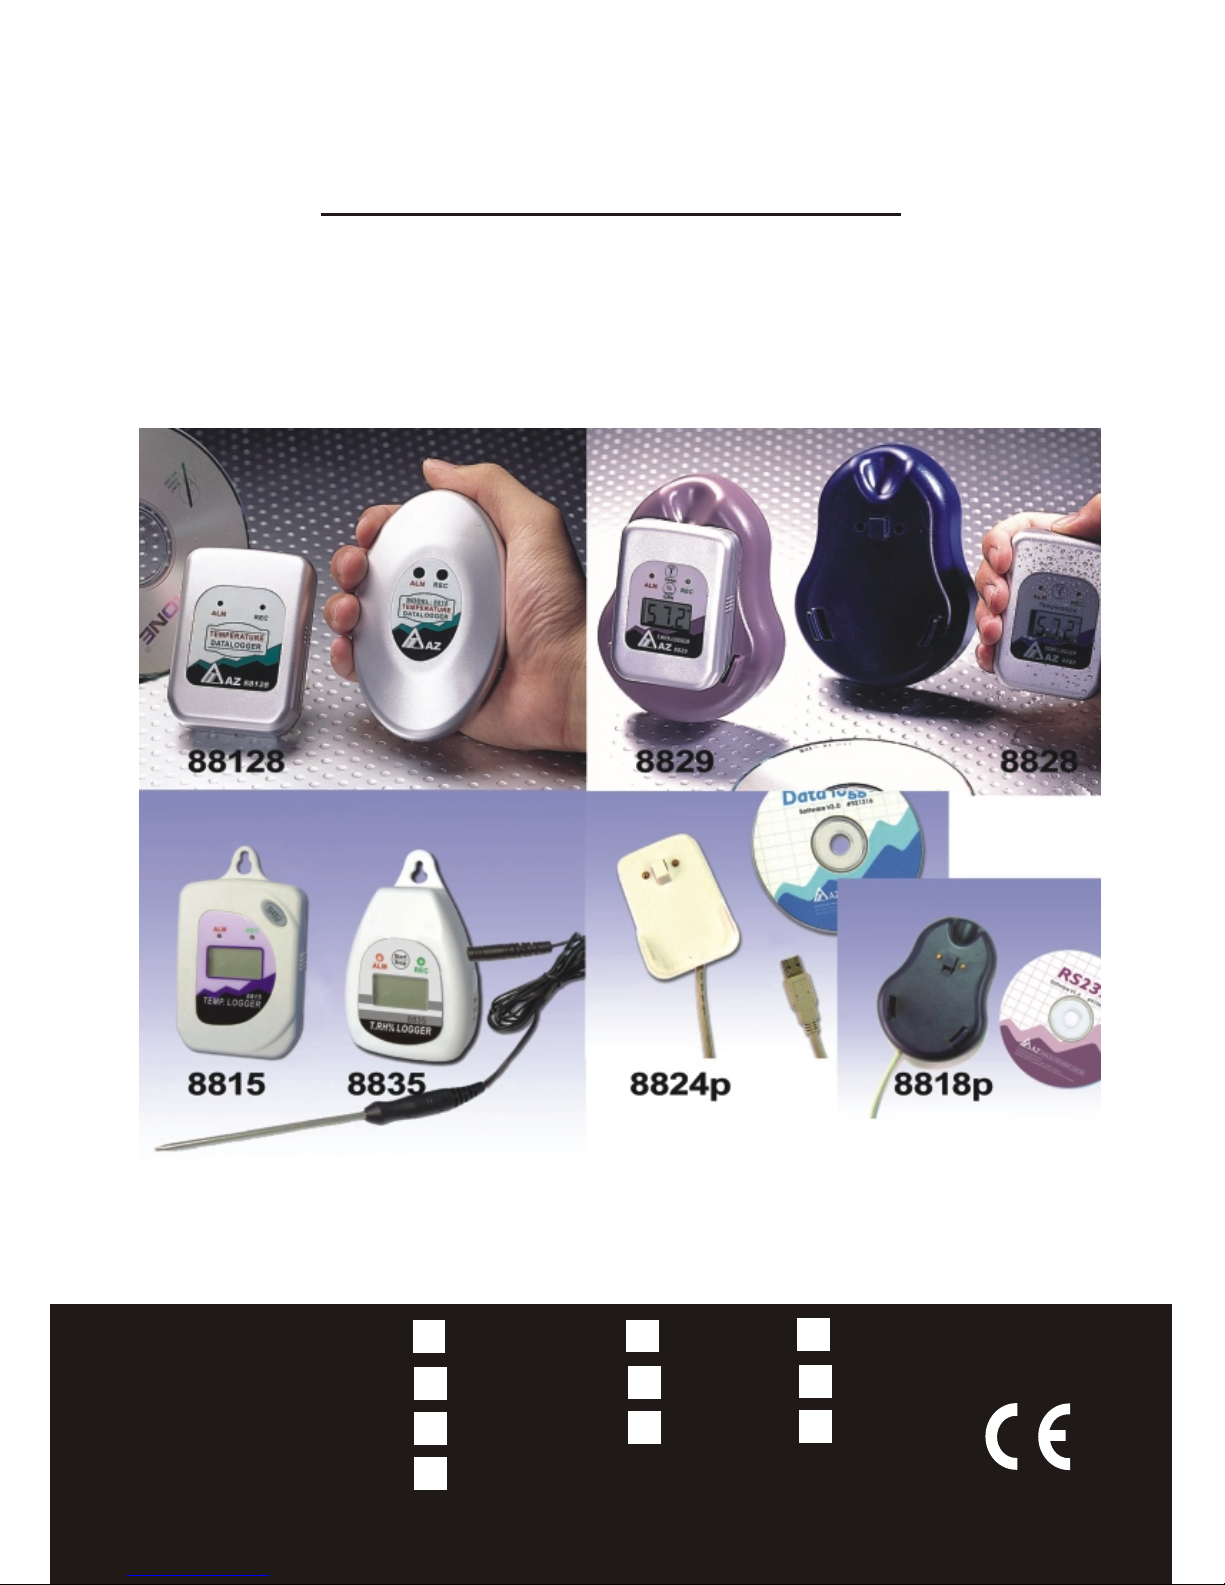
Model: 88128
8828
8829
8813
8814
8815
8833
8834
8835
Interface
Page 2

Material supplied.......................................................................
Group Files...............................................................................
Previous setting,Temperature Chart,Cursor status...................
Introduction...............................................................................
Features....................................................................................
Front View ................................................................................
LCD display (Model 8828 / 8829).......................................................
Battery replacement..................................................................
Software Installation .................................................................
Main screen & introduction.......................................................
Retrieve File..............................................................................
Save File...................................................................................
Comport Setup..........................................................................
Logger setting...........................................................................
A) Sample point setup............................................................................
B) Sample rate........................................................................................
C) Start mode set up...............................................................................
D) Logger's clock setting.........................................................................
E) Alarm setting......................................................................................
F) Unit setting ,Logger ID setting............................................................
G) Sleep Mode setting & Data Table......................................................
Data Table : Edit (Go to ,Find ).................................................
Statistics....................................................................................
Print Graph................................................................................
Blank logo,Message..................................................................
Download commands................................................................
Display control..........................................................................
General Specification................................................................
F.A.Q. Warranty and Return Authorization................................
INDEX
1
2
3
4
5
6
7
8-10
11-12
13
14
15
15
16
16
17
18
19
20
21-24
25-27
28
29-30
31
32
33
34-37
38-41
42
Index
Page 3
Thank you for purchasing this Temperature Data Logger! This unit
has been developed to meet your maximum satisfaction with its
user-friendly design. Review the entire manual for a complete
overview of the operation of this new data logger.
You may review the manual from Autoplay Menu, double click
"Run software, Manual (PDF)"and peruse every procedure
and function step by step. The logger is very easy-to-use.
The software is used to readout the stored data and see as a graph,
showing the history with real-time clock, the tabular data can be
viewed or exported to a spreadsheet for various analysis.
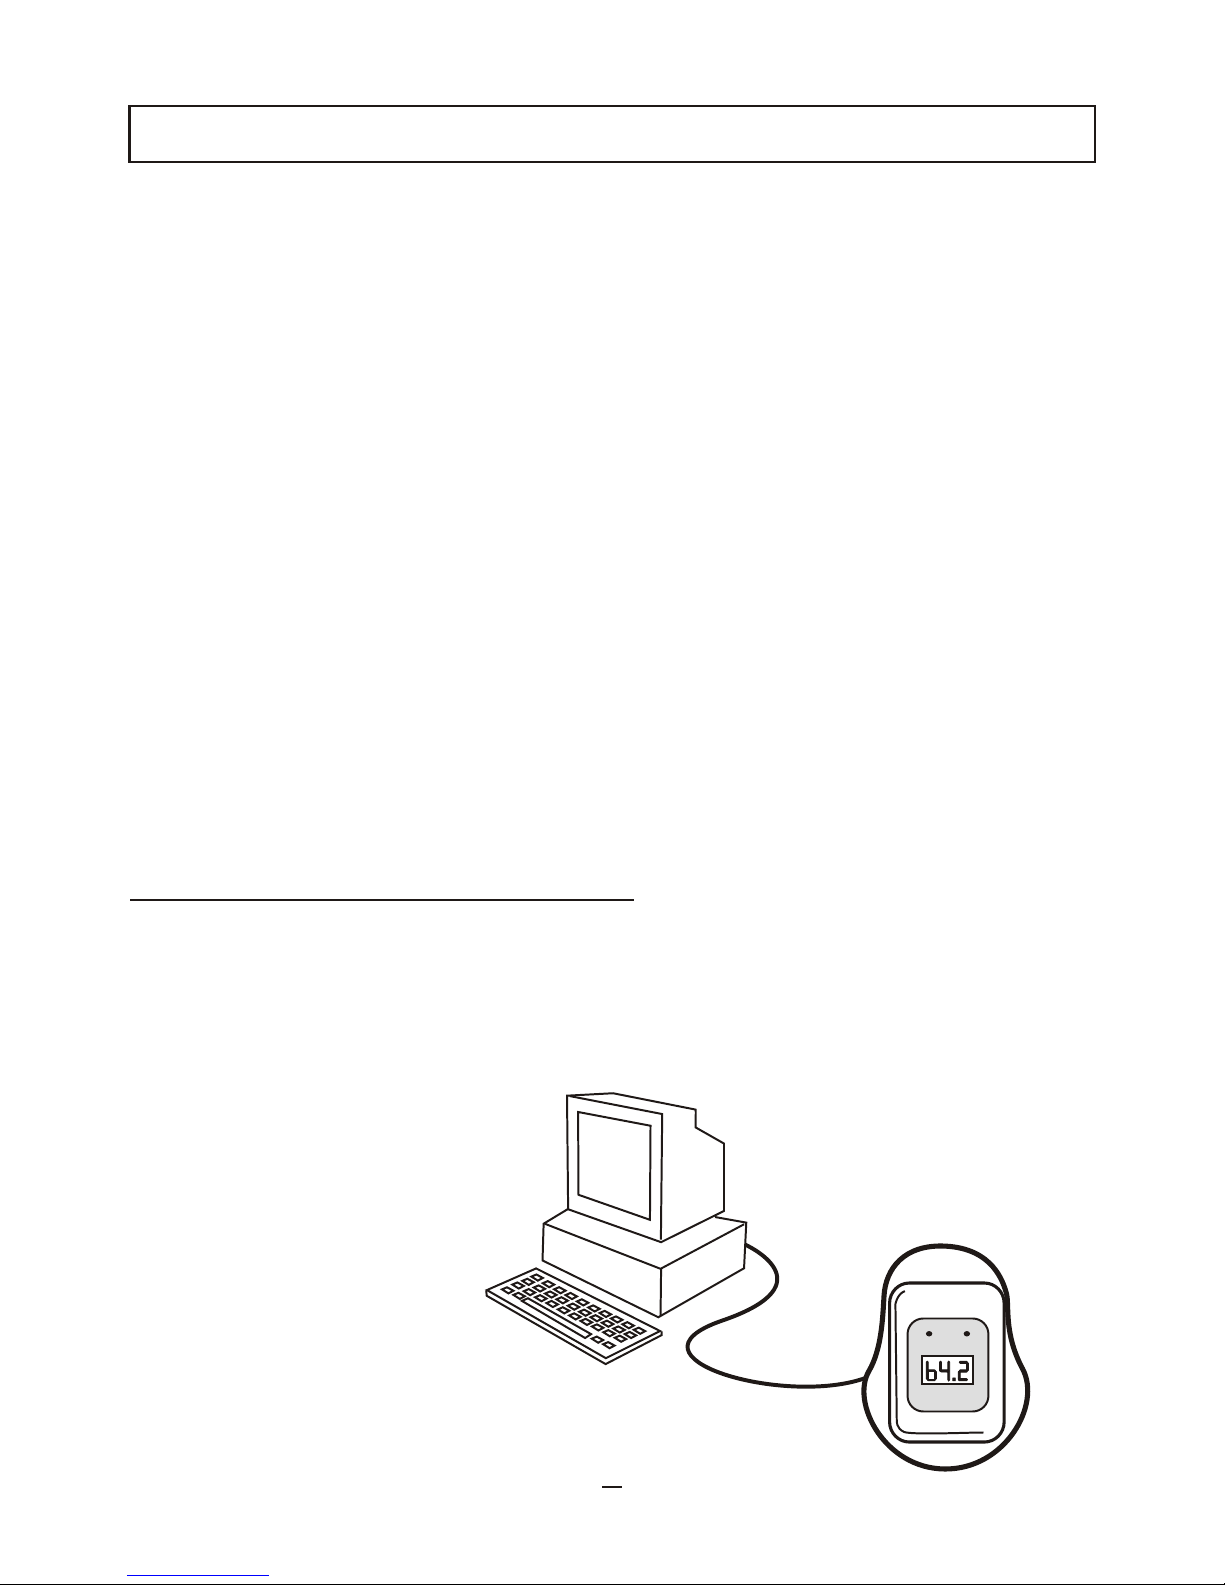
One interface can be used with multiple loggers, designed as a
saving cost unit. There are 3 color of interfaces for choice: White
,Dark Blue, Burgundy.
IDEAL FOR APPLICATION:
Monitoring Ambient condition in Greenhouses, Warehouses,
Food transport, Aircraft cabins, refrigerate truck,
containers, railway ....Art galleries and
Museum, incubation process,
Hatcheries, HVAC field
(Heat, Ventilation, Air
Conditioning),
collecting data
for QC.....
INTRODUCTION
1
Page 4
MATERIAL SUPPLIED
Check for damaged or missing parts in your data logger before
starting:
The Data Logger Set should contain:
2. Either one of the following :
Model: 88128, 8828, 8829, 8813, 8814, 8815, 8833, 8834, 8835
The Data Loggers, supplied with one CR2 /ER3(3.6V lithium
battery) or CR2032 (3.0 V button cell)
Model: 8818P(White) , 8828P(Dark blue), 8829P (Burgundy)
The RS232 Interface with cable & software.
Model: 8824P(White)
The USB Interface with cable & software.
Model: 88128S, 8828S, 8829S, 8813S,8814S,8815S,8833S,
8834S,8835S
The complete set including data logger with battery ,
interface and software.
1
3
88888
88
8
8
8
H/M/S
2
88128/8828/8829
88128S/8828S/8829S
8818P/8828P/8829P
A
Z
8
8
2
9
T
.
R
H
%
L
O
G
G
E
R
%
R
H
:
0
~
10
0
%
T
e
m
p
.
o
:
-
40
~
8
5
C
A
L
M
R
E
C
A
Z
8
8
2
9
T
.
R
H
%
L
O
G
G
E
R
%
R
H
:
0~
1
0
0
%
T
e
mp
.
o
:
-
4
0
~
8
5
C
A
L
M
R
E
C
2
Before starting the logger setting ,please read throughly the
whole operation manual, there are some FAQ listed in some
pages for troubleshooting reference.
1. Operation manual
Example:
Page 5
FEATURES
Up to 4000 (8813,8814) or 8000 (8815,8833,8834) or 16000 (88128,
8828,8829,8835) sample readings with real-time clock memory.
LCD display of data ( 8828, 8829, 8814, 8815, 8834, 8835).
Programmable sample interval from 1 second to 12 hours.
oo
Temperature unit: C / F selectable.
User-defined High / Low limit alarm.
Built-in real-time clock.
Up to 5 different start modes, please see summary in page 17.
Programming with RS-232 and USB interface.
Data retained when battery is low or has been removed.
IP65 waterproof housing design.
Hanger at the rear upper for hanging on the wall to prevent
losing or falling down .
One Interface can be used with several loggers to save cost.
Download data to other program for further analysis.
All data is saved in text format and can be easily transformed
into Microsoft Office applications.
Easy to use Software provides :Retrieve file, Save file, Logger
setting, Comport setting, Group file, Print graph, Data table
list, Statistic .......
Sleep mode and Non-Sleep mode to be selectable to display
current Temperature and Humidity (LCD models)
3
R
Additional start/stop key to power on/off the LCD display and start/
stop the logging. (8813/14/15, 8833/34/35)
External temperature probe socket included in 8833~8835 enables
to measure second channel temperature.
Page 6
FRONT VIEW
- Stands for RECORD
For model without LCD : 88128, 8813,8833
"REC" is flashing while logging the temperature records. Yellow LED
will stop flashing after complete recorded or battery is out of power.
REC yellow light flash
5 second, the LED flash every 5 seconds.
For model with LCD : 8828, 8829, 8814, 8815, 8834, 8835
Both yellow LED light and "REC" indicator will active and display on the
screen per every set sample interval. F
"ALM" is flashing while recorded value is higher than set HI or
less than LO setting, the logger alarm designed as not audible,
but only for reminding or warning the user to do necessary action.
REC
per sample rate setting. For 88128, if
the interval is over
or 8828/8829, if the interval is
over 5 second, the LED flash every 5 seconds
For model without LCD : 88128, 8813, 8833
"ALM" "ALM" LED will stop flashing after downloading to a PC or
battery is out of power. "RED" light flash per sample rate setting.
For 88128, if the interval is over 5 second, the LED flash every
5 seconds.
For model with LCD : 8828, 8829, 8814, 8815, 8834, 8835
Both red LED light and "ALM" indicator will active and display on the
screen per every set sample interval. For 8828/8829, if the interval is
over 5 second, the LED flash every 5 seconds
4
- Stands for ALARMALM
Page 7
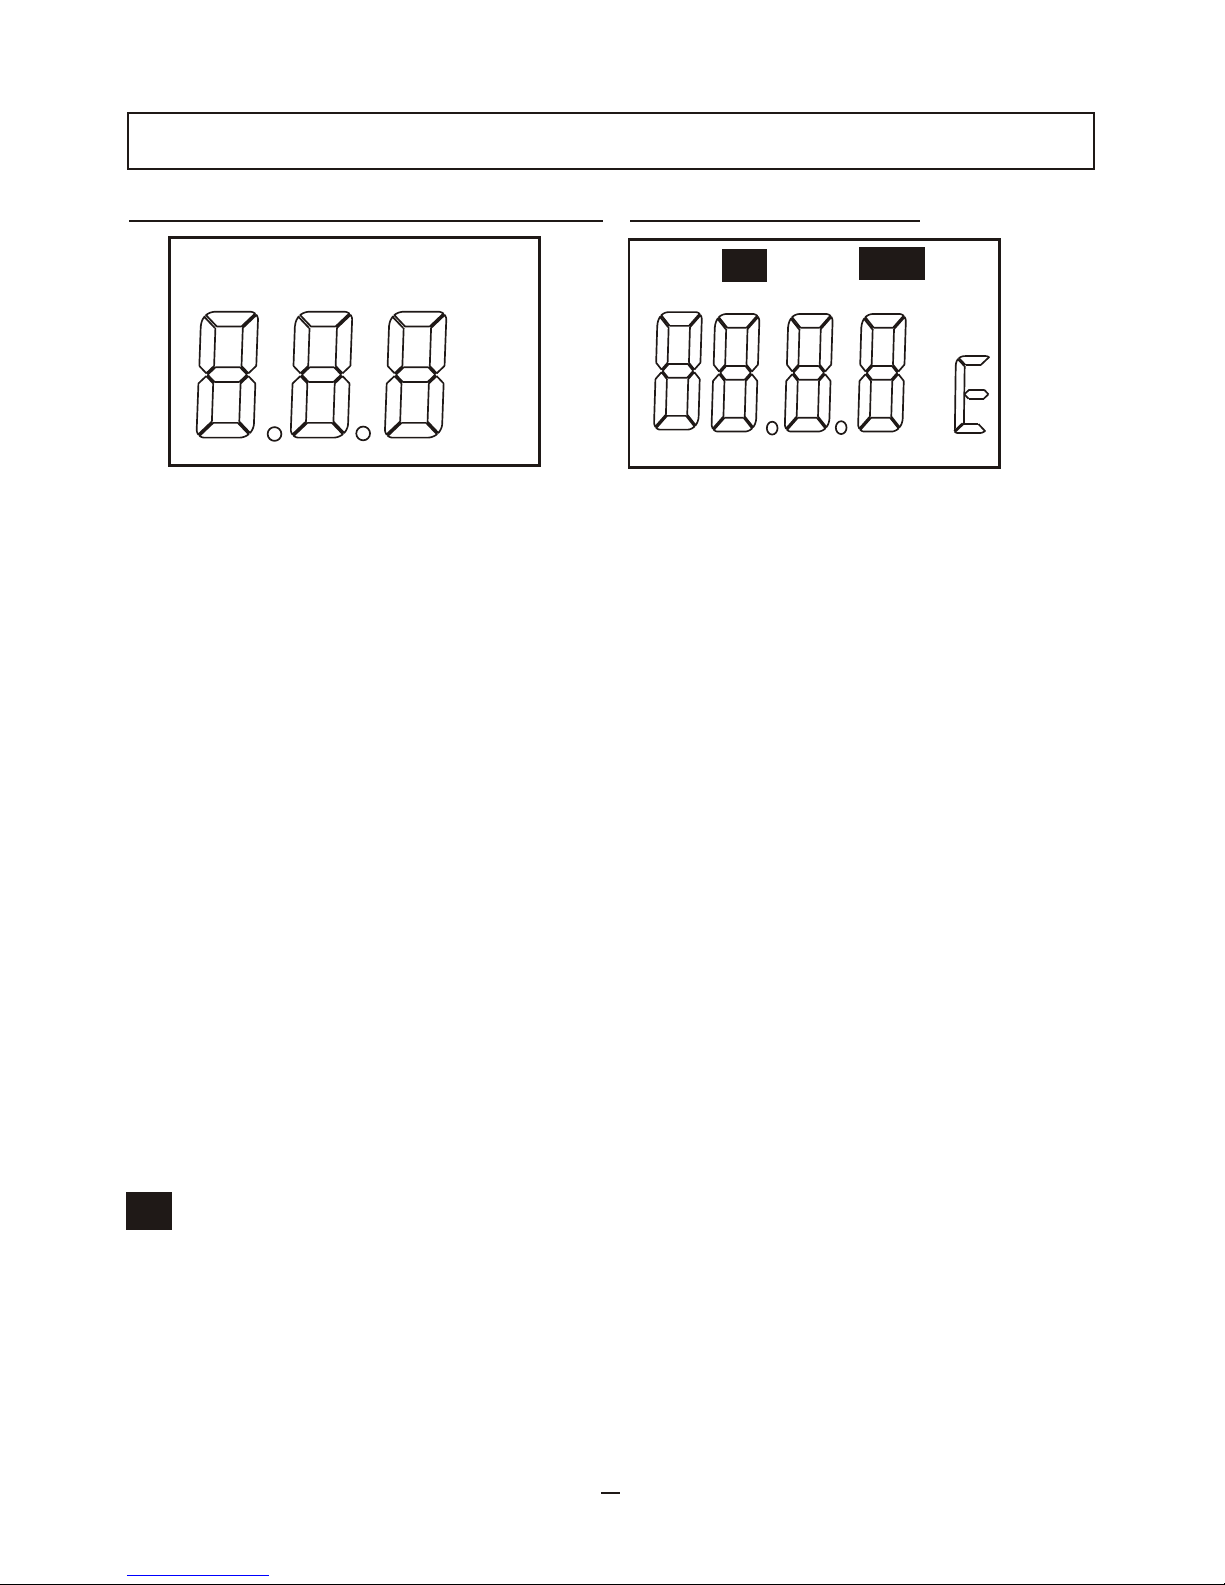
LCD DISPLAY
5
REC - "REC" is displayed while logging the temperature
or humidity. When stop logging and only in monitoring mode,
If the logger is in Non-sleep mode, "REC" will not appear on
LCD.
HI - "HI" is displayed and alarm LED is flashing if a
temperature/or humidity is higher than set High value
in the logger unit .
LOW - "LOW" or "LO" is displayed while logged temperature is lower
than set Low value in the logger unit .
RH% - Display Relative Humidity %.(Though you might have
seen RH% when replacing with a new battery , which
is not available for the model 8828 but model 8829
Temperature/ Humidity datalogger .)
o
C - Temperature displays reading in Celsius
o
F - Temperature displays reading in Fahrenheit
COMM - When communicating with computer ,"COMM" or "COM" is
shown at the top of the screen.
- External probe temperature. In 8835, the air temperature,
RH% and external probe temperature will appear in turns.
EX
REC
HI
LOW
COMM
RH%
o
C
o
F
Model: 8828, 8829,8814, 8815 Model: 8834, 8835
REC
HI
LO
COM
RH%
O
EX
BAT
Page 8
BATTERY REPLACEMENT
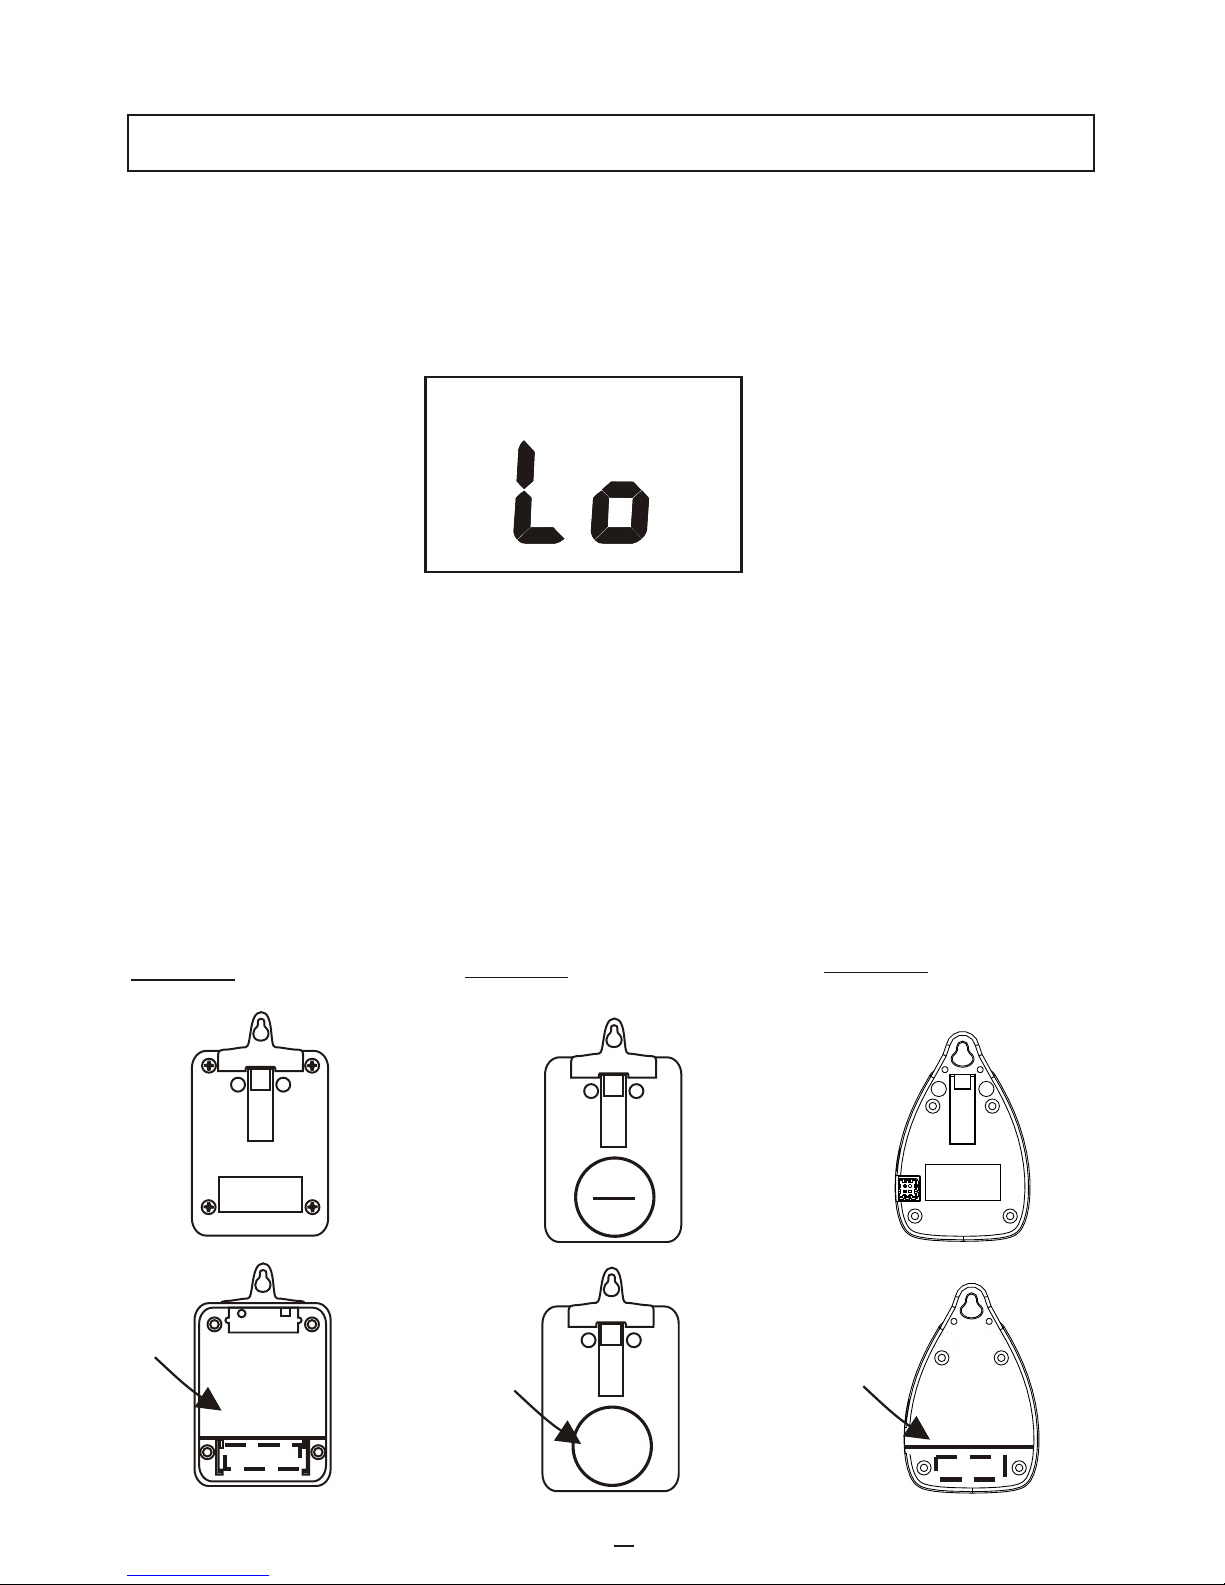
The dataloggers are designed with a waterproof housing and allow
the user to replace battery when it has expired .You will see "Lo" or
"BAT" appeared on the display when battery is weak.
Follow the steps to remove and replace battery:
1. Unscrew the datalogger from the rear side .
2. Do not remove o-ring and make sure the o-ring is in its place
(groove).
3. Remove the expired battery
4. Insert a new battery CR3/ ER2 or CR2032, make sure the battery is
inserted with correct polarity.
5. Re-screw the rear cover with screwdriver .
+CR2/ER3-
Model:
88128/8828/8829
CR2032
Model:
8813/8814/8815
Model:
8833/8834/8835
6
+CR2/ER3-
Page 9
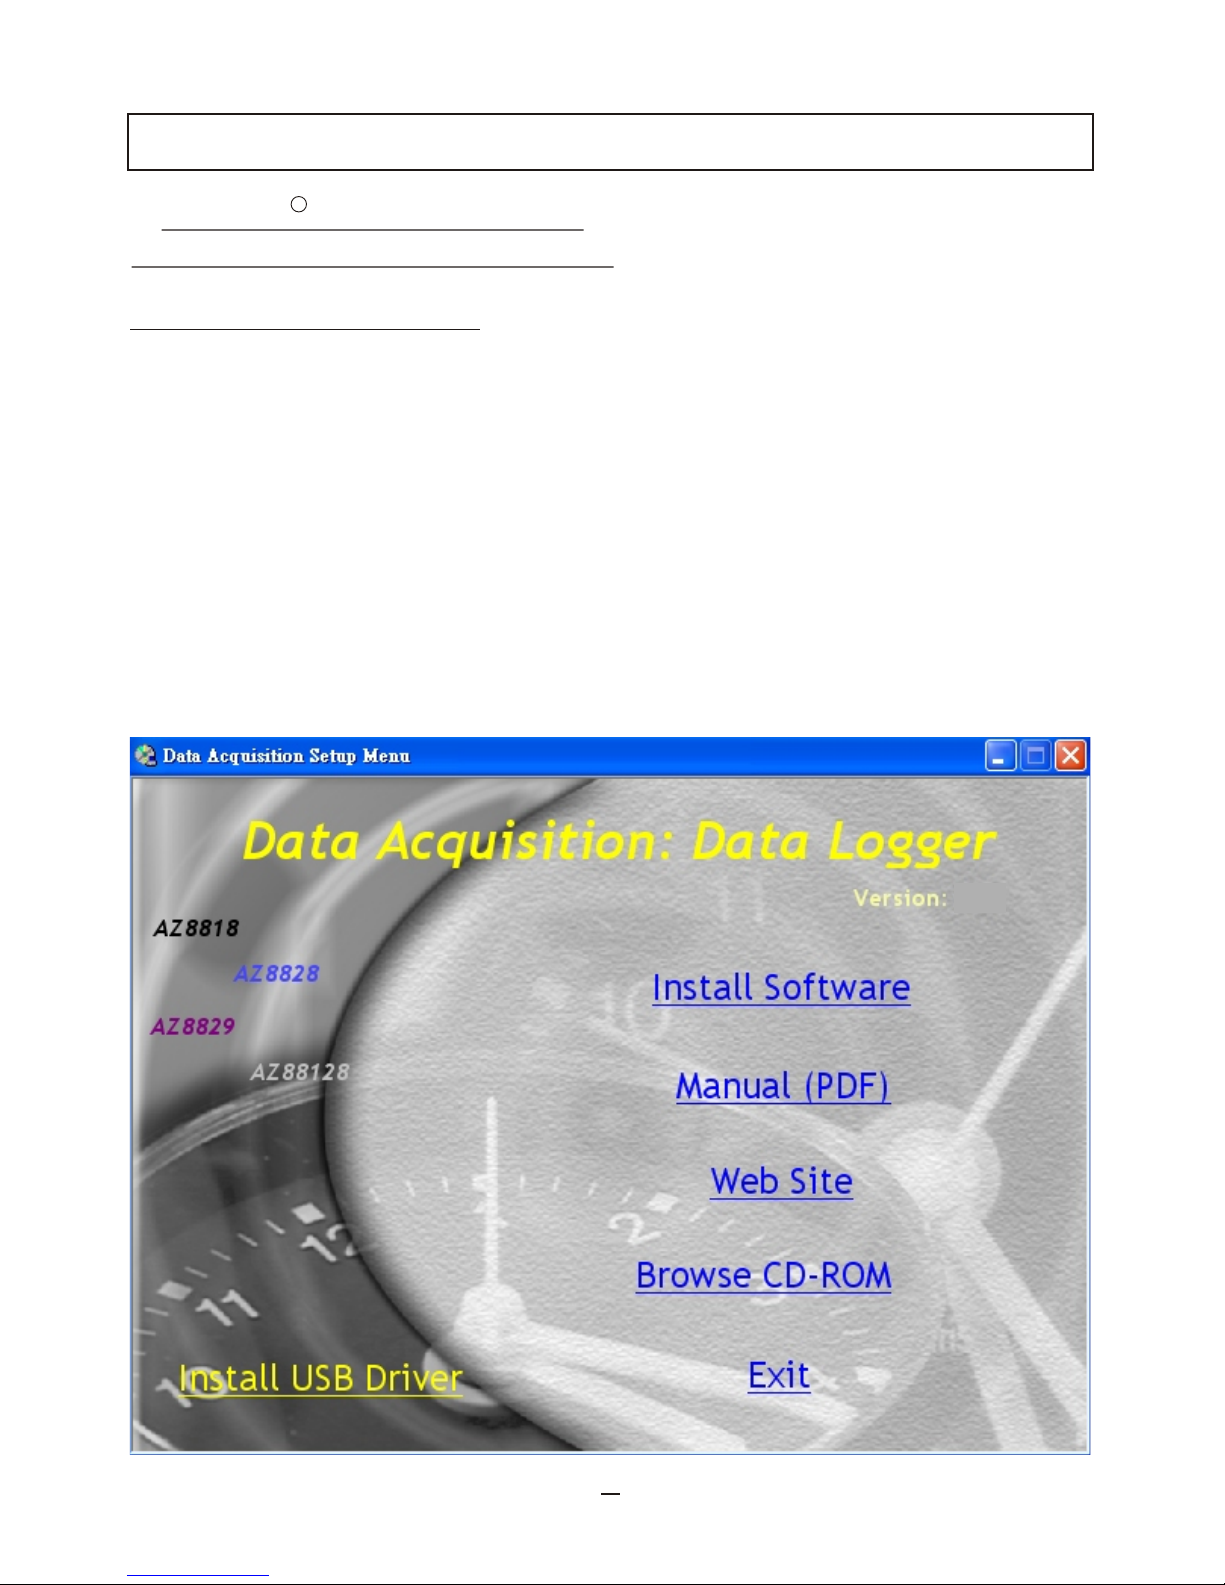
Installation procedure :
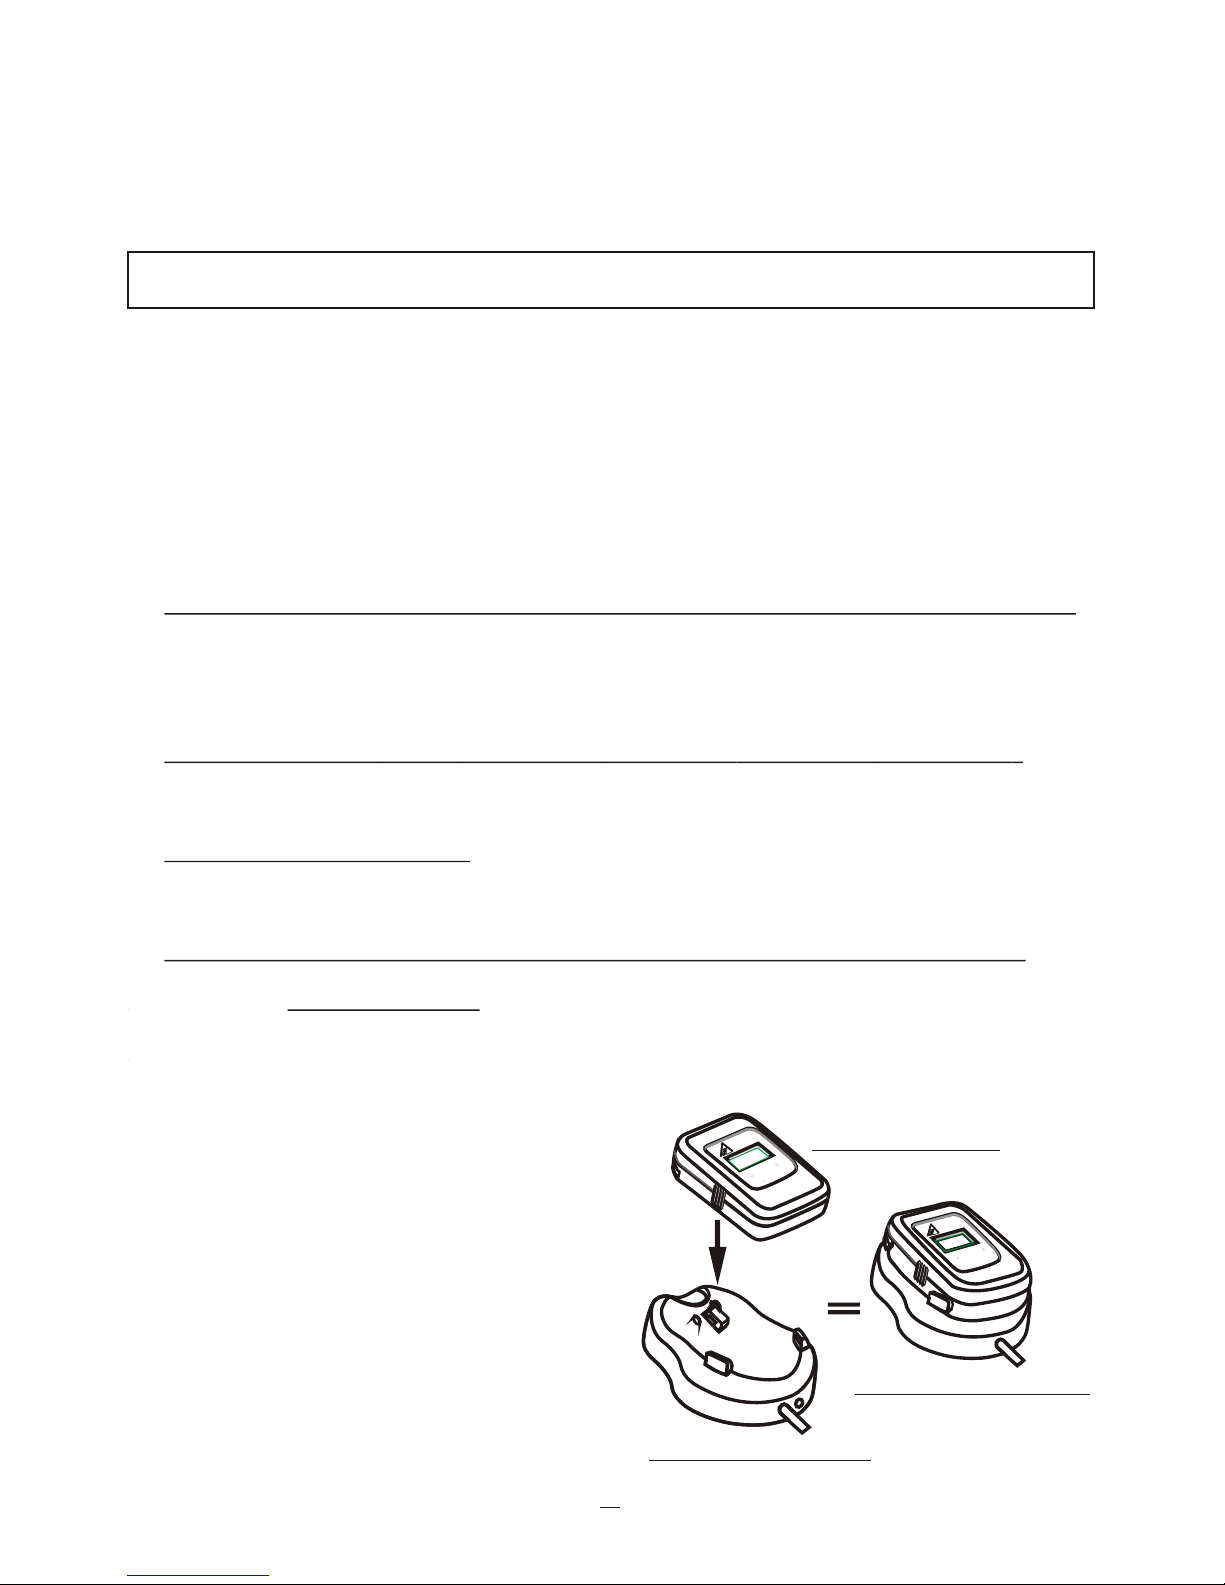
1. Slide the logger unit onto the RS232 or USB interface.
2. Connect the socket of the interface to COM1...COM8 of computer.
3. Insert the CD-ROM to the computer for starting software set up:
a).Install Software. To install the program.
b).Manual (PDF)
c
Open the PDF format manual.
).Web Site. Visit our web site in your browser.
d) .Brow CD-ROM. Browse the CD-Rom using Windows.
E) .Exit. Exit the software.
Microsoft Office is a registered
trademark of Microsoft Corporation.
R
SOFTWARE INSTALLATION
7
3.4
AZ8813~8815
AZ8833~8835
Page 10
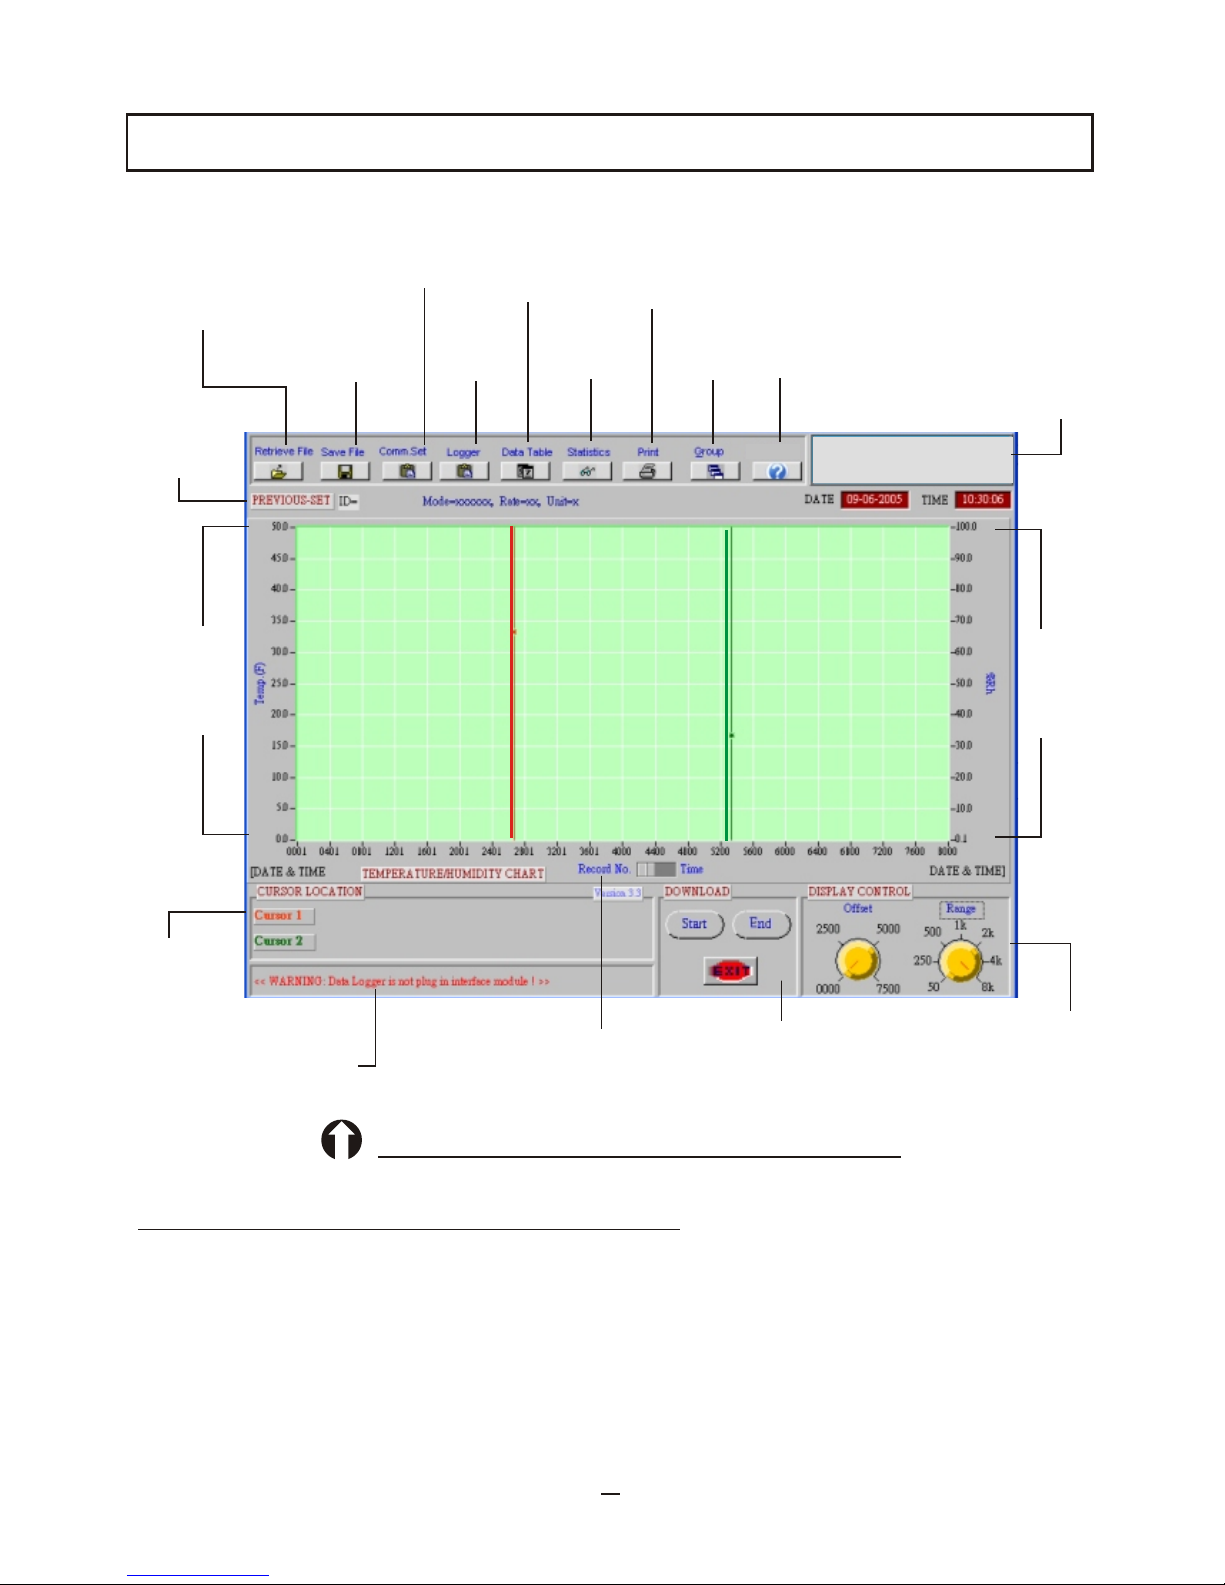
The data logger program is easy to operate from its main screen.
8
Keyboard Actions for Cursor
Make sure you have selected a cursor, when you click the red vertical
line, it turns bold red line, the same for green line. You will see the
numbers at the left lower part (cursor status) changed while pressing
arrow left or down arrow key for last record or pressing right or up
arrow key for next record.
MAIN SCREEN
Diagram A: Main Screen
LOGO
Display Control
Download
Commands
Cursor 1
(red)
Cursor 2
(green)
Previous
Setting
Temperature
Chart
Humidity
Chart
Cursor
Status
Message
Record Number
Time
Retrieve File
Save
File
Com. Set
Logger
Set
Data
Table
Statistics
Print
Graph
Group
Files
Logo
Help
Help
Page 11

9
Left arrow key To the previous point on the current plot.
Right arrow key To the next point on the current plot.
<Shift>-left arrow key Back 10 points on the current plot.
<Shift>-right arrow key Forward 10 points on the current plot.
<Home> To the first Visible point on the current plot.
<End> To the last visible point on the current plot.
Drag a cursor to move it.
The cursor tracks the mouse until you release the mouse button,
and then the cursor snaps to the nearest data point.
Actions by Offset Knob
You can operate on graph from the "Offset Knob" after pressed
"Offset Knob" in the following ways :
Press the up or down arrow key to increase or decrease
one record number (or corresponding to date ) in the graph .
FAQ: Why can't I see the movement by pressing above keys ?
Ans : First of all, click the mouse on the monitor and make sure
the bottom right corner "Display Control - Offset " figures
are not in black.
Zooming and Panning on Graphs
To start zooming in on a point, press the <Ctrl> key and click on the
left mouse button over the point; you can release the <Ctrl> key
after you press the mouse button. The resolution in the viewport is
increases dynamically until you release the mouse.
To zoom out, click on the right mouse button, and then press the
<Ctrl> key as you do to zoom in.
Page 12
10
To pan, press the <Ctrl-Shift> keys and click on the left mouse
button over a point on the viewport. Then drag the mouse to
another point.
The graph viewport scrolls so that the original point now appears
under the new mouse cursor location. You can drag the mouse
anywhere on the screen, even beyond the viewport.
To restore the viewport to its original state after zooming or panning
. Press and hold the left mouse to drag the yellow line from " Offset
knob " and "Range knob" .
After your downloading or retrieving a record , you will see the
number on the knobs of "Offset" and "Range" be changed. The control
range depended on each logger
Logger Offset Range
8813/8814 0000, 1000, 2000, 3000 50, 250, 500, 1K,2K, 4K
8815/8833/34 0000, 2500, 5000, 7500 50, 250, 500, 1K,2K, 4K, 8K
88128/8828/ 0000, 5000, 10000, 15000 50, 250, 500, 1K,2K, 4K, 8K, 12K, 16K
8829/8835
Display Control
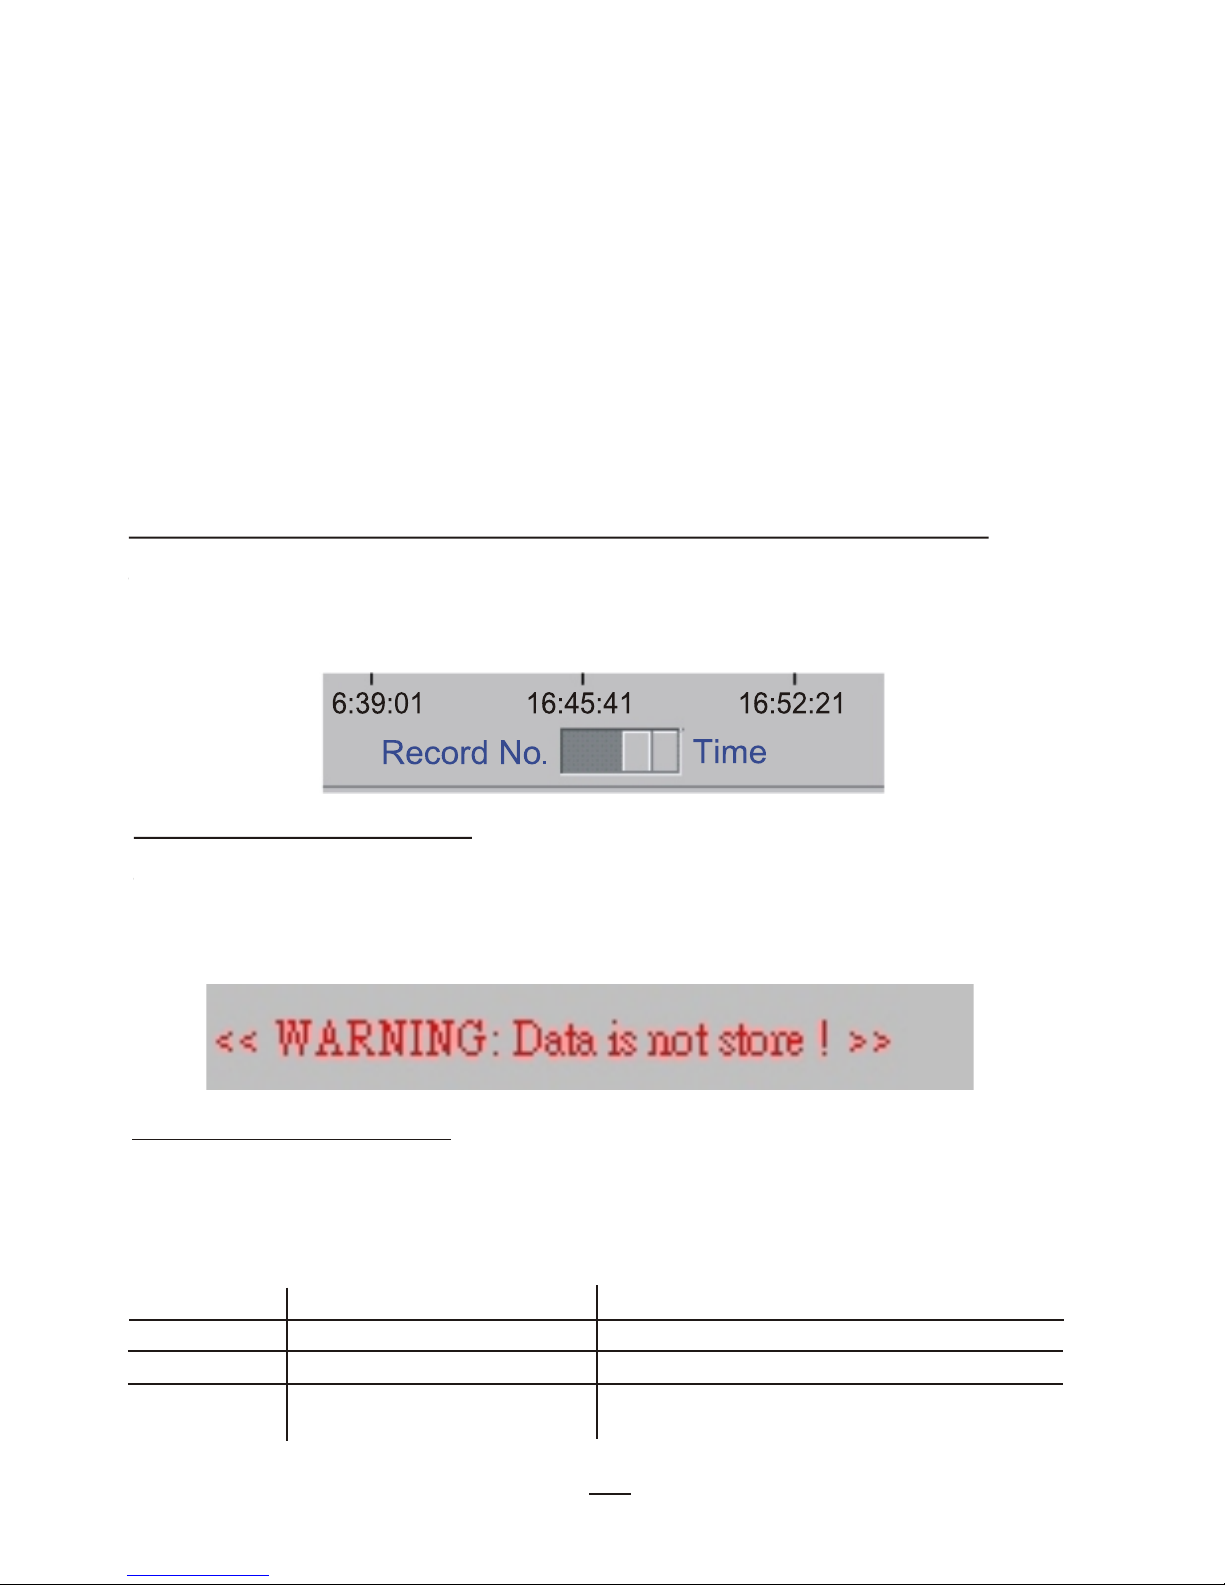
Data record number or Time display selection
Press the switch button and select between Record number and
Time ( xx : xx : xx ) the hour, minute, second. The record number
and time will display in turn while pressing the switch button .
Warning message
The left bottom corner will show a warning message. For example,
if you download the data but not yet save it, the message will be:
<< WARNING : The data is not sotre !>>
Page 13
¡ö
NOTE:
Above file names are the examples to help you understanding
what screen will be .Don't be alarmed if you couldn't see the
files shows on your software .
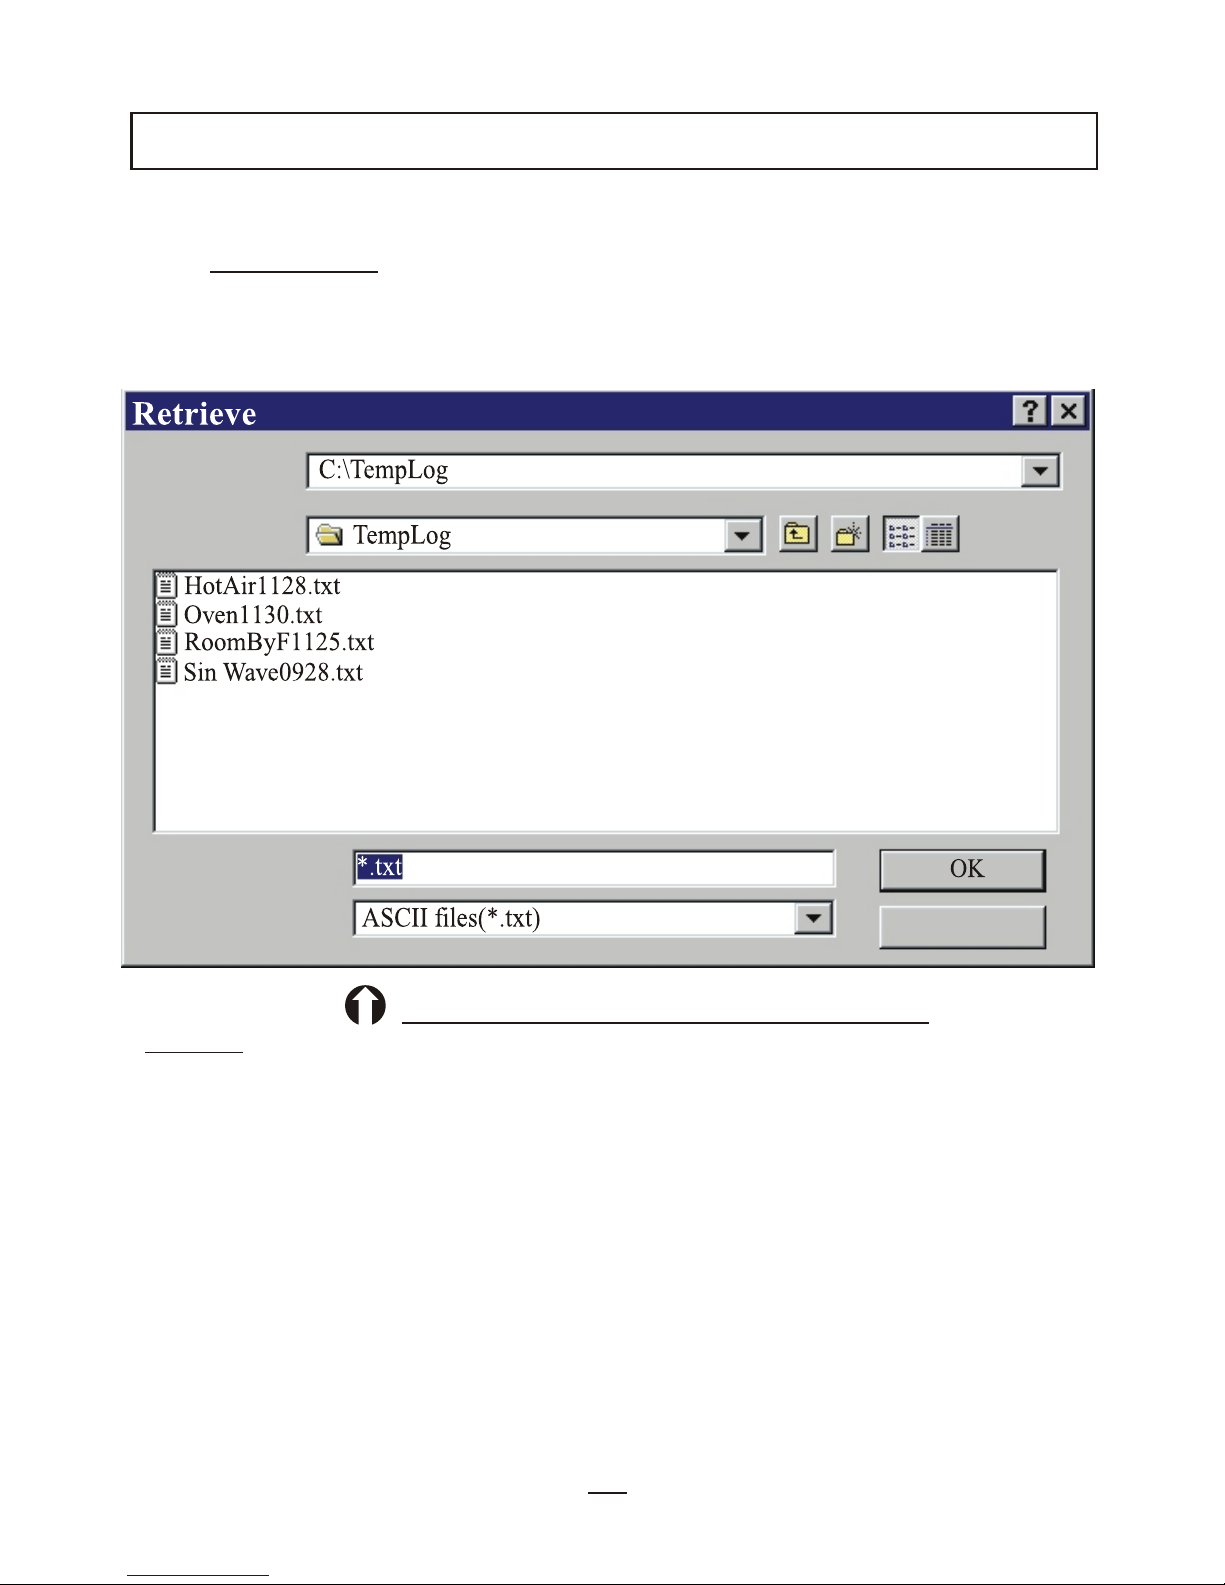
Open data file "RoomByF1125.txt " for test file. See Diagram C
for an example of data in file :
To aid in reading a graph , a grid can be drawn on the graph, and a
dialogue box display at the left bottom corner shows the appearance
of this grid.(CONTROL LOCATION-Cursor 1 and Cursor 2).
11
Diagram B: Retrieve File
Look in:
Directory
History:
File name:
File of type:
Cancel
(Example)
Click on icon to retrieve and to load a data file into this program.
(See Diagram B.) This program is designed to log up 16,000 sample
readings.(Model 88128/ 8828/ 8829/8835 are available for 16,000
sample collecting )
RETRIEVE FILE
Page 14
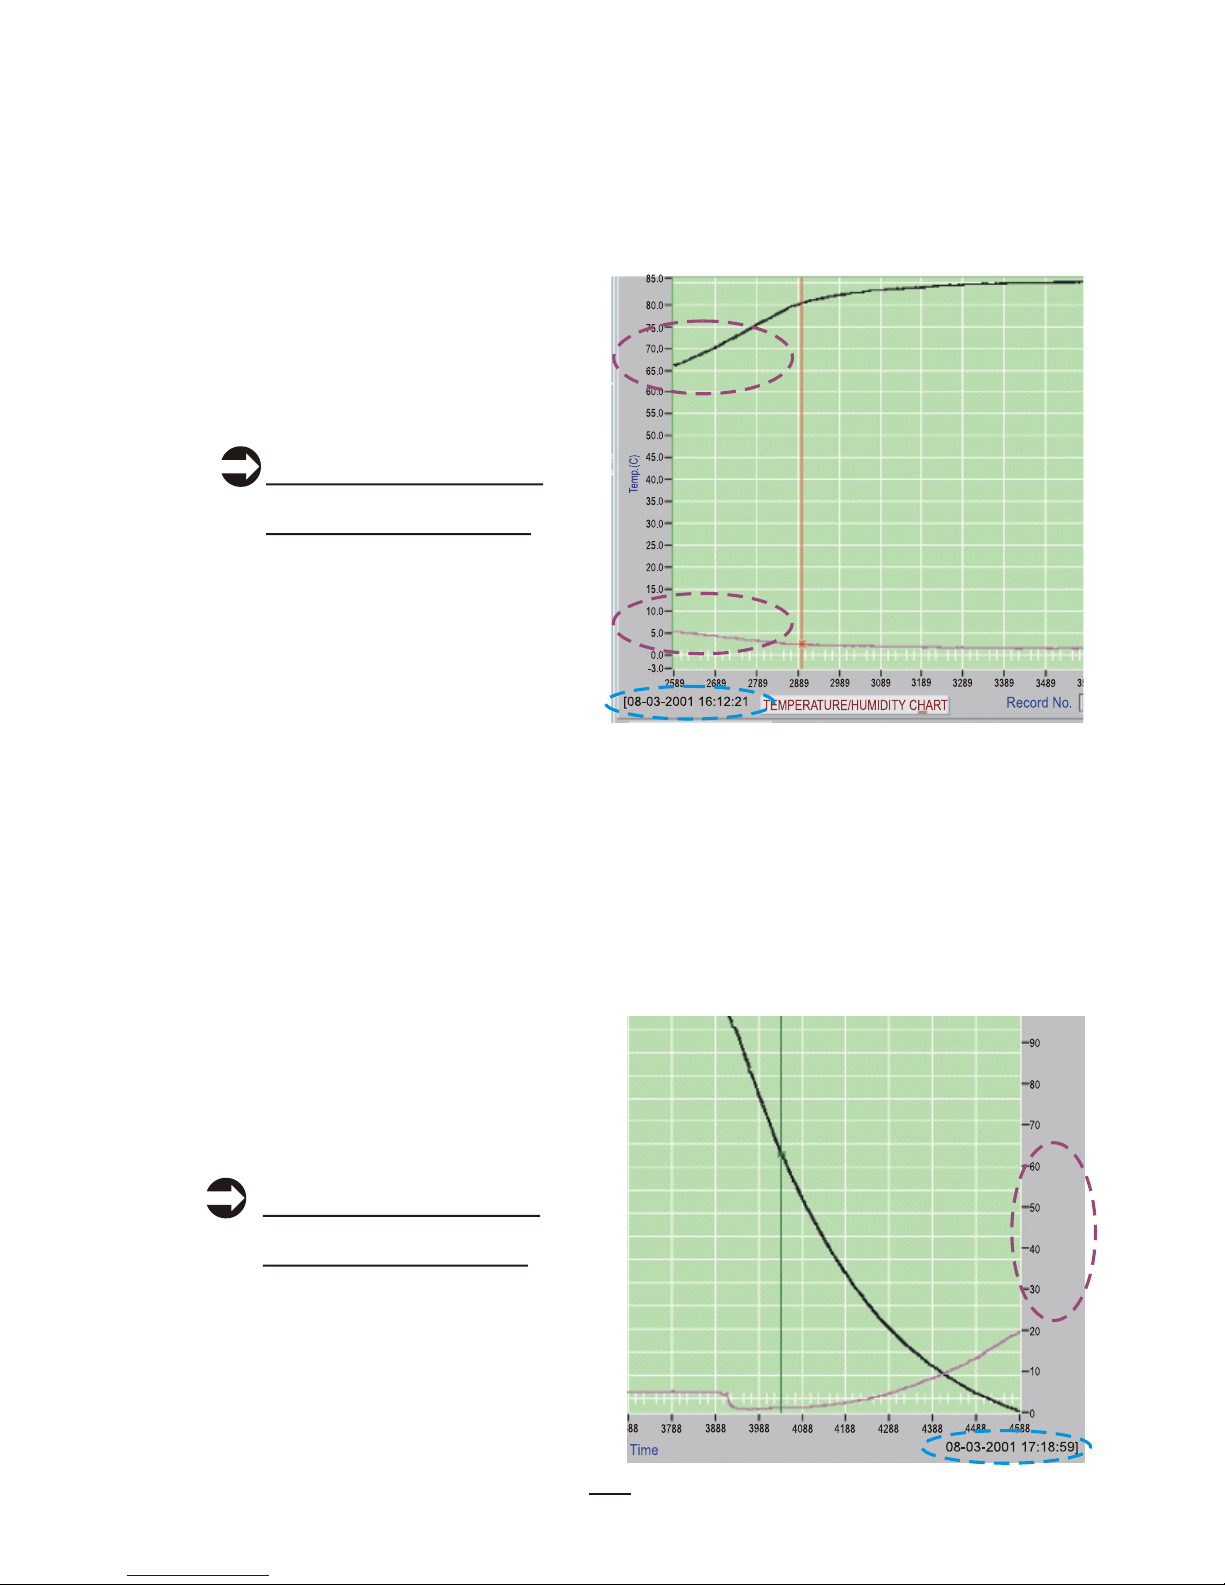
After you downloading from model 8829/8835 or retrieving a file with
Humidity records, you will find " Temperature " and " Humidity "
indicated on the start point of curves . (See Dia.B-1 ) Otherwise, you
will only see temperature curve.
For model 88128,8828,8813, 8814, 8815, 8833, 8834 you will not see
RH% on the right side of the screen but only model 8829/8835 .(See
Dia.B-2 ). However, if you plug external probe on 8833 and 8834, you
will see two different temperature curve.
Meantime, you will see the date and time of the first point at the
left corner , and see the last point date and time at the right corner .
(See Dia. B-1 and Dia.B-2 in blue )
Diagram B-1:
Retrieve File
Diagram B-2:
Retrieve File
%Rh
12
Temperature
Humidity
Temperature
Humidity
Page 15
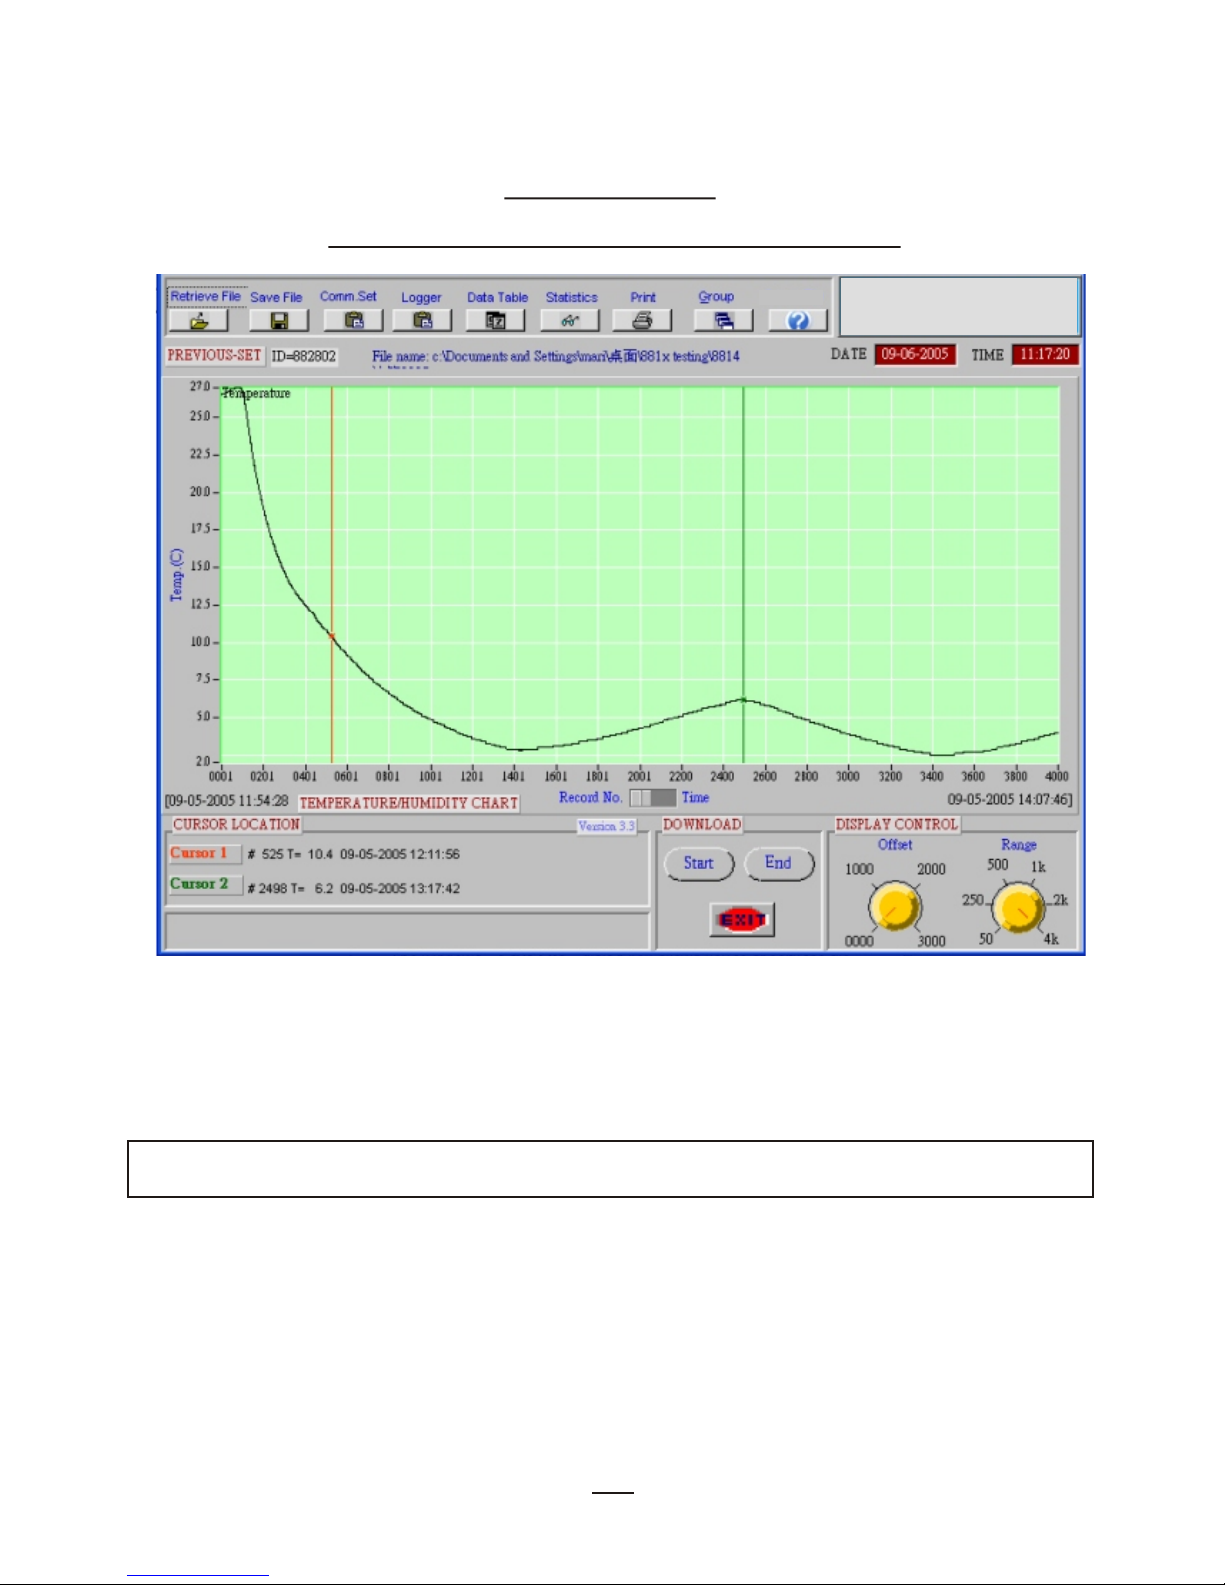
Diagram C:
Main Screen with Sample Data
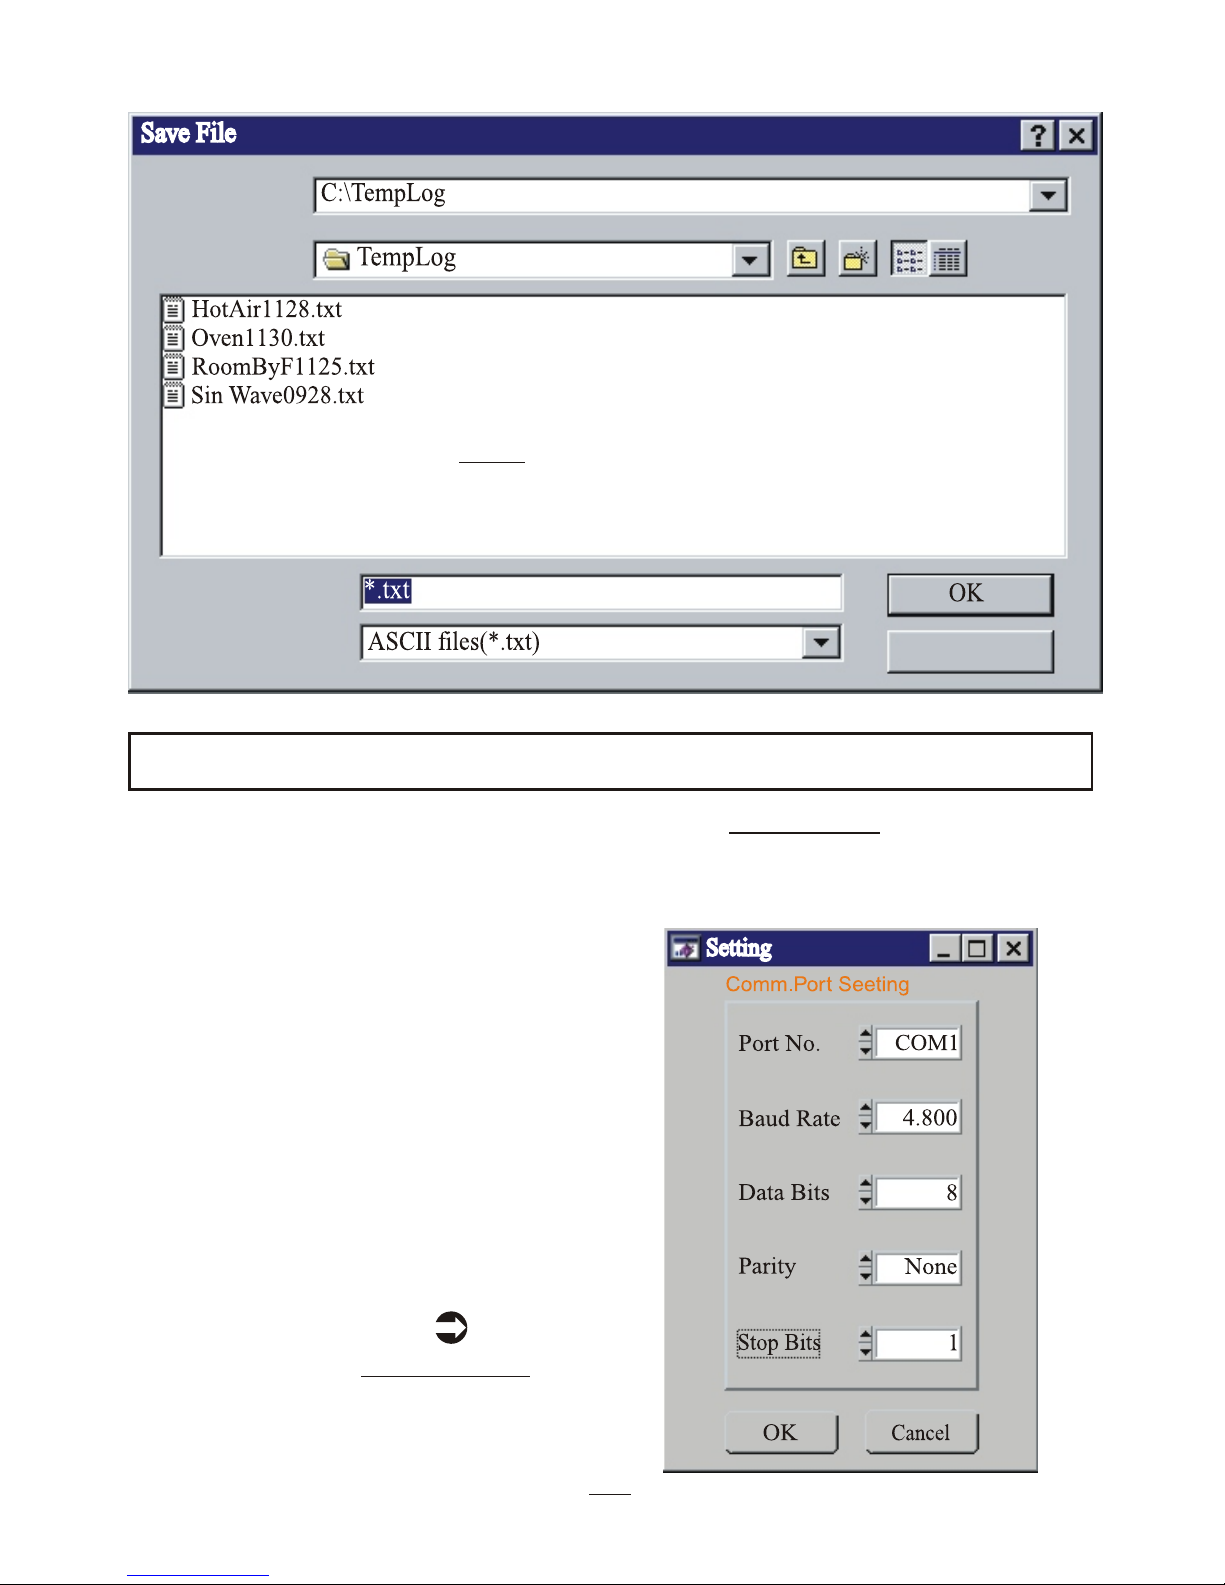
Selecting icon, select folder and name to save the data to be saved.
The windows " Save File " dialog box allows you to specify the file
format to save the data,the file name to be called , where the file
to be saved to .
SAVE FILE
13
(Example:8814)
LOGO
Help
Page 16
14
COM PORT. SETUP
Select icon for "Com. Port Setting". (See Diagram D). Set correct
COM port, Baud rate, Data bits, Parity and Stop bits.
Usually, it's COM1 for most notebook and desktop computers.
Select up to COM 8 for special
systems. Select OK to accept
setting changes, Cancel to
abort and to exit Setting menu.
Note:
Always remember to select 9600
baud rate for all models.
Data bits always is 8
Parity is None
Stop bits is 1
Diagram D:
COM Port Setup
Look in:
Directory
History:
File name:
File of type:
Cancel
NOTE:
Above file names are the examples to help you understanding
what screen will be .Don't be alarmed if you couldn't see the
files shows on your software .
(Example)
Page 17
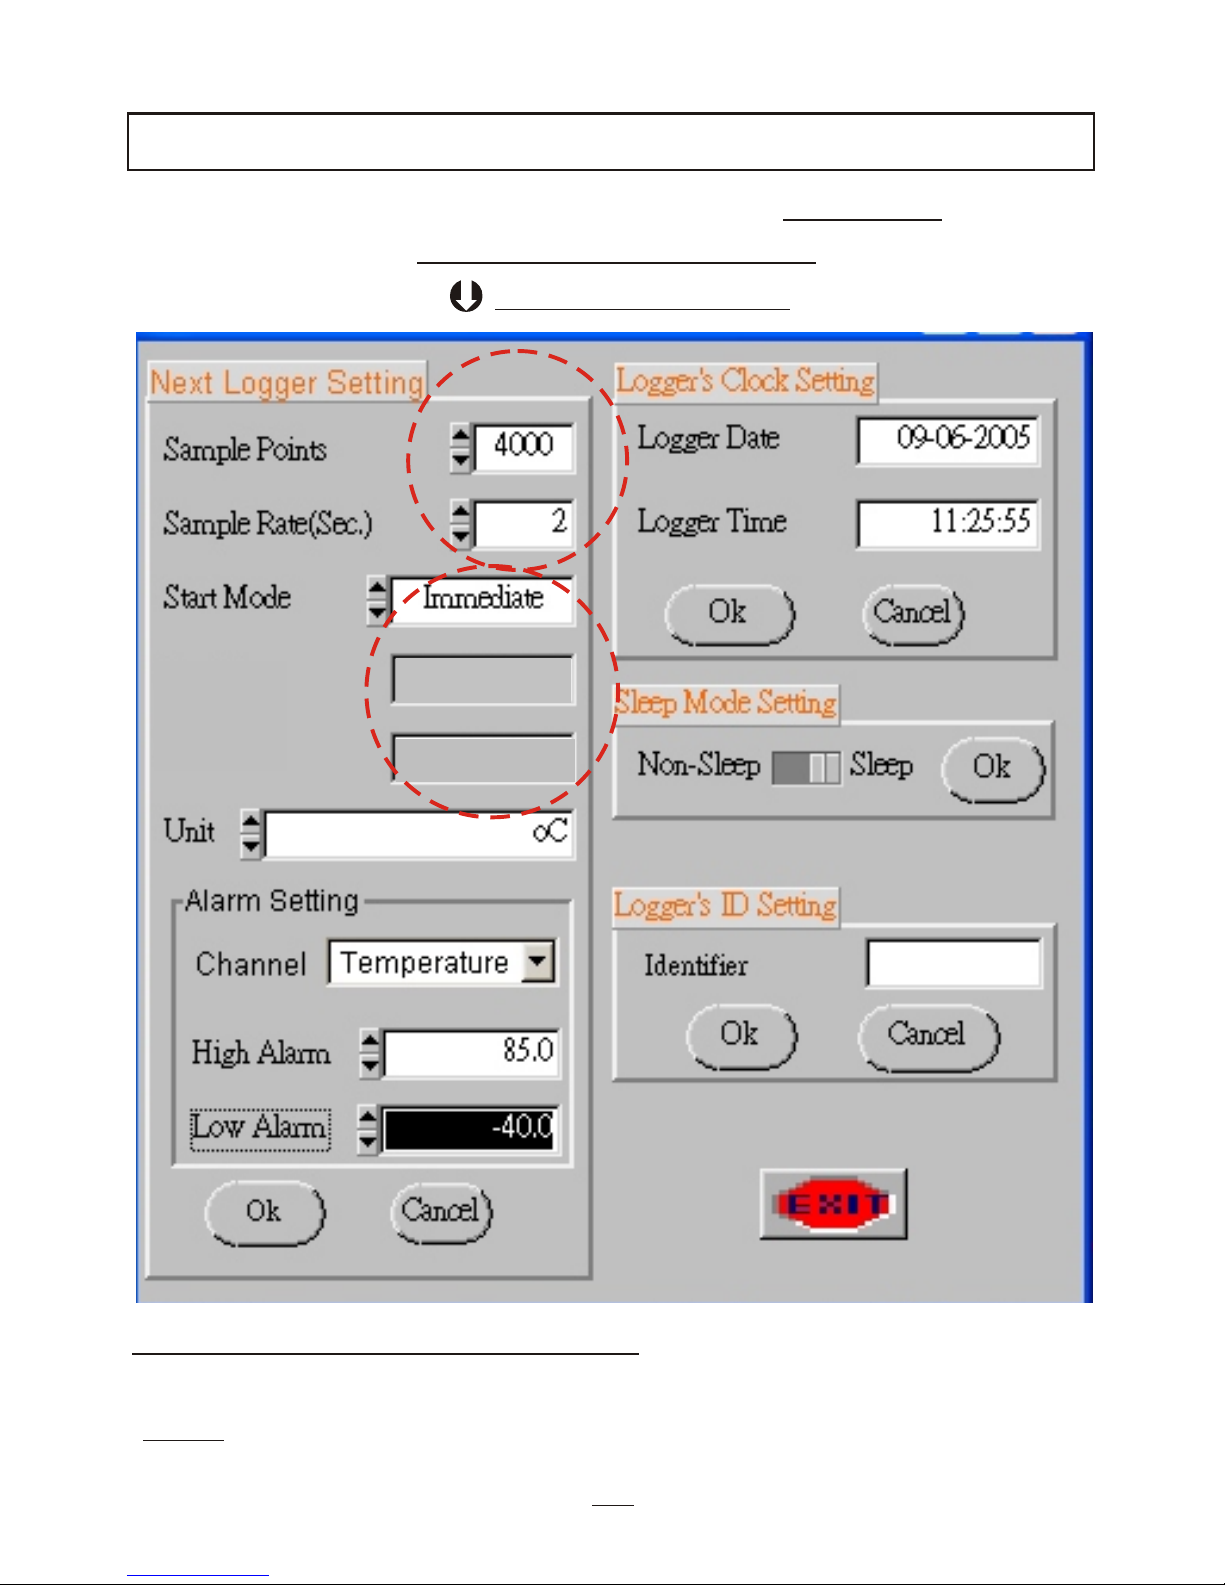
Depress icon to perform Next Logger Setting. (Diagram E.)
LOGGER SETTING
Diagram E: Logger Setting
Sample point Setup
SAMPLE POINTS SETTING -
Select sample point 1,000 / 2,000 / 4,000/ 8,000 or 12,000 / 16,000
(Note: Only 88128, 8828, 8829, 8835 are available for selecting sample
point : 12,000 / 16,000 ).
¡ö
15
Start Date
Start Time
09-06-2005
11:25:43
Page 18

By scrolling up or down and then click OK to save the selection.
(See Dia-E )For example ,select 1,000 sample data,the logger will
stop collecting data and power off for saving battery when 1000
data collected completely .
Recording inactivated when selected data is full , and yellow LED
light will not blink to confirm operation is stopped .
SAMPLE RATE : Select the sampling time ranges from 1 ~43200
seconds. Scroll up for increasing time in seconds or down for
decreasing time in seconds. The datalogger defaults sample rate
is the same as you last setting..
16
FAQ: If I want to stop logging before completing all sample
points , how should I do ?
Ans: 1. Downloading by PC to stop logging.
Note: The download operation before completing all sample
points won't work for the logger sample rate to be set
as "1" second.
2. For 8813/14/15 and 8833/34/35, press "start/stop" key for
over 3 seconds could also turn off the logger any time.
START MODES : (Diagram E):
Schedule -
Set up Start Date/Start Time desired to start logging. The logger
will start when the setting time clock reaches the time you entered.
Make sure the logger date and time are the time you are now .
Magnetic -
Link with your computer to setup the Magnetic start mode , select
Magnetic , make sure the logger date and time are the time you are
now , press "OK" , enter desired ID , press"OK" to confirm the
Magnetic start setting.
To start with magnetic, use a strong magnetism
one pass over the middle of the bottom, now LED is flashing .Flashing
times is depend on the time interval of every sample logging.
Page 19
17
Enter your Logger's clock setting allows real-time setting for this data
logger unit.See Diagram E.
LOGGER'S CLOCK SETTING
Immediate -
While pressing "OK" Button , the logger starts recording immediately.
Repeat -
To set the mode as "Key Start" and press OK. To start recoring, press
start button on the meter for over 3 seconds until the REC LED flash
or "REC" display on LCD. While long press the button again, the meter
will stop recording. Above start & stop action is valid for one time
only. If want to re-start the meter after stopping the meter, please use
software to set the mode as Key Start and press button again.
When set the mode as "On-line" and press "OK" button, the logger will
start recording immediately and export data to computer synchronously.
So, when choose this mode, please connecting your datalogger to PC
before starting logging in order to avoid missing any logging data.
Immediate
Magnetic
Schedule
On-line
Key Start
Repeat
88128/8828
/8829
8813/8814
/8815
8833/8834
/8835
When set the mode as "Repeat" and press "OK", the meter will start
immediately. After downloading the records, the meter will keep on
recording the data based on previous setting. No need to set the
datalogger again if your sampling criteria is the same as last time.
Key Start -
On-line-
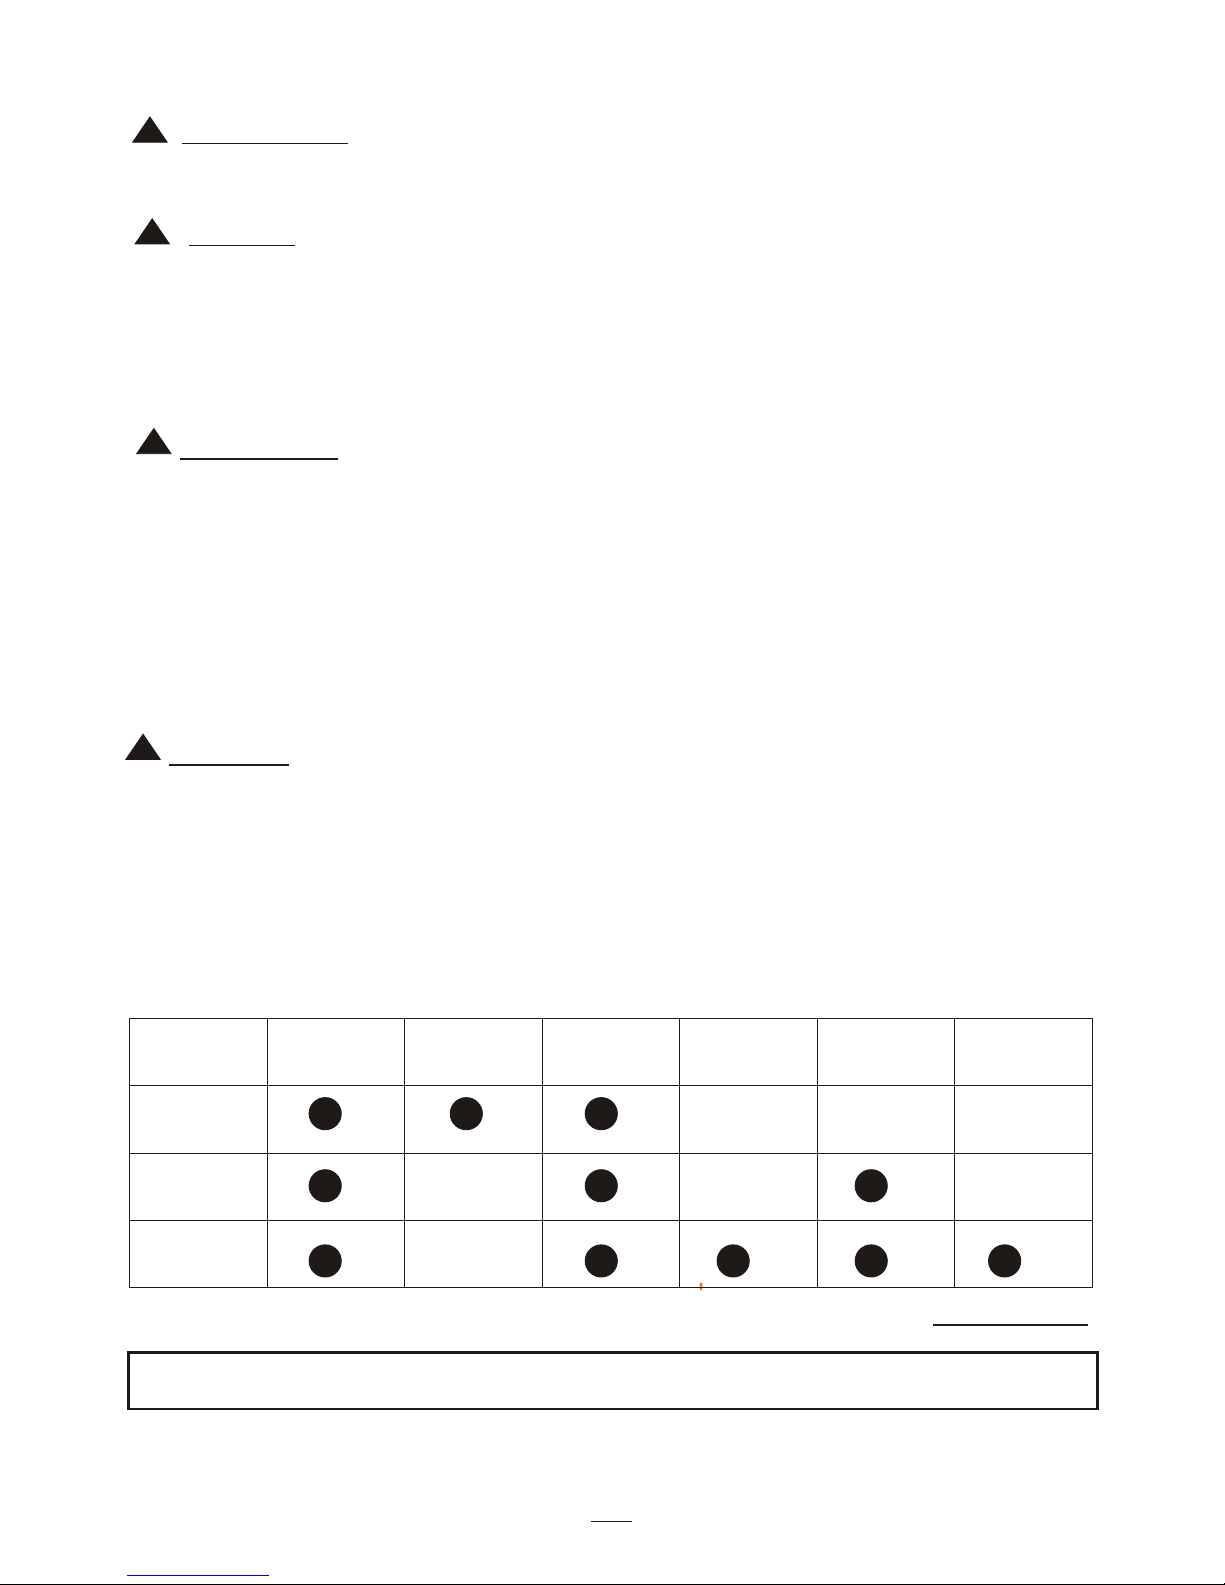
Below diagram F is the chart of start mode for each logger
Diagram F
Page 20
18
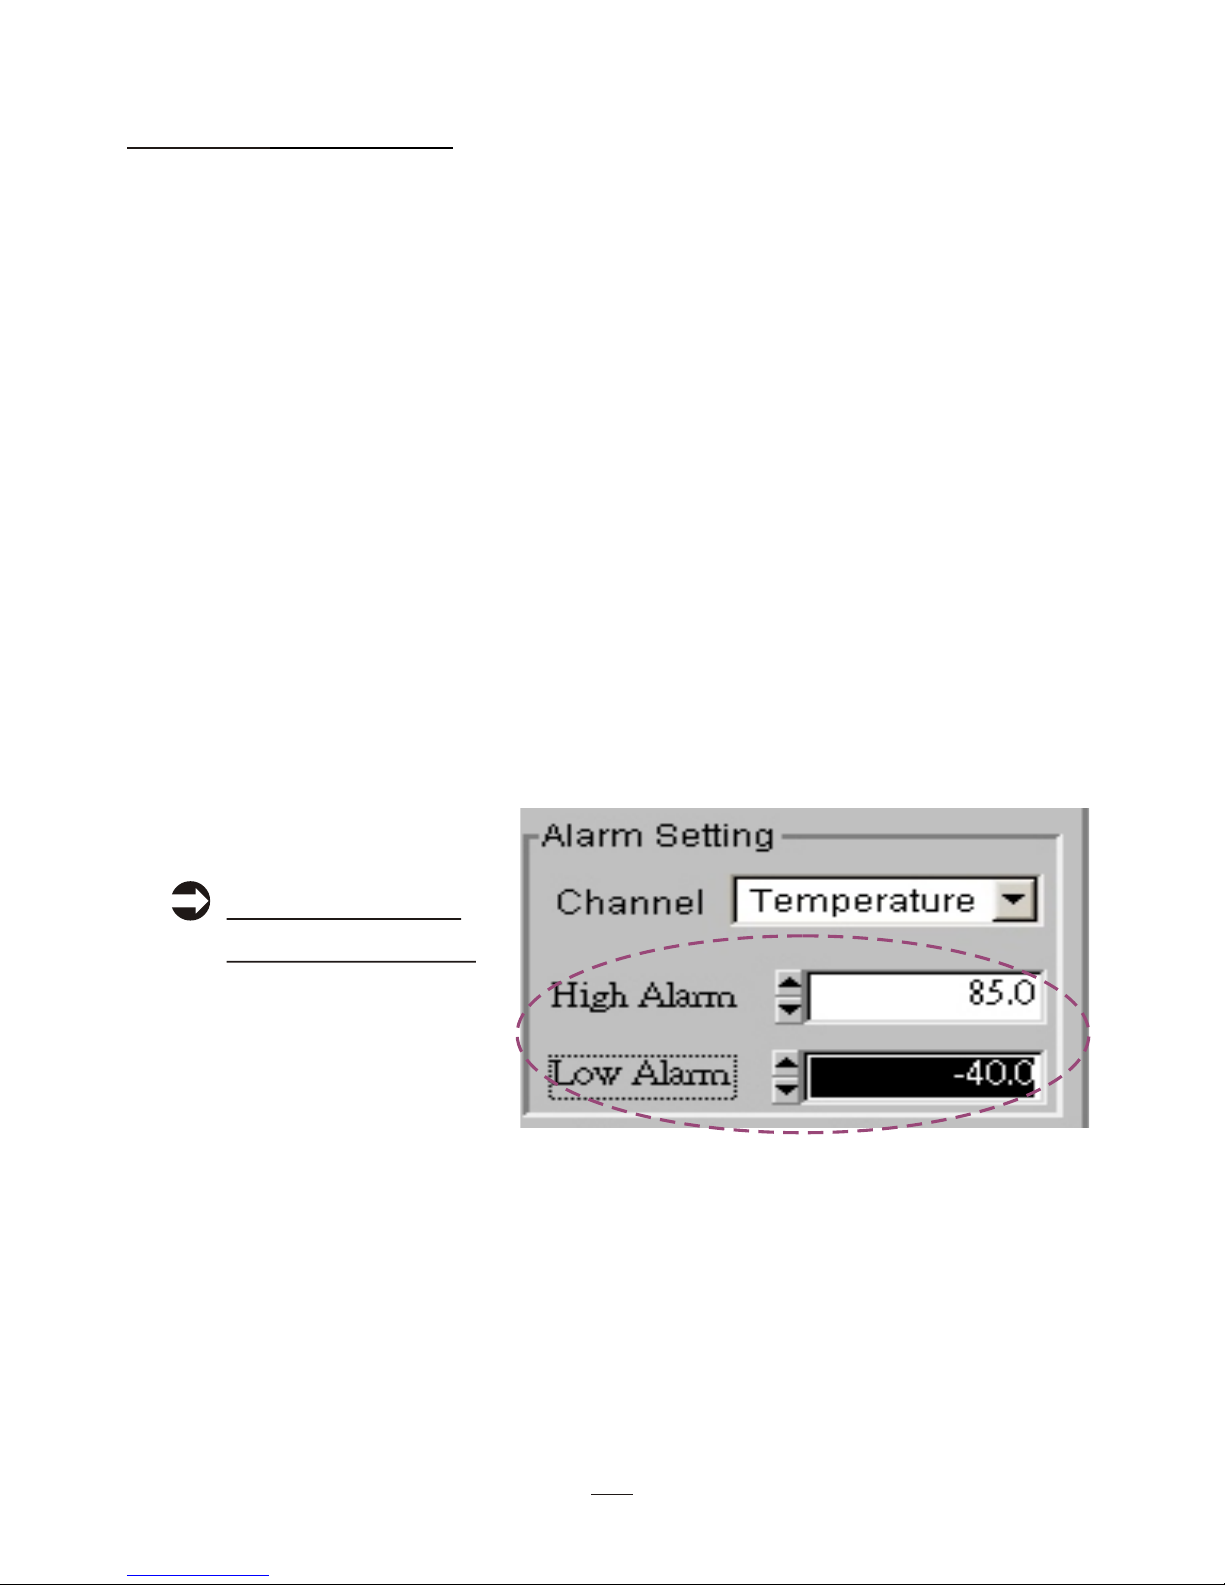
Setting up the High Alarm and the Low Alarm enables to activate
the red LED flash of the Data Logger. (See Dia. F-1)
-Select the channel you need: Air temp./external temp./ Air RH%.
If the logger not yet be set any alarm before, the default will be:
o
-High Alarm temperature defaults at 85 C.
o
-Low Alarm temperature defaults at -40 C.
-High Alarm Relative Humidity defaults at 100%.
-Low Alarm Relative Humidity defaults at 0%.
If the logger used to have alarm setting before, then, the default will
be the same as your last setting. You could choose to change it or not.
User simply select desired High value or Low value by scrolling up
for increasing or scrolling down for decreasing .
If a temperature or RH% is higher than HI setting or less than LO
setting, ALM LED will flash until you download to a PC.
ALARM SETTING
Diagram F-1:
Alarm Setting
While in 8829, could not set alarm of temperature and RH at the same.
The "channel" column will be disable in 8829. Please choose the
parameter you want to have alarm from "Unit" column and then set
the value as Diagram F-1
NOTE:
Page 21
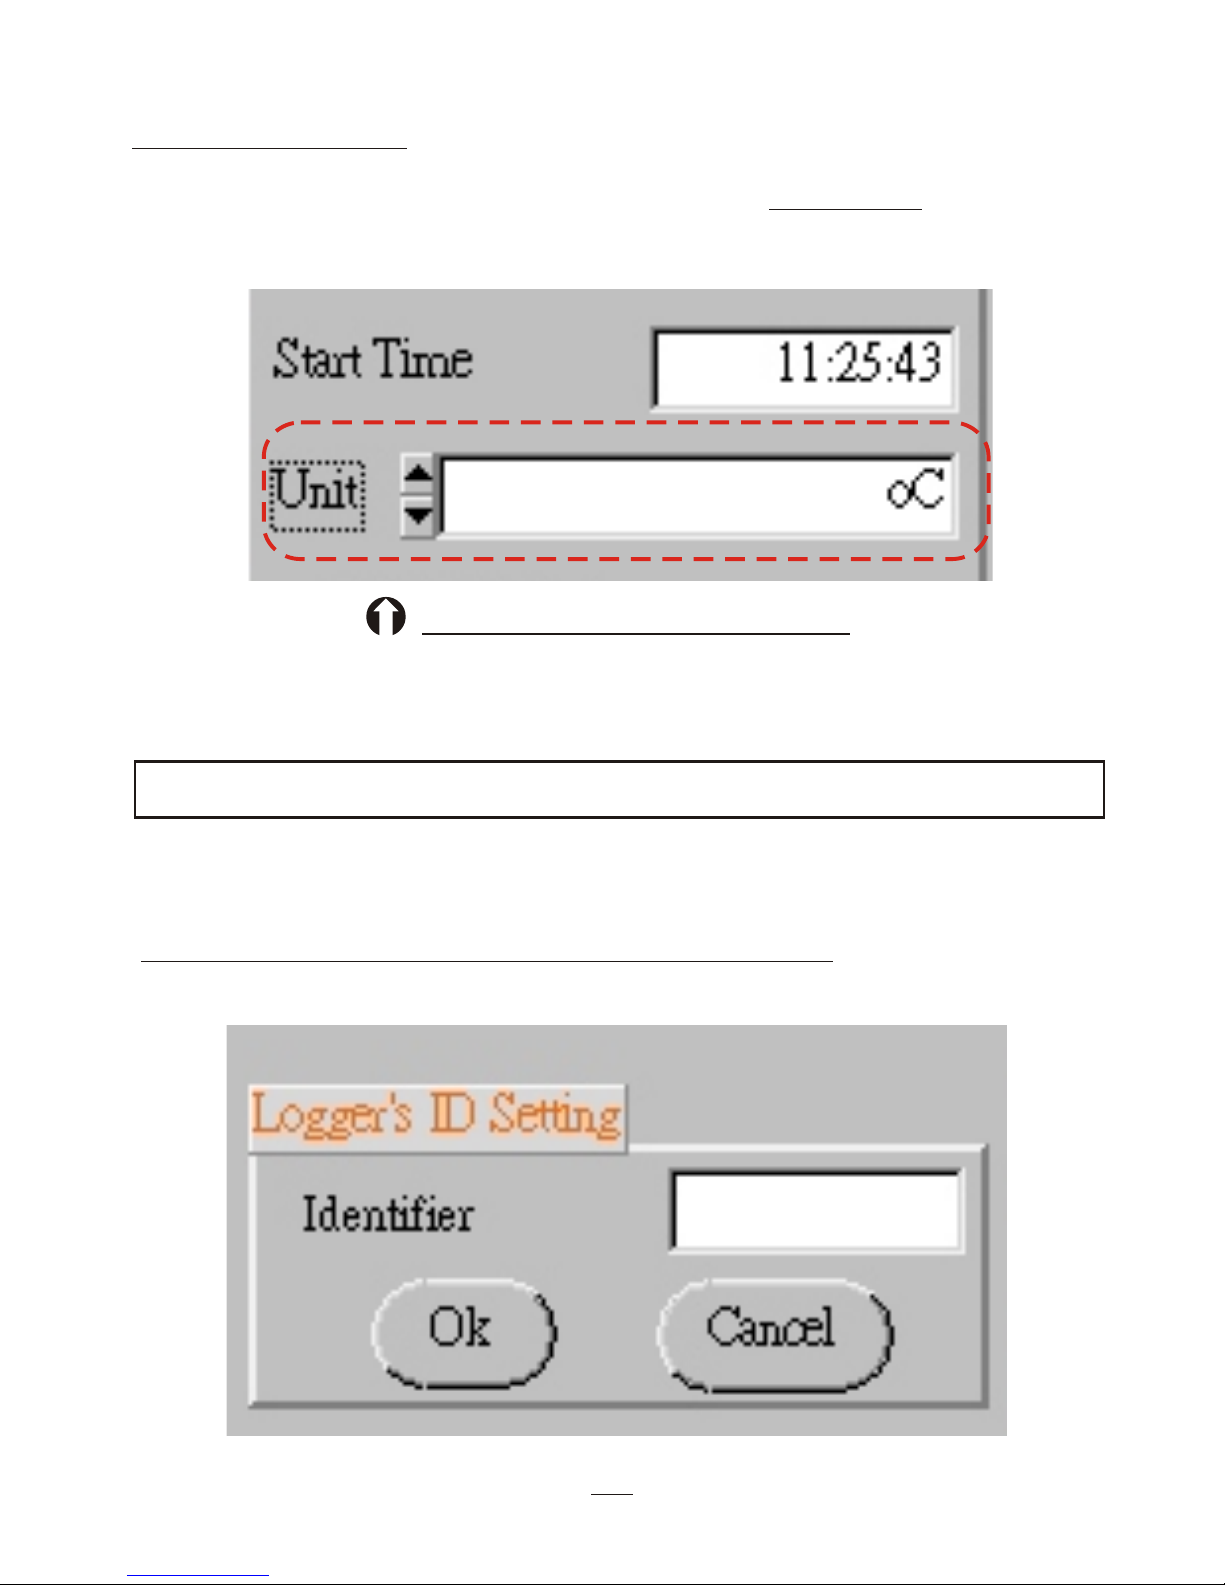
Diagram G: Unit setting
o
o
Data logger is available in " C" and " F" (See Diagram G).
UNIT SETTING
Logger's ID Setting enables user to give unique ID names to each
data logger (up to 8-digits), simplifying data tracking.
LOGGER ID SETTING
19
Please be sure NOT to let the ID setting blank.
Page 22
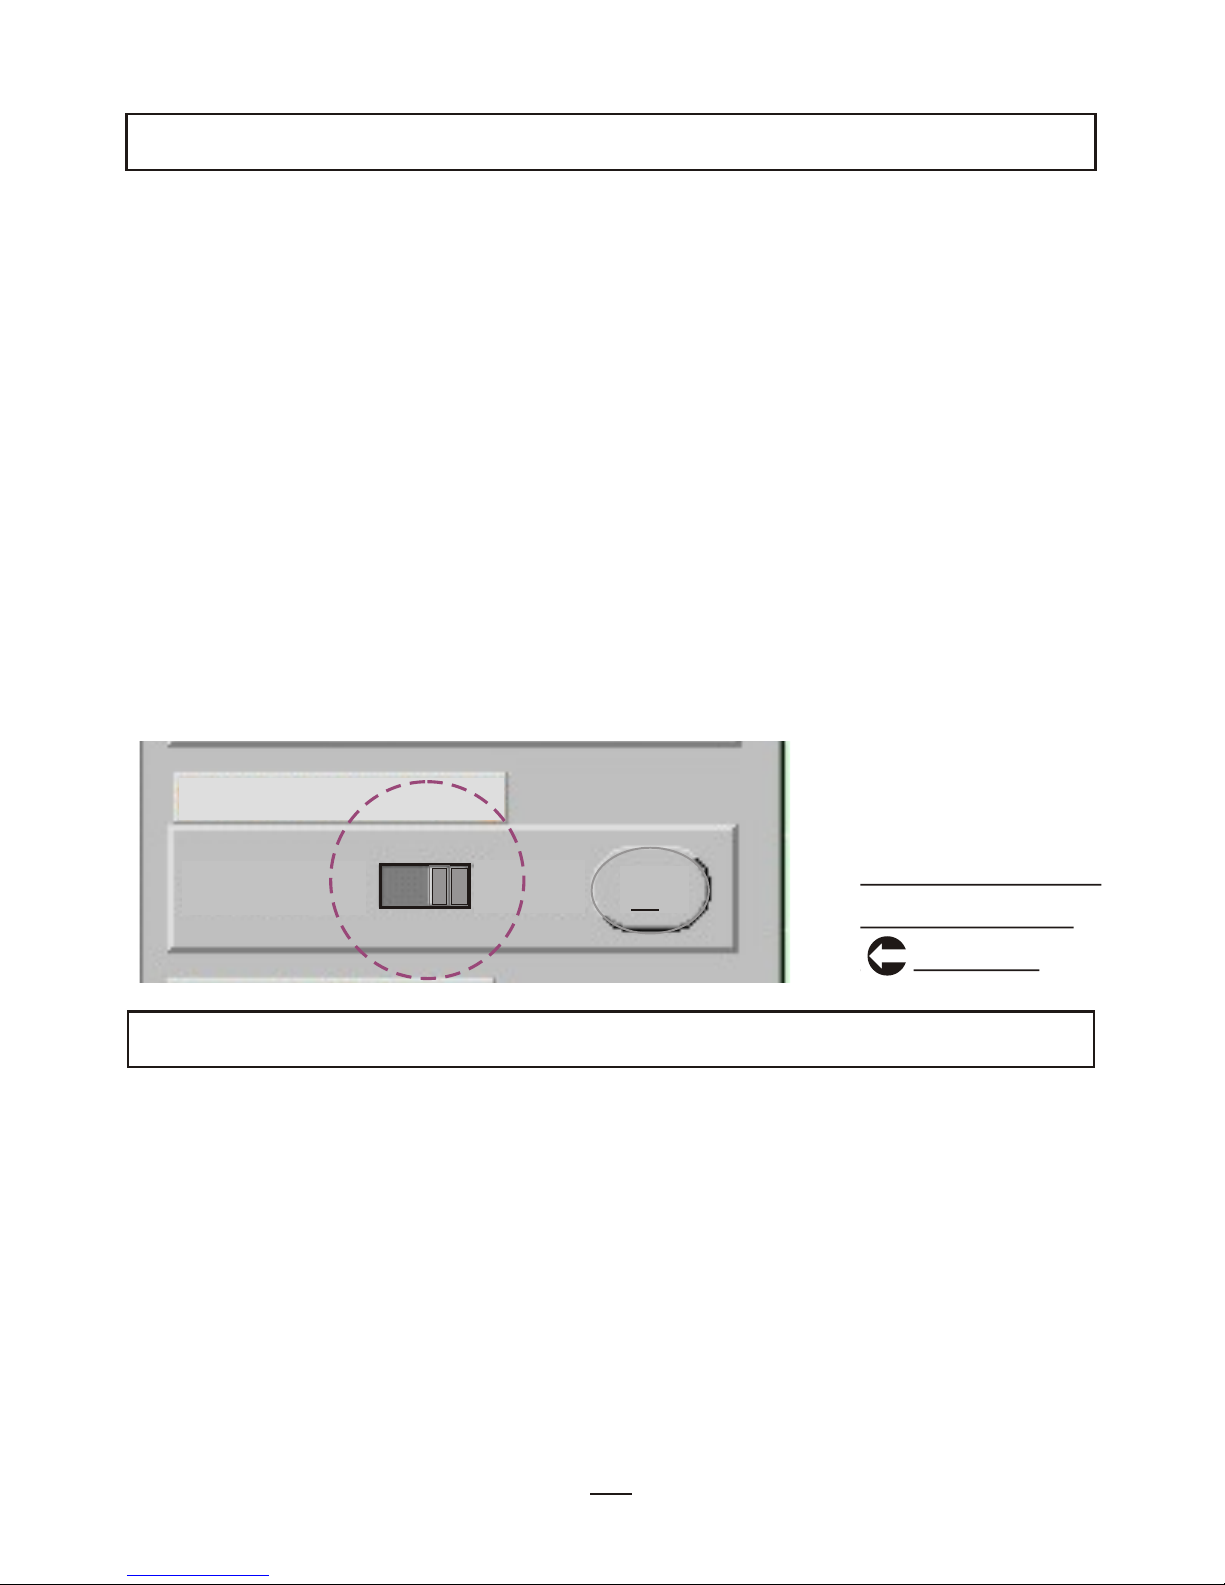
Diagram G-1:
Sleep Mode
setting
When the logger stop logging, all LCD included models could be used
to monitor the current temp. or RH condition. If you need this function,
You may select NON-SLEEP and press OK , then the logger will always
display current Temperature / Relative Humidity after completing
recording. Please be noted that this setting will consume the battery
power. (The software default in Sleep mode)
SLEEP MODE SETTING
20
Sleep Mode Setting
Ok
SleepNon-Sleep
Print out the data table to either a printer or a fax /internet application
depending on your available facilities. The print out points range is
selectable. (See Diagram H )
Depress icon to view detailed data table,which includes 1000 sample
readings. Temperature data shows the curser 1, If you are logging
model 8829 (Temp. & Relative Humidity), RH% reading shows
next to the temperature reading.
If logging model 8835, RH% and external temp. reading show next to
the temperature reading.
DATA TABLE
If you want to save battery and no need to monitor the environment
condition after stop logging, press the slide switch to the right for
SLEEP then click OK .
In model 8814/8815/8834/8835, you could press start/stop key shortly
to turn on/off the LCD any time.
Page 23
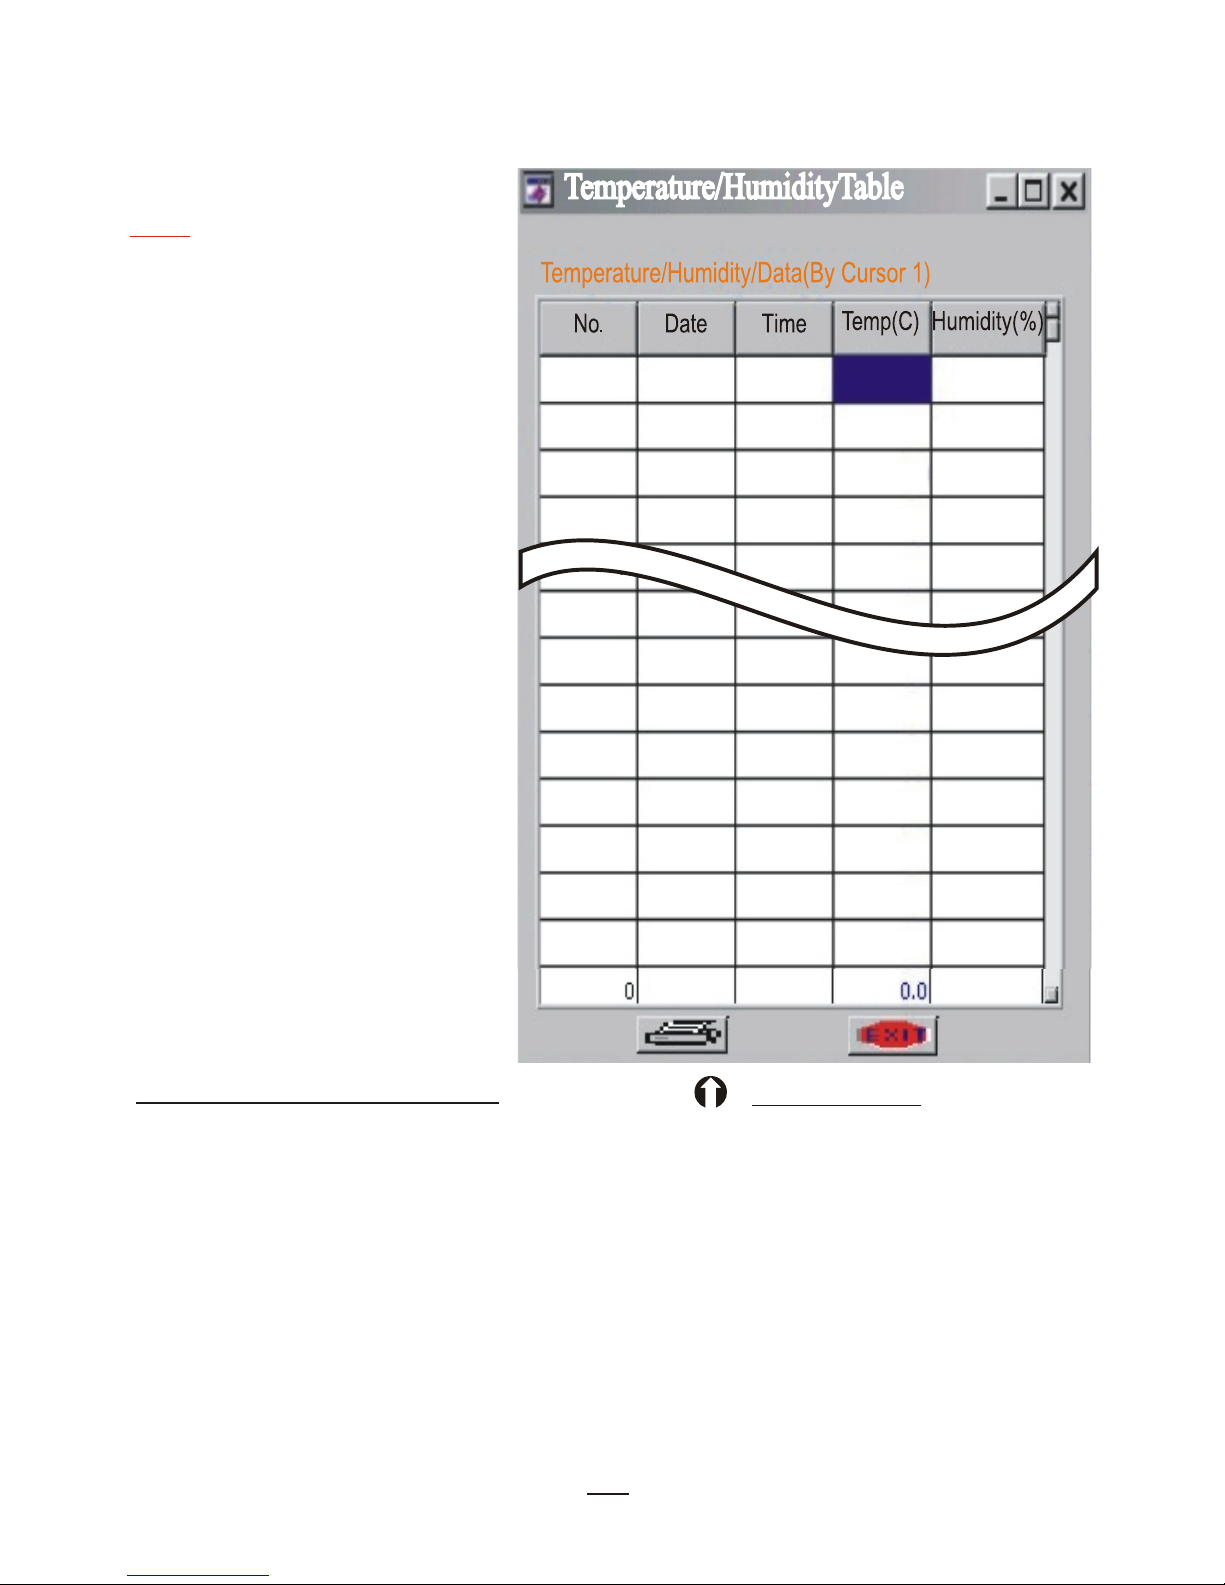
FAQ: Why won't data table be updated when removing the
cursor ?
Ans: It is when you
remove the cursor
between the ranges
( 1000 sample from
cursor 1).For
example : If you set
number 50 record
as cursor 1, the table
data shows from 50
to 1049 , now you
remove cursor 1
within the range,
the data won't be
updated, unless
remove the curser
1 outside the range,
i.e less than 50
or more than 1049 .
Diagram H:
21
EXIT
123
124
125
126
150
151
152
153
154
155
156
157
6-29-2001
6-29-2001
6-29-2001
6-29-2001
6-29-2001
6-29-2001
6-29-2001
6-29-2001
6-29-2001
6-29-2001
6-29-2001
6-29-2001
8:28:20
8:28:24
8:28:23
8:28:22
8:28:21
8:28:53
8:28:52
8:28:54
8:28:55
8:28:56
8:28:57
8:28:58
9.3
9.3
9.3
9.3
9.3
9.3
9.3
9.3
9.3
9.3
9.3
9.3
9.3
29.7
29.7
29.7
29.7
29.7
29.7
29.7
29.8
29.8
29.8
29.8
29.8
29.8
(Example)
.
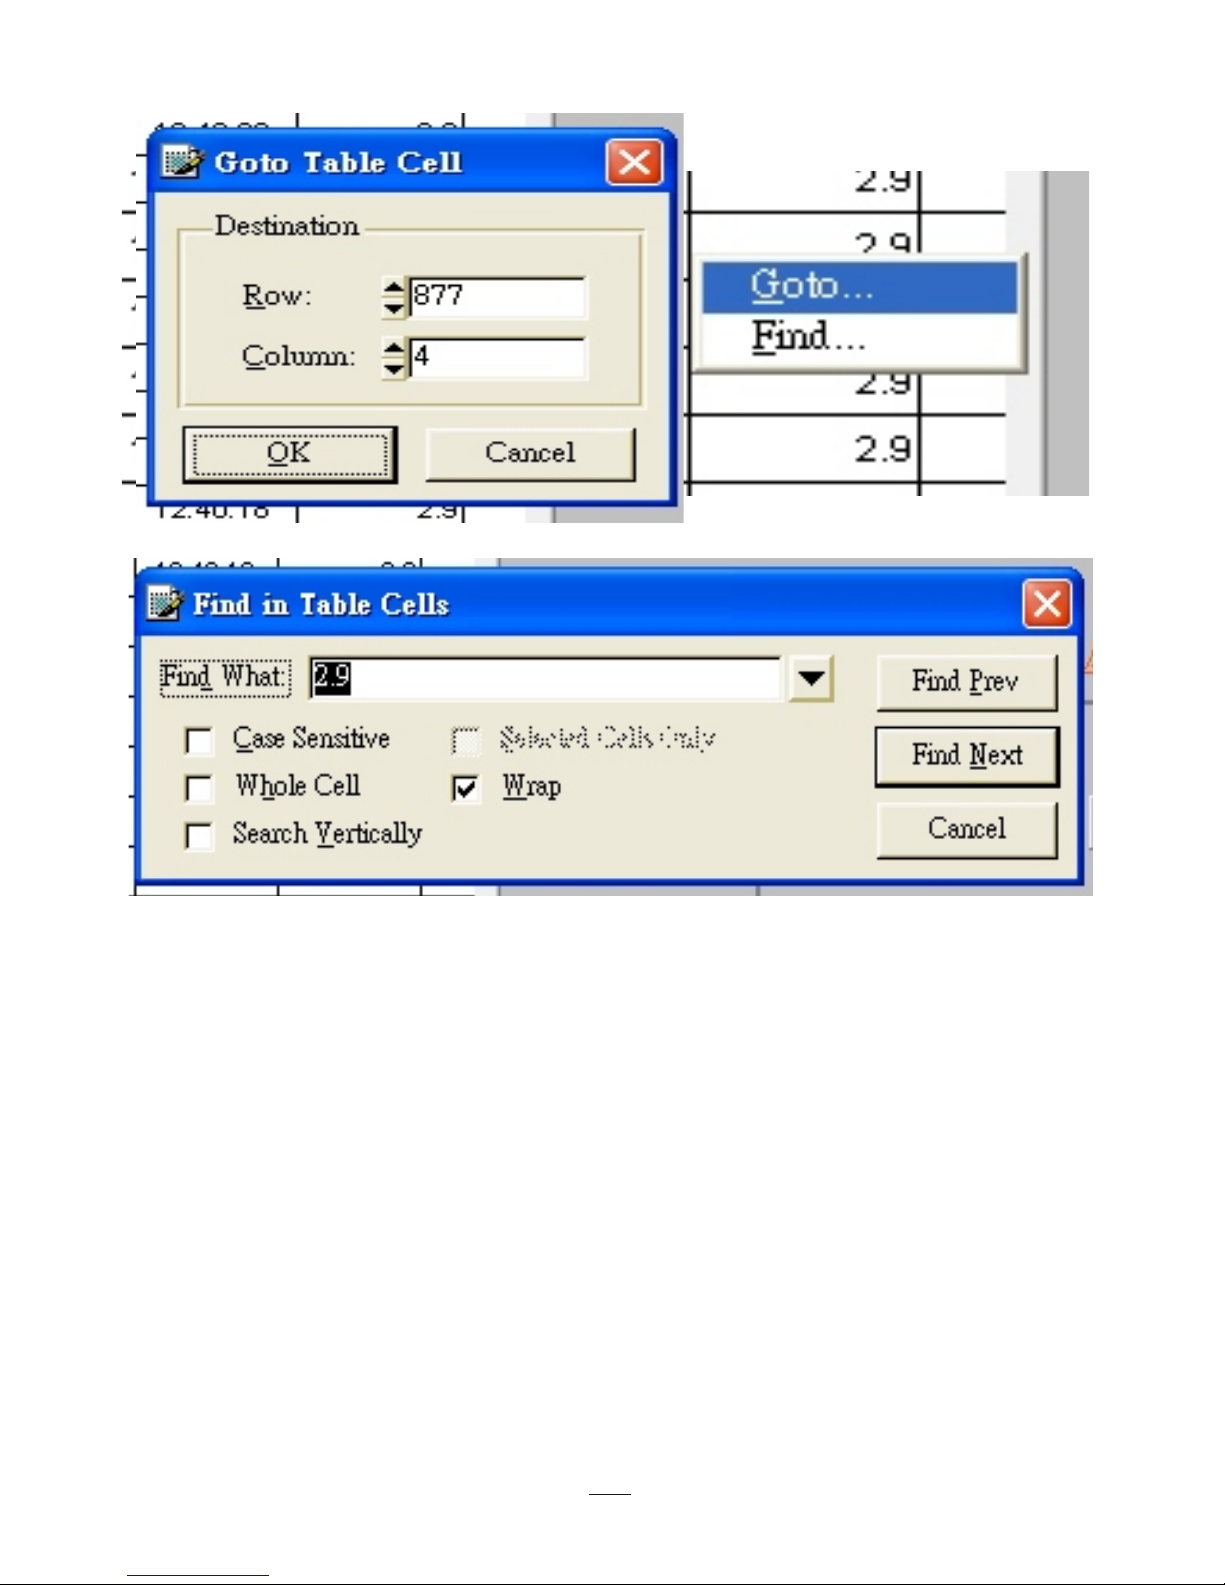
Find To search all numeric and text in the entire table or in a selection
range, for a text string. After the initial search, you can press
<F3> to find the next occurrence of the same text string.
Data table pop-Up Menu
Clicking the right mouse button anywhere over the table, you will
activate a menu which contains Goto and Find.
Goto You can specify a target cell to go to, using its row and column
indices. Key in which row and column you want to go, then press
"OK", the cursor will go to the destination.
Page 24
22
From Find menu dialogue, you may enter the value or number
or letters you try to find in the "Find What " block. Select from
the following :
1. Case Sensitive
2. While Cell
3. Search Vertically
4. Select Cell Only
5. Wrap
Click any of above , and press "Find Next " button to find , press
again to find the next , press "Find Prev." To find the previous
found point, or exit by pressing "Cancel" key .
Page 25
23
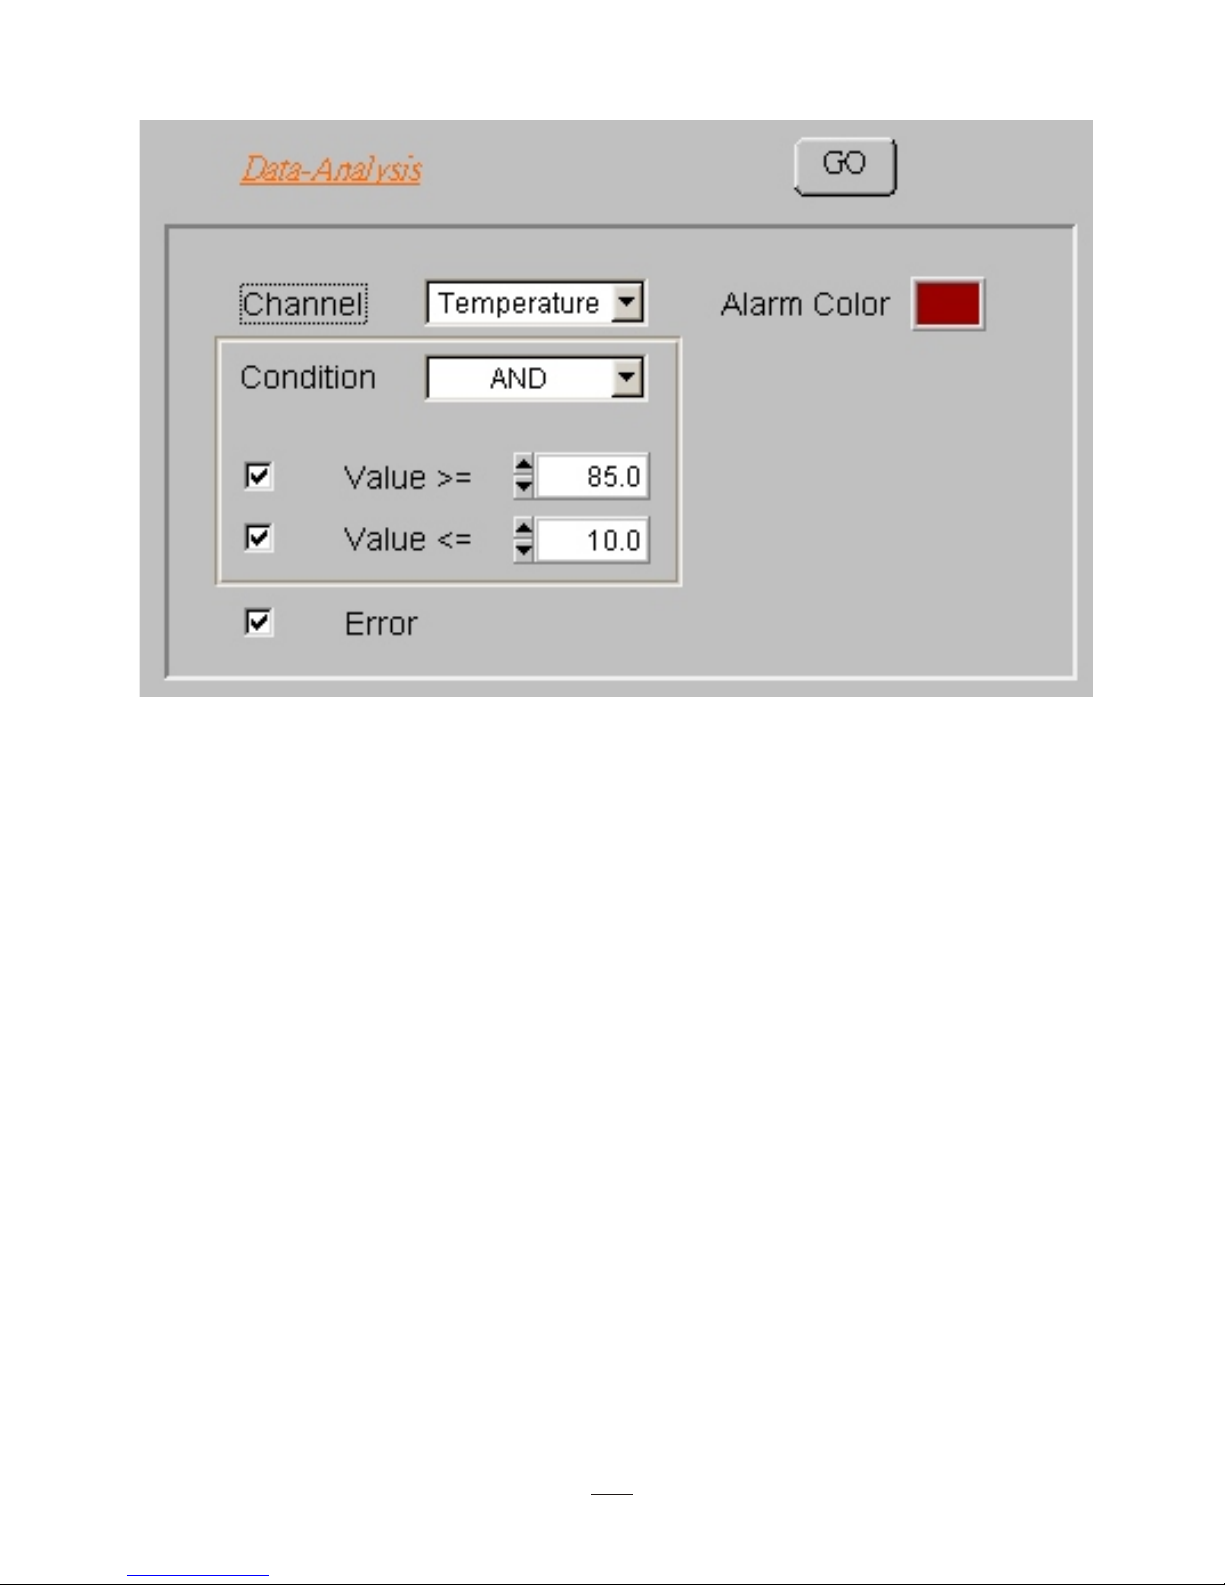
To remark the specified data, select the channel, condition and range
first, then press "GO" to remark the qualified reading. The color of
remarked text could be selected.
1. Channel: temperature/RH%/external temperature
2. Condition : AND /OR
3. Value>= certain reading
4. Value<= certain reading
5. Error: If selecting this, all the Error code appeared in data table will
be marked and counted.
6. Alarm Color: Press to change the color of remarked reading
After selection, press "GO" to run the program. The qualified reading
will be selected and indicated with the color you choose.
Page 26
24
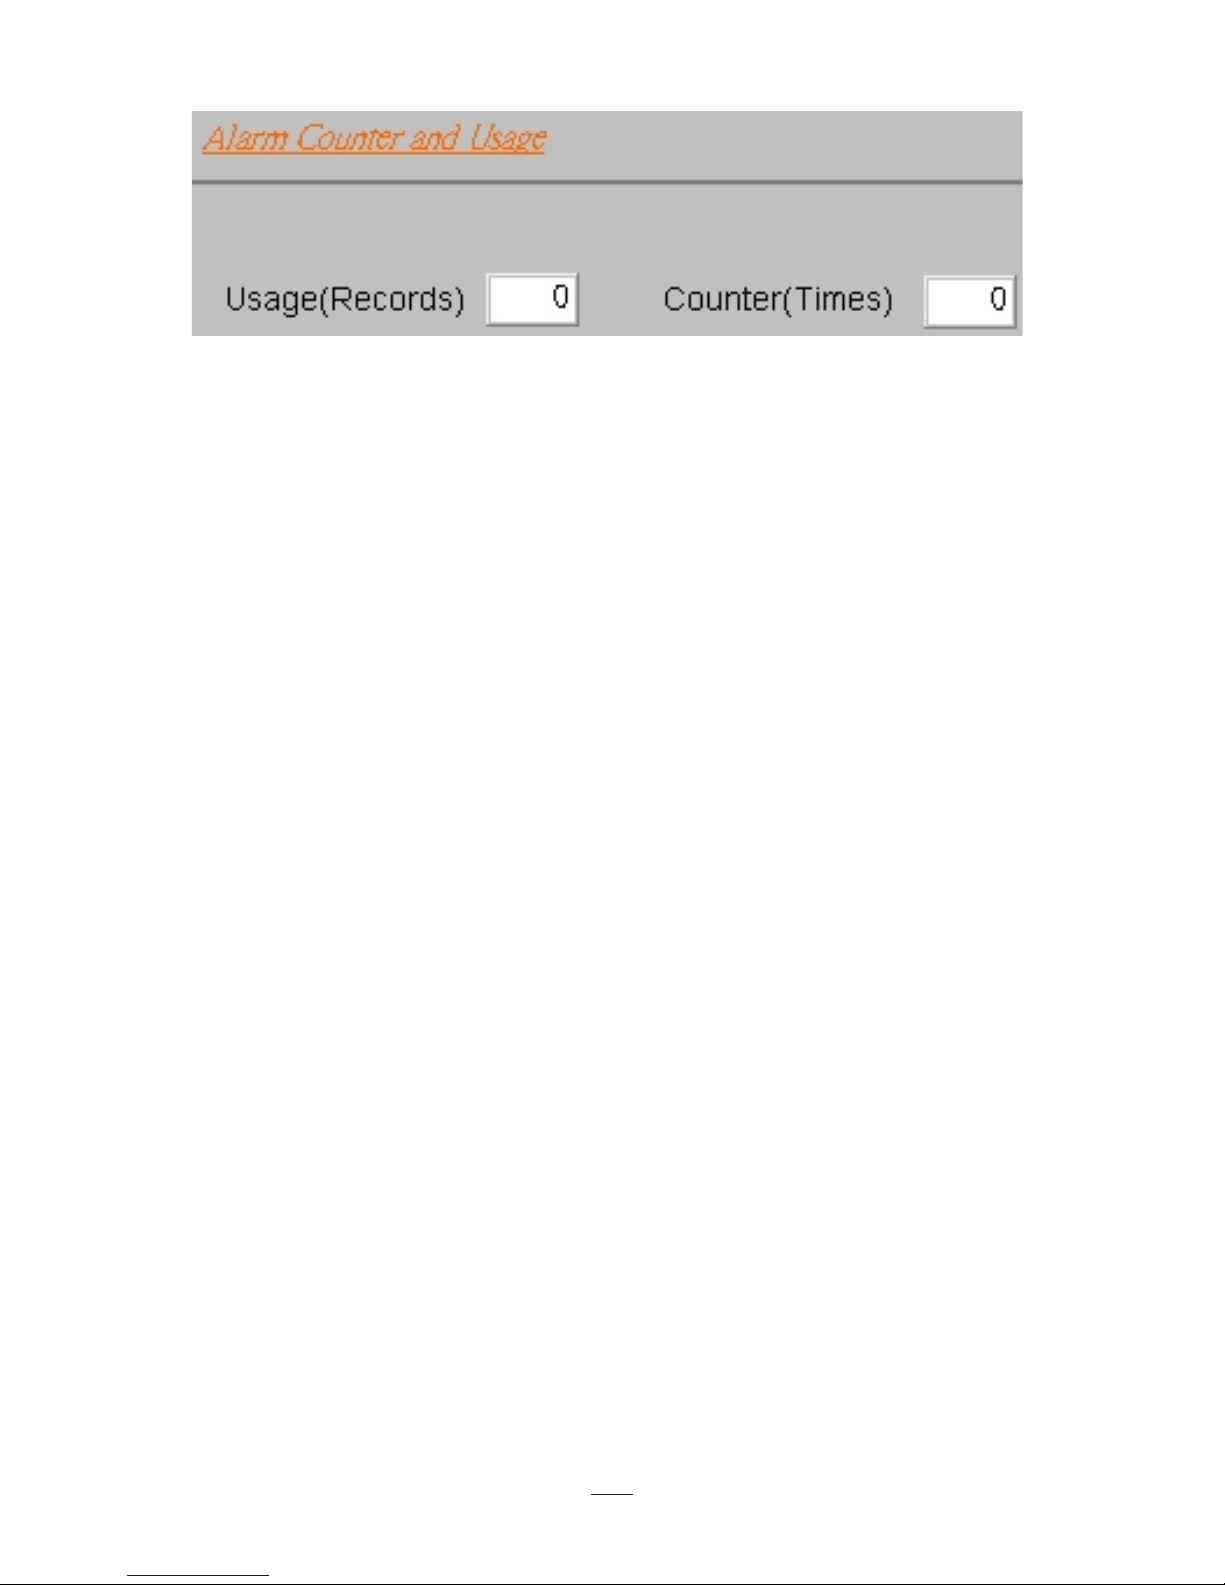
Usage(Records): The software could help to count how many records
is within the range you set.
Counter ( Times): Help to count how many runs the data out of the
select range and then come back again.
Page 27

STATISTICS
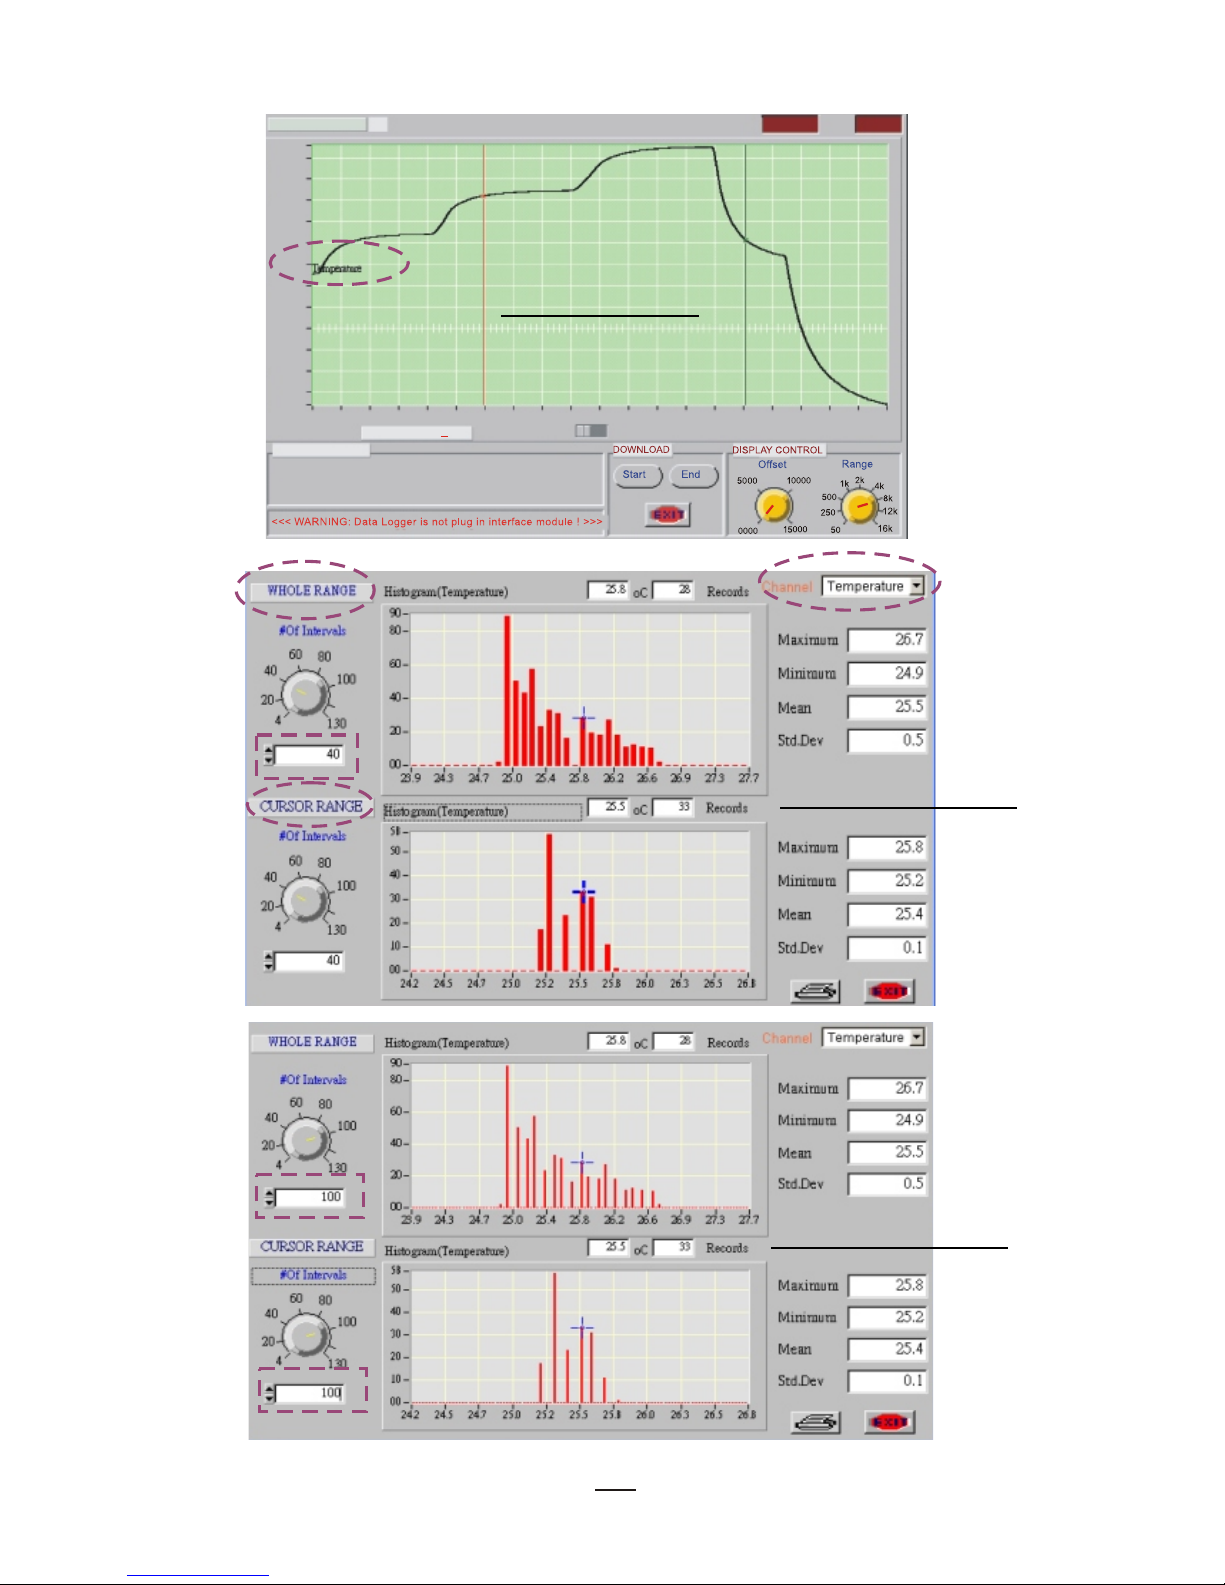
Depress icon to view histograms of data based on "Whole Range"
and on different "Cursor Range" basis. See (Diagram I)
Whole Range - Covers all sample readings which have been logged.
Cursor Range - Covers all sample readings between two cursors.
Channel- select the parameters you want to check. (Diagram I-1)
25
1. First of all, you could select the parameters you want to check. For
example, if there are three parameters ( temp./RH%/external temp.)
you could change the parameters which you want to see.
. Diagram I-2 is another example of setting the
2. As shown in the middle top of Diagram I-1, by changing the cursor
position on the graph, you will find an example for the statistic screen
of temperature records. Samples located at the temperature of
oo
25.8 C is 28 samples, or 33 samples at the temperature of 25.5
C
between two cursors' range as shown in the middle bottom).
3. If you set all sample readings into 100 divisions, you will find the
histogram of whole range changed as well.(Diagram I-2)
4 cursor range; it has
been set into 100 division as well.
5. If you compare Diagram I, I-1,I-2, you will notice the differences
of changing setting have also changed the related figures.
Page 28
Temperature Logger Monitor
File name:d\TRLog\TempRhEx2.txt
ID=
PREVIOUS SETTING:
86.0
88.0
70.0
60.0
50.0
40.0
30.0
20.0
10.0
0.0
-10.0
-20.0
-30.0
-36.0
Temp(C)
DATE(M-D-Y) TIME
11-23-2001
17:12:57
0001 0401 0801 1201 1601 2001 2401 2801 3201 3601 4000 4400 4800 5200 5600 6000 6400 6800 7200 7600 8000
08-03-2001 14:46:05
TEMPERATURE CHART
Record No
Time
08-03-2001 19:12:43
CURSOR LOCATION
Cursor 1: # 2381 T=62.2 Date(M-D-Y)=08-03-2001 Time=16:10:23
Cursor 2: # 6028 T=41.4 Date(M-D-Y)=08-03-2001 Time=17:20:31
Diagram I
26
Diagram I-1
Diagram I-2
Page 29
27
Maximum :
The greatest value of whole logged records or
the greatest value between two selected cursors
Minimum : The least value from the logged records or
the least value between two selected cursors
Mean : Average value from the logged records or
average value between two selected cursors
Std. Dev. : This is a very useful feature to see more reliable
deviation while recording . Calculate each deviation
between each value and Mean value, then get an
average figure from totalism deviation.
Maximum
Minmium
Mean
Std.Dev
85.1
41.4
72.0
11.6
6. The right part of Diagram I indicates Maximum, Minimum, Mean
and Standard Deviation (Std.Dev) values from the temperature
of whole range ( Upper part ) and between 2 cursors' range
( Lower part ).
Page 30
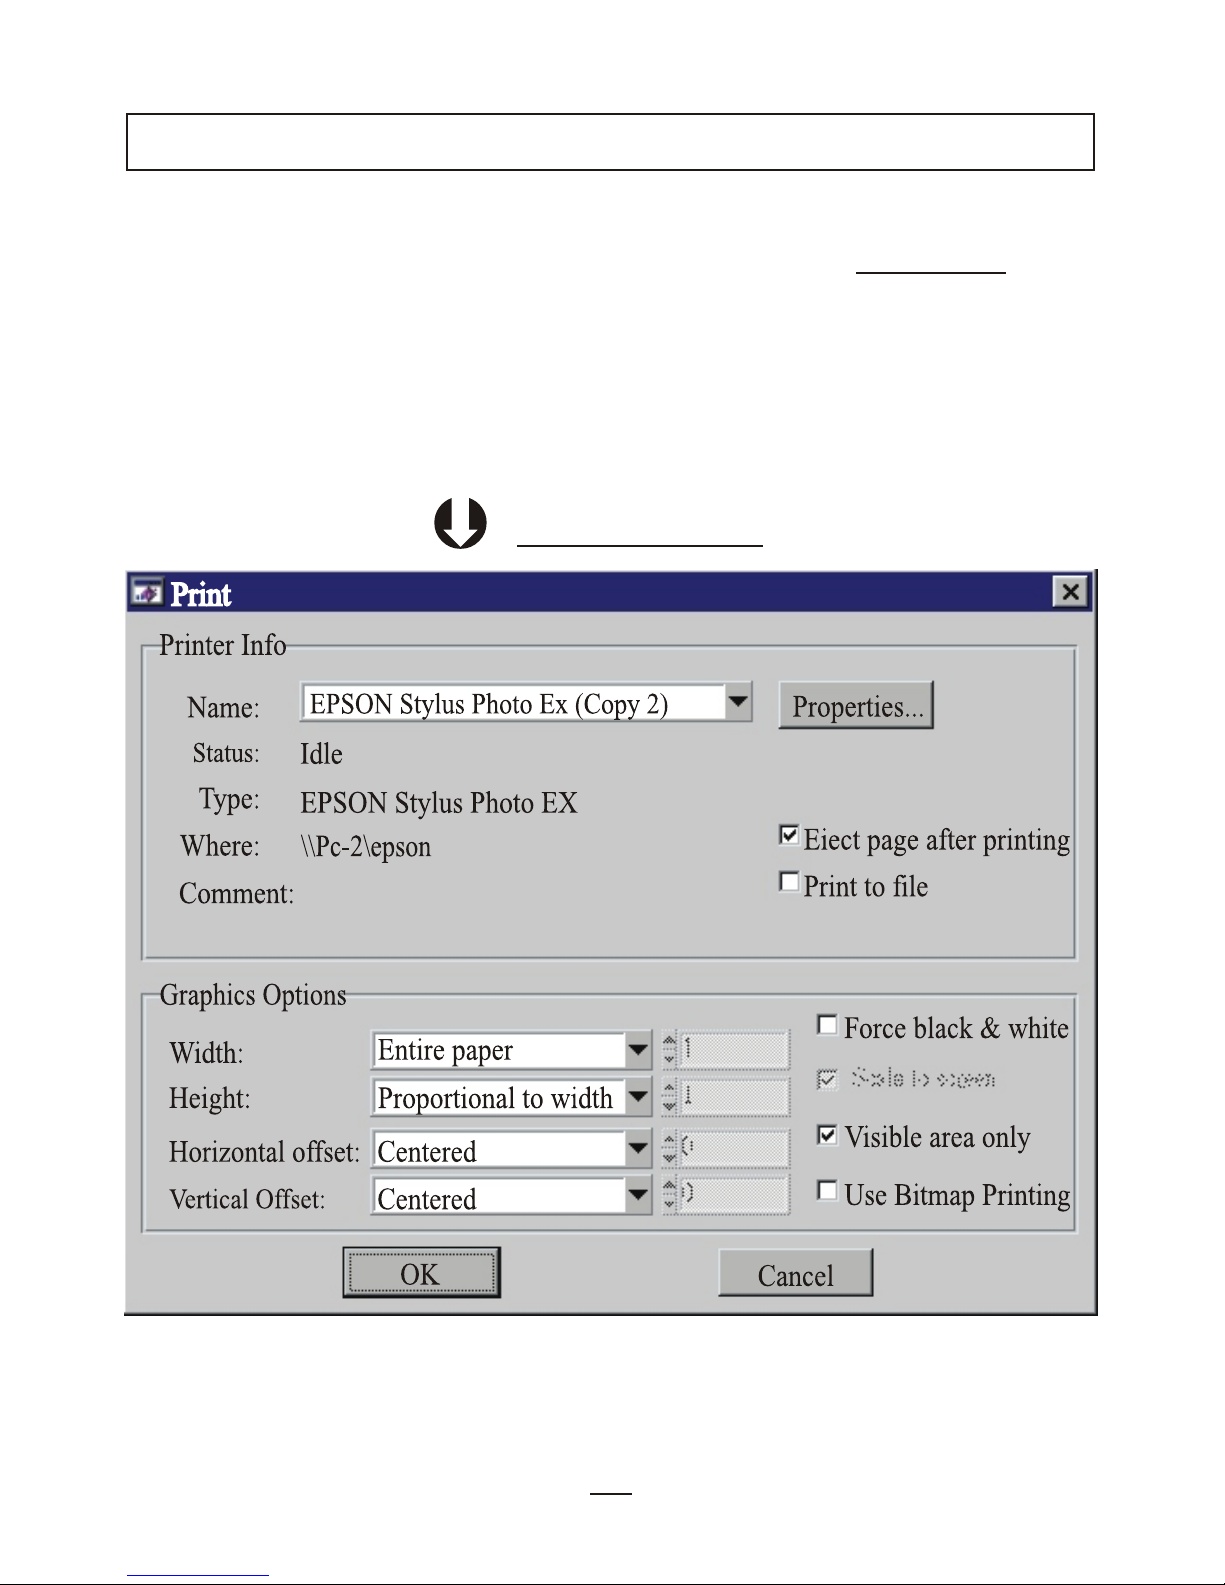
Depress icon to print the graph out to either a printer or a fax/internet
program depending on your available facilities. See diagram J.
Selecting "Print" button on the menu bar, Windows "Print" dialog
box allows you to change the pre-set format ,then print the contents
of the currently active window .
PRINT GRAPH
Diagram J
28
(Example)
Page 31
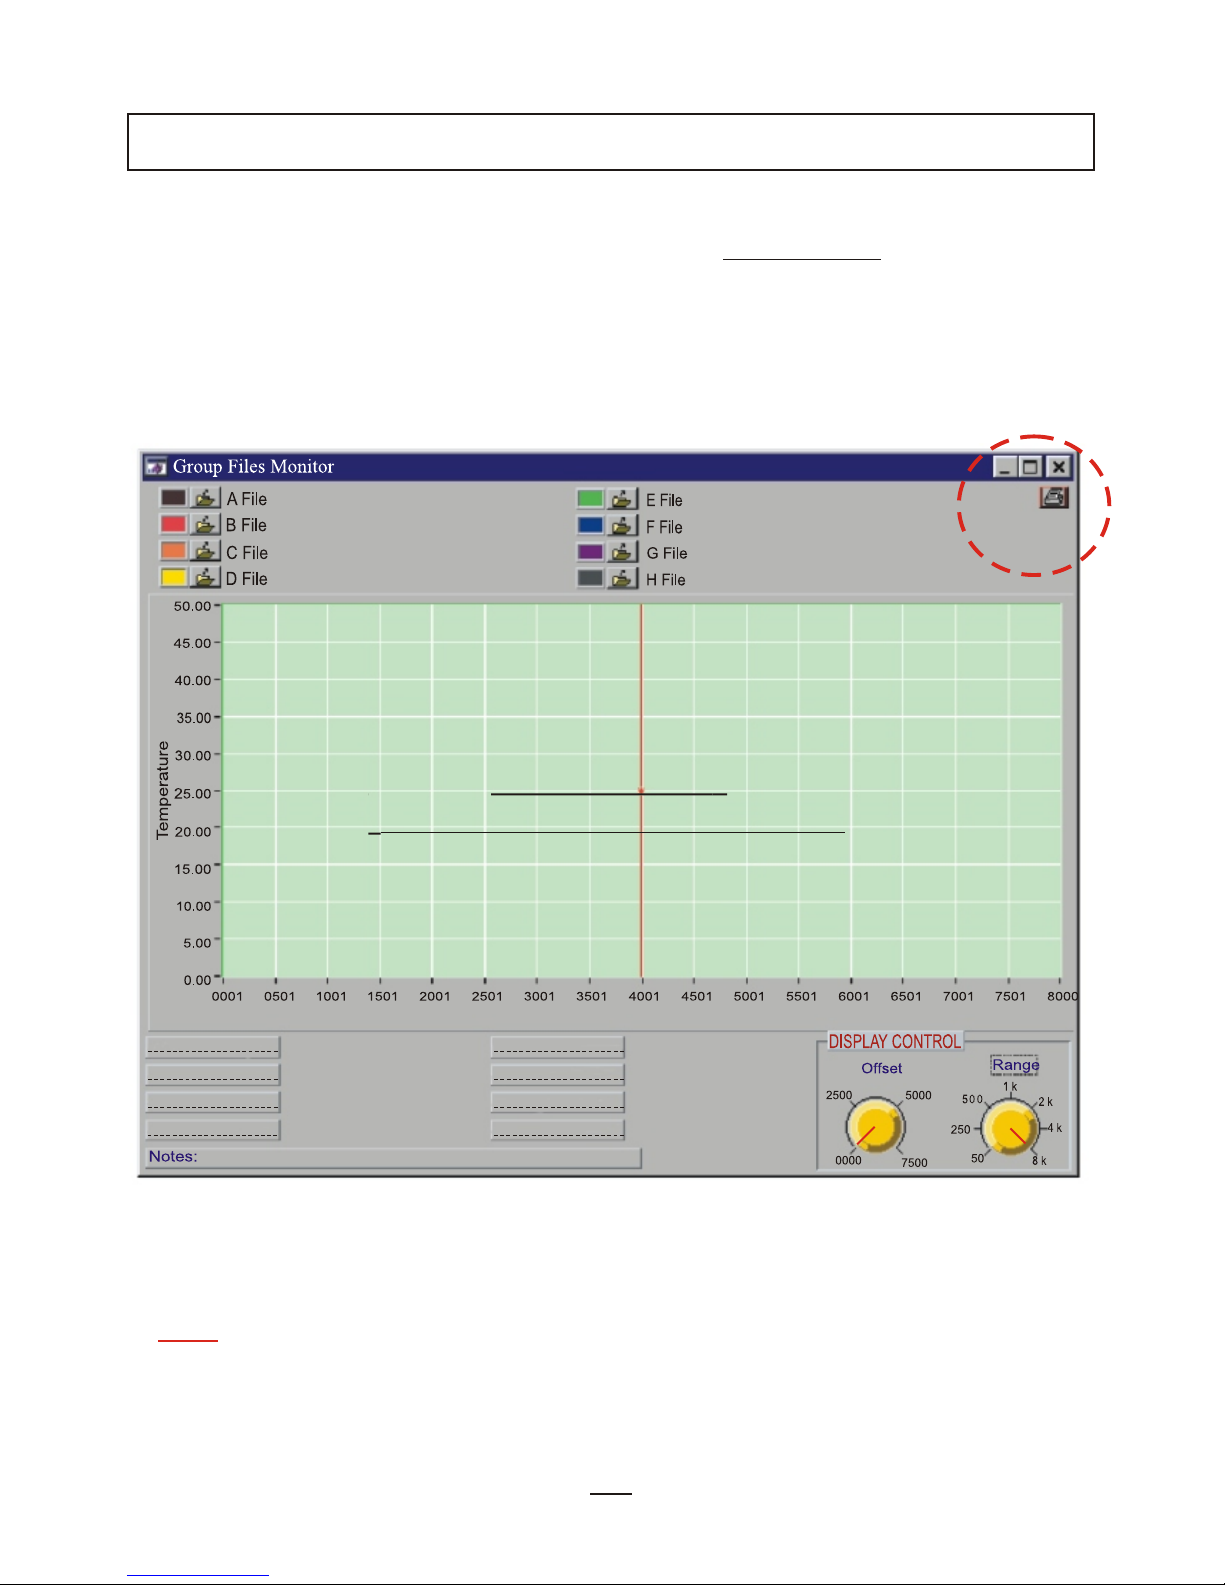
GROUP FILES
Click on its icon to view "Multi-Logger Monitor", which is designed
to view and to compare different data files.Diagram K is the screen
before you clicking the icon.You may select and change the color of
curve to refer to the file you retrieve by clicking the color block.
You can print the screen datas by clicking the printer icon at the right
top corner.
29
FAQ: If I want to retrieve another file to replace current file
shown on the graph , how should I ?
Ans: Select the file you don't want and then select the desired file
you want to retrieve.
Diagram K:
MULTI-LOGGER GROUP FILE
TEMPERATURE CHART
Record No:
Page 32
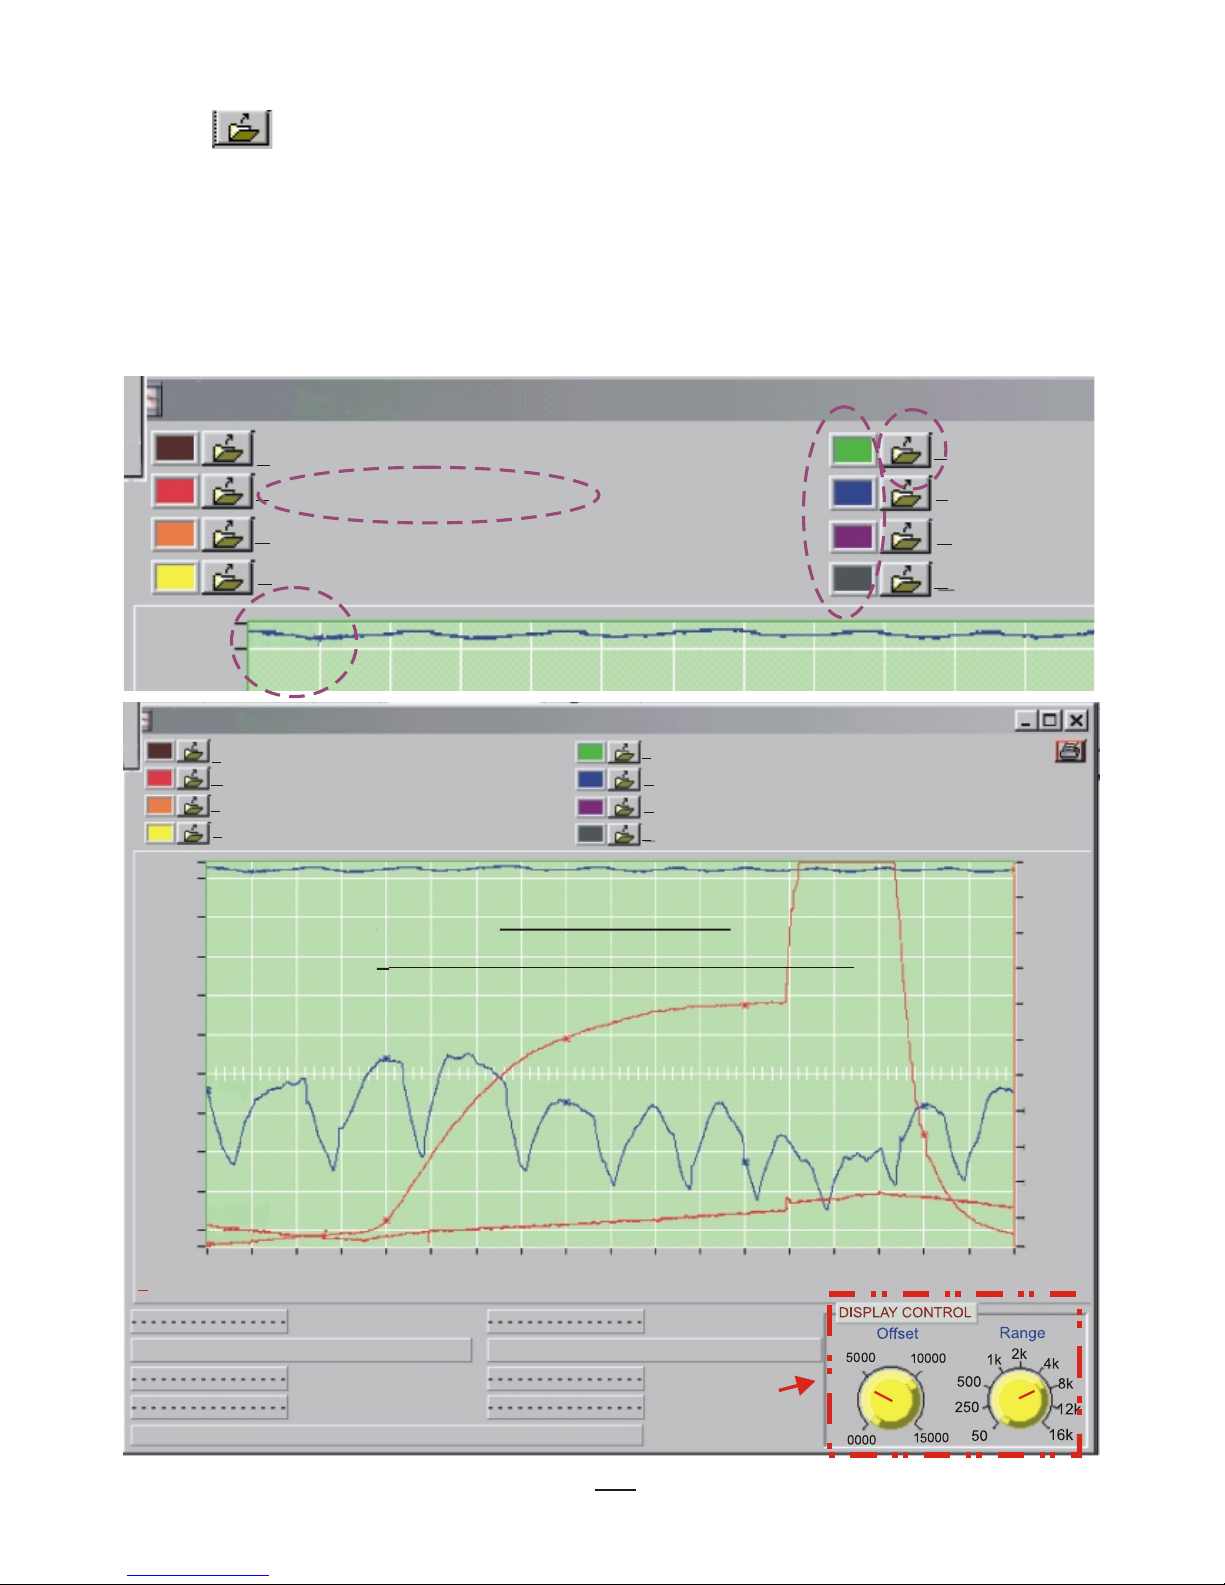
Click to select the file you want to compare or view with
other files , click color icon box to select the color you want ,
After file retrieved completed , the start point of the file curve
indicate with a Capital initial ( A, B, C, D, E, F, G, H ) and
Temperature or Humidity, the file name follow the capital
shown on below screen .
Group File Monitor
G File
H File
E File
C File
A File
B d:\TRLog\TempRhEx3.txt F d:\TRLog\TempRhEx2.txt
D File
27.0
26.0
F.TEMP
(Example)
Group File Monitor
G File
H File
E File
C File
A File
B d:\TRLog\TempRhEx3.txt
F d:\TRLog\TempRhEx2.txt
D File
27.0
26.0
20.0
15.0
10.0
-5.0
5.0
-10.0
-15.0
-20.0
-22.0
0.00.0
Temperature
TEMPERATURE CHART
4398 4598 4798 4998 5198 5398 5598 5798 5998 6198 6398 6598 6798 6998 7198 7398 7598 7798 8000
99.9
95.0
90.0
85.0
80.0
75.0
70.0
65.0
60.0
55.0
50.0
46.0
%Rh
B:Date=07-16-2001 Time=15:26:10 T=-17.0 RH=47.8
F:Date=07-17-2001 Time=14:09:15 T=26.1 RH=67.4
Retrieve B file completed
F.TEMP
F.RH%
B.TEMP
B.RH%
Display
Control
30
Record No:
Diagram L:
MULTI-LOGGER GROUP FILE
Page 33
Indicates different data files loaded and shown in different colors of
histogram.
To compare with different data files :
Diagram K displays main screen before retrieving any file.
Diagram L is what you see after loading the example files:
You can always change the offset and range setting desired
by moving the indicator on the yellow button. Please see Diagram L ,
refer to the introduction DISPLAY CONTROL.
31
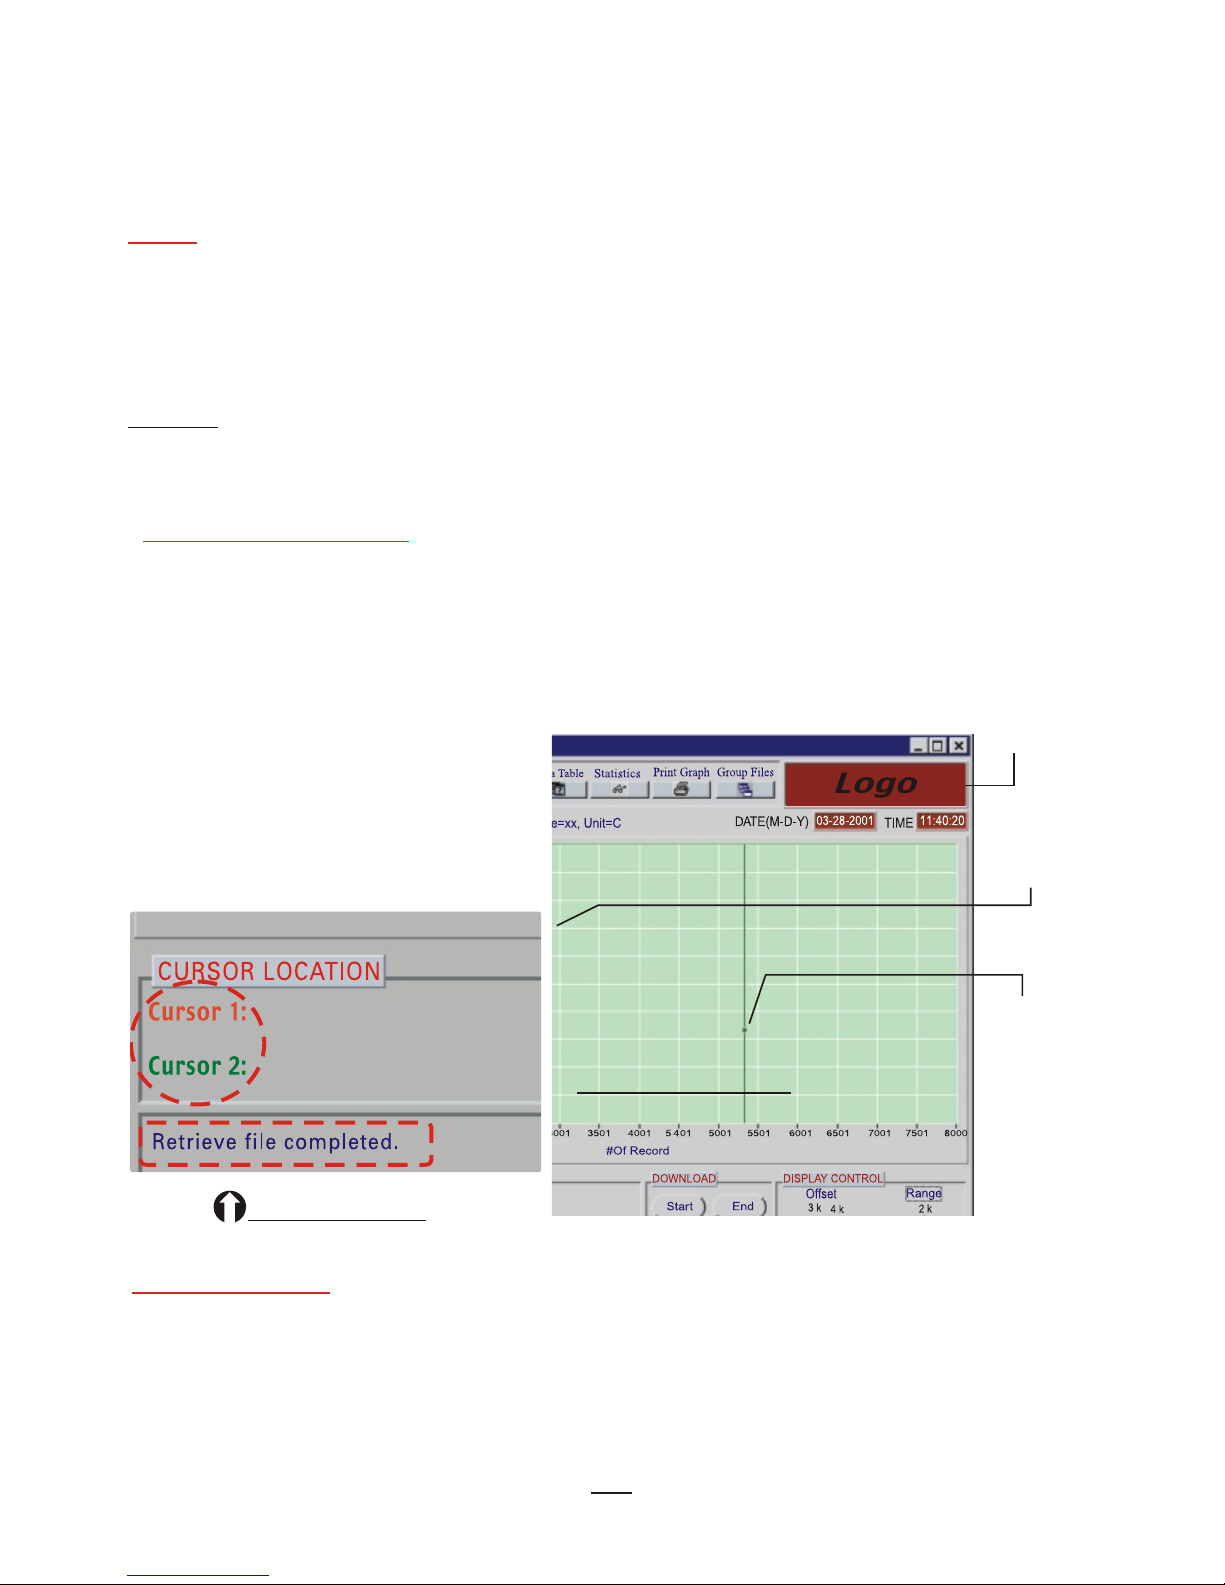
CURSOR STATUS
The Cursor Status indicates exact figures of Cursor 1 and Cursor 2.
(See Diagram N)
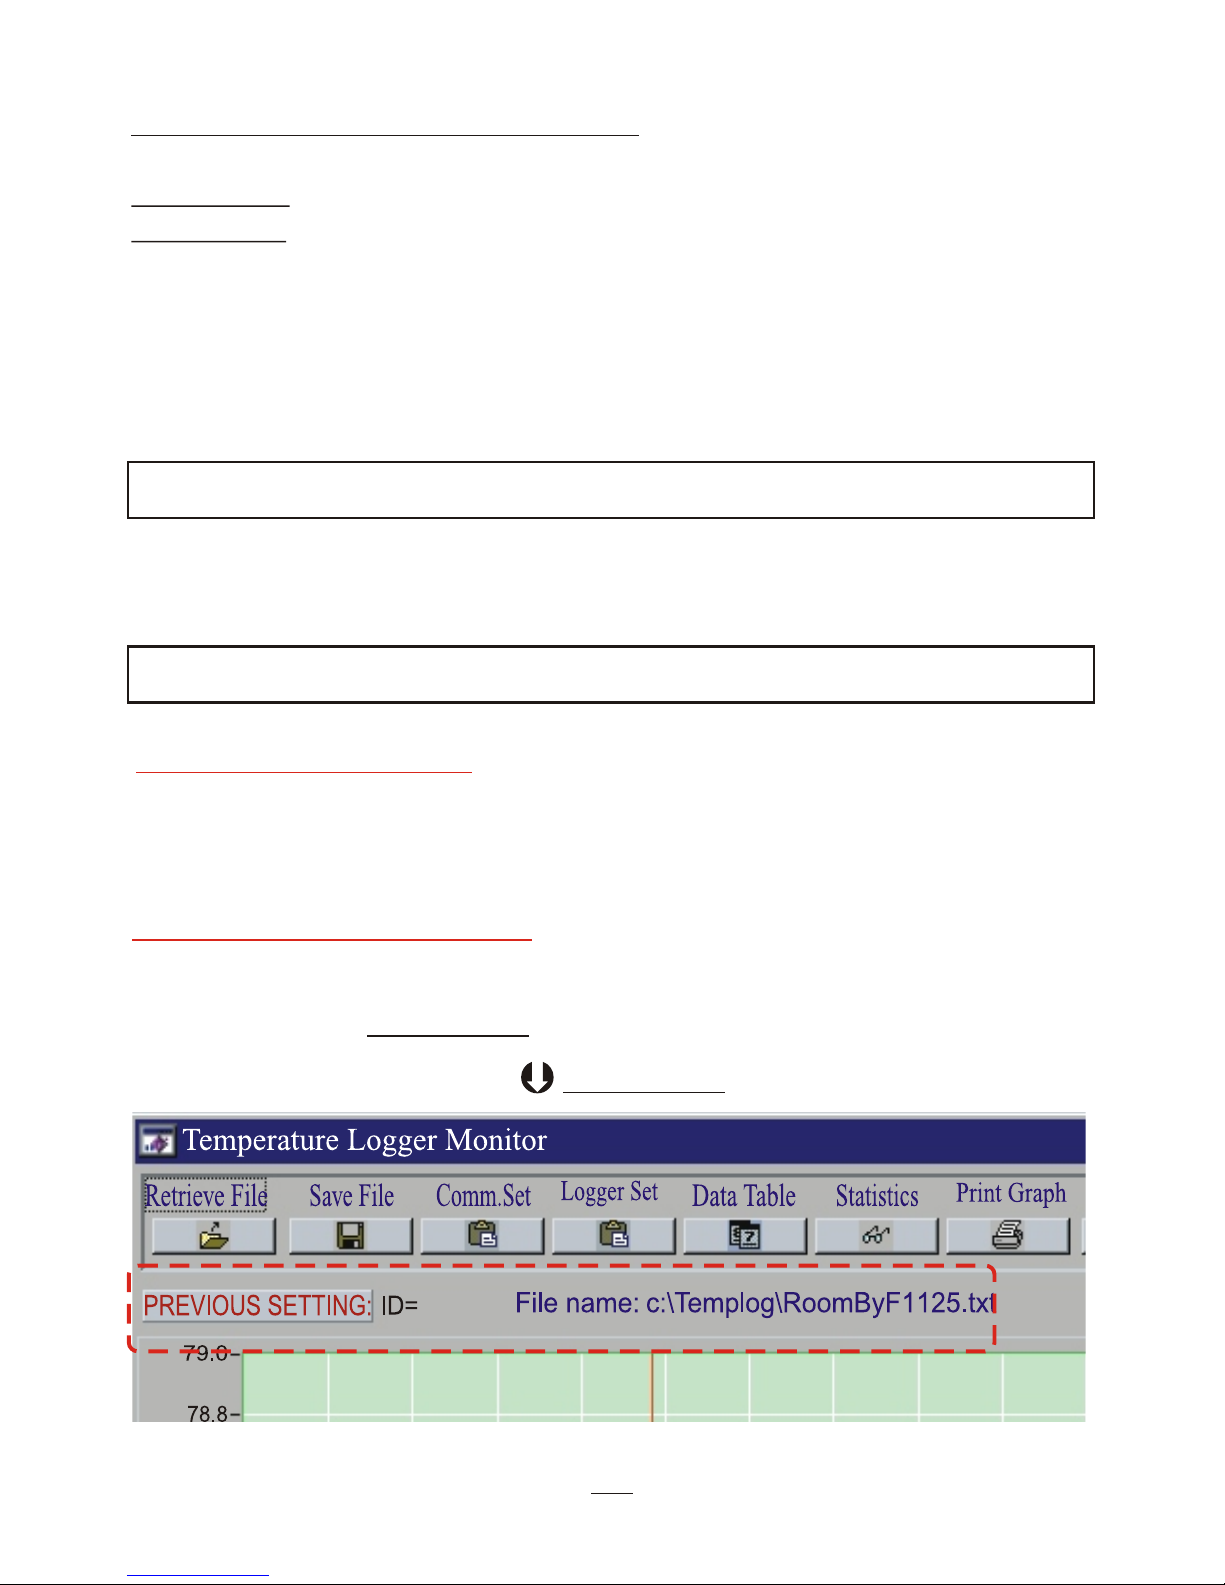
PREVIOUS SETTING:
Previous setting records are listed in this column for reference.
( Please refer to Diagram M. )
Diagram M
(Example)
HELP
Press to review the manual if you have question when operating the
software.
OTHERS
Page 34
32
FAQ: If I want to download next logger , how to update the last
one graph without turning off or exiting current screen ?
Ans.: You may have two choices to down load the next logger :
a) Click "PREVIOUS SETTING"to replace the last logger data
with a new one.
b) Close the program and reopen again.
Note : Click "Retrieve File" will not activate with a new logger data
unless you follow up above instruction.
BLANK LOGO
This area is designed to insert customers' own logo. The logo will be
set as default image and can't be changed by the users. (Please
refer to Diagram M-1) If private logo is needed , a clear logo artwork
has to be sent to the manufacturer for setting up purpose.
Logo
Cursor 1
(red)
Cursor 2
(green)
Diagram M-1
It is blank if there is no file retrieved. After retrieving file, the message
will be changed to "Retrieve file completed." (See Diagram N)
MESSAGE
#2796 Value=48.1 Date(M-D-Y)=
#5104 Value=26.9 Date(M-D-y)=
(Example)
Diagram N
Page 35
DOWNLOAD COMMANDS
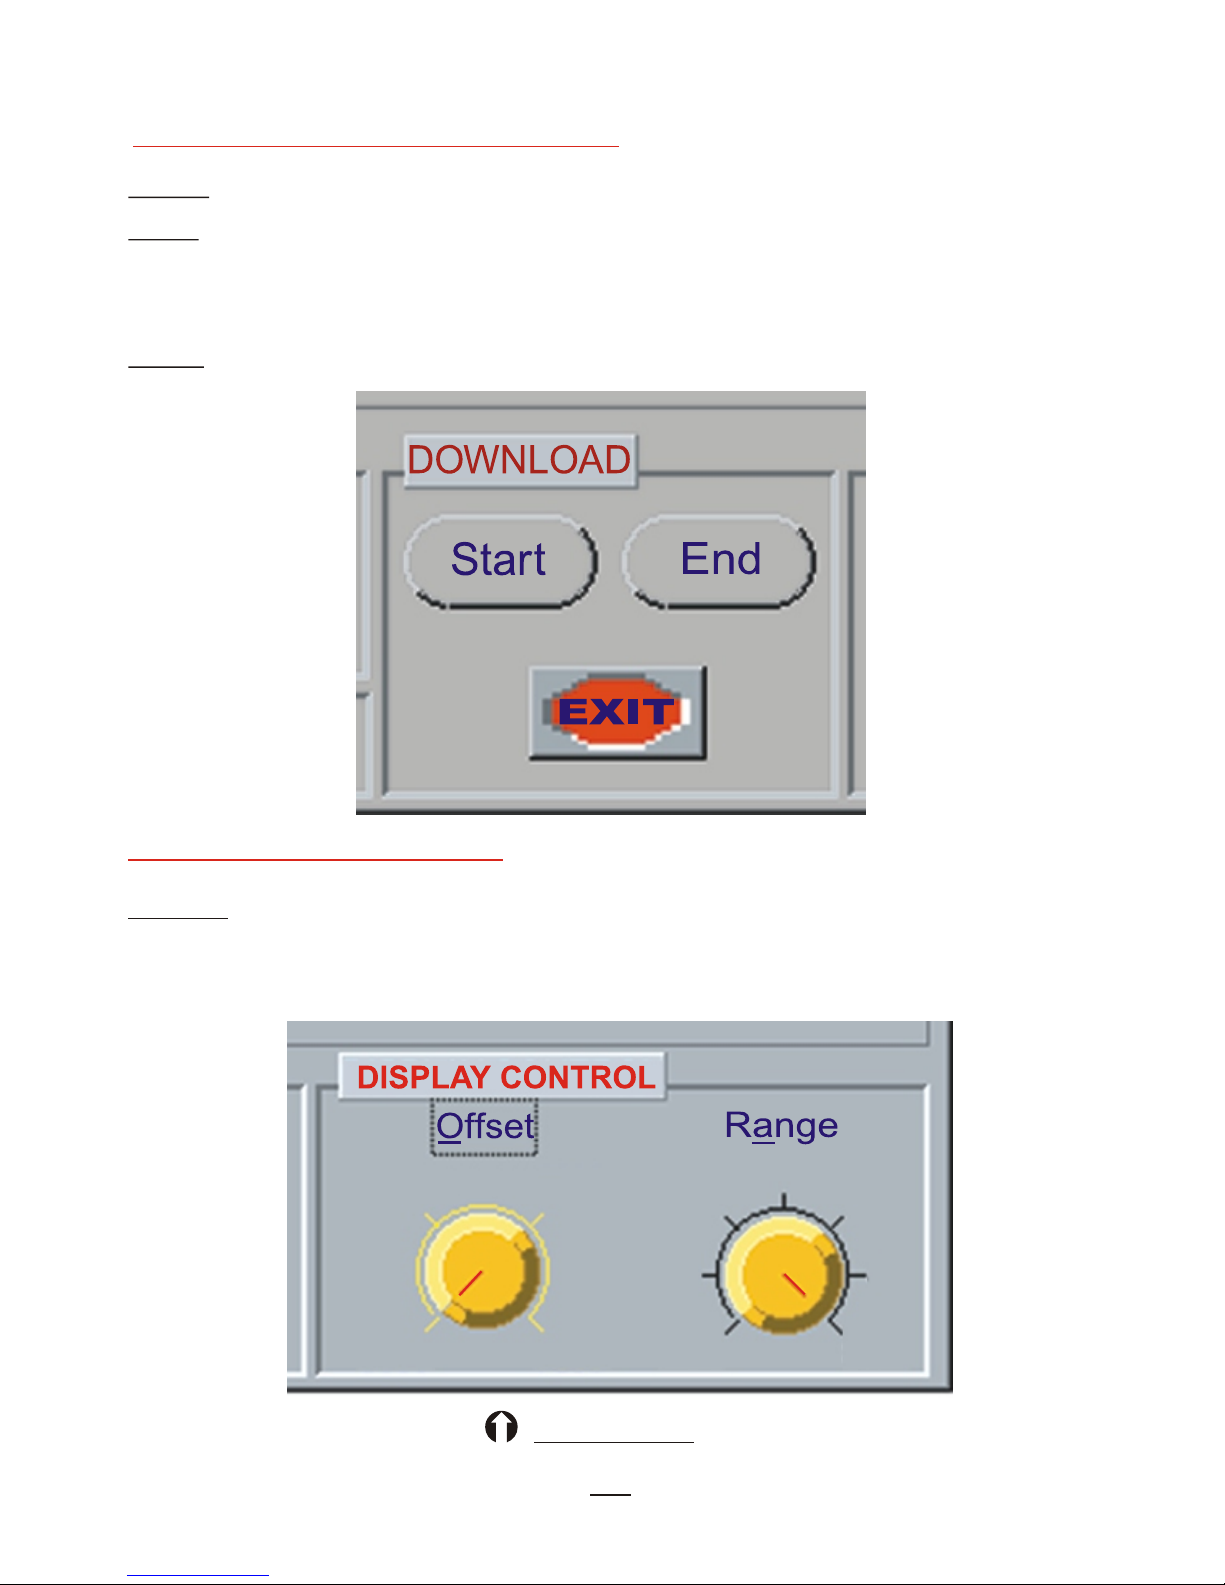
Start - To start downloading data to the program.(See below diagram)
Stop - To manually stop downloading data to the program; which
means if you don't want to download complete sample
readings, you can always stop it at any time you want.
Exit - To exit Download Commands.
DISPLAY CONTROL
Offset - To set up from which sample Reading you would like to start.
There are different ranges for selection based on the logger
you use.
Diagram O
33
0000
2500
5000
7500
50
250
500
1K
2K
4K
8K
Page 36
34
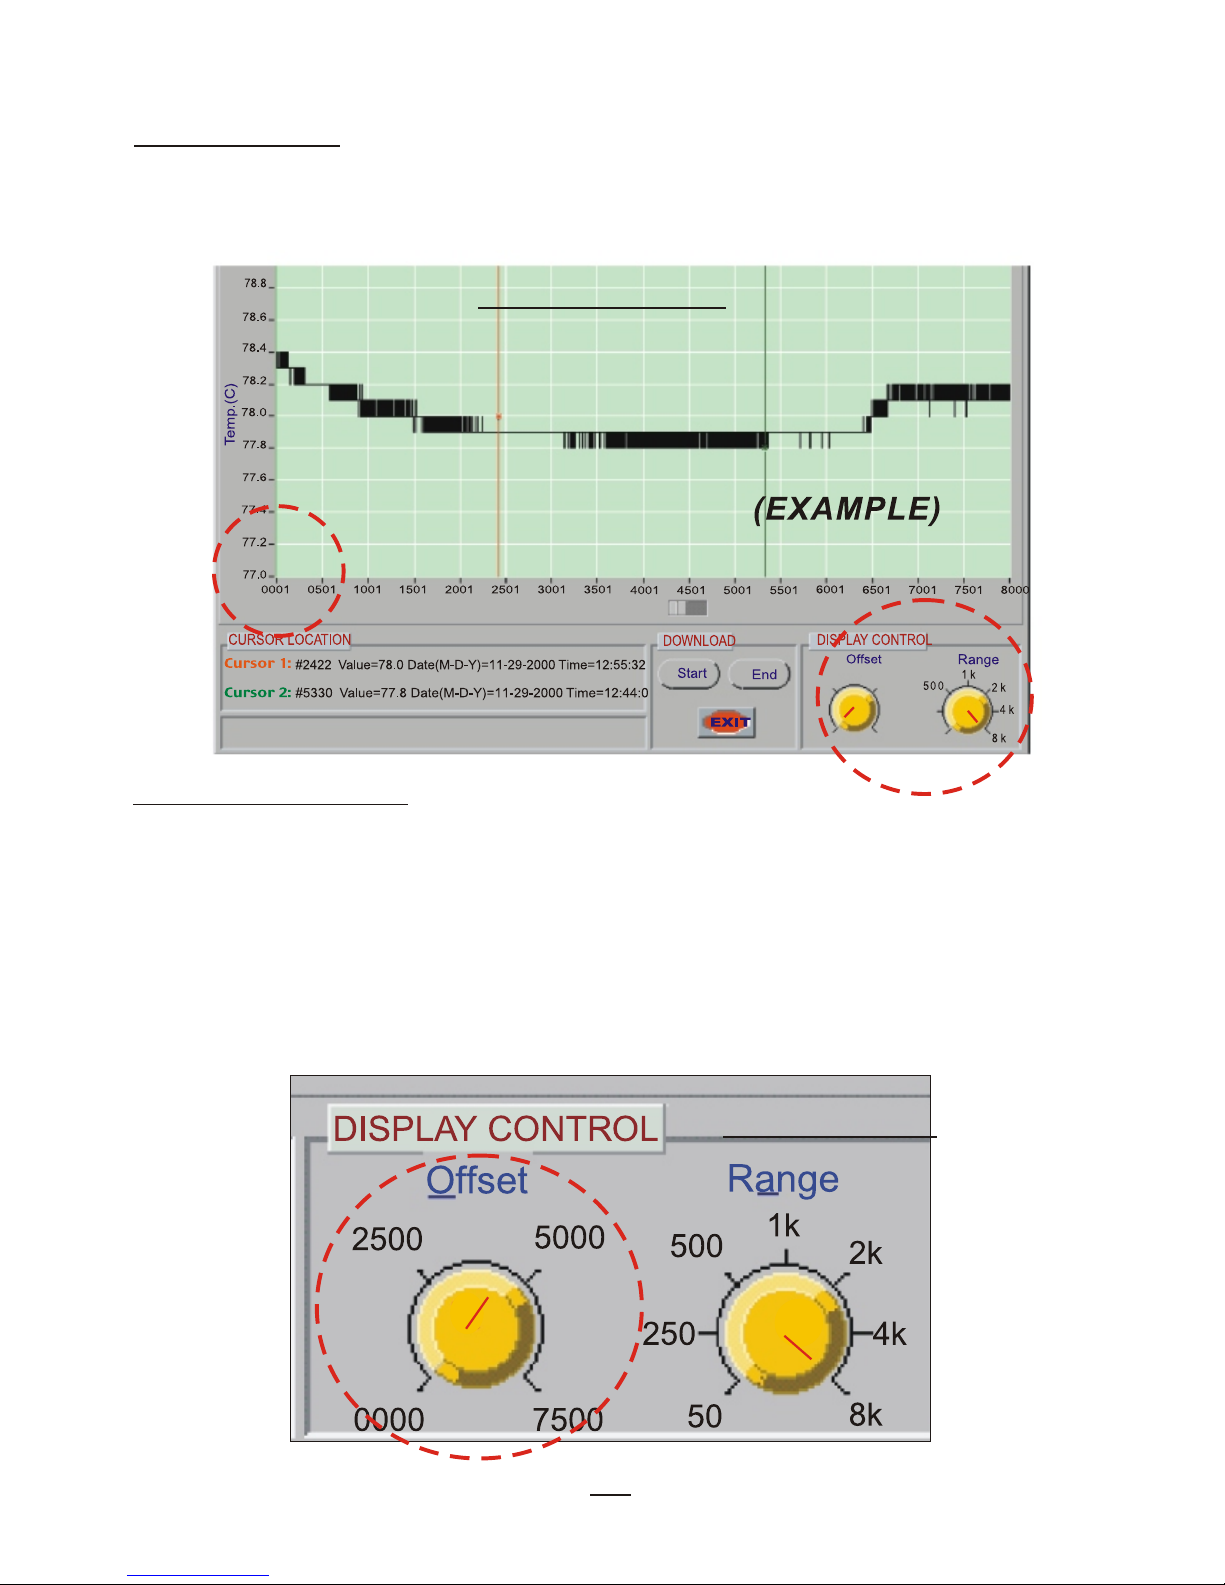
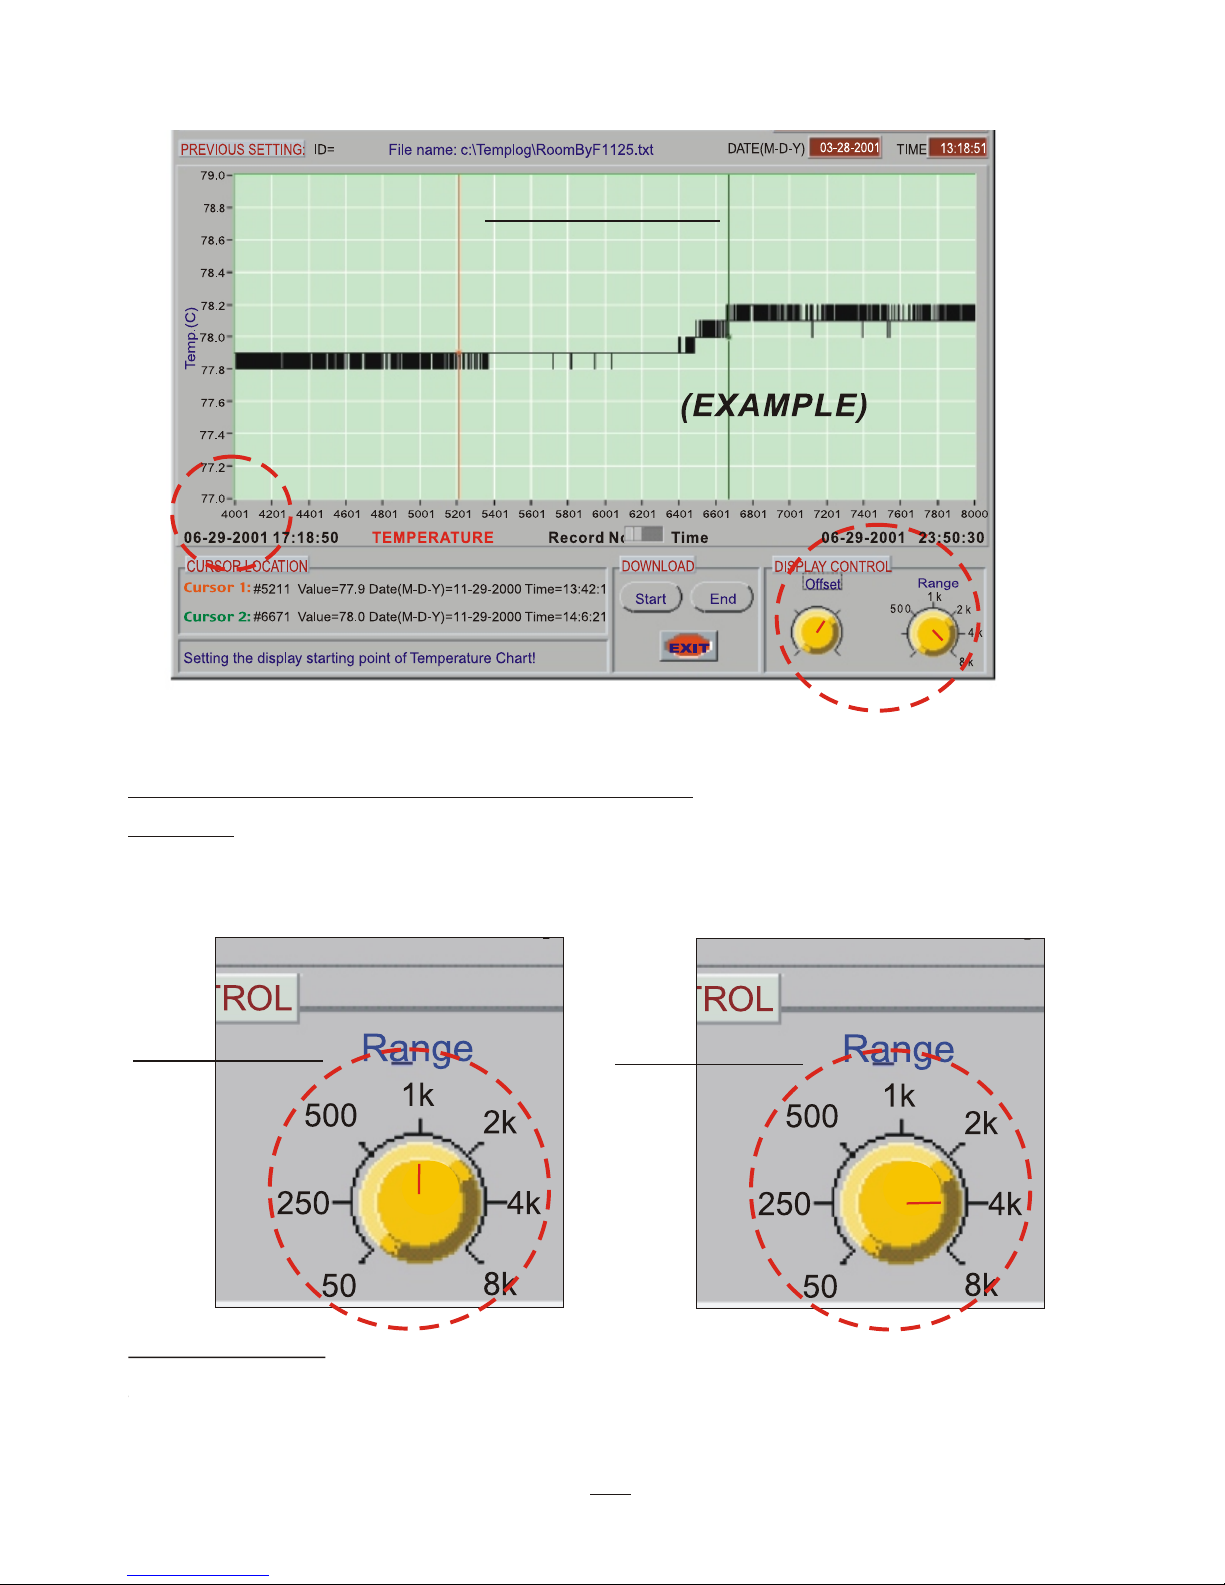
For example : Set Offset by clicking and dragging the red indicator
to " 0000 ",Range unchanged at " 8K ", you will see the Diagram
P-1 The screen shows the number 0001 as starting point of the
total 8,000 records.
Set Offset by clicking and dragging the red indicator to "4000",
Range unchanged at " 8K ", you will see the Diagram Q below.
The screen shows the number 4000 as starting point of the total
8,000 records.(See diagram Q-1 )
Actually there are 4,000 records per the offset you selected but not
a total 8,000 records ( Range set on 8K ).
Another example :
250
50
0000
2500
5000
7500
Diagram P-1
Diagram Q
06-29-2001 17:18:50 TEMPERATURE Record No Time 06-29-2001 23:50:30
Page 37
Range - To set up the range of sample Reading you would like to
cover in the chart. There are different range for selection
based on the logger.
Display Control ( For X-Axis records)
For example:
Set Range by clicking & dragging the red indicator as D iagram R
to "1K" , Diagram R-1 is shown the data record from 0001 to 1000.
35
Diagram Q-1
250
50
0000
2500
5000
7500
Diagram R
Diagram S
Page 38
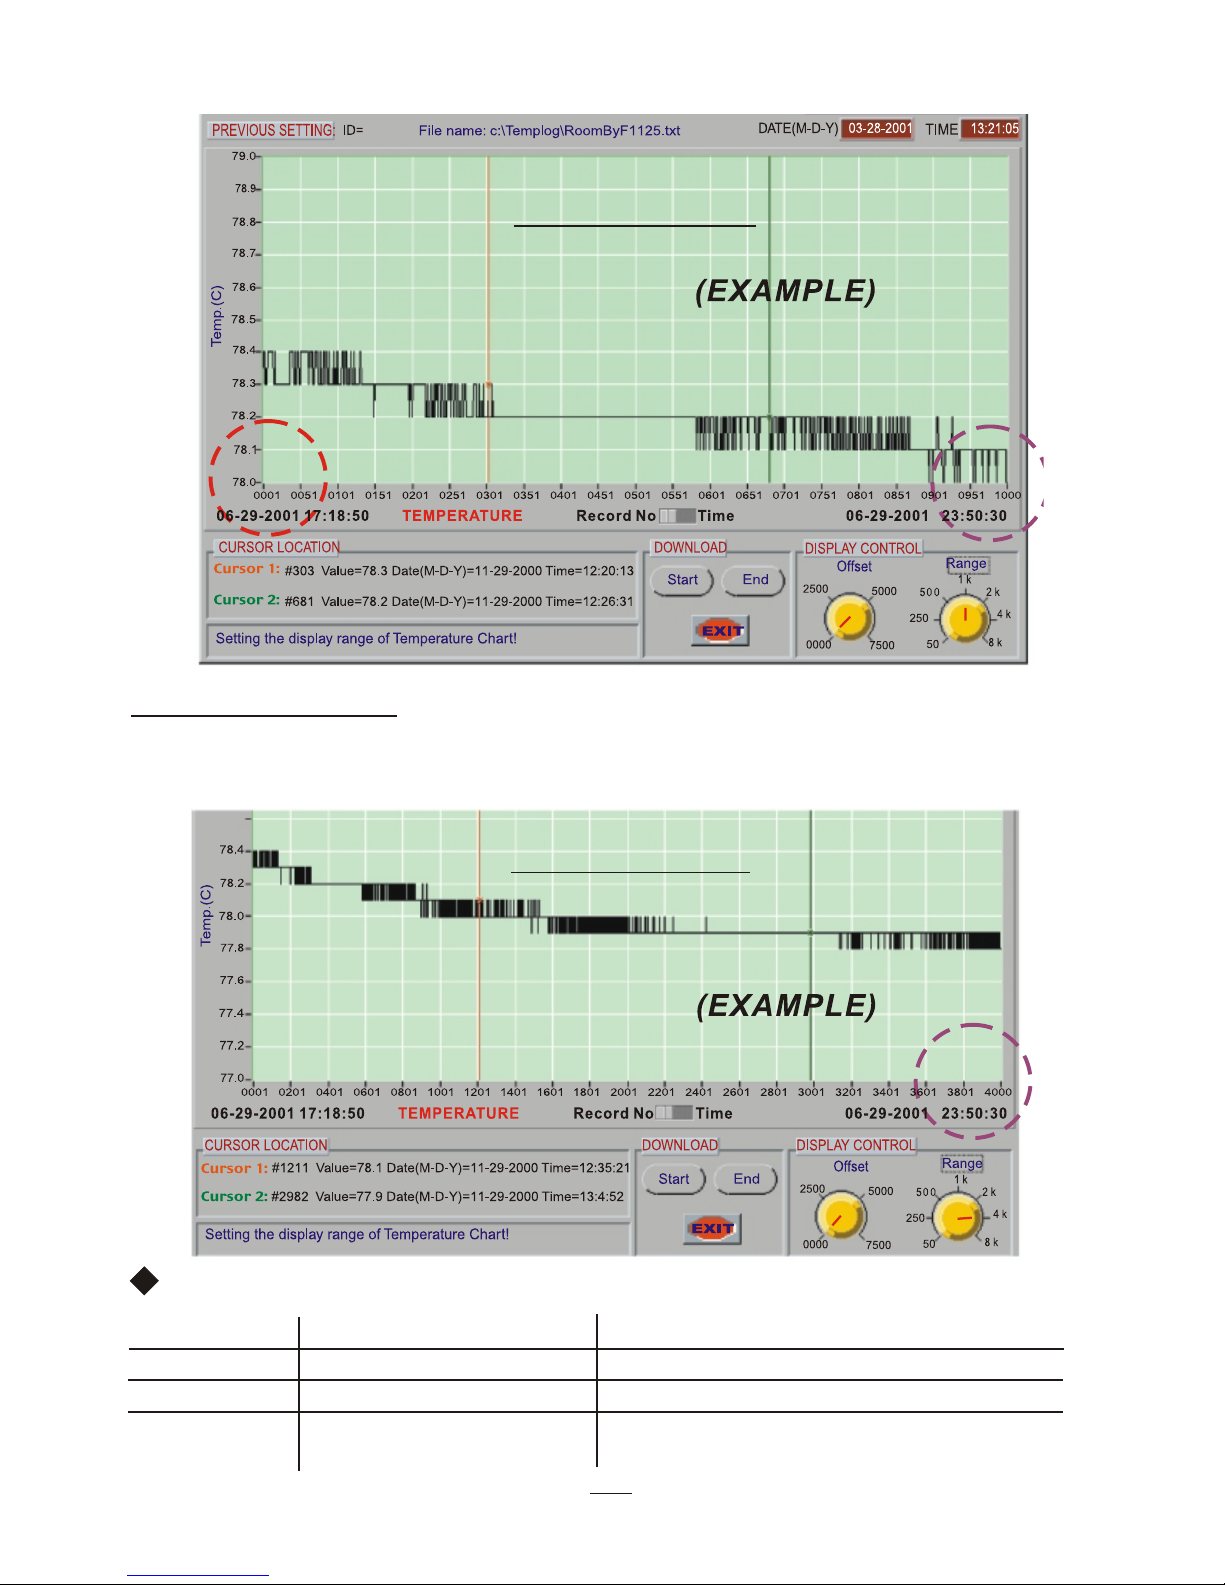
Another example :
Set Range to "4K" as Diagram S, then Diagram S-1 is shown the
data record from 0001 to 4001.
36
Diagram S-1
Diagram R-1
Logger Offset Range
8813/8814 0000, 1000, 2000, 3000 50, 250, 500, 1K,2K, 4K
8815/8833/34 0000, 2500, 5000, 7500 50, 250, 500, 1K,2K, 4K, 8K
88128/8828/ 0000, 5000, 10000, 15000 50, 250, 500, 1K,2K, 4K, 8K, 12K, 16K
8829/8835
Available value of "offset" and "range"
Page 39
37
Diagram T-2
Diagram T-1
CHANGE THE Y SCALE
.
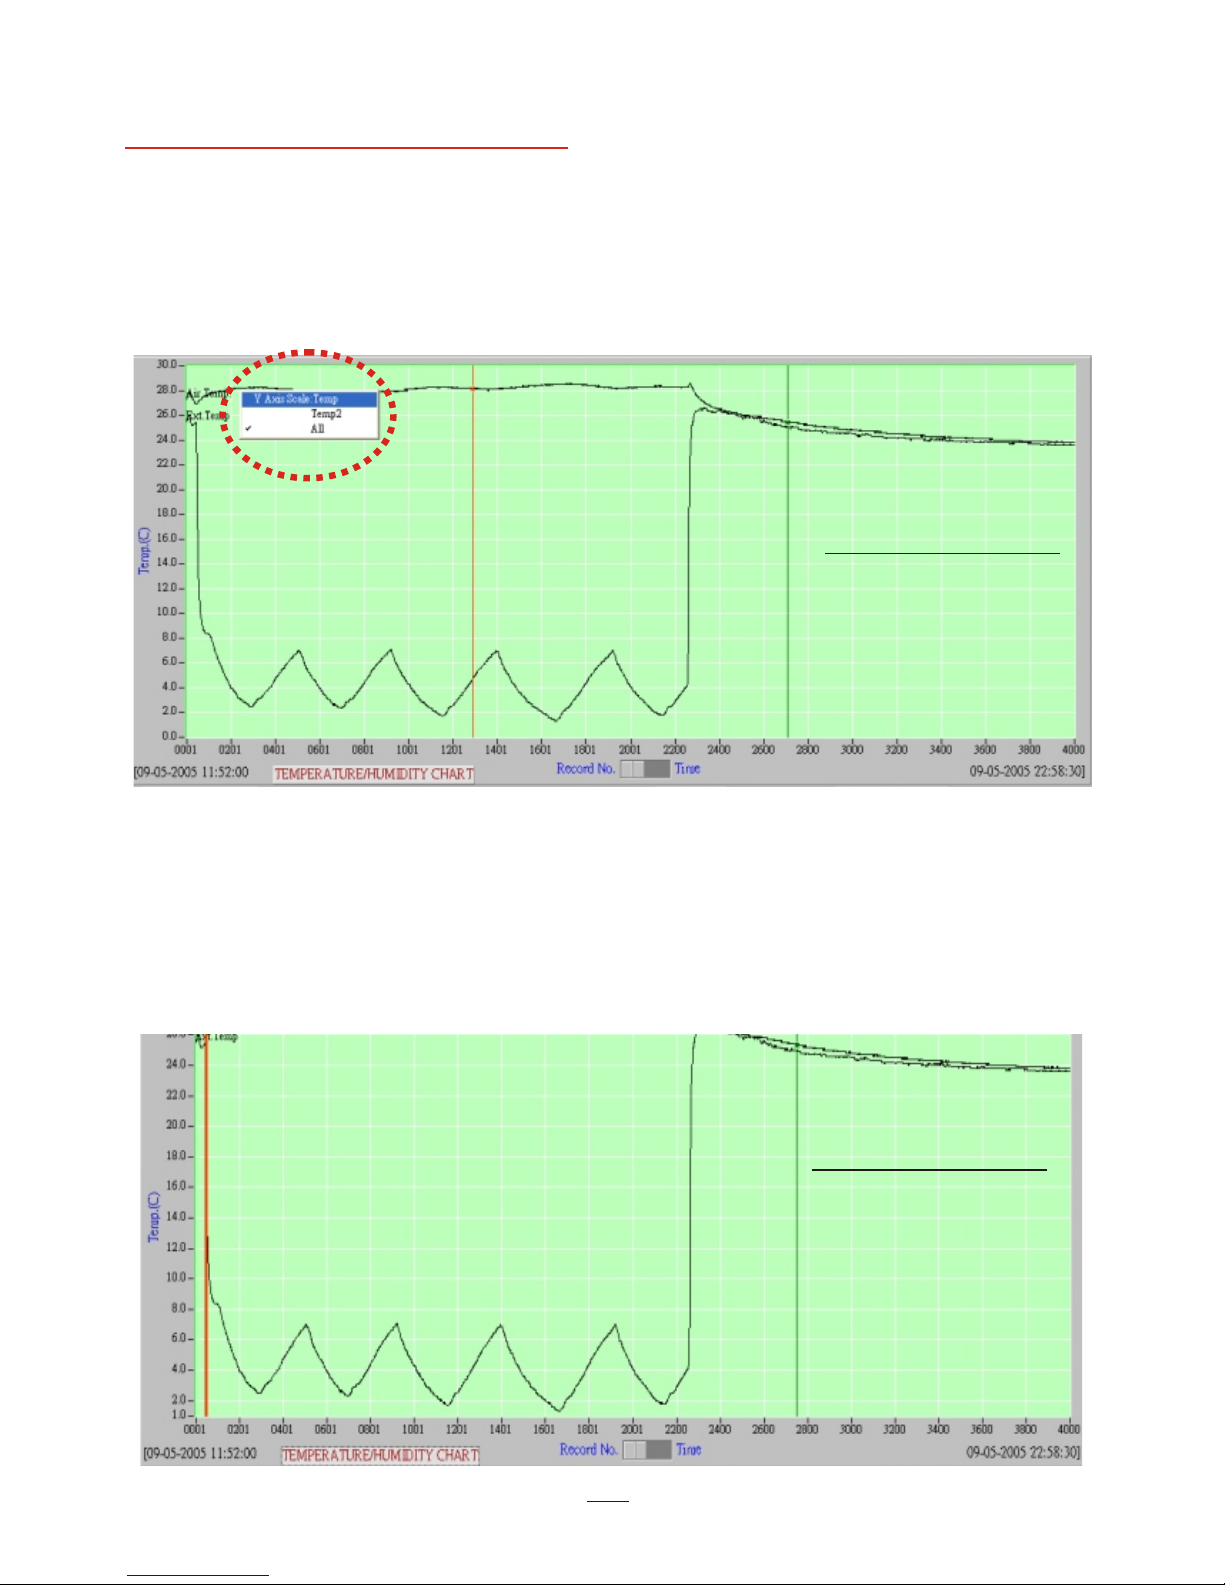
When there are more than one curve display on the monitor, user
could press right key of mouse anywhere on the monitor to active
Y scale selection function. ( See Diagram T-1). There are "Temp "
"Temp2" and "all" three functions for selection.
Temp=air temp, Temp2=external temp, All= Temp.&Temp2.
Above is the display of "All", Y scale will be decided by two temp.
For example, if the highest/lowest temp. Of temp&temp2 are
30.1 and 10.5, then the Y scale will be 31 to 10.
While select temp2, if the highest/lowest value of temp2 is 20.1
and 10.5, then the Y scale will be 21 to 10.
Page 40
37
GENERAL SPECIFICATION
TEMPERATURE DATALOGGER
1K/2K/4K/8K
1K/2K/4K/8K/12K/16K
oo
+
Temp. 0.6 C(-20~50 C)
ooo
+
1.2 C(-40~20 C,51~85 C)
-
-
o
F
-40~185
o
-40~85 C
SPECIFICATIONS
TEMP. RANGE
ER3 or CR2 lithium battery x1
POWER BAT.
SHAPE
OVAL SQUARE
ACCURACY
SAMPLE DATA
Up to 8000 up to 16000
SAMPLE POINTS
HOUSING
WATERPROOF
8818 (Phased out)
88128
DIMENSIONS(mm)
124(L)x92(W)x37(T)(Interface)
108(L)x66(W)x22(T)
124(L)x92(W)(Complete set)
LED SIGNAL
Red (HI,LO Alarm) /Yellow(Record)
RESOLUTION
o
o
oo
0.1 C (0.1 F) for range -40 C~50 C
oo
0.2 C for range 50~70 C
oo
0.3 C for range 70~85 C
CABLE LENGTH
150 cm with DB9 connector
oo
0.1 C (0.1 F)
88128
80(L)x55(W)x22(T)
38
(Phased out)
Page 41
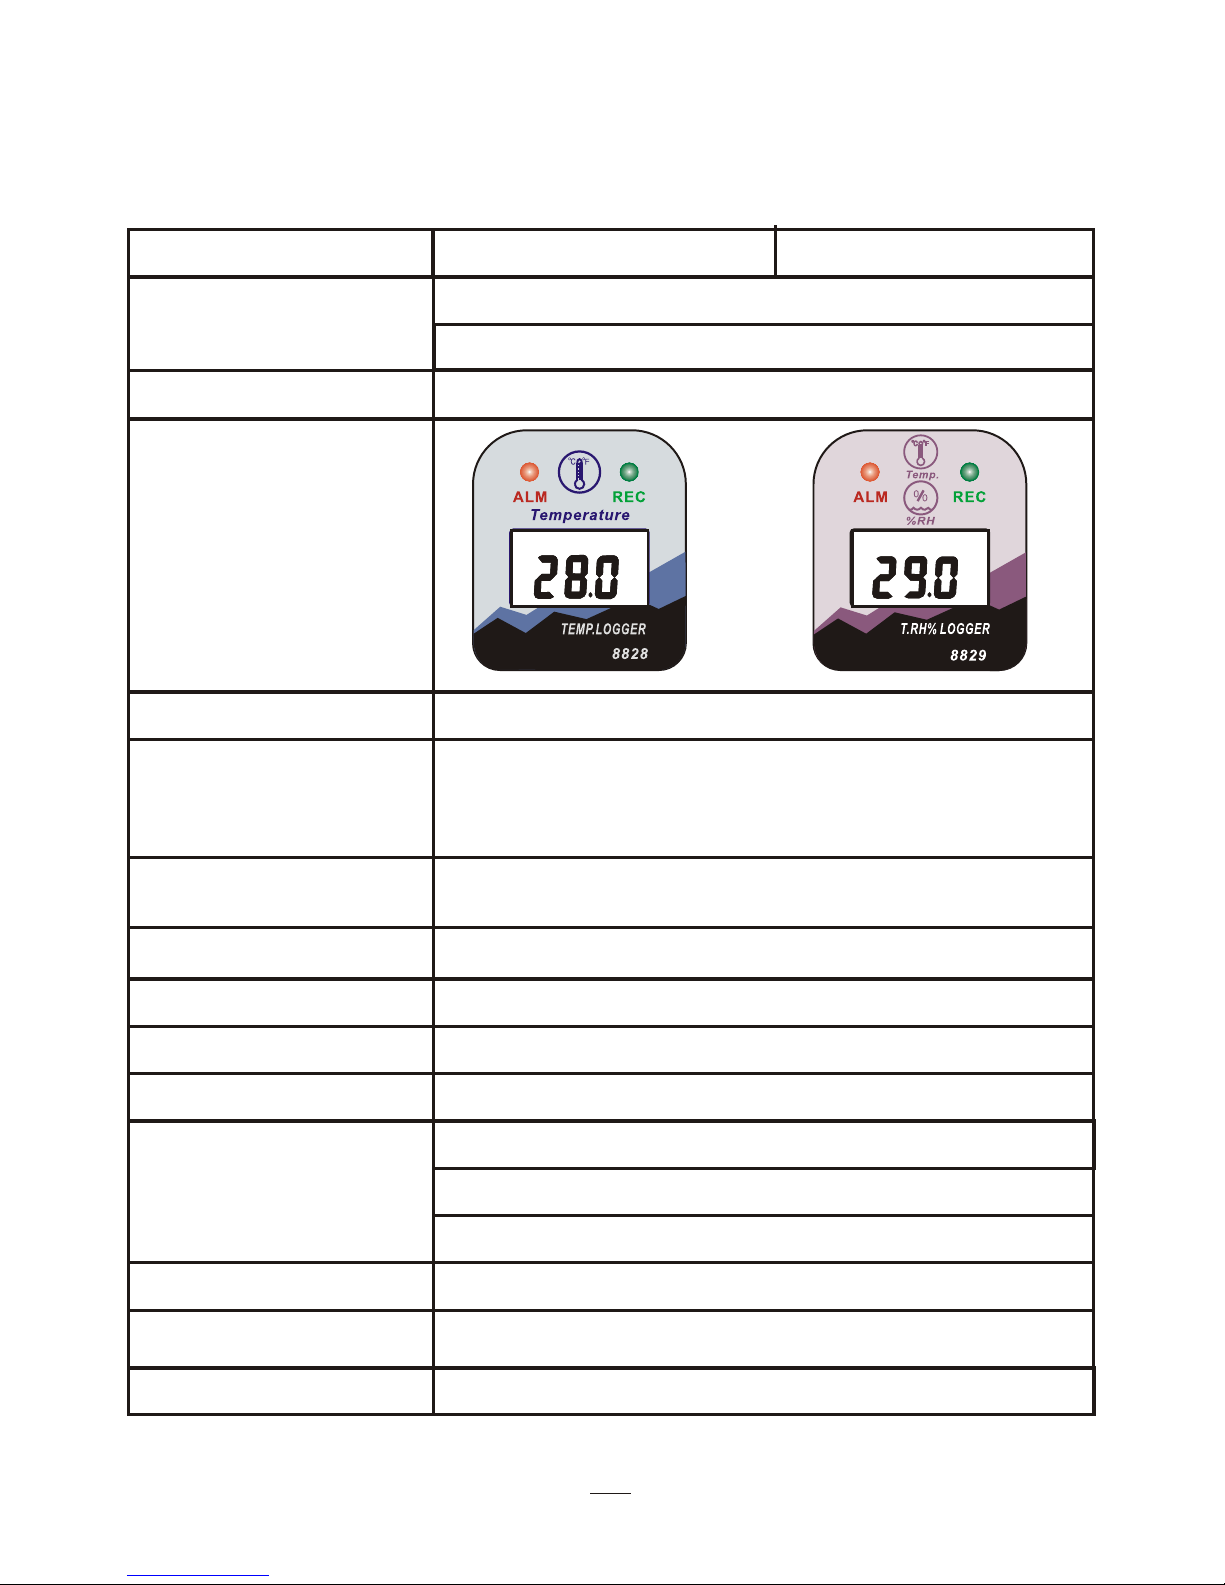
TEMPERATURE / RELATIVE HUMIDITY
DATALOGGER WITH LCD DISPLAY
o
F
-40~185
o
-40~85 C
SPECIFICATIONS
TEMP. RANGE
HUMIDITY RANGE
N/A 0~100% RH
8828 8829
1K/2K/4K/8K/12K/16K
SIZE:12 x 25.5 mm
oo
+
Temp. 0.6 C(-20~50 C)
ooo
+
1.2 C(-40~20 C,51~85 C)
+
Humidity: 3%RH
-
-
-
ER3 or CR2 lithium battery x1
POWER BAT.
FRONT PANEL
ACCURACY
BAT LOW DISPLAY
"Lo" DISPLAY
SAMPLE DATA
Up to 16000
SAMPLE POINTS
LCD DISPLAY
HOUSING
WATERPROOF
WATER RESISTANT
DIMENSIONS(mm)
124(L)x92(W)x37(T)(Interface)
124(L)x92(W)(Complete set)
LED SIGNAL
Red (HI,LO Alarm) /Yellow(Record)
RESOLUTION
CABLE LENGTH
150 cm with DB9 connector
oo
0.1 C (0.1 F)
80(L)x55(W)x22(T)
o
C
RH%
39
Page 42
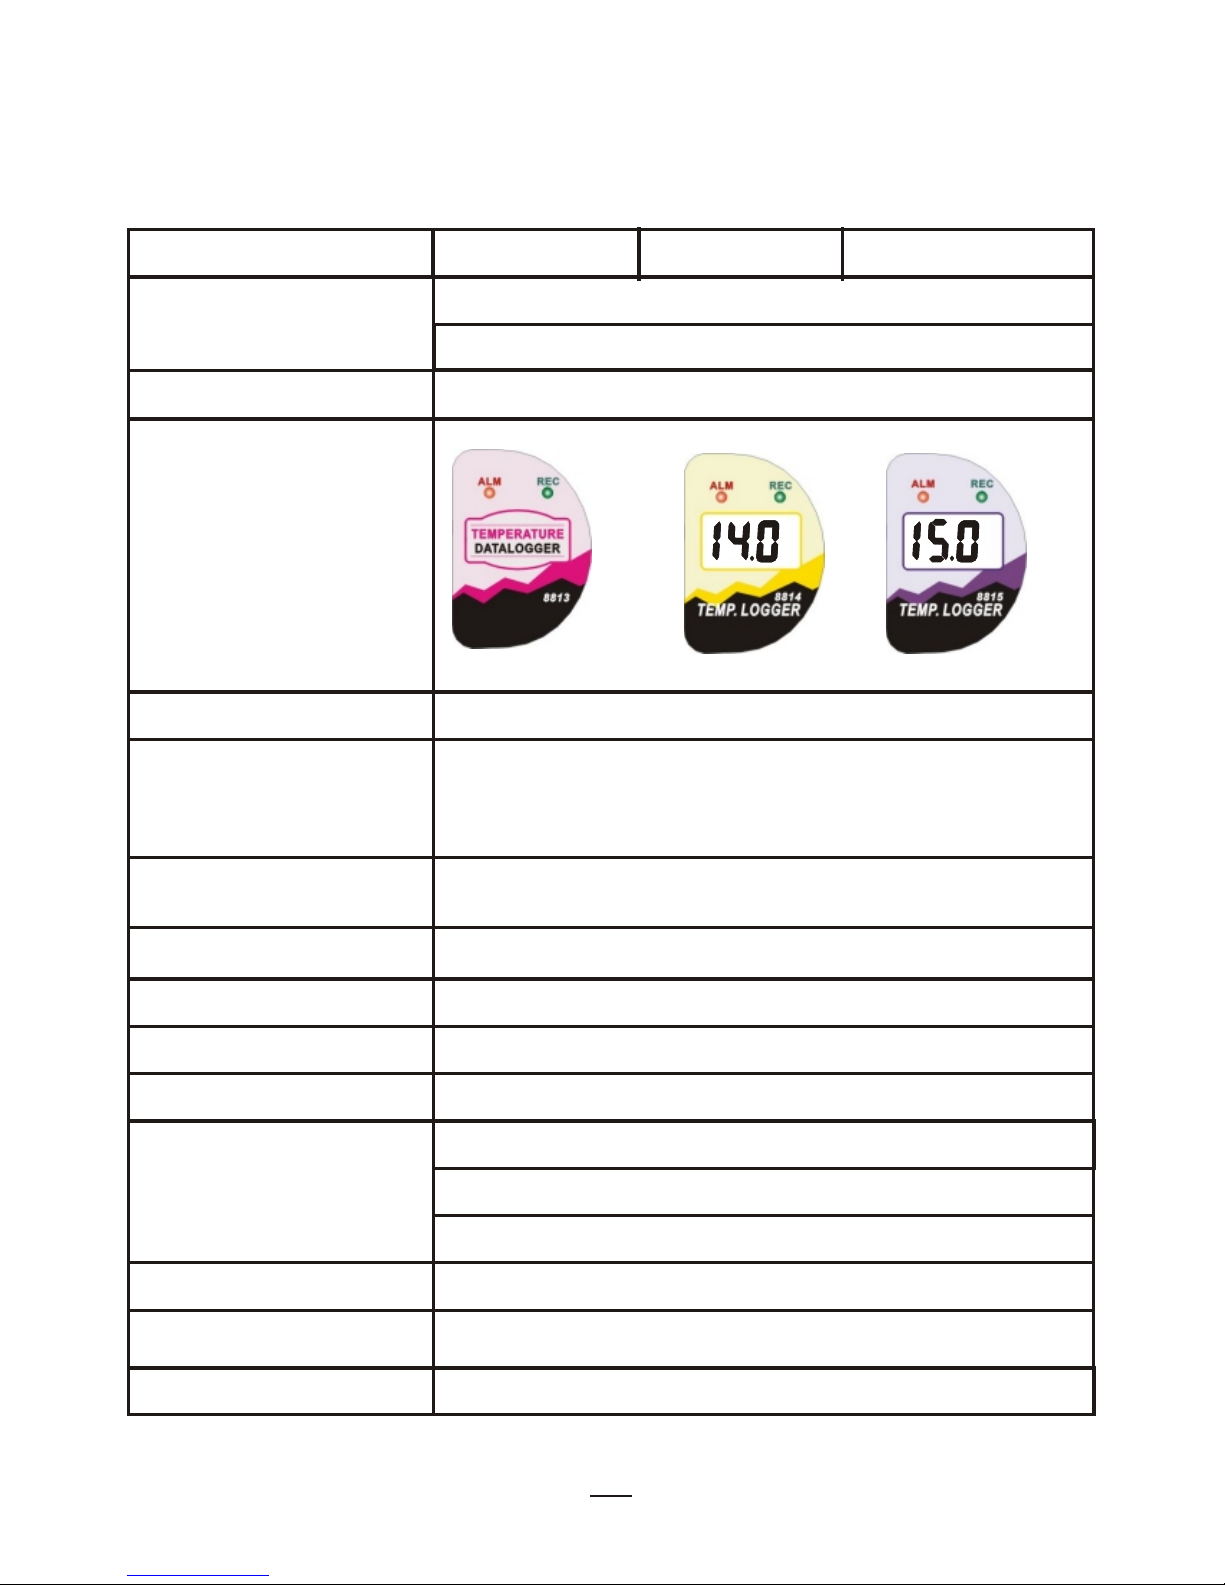
TEMPERATURE DATALOGGER
o
F
-22~188
o
-30~70 C
SPECIFICATIONS
TEMP. RANGE
HUMIDITY RANGE
N/A
8813
8815
1K/2K/4K/8K
SIZE:12 x 25.5 mm
oo
+
Temp. 0.6 C(-20~50 C)
ooo
+
1.2 C(-30~-20 C,51~70 C)
-
-
-
CR2032 x1
POWER BAT.
FRONT PANEL
ACCURACY
BAT LOW DISPLAY
"Lo" DISPLAY
SAMPLE DATA
SAMPLE POINTS
LCD DISPLAY
HOUSING
WATERPROOF
WATERPROOF
DIMENSIONS(mm)
85(L)x61(W)x20.2(T)(USB type Interface)
124(L)x92(W)(Complete set)
LED SIGNAL
Red (HI,LO Alarm) /Yellow(Record)
RESOLUTION
CABLE LENGTH
150 cm with DB9 connector
oo
0.1 C (0.1 F)
85(L)x61(W)x20.2(T)
40
8814
NO DISPLAY
Up to 8000
Up to 4000
Up to 4000
o
C
oCo
C
Page 43
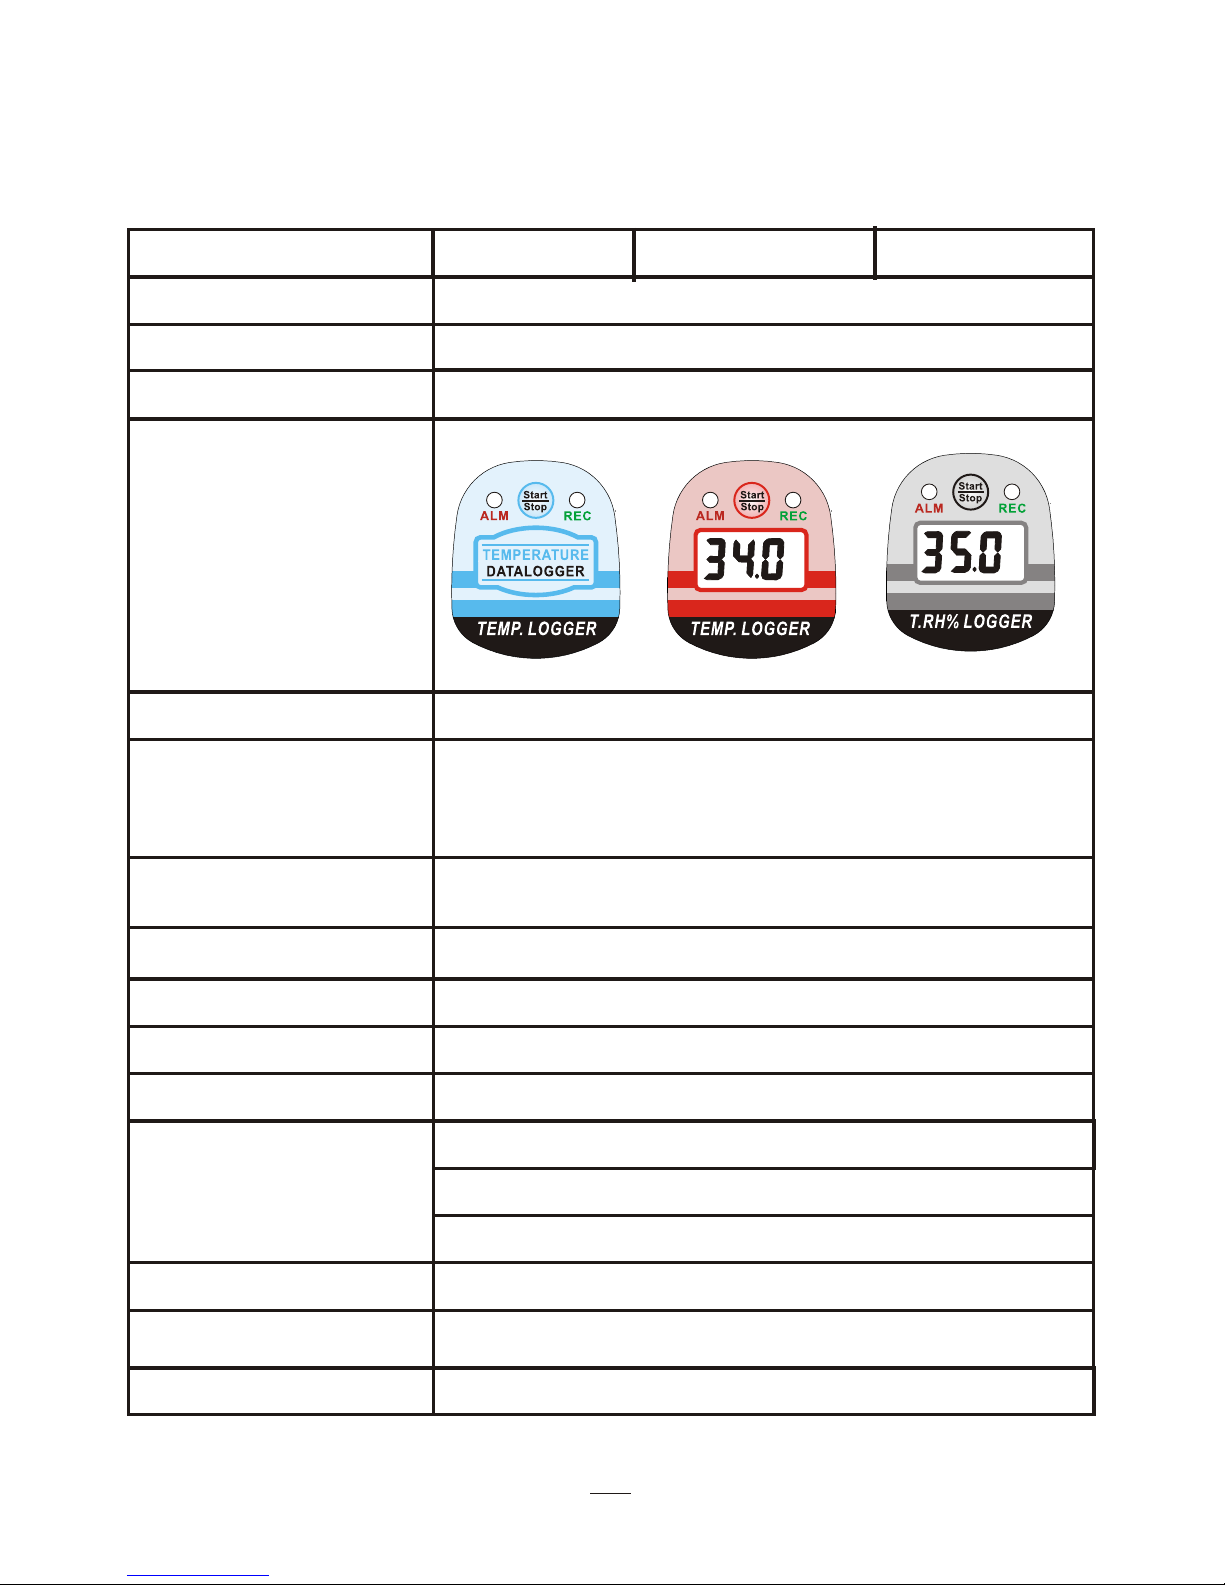
TEMPERATURE / RELATIVE HUMIDITY
DATALOGGER WITH PROBE
o
F)
(-40~185
o
Internal:-40~85 C
SPECIFICATIONS
TEMP. RANGE
HUMIDITY RANGE
N/A 0~100% RH
8833
8835
1K/2K/4K/8K/12K/16K
SIZE:12 x 25.5 mm
oo
+
Temp. 0.6 C(-20~50 C)
ooo
+
1.2 C(-40~-20 C,51~85 C)
+
Humidity: 3%RH
-
-
-
ER3 or CR2 lithium battery x1
POWER BAT.
FRONT PANEL
ACCURACY
BAT LOW DISPLAY
"Lo" DISPLAY
SAMPLE DATA
Up to 8000
SAMPLE POINTS
LCD DISPLAY
HOUSING
WATERPROOF
DIMENSIONS(mm)
85(L)x61(W)x20.2(T)(Interface)
124(L)x92(W)x50(T)(Complete set)
LED SIGNAL
Red (HI,LO Alarm) /Yellow(Record)
RESOLUTION
CABLE LENGTH
150 cm with DB9 connector
oo
0.1 C (0.1 F)
80(L)x55(W)x22(T)
41
8834
PROBE TEMP. RANGE
o
F)
(-4~248
o
External:-20~120 C
8833 8834
o
C
8835
o
C
NO DISPLAY
Up to 8000 Up to 16000
WATERPROOF
Page 44
WARRANTY
F.A.Q.(Frequently Ask Question)
Authorization must be obtained from the supplier before returning
items for any reason.
When requiring a RA (Return Authorization), please include data
regarding the defective reason, the meters are to be returned along
with good packing to prevent any damage in shipment and insured
against possible damage or loss .
The meter is warranted to be free from defects in material and
workmanship for a period of one years from the date of purchase.
This warranty covers normal operation and does not cover batteries,
misuse,abuse, alteration, tampering, neglect, mproper maintenance,
or damage resulting from leaking batteries. Proof of purchase is
required for warranty repairs.
RETURN AUTHORIZATION
42
FAQ: If I can't down load and the display won't active, what
should I do ?
Ans: Make sure you have selected correct baud rate. Select 9600
baud rate for all the models (except 8818). This is to ensure you
could download quicker by selecting correct baud rate value.
FAQ: If the logger is not flashing , how should I do ?
Ans: If you were set up Magnet start function ( for 88128/8829/8829)
, when a magnet passes over the middle of rear side , the logger
is not flashing, change with a new and stronger magnetism and
try it again. Make sure the flashing interval is the same as
programmed sampling time . If you were set 5 minutes as sample
rate , the LED will just flash every 5 minutes .
Page 45

Accuracy, the Zenith of
Measuring / Testing Instruments !
More products available !
Hygrometer/Psychrometer
Thermometer
Anemometer
Sound Level Meter
Air Flow meter
Infrared Thermometer
K type Thermometer
K.J.T. type Thermometer
K.J.T.R.S.E. type Thermometer
pH Meter
Conductivity Meter
T.D.S. Meter
D.O. Meter
Saccharimeter
Manometer
Tacho Meter
Lux / Light Meter
Moisture Meter
Data logger
Temp./RH transmitter
Wireless Transmitter ..........
 Loading...