

Page 1

PeriView Reference Manual
(Software Release 1.0)
Publication #:
Document Release:
Release Date:
P0988094
Rev: 1.0
April 30, 2002
Page 2

Important Notice
Nortel Networks reserves the right to make cha nges in the content s of this publ icat ion
including functions and specifications identified herein without notice.
The material contained in this document is intended for Nortel Networks personnel
and licensed customers with a non-disclosure agreement or standard contract.
In the absence of a written agreement to the contrary, Nortel Networks assumes no
liability for applications assistance, customer’s product/application/concepts, or
infringements of patents or copyrights of third parties arising from the use of systems
and architectures described herein. Nor does Nortel Networks warrant or represent
that any license, either expressed or implied, is granted under any patent right,
copyright, or other combina tion of technolo gy, archit ecture, or software as might be or
is already in use.
This document should not be reproduced, disseminated, or otherwise disclosed
without prior written consent from an officer of Nortel Networks.
This document has been copyrighted by Nortel Networks and may not be duplicated.
Copyright © 2002 Nortel Networks, All Rights Reserved
Page 3

Table of Contents
Preface . . . . . . . . . . . . . . . . . . . . . . . . . . . . . . . . . . . . . . . . . . xiii
Scope. . . . . . . . . . . . . . . . . . . . . . . . . . . . . . . . . . . . . . . . . . . . . . xiv
Intended Audience . . . . . . . . . . . . . . . . . . . . . . . . . . . . . . . . . . . xiv
How To Use This Manual. . . . . . . . . . . . . . . . . . . . . . . . . . . . . . . xv
Organization of This Manual . . . . . . . . . . . . . . . . . . . . . . . . . . . xvi
Conventions Used in This Manual . . . . . . . . . . . . . . . . . . . . . . . xix
Solaris and Windows NT Conventions. . . . . . . . . . . . . . . . . . . . . xx
Trademark Conventions . . . . . . . . . . . . . . . . . . . . . . . . . . . . . . . xxi
Manual (man) Pages . . . . . . . . . . . . . . . . . . . . . . . . . . . . . . . . . .xxii
Introduction to PeriView . . . . . . . . . . . . . . . . . . . . . . . . . . . . . 1
What is PeriView? . . . . . . . . . . . . . . . . . . . . . . . . . . . . . . . . . . . . . 2
What are PeriView’s Tools?. . . . . . . . . . . . . . . . . . . . . . . . . . . . . . 3
What is the Work Environment? . . . . . . . . . . . . . . . . . . . . . . . . . . 6
Configurations and Naming Conventions. . . . . . . . . . . . . . . . . 6
Single Processing Server . . . . . . . . . . . . . . . . . . . . . . . . . . 6
Processing Server Network Configuration . . . . . . . . . . . . 7
Components in the Processing Server . . . . . . . . . . . . . . . . . . . 8
Types of Components . . . . . . . . . . . . . . . . . . . . . . . . . . . . 8
Component Identifiers . . . . . . . . . . . . . . . . . . . . . . . . . . . 11
Sharing Network Resources . . . . . . . . . . . . . . . . . . . . . . . . . . 12
Network Configuration with VAS Support . . . . . . . . . . . 12
Network Design . . . . . . . . . . . . . . . . . . . . . . . . . . . . . . . . 14
Configuring the Network for Sharing Resources . . . . . . . . . . 15
Sample Network Configuration . . . . . . . . . . . . . . . . . . . . 16
Sample Configuration Files and Reports . . . . . . . . . . . . . . . . . . . 17
vpshosts File . . . . . . . . . . . . . . . . . . . . . . . . . . . . . . . . . . . . . . 19
ase.cfg File . . . . . . . . . . . . . . . . . . . . . . . . . . . . . . . . . . . . . . . 22
gen.cfg File . . . . . . . . . . . . . . . . . . . . . . . . . . . . . . . . . . . . . . . 24
IP Addresses . . . . . . . . . . . . . . . . . . . . . . . . . . . . . . . . . . . . . . 26
Ethernet Addresses . . . . . . . . . . . . . . . . . . . . . . . . . . . . . . . . . 27
SRP Group Status Report . . . . . . . . . . . . . . . . . . . . . . . . . . . . 30
SRP Log . . . . . . . . . . . . . . . . . . . . . . . . . . . . . . . . . . . . . . . . . 31
SRP State Log. . . . . . . . . . . . . . . . . . . . . . . . . . . . . . . . . . . . . 32
Sample Installation/Configuration Procedure. . . . . . . . . . . . . . . . 33
Edit the vpshosts File . . . . . . . . . . . . . . . . . . . . . . . . . . . . . . . . . . 40
VHMAN . . . . . . . . . . . . . . . . . . . . . . . . . . . . . . . . . . . . . . . . . 40
XVHMAN . . . . . . . . . . . . . . . . . . . . . . . . . . . . . . . . . . . . . . . 42
How is the PeriView Graphical Environment Organized?. . . . . . 45
Elements in the Graphical Environment. . . . . . . . . . . . . . . . . 46
Tree Objects . . . . . . . . . . . . . . . . . . . . . . . . . . . . . . . . . . . . . . 47
Buttons . . . . . . . . . . . . . . . . . . . . . . . . . . . . . . . . . . . . . . . . . . 48
About ... . . . . . . . . . . . . . . . . . . . . . . . . . . . . . . . . . . . . . . . . . 48
# P0988094 Ver: 1.0 Nortel Networks Confidential Page iii
Page 4

PeriView Reference Manual
Tool Bars. . . . . . . . . . . . . . . . . . . . . . . . . . . . . . . . . . . . . . . . . 49
Progress Box. . . . . . . . . . . . . . . . . . . . . . . . . . . . . . . . . . . . . . 50
Tree Controls . . . . . . . . . . . . . . . . . . . . . . . . . . . . . . . . . . . . . 51
Nodes in the Network . . . . . . . . . . . . . . . . . . . . . . . . . . . . . . . . . . 52
Tree Object States. . . . . . . . . . . . . . . . . . . . . . . . . . . . . . . . . . . . . 53
Component States. . . . . . . . . . . . . . . . . . . . . . . . . . . . . . . . . . 55
Domain, Group, Node States . . . . . . . . . . . . . . . . . . . . . . . . . 55
Summary of Tree Object States . . . . . . . . . . . . . . . . . . . . . . . 58
PeriView Topology. . . . . . . . . . . . . . . . . . . . . . . . . . . . . . . . . . . . 62
Security and Data Views. . . . . . . . . . . . . . . . . . . . . . . . . . . . . . . . 64
The PeriView Workspace. . . . . . . . . . . . . . . . . . . . . . . . . . . . . . . 65
The Tree . . . . . . . . . . . . . . . . . . . . . . . . . . . . . . . . . . . . . . . . . 65
The Window Pane. . . . . . . . . . . . . . . . . . . . . . . . . . . . . . . . . . 66
Optimize GUI Display Option . . . . . . . . . . . . . . . . . . . . . . . . 67
Scrollbar Menus . . . . . . . . . . . . . . . . . . . . . . . . . . . . . . . . . . . 71
Screen Tips . . . . . . . . . . . . . . . . . . . . . . . . . . . . . . . . . . . . . . . 72
Scrolling Lists. . . . . . . . . . . . . . . . . . . . . . . . . . . . . . . . . . . . . . . . 73
System Status, Error and Warning Messages. . . . . . . . . . . . . 74
How to Execute PeriView Operations . . . . . . . . . . . . . . . . . . . . . 75
Using GUI Objects . . . . . . . . . . . . . . . . . . . . . . . . . . . . . . . . . 75
Using Menus. . . . . . . . . . . . . . . . . . . . . . . . . . . . . . . . . . . . . . 76
Working in PeriView on Solaris. . . . . . . . . . . . . . . . . . . . . . . . . . 77
Working in PeriView on NT. . . . . . . . . . . . . . . . . . . . . . . . . . . . . 78
Solaris Login to PeriView. . . . . . . . . . . . . . . . . . . . . . . . . . . . . . . 79
NT Login to PeriView . . . . . . . . . . . . . . . . . . . . . . . . . . . . . . . . . 81
File Path Names . . . . . . . . . . . . . . . . . . . . . . . . . . . . . . . . . . . . . . 83
File Chooser Windows . . . . . . . . . . . . . . . . . . . . . . . . . . . . . . . . . 84
PeriView Launcher Tools . . . . . . . . . . . . . . . . . . . . . . . . 49
Application Manager Tools . . . . . . . . . . . . . . . . . . . . . . . 49
Activity Monitor Tools . . . . . . . . . . . . . . . . . . . . . . . . . . 50
PeriView Launcher Tree Controls . . . . . . . . . . . . . . . . . . 51
Application Manager & Activity Monitor Tree Controls 51
Node States . . . . . . . . . . . . . . . . . . . . . . . . . . . . . . . . . . . 56
Group and Domain States . . . . . . . . . . . . . . . . . . . . . . . . 57
Benefits and Consequences of Optimization . . . . . . . . . . 67
Set Display Option to Optimize GUI . . . . . . . . . . . . . . . . 69
Tool Tips . . . . . . . . . . . . . . . . . . . . . . . . . . . . . . . . . . . . . 72
Tree Tips . . . . . . . . . . . . . . . . . . . . . . . . . . . . . . . . . . . . . 72
PeriView Launcher . . . . . . . . . . . . . . . . . . . . . . . . . . . . . . . . 85
Section 1 — Define the Network . . . . . . . . . . . . . . . . . . . . . . . . . . . . 87
Introduction to the Launcher. . . . . . . . . . . . . . . . . . . . . . . . . . . . . 88
Solaris Launch of the PeriView Launcher . . . . . . . . . . . . . . . . . . 89
NT Launch of the PeriView Launcher . . . . . . . . . . . . . . . . . . . . . 91
Menu Buttons . . . . . . . . . . . . . . . . . . . . . . . . . . . . . . . . . . . . . . . . 93
Page iv Nortel Networks Confidential # P0988094 Ver: 1.0
Page 5

Table of Contents
Tool Bar . . . . . . . . . . . . . . . . . . . . . . . . . . . . . . . . . . . . . . . . . . . . 95
Tree Controls . . . . . . . . . . . . . . . . . . . . . . . . . . . . . . . . . . . . . . . . 96
Define a Network as Groups and Domains . . . . . . . . . . . . . . . . . 97
Summary of Tree Object States . . . . . . . . . . . . . . . . . . . . . . . 99
Domain/Group/Icon Properties Menu Buttons. . . . . . . . . . . 103
Define a Group . . . . . . . . . . . . . . . . . . . . . . . . . . . . . . . . . . . 104
Define a Domain. . . . . . . . . . . . . . . . . . . . . . . . . . . . . . . . . . 108
Properties Menu . . . . . . . . . . . . . . . . . . . . . . . . . . . . . . . . . . 112
View Menu . . . . . . . . . . . . . . . . . . . . . . . . . . . . . . . . . . . . . . 114
Change Orientation . . . . . . . . . . . . . . . . . . . . . . . . . . . . 114
Load a Domain . . . . . . . . . . . . . . . . . . . . . . . . . . . . . . . . 115
Expand and Collapse a Tree . . . . . . . . . . . . . . . . . . . . . . . . . . . . 116
Expand a Tree. . . . . . . . . . . . . . . . . . . . . . . . . . . . . . . . . . . . 118
Expand the Domain . . . . . . . . . . . . . . . . . . . . . . . . . . . . 119
Expand by Group . . . . . . . . . . . . . . . . . . . . . . . . . . . . . . 122
Expand by Node . . . . . . . . . . . . . . . . . . . . . . . . . . . . . . . 124
Expand by Component . . . . . . . . . . . . . . . . . . . . . . . . . . 127
Expand by VPS or MPS . . . . . . . . . . . . . . . . . . . . . . . . . 130
Expand by VAS . . . . . . . . . . . . . . . . . . . . . . . . . . . . . . . 132
Expand by TMSCOMM . . . . . . . . . . . . . . . . . . . . . . . . 134
Expand by OSCAR . . . . . . . . . . . . . . . . . . . . . . . . . . . . 136
Collapse a Tree . . . . . . . . . . . . . . . . . . . . . . . . . . . . . . . . . . . 138
Context Sensitive Launcher Menus . . . . . . . . . . . . . . . . . . . 139
Launcher Topology. . . . . . . . . . . . . . . . . . . . . . . . . . . . . . . . . . . 140
Section 2 — Launcher Tools . . . . . . . . . . . . . . . . . . . . . . . . . . . . . . 143
Security. . . . . . . . . . . . . . . . . . . . . . . . . . . . . . . . . . . . . . . . . . . . 144
A Quick Look at Security. . . . . . . . . . . . . . . . . . . . . . . . . . . 144
Login Categories . . . . . . . . . . . . . . . . . . . . . . . . . . . . . . 145
Global vs. Personal Data View . . . . . . . . . . . . . . . . . . . 145
Data Views and Privileges . . . . . . . . . . . . . . . . . . . . . . . . . . 146
Data Views . . . . . . . . . . . . . . . . . . . . . . . . . . . . . . . . . . . 146
Privileges . . . . . . . . . . . . . . . . . . . . . . . . . . . . . . . . . . . . 146
root’s Privileges and Constraints . . . . . . . . . . . . . . . . . . . . . 147
Privileges for the User root . . . . . . . . . . . . . . . . . . . . . . 147
Constraints for the User root . . . . . . . . . . . . . . . . . . . . . 147
Data Views . . . . . . . . . . . . . . . . . . . . . . . . . . . . . . . . . . . . . . 148
Global Data View . . . . . . . . . . . . . . . . . . . . . . . . . . . . . 148
Personal Data View . . . . . . . . . . . . . . . . . . . . . . . . . . . . 149
Login Names. . . . . . . . . . . . . . . . . . . . . . . . . . . . . . . . . . . . . 150
Global Users Configuration File. . . . . . . . . . . . . . . . . . . . . . 151
Define Launcher Properties . . . . . . . . . . . . . . . . . . . . . . . . . . . . 152
Launcher Properties . . . . . . . . . . . . . . . . . . . . . . . . . . . . . . . 154
Tree Proportions . . . . . . . . . . . . . . . . . . . . . . . . . . . . . . . . . . 158
Network Timeout . . . . . . . . . . . . . . . . . . . . . . . . . . . . . . . . . 160
Snapshot Properties. . . . . . . . . . . . . . . . . . . . . . . . . . . . . . . . 162
# P0988094 Ver: 1.0 Nortel Networks Confidential Page v
Page 6

PeriView Reference Manual
Refresh Properties. . . . . . . . . . . . . . . . . . . . . . . . . . . . . . . . . 164
Data View Properties . . . . . . . . . . . . . . . . . . . . . . . . . . . . . . 166
Select Launcher Views . . . . . . . . . . . . . . . . . . . . . . . . . . . . . . . . 168
Change Tree Orientation. . . . . . . . . . . . . . . . . . . . . . . . . . . . 169
Select a Domain . . . . . . . . . . . . . . . . . . . . . . . . . . . . . . . . . . 170
Select a Snapshot . . . . . . . . . . . . . . . . . . . . . . . . . . . . . . . . . 171
Compact/Full Launcher . . . . . . . . . . . . . . . . . . . . . . . . . . . . 172
Refresh . . . . . . . . . . . . . . . . . . . . . . . . . . . . . . . . . . . . . . . . . 173
Launch PeriView Tools . . . . . . . . . . . . . . . . . . . . . . . . . . . . . . . 174
Use Online Documentation. . . . . . . . . . . . . . . . . . . . . . . . . . . . . 177
Launch the Online Documentation System . . . . . . . . . . . . . 178
Application Manager . . . . . . . . . . . . . . . . . . . . . . . . . . . . . . 179
Section 1 — APPMAN Overview . . . . . . . . . . . . . . . . . . . . . . . . . . 181
Introduction to APPMAN. . . . . . . . . . . . . . . . . . . . . . . . . . . . . . 182
Solaris Launch of the Application Manager. . . . . . . . . . . . . . . . 184
NT Launch of the Application Manager. . . . . . . . . . . . . . . . . . . 186
Menu Buttons . . . . . . . . . . . . . . . . . . . . . . . . . . . . . . . . . . . . 188
Tool Bar . . . . . . . . . . . . . . . . . . . . . . . . . . . . . . . . . . . . . . . . 189
Tree Controls . . . . . . . . . . . . . . . . . . . . . . . . . . . . . . . . . . . . 190
Expand and Collapse the Tree . . . . . . . . . . . . . . . . . . . . . . . . . . 191
Tree Object Information . . . . . . . . . . . . . . . . . . . . . . . . . . . . 193
Context Sensitive Menus . . . . . . . . . . . . . . . . . . . . . . . . . . . 198
Expand by Node . . . . . . . . . . . . . . . . . . . . . . . . . . . . . . . . . . 199
Expand by Component . . . . . . . . . . . . . . . . . . . . . . . . . . . . . 201
Expand by VPS or MPS . . . . . . . . . . . . . . . . . . . . . . . . . . . . 204
Expand by VAS . . . . . . . . . . . . . . . . . . . . . . . . . . . . . . . . . . 207
Expand by Application . . . . . . . . . . . . . . . . . . . . . . . . . . . . . 210
APPMAN Topology . . . . . . . . . . . . . . . . . . . . . . . . . . . . . . . . . . 216
Security. . . . . . . . . . . . . . . . . . . . . . . . . . . . . . . . . . . . . . . . . . . . 220
A Quick Look at Security. . . . . . . . . . . . . . . . . . . . . . . . . . . 220
User-Specific Phone Line Security. . . . . . . . . . . . . . . . . . . . 225
Topology and Data View Examples. . . . . . . . . . . . . . . . . . . 226
Define APPMAN Properties. . . . . . . . . . . . . . . . . . . . . . . . . . . . 228
Select APPMAN Views . . . . . . . . . . . . . . . . . . . . . . . . . . . . . . . 229
Application Management . . . . . . . . . . . . . . . . . . . . . . . . . . . . . . 230
Types of Applications. . . . . . . . . . . . . . . . . . . . . . . . . . . . . . 233
Types of Phone Lines . . . . . . . . . . . . . . . . . . . . . . . . . . . . . . 234
Login Categories . . . . . . . . . . . . . . . . . . . . . . . . . . . . . . 221
Global Data View . . . . . . . . . . . . . . . . . . . . . . . . . . . . . 221
Personal Data View . . . . . . . . . . . . . . . . . . . . . . . . . . . . 222
Security, Data View, Privileges Summary . . . . . . . . . . 223
Global Data View . . . . . . . . . . . . . . . . . . . . . . . . . . . . . 226
Personal Data View . . . . . . . . . . . . . . . . . . . . . . . . . . . . 227
Application Management Tools . . . . . . . . . . . . . . . . . . . 230
Page vi Nortel Networks Confidential # P0988094 Ver: 1.0
Page 7

Table of Contents
File Location Requirements . . . . . . . . . . . . . . . . . . . . . . . . . 236
Application Assign/Start Order . . . . . . . . . . . . . . . . . . . . . . 238
Application Management Event Cycle. . . . . . . . . . . . . . . . . . . . 239
Section 2 — Assign/(Re)Start Lines . . . . . . . . . . . . . . . . . . . . . . . . 245
Introduction. . . . . . . . . . . . . . . . . . . . . . . . . . . . . . . . . . . . . . . . . 246
Launch the Assign/(Re)Start Lines Tool . . . . . . . . . . . . . . . . . . 249
Assign, Start or Restart Lines. . . . . . . . . . . . . . . . . . . . . . . . . . . 251
The Assign/(Re)Start Lines Window . . . . . . . . . . . . . . . . . . 253
Security . . . . . . . . . . . . . . . . . . . . . . . . . . . . . . . . . . . . . 258
Assign/(Re)Start Actions . . . . . . . . . . . . . . . . . . . . . . . 261
Enter Applications Information . . . . . . . . . . . . . . . . . . . 262
Enter Locations Information . . . . . . . . . . . . . . . . . . . . . 264
Designate the Assign, Start and Restart Order . . . . . . . 270
Select Assign Options . . . . . . . . . . . . . . . . . . . . . . . . . . 271
Assign, Start, or Restart Lines . . . . . . . . . . . . . . . . . . . . 274
Assign/(Re)Start Lines Progress. . . . . . . . . . . . . . . . . . . . . . 281
Section 3 — Terminate/Un-Assign Lines . . . . . . . . . . . . . . . . . . . . 283
Introduction. . . . . . . . . . . . . . . . . . . . . . . . . . . . . . . . . . . . . . . . . 284
Launch the Terminate/Un-Assign Lines Tool . . . . . . . . . . . . . . 287
Terminate/Un-Assign Lines . . . . . . . . . . . . . . . . . . . . . . . . . . . . 289
The Terminate/Un-Assign Lines Window . . . . . . . . . . . . . . 290
Security . . . . . . . . . . . . . . . . . . . . . . . . . . . . . . . . . . . . . 292
Terminate and Un-Assign Actions . . . . . . . . . . . . . . . . 295
Enter Locations Information . . . . . . . . . . . . . . . . . . . . . 296
Select Terminate/Un-Assign Options . . . . . . . . . . . . . . 302
Terminate, Un-Assign, Terminate & Un-Assign Lines . 304
Terminate/Un-Assign Lines Progress. . . . . . . . . . . . . . . . . . 309
Section 4 — Configure Applications . . . . . . . . . . . . . . . . . . . . . . . . 311
Introduction. . . . . . . . . . . . . . . . . . . . . . . . . . . . . . . . . . . . . . . . . 312
Launch the Configure Application Tool. . . . . . . . . . . . . . . . . . . 315
Configure Applications. . . . . . . . . . . . . . . . . . . . . . . . . . . . . . . . 317
The Configure Application Window . . . . . . . . . . . . . . . . . . 318
Identify the Application to Configure . . . . . . . . . . . . . . 319
Define the Application Type . . . . . . . . . . . . . . . . . . . . . 320
Define the Configuration Type . . . . . . . . . . . . . . . . . . . 321
Define Custom Configurations . . . . . . . . . . . . . . . . . . . 323
Save . . . . . . . . . . . . . . . . . . . . . . . . . . . . . . . . . . . . . . . . 324
Assign/Start . . . . . . . . . . . . . . . . . . . . . . . . . . . . . . . . . . 324
Configuration Options’ Categories. . . . . . . . . . . . . . . . . . . . 325
Data Processing Options . . . . . . . . . . . . . . . . . . . . . . . . 326
Shared Libraries . . . . . . . . . . . . . . . . . . . . . . . . . . . . . . . 332
Host Communications Options . . . . . . . . . . . . . . . . . . . 336
Execution Options . . . . . . . . . . . . . . . . . . . . . . . . . . . . . 339
# P0988094 Ver: 1.0 Nortel Networks Confidential Page vii
Page 8

PeriView Reference Manual
Section 5 — Status . . . . . . . . . . . . . . . . . . . . . . . . . . . . . . . . . . . . . . 365
Introduction. . . . . . . . . . . . . . . . . . . . . . . . . . . . . . . . . . . . . . . . . 366
Launch the Status Tool . . . . . . . . . . . . . . . . . . . . . . . . . . . . . . . . 367
Security. . . . . . . . . . . . . . . . . . . . . . . . . . . . . . . . . . . . . . . . . . . . 370
Component Status Tool . . . . . . . . . . . . . . . . . . . . . . . . . . . . . . . 371
Component Status Information. . . . . . . . . . . . . . . . . . . . . . . 372
Security. . . . . . . . . . . . . . . . . . . . . . . . . . . . . . . . . . . . . . . . . 375
Application Status Tool . . . . . . . . . . . . . . . . . . . . . . . . . . . . . . . 377
Application Status Information. . . . . . . . . . . . . . . . . . . . . . . 378
Security. . . . . . . . . . . . . . . . . . . . . . . . . . . . . . . . . . . . . . . . . 380
Section 6 — Line Start Order During Reboot . . . . . . . . . . . . . . . . . 383
Introduction. . . . . . . . . . . . . . . . . . . . . . . . . . . . . . . . . . . . . . . . . 384
Launch the Line Start Order During Reboot Tool . . . . . . . . . . . 386
How are applications assigned to the list? . . . . . . . . . . . . . . . . . 388
Which applications are assigned and started?. . . . . . . . . . . . . . . 388
What determines the assigned/started order? . . . . . . . . . . . . . . . 388
Why reorder the list?. . . . . . . . . . . . . . . . . . . . . . . . . . . . . . . . . . 389
What affects the order of items on the list? . . . . . . . . . . . . . . . . 389
Where is the information stored? . . . . . . . . . . . . . . . . . . . . . . . . 390
How do I reorder the list? . . . . . . . . . . . . . . . . . . . . . . . . . . . . . . 390
Diagnostic Options . . . . . . . . . . . . . . . . . . . . . . . . . . . . 355
Vocabulary Options . . . . . . . . . . . . . . . . . . . . . . . . . . . . 359
Section 7 — File Maintenance . . . . . . . . . . . . . . . . . . . . . . . . . . . . . 393
Introduction. . . . . . . . . . . . . . . . . . . . . . . . . . . . . . . . . . . . . . . . . 394
Launch the File Maintenance Tool. . . . . . . . . . . . . . . . . . . . . . . 397
Security. . . . . . . . . . . . . . . . . . . . . . . . . . . . . . . . . . . . . . . . . . . . 398
Select and Remove Files. . . . . . . . . . . . . . . . . . . . . . . . . . . . . . . 399
Activity Monitor . . . . . . . . . . . . . . . . . . . . . . . . . . . . . . . . . . 401
Section 1 — Working with the Monitor . . . . . . . . . . . . . . . . . . . . . 403
Introduction to the Activity Monitor . . . . . . . . . . . . . . . . . . . . . 404
Solaris Launch of the Activity Monitor . . . . . . . . . . . . . . . . . . . 406
NT Launch of the Activity Monitor . . . . . . . . . . . . . . . . . . . . . . 407
Working in the Activity Monitor . . . . . . . . . . . . . . . . . . . . . . . . 409
Menu Buttons . . . . . . . . . . . . . . . . . . . . . . . . . . . . . . . . . . . . 411
Tool Bar . . . . . . . . . . . . . . . . . . . . . . . . . . . . . . . . . . . . . . . . 412
Tree Controls . . . . . . . . . . . . . . . . . . . . . . . . . . . . . . . . . . . . 414
Expand and Collapse the Tree . . . . . . . . . . . . . . . . . . . . . . . . . . 415
Tree Object Information . . . . . . . . . . . . . . . . . . . . . . . . . . . . 417
Context Sensitive Menus . . . . . . . . . . . . . . . . . . . . . . . . . . . 423
Monitor Activity and Topology . . . . . . . . . . . . . . . . . . . . . . . . . 424
Monitor Activity. . . . . . . . . . . . . . . . . . . . . . . . . . . . . . . . . . 424
Monitor Topology. . . . . . . . . . . . . . . . . . . . . . . . . . . . . . . . . 425
Page viii Nortel Networks Confidential # P0988094 Ver: 1.0
Page 9

Table of Contents
Tree Objects Without Phone Lines. . . . . . . . . . . . . . . . . . . . 435
No Graph Launch . . . . . . . . . . . . . . . . . . . . . . . . . . . . . . 435
Application Graph Launch . . . . . . . . . . . . . . . . . . . . . . . 436
Security. . . . . . . . . . . . . . . . . . . . . . . . . . . . . . . . . . . . . . . . . . . . 437
A Quick Look at Security. . . . . . . . . . . . . . . . . . . . . . . . . . . 438
Login Categories . . . . . . . . . . . . . . . . . . . . . . . . . . . . . . 438
Global Data View . . . . . . . . . . . . . . . . . . . . . . . . . . . . . 439
Personal Data View . . . . . . . . . . . . . . . . . . . . . . . . . . . . 439
Security, Data View, Privileges Summary . . . . . . . . . . 440
Topology and Data View Examples. . . . . . . . . . . . . . . . . . . 441
Global Data View . . . . . . . . . . . . . . . . . . . . . . . . . . . . . 441
Personal Data View . . . . . . . . . . . . . . . . . . . . . . . . . . . . 442
Section 2 — Activity Monitor Tools . . . . . . . . . . . . . . . . . . . . . . . . 443
Overview. . . . . . . . . . . . . . . . . . . . . . . . . . . . . . . . . . . . . . . . . . . 444
Phone Line Status . . . . . . . . . . . . . . . . . . . . . . . . . . . . . . . . . . . 445
Graph Elements. . . . . . . . . . . . . . . . . . . . . . . . . . . . . . . . . . . . . . 447
Phone Line Status Graph Display. . . . . . . . . . . . . . . . . . . . . . . . 448
Phone Line Status Graph Types . . . . . . . . . . . . . . . . . . . . . . 450
Consolidated versus Individual Viewpoints. . . . . . . . . . . . . 452
Phone Line Status Graph Properties. . . . . . . . . . . . . . . . . . . 455
Security. . . . . . . . . . . . . . . . . . . . . . . . . . . . . . . . . . . . . . . . . 459
Linked Application Status Bar Graph. . . . . . . . . . . . . . . . . . . . . 462
Launch the Linked Application Activity Graph . . . . . . . . . . 463
Graph Display. . . . . . . . . . . . . . . . . . . . . . . . . . . . . . . . . . . . 464
Security. . . . . . . . . . . . . . . . . . . . . . . . . . . . . . . . . . . . . . . . . 469
Linked Graph Properties. . . . . . . . . . . . . . . . . . . . . . . . . . . . 471
Graph Scenarios . . . . . . . . . . . . . . . . . . . . . . . . . . . . . . . . . . 477
Component Span Status . . . . . . . . . . . . . . . . . . . . . . . . . . . . . . . 481
Component Span Status Information . . . . . . . . . . . . . . . . . . 483
Component Span Status Security . . . . . . . . . . . . . . . . . . . . . 488
Component Host Status . . . . . . . . . . . . . . . . . . . . . . . . . . . . . . . 490
Component Host Status Information . . . . . . . . . . . . . . . . . . 494
Define Monitor Properties . . . . . . . . . . . . . . . . . . . . . . . . . . . . . 498
Activity Polling Rate . . . . . . . . . . . . . . . . . . . . . . . . . . . . . . 500
Save Graph State as Defaults . . . . . . . . . . . . . . . . . . . . . . . . 501
Select Monitor Views . . . . . . . . . . . . . . . . . . . . . . . . . . . . . . . . . 502
Alarm Viewer . . . . . . . . . . . . . . . . . . . . . . . . . . . . . . . . . . . . 503
Introduction to the Alarm Viewer. . . . . . . . . . . . . . . . . . . . . . . . 504
Solaris Launch of the Alarm Viewer . . . . . . . . . . . . . . . . . . . . . 507
NT Launch of the Alarm Viewer . . . . . . . . . . . . . . . . . . . . . . . . 508
Working in the Alarm Viewer . . . . . . . . . . . . . . . . . . . . . . . . . . 510
Menu Buttons . . . . . . . . . . . . . . . . . . . . . . . . . . . . . . . . . . . . 512
Source of Alarm Information . . . . . . . . . . . . . . . . . . . . . . . . . . . 514
Live Alarms . . . . . . . . . . . . . . . . . . . . . . . . . . . . . . . . . . . . . 514
# P0988094 Ver: 1.0 Nortel Networks Confidential Page ix
Page 10

PeriView Reference Manual
Default Alarm Log Files. . . . . . . . . . . . . . . . . . . . . . . . . . . . 515
Historical Alarm Log Files. . . . . . . . . . . . . . . . . . . . . . . . . . 516
Alarm Viewer Windows. . . . . . . . . . . . . . . . . . . . . . . . . . . . . . . 517
Alarm Information . . . . . . . . . . . . . . . . . . . . . . . . . . . . . . . . 517
Viewer Buffer . . . . . . . . . . . . . . . . . . . . . . . . . . . . . . . . . . . . 518
Logging. . . . . . . . . . . . . . . . . . . . . . . . . . . . . . . . . . . . . . . . . 518
Locate Alarm Information . . . . . . . . . . . . . . . . . . . . . . . . . . 519
View Log Files . . . . . . . . . . . . . . . . . . . . . . . . . . . . . . . . . . . 520
View Live Alarms. . . . . . . . . . . . . . . . . . . . . . . . . . . . . . . . . . . . 522
View Default Alarm Log Files . . . . . . . . . . . . . . . . . . . . . . . . . . 525
View Historical Alarm Log Files . . . . . . . . . . . . . . . . . . . . . . . . 529
Filter Alarms. . . . . . . . . . . . . . . . . . . . . . . . . . . . . . . . . . . . . . . . 534
Designate Alarm Properties . . . . . . . . . . . . . . . . . . . . . . . . . . . . 542
Alarm Severity/Color . . . . . . . . . . . . . . . . . . . . . . . . . . . . . . 544
Logging Properties . . . . . . . . . . . . . . . . . . . . . . . . . . . . . . . . 546
Viewer Column Layout . . . . . . . . . . . . . . . . . . . . . . . . . . . . 549
Alarm Ringing . . . . . . . . . . . . . . . . . . . . . . . . . . . . . . . . . . . 550
Alarm Buffering . . . . . . . . . . . . . . . . . . . . . . . . . . . . . . . . . . 551
Viewer Identification . . . . . . . . . . . . . . . . . . . . . . . . . . . . . . 553
Load Configuration. . . . . . . . . . . . . . . . . . . . . . . . . . . . . . . . 554
Save Configuration . . . . . . . . . . . . . . . . . . . . . . . . . . . . . . . . 557
User Defined. . . . . . . . . . . . . . . . . . . . . . . . . . . . . . . . . . . . . 560
Data Format . . . . . . . . . . . . . . . . . . . . . . . . . . . . . . . . . . 518
Source of Alarm Information . . . . . . . . . . . . . . . . . . . . . 518
Size for an Alarm . . . . . . . . . . . . . . . . . . . . . . . . . . . . . . 561
VSH Tool . . . . . . . . . . . . . . . . . . . . . . . . . . . . . . . . . . . . . . . . 563
Section 1 — Overview . . . . . . . . . . . . . . . . . . . . . . . . . . . . . . . . . . . 565
VSH Command Line on MPS Systems . . . . . . . . . . . . . . . . . . . 565
VSH Tool on VPS/is Systems . . . . . . . . . . . . . . . . . . . . . . . . . . 566
Introduction to the VSH Tool. . . . . . . . . . . . . . . . . . . . . . . . . . . 567
Solaris Launch of the VSH Tool. . . . . . . . . . . . . . . . . . . . . . . . . 568
NT Launch of the VSH Tool . . . . . . . . . . . . . . . . . . . . . . . . . . . 569
Menu Buttons . . . . . . . . . . . . . . . . . . . . . . . . . . . . . . . . . . . . 571
Access a VSH Command Line . . . . . . . . . . . . . . . . . . . . . . . 571
Command Line Prompt . . . . . . . . . . . . . . . . . . . . . . . . . 571
Connection to a Component . . . . . . . . . . . . . . . . . . . . . 572
Component List . . . . . . . . . . . . . . . . . . . . . . . . . . . . . . . 573
Identify and Change the VSH Command Line. . . . . . . . . . . . . . 574
VSH Command Line Format . . . . . . . . . . . . . . . . . . . . . . . . 574
Identify and Change the Component . . . . . . . . . . . . . . . . . . 574
Use the VSH Command Line . . . . . . . . . . . . . . . . . . . . . . . . . . . 575
Access Man Page Reference Material . . . . . . . . . . . . . . . . . . . . 576
Solaris Command Man Pages. . . . . . . . . . . . . . . . . . . . . . . . 576
MPS Command Man Page . . . . . . . . . . . . . . . . . . . . . . . . . . 577
Page x Nortel Networks Confidential # P0988094 Ver: 1.0
Page 11

Table of Contents
MPS Alarm Reference Man Pages . . . . . . . . . . . . . . . . . . . . 578
VPS/is Command Man Page. . . . . . . . . . . . . . . . . . . . . . . . . 579
VPS/is Alarm Reference Man Pages . . . . . . . . . . . . . . . . . . 580
MPS and VPS/is Status/Exception Condition Man Pages . . 581
Menu Access to MPS Commands . . . . . . . . . . . . . . . . . . . . . . . 582
Comp Menu . . . . . . . . . . . . . . . . . . . . . . . . . . . . . . . . . . . . . . . . 585
Section 2 — VSH Line & Vocabulary Commands . . . . . . . . . . . . . 587
Line Commands . . . . . . . . . . . . . . . . . . . . . . . . . . . . . . . . . . . . . 588
Line Commands—Reports . . . . . . . . . . . . . . . . . . . . . . . . . 590
Line Commands—Status . . . . . . . . . . . . . . . . . . . . . . . . . . . 601
Vocabulary Commands. . . . . . . . . . . . . . . . . . . . . . . . . . . . . . . . 606
Vocabulary Commands—Application . . . . . . . . . . . . . . . . . 608
Vocabulary Commands—MMF . . . . . . . . . . . . . . . . . . . . . 613
Vocabulary Commands—Status . . . . . . . . . . . . . . . . . . . . . 618
Section 3 — VSH Host, System & User Commands . . . . . . . . . . . 639
Host Commands . . . . . . . . . . . . . . . . . . . . . . . . . . . . . . . . . . . . . 640
Host—Parameters—Configuration. . . . . . . . . . . . . . . . . . . . 641
Host Commands—Status . . . . . . . . . . . . . . . . . . . . . . . . . . . 642
System Commands . . . . . . . . . . . . . . . . . . . . . . . . . . . . . . . . . . . 644
System Commands—Database. . . . . . . . . . . . . . . . . . . . . . . 644
System Commands—SRP Status . . . . . . . . . . . . . . . . . . . . 657
SRP Status . . . . . . . . . . . . . . . . . . . . . . . . . . . . . . . . . . . 657
SRP Group Status . . . . . . . . . . . . . . . . . . . . . . . . . . . . . 659
SRP Log Files . . . . . . . . . . . . . . . . . . . . . . . . . . . . . . . . 660
SRP Command Line Options . . . . . . . . . . . . . . . . . . . . . 662
SRP Configuration File . . . . . . . . . . . . . . . . . . . . . . . . . 664
System Commands—IPC Status . . . . . . . . . . . . . . . . . . . . . 665
System Commands—Alarm Manager . . . . . . . . . . . . . . . . . 666
The Alarm Database . . . . . . . . . . . . . . . . . . . . . . . . . . . 667
Manipulating the Alarm Database . . . . . . . . . . . . . . . . . 669
Alarm Database Record Format . . . . . . . . . . . . . . . . . . 670
System Commands—Shared Memory . . . . . . . . . . . . . . . . . 684
User Commands . . . . . . . . . . . . . . . . . . . . . . . . . . . . . . . . . . . . . 689
User Command—Commands. . . . . . . . . . . . . . . . . . . . . . . . 690
User Command—Add . . . . . . . . . . . . . . . . . . . . . . . . . . . . . 691
User Command—Delete. . . . . . . . . . . . . . . . . . . . . . . . . . . . 691
File Transfer . . . . . . . . . . . . . . . . . . . . . . . . . . . . . . . . . . . . . 693
Introduction to the File Transfer Tool . . . . . . . . . . . . . . . . . . . . 694
Host (Node) Equivalency Prerequisites . . . . . . . . . . . . . . . . . . . 695
Launch the File Transfer Tool . . . . . . . . . . . . . . . . . . . . . . . . . . 697
The File Transfer Package . . . . . . . . . . . . . . . . . . . . . . . . . . . . . 698
Create, Edit and Delete a Package . . . . . . . . . . . . . . . . . . . . . . . 700
Transfer Package Procedure Summary. . . . . . . . . . . . . . . . . 702
# P0988094 Ver: 1.0 Nortel Networks Confidential Page xi
Page 12

PeriView Reference Manual
Package Data. . . . . . . . . . . . . . . . . . . . . . . . . . . . . . . . . . . . . 704
Group Data . . . . . . . . . . . . . . . . . . . . . . . . . . . . . . . . . . . . . . 706
Transfer Task Data . . . . . . . . . . . . . . . . . . . . . . . . . . . . . . . . 710
Execute a File Transfer. . . . . . . . . . . . . . . . . . . . . . . . . . . . . . . . 712
Transfer Status Window . . . . . . . . . . . . . . . . . . . . . . . . . . . . 713
Transfer Log Window. . . . . . . . . . . . . . . . . . . . . . . . . . . . . . 714
Transfer Log File . . . . . . . . . . . . . . . . . . . . . . . . . . . . . . . . . 716
Display Transfer Status Information. . . . . . . . . . . . . . . . . . . . . . 717
View Transfer Log Files. . . . . . . . . . . . . . . . . . . . . . . . . . . . . . . 718
Schedule Transfer Package. . . . . . . . . . . . . . . . . . . . . . . . . . . . . 721
Task Scheduler . . . . . . . . . . . . . . . . . . . . . . . . . . . . . . . . . . . 723
Introduction to the Task Scheduler. . . . . . . . . . . . . . . . . . . . . . . 724
Host (Node) Equivalency Prerequisites . . . . . . . . . . . . . . . . . . . 726
Time Synchronization Between Nodes. . . . . . . . . . . . . . . . . . . . 728
Task Scheduler Prerequisite Checklist . . . . . . . . . . . . . . . . . . . . 729
Launch the Task Scheduler. . . . . . . . . . . . . . . . . . . . . . . . . . . . . 731
Launch the Task Scheduler from the File Transfer Tool . . . . . . 733
Launch the Task Scheduler from PeriReporter Tools . . . . . . . . 734
Define and Schedule a Task . . . . . . . . . . . . . . . . . . . . . . . . . . . . 735
View the Scheduler Log File . . . . . . . . . . . . . . . . . . . . . . . . . . . 743
sched.log File Data . . . . . . . . . . . . . . . . . . . . . . . . . . . . . . . . 744
Define the sched.log File Size . . . . . . . . . . . . . . . . . . . . . . . 746
Tracing a Task . . . . . . . . . . . . . . . . . . . . . . . . . . . . . . . . . . . . . . 747
sched.table File . . . . . . . . . . . . . . . . . . . . . . . . . . . . . . . . . . . 748
at and cron Processes . . . . . . . . . . . . . . . . . . . . . . . . . . . . . . 749
at -l Command . . . . . . . . . . . . . . . . . . . . . . . . . . . . . . . . 750
crontab -l Command . . . . . . . . . . . . . . . . . . . . . . . . . . . 751
cron_error.log File . . . . . . . . . . . . . . . . . . . . . . . . . . . . . 752
Index . . . . . . . . . . . . . . . . . . . . . . . . . . . . . . . . . . . . . . . . . . . 753
Page xii Nortel Networks Confidential # P0988094 Ver: 1.0
Page 13

Preface
Page 14

PeriView Reference Manual
Scope
PeriView is a Graphical User Interface (GUI) tool that you use with the Nortel
Networks Media Processing Server Series and Voice Processing Series Platforms
(hereafter, collectively known as Processing Server).
The PeriView Reference Manual prov ides i nformat io n about h ow to use PeriView a nd
its subset of tools. A companion document, PeriView Quick Start Guide offers a
concentrated version of this material.
In addition to these docum ents, refer to the Processing Server reference materi al,
available from the Refere nce Ma ter ia l link in PeriDoc.
Intended Audience
This document is useful to any person who uses PeriView to interact with the
Processing Server systems. It is expected that you have complete the training
programs conducted as part of the initial system installation.
In addition, it is importan t to be familiar with site-specific proce dures relating to the
Processing Servers. Basic knowledge of the Solaris and/or Windows NT operating
system(s) is assumed.
Page xiv Nor tel Networks Confidential # P0988094 Ver: 1.0
Page 15

How To Use This Manual
Initially, read this manual at least once, from start to finish. Later, you can use the
table of contents to locate specific topics. In addition to standard computer
terminology, this manual contains some language that can only be explained in the
context of the Processing Server systems. Refer to the following documents:
• Glossary of Nortel Networks Media Processing Server Series Terminology.
• Glossary of VPS/is Terminology.
If you are reading this document online, use the hypertext links marked in blue to
locate related topics. To move to the topic, <L
cursor is positioned over the hypertext link. Click on any point in a Table of Contents
entry to move to th at to pic. Cl ic k on t he page numb er of any I ndex en tr y to a ccess that
topic. Use the hyperlinks at the top and bottom of each online “page” to help you
navigate the documentation. Click on the Nortel Globemark to display the title,
software release, publicat ion an d revision number , and rel ease date for the manual you
are using.
To familiarize yourself with various specialized textual references within the manual,
see Conventions Used in This Manual on page xix.
Preface
EFT> click the mouse once when the
Periphonics is now part of Nortel Networks. The name Periphonics, and variations
thereof, still appear in this manual only where it is referred to in a product. (Some
examples are: a PeriProducer applic ation, t he PERImps pack age, and the perirev
command.
# P0988094 Ver: 1.0 Nortel Networks Confidential Page xv
Page 16

PeriView Reference Manual
Organization of This Manual
This manual is designed to be a comprehensive reference guide to working within
PeriView’s GUI environment and using PeriView’s suite of tools. Each tool is
documented in a separate chapter. A summary of these chapters follow.
Chapter 1 — Introduction
Provides an overvi ew of Per iView’s suite of tools ; a conceptual vie w of the Processing
Server network; and a plan to setup your network environment. You can learn how to
work in a GUI environment and execute PeriView operations. Refer to What is
PeriView? on page 2.
Chapter 2 — PeriView Launcher
Documents the PeriView Launcher, which is PeriView’s administrative tool. You can
learn how to define the PeriView network and launch its suite of tools. Refer to
Introduction to the Launcher on page 88.
Chapter 2 — Section 1 — Define the Network
Documents how to use PeriView’s graphical environment to administer and
control the Processing Server environment. You can learn how to use GUI tools;
define and manipulate objects that represent Processing Server network entities;
and interpret network topologies. Refer to Section 1 — Define the Network on
page 87.
Chapter 2 — Section 2 — Launcher Tools
Documents security in the PeriView environment, working within the launcher,
and accessing the suite of PeriView tools. You can learn how to define Launcher
properties; select Launcher views; launch other PeriView tools; access the
Processing Server online documentation. Refer to Section 2 — Launcher Tools
on page 143.
Chapter 3 — Application Manager
Documents the Application Manger and its subset of tools, which you use to manage
applications in the Proc ess ing Server network. Refer to Introduction to APPMAN on
page 182.
Chapter 3 — Section 1 — Overview
Provides an introduction to APPMAN. You can learn to manipulate the
Processing Server network graphically to accomplish specific operations. This
section provides es sential informa tion about the el ements involve d with managing
applications in the Processing Server environment. Refer to Section 1 —
APPMAN Overview on page 181.
Page xvi Nortel Networks Confidential # P0988094 Ver: 1.0
Page 17

Preface
Chapter 3 — Section 2 — Assign/(Re)Start Lines
Documents the Assign/(Re)Start Lines tool, which you use to associate
applications with phone lines and initiate their execution. You can learn how to
launch this tool and how to assign applications to phone lines and start, or restart,
applications. Refer to Section 2 — Assign/(Re)Start Lines on page 245.
Chapter 3 — Section 3 — Terminate/Un-Assign Lines
Documents the Terminate/Un-Assign Lines tool, which you use to halt the
execution of applications and disassociate them from phone lines. You can learn
how to launch this tool and how to terminate applications and un-assign them
from phone lines. Refer to Sec ti on 3 — Terminate/Un-Assign Lines on page 283.
Chapter 3 — Section 4 — Configure Application
Documents the Configure Application tool, which you use to define the
environment in which an application executes. You can learn how to launch this
tool and how to configure an appl ication’s run- time parameters . Refer to Sect ion 4
— Configure Applications on page 311.
Chapter 3 — Section 5 — Status
Documents the Status tool, which you use to display the status of a component or
an application. You can learn how to launch this tool and how to display
application and component status information. Refer to Section 5 — Status on
page 365.
Chapter 3 — Section 6 — Line Start Order During Reboot
Documents the Line Start Order During Reboot t ool , whi ch you use to control the
default order in which applications are assigned and started (if so configured)
when the system reboots. You can learn how to launch this tool and how to define
the default order for assigning, starting, and restarting applications. Refer to
Section 6 — Line Start Order During Reboot on page 383.
Chapter 3 — Section 7 — File Maintenance
Documents the File Maintenance tool, which you use to delete files from a
component. You can learn how to launch this tool and how to remove files. Refer
to Section 7 — File Maintenance on page 393.
Chapter 4 — Activity Monitor
Documents the Activity Monitor, which you use to monitor component and
application activ ity us ing a set o f g raphs. PLM (Phone Line Mana gement) Line Status
graphs monitor the l ine st ate of compon ents a nd a pplic ation s. The Li nked Appl icat ion
Activity graph depicts the activity of an application and the applications to which it
links. You can also graphically display the status of a digital span or an external host
that is associated with a specific component. Refer to Introduction to the Activity
Monitor on page 404.
# P0988094 Ver: 1.0 Nortel Networks Confidential Page xvii
Page 18

PeriView Reference Manual
Chapter 5 — Alarm Viewer
Documents the Alarm Viewer, which you use to view and log alarms. You can learn
how to launch the is tool; display and interpret alarm information; and filter, display,
and log alarms. Refer to Introduction to the Alarm Viewer on page 504.
Chapter 6 — VSH Tool
Documents the VSH tool, whi ch you use t o issue c ommands an d tra nsmit me ssages to
a component in the Processing Server network.
The VSH tool is available only on the Nortel Networks Voice Processing Series
Platform (VPS/is). It is not currently available on the Nortel Networks Media
Processing Server Series Platform (MPS100 and MPS 1000).
Chapter 6 — Section 1 — Overview
Describes how to launch the VSH tool and how to issue commands typed at the
command line. You can see examples of issuing of VSH commands , lear n how to
display Manual (Man) Refer ence Pages, and view t he menu structure used to issue
commands. Refer to Section 1 — Overview on page 565.
Chapter 6 — Section 2 — VSH Line & Vocabul ary Commands
Document the menu driven commands that display Phone Line and Vocabulary
information. You can learn how to issue these commands and how to inte rpr et th e
information they display. Refer to Section 2 — VSH Line & Vo cabulary
Commands on page 587.
Chapter 6 — Section 3 — VSH Host, System & User Commands
Documents the menu driven commands that display information about a
component’s external hosts associated with the Voice Processing Series Platform.
You can learn how to issue these commands and how to interpret the information
they display. Further, you can learn how to add commands to the menu structure.
Refer to Section 3 — VSH Host, System & User Commands on page 639.
Chapter 7 — File Transfer Tool
Documents the File Transfer tool, which you use to distribute files across the
Processing Server network. You can learn how to transfer files from one location to
one or more different network locations. A file transfer package can include a single
file, a single directory or a group of related files and/or directories. Refer to
Introduction to the File Transfer Tool on page 694.
Chapter 8 — Task Scheduler
Documents the Task Scheduler, which you use to schedule single occurrence or
recurrent tasks. You can learn how to launch the tool, create tasks, and schedule their
execution. Refer to Introduction to the Task Scheduler on page 724.
Page xviii Nortel Networks Confidential # P0988094 Ver: 1.0
Page 19
Conventions Used in This Manual
This manual uses different fonts and symbols to differentiate between document
elements and types of information. These conventions are summarized in the
following table.
Conventions Used in This Manual
Notation Description
Preface
Normal text
important term
system
command
file name /
directory
on-screen field
<KEY NAME>
Book Reference
cross refer ence
Normal text font is used for most of the document.
The Italics font is used to introduce new terms, to highlight
meaningful words or phrases, or to distinguish specific terms fr om
nearby text.
This font indicates a system command and/or its arguments. Such
keywords are to be entered exactly as shown (for example, users
are not to fill in their own values).
This font is used for highlig hting the names of disk directories , files,
and extensions for file names. It is also used to show displays on
text-based screens (for example, to show the contents of a file.)
This font is used for field labels, on-screen menu buttons, and
action buttons.
A term that appears within angled brackets denotes a terminal
keyboard key, a telephone keypad button, or a system mouse
button.
This font indicates the names of other publications referenced
within the document.
A cross reference or man page reference is shown on the screen
in blue. Click on the cross reference to access the referenced
location. A cross reference that refers to a section name accesses
the first page of that section. Click on the man page reference to
elicit a pop-up window displaying the subject man page.
The Note icon identifies notes, important facts, and other keys to
understanding.
The Caution icon identifies procedures or events that require
!
special attention. The icon indicates a warning that serious
problems can arise if the stated instructions are improperly
followed.
The flying Window icon identifies procedures or events that apply
to the Windows NT operating system only.
The Solaris icon identifies procedures or events that apply to the
Solaris operating system only.
2
1
# P0988094 Ver: 1.0 Nortel Networks Confidential Page xix
Page 20

PeriView Reference Manual
1. Windows NT and the flying Window logo are either trademarks or registered
trademarks of the Microsoft Corp orat ion .
2. Solaris® is a registered trademark of The Open Group i n the U.S. and other
countries.
Solaris and Windows NT Conventions
This manual depicts examples (command line syntax, configuration files, and screen
shots) in Solaris format. In certain instances Windows NT specific commands,
procedures, or screen shots are shown where required. The following table lists
examples of general operating system conventions to keep in mind when using this
manual with either the Solaris or NT operating system.
Solaris Windows NT
Environment $VPSHOME %VPSHOME%
Environment $MPSHOME %MPSHOME%
Paths $VPSHOME/common/etc %VPSHOME%\common\etc
Paths $MPSHOME/common/etc %MPSHOME%\common\etc
Command <command> & start /b <command>
Page xx Nortel Ne tworks Confidential # P0988094 Ver: 1.0
Page 21

Trademark Conventions
The following trademark information is presented here and applies throughout for
third party products discussed within this manual. Trademarking information is not
repeated hereafter.
Solaris is a tr adema rk or regist ered trade mark of Su n Micro systems , Inc. in the United
States and other countries.
Microsoft, Windows, Windows NT, Internet Explorer, and the Flying Windows logo
are either trademarks or registered trademarks of Microsoft Corporation.
Netscape
Netscape Communications Corporation in the U.S. and other countries. Netscape
Navigator is also a trademark of Netscape Communications Corporation and can be
registered outside the U.S.
Preface
®
and the Netscape N® and Ship’s Wheel® logos are register ed trade marks of
# P0988094 Ver: 1.0 Nortel Networks Confidential Page xxi
Page 22

PeriView Reference Manual
Manual (man) Pages
Manual (man) pages provide access to documentation about Solaris system
commands, Processing Server commands, status/exception conditions, and alarm
information.
• On Solaris systems, you can display man pages from any command line.
• On NT systems, you can display man pages from a DOS prompt/VSH prompt.
The man page appears in a separate browser window. The type of browser
window depends on which browsers are installed and what browser is set as the
default.
• man pages are always accessible through PeriDoc’s Search page and through
hypertext links in the documents.
When working with the Nortel Networks Media Processing Server Series, to access a
Man Page for:
• a Solaris system command, use the syntax man <command> (Solaris only).
• an MPS command, use the syntax mpsman <processname> <command>.
On Solaris systems on ly, enter man mpsman for a detailed description of using
MPS command manual pages.
• an MPS alarm, use the syntax mpsalarm <processname> <alarm#>.
On Solaris systems only, enter man mpsalarm for a detailed description of
using alarm manual pages, or man alarmintro for an overview of MPS
alarms and the alarm dat abase.
• an MPS status/excepti on conditi on, use the syn tax conman <condition>. On
Solaris systems only, enter man conman for a detailed description of using
MPS condition manual pages.
When working with the Voice Processing Series, to access a Man Page for:
• a Solaris system command, use the syntax man <command> (Solaris only).
• an VPS command, use the syntax vpsman <processname> <command>.
On Solaris systems on ly, enter man vpsman for a detailed description of using
VPS command manual pages.
• a VPS alarm, use the syntax vpsalarm <processname> <alarm#>. On
Solaris systems only, enter man vpsalarm for a detailed description of using
alarm manual pages, or man alarmintro for an overview of VPS/is alarms
and the alarm database.
• a VPS status/exception condition, use the syntax conman <condition>. On
Solaris systems only, enter man conman for a detailed description of using
VPS condition manual pages.
Page xxii Nortel Networks Confidential # P0988094 Ver: 1.0
Page 23

Preface
The man page scripts rely on the Windows NT registry settings for default browser
information. Older browsers do not set the registry entries required by the man page
scripts. Do not use command line Man pages if you are using browsers older than
Netscape Navigator 4/Internet Explorer 4.
If you are viewing this document online, click any command highlighted in blue to
open a window displaying the manual page for that command.
# P0988094 Ver: 1.0 Nortel Networks Confidential Page xxiii
Page 24

PeriView Reference Manual
This page has been intentionally left blank.
Page xxiv Nor tel Networks Confidential # P0988094 Ver: 1.0
Page 25

1
Introduction to PeriView
This chapter covers:
1. What is PeriView?
2. What ar e Pe riView’s Tools?
3. What is the Work Environment?
4. How is the Graphical Environment Organized?
5. Security
6. How are PeriView Operations Executed?
7. How do I Launch PeriView?
Page 26
PeriView Reference Manual
What is PeriView?
PeriView is the suite of graphical tools that you use fo r admi ni str at ion, operation, and
control of Nortel Networks Media Processing Server Series and Voice Processing
Series Platforms, hereafter collectively known as Processing Server (PS).
You can use PeriView to manipulate and view network activity and to develop and
maintain applications in a GUI (Graphical User Interface) environment. The palate of
tools display on the tool bar when you log onto PeriView.
PeriView provides for distributive control over network activity. It lets you to define
virtual environments and operate within them. Each tool offers a wide range of
customization.
You launch each tool individually. You can launch tools sequentially so that you can
work with multiple tools. Once you launch a tool, you can iconify it and restore it to
view when you need it.
This flexibility permits simultaneous interaction with multiple PeriView operations
and allows for network awareness and control in the operating environment. For
example, you can view alarms in the Alarm Viewer, monitor applications in the
Activity Monitor, and issue commands with the VSH tool while you are assigning,
starting, or terminating appl ications.
Page 2 Nortel Networks Confidential # P0988094 Ver: 1.0
Page 27
What are PeriView’s Tools?
You use PeriView’s suite of tools to administer, operate, control, and view network
activity; develop and maintain applications; and, create, manage, and edit speech
elements. Additionally, PeriView is equipped with a comprehensi ve online library that
you can launch, spontaneously, while working with its palate of tools.
The Launcher is PeriView’s main administrative tool. It displays when you log onto
PeriView. You use it to access to the entire palate of tools, which include: PeriView
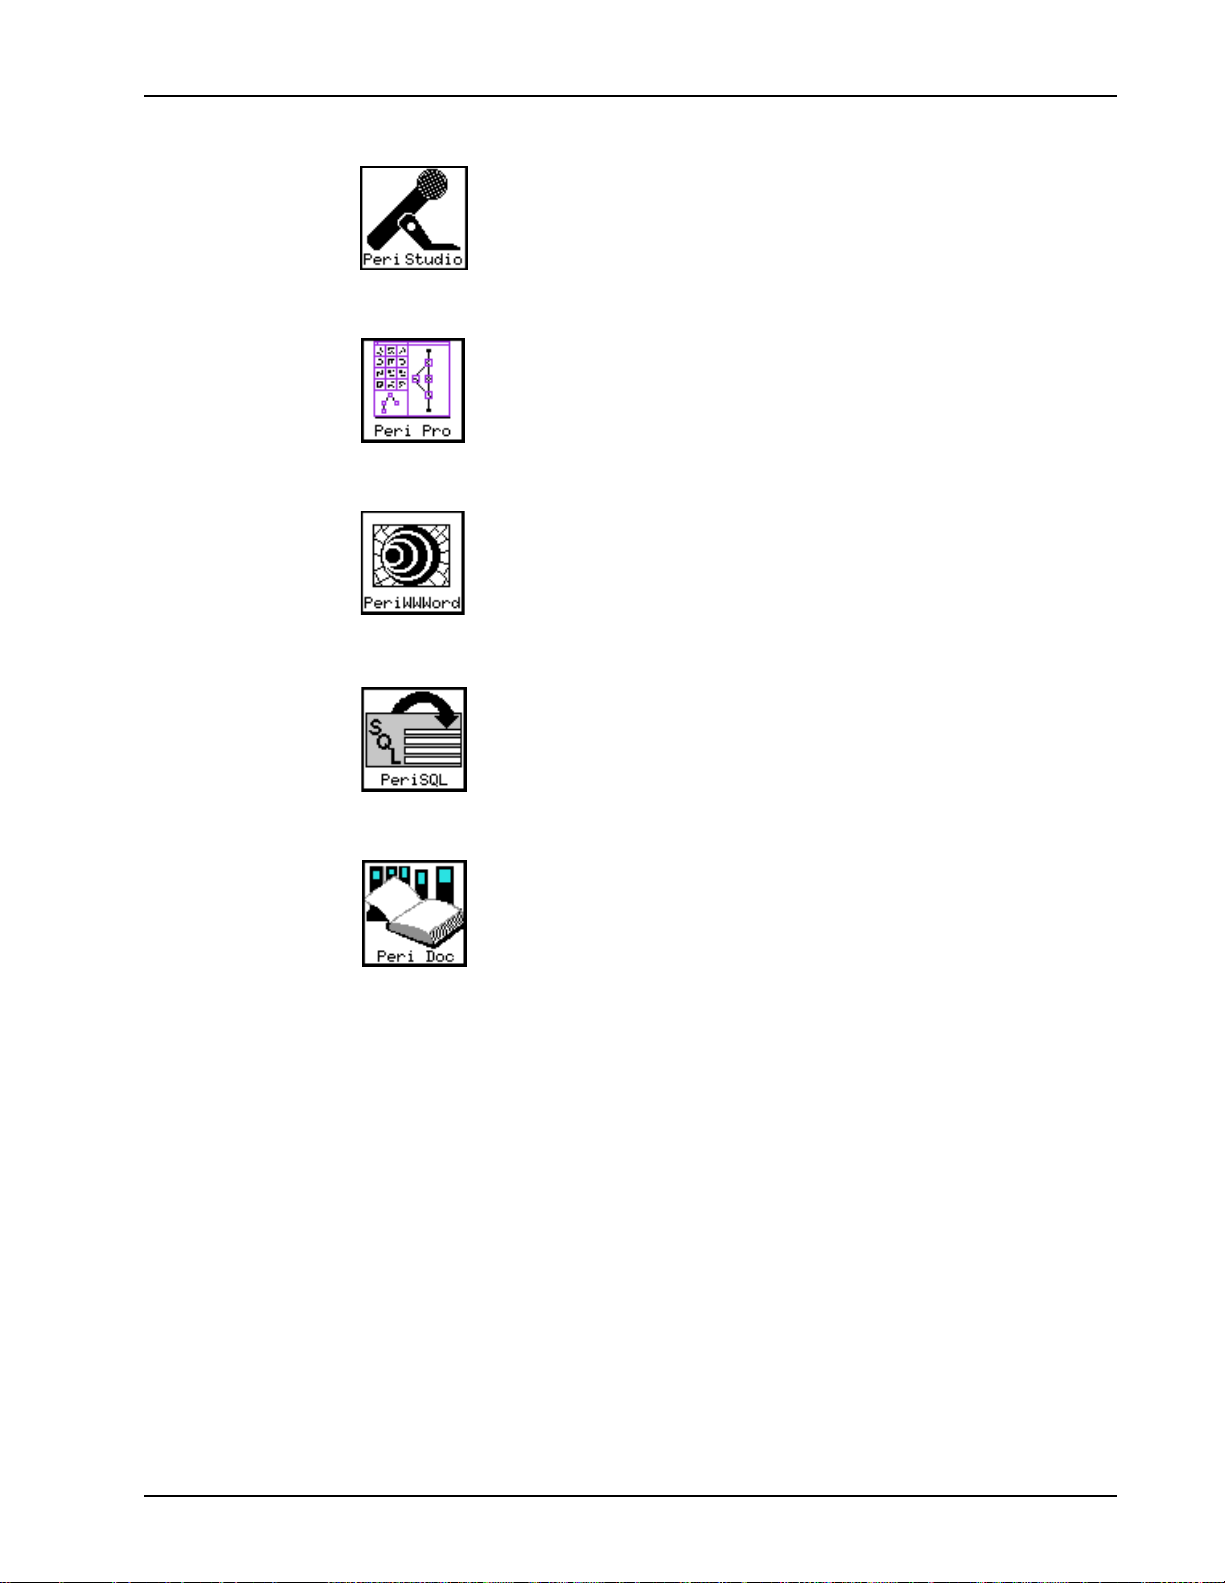
Launcher, Applica tion Manager, Activit y Monitor, Alarm Viewer, VSH, File T r ansfer,
Task Scheduler, Spin, PeriReporter Tools, PeriStudio, PeriProducer, PeriWWWord,
PeriSQL, and PeriDoc.
Introduction to PeriView
Use the PeriView Launcher to customize the a network’s virtual
working environment by defining relationships between member
entities; display their hierarchical tree structure graphical l y; and,
launch other PeriView tools. See Introduction to the Launcher on
page 88.
Use the Applicatio n Manager (APPMAN) to associate
applications with phone lines and start applications; terminate
applications and disassociate them from phone lines; configure an
application’s run-time environment; display application and
component status information, control the default line start order
during reboot; and delete fil es from a component. See Introduction
to APPMAN on page 182.
Use the Activity Monitor to graphically represent the states of
phone line activity for components and applications and to
graphically monitor linked application activity. A set of graphs
depict activity in near real-time. You can view a component’s
digital span activity and external host status graphically. See
Introduction to the Activ ity Monitor on page 404.
Use the Alarm Viewer to view live and logged alarms. Logging
allows you to creat e ala rm log file s. A fi ltering mechani sm lets you
to control which alarms display and are logged. See Introduction
to the Alarm Viewer on page 504.
# P0988094 Ver: 1.0 Nortel Networks Confidential Page 3
Page 28
PeriView Reference Manual
The VSH tool is supported only on the Voice Processing Series
platform. You can issue VSH commands on the MPS100 or
MPS1000 platform from a Solaris Command Tool and Windows
NT MSDOS window. See Section 1 — Overvie w on page 565.
Use the File Transfer to copy files across a network. Transfer
capability lets you duplicate a single file, a single directory, or a
group of related files and directories at one or more destination
locations. S ee Introduction to the File Transfer Tool on page 694.
Use the Task Scheduler to schedule operations as single
occurrence task or as recurrent tasks. You can launch the Task
Scheduler from the PeriView Launcher, the File Transfer tool, or
PeriReporter Tools. See Introduction to the Task Scheduler on
page 724.
SPIN is a diagnostic tool, which is u sed to ide ntify pr oblems on th e
VPS/is platform. The tool is intended for use, primarily, by Nortel
Networks support personnel only on the VPS/is platform.
SPIN (S
basic components of Processing Server of products to identify
problems: interprocess communication (IPC) and the ability of
firmware to echo messages back to SPIN.
The first co mponent tests that Nortel Networks operating system
software is properly sending messages among core processes. The
second component sends messages to firmware images to ensure
they can respond in a timely manner.
Typically, you will be working directly with Nortel Networks
support when you use this tool.
Use PeriReporter Tools for statistics and reports management.
You can generate predefined reports and define and report
application-specific statistics.
Typically, PeriReporter Tools reside on the node designated as the
site of statistical collection and reporting for the network. Th e tool
displays the PeriView tool bar only at the node where you install
the PeriReporter Tools software. For i nformation about
PeriReporter Tools, see the PeriReporter User’s Guide.
ystem Performance and INtegrity monitor) probes two
Page 4 Nortel Networks Confidential # P0988094 Ver: 1.0
Page 29
Introduction to PeriView
Use PeriStudio to create and edit speech vocabularies for the
Processing Server systems. For infor mat ion about PeriSt udio, r efer
to the PeriStudio User’s Guide.
Use PeriProducer to cr eate and support i n t era ct ive voice respon se
and Web applications. You can build applications in a graphical
construction area with a set of building block icons that represent
basic functions. For information about PeriProducer, refer to the
PeriPr oduc er Us er’s Guid e.
Use PeriWWWord to launch the PeriWWWord utility. You can
create and modify the HTML dictionaries that PeriWeb
applications reference. For information about PeriWWWord, refer
to the PeriWeb User’s Guide.
Use the Nortel Networks SQL Generate and Display tool
(PeriSQL), to create, modify, and execute Structured Query
Language (SQL) SELECT commands through a graphical
interface. For information about PeriSQL, refer to the PeriRDB
User’s Guide.
Use the PeriDoc tool to access the comprehensive online resource
library, which contains Nortel Networks reference material. See
Use Online Documentation on page 177.
# P0988094 Ver: 1.0 Nortel Networks Confidential Page 5
Page 30
PeriView Reference Manual
What is the Work Environment?
The Processing Server systems consists of the hardware and software required to
support interactive call processing functions for both voice and Web (Internet)
interaction.
In this Beta Version of the PeriView Reference Guide, the component names VPS and
MPS are synonymous, except where explicitly differentiated.
Configurations and Naming Conventions
The following description illustrates the Processing Server system concepts and
naming conventions used in the PeriView Reference Manual and Quick Start Guide.
Single Processing Server
A single node is the building block in the Processing Server
configuration. It is configured with one VPS or MPS
component which consists of:
• TMS (Telephony Media Server) hardware.
• ASE (Application Services Environment) and the VOS
(Voice Operating Software) software processes executing
on a node.
PS
Node
VPS
ASE
VOS
TMS
Page 6 Nortel Networks Confidential # P0988094 Ver: 1.0
Page 31

Introduction to PeriView
Processing Server Network Configuration
The following diagram illustrates a two node Processing Server configuration. It
consists of a node configured with one VPS component and a node configured with
two VPS components. Each node is identified by a node name (A and B) and each
VPS is identified by a VPS number (1, 2, & 3) that must be unique across all nodes.
Typically, statistics collection and processing is performed only on one node in a
multi-node environment. PeriView tools reside on each node. However, PeriReporter
Tools typically reside only on the node designated for statistics collection and
processing (Node B in this diagram). You can launch any of PeriView’s tools from
any node, except for Pe riReporter Tools. Yo u can launch Pe riReporter Tools only from
the node designated for statistical collection and reporting.
PS Network
PS
Node A
(PeriView)
VPS 1
ASE
VOS
TMS
PS
Node B
(PeriView and
PeriReporter Tools)
VPS 2
ASE
VOS
TMS
VPS 3
ASE
VOS
TMS
# P0988094 Ver: 1.0 Nortel Networks Confidential Page 7
Page 32

PeriView Reference Manual
Components in the Processing Server
Processing Servers can consist of one or more nodes. Components provide specific
functionality to the ne twor k and resi de on nodes. A node provides the cen tr al point of
control for the components that reside on the node. While it is possible for a node to
configure a node without components (a specific functionality), all nodes are
PeriView workstations from which you can launch PeriView’s suite of tools.
Types of Components
The types of compo nents that can be conf igured in P rocess ing Se rve r env ironment a re
summarized on the following table.
Component Description (Sheet 1 of 3)
VPS A VPS (Voice Processing Series) component provides
MPS An MPS (Media Processing Series) component provides full
telephone services and is capable of application processing. It
is equipped with the telephony required to interact with
applications to process calls.
interactive call processing functionality with a programmable
switching fabric in an integrated system.
It provides telephone servi ce s and is ca pab le of appl ic ati on
processing. It is equipped with the telephony required to
interact with applications to process calls.
VAS A VAS (Process Server Application Server) component
provides application services on the VPS/is platform. It runs
ASE processes on behalf of a component that resides on a
different node.
This allows for sharing resources between applications that
execute on different nodes. It functions in conjunction with a
component that prov ides te lepho ny serv ices for c all pro cess ing.
VAS application processing is not available on the MPS
platform.
OSCAR An OSCAR (Open Signal Computing and Analysis Resource)
component provides external resource services such as
speech recognition and speech synthesis.
It functions in conjunction with a component that provides the
telephony and appli cation services required for call proc essin g.
MTS An MTS (Message Transfer Server) component provides a
platform for centralized voice message storage and retrieval
across a network of Processing Server systems.
CCSS A CCSS (Common Channeling Signal Server) component that
provides SS7 (Signalling System 7) and C7 support to the
Process Server product line.
Page 8 Nortel Networks Confidential # P0988094 Ver: 1.0
Page 33

Introduction to PeriView
Component Description (Sheet 2 of 3)
CSS An CSS (Call Sponsor Server) component provides CTI
(Computer Telep hony Int egratio n) clien t/serv er based s olutio ns
that integrate call and data processing environments.
The CallSPONSOR® Server CTI server that integrates
PBX/ACD, Interactive Voice Response (IVR), agent
workstations, host comp uter(s), and transaction processi ng.
VAPI A VAPI (Voice Application Programming Interface) component
is associated with the CTI product line. VAPI components
make-up the connection between VRU (Voice Response Unit)
applications and the CTI Server.
The CTI Server can be the Ca llSPONSOR Server (CSS) or the
vendor's server. VAPI component’s include:
• Aspect VAPI
The VAPI and ASPECT TLS interface provides a set of
commands that can be used by applications to access
Aspect PBX services. Refer to Aspect VAPI Reference
Guide.
• CSVAPI - CallSPONSOR.
The VAPI interface provides a set of request messages
that are used by applications to access the CSS services.
Refer to CSVAPI Reference Guide.
• TCMV API -- Hewlett-Packard Telephony Contact Manager .
TCMVAPI provides a standardized set of commands for
applications to access the services of the HP CTI server.
Refer to TCMVAPI Reference Guide.
• ICPE VAPI -- IBM CallPath Enterprise server
The VAPI and ICPE TLS interface provides a set of request
messages that can be used by applications to access the
IBM CallPath’s services. Refer to ICPE VAPI Reference
Guide.
• GTS VAPI -- Genesys Tserver.
The V API and GTS TLS i nterfac e provi des a set o f reques t
messages that can be used by applications to access the
Genesys Ts erver’s services. Re fer to GTS VAPI Reference
Guide.
RTR A RTR (Call Router) component is associated with the CTI
product line.
The CS-Router provides a call center with the ability to
efficiently route a high volume of calls to the appropriate
destination.
# P0988094 Ver: 1.0 Nortel Networks Confidential Page 9
Page 34

PeriView Reference Manual
Component Description (Sheet 3 of 3)
SNTRY The SNTRY (CallSentry™) component is associated with the
DCS A DCS (Dynamic Context Server) component is associated with
CTXCOMM The CTXcommon component provides network control and
TMSCOMM The TMSCOMM component provides network control and
CTI product line.
It combines Processing Server and CallSPONSOR® Server
technologies to provide a hardware/software call
recording/playback/scoring system.
Refer to CallSentry(TM) User’s Guide.
the CTI product line.The DSC component is the CTI statistics
server.
telephony bridging fu nc tio ns a cro ss com po nen ts an d no des on
a Voice Processing Series platform.
telephony bridging functions across components and nodes in
a Processing Server environment.
Page 10 Nortel Networks Confidential # P0988094 Ver: 1.0
Page 35

Introduction to PeriView
Component Identifiers
Component tree objects are identified by a triplet parameter setting that consists of the
component type, component number, and the name of the node where the component
resides.
• There are several types of components. See Types of Components on page 8.
• The component number is a number that is associated with a component of a
specific type. Each component of a specific component type must be assigned a
unique component number. For example, there can only be one vps22 in the a
Processing Server environment. There can also be an oscar22 and a vas22.
But, only one VPS component can be assigned the number 22.
• The node name identifies the name of the node where the component resides.
Some examples of component identifiers are described on the following table.
Component Identifier Examples
Identifier Description
vps.109/is9509 vps109 configured for node is9509
vas.109/grouse vas109 configured for node grouse
oscar.1/oscar1 oscar1 configured for node oscar1
# P0988094 Ver: 1.0 Nortel Networks Confidential Page 11
Page 36

PeriView Reference Manual
Sharing Network Resources
The VAS component allows the resources required by applications executing on an
VPS component to be shared across the nodes where these components reside.
VAS application processing is available only on the VPS/is platform (and not on the
MPS platform).
VAS components are VPS-specific, which means that a specific VAS component on
one node is configure d to proces s applicat ions remot ely for a sp ecifi c VPS component
or another node. Only a VPS’s ASE process, which controls application processing,
can run remotely on the V AS. A VPS’s VOS processes ex ecutes on the node whe re the
VPS resides.
Remote processing allows for flexibili ty in sharing the work load bet w een node s. The
shared memory area is node -specif ic. A node ’s shared memo ry area i s accessi ble to all
applications that are processing on a common node. Conversely, a node’s shared
memory area is unavailable to applications which are processing on different nodes.
When you process applications on a VAS component that process calls on VPS
components on other nodes, the VAS node provides the shared memory area that is
accessible to all the applications.
Network Configuration with VAS Support
VAS processing allows for application proc ess in g to occur on one node, in a common
shared memory environmen t, whi l e th e applications are pro ces si ng calls on the phone
lines on VPSs that reside on other nodes.
VPS/is Network — with VPS and VAS Components
VPS/is
Node A
VPS 1
ASE
VOS
CPS
VPS/is
Node B
VPS 2
ASE
VOS
CPS
Node C
VAS 1
VAS 2
In this diagram, the Processing Server network consists of three nodes. All nodes are
PeriView work stations. Node A and Node B are each configured with a single VPS
component. Node C is configured with two VAS components, one for each of the
VPSs.
Page 12 Nortel Networks Confidential # P0988094 Ver: 1.0
Page 37

Introduction to PeriView
Componen ts are identified by the triplet parameter set: component type, co mponent
number, and node_name. The following examples use this identifier in the format:
componant_type.component_number/node_name
For additional information on component identifiers, see Components in the
Processing Server on page 8.
• The VPSs in this diagra m are named: vps.1/A and vps.2/B.
• The VASs in this diagram are named: vas.1/C and vas.2/C.
Applications which execute on the phone lines on Node A and Node B have access to
the same area of shared memory when they are assigned to process on Node C.
You install a VAS component on a node to process applications remotely for a VPS
that resides on a different node. In this example, a VAS component is installed on
Node C for each of the VPS components on Node A and Node B. On the VPS nodes,
the directory structure /opt/vps/vpsN is created. On the VAS node, the directory
structure /opt/vps/vasN is created. The value N represents t he number of the VPS
and VAS components. In this example, the directory structure created on:
• Node A is /opt/vps/vps1.
• Node B is /opt/vps/vps2.
• Node C is /opt/vps/vas1 and /opt/vps/vas2.
In this example, each VAS can act as a surrogate processor for the applications which
are assigned to execute on the phone lines configured for vps1 and vps2.
While the VAS can be assigned to process all applications for its VPS, applications
can also be assigned to both process and execute on the VPS node. In this case, the
application is processed on the node where the VPS resides, not on the VAS node.
All application s that a re assig ned to pr ocess on t he VAS node (Node C) are assigned to
phone lines on Node A and Node B and can access the same shared memory area on
Node C (the VAS node). Applications are assigned (on a per line basis) to the node
where call processing occurs.
The VAS configured for vps1 processes those applications, for vps1, that were
assigned to process on the VAS node. The VAS configured for vps2 processes t hose
applications, for vps2, that were assigned to process on the VAS node. The shared
memory area is available only to applications that are processing on the VAS node.
Regardless of which node a VPS’s applications are assigned for processing, they
execute on the phone lines that are associated with their respective VPS component.
# P0988094 Ver: 1.0 Nortel Networks Confidential Page 13
Page 38

PeriView Reference Manual
Network Design
When considering network design, it essential to focus on your individual business
situation and configu re the netw ork appropria tely to ensur e efficie nt operations . While
remote processing offers flexibility with respect to sharing resources among
applications at different nodes, remote processing is an optional configuration.
Alternatively, application processing can occur totally on the node where the VPS is
configured. In th is cas e, appl icati ons as si gned to a VPS pro cess on th e node whe re th e
VPS resides, and execute on the phone lines of that VPS component. However, the
shared memory area of the node is accessible only to the applications that are
processing on that node.
Page 14 Nortel Networks Confidential # P0988094 Ver: 1.0
Page 39

Introduction to PeriView
!
Configuring the Network for Sharing Resources
Basically, VAS support means that you can configure the network to run ASE
processes on nodes, other than the VPS node where the applications are assigned to
telephone lines.
Although the particular network configuration you select depends upon the specifics
of your working environment, you must define the configuration in a set of
configuration files.
In a typical VAS environment, a site can have multiple Processing Server systems
with their VENGINE processes running on a single dedicated VAS node. Also, it is
not uncommon for some administrative applications to execute locally, on nodes
configured with VPSs while other applications execute remotely, on a VAS node.
The following sample Network Configuration (page 16), corresponding Configura tion
Files (page 17), and Installation/Configuration Procedure (page 32) are used as an
example of the minimum requirements for configuring the Processing Server with
VAS support.
Although other configurations are possible, for the purposes of clarity, a simplified
configuration has been used as an example of VAS configuration.
Both VAS and PeriWeb require custom configuration for proper operation. VAS
configuration is described in this section of the document. PeriWeb configuration is
documented in the PeriWeb User’s Guide.
PeriProducer applica tions that u tili ze Shar ed Fo lders or Event Handlin g (for example :
POST/WAIT) require access to a node’s shared memory area. When shared memory
is a requirement fo r an appl icat ion, th e appli ca tion must be a ss igned f or proc essing on
a VAS node. This implies that PeriView must be configured for VAS support and the
application must be assigned to process on the VAS node.
• For information about configuring the PeriView environment with VAS support,
see Configuring th e Network for Sharing Resources on page 15.
• For information about assigning applications to a VAS, see Enter Locations
Information on page 2 64.
# P0988094 Ver: 1.0 Nortel Networks Confidential Page 15
Page 40

PeriView Reference Manual
Sample Network Configuration
In this example, the network consists of three nodes: is9513, is9509, grouse;
two VPSs: vps.113/is9513 and vps.109/is9509, and two VASs:
vas.113/grouse and vas.109/grouse.
VPS/is Network — with VPS and VAS Components
VPS/is
Node
is9513
VPS
is9513:113
ASE
VOS
CPS
VPS/is
Node
is9509
VPS
is9509:109
ASE
VOS
CPS
Node
grouse
VAS
grouse:113
VAS
grouse:109
This sample network configuration indicates the following:
• A VPS component (vps113) resides on node is9513 and is identified as
vps.113/is9513.
• A VPS component (vps109) resides on node is9509 and is identified as
vps.109/is9509.
• A VAS component for vps113 resides (vas113) on node grouse and is
identified as vas.113/grouse.
• A VAS component for vps109 (vas109) resides on node grouse and is
identified as vas.109/grouse.
• The VAS for vps113 (vas113) processes those applications that are assigned
to grouse, but they execute on vps113’s phone lines (on node is9513).
• The VAS for vps109 (vas109) processes those applications that are assigned
to grouse, but they execute on vps109’s phone lines (on node is9509).
• All applications processing on a node have access to the same shared memory
area. (Applications assigned to vas.113/grouse and vas.109/grouse
have access to grouse’s shared memory area.)
Page 16 Nortel Networks Confidential # P0988094 Ver: 1.0
Page 41

Sample Configuration Files and Reports
Configuration files define the Processing Server network. You can display network
status with a seri es of r eports. Th ese fil es and r eports ar e summariz ed on the following
table. They correspond to the sampl e networ k confi gurati on (pag e 16) and i nstal lati on
and configuration procedure (page 33).
• For a complete description of Processing Server configuration files, refer to the
Processing Server reference material , available from the Reference Material link
in PeriDoc.
• For information abo u t f il e p at h nam e s on Solaris and NT machines, see File Path
Names on page 83.
File/Report Location/Description (Sheet 1 of 2) Go To
Introduction to PeriView
vpshosts Solaris: $VPSHOME/common/etc/vpshosts
NT: %VPSHOME%\common\etc\vpshosts
Identifies the components configured for nodes in a
Processing Server network.
ase.cfg Solaris: $VPSHOME/vps#/etc/ase.cfg
NT: %VPSHOME%\vps#\etc\ase.cfg
Identifies the node where VMS process is running.
gen.cfg Solaris: $VPSHOME/common/etc/gen.cfg
NT: %VPSHOME%\common\etc\gen.cfg
Identifies ancillary processes that are to be started upon
system initialization.
IP Addresses Solaris: /etc/hosts
NT: %windir%\sys32\drivers\etc\hosts
Identifies the IP addresses of each of the nodes in the
Processing Server network.
Ethernet
Addresses
Solaris: /etc/ethers
NT: %windir%\sys32\drivers\etc\bootptab
Identifies a nodes ethernet address.
page 19
page 22
page 24
page 26
page 27
In a VAS configuration, any VPS running a remote VMS
process on a VAS node, must identi fy the VAS node and its
ethernet address in the VPS’s hosts and ethers files.
(VAS is supported only on the VPS/is platform, and not on
the MPS platform.)
srp -status Displays the SRP Status report. The report identifies the
status of SRP (as well as other process es and applic ations)
and the nodes where they are executin g.
page 28
# P0988094 Ver: 1.0 Nortel Networks Confidential Page 17
Page 42

PeriView Reference Manual
File/Report Location/Description (Sheet 2 of 2) Go To
srp -gstatus Displays the SRP Group Process Status report. The report
identifies the status of process groups and applications.
Further, it displays VAS state and identifies the node(s)
where V AS(s) are con figured. (VAS is supporte d only on the
VPS/is platform, and not on the MPS platform.)
srp.log Displays a history of SRP messages. page 31
srp_state.log Displ ays the s tate c hange h istory for a ll SRP objec ts, w hich
include all components. This log file corresponds to the
srp.cfg file attribute statelog.
page 30
page 32
Page 18 Nortel Networks Confidential # P0988094 Ver: 1.0
Page 43

Introduction to PeriView
vpshosts File
A node’s vpshosts file identifies the components that the node can recognize.
It is recommended that the vpshosts file on an NT node contain only the names of
nodes configured with software Version 5.4.1 or greater.
vpshosts File (Sheet 1 of 3)
Full Path Name:
Solaris: $VPSHOME/common/etc/vpshosts
NT: %VPSHOME%\common\etc\vpshosts
Description:
The vpshosts file is the component hosts file. This file is required to exist on each
node in the network. Each component is identified by its component number, the name
of the node where it resides, and the component type. Typically, the file’s contents
should be the same across all nodes, however, this is not necessary in all cases.
The vpshosts file is created/updated on a node, automatically, during the system
installation procedure. Edit this file to include any components that have not been
installed on the node but, are configured for other nodes in the network.
A node is only aware of those co mponents in the network that are ex plicitly defi ned in its
vpshosts file. You must edit a node’s vpshosts file to make the node aware of
components that are installed at a different node. For information about creating/editing
the vpshosts file, see XVHMAN on page 42.
When a VPS/is component is configured with VAS support, a vpshosts file is created
during the VAS installation process, on the VAS node. It identifies all components for
which VASs have been installed on the VAS node. You must edit the file to include
information about the components on the other nodes. (VAS is supported only on the
VPS/is platform, and not on the MPS platform.)
The files used in this example represent the Sample Network Configuration. For
additional information, see Sample Network Configuration on page 16.
The vpshosts file residing on nodes is9513, is9509, and grouse indicate:
• vps109 is configured for Node is9509.
• vps113 is configured for Node is9513.
• vas113 is configured for Node grouse.
• vas109 is configured for Node grouse.
A dash (-) in the NODE column indicates that the component is configured for the local
node (default host), the node where the component resides.
Typically, components configured for the local node are always listed after components
configured for remote nodes.
User login names should be consistent across all nodes in the vpshosts file to allow for
interoperability be twee n nod es . For ex am ple , the user joe (password joem) on any node
in the vpshosts file should represent the same user. And, the user joe (password
joem) should be defined for all nodes listed in the vpshosts file.
# P0988094 Ver: 1.0 Nortel Networks Confidential Page 19
Page 44

PeriView Reference Manual
vpshosts File (Sheet 2 of 3)
Sample files on VPS nodes and VAS node:
vpshosts file on VPS node is9513
$1
#
#vpshosts
#
# This file was automatically generated by vhman.
# Tue Aug 5 15:35:52 2001
#
# COMPONENT# NODE TYPE
This file indicates that vps109 is configured at the node is9509 and vps113 is
configured at the node where the file resides (is9513), as indicated by the dash (-).
The file was created during the installation of vps113 and was updated manually to
include the entries for vps109 and the two VASs (109 and 113).
109 grouse vas
109 is9509 vps
113 grouse vas
113 - vps
vpshosts file on VPS node is9509
$1
#
#vpshosts
#
# This file was automatically generated by vhman.
# Tue Aug 5 15:40:52 2001
#
# COMPONENT# NODE TYPE
113 grouse vas
113 is9513 vps
109 grouse vas
109 - vps
This file indicates that vps113 is configured at the node is9513 and vps109 is
configured at the node where the file resides (is9509), as indicated by the dash (-).
The file was created during the installation of vps109 and was updated manuall y to
include the entries for vps113and the two VASs (vas109 and vas113).
Page 20 Nortel Networks Confidential # P0988094 Ver: 1.0
Page 45

Introduction to PeriView
vpshosts File (Sheet 3 of 3)
vpshosts file on VAS node grouse
$1
#
#vpshosts
#
# This file was automatically generated by vhman.
# Tue Aug 5 15:45:52 2001
#
# COMPONENT# NODE TYPE
113 grouse vas
113 is9513 vps
109 grouse vas
109 is9509 vps
This file indicates that vps113 is configured at the node is9513 and vps109 is
configured node is9509.The file was created on grouse during the VAS installation
and was manually updated to include the entries for vps109 and vps113.
# P0988094 Ver: 1.0 Nortel Networks Confidential Page 21
Page 46

PeriView Reference Manual
ase.cfg File
The ase.cfg file identifies the component processes that are associated with the
ASE (Application Services Environment).
ase.cfg File (Sheet 1 of 2)
Full Path Name:
Solaris: $VPSHOME/componentN/etc/ase.cfg
NT: %VPSHOME%\componentN\etc\ase.cfg
Description:
The ase.cfg file identi fie s th e com pon ent processes that are ass ociate d wit h th e ASE
(Application Services Environment) and defines the node where the VMST process is
running.
For reasons regarding the use of shared memory by various ASE processes, it is
recommended that all VENGINE, VMST, VSUPD, and VASTIMER processe s be run on
the VAS node. It is not possible to run VENGINE processes on both the VAS node and
the VPS, for a particular VPS, if the VENGINES all require shared memory features.
(VAS is supported only on the VPS/is platform, and not on the MPS platform.)
All VENGINE processes that require sha red memory features must execute on the
node where those shared memory features exist.
To implement the recommended configuration, the ase.cfg file needs to be modified
on each of the VPS nodes and the gen.cfg file needs to be modified on the VPS and
VAS nodes. For information about gen.cfg, see gen.cfg File on page 24.
A VPS’s ase.cfg fil e must indi cate that the VMST p rocess i s running on the VAS node,
not on the VPS node. Although, a directory is created for a VPS on the VAS node
(during VAS installation), it is the ase.cfg files on the VPS nodes that must identify
VMST processing on the VAS node.
This file represents the Sample Network Configuration described on page 16. In these
examples, the ase.cfg file indi cat es :
• vps113’s VMST process is configured at the node grouse.
• vps109’s VMST process is configured at the node grouse.
There is no ase.cfg file defined for the node grouse because the node is configured
only with VASs (and no VPSs) and the ase.cfg file is a VPS-specific file.
Page 22 Nortel Networks Confidential # P0988094 Ver: 1.0
Page 47

ase.cfg File (Sheet 2 of 2)
Sample files on VPS nodes:
ase.cfg file on VPS node is9513
$1
#
# ase.cfg
#
# NAME HOST PRI COMMAND LINE
mxvmt - 0 mxvmt
vms grouse 0 vms
ase.cfg file on VPS node is9509
$1
#
# ase.cfg
#
# NAME HOST PRI COMMAND LINE
mxvmt - 0 mxvmt
vms grouse 0 vms
Introduction to PeriView
# P0988094 Ver: 1.0 Nortel Networks Confidential Page 23
Page 48

PeriView Reference Manual
gen.cfg File
The gen.cfg file identifies ancillary processes that are to be started upon system
initialization. It identifies all GEN sub-component processes that are required by any
component in the Processing Server.
gen.cfg File (Sheet 1 of 2)
Full Path Name:
Solaris: $VPSHOME/common/etc/gen.cfg
NT: %VPSHOME%\common\etc\gen.cfg
Description:
The file identifies the processes that are to be monitored by SRP (Startup and Recovery Process).
The VSUPD process is responsible for collecting statics generated by applications and updating the statistics
database with that information. Assuming that all the applications from which you want to collect statistics are
running on the VAS node, you only need VSU PD to run on that no de. In this cas e, the gen.cfg fil e ne eds to be
modified on both the VPS and VAS nodes to indicate that the VSUPD process is running on the VAS node, not
on the VPSnode.
T o edit these fil es, comment out the refere nce to VSUPD on the VPS no de’s file and un comment this entry on the
VAS nod e’s file.
The proces ses listed in these sample files represen t what your gen.cfg file can contain. However, they cannot
all be present. Plus, your gen.cfg file ca n list pro cesses th at are not ide ntifie d in these sample files. Th e critic al
issues, with respect to VAS configuration, are the lines that refer to VSUPD.
If this is an upgrade from a release earlie r than 5.3.0, yo u must edit this file to me et the specifica tions of the 5.3.0
release in addition to editing the file in support of VAS processing.
Page 24 Nortel Networks Confidential # P0988094 Ver: 1.0
Page 49

gen.cfg File (Sheet 2 of 2)
Sample files on VPS and VAS nodes:
gen.cfg file on VPS node
$2
#
# gen.cfg
#
#NAME NODE is-VOS-CLASS PRI COMMAND LINE
alarmd - 1 0 alarmd
configd - 1 0 configd
conout - 1 0 conout
rpc.riod - 0 0 rpc.riod
nriod - 1 0 niod
#vastimer - 0 0 vastimer
#screendaemon - 0 0 screendaemon
consoled - 0 0 consoled
#vsupd - 0 0 vsupd
#periweb - 0 0 periweb
#proxy - 0 0 “proxy -S ccss -L cons -l info -k 10 -n”
Introduction to PeriView
The gen.cfg file on the VPS node indicates that VSUPD does not run on the VPS node.
gen.cfg file on VAS node
$2
#
# gen.cfg
#
#NAME NODE is-VOS-CLASS PRI COMMAND LINE
alarmd - 1 0 alarmd
configd - 1 0 configd
conout - 1 0 conout
rpc.riod - 0 0 rpc.riod
nriod - 1 0 niod
#vastimer - 0 0 vastimer
#screendaemon - 0 0 screendaemon
consoled - 0 0 consoled
#vsupd - 0 0 vsupd
#periweb - 0 0 periweb
#proxy - 0 0 “proxy -S ccss -L cons -l info -k 10 -n”
The gen.cfg file on the VAS node indicates that VSUPD runs on the VAS node.
# P0988094 Ver: 1.0 Nortel Networks Confidential Page 25
Page 50

PeriView Reference Manual
IP Addresses
The files that contain IP addresses are dependent on the node’s operating system.
• On a Solaris node, IP addresses are contained in
/etc/hosts.
• On an NT node, IP addresses are contained in the file:
%windir%\sys32\drivers\etc\hosts
The environment variable %windir%, typically, refers to the directory
C:\WINNT\.
Solaris hosts File
Full Path Name: /etc/hosts
Description:
The hosts file iden tif ies the n am e and I P addre ss of ea ch of the no des in the Process
Server network.
Sample File:
hosts file on VPS is9509
192.168.105.21 is7501
192.168.105.22 is9509
192.168.105.23 grouse
NT hosts File
Full Path Name: %windir%\sys32\drivers\etc\hosts
Description:
The hosts file identifies the IP ad dress es of loc al nod e, its CPSs , and t he is-to-cps
connection.
Sample File:
Page 26 Nortel Networks Confidential # P0988094 Ver: 1.0
Page 51

Introduction to PeriView
Ethernet Addresses
The files that contain ethernet addresses are dependent on the node’s architecture.
• In a Solaris machine, ethernet addresses are contained in the file
/etc/hosts.
• In an NT machine, ethernet addresses are contained in the file:
\WINNT\sys32\drivers\etc\bootptab
The environment variable %windir%, typically, refers to the directory
C:\WINNT\
Solaris ethers File
Full Path Name: /etc/ethers
Description:
The ethers file contains (at least) the node’s name and its ethernet address. A Process
Server node must also contain the ethernet address of its CPS (if any).
In a VAS configuration, any VPS running a remote VMS process on a VAS node, must
identify the VAS node and its ethernet address in its (the VPSs) ethers file. It must also
contain the name and internet addre ss of the nod e runn ing VMS. (VAS is supporte d onl y on
the VPS/is platform, and not on the MPS platform.)
Sample File (VPS node only):
ethers file on VPS is9509
0:80:14:0:0:12 cps109
08:00:20:1e:f3:69 is9509
08:00:20:1e:f5:72 grouse
The ethers file on th e VPS node indicate s that th e VMS proce ss is ex ecutin g remotely on the
VAS node grouse. The first column identifies each node’s ethernet address. The second
column identifies the node name.
NT bootptab File
Full Path Name: %windir%\sys32\drivers\etc\bootptab
Description:
The bootptab file identifies the IP addresses of local node, its CPSs, and
the is-to-cps connection.
Sample File:
# P0988094 Ver: 1.0 Nortel Networks Confidential Page 27
Page 52

PeriView Reference Manual
SRP Status Report
The SRP status report identifies the status of SRP as well as all process and
applications reported by SRP on the nodes where they are executing.
srp -status Report (Sheet 1 of 2)
Description:
The SRP status report is generated by the srp -status com mand. Fo r additiona l inform ation ab out
states, see Tree Object States on page 53.
In this example:
• The state of an SRP on node is9509 is RUNNING.
• The ASE process VMS, is RUNNING on node grouse (the VAS node).
Process State is identified in the column STATE. The date and time when a state change occurred,
displays in the column ENTERED STATE.
The file that contains the history of state changes (page 32) is maintained in the following locations:
• Solaris: $VPSHOME/common/log/srp_state.log
• NT: %VPSHOME%\common\log\srp_state.log
To display the report:
At a VSH command line, type: srp -status
Page 28 Nortel Networks Confidential # P0988094 Ver: 1.0
Page 53

srp -status Report (Sheet 2 of 2)
Sample SRP Status Report:
Introduction to PeriView
# P0988094 Ver: 1.0 Nortel Networks Confidential Page 29
Page 54

PeriView Reference Manual
SRP Group Status Report
The SRP Group Status report identifies the status of process groups and applications.
srp -gstatus Report
Description:
The SRP Group Status report i dentifies the s tatus of proc ess grou ps and appl ications. It
also displays VAS state and identifies the VAS component name. The SRP Group
Status report is genera ted by th e srp -gstatus command. For additional information
about states, see Tree Object States on page 53.
In this example:
• The state of SRP is RUNNING.
• The state of the VAS is RUNNING on the node grouse.
Process State is identified in the column STATE. The date and time when a state
change occurred, displays in the column ENTERED STATE.
The file that contain s the histor y of state c hanges (page 32) is mainta ined in the followin g
locations:
• Solaris: $VPSHOME/common/log/srp_state.log
• NT: %VPSHOME%\common\log\srp_state.log
To display the report:
At a VSH command line, type: srp -gstatus
Sample SRP Group Status Report:
Page 30 Nortel Networks Confidential # P0988094 Ver: 1.0
Page 55

Introduction to PeriView
SRP Log
The SRP Log contains a historical record of SRP messages.
srp.log Report
Full Path Name:
Solaris: $VPSHOME/common/log/srp.log
NT: %VPSHOME%\common\log\srp.log
Description:
The srp.log file contains a history of SRP messages.
To display the file:
At a VSH command line (in the log file’s directory), type: page srp.log
Sample SRP Log File:
# P0988094 Ver: 1.0 Nortel Networks Confidential Page 31
Page 56

PeriView Reference Manual
SRP State Log
The State Log displays the state change history for all SRP objects.
srp_state.log Report
Full Path Name:
Solaris: $VPSHOME/common/log/srp_state.log
NT: %VPSHOME%\common\log\srp_state.log
Description:
The srp_state.log file displays the state change history for all SRP objects, which
include all components. The file dis pl ay s d ate and time when a st ate c han ge oc cu rred, the
component or pro cess exhi biting c hange, and the state to which th e proces s chang ed. Th is
log file corresponds to the srp.cfg file attribute statelog. For additional information
about states, see Tree Object States on page 53.
To display the report:
At a VSH command line (in the log file’s directory), type: page srp_state.log
Sample SRP State Log:
Page 32 Nortel Networks Confidential # P0988094 Ver: 1.0
Page 57

Sample Installation/Configuration Procedure
!
Although your particular network configuration determines exactly what you are
installing, the following sample procedure illustrates the elements that you need to
address to establish a VPS environment with VAS support. This sample procedure is
illustrated for a network that consists of three Solaris nodes.
VAS is supported only on the VPS/is platform, and not on the MPS platform.
The simplified procedure described in the following table corresponds to the sample
network configuration (page 16) and sample configuration files (page 17).
For specific information about installation procedures and the directory structure,
refer to the P rocessing Server referen ce material, available fro m the Reference
Material link in PeriDoc.
The following procedure summarizes the installation and configuration of a network
with a VAS environment. In most probability, your installation involves more issues
than are addressed in this procedure. However, if you are installing a VAS
environment, ensure that you have addressed the elements described in this summary.
Introduction to PeriView
This sample procedure illustrates a network that consists of three Solaris nodes.
Sample Installation/Configuration Procedure (Sheet 1 of 7)
The network (configured with this procedure) consists of three nodes named is9513,
is9509, and grouse. This procedu re ins talls the followi ng comp onents amo ng thre e nod es.
• A VPS component will be installed on node is9513.
• A VPS component will be installed on node is9509.
• Two VAS components (one for each VPS) will be installed on node grouse.
Before you begin Step 1, be sure that you have followed the installation instructions
defined in
Once the components are installed, you can edit the configuration files before you reboot. If
you reboot before editing the configuration files, you have to Refresh PeriView’s tools after
you launch them. For information about refreshing tools, see Refresh on page 173.
Use either vhman or xvhman to edit the vpshosts file. The ase.cfg, gen.cfg, and
ethers files can be edited with any file editor (vi, for example).
• For information about editing the vpshosts fil e, se e VHMAN on page 40 and XVHMAN
• For a description of the network configuration used in this example, see Sample Network
Installing Nortel Networks Software on a Solaris Platform.
on page 42.
Configuration on page 16.
• For a description of the configuration files used in this example, see Sample
Configuration Files and Reports on page 17.
# P0988094 Ver: 1.0 Nortel Networks Confidential Page 33
Page 58

PeriView Reference Manual
Sample Installation/Configuration Procedure (Sheet 2 of 7)
Step Description
1 Install the VAS components on node grouse.
• Install a VAS component on node grouse to process applications remotely for
• Install a VAS component on node grouse to process applications remotely for
The installation process creates the vpshosts file for this node. Each time a VAS
component is installed, corresponding information is appended to this file.
The vpshosts file on this node (grouse) has to be edited to identify:
• vps113, which will be installed on node is9513 (Step 2).
• vps109, which will be installed on node is9509 (Step 3).
2 Install the VPS component (vps113) on node is9513.
The installation process creates the vpshosts file for this node. It contains
information only about the VPSs installed on this node (vps113).
vps113, which will be installed (Step 2) on node is9513.
vps109, which will be installed (Step 3) on node is9509.
The vpshosts file on this node (is9513) has to be edited to identify:
• vps109, which will be installed on node is9509 (Step 3)
• the two VAS components installed on node grouse (Step 1).
3 Install the VPS component (vps109) on node is9509.
The installation process creates the vpshosts file for this node. It contains
information only about the VPSs installed on this node (vps109).
The vpshosts file on this node (is9509) has to be edited to identify:
• vps113, which was installed on node 9513 (Step 2).
• the two VAS components installed on node grouse (Step 1).
Page 34 Nortel Networks Confidential # P0988094 Ver: 1.0
Page 59

Introduction to PeriView
Sample Installation/Configuration Procedure (Sheet 3 of 7)
4 Edit the vpshosts file on the VAS node grouse.
The vpshosts file was created on the VAS node (grouse) during the VAS
installation process. The information that is entered automatically only identifies the
components that were actually installed on the node.
The vpshosts file automatically includes information for the VASs and their
corresponding VPSs on the VAS node on ly. The vpshosts file on the VPSs nodes
must be edited to include information about their corresponding VASs (Step 5).
The contents of this file was deri ved from the data tha t you ente red manuall y, during
the installation procedure. Any typographical errors entered at that time, were
propagated into the file.
You must check t his fil e to e ns ure i ts a cc ura cy and edi t it to identify the component s
that are installed at other nodes (if applicable).
After editing, the vpshosts file on the VAS node (grouse), looks as follows:
vpshosts file on node grouse
$1
#
#vpshosts
#
# This file was automatically generated by vhman.
# Tue Aug 5 15:55:52 2001
#
# COMPONENT# NODE TYPE
109 grouse vas
109 is9509 vps
113 grouse vas
113 is9513 vps
If you need to edit this file, you can use either vhman or xvhman. (Alternatively, you
can use any text editor to modify the file.) For additional information, see Edit the
vpshosts File on page 40.
# P0988094 Ver: 1.0 Nortel Networks Confidential Page 35
Page 60

PeriView Reference Manual
Sample Installation/Configuration Procedure (Sheet 4 of 7)
5 Edit the vpshosts file on the VPS nodes is9513 and is9509.
The vpshosts file was created on the VPS nodes (is9513 and is9509) during
the VPS installation process. The information that is entered automatically only
identifies the components that were actually installed on each of the nodes. These
files have to be edited to include information about the VPS and VAS components,
which you installed on other nodes.
Edit the vpshosts file on nodes is9513 and is9509 to include information
about both VPSs and their co rresponding VAS components. At the completion of the
process, the vpshosts files on all three nodes (is9513, is9509 and grouse)
contains the following information:
vpshosts file on nodes is9513 and is9509
$1
#
#vpshosts
#
# This file was automatically generated by vhman.
# Tue Aug 5 15:55:52 2001
#
# COMPONENT# NODE TYPE
109 grouse vas
109 is9509 vps
113 grouse vas
113 is9513 vps
You can use either vhman or xvhman to edit these files. (Alternatively, you can use
any text editor to modif y the se file s.) For additional informati on, see Edit the vpshosts
File on page 40.
6 Edit the ase.cfg file on the VPS nodes is9513 and is9509.
Use any file editor to edit the ase.cfg file on both VPS nodes (is9513 and
is9509) to indicate that the VM ST process is executing o n the VAS node (grouse).
Files to be edited:
$VPSHOME/vps109/etc/ase.cfg
$VPSHOME/vps113/etc/ase.cfg
After editing, the ase.cfg files on the VPS nodes (is9513 and is9509) looks
as follows:
ase.cfg file on is9513 and is9509
$1
# NAME HOST PRI COMMAND LINE
mxvmt - 0 mxvmt
vms grouse 0 vms
Page 36 Nortel Networks Confidential # P0988094 Ver: 1.0
Page 61

Introduction to PeriView
Sample Installation/Configuration Procedure (Sheet 5 of 7)
7 Edit the gen.cfg file on the VPS and VAS nodes (is9513, is9509,
grouse).
Use any file editor to edit the gen.cfg file on VPS and VAS nodes (is9513,
is9509, and grouse) to indicate that the VASTIMER and VSUPD process are
running on the VAS node (grouse), not on the VPS nodes.
• Comment out any reference to VASTIMER or VSUPD on the VPS nodes
(is9513 and is9509).
• Uncomment these entries from the file on the VAS node (grouse).
File to be edited on the VPS and VAS nodes (is9513, is950, and grouse).
$VPSHOME/common/etc/gen.cfg
At the completion of this process, the gen.cfg files looks as follows:
gen.cfg file on the VPS nodes (is9513 and is9509)
$2
#
# gen.cfg
#
#NAME NODE is-VOS-CLASS PRI COMMAND LINE
alarmd - 1 0 alarmd
configd - 1 0 configd
conout - 1 0 conout
rpc.riod - 0 0 rpc.riod
nriod - 1 0 niod
#vastimer - 0 0 vastimer
#screendaemon - 0 0 screendaemon
consoled - 0 0 consoled
#vsupd - 0 0 vsupd
#periweb - 0 0 periweb
#proxy - 0 0 “proxy -S ccss -L cons
-l info -k 10 -n”
# P0988094 Ver: 1.0 Nortel Networks Confidential Page 37
Page 62

PeriView Reference Manual
Sample Installation/Configuration Procedure (Sheet 6 of 7)
7
gen.cfg file on the VAS node (grouse)
$2
#
# gen.cfg
#
#NAME NODE is-VOS-CLASS PRI COMMAND LINE
alarmd - 1 0 alarmd
configd - 1 0 configd
conout - 1 0 conout
rpc.riod - 0 0 rpc.riod
nriod - 1 0 niod
vastimer - 0 0 vastimer
#screendaemon - 0 0 screendaemon
consoled - 0 0 consoled
vsupd - 0 0 vsupd
#periweb - 0 0 periweb
#proxy - 0 0 “proxy -S ccss -L
cons -l info -k 10 -n”
8 Edit the ethers file on the VPS nodes is9513 and is9509.
In a VAS configuration, any VPS running a remote VMST process on a VAS node,
must identify the VAS node in its ethers file. Use any file e ditor to e dit the ethers
file on both VPS nodes (is9513 and is9509) to indicate that VMST is executing
on the VAS node (grouse).
File to be edited on the VPS nodes (is9513 and is9509)
/etc/ethers
After editing, the ethers file on the VPS nodes (is9513 and is9509) looks as
follows:
ethers file on node is9509
0:80:14:0:0:12 cps109
08:00:20:1e:f3:69 is9509
08:00:20:1e:f5:72 grouse
ethers file on node is9513
0:80:14:0:0:11 cps113
08:00:20:1e:f3:68 is9513
08:00:20:1e:f5:72 grouse
Page 38 Nortel Networks Confidential # P0988094 Ver: 1.0
Page 63

Introduction to PeriView
Sample Installation/Configuration Procedure (Sheet 7 of 7)
9 Reboot the VAS node (grouse).
You must reboot the VAS node after all configuration files have been edited and
before you reboot the VPS nodes. (SRP must be running on the VAS node before
you reboot the VPS nodes.) Display the SRP Status report to ensure that the SRP
process is running.
To display the status of SRP, launch the VSH tool and do one of the following:
• Follow the menu path: System, SRP Status.
• At the command line, type: srp -status
10 Reboot the VPS nodes (is9513 and is9509).
Reboot the VPS nodes (is9513 and is9509) only after the configuration files are
edited, you have rebooted the VAS node (grouse), and check to see that SRP is
running on the VAS node.
# P0988094 Ver: 1.0 Nortel Networks Confidential Page 39
Page 64

PeriView Reference Manual
Edit the vpshosts File
The vpshosts file identifies Processing Server network components. Each
component is identified by a component number, the name of the node at which the
component resides, and the component type. This file resides in each node’s
$VPSHOME/common/etc directory and should contai n the same information across
all nodes.
User login names should be consistent across all nodes in the vpshosts file to
allow for interoperability between nodes. For example, the user joe (password
joem) on any node in the vpshosts file should represent the same user. And, the
user joe (password joem) should be defined for all nodes listed in the
vpshosts file. For information about the vpshosts file, see vpshosts File on page
19.
You can edit the vpshosts file with either the vhman command or the xvhman
command. Both commands are executed from any command line. Alternatively, you
can use any text editor to edit this file.
vhman and xvhman are alternative commands you can use to edit the vpshosts
file. The vhman command requires text-based editing of these files. XVHMAN is
the GUI (Gra phical User Interface) used to implement the vhman command
graphically.
VHMAN
This is a text -based editor, whic h you use to edit the vpshosts file. You issue the
command from a command line. The following descriptions and examples illustrate
how you can modify the vpshost file with this comman d to add a VPS and a VAS.
VAS is supported only on the VPS/is platform, and not on the MPS platform.
Add a VPS to the vpshosts File with vhman (Sheet 1 of 2)
Use the following syntax and example to edit the vpshosts file at node is9509. In this
example, the vpshosts file is edited to ind ic ate that vps113 is conf igu r ed for Nod e is9513.
Before Editing:
Syntax: vhman -c# -his# -t[vps, vas, oscar, etc] -a
$1
#
#vpshosts
#
# This file was automatically generated by vhman.
# Tue Aug 5 15:35:52 1997
#
# COMPONENT# NODE TYPE
109 - vps
Command Line: vhman -c113 -his9513 -tvps -a
Page 40 Nortel Networks Confidential # P0988094 Ver: 1.0
Page 65

Introduction to PeriView
Add a VPS to the vpshosts File with vhman
After Editing:
Add a VAS to the vpshosts File with vhman
Use the following syntax and example to edit the vpshosts file at node is9509. In this
example, the vpshosts file i s edit ed to i ndica te that a VAS is co nfigure d on n ode grouse for
the vps109 configured at node is9509.
Before Editing:
$1
#
#vpshosts
#
# This file was automatically generated by vhman.
# Tue Aug 5 15:35:52 1997
#
# COMPONENT# NODE TYPE
113 is9513 vps
109 - vps
$1
#
#vpshosts
#
# This file was automatically generated by vhman.
# Tue Aug 5 15:35:52 1997
#
# COMPONENT# NODE TYPE
109 - vps
(Sheet 2 of 2)
Syntax: -c# -his# -t[vps, vas, oscar, etc] -a
Command Line: vhman -c109 -hgrouse -tvas -a
After Editing:
$1
#
#vpshosts
#
# This file was automatically generated by vhman.
# Tue Aug 5 15:35:52 1997
#
# COMPONENT# NODE TYPE
109 grouse vas
109 - vps
# P0988094 Ver: 1.0 Nortel Networks Confidential Page 41
Page 66

PeriView Reference Manual
XVHMAN
XVHMAN is the GUI tool you can use to edit the vpshosts file.
(vhman is a text based tool.) Both commands are issued from the
command line. XVHMAN allows you to edit the file graphically and
iconify the tool until you need to use it.
With XVHMAN you select the node where the files are to be edited and specify the
file’s parameters. You can either add components to a node’s vpshosts file or
remove com ponents from a node’s vpshosts file with xvhman. The file is written
to the node you select, after you select Apply.
Page 42 Nortel Networks Confidential # P0988094 Ver: 1.0
Page 67

Introduction to PeriView
To edit the vpshosts file:
• At any command line, type: xvhman
The XVHMAN tool opens and you can spe cify t he par ameters that r esult in eit her
the entry or removal of items in the vpshosts file.
• Define the following XVHMAN parameters.
• Source Node:
The list represents all nodes that are specified in any vpshosts files, which
are currently defined for the network. Select the node where the vpshosts
file is to be updated. Alter natively, you can select All Nodes to specify that
the edits apply to all nodes listed in this scrolling window.
vpshosts files reside in the following locations:
Solaris: $VPSHOME/common/etc/vpshosts
NT: %VPSHOME%\common\etc\vpshosts
• Vpshosts File:
This scrolling window contains thr ee columns of data: Componen t, Node, and
Type. Each line entry represents a single component, which is defined by this
parameter triplet.
• The Component column identified the number of the component.
• The Node column identifies the node at which the component resides (is
local).
• The Type column identifies the component type.
The VAS component type is supported only on the VPS/is platform, and
not on the MPS platform.
Y ou can add components to , or remove components from, this list by selecting
Add or Remove at the Action prompt.
• Action:
Select Add to add a component to the list. Select Remove to remove selected
components from this list.
This action results in either the entr y of a component to, or the removal of
selected components from, the vpshosts file at the node(s) selected in the
Source Node scrolling window after you specify appropriate parameters and
select Apply.
The appearance of the xvhman window depends on whether you select Add
or Remove.
# P0988094 Ver: 1.0 Nortel Networks Confidential Page 43
Page 68

PeriView Reference Manual
• Add:
Select Add to add a single component to the scrolling window. This
component is added to the vpshosts file on th e node you selected i n the
Source Node scrolling wi ndow . If y ou selected All Nodes, this co mponent
is added to the vpshosts file of all nodes listed in the Source N ode
scrolling window.
Once you select Add at the Action prompt, the Add prompt is active and
you have to specify the:
• type of component
• component number
• node at which the component resides (is local).
The component types that you can select from, represent all possible
types of components in the network. It is not necessarily true that you
actually have each of these components configured for your system. The
list represents only the possible types of components that can exist in
Processing Server network.
Specify the triple t of paramete rs for the co mponent you want to add to the
vpshosts file at the node(s) you specified in the Source Node scrolling
window. No action is taken until you select Apply.
The VAS component type is supported only on the VPS/is platform, and
not on the MPS platform.
• Remove:
Choose Remove to remove the selected components, which are listed in
scrolling window. These selecte d component(s) are removed from the
vpshosts file on the node you selected in the Source Node scrolling
window. If you selected All Nodes, the component(s) are removed from
the vpshosts file of all nodes listed in the Source Node scrolling
window.
Once you select Remove at the Action prompt, the Add prompt becomes
inactive. Select the co mponent(s) that you want to remove in t he Vpshosts
File scrolling window.
The selected components are removed from the vpshosts file at the
node(s) you specifie d in th e Source Node scrolling wi ndow onl y after y ou
select Apply.
• Apply:
Select Apply to effect the changes you spe cified to the vpsho sts file (s) locat ed
at the nodes y ou sel ecte d in the Sour ce Node scro llin g window. The file(s) are
updated only after you select Apply. If you want to cancel this operation,
simply close the window without selecting Apply.
Page 44 Nortel Networks Confidential # P0988094 Ver: 1.0
Page 69

How is the PeriView Graphical Environment Organized?
PeriView operations are presented and implemented both graphically and textually.
The PeriView Launcher, Application Manager, and Activity Monitor each launch in a
graphical environment designed with a workspace that displays objects, which
represent your work environment. You can manipulate these objects to accomplish
specific tasks . The wor kspace ca n disp lay ei ther a si ngle gr aphic al obj ec t or as a s et of
objects, which are organized into a hierarchical tree structure. Tools display on a tool
bar above the workspace. Tree controls, which are used to manipulate the tree are
located below the workspace.
Although the Launcher , Appli cation Manager , and Act ivity Monitor are ea ch designed
to implement different sets of operations, their graphical environments consist of
similar elements. Each of PeriView’s tools are documented individually in this
PeriView Reference Manual and in the PeriView Quick Start Gui de.
Introduction to PeriView
# P0988094 Ver: 1.0 Nortel Networks Confidential Page 45
Page 70

PeriView Reference Manual
Elements in the Graphical Environment
Consider PeriView’s graphi cal en vironment a s an activi ty palate from which you vi ew
and execute operations. The tool name displays in the title bar. In this example,
PeriView Launcher is the tool in use.
Title Bar
Buttons
PeriView Tools
Workspace
Network Entity
Scroll Bars
Tree Controls
Message Area
This window displays when you launch the PeriView Launcher. Its graphical
environment consists of buttons; icons that represent tools, tree objects, and tree
controls; a workspace from which to direct and view network activity; menu system;
and a message display area. Network entities display in green, red, or black objects,
which indicate their state (up, down, unreachable).
Tree control and tool bar activity in the Launcher, Application Manager, and Activity
Monitor can be initiated by drag-and-drop methodology, by double clicking a tool, or
by selection from context sensitive tree object menus.
• For a description of the objects that represent network entities in the workspace,
see Tree Objects on page 47.
• To understand the network topology that displays in the workspace, see PeriView
Topology on page 62.
Page 46 Nortel Networks Confidential # P0988094 Ver: 1.0
Page 71

Introduction to PeriView
Tree Objects
Network entities display as objects, in a hierarchical tree structure, in the workspace
of the PeriView Launcher, Application Manager, and Activity Monitor. The type of
objects that actually display, depend on the network configuration, tree object
definitions, and the method of expansion.
Tree objects display as green, red, or black objects, which indicate their state (up,
down, unreachable) with respect to SRP (Startup and Recovery Process). These
objects are summarized on the following table. For information about tree object
states, see Tree Object States on page 53.
PeriView Tree Object Summary (Sheet 1 of 2)
Object Name Description
Domain A domain tree object represents all, or a subset of,
components in the network. The domain always displays at
the apex of the tree. For additional information about
domains, see Expand the Domain on page 119. For
information about defin ing a domain, see Define a Domain on
page 108.
Group A group tree object represents a user defined subset of the
network and can consist of nodes, components, or other
groups. For additional in formation abou t groups, see Expand
by Group on page 122. For inform ation about def ining a group,
see Define a Group on page 104.
Node Each node tree object represents an individual node that is
defined for the network. For additional information about
nodes, see Expan d by No de on page 124.
VPS A VPS or MPS tree object represents a network component
that provides telephone services and is capable of
application processing. For additional information about
VPSs and MPSs, see Expand by VPS or MPS on page 130.
VAS A VAS tree object represents a network component that
provides application se rvices. It ca n process ap plication s on
behalf of a VPS component. For additional information
about VASs, see Expand by VAS on page 132.
VAS is supported only on the VPS/is platform, and not on
the MPS platform.
TMSCOMM The TMSCOMM tree object represents the network
component that provides network control and telephony
bridging functions acro ss compo nents and no des in a Nortel
Networks Media Processing Server Series Releas e 1.0
product.
# P0988094 Ver: 1.0 Nortel Networks Confidential Page 47
Page 72

PeriView Reference Manual
PeriView Tree Object Summary (Sheet 2 of 2)
Object Name Description
Buttons
Buttons display a drop-down list of menu options, open a subsidiary window, or
initiate some activity. Any button or menu item displaying an arrow displays a menu.
A button or menu item displaying an ellipse opens a window. A button displaying only
a name (no arrow, no ellipse) initiates an action.
OSCAR An OSCAR tree object represents a network component
that provides external resource services (speech synthesis
and recognition). It functions in conjunction with a VPS or
MPS, which provides telephony and application services.
• For additional information about OSCARs in PeriView,
see Expand by OSCAR on page 136.
• For detailed information about OSCAR resource
processing, refer to the OSCAR Reference Guide.
About ...
The About button displays information about version of the software that you are
using. When this informatio n is available for a tool, an About button displays in the
tool’s main window. Currently, the About button displays in the Launcher,
Application Manager, Activity Monitor, Alarm Viewer, and VSH tools.
Page 48 Nortel Networks Confidential # P0988094 Ver: 1.0
Page 73

Introduction to PeriView
Tool Bars
Tools are located on tool bars above the workspace in each graphical environment.
Each tool bar consists of a subset of tools. The Launcher’s tool bar displays the suite
of PeriView tools. The Application Manager’s tool bar displays a sub-set of
application management tools. The Activity Monitor’s tool bar displays a set of
monitoring tools.
You can l aunch each of the to ols di rectly fro m the to ol bar by e ither do uble cli cking an
individual tool or by drag-and-drop methodology. Alternatively, you can launch tools
from the Launch and Tools menu buttons and from context sensitive tree object
menus.
PeriView Launcher Tools
The Launcher’s too l bar displays the suite of tool s known as PeriView. Use these tools
to manage applicatio ns, monitor syste m acti vity, view and log alarms, access the VSH
shell, transfer files, schedule tasks, perform system diagnostics, generate statistical
reports; and launch PeriStudio, PeriProducer, PeriWWWord, PeriSQL and PeriDoc
(the online documentation system).
Unlike all other PeriView tools, PeriReporter Tools are available only on the node(s)
where Peri Reporter Tools resides.
Application Manager Tools
The Application Manager’s tool bar displays the tools required for managing
applications. Use these tools to assign and start applications; terminate and un-assign
applications; conf igure an appl ication’s run -time environmen t; display app lication an d
component status information; and define the line start order during reboot. Use the
File Maintenance tool to remove files from a directory on a component. This tool is
available s olely from the Tools menu button.
# P0988094 Ver: 1.0 Nortel Networks Confidential Page 49
Page 74

PeriView Reference Manual
Activity Monitor Tools
The Activity Monitor’s tool bar displays the tools that you use to monitor phone line
status; linked application activity; and digital span and external host status for a
specific component.
A set of graphs depict phone line status and linked application activity. Each of these
tools initiates a distinct type of graph. Phone line status can be monitored as a pie
graph, a stacked bar graph, or a bar graph. Linked application ac ti vit y is monit ored as
a bar graph.
Progress Box
When you launch some PeriView tools, information about the rate of the tool’s
initialization displays both textually and graphically in the form of a Progress Box.
This information inc lud es a gauge measuring the initialization r at e pl us text messages
describing initialization status. When the display indicates 100%, the tool window
opens and the pro gress box closes. To abort the launch, press Cancel. Cu rr ent ly, the a
Progress Box displays for the Launcher, Application Manager, Activity Monitor,
Alarm Viewer, and the VSH tool.
Page 50 Nortel Networks Confidential # P0988094 Ver: 1.0
Page 75

Introduction to PeriView
Tree Controls
The network is represented graphically in the workspace by an array objects that are
organized in a hierarchical tree structure. You accomplish tasks by manipulating tree
objects to execute operations. You use tree controls to expand and collapse the tree’s
structure to reveal or conceal objects, which represent network entities. The entities
(or tree objects) can include the domain (which includes all network entities), userdefined groups or sub-groups, nodes, components, and applications.
When you display tree objects (network entities), you can initiate PeriView activity
and reveal status information. You can initiate activity from tree objects at any
hierarchical level of the tree. Activity resulting from manipulating a node is relevant
to the node’s context on the tree, which includes its parent and child objects. You can
either expand the network hierarchy completely to reveal all composite network
entities or selectively expanded it to reveal only a portion of its entities.
In PeriView Launcher, you can expand the tree by group (if defined with groups),
node, and component. In the Application Manager and Activity Monitor you can
expand the tree by group (if defined with groups), node, component, and application.
You use a single tree control to collapse any previously expanded tree object.
PeriView Launcher Tree Controls
Use tree controls in the PeriView Launcher to expand the tree by group, node, and
component, and to collapse any previously expanded tree object.
Application Manager & Activity Monitor Tree Controls
Use tree controls in the Application Manager and Activity Monitor to expand the tree
by group, node, c omponent, and applicat ion , a nd to collapse any pr evi ous ly expanded
tree object.
Component Tree Control
Use the component tree control to expand an object to
display all components by which it is defined. In
contrast, you can use context sensitive menu options to
expand an object explicitly by a specific component or
by all Components (as well as by Groups and Nodes).
# P0988094 Ver: 1.0 Nortel Networks Confidential Page 51
Page 76

PeriView Reference Manual
Nodes in the Network
The nodes that di splay a s tree objects in the P eriView Launc her , Applicat ion Manager,
and Activity Monitor are defined in the vpshosts and .xtrahostsrc files (if
any).
The .xtrahostsrc file resides only on Solaris machines.
The .xtrahostsrc fi le identifi es any nodes, other than those that ar e defined in the
vpshosts file, which are to be displayed in the tree. The vpshosts file is defi ned
as the component host file. Typically, the vpshosts file contains t he names of node s
configured with components. The .xtrahostsrc file let s you inc lu de nodes in the
tree that are not installed with components (although you can include nodes that are
configured with components). For information about the vpshosts file, see
vpshosts File on page 19.
An example of a node you can add to this file is a PeriView Workstation node. The
.xtrahostsrc file resides in the $HOME directory of the user that launched the
PeriView tool ($HOME/.xtrahostsrc).
To display nodes in the tree that are not identified in the vpshosts file, create this
file and place it in your $HOME directory and expand the tree by node.
You can include the nodes defined in the .xtrahostsrc and vpshosts files in
the definition of user defined domains and they display in a nodes listing. For
example, nodes defined in these files display in the Launcher’s Define Groups and
Domains window and in the Application Manager location’s listings.
.xtrahostsrc File
Full Path Name: $HOME/.xtrahostsrc
Description:
The .xtrahostsrc file identifies any nodes, which are not already defined in the
vpshosts file and the user wants to display in the tree and in listings of nodes.
The file has the format of one node per line.
Each line of data ha s t he form at nodename followed by a space or tab, fo llo wed by
yes or no.
The nodename represents the name of the node. The yes or no indicates whether the
SRP process is confi gured to ru n on the node. Th e state of the no de dis plays in t he tre e
only if SRP is configured as yes.
In the following example, the node pv101 display s in the tre e. H owe ver, its stat e is not
indicated because SRP is configured not to run on the node.
Sample File:
$1
#
pv101 no
Page 52 Nortel Networks Confidential # P0988094 Ver: 1.0
Page 77

Tree Object States
When you launch the PeriVi ew Launcher, Application Manager, and the Activity
Monitor, these tools attempt to contact specific software processes periodically. The
information returned by the contact, or t he lack of contact, is p roj ec ted by the color of
tree objects assigned to the domain in the workspace.
Tree objects represent network entities. For a description of the types of objects that
can display in a tree, see Tree Objects on page 47.
SRP dictates the state of a tree object in the workspace. The color of tree object
indicate their st ate. Th e domain, node s, grou ps, and c omponent s can di splay as green,
red, or black objects in the tree.
State is a representation of a PeriView tool attempting to contact some software
process.
• In the case of tree objects, PeriView tools (PeriView Launcher, Application
Introduction to PeriView
Manager and Activity Monitor) attempt to c ontact srp (Startup and Reco very
Process).
• In the Activity Monitor:
• Graphs attempt to contact TMS (Telephony Media Server).
• The Component Host Status tool attempts to contact commgr
(Communications Manager; commgr intro).
For information about each of these tools, see Introduction to the Activity
Monitor on page 404.
For a description of tree objects in the:
• PeriView Launcher , see Expand and Collapse a Tree on page 116.
• Application Manager, see Expand and Collapse the Tree on page 191.
• Activity Monitor, see Expand and Collapse the Tree on page 415.
# P0988094 Ver: 1.0 Nortel Networks Confidential Page 53
Page 78

PeriView Reference Manual
When you launch the PeriVi ew Launcher, Application Manager, or Activity Monitor,
the tools atte mpt to cont act SRP (St artup an d Recovery Proces s) for i nformatio n about
the state of the tree objects that display in their workspace.
The state of tree objects is considered unreachable until these PeriView tools
establish contact with SRP and recei ve state information. The tree object s ta tes can be
either Up or Down acco rding to SRP.
Therefore, when you first launch the PeriView Launcher, Application Manager, or
Activity Monitor, tree objects appear as black for the period of time it takes to
establish contact with SRP. They change color only after they receive state
information.
When a tree object is colored red in a PeriView tool session, it means that the state of
the object is known to be down. If you launch a new PeriView tool for the same
domain, the red tree object displays as black in the newly launched PeriView tool. In
this scenario, you ha ve two Peri View t ools dis playi ng the sa me tree ob je ct in di f feren t
states (down and unreachable). This is be cause the t wo Pe riView t ools have di f fer ent
sets of information.
• The first PeriView tool has information indicating that the tree object is down,
therefore it displays the object as red.
• The second PeriView tool has n o pre vious i nforma tion ab out the state s of any tre e
objects. All it knows is th at the tree obj ect is unreachable, therefore it displays
the object as black.
The actual meaning of th e states t hese color s represe nt is depend ent on the ty pe of tree
object you are looking at.
• See Component States on page 55.
• See Domain, Group, Node States on page 55.
Page 54 Nortel Networks Confidential # P0988094 Ver: 1.0
Page 79

Introduction to PeriView
Component States
When you launch a PeriView Launch er , App licatio n Manager , o r Activity Moni tor , no
component state information is available. The state of a component is defined as
Unreachable until contact is confirmed.
Unreachable components display as black objects in the workspace (assuming the
tree is expanded to displ ay its co mponen ts). A compon ent is co nsider ed Unreachable
for the window of time that it takes to return a response to the tool requesting initial
contact.
Components acknowledge contact with SRP on an individual basis. A component is
considered Unreachable until SRP returns information to the tool ab out its state,
which can be either Up or Down.
• A component is in an Up state and displ ays as a green object when SRP identi fies
its state as RUNNING.
• A component is in a Down state and displays as a red object when SRP identifies
its state anything other than RUNNING.
Domain, Group, Node States
Domain, group, and node objects represent a collection of member entities. These
objects can represent individual components, other groups, or workstations.
Typically, the state of a parent object (domain, group, node) in the tree represents the
sum of the states of its children (components or other groups).
The color of the parent indicates something about the state of its children. Parent tree
objects display as either black, red, or green, depending upon the collective states
(Unreachable, Down, or Up) of their children.
• Because it is more important to know that a component is Unreachable than Up,
black always supersedes green as the color of the parent object.Therefore, if any
member of a domain, group or node is black and no member is red, the parent
tree object is black.
• Because it is more important to know that a component is Down than either
Unreachable or Up, red always supersedes black or green as the color of the
parent object. Therefore, if any member of a domain, group, or node is red, the
parent tree object is red.
There are some circumstances in which a parent object's state in the tree does not seem
to represent the sum of its children's states. This can be the case for nodes and groups.
# P0988094 Ver: 1.0 Nortel Networks Confidential Page 55
Page 80

PeriView Reference Manual
Node States
The state of a node is based on the following two things:
• The combined state of all of the components installed on that node.
• The state of the connection between a PeriView tool and the node itself.
A node can be either green, red, or black.
• A green node indicates that all component members are in an Up state. This
implies that all components display as green objects.
• A red node indicates that at least one component member is Down. This implies
that at least one component displays as a red object.
• A black node indicates one of the following:
• At least one of the components on the node is Unreachable and all of the
components that are reachable are Up. No components are Down! This
implies that at least one c omponent dis plays as a black object and all other
objects are green. No objects are red! In this case, black rep res ent s the
combined state of all the components on the node.
• The node is configured to ru n an SRP (Star tup and Rec overy Pr ocess) and the
PeriV i ew tool c anno t make a con necti on with th e node. Eve n tho ugh the no de
consists of only green components, the node is Unreachable because no
information is available about the node itself.
In this case, black represents the state of connection between the PeriView
tool and the nod e. The n ode's stat e, as displ ayed i n the tr ee, do es not repr esent
the sum of the stat es of its children . Thi s sce nario can exist for nod es, groups,
and domains.
This situation is not likel y to occ ur when a nod e co nsist s of onl y VPS or MPS
components. This situation can occur when VAS components or workstations
are installed on a node. (VAS is supported only on the VPS/is platform, and
not on the MPS platform.)
• When a node consists of VPS or MPS components, a PeriView tool
contacts the VPS or MPS node for the state of the components as well as
for the node connection.
• When a node consists of VAS components, a PeriView tool contacts the
VPS node for the state of the VAS components (since the VAS is
controlled by the VPS). However, the PeriView t ool also has to establi sh a
connection with the VAS node.
Therefore, in the case of V AS, there are two different connections that have an
effect on t he state of the VAS node. If those c onnection s are in dif ferent s tates,
the parent tree object reflects that difference.
In the case of a node installed with a workstation, see Group and Domain
States on page 57.
Page 56 Nortel Networks Confidential # P0988094 Ver: 1.0
Page 81

Introduction to PeriView
Group and Domain States
A green group or domain object indicates tha t all node and compon ent members are in
an Up state. This implies that all nodes and components display as green objects.
A red group or domain obj ect indi cates t hat at least on e node or component member is
Down. This implies that at least one node or component displays as a red object.
A black group or domain indicates that at least one member node or component is
Unreachable and all nodes and components that are reachable are Up. No members
are Down! This implies that, at least, one node or component displays as a black
object and all other objects are green. No objects are red!
As in the case for nodes, there are some circumstances in which a group object’s state
in the tree doe s n ot seem to represent th e s u m of t he states of its chil dr en. Thi s t ype of
behavior can result in groups that contain nodes with either VAS components or
workstations.
In the case of a group or domain cons ist i ng of nodes configured with VASs, see Node
States on page 56.
You also can ha ve a group or a d omain whi ch cont ains only no des and th ose nod es are
configured with components and PeriView workstations.
Example:
A group consists of:
• a VPS node with two Up VPSs (green).
• a PeriView Workstation node (which has no components) that is Down (red).
The group appears red in the tree. If you expand the group by nodes, you see one
red node and one green node. At this point, all seems consistent.
But, if you expand the gr oup by component s instead of nodes, you s ee that the red
group is expanded by only green c ompone nts. This can look wr ong, however it is
correct because there are no components associated with a workstation.
# P0988094 Ver: 1.0 Nortel Networks Confidential Page 57
Page 82

PeriView Reference Manual
Summary of Tree Object States
Tree obje cts re present t heir stat e by color: Unreachable (black), Down (red), and Up
(green). When a tree object represents states collectively (node, group and domain),
the Down state supersedes the Unreachable state.
An Unreachable state, which does not necessarily indicate a problem, implies only
that no information is available for an object. A Down state indicates that infor mati on
is available and the component is Down.
Summary of Tree Object States (Sheet 1 of 4)
Object State Color Description
DOWN red The VPS or MPS is Down, as indicated by an
SRP state of anything other than RUNNING.
Indicates that one or more VPS-specific or
MPS-specific processes have either been
interrupted or are not yet fully operational.
UP green The VPS or MPS is Up, as indicated by an SRP
state of RUNNING. Indicates that all VPSspecific or MPS-specific processes are fully
operational.
UNREACHABLE black The state of the VPS or MPS is unknown. No
information is available. Once information is
available, the state of the VPS or MPS is either
Down or Up.
Example: While a VPS or MPS is in th e process
of booting, and not all processes are fully
operational, the VPS or MPS displays as a red
object. However, when the VPS or MPS is up,
the VPS or MPS object becomes green,
indicating that all processes are fully
operational.
A VPS or MPS object that displays with a
purple triangle indicates that a VAS has been
configured to process applications remotely for
the VPS or MPS.
DOWN red The VAS is Down, as indicated by an SRP
state of anything other than RUNNING.
Indicates:
• SRP is not running (Down) on either the
VPS or the VAS (or both).
• The VMST process had been running, but
has gone Down.
Page 58 Nortel Networks Confidential # P0988094 Ver: 1.0
Page 83

Summary of Tree Object States (Sheet 2 of 4)
Object State Color Description
UP green The VAS is Up, as indica ted by a n SRP state of
RUNNING.
Indicates:
• There is communication between the VAS
and the VPS for which it can process
applications remote ly. Comm un ica t io n
implies that SRP is running (Up) both on
the VPS and on the VAS.
• The VMST process is running (Up) on the
VAS or has not yet (initially) come up on
the VAS.
UNREACHABLE black The state of the VAS is unknown. No
information is available. Once information is
available the state of the VAS is eit her Down or
Up.
Introduction to PeriView
DOWN red A TMSCOMM component is Down when the
state of SRP is of anything other than
RUNNING. It indicates that one or more
TMSCOMM-specific processes have either
been interrupted or are not yet fully opera tional.
UP green A TMSCOMM component Up when the state of
SRP is Running. It indicates that all
TMSCOMM-specific processes are fully
operational.
UNREACHABLE black A TMSCOMM component is Unreachable
when its state is unknown. No information is
available. Once information is available, the
state of the TMSCOMM component is either
Down or Up.
DOWN red An OSCAR is Down when the state of SRP is
of anything other than RUNNING. It indicates
that one or more OSCAR-specific processes
have either been interrupted or are not yet fully
operational.
UP green An OSCAR is Up when the state of SRP is
Running. It indicates that all OSCAR-specific
processes are fully operational.
UNREACHABLE black An OSCAR is Unreachable when the OSCAR
state is unknown. No information is available.
Once information is available, the state of the
OSCAR is either Down or Up.
# P0988094 Ver: 1.0 Nortel Networks Confidential Page 59
Page 84

PeriView Reference Manual
Summary of Tree Object States (Sheet 3 of 4)
Object State Color Description
DOWN red At least one of the node ’s com ponents is Down,
as indicated by an SRP state of anything other
than RUNNING.
Indicates either of the following:
• One or more components configured on
the node are down. (When you expand the
node by component, one or more
components on the node are represented
by red objects)
• A connection with the node does not exist
and one should exist. (There is an SRP
process executing on that node).
UP green All of the node’s components on it are Up, as
indicated by an SRP state of RUNNING.
Indicates both of the following:
• All components c onfigured on the node are
up and running. (When you expand the
node by component, a ll component s on the
node are represented by green objects.)
• A connection with the node exists (if an
SRP process is designated to run on that
node).
UNREACHABLE black The state of the node is unknown. No
information is available. Once information is
available the state of th e node is eithe r Down or
Up.
A node is considered Unreachable when the
node itself is unreachable or at least one of its
components are unreachable and all other
components are Up (as indicated by an SRP
state of Running).
DOWN red At least one of the group’s components is
Down, as indicated by an SRP state of anything
other than RUNNING.
Indicates that one or more component -specific
processes have either been interrup ted or are
not yet fully operational for at least one group
member.
UP green All of the group’s components are Up, as
indicated by an SRP state of RUNNING.
Indicates that all component -specific
processes for all member components are fully
operational.
Page 60 Nortel Networks Confidential # P0988094 Ver: 1.0
Page 85

Summary of Tree Object States (Sheet 4 of 4)
Object State Color Description
UNREACHABLE black At least one of the nodes or components in the
group are Unreachable and all its reachable
components are Up, as indicated by an SRP
state of RUNNING.
DOWN red At least one of the domain’s components is
Down, as indicated by an SRP state of anything
other than RUNNING.
Indicates that one or more component -specific
processes have either been interrupted or are
not yet fully operational for at least one domain
member.
UP green All of the domain’s components 3are Up, as
indicated by an SRP state of RUNNING.
Indicates that all component -specific
processes for all component members are fully
operational.
Introduction to PeriView
UNREACHABLE black At least one of the nodes or components in the
domain is Unreachable and all its reachable
components are Up, as indicated by an SRP
state of RUNNING.
For additional information about:
• Domains, see Expand the Domain on page 119.
• Groups, see Expand by Group on page 122.
• Nodes, see Expand by Node on page 124.
• Components, see Expand by Component on page 127.
# P0988094 Ver: 1.0 Nortel Networks Confidential Page 61
Page 86

PeriView Reference Manual
PeriView Topology
PeriView topology refers to the graphic representation of the network that displays in
the workspace of the PeriView Launcher, Applicati on Ma nag er, and Activity Monitor.
The lines by which tree objects are connected represent logical relationships between
network entities. These lines do not represent network hardware links.
In any topology, the hierarchical tree structure depicts network entities and their
logical relationsh ips. The domai n always displa ys at the apex of the tr ee. Component s
always display at the same hierarchical level. All tree objects display their state with
the colors green, red, or black.
The following topology view depicts a network represented by a domain named
PERI. All tree objects are green, which means that al l network entities are Up wi th
respect to SRP. The relationships in this topology are described following the
illustration.
OSCAR component
VPS component
VPS component with purple triangle indicating VAS support
VAS co mponent
TMSCOMM component
For information about configuring the network, see Sample
Installation/Configu ration Proc edure on page 33.
Domain
Group
Node
Page 62 Nortel Networks Confidential # P0988094 Ver: 1.0
Page 87

Introduction to PeriView
The domain PERI contains four groups. (Domains and groups are defined in the
PeriView Launcher.)
• The group GN_VO contains a VPS component (oscaris2t:2) and an OSCAR
component (oscar21:21).
• The group GN_VV1 contains a VPS component (is7501:1) and a VAS
component (grouse:1).
• The group GN_VV109 contains a VPS component (is9509:109) and a VAS
component (grouse:109).
• The group GN_all contains two n odes (tms3000 and tms1000). Each node is
an independent machine that ha s been c onfigur ed for the net work displa yed in t he
domain PERI. This group allows you to view and manipulate the netwo rk from a
node perspective.
• The node tms3000 is configured with a VPS component (tms3000:31).
• The node tms1000 is configured with a VPS component (tms1000:11)
and with a TMSCOMM component (tms1000:1).
When you launch the Application Manager or Activity Monitor, applications that are
assigned to nodes display as application objects in the tree. The VPS, MPS, and VAS
components indicate the number of applications associated with the component.
OSCAR and TMSCOMM components do not display in the Application Manager
workspace because application management functions do not occur on these
components. For information about:
• Application Manager topology, see APPMAN Topology on page 216.
• Activity Monitor topology, see Monitor Activity and Topology on page 424.
VAS is supported only on the VPS/is platform, and not on the MPS platform.
# P0988094 Ver: 1.0 Nortel Networks Confidential Page 63
Page 88

PeriView Reference Manual
Security and Data Views
Security means application ownership within the context of PeriView. Security is
intended to:
• keep one user from seeing information about any application assigned by a
different user.
• keep one user from changin g anything about an application assigned by a dif ferent
user.
In the interest of security:
• PeriView offers two Data Views (Global and Personal) in which you can display
information in the Application Manager and Activity Monitor.
• PeriView controls the privileges associated with application management.
Security, Data Views, and their respective privileges are di rectly associ ated with the
login name of the user that launches PeriView. The PeriView Launcher allows for
choosing the Data View that displays when these tools launch, if you launch them
from the PeriView Launcher. These different Data Views are visible only in the
Application Manager and Activity Monitor, not in the PeriView Launcher.
When the Application Manager and Activity Monitor are not launched from the
PeriView Launcher, the user’s default Data View determines the Data View that
displays when these tools open.
There are three categories of users (root, Global User, Non-Global User) and two
Data Views (Global and Personal).
• The Data View defaults to Global for root and Global Users.
• Only the Personal Data View is avai lable to Non-Global Users.
• Global Users and root can use the PeriView Launcher to choose the display that
presides when they launch the Application Manager and Activity Monitor from
the PeriView Launcher.
For information about:
• Launching PeriView on a Sola ri s n ode, see Solaris Login to Pe ri View on page 79.
• Launching PeriView on an NT node, see NT Login to PeriView on page 81.
• Security and Data Views in the:
• PeriView Launcher , see Security on page 144.
• Application Manager, see Security on page 220.
• Activity Monitor, see Security on page 437.
Page 64 Nortel Networks Confidential # P0988094 Ver: 1.0
Page 89

The PeriView Workspace
The network is represe nted in t he PeriView wor kspace by e ither a s ingle obj ect or by a
series of objects, which are organized in a hierarchical tree structure. You can
manipulate these objec ts to dire ct and view ne twork opera tions by la unching tools and
initiating activi ties withi n each tool. Use the hori zontal and vertical scroll bar s to view
the workspace area and to divide the window into segments. Elements of the
workspace include the Tree, Window Pane, and Scroll bar menus.
Introduction to PeriView
Window Pane
Tree
Vertical
Scrollbar
Menu
Horizontal
Scrollbar
Menu
The Tree
The tree represents the network as either a single object (domain) or a hierarchy of
objects (domain, group, node, component, application). Each object is considered to
be a network entity. You can display context sensitive menus directly from each
object. These menus al low acce ss only to options th at are val id for th e objec t when the
menu is displayed.
In this example, a context sensitive menu displays from
a domain object. Sub-menus displa y from all items with
an arrow al ongside their item name.
# P0988094 Ver: 1.0 Nortel Networks Confidential Page 65
Page 90

PeriView Reference Manual
The Window Pane
The Window Pane is the area of the workspace that is free of tree objects. You can
access the menu directly from the window pane. These menus display the same set of
options that are available at the Menu Buttons above the workspace.
In this example, a context sensitive menu displays from
the Launcher Window Pane area. Use this menu to
display the View, Launch, and Properties menus and to
simultaneously unselect selected tree objects.
Custom Configuration
PeriView allows for custom configuration of it graphical tools. This information is
saved to a configuration file and is associated with the user who made the changes.
These files reside in a user’s $HOME directory.
If you defined a default configuration for a tool, when you launch the tool, it opens
with the properties specified in the configuration file associated with your logon
name. When you save a default configuration, the newly defined set of parameters
overwrite the previous set of default parameters (if a ny).
These configuration files are created when a user specifies custom properties for a
tool. These files only exist when you define custom properties. The names of the
custom configuration files are identified on the following table.
PeriView Tool Configuration File Name
PeriView Launcher .periviewrc
Application Manager .appmanrc
Activity Monitor .monitorrc
Alarm Viewer .alrmviewrc
VSH Tool .vshtoolrc
In addition to these files, you can customize the nodes that display in a user defined
domain by editing the .xtrahostsrc file. See Nodes in the Network on page 52.
Page 66 Nortel Networks Confidential # P0988094 Ver: 1.0
Page 91

Introduction to PeriView
Optimize GUI Display Option
The PeriView Graphical User Interface (GUI) can experience significant start-up
delays in large installations, where there are multiple remote nodes and many are
down simultaneously.
The extent of the delay depends on the number of nodes that are down and the
network timeout period required to elapse on each down node. The nodes configured
for a network are defined in the vpshosts file. See vpshosts File on page 19.
The delay affects the GUI display in the workspace of the PeriView Launcher, the
Application Manager, and the Activity Monitor.
You have the option to avoid some of the GUI delay during startup by setting the
Environment Variable PTL_NOT_WAIT_FOR_DISPLAY before launching
PeriView. This variable optimizes the GUI by opening the graphical workspace
window and displaying net work enti ties before al l th e infor mation as socia ted with the
network is available to the GUI.
Benefits and Consequences of Optimization
The benefit associated with setting this variable is that the GUI displays the main
windows much faster during startup. However, this benefit is accompanied by
consequences resulting from displaying the GUI before all information is available.
Examples of some of these consequences follow.
• Initially, all network entities appear as black objects because information about
their state is unavailable.
Once the information is available, tree objects reflect their states by changing
color to red or green. Unreachable tree objects remain black. See Tree Object
States on page 53.
• In the Application Mana ger, when fil ling t he l ocati ons li st wi th li nes, phones li nes
(real phone lines indicated by the Phone Line icon) can appear as administrative
phone lines (indicated by the Administrative Line icon) until initial contact with
that system has been made.
The lines are represented accurately after the component icon in the tree becomes
reachable. However, this does not prevent you from manipulating the lines (such
as starting and stopping the applications assigned to them). See Introduction to
APPMAN on page 182.
# P0988094 Ver: 1.0 Nortel Networks Confidential Page 67
Page 92

PeriView Reference Manual
• When displaying saved default snapshots, line stat us information is unknown and
you can not expand the tree by application until that information is available.
For example:
• If the saved default snapshot consisted of a domain expanded by groups,
expanded by components, expanded by applications, expanded by node, the
tree only includes expansions down to the component level.
• If you do not set this environment variable, when the GUIs start up and load
the saved snapshot automatically, information about the lines is known and it
is possible to expand the tree by application.
See Expand and Collapse the Tree on page 191.
You experience the same behavior when transferring a snapshot from the
PeriView’s workspace to a launched application. (When you are using Periview,
the snapshot sends tree data about the currently displayed tree to the launched
application.)
See Snapshot Properties on page 162.
Small installations, where (typically) there are fewer remote systems, do not
experience this type of delay and can avoid the consequences associated with this
option. Therefore, you probably only want to consider this option if your site is
experiencing significant GUI startup delays.
Page 68 Nortel Networks Confidential # P0988094 Ver: 1.0
Page 93

Introduction to PeriView
Set Display Option to Optimize GUI
You can optimize the GUI by setting the Environment Variable
PTL_NOT_WAIT_FOR_DISPLAY before launching PeriView.
• If this varia ble is set, the G UIs display in the workspace of PeriView, the
Application Manager, and the Activity Monitor without waiting for all
information that it they are capable of displaying.
• If this varia ble is not set, P eriView’s performs with typical GUI behavior.
You can set this variable in a system configuration file or at a command line.
To set this variable a Solaris command line:
• Launch a Solaris Command tool window and type the following at the command
line.
setenv PTL_NOT_WAIT_FOR_DISPLAY yes
• Launch PeriView from the following command line by typing: periview
To revert to a non-optimized GUI display: exit PeriView; type the followin g
command; launch PeriView.
unsetenv PTL_NOT_WAIT_FOR_DISPLAY
To set this variable at an NT command line:
• Launch an NT MS-DOS window and type the following at the command line.
set PTL_NOT_WAIT_FOR_DISPLAY=yes
• Launch PeriView from the following command line by typing: periview
To revert to a non-optimized GUI display: exit PeriView; type the followin g
command; launch PeriView.
set PTL_NOT_WAIT_FOR_DISPLAY=
# P0988094 Ver: 1.0 Nortel Networks Confidential Page 69
Page 94

PeriView Reference Manual
To set this variable from a Solaris system configuration fi le:
• Edit either the .cshrc file or the .shrc file (depending on the shell you are
using) to add the following line and save the file:
setenv PTL_NOT_WAIT_FOR_DISPLAY yes
• To effect the change, source the file you edited by do one of the following:
• Reload the Openwindows desktop by typing:
openwin
• Source the file by typing one of the following, depending on the file you
edited:
source .cshrc
source .shrc
To revert to a non-optimized GUI display: exit Per i View; remove the comma nd from
the file and save the fi le; open a new Command Tool window; launch PeriView in the
new window.
To set this variable from an NT System Variable Window:
• Follow the path Start, Settings, Control Panel, System, Environment, System
Variable.
• Enter the Variable: PTL_NOT_WAIT_FOR_DISPLAY
• Enter any value. For example, enter abc.
• Select Set. You should now see the PTL_NOT_WAIT_FOR_DISPLAY variable
defined in the System Variable list.
• Select Apply, then select OK.
T o revert t o a non-optimize d GUI display: exi t PeriView; remove the variable f rom the
System Variable list; launch PeriView.
Page 70 Nortel Networks Confidential # P0988094 Ver: 1.0
Page 95

Introduction to PeriView
Scrollbar Menus
Use the Scrollbar menus to control the movement of the tree in the workspace and to
split and rejo in the wor kspace . The spli t scre en featu re is of partic ular adv antage when
the expanded tree is too large to view in a single workspace window. You can display
tree objects simultaneously, even when they reside on opposite ends of a tree that is
too large to be displayed in its entirety.
T o sp li t or j oin the work space, p ositi on the c ursor on th e scr oll ba r, click the <R
IGHT>
mouse button to display the Scrollbar menu, and select and action. The horizontal
Scrollbar menu controls the left–right movement of the tree in the workspace and
splits the screen into vertical segments. The vertical Scrollbar menu controls the up–
down movement of the tree in the workspace and splits the screen into horizontal
segments.
The vertical Scrollbar menu controls up-down tree movement and enables the
horizontal spliting and joining of the screen.
The horizontal
Scrollbar menu
controls left-right tree
movement and
enables the vertical
splitting and joining of
the screen.
# P0988094 Ver: 1.0 Nortel Networks Confidential Page 71
Page 96

PeriView Reference Manual
Screen Tips
Messages display in the lower left corner of the screen each time you position the
pointer (cursor) is over a tool or tree control.
Tool Tips
When you position t he cursor over a tool o n t he tool bar, the name of th e to ol displays
in the lower left corner of the window. In this example, the cursor is over the
Application Manager tool on the tool bar.
Tree Tips
When you position the cursor over a tree control, the name of the control displays in
the lower left corner of the window. In this example, the cursor is ov er the
Componen ts tree contro l.
Page 72 Nortel Networks Confidential # P0988094 Ver: 1.0
Page 97

Scrolling Lists
Introduction to PeriView
Throughout PeriView, lists of items display in windows equipped with scroll bars,
which allow all entries to be viewed. At each of these windows, a Scrolling List and
Scrollbar menus are avai lable to assis t with the di splay an d select io n of items li sted in
the window.
Scrolling List Menu
Although you can use the scroll bar to view al l items, the Scrol l List menu prov ides an
alternate method for locating and selectin g it ems. Menu options vary among scrolling
lists because the menu is context sensitive.
To display a Scrolling List menu:
• Press and hold the <R
IGHT> mouse button in a window that is equipped with a
scroll bar.
• Scroll until your choice is highlighted and release the mouse button.
This scrolling list identifies nodes that
are available for selection. You can use
the scroll bar or the Scrolling List menu
to locate and select nodes.
Scrollbar Menu
Although you can use the scroll bar to view all items, the Scrollbar menu provides an
alternate method of positioning a range of the listed items in the window. Unlike the
Scrolling List menu (which you use to locate and select items), the Scrollbar menu
only enables you to m ove t he lis t with in the wi ndow. When t he scro ll bar displ ays in a
workspace window (as opposed to a text window) the Split View option is also
available (page 73).
To display a Scrollbar menu:
• Press and hold the <R
IGHT> mouse button on the sc roll bar parallel to the loca tion
of a specific node that is the reference point of the move.
• Scroll until your choice is highlighted and release the mouse button. Movement
occurs relative to the position where the menu was displayed.
This scrolling list identifie s nodes that
are available for selection. You can
use the scroll bars or Scroll bar menu
to locate and select nodes.
# P0988094 Ver: 1.0 Nortel Networks Confidential Page 73
Page 98

PeriView Reference Manual
System Status, Error and Warning Messages
Messages that indicate the status of PeriView activity display in the lower corners of
the PeriView screen. Some examples of these messages are labeled STATE,
WARNING, and ERROR.
• The STATE mes sage is visi ble during a c hange in stat e
and indicates the current status of PeriView activity.
• WARNING and ERROR messages displays in direct response to an action, when a
problem is associated with that action.
Additionally, the Solari s st op wat ch cursor displays in the Per iView window (in place
of the pointer) when you initiate an activity. The stop watch cursor remains in view
until the process is complete. When the stop watch cursor is restored to a pointer
cursor, a different activity can be initiated.
Page 74 Nortel Networks Confidential # P0988094 Ver: 1.0
Page 99

How to Execute PeriView Operations
You execu te Peri View oper ation s b y physi call y manip ula ting GUI obj ects or se le cting
options from a menu. These activities are described in the following tables.
Using GUI Objects
GUI objects are represented by icons in the graphical environment.
GUI Elements Description
Icons GUI icons are symbols that represent:
• Tools: Application Manager, Activity Monitor, Alarm Viewer,
• Objects: Network entities (domain, group, node, component,
• Tree Controls: Expand by Group, Component, and
Single Object Selection GUI method of selecting an object to manipulate. Point to the
object and left-click the mouse. A selection box displays around
the object.
Introduction to PeriView
VSH Tool, File Transfer, Task Scheduler, SPIN, PeriReporter
Tools, PeriStudio, and PeriProducer and the subsets of
Application Manager and Activity Monitor Tools.
and application).
Application; and Collapse.
Multiple Object Selection GUI method of selecting more than one object to manipulate
simultaneously. Drag the selection frame across the workspace
until it encompass es all the obj ects to be selec ted. A select ion bo x
displays around the objects. Once multiple objects are selected,
operations (whether initiated via drag-and-drop methodology or
tree object menu selection) are applicable to all selected objects.
GUI Menu Selection GUI method of displaying a context sensitive menu from a tree
object. Select the object and right-click the mouse to display the
menu.
* Drag-and-drop GUI method of initiating an operation by selectin g and moving
either a single object or multiple objects onto a GUI Activity Tool
(Expand and Collapse or the subset of Application Manager and
Activity Monitor Tools). Move the mouse pointer, along with the
selected t ree objects, over the drop target.
Expansion & Collapse GUI method of manipulating the hierarchical structure of the
network. Once selected, tree objects can be expanded or
collapsed displaying alternative network views. Expansion and
collapse of either a single object or multiple objects can be
accomplished either by drag-and-drop methodology or by tree
object menu selection.
* Tool Selection via Mouse Launch PeriVIew tools by double left clicking the mouse on the
GUI icon that represents a tool on either the Launcher Application
Manager or Activity Monitor Tool Bars.
* When an object is selected and a tool is launched from the tool bar using drag-and-drop
methodology, the tool launches with information transferred from the selected object (when
applicable). Alternatively, when a tool is launched by double clicking the tool icon, no tree
information is transferred to the tool.
# P0988094 Ver: 1.0 Nortel Networks Confidential Page 75
Page 100

PeriView Reference Manual
Using Menus
You can display menus from tree objects, menu buttons, or the window pane and
select options from drop-down lists of alternative choices. Further, some menu items
display sub-menus listing a subset of choices. You can identify menu items that
display sub-menus by an arrow following the option name.
When items are inapplicable to the cu rrent operation, the y appear grayed on the men u
and are unavailable for selection. You display menus and select options with the
mouse from Menu Buttons, Tree Objects, Scrolling Windows, or the Window Pane.
Mouse actions are described in the following table.
To Do
Display a menu. • Point to the menu button, tree object, scrolling list, or
Select an option. • Point to a menu option.
window pane.
• Right-click the mouse.
• Left-click the mouse.
Display the me nu and select
an option.
Select the first option on a
drop-down list.
Display a sub-menu. • Point to the right arrow (if any) alongside a menu option
• Point to the menu button, tree object, scrolling list, or
window pane.
• Right-click the mouse without releasing the button.
• Scroll to select the preferred option.
• Release the mouse button.
• Point to the menu button or tree object.
• Left-click the mouse.
name to display its sub-menu.
• Select an option (as described above) or display an
additional sub-menu (if applicable).
The following menus were displayed from a menu button and a tree object. A
sub-menu displays for each option indicated by a right arrow.
Page 76 Nortel Networks Confidential # P0988094 Ver: 1.0
 Loading...