

Page 1

PeriReporter User’s Guide
(Software Release 1.0)
Publication#:
Document Release:
Release Date:
P0988093
Rev. 1.5
April 10, 2002
Page 2

PeriReporter User’s Guide
Important Notice
Nortel Networks reserves the right to make cha nges in the content s of this publ icat ion
including functions and specifications identified herein without notice.
The material contained in this document is intended for Nortel Networks personnel
and licensed customers with a non-disclosure agreement or standard contract.
In the absence of a written agreement to the contrary, Nortel Networks assumes no
liability for applications assistance, customer’s product/application/concepts, or
infringements of patents or copyrights of third parties arising from the use of systems
and architectures described herein. Nor does Nortel Networks warrant or represent
that any license, either expressed or implied, is granted under any patent right,
copyright, or other combina tion of technolo gy, archit ecture, or software as might be or
is already in use.
This document should not be reproduced, disseminated, or otherwise disclosed
without prior written consent from an officer of Nortel Networks.
This document has been copyrighted by Nortel Networks and may not be duplicated.
Copyright © 1995 - 2002 Nortel Networks, All Rights Reserved
Page 3

Table of Contents
Table of Contents
Preface . . . . . . . . . . . . . . . . . . . . . . . . . . . . . . . . . . . . . . . . . . . vii
Scope . . . . . . . . . . . . . . . . . . . . . . . . . . . . . . . . . . . . . . . . . . . . . viii
Intended Audience . . . . . . . . . . . . . . . . . . . . . . . . . . . . . . . . . . . viii
How to Use This Manual . . . . . . . . . . . . . . . . . . . . . . . . . . . . . . viii
Organization of this Manual . . . . . . . . . . . . . . . . . . . . . . . . . . . . ix
Conventions Used in This Manual . . . . . . . . . . . . . . . . . . . . . . . . . x
UNIX and Windows NT Conventions . . . . . . . . . . . . . . . . . . . . . xi
Manual (Man) Pages . . . . . . . . . . . . . . . . . . . . . . . . . . . . . . . . . xii
Reference Material . . . . . . . . . . . . . . . . . . . . . . . . . . . . . . . . . . . xiii
Introduction . . . . . . . . . . . . . . . . . . . . . . . . . . . . . . . . . . . . . . 17
What is PeriReporter? . . . . . . . . . . . . . . . . . . . . . . . . . . . . . . . . . 18
Three Components of PeriReporter . . . . . . . . . . . . . . . . . . . . . . . 19
PeriConsolidator . . . . . . . . . . . . . . . . . . . . . . . . . . . . . . . . . . 19
PeriDefiner . . . . . . . . . . . . . . . . . . . . . . . . . . . . . . . . . . . . . . 19
PeriReporter . . . . . . . . . . . . . . . . . . . . . . . . . . . . . . . . . . . . . 19
Launch PeriReporter . . . . . . . . . . . . . . . . . . . . . . . . . . . . . . . . . . 20
Schedule A Report . . . . . . . . . . . . . . . . . . . . . . . . . . . . . . . . 21
Sharing Data Between UNIX and NT . . . . . . . . . . . . . . . . . . . . . 24
Time Zones . . . . . . . . . . . . . . . . . . . . . . . . . . . . . . . . . . . . . . . . . 25
Statistical Maintenance . . . . . . . . . . . . . . . . . . . . . . . . . . . . . 27
Collection and Maintenance of Statistical Data . . . . . . . . . . . . . . 28
Single vs. Multi-node Environments . . . . . . . . . . . . . . . . . . 28
Defining Stat Events in a Single Node Environment . . . 29
Application Stat Events in a Multi-Node Environment . 30
PeriReporter and the VPS/is Network . . . . . . . . . . . . . . . . . 32
System and Application Statistics. . . . . . . . . . . . . . . . . . . . . 34
System Statistics . . . . . . . . . . . . . . . . . . . . . . . . . . . . . . . 34
Application Statistics . . . . . . . . . . . . . . . . . . . . . . . . . . . 38
PeriProducer and VRAM Applications . . . . . . . . . . . . . 40
Gathering Application Statistics (Block Execution Statistics)41
Defining Application (Block Execution) Statistics . . . . 41
Determining Blocks Associated With a Counter . . . . . . 42
Passing Statistics Folders to a Linked Application . . . . . 43
PeriConsolidator . . . . . . . . . . . . . . . . . . . . . . . . . . . . . . . . . . . 45
Purpose . . . . . . . . . . . . . . . . . . . . . . . . . . . . . . . . . . . . . . . . . . . . . 46
Configuration . . . . . . . . . . . . . . . . . . . . . . . . . . . . . . . . . . . . . . . . 47
Data Maintenance . . . . . . . . . . . . . . . . . . . . . . . . . . . . . . . . . 48
Parameters. . . . . . . . . . . . . . . . . . . . . . . . . . . . . . . . . . . . . . . 49
Logging. . . . . . . . . . . . . . . . . . . . . . . . . . . . . . . . . . . . . . . . . 50
# P0988093 Nortel Networks Confidential Page iii
Page 4

PeriReporter User’s Guide
Command Line Options . . . . . . . . . . . . . . . . . . . . . . . . . . . . . . . . 51
PeriDefiner . . . . . . . . . . . . . . . . . . . . . . . . . . . . . . . . . . . . . . . 53
Purpose . . . . . . . . . . . . . . . . . . . . . . . . . . . . . . . . . . . . . . . . . . . . . 54
PeriDefiner Tool Bar . . . . . . . . . . . . . . . . . . . . . . . . . . . . . . . . . . 56
Open a Report Definition . . . . . . . . . . . . . . . . . . . . . . . . . . . . . . . 57
Defining a Report . . . . . . . . . . . . . . . . . . . . . . . . . . . . . . . . . . . . . 58
Options . . . . . . . . . . . . . . . . . . . . . . . . . . . . . . . . . . . . . . . . . . . . . 70
pchistory.log . . . . . . . . . . . . . . . . . . . . . . . . . . . . . 50
Launch PeriDefiner. . . . . . . . . . . . . . . . . . . . . . . . . . . . . . . . 54
Launching PeriDefiner through PeriView . . . . . . . . . . . 54
Launch PeriDefiner through PeriReporter . . . . . . . . . . . 55
Save the Report Definition . . . . . . . . . . . . . . . . . . . . . . . . . . 58
Update the Report Settings. . . . . . . . . . . . . . . . . . . . . . . . . . 59
Lines for Report Title . . . . . . . . . . . . . . . . . . . . . . . . . . . 59
Report Title . . . . . . . . . . . . . . . . . . . . . . . . . . . . . . . . . . . 59
Column Heading Rows . . . . . . . . . . . . . . . . . . . . . . . . . . 60
Rows per Page . . . . . . . . . . . . . . . . . . . . . . . . . . . . . . . . 60
Rows for Subtotals . . . . . . . . . . . . . . . . . . . . . . . . . . . . . 60
Rows for Totals . . . . . . . . . . . . . . . . . . . . . . . . . . . . . . . . 60
Report Mode . . . . . . . . . . . . . . . . . . . . . . . . . . . . . . . . . . 60
Default Detail Level . . . . . . . . . . . . . . . . . . . . . . . . . . . . 60
Default Start/End Time . . . . . . . . . . . . . . . . . . . . . . . . . . 60
Define Column Formulas and Mappings . . . . . . . . . . . . . . . 61
Column Formulas . . . . . . . . . . . . . . . . . . . . . . . . . . . . . . 61
Data Mapping . . . . . . . . . . . . . . . . . . . . . . . . . . . . . . . . . 62
Update Individual Columns and Cells . . . . . . . . . . . . . . . . . 65
Display Filters . . . . . . . . . . . . . . . . . . . . . . . . . . . . . . . . . 65
Column Appearance . . . . . . . . . . . . . . . . . . . . . . . . . . . . 67
Define Subtotals . . . . . . . . . . . . . . . . . . . . . . . . . . . . . . . . . . 69
Define Totals. . . . . . . . . . . . . . . . . . . . . . . . . . . . . . . . . . . . . 69
Column Mappings . . . . . . . . . . . . . . . . . . . . . . . . . . . . . . 70
Column Filters . . . . . . . . . . . . . . . . . . . . . . . . . . . . . . . . 70
Global Settings . . . . . . . . . . . . . . . . . . . . . . . . . . . . . . . . 72
Screen Colors . . . . . . . . . . . . . . . . . . . . . . . . . . . . . . . . . 73
Fill/Empty Report . . . . . . . . . . . . . . . . . . . . . . . . . . . . . . 74
Print the Report Definition . . . . . . . . . . . . . . . . . . . . . . . . . . 75
Command Line Options . . . . . . . . . . . . . . . . . . . . . . . . . . . . 78
Help Menu . . . . . . . . . . . . . . . . . . . . . . . . . . . . . . . . . . . . . . 78
PeriReporter . . . . . . . . . . . . . . . . . . . . . . . . . . . . . . . . . . . . . . 79
Purpose . . . . . . . . . . . . . . . . . . . . . . . . . . . . . . . . . . . . . . . . . . . . . 80
Launch PeriReporter. . . . . . . . . . . . . . . . . . . . . . . . . . . . . . . 80
Launching PeriReporter through PeriView . . . . . . . . . . 80
PeriReporter Tool Bar . . . . . . . . . . . . . . . . . . . . . . . . . . . . . . . . . 81
Page iv Nortel Networks Confidential # P0988093
Page 5

Table of Contents
Generating a Report . . . . . . . . . . . . . . . . . . . . . . . . . . . . . . . . . . . 82
Open a Report Definition . . . . . . . . . . . . . . . . . . . . . . . . . . . 82
Select a Report Scope . . . . . . . . . . . . . . . . . . . . . . . . . . . . . . 84
Start Date and End Date . . . . . . . . . . . . . . . . . . . . . . . . . 84
Start Time and End Time . . . . . . . . . . . . . . . . . . . . . . . . 85
Override Column VPS Numbers . . . . . . . . . . . . . . . . . . 85
VPS Range . . . . . . . . . . . . . . . . . . . . . . . . . . . . . . . . . . . 86
Detail Level . . . . . . . . . . . . . . . . . . . . . . . . . . . . . . . . . . . 86
List Files in Range . . . . . . . . . . . . . . . . . . . . . . . . . . . . . 86
Generate the Report . . . . . . . . . . . . . . . . . . . . . . . . . . . . . . . 86
Graphs . . . . . . . . . . . . . . . . . . . . . . . . . . . . . . . . . . . . . . . . . . . . . 87
Graph Type . . . . . . . . . . . . . . . . . . . . . . . . . . . . . . . . . . . . . . 88
Plot Graph . . . . . . . . . . . . . . . . . . . . . . . . . . . . . . . . . . . . 88
Bar Graph . . . . . . . . . . . . . . . . . . . . . . . . . . . . . . . . . . . . 89
Area Graph . . . . . . . . . . . . . . . . . . . . . . . . . . . . . . . . . . . 90
Candle Graph . . . . . . . . . . . . . . . . . . . . . . . . . . . . . . . . . 91
Hilo Graph . . . . . . . . . . . . . . . . . . . . . . . . . . . . . . . . . . . 92
Pie Graph . . . . . . . . . . . . . . . . . . . . . . . . . . . . . . . . . . . . 93
Scatter Graph . . . . . . . . . . . . . . . . . . . . . . . . . . . . . . . . . 94
Stacking Graph . . . . . . . . . . . . . . . . . . . . . . . . . . . . . . . . 95
Grid Lines . . . . . . . . . . . . . . . . . . . . . . . . . . . . . . . . . . . . 96
Columns Available . . . . . . . . . . . . . . . . . . . . . . . . . . . . . 96
Titles Available . . . . . . . . . . . . . . . . . . . . . . . . . . . . . . . . 96
Selected Columns . . . . . . . . . . . . . . . . . . . . . . . . . . . . . . 96
Options . . . . . . . . . . . . . . . . . . . . . . . . . . . . . . . . . . . . . . . . . . . . . 97
Global Settings . . . . . . . . . . . . . . . . . . . . . . . . . . . . . . . . 97
Screen Colors . . . . . . . . . . . . . . . . . . . . . . . . . . . . . . . . . 98
Preview a Report . . . . . . . . . . . . . . . . . . . . . . . . . . . . . . . 99
Export/Import . . . . . . . . . . . . . . . . . . . . . . . . . . . . . . . . 100
Print a Generated Report. . . . . . . . . . . . . . . . . . . . . . . . . . . 101
Other Functions. . . . . . . . . . . . . . . . . . . . . . . . . . . . . . . . . . 104
Command Line Options . . . . . . . . . . . . . . . . . . . . . . . . . . . 104
Help Menu . . . . . . . . . . . . . . . . . . . . . . . . . . . . . . . . . . . . . 105
Step-by-Step
Sample Report . . . . . . . . . . . . . . . . . . . . . . . . . . . . . . . . . . . 107
Step-by-Step Sample Report . . . . . . . . . . . . . . . . . . . . . . . . . . . 108
Index . . . . . . . . . . . . . . . . . . . . . . . . . . . . . . . . . . . . . . . . . . . 119
# P0988093 Nortel Networks Confidential Page v
Page 6

PeriReporter User’s Guide
This page has been intentionally left blank.
Page vi Nortel Networks Confidential # P0988093
Page 7

Preface
Page 8

PeriReporter User’s Guide
Scope
The PeriReporter User’s Guide provides information for the use of the PeriReporter
tool. It gives step-by-step instructions on gathering and displaying data from the
Nortel Networks Media Processing Series system.
In addition to this document, the PeriView Reference Manual #9090722(I) may be
particularly helpf ul when working with PeriReporter. It descr ibe s how to wor k within
PeriView’s Graphical User Interface (GUI) and individually documents each of
PeriView’s tools.
Intended Audience
This document is targeted for any PeriView user. That is, any person responsible for
using PeriView to interact with the Nortel Networks Media Processing Server Series
could use this information. This guide assumes that PeriView users have completed a
Periphonics training program conducted as part of the initial system installation.
How to Use This Manual
This manual uses many standard terms relating to computer system and software
application functions. However, it contains some terminology that can only be
explained in the context of the Nortel Networks Media Processing Server Series
system. Refer to the Glossary of MPS Terminology publication # 9090788(I) for
definitions of these specific terms.
Initially, you should re ad this manual at least once, fr om sta rt to finish. Later, you can
use the Table of Contents to locate topics of interest for reference and review.
If you are reading this document online, use the hypertext links to quickly locate
related topics. Click onc e with your mouse while pos itio ned with you r cursor over the
hypertext link. Click on any point in a Table of Contents entry to move to that topic.
Click on the page number of any Index entry to access that topic page. Use the
hyperlinks at the top and bottom of each online “page” to help you navigate the
documentation. Pass your cursor over the Nortel Globemark to display the title,
software release, publicat ion an d revision number , and rel ease date for the manual you
are using.
For additional related information, use the Reference Material link in PeriDoc. To
familiarize yourself with various specialized textual references within the manual, see
Conventions Used in This Manual on page x.
Periphonics is now part of Nortel Networks. The name Periphonics, and variations
thereof, appear i n t his manua l only where it is ref err ed to i n a product. (For examples,
a PeriProducer application, the PERImps package, the perirev command, etc.)
At certain points in this manual, MPS (Nortel Networks Media Processing Server
Series) is analogous with VPS (Voice Processing Series). This is reflected in specific
file names and directories, as well as certain software features.
Page viii Nortel Networks Confidential # P0988093
Page 9

Organization of this Manual
This manual contains separate sections that describe the features and functions of the
PeriReporter tool.
• Chapter 1: Introduction
This chapter discusses the general characteristics of the PeriReporter tool,
including function, terminology, and individual components.
• Chapter 2: Statistical Maintenance
This chapter discusses the differences between single and multi node
environments along with System and Application statistics. This chapter
further discusses the collection and storage of statistical information for the
Nortel Networks Media Processing Server Series system.
• Chapter 3: PeriConsolidator
This chapter discusses the various ways statistical data is gathered for use by
the PeriReporter tool.
• Chapter 4: PeriDefiner
This chapter discusses how reports are designed for generation at a later time.
Preface
• Chapter 5: PeriReporter
This chapter discusses how reports are generated for specific dates and times.
• Chapter 6: Step-by-Step Sample Report
This chapter contains a step-by-step construction of a sample report.
# P0988093 Nortel Networks Confidential Page ix
Page 10
PeriReporter User’s Guide
!
Conventions Used in This Manual
This manual uses different fonts and symbols to differentiate between document
elements and types of information. These conventions are summarized in the
following table.
Notation Description
Conventions Used in This Manual
Normal text
important term
system
command
file name /
directory
on-screen field
<KEY NAME>
Book Reference
cross refer ence
Normal text font is used for most of the document.
The Italics font is used to introduce new terms, to highlight
meaningful words or phrases, or to distinguish specific terms from
nearby text.
This font indicates a system command and/or its arguments. Such
keywords are to be entered exactly as shown (i.e., users are not to
fill in their own values).
This font is used for highlig hting the names of disk directories , files,
and extensions for file names. It is also used to show displays on
text-based screens (e.g., to show the contents of a file.)
This font is used for field labels, on-screen menu buttons, and
action buttons.
A term that appears within angled brackets denotes a terminal
keyboard key, a telephone keypad button, or a system mouse
button.
This font indicates the names of other publications referenced
within the document.
A cross reference or man page reference is shown on the screen
in blue. Click on the cross reference to access the referenced
location. A cross reference that refers to a section name accesses
the first page of that section. Click on the man page reference to
elicit a pop-up window displaying the subject man page.
The Note icon identifies notes, important facts, and other keys to
understanding.
The Caution icon identifies procedures or events that require
special attention. The icon indicates a warning that serious
problems may arise if the stated instructions are improperly
followed.
The flying Window icon identifies procedures or events that apply
to the Windows NT operating system only.
The Solaris icon identifies procedures or events that apply to the
Solaris operating system only.
b
a
Page x Nortel Networks Confidential # P0988093
Page 11

a. Windows NT and the flying Window logo are either trademarks or registered
trademarks of the Microsoft Corp orat ion .
b. Solaris is a trademark or registered trademark of Sun Microsystems, Inc. in the
United States and other countries.
Solaris and Windows NT Conventions
This manual depicts examples (command line syntax, configuration files, and screen
shots) in Solaris format. In certain instances Windows NT specific commands,
procedures, or screen shots are shown where required. The following table lists
examples of general operating system conventions to keep in mind when using this
manual with either the Solaris or NT operating system.
Solaris Windows NT
Environment $VPSHOME %VPSHOME%
Paths $VPSHOME/common/etc %VPSHOME%\common\etc
Preface
Command <command> & start /b <command>
# P0988093 Nortel Networks Confidential Page xi
Page 12

PeriReporter User’s Guide
Trademark Conventions
The following trademark information is presented here and applies throughout for
third party products discussed within this manual. Trademarking information is not
repeated hereafter.
Solaris is a tr adema rk or regist ered trade mark of Su n Micro systems , Inc. in the United
States and other countries.
Microsoft, Windows, Windows NT, Internet Explorer, and the Flying Windows logo
are either trademarks or registered trademarks of Microsoft Corporation.
Netscape
Communications Corporation in the United States and other countries. Netscape’s
logos and Netscape product and service names are also trademarks of Netscape
Communications Corporation, which may be registered in other countries.
Manual (Man) Pages
Manual (man) pages provide access to documentation about Solaris system
commands, Nortel Networks Media Processing Server Series commands,
status/exception co nditions, and a larm information. Man pa ges may be disp layed from
any command line on Solaris systems. On NT systems, man pages may be displayed
from a DOS prompt/VSH prompt (the man page appears in a separate browser
window: the browser used depends on what browsers are installed and what browser
is set as the default). In addition, man pages are always accessible through PeriDoc’s
Search page and through hypertext links in the documents.
®
and Netscape Navigator® are registered trademarks of Netscape
To access a Man Page for:
• a Solaris system command, use the syntax man <command> (Solaris only).
• a Nortel Networks Media Processing Server Series command, use the syntax
vpsman <processname> <command>.
On Solaris systems on ly, enter man vpsman for a det ailed description of using
Nortel Networks Media Processing Server Series command manual pages.
• a Nortel Networks Media Processing Server Series alarm, use the syntax
vpsalarm <processname> <alarm#>.
On Solaris systems only, enter man vpsalarm for a detailed description of
using alarm manual pages, or man alarmintro for an overvie w of Nortel
Networks Media Processing Server Series alarms and the alarm database.
• a Nortel Networks Media Processin g Server Series statu s/exception condition, use
the syntax conman <condition>.
On Solaris systems on ly, enter man conman for a det ailed description of using
Nortel Networks Media Processing Server Series condition manual pages.
The man page scripts rely on the Windows NT registry settings for default
browser information. Older browsers do not set the registry entries required by
the man page scripts. Do not use command line man pages if you are using
browsers older than Netscape Navigator 4/Internet Explorer 4.
If you are viewing this document online, click any command highlighted in blue to
open a window displaying the manual page for that command.
Page xii Nortel Networks Confidential # P0988093
Page 13

Introduction
This chapter covers:
1
1. What is PeriRe porter?
2. Three Components of
PeriReporter
3. Launch PeriReporter
4. Schedule a Report
5. Sharing Data Between
Solaris and NT
6. Time Zones
Page 14
PeriReporter User’s Guide
What is PeriReporter?
PeriReporter is a PeriView tool, consisting of three subtools - PeriConsolidator,
PeriDefiner, and PeriReporter - each contributing to the process of collecting,
maintaining, defining, and reporting statistical data for the Nortel Networks Media
Processing Server Ser ies ne twork. Usi ng a Gra phical User I nterf ace (GUI ), it al lows a
point and click specification of multiple report formats for each statistics record type.
A report is viewed as a set of columns, with each column representing an application
or system statistics defined counter. There is a row of cells for each time interval
recorded in a statistics file.
When the PeriReporter Tools package is installed a .perireporter file is created
in the default PeriReporter home directory ($VPSHOME/PERIprpt/prpt). When
any changes are made i n the Global Sett ings, Scree n Color s, or Pr int S etup p ortio ns of
the PeriDe finer or PeriRe porter components a new .perireporter file is created
in your home directory. These changes are then saved in this new file. The original
.perireporter file will remain unchanged. Eliminating the file residing in your
home directory will reset all parameters back to their de fault settings.
For additional in f orma ti on o n the installation of t he PeriReporter Tools pa ckage, refer
to the Installing Graphical Tools on a Customer Supplied Workstation (9090504(I))
manual.
In a single node environment, each of PeriView’s tools reside on
the Nortel Networks Media Process ing Serve r Serie s node and all
tools will display on the tool bar. In a multi-node environment,
PeriV i ew tool s resi de on e ach nod e i n the Nor tel Networks Media
Processing Server Series network, but the PeriReporter tool
typically reside s only on the node t h a t is designated as the si te for
statistical collection and reporting. Therefore, in a multi-node
environment, the PeriReporter tool will only display on the tool
bar at the node(s) at which PeriReporter resides.
For additional information on single node environments, see
Defining Stat Events in a Single Node Environment on page 25.
Page 14 Nortel Networks Confidential # P0988093
Page 15

Three Components of PeriReporter
PeriReporter consists of three parts, each dependent on previous input for required
information.
PeriConsolidator
This program gathers all system and application statistics and consolidates them into
15 minute, hourly, daily, weekly, monthly and yearly file s. PeriConsol idator shou ld be
configured in the crontab and set to run once a day at a convenien t time, pre ferab ly
when the Nortel Networks Media Processing Server Series system lo ad is relatively
light.
For additional information, see the PeriConsolidator chapter.
PeriDefiner
This program is a graphical utility which is use d to set up the contents and t he display
of a specific report. After a report definition is created and saved it can be generated
using the PeriReporter tool.
Introduction
For additional information, see the PeriDefiner chapter.
PeriReporter
This program is a graphical utility which is used to generate reports. The report
(created in PeriDefiner) must be specified, along with the date and the con solidation
type, after which it can be generated and printed.
For additional information, see the PeriReporter chapter.
# P0988093 Nortel Networks Confidential Page 15
Page 16
PeriReporter User’s Guide
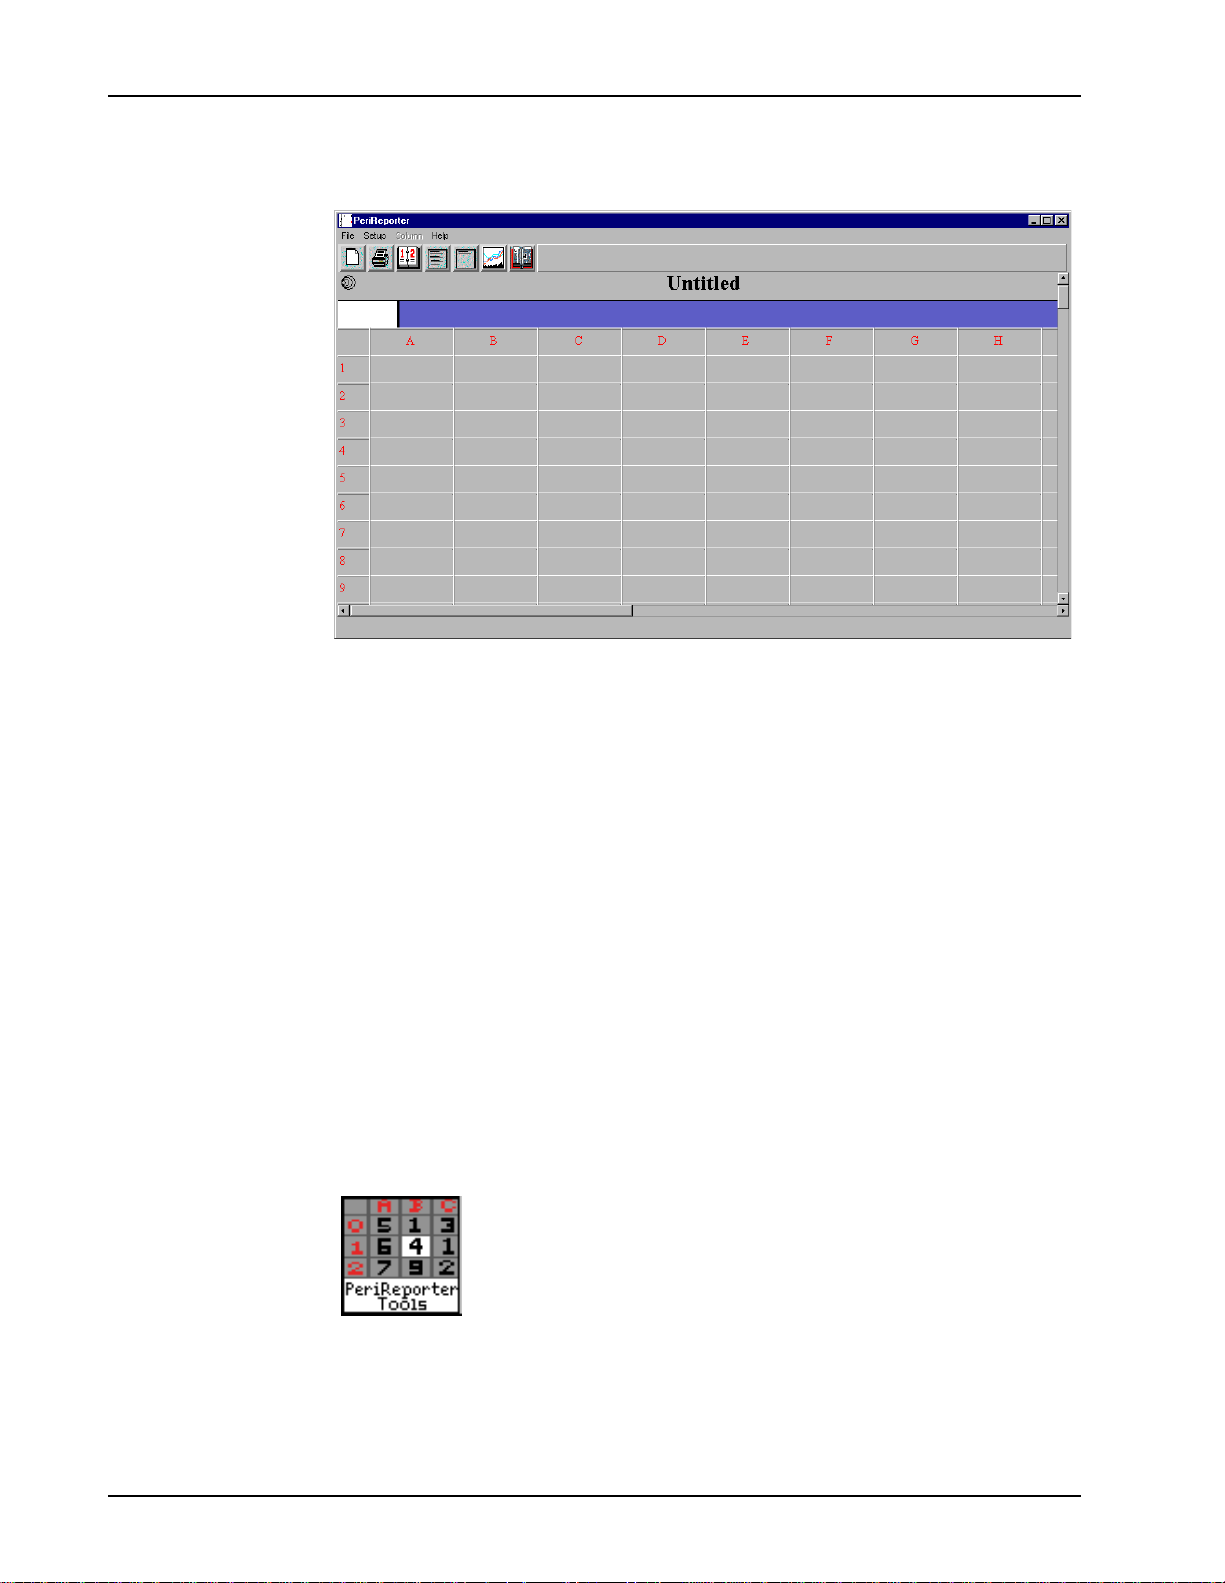
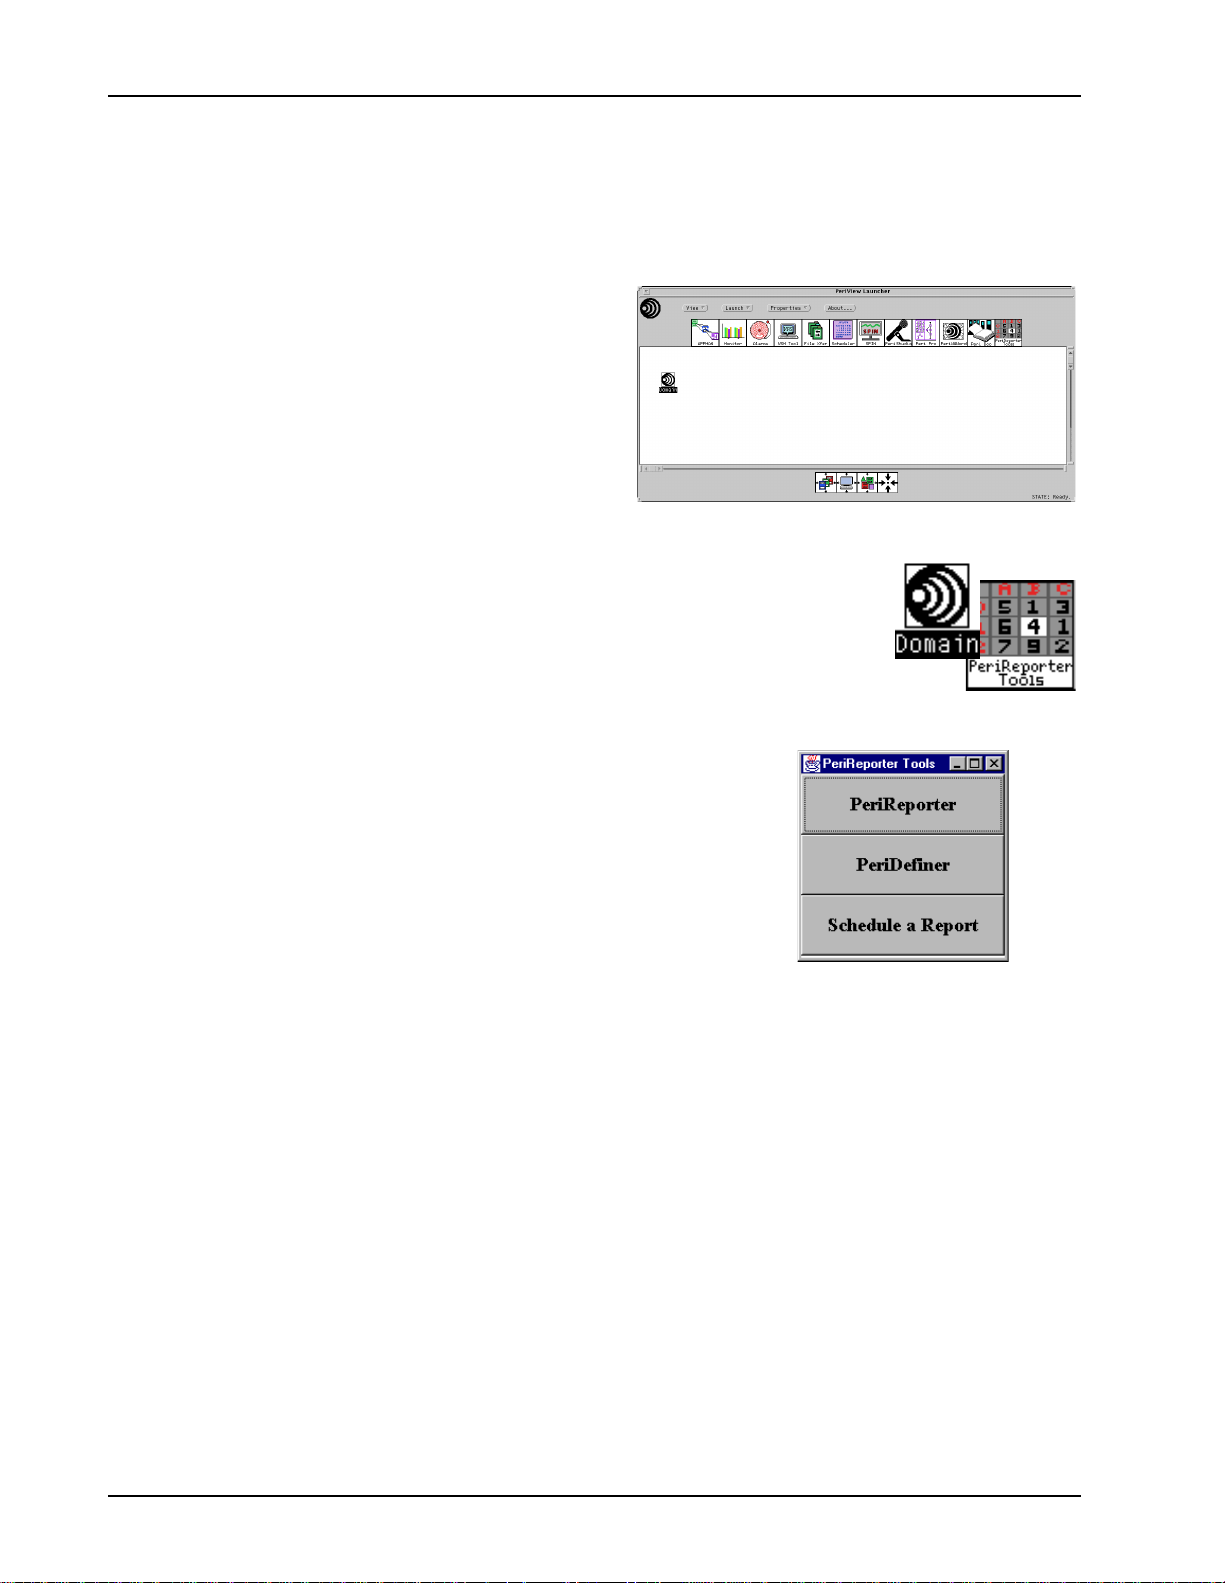
Launch PeriReporter
Launch PeriReporter by typing PeriReporter at the command line or from the
PeriView Launcher using either the Launch menu button or the tool bar.
Open PeriReporter Tools from
the menu bar
Select:
• Launch
• PeriReporter Tools
Open PeriReporter Tools from the tool bar
Either double click the PeriReporter Tools button on the
tool bar or drag a tree object onto PeriReporter Tools.
Launch a PeriReporter Tools component
Select from:
• PeriReporter
• PeriDefiner
• Schedule A Report
Page 16 Nortel Networks Confidential # P0988093
Page 17
Introduction
Schedule A Report
The Schedule A Report feature is available on Solaris only, and does not work on
PeriReporter systems running on Windows NT. All reports on Windows NT must be
manually started.
At certain points in this manual, MPS (Nortel Networks Media Processing Server
Series) is analogous with VPS (Voice Processing Series). This is reflected in specific
file names and directories, as well as certain software features.
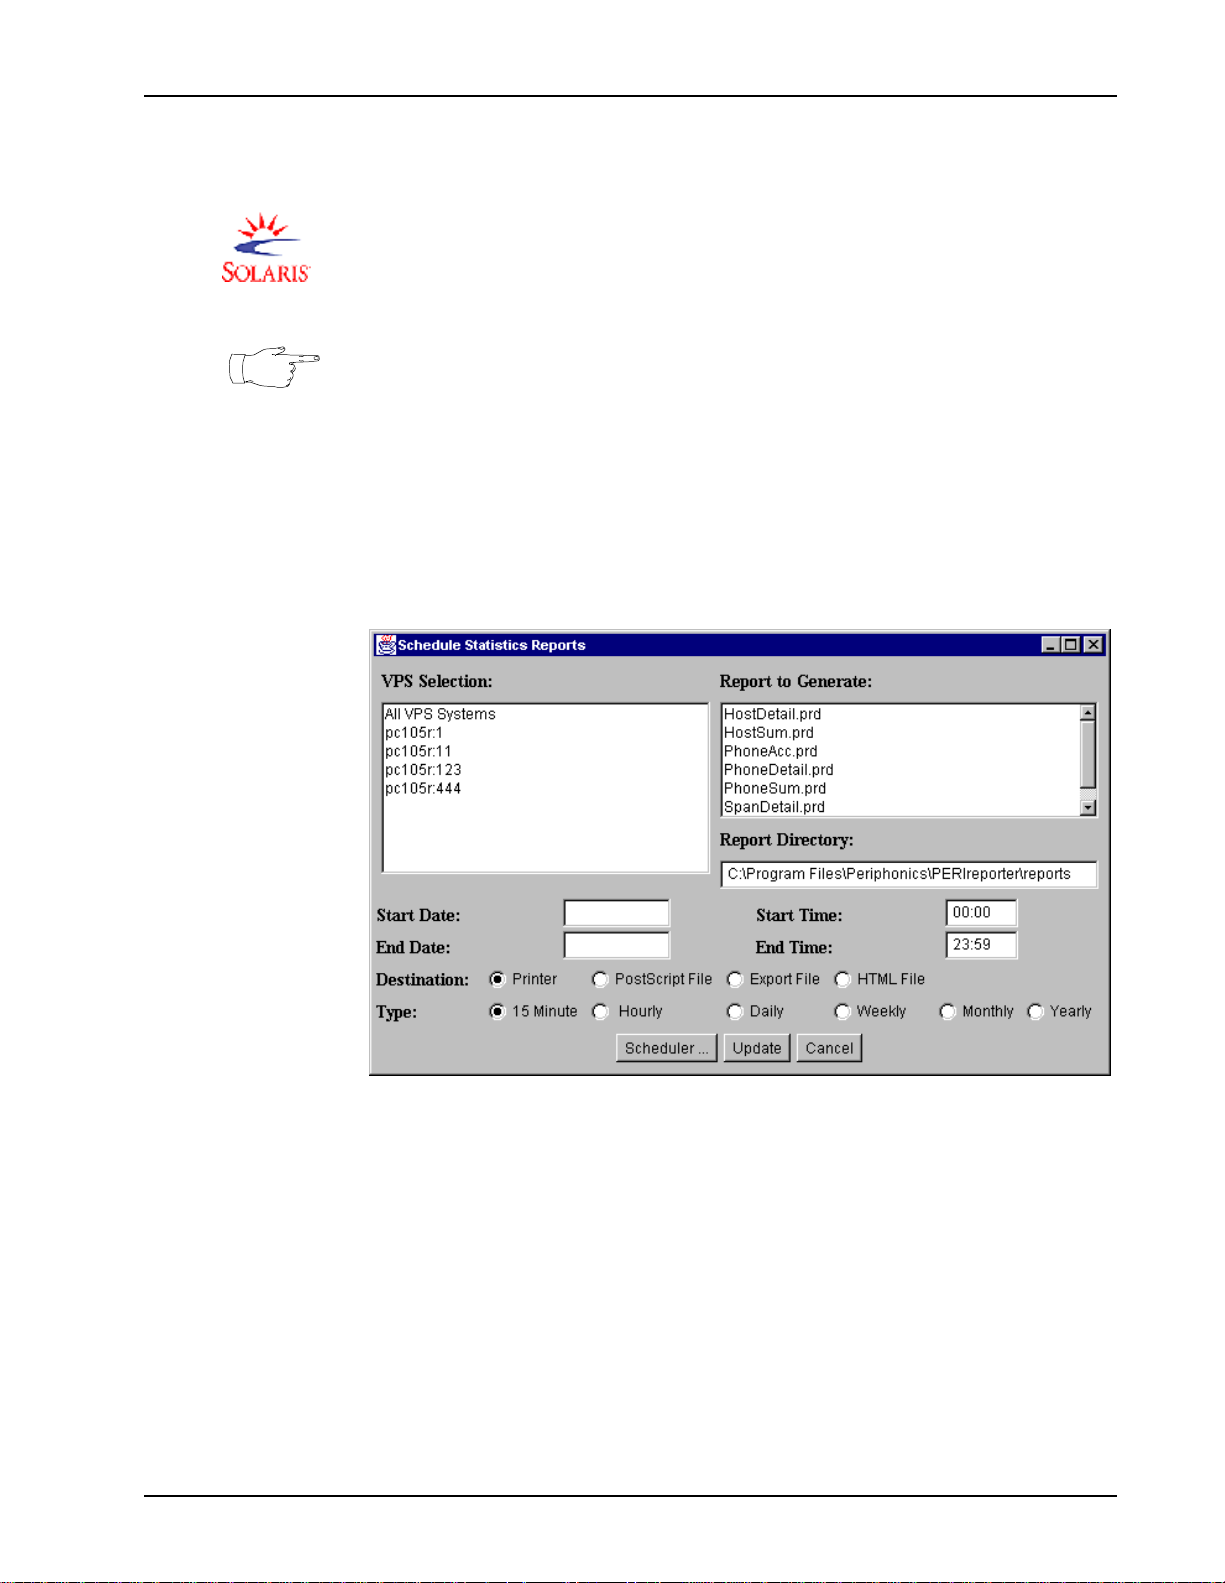
Specific reports are scheduled to be run in the Schedule Statistics Reports window.
The parameters selected here include the name of the report to be generated, the
MPS/VPS for which to rep ort da ta, th e star ting and endi ng dat e rang e, the st artin g and
ending time range, the type of report, and the report destination (printer, postscript
file, export file or HTML file). To launch the Schedule Statistics Reports window,
choose Schedule A Report from the PeriReporter Tools launch window.
# P0988093 Nortel Networks Confidential Page 17
Page 18

PeriReporter User’s Guide
To Schedule a report, define the following paramete rs:
• MPS/VPS selection
Select the MPS/VPS for which the report is to be generated. One or all
MPSs/VPSs may be sele ct ed. Alt ernatively, no MPSs/VPSs nee d be se lected here
as they may be selected in the PeriDefiner and/or PeriReporter component.
An MPS/VPS chosen in the MPS/VPS Selection window will override any
MPSs/VPSs selected in either component.
• Report to Generate
Select the r eport to generate from the scrolling list of existing reports.
• Start Date/End Date
Enter a specific a date range for which data is to be reported. The date must be
entered as MM/DD/CCYY.
If no End Date is entered then a report will be run for the Start Date only.
If no Start Date is entered then the request will be invalid.
If no Start or End Dates are entered then a report will run for the previous
specified period. (A 15 Minute, Hourly, or Daily report will run for the previous
day. A Weekly report will run for the previous week. A Monthly report will run
for the previous month. A Yearly report will run for the previous year.)
• Start Tim e/ End Time
Enter a specific time range for which data is to be reported. The time must be
entered in military time as HH:MM. The default Start Time is 00:00. The default
End time is 23:59.
Start Time and End Time are only used for 15 minute and hourly consolidated
reports.
• Report Directory
Enter the directory which contains the reports to be displayed in the Report to
Generate window.
Page 18 Nortel Networks Confidential # P0988093
Page 19

Introduction
• Destination
Enter the device on which the report will be displayed. Se lect from Printer,
PostScript, Export or HTML File.
Choosing PostScri pt File cr ea tes a postscript fi le which can be viewed or p ri nted
at a later tim e. The file format is Reportname.VPS#.MMDDYY.ps.
Choosing Export File creates a tab-separated file which can later be imported into
a spreadsheet program. The file format is Reportname.VPS#.MMDDYY.exp.
Choosing HTML File creat es a file which can la ter b e opened and viewed from a
Web browser. The file format is Reportname.VPS#.MMDDYY.html.
PeriReporter stores PostScript, Export and HTML files in the following
directories. If a fil e cannot be saved in one directory, beca use of size or permi ssion
restrictions, P eriRepo rter will a ttempt the nex t dir ectory until an acc eptabl e one i s
found.
• Directory where report being saved is found.
• Current working directory
• Home directory
• /tmp or /temp
• Type
Enter the consolida tion per iod of the report. Se lect fr om 15 Minute , Hourly, Daily,
Weekly, Monthly, or Yearly.
• Select Scheduler, Update, or Cancel
• Scheduler: Launches the Task Scheduler tool.
When the Task Scheduler is launched, report informatio n for the selected
report will automatically be entered as commands in the Task Scheduler’s
properties windows and the report will be ready for scheduling.
• Update: The Report To Gener ate fie ld will d isplay al l repor ts contai ned in th e
folder selected in the Report Directory field.
• Cancel: Exit from the Schedule Statistics Reports widow.
For additional information on the Task Scheduler tool, see the PeriView
Reference Manual #9090701(I).
# P0988093 Nortel Networks Confidential Page 19
Page 20
PeriReporter User’s Guide
Sharing Data Between Solaris and NT
If PeriReporter is going to be used to collect data from both Solaris and NT terminals
certain configuration changes have to be made to the .rhosts file.
On Solaris terminals the .rhosts file is located in the /home/peri directory . This
configuration change onl y needs to be made if dat a will be collect ed from both Solar is
and NT terminals.
On NT terminals the .rhosts file is located in the \WinNT directory. This
configuration change al ways needs to be made, r egardl ess of whether data wil l or will
not be collected from both Solaris and NT terminals.
Open the .rhosts file and add the identifications of all terminals from where
statistics a re to be collected.
The following example represents a system which has three Solaris terminals and
three NT term inals, where th e .rhosts file from the first Solaris terminal (UNIX1)
is being changed.
UNIX2_NAME peri
UNIX2_NAME SYSTEM
UNIX3_NAME peri
UNIX3_NAME SYSTEM
NT1_NAME peri
NT1_NAME SYSTEM
NT2_NAME peri
NT2_NAME SYSTEM
NT3_NAME peri
NT3_NAME SYSTEM
Seeing as how the statistics are being collected on the UNIX1 terminal from the
terminals UNIX2, UNIX3, NT1, NT2 and NT3, only those terminals need be listed.
Page 20 Nortel Networks Confidential # P0988093
Page 21
Time Zones
Introduction
In certain areas of the world, Java will not recognize the time zones set on the system
which it is instal led. I f thi s occ urs, Pe ri Reporte r wil l defa ult t o Gree nwich M ean Time
and report times will be off by several hours. It is also possible that the consolidation
will not be performed correctly.
To be sure this does not occur the .perireporter file, residing in your home
directory, must be modified. A line stating timezone= along with your three-digit
time zone identification code must be added.
For example, if your system is installed in Hong Kong, and runs on China Standard
Time, the following line would need to be added to the .perireporter file.
timezone=CTT
To determine your time zone identificatio n code, refer to the following table.
All times are listed in Standard Time. Adjust for Daylight Saving Time accordingly.
Time Zones Sheet 1 of 2
Time Zone Name Offset From GMT ID Countries/Cities/Regions
Greenwich Mean Time GMT + 0 hours GMT Africa/Casablanca
Romance Standard Time GMT + 1 hour ECT Europe/Paris
Egypt Standard Time GMT + 2 hours EET Arica/Cairo
Saudi Arabia Standard Time GMT + 3 hours EAT Asia/Riyadh
Iran Standard Time GMT + 3 1/2 hours MET Asia/Tehran
Arabian Standard Time GMT + 4 hours NET Asia/Yerevan
West Asia Standard Time GMT + 5 hours PLT Asia/Karachi
India Standard Time GMT + 5 1/2 hours IST Asia/Calcutta
Central Asia Standard Time GMT + 6 hours BST Asia/Dacca
Bangkok Standard Time GMT + 7 hours VST Asia/Bangkok
China Standard Time GMT + 8 hours CTT Asia/Shanghai
Tokyo Standard Time GMT + 9 hours JST Asia/Tokyo
Central Australia Standard
Time
GMT + 9 1/2 hours ACT Australia/Adelaide
Sydney Standard Time GMT + 10 hours AET Australia/Sydney
Central Pacific Standard Time GMT + 11 hours SST Pacific/Guadalcanal
New Zealand Standard Time GMT + 12 hours NST Pacific/Auckland
Samoa Standard Time GMT - 11 hours MIT Pacific/Apia
# P0988093 Nortel Networks Confidential Page 21
Page 22
PeriReporter User’s Guide
Time Zone Name Offset From GMT ID Countries/Cities/Regions
Hawaiian Standard Time GMT - 10 hours HST Pacific/Honolulu
Alaskan Standard Time GMT - 9 hours AST America/Anchorage
Pacific Standard Time GMT - 8 hours PST America/Los Angeles
US Mountain Standard Time GMT - 7 hours MST America/Denver
Central Standard Time GMT - 6 hours CST America/Chicago
Eastern Standard Time GMT - 5 hours EST America/New York
Atlantic Standard Time GMT - 4 hours PRT America/Halifax
Newfoundland Standard Time GMT - 3 1/2 hours CNT America/St. Johns
Time Zones Sheet 2 of 2
South America Eastern
Standard Time
East South America Standard
Time
Azores Standard Time GMT - 1 hours CAT Atlantic/Azores
GMT - 3 hours AGT America/Buenos Aires
GMT - 3 hours BET America/San Paulo
Page 22 Nortel Networks Confidential # P0988093
Page 23

Statistical
Maintenance
This chapter covers:
2
1. Collection and Maintenance
of Statistical Data
2. PeriReporter and the Media
Processing Server Network
3. System and Application
Statistics
4. Gathering Application
Statistics
Page 24

PeriReporter User’s Guide
Collection and Maintenance of Statistical Data
Statistics are collected and stored in 15-minute intervals, on a per Nortel Networks
Media Processing Server Series basis, for all Nortel Networks Media Processing
Servers configured for the network. The $VPSHOME/common/etc/vpshosts
file lists all networked servers and th e nodes at which they are configured.
When collecting stat s fr om re mo te s yst em s, Pe ri Repor ter will look in the vpshosts
file. For both system and application stats, PeriReporter will retrieve data for all
systems that are of TYPE vps in the vpshosts file.
For system sta ts, Peri Report er g oes thr ough e ach v ps entr y, conver ts t he d ata to bina ry
form and brings it back to the PeriReporter node.
For application stats, PeriReporter goes through each vps entry. If it is not the local
node and it has not already been copied from another vps entry, the data is brought
back to the PeriReporter node.
The vpshosts file determines which system s will be used to gather statistics from.
Use the vhman or xvhman command to configure the vpshosts file.
For additional information on configuring the vpshosts file, refer to the PeriView
Reference Manual (9090722 (I)).
Statistics may be categorized as being either system statistics or user-defined,
application-specific statistics. All statistics data is stored and is available for creating
and generating reports.
• Each Nortel Networks Medi a Proc essin g Serve r’s VST AT process collects system
statistics and writes them to raw statistics files in the directory
$VPSHOME/vps(#)/stats. One VSTAT process exists for each server.
• Each node’s VSUPD process collects ap plica tion stat isti cs and wri tes t hem to raw
statistics files in the directory: $ASEHOME/stats. One VSUPD process exists
for each node.
The process of system statistics collection and reporting is transparent to the user.
However, the process of collecting and reporting application statistics requires user
intervention.
Once a report is generated, report data is always static. Statistical updates can only be
displayed by generating a new report.
Single vs. Multi-node Environments
In a single no de envi ronment , t he Per iRepor ter too l, st atis tics fil es and appli ca tions all
exist on the same node. (Stat events are defined generated and collected on this same
node.)
In a multi-node environment, applications can execute on nodes where PeriReporter
does not reside. Sta ti st ic s ar e t ra nsferred from the node at which they are generated t o
the statistics node via scripts which run on the collection node.
Page 24 Nortel Networks Confidential # P0988093
Page 25
Statistical Maintenance
Defining Stat Events in a Single Node Environment
This process applies to a configuration in which application statistics are to be
collected from Nortel Networks Media Processing Server Series and VAS resources
that reside on the statistics node. The node’s VSUPD process is responsible for
collecting application statistics from all resources on the node. Each server’s VSTAT
process is responsible for collecting system statistics for the unit.
A single Nortel Networks Media Pr ocess ing Serv er 1000 c onsist s of TMS (Telephony
Media Server) hardware a nd both ASE (Applicatio n Ser vi ces Envi ro nment) and VOS
(Voice Operating Software) software processes. The UNIX node consists of Nortel
Networks Media Processing Server Series elements common to all units configured
for the node.
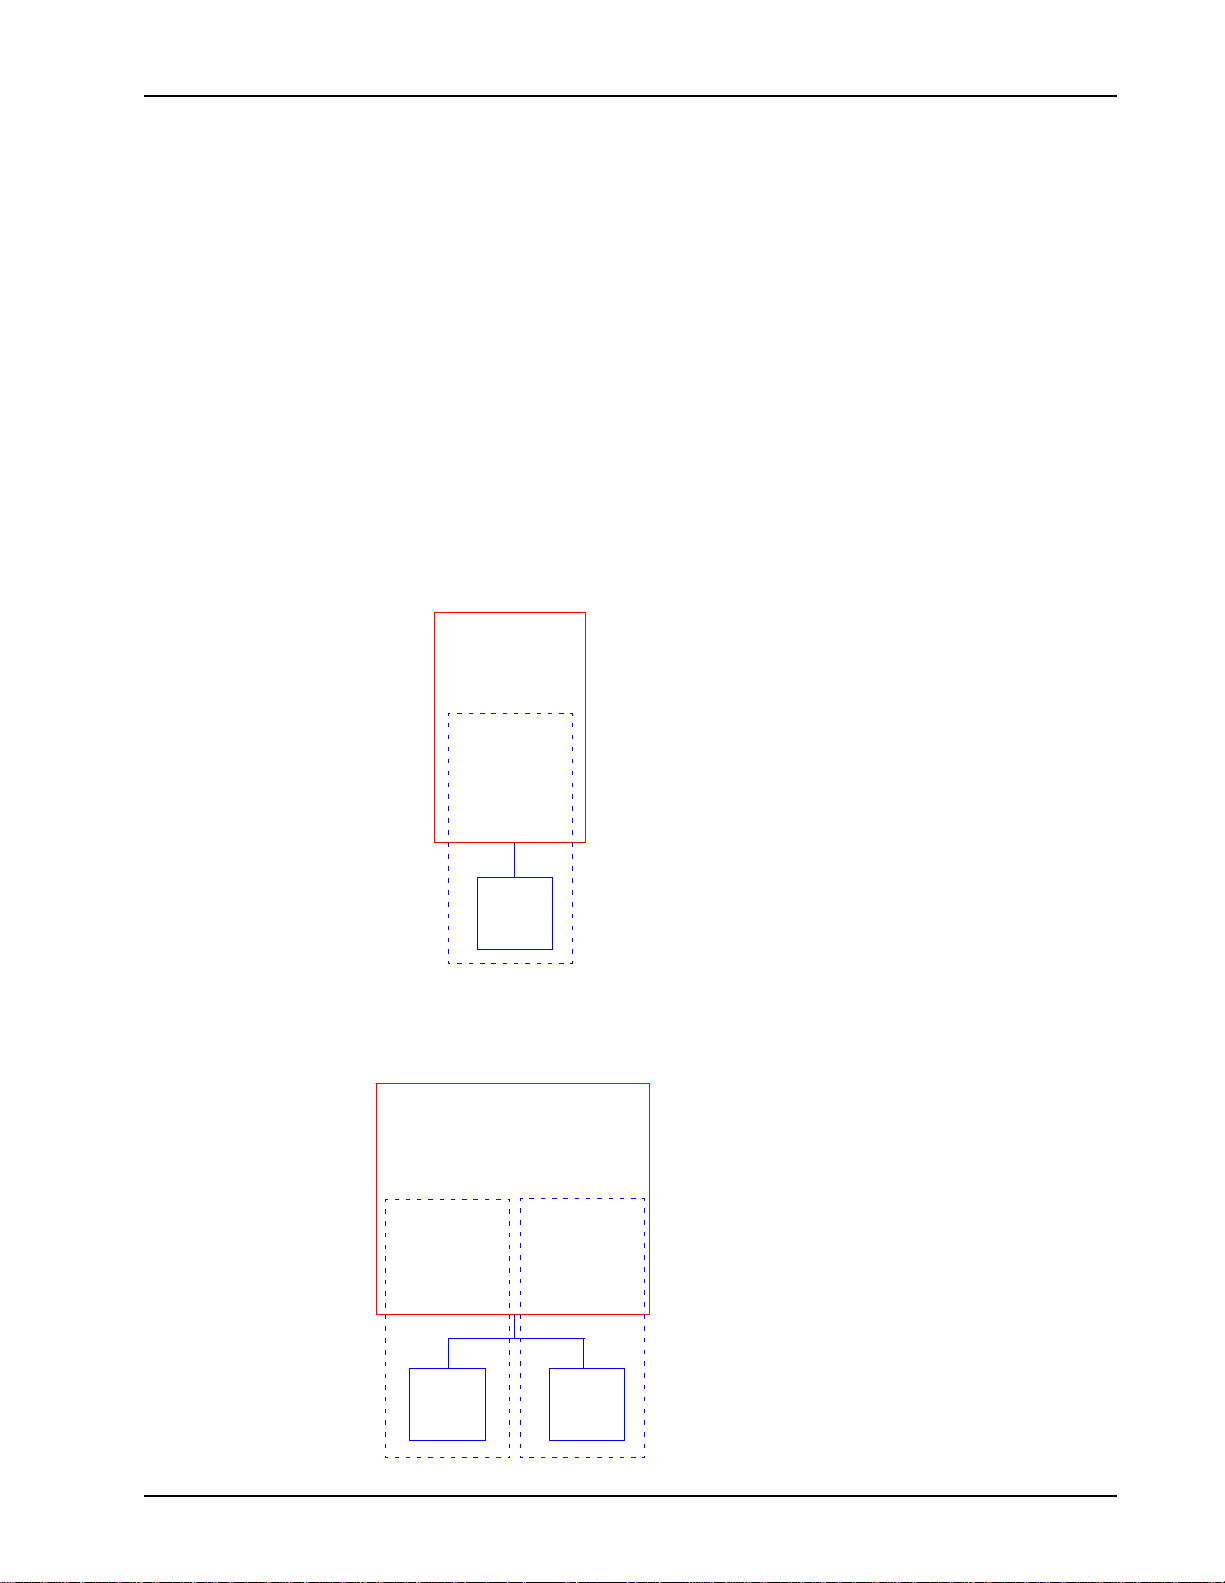
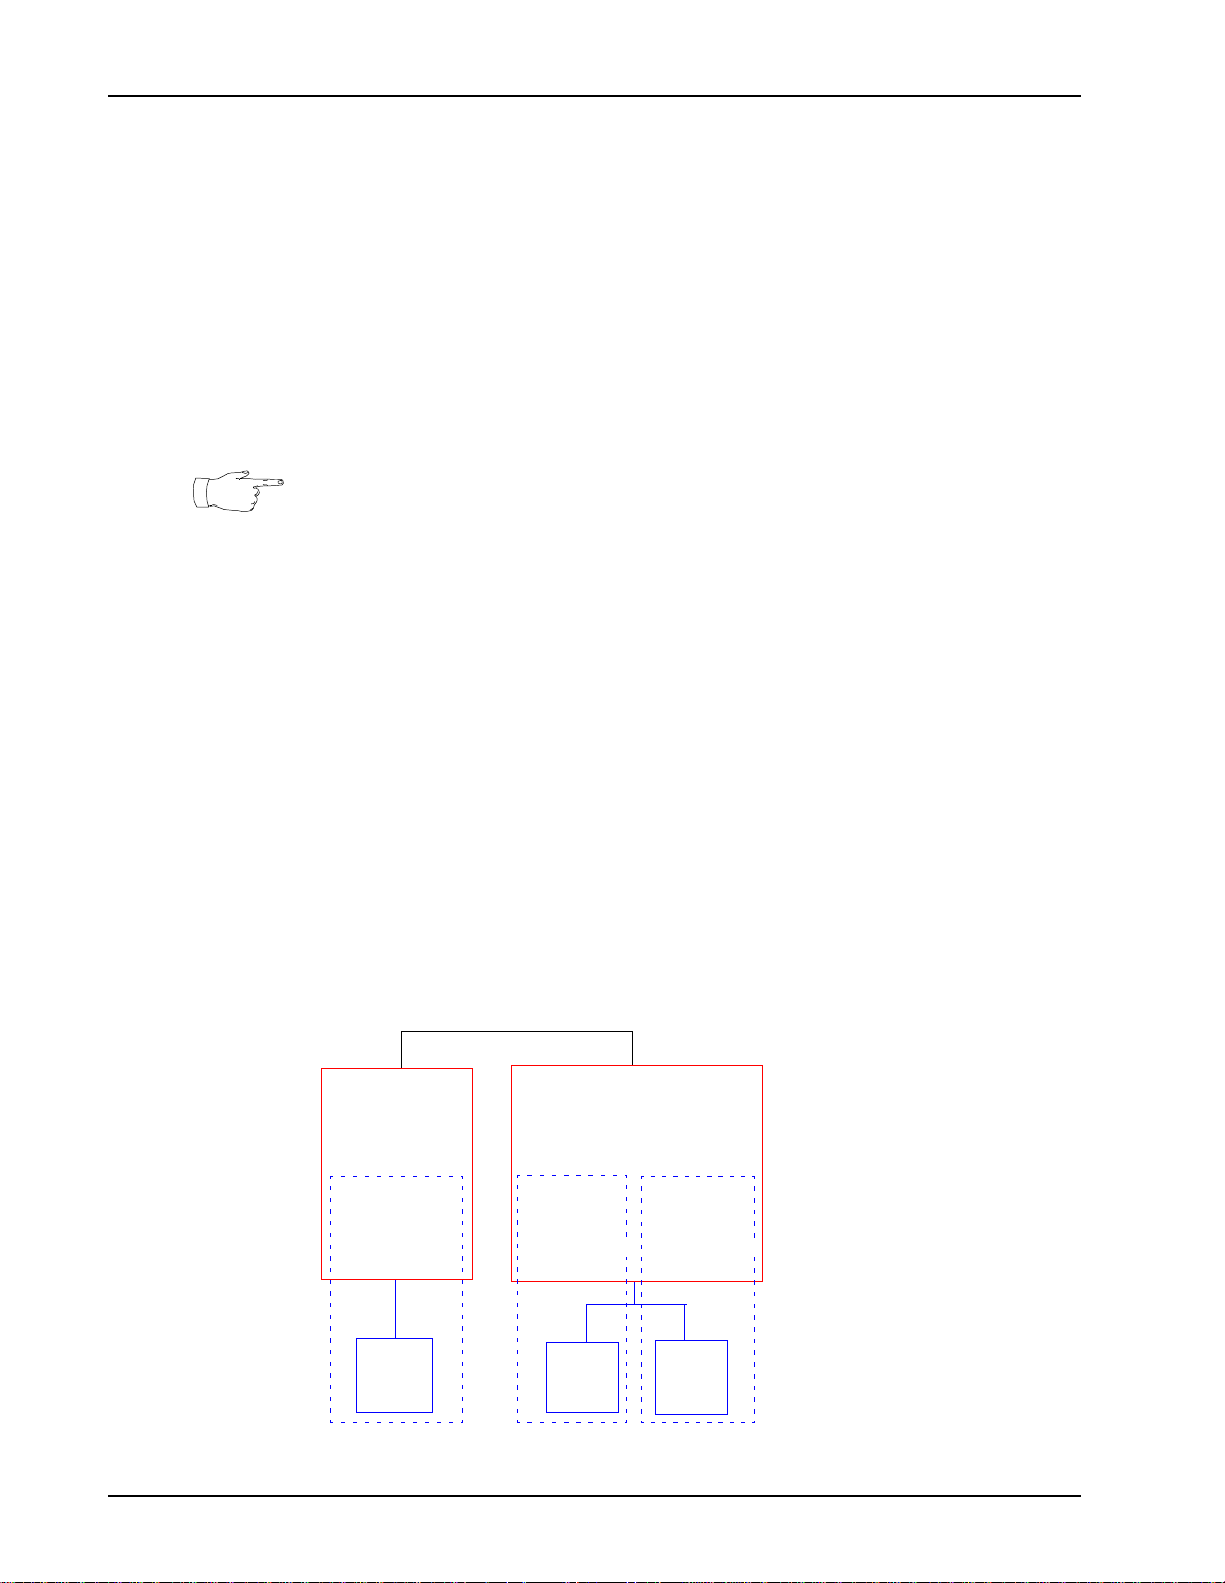
The following diagrams ill ustrate the rela tionships betwe en the components in a
single node Nortel Networks Media Processing Server Series 1000 from the
PeriReporter point of view.
In this example, the UNIX node consists of a
MPS 1000
UNIX Node
VSUPD
PeriView &
PeriReporter
MPS 1
VSTAT
Application(s)
ASE / VOS
VSUPD process and PeriView—with PeriReporter,
and a single Nortel Networks Media Processing
Server on which applications execute. The Nortel
Networks Media Processing Server consists of a
VSTAT process; applications; ASE and VOS
processes; and TMS hardware.
Application stat events are defined within each
application, to the statistics node, and to the VSUPD
process. The VSUPD process collects application
statistics for the node and writes them to
$ASEHOME/stats as raw statistics files.
MPS 1000
UNIX Node
VSUPD
PeriView &
PeriReporter
MPS 1
VSTAT
Application(s)
ASE / VOS
TMS
TMS
MPS 2
VSTAT
Application(s)
ASE / VOS
TMS
After System statistics for the Nortel Networks
Media Processing Server are collected they are
converted and stored in $ASEHOME/stats as raw
statistics files.
In this example, the UNIX node consists of a
VSUPD process and PeriView—with PeriReporter,
and two Nortel Networks Media Processing Servers
on which applications execute. The Nortel Networks
Media Processing Servers each consist of a VSTAT
process; applications; ASE and VOS processes; and
TMS hardware.
Application stat events are defined within each
application, to the statistics node, and to the VSUPD
process. The VSUPD process collects application
statistics for the node and writes them to
$ASEHOME/stats as raw statistics files.
After System statistics for the Nortel Networks
Media Processing Server are collected they are
converted and stored in $ASEHOME/stats as raw
statistics files.
# P0988093 Nortel Networks Confidential Page 25
Page 26
PeriReporter User’s Guide
Application Stat Events in a Multi-Node Environment
This process applies to a configuration in which application statistics may have to be
collected from the Nortel Networks Media Processing Server Series Network and
VAS resources that reside on the statistics node and from Nortel Networks Media
Processing Server and VAS resources that reside on nodes at which the statistics files
do not reside. Typically, in a multi-node environment, the PeriReporter tool resides at
one node only.
A node’s VSUPD process is responsible for collecting application statistics from all
Nortel Networks Media Processing Server and VAS resources on the node. Each
servers VSTAT process is respons ible for collecti ng system statistics for the uni t.
VSUPD must be running on all nodes at which application statistics are to be
collected. This inc lud es all Nortel Networks Medi a Processing Server a nd VAS nodes
at which applications are running.
The following diagram illustrates the relationship between the components in a
multi-node Nortel Networks Media Processing Server Series Network configuration,
from the PeriReporter tool point of view.
In this example, the Nortel Networks Media Processing Server Series Network is
configured with t wo UNIX nod es, and a VSUPD proce ss is a ssociat ed with e ach node.
Although PeriView reside s at bot h nodes, Per iReporter reside s only on No de A, which
is configured with a single Nortel Networks Media Processing Server 100. Node B
consists of two Nortel Networks Media Processing Server 100s. Each Nortel
Networks Media Processing Server consists of ASE and VOS software processes, a
VSUPD process, TMS hardware, and applications.
Applications assigned to Node A are executing locally with respect to PeriReporter.
Applications assigned to N ode B are execut ing remotely wi th respect to PeriReporter.
Stat Events are defined within
each application and to each
node’s VSUPD process (which
collects application statistics for
the node and writes them to the
directory $ASEHOME/stats as
raw statistics files).
The strec#.sre files must be
copied from Node A to Node B.
Application statistics, collected
at Node B, need to be transferred
to Node A.
MPS 1000
Node A
VSUPD
PeriView &
PeriReporter
VSTAT
Application(s)
ASE / VOS
MPS 1
MPS network
Application(s)
ASE / VOS
VSTAT
MPS 1000
Node B
VSUPD
PeriView
MPS 3MPS 2
VSTAT
Application(s)
ASE / VOS
TMS
TMS
TMS
Page 26 Nortel Networks Confidential # P0988093
Page 27

Statistical Maintenance
In a multi-node environment, the stat event definition process may involve defining
stat events for applications that are executing on both local and remote nodes. Fields
in a stat record file must be defined once for each unique application for which
statistics are to be collected, whereas stat record code stub files must exist on each
node at which application statistics are to be collected.
Example:
If multiple instances of the same application are to execute on different nodes in the
network, fields in a stat record file have to be defined only once for the application,
regardless of the number of locations at which it will execute. However, stat record
code stub files must be located on all nodes running applications for which statistics
are to be collected.
# P0988093 Nortel Networks Confidential Page 27
Page 28

PeriReporter User’s Guide
PeriReporter and the MPS Network
Typically, a single node in a Nortel Networks Media Processing Server Series
Network is designated to collect and re port stat istical data. PeriRe porter re sides on the
node designated for this purpose.
System statistics are collected from each Nortel Networks Media Processing Server
Series by the server’s VSTAT process. One VSTAT process exists for each unit.
• In a single node environment, all Nortel Networks Media Processing Server
Series exist on the same (local) node. System statistics are collected once each
hour by each unit’s VSTAT process. The script pr-sys-v5-sh run s and
collects the raw data files from the $VPSHOME/vpsN/stats directory and
creates bin ary files in the $ASEHOME/stats directory.
• In a multi-node environment, Nortel Networks Media Processing Server Series
can be configured for nodes at which PeriReporter does not reside (remote) as
well as for the statistics collection node (local). Scripts run on the collection node
only and are transferred from the remote nodes to the $ASEHOME/stats
directory of the collection node.
• System statistics generated at remote nodes are collected by each remote
Nortel Networks Media Proc essing Server Seri es’ VST AT process, transferred
to the statistics node and stored in sysstats and accstats files.
• System statistics generated by Nortel Networks Media Processing Server
Series configured for the statistics node (local) are collected by each local
server’s VSTA T pr oces s and s tored in sysstats a nd accstats fi les. Two
types of files are created by the script pr-sys-v5-sh.
• sysstats - system statisti cs files by Nort el Networks Medi a Processi ng
Server, line, span, and host
• accstats - system statistics files by time
• The System Variables are predefined. Of the System Variables available, ea ch
report definition can specify only one of the following.
• System.VPS
• System.Line
• System.Host
• System.Span
If one of the abov e syst em vari ables is chosen in a repo rt th en all vari ables for
the report definitio n will be col lect ed from sysstats fi les. Count ers for the
rest of the report definition can be any combination of remaining System
Variables.
These variables are usually mapped to the first column of a report in place of
the date. When these variables are used, no column may be mapped to record
the date. If one of these variables is chosen for a particular column and Date is
chosen for another column an error message will appear.
• With th e excepti on of the above vari ables, report d efinitions can be mapped to
any combination of Application and System Variables.
For additional information on mapping of columns for report definitions, refer to the
Data Mapping section of this manual.
Page 28 Nortel Networks Confidential # P0988093
Page 29
Statistical Maintenance
!
Application statistics are generated during an application’s execution cycle and
collected by each node’s VSUPD process. One VSUPD process exists for each node.
• In a single node environment, all Nortel Networks Media Processing Server
Series exist on the same (local) node. Application statistics are collected by the
node’s VSUPD process and written to raw statistics files in the directory
$ASEHOME/stats.
• Application statistics generated at remote nodes are collected by each remote
node’s VSUPD process, transferred to the statistics node and stored in
appstats files in $ASEHOME/stats.
• appstats - application statistics files
• Application statisti cs generated by Nortel Ne tworks Media Processing Ser ver
Series configured for the statistics node (local) are collected by the node’s
VSUPD process and stored in appstats files.
To view these files, use the vsupdump -f command.
The VSUPD process must be running on all nodes at which applicat ions are exec uting
and statistics are to be collected. If VSUPD is not running on a node at which
applications are executing, any statistics that are generated at that node will not be
collected.
To run the VSUPD process, uncomment the VSUPD line within the gen.cfg file in
the $VPSHOME/common/etc directory.
# P0988093 Nortel Networks Confidential Page 29
Page 30

PeriReporter User’s Guide
System and Application Statistics
Statistical data originates from user defined, application-specific stat events and
system def ined stat events.
System statistics and application statistics reports can be generated individually for
each Nortel Networks Media Processing Server, or for all units configured for the
network.
On systems configured with more than one node, application statistics will be
collected for a ll of the n ode’s res ources by a s ingle VSUPD proce ss. Howeve r, system
statistics will be collected for each Nortel Networks Media Processing Server by
individual VSTAT processes.
System Statistics
System statistics report data related to phone line usage, digital span activity, and host
interactio n. System statistics are Nortel Networks Media Processing Server-specific
and include all statistics generated by all applications on each unit.
System stat events are predefined by Nortel Networks. System statistical reports are
predefined by Nortel Networks and should not be modified without consulting Nortel
Networks. System statistics can be viewed with PeriReporter, which is used to select
and generate a report.
VSTAT is the VOS (Voice Operating Software) process responsible for collecting
system statistics. System stat events are maintained by stat event counters. Each
Nortel Networks Media Processing Server Series designates one counter for each
unique occurrence of a specified event. System statistics are collected on a per Nortel
Networks Media Processing Server Series basis, by each unit’s VSTAT process. At
regular intervals, da ta is collect ed from each un it to the collect ion node and trans ferred
to binary fi les, where it is stored on a per unit basis.
These files are located in $ASEHOME/stats and are called sysstats and
accstats.
Page 30 Nortel Networks Confidential # P0988093
Page 31

Statistical Maintenance
System Statistics Reports Summary
There are seven predefined System Statistics Reports.
Filename Report
PhoneDetail.prd Detail Phone Line Statistics Report
PhoneSum.prd Summary Phone Line Statistics Report
PhoneAcc.prd Accumulated Summary Phone Line Statistics Report
SpanDetail .prd Detail Span Statistics Report
SpanSum.prd Summary Span Statistics Report
HostDetail.prd De tail System Statistics Report
HostSum. prd Summary S ystem Statistics Report
The tables that follow summarize the contents of each of the previously mentioned
predefined reports.
The following tables also describe the system counters for statistical collection and
reporting for whic h individual columns ca n be mapped. These count ers can be chosen
in the System Variables section of the Data Mapping window.
For additional information on Data Mapping, see the PeriDefiner section of this
manual.
# P0988093 Nortel Networks Confidential Page 31
Page 32

PeriReporter User’s Guide
System Statistical Reports
Sheet 1 of 3
SPAN REPORTS
Span statistics indicate span activity for digital T-1 systems in both summary and detail
format. Reports include the Span Detail Report and Span Summary Report.
Type
Detail
Summary
SpanDetail.prd: Data is reported for each span on selected or all Nortel
Networks Media Processing Server Series, for a specified range.
SpanSum.prd: Data is collectively summarize d for all spans, for se lected or
all Nortel Networks Media Processing Server Series, then reported for a
specified date range. Data for each unit is summarized on a single line.
Totals reflect span activity inclusive of all units.
Statistics
Busy
Seconds
Errored
Seconds
Severe
Seconds
System.SpanBusy: The number of seconds the span was in an inservice/busy state.
System.SpanError: The number of seconds the span was in an errored
signal state. (The span could not take calls.)
System.SpanSevere: The number of seconds the span was in an errored
signal state and th e s ev eri ty of the s tate was high. (The s pan c ou ld not take
calls.)
Failed
Seconds
Yellow
Seconds
Max Bit
Change
Degraded
Minutes
System.SpanFailed: The number of seconds the span was in a failed
signal state. (The span could not take calls.)
System.SpanYellow: The number of seconds the span was in a yellow
signal state. (The span could not take calls.)
System.SpanMaxBit: The number of “MAX a and b” bit changes per
second that occurred on the span.
System.SpanDegraded: This variable is not implemented at this time.
Page 32 Nortel Networks Confidential # P0988093
Page 33

Statistical Maintenance
System Statistical Reports Sheet 2 of 3
PHONE LINE REPORTS
Phone line statistics in dicate phone li ne usag e in both a su mmary and deta il forma t. Repo rts
include the Phone Line Detail Report, Phone Line Summary Report, and Phone Line
Accumulated Summary Report.
Type
Detail
Summary
Accumulated
Summary
MIS
SecsPeriod
%U
#CE
PhoneDetail.prd: Phone line usage is reported for selected or all Nortel
Networks Media Processing Server Series and phone lines, for a specified
date range. Totals reflect usage per individual units.
PhoneSum.prd: Data is collectively summarized for selected or all phone
lines, then reported for selected or all Nortel Networks Media Processing
Server Series, for a specified date range. Data for each unit is summarized
on a single line. Totals reflect usage inclusive of all units.
PhoneAcc.prd: Data is summarized per the time per iod specified by the
user collective ly for s elect ed or all phone lines , then rep orted fo r se lected or
all Nortel Networks Media Processing Server Series for the specified date–
time range.
Statistics
System.MIS: Minutes In Serv ice : Th e nu mb er of minutes the line w as in a n
in-service state—connected and able to take calls.
System.SecsPeriod: Seconds in Period : The number of seconds in a giv en
period.
i.e. 15 minutes = 900 seconds
System.Utilized: Percent Utilizat ion: The perce ntage of time the line was in
a busy state—out of service or taking calls.
System.Calls: Number of Calls Ended: The total number of calls ended—
irrespective of the terminatio n proc es s.
System.ACS: Average Call Seconds: The length of the average call—
measured in seconds.
ACS
While this is correct for a column within a report, the actual counter stores
the data as the average multiplied by the total number of calls for that
period.
System.UAB: User Abandoned Calls: The number of user abandoned
UAB
calls—the user elects not to follow through with the call.
System.SAB: System Abandoned Call s: The number of sy stem abandon ed
SAB
calls—the Nortel Networks Media Processing Server Series application
terminates the call.
System.CR: Num ber of Calls Referred: Th e numbe r of calls referred—calls
#CR
transferred to an operator.
# P0988093 Nortel Networks Confidential Page 33
Page 34

PeriReporter User’s Guide
System Statistical Reports Sheet 3 of 3
System.ARS: Average Referral Seconds: Detected activity is determined
by the type of referral method that has been instituted—either a hook flash
or digital referral method.
ARS
Hook Flash : The number of se con ds us ed t o re fer a call to an operator.
Digital : The number of seconds used to refer a call to an operator plus
the number of seconds the caller is interacting with the operator.
While this is correct for a column within a report, the actual counter stores
the data as the average multiplied by the total number of referrals for that
period.
PHONE LINE REPORTS - Statistics (continued)
System.UAR: User Abandoned Referrals: The number of user abandoned
UAR
referrals—the user el ec ts no t to fo llo w th roug h wi th the re ferra l p r oces s and
terminates the call.
System.FR: Number of Failed Referrals: The number of times the system
#FR
failed to refer the call—the Norte l Networks Media Pro cessing Ser ver Series
did not complete the referral process.
SYSTEM REPORTS
System Statistics i ndica te o verall syst em activ ity in both s umm ary and detail forma t. Rep orts
include the System (Host) Detail Report and System (Host) Summary Report.
Type
Detail HostDetail.prd: Data is reported for selected or all Nortel Networks Media
Processing Server Series and external hosts for a specified date range.
Summary
Total Calls
All Busy
# Messages
to Host
# Messages
from Host
HostSum.prd: Data is cumulatively summarized by external host for
selected or all Nortel Networks Media Processing Server Series, then
reported for a specified date range. Data for each unit is summarized on a
single line. Totals reflect system activity inclusive of all units.
Statistics
System.TotalCalls: The number of calls p rocessed by selec ted or all Norte l
Networks Media Processing Server Series .
System.AllBusy: The number of minutes that selected or all Nortel
Networks Media Processing Server Series were all in an in-service/busy
state and not available to take calls.
System.MessagesTo: The detail report displays the number of messages
sent to each host and the summary report displays the cumulative number
of messages sent to a ll hos ts per No rtel N etworks Media Processi ng Server
Series.
System.MessagesFrom: The detail report displays the number of
messages received from each host and the summary report displays the
cumulative number of messages received from all hosts per Nortel
Networks Media Processing Server Series .
Page 34 Nortel Networks Confidential # P0988093
Page 35

Statistical Maintenance
Application Statistics
Application-spec ific stat events ar e gene rated during an applic ation ’s execut ion cy cle.
Application stat even ts must be def ined withi n each appli cation and identif ied as a sta t
event to VSUPD (the process responsible for collecting application statistics data).
Application statistic reports may be defined to include system statistics data along
with application-sp eci f ic sta ti st ic s.
VSUPD is the ASE (Application Services Environment) process responsible for
collecting application-specific statistics. Application stat events are tracked by stat
event counters. One c ounter must be defined for each un ique occur rence of a specifie d
event. On each node, counters are incremented as the corresponding events occur.
Application statis tics are colle cted o n a per Nor tel Ne tworks Media Proces sing Ser ver
Series basis (if they have been generated), by each node’s VSUPD process (if it is
running). Each hour, data is collected from each node and transferred to the statistics
node, where it is stored in binary files on a per Nortel Networks Media Processing
Server Series basis in the $ASEHOME/stats directory and named appstats.
The VSUPD process must be running on each node where applications are executing
and statistics are to be collected. If VSUPD is not running, statistics will not be
collected.
Application-specific reports are created with the PeriDefiner component.
# P0988093 Nortel Networks Confidential Page 35
Page 36

PeriReporter User’s Guide
The Process of Defining Application Stat Events
Although the process of sys te m statistics collecti on and re por ting is transparent to the
user, the process of application statistics collection and reporting is user dependent.
Application stat events must be defined within each application and to the VSUPD
process (on the node where t he applicati ons will execut e). Once applic ation stat ev ents
are defined, application statistics reports must be created, using PeriDefiner to first
define the reports and then PeriReporter to subsequently generate the statistical
information.
Application stat events are defined in PeriPro or VRAM. The vexdump utility, with
the -s option, can be used to create .sre files and move them into
$ASEHOME/copy. These files can then be read by VSUPD.
Typically, the issues relating to application statistics are addressed during application
development.
• The stat events that are to be collected must be defined within the application.
This procedure will differ for PeriProducer and VRAM applications.
• Once defined in the application, statistics will be generated during the
application’s executi on cycle. Before appl icatio n stat eve nts can be collect ed, they
must be defined to the VSUPD process.
Application stat events are defined using the vexdump -s <appname>
command. A stat record code stub (.sre) file is created in the
$ASEHOME/copy directory. This .sre file must be manually copied to the
$ASEHOME/copy directory of all nodes where this application will be running.
• Application statistics that have been completely defined will only be collected if
VSUPD is running on the node at which applications are executing and statistics
are to be collected. If VSUPD is not running, any application statistics that are
generated, will not be collected.
In a single node environment, all applications will be executing locally. In a multinode environment, some applications may be executing on the statistics node while
others may be on remote nodes. Each hour a collection script runs on the stats node
and transfers the appstats files to the statistics node’s $ASEHOME/stats
directory. These appstats files are stored on a per Nortel Networks Media
Processing Server Series basis.
Page 36 Nortel Networks Confidential # P0988093
Page 37

Statistical Maintenance
PeriProducer and VRAM Applications
Application stat istics are coll ected and stored using st at recor d code stu b (.sre) files.
Stat record code stub files must exist on each node at which application statistics are
to be collected.
• Stat events are defined and stored in appstats files.
• Stat record code stub files (e.g. strec#.sre) contain sta t even t definitions,
which are used by VSUPD duri ng appl icat ion st atis tics co llecti on (re gular ly, at 15
minute intervals).
Example:
If multiple instances of the same application are to execute on different nodes in
the network, the stat record code stub files must be located on the statistics node
as well as at all other nodes running applications for which statistics are to be
collected.
The method by which stat record files are defined and code stub files are created is
dependent upon how the application itself was created as well as on the network
configuration.
Applications can be created with either PeriProducer or VRAM. PeriProducer is a
graphical u ser interface (GUI) tool used to create and validate applications, and is
accessible from the PeriView Launcher . VRAM is a text based programming langu age
and is also used to create and validate applications.
The following information on enabling application statistics collection and reporting
is presented from the point of view of the type of development tool you are working
with (PeriProducer or VRAM) and the network configuration (single or multi-node).
PeriProducer
Stat events are def ined, in a n applica tion, as special data card s (call ed counter s) withi n
a folder of scope statistics.
For additional information, see Gathering Applicat ion Statistics (Block Execution
Statistics) on page 38.
VRAM
Stat record files are included in the .vex file by use of the VRAM copy directive.
Events must be defined within the application from which they are to be generated.
For additional information, refer to the MPS Programming Reference Manual
(9070901(I)).
Vexdump
The vexdump utility , with the -s option, is used to, initially, add the definitions from
the Folder of Sevents to stat record files in appstats. This process both specifies
the stat record file(s) and creates the stat record code stub (.sre) files.
# P0988093 Nortel Networks Confidential Page 37
Page 38

PeriReporter User’s Guide
Gathering Application Statistics (Block Execution Statistics)
You can customize each application to record the number of times any single block is
executed during runtime.
Every 15 minutes, VSUPD broadcasts a stati stic s reques t to all exe cuting applica tions
and collects available application statistics. This statistics collection daemon stores
these statistics for future reference.
To use block execution statistics (application statistics), create one or more Statistics
folders (Folders of Sevents ) for th e appli catio n and sp ecial stati stic s data ca rds (ca lled
counters or stat events) for selected blocks. When PeriProducer executes the block
during runtime, it in crements counters (stat events) associated with t hat bloc k by one ;
it does not re-initialize statistics folders when the application restarts. This allows
statistics to accumulate over many calls.
PeriProducer allows you to assign any legal name to Statistics folders.
If it is possible, use a single, unique statistics folder to gather the statistics from each
application. For example, gather all the statistics for application_1 in strec1
and all the statistics for application_2 in strec2.
Page 38 Nortel Networks Confidential # P0988093
Page 39

1. Create a Statistics folder (Folder of Sevents) for the application. From the Tool
To use the system wide
statistics collection utility,
assign any legal name to
the folder (e.g. name the
Statistics Folders strec1,
strec 2,...)
Select Statistics
Select Add
Statistical Maintenance
Defining Application (Block Execution) Statistics
Kit, select Folders.
2. Access the Block menu for the block you want to reference. Click <M
ENU> on the
block in the construction area.
3. From the Block menu, clic k <M
Show the currently configured co unters.
Create and attach a default counter to the selected statistics folder.
Select/Define a new counte r. This coun te r m ust be n um e ric, le ng th ni ne .
Detach an existing counter.
ENU> on Counters. Select fro m the counter options:
4. Save the fold er to a file. Follow the menu path File—Save As.
Supply a descriptive name for the file. PeriProducer adds the
suffix .folder
5. To create a basic report in PeriReporter, copy the .folder file to a working
directory on each node where PeriReporter is executing.
6. To create a more detailed report in PeriReporter, create a stat record code stub file
by executing the followin g command:
vexdump -s app.vex
7. Copy the stat record code stub file (strec#.sre) from $ASEHOME/copy to
$ASEHOME/copy on each node where PeriReporter is executing.
You can creat e multiple st atistics folders (folde rs of sevents) fo r each applic ation. This
can be helpful, for instance, in an application that allows the caller to choose between
English and Spanish. The Spanish blocks can increment counters in one folder
(strec1), while the English blocks increment counters in another (strec2).
# P0988093 Nortel Networks Confidential Page 39
Page 40

PeriReporter User’s Guide
Determining Blocks Associated With a Counter
Use the global Manage Data Folders window to display the names of all the blocks in
the application that use a particular data card as a counter.
First, select the folder that contains the data card. Next, click <M
card name. Finally, from the hidden menu, click <M
ENU> on StatBlocks.
ENU> on the data
Block that uses
sRhost1_1 as a
counter
Passing Statistics Folders to a Linked Application
You can pass a statistics folder as a parameter to a linked application. In this case, the
system does not make the statistics folder availabl e to VSUPD when the linked
application terminates, unless the linked application receives an explicit request from
VSUPD. Instead, the system makes the statistics folder available when the main
applicatio n terminates.
strec2 is available
Main
execution
strec2 [type: statistics folder]
sRHost1_1 [type: number ]
Linked
LPstats: [type: parameter folder]
LFstrec2: [type: lower-level folder]
sRHost1_1: [type: number]
For further information about implementing linked applications, refer to the
PeriProducer User’s Guide (#9090752 (I)).
Page 40 Nortel Networks Confidential # P0988093
Page 41

PeriConsolidator
This chapter covers:
3
1. Purpose
2. Configuration
3. Command Line Options
Page 42

PeriReporter User’s Guide
Purpose
PeriConsolidator re ads in the binary app licatio n st atis tics file s crea ted by VSUPD a nd
the binary system statistics files. These files are typically read in every evening and
consolidated based on the PeriConsolidator crontab setup.
These files have six possible consolidation levels:
• 15 minute
• hourly
• daily
• weekly
• monthly
• yearly
PeriConsolidator should be set up to run daily through crontab during off-peak
hours, when the Nortel Networks Media Processi ng Server Seri es system load is light.
Every day the weekly, monthly, and yearly files will be consolidated through the
current day.
Depending on the size of the Nortel Net works Media Processi ng Server Series syste m,
consolidation run-time will vary.
It is important to realize that there will be a level of detail l ost each time a
consolidation is performed.
A file of each defined type may be produced each day.
Setup
• Update $VPSHOME/common/etc/vpshosts to include all of the VASs
and Nortel Networks Media Processing Servers. The following programs
should be set up in crontab upon installation.
Program Frequency Function
pr_app_v5.sh hourly collects application statistics
from all VASs
pr_sys_v5.sh hourly collects system statis tics from all
Nortel Networks Media
Processing Server Series nodes
PeriConsolidator nightly (at off-peak
time)
consolidates statist ics to
specified level
At certain points in this manual, MPS (Nortel Networks Media Processing Server
Series) is analogous with VPS (Voice Processing Series). This is reflected in specific
file names and directories, as well as certain software features.
Page 42 Nortel Networks Confidential # P0988093
Page 43

Configuration
!
Stats File (“X” represents MPS number) Content
appstats.X.MMDDYYHH
accstats.X.MMDDYYHH
sysstats.X.MMDDYYHH
15 minute d ata
PeriConsolidator
Happstats.X.MMDDYYHH
Haccstats.X.MMDDYYHH
Hsysstats.X.MMDDYYHH
Dappstats.X.MMDDYYHH
Daccstats.X.MMDDYYHH
Dsysstats.X.MMDDYYHH
Wappstats.X.MMDDYYHH
Waccstats.X.MMDDYYHH
Wsysstats.X.MMDDYYHH
Mappstats.X.MMDDYYHH
Maccstats.X.MMDDYYHH
Msysstats.X.MMDDYYHH
Yappstats.X.MMDDYYHH
Yaccstats.X.MMDDYYHH
Ysysstats.X.MMDDYYHH
Hourly data consolidated by
hour
Daily data consolidated by
day
(midnight to midnight)
Weekly data consolidated by
day
(Sunday through Saturday)
Monthly data consolidated by
day (First through last day of
month)
Yearly data consolidated by
month
(January through December)
When collecting data from a local system, “X” need not be used. When data is to be
collected from a remote system, “X” is used as a parameter to identify that syst em.
Weekly data whic h is ga the red mid- week wil l be c onsoli dated up to t hat day. The next
time a consolidation is run for that month the new data wil l overwrite the existing
data. Monthly data which is gathered mid-month will be consolidated up to that date.
The next time a consolidation is run for that month the new data will overwrite the
existing data. Yearly data which is gathered mid-year will be consolidated up to that
date. The next time a consolidation is r un f or tha t year the new data wil l o ver wri te the
existing data.
You must wait an ample amount of time for statistics to finish consolidating before
attempting to generate a repor t.
# P0988093 Nortel Networks Confidential Page 43
Page 44

PeriReporter User’s Guide
Data Maintenance
Data maintenance can be per fo rmed a utomatically and is g over ned by bot h t he period
of time for which data is collected and the source from which data originated.
Parameters for Data Maintenance are set up in th e .conspr file within your $HOME
directory.
For additional information on Data Maintenance, see Parameters.
Data mainte nance is defined in the followin g two tables.
Data Period Data Maintenance
For a 24 hour period
Data is maintained in 15 minute increments.
Data is maintained in hourly increments.
Data is maintained in daily increments.
For a weekly period
For a monthly period
For a yearly period
Data Source Data Maintenance
System (Host) Statistics
Phone Line Statistics
Span Statistics
Data is maintained in daily increments.
(Sunday - Saturday)
Data is maintained in daily increments.
(1st day - last day of month)
Data is maintained in monthly increments.
(Jan. - Dec.)
Data is maintained on a per Nortel Networks Media
Processing Server Series basis. It is possible to report System
Statistics for each unit configured for the network.
System Statistics report data related to phone line usage,
digital span activity, and host interaction.
Data is maintai ned o n a per Phone Line bas is . I t i s po ss ible to
report System Phone Line Statistics for each phone line
assigned to each Nortel Networks Media Proces si ng Serv er
Series in the network.
Data is maintai ned o n a per span basis . I t i s po ss ib le to report
System Span Statistics for each s pan as sign ed to ea ch Norte l
Networks Media Processing Server Series in the network.
Span Statistics applies only to digital phone line system
configurations.
Application Statistics and all
User Defined Reports
Data is maintained on a per Nortel Networks Media
Processin g Server Series basis.
Page 44 Nortel Networks Confidential # P0988093
Page 45

PeriConsolidator
Parameters
PeriConsolidator allows you to set configurable parameters to automatically handle
file maintenance. These parameters are set up in the .conspr file. This will allow
specification of the number of days files are saved before they are automatically
deleted.
The .conspr file is located in the default PeriReporter home directory. To make
changes to this file, make a copy and place it in your $HOME directory. Make all
changes to the copied file, leaving the default file unchanged.
• Leaving th e default settin g, True, at the maintainStats command line
will allow files to be maintained for a set number of days. These days can be
customized by the user or l eft to the defa ults. If no speci fied number of days is
entered for a file type then the default takes precedence.
• Entering False at the maintainStats command line will disable
maintenance of any files. PeriConsolidator will continue to collect data
without removing any of the old files. Files will continue to be created until
manually removed.
The default number of days for each file type to be saved:
15 minute - 2 days
Hourly - 5 days
Daily - 40 days
Weekly - 60 days
Monthly - 400 days
Yearly - 1800 days
# P0988093 Nortel Networks Confidential Page 45
Page 46

PeriReporter User’s Guide
Logging
When PeriConsolidator runs it creates a log file named pericons.log which is
stored in $ASEHOME/stats. The purpose of th is log is to giv e a brief descr iptio n of
what data PeriConsolidator gathers and consolidates.
When the file size reaches 100K, the data is moved to pericons.log.BAK and
another pericons.log is created.
By default, PeriConsol idator Lo gging is turned on. It can be turned o f f by typi ng -n at
the command line.
pchistory.log
In order to keep track of the las t day in whi ch Peri Conso lidat or succ essful ly ran, a file
in the $ASEHOME/stats directory, called pchistory.log, is used. After each
successful execution of Pe riConsolidator, the date last ran is appended to this file.
Before any subsequent run starts, PeriConsolidator checks this date. If any days are
missing, it will run for those days, appending the file as it runs.
Page 46 Nortel Networks Confidential # P0988093
Page 47

Command Line Options
Option Function
PeriConsolidator Run consolidation for previous day
PeriConsolidator -d MMDDCCYY Run consolidation for specified date
PeriConsolidator -n Turn off Logging
PeriConsolidator -s Show .conspr file settings
PeriConsolidator -version Show current Version running
PeriConsolidator -h Show help message
If you re-run PeriConsolidator for any day using the -d option, the
pchistory.log file will be appended, causing other days to be re-run.
PeriConsolidator
# P0988093 Nortel Networks Confidential Page 47
Page 48

PeriReporter User’s Guide
This page has been intentionally left blank.
Page 48 Nortel Networks Confidential # P0988093
Page 49

PeriDefiner
This chapter covers:
4
1. Purpose
2. PeriDefiner Tool Bar
3. Defining a Report
Page 50

PeriReporter User’s Guide
Purpose
PeriDefiner is a gr aphical ut ility which i s used to set up the con tents and t he display of
a specific report. It allows you to map statistics variables to columns of data. Each
column can have its own heading in relation to the data to be displayed there.
For each column which is mapped to a variable, you can specify the allowable range
for the variable , sort t he dat a in tha t c olumn b y ascen ding or d esc ending order, and se t
which columns take precedence over others.
Launch PeriDefiner
You can choose to launch PeriDefiner in one of three ways - by typing
PeriDefiner at the command line, through PeriView, or through PeriReporter.
Launching PeriDefiner through PeriView
Launch PeriDefiner from t he PeriView Launc her using e ither the Launch menu butt on
or the tool bar.
Open PeriDefiner from the
menu bar
Select:
• Launch
• PeriReporter Tools
Open PeriDefiner from the tool bar
Either double click the PeriReporter Tools button on the
tool bar or drag a tree object onto PeriReporter Tools.
Launch PeriDefiner
Select:
• PeriDefiner
Page 50 Nortel Networks Confidential # P0988093
Page 51

PeriDefiner
Launch PeriDefiner through PeriReporter
Launch PeriDefiner by first launching PeriReporter through PeriView, as previously
described. Once PeriRep orter is open, laun ch PeriDef iner. You can do this using either
the menu options or the tool bar.
Open PeriDefiner from the
menu bar
Select:
• Setup
• Run PeriD efiner
Open PeriDefiner from the
tool bar
Click:
• PeriDefiner button
PeriDefiner launches
Begin defining report
# P0988093 Nortel Networks Confidential Page 51
Page 52

PeriReporter User’s Guide
PeriDefiner Tool Bar
PeriDefiner contains a tool bar at the top of its graphical display. This consists of
buttons which can be clic ked to perform spe cified functi ons within the progr am. Many
of these functions can also be initiated through the program’s pull-down menus.
At certain points in this manual, MPS (Nortel Networks Media Processing Server
Series) is analogous with VPS (Voice Processing Series). This is reflected in specific
file names and directories, as well as certain software features.
Open - Opens a previously created report, in which changes can
then be made.
Save - Used to save changes made to a new or previously created
report.
Print - Used to print a filled report or report definition. This
function will list columns along with their headings, assigned
MPS/VPS numbers, etc. No true statistical data will appear in
these printouts.
Cut - An editing tool used to remove a column or cell from the
report and place it in the clipboard for later use.
Copy - An editing tool used to reproduce an existing column or
cell which has been placed in the clipboard.
Paste - An editing tool used to move a cu t or cop ied column or cell
from the clipboard and insert it preceding the current column.
Left Justify - Moves all text and numbers within a specified
column to t he left-most side of the cells.
Center Justify - Moves all text and numbers within a specified
column to the center of the cells.
Right Justify - Moves all text and numbers within a specified
column to the right-most side of the cells.
Plain - Causes all text a nd numbers in a spe cified column or cell to
display with normal font.
Bold - Caus es all text and number s in a speci fied column or cell t o
display with bold font.
Italics - Causes all text and numbers in a specified column or cell
to display with italicized font.
Page 52 Nortel Networks Confidential # P0988093
Page 53

Open a Report Definition
You can choose to begin a new report definition or modify an existing report
definition. Open an existing report definition from the File menu or tool bar.
Open an existing report
definition or PeriPro folder
from the menu bar
Select:
• File
• Open Report
• Report Definition...
• PeriPro Folder...
Open an existing report
definition from the tool bar
PeriDefiner
or
Click:
• Open button
Choose the specified report
from the corresponding
window
Select:
• Folder
• File
• Click OK
The specified report definition
opens and parameters can now
be modified.
When opening a PeriPro folder, a pre-determined report definition is opened along
with it. This definiti on can then be changed through t he f o ll owi ng st eps , as i f cr ea ti ng
a new report definition, or modifying an existing definition.
# P0988093 Nortel Networks Confidential Page 53
Page 54

PeriReporter User’s Guide
Defining a Report
Defining a report is a 6 step process.
1. Save the Report Definition
2. Update the Report Settings
3. Define Column Formulas and Mappings
4. Update Individual Columns and Cells (optional)
5. Define Su btotals (optional)
6. Define Totals (optional)
Save the Report Definition
It is important to remember to save your Report Definition periodically as you
proceed through th e followi ng steps. You can save the report defi nition by using eit her
the file menu or the tool bar.
Save the Report Definition
from the File Menu
Select:
• File
• Save/Save As...
Save the Report Definition
from the tool bar
Click:
• Save button
Determine If Any Unsaved
Changes Have Taken Place
If changes have not be en save d,
the symbol i n the top, left
corner of the report screen, just
below the Open button, will be
Red. If a save has been made,
the logo will be Black.
Page 54 Nortel Networks Confidential # P0988093
Page 55

PeriDefiner
Update the Report Settings
Use the Report Settings window to determine what your generated report will look
like. Here you can set Report Title, number of rows used for various purposes, the
Report Mode (Standard or Summary), the Detail Level, and the Start and End Time.
Open the Report Settings
window from the menu bar
Select:
• Setup
• Report Settings...
Lines for Report Title
Enter the number of li nes to be made ava ilabl e to en te r a repo rt ti tle by click ing on t he
up and down arrows o r by t yping in a number. The max imum number of l ines allowed
is 5. Each line can have a separate title or be left blank.
Report Title
Enter the title of the report which is to appear at the top of each printed page of the
report. If more than one line has been designated for the report title, choose OK and
then reopen Report Settings. Additional areas for Report Titles will now be present.
# P0988093 Nortel Networks Confidential Page 55
Page 56

PeriReporter User’s Guide
Column Heading Rows
Enter the number of rows to be made available to enter a column heading by clicking
on the up and down arrows or by typing in a number.
Rows per Page
Enter the number of ro ws to be di splay ed on each p age of the repor t by cl ickin g on t he
up and down arrows or by typing in a number. Each row will typically represent one
time interval of the specified consolidation level. A report page will contain the
specified number of rows, ending in a Subtotal row. This will continue to the end of
the report where a Total row will then be displayed.
Rows for Subtotals
Enter the number of rows to be used to di splay subtotals at t he bottom of each page of
the report by clicking on the up and down arrows or by typing in a number.
Rows for Totals
Enter the number of rows to be used to display totals at the end of the report by
clicking on the up and down arrows or by typing in a number.
Report Mode
Report mode is Standard or Summary.
Standard mode means that report data will be displayed by individual time periods in
chronological, or Key Priority, order. For example, a report set to consolidate for 15
minute intervals will display data in one row for each 15 minute period of the day.
Most reports will be in Standard mode.
Summary mode processes multiple days of data and totals them with corresponding
time periods from all include d days. For exa mple, a report se t to consol idate in hourly
intervals in Summary mode will gather the data from each day and display the totals
from each hour in its corresponding row. This is useful if you would like to find out
the busiest time period of a given week, month or year.
Standard is the default mode.
Default Detail Level
Enter the type of report that will act as a default when opening this report definition.
Detail level can be overridden in PeriReporter.
Default Start/ E n d Time
Enter the Start and End time, which will act a s the default when this report de finition
is opened, by typing the time in the boxes. Enter time in 24-hour military format.
Start and End time can be overridden in PeriReporter.
Page 56 Nortel Networks Confidential # P0988093
Page 57

PeriDefiner
Define Column Formulas and Mappings
Defining Column Formulas and Mappings are the most important part of defining a
report.
Column Formulas
Column Formulas allow you to determine what will be represented by a specific
column. Column Formulas include:
v Float or Integer value
lText label
= Mathematical Expression (example- A2+B2)
@ Function (SUM, TOT, AVG, TAVG, MIN, TMIN, MAX, TMAX)
Functions
Function Parameters Example Result
@SUM 2 cells that share a
common row or column;
Column lett er
@TOT Column letter @TOT(A) Adds up all data
@AVG 2 cells that share a
common row or column
@TAVG Column letter @TAVG(A) Adds up all data
@MIN 2 cells that share a
common row or column
@TMIN Column letter @TMIN(A) Finds the smallest
@SUM(A3,D3)
@SUM(A)
@AVG(A3,D3) Adds up all data within
@MIN(A3,D3) Finds the smallest
Adds up all data in
specified cells or
column
excluding heading,
subtotal and total rows
the specified cells and
produces average
excluding heading,
subtotal and total rows
and produces average
number within the
range of specified cells
number excluding title ,
subtotal and total rows
@MAX 2 cells that share a
common row or column
@TMAX Column letter @TMAX(A) Finds the largest
# P0988093 Nortel Networks Confidential Page 57
@MAX(A3,D3) Finds the largest
number within the
range of specified cells
number excluding title ,
subtotal and total rows
Page 58

PeriReporter User’s Guide
To Enter a Column Formula
To designate a Value, Label, Expression, or Function to a column, highlight the entire
column by clicking on the column letter. At this point all cells in the column will
appear white. You can then enter text which will appear a s bl ac k text in the blue input
area at the top of the report. Type the character which identifies the type of Formula,
followed immediately by the contents. Hit retu rn and all appli cable cells in th e column
will be updated.
Examples
Formula Updated Column Example
v123 123
lAugust 20, 1997 August 20, 1997
=A2+B2+C2 (add)
=A2-B2 (subtract)
=A2*B2 (multiply)
=A2/B2 (divide)
=A2%B2 (modulus)
@TOT(A) The sum of column A, excluding
When entering an Ex pre ssi on or a Function, if yo u want the value calc ul ate d on a row
by row basis, and not by individual cells, do not enter a specific row number. For
example, to add columns A and B enter the formula as =A+B. Each cell of that
column will sum the A and B values from the ro w in which they reside.
Data Mapping
Use the Data Mapping window to specify what data will be shown in individual
columns. This can be the da te and t ime pe riod for each row on the gener at ed r epo rt or
statistical information.
To open the Data Mapping window, click on a column letter to highlight the column.
The Column menu will now be enabled on the menu bar.
Sum of cells A2, B2, and C2
Difference between cells A2 and B2
Product of cells A2 multiplied by B2
Quotient of cells A2 divided by B2
Remainder after A2 is divided by B2
heading, subtotal, and total rows
15+4+6=25
23-14=9
17*3=51
42/6=7
20%3=2
Open the Data Mapping
window from the menu bar
Select:
• Column
• Mapping...
Page 58 Nortel Networks Confidential # P0988093
Page 59

PeriDefiner
Column Type
Column Type will determine what type of information will be displayed in a specific
column - Date or Variable.
If Date is chosen than no other information can be entered in this window. The chosen
column will display the date and time period of the statistical data for each row of the
report being generated.
If Variable is chosen then all other information must be entered in this window.
Folder Name
The Folder Name is the folder that contains the datacard that may be desired for the
specified column. Folders containing Application Variables are created in PeriPro.
System Variables are predefined counters which are aut omatica lly inc reme nted by the
system.
For additional information, see the PeriProducer User’s Guide (9090752(I)).
Datacard Nam e
The DataCa rd Name identifies the sub-folder, contained in the previously specified
folder, that contains the information desired for the chosen column.
For additional information, see the PeriProducer User’s Guide (9090752(I)).
MPS/VPS Number
Enter the MPS/VPS number from which you would like the statistics to be generated.
Entering 0 will gather data from all available MPSs/VPSs. If an MPS/VPS number is
designated for this report in the Schedule Statistics Reports window or within the
PeriReporter component, then that choice will override any MPSs/VPSs chosen here.
# P0988093 Nortel Networks Confidential Page 59
Page 60

PeriReporter User’s Guide
Application Variables and Syste m Va riables
The Application Variables and System Variables include all currently available
variables on the system. Double clicking on an item will automatically fill in the data
in the Folder Name and Datacard Name sections of the window.
• The available Application Variables are determined from the
• The System Variables are predefined. Of the System Variables available, ea ch
$ASEHOME/copy directory. PeriDefiner reads in any files ending with
.sre.
report definition can have only one of the following.
System.VPS
System.Line
System.Host
System.Span
If the report is based on one of the above variables then all variables for the
report definition will be collected from sysstats files. Counters for the r est
of the report definition can be any combination of remaining System
Variables.
These System Variables are usually mapped to the first column in pl ace of t he
date. When these variables are used, no column may be mapped to reco rd the
date. If one of these reports is chosen for a particular column and Date is
chosen for another column an error message will appear.
• With the exception of a report based on one of the above System Variables,
report definitions can be mapped to any combination of Application and
System Variables.
Page 60 Nortel Networks Confidential # P0988093
Page 61

PeriDefiner
Update Individual Columns and Cells
Update Individual Columns
Aside from assigning a value, label, expression, or functio n t o a column you may also
choose other options. In Display Fil ters the se include naming the co lumn, choosing an
allowable range of data, choosing which column’s data gets precedence over another,
picking an ascend ing or de scending order for data, or choosin g to hide a column’s data
in a generated report. In Column Appearance these include column width, number of
decimal positions allowed in data and appearance of data.
Display Filters
To open the Display Filters window, click on a column letter to highlight the column.
The Column menu will now be enabled on the menu bar.
Open the Display Filters
window from the menu bar
Select:
• Column
• Filters...
Column Heading
Column Heading is where the name of e ach colu mn, to be displa yed at th e to p of each
page of the report in the Column Heading Row, is entered. If more than one Column
Heading Row was chosen in the Repor t Set ti ngs wind ow then that amount of Column
Heading entry boxes will be displayed. Type in the column heading. You may use as
long a name as you like, keeping in mind the column width. If the amount of
characters exceeds the space of the column then a series of question marks
(??????????) will be displayed in place of the heading. If this happens, increase
Column Width.
For additional information on setting column width, see the Colu mn Appearanc e
section of this manual.
# P0988093 Nortel Networks Confidential Page 61
Page 62

PeriReporter User’s Guide
Key Priority
Key Priority allows you to choo se which columns take preced ence over oth ers. This is
accomplished by assigning a priority number to each column that is to be sorted.
Entering a zero will not assign the column to a Key Priority and it will be sorted
normally. Lower numbered Key Priorities will be given precedence over higher
numbered or zero Key Priorities. Each column must have a unique Key Priority,
unless it is e ntered as zero. Enter a Key Prio rity by clicking on the up and do wn
arrows or typing in a number.
Order
The Order field only has meaning if a non-zero Key Priority is chosen. This will
determine if the column’s data is to be sorted in an Ascending or Descending order.
Display
This function will allow a specified column to be hidden from view. Show is the
default setting for all columns. To prevent a column from appearing on a report click
Hide. This is useful if you would like to perform calculations in a column that you do
not want to display in a generated report. In PeriDefiner a hidden column will display
in black. Hidden columns will not appear at all in the PeriReporter component or in a
generated report.
Page 62 Nortel Networks Confidential # P0988093
Page 63

PeriDefiner
Allowable Range
Allowable Range accepts a simple expression, signaling whether certain data should
be included in the column. If the data satis fies the expression, then it is included; if it
does not, then it, and the en tire row it resides in, is omitted from the report.
Expression Meaning Example
< Include numbers
Less than...
> Include numbers
Greater than...
= Include numbers
Equal to...
<= Include numbers
Less than or Equal to...
>= Include numbers
Greater than or Equal to...
AND Combine two of
the above expressions
OR Combine two of
the above expressions
# < 10
Include only numbers Less than 10
# > 10
Include only numbers Greater than 10
# = 10
Include only numbers Equal to 10
# <= 10
Include only numbers Less than or
Equal to 10
# >= 10
Include only numbers Greater than or
Equal to 10
# < 10 AND #> 5
Include only numbers Less than 10
AND Greater than 5 (include numbers
within that range)
# < 10 OR #> 20
Include only numbers Less than 10 OR
Greater than 20 (leave out all numbers
in between that range)
Column Appearance
To open the Column Appearance window, click on a column letter to highlight the
column. The Column menu will now be enabled on the menu bar.
Open the Column
Appearance window from t he
menu bar
Select:
• Column
• Appearance...
# P0988093 Nortel Networks Confidential Page 63
Page 64

PeriReporter User’s Guide
Column Width
Column Width determines how wide the cells of th e column will be. If a Column
Heading or value does not fit in the allotted column size a series of question marks
(??????????) will be displayed. If this happens, increase the Column Width. Enter the
Column Width by clicking on the up and down arrows or typing in a number. The
default setting is 103 units.
Number of Decimals
Number of Decimals allows you to set how much detail for the data to displ ay by
specifying the amount of decimal positions. Make sure the Column Width is set wide
enough to account for the Number of Decimals. Enter the Number of Decimals by
clicking on the up and down arrows or typing in a number.
Justification
Justification determines the visual placement of data in the column. The choice is
Left, Right or Center.
Font and Style
Both Font and Style determine the look of the data and heading of a column. Choose
Font type and Style of that particular font by clicking on the respective buttons.
Update Individual Cells
Any individual cell can have its contents set to a value, label, expression, or function,
as long as the column in which it resides is not already defined. To update a cell,
highlight the cell and update its contents in the same fashion as entering a Column
Formula. When a cell is selected, its current contents are displayed in the blue input
area at the top of the report in whit e te xt . The defa ult content of any cell is a value, so
if the cell is currently empty a “v” will appear in the input area.
Page 64 Nortel Networks Confidential # P0988093
Page 65

PeriDefiner
Define Subtotals
T o defi ne Sub totals, sc roll down th e rep ort unti l you come to the rows in green . These
cells are where subtotals will be displayed. Subtotals appear at the end of every page
of the report. To enter Subtotal information, highlight a cell defined as Subtotal and
update its contents in the same fashion as entering a Column Formula using the
@SUM(column letter) function. When defining a Subtotal the text in the blue input
area at the top of the report will be white. Hit return and the cell will be updated.
Subtotal row colors are configurable. If the color has been adjusted then they will
appear on screen as th e color last set. Con fi gur e screen colors fro m the Screen Colors
window.
Define Totals
T o defin e Tota ls, scrol l down the re port unti l you come to the rows i n blue. Thes e cells
are where totals will be di splayed. Totals appear at the end of the generated report. To
enter Total in for mat ion, highlight a cell def ined as Total and update it s con tents in the
same fashion as entering a Column Formula using the @TOT(column letter) function.
When defining a Total, text in the blue input area at the top of the report will be white.
Hit return and the cell will be updated.
Total row colors are conf igurable. If the color has bee n adjusted then they will appear
on screen as the color last set. Configure screen colors from the Screen Colors
window.
If you would like a tot al or subt otal for t he ent ire column, enter only the co lumn le tter
after the function.
# P0988093 Nortel Networks Confidential Page 65
Page 66

PeriReporter User’s Guide
Options
Column Mappings
The Column Mappings window allows you to view the parameters that have been set
to all columns at the same time. To open the Column Mappings window , use the menu
bar.
Open the Column Mappings
window from the menu bar
Select:
• Setup
• Column Mappings...
The report definition shown in the above example has column A mapped to a Date.
Column F is mapped to the SUM function. Columns G and H are mapped to calculate
mathematical express ions. The remainin g colu mns are map ped to variabl es and are set
to record Application Statistics. All columns are mapped to record data from all
available MPSs/VPSs. No editing can be done in the Column Mappings window.
Column Filters
The Column Filters window allows you to vi ew the filters a ssigned to all columns
with an Allowable Range and/or Key Priority and to see if the columns are to be
Shown or Hidden, at the same time. To open the Column Filters window use the menu
bar.
Page 66 Nortel Networks Confidential # P0988093
Page 67

Open the Column Filters
window using the menu bar
Select:
• SetUp
• Column Filters...
PeriDefiner
The report definition shown in the above example has columns B, D and G set to an
Allowable Range. All other columns will gather all data from their assigned places
regardless of value. The window also shows which columns will be sorted to display
data in Ascending and Descending order along with Key Priority and whether a
column is to be Hidden or Shown.
The top sub-window displays the columns in column order. The bottom sub-window
displays columns accordin g to Key Priority.
Clear All Keys
The Clear All Keys but ton will remove all current Key Prior ities. If no col umns are set
with Key Priorities then t he button will not be enable d. A win dow pr ompt wil l ap pea r
after choosing this option asking for confirmation.
Clear All Ranges
The Clear All Ranges button will remove all cur rent Allowa ble Ranges. If no columns
are set for Allowable Ranges then the button will not be enabled. A window prompt
will appear after choosing this option asking for confirmation.
Show All Columns
The Show All Columns button will make all Hidden columns visible in the report
definition. If no columns are set to Hide then the button will not be enabled. A
window prompt will appear after choosing this option asking for confirmation.
# P0988093 Nortel Networks Confidential Page 67
Page 68

PeriReporter User’s Guide
!
Global Settings
The Global Settings win dow allows you to set the maximum number of rows, col umns
and preview intervals f or al l report definitions . Sele ct Globa l Set t ings using the Setup
menu.
Any changes made in Global Settings are saved in the .perireporter file.
Open the Global Settings
window from the menu bar
Select:
• Setup
• Global Settings
• Configuration...
Installation S it e
Enter the name of the site from which these reports are to be generated. This will
identify different reports from different locations. This is useful in keeping track of
reports if there are several sites from which data is collected. You may enter any
desired text to help in identifying each individual report. The Installation Site will
appear on the first page of each printed report.
The inclusion of an Installation Site is optional.
Number of Rows
Enter the maximum number of rows that the report will consist of by clicking on the
up and down arrows or typing in a number.
Be sure to allow enou gh rows f or the repor t to co mplet e runn ing . If th e repor t run s out
of room PeriReporter will attempt to make the proper adjustments to accommodate
the report. If this can not occur, a warning message will appear indicating how many
rows are needed to finish generating the e ntire report.
Number of Columns
Enter the maximum number of columns of statistical data that the report will consist
of by clicking the up and down arrows or typing in a number.
Page 68 Nortel Networks Confidential # P0988093
Page 69

PeriDefiner
Preview Intervals
Enter the number of rows o f statist ical da ta that will b e shown when Preview i s chosen
from the PeriReporter tool bar by clicking the up and down arrows or typing in a
number. Each row represents one tim e interval of the generated report.
After changes are made in the Global Settings window a pop-up screen will appear
asking if you would l ik e t o save the changes you have made to this re port definition if
you have not previously performed a save.
Any Global Setting changes made here will affect all report definitions.
Screen Colors
The Screen Colors window allows you to change the color of specific areas of all
report definitions. Access the Screen Colors window using the Setup menu.
Any changes made in the Screen Colo rs win dow are saved in the .perireporte r
file.
Open the Screen Colors
window from the menu bar
Select:
• Setup
• Global Settings
• Screen Colors...
# P0988093 Nortel Networks Confidential Page 69
Page 70

PeriReporter User’s Guide
!
Change Color
Click on the button next to the area of which you would like to change the color. The
current color setting will appear in the sample cube in the middle of the window.
Change the color by adj ustin g the Red, Gree n, and Blue slide bars at the bot tom o f the
window. To the right of each bar is the maxi mum set ti ng. To the left of each bar is the
setting the bar is currently at. Pressing the Reset button will set all colors back to
where they were when the window was opened. After adjusting colors, click OK.
When report colors are modified, these changes will only take place on-screen.
Printed reports will remain in black and white.
Make sure not to set the Foreground and Background colors to the same settings. If
this happens the report will appear all one color and no data will be visible. Return to
the Screen Colors window and click the Restore button. Then re-adjust colors.
Any Screen Color changes made here will affect all report definitions.
Fill/Empty Report
Selecting Fill Report will insert sample data into one page of the open report
definition. This will give you an idea of what the generated report will look like. To
clear sample data from a report definition, select Empty Report. Select Fill/Empty
Report using the file menu.
Choose Fill/Empty Report
from the menu bar
Select:
• File
• Fill Report
or
• Empty Report
Saving a filled report definition will cause the sample data to be removed from all
cells before the save takes place.
Page 70 Nortel Networks Confidential # P0988093
Page 71

PeriDefiner
Print the Report Definition
You can chose to print the filled report definition to see what a generated report will
look like or print the definition itself to see how each column is mapped. Open the
Print Setup window from the File menu or the tool bar.
Any changes made in the Print Setup wi ndow are s aved i n the .perireporter file.
Open the Print Setup window
from the menu bar
Select:
• File
• Print...
Open the Print Setup window
from the tool bar
Click:
• Print button
Print Command
Enter the printer desti nati on of the doc ument to be printe d. This is t he same command
that would be entered elsewhere on your system to allocate a specific printer.
Point Size
Point Size controls the size of the data to be displayed in the printed report definition.
Change the Point Size by clicking on the up and down arrows or typing in a number.
Point Size is disabled if Print Report Definition is chosen.
# P0988093 Nortel Networks Confidential Page 71
Page 72

PeriReporter User’s Guide
!
Leading Size
Leading Size controls the vertical size of the cells in the printed report definition.
Change the Leading Size by clicking the up and down arrows or typing in a number.
Leading Size is disabled if Print Report Definition is chosen.
Be careful not to make the Point S ize lar ge r than the Leadin g Size. If th is happens , th e
data will overflow out of the cells, making the printed report definition difficult to
read.
Print Report Definition
Choosing this option will print a table labeling the column mappings, formulas, and
styles. An example of this table is below.
Col. Heading Mps# Date Folder Variable Formula Key
ADate 0 T 0
B# of
Calls
CTotal 0 F Total SUM(B,G)0
Order Range Show Dec. Align Height Width FontStyle
A true 0 C 33 131 TimesRoman
B #>20 true 0 C 33 103 TimesRoman
C true 0 C 33 103 TimesRoman
Choosing Print Report Definition will also create a table labeling the Subtotal and
Total rows, along with any Special Cells that may be mapped. An example of this
table is below.
Column: Subtotals Rows: Totals Rows: Special Cells:
A Subtotal Total
B SUM(B) TOT(B)
0FTestCalls 0
Italic
Bold
C SUM(C) TOT(C) B4+C6
Turning off the Print Report Definition button will allow the report to be printed so
you may see what it will look like once it is generated. You may also print the report
with Filled data.
The default setting in PeriDefiner is for the Print Report Definition button to be on.
Page 72 Nortel Networks Confidential # P0988093
Page 73

PeriDefiner
Paper Size
Page Size allows you to choose the paper the report definition will be printed on.
Letter is standard 8 1/2 x 11 paper. A4 is a European standard of paper size. Letter is
the default setting.
Page Orientation
Page Orientation allows you to choose how the report definition will be displayed on
the paper. Portrait will print the report definition vertically. Landscape will print the
report definition horizontally. Landscape will also allow more columns to be
displayed across the page. Landscape is the default setting.
Page Orientation is disabled if Print Report Definition is chosen.
Print Scope
Print Scope will allow you to choose between printing one entire page of a Filled
report or only what is displayed on the monitor. Entire is the default setting.
Entire will only print one page of the report in PeriDefiner, as opposed to the fully
generated report in the PeriReporter component. This is simply to give an example of
what a generated report may look like.
Print Scope is disabled if Print Report Definition is chosen.
Grid Lines
Grid Lines allows you to choose how to show the cell divisions on the printed report
definition. The lines can either be Solid or Dashed. You can also choose to have no
visible lines by clicking off both options. No lines is the default setting.
Page Layout
• Full Size
Clicking the Full Size button will print the report with the number of Rows
per Page specified in the Report Settings window.
• Fit To Page
Clicking the Fit To Page button will fit as many rows vertically and as many
columns horizontally on the page as possible, before starting a new page.
• Horizontal Adjustment
Clicking the Horizontal Adjustment button will force the report to either
spread the columns out or condense the column width in order to fit all of the
columns onto the width of the page. If the report consists of many columns,
choosing this option may make the generated report difficult to read as it will
be minimized to fit onto the page width.
Full Size is the default setting.
Page Layout is disabled if Print Report Definition is chosen.
# P0988093 Nortel Networks Confidential Page 73
Page 74

PeriReporter User’s Guide
Print and Postscript
Clicking on the Print button will p rint th e repor t defin ition a ccording to the parame ters
you have set in the Print Setup wi ndow. Clicking on the Postscript button will save the
print definition to a postscript file, but will not print the report. This file will be named
Reportname.prd.ps.
If you change the report d efini tion, a nd would st ill l ike to s ave thi s versi on, remember
to change the name of the repo rt or el se this one will ov erwrit e the pre vious de fi niti on.
Command Line Options
These options can be specified when starting PeriDefiner from the command line.
Option Parameter Function
-h Show Help
-version Show version of PeriDefiner running
report[.prd] Load Report
Help Menu
PeriDefiner has an extensive on-line Help menu. You can choose to use the Table of
Contents or the scroll bars to search for a desired topic. You can move back and forth
between topics by using the Forward and Back buttons. The name of the current help
file is displayed in the URL box. You can switch to the PeriReporter help file by
typing in PeriReporter.html.
To activate the Help window, click the word Help in the menu bar.
Page 74 Nortel Networks Confidential # P0988093
Page 75

PeriReporter
This chapter covers:
5
1. Purpose
2. PeriReporter Tool Bar
3. Generating a Report
Page 76

PeriReporter User’s Guide
Purpose
The PeriReporter component is a graphical utility which is used to generate reports.
The report (created in PeriDefiner) must be specified, along with the date and the
consolidation level, after which it can be generated and printed.
Launch PeriReporter
You can choose to launch PeriReporter in one of two ways - by typing
PeriReporter at the command line or through PeriView.
Launching PeriReporter through PeriV iew
Launch PeriReporter from the PeriView Launcher using either the Launch menu
button or the tool bar.
Open PeriReporter from the
menu bar
Select:
• Launch
• PeriReporter Tools
Open PeriReporter from the tool bar
Either double click the PeriReporter Tools button on the
tool bar or drag a tree object onto PeriReporter Tools.
Launch PeriReporter
Select:
• PeriReporter
Page 76 Nortel Networks Confidential # P0988093
Page 77

PeriReporter Tool Bar
PeriReporter contains a tool bar at the top of its graphical display. This consists of
buttons which can be clic ked to perform spe cified functi ons within the progr am. Many
of these functions can also be initiated through the program’s pull-down menus.
PeriReporter
At certain points in this manual, MPS (Nortel Networks Media Processing Server
Series) is analogous with VPS (Voice Processing Series). This is reflected in specific
file names and directories, as well as certain software features.
Open - Opens a report definition cre ated in PeriDefi ner. No
changes can be made to the report parameters .
Print - Used to print the generated report, complete with statistical
data or the report definition.
Report Scope - Used to select a range of dates and times, report
type, and MPS/VPS #s that will be used in the generated report.
Generate - Used to create the specified report for the dates and
detail level selected.
Preview - Used to display only a specified number of rows from a
generated report.
Graph - Used to activate the Graph Setup window, from which
data can be displayed in a series of eight different graph types.
PeriDefiner - Used to initiate running PeriDefiner, in which report
definitions can be created or modified.
# P0988093 Nortel Networks Confidential Page 77
Page 78

PeriReporter User’s Guide
Generating a Report
Generating a report is a 3 step process.
1. Open a Report Definition
2. Select a Report Scope
3. Generate the Report
Open a Report Definition
Open a Report Definition using either the File menu or the tool bar. PeriReporter will
accept specification of either a report definition or a .folder file created by
PeriProducer.
For additional information on creating a .folder file, refer to the PeriProducer
User’s Guide (9090752(I)).
Open a Report Definition or
PeriPro folder fr om the menu
bar.
Select:
• File
• Open Report
• Report Definition...
or
• PeriPro Folder...
Choose the specified report
from the corresponding
window
Select:
• Folder
• File
• Click OK
The specified report definition
or PeriPro fo lder opens
Page 78 Nortel Networks Confidential # P0988093
Page 79

Open a Report Definition
from the tool bar
Click:
• Open button
Choose the specified Report
Definition
Select:
• Folder
• File
• Click OK
PeriReporter
The specified report definition
opens
# P0988093 Nortel Networks Confidential Page 79
Page 80

PeriReporter User’s Guide
Select a Report Scope
The Report Scope window allows you to select a start and end date, start and end
times, consolidation level, and MPS/VPS number for the specified report. Open the
Report Scope window from the Setup menu or the tool bar.
Open the Report Scope
window from the menu bar
Select:
• Setup
• Report Scope...
Open the Report Scope
window from the tool bar
Click:
• Report Scope button
Start Date a n d E n d Da te
In the Start Date field, enter the date you would like the generated report to begin
with.
In the End Da te field, enter the date you would like the generated report to end with.
The date must be entered in MM/DD/CCYY format.
If the End Date i s left blank t hen the r eport wil l only b e generat ed fo r the da y specif ied
in the Start Date field.
Page 80 Nortel Networks Confidential # P0988093
Page 81

PeriReporter
Start Time and End Time
In the Start Time field, enter the time you would like the generated report to begin
with on the Start Date. In the End Time field, enter the time you would like the
generated report to end with on the End Date. The time must be entered in HH:MM
format as military time.
A report generated in Standard mode will contain all data for all dates specified,
beginning with the Start Time and completing with the End Time. A report defined to
run in Summary mode will o nly c ontain d ata acc umulated b etween t he hours indicat ed
for the spec ified dates.
Report Mode Start/End Date/Time Generated Report Data
Standard 01/05/1997 - 02/10/1997
08:00 - 17:00
Summary 01/05/1997 - 02/10/1997
08:00 - 17:00
The default times are: Start - 00:00 / End - 23:59.
Start and End times are only used for 15 minute and hourly consolidated reports.
In a 15 minute consolidated report, Start Time will round backward to the nearest
quarter hour, while End Time will round forward to the nearest quarter hour.
For example, if a Start Time of 02:17 is entered the report will adjust to begin
gathering data at 02:15. If an End Time of 05:23 is entered the report will adju st to
finish gathering data at 05:29.
In an hourly consolidated report, Start Time will round backward to the nearest hour,
while End Time will round forward to the nearest hour.
For example, if a Start Time of 02:17 is entered the report will adjust to begin
gathering data at 02:00. If an End Time of 05:23 is entered the report will adju st to
finish gathering data at 05:59.
All statisti cal data
gathered between 8am,
Jan. 5, 1997 and 5pm,
Feb. 10, 1997.
Statistical data gathered
between the hours of 8am
and 5pm will be summed
for each like time period,
from Jan. 5, 1997 to Feb.
10, 1997.
Override Column MPS/VPS Numbers
Clicking the Override Column MPS/VPS Numbers button allows you to choose one
or more MPSs/VPSs from which to gather data, regardless of the MPSs/V PSs to
which the individu al col umns of the specified r epor t def ini t ion are mapped. Zero may
also be chosen to specify all MPSs/VPSs.
When choosing this option, you will need to enter the MPS/VPS numbers in the
MPS/VPS Range box.
# P0988093 Nortel Networks Confidential Page 81
Page 82

PeriReporter User’s Guide
MPS/VPS Range
The MPS/VPS Range box allows you to choose which MPSs/VPSs the report will
collect data from. In this box you may enter one or more MPS/VPS numbers in the
following fashions.
• 1, 2, 4, 6, ...
• 1-4, 6, 8-10, ...
You may also enter “0” to collect data from all available MPSs/VPSs.
Detail Level
The Detail Level optio n allows you to choose the c ons olidation level for t he spec ified
report.
There are six different Detail Levels:
• 15-minute
• hourly
• daily
• weekly
• monthly
• yearly
Reports run for all Detail Levels, except 15-minute, will not be available for
generation until the following day, after PeriConsolidator has run. 15-minute reports
are available every hour for the previous hour.
List Files in Range
Click the List Files in Range button to see which files meet the criteria for the Start
Date and End Date you have selected for this report.
Generate the Report
To Generate the Report with true statistical data, use the file menu or the tool bar.
Generate the Report from the
menu bar
Select:
• File
• Generate
Generate the Report from the
tool bar
Click:
• Generate
Page 82 Nortel Networks Confidential # P0988093
Page 83

Graphs
PeriReporter
Once a report has been generated, a graph may be made of the collected data. This is
useful for comparing data from separate columns. The columns may represent
counters, formulas or functions.
Graphing will only be enabled after a report has been generated.
To create a Graph, use the file menu or the tool bar.
Open the Graph Setup box
from the menu bar
Select:
• File
• Graph
Open the Graph Setup box
from the tool bar
Click:
• Graph
# P0988093 Nortel Networks Confidential Page 83
Page 84

PeriReporter User’s Guide
Graph Type
Choose the type of graph you would like t o have your data dis played in thr ough use of
the pull-down menu. There are a total of eight different graph types.
Plot Graph
Plot graphs display the data in a series of high and low points connected by lines.
Plot graphs can display any number of columns. Each column will display in a
different color.
Placing the cursor over any point on the graph will display the date and count for that
point.
To zoom in and get a close up view of any part of the graph, click the left mouse
button on the speci fied area. The z oom feature is parti cularly helpful i f a graph ha s too
much information crowded together, as may be the case with a 15 minute generated
report. The zoom feature may be use d numerous times to get conti nual ly clo ser views
a particular area of the graph. Press the <R> key to return to normal view.
To change the axis of the graph, either left and right or up and down, depress the
TRL> key while holding the left mouse button . Then move the gr aph to the desired
<C
position. Press the <R> key to return to normal view.
Page 84 Nortel Networks Confidential # P0988093
Page 85

PeriReporter
Bar Graph
Bar graphs display the data in a series of high and low points represented by solid
vertical bars.
Bar graphs can display any number of columns. Each column will display in a
different color.
Placing the curso r over any point on a p articul ar bar will display t he date an d count for
that bar.
To zoom in and get a close up view of any part of the graph, click the left mouse
button on the speci fied area. The z oom feature is parti cularly helpful i f a graph ha s too
much information crowded together, as may be the case with a 15 minute generated
report. The zoom feature may be use d numerous times to get conti nual ly clo ser views
a particular area of the graph. Press the <R> key to return to normal view.
To change the axis of the graph, either left and right or up and down, depress the
TRL> key while holding the left mouse button . Then move the gr aph to the desired
<C
position. Press the <R> key to return to normal view.
To rotate the graph on a three dimensional plane, depress the <S
HIFT> key while
holding the left mouse button. Then rotate the graph to the desired position. There is
no reset for this option.
# P0988093 Nortel Networks Confidential Page 85
Page 86

PeriReporter User’s Guide
Area Graph
Area graphs display the data in very much the same manner as Plot Graphs. A series
of high and low poin ts are sh own as fille d areas, wi th each co unter ove rlaying a nother.
The order in which counters are chosen determines which data will lay over others.
The first chosen counter will appear in the background, while the last chosen will
remain up front.
Area graphs can display any number of columns. Each column will display in a
different color.
Placing the cursor over any point in a particular area will display the date and count
for that point.
To zoom in and get a close up view of any part of the graph, click the left mouse
button on the speci fied area. The z oom feature is parti cularly helpful i f a graph ha s too
much information crowded together, as may be the case with a 15 minute generated
report. The zoom feature may be use d numerous times to get conti nual ly clo ser views
a particular area of the graph. Press the <R> key to return to normal view.
To change the axis of the graph, either left and right or up and down, depress the
TRL> key while holding the left mouse button . Then move the gr aph to the desired
<C
position. Press the <R> key to return to normal view.
Page 86 Nortel Networks Confidential # P0988093
Page 87

PeriReporter
Candle Graph
Candle graphs display the data in a series of opening, closing, high and low points
represented by vert ical bars and lines. The bar depicts an open ing and closing number
for a time period. A solid bar denotes a rising number, while an empty bar denotes a
falling number. The line depicts a high and low for that period.
Candle graphs are helpful when tracking financial information, such as stock prices,
for a specific time period. The following example shows how a Candle graph would
represent this.
High during period
Opening number
This graph
denotes a falling
number
Closing numbe r
Low during period
Candle graphs must be s et to disp lay a seri es of four separat e columns. Any numbe r of
columns above four, must be divisible by four. (8, 12, 16...)
Placing the cursor over any point on a particular line will display the date and count
for that point.
To zoom in and get a close up view of any part of the graph, click the left mouse
button on the speci fied area. The z oom feature is parti cularly helpful i f a graph ha s too
much information crowded together, as may be the case with a 15 minute generated
report. The zoom feature may be use d numerous times to get conti nual ly clo ser views
a particular area of the graph. Press the <R> key to return to normal view.
To change the axis of the graph, either left and right or up and down, depress the
TRL> key while holding the left mouse button . Then move the gr aph to the desired
<C
position. Press the <R> key to return to normal view.
# P0988093 Nortel Networks Confidential Page 87
Page 88

PeriReporter User’s Guide
Hilo Graph
Hilo graphs display the da ta in a s imilar wa y to Candle graphs, wi th a ser ies o f vertical
lines. The high and low points of the data are represented by t he top and bott om points
of the lines.
Hilo graphs must be set to display a series of two separate columns. Any number of
columns above two, must be divisible by two. (4, 6, 8...)
Placing the cursor over any point on a particular line will display the date and count
for that point.
To zoom in and get a close up view of any part of the graph, click the left mouse
button on the speci fied area. The z oom feature is parti cularly helpful i f a graph ha s too
much information crowded together, as may be the case with a 15 minute generated
report. The zoom feature may be use d numerous times to get conti nual ly clo ser views
a particular area of the graph. Press the <R> key to return to normal view.
To change the axis of the graph, either left and right or up and down, depress the
TRL> key while holding the left mouse button . Then move the gr aph to the desired
<C
position. Press the <R> key to return to normal view.
Page 88 Nortel Networks Confidential # P0988093
Page 89

PeriReporter
Pie Graph
Pie graphs display the data as individual sections of a circle, or slices of a pie. 15
Minute, Hourly, Weekly, Monthly, and Yearly reports will have data displayed in a
series of graphs, eac h represe nting a di ff erent time peri od. Daily re ports wil l have data
displayed as a single graph, representing the entire time period.
An example of a Pie graph based on a Daily report is shown below.
Pie graphs must display a minimum of two columns. Each column will display in a
different color.
Placing the cursor over any section on a particular pie will display the date and count
for that section.
To rotate the graph on a three dimensional plane, depress the <S
HIFT> key while
holding the left mouse but to n. Then move the mouse to rotate the graph to the d esi re d
position. There is no reset for this option.
There is no zoom feature associated with the Pie graph, therefore it is not
recommended that reports which contain large amounts of time intervals, such as 15
minute reports, be graphed in this style. Hourly, Daily, Weekly, Monthly and Yearly
reports, which have fewer time intervals, are generally easier to read.
If the Pie graph attempts to d i splay too many time intervals for the space of th e
window, the dates and times may run together, making them difficult to read. If this
occurs, resize the window to space the graphs apart.
# P0988093 Nortel Networks Confidential Page 89
Page 90

PeriReporter User’s Guide
Scatter Graph
Scatter graphs display the data in a si mil ar way to Plot graphs, wit h th e exception that
there are no lines connecting the individual points.
Scatter graphs can display any number of columns. Each column will display in a
different color.
Placing the cursor over any point in the graph will display the date and count for that
point.
To zoom in and get a close up view of any part of the graph, click the left mouse
button on the speci fied area. The z oom feature is parti cularly helpful i f a graph ha s too
much information crowded together, as may be the case with a 15 minute generated
report. The zoom feature may be use d numerous times to get conti nual ly clo ser views
a particular area of the graph. Press the <R> key to return to normal view.
To change the axis of the graph, either left and right or up and down, depress the
TRL> key while holding the left mouse button . Then move the gr aph to the desired
<C
position. Press the <R> key to return to normal view.
Page 90 Nortel Networks Confidential # P0988093
Page 91

PeriReporter
Stacking Graph
Stacking graphs display the data in a similar way to Bar Graphs, with the exception
that the vertical bars are placed on top of one another.
Stacking graphs can display any number of columns. Each column will display in a
different color.
Placing the curso r over any point on a p articul ar bar will display t he date an d count for
that bar.
To zoom in and get a close up view of any part of the graph, click the left mouse
button on the speci fied area. The z oom feature is parti cularly helpful i f a graph ha s too
much information crowded together, as may be the case with a 15 minute generated
report. The zoom feature may be use d numerous times to get conti nual ly clo ser views
a particular area of the graph. Press the <R> key to return to normal view.
To change the axis of the graph, either left and right or up and down, depress the
TRL> key while holding the left mouse button . Then move the gr aph to the desired
<C
position. Press the <R> key to return to normal view.
To rotate the graph on a three dimensional plane, depress the <S
HIFT> key while
holding the left mouse button. Then rotate the graph to the desired position. There is
no reset for this option.
# P0988093 Nortel Networks Confidential Page 91
Page 92

PeriReporter User’s Guide
Grid Lines
Grid Lines allows you to choose how to show the grid lines on the specified graph.
You can also choose to have either solid grid lines or no grid lines displayed.
Columns Available
The Columns Available fiel d shows which c olumns are able to be chosen for the
specified graph. These will generally be the columns for which data has been collected
or formula columns for the generated report.
Add
To add a column to be graphed, click on the column letter within the box and then
click A
Titles Available
Titles available indicates the titles of a highlighted column. These are the titles which
can be used to identify the column within the graph. The tit les listed in the Titles
Available menu will be names given to the columns in the Report Settings window,
located in PeriDefiner.
DD.
If only one Line For Report Title was specified in the Report Settings window then
there will only be one title listed.
If more than one Line For Report Title was specifie d in the Report Settings window,
then a choice of titles, one from each Title Line plus one combining all titles, will be
available.
Selected Columns
Columns selected to be included in the graph will be displayed in this box.
Change
To change the title of a selected column, choose the specified column to highlight it,
choose the desired title in the Titles Available pull down menu and then click
HANGE.
C
Delete
You may choose to remove a column that has been selected by clicking on the
specified column to highlight it, and then clicking D
ELETE.
Graph Click the G
RAPH button when you are ready to view the graph.
Page 92 Nortel Networks Confidential # P0988093
Page 93

Options
!
PeriReporter
Global Settings
The Global Settings win dow allows you to set the maximum number of rows, col umns
and preview intervals for all reports. Select Global Settings using the Setup menu.
Any changes made in Global Settings will be saved in the .perireporter file.
Open the Global Settings
window from the menu bar
Select:
• Setup
• Global Settings
• Configuration...
Installation S it e
Enter the name of the site from which these reports are to be generated. This will
identify different reports from different locations. This is useful in keeping track of
reports if there are several sites from which data is collected. You may enter any
desired text to help in identifying each individual report. The Installation Site will
appear on the first page of each printed report.
The inclusion of an Installation Site is optional.
Number of Rows
Enter the maximum number of rows that the report will consist of by clicking on the
up and down arrows or typing in a number.
Be sure to allow enou gh rows f or the repor t to co mplet e runn ing . If th e repor t run s out
of room PeriReporter will attempt to make the proper adjustments to accommodate
the report. If this can not occur, a warning message will appear indicating how many
rows are needed to finish generating the e ntire report.
Number of Columns
Enter the maximum number of columns of statistical data that the report will consist
of by clicking the up and down arrows or typing in a number.
# P0988093 Nortel Networks Confidential Page 93
Page 94

PeriReporter User’s Guide
Preview Intervals
Enter the number of rows o f statist ical da ta that will b e shown when Preview i s chosen
from the PeriReporter tool bar by clicking the up and down arrows or typing in a
number. Each row represents one time interval of the generated report.
After changes are made in the Global Settings window a pop-up screen will appear
asking if you would l ike to save the chan ges you have made to thi s re por t definition if
you have not previously performed a save.
Any Global Setting changes made here will affect all reports.
Screen Colors
The Screen Colors window allows you to change the color of specific areas of all
reports. Access the Screen Colors window using the Setup menu.
Any changes made in the Screen Colors window will be saved in the
.perireporter file.
Open the Sc reen Colors
window from the menu bar
Select:
• Setup
• Global Settings
• Screen Colors...
Page 94 Nortel Networks Confidential # P0988093
Page 95

PeriReporter
!
Change Color
Click on the button next to the area of which you would like to change the color. The
current color setting will appear in the sample cube in the middle of the window.
Change the color by adj ustin g the Red, Green, and Blue slide bars at the bot tom o f the
window. To the right of each bar is the maxi mum set ti ng. To the left of each bar is the
setting the bar is currently at. Pressing the Reset button will set all colors back to
where they were when the window was opened. After adjusting colors, click OK.
When report colors are modified, these changes will only take place on-screen.
Printed reports will remain in black and white.
Be sure not to set the Foreground and Background colors to the same settings. If this
happens the report will appear all one color and no data will be visible. Return to the
Screen Colors window and click the Restore button. Then re-adjust colors.
Any Screen Color changes made here will affect all reports.
Preview a Report
Choose Preview when onl y a spe cifi ed number of ti me int erval s of t he repo rt ar e to b e
viewed. Configure the number of Preview intervals in the Global Settings window.
Select Preview fro m the Fil e menu or the Pre vie w button on the t ool bar.
# P0988093 Nortel Networks Confidential Page 95
Page 96

PeriReporter User’s Guide
Export/Import
Using Export will reformat the report and create a ta b sep ar ated ASCII file which can
be read by a spreadsheet program. Import can be used to reload a pre vi ously exported
report into PeriReporter. Access the Export and Import functions from the File menu.
Open the Export and Import
windows from the menu bar
Select:
• File
• Export
• Import
Choose the file where the tab
separated ASCII file is to be
written to or retrieved from in
the corresponding window
or
Select:
• Folder
• File
• Enter File Name
• Click OK
For additional information on the Export function, see Destination on page 19.
Page 96 Nortel Networks Confidential # P0988093
Page 97

PeriReporter
Print a Generated Report
You can chose to print the entire generated report, only the portion displayed on the
screen, or only the report definition of the specified report. Select Print from the File
menu or the tool bar.
Any changes made i n t he Pr int Setup window will b e s ave d in the .perireporter
file.
Open the Print Setup window
from the menu bar
Select:
• File
• Print...
Open the Print Setup window
from the tool bar
Click:
• Print button
Print Command
Enter the printer desti nati on of the doc ument to be printe d. This is t he same command
that would be entered elsewhere on your system to allocate a specific printer.
Point Size
Point Size controls the size of the data to be displayed in the printed report. Change
the Point Size by clicking on the up and down arrows or typing in a number.
Point Size is disabled if Print Report Definition is chosen.
# P0988093 Nortel Networks Confidential Page 97
Page 98

PeriReporter User’s Guide
!
Leading Size
Leading Size controls the vertical size of the cells in the printed report. Change the
Leading Size by clicking on the up and down arrows or typing in a number.
Leading Size is disabled if Print Report Definition is chosen.
Be careful not to make the Point S ize lar ge r than the Leadin g Size. If th is happens , th e
data will overflow the cells, making the printed report difficult to read.
Print Report Definition
Choosing this option will print a table labeling the column mappings, formulas, and
styles. An example of this table is below.
Col. Heading Mps# Date Folder Variable Formula Key
ADate 0 T 0
B# of
Calls
CTotal 0 F Total SUM(B,G)0
Order Range Show Dec. Align Height Width FontStyle
A true 0 C 33 131 TimesRoman
B #>20 true 0 C 33 103 TimesRoman
C true 0 C 33 103 TimesRoman
Choosing Print Report Definition will also create a table labeling the Subtotal and
Total rows, along with any Special Cells that may be mapped. An example of this
table is below.
Column: Subtotals Rows: Totals Rows: Special Cells:
A Subtotal Total
BSUM(B) TOT(B)
0FTestCalls 0
Italic
Bold
CSUM(C) TOT(C)B4+C6
The default setting in PeriReporter is for the Print Report Definition button to be off.
Paper Size
Paper Size allows you to specify the paper the generated report will be printed on.
Letter is standard 8 1/2 x 11 paper. A4 is a European standard of paper size. Letter is
the default setting.
Page 98 Nortel Networks Confidential # P0988093
Page 99

PeriReporter
Page Orientation
Page Orientation allows you to choose how the generated report will be displayed on
the paper. Portrait will print the report vertically. Landscape will print the report
horizontally. Landsca pe will als o allow more col umns to be disp layed acros s the page.
Landscape is the default setting.
Page Orientation is disabled if Print Report Definition is chosen.
Print Scope
Print Scope will allow you to choose between printing the entire generated report or
only the portion which is displayed on the computer monitor. Entire is the default
setting.
Print Scope is disabled if Print Report Definition is chosen.
Grid Lines
Grid Lines allows you to choose how to show the cell divisions on the printed report.
The lines can either be Solid or Dashed. You can also choose to have no visible lines
by clicking off both options. No lines is the default setting.
Page Layout
• Full Size
Clicking the Full Size button will print the report as the number of Rows per
Page specified in the Report Settings window.
• Fit To Page
Clicking the Fit To Page button will fit as many rows vertically and as many
columns horizontally on the page as possible, before starting a new page.
• Horizontal Adjustment
Clicking the Horizontal Adjustment button will force the generated report to
either spread the columns out or condense the column width in order to fit all
of the columns onto the width of the page. If the report consists of many
columns, choosing this opti on may make the ge nerat ed report di f ficu lt to read
as it will be minimized to fit onto the page width.
Full Size is the default setting.
Page Layout is disabled if Print Report Definition is chosen.
Print and Postscript
Clicking on the Print button will p rint t he genera ted rep ort a ccording to the parame ters
you have set in the Print Setup wi ndow. Clicking on the Postscript button will save the
generated report to a postscript file, without printing it.
For additional information on the PostScript function, see Destination on page 19.
If you change the report d efini tion, a nd would st ill l ike to s ave thi s versi on, remember
to change the name of the repo rt or el se this one will ov erwrit e the pre vious de fi niti on.
# P0988093 Nortel Networks Confidential Page 99
Page 100

PeriReporter User’s Guide
Other Functions
Some functions which are u sed in Per iDefiner are not configur able in t he PeriRep orter
component.
• The Data Mapping, Display Filters, and Column Appearance windows, all of
• The Report Settings, Column Mappings, and Column Filters windows, all of
Command Line Options
These options can be specified when starting PeriReporter from the command line.
Option Parameter Function
which are accessed through the Column menu, can be viewed only. No
changes can be made here.
which are accessed through the Setup menu, can be viewed only. No changes
can be made here.
-b report[.prd]
-sdate MM/DD/CCYY
-edate MM/DD/CCYY
(optionally -stime and
-etime can be chosen)
-ps Create postscript file (runs in batch
-sdate MM/DD/CCYY Set Start date
-edate MM/DD/CCYY Set End date
-stime HH:MM Set Start Time (military format)
-etime HH:MM Set End Time (military format)
-t h(hourly), d(daily),
w(weekly), m(monthly),
y(yearly)
-h Show Help
-v # Override MPS/VPS number
Batch mode (print report without
viewing)
Multiple reports can be generated by
typing additional report names at the
command line.
mode)
Set Report Type (default - 15 minute)
-version Show version of PeriReporter running
report[.prd] Load Report
Page 100 Nortel Networks Confidential # P0988093
 Loading...