

Page 1

Nortel Business Communications Manager 5.0
Fault and Performance
Management
Release: 5.0
Document Revision: 01.01
NN40170-701
Page 2

Document status: Standard
Document issue: 01.01
Document date: August 2009
Product release: BCM 5.0
Job function: Fault and Performance
Type: Technical Publication
Language type: EN
Copyright © 2009 Nortel Networks
All Rights Reserved.
NORTEL, the globemark design, and the NORTEL corporate logo are trademarks of Nortel
Networks.
Page 3

Contents
New in this release 7
Features 7
Introduction 9
Fault and performance management fundamentals 11
BCM fault management scope 11
BCM alarms 12
Alarm administration 12
Alarms and LEDs 18
SNMP traps manager for remote monitoring 18
Alarm configuration scope 19
Fault management 7
System metrics 7
Telephony metrics 7
LED status 7
Alarms 7
Alarms and log files 12
Alarm severities 12
Alarms and the Alarms Panel 13
Alarm banner 14
Alarm set 15
Alarm to email forwarding 16
Alarm profile 17
Using the BCM fault management system 21
Administering alarms 21
Monitoring an alarm condition 22
Acknowledging an alarm 22
Clearing the alarm log 23
Using the alarm banner 24
Including or omitting acknowledged alarms in the Alarm Banner 24
Using the alarm set 24
Configuring the alarm set 24
Clearing an alarm from the alarm set 25
Copyright © 2009, Nortel Networks
Nortel Business Communications Manager 5.0
Fault and Performance Management
NN40170-701 01.01 Standard
August 2009
Page 4

4 Contents
Responding to LED indicators 25
Reset the status LED 25
Configuring alarm behavior 25
Notifying and selecting an alarm profile 26
Notify and select an alarm profile 26
Enabling or disabling SNMP traps for alarms 26
Enabling or disabling monitoring for selected alarms 27
Monitoring settings for the alarm set 27
Testing an alarm 28
Configuring an email 28
Adding, modifying, and deleting an email account 29
Enabling or disabling forwarding of alarms 30
Alarm Severity reference 31
Alarm Severities 31
Default mapping of severity levels 31
Alarm graph colors in the Business Element Manager 32
System metrics monitoring 33
QoS Monitoring 33
Configuring the QoS monitor 35
Configuring QoS logging attributes 35
Viewing QoS logs 36
UPS metrics 37
Accessing the UPS status 38
NTP metrics 38
Accessing the NTP metrics 39
Telephony metrics monitoring 41
Proactive Voice Quality Management 41
Setting the PVQM threshold settings 43
Viewing PVQM telephony metrics 47
Activity Reporter Basic 48
Enabling Activity Reporter Basic 48
Disabling Activity Reporter Basic 49
Trunk module metrics 50
Viewing the trunk module status 50
Viewing performance history information 50
Viewing D-channel information 51
Disabling or enabling a B-channel setting 51
Provisioning a PRI B-channel 52
Trunk module CSU statistics 52
BCM trunk module CSU statistics navigation 53
Enabling the internal CSU 54
Checking the performance statistics 54
Copyright © 2009 Nortel Networks
Nortel Business Communications Manager 5.0
Fault and Performance Management
NN40170-701 01.01 Standard
August 2009
Page 5

Contents 5
Checking the CSU alarms 55
Checking carrier failure alarms 55
Checking bipolar violations 56
Checking short-term alarms 57
Checking defects 57
Viewing CSU alarm history 58
CbC limit metrics 58
Accessing CbC limit metrics 58
Clearing CbC limit metrics 60
Hunt group metrics 60
Accessing Hunt Group metrics 60
Resetting the Hunt Group metrics 62
PSTN Fallback metrics 62
Accessing PSTN Fallback metrics 62
Resetting PSTN Fallback metrics 63
System LEDs reference 65
System status monitor LEDs 65
Alarm reference 67
Copyright © 2009 Nortel Networks
Nortel Business Communications Manager 5.0
Fault and Performance Management
NN40170-701 01.01 Standard
August 2009
Page 6

6 Contents
Copyright © 2009 Nortel Networks
Nortel Business Communications Manager 5.0
Fault and Performance Management
NN40170-701 01.01 Standard
August 2009
Page 7

New in this release
The information in this chapter applies to both the BCM50 and the BCM450
platforms running BCM 5.0.
This document contains information about the alarms and performance
metrics supported in the BCM system in Release 5.0.
Navigation
• Features (page 7)
Features
This document contains information about the following features in Release
5.0.
Fault management
You can view and manage alarms and SNMP traps on the BCM system. For
more information, see Using the BCM fault management system (page 21).
System metrics
You can view detailed information about the performance of the BCM and
about the performance of system resources. For more information, see
System metrics monitoring (page 33).
Telephony metrics
You can view detailed information about the performance of telephony
services on the BCM system. For more information, see Telephony metrics
monitoring (page 41)
LED status
The LEDs on the BCM hardware provide information about the status of the
system. For more information, see System LEDs reference (page 65).
Alarms
This document provides a reference to alarms supported on the BCM system.
For information about the alarm reference, see Alarm reference (page 67).
Copyright © 2009 Nortel Networks
.
Nortel Business Communications Manager 5.0
Fault and Performance Management
NN40170-701 01.01 Standard
August 2009
Page 8

8 New in this release
Copyright © 2009 Nortel Networks
Nortel Business Communications Manager 5.0
Fault and Performance Management
NN40170-701 01.01 Standard
August 2009
Page 9

Introduction
The information in this document applies to both the BCM50 and the BCM450
platforms running BCM 5.0.
This document contains information about how to manage alarms generated
by the BCM 5.0 system and administer alarm settings.
Navigation
• Fault and performance management fundamentals (page 11)
• Using the BCM fault management system (page 21)
• Alarm Severity reference (page 31)
• System metrics monitoring (page 33)
• Telephony metrics monitoring (page 41)
• System LEDs reference (page 65)
• Alarm reference (page 67)
Copyright © 2009 Nortel Networks
Nortel Business Communications Manager 5.0
Fault and Performance Management
NN40170-701 01.01 Standard
August 2009
Page 10

10 Introduction
Copyright © 2009 Nortel Networks
Nortel Business Communications Manager 5.0
Fault and Performance Management
NN40170-701 01.01 Standard
August 2009
Page 11

Fault and performance management fundamentals
The information in this chapter applies to both the BCM50 and the BCM450
platforms running BCM 5.0.
This section provides information about managing alarms generated by the
system and administering alarm settings.
Navigation
• BCM fault management scope (page 11)
• BCM alarms (page 12)
• Alarm administration (page 12)
• Alarm to email forwarding (page 16)
• Alarms and LEDs (page 18)
• SNMP traps manager for remote monitoring (page 18)
• Alarm configuration scope (page 19)
BCM fault management scope
You can view and manage real-time alarms generated by the BCM system.
Alarms arise from components that run on the system; these alarms indicate
faults or informational conditions that may require resolution from the system
administrator. Examples of alarm conditions include:
• a T1 circuit on the system is down
• an administrator stopped a service that runs on the BCM
You can receive alarm information through any of the following means:
• the Alarms Panel in the Business Element Manager
• the Alarm Banner in the Business Element Manager
• Simple Network Management Protocol (SNMP) traps for remote
management of faults
Nortel Business Communications Manager 5.0
Fault and Performance Management
NN40170-701 01.01 Standard
Copyright © 2009 Nortel Networks
August 2009
Page 12

12 Fault and performance management fundamentals
• email notification - alarm email notification can be per alarm or based on
alarm severity
You can manage alarms and alarm information by:
• configuring alarm settings, for example, filter alarms so that only the
desired subset of alarms display in the Business Element Manager Alarms
Panel are sent as SNMP traps
• administering alarms, for example, acknowledge selected alarms and
clear the alarm log
• email notification, for example configuring settings so you receive
notification about all critical alarms
BCM alarms
Software components that run on the BCM system generate alarms related to
BCM services and applications.
Each component includes a range of alarm IDs, so each BCM alarm retains a
unique alarm ID.
Alarms and log files
The system logs all alarms that appear in the Business Element Manager
Alarms Panel in the alarms.systemlog file. This file is capped at 1 MB in size;
when the file reaches this size, the system creates a new alarms.systemlog
file. The BCM keeps the current file as well as three previous files. A new file
starts when the BCM system reboots.
You can retrieve the alarms.systemlog files (the current file and the three
previous files) from the BCM system using the Log Management task in the
Business Element Manager. You can view the files using the BCM Log
Browser. For more information, see the BCM 5.0 Administration and Security
Guide (NN40170-603).
Alarm severities
By default, all major and critical alarms are visible on the alarm set, sent as
email or SNMP traps. Most, but not all alarms are visible in the Business
Element Manager Alarm Panel. When BCM raises a Critical, Major, Minor and
Warning alarm, this is reflected in the Alarm Banner.
Alarm administration
Alarm information can be delivered to you by any of the following means:
• on a table on the alarms panel
• email notification
Copyright © 2009 Nortel Networks
Nortel Business Communications Manager 5.0
Fault and Performance Management
NN40170-701 01.01 Standard
August 2009
Page 13

• on the alarm banner on the bottom right corner of the Business Element
Manager
• on the alarm set
Alarms and the Alarms Panel
You can view real-time alarm information using the Alarms Panel in the
Business Element Manager. Each alarm has a unique identifier. Alarms are
displayed in the Alarms table, sorted by date and time by default, with the
newest at the top of the table. The Alarms table displays from 100 to 1000
alarms. For information about setting the number of alarms that are displayed,
see Configuring the alarm set (page 24). The Alarms table contains the
following elements:
• Time — the date and time of the alarm
• Alarm Acked — indicates whether the Business Element Manager has
acknowledged the alarm.
• Alarm ID — the unique alarm ID associated with the alarm
• Severity — the severity of the alarm (Critical, Major, Minor, Warning, and
Information)
Fault and performance management fundamentals 13
• Problem Description — a description of the alarm condition
• Component ID — the process that has generated the alarm, in a 3-part DN
format. The component ID always identifies the system as a BCM,
includes the name of the system that generated the alarm, and identifies
the component that generated the alarm. In this way, remote monitoring
stations can easily identify what type of system generated an SNMP trap
and which system generated the trap.
When you select an alarm in the table, an Alarm Details pane is displayed for
the selected alarm. The Alarm Details pane displays the following information:
• Time — the date and time of the alarm
• Problem description — a description of the alarm condition
• Problem resolution — the course of action for the alarm
You can acknowledge an alarm to indicate that you are troubleshooting an
alarm. You can specify whether to include acknowledged alarms in the Alarm
Banner so that the alarm count remains concise.For more information about
the Alarm Banner, see Alarm banner (page 14).The alarm list in the Business
Element Manager remains after BCM reboots.
Copyright © 2009 Nortel Networks
Nortel Business Communications Manager 5.0
Fault and Performance Management
NN40170-701 01.01 Standard
August 2009
Page 14

14 Fault and performance management fundamentals
Alarm banner
You can use the Alarm Banner in the Business Element Manager to view
current alarm counts and recent alarm activity on the BCM system. The Alarm
Banner appears on the bottom-right corner of the Business Element Manager
window. The Alarm Banner is visible at all times, so you do not have to
navigate to the Alarms Panel to view alarms. If you notice a change in alarm
conditions in the Alarm Banner — for example a red spike in the Critical
category — you can navigate to the Alarms Panel to view the actual alarm.
Alarm banner
The Alarm Banner provides counts of Critical, Major, Minor, and Warning
alarms; Information alarms are not included. You can specify whether to
include acknowledged alarms in the Alarm Banner.
Each alarm severity counter has a graph, which represents a data sample of
the last 20 polling intervals. The system polls for new alarms every 30 seconds
by default. The graph has a color to indicate a data change. The colors are as
follows:
Table 1 Alarm graph colors
Color Indicates
Green There are no alarms of this severity, or there are
alarms of this severity but the count has decreased
since the last polling interval.
Yellow There are alarms of this severity, but they are older
than at least one polling interval.
Red A new alarm has occurred since the last polling
interval.
If you clear the alarm log from the Business Element Manager, the alarms
displayed on the Alarm Banner are also cleared and reset to 0.
Copyright © 2009 Nortel Networks
Nortel Business Communications Manager 5.0
Fault and Performance Management
NN40170-701 01.01 Standard
August 2009
Page 15

Alarm set
You can view critical and major alarms on a telephone set on the BCM system.
This allows a system administrator to monitor alarm activity without having a
Business Element Manager and a personal computer.
You can specify the telephone to serve as the alarm set in the Business
Element Manager. The telephone set used for alarms must have a 2-line
display and three soft keys.
The alarm set displays an alarm as follows:
XXXXX-YYYY
Where XXXXX is the alarm ID and YYYY is additional alarm information.
The following options are available when an alarm is sent to the alarm set:
• Time — indicates the date and time when the alarm occurred
• Clear — use this soft key to remove the alarm from the alarm set
Fault and performance management fundamentals 15
Attention: Clearing an alarm from the alarm set does not change the status
of alarms on the Business Element Manager or reset the LEDs on the front
panel of the unit.
Attention: When an alarm is displayed on the alarm set, it remains visible
until you clear the alarm by using a softkey on the alarm set. More recent
alarms are not be displayed until the current alarm is cleared on the alarm
set.
The following figure shows an example of an alarm on the alarm set.
Figure 1 Alarm set alarm
Copyright © 2009 Nortel Networks
Nortel Business Communications Manager 5.0
Fault and Performance Management
NN40170-701 01.01 Standard
August 2009
Page 16

16 Fault and performance management fundamentals
Alarm to email forwarding
You can forward alarms to email and use the email forwarding option to
• monitor alarms on the BCM
• forward alarms to a third party for the BCM support
Destinations you have provisioned to receive alarms have the following
parameters:
• variable number of TO recipients
• variable number of CC recipients
•From field
• Simple Mail Transfer Protocol (SMTP) server field that can be IP address
or hostname
• SMTP port
• option to enable Transport Layer Security (TLS)
• option to enable authentication
• user name and password for SMTP authentication
The following alarm details are included in the alarm email notification:
•title
— hostname
— alarm severity
— alarm ID
• email body
— date of alarm
— alarm ID
— alarm severity
— alarm description
— alarm resolution
Use the Test Alarm feature in the Business Element Manager to test the
settings.
If any of the destinations do not successfully receive the email, the alarms are
not retransmitted. To view the alarms, log into the Business Element Manager
or download the alarm.systemlog.
Copyright © 2009 Nortel Networks
Nortel Business Communications Manager 5.0
Fault and Performance Management
NN40170-701 01.01 Standard
August 2009
Page 17

Emails are not sent under the following conditions:
• network failure between the BCM and the SMTP server
• invalid SMTP server address or SMTP port
• conditions causing the SMTP server to reject the email including wrong
TO address, wrong FROM address, or incorrect user ID and password
details
Alarm profile
An alarm profile simplifies alarm management by automatically enabling or
disabling alarms in bulk based on their severity. This can be done for each
supported alarm destination. BCM supports five profiles, as detailed in Table
2.
The BCM supports the following alarm destinations:
• Business Element Manager alarm list — viewable in the alarm panel of the
Business Element Manager
• Email — alarm is sent as an email to any provisioned destinations
Fault and performance management fundamentals 17
• SNMP — alarm is sent as a SNMP trap to any configured trap receivers
• Alarm set — alarm is sent to the BCM designated telephone set
See Table 2 for details on the alarm profile types.
To refine alarms that should be sent to a specified destination, select the
alarm profile name and the alarm destination, and then apply settings. For
more information about selecting an alarm profile, seeNotify and select an
alarm profile (page 26).
Table 2 BCM alarm profiles
Profiles Description
Critical Any alarm in this category has critical alarm designation.
Critical and Major This category has critical and major alarm designation.
Critical, Major and Minor Any alarm in this category has critical, major or minor alarm
designation.
All All possible alarms.
None -
Copyright © 2009 Nortel Networks
Nortel Business Communications Manager 5.0
Fault and Performance Management
NN40170-701 01.01 Standard
August 2009
Page 18

18 Fault and performance management fundamentals
Alarms and LEDs
When an alarm condition occurs on the system, the Status LED on the front
of the BCM main unit, changes to reflect the alarm condition. In normal
operation, both LEDs are green. All alarms with a severity of Major and Critical
change the Status LED to solid red, except in the event of a Failed Startup
Profile, which is indicated by a flashing red LED.
Using the Business Element Manager, you can reset the Status LEDs on the
front pane of the BCM 5.0 to a normal state.
Attention: Once the Status LED has changed to red in response to a Critical
or Major alarm condition, it remains in the alarmed state until you reset it
using the Business Element Manager.
For information about LEDs and what they indicate, see System LEDs
reference (page 65).
SNMP traps manager for remote monitoring
You can use an SNMP trap manager to remotely monitor BCM alarms via
SNMP traps. A trap is an indication from the BCM system to configured trap
managers that an alarm has occurred in the BCM system. Any BCM alarm
can generate an SNMP trap.
If you want the BCM to send SNMP traps, you must first configure the SNMP
agent using the Business Element Manager. You must enable an SNMP agent
and then configure how the system handles SNMP trap notifications. For
information about configuring SNMP settings, see Enabling or disabling
SNMP traps for alarms (page 26).
The BCM system uses the Small Site Events Management Information Base
(MIB) for alarms. The trap format is specified in this MIB. You capture and view
traps using any standard SNMP fault monitoring framework or trap watcher.
By default, the BCM sends SNMP traps for alarms with a severity of Major and
Critical. You can change the default alarms that are set for SNMP to limit the
volume and type of SNMP information, and to control essential information
that is transferred on the network. For information about how to change the
default alarms, see Configuring the alarm set (page 24).
Copyright © 2009 Nortel Networks
Nortel Business Communications Manager 5.0
Fault and Performance Management
NN40170-701 01.01 Standard
August 2009
Page 19

Alarm configuration scope
Although the BCM system provides a default mapping of alarms that are
displayed in the Alarms table and that are sent as an SNMP trap, you may
want to monitor additional alarms using either of these means, or you may
want to reduce the number of alarms that are displayed in the Alarms table or
sent via SNMP traps.You can specify how each alarm is handled, according
to your business requirements.
You can specify the following settings for alarms:
• the maximum number of alarms displayed in the Alarms Panel (from 100
to 1000)
• whether to enable or disable SNMP traps for selected alarms; by default,
the system sends all Critical and Major alarms as SNMP traps if you
specify one or more trap destinations
• whether to display selected alarms in the Alarms table; by default all
Critical, Major, Minor, and Warning alarms are displayed in the Alarms
table
• whether to display selected alarms on the alarm set; by default, only
Critical and Major alarms are sent to this set
Fault and performance management fundamentals 19
You can also test a selected alarm. This allows you to test whether the LED or
SNMP traps are functioning as expected. Testing an alarm generates an
alarm in the system. Alarms generated using the Test Alarm feature are
identified in the Alarms table by the words “Test Event” in the alarm Problem
Description field.
For more information about using SNMP to monitor your system see, the BCM
5.0 Configuration—Telephony Guide (NN40170-502).
Copyright © 2009 Nortel Networks
Nortel Business Communications Manager 5.0
Fault and Performance Management
NN40170-701 01.01 Standard
August 2009
Page 20

20 Fault and performance management fundamentals
Copyright © 2009 Nortel Networks
Nortel Business Communications Manager 5.0
Fault and Performance Management
NN40170-701 01.01 Standard
August 2009
Page 21

Using the BCM fault management system
The information in this section applies to both the BCM50 and the BCM450
platforms running BCM 5.0.
This section describes how to manage alarms generated by the BCM system
and administer alarm settings.
Using the BCM fault management system navigation
• Administering alarms (page 21)
• Using the alarm banner (page 24)
• Using the alarm set (page 24)
• Responding to LED indicators (page 25)
• Configuring alarm behavior (page 25)
• Notify and select an alarm profile (page 26)
• Configuring an email (page 28)
Administering alarms
This section contains information on the following topics:
• Monitoring an alarm condition (page 22)
• Acknowledging an alarm (page 22)
• Clearing the alarm log (page 23)
Copyright © 2009 Nortel Networks
Nortel Business Communications Manager 5.0
Fault and Performance Management
NN40170-701 01.01 Standard
August 2009
Page 22

22 Using the BCM fault management system
Monitoring an alarm condition
Use the following procedure to monitor an alarm condition.
Procedure steps
Step Action
1 Click the Administration tab.
2 Open the General folder, and then click the Alarms task.
The Alarm page opens.
3 In the Alarms Panel table, select an alarm.
The Alarm Details pane displays below the Alarms table.
4 To change the order of columns in the Alarm table, select a column and drag
it left or right to the desired location, and release it.
5 To view a column by ascending or descending order, click the column
heading.
6 To sort columns, right-click a column heading.
The Sort dialog box opens.
7 Sort columns as required, and then click OK.
8 The columns in the Alarms table are sorted according to your
specifications.
Acknowledging an alarm
Use the following procedure to acknowledge an alarm.
Procedure steps
Step Action
1 Click the Administration tab.
2 Open the General folder, and then click the Alarms task.
The Alarms pane opens.
--End--
Copyright © 2009 Nortel Networks
Nortel Business Communications Manager 5.0
Fault and Performance Management
NN40170-701 01.01 Standard
August 2009
Page 23

3 In the Alarms table, select the alarm you want to acknowledge.
The Alarm Details pane is displayed below the Alarms table.
4 On the Alarms Details pane, click the Acknowledge Alarm button.
A check box appears in the Alarm Acked column in the Alarms table for this
alarm.
Attention: Acknowledging the alarm does not clear the alarm; it indicates only that
you have noted it.
Clearing the alarm log
Use the following procedure to clear the alarm log.
Procedure steps
Step Action
Using the BCM fault management system 23
--End--
1 Click the Administration tab.
2 Open the General folder, and then click the Alarms task.
The Alarms pane opens.
3 On the Alarms pane, click the Clear Alarm Log button.
The Alarms table is cleared. You will be able to see all new alarms only after
the next alarm polling interval.
--End--
Copyright © 2009 Nortel Networks
Nortel Business Communications Manager 5.0
Fault and Performance Management
NN40170-701 01.01 Standard
August 2009
Page 24

24 Using the BCM fault management system
Using the alarm banner
Use the alarm banner to view current alarm counts and recent alarm activity
on the BCM system.
Including or omitting acknowledged alarms in the Alarm Banner
Use the following step to include or omit acknowledged alarms in the Alarm
Banner.
Procedure steps
Step Action
1 Select or clear the Include Acked Alarms check box in the Alarm Banner.
Using the alarm set
Use the alarm set to monitor alarm activity without having a Business Element
Manager and a personal computer.
--End--
Configuring the alarm set
Use the following steps to configure the alarm set.
Procedure steps
Step Action
1 Click the Configuration tab.
2 Open the Telephony folder.
3 Open the Global Settings folder, and then click the Feature settings task.
The Feature Settings page opens.
4 In the Feature Settings area, enter the DN of the telephone set that you
want to use for the alarm set in the Alarm Set field.
--End--
Copyright © 2009 Nortel Networks
Nortel Business Communications Manager 5.0
Fault and Performance Management
NN40170-701 01.01 Standard
August 2009
Page 25

Clearing an alarm from the alarm set
Use the following step to clear an alarm from the alarm set.
Procedure steps
Step Action
1 On the alarm set, press the Clear soft key. The alarm is cleared from the
alarm set.
Responding to LED indicators
Use the Business Element Manager to reset the Status LEDs on the front
panel of the BCM to a normal state.
Reset the status LED
Use the following steps to reset the status LED.
Using the BCM fault management system 25
--End--
Procedure steps
Step Action
1 Click the Administration tab.
2 Open the General folder, and then click the Alarms task.
The Alarms pane opens
3 On the Alarms pane, click the Reset LEDs button.
The Status LED on the front panel of the BCM is reset from red to normal
operation green.
Configuring alarm behavior
Configure alarm behavior to specify the following settings for alarms:
• the maximum number of alarms to display in the Alarms Panel (from 100
to 1000)
• whether to enable or disable SNMP traps for selected alarms; if you have
specified an SNMP trap destination, by default you will receive all Critical
and Major alarms
--End--
Copyright © 2009 Nortel Networks
Nortel Business Communications Manager 5.0
Fault and Performance Management
NN40170-701 01.01 Standard
August 2009
Page 26

26 Using the BCM fault management system
• whether to display selected alarms in the Alarms table; by default all
Critical, Major, Minor, and Warning alarms are displayed in the Alarms
table
• whether to display selected alarms on the alarm set; by default, only core
telephony Critical and Major alarms are sent to this set
• use email forwarding
Notifying and selecting an alarm profile
Use the Alarm Setting panel to select the Notification Type which describes
where the alarm will be presented and Profile Selection which selects an
alarm profile.
Notify and select an alarm profile
Use the following procedure to select a Notification Type and an Alarm Profile.
Step Action
1 Click on the Administration tab.
2 Open the General folder, and then click the Alarm Settings task.
The Alarm Settings panel opens.
3 Select the Notification Type that you want from the list.
4 Select the Profile Selection that you want from the list.
--End--
Enabling or disabling SNMP traps for alarms
Use the following procedure to enable to disable SNMP traps for alarms.
Procedure steps
Step Action
1 Click the Administration tab.
2 Open the General folder, and then click the Alarm Settings task.
Copyright © 2009 Nortel Networks
Nortel Business Communications Manager 5.0
Fault and Performance Management
NN40170-701 01.01 Standard
August 2009
Page 27

Using the BCM fault management system 27
3 In the Alarm Settings table, select an alarm.
4 In the Enable SNMP Trap column, select or clear the check box to enable
or disable SNMP traps for the selected alarm. If you select the check box for
a selected alarm, an SNMP trap will be generated if that particular alarm
condition occurs.
--End--
Enabling or disabling monitoring for selected alarms
Use the following procedure to enable or disable alarms.
Procedure steps
Step Action
1 Click the Administration tab.
2 Open the General folder, and then click the Alarm Settings task.
The Alarm Settings pane opens.
3 In the Alarms Settings table, select an alarm.
4 In the Enable GUI View column, select or clear the check box to enable or
disable a view of the selected alarm in the Alarms Panel. If you clear the
check box for a selected alarm, the alarm will not be displayed in the Alarms
table if that particular alarm condition occurs in the system.
Monitoring settings for the alarm set
Use the following procedure to monitor settings for the alarm set.
Procedure steps
Step Action
1 Click the Administration tab.
2 Open the General folder, and then click the Alarm Settings task.
The Alarm Settings pane opens.
--End--
Copyright © 2009 Nortel Networks
Nortel Business Communications Manager 5.0
Fault and Performance Management
NN40170-701 01.01 Standard
August 2009
Page 28

28 Using the BCM fault management system
3 In the Alarms table, select an alarm.
4 The Enable Alarm Set column indicates whether the alarm will display on
the alarm set.
Testing an alarm
Use the following procedure to test an alarm.
Procedure steps
Step Action
1 Click the Administration tab.
2 Open the General folder, and then click the Alarm Settings task.
The Alarm Settings pane opens.
3 In the Alarm Settings table, select an alarm.
4 Click the Test Alarm button.
--End--
In the Alarms table, “Test Event” is displayed in the alarm Problem
Description field.
Configuring an email
Use the Email Setting panel in the Business Element Manager to set and
retrieve the SMTP settings.
--End--
Copyright © 2009 Nortel Networks
Nortel Business Communications Manager 5.0
Fault and Performance Management
NN40170-701 01.01 Standard
August 2009
Page 29

Using the BCM fault management system 29
Adding, modifying, and deleting an email account
Use the following procedure to add, modify, or delete an email account.
Procedure steps
Step Action
1 Click on the Configuration tab.
2 Open the Administration Access folder, and then click on the Email
Settings task.
The Email Settings panel appears.
3 To add an email account, click the Add button.
The Add Account panel appears.
4 Configure the Add Account parameters.
5 Click OK to add an email account.
6 To modify an email account, select an email account that you want to modify.
7 Modify the attributes by clicking the Modify button.
8 To delete an email account, select an email account that you want to delete.
9 Click the Delete button. A confirmation message appears.
10 Click Yes to confirm to deletion.
--End--
Copyright © 2009 Nortel Networks
Nortel Business Communications Manager 5.0
Fault and Performance Management
NN40170-701 01.01 Standard
August 2009
Page 30

30 Using the BCM fault management system
Variable definitions
Variable Value
SMTP server Hostname or IP address of SMPT server
SMTP port The port for the SMPT server
Default is 25
To address A series of email addresses separated by comma that the mail
will be sent to
CC address A series of email addresses separated by comma that the mail
will be CC'ed to
From address The email address the alarm will be sent from
Default is bcm5.0@nortel.com
Use encryption Select Use encryption check box to enable TLS encryption
Default is disabled
SMTP authentication Select SMTP authentication check box to enable SMTP
authentication
Default is disabled
Enabling or disabling forwarding of alarms
Use the following procedure to enable or disable forwarding of alarms to the
SMPT destinations.
Procedure steps
Step Action
1 Click on the Administration tab.
2 Open the General folder, and then click the Alarm Settings task.
The Alarm Settings panel opens.
3 In the Alarms Settings table, select an alarm.
4 In the Enable Email column, select or clear the check box to enable or
disable forwarding of alarms. If you clear the check box, the email is not sent
to the selected SMTP destination.
--End--
Copyright © 2009 Nortel Networks
Nortel Business Communications Manager 5.0
Fault and Performance Management
NN40170-701 01.01 Standard
August 2009
Page 31

Alarm Severity reference
The information in this section applies to both the BCM50 and the BCM450
platforms running BCM 5.0.
This section contains information about Alarm Severities, default mapping of
security levels, and Alarm graph colors in the Business Element Manager.
Navigation
• Alarm Severities (page 31)
• Default mapping of severity levels (page 31)
• Alarm graph colors in the Business Element Manager (page 32)
Alarm Severities
Alarm severities are as follows:
Table 3 Alarm severities
Alarm Severity Description
Critical Immediate corrective action is required due to conditions such as loss of service,
loss of bandwidth, outage, loss of data, and/or functionality
Major Urgent corrective action is required due to conditions such as pending loss of
service, outage, loss of data, and/or functionality
Minor Corrective action is required to prevent eventual service-affecting degeneration
Warning Indicates the detection of a potential or impending service-affecting condition and
that some diagnostic action is required
Information Indicates audit-type information, such as configuration changes
Default mapping of severity levels
Use the following table to view the default mapping of each severity level
against the Alarms Panel, alarms set, LEDs, and SNMP.
Nortel Business Communications Manager 5.0
Fault and Performance Management
NN40170-701 01.01 Standard
Copyright © 2009 Nortel Networks
August 2009
Page 32

32 Alarm Severity reference
Table 4 Default mapping of severity levels
Alarm
Severity
Critical Yes Yes Yes Yes Yes
Major Yes Yes Yes Yes Yes
Minor Yes No No No Yes
Warning Yes No No No No
Information Yes No No No Yes
Alarms Panel LEDs SNMP Alarm Set (core
telephony
alarms only)
Email
forwarding
Alarm graph colors in the Business Element Manager
Use the following table to view alarm graph colors in the Business Element
Manager.
Table 5 Alarm graph colors in Business Element Manager
Color Indicates
Green There are no alarms of this severity, or there are alarms of this severity but the
count has decreased since the last polling interval.
Yellow There are alarms of this severity, but they are older than at least one polling
interval.
Red A new alarm has occurred since the last polling interval.
Copyright © 2009 Nortel Networks
Nortel Business Communications Manager 5.0
Fault and Performance Management
NN40170-701 01.01 Standard
August 2009
Page 33

System metrics monitoring
The information in this section applies to both the BCM50 and the BCM450
platforms running BCM 5.0.
You can use the Business Element Manager to view detailed information
about the performance of the BCM and about the performance of system
resources. This chapter provides procedures for monitoring quality of service
(QoS) and other system metrics.
Using the Business Element Manager, you can monitor overall system
performance and other performance-related information.
You can monitor system metrics using the following tools:
• QoS Monitoring
• UPS Status
• NTP Metrics
This section contains information on the following topics:
• QoS Monitoring (page 33)
• UPS metrics (page 37)
• NTP metrics (page 38)
QoS Monitoring
QoS Monitor monitors the quality of service (QoS) of IP trunk services. The
tool periodically monitors the delay and packet-loss of IP networks between
two peer gateways. The main objective of the QoS Monitor is to allow new IP
telephony calls to fall back to the PSTN if the voice quality of the IP network
falls below the specified transmit threshold.
For information about setting the transmit threshold, see Nortel Business
Communications Manager 5.0 Configuration—Telephony (NN40170-502).
You can set the threshold in the Business Element Manager in the Telephony
Resources panel.
Copyright © 2009 Nortel Networks
Nortel Business Communications Manager 5.0
Fault and Performance Management
NN40170-701 01.01 Standard
August 2009
Page 34

34 System metrics monitoring
QoS system metrics monitoring procedures
This task flow shows you the sequence of tasks you perform to monitor QoS
statistics on the BCM system. To link to any procedures, click on QoS system
metrics monitoring procedures navigation (page 34).
Figure 2 QoS system metrics monitoring procedures
QoS system metrics monitoring procedures navigation
• Configuring the QoS monitor (page 35)
• Configuring QoS logging attributes (page 35)
• Viewing QoS logs (page 36)
Copyright © 2009 Nortel Networks
Nortel Business Communications Manager 5.0
Fault and Performance Management
NN40170-701 01.01 Standard
August 2009
Page 35

Configuring the QoS monitor
You configure the QoS Monitor using the QoS Monitor panel on the
Administration tab. You can configure the following:
• the monitoring mode
• logging parameters
Procedure steps
Step Action
1 Click the Administration tab.
2 In the Navigation tree, click System Metrics >QoS Monitor.
3 From the Monitoring Mode drop-down menu, select a monitoring mode.
Table 6 Variable definitions
System metrics monitoring 35
--End--
Variable Value
Disabled —
Enabled in Link-Monitor mode Continuously test the connection between the BCM and remote
endpoints.
Enabled in QoS-Monitor mode Select this option if you want to calculate MOS values for each
endpoint, determine whether the connection has fallen below a
specific threshold, send MOS scores to FCAPS applications, and
create a log history of the MOS scores.
Configuring QoS logging attributes
Configure the logging attributes to set the size and frequency of QoS logs.
Procedure steps
Step Action
1 Click the Administration tab.
2 In the Navigation tree, click System Metrics>QoS Monitor.
3 In the Logging area, select or clear the Enable Logging check box.
4 In the Maximum log file size field, type the value of the maximum log size
allowed.
Copyright © 2009 Nortel Networks
Nortel Business Communications Manager 5.0
Fault and Performance Management
NN40170-701 01.01 Standard
August 2009
Page 36

36 System metrics monitoring
5 In the Logging Frequency field, type the value of the interval between logs.
After the interval you specified, the QoS system metrics appear in the Mean
Opinion Scores table.
--End--
Table 7 Variable definitions
Variable Value
Enable Logging Enable the check box if you want to enable the logging of MOS
scores.
Maximum log file size Enter a value for the maximum size of the log file, from 1 to 10240
kilobytes (KB). The default is 10 KB.
Logging Frequency Enter the time interval between each MOS log: 1 to 1440
minutes. The default is 1 minute.
Viewing QoS logs
The Mean Opinion Scores table displays the current network quality
described as a Mean Opinion Score (MOS) for each IP destination. You can
view the MOS mapping. Unlike the BCM 3.x where both transmit and receive
values were reported, the QoS Monitor collects only the transmit values.
Procedure steps
Step Action
1 Click the Administration tab.
2 In the Navigation tree, click System Metrics>QoS Monitor.
The QoS system metrics appear in the Mean Opinion Scores table.
3 To update the MOS table with the most current values, select View >
Refresh, press F5, or select the Refresh icon from the toolbar.
--End--
Table 8 Variable definitions
Variable Value
Name Displays the name of the Remote Gateway.
IP Address Displays the IP address of the Remote Gateway.
QoS Indicator Displays a text description of the current MOS value. The MOS
values can be Poor, Fair, Good or Excellent.
Copyright © 2009 Nortel Networks
Nortel Business Communications Manager 5.0
Fault and Performance Management
NN40170-701 01.01 Standard
August 2009
Page 37

System metrics monitoring 37
Table 8 Variable definitions
Variable Value
G.711 Displays the current MOS value calculated when using a G.711
aLaw codec to transmit VoIP packets to this Remote Gateway.
The MOS can be a value from 0.00 to 5.00, where 0.00 is the
worst score (Poor) and 5.00 is best score (Excellent).
G.723-5.3kbit/s Displays the current MOS value calculated when using a G.723
5.3 kbit/s codec to transmit VoIP packets to this Remote
Gateway.
The MOS can be a value from 0.00 to 5.00, where 0.00 is the
worst score (Poor) and 5.00 is best score (Excellent).
G.723-6.3kbit/s Displays the current MOS value calculated when using a G.723
6.3 kbit/s codec to transmit VoIP packets to this Remote
Gateway.
The MOS can be a value from 0.00 to 5.00, where 0.00 is the
worst score (Poor) and 5.00 is best score (Excellent).
G.729 Displays the current MOS value calculated when using a G.729
codec to transmit VoIP packets to this Remote Gateway.
The MOS can be a value from 0.00 to 5.00, where 0.00 is the
worst score (Poor) and 5.00 is best score (Excellent).
G.729A Displays the current MOS value calculated when using a G.729A
codec to transmit VoIP packets to this remote Gateway.
The MOS can be a value from 0.00 to 5.00, where 0.00 is the
worst score (Poor) and 5.00 is best score (Excellent).
UPS metrics
BCM can support an Uninterruptible Power Supply (UPS) device to ensure
continuous operation during power interruption and failure conditions. The
UPS feature provides power source monitoring and battery backup so that
critical system functionality required to maintain and provide warning time to
either correct the problem or to activate a contingency plan for impacted
services is possible. UPS is described in Nortel Business Communication
Manager 450 5.0 Installation—System (NN40170-303) and BCM450 5.0
Installation Checklist and Quick Start Guide (NN40170-302) or the BCM50 5.0
Installation Checklist and Quick Start Guide (NN40170-308).
The UPS connects and communicates with the BCM through USB. Enable the
UPS feature by plugging the UPS USB cable into the BCM USB connector
before you power up the BCM. The UPS must be present during the boot up
process for the BCM to function.
Copyright © 2009 Nortel Networks
Nortel Business Communications Manager 5.0
Fault and Performance Management
NN40170-701 01.01 Standard
August 2009
Page 38

38 System metrics monitoring
The UPS Status panel tracks occurrences of alarms pertaining to UPS
operation. These alarms are also sequentially viewable in the Alarm panel.
The metrics correspond to alarms in the BCM and appear in the alarm panel
as well.
Accessing the UPS status
Complete this procedure to verify the status of the UPS before you boot up the
BCM system.
Procedure steps
Step Action
1 Click the Administration tab.
2 In the Navigation tree, click System Metrics >UPS Metrics > Status tab.
The status of the UPS appears. The UPS Status panel confirms that a UPS
is connected including model and serial number, its current status, and
provides a read out of the current values. Additionally, an indication is given
whether the value is within the normal range or not.
3 To check the metrics of the UPS, click the Metrics tab.
NTP metrics
The metrics information appears in the panel.
--End--
Using Network Time Protocol (NTP), you can configure the time on the BCM
indirectly from a single time server. NTP is a network protocol designed to
synchronize the clocks of computers over an IP network. The NTP Metrics
provide an overview of the integrity of the NTP time source. If the BCM clock
control has not been configured to use NTP (Configuration>System>Date &
Time), then the NTP Metrics panel displays no data.
Copyright © 2009 Nortel Networks
Nortel Business Communications Manager 5.0
Fault and Performance Management
NN40170-701 01.01 Standard
August 2009
Page 39

System metrics monitoring 39
Accessing the NTP metrics
Complete this procedure to view NTP metrics.
Procedure steps
Step Action
1 Click the Administration tab.
2 In the Navigation tree, click System Metrics>NTP Metrics.
The NTP metrics appear in the panel.
--End--
Table 9 Variable definitions
Variable Value
Last Synchronized When the last synchronization occurred.
Minimum time difference (s) The minimum time change that occurred since NTP was running.
Maximum time difference (s) The maximum time difference that occurred since NTP was
running.
Last Synchronization Status The results of the last synchronization: successful or
unsuccessful. If unsuccessful the reason for the failure is given:
failed to contact, or failed security check. A status of Not Running
indicates that NTP is not configured.
Copyright © 2009 Nortel Networks
Nortel Business Communications Manager 5.0
Fault and Performance Management
NN40170-701 01.01 Standard
August 2009
Page 40

40 System metrics monitoring
Copyright © 2009 Nortel Networks
Nortel Business Communications Manager 5.0
Fault and Performance Management
NN40170-701 01.01 Standard
August 2009
Page 41

Telephony metrics monitoring
The information in this section applies to both the BCM50 and the BCM450
platforms running BCM 5.0.
You can use the Business Element Manager to view detailed information
about the performance of telephony resources on the BCM 5.0 system.
The Telephony Metrics folder allows you to track different aspects of
Telephony services.
This section contains information on the following topics:
• Proactive Voice Quality Management (page 41)
• Activity Reporter Basic (page 48)
• Trunk module metrics (page 50)
• Trunk module CSU statistics (page 52)
• CbC limit metrics (page 58)
• Hunt group metrics (page 60)
• PSTN Fallback metrics (page 62)
Proactive Voice Quality Management
Use Proactive Voice Quality Management (PVQM) metrics to monitor the
quality of VoIP calls. You can also use the PVQM metrics to diagnose
infrastructure problems in your network.
PVQM is fully supported on Phase 2 IP sets. Phase 1 IP sets support only the
following PVQM metrics: packet loss, inter arrival jitter, and rould trip delay.
The following table lists the IP Phones that support PVQM.
Table 10 PVQM set support
IP Set Type Description
IP Phone 2001 Phase 2 firmware
IP Phone 2002 Phase 1 and Phase 2 firmware
Nortel Business Communications Manager 5.0
Fault and Performance Management
NN40170-701 01.01 Standard
Copyright © 2009 Nortel Networks
August 2009
Page 42
42 Telephony metrics monitoring
Table 10 PVQM set support
IP Set Type Description
IP Phone 2004 Phase 1 and Phase 2 firmware
IP Phone 2050 v2 PC-based soft client
IP Phone 2007 Phase 2 firmware
IP Phone 1120E Phase 2 firmware
IP Phone 1140E Phase 2 firmware
IP Phone 1110 n/a
IP Phones 1210, 1220, 1230 n/a
IP Phones 2210, 2211, 2212 n/a
IP Phones 6120,6140 n/a
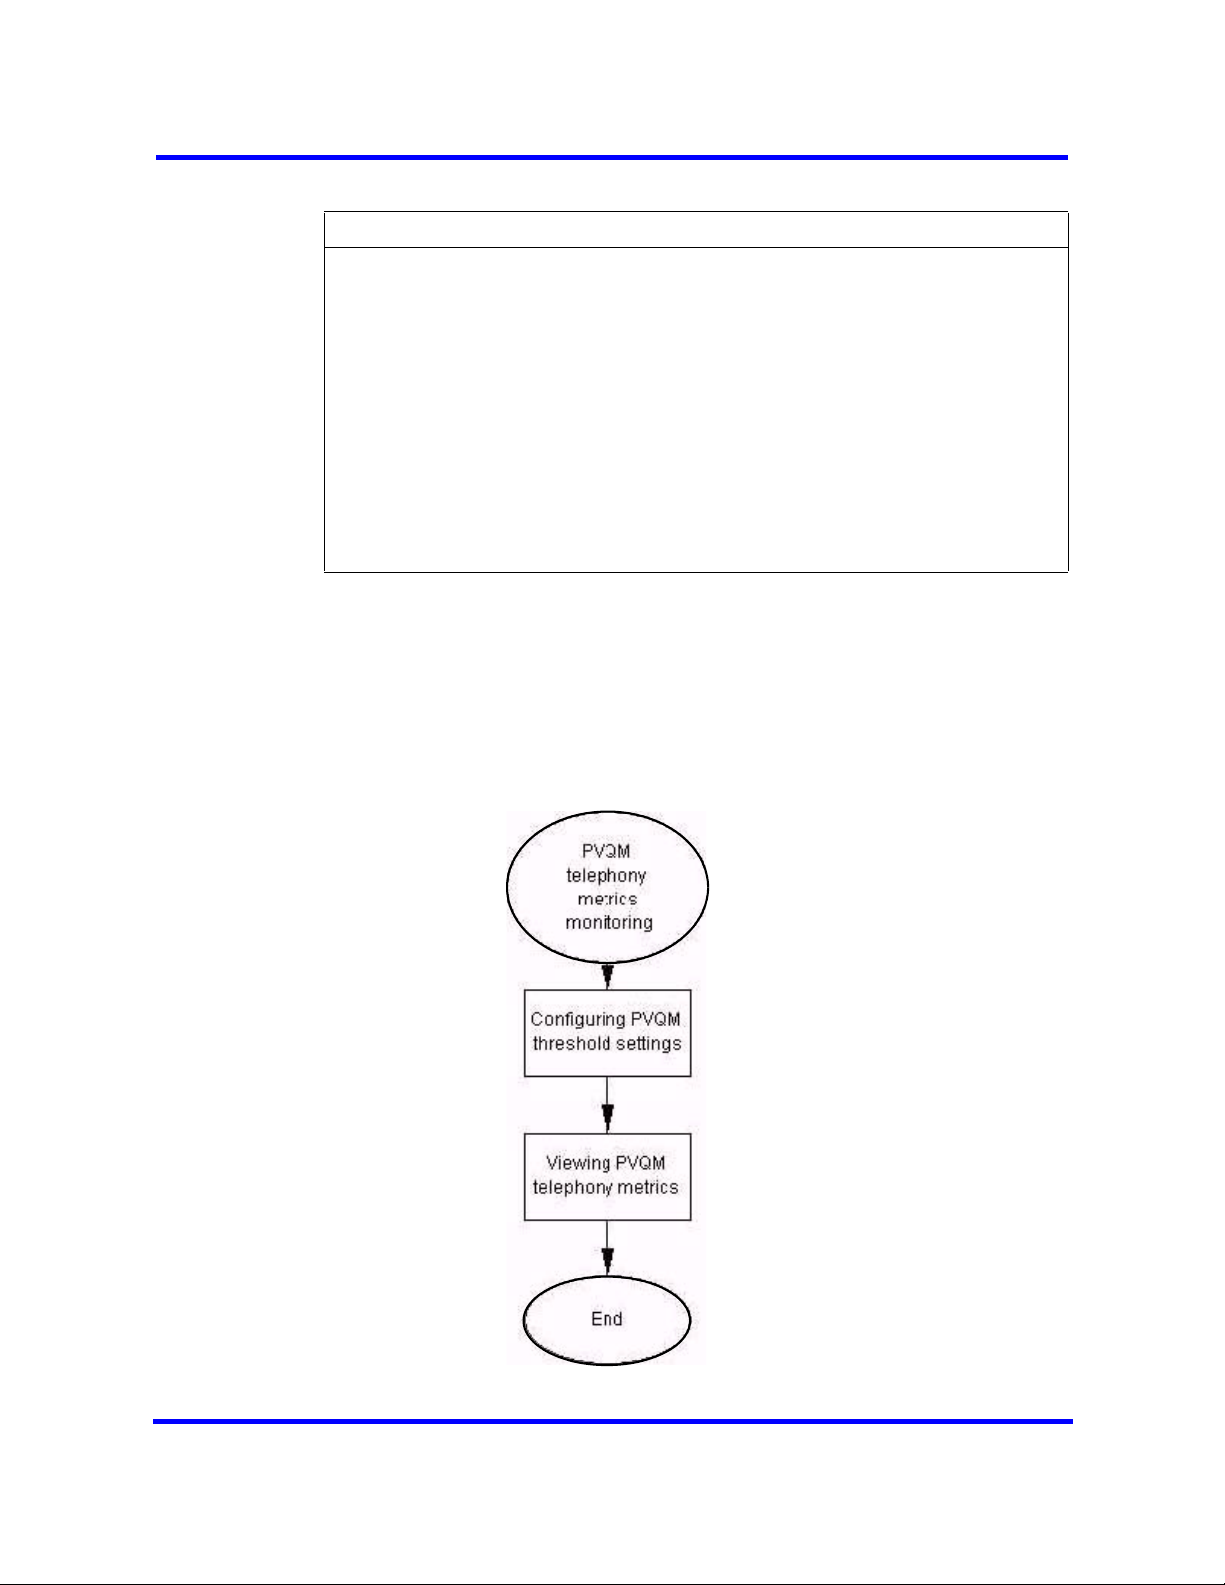
PVQM telephony metrics monitoring procedures
This task flow shows you the sequence of tasks you perform to configure and
monitor PVQM telephony metrics on the BCM system. To link to any
procedures, click on PVQM telephony metrics monitoring procedures
navigation (page 43).
Figure 3 PVQM telephony metrics monitoring procedures
Copyright © 2009 Nortel Networks
Nortel Business Communications Manager 5.0
Fault and Performance Management
NN40170-701 01.01 Standard
August 2009
Page 43

PVQM telephony metrics monitoring procedures navigation
• Setting the PVQM threshold settings (page 43)
• Viewing PVQM telephony metrics (page 47)
Setting the PVQM threshold settings
You can use PVQM to configure and report threshold violations for the
following voice quality metrics:
•
packet loss—packets lost in transit due to errors or network failures
• inter arrival jitter—the variable delay on a packet as it traverses a network
• round trip delay
• listening R factor—the transmission quality as experienced by the user; this
metric reflects the segment of the call that is carried over the RTP session
There are two thresholds for PVQM metrics: Warning, and Unacceptable. A
violation of the Warning threshold indicates that the voice quality is reduced
but is still within an acceptable range. A violation of the Unacceptable
threshold indicates a severe degradation in voice quality.
If an alarm is generated to report a threshold violation, additional information
is included in the alarm to indicate the source of the alarm and provide other
troubleshooting information. Table 11PVQM Alarms (page 43) lists the
abbreviations used in the alarm text to present this additional information.
Telephony metrics monitoring 43
Table 11 PVQM Alarms
Abbreviation Attribute Value Description
cT codec type alphanumeric Vocoder type used on this call
eT endpoint type S or D S indicates softclient
D indicates desktop
nLR network loss rate percentage, scaled by 256
(e.g. 354 = 1.4%)
dR average discard rate percentage, scaled by 256 Average rate of discards due to
bD burst loss density percentage, scaled by
256
bL burst length milliseconds Average length of bursts
gD gap loss density percentage, scaled by 256 Density of lost and discarded
gL average length of gap milliseconds average length of gap
eSD end system delay milliseconds Average end system delay on
Rate of network packet los
jitter
Density of lost and discarded
packets during burst periods
packets during gap periods
the call
Copyright © 2009 Nortel Networks
Nortel Business Communications Manager 5.0
Fault and Performance Management
NN40170-701 01.01 Standard
August 2009
Page 44

44 Telephony metrics monitoring
Table 11 PVQM Alarms
Abbreviation Attribute Value Description
aNL noise level dBm Measured received silent period
noise level
aSP average signal level dBm Measured received signal level
during talk spurts
rTT local round trip time
average
Procedure steps
Step Action
1 Click the Administration tab.
2 In the Navigation tree, click Telephony Metrics>PVQM>Threshold
settings.
The Proactive Voice Quality Monitoring panel appears.
3 In the Threshold settings table, select the metric you want to configure.
4 In the Warning (desktop) column, double click the value and type the
threshold value you want to set.
5 In the Unacceptable (desktop) column, double click the value and type the
threshold value you want to set.
6 In the Warning (softclient) column, double click the value and type the
threshold value you want to set.
7 In the Unacceptable (softclient) column, double click the value and type
the threshold value you want to set.
1/65536 of a second Average round trip time on the
call
8 In the Polling interval(s) field, type the interval at which you want the
Copyright © 2009 Nortel Networks
metrics to be polled.
--End--
Nortel Business Communications Manager 5.0
Fault and Performance Management
NN40170-701 01.01 Standard
August 2009
Page 45

Telephony metrics monitoring 45
Variable definitions
Variable Value
Metric Contains the following PVQM metrics to monitor:
• Packet Loss Rate: The fraction of RTP data
packets from the source lost since the
beginning of the call, expressed as a
percentage.
• Inter-arrival Jitter: The inter-arrival time of
incoming RTP packets, as defined in RFC
1889. Expressed in milliseconds.
• RTCP Round Trip Delay: The round trip time of
incoming RTP packets, as defined in RFC
1889. Measured in milliseconds.
• Listening R Factor: A scale from 0 (lowest
quality) to 100 (highest quality) according to
ITU-T G.107.
Warning (desktop) The number of warnings you can receive for a
desktop phone model. The value ranges and
default thresholds are as follows:
• Packet Loss Rate: The value range for this
metric is 0 to 100. The default value for warning
thresholds is 1%.
• Inter-arrival Jitter: The value range for this
metric is 0 to 1000. The default value for
warning thresholds is 50 ms.
• RTCP Round Trip Delay: The value range for
this metric is 0 to 1000. The default value for
warning thresholds is 300 ms.
• Listening R Factor: The value range for this
metric is 0 to 100. The default value for warning
thresholds is 65.
Copyright © 2009 Nortel Networks
Nortel Business Communications Manager 5.0
Fault and Performance Management
NN40170-701 01.01 Standard
August 2009
Page 46

46 Telephony metrics monitoring
Variable Value
Unacceptable (desktop) The number of unacceptable errors you can
Warning (softclient) The number of warnings you can receive for a
receive for a desktop phone model. The value
ranges and default thresholds are as follows:
• Packet Loss Rate: The value range for this
metric is 0 to 100. The default value for
unacceptable thresholds is 5%.
• Inter-arrival Jitter: The value range for this
metric is 0 to 1000. The default value for
unacceptable thresholds is 500 ms.
• RTCP Round Trip Delay: The value range for
this metric is 0 to 1000. The default value for
unacceptable thresholds is 500 ms.
softclient phone model. The value ranges and
default thresholds are as follows:
• Packet Loss Rate: The value range for this
metric is 0 to 100. The default value for warning
thresholds is 1%.
• Inter-arrival Jitter: The value range for this
metric is 0 to 1000. The default value for
warning thresholds is 50 ms.
• RTCP Round Trip Delay: The value range for
this metric is 0 to 1000. The default value for
warning thresholds is 300 ms.
• Listening R Factor: The value range for this
metric is 0 to 100. The default value for warning
thresholds is 65.
Unacceptable (softclient) The number of unacceptable errors you can
receive for a softclient phone model. The value
ranges and default thresholds are as follows:
• Packet Loss Rate: The value range for this
metric is 0 to 100. The default value for
unacceptable thresholds is 5%.
• Inter-arrival Jitter: The value range for this
metric is 0 to 1000. The default value for
unacceptable thresholds is 500 ms.
• RTCP Round Trip Delay: The value range for
this metric is 0 to 1000. The default value for
unacceptable thresholds is 500 ms.
Copyright © 2009 Nortel Networks
Nortel Business Communications Manager 5.0
Fault and Performance Management
NN40170-701 01.01 Standard
August 2009
Page 47

Variable Value
Polling interval(s) The interval at which the metrics are polled. The
Attention: The term “desktop” indicates IP sets that are desktop models. The term
“soft client” indicates IP sets that are software applications, such as the 2050 and
the 2050MVC. Because desktop IP sets can provide better voice quality than
software-based IP sets, you can specify different threshold levels for each type of IP
set.
Viewing PVQM telephony metrics
Use this procedure to view PVQM metrics.
Procedure steps
Step Action
1 Click the Administration tab.
2 In the Navigation tree, click Telephony Metrics >PVQM >Metrics.
Telephony metrics monitoring 47
value for this field is XXXXX. The default value is
XXXXX.
The PVQM metrics panel appears.
3 Click a column heading to sort the metrics by a particular value.
--End--
Copyright © 2009 Nortel Networks
Nortel Business Communications Manager 5.0
Fault and Performance Management
NN40170-701 01.01 Standard
August 2009
Page 48

48 Telephony metrics monitoring
Variable definitions
Variable Value
Number of connections Displays the total number of connections by IP sets
Last rest Displays the time of the last reset.
Most recent date and time Displays the time of the most recent threshold
Most recent DN Displays the DN of the most recent threshold violation.
Count (desktop) Displays the number of times a desktop client
on the system since the last reset. This count
includes non-interactive features such as dial
tones, call progress tones, and music on hold.
violation.
violated a threshold.
Count
(softclient)
MTBV (desktop) Displays the mean time between threshold
MTBV (soft client) Displays the mean time between threshold
Reset metrics Click this button to clear out the metrics table. The
Activity Reporter Basic
This section contains information on the following topics:
• Enabling Activity Reporter Basic (page 48)
• Disabling Activity Reporter Basic (page 49)
Enabling Activity Reporter Basic
Activity Reporter Basic allows you to monitor the performance of the BCM.
You can use the Activity Reporter Basic to generate the following reports:
• telephone call activity
Displays the number of times a soft client violated
a threshold.
violations of a particular metric for desktop clients
(measured in seconds).
violations of a particular metric for soft clients
(measured in seconds).
Last reset time displays the current date and time.
• custom call routing activity
• voice mail receive statistics
• hunt group performance
When you enable Activity Reporter Basic, the BCM automatically generates
reports and updates them each night. The reports reflect the performance of
the BCM during the past four days. The panel displays the date and time of
the most recent report.
Copyright © 2009 Nortel Networks
Nortel Business Communications Manager 5.0
Fault and Performance Management
NN40170-701 01.01 Standard
August 2009
Page 49

Telephony metrics monitoring 49
Procedure steps
Step Action
1 Select Administration >Telephony Metrics > Activity Reporter Basic.
The Activity Reporter Basic panel appears.
2 In the Activity Reporter Basic panel, select the Enable daily data
collection checkbox to activate Activity Reporter Basic.
3 From the Collection time drop-down menu, select a time to generate daily
reports.
--End--
Variable definitions
Variable Value
Enable daily data collection Select or clear the check box to enable Activity
Reporter Basic.
Collection Time Set the time at which the daily reports are
Most recent data collection Displays a timestamp of the time at which data was
Disabling Activity Reporter Basic
When you disable Activity Reporter Basic, the BCM does not generate
performance reports.
Procedure steps
Step Action
1 Select Administration > Telephony Metrics > Activity Reporter Basic.
The Activity Reporter Basic panel appears.
2 In the Activity Reporter Basic panel, clear the Enable daily data collection
check box to deactivate Activity Reporter Basic.
generated. The default time is set at 12:30 am.
last collected.
--End--
Copyright © 2009 Nortel Networks
Nortel Business Communications Manager 5.0
Fault and Performance Management
NN40170-701 01.01 Standard
August 2009
Page 50

50 Telephony metrics monitoring
Variable definitions
Variable Value
Enable daily data collection Clear the check box to disable Activity Reporter
Trunk module metrics
This section contains information on the following topics:
• Viewing the trunk module status (page 50)
• Viewing performance history information (page 50)
• Viewing D-channel information (page 51)
• Disabling or enabling a B-channel setting (page 51)
• Provisioning a PRI B-channel (page 52)
Viewing the trunk module status
View the trunk module status to isolate malfunctioning parts of your BCM
system. In addition, you can use the trunk module selection to disable and
enable modules and devices.
Basic.
Procedure steps
Step Action
1 Select Administration > Telephony Metrics > Trunk Module Metrics.
The window displays the locations for the modules connected to the system.
2 Select the module that you want to view.
3 Click Start Loopback Test to start the network test without having to
remove the
4 Select a loopback type from the list.
5 Click Stop Loopback Test when done the test of the network.
module.
--End--
Viewing performance history information
The Performance History tab displays the performance information over 15minute intervals collected in the past 24 hours. The performance information
collected includes the number of errored seconds, severely errored seconds,
and unavailable seconds over each 15-minute interval.
Copyright © 2009 Nortel Networks
Nortel Business Communications Manager 5.0
Fault and Performance Management
NN40170-701 01.01 Standard
August 2009
Page 51

Procedure steps
Step Action
1 Select Administration > Telephony Metrics > Trunk Module Metrics.
2 Click the Performance History tab to view metrics information.
Viewing D-channel information
The D-channel tab displays trunk module metrics for the D-channel.
Prerequisites
• You must have a BRI trunk module configured on the BCM system.
Procedure steps
Step Action
Telephony metrics monitoring 51
--End--
1 Select Administration > Telephony Metrics > Trunk Module Metrics.
2 Select the BRI module.
3 Click the D-channel tab to view metrics information.
--End--
Disabling or enabling a B-channel setting
If you need to isolate a problem, you can turn off individual port channels,
rather than the entire module.
Procedure steps
Step Action
1 Select Administration > Telephony Metrics > Trunk Module Metrics.
The Trunk Modules window displays the MBM location, type, state, and
Loopback test.
2 Click the heading of the bus you want to view.
3 Click the tab in the lower menu marked B-channels.
Copyright © 2009 Nortel Networks
Nortel Business Communications Manager 5.0
Fault and Performance Management
NN40170-701 01.01 Standard
August 2009
Page 52

52 Telephony metrics monitoring
4 Click the B-channel you want to enable or disable (B1 or B2).
5 Select Enable or Disable.
If you are disabling the channel, you are prompted by a dialog box to confirm
your action. The State box indicates the mode of operation for the port. If the
port is enabled, this box is blank unless a device is physically connected.
Provisioning a PRI B-channel
When you purchase PRI from your service provider, you can request the
number of B-channels that are allocated for you to use. For example, you can
use 12 B-channels. If you do not have all of the PRI B channels, disable all the
B-channels that you do not need.
Prerequisites
• Nortel recommends that the number of lines you deprovision on a DTM
(configured as PRI) be the same as the number of B-channels that you
disable. For example, if the DTM is on Expansion 1, when you disable Bchannels 13 to 23, you should deprovision lines 77 to 87.
--End--
Procedure steps
Step Action
1 Select Administration > Telephony Metrics > Trunk Module Metrics.
2 Choose a module.
3 Click B-channels.
A list of the B-channels on this module appears.
4 Click a channel, for example, B 01.
The display shows the status of the PRI channel.
5 Click the Enable or Disable button to change the setting for the channel.
Trunk module CSU statistics
Each trunk module has an internal channel service unit (CSU). When
enabled, the internal CSU monitors the quality of the received T1 signal and
provides performance statistics, alarm statistics, and diagnostic information.
--End--
Trunk modules must be individually programmed to establish parameters for
collecting and measuring transmission performance statistics by the CSU.
Copyright © 2009 Nortel Networks
Nortel Business Communications Manager 5.0
Fault and Performance Management
NN40170-701 01.01 Standard
August 2009
Page 53

Telephony metrics monitoring 53
The system accumulates three performance parameters:
• errored seconds (ES)
• severely errored seconds (SES)
• unavailable seconds (UAS)
These parameters are defined according to TIA-547A. Errored seconds are
enhanced to include control slip (CS) events. Only near-end performance data
is recorded.
The internal CSU continuously monitors the received signal and detects four
types of transmission defects:
• any active carrier failure alarms (CFA), such as loss of signal (LOS), out
of frame (OOF), alarm indication signal (AIS), and remote alarm indication
(RAI)
• the number of bipolar violations that occurred in the last minute
• any defects that occurred in the last minute, such as loss of signal (LOS),
out of frame (OOF), and alarm indication signal (AIS)
• the number of milliseconds of short-term alarms in the last minute, such
as loss of signal (LOS), out of frame (OOF), alarm indication signal (AIS),
and remote alarm indication (RAI).
A short term alarm is declared when the detected defects persist for tens of
milliseconds. A carrier failure alarm (CFA) is a duration of carrier system
outage.
The criteria for declaring and clearing the alarms is selectable to meet those
in TIA-547A or TR64211. You can also view Carrier Failure Alarms as Core
Telephony Alarms in the Alarm Viewer.
BCM trunk module CSU statistics navigation
• Enabling the internal CSU (page 54)
• Checking the performance statistics (page 54)
• Checking the CSU alarms (page 55)
• Checking carrier failure alarms (page 55)
• Checking bipolar violations (page 56)
• Checking short-term alarms (page 57)
• Checking defects (page 57)
• Viewing CSU alarm history (page 58)
Copyright © 2009 Nortel Networks
Nortel Business Communications Manager 5.0
Fault and Performance Management
NN40170-701 01.01 Standard
August 2009
Page 54

54 Telephony metrics monitoring
Enabling the internal CSU
Enable the internal CSU to gather performance statistics for your T1 lines or
PRI with public interface.
Procedure steps
Step Action
1 Select Configuration > Resources > Telephony Resources.
2 Select the appropriate module.
3 Click the Trunk Module Parameters tab.
4 In the T1 Parameters section, select the Internal CSU check box to enable
the Internal CSU.
Checking the performance statistics
Check the performance statistics to determine if the system detects errors or
alarms within the selected period.
--End--
Procedure steps
Step Action
1 Select Administration > Telephony Metrics > Trunk Module Metrics.
2 Select the appropriate module.
3 Click the Performance tab.
The Current interval displays the duration of the current 15-minute interval
of the selected card, the number of errored seconds (ES), the number of
severely errored seconds (SES), and the number of unavailable time
seconds (UAS).
4 Click the 24-hour summary heading for an overall summary of the previous
24 hours.
The Number of intervals, Errored Seconds, Severely Errored Seconds,
Unavailable Seconds appear in the summary.
Copyright © 2009 Nortel Networks
Nortel Business Communications Manager 5.0
Fault and Performance Management
NN40170-701 01.01 Standard
August 2009
Page 55

5 Click Reset Statistics to reset new settings.
The system displays a message indicating that this will remove all of the
statistics.
6 Click OK to erase all the current statistics and begin collecting statistics
again.
Checking the CSU alarms
Check the CSU alarms to view the active loss of signal (LOS), out of frame
(OOF), remote alarm indicator (RAI), or alarm indication signal (AIS) alarms.
Procedure steps
Step Action
1 Select Administration > Telephony Metrics > Trunk Module Metrics.
2 Select a module.
Telephony metrics monitoring 55
--End--
3 Click the CSU Alarms tab.
The display shows all the active alarms of the types LOS (loss of signal),
OOF (out of Frame), RAI (Remote alarm indicator), or AIS (Alarm indication
signal).
Checking carrier failure alarms
Check carrier failure alarms to view a history of alarms for a module. CFA
types reported by the BCM can be mapped to CFAs defined in TIA-547A and
TR62411 as shown in the table below.
Procedure steps
Step Action
1 Select Administration > Telephony Metrics > Trunk Module Metrics.
2 Select a module.
3 Click the CSU Alarm History tab.
The display shows LOS (loss of signal), OOF (out of Frame), AIS (Alarm
indication signal), and RAI (Remote alarm indicator).
--End--
Copyright © 2009 Nortel Networks
Nortel Business Communications Manager 5.0
Fault and Performance Management
NN40170-701 01.01 Standard
August 2009
Page 56

56 Telephony metrics monitoring
4 Select the type of alarm you want to view.
5 Select a time period.
The display shows the start time of the period.
Variable definitions
Table 12
--End--
Business
Communications
Manager
LOS CFA RED CFA RED CFA
OOF CFA RED CFA RED CFA
AIS CFA RED CFA AIS CFA
RAI CFA YELLOW CFA YELLOW CFA
TIA-547A TR62411
Checking bipolar violations
Check bipolar violations to view the number of bipolar violations occurring
within the defined time period.
Procedure steps
Step Action
1 Select Administration > Telephony Metrics > Trunk Module Metrics.
2 Select a module.
3 Click the CSU Alarms tab.
The display shows the number of bipolar violations that occurred in the last
minute.
Copyright © 2009 Nortel Networks
--End--
Nortel Business Communications Manager 5.0
Fault and Performance Management
NN40170-701 01.01 Standard
August 2009
Page 57

Checking short-term alarms
Check short-term alarms to view the number of alarms within the last minute.
Procedure steps
Step Action
1 Select Administration > Telephony Metrics > Trunk Module Metrics.
2 Select a module.
3 Click the CSU Alarms tab.
The display shows the short term alarms and the number of milliseconds
(not necessarily contiguous) that were active in the last minute.
Checking defects
Check defects to view the first type of defect in the last minute.
Telephony metrics monitoring 57
--End--
Procedure steps
Step Action
1 Select Administration > Telephony Metrics > Trunk Module Metrics.
2 Select a module.
3 Click the CSU Alarms tab.
The display shows the first type of defect and the number of milliseconds
(not necessarily contiguous) the hardware reported in the last minute.
--End--
Copyright © 2009 Nortel Networks
Nortel Business Communications Manager 5.0
Fault and Performance Management
NN40170-701 01.01 Standard
August 2009
Page 58

58 Telephony metrics monitoring
Viewing CSU alarm history
View CSU alarm history to view all occurrences of a specific alarm.
Procedure steps
Step Action
1 Select Administration > Telephony Metrics > Trunk Module Metrics.
2 Select a module.
3 Click the CSU Alarm History tab.
The display shows all the alarms.
4 To view a specific alarm, click the alarm name.
The display shows all the occurrences of that alarm.
CbC limit metrics
This section contains information on the following topics:
--End--
• Accessing CbC limit metrics (page 58)
• Clearing CbC limit metrics (page 60)
Accessing CbC limit metrics
Call-by-call service (CbC) on public PRI protocol (NI-2) allows a PBX to use
channels more effectively by expanding or contracting the number of channels
available to different call types such as INWATS, OUTWATS, Foreign
Exchange (FX), and tie lines.
The call-by-call service is a method of offering and receiving services to
Customer Premises Equipment (CPE) on ISDN PRI without the use of
dedicated circuits (i.e. interface or B-channels). The Call-By-Call service
conveys signaling information over an ISDN Primary Rate Interface (PRI) that
indicates, on a per-call basis, the specific service type required to complete
the call.
Although PRI-MCDN and IP trunks do not have multiple call types, CbC limits
can be used on these trunks to limit the number of incoming or outgoing trunks
that may be in use simultaneously.
When the CbC the feature is configured, use the CbC Limit metrics panel to
monitor denied call activity for each service on each line pool.
Copyright © 2009 Nortel Networks
Nortel Business Communications Manager 5.0
Fault and Performance Management
NN40170-701 01.01 Standard
August 2009
Page 59

Telephony metrics monitoring 59
PRI lines that support call-by-call services have maximum and minimum call
limits for each service. Use this panel to view reports for the services and to
assess the capacity of the PRI call services on your system. These limits are
set as part of the numbering plan programming.
Procedure steps
Step Action
1 Click the Administration tab.
2 In the Navigation tree, click Telephony Metrics >CbC Limit Metrics.
3 In the Call by CallLimit Metrics table, select the line pool for which you
want to view CbC traffic.
The denied call details for each type of service supported by the line pool
appears in the Details for Pool table.
--End--
Variable definitions
Variable Value
Line Pool The pool of lines that call-by-call limits are applied
to.
Service Type The type of service that the limits apply to.
INCOMING due to Outgoing
Min.
due to Incoming Max. The number of incoming calls that have been
OUTGOING due to Incoming
Min.
due to Outgoing Max. The number of outgoing calls that have been
The number of incoming calls that have been
blocked due to the call-by-call limits.
blocked due to call-by-call limits.
The number of outgoing calls that have been
blocked due to the call-by-call limits.
blocked due to the call-by-call limits.
Copyright © 2009 Nortel Networks
Nortel Business Communications Manager 5.0
Fault and Performance Management
NN40170-701 01.01 Standard
August 2009
Page 60

60 Telephony metrics monitoring
Clearing CbC limit metrics
Use this procedure to clear the Details for Pool table of the current CbC limit
metrics, and start a new monitoring period.
Procedure steps
Step Action
1 Click the Administration tab.
2 In the Navigation tree, click Telephony Metrics>CbC Limit Metrics.
3 In the Call by Call Metrics table, select the line pool for which you want to
view CbC traffic.
The denied call details for each type of service supported by the line pool
appears in the Details for Pool table.
4 Select one of the calls in the Calls denied because CbC limits were
exceeded list.
5 Click the Reset Metrics button.
Hunt group metrics
This section contains information on the following topics:
• Accessing Hunt Group metrics (page 60)
• Resetting the Hunt Group metrics (page 62)
Accessing Hunt Group metrics
Hunt groups provide a service where incoming calls ring on a targeted group
of telephones called a Hunt group. When you designate a Hunt group, you
define the group as a unique Directory Number (DN). This DN receives and
distributes calls to the telephones assigned to the group.
You can include Hunt Group hourly metrics files with the CDR data files when
the are transferred to the central server. For more information on configuring
this option, refer to the Call Detail Recording System Configuration Guide
(NN40020-605).
Access the Hunt Group metrics to evaluate total call processing by hunt group
member.
--End--
Copyright © 2009 Nortel Networks
Nortel Business Communications Manager 5.0
Fault and Performance Management
NN40170-701 01.01 Standard
August 2009
Page 61

Telephony metrics monitoring 61
Procedure steps
Step Action
1 Click the Administration tab.
2 In the Navigation tree, click Telephony Metrics>Hunt Group Metrics.
The Hunt Groups table appears.
3 In the Hunt Groups table, select the Hunt Group for which you want to see
metrics.
The Details for Hunt Group table appears.
--End--
Variable definitions
Variable Value
Hunt Group Name of the hunt group.
Name Name entered on the DN record.
Total calls Total number of calls.
Answered: Total Total number of answered calls.
Answered: Avg% Average number of answered calls.
Answered: Avg time(s) Average answer time.
Abandoned: Total Total number of abandoned calls.
Abandoned: Avg% Average number of abandoned calls.
Busy: Total Total number of busy calls.
Busy: Avg% Average number of busy calls
Overflow: Total Total number of overflow calls.
Overflow: Avg% Average number of overflow calls.
Time in Queue Time in queue.
Last Reset time Time and date format depends on the country
profile of the system.
Copyright © 2009 Nortel Networks
Nortel Business Communications Manager 5.0
Fault and Performance Management
NN40170-701 01.01 Standard
August 2009
Page 62

62 Telephony metrics monitoring
Resetting the Hunt Group metrics
Use this procedure to reset the Hunt Group metrics.
Procedure steps
Step Action
1 Click the Administration tab.
2 In the Navigation tree, click Telephony Metrics>Hunt Group Metrics.
The Hunt Groups table appears.
3 In the Hunt Groups table, select the Hunt Group for which you want to reset
the metrics.
The Details for Hunt Group table appears.
4 Click the Reset button.
--End--
PSTN Fallback metrics
This section contains information on the following topics:
• Accessing PSTN Fallback metrics (page 62)
• Resetting PSTN Fallback metrics (page 63)
Accessing PSTN Fallback metrics
When trunks are out of service, traffic can be switched to PSTN fallback lines.
Use this procedure to view how many fallback attempts and fallback failures
occur within a specific period using the PSTN Fallback Metrics panel.
Procedure steps
Step Action
1 Click the Administration tab.
2 In the Navigation tree, click Telephony Metrics>PSTN Fallback Metrics.
The PSTN Fallback Metrics panel appears with the metrics displayed.
--End--
Copyright © 2009 Nortel Networks
Nortel Business Communications Manager 5.0
Fault and Performance Management
NN40170-701 01.01 Standard
August 2009
Page 63

Variable definitions
Variable Definition
Last reset time The date and time the metrics table was last reset.
Fallback requests The number of calls unable to route through the
Fallback failures The number of calls unable to route though the
Resetting PSTN Fallback metrics
Use this procedure to clear the PSTN Fallback Metrics panel.
Step Action
1 Click the Administration tab.
2 In the Navigation tree, click Telephony Metrics>PSTN Fallback Metrics.
The PSTN Fallback Metrics panel appears with the metrics displayed.
Telephony metrics monitoring 63
preferred trunk.
fallback trunk.
3 Click the Reset button.
--End--
Copyright © 2009 Nortel Networks
Nortel Business Communications Manager 5.0
Fault and Performance Management
NN40170-701 01.01 Standard
August 2009
Page 64

64 Telephony metrics monitoring
Copyright © 2009 Nortel Networks
Nortel Business Communications Manager 5.0
Fault and Performance Management
NN40170-701 01.01 Standard
August 2009
Page 65

System LEDs reference
The information in this section applies to both BCM450 and BCM50 platforms
running BCM 5.0.
This section provides information about the main unit LED status during
normal operation, startup, and reboot.
Navigation
• System status monitor LEDs (page 65)
System status monitor LEDs
The BCM system status LEDs on the main unit provide information about the
status of the BCM system. Use these LEDs to determine if the system is
functioning properly and if the system generates an alarm.
Table 13 System status LEDs states and descriptions
Power Status Description
Start-up sequence
Solid yellow
Solid yellow Off Power on self test (POST); 9 seconds.
Solid yellow Solid yellow System initialization; 14 seconds.
Solid green Solid yellow Kernel initialization; 8 seconds.
Solid green Flashing green Services initialization; 1 minute.
Solid green Solid green System running; normal operation.
Solid green Solid red Services initialization failure
Safe mode start-up sequence
Solid red Solid green System running with manufacturing
Solid red Solid red System running in software reset mode
Solid red Flashing yellow System running in configuration reset
Copyright © 2009 Nortel Networks
Solid yellow Power applied to the system.
settings enabled
mode
Nortel Business Communications Manager 5.0
Fault and Performance Management
NN40170-701 01.01 Standard
August 2009
Page 66

66 System LEDs reference
Table 13 System status LEDs states and descriptions
Power Status Description
Shutdown sequence or failure
Solid green Flashing yellow Graceful shutdown in progress
Off Solid yellow Graceful shutdown completed
Solid red Flashing yellow Overheating detected; thermal shutdown
Solid red Solid red Power spike or rail power fluctuation
Flashing red Solid red Rail power fluctuation; power monitor
Solid yellow Solid red Power spike shutdown completed
Off Off No power; system is shut down (power
Start-up profile sequence
Flashing yellow Flashing yellow Start-up profile executing
Flashing green Flashing green Start-up profile completed (USB device
completed
detected
shutdown completed
cable is disconnected)
can be removed)
Solid green Solid green Start-up profile successfully applied
Blink yellow Blink red Start-up profile failure
Copyright © 2009 Nortel Networks
Nortel Business Communications Manager 5.0
Fault and Performance Management
NN40170-701 01.01 Standard
August 2009
Page 67

Alarm reference
For a list of alarms generated by the BCM system, see the Nortel Business
Communications Manager 5.0 Alarm Reference (NN40170-702).
Copyright © 2009 Nortel Networks
Nortel Business Communications Manager 5.0
Fault and Performance Management
NN40170-701 01.01 Standard
August 2009
Page 68

68 Alarm reference
Copyright © 2009 Nortel Networks
Nortel Business Communications Manager 5.0
Fault and Performance Management
NN40170-701 01.01 Standard
August 2009
Page 69

Page 70

Nortel Business Communications Manager 5.0
Fault and Performance Management
Copyright © 2009 Nortel Networks
The information in this document is sourced in Canada, the United States, India and the United Kingdom.
All Rights Reserved.
Publication: NN40170-701
Document status: Standard
Document issue: 01.01
Document date: August 2009
Product release: 1.0
Job function: Planning and Engineering
Type: Publication
Language type: EN
NORTEL, the globemark design, and the NORTEL corporate logo are trademarks of Nortel Networks.
Windows is a trademark of Microsoft Corporation.
All other trademarks are the property of their respective owners.
To provide feedback or report a problem with this document, go to www.nortel.com/documentfeedback.
 Loading...