

Page 1

Trademarks
Autel®, MaxiSys®, MaxiDAS®, MaxiScan®, MaxiTPMS®, MaxiRecorder®, and
MaxiCheck® are trademarks of Autel Intelligent Technology Corp., Ltd., registered in
China, the United States and other countries. All other marks are trademarks or
registered trademarks of their respective holders.
Copyright Information
No part of this manual may be reproduced, stored in a retrieval system or transmitted,
in any form or by any means, electronic, mechanical, photocopying, recording, or
otherwise without the prior written permission of Autel.
Disclaimer of Warranties and Limitation of Liabilities
All information, specifications and illustrations in this manual are based on the latest
information available at the time of printing. Autel reserves the right to make changes at
any time without notice. While information of this manual has been carefully checked
for accuracy, no guarantee is given to the completeness and correctness of the
contents, including but not limited to the product specifications, functions, and
illustrations.
Autel will not be liable for any direct damages or for any special, incidental, or indirect
damages or for any economic consequential damages (including the loss of profits).
IMPORTANT: Before operating or maintaining this unit, please read this manual
carefully, paying extra attention to the safety warnings and precautions.
For Services and Support:
pro.autel.com
www.autel.com
1-855-288-3587/1-855-AUTELUS (North America)
0086-755-86147779 (China)
Support@autel.com
For technical assistance in all other markets, please contact your local selling agent
i
Page 2

Safety Information
For your own safety and the safety of others, and to prevent damage to the device and
vehicles upon which it is used, it is important that the safety instructions presented
throughout this manual be read and understood by all persons operating or coming into
contact with the device.
There are various procedures, techniques, tools, and parts for servicing vehicles, as
well as in the skill of the person doing the work. Because of the vast number of test
applications and variations in the products that can be tested with this equipment, we
cannot possibly anticipate or provide advice or safety messages to cover every
circumstance. It is the automotive technician’s responsibility to be knowledgeable of the
system being tested. It is crucial to use proper service methods and test procedures. It
is essential to perform tests in an appropriate and acceptable manner that does not
endanger your safety, the safety of others in the work area, the device being used, or
the vehicle being tested.
Before using the device, always refer to and follow the safety messages and applicable
test procedures provided by the manufacturer of the vehicle or equipment being tested.
Use the device only as described in this manual. Read, understand, and follow all
safety messages and instructions in this manual.
Safety Messages
Safety messages are provided to help prevent personal injury and equipment damage.
All safety messages are introduced by a signal word indicating the hazard level.
DANGER: Indicates an imminently hazardous situation which, if not avoided, will
result in death or serious injury to the operator or to bystanders.
WARNING: Indicates a potentially hazardous situation which, if not avoided,
could result in death or serious injury to the operator or to bystanders.
Safety Instructions
The safety messages herein cover situations Autel is aware of. Autel cannot know,
evaluate or advise you as to all of the possible hazards. You must be certain that any
condition or service procedure encountered does not jeopardize your personal safety.
DANGER: When an engine is operating, keep the service area WELL
VENTILATED or attach a building exhaust removal system to the engine exhaust
system. Engines produce carbon monoxide, an odorless, poisonous gas that
causes slower reaction time and can lead to serious personal injury or loss of
life.
ii
Page 3

Safety Information Important Safety Instructions
Do Not Turn the Volume Up Too Loud When Using Headphones
Listening at high volumes that over-stimulate the ear for long periods of time
may result in loss of hearing.
SAFETY WARNINGS:
Always perform automotive testing in a safe environment.
Wear safety eye protection that meets ANSI standards.
Keep clothing, hair, hands, tools, test equipment, etc. away from all
moving or hot engine parts.
Operate the vehicle in a well ventilated work area, for exhaust gases are
poisonous.
Put the transmission in PARK (for automatic transmission) or NEUTRAL
(for manual transmission) and make sure the parking brake is engaged.
Put blocks in front of the drive wheels and never leave the vehicle
unattended while testing.
Be extra cautious when working around the ignition coil, distributor cap,
ignition wires and spark plugs. These components create hazardous
voltages when the engine is running.
Keep a fire extinguisher suitable for gasoline, chemical, and electrical fires
nearby.
Do not connect or disconnect any test equipment while the ignition is on or
the engine is running.
Keep the test equipment dry, clean, free from oil, water or grease. Use a
mild detergent on a clean cloth to clean the outside of the equipment as
necessary.
Do not drive the vehicle and operate the test equipment at the same time.
Any distraction may cause an accident.
Refer to the service manual for the vehicle being serviced and adhere to
all diagnostic procedures and precautions. Failure to do so may result in
personal injury or damage to the test equipment.
To avoid damaging the test equipment or generating false data, make
sure the vehicle battery is fully charged and the connection to the vehicle
DLC is clean and secure.
Do not place the test equipment on the distributor of the vehicle. Strong
electro-magnetic interference can damage the equipment.
iii
Page 4

Contents
SAFETY INFORMATION ............................................................................................ II
CHAPTER 1 USING THIS MANUAL ...................................................................... 1
1.1 CONVENTIONS ............................................................................................... 1
1.1.1 Bold Text ............................................................................................. 1
1.1.2 Notes .................................................................................................. 1
1.1.3 Important ............................................................................................ 1
1.1.4 Hyperlink............................................................................................. 1
1.1.5 Procedure............................................................................................ 1
CHAPTER 2 GENERAL INTRODUCTION ............................................................... 3
2.1 MAXISYS DISPLAY TABLET ................................................................................. 3
2.1.1 Functional Description ......................................................................... 3
2.1.2 Power Sources ..................................................................................... 5
2.1.3 Technical Specifications ....................................................................... 6
2.2 VCI – WIRELESS DIAGNOSTIC INTERFACE .............................................................. 7
2.2.1 Functional Description ......................................................................... 7
2.2.2 Technical Specifications ....................................................................... 8
2.2.3 Power Sources ..................................................................................... 9
2.3 ACCESSORY KIT .............................................................................................. 9
2.3.1 OBD I Adapters .................................................................................... 9
2.3.2 Other Accessories ...............................................................................10
CHAPTER 3 GETTING STARTED ..........................................................................11
3.1 POWERING UP ..............................................................................................11
3.1.1 Application Buttons ............................................................................12
3.1.2 Locator and Navigation Buttons .........................................................14
3.1.3 System Status Icons ............................................................................15
3.2 POWERING DOWN .........................................................................................16
3.2.1 Reboot System....................................................................................17
3.3 INSTALLING COMPUTER SOFTWAR E ....................................................................17
3.3.1 Printing Operation ..............................................................................17
CHAPTER 4 DIAGNOSTICS OPERATIONS ............................................................19
4.1 ESTABLISHING VEHICLE COMMUNICATION ............................................................19
4.1.1 Vehicle Connection .............................................................................19
4.1.2 VCI Connection ...................................................................................20
4.1.3 No Communication Message ..............................................................22
4.2 GETTING STARTED..........................................................................................23
Page 5

4.2.1 Vehicle Menu Layout ..........................................................................23
4.3 VEHICLE IDENTIFICATION ..................................................................................25
4.3.1 Auto VIN Scan ....................................................................................25
4.3.2 Manual VIN Input ...............................................................................26
4.3.3 Manual Vehicle Selection ....................................................................27
4.3.4 Alternative Vehicle Identification ........................................................28
4.4 NAVIGATIO N .................................................................................................28
4.4.1 Diagnostics Screen Layout ..................................................................28
4.4.2 Screen Messages ................................................................................31
4.4.3 Making Selections ..............................................................................32
4.5 MAIN MENU ................................................................................................32
4.6 DIAGNOSIS ...................................................................................................32
4.6.1 ECU Information .................................................................................37
4.6.2 Read Codes ........................................................................................37
4.6.3 Erase Codes ........................................................................................38
4.6.4 Live Data ............................................................................................39
4.6.5 Active Test ..........................................................................................45
4.6.6 Special Functions ................................................................................46
4.7 SERVICE.......................................................................................................47
4.7.1 Function Descriptions .........................................................................48
4.8 GENERIC OBD II OPERATIONS ..........................................................................49
4.8.1 General Procedure ..............................................................................49
4.8.2 Function Descriptions .........................................................................51
4.9 EXITING DIAGNOSTICS .....................................................................................53
CHAPTER 5 TPMS SERVICE OPERATIONS ...........................................................55
5.1 NAVIGATIO N .................................................................................................55
5.1.1 TPMS Service Screen Layout ...............................................................55
5.2 CHECK OPERATIONS .......................................................................................57
5.3 PROGRAMMING OPERATIONS ...........................................................................59
5.3.1 Copy by Activation ..............................................................................60
5.3.2 Copy by OBD ......................................................................................62
5.3.3 Auto Create ........................................................................................63
5.3.4 Manual Create ...................................................................................64
5.4 RELEARN OPERATIONS ....................................................................................64
5.4.1 OBDII Relearn .....................................................................................65
5.4.2 Read IDs from vehicle .........................................................................66
5.4.3 Read DTC............................................................................................66
5.4.4 Clear DTC ...........................................................................................66
CHAPTER 6 MAXIFIX OPERATIONS ....................................................................67
Page 6

6.1 NAVIGATIO N .................................................................................................67
6.1.1 Terminology .......................................................................................69
6.2 OPERATIONS .................................................................................................70
6.2.1 Home .................................................................................................71
6.2.2 Search Fix Features .............................................................................71
6.2.3 Ask .....................................................................................................71
6.2.4 My MaxiFix ........................................................................................72
6.2.5 My Messages .....................................................................................74
6.2.6 Support ..............................................................................................75
CHAPTER 7 SHOP MANAGER OPERATIONS .......................................................76
7.1 VEHICLE HISTORY ...........................................................................................77
7.1.1 Historical Test Record .........................................................................78
7.2 WORKSHOP INFORMATION ...............................................................................79
7.3 CUSTOMER MANAGER ....................................................................................80
7.3.1 History Notes......................................................................................82
CHAPTER 8 DATA MANAGER OPERATIONS ........................................................84
8.1 OPERATIONS .................................................................................................84
8.1.1 Image Files .........................................................................................84
8.1.2 PDF Files ............................................................................................86
8.1.3 Review Data .......................................................................................87
8.1.4 Apps Manager....................................................................................87
8.1.5 Data Logging ......................................................................................88
CHAPTER 9 SETTINGS OPERATIONS ..................................................................89
9.1 OPERATIONS .................................................................................................89
9.1.1 Unit....................................................................................................89
9.1.2 Language ...........................................................................................89
9.1.3 Printing Setting ..................................................................................90
9.1.4 Notification Center .............................................................................90
9.1.5 About .................................................................................................91
9.1.6 System Settings ..................................................................................91
CHAPTER 10 UPDATE OPERATIONS .....................................................................93
CHAPTER 11 VCI MANAGER OPERATIONS ...........................................................96
11.1 BT PAIRING ..............................................................................................96
11.2 UPDATE ...................................................................................................97
11.3 TPMS MODULE UPDATE .............................................................................98
CHAPTER 12 SUPPORT OPERATIONS ...................................................................99
12.1 PRODUCT REGISTRATION ..............................................................................99
Page 7

12.2 SUPPORT SCREEN LAYOUT .......................................................................... 100
12.3 MY ACCOUNT ......................................................................................... 101
12.4 USER COMPLAINT .................................................................................... 101
12.5 DATA LOGGING ........................................................................................ 104
12.6 COMMUNITIES......................................................................................... 105
12.7 TRAINING CHANNELS ................................................................................ 107
12.8 FAQ DATABASE........................................................................................ 108
CHAPTER 13 TRAINING OPERATIONS ................................................................ 109
CHAPTER 14 REMOTE DESK OPERATIONS ......................................................... 111
14.1 OPERATIONS ........................................................................................... 111
CHAPTER 15 QUICK LINK OPERATIONS ............................................................. 113
CHAPTER 16 OSCILLOSCOPE OPERATIONS ........................................................ 114
16.1 SAFETY INFORMATION ............................................................................... 114
16.2 GLOSSARY .............................................................................................. 116
16.3 MAXISCOPE MODULE ............................................................................... 118
16.4 SCREEN LAYOUT AND OPERAT IONS ................................................................ 121
16.4.1 Top Toolbar ...................................................................................... 122
16.4.2 Functional Buttons ........................................................................... 125
16.4.3 Measurement Grid ........................................................................... 126
16.4.4 Measurement Rulers ........................................................................ 127
16.4.5 Functional Buttons ........................................................................... 128
16.5 TROUBLESHOOTING .................................................................................. 129
16.6 MAXISCOPE FIRMWARE UPDATE .................................................................. 130
CHAPTER 17 DIGITAL INSPECTION OPERATIONS ............................................... 131
17.1 ADDITIONAL ACCESSORIES .......................................................................... 132
17.1.1 Technical Specifications .................................................................... 135
17.2 OPERATIONS ........................................................................................... 135
CHAPTER 18 MAINTENANCE AND SERVICE ....................................................... 138
18.1 MAINTENANCE INSTRUCTIONS ..................................................................... 138
18.2 TROUBLESHOOTING CHECKLIST .................................................................... 139
18.3 ABOUT BATTERY USAGE ............................................................................. 139
18.4 SERVICE PROCEDURES ............................................................................... 140
CHAPTER 19 COMPLIANCE INFORMATION........................................................ 142
CHAPTER 20 WARRANTY .................................................................................. 144
Page 8

Chapter 1 Using This Manual
This manual contains device usage instructions.
Some illustrations shown in this manual may contain modules and optional equipment
that are not included in your system. Contact your sales representative for availability of
other modules and optional tools or accessories.
1.1 Conventions
The following conventions are used.
1.1.1 Bold Text
Bold emphasis is used to highlight selectable items such as buttons and menu
options.
Example:
Tap OK.
1.1.2 Notes
A NOTE provides helpful information such as additional explanations, tips,
and comments.
1.1.3 Important
IMPORTANT indicates a situation which, if not avoided, may result in damage
to the test equipment or vehicle.
1.1.4 Hyperlink
Hyperlinks, or links, that take you to other related articles, procedures, and
illustrations are available in electronic documents. Blue colored text indicates
a selectable hyperlink.
1.1.5 Procedure
An arrow icon indicates a procedure.
Example:
1
Page 9

Using This Manual Conventions
To use the camera:
1 Tap the Camera button. The camera screen opens.
2 Focus the image to be captured in the view finder.
3 Tap the blue circle. The view finder now shows the captured picture
and auto-saves the taken photo.
2
Page 10
Chapter 2 General Introduction
The MaxiSys MS906BT/MaxiSys MS906TS is an advanced smart wireless diagnostic
device providing specialized automotive diagnostic service for customers. Featuring the
powerful Samsung Exynos 5260 6-core processor (1.3 GHz quad-core ARM Cortex-A7
+ 1.7 GHz dual-core ARM Cortex-A15), an 8.0 inch LED capacitive touch screen, and
long-distance wireless communication, based on the multitasking mobile operating
system, and combined with the best possible coverage of OE-level diagnostics, the
MaxiSys MS906TS/MS906BT performs comprehensive vehicle diagnostics and
analysis efficiently. With the integrated TPMS module, the MaxiSys MS906TS also
provides comprehensive TPMS solutions.
There are two main components to the MaxiSys system:
MaxiSys System Display Tablet -- the central processor and monitor for the
system
Vehicle Communication Interface (VCI) -- the device for accessing vehicle data
This manual describes the construction and operation of both the devices and how they
work together to deliver diagnostic solutions.
2.1 MaxiSys System Display Tablet
2.1.1 Functional Description
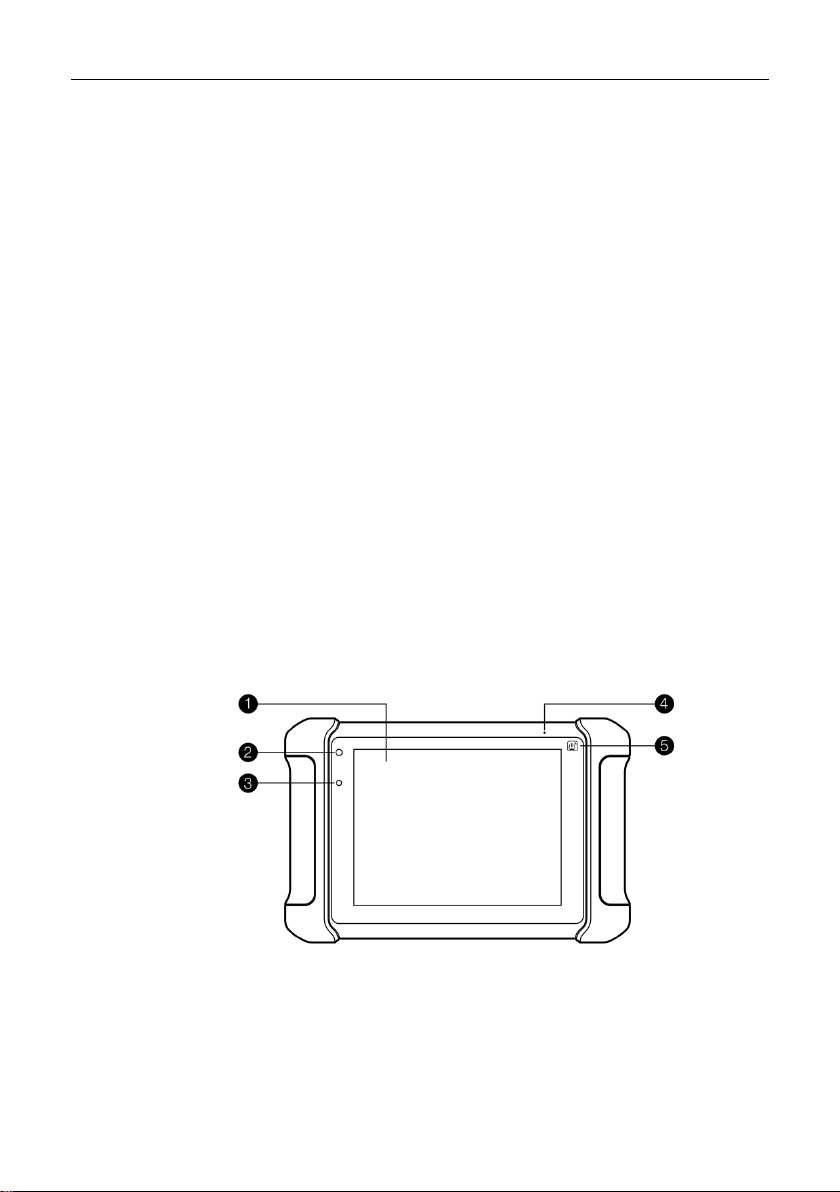
Figure 2-1 Display Tablet Front View
1. 8.0” LED Capacitive Touch Screen
2. Power LED – indicates battery level & charging or system status
3
Page 11
General Introduction MaxiSys System Display Tablet
3. Ambient Light Sensor – detects ambient brightness
4. Microphone
5. TPMS Service Symbol – indicates the position of the embedded TPMS
antenna (for MaxiSys MS906TS only)
The power LED displays different colors in response to the following
scenarios:
A. Green
Illuminates green when the Display Tablet is charging and the
battery level is above 90%.
B. Yellow
Illuminates yellow when the Display Tablet is charging and the
battery level is below 90%.
C. Red
Illuminates red when the Display Tablet is powered on and the
battery level is below 15%.
D. Blue
Illuminates blue when the MaxiSys system is fault.
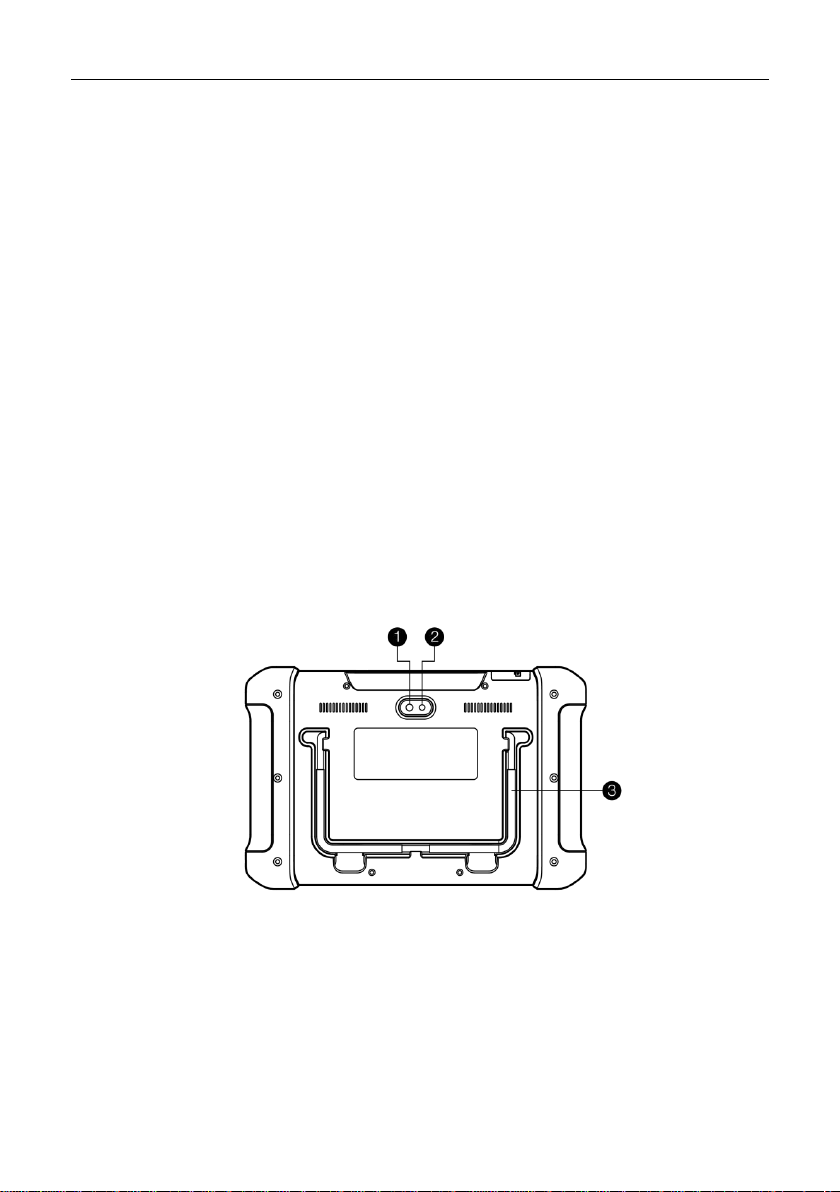
Figure 2-2 Display Tablet Back View
1. Camera Lens
2. Camera Flash
3. Collapsible Stand – extends from the back to allow hands-free viewing of
the Display Tablet at a 30-degree angle
4
Page 12

General Introduction MaxiSys System Display Tablet
Figure 2-3 Display Tablet Top View
1. Mini SD Card Slot - holds the mini SD Card
2. Mini USB OTG Port
3. DC Power Supply Input Port - Connects the 12 volt power adapter to
charge.
4. HDMI (high-definition multimedia interface) Port
5. USB Port
6. Headset Jack (3-Band 3.5mm )
7. Lock/Power Button – turns the device on & off with long press, or locks
the screen with short press
2.1.2 Power Sources
The Display Tablet can receive power from any of the following sources:
Internal Battery Pack
AC/DC Power Supply
Vehicle Power Supply
Internal Battery Pack
The Display Tablet can be powered with the internal rechargeable battery,
which if fully charged can provide sufficient power for about 14 hours of
continuous operation.
5
Page 13

General Introduction MaxiSys System Display Tablet
Item
Description
Operating System
AndroidTM 4.4.2, KitKat
Processor
Samsung Exynos T5260 6-Core Processor (1.3
GHz quad-core ARM Cortex-A7 + 1.7 GHz
dual-core ARM Cortex-A15)
Memory
2 GB RAM & 32 GB ROM
Display
8.0 inch LED capacitive touch screen with
1024x768P resolution
Connectivity
Wi-Fi (802.11 b/g/n)
USB: 2.0
Mini USB 2.0
Wireless BT V2.1+EDR, Class1
HDMI 1.4a
SD Card (support up to 32GB)
Camera (rear)
Rear-facing, 8.0 Megapixel, AF with Flashlight
Sensors
Gravity Accelerometer, Ambient Light Sensor
(ALS)
Audio Input/Output
Microphone
Single Speakers
3-Band 3.5 mm stereo/standard headset jack
Power and Battery
10,000 mAh 3.7 V lithium-polymer battery
Charging via 12 V AC/DC power supply
Input Voltage
12 V (9-35 V)
Power Consumption
5 W
AC/DC Power Supply
The Display Tablet can be powered from a wall socket using the AC/DC power
adapter. The AC/DC power supply also charges the internal battery pack.
Vehicle Power
The Display Tablet can be powered from the cigarette lighter or other suitable
power port on the test vehicle through a direct cable connection. The vehicle
power cable connects to the DC power supply port on the top side of the
display unit.
2.1.3 Technical Specifications
6
Page 14
General Introduction MaxiSys System Display Tablet
Item
Description
Operating
Temperature
-10 to 55°C (14 to 131°F)
Storage Temperature
-20 to 70°C (-4 to 158°F)
Housing
Strong plastic housing with protective rubber boot
Dimensions (W x H x D)
270.8 mm (10.0”) x 176.0 mm (6.9”) x 36.0 mm
(1.4”)
Weight
NW: 1.10 kg (2.42 lb.) (for 906TS)
1.05 kg (2.31 lb.) (for 906BT)
Supported
Automotive
Protocols
ISO 9142-2, ISO 14230-2, ISO 15765-4, K-Line,
L-Line, Flashing Code, SAE-J1850 VPW,
SAE-J1850 PWM, CAN ISO 11898, Highspeed,
Middlespeed, Lowspeed and Singlewire CAN, GM
UART, UART Echo Byte Protocol, Honda Diag-H
Protocol, TP 2.0, TP 1.6, SAE J1939, SAE J1708,
Fault-Tolerant CAN
2.2 VCI – Wireless Diagnostic Interface
The wireless diagnostic interface MaxiVCI V100 is a small vehicle
communication interface (VCI) used to connect to a vehicle’s diagnostic
connector (DLC) and connect with the Display Tablet, as well as standalone
PC, as a vehicle communication interface (VCI) for vehicle data transmission.
2.2.1 Functional Description
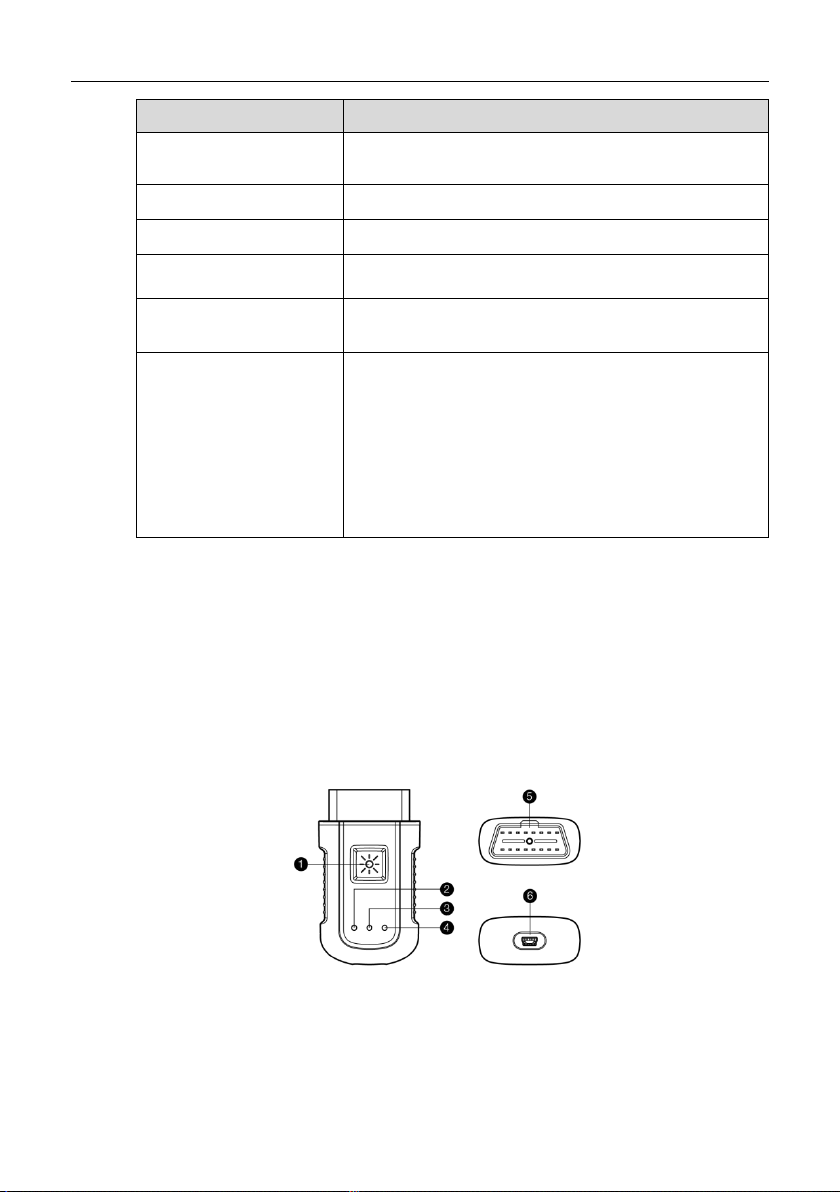
Figure 2-4 MaxiVCI V100 Wireless Diagnostic Interface
7
Page 15

General Introduction VCI – Wireless Diagnostic Interface
Item
Description
Communications
BT V.2.1 + EDR
USB 2.0
Wireless Frequency
2.4 GHz
Input Voltage Range
12 VDC
Supply Current
150 mA @ 12 VDC
Operating Temperature
0°C to 50°C (ambient)
Storage Temperature
-20°C to 70°C (ambient)
1. Lighting Push Button – presses to turn on the white LED in the vehicle
data connector socket
2. Power LED – indicates power and system status
Green: illuminates solid green when powered on.
Amber: flashes green and amber automatically when performing
firmware update.
Red: illuminates red automatically when powered up, and flashes red
when system failure occurs.
3. Vehicle LED - flashes green when communicating with the vehicle’s
system
4. Connection Mode LED - illuminates solid green when the device is
properly connected with the Display Tablet or PC via the USB cable, or
illuminates solid blue via wireless BT connection
5. Vehicle Data Connector (16-pin)
6. USB Port
Communication
The Wireless Diagnostic Interface supports both the wireless BT and the USB
communication. It can transmit vehicle data to the Display Tablet with or
without a physical connection. The working range of the transmitter through
BT communication is about 164 feet (about 50 m). A signal lost due to moving
out of range automatically restores itself when the Display Tablet is brought
closer to the VCI unit.
2.2.2 Technical Specifications
8
Page 16
General Introduction VCI – Wireless Diagnostic Interface
Dimensions (L x W x H)
87.0 mm (3.43”) x 52.0 mm (2.05”) x24.5 mm
(0.96”)
Weight
0.076 kg (0.168 lb.)
Built-in Battery
3.7V Lithium Battery
Light
White LED
Benz-14
Chrysler-16
BMW-20
Kia-20
Nissan-14
GM/Daewoo-12
Honda-3
VW/Audi-2+2
2.2.3 Power Sources
The Wireless Diagnostic Interface operates on 12-volt vehicle power, which it
receives through the vehicle data connection port. The unit powers on
whenever it is connected to an OBD II/EOBD compliant data link connector
(DLC).
2.3 Accessory Kit
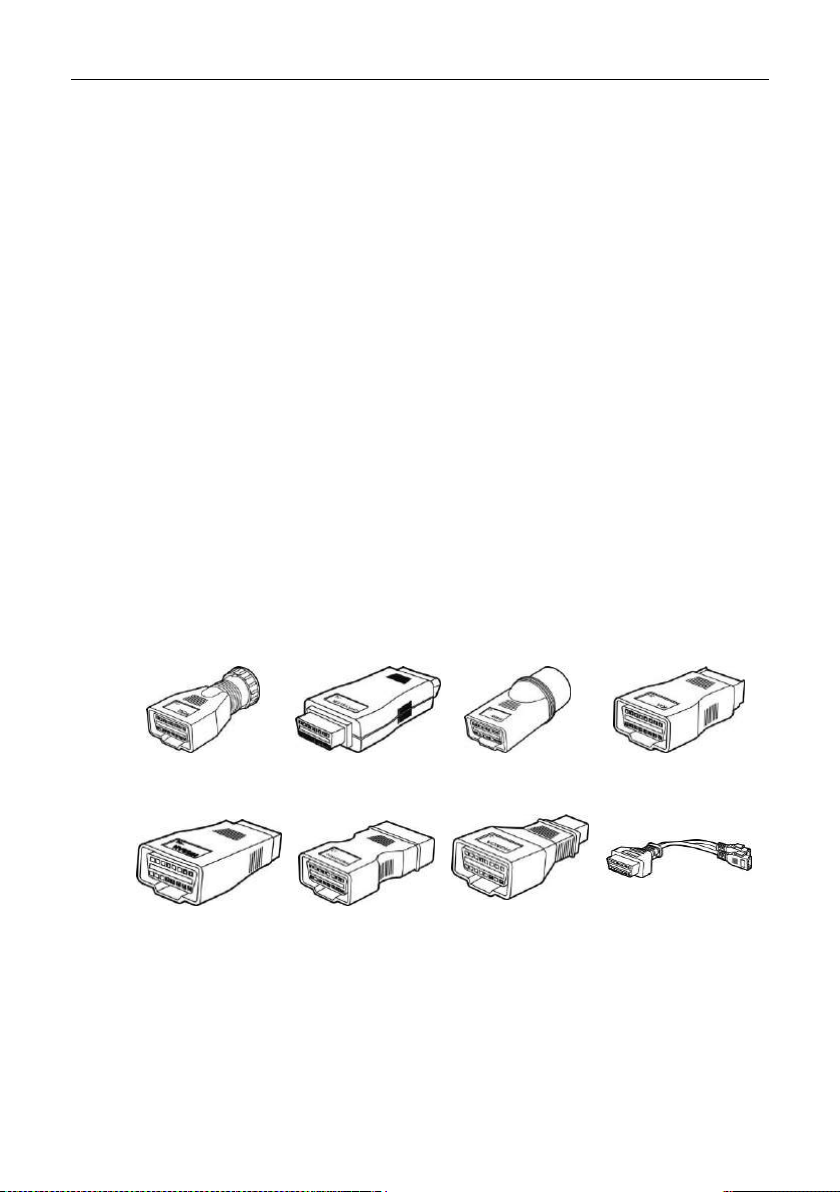
2.3.1 OBD I Adapters
The OBD I adapters are for Non-OBD II vehicles. The adapter used depends
on the type of vehicle being tested. The most common adapters are shown
below. (Benz-14 is for European unit only and Chrysler-16 is for American unit
only.)
9
Page 17
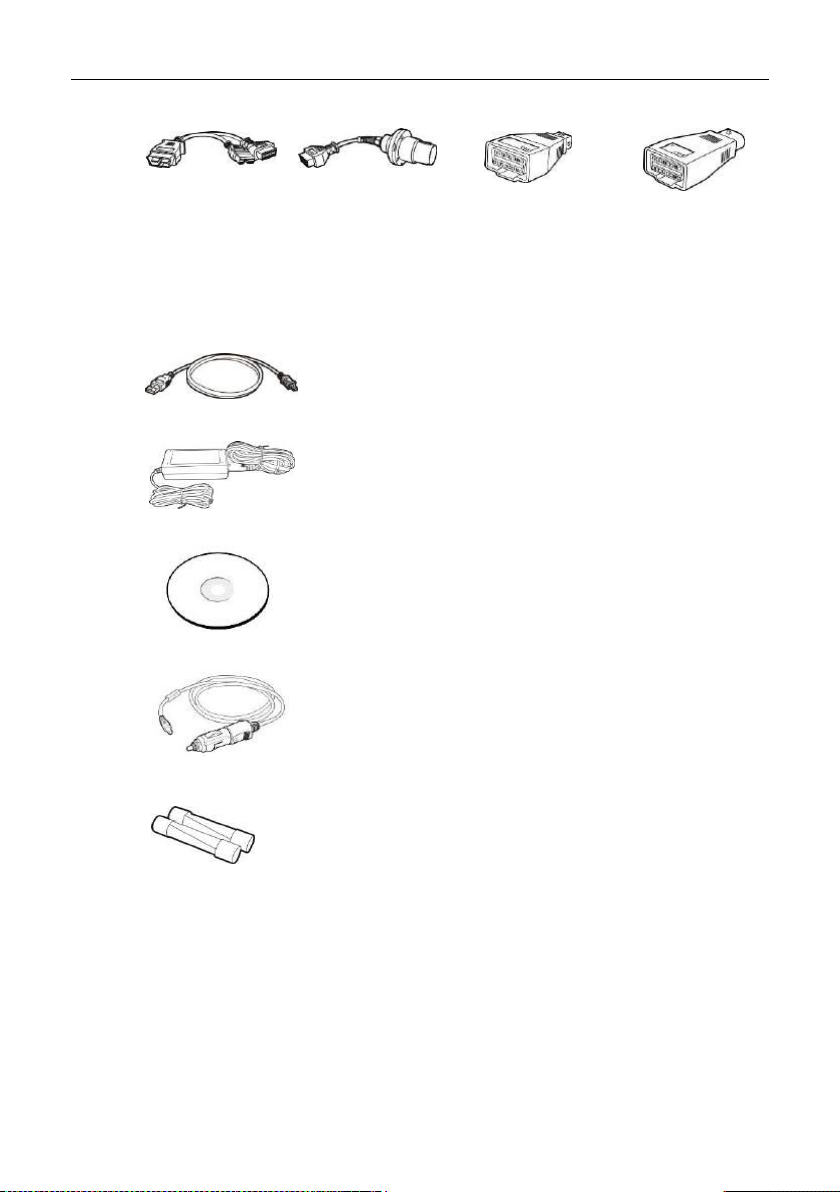
General Introduction Accessory Kit
Mitsubishi/
Hyundai -12+16
Benz-38
PSA-2
Fiat-3
Mini USB Cable
Connects the Display Tablet to the PC or the VCI unit.
AC/DC External Power Adapter
Connects the Display Tablet to the external DC power
port for power supply.
Compact Disc (CD)
Includes the User Manual, Printing Services, VCI
Update Agent, etc.
Cigarette Lighter
Provides power to the Display Tablet through
connection to the vehicle’s cigarette lighter receptacle.
Lighter Fuse
A safety device for the cigarette lighter.
2.3.2 Other Accessories
10
Page 18
Chapter 3 Getting Started
Make sure the Display Tablet has sufficient battery level or is connected to the DC
power supply (see 2.1.2 Power Sources on page 5).
NOTE: The images and illustrations depicted in this manual may differ from the actual
ones.
3.1 Powering Up
Press the Lock/Power button on the top right side of the Display Tablet to
switch the unit on. The system boots up, and shows the lock screen. Pressing
the inner ring with a Lock icon at the center displays 3 entry options:
1. Unlock – Drag the inner ring to the right edge of the circle to enter the
Android System’s Home Screen.
2. MaxiSys – Drag the inner ring to the top edge of the circle to enter the
MaxiSys Job Menu.
3. Camera – Drag the inner ring to the left edge of the circle to launch the
camera
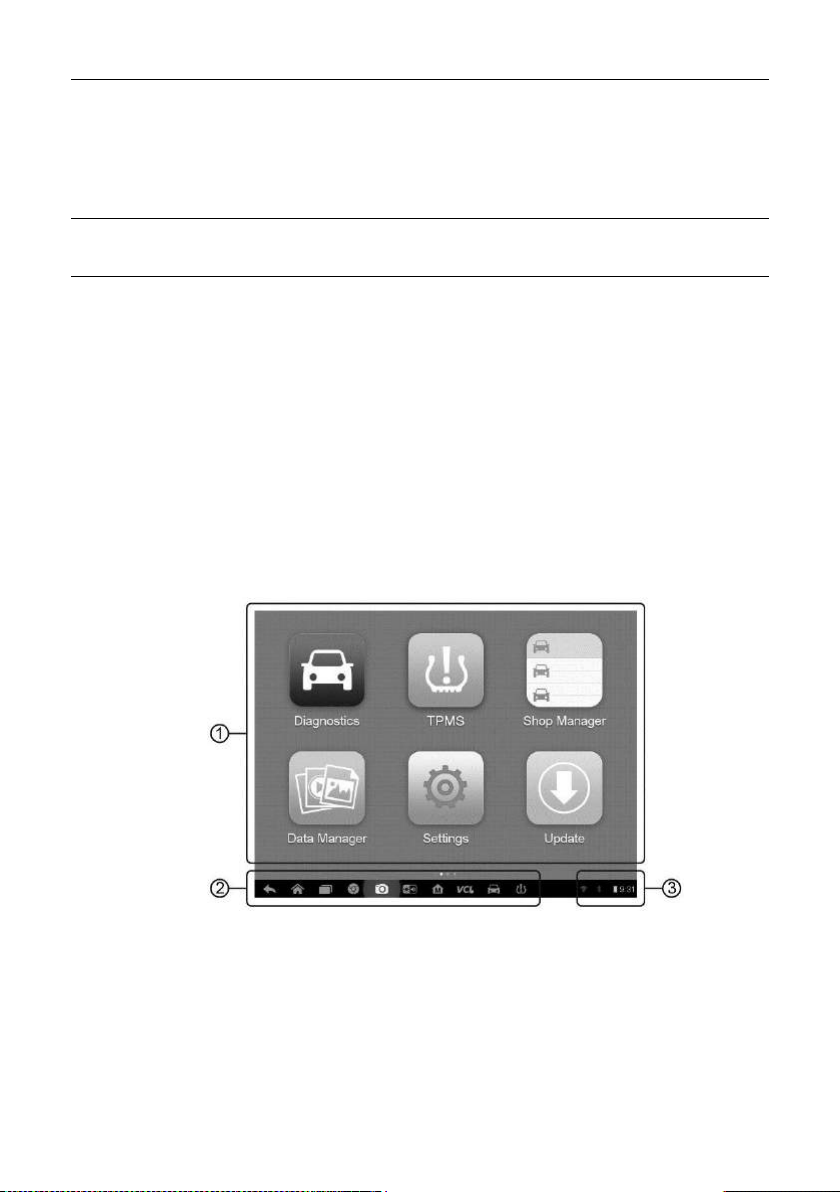
Figure 3-1 Sample MaxiSys MS906TS Job Menu
11
Page 19
Getting Started Powering Up
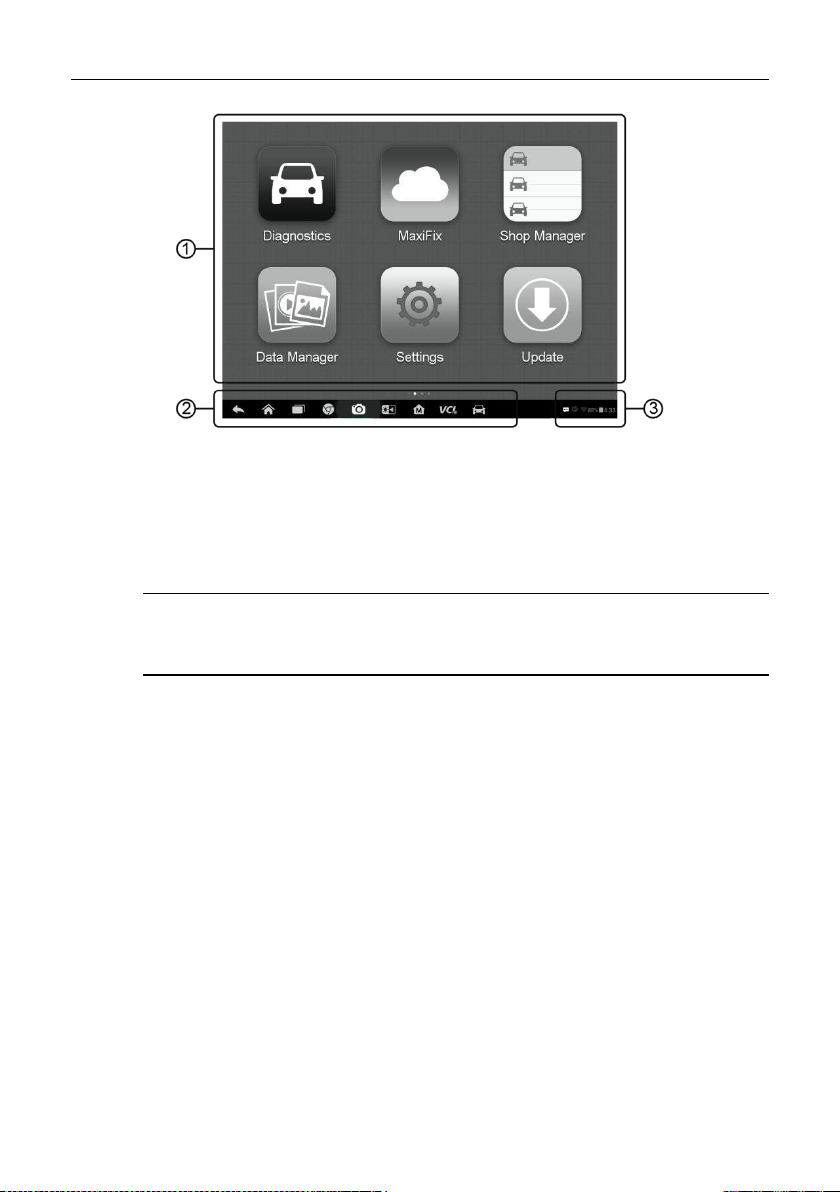
Figure 3-2 Sample MaxiSys MS906BT Job Menu
1. Application Buttons
2. Locator and Navigation Buttons
3. Status Icons
NOTE: The screen is locked by default when you first turn on the Display
Tablet. It is recommended to lock the screen to protect the information in the
system and reduce the power consumption.
Almost all operations on the Display Tablet are controlled through the touch
screen. The touch screen navigation is menu driven, which allows you to
quickly locate the test procedure, or data that you need, through a series of
choices and questions. Detailed descriptions of the menu structures are found
in the chapters for the various applications.
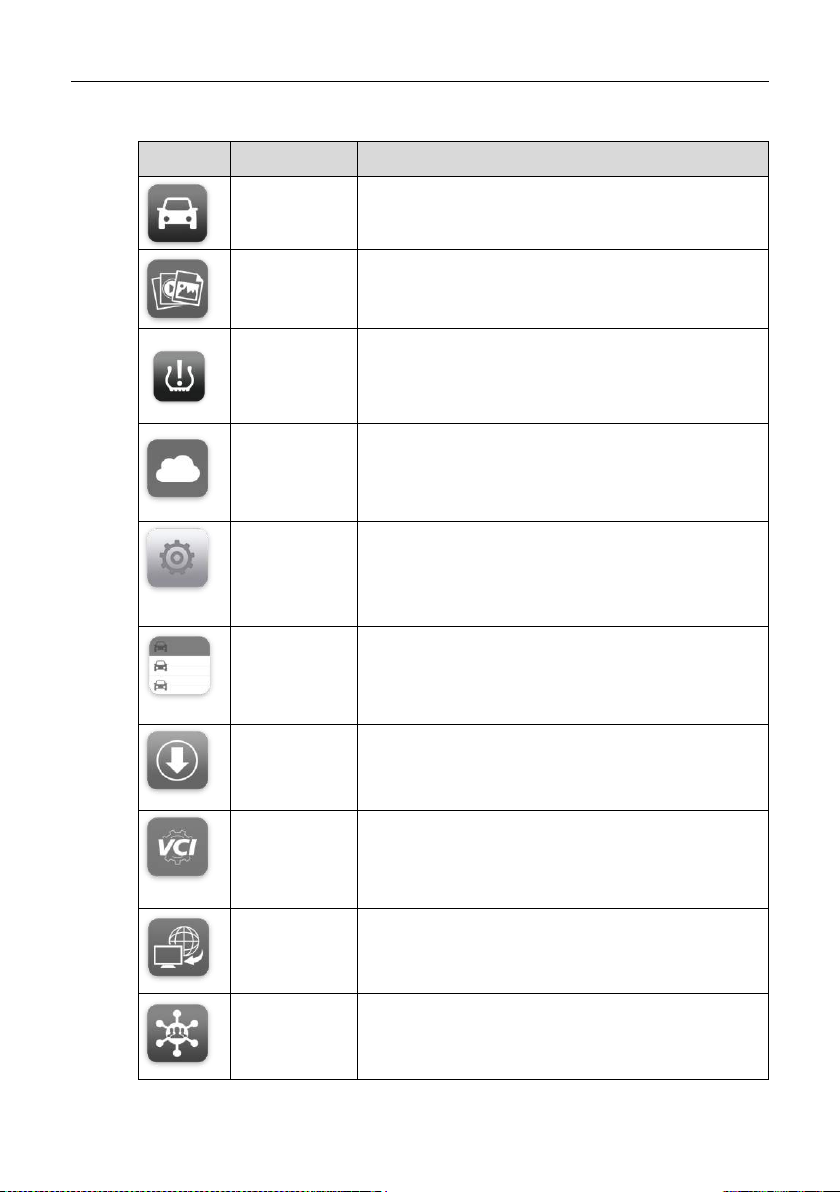
3.1.1 Application Buttons
The Application buttons configure the MaxiSys for the type of operation or
activity to be performed. The table below gives brief descriptions of the
available applications.
Tap on the screen to select an application from the Job Menu.
12
Page 20
Getting Started Powering Up
Button
Name
Description
Diagnostics
Configures the unit to operate as a diagnostic
tool. See Diagnostics Operations on page 19.
Data
Manager
Opens the organization system for saved data
files. See Data Manager Operations on page 84.
TMPS
Launches the TPMS service program directly.
See TPMS Service Operations on page 55 . (For
MaxiSys MS906TS)
MaxiFix
Launches the MaxiFix platform which provides
the most compatible and abundant repair
techniques and diagnostics database. See
MaxiFix Operations on page 67.
Settings
Allows you to set the MaxiSys system settings,
and to view the general information about the
Display Tablet. See Settings Operations on page
89.
Shop
Manager
Allows you to edit and save workshop
information and customer data, as well as
reviewing test vehicle history records. See Shop
Manager Operations on page 76.
Update
Checks for the latest update available for the
MaxiSys system, and performs updating
procedures. See Update Operations on page 93.
VCI
Manager
Establishes and manages BT connection to the
VCI device. See VCI Manager Operations on
page 96.
Remote
Desk
Configures your unit to receive remote support
using the TeamViewer application program. See
Remote Desk Operations on page 111.
Support
Launches the Support platform which
synchronizes Autel’s on-line service base station
with the MaxiSys tablet. See Support Operations
on page 99.
Table 3-1 Applications
13
Page 21
Getting Started Powering Up
Button
Name
Description
Training
Allows you to store and play technical tutorial
and training videos about the device usage or
vehicle diagnostic techniques. See Training
Operations on page 109.
Quick Link
Provides associated website bookmarks to allow
quick access to product update, service, support
and other information. See Quick Link
Operations on page 113.
MaxiScope
Configures the unit to operate as an automotive
oscilloscope to perform electrical and electronic
circuit tests and monitor signal activitie
s. See
Oscilloscope Operations
on page
114.
Digital
Inspection
Configures the unit to operate as a video scope
device by connecting to an Imager head cable for
close vehicle inspections. See Digital Inspection
Operations on page 131.
Button
Name
Description
Locator
Indicates the location of the screen. Swipe the
screen left or right to view the previous or next
screen.
Back
Returns to the previous screen.
Android
Home
Returns to Android System’s Home screen.
Recent
Apps
Displays a list of applications that are currently
working. To open an app, touch it. To remove an
app, swipe it to the right.
Chrome
Launches the Android built-in browser.
3.1.2 Locator and Navigation Buttons
Operations of the Navigation buttons at the bottom of the screen are described
in the table below:
Table 3-2 Locator and Navigation Buttons
14
Page 22
Getting Started Powering Up
Button
Name
Description
Camera
Opens the camera with short press; takes and
saves screenshot image with long press. The
saved files are auto-stored in the Data Manager
application for later reviews. See Data Manager
Operations on page 84.
Display &
Sound
Allows you to adjust the brightness of the screen
and the volume of the audio output.
MaxiSys
Home
Returns to MaxiSys Job Menu.
VCI
Opens the VCI Manager application. The tick
icon at the bottom right corner indicates the
Display Tablet is communicating with the VCI
device, otherwise a cross icon displays.
MaxiSys
Shortcut
Returns to the MaxiSys operation interface from
other Android applications.
TPMS
Shortcut
Returns to the TPMS service operation interface
from other applications. (For MS906TS)
To use the camera:
1. Tap the Camera button. The camera screen opens.
2. Focus the image to be captured in the view finder.
3. Tap the inner blue circle. The view finder now shows the captured
picture and auto-saves the taken photo.
4. Tap the thumbnail image on the top right corner of the screen to
view the stored image.
5. Tap the Back or Home button to exit the camera application.
Refer to Android documents for additional information.
3.1.3 System Status Icons
As the Display Tablet is working with the Android operating system, you may
refer to Android documents for more information.
15
Page 23
Getting Started Powering Down
Button
Name
Description
Calculator
Launches calculator when pressed.
Clock
Launches clock when pressed.
BT
Enables/disables BT when pressed.
Wi-Fi
Enables/disables Wi-Fi when pressed.
Torch
Turns on/off the torch when pressed.
Auto Rotate
Enables/disables auto-rotate screen when
pressed.
Airplane
Mode
Enables/disables Airplane Mode when pressed.
System
Settings
Launches the Android System Settings interface
when pressed.
By tapping on the bottom right corner, a Shortcuts Panel will be displayed, on
which you are allowed to set various system settings of the tablet. Operations
of each button on the panel are described in the table below:
Table 3-3 Shortcuts Panel Buttons
NOTE: The shortcuts buttons will be highlighted when enabled, and dimmed
when disabled.
3.2 Powering Down
All vehicle communications must be terminated before shutting down the
Display Tablet. A warning message displays if you attempt to shut down the
Display Tablet while the VCI unit is communicating with the vehicle. Forcing a
shut-down while communicating may lead to ECM problems on some vehicles.
Exit the Diagnostics application before powering down.
To power down the display tablet:
1. Press and hold the Lock/Power Button.
2. Tap Power off option.
16
Page 24

Getting Started Installing Computer Software
3. Tap OK; the tablet will turn off in a few seconds.
3.2.1 Reboot System
In case of system crash, press and hold the Lock/Power button for 8 seconds
to reboot the system.
3.3 Installing Computer Software
The MaxiSys MS906BT/MS906TS Diagnostic Platform allows you to print the
information needed for your convenience. To realize the printing function, you
need to install the printer driver program.
To install the printer driver program
1. Insert the included CD into the CD-ROM of the computer and open
the CD folder.
2. Double click on Autel Run.exe item.
3. Click the MaxiSys Printer icon in the MaxiSys PC Suite screen.
4. Select the installation language and the printer driver installation
wizard will load momentarily.
5. Follow the wizard instructions on the screen and Click Next to
continue.
6. Click on Install and the printer driver program will be installed onto
the computer.
7. Click on Finish to complete the whole installation procedure.
NOTE: The MaxiSys Printer runs automatically after the installation.
3.3.1 Printing Operation
This section describes how to receive file from the MaxiSys tablet and perform
printing through the computer:
To perform printing through the computer
1. Install the printer driver to the computer.
2. Before printing make sure the Display Tablet is connected to the
17
Page 25

Getting Started Installing Computer Software
computer network, either via WiFi or LAN. See 9.1.3 Printing Setting
on page 90 for more information.
3. Run the MaxiSys Printer program on the computer to open up the
printer interface.
4. Click Test Print to make sure the printer is working successfully.
5. Tap the Print button on the toolbar. A temporary document will be
created and sent to the computer for printing.
6. The MaxiSys Printer will print the received document automatically
when the Auto Print option is selected.
If you need to print the document later, click Open PDF file and
select the document, and double click the Print button on the
MaxiSys Printer interface to start the printing.
NOTE: Make sure the computer installed with the Printing Driver program is
connected to a printer.
18
Page 26

Chapter 4 Diagnostics Operations
By establishing a data link to the electronic control systems of the vehicle being
serviced through the VCI device, the Diagnostics application allows you to retrieve
diagnostic information, view live data parameters, and perform active tests. The
Diagnostics application can access the electronic control module (ECM) for various
vehicle control systems, such as engine, transmission, antilock brake system (ABS),
airbag system (SRS) and more.
4.1 Establishing Vehicle Communication
The Diagnostics operations require connecting the MaxiSys Diagnostic
Platform to the test vehicle through the VCI device and test adapters (for
non-OBD II vehicles). To establish proper vehicle communication to the
Display Tablet, you need to perform the following steps:
1. Connect the VCI device to the vehicle’s DLC for both communication and
power source.
2. Connect the VCI device to the Display Tablet via BT pairing or USB
connection.
3. When these are done, check the VCI navigation button at the bottom bar
on the screen, if the button displays a green tick icon at the lower right
corner, the MaxiSys Mini diagnostic platform is ready to start vehicle
diagnosis.
4.1.1 Vehicle Connection
The method used to connect the VCI device to a vehicle’s DLC depends on
the vehicle’s configuration as follows:
A vehicle equipped with an On-board Diagnostics Two (OBD II)
management system supplies both communication and 12-volt power
through a standardized J-1962 DLC.
A vehicle not equipped with an OBD II management system supplies
communication through a DLC connection, and in some cases supplies
12-volt power through the cigarette lighter receptacle or a connection to
the vehicle battery.
OBD II Vehicle Connection
This type of connection only requires the VCI device without any additional
adapter.
19
Page 27

Diagnostics Operations Establishing Vehicle Communication
To connect to an OBD II vehicle
1. Insert the Vehicle Data Connector on the MaxiVCI V100 into the
vehicle’s DLC, which is generally located under the vehicle dash.
NOTE: The vehicle’s DLC is not always located under the dash; refer to
the user manual of the test vehicle for additional connection information.
Non-OBD II Vehicle Connection
This type of connection requires both the VCI device and a required OBD I
adapter for the specific vehicle being serviced.
To connect to a Non-OBD II Vehicle
1. Locate the required OBD I adapter and connect its 16-pin jack to the
Vehicle Data Connector on the MaxiVCI V100.
2. Connect the attached OBD I adapter to the vehicle’s DLC.
NOTE: Some adapters may have more than one adapter or may have
test leads instead of an adapter. Whatever the case, make the proper
connection to the vehicle’s DLC as required.
The Display Tablet can be powered from the cigarette lighter when necessary.
To connect the cigarette lighter
1. Plug the DC power connector of the cigarette lighter into the DC
power supply input port on the Display Tablet.
2. Connect the male connector of the cigarette lighter into the vehicle’s
cigarette lighter receptacle.
4.1.2 VCI Connection
After the MaxiVCI V100 is properly connected to the vehicle, and the Power
LED on the VCI device illuminates solid green, it indicates that the MaxiVCI
V100 is ready to establish communication with the Display Tablet.
The Wireless Diagnostic Interface MaxiVCI V100 supports 2 communication
methods with the Display Tablet, wireless BT and USB.
Pairing Up via BT
BT pairing is recommended as the first choice for the communication between
the Display Tablet and the VCI device. The working range for BT
20
Page 28

Diagnostics Operations Establishing Vehicle Communication
communication is about 164 feet (about 50 m); this means you can perform
vehicle diagnosis freely around the workshop with greater convenience.
If you use more than one VCI device to connect to the test vehicles, you can
perform vehicle diagnosis on various vehicles conveniently, by pairing the
Display Tablet separately to each of the VCI devices connected to the different
test vehicles, via wireless BT, without the need to repeat the plugging and
unplugging procedure, which is unavoidable through traditional wired
connection, thus saves you more time and provides more efficiency.
To pair up the Display Tablet with the MaxiVCI V100 via BT
1. If not already done, power up the Display Tablet.
2. Select the VCI Manager application from the MaxiSys Job Menu.
3. When the VCI Manager application is opened, the Display Tablet
automatically starts scanning for available VCI devices around for
BT pairing. The found VCI devices are listed in the Setting section
on the right side of the screen.
NOTE: If no VCI device is found, this may indicate that the signal strength
of the transmitter is too weak to be detected. In this case, try to get closer
to the device, or reposition the VCI device, and remove all possible
objects that cause signal interference. When these are done, tap the
Scan button at the top right corner to start searching again.
4. The device name appeared on the Display Tablet may display as
Maxi suffixed with a serial number. Select the required device for
pairing.
5. When paring is successfully done, the connection status displayed
to the right of the device name is shown as Paired.
6. Wait for a few seconds, and the VCI button on the system
Navigation bar at the bottom of the screen shall display a green tick
icon, and the Connection Mode LED on the MaxiVCI V100
illuminates solid blue, indicating the Display Tablet is connected to
the VCI device, and is ready to perform vehicle diagnosis.
Refer to 11.1 BT Pairing on page 96 for additional information.
USB Cable Connection
The USB cable connection is a simple and quick way to establish
communication between the Display Tablet and the MaxiVCI V100. After
properly connecting the USB cable from the tablet to the VCI device, the VCI
navigation button at the bottom bar of the screen shows a green tick icon in a
21
Page 29

Diagnostics Operations Establishing Vehicle Communication
few seconds, and the Connection Mode LED on the MaxiVCI V100 illuminates
solid green, indicating the connection between the devices is successful. The
MaxiSys diagnostic platform is now ready to perform vehicle diagnosis.
NOTE: When both the communication methods are applied at the same time,
the MaxiSys system will use the USB communication as the default priority.
4.1.3 No Communication Message
A. If the Display Tablet is not connected to the VCI device correctly, an
“Error” message may display. This indicates that the Display Tablet
cannot access to the vehicle control module. In this case, you need to do
the following check-ups:
Check if the VCI device is powered up.
In case of wireless connection, check if the network is configured
correctly, or if the right VCI device has been paired.
If during the diagnosis process, the communication is suddenly
interrupted due to the loss of signal, check if there is any object that
causes signal interruption.
Check if the VCI device is properly positioned.
Try standing closer to the VCI device to obtain more stable signals,
and faster communication speed.
In case of wired connection, check the cable connection between
the Display Tablet and the VCI device.
Check if the Connection Mode LED on the VCI device is illuminated
for BT or USB.
Check if the Power LED on the VCI device is flashing red, this may
indicate there is a hardware problem with the VCI device, in this
case contact for the technical support.
B. If the VCI device is unable to establish a communication link, a prompt
message displays with check instructions. The following conditions are
the possible causes:
The VCI device is unable to establish a communication link with the
vehicle.
You’ve selected a system for testing that the vehicle is not equipped
with.
22
Page 30
Diagnostics Operations Getting Started
There is a loose connection.
There is a blown vehicle fuse.
There is a wiring fault on the vehicle or the adapter.
There is a circuit fault in the adapter.
Incorrect vehicle identification was entered.
4.2 Getting Started
Prior to first use of the Diagnostics application, make sure the VCI device has
been synchronized with the Display Tablet to establish a communication link.
See VCI Manager Operations on page 96.
4.2.1 Vehicle Menu Layout
When the VCI device is properly connected to the vehicle, and paired to the
Display Tablet, the platform is ready to start the vehicle diagnosis. Tap on the
Diagnostics application button on the MaxiSys Job Menu, the screen then
opens the Vehicle Menu.
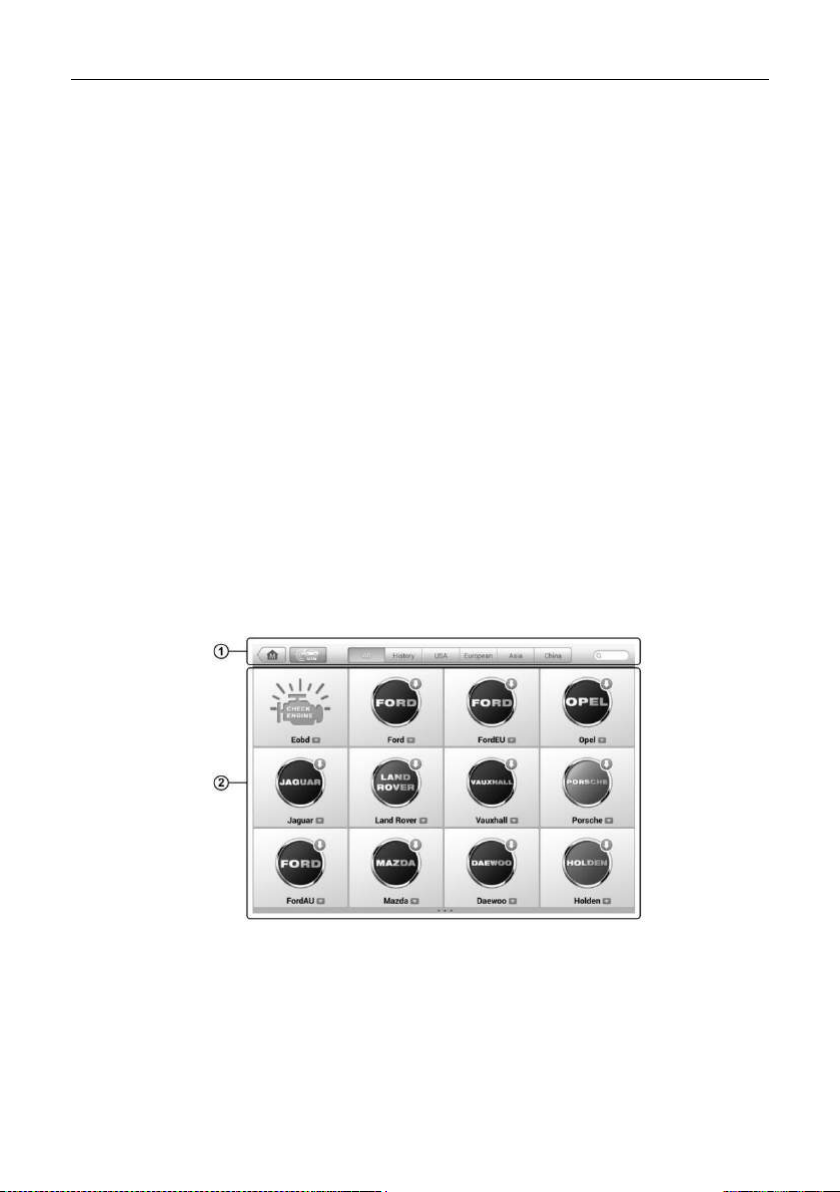
Figure 4-1 Sample Vehicle Menu Screen
1. Top Toolbar Buttons
2. Manufacturer Buttons
23
Page 31

Diagnostics Operations Getting Started
Button
Name
Description
Home
Returns to the MaxiSys Job Menu.
VIN
Scan
Touching this button opens a dropdown list; tap
Auto Detect for auto VIN detection; tap
Manual Input to enter VIN manually.
All
Displays all the vehicle makes in the vehicle
menu.
History
Displays the stored test vehicle history records.
This option provides you direct access to the
previously tested vehicle recorded during
previous test sessions. See 7.1 Vehicle History
on page 77.
USA
Displays the USA vehicle menu.
Europe
Displays the European vehicle menu.
Asia
Displays the Asian vehicle menu.
Search
Touching this button opens the virtual
keyboard, allowing you to manually enter the
specific vehicle make required.
Cancel
Touching this button exits the search screen, or
cancels an operation.
Top toolbar Buttons
The operations of the Toolbar buttons at the top of the screen are listed and
described in the table below:
Table 4-1 Top Toolbar Buttons
Manufacturer Buttons
The Manufacturer buttons display the various vehicle logos and the brand
names. Select the required manufacturer button after the VCI device is
properly connected to the test vehicle to start a diagnostic session.
Tapping the small envelop icon beside each vehicle brand name will open a
PDF document displaying the function list of the diagnostic software, including
the applicable models and functions.
24
Page 32

Diagnostics Operations Vehicle Identification
NOTE: The Update icon displayed on the upper right of the vehicle brand
name indicates there is available update for the vehicle. Tap this icon to enter
the Update application directly.
4.3 Vehicle Identification
The MaxiSys diagnostic system supports four methods for Vehicle
Identification.
1. Auto VIN Scan
2. Manual VIN Input
3. Manual Vehicle Selection
4. OBD Direct Entry
4.3.1 Auto VIN Scan
The MaxiSys diagnostic system features the latest VIN-based Auto VIN Scan
function to identify CAN vehicles in just one touch, which allows the technician
to quickly detect vehicles, scan all the diagnosable ECUs on every vehicle and
run diagnostics on the selected system.
To perform Auto VIN Scan
1. Tap the Diagnostics application button from the MaxiSys Job Menu.
The Vehicle Menu displays. (Figure 4-1)
2. Tap the VIN Scan button on the top toolbar.
3. Select Auto Detect. The tester starts VIN scanning on the vehicle’s
ECU. Once the test vehicle is successfully identified, the system will
guide you to the Vehicle Diagnostics screen directly.
25
Page 33

Diagnostics Operations Vehicle Identification
Figure 4-2 Sample Vehicle Diagnostics Screen
In some cases when users have selected the vehicle brand instead of
performing Auto VIN Scan in the first place, the system still provides an option
for vehicle VIN scan.
Figure 4-3 Sample Vehicle Selection Screen
Select Automatic Selection and the system will proceed to acquire VIN
information automatically or allow users to input the VIN manually.
4.3.2 Manual VIN Input
For some vehicles that do not support the Auto VIN Scan function, the
MaxiSys diagnostic system allows you to enter the vehicle VIN manually.
26
Page 34

Diagnostics Operations Vehicle Identification
To perform Manual VIN Input
1. Tap the Diagnostics application button from the MaxiSys Job Menu.
The Vehicle Menu displays. (错误!未找到引用源。 )
2. Tap the VIN Scan button on the top toolbar.
3. Select Manual Input.
4. Tap the input box and enter the correct VIN.
Figure 4-4 Manual VIN Input
5. Tap Done. The vehicle will be identified in a few seconds, and once
the matching is successful, the system will guide you to the Vehicle
Diagnostics screen directly. (Figure 4-2)
6. Tap Cancel to exit Manual Input.
4.3.3 Manual Vehicle Selection
When the vehicle’s VIN is not automatically retrievable through the vehicle's
ECU, or the specific VIN is unknown, you can choose to select the vehicle
manually.
Step-by-step Vehicle Selection
This mode of vehicle selection is menu driven; you can simply follow the
on-screen prompts and make a series of choices. Each selection you make
advances you to the next screen. A Back button at the lower right corner of the
screen will bring you back to the previous step. Exact procedures may vary
somewhat by various vehicles being serviced.
27
Page 35

Diagnostics Operations Navigation
4.3.4 Alternative Vehicle Identification
Occasionally, you may identify a test vehicle that the tester does not recognize;
the database does not support, or has some unique characteristics that
prevent it from communicating with the tester through the normal channels. In
these instances, you are provided with the OBD direct entry, through which
you can perform generic OBD II or EOBD tests. See 4.8 Generic OBD II
Operations on page 49 for details.
4.4 Navigation
This section describes how to navigate the Diagnostics interface and select
test options.
4.4.1 Diagnostics Screen Layout
The diagnostic screens typically include four sections. (Figure 4-5)
Figure 4-5 Sample Diagnostics Screen
1. Diagnostics Toolbar
2. Status Information Bar
3. Main Section
4. Functional Buttons
28
Page 36

Diagnostics Operations Navigation
Button
Name
Description
Home
Returns to the MaxiSys Job Menu.
Vehicle
Swap
Touching this button allows you to exit the
diagnostic session of the currently identified test
vehicle, and returns you to the vehicle menu screen
to select another vehicle for testing.
Settings
Opens the setting screen. See Settings Operations
on page 89.
Print
Saves and prints a copy of the displayed data. See
3.3.1 Printing Operation for additional information
on page 17.
Help
Provides instructions or tips for operations of
various diagnostic functions.
Save
Tapping this button opens a submenu, on which
there are 3 options available to save the displayed
data.
Tap Save This Page to take a screenshot
image
Tap Save All Data to save a PDF file (mostly
used to save data that cover more than 1
page)
Tap Start Saving to record a video clip (only
available for recording Live Data or special
graph data)
All saved data are stored in the Data Manager
application for later reviews. See Data Manager
Operations on page 84.
Diagnostics Toolbar
The Diagnostics Toolbar contains a number of buttons that allow you to print
or save the displayed data and make other controls. The table below provides
a brief description for the operations of the Diagnostics Toolbar buttons:
Table 4-2 Diagnostics Toolbar Buttons
29
Page 37

Diagnostics Operations Navigation
Button
Name
Description
Data
Logging
Records the communication data and ECU
information of the test vehicle. The saved data can
be reported and sent to the technical center via the
internet.
You can go to the Support application to follow up
the processing progress, see 12.5 Data Logging on
page 104 for detailed information.
Send
Tapping this button submits the Data Logging report
to the technical center via the internet.
To print data in Diagnostics
1. Tap the Diagnostics application button from the MaxiSys Job Menu.
The Print button on the diagnostic toolbar is available throughout
the whole Diagnostics operations.
2. Tap Print whenever you want to make a printing. A drop-down menu
appears.
a) Print This Page – prints a screenshot copy of the current
screen
b) Print All Page – prints a PDF copy of all displayed data
3. A temporary file will be created and send to the computer for
printing.
4. When the file is transferred successfully, a confirmation message
displays.
NOTE: Make sure the Display Tablet is connected to the computer network,
either via Wi-Fi or LAN, before printing. For more instructions on printing, see
3.3.1 Printing Operation on page 17 for details.
To submit Data Logging reports in Diagnostics
1. Tap the Diagnostics application button from the MaxiSys Job Menu.
The Data Logging button on the diagnostic toolbar is available
throughout the whole Diagnostics operations.
2. Tap the Data Logging button. The button displays blue during the
active recording process.
3. Tap the Data Logging button again to finish recording. A submission
30
Page 38

Diagnostics Operations Navigation
form will display to let you fill in the report information.
4. Tap the Send button to submit the report form via the internet, a
confirmation message displays when sending is successful.
Status Information Bar
The Status Information Bar at the top of the Main Section displays the
following items:
1. Menu Title – indicates the menu subject of the Main Section
2. VCI Icon – indicates the communication status between the tablet and
the VCI device
3. Battery Icon – indicates the battery status of the VEHICLE
Main Section
The Main Section of the screen varies depending on the stage of operations.
The Main Section can show vehicle identification selections, the main menu,
test data, messages, instructions and other diagnostic information.
Functional Buttons
The displayed Functional Buttons at this section of the screen varies
depending on the stage of operations. They can be used to navigate, save or
clear the diagnostic data, exit scanning as well as make other functional
controls. The functions of these buttons will be introduced respectively in the
following sections of the corresponding test operations.
4.4.2 Screen Messages
Screen messages appear when additional input is needed before proceeding.
There are mainly three types of on-screen messages as to their purposes:
Confirmation, Warning, and Error.
Confirmation Messages
This type of messages usually displays as an “Information” screen, which
informs you when you are about to perform an action that cannot be reversed
or when an action has been initiated and your confirmation is needed to
continue.
When a user-response is not required to continue, the message displays
briefly before automatically disappearing.
31
Page 39

Diagnostics Operations Main Menu
Warning Messages
This type of messages informs you when completing the selected action may
result in an irreversible change or loss of data. The typical example for this is
the “Erase Codes” message.
Error Messages
Error messages inform you when a system or procedural error has occurred.
Examples of possible errors include a disconnection or communication
interruption due to certain reasons.
4.4.3 Making Selections
The Diagnostics application is a menu driven program that presents a series
of choices one at a time. As you select from a menu, the next menu in the
series displays. Each selection narrows the focus and leads to the desired test.
Use your fingertip or the stylus pen to make menu selections.
4.5 Main Menu
The Diagnostics application allows you to establish a data link to the electronic
control system of the test vehicle via the VCI device for vehicle diagnosis, and
service. You can operate functional tests, retrieve vehicle diagnostic
information such as trouble codes, event codes and live data for various
vehicle control systems, such as engine, transmission, ABS and more.
The Vehicle Diagnostics screen (Figure 4-2) has 2 main options:
1. Diagnosis – a comprehensive section which includes all available
functions: reading, clearing, saving and printing diagnostic information,
as well as performing active tests and special functions
2. Service – a separate section designed to perform vehicle scheduled
service and maintenance, such as to reset the service lights and perform
calibration for various systems
After a section is selected and the tablet establishes communication with the
vehicle via the VCI device, the corresponding function menu or selection
menu displays.
4.6 Diagnosis
There are two options available when accessing the Diagnosis section:
32
Page 40

Diagnostics Operations Diagnosis
1. Auto Scan – starts auto scanning for all the available systems on the
vehicle
2. Control Units – displays a selection menu of all available control units of
the test vehicle
Auto Scan
The Auto Scan function performs a comprehensive scanning over all the
systems on the vehicle’s ECU in order to locate fault systems and retrieve
DTCs. The sample operation interface of Auto Scan displays as below:
Figure 4-6 Sample Auto Scan Operation Screen
1. Navigation Bar
2. Main Section
3. Functional Buttons
Navigation Bar
1. List Tab – displays the scanned data in list format
2. Tree Tab – display the scanned data in system distribution diagram
format
3. Progress Bar – indicates the test progress
33
Page 41

Diagnostics Operations Diagnosis
Main Section
A. List Tab
Column 1 - displays the system numbers
Column 2 - displays the scanned systems
Column 3 - displays the diagnostic marks indicating different conditions
of the test result:
-!-: Indicates that the scanned system may not support the code
reading function, or there is a communication error between the tester
and the control system.
-?-: Indicates that the vehicle control system has been detected, but
the tester cannot accurately locate it.
Fault | #: Indicates there is/are detected fault code(s) present; “#”
indicates the number of the detected faults.
Pass | No Fault: Indicates the system has passed the scanning
process and no fault has been detected.
B. Tree Tab
The tree tab screen displays a system distribution diagram of the vehicle
control modules. The scanned system which has passed scanning with
no fault is shown in blue font; whereas the scanned system that has been
detected with fault present is shown in red font.
Tap the
perform further diagnosis and other test activities. A Function Menu
screen (Figure 4-7) shall then display.
Functional Buttons
The table below provides a brief description of the Functional Buttons’
operations in Auto Scan:
> button to the right of the system item, on which you want to
○
34
Page 42

Diagnostics Operations Diagnosis
Name
Description
Back
Returns to the previous screen or exit Auto Scan.
Pause
Suspends scanning and changes to show the Continue
button.
OK
Confirms the test result, and continues to the system
diagnosis after selecting the required system by tapping
the item in the Main Section.
Quick Erase
Deletes codes. A warning message screen will display
to inform you of possible data loss when this function is
selected.
Report
Displays the diagnostic data in the report form.
Save
Saves the diagnostic session as a history record, this
allows you to quickly restore access to the test systems.
Table 4-3 Functional Buttons in Auto Scan
Control Units
This option allows you to manually locate a required control system for testing
through a series of choices. You simply follow the menu driven procedure, and
make proper selection each time; the program will guide you to the diagnostic
function menu after a few choices you’ve made.
Figure 4-7 Sample Function Menu Screen
35
Page 43

Diagnostics Operations Diagnosis
The Function Menu options vary slightly for different vehicles. The function
menu may include:
ECU Information – provides the retrieved ECU information in detail.
Selecting opens an information screen.
Read Codes – displays detailed information of DTC records retrieved
from the vehicle control module.
Erase Codes – erases DTC records and other data from the ECM.
Live Data – retrieves and displays live data and parameters from the
vehicle’s ECU.
Active Test – provides specific subsystem and component tests. This
selection may appear as Actuators, Actuator Test, or Function Tests,
etc., and the tests options vary depending on the manufacturer and
model.
Special Functions – provides component adaptation or variant coding
functions for custom configurations, and also allows you to reprogram
adaptive values for certain components after making repairs. Depending
on the test vehicle, this selection may sometimes appear as Control
Unit Adaptations, Special Functions, Variant Coding, Configuration,
etc.
NOTE: With the diagnostic toolbar on top of the screen throughout the whole
diagnostic procedures, you are allowed to make various controls of the
diagnostic information at any time, such as printing and saving the displayed
data, getting help information, or performing data logging, etc.
To perform a diagnostic function
1. Establish communication with the test vehicle via the VCI device.
2. Identify the test vehicle by selecting from the menu options.
3. Select the Diagnosis section.
4. Locate the required system for testing by Auto Scan or through
menu driven selections in Control Units.
5. Select the desired test from the Function Menu.
36
Page 44

Diagnostics Operations Diagnosis
4.6.1 ECU Information
This function retrieves and displays the specific information for the tested
control unit, including unit type, version numbers and other specifications.
The sample ECU Information screen displays as below:
Figure 4-8 Sample ECU Information Screen
1. Diagnostics Toolbar Buttons – see Table 4-2 Diagnostics Toolbar
Buttons on page 29 for detailed descriptions of the operations for each
button.
2. Main Section – the left column displays the item names; the right
column shows the specifications or descriptions.
3. Functional Button – In this case, only a Back (or sometimes an ESC)
button is available; tap it to exit after viewing.
4.6.2 Read Codes
This function retrieves and displays the DTCs from the vehicle’s control
system. The Read Codes screen varies for each vehicle being tested. On
some vehicles, freeze frame data can also be retrieved for viewing. The
sample Read Codes screen displays as below:
37
Page 45

Diagnostics Operations Diagnosis
Figure 4-9 Sample Read Codes Screen
1. Diagnostics Toolbar Buttons – see Table 4-2 Diagnostics Toolbar
Buttons on page 29 for detailed descriptions of the operations for each
button.
2. Main Section
Code Column – displays the retrieved codes from the vehicle.
Status Column – indicates the status of the retrieved codes.
Description Column – detailed descriptions for the retrieved codes.
Snowflake Icon – only displays when freeze frame data is available
for viewing; Selecting this icon will display a data screen, which
looks very similar to the Read Codes interface, therefore same
operation method may be applied.
3. Functional Button – only a Back (or sometimes an ESC) button is
available; tap it to return to the previous screen or exit the function.
4.6.3 Erase Codes
After reading the retrieved codes from the vehicle and certain repairs have
been carried out, you can erase the codes from the vehicle using this function.
Before performing this function, make sure the vehicle’s ignition key is in the
ON (RUN) position with the engine off.
38
Page 46

Diagnostics Operations Diagnosis
To erase codes
1. Tap Erase Codes from the Function Menu.
2. A warning message displays to inform you of data loss when this
function is applied.
a) Tap Yes to continue. A confirming screen displays when the
operation is successfully done.
b) Tap No to exit.
3. Tap ESC on the confirming screen to exit Erase Codes.
4. Perform the Read Codes function again to check if the code erasing
is successful.
4.6.4 Live Data
When this function is selected, the screen displays the data list for the
selected module. The items available for any control module vary from one
vehicle to another. The parameters display in the order that they are
transmitted by the ECM, so expect variation between vehicles.
Gesture scrolling allows you to quickly move through the data list. Simply
swipe the screen up or down to locate the data you want. The figure below
shows a typical Live Data screen:
Figure 4-10 Sample Live Data Screen
39
Page 47

Diagnostics Operations Diagnosis
1. Diagnostics Toolbar Buttons – tap the drop-down button at the top
center of the screen and the toolbar buttons will display. See Table 4-2
Diagnostics Toolbar Buttons on page 29 for detailed descriptions of the
operations for each button.
2. Main Section
Name Column – this column displays the parameter names.
a) Check Box - tap the check box at the left side of the parameter
name to make selection of an item. Tap the check box again to
deselect the item.
b) Drop-down Button – tapping the drop-down button at the right
side of the parameter name opens a submenu, which provides
various choices for data display mode.
Value Column – displays the values of the parameter items.
Range Column - displays the minimum and the maximum value.
Unit Column – displays the unit for the parameters.
To change the unit mode, tap the Setting button on the top toolbar
and select a required mode. See 9.1.1 Unit on page 89 for more
information.
3. Display Mode
There are 4 types of display modes available for data viewing, allowing
you to view various types of parameters in the most suitable way.
Tapping the drop-down button on the right side of the parameter name
opens a submenu. There are 4 buttons to configure the data display
mode, and one Help button on the right that you can tap for additional
information.
Each parameter item displays the selected mode independently.
Analog Gauge Mode – displays the parameters in form of an analog
meter graph
Text Mode – this is the default mode which displays the parameters in
texts and shows in list format
NOTE: Reading of status parameters, such as a switch reading, which
are mostly in word form, like ON, OFF, ACTIVE, and ABORT, etc., can
only be displayed in Text Mode. Whereas reading of value parameters,
such as a sensor reading, can be displayed in text mode and other graph
modes.
Waveform Graph Mode – displays the parameters in waveform graphs
40
Page 48

Diagnostics Operations Diagnosis
When this mode is applied, three control buttons will appear on the right
side of the parameter item, allowing you to manipulate the display status.
Text Button – resumes Text Display Mode
Scale Button – changes the scale values, which are displayed
below the waveform graph. There are 4 scales available: x1, x2,
x4 and x8.
Zoom-in Button – tap once to display the selected data graph in
full screen
Digital Gauge Mode– displays the parameters in form of a digital gauge
graph
Full Screen Display – this option is only available in the waveform graph
mode, and mostly used in Graph Merge status for data comparison.
There are three control buttons available on the top right side of the
screen under this mode.
Edit Button – tapping this button opens an edit window, on which
you can set the waveform color and the line thickness displayed
for the selected parameter item.
Scale Button - changes the scale values, which are displayed
below the waveform graph. There are 4 scales available: x1, x2,
x4 and x8.
Zoom-out Button – exits full screen display.
To edit the waveform color and line thickness in a data graph
1. Select 1 to 3 parameter items to display in Waveform Graph mode.
2. Tap the Zoom-in Button on the right to display the data graph in
full screen.
3. Tap the Edit Button, and an edit window appears.
4. Select a parameter item on the left column.
5. Select a desired sample color from the second column.
6. Select a desired sample line thickness from the right column.
7. Repeat step 4-7 to edit the waveform for each parameter item.
8. Tap Done to save the setting and exit, or tap Cancel to exit without
saving.
4. Functional Buttons
41
Page 49

Diagnostics Operations Diagnosis
The operations of all the available functional buttons on Live Data screen
are described below:
Back – returns you to the previous screen or exit the function.
Record – starts recording the retrieved live data; the recorded data is
then stored as a video clip in the Data Manager application for future
reviews. This function could be triggered automatically at preset threshold
value or manually as you choose, and the triggering mode and record
duration can be configured in the Setting mode of Live Data.
Freeze – displays the retrieved data in freeze mode.
Previous Frame – Moves to the previous frame in the freeze data.
Next Frame – Moves to the next frame in the freeze data.
Resume – this button appears when the Record or Freeze function is
applied. Tapping this button stops data recording, or exit freeze data
mode, and resumes normal data display mode.
Flag – this button appears when the Record function is applied. Tapping
this button sets flags for the recorded data at points wherever you choose.
When playing back the recorded video clip later in Data Manager, the
preset flag will enable a popup to allow input of text to take notes.
Clear Data – clears all previously retrieved parameter values at a cutting
point whenever you choose.
To Top – moves a selected data item to the top of the list.
Graph Merge – tap this button to merge selected data graphs (for
Waveform Graph Mode only). This function is very useful when making
comparison between different parameters.
NOTE: This mode supports Graph Merge for 2 to 3 parameter items only,
so select no less than 2 or no more than 3 items each time when making
graph merge.
To cancel Graph Merge mode, tap the drop-down button on the
right side of the parameter name, and select a data display mode.
Show Selected/Show All – tap this option to switch between the two
options; one displays the selected parameter items, the other displays all
the available items.
42
Page 50

Diagnostics Operations Diagnosis
Setting – tapping this button opens a setting screen, which allows you to
set the trigger mode, recording duration, and various threshold values for
data recording, and make other controls.
Figure 4-11 Sample Setting Mode in Live Data
There are four navigation buttons on top of the Setting mode screen.
Range Button – displays the configuration screen on which you can
set the threshold values, an upper limit and a lower limit, for
triggering the buzzer alarm. This function is only applied to the
Waveform Graph display mode.
a) MIN – tapping which opens a virtual keyboard, allowing you to
enter the required lower limit value
b) MAX – tapping which opens a virtual keyboard, allowing you to
enter the required upper limit value
c) Buzzer Alarm – switches the alarm on and off. The alarm
function makes a beep sound as a reminder whenever the data
reading reaches the preset minimum or maximum point
To set threshold limits for the parameter values
1. Tap the Setting functional button at the bottom of the Live Data
screen.
2. Tap the Range navigation button.
43
Page 51

Diagnostics Operations Diagnosis
3. Select a parameter item on the left column, or enter the item
name in the Search bar.
4. Tap on the right side of the MIN button, and enter the required
minimum value.
5. Tap on the right side of the MAX button, and enter the required
maximum value.
6. Tap the ON/OFF button on the right side of the Buzzer Alarm
button to turn it on or off.
7. Tap Done to save the setting and return to the Live Data
screen; or tap Cancel to exit without saving.
If the threshold limits are successfully set, two horizontal lines will
appear on each of the data graphs (when Waveform Graph Mode is
applied) to indicate the alarming point. The threshold lines are shown
in different colors from the waveform of the parameters for
distinction.
Record Button – displays the configuration screen for Record
Setting, on which you can set the trigger type, duration and trigger
point for the data recording function.
a) Trigger Type – sets the trigger mode for data recording,
mainly of two kinds: Manual and Auto. There are four options
available:
1) Manual – allows you to manually start and stop data
recording
2) DTC – auto triggers data recording when any DTC is
detected
3) DTC Check Mode – auto triggers data recording when
certain pre-selected DTC types are detected
4) Parameter – auto triggers data recording when any
parameter value reaches the preset threshold
b) Duration – sets the recording time (for Auto trigger mode only)
c) Trigger Point – reserves a relative percentage of a record
length before the data recording start point for reference (for
Auto trigger mode only)
44
Page 52

Diagnostics Operations Diagnosis
To perform setting for live data record
1. Tap the Setting functional button at the bottom of the Live Data
screen.
2. Tap the Record navigation button.
3. Tap the ○> button on the right of Trigger Type bar and select
the required trigger mode.
4. Tap the ○> button on the right of Duration bar and select a
length of time.
5. Tap the ○> button on the right of Trigger Point bar and select
a relative percentage of a record length to be reserved before
the data recording start point.
6. Tap Done to save the setting and return to the Live Data
screen; or tap Cancel to cancel without saving and exit Setting.
Done Button - confirms and saves the setting, and returns you to
the Live Data screen.
Cancel Button – cancels the setting operation, and returns you to
the Live Data screen.
4.6.5 Active Test
The Active Test function is used to access vehicle-specific subsystem and
component tests. Available tests vary depending on the manufacturer, year,
and model, and only the available tests display in the menu.
During an active test, the tester outputs commands to the ECU in order to
drive the actuators. This test determines the integrity of the system or parts by
reading the engine ECU data, or by monitoring the operation of the actuators,
such as switching a solenoid, relay, or switch, between two operating states.
Selecting Active Test opens a menu of test options that varies by make and
model. Selecting a menu option activates the test. Follow all screen
instructions while performing tests. The content and pattern of the on-screen
information vary according to the type of test being performed. Some toggle
and variable control tests display Active Test Controls at the top of the screen
with data stream information below, or vice versa.
45
Page 53

Diagnostics Operations Diagnosis
Figure 4-12 Sample Active Test Screen
The functional buttons at the lower right corner of the Active Test screen
manipulate the test signals. The operational instructions are displayed on the
main section of the test screen. Simply follow the on-screen instructions and
make appropriate selections to complete the tests. Each time when an
operation is successfully executed, message such as “Command Finished”,
“Activation Successful”, or something similar displays.
Tap the ESC functional button to exit the test when finished.
4.6.6 Special Functions
These functions perform various component adaptations, allowing you to
recalibrate or configure certain components after making repairs or
replacement.
The main section of the Adaptation Operation screen displays a list of
operational and vehicle status information, which mainly consists of four parts:
1. The first part in the top line shows the description of the operation being
performed, and the execution status is displayed on the right, such as
Completed, Activated, etc.
2. The second part shows the preconditions or requirements for executing
the operation being selected.
46
Page 54

Diagnostics Operations Service
3. The third part displays the current conditions of the vehicle control module
being learned for comparison to the preconditions suggested by the
second part. If the current condition of the control module is out of the
suggested limit value, you must adjust the vehicle condition to meet the
requirement.
4. The last part displays the instruction of how to use the functional button at
the lower right corner of the screen to manipulate the teach-in operations.
Read the information carefully and check the vehicle condition accordingly,
when you are sure that the vehicle is ready to perform the adaptation, simply
follow the instruction provided to make appropriate selections. When the
operation is done, an execution status message such as Completed, Finished
or Successful, displays.
Tap the ESC button to exit the function.
4.7 Service
The Service section is specially designed to provide you with quick access to
the vehicle systems for various scheduled service and maintenance
performances. The typical service operation screen is a series of menu driven
executive commands. By following the on-screen instructions to select
appropriate execution options, enter correct values or data, and perform
necessary actions, the system will guide you through the complete
performance for various service operations.
Figure 4-13 Sample Adaptation Operation Screen
47
Page 55

Diagnostics Operations Service
The most commonly performed service functions include:
Oil Reset Service
TPMS Programming Service
EPB Service
ABS/SRS Services
SAS Calibration Service
DPF Regeneration Service
4.7.1 Function Descriptions
This section describes the main functions for vehicle service:
Oil Reset Service
This function allows you to perform reset for the Engine Oil Life system, which
calculates an optimal oil life change interval depending on the vehicle driving
conditions and climate. The Oil Life Reminder must be reset every time the oil
is changed, so the system can calculate when the next oil change is required.
Tire Pressure Monitor System (TPMS) Service
This function allows you to quickly look up the tire sensor IDs from the
vehicle’s ECU, as well as to perform TPMS programming and reset
procedures after tire sensors are replaced.
Electric Parking Brake (EPB) Service
This function has a multitude of usages to maintain the electronic braking
system safely and effectively. The applications include deactivating and
activating the brake control system, assisting with brake fluid control, opening
and closing brake pads, and setting brakes after disc or pad replacement, etc.
ABS/SRS Services
This function allows you to perform various bi-directional tests to check the
operating conditions of both the Anti-lock Braking System and the
Supplemental Restraint System, such as Automated Bleeding, Pump Motor
Test, and checking Module information, etc.
48
Page 56

Diagnostics Operations Generic OBD II Operations
Steering Angle Sensor (SAS) Service
This service function allows you to perform calibration for the Steering Angle
Sensor, which permanently stores the current steering wheel position as the
straight-ahead position in the steering angle sensor EEPROM. On successful
completion of the calibration, the steering angle sensor fault memory is
automatically cleared.
DPF Regeneration Service
The Diesel Particulate Filter service function performs the regeneration
procedure which is the DPF cleaning operation to clear the blockage through
continuous burning of the particulate matter captured in the DPF filter. If the
DPF light on the vehicle comes on and you successfully complete a DPF
regeneration cycle, you will notice that the DPF light will automatically turn off.
4.8 Generic OBD II Operations
A fast-access option for OBD II/EOBD vehicle diagnosis is available on the
Vehicle Menu screen (Figure 4-1). This option presents a quick way to check
for DTCs, isolate the cause of an illuminated malfunction indicator lamp (MIL),
check monitor status prior to emissions certification testing, verify repairs, and
perform a number of other services that are emissions-related. The OBD
direct access option is also used for testing OBD II/EOBD compliant vehicles
that are not included in the Diagnostics database.
Functions of the diagnostics toolbar buttons at the top of the screen are the
same as those available for specific vehicle diagnostics. See Table 4-2
Diagnostics Toolbar Buttons on page 29 for details.
4.8.1 General Procedure
To access the OBD II/EOBD diagnostics functions
1. Tap the Diagnostics application button from the MaxiSys Job
Menu. The Vehicle Menu displays.
2. Tap the EOBD button. There are two options to establish
communication with the vehicle.
Auto Scan – When this option is selected the diagnostic tool
attempts to establish communication using each protocol in
order to determine which one the vehicle is broadcasting on.
49
Page 57

Diagnostics Operations Generic OBD II Operations
Protocol – When this option is selected the screen opens a
submenu of various protocols. A communication protocol is a
standardized way of data communication between an ECM
and a diagnostic tool. Global OBD may use several different
communication protocols.
3. Select a specific protocol under the Protocol option. Wait for the
OBD II Diagnostic Menu to appear.
Figure 4-14 Sample OBD II Diagnostic Menu
NOTE: Tapping the ○i button displayed beside the function name opens
a bubble with additional function information.
4. Select a function option to continue.
DTC & FFD
I/M Readiness
Live Data
O2 Sensor Monitor
On-Board Monitor
Component Test
Vehicle Information
Vehicle Status
NOTE: Some functions are supported only on certain vehicle makes.
50
Page 58

Diagnostics Operations Generic OBD II Operations
4.8.2 Function Descriptions
This section describes the various functions of each diagnostic option:
DTC & FFD
When this function is selected, the screen displays a list of Stored Codes and
Pending Codes. When the Freeze Frame data of certain DTCs are available
for viewing, a snowflake button will display on the right side of the DTC item.
The Erase Codes function can be applied by tapping the functional button at
the lower bottom of the screen.
Figure 4-15 Sample DTC & FFD Screen
Stored Codes
Stored codes are the current emission related DTCs from the ECM of the
vehicle. OBD II/EOBD Codes have a priority according to their emission
severity, with higher priority codes overwriting lower priority codes. The
priority of the code determines the illumination of the MIL and the codes
erase procedure. Manufacturers rank codes differently, so expect to see
differences between makes.
Pending Codes
These are codes whose setting conditions were met during the last drive
cycle, but need to be met on two or more consecutive drive cycles before
the DTC actually sets. The intended use of this service is to assist the
service technician after a vehicle repair and after clearing diagnostic
information, by reporting test results after a driving cycle.
51
Page 59

Diagnostics Operations Generic OBD II Operations
a) If a test failed during the driving cycle, the DTC associated with that
test is reported. If the pending fault does not occur again within 40 to
80 warm-up cycles, the fault is automatically cleared from memory.
b) Test results reported by this service do not necessarily indicate a
faulty component or system. If test results indicate another failure
after additional driving, then a DTC is set to indicate a faulty
component or system, and the MIL is illuminated.
Freeze Frame
In most cases the stored frame is the last DTC that occurred. Certain
DTCs, which have a greater impact on vehicle emission, have a higher
priority. In these cases, the top prioritized DTC is the one for which the
freeze frame records are retained. Freeze frame data includes a
“snapshot” of critical parameter values at the time the DTC is set.
Erase Codes
This option is used to clear all emission related diagnostic data such as,
DTCs, freeze frame data and manufacturer specific enhanced data from
the vehicle’s ECM, and reset the I/M Readiness Monitor Status for all
vehicle monitors to Not Ready or Not Complete status.
A confirmation screen displays when the clear codes option is selected to
prevent accidental loss of data. Select Yes on the confirmation screen to
continue or No to exit.
I/M Readiness
This function is used to check the readiness of the monitoring system. It is an
excellent function to use prior to having a vehicle inspected for compliance to
a state emissions program. Selecting I/M Readiness opens a submenu with
two choices:
Since DTCs Cleared – displays the status of monitors since the last time
the DTCs are erased.
This Driving Cycle – displays the status of monitors since the beginning
of the current drive cycle.
Live Data
This function displays the real time PID data from ECU. Displayed data
includes analog inputs and outputs, digital inputs and outputs, and system
52
Page 60

Diagnostics Operations Generic OBD II Operations
status information broadcast on the vehicle data stream.
Live data can be displayed in various modes, see 4.6.4 Live Data on page 39
for detailed information.
O2 Sensor Monitor
This option allows retrieval and viewing of O2 sensor monitor test results for
the most recently performed tests from the vehicle’s on-board computer.
The O2 Sensor Monitor test function is not supported by vehicles which
communicate using a controller area network (CAN). For O2 Sensor Monitor
tests results of CAN-equipped vehicles, refer to On-Board Monitor.
On-Board Monitor
This option allows you to view the results of On-Board Monitor tests. The tests
are useful after servicing or after erasing a vehicle’s control module memory.
Component Test
This service enables bi-directional control of the ECM so that the diagnostic
tool is able to transmit control commands to operate the vehicle systems. This
function is useful in determining whether the ECM responds to a command
well.
Vehicle Information
The option displays the vehicle identification number (VIN), the calibration
identification, and the calibration verification number (CVN), and other
information of the test vehicle.
Vehicle Status
This item is used to check the current condition of the vehicle, including
communication protocols of OBD II modules, retrieved codes amount, status
of the Malfunction Indicator Light (MIL), and other additional information.
4.9 Exiting Diagnostics
The Diagnostics application remains open as long as there is an active
communication with the vehicle. You must exit the diagnostics operation
interface to stop all communications with the vehicle before closing the
Diagnostics application.
53
Page 61

Diagnostics Operations Exiting Diagnostics
NOTE: Damage to the vehicle electronic control module (ECM) may occur if
communication is disrupted. Make sure all connections, such as USB cable
and wireless connection, are properly connected at all times during testing.
Exit all tests before disconnecting the test connection or powering down the
tool.
To exit the Diagnostics application
1. From an active diagnostic screen, tap the Back or ESC functional
button to exit a diagnostic session step-by-step; Or
2. Tap the Vehicle Swap button on the diagnostics toolbar to return to
the Vehicle Menu screen.
3. From the Vehicle Menu screen, tap the Home button on the top
toolbar; or tap the Back button on the navigation bar at the bottom of
the screen. Or
4. Tap the Home button on the diagnostics toolbar to exit the
application directly and go back to the MaxiSys Job Menu.
Now, the Diagnostics application is no longer communicating with the vehicle
and it is safe to open other MaxiSys applications, or exit the MaxiSys
Diagnostic System and return to the Android System’s Home screen.
54
Page 62

Chapter 5 TPMS Service Operations
The TPMS application is used to check the TPMS sensor conditions, program the
MX-Sensor, perform the TPMS Relearn procedure and basic TPMS diagnostic
functions.
NOTE: The TPMS service operation is available for MaxiSys MS906TS only.
5.1 Navigation
Tap the TPMS application button from the MaxiSys Job, the Vehicle Menu will
appear. (Figure 5-1) Select the specific vehicle to perform TPMS service.
Figure 5-1 Sample Vehicle Menu Screen
A TPMS icon displays on the Manufacturer button indicating the TPMS service
is available. Detailed description of the buttons, see 4.2.1 Vehicle Menu
Layout on page 23.
After selecting the vehicle brand, the TPMS button on the system Navigation
bar at the bottom of the screen shall display a green tick icon.
5.1.1 TPMS Service Screen Layout
The screens in TPMS service application typically include four sections.
55
Page 63

TPMS Service Operations Navigation
Figure 5-2 Sample TPMS Service Menu Screen
1. Top Toolbar Buttons
2. Navigation Tab
3. Main Section
4. Functional Buttons
Top Toolbar Buttons
The top toolbar contains a number of buttons that allow you to print or save
the displayed data and make other controls. For more information, see Table
4-2 Diagnostics Toolbar Buttons on page 13.
Navigation Tab
The navigation tab at the top of the Main Section screen contains the following
items:
1. Check Tab – displays the triggered sensor data
2. Programming Tab – displays the triggered/retrieved sensor IDs
and new programmed sensor IDs.
3. Relearn Tab – displays the OEM sensor manufacturer and part
number, sensor frequency and relearn procedures.
56
Page 64

TPMS Service Operations Navigation
Main Section
The main section of the screen varies depending on the stage of operations.
The main section can show the TPMS sensor conditions, such as sensor ID,
pressure, temperature and battery status, and the specific relearn procedures.
Functional Buttons
The displayed functional buttons at this section of the screen varies depending
on the stage of operations. They can be used to trigger the TPMS sensor,
create sensor IDs, program MX-Sensor, read and clear codes, return to the
previous screen or exit the function. The functions of these buttons will be
introduced respectively in the following sections.
5.2 Check Operations
The sensor check function allows activating of TPMS sensor to view sensor
data such as sensor ID, tire pressure, tire temperature, sensor battery, sensor
position, and sensor frequency. It also sends the sensor data to vehicle’s ECU
to let the ECU learn the positions of sensors whenever wheels are rotated or
sensors are replaced.
Figure 5-3 Sample Check Function Screen
57
Page 65

TPMS Service Operations Check Operations
Main Section
Column 1 – displays the wheel positions
Column 2 – displays sensor IDs
Column 3 – displays the tire pressure
Column 4 – displays the sensor frequency
Column 5 – displays the tire temperature
Column 6 – displays the sensor battery condition
NOTE: You can choose a unit on the table header according to your
preference.
To check TPMS sensor
1. Tap Check Tab.
2. Tap the desired wheel position on the vehicle thumbnail. Hold the
Display Tablet with its top right corner (with the TPMS service
symbol) close to the tire sidewall near the valve stem, and then
press the Trigger button.
The Display Tablet will send low frequency signal to trigger the
sensor.
NOTE: The Display Tablet will perform TPMS check in a sequence of FL (front
left), FR (front right), RR (rear right), RL (rear left) and SP (spare, if any).
3. The sensor data of the selected wheel will display on the table of
the screen once the sensor is successfully activated and decoded.
4. Tap Back to exit.
NOTE: Wheel with a feedback icon, red or green vertical rectangle, indicates
sensor trigger has been finished. Refer to Table 5-1 for details.
58
Page 66

TPMS Service Operations Check Operations
Icon
Results
Description
(Green)
Successful
Sensor Read
TPMS sensor is successfully activated and
decoded. The table on the right side of the
screen displays the sensor information.
(Red)
Failed Sensor
Read
If the search period expires and no sensor
is activated or decoded, the sensor may be
mounted incorrectly or cannot function. The
table on the right side of the screen displays
“Failed”.
If a sensor with a duplicate ID has been
read, the screen displays a message
“Sensor ID duplicated”.
In this case, repeat the test procedure.
Table 5-1 Possible results for triggering
NOTE: With Ford sensors, the tablet should be held 180 degree away from
the stem. Please refer to the user manual from the vehicle maker.
5.3 Programming Operations
The programming function is used to program the sensor data to the
MX-Sensor and replace the faulty senor (poor battery life or malfunction). The
MaxiSys MS906TS is easy to use with a proven efficiency and guaranteed
accurate results.
There are four options available when programming MX-Sensor using the
Display Tablet: Copy by Activation, Copy by OBD, Auto Create, and Manual
Create.
59
Page 67

TPMS Service Operations Programming Operations
Figure 5-4 Sample Programming Function Screen
Main Section
Column 1 – displays wheel positions
Column 2 – displays the new created sensor IDs
Column 3 – displays the retrieved sensor IDs by activation or by OBD
NOTE: Programming function will only work with Autel’s MX-Sensor.
Currently, there are two models available: Clamp-in Sensor and Snap-in
Sensor, both with two types, one in orange color with 433MHz frequency, and
one in dark gray color with 315MHz frequency. The Clamp-in Sensor is taken
as an example in this manual. Please choose the proper MX-Sensor when
programming.
5.3.1 Copy by Activation
This function allows user to bypass OBD II and automatically write in the
retrieved original sensor data to the MX-Sensor. It is used after the original
sensor is triggered.
60
Page 68

TPMS Service Operations Programming Operations
Figure 5-5 Sample Copy by Activation Function Main Screen
To copy by activation
1. After performing Check function (see 5.2 Check Operations), trigger
marks with sensor IDs will appear on the table in the Programming
screen.
2. Select the corresponding wheel, and then tap Copy by Activation
button.
3. Place the MX-Sensor near the top right of the Display Tablet and tap
OK to start programming the retrieved sensor ID to the MX-Sensor.
61
Page 69

TPMS Service Operations Programming Operations
Figure 5-6 Sample Copy by Activation Function Screen
4. The programed sensor ID will appear on Column 2.
5.3.2 Copy by OBD
This function allows users to write the saved sensor information into
MX-Sensor after performing Read IDs from Vehicle in Relearn function.
Figure 5-7 Sample Copy by OBD Function Main Screen
62
Page 70

TPMS Service Operations Programming Operations
To copy by OBD
1. After performing Read IDs from Vehicle in Relearn function,
OBD marks with the sensor IDs will appear on the table in
Programming screen.
2. Select the specific wheel on the screen, and then tap Copy by
OBD button.
3. Place the proper MX-Sensor near the top right of the Display
Tablet, and tap OK to start programming the saved sensor
information to the MX-Sensor.
4. The programmed sensor ID will appear on Column 2 of the table.
NOTE: If you have performed both Check and Read IDs from Vehicle
functions, you can select either Copy by Activation or Copy by OBD to
program the retrieved sensor ID to the MX-Sensor.
5.3.3 Auto Create
This function is designed to program the MX-Sensor by applying random IDs
created according to the test vehicle, when it is unable to obtain the original
sensor ID.
To Auto Create
1. Tap Programming tab.
2. Select the specific wheel on the screen.
3. Tap the Auto Create functional button on the screen.
4. A message with sensor ID will prompt. Place the proper MX-Sensor near
the top right of the Display Tablet and tap OK to write the new created
sensor ID into the MX-Sensor.
After programming is finished, the new programmed MX-Sensor ID will
display on Column 2 of the table.
NOTE: For some models, it is necessary to perform Relearn procedure after
installing the new MX-Sensor programmed by the way of Auto Create.
63
Page 71

TPMS Service Operations Programming Operations
5.3.4 Manual Create
This function allows you to manually enter sensor IDs. You can enter a random
ID or the original sensor ID.
NOTE: Do not enter the same ID for different sensors.
To manual create
1. Tap the Programming tab.
2. Select the specific wheel on the screen.
3. Tap Manual Create button.
4. Enter the characters in the prompted screen. Tap Done to finish and save
the sensor ID, or No to exit.
NOTE: Sensors from different manufacturers may have different ID character
length limits. The Display Tablet will automatically recognize character length
of the OEM sensor ID, and prevent further input into the textbox when the
limit is reached.
5. Place the proper MX-Sensor near the top right of the Display Tablet and
tap OK to start programming.
NOTE: For some models, if a random ID is entered, please perform Relearn
function after programming is finished; if the original sensor ID is entered,
there is no need to perform Relearn function.
5.4 Relearn Operations
This function allows quick access to the vehicle’s ECU, performing TPMS
diagnostics, reading IDs from vehicle, writing IDs to the vehicle and reading/
clearing codes of tire pressure monitoring system.
64
Page 72

TPMS Service Operations Relearn Operations
Figure 5-8 Sample Relearn Function Main Screen
The OEM sensor information and specification, and relearn procedure
for each vehicle will display on the right side of the screen. Please read
the relearn procedure carefully before performing the relearn function.
To perform TPMS Relearn function
1. Establish the communication with the test vehicle via the MaxiVCI V100.
Power on the Display Tablet.
2. Turn the ignition on but do not start the engine.
3. Tap Relearn tab on the screen and select the specific function to continue.
Details are explained in the following sections.
5.4.1 OBDII Relearn
This function allows writing the sensor IDs to the TPMS ECU without
performing other procedures.
NOTE: Make sure all sensors are checked before performing the OBDII
Relearn function.
65
Page 73

TPMS Service Operations Relearn Operations
To perform OBDII Relearn function
1. Tap OBDII Relearn to write IDs to the vehicle directly without performing
further procedures.
2. A message will appear when the sensor IDs are successfully written.
5.4.2 Read IDs from vehicle
This function will read sensor IDs from the test vehicle directly.
To read IDs from vehicle
1. Tap Read IDs from vehicle in the Relearn screen.
2. The Display Tablet will display the sensor IDs and positions for you to
view. Tap OK to save data for future review, or Back to exit.
5.4.3 Read DTC
To read DTCs
1. Tap Read DTC button from the Relearn screen.
2. A data list of TPMS DTCs retrieved from the vehicle’s ECU will show up.
For more information about read codes, see 4.6.2 Read Codes on page
37.
5.4.4 Clear DTC
To clear DTCs
1. Tap Clear DTC from the Relearn screen.
2. The Display Tablet will show a warning message for you to confirm. Tap
Yes to continue, or No to exit.
3. If the erase command is sent successfully, the confirming screen will
display. Tap ESC on the confirming screen to exit Clear DTC.
4. Run Read DTC again to ensure the operation is successful.
For more information about DTC erasing, see 4.6.3 Erase Codes on page 38.
66
Page 74

Chapter 6 MaxiFix Operations
The MaxiFix application launches the on-line troubleshooter database, which not only
provides you virtually all common diagnostic trouble code (DTC) database for most
vehicles, but also serves as a forum allowing you to network with other MaxiSys users,
and gives you access to a vast database of repair and diagnostic tips along with proven
filed fixes.
While the MaxiFix provides the abundant troubleshooter information available, the
database keeps growing with daily troubleshooting resources by recording the reported
solution cases, and the advisory reports of the MaxiSys users from all over the world.
Information in the MaxiFix database is organized into a series of diagnostic tips that are
designed to quickly lead you to the root cause of a particular problem on the test vehicle,
which will help you quickly find solutions for various diagnostic problems.
6.1 Navigation
You need to register the device to your online account before launching the
MaxiFix platform, see 12.1 Product Registration on page 99 for details.
Figure 6-1 Sample MaxiFix Home Page
67
Page 75

MaxiFix Operations Navigation
The MaxiFix screen layout consists of 3 main areas:
1. The Header –the tool bar across the top of the screen which allows you
to select vehicles and perform searches.
2. The Main Screen –located at the center of the screen displaying content
based on the vehicle attributes and keywords specified. The tabs on the
main screen vary in accordance with the section selected on the
Navigation Menu, allowing you to switch between functions.
3. The Navigation Menu –the main menu at the bottom of the screen,
which provides you access to different sections of MaxiFix.
The Header
The Header at the top of the screen features:
A Select Vehicle button to open the vehicle identification window, and
vehicle information bar, for example “2014>Hyundai> Accord Coupe >
L4-2.4L (K24W1)”.
A search field to find relevant information by entering keywords, codes,
or problems.
Select Vehicle Button
The “Select Vehicle” button on the Header allows you to specify the vehicle
which you want to reference on MaxiFix, by selecting each of the vehicle
attribute from a sequence of option lists. This feature helps to filter out the
searches that allow only the information that applies to the identified vehicle to
display.
Note: All attributes must be specified to make a complete vehicle selection for
the most efficient search results.
To select a vehicle
Follow the procedure below to select a vehicle:
1. If you haven’t already done so, click the “Select Vehicle” button on
the Header.
2. Select the year of the vehicle from the list.
3. Select the make of the vehicle from the list.
4. Select the model of the vehicle from the list.
68
Page 76

MaxiFix Operations Navigation
5. Select the submodel of the vehicle from the list.
6. Select the engine of the vehicle from the list.
After completing the vehicle selection procedure, the identified vehicle is
shown on the Header.
6.1.1 Terminology
MaxiFix Tip
A MaxiFix Tip provides practical information of real fix of a specific vehicle
repair issue with detailed descriptions. It is combined with proven fix and
vehicle specific data, and filed into an all-in-one information source to provide
you with quick and easy repair solutions.
On MaxiFix community you can find Tips or share your own Tip to help other
community members solve vehicle issues.
To search for a MaxiFix Tip
1. Select a Vehicle:
a) Click the “Select Vehicle” button on the Header at the top of
the page.
b) Select the year of the vehicle from the list.
c) Select the make of the vehicle from the list.
d) Select the model of the vehicle from the list.
e) Select the submodel of the vehicle from the list.
f) Select the engine of the vehicle from the list.
After completing the vehicle selection procedure, the identified
vehicle is shown on the Header.
2. Enter a Search Term.
MaxiFix has an exclusive one-stop lookup that helps you find all of
MaxiFix resources by one click. Simply enter a search term into the
search bar on the Header to begin the search.
3. Proven Results!
The powerful MaxiFix database gives you proven results! The
typical MaxiFix Tips combine actual workshop fixes and data which
may include:
69
Page 77

MaxiFix Operations Operations
a) OBDII Fault Codes description and reference—helps in
diagnostic assessment by making clear the nature of an
automotive problem so that beginner and advanced
technicians can make effective repairs
b) Real Fix Tips—provides repair tips from actual shop
practices and are presented in an easy to understand
Complaint, Cause, Correction format.
If you still can’t find the information you want, you can ask the
MaxiFix community for help by clicking “Ask” on the Navigation
Menu at the bottom of the screen.
Adopted!
The “Adopted!” icon that displays at the top right side of a Tip page indicates
that the related Tip has been adopted by at least 1 technician in the community.
If a tip has helped you to solve a repair problem, you are encouraged to give
an Adopted! count to the tip. Each member is allowed to click the “Adopted!”
once for a tip, and each click will add 1 count to the total number of “Adopted!”
The “Adopted!” count helps you easily identify which tips are really helpful for
repairing vehicle issues. You can also post a comment about how the tip has
helped you as reference to other members.
6.2 Operations
The Navigation Menu is at the bottom of the screen. Selecting the items on the
Navigation Menu allows you to switch between the main sections on MaxiFix.
These main sections include:
Home –shows all questions and allows you to specify questions about
one or multiple makes.
Search Fix –allows you to search for information from all available
resources on MaxiFix, including: Open Questions, Tips, and Real Fixes,
and displays search results.
Ask –allows you to ask a question in the community.
My MaxiFix –shows all your posts including Questions and Fixes in the
community, and allows you to view your personal profile, select your
vehicle preference, and share your tips.
My Messages – shows a list of message notifications which is relevant
70
Page 78

MaxiFix Operations Operations
to your activities in the Question section.
Support – opens the FAQ page, or a message box for contacting
Customer Service by email.
6.2.1 Home
Home is the first option on the Navigation Menu at the bottom of the screen.
Tapping it opens your MaxiFix home page. There is a list of questions posted
on the community, and you can scroll down the page to the bottom and view
more questions by tapping “View More”. Click on any question and you will be
linked to the detailed page in the Ask section.
You can configure your main screen to display questions only related to the
vehicle makes you are interested in, by clicking the “Filter” button on the main
page of Home, and select the desired vehicle makes. This filter can be
canceled anytime by clicking the “Remove All Filters” button, and the default
setting will be restored to display questions about all vehicle makes.
6.2.2 Search Fix Features
Search Fix, the second option on the Navigation Menu at the bottom of the
screen, presents search results for the specified vehicle. Search results are
listed in various categories:
All – includes all search results, including related Questions, Tips, and
Questions – presents a list of open Question discussed in the
Tips – presents a list of Tips that directly correlate to your search criteria.
Real Fixes –presents a list of Tips that have been collected from actual
6.2.3 Ask
Ask, the third option on the Navigation Menu at the bottom of the screen,
allows you to ask a question about a particular vehicle repair issue in the
community.
Real Fixes to your search.
community that may be pertinent to your search.
Select a Tip from the list to open and review the complete Tip.
shop repair orders and are presented in an easy-to-understand
Complaint, Cause, and Correction format.
71
Page 79

MaxiFix Operations Operations
To ask a MaxiFix Question
1. If not already done, click Select Vehicle on the Header to specify
the vehicle you are asking about.
2. Click Ask on the Navigation Menu at the bottom of the screen to
open the Ask page.
3. On the Ask page find Ask for Help, fill in the following sections to
ask a question.
The Ask page has 4 sections:
Subject – this is where you enter a brief subject for the
question.
My Question – ask a clear and concise question that you want
to ask the community. Be sure to be descriptive and concise
when asking your question.
Problem Description –describe how the vehicle is behaving.
Repair History – include any previous diagnostic tests that you
performed, including the results of the tests. Also list any parts
that were replaced during previous diagnostic work.
Tap the “Cancel” button to cancel your question and return to the Ask
page.
Tap the “Submit” button to post your question to the community.
Tap the “Attach File” button to include images or reference files with
your question.
You are requested to select one Adopted Answer from all of the
responses and then close the question. For details, please refer to
My Messages section.
6.2.4 My MaxiFix
My MaxiFix, the fourth option on the Navigation Menu at the bottom of the
screen, opens your personal MaxiFix page. To access the features on My
MaxiFix page you can select from the tabs:
My Questions – opens a list with links to the opened questions that you
have posted to the community
My Cases – opens a list with links to the closed questions and tips that
you have contributed to the community.
72
Page 80

MaxiFix Operations Operations
Marked Posts – opens a list with links to Tips and discussions that you
are actively participating in.
My Profile –allows you to view your Autel account information including:
your Autel ID, personal information, MaxiFix score, phone number and
register time, and edit your portrait.
Vehicle Preference –used to set up a list of preferred vehicles. The
preferred list allows you to limit the choices that displayed on the “Select
Vehicle” list to specific years, and makes. Click “Set Year” or “Set Make”
to set your preferred models. The preferred makes will also be displayed
in the “Filter” options on the Home page.
Share a Tip – allows you to share your personal repair experience with
the community.
Click My MaxiFix on the Navigation Menu at the bottom of the screen, to
display all questions and tips that you have contributed to the community.
Create a Tip
A “Tip” is a concise and complete description of the fix for a particular vehicle
repair issue.
To create a new MaxiFix Tip
1. Select My MaxiFix from the Navigation Menu.
2. Select Select Vehicle from the Header and enter the identifying
attributes of the vehicle you are writing the Tip about.
3. On the My MaxiFix page find Share a Tip; click this link to open the
My Tips page.
4. Enter the Tip subject in the Subject field.
5. Compose your Tip in the Description field. Include as much
information as possible, while keeping the information concise and
to the point. A Tip should provide accurate information that is
reader-friendly.
Use the Cancel button at the right-side bottom of the page to cancel your
tip and return to the My MaxiFix page. Or,
Use the Submit button at the right-side bottom of the page to contribute
your tip to the community.
Use the Attach File button at the left-side bottom of the page to include
images or other supporting data with your question.
73
Page 81

MaxiFix Operations Operations
View Profile Information
You can view your personal profile by clicking on your account ID or “My
Profile” in My MaxiFix section or edit portrait where applicable, and visit other
community members’ profile by clicking their portrait. Information included in
your profile determines how you are presented to the community, and what
type of information will be sent to you from the community.
6.2.5 My Messages
My Messages, the fifth option on the Navigation Menu at the bottom of the
screen, shows a list of message notification which is relevant to your activities
in the Question section. A notification icon will appear on the top-right corner of
“My Messages” if there is any new or unread message in the Question section.
The number on the notification icon indicates the total number of the new and
unread messages. The displayed number will be reduced correspondingly
after viewing. The message notification will appear under the following two
conditions:
1. Your question or answer is replied by other MaxiFix community members.
2. Your answer is marked as the “Adopted!” by the MaxiFix community
member who asked the question.
Tap My Messages, select and open the message you want to read from the list.
If your problem is solved according to the reply, you should select one
Adopted Answer and close the question. If your answer is marked as
“Adopted!”, the prompt “Adopted! + 4” will be displayed permanently.
Tap Clear to delete all message notifications.
Select “Adopted Answers”
Members are requested to select one Adopted Answer from all of the
responses on “My Messages” page before closing a question. The community
members who provided the Adopted Answer are rewarded with scores for
their contribution.
About Adopted Answer:
Only one answer can be selected as “Adopted Answer”.
Answers can only be rated by the MaxiFix member who asked the
question.
74
Page 82

MaxiFix Operations Operations
Close a Question
When a repair question that you've posted to the community is resolved, you
are encouraged to write down the case as a way to share a good solution. This
will help the other MaxiFix members to find useful information for practical fix.
To close a question, you need to select the question’s response message from
the message list on “My Messages” page first, then tap “Adopted Answer” and
select “Close Question”. Tap the “Cancel” button to cancel your submission
and return to My Messages page. It is strongly recommended to share your
repair solutions before closing a question. Your question will be converted to a
MaxiFix Community Tip after closing.
Score Rewarding System
1. A score of 3 is awarded when you close a question.
2. A score of 2 is awarded if your closed question is marked as "Adopted!" by no
less than 20 community members.
3. A score of 4 is awarded if your answer is selected as the “Adopted Answer”.
4. A score of 1 is awarded if your answer is selected as the "Adopted Answer" for
a closed question which is marked as "Adopted!" by no less than 20
community members.
5. A score of 1 is awarded to each of the first three respondents.
6.2.6 Support
Support, the last option on the Navigation Menu at the bottom of the screen,
opens a page that provides 2 ways to gain support from MaxiFix:
1. A message form to contact the administrator of MaxiFix.
2. A Frequently Asked Questions (FAQ) link that answers the most frequent
questions we hear from MaxiFix community members.
If you wish to contact the administrator of this site please use the contact form.
Select “Support” from the Navigation Menu to open the comment window. To
allow the administrator to respond to your question or issue, the following
information should be provided:
Your name
A contact email address
A contact phone number
75
Page 83

Button
Name
Description
Back
Returns to the previous screen.
Diagnostics
Touching this button directs you to the vehicle’s
Diagnostics screen to activate a direct test
session.
Enter Edit
Touching this button shows the editing toolbar to
print or delete the selected file.
Delete
Touching this button deletes the selected vehicle
record item from the list.
Search
Quickly locates the vehicle record by entering the
vehicle name or test path.
Cancel
Touching this button to cancel edit or file search.
Edit
Touching this button allows you to edit information
for the displayed file.
Add
Account
Touching this button to create a new customer
account file.
Chapter 7 Shop Manager Operations
The Shop Manager application helps you to manage the workshop information,
customer information records, and keep test vehicle history records, which can be a
great assist in dealing with daily workshop business and improves customer service.
There are three main functions available:
Vehicle History
Workshop Information
Customer Manager
The operations of these functions of the Shop Manager application are mainly
manipulated by the toolbar buttons, which are listed and described in the table below:
Table 7-1 Top Toolbar Buttons in Shop Manager
76
Page 84

Shop Manager Operations Vehicle History
Button
Name
Description
History
Notes
Touching this button opens a note form, which
allows you to create audio record, attach picture or
video, or edit text notes, etc.
Vehicle
History
Touching this button opens the Vehicle History
screen which displays the correlated test vehicle
records.
Done
Complete editing and save the file.
7.1 Vehicle History
This function stores records of test vehicle history, including vehicle
information and the retrieved DTCs from previous diagnostic sessions, and
displays all information in an easy-to-check table list, on which you can view
summarized details and manually input other information about the test
vehicle and diagnostic loggings, etc. The Vehicle History also provides direct
access to the previously tested vehicle and allows you to restart a diagnostic
session without the need to do vehicle identification again.
Figure 7-1 Sample Vehicle History Screen
1. Top Toolbar Buttons – navigates and makes various controls of the
application.
2. Main Section – displays all the vehicle history records information.
77
Page 85

Shop Manager Operations Vehicle History
To activate a test session for the recorded vehicle
1. Tap the Shop Manager application on the MaxiSys Job Menu.
2. Select Vehicle History
3. Tap the Diagnostics button at the bottom of the thumbnail of a
vehicle record item. Or,
4. Select a vehicle record item by tapping the thumbnail.
5. A Historical Test record sheet displays, check the recorded
information of the recorded test vehicle, and tap the Diagnostics
button on the upper right corner.
6. The vehicle’s Diagnostics screen displays, now a new diagnostic
session is activated, see 4.6 Diagnosis on page 32 for detailed
instructions on vehicle diagnostic operations.
7.1.1 Historical Test Record
The Historical Test record sheet of the tested vehicle is a detailed data form,
which includes all general information of the vehicle such as vehicle year,
make and model, etc., and the diagnostic trouble codes retrieved from the
previous test sessions, as well as other service details which can be added
manually by the technician himself.
Figure 7-2 Sample Historical Test Record Sheet
78
Page 86

Shop Manager Operations Workshop Information
To edit the Historical Test record sheet
1. Tap the Shop Manager application on the MaxiSys Job Menu.
2. Select Vehicle History.
3. Select the specific vehicle history record thumbnail from the main
section. The Historical Test record sheet displays.
4. Tap the Edit button to start editing.
5. Tap on each item to input the corresponding information or add
attaching files or images.
NOTE: The vehicle VIN number, or license and the customer information
account are correlated by default. Adding one of the information will
automatically associate the other item in the record sheet, provided that
the later one exists.
6. Tap Add to Customer to correlate the Historical Test record sheet to
an existing customer account, or add a new associating account to
be correlated with the test vehicle record. See 7.3 Customer
Manager on page 80 for more information.
7. Tap Done to save the updated record sheet, or tap Cancel to exit
without saving.
7.2 Workshop Information
The Workshop Information form allows you to edit, input and save the detailed
workshop information, such as shop name, address, phone number and other
remarks, which, when printing vehicle diagnostic reports and other associated
test file, will appear as the header of the printed documents.
79
Page 87

Shop Manager Operations Customer Manager
Figure 7-3 Sample Workshop Information Sheet
To edit the Workshop Information sheet
1. Tap the Shop Manager application on the MaxiSys Job Menu.
2. Select Workshop Information.
3. Tap the Edit button on the top toolbar.
4. Tap on each field to input the appropriate information.
5. Tap Done to save the updated workshop information sheet, or tap
Cancel to exit without saving.
7.3 Customer Manager
The Customer Manager function allows you to create and edit customer
accounts. It helps you to save and organize all customer information accounts
that are correlated with the associated test vehicle history records, which is a
great support for the arrangement of daily workshop business.
To create a customer account
1. Tap the Shop Manager application on the MaxiSys Job Menu.
2. Select Customer Manager.
3. Tap the Add Account button. An empty information form displays,
tap each field to input the appropriate information.
NOTE: The items that must be filled are indicated as required fields.
80
Page 88

Shop Manager Operations Customer Manager
4. Tap the □+ photo frame beside the Name chart to add a photo. A
sub menu displays, select Take Photo to take a new photo for the
account, or select Choose Photo to choose from the existing files.
5. Some customers may have more than one vehicle for service; you
can always add new vehicle information to the account to be
correlated. Tap Add New Vehicle Information, and then fill in the
vehicle information. Tap the ○x button to cancel adding.
6. Tap Done to save the account, or tap Cancel to exit without saving.
To edit a customer account
1. Tap the Shop Manager application on the MaxiSys Job Menu.
2. Select Customer Manager.
3. Select a customer account by tapping the corresponding name card.
A Customer Information sheet displays.
4. Tap the Edit button on the top toolbar to start editing.
5. Tap on the input field where needs to be altered or supplemented,
and enter updated information.
6. Tap Done to save the updated information, or tap Cancel to exit
without saving.
To delete a customer account
1. Tap the Shop Manager application on the MaxiSys Job Menu.
2. Select Customer Manager.
3. Select a customer account by tapping the corresponding name card.
A Customer Information sheet displays.
4. Tap the Edit button on the top toolbar to start editing.
5. Tap the Delete Customer Information button. A confirmation
message displays.
6. Tap OK to confirm the command, and the account is deleted. Tap
Cancel to cancel the request.
81
Page 89

Shop Manager Operations Customer Manager
7.3.1 History Notes
The History Notes function allows you to add audio and video records, text
notes and photos, to keep multi-media work logs for the associated customer
account, which can be very helpful when dealing with repeat customers.
Keeping notes for each vehicle serviced for each customer will keep you
always on track and well organized in business.
To access History Notes
1. Tap the Shop Manager application on the MaxiSys Job Menu.
2. Select Customer Manager or Vehicle History.
3. Select a customer account by tapping the corresponding name card.
A Customer Information sheet displays (if Customer Manager is
selected). Or, select a vehicle history record item to open the
Historical Test record sheet (if Vehicle History is selected).
4. Tap the History Notes button on the top bar. Now the History Notes
screen displays.
Figure 7-4 Sample History Notes Screen
1. Functional Buttons – navigates and make various controls of the
function
2. Main Section – displays the note list on the left column and the detail
information of the selected note on the right column
82
Page 90

Shop Manager Operations Customer Manager
Button
Name
Description
Back
Returns to the previous screen.
Delete
Touching this button deletes the selected
note.
Search
Quickly locates the required note by
entering the note title.
Cancel
Touching this button to cancel edit or file
search.
Edit
Touching this button opens an edit
window allowing you to edit notes and
Add Notes
Touching this button to add new note in
History Notes.
Audio Record
Performs audio recording and creates
audio files.
Add Photos
Opens the image file for selection, and
adds the selected photos to History
Notes.
Take a Video
Records a video and adds the file to
History Notes.
Take a Photo
Takes photos and adds the files to History
Notes.
Save
Saves notes.
Table 7-2 Function Buttons in History Notes
To add a note in History Notes
1. Access History Notes.
2. Tap the Add Notes button. An edit window displays.
3. Tap on the Title bar to input a note title.
4. Tap on the blank space below to edit a text note or remark.
5. Select a function button on the top to add files in any form you
choose.
6. Tap Save to save the note; tap Discard or Cancel to exit without
saving.
83
Page 91

Chapter 8 Data Manager Operations
The Data Manager application is used to store, print, and review the saved files. Most
operations are controlled through the toolbar.
Selecting the Data Manager application opens the file system menu. Different file types
are sorted separately under different options, there are six types of information files to
be viewed or played back.
Figure 8-1 Sample Data Manager Main Screen
8.1 Operations
Data Manager Operations are based on toolbar controls. Details are explained
in the following sections.
8.1.1 Image Files
The Image section is a JPG database containing all captured screenshot
images.
84
Page 92

Data Manager Operations Operations
Button
Name
Description
Back
Returns to the previous screen.
Enter Edit
Tapping this button shows the editing toolbar
to print, delete or view image information.
Cancel
Tapping this button close the editing toolbar or
cancels file search.
Search
Quickly locates the image file by entering the
vehicle name, test path, file name or file info.
Info
Tapping this button opens a window displaying
the details of the image.
Print
Tapping this button prints the selected image.
Delete
Tapping this button deletes the selected
image.
Figure 8-2 Sample Image Database Screen
1. Toolbar Buttons – used to edit, print and delete the image files. See
Table 8-1 Toolbar Buttons in JPG Database on page 85 for detailed
information.
2. Main Section – displays the stored images.
Table 8-1 Toolbar Buttons in JPG Database
85
Page 93

Data Manager Operations Operations
To edit image information
1. Select Data Manager application from the MaxiSys Job Menu.
2. Select Image to access the JPG database.
3. Select an image to display it in full screen.
4. Tapping the screen once displays the editing toolbar.
5. Tap the Info button to open a window displaying the image
information.
6. Tap the Edit button on the top right corner of the window. The editing
screen displays.
7. Edit the image information by entering the new file name, and file
information.
8. Tap Done to save the information and exit, or tap Cancel to exit
without saving.
To delete selected images
1. Select Data Manager application from the MaxiSys Job Menu.
2. Select Image to access the JPG database.
3. Tap the Enter Edit button to display the editing toolbar.
4. Select the images that need to be deleted by tapping the thumbnail
images, the selected thumbnail displays a tick icon at the bottom
right corner.
5. Tap the Delete button, and then Delete Selected, then the selected
images will be deleted.
8.1.2 PDF Files
The PDF section stores and displays all PDF files of saved data. After entering
the PDF database, select a PDF file to view the stored information.
This section uses the standard Adobe Reader application for file viewing and
editing, please refer to the associated Adobe Reader manual for more detailed
instructions.
86
Page 94

Data Manager Operations Operations
8.1.3 Review Data
The Review Data section allows you to playback the recorded data frames of
live data streams.
On the Review Data main screen, select a record file to playback.
Figure 8-3 Sample Data Playback Screen
1. Drop-down Toolbar – tap the button at the top center of the screen to
open the Drop-down Toolbar
2. Main Section – displays the recorded data frames
3. Navigation Toolbar – allows you to manipulate data playback
Use the Navigation Toolbar buttons to playback the record data from frame to
frame.
Tap Back to exit data playback.
8.1.4 Apps Manager
This section allows you to manage the firmware applications installed on the
MaxiSys Diagnostics System. Selecting this section opens a managing screen,
on which you can check all the available vehicle diagnostic applications.
Select the vehicle firmware you want to delete by tapping on the car brand
icon, the selected item will display a blue tick at the upper right corner. Tap the
Delete button on the top bar to delete the firmware from the system database.
87
Page 95

Data Manager Operations Operations
8.1.5 Data Logging
The Data Logging section allows you to launch Support platform directly to view all
records of all sent or unsent (saved) data loggings on the diagnostic system. For
more details, please refer to12.5 Data Logging 12.5on Page 104.
88
Page 96

Chapter 9 Settings Operations
Selecting Settings application opens a setup interface, on which you can adjust default
setting and view information about the MaxiSys system. There are seven options
available for the MaxiSys system settings:
Unit
Language
Printing Setting
Notification Center
About
System Settings
9.1 Operations
This section describes the operation procedures for the settings.
9.1.1 Unit
This option allows you to adjust the measurement unit for the diagnostic
system.
To adjust the unit setting
1. Tap the Settings application on the MaxiSys Job Menu.
2. Tap the Unit option on the left column.
3. Select the required measurement unit, Metric or English. A tick icon
will display to the right of the selected unit.
4. Tap the Home button on the top left corner to return to the MaxiSys
Job Menu. Or select another setting option for the system setup.
9.1.2 Language
This option allows you to adjust the display language for the MaxiSys system.
89
Page 97

Settings Operations Operations
To adjust the language setting
1. Tap the Settings application on the MaxiSys Job Menu.
2. Tap the Language option on the left column.
3. Select the required language. A tick icon will display to the right of
the selected language.
4. Tap the Home button on the top left corner to return to the MaxiSys
Job Menu. Or select another setting option for the system setup.
9.1.3 Printing Setting
This option allows you to print any data or information anywhere and anytime
via Wi-Fi connection. For more information about printing, see 3.3.1 Printing
Operation on page 17.
To setup the printer connection
1. Tap the Settings application on the MaxiSys Job Menu.
2. Tap the Printing Setting option on the left column.
3. Tap the Print via Network item to activate the printing function,
which enables the device to send files to the printer through the PC
via Wi-Fi connection.
4. Tap the Home button on the top left corner to return to the MaxiSys
Job Menu. Or select another setting option for the system setup.
9.1.4 Notification Center
This option allows you to turn the Notification Center function on or off. The
Notification Center function configures the MaxiSys tablet to receive regular
on-line messages from the server for system update notifications or other
service information via the Internet. It is highly recommended to keep this
function on all the time, so you won’t miss out any new update for MaxiSys or
event from Autel. Internet access is required for receiving on-line messages.
To enable the Notification Center function
1. Tap the Settings application on the MaxiSys Job Menu.
90
Page 98

Settings Operations Operations
2. Tap the Notification Center option on the left column.
3. Tap the ON/OFF button to enable or disable the Notifications
function. If the function is enabled the button turns blue, or if
disabled the button turns gray.
4. Tap the Home button on the top left corner to return to the MaxiSys
Job Menu. Or select another setting option for the system setup.
When the Notification Center function is turned on, and new messages are
received by the MaxiSys device, a notification message displays on the
MaxiSys Job Menu. Press on the message bar and drag it down, and the
received messages are shown in the list, slide the list up or down to view all if
the message list covers more than one screen.
Tapping a specific message launches the corresponding application. For
example, if you tap on an Update notification message, the Update application
will be launched.
9.1.5 About
The About option provides information of the MaxiSys diagnostic device
regarding the product name, version, hardware, and serial number, etc.
To check the MaxiSys product information in About
1. Tap the Settings application on the MaxiSys Job Menu.
2. Tap the About option on the left column. The product information
screen displays on the right.
3. Tap the Home button on the top left corner to return to the MaxiSys
Job Menu, or select another setting option for the system setup,
after viewing.
9.1.6 System Settings
This option provides you a direct access to the Android background system
setting interface, on which you can adjust various system settings for the
Android system platform, regarding wireless and networks settings, various
device settings such as sound and display, as well as system security settings,
and check the associated information about the Android system, etc.
To enable the App Switcher function
1. Tap the Settings application on the MaxiSys Job Menu.
2. Tap the System settings option on the left column.
91
Page 99

Settings Operations Operations
3. Tap the App Switcher option on the left column.
4. Mark the checkbox beside “Always show the App Switcher” on the
right side of the screen, then the App Switcher icon shows.
Short pressing the App Switcher icon opens a control panel:
Tapping a specific app shortcut button enables you to switch directly to
the selected application screen.
Long pressing a specific app shortcut button displays the app menu, on
which you can select and change the app shortcut.
Pressing and dragging the App Switcher icon around allows you to
change the icon position alongside the edge of the screen.
You may refer to Android documentation for additional information about
Android system settings.
92
Page 100

Chapter 10 Update Operations
The Update application allows you to download the latest released software. The
updates can improve the MaxiSys applications’ capabilities, typically by adding new
tests, new models, or enhanced applications to the database.
The Display Tablet automatically searches for available updates for all of the MaxiSys
software when it is connected to the internet. Any updates that are found can be
downloaded and installed on the device. This section describes installing an update to
the MaxiSys System. A notification message displays if an update is available when the
Notifications Center function is enabled in the Settings application (See 9.1.4
Notification Center page 90 for details).
Figure 10-1 Sample Update Screen – for MaxiSys MS906TS
93
 Loading...