

Figure 8-48 Sample DLC Connection Diagram
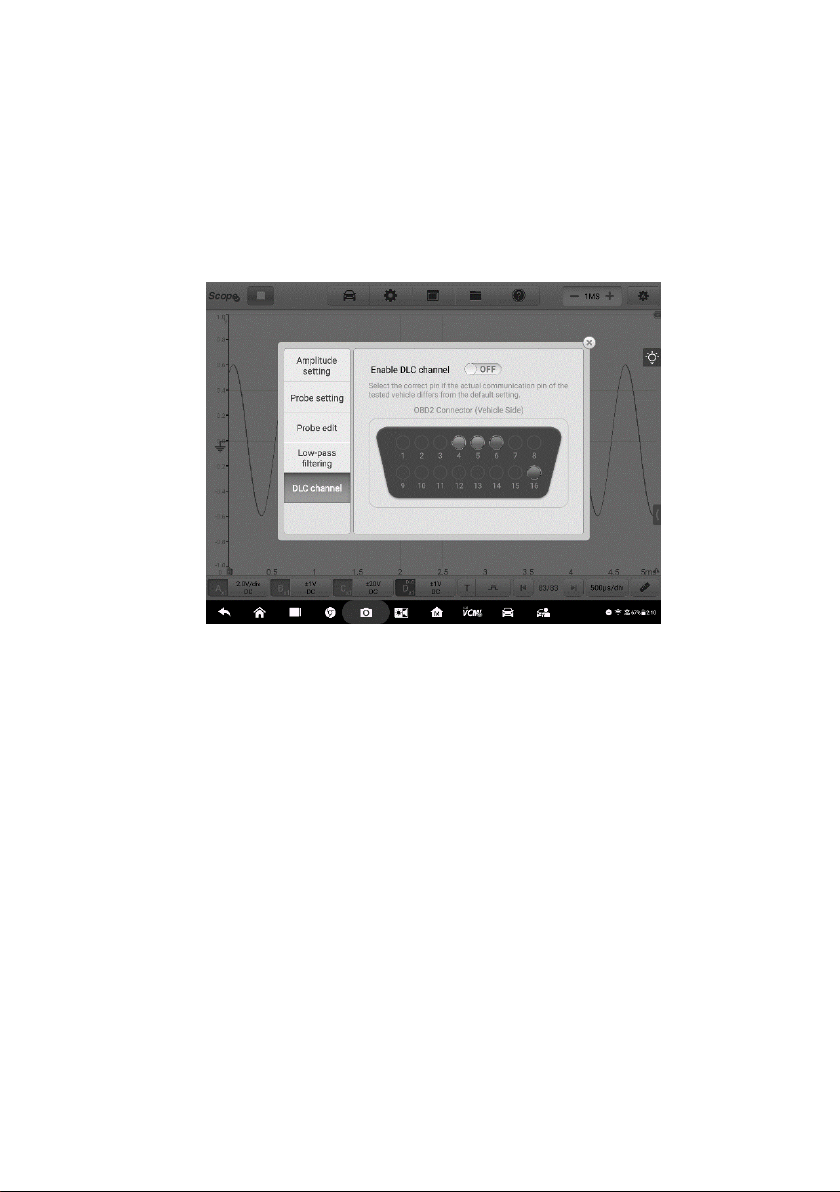
To open and set the DLC channel
1. Tap the right column of the channel D button at the bottom of the screen to
open the setting dialog box.
2. Select the DLC Channel in the left column of the dialog box.
3. Swipe the Enable DLC channel to ON. Select the appropriate pins.
Figure 8-49 Sample DLC Channel Setting Screen 1
4. Close the dialog box, the selected result is displayed on the screen. Tap the
amplitude setting button on the bottom of the screen to adjust the value for
the DLC channel.
135

Figure 8-50 Sample DLC Channel Setting Screen 2
Figure 8-51 Sample DLC Channel Setting Screen 3
5. Tap the DLC icon in the lower left corner of the screen to close the DLC
channel.
136
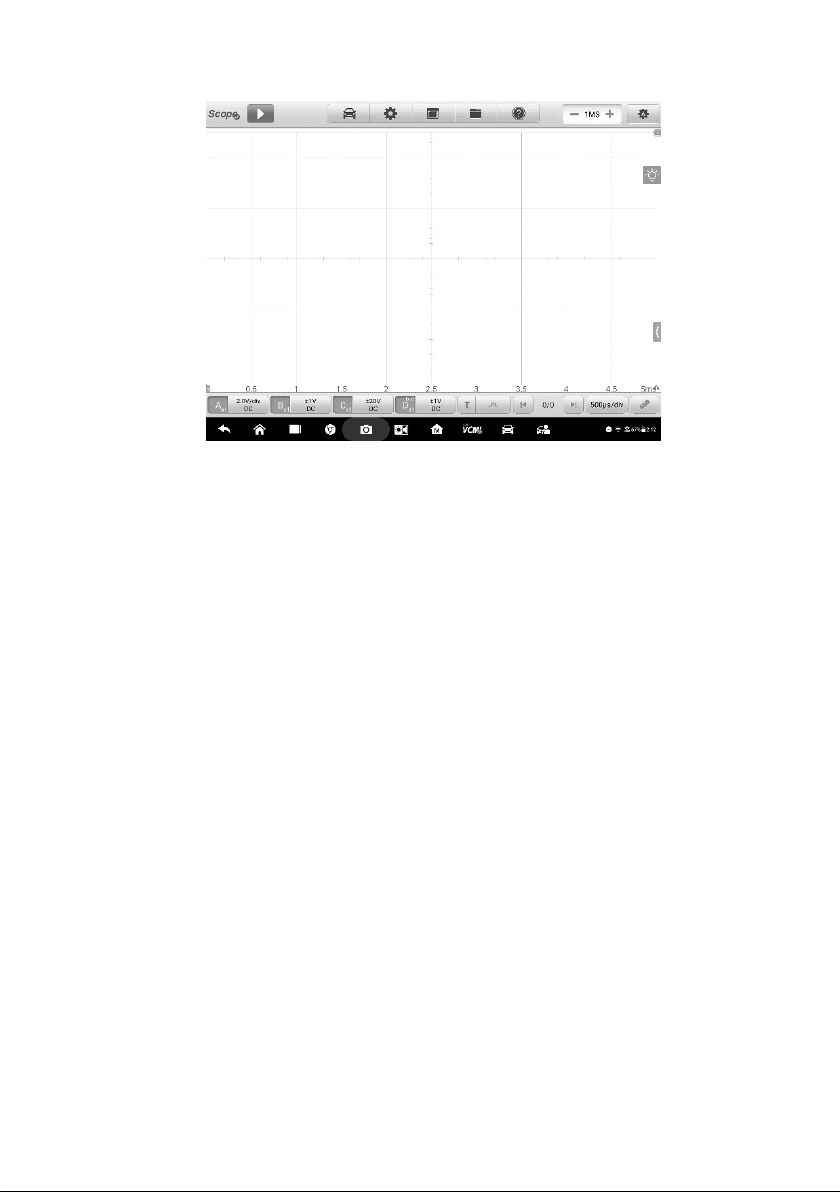
Figure 8-52 Sample DLC Channel Setting Screen
Trigger
The trigger feature is used to stabilize repetitive waveforms to obtain a clear signal
characterization.
A trigger is activated when a signal crosses set thresholds. Trigger points can also
be set manually as the user views a waveform.
When the oscilloscope is capturing the signal, tap the left column of the Trigger
button to activate the trigger function. A trigger point displays as a blue point.
137
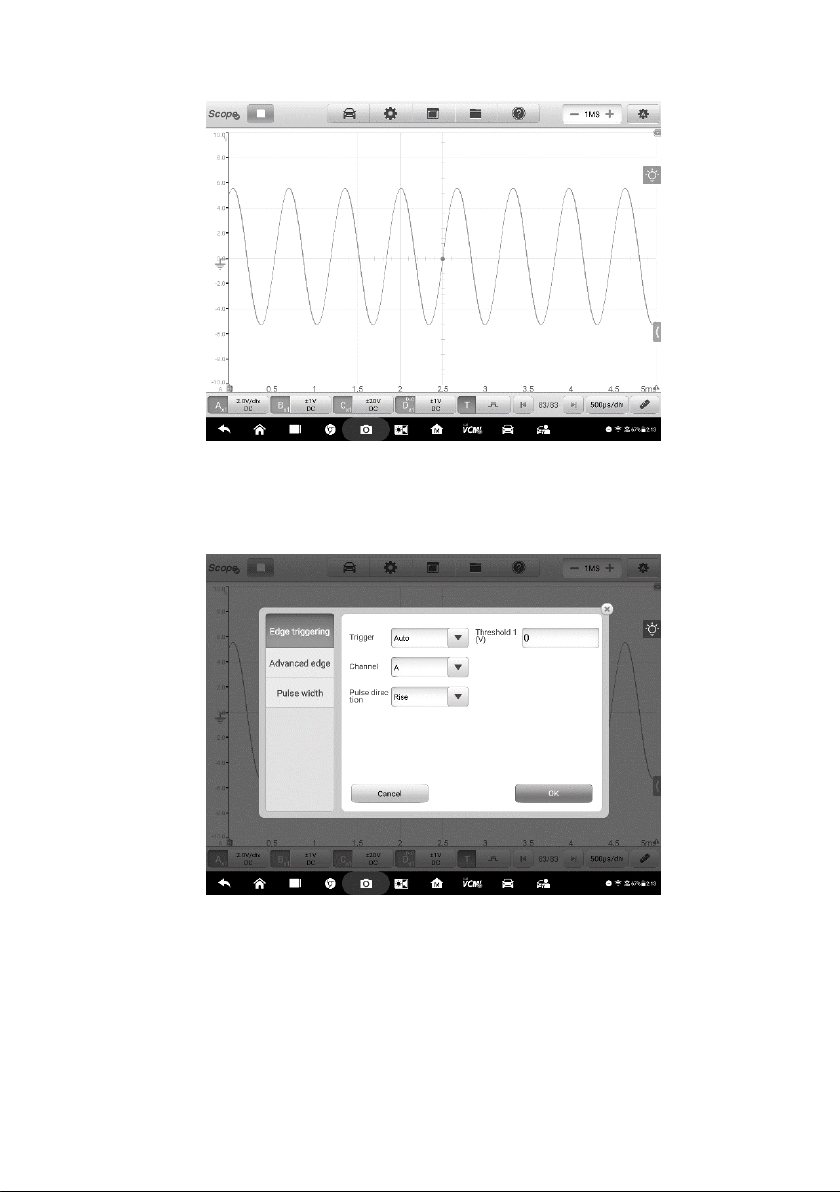
Figure 8-53 Sample Trigger Point Screen
When the oscilloscope is capturing the signal, tap the right column of the Trigger
button to open the trigger settings dialog box.
Figure 8-54 Sample Trigger Settings Screen
Edge Triggering
The edge trigger is one of the most common trigger modes and is activated when
voltage rises above or falls below a preset threshold. This trigger type allows you to
138
Trigger Mode
Description
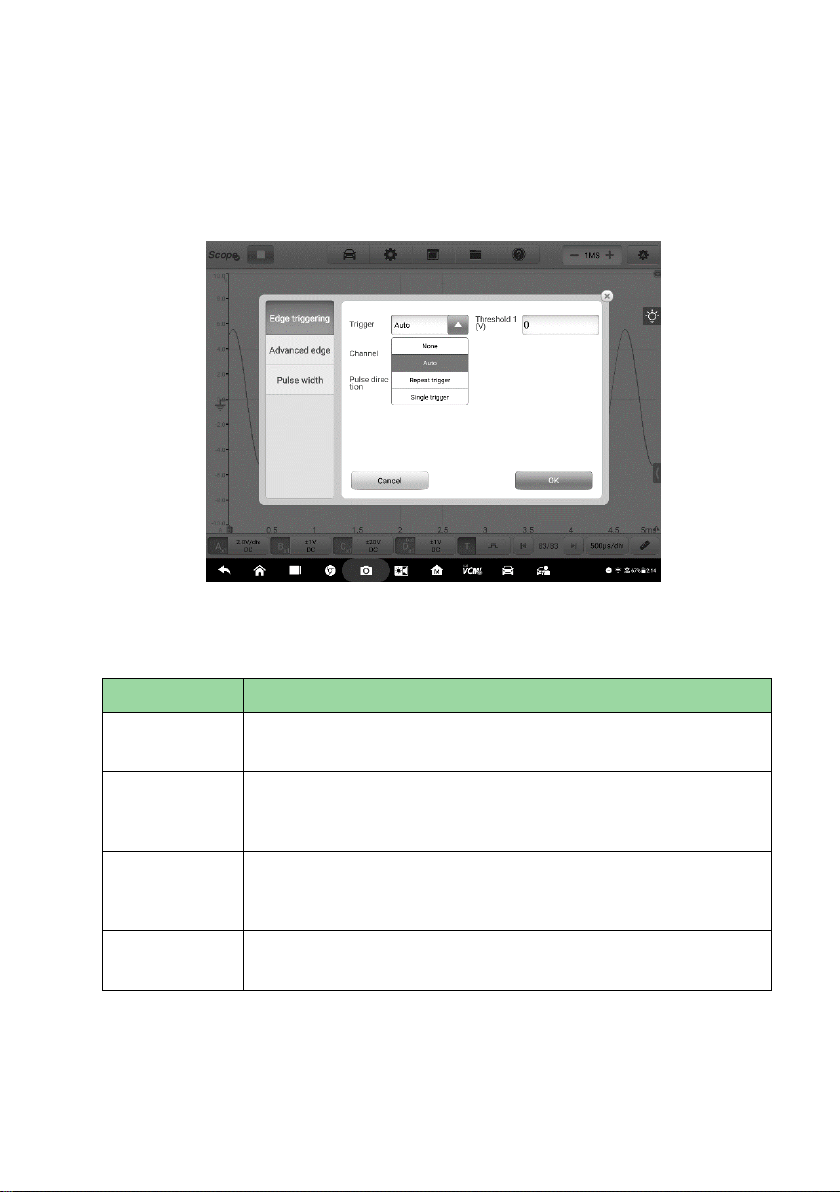
None
In this trigger mode, the oscilloscope can continuously capture
data, without waiting for a trigger event.
Auto
In this trigger mode, the oscilloscope will wait for a trigger
before capturing data. It can automatically update after a short
period, even if the signal does not across the trigger point.
Repeat
In this trigger mode, the oscilloscope waits until a trigger event
occurs. If there is no trigger event, nothing will be displayed on
the screen.
Single
In this trigger mode, the oscilloscope stops capturing data once
a trigger event occurs.
configure the trigger mode, threshold, trigger channel and pulse direction settings.
Tap Done to save the settings or tap Cancel to exit without saving.
Trigger Mode
Four trigger modes are available: None, Auto, Repeat and Single.
Figure 8-55 Sample Trigger Mode Screen
The table below offers brief descriptions for each trigger mode.
Table 8-4 Trigger Mode Table
Channel
139
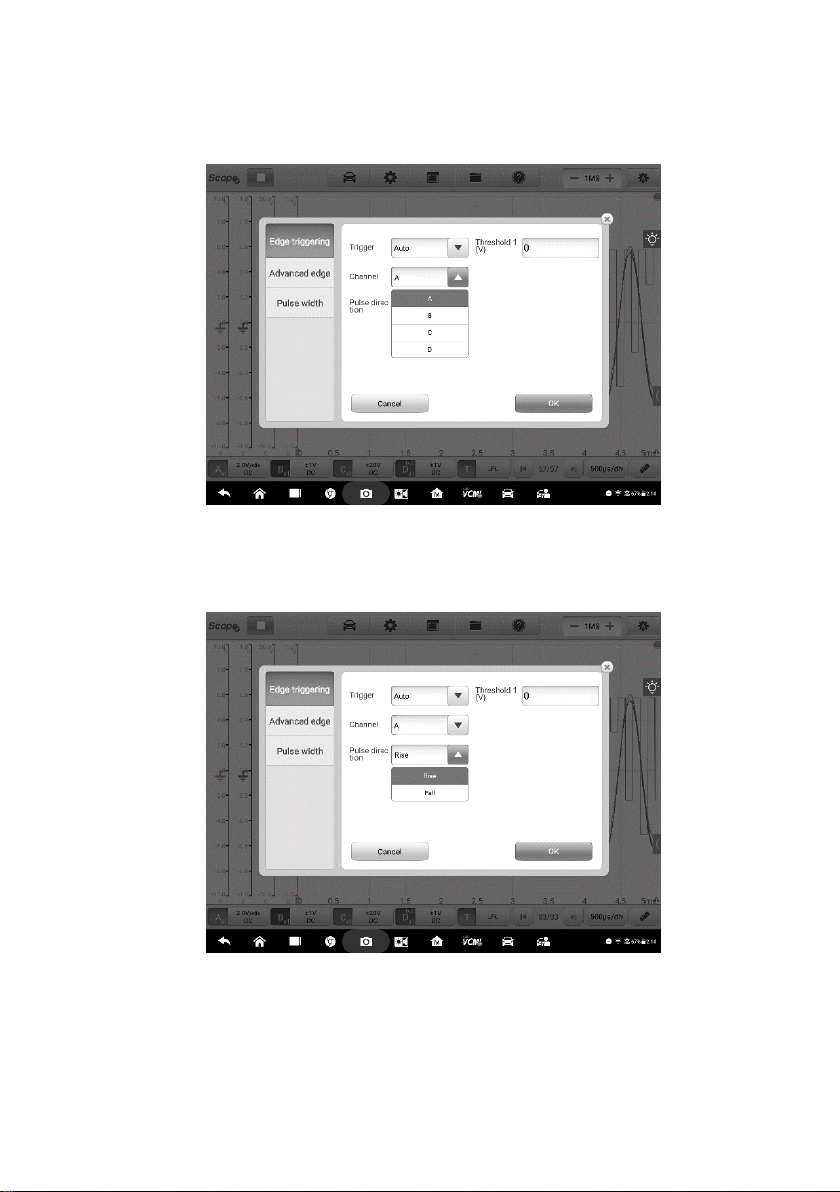
Select the applicable trigger channel from the dropdown menu. The selected
channel is the one that the oscilloscope monitors for the trigger condition.
Figure 8-56 Sample Trigger Channel Screen
Pulse Direction
Two pulse direction settings are available: Rise and Fall.
Figure 8-57 Sample Pulse Direction Screen
Rising Edge Trigger - Indicates trigger is turned on to start the trace on the rising
edge of the waveform.
140

Falling Edge Trigger – Indicates trigger is turned on to start the trace on the
falling edge of the waveform
Threshold
The Threshold allows you to set the voltage threshold for the trigger.
To precisely position the trigger point, input the value in the Threshold field in the
trigger settings dialog box.
To roughly position the trigger point, drag the trigger point to a desired position.
To configure the trigger settings
1. Tap the right column of the Trigger button to open the trigger settings dialog
box.
2. Select the trigger mode, trigger channel and pulse direction in the dropdown
list.
3. Input the value in the Threshold field in the trigger settings dialog box.
4. Tap Done to save settings or tap Cancel to exit without saving.
Advanced Edge
This trigger type includes all the functions of the edge trigger type, plus two
additional options: the Rising or Falling option and the hysteresis option.
Rising or Falling option in the dropdown menu of the pulse direction: Dual edges
of a waveform can be triggered. This mode is especially useful for monitoring pulses
of both polarities at once.
Hysteresis option: It is used to reduce false triggering on noisy signals. When
hysteresis is enabled, a second trigger threshold voltage is used in addition to the
main trigger threshold. The trigger fires only when the signal crosses the two
thresholds in the correct order. The first threshold arms the trigger, and the second
causes it to fire.
141
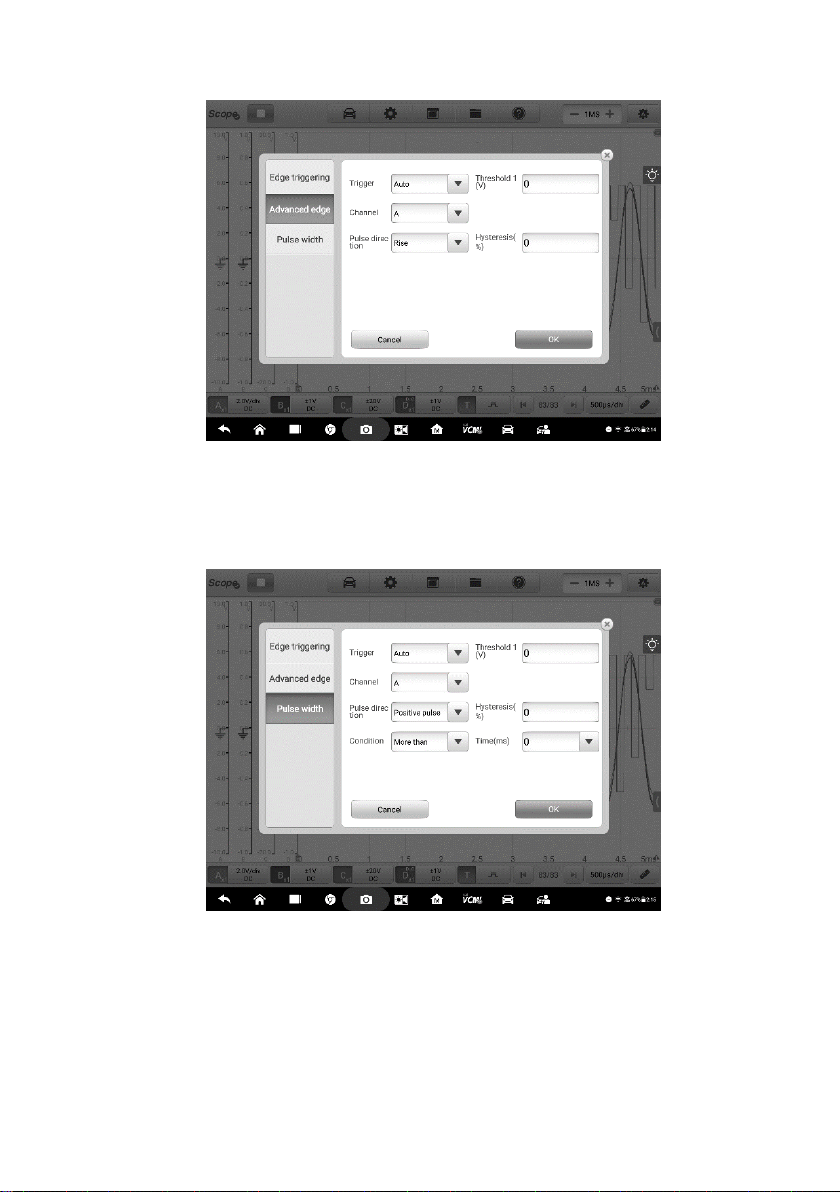
Figure 8-58 Sample Advanced Edge Screen
Pulse Width
This trigger type allows you to monitor pulses of a specified width.
Figure 8-59 Sample Pulse Width Settings Screen
To set the pulse width
1. Tap the Trigger button at the bottom of the screen to open the Trigger
Settings dialog box.
142

2. Select the Pulse Width in the left column of the dialog box.
3. Select the desired trigger mode and channel mode.
4. Set the pulse direction to either Positive pulse or Negative pulse according to
the polarity of the pulse.
5. Select one of the four Conditions:
More than: triggers on pulses wider than the specified time.
Less than: triggers on pulses narrower than the specified time.
In the time range: triggers on pulses wider than Time 1 but narrower
than Time 2.
Out of the time range: triggers on pulses narrower than Time 1 but
wider than Time 2.
6. Set the trigger Threshold and Hysteresis.
7. Set the Time 1 or Time 2 in minutes (if available) to define the pulse width.
8. Tap Done to save settings or tap Cancel to exit without saving.
Buffer
The waveform buffer shows which signal waveform is displayed on the current
screen and how many signal waveforms are captured and stored in the buffer
memory.
The oscilloscope can capture and store up to 32 waveforms. Select a waveform
from the waveform buffer by tapping the Previous or Next button.
143
Name
Button
Description
Previous
Tap to display the previous waveform in the buffer.
Buffer
Index
Displays the number of the waveform currently
displayed onscreen out of the total number of
buffered waveforms.
Next
Tap to display the next waveform in the buffer.
Figure 8-60 Sample Buffer Screen
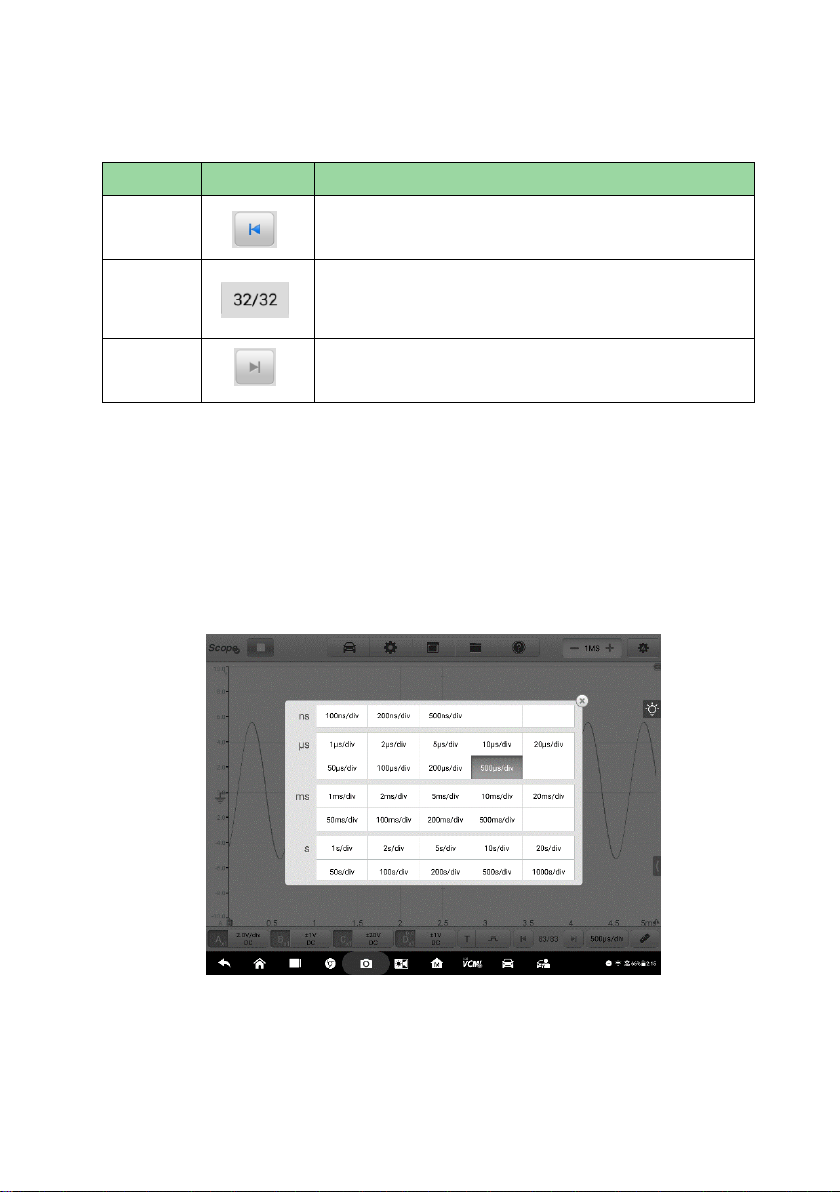
Time Base
The time base controls the time interval across the oscilloscope display. Tap the
Time Base button at the bottom to open the setting dialog box.
Continuous Mode: if the time base is set to more than or equal to 200ms/div, the
oscilloscope switches to the continuous mode. In this mode, the oscilloscope
updates the trace continuously as each capture progresses, rather than waiting for
a complete capture before updating the trace.
Figure 8-61 Sample Time Base Screen
144
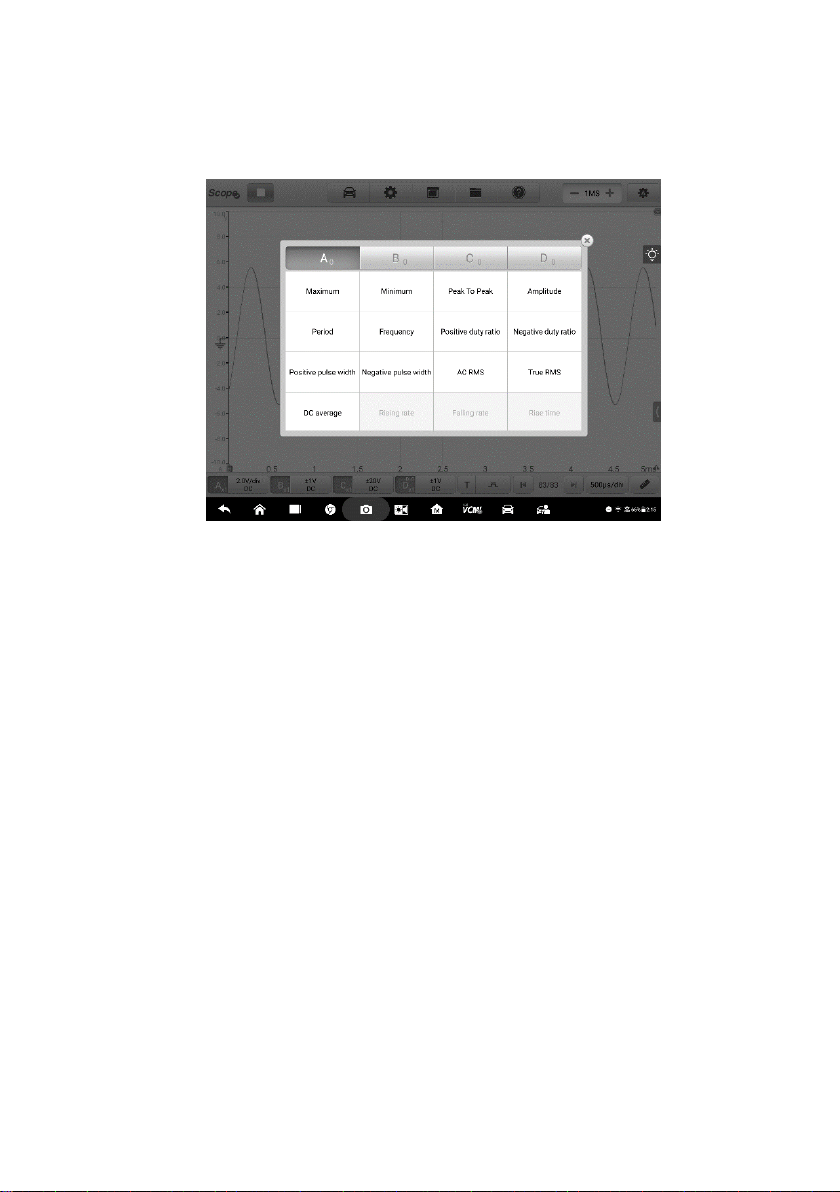
Measurement
The available measurements for each channel are (from left to right):
Figure 8-62 Sample Measurement Screen
Maximum – the highest level that the signal reaches
Minimum – the lowest level that the signal reaches
Peak To Peak – the difference between maximum and minimum
Amplitude – the top value minus the bottom value
Period – the duration of one cycle in a repeated pattern in the waveform
Frequency – the number of signal occurrences per second
Positive Duty Ratio – the ratio of positive pulse width to period width
Negative Duty Ratio –the ratio of negative pulse width to period width
Positive Pulse Width – the amount of time that the signal spends above its
average value
Negative Pulse Width – the amount of time that the signal spends below its
average value
AC RMS – the root mean square (RMS) value of the waveform minus the DC
Average
True RMS – the root mean square (RMS) value of the waveform, including
the DC component
DC Average – the average value of the waveform
145

Rising Rate – the rate at which the signal level rises
Falling Rate – the rate at which the signal level falls
Rise Time – the time the signal takes to rise from the lower threshold to the
upper threshold
Fall Time – the time the signal takes to fall from the upper threshold to the
lower threshold
X@Max – the corresponding value of X axis when the amplitude is the
maximum
X@Min – the corresponding value of X axis when the amplitude is the
minimum
Positive Acreage – the waveform acreage measured above the zero
baseline
Negative Acreage – the waveform acreage measured below the zero
baseline
Full Acreage – the positive acreage plus negative acreage
Top Value – 90% of the waveform maximum value
Bottom Value – 10% of the waveform minimum value
Positive Overshoot – the ratio of the difference between the maximum value
and the top value and the amplitude
Negative Overshoot – the ratio of the difference between the bottom value
and the minimum value and the amplitude
Positive Pre-shoot – the ratio of the difference between the bottom value
and the minimum value and the amplitude
Negative Pre-shoot –the ratio of the difference between the maximum value
and the top value and the amplitude
To set the measurements
1. Tap the Measure button at the bottom of the screen to open the
measurement dialog box.
2. Select the channel to be measured.
3. Select the appropriate measurement options. The Whole Track and Ruler
Track can be toggled through the Edit icon in the upper corner of the option.
146

Figure 8-63 Sample Measurement Setting Screen
4. Close the dialog box, and the corresponding measurement readings are
displayed on the right-hand side of the screen. Adjust the whole track or ruler
track on the displayed screen or delete the measurement directly by tapping
the X button.
Figure 8-64 Sample Measurement Display Screen
147

8.1.6 Troubleshooting
A. If the oscilloscope cannot communicate with the MaxiSys Tablet:
Ensure the VCMI device is properly connected to the MaxiSys Tablet via Wi-Fi or
with the supplied USB cable.
Restart the MaxiSys Tablet and reconnect the VCMI device if communication
between the two continues to fail.
B. If unwanted signals are displayed or signals are distorted:
Use only the supplied test leads or probes to connect with the input channels.
Check the test leads or probes for damage.
Ensure the polarity of the test leads connections are correct.
Ensure the signal and ground connections are clean and secure.
Ensure the ground lead is providing a direct ground from the circuit to the input
channel.
Isolate the test leads from other components, leads, or systems that may induct
unwanted noise into the signal being tested including the electric motors,
secondary ignition components, relays, alternators.
8.1.7 Glossary
AC/DC Control
Each channel can be set to either AC coupling or DC coupling. With DC coupling,
the voltage displayed onscreen is equal to the true voltage of the signal with respect
to ground. With AC coupling, any DC component of the signal is filtered out, leaving
only the variations in the signal for the AC component.
Aliasing
When the signal frequency gets higher than half the scope’s maximum sampling
rate and exceeds the limit, a distorted waveform displays. This distortion is called
aliasing.
Amplitude
The maximum voltage generated from the zero volts line of the oscilloscope.
148

Analog Bandwidth
The frequency at which a displayed sine wave has half the power of the input sine
wave (about 71% of the amplitude).
Buffer Size/Cache Size
The size of the oscilloscope’s buffer memory. The buffer memory is used by the
oscilloscope to temporarily store data. This helps to compensate for the differences
in data transfer rate from one device to another.
Frequency
The number of signal occurrences per second. Frequency is measured in Hz
(hertz).
Peak to peak voltage
The difference in voltage between the minimum and maximum voltages occurring in
the waveform.
Time Base
The time interval across the scope display.
Voltage Range
The range between the maximum and minimum voltages that can be accurately
captured by the oscilloscope.
Sampling Rate
The number of samples per second captured by the oscilloscope. The faster the
sampling rate of the scope, the more frequently it measures the signal voltage, and
so the more detailed will be the trace that appears on the scope screen.
149

8.2 Multimeter Operation
A multimeter is an electronic measuring instrument that is used to measure voltage,
resistance, frequency, diode, duty cycle and pulse width and continuity test. The
VCMI (Vehicle Communication and Measurement Interface) working with MaxiSys
Ultra can function as a multimeter to provide precise measurements.
8.2.1 Safety Information
Follow the instructions below to reduce the risk of injury from electric shock and
prevent equipment damage.
Use the multimeter only as specified in this manual.
Do not apply more than the rated voltage between terminals or between any
terminal and earth ground.
Do not input a value beyond the range when measuring. Remember that the limit
value range of this multimeter is ±200V.
To prevent injury or death, do not use the multimeter if it appears to be damaged
in any way, and stop use immediately if you are concerned with any abnormal
operations.
To prevent injury or death, never ground yourself when taking electrical
measurements. Isolate yourself from ground by using dry rubber insulating mats
to cover all exposed/grounded metal. Ensure all clothing including gloves are dry.
Stand on rubber mats when using tool.
Use the test leads or probes supplied with the product, or proper and applicable
terminals. Inspect the test leads or probes for damage before use.
When using probes, keep fingers behind the finger guards on the probes.
Use the supplied replacement fuses or specified replacement parts.
Always consider electrical and electronic equipment to be energized (live). Never
assume any equipment is de-energized.
When making electrical connections, connect the common test lead before
connecting the live test lead; when disconnecting, disconnect the live test lead
before disconnecting the common test lead.
When measuring current, turn off circuit power before connecting the multimeter
to the circuit. Remember to place the multimeter in series with the circuit.
After current measurement is finished, turn off the power to the circuit before
removing the test leads and before reconnecting any disconnected wires or
devices.
150
Do not add voltage to the input terminal when measuring resistance.
To avoid electric shock, turn off the power to the component before connecting.
To prevent damage, always use and store your multimeter in appropriate
environments.
Do not use in wet or damp conditions, or around explosive gas or vapor.
Do not tamper with or disassemble the multimeter, connectors or accessories.
Internal damage will affect performance.
Before carrying out maintenance and cleaning of the multimeter, make sure the
unit is NOT connected to a power source, vehicle or computer.
When cleaning the multimeter, use a damp, soft cloth with mild detergent. Do not
allow water to enter the multimeter casing.
8.2.2 General Introduction
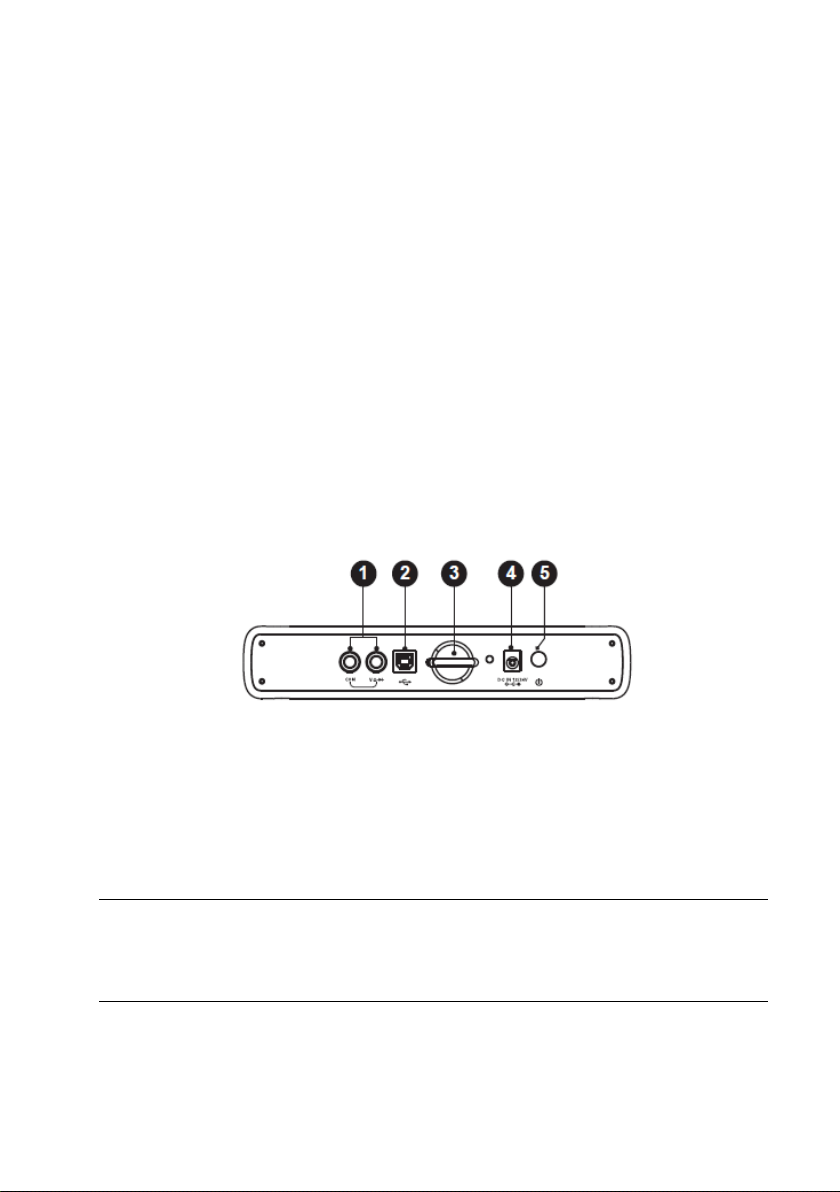
8.2.2.1 Component Locations
The multimeter jacks are located on the top of the VCMI device while the input
channels are located on the bottom.
VCMI Top View
1. Multimeter Jacks – for ground and signal cables
2. USB Port
3. Hook
4. DC Power Supply Input Port
5. Power Button
IMPORTANT
When using the multimeter function, please insert the supplied multimeter probes to
the multimeter probe jacks. The input channel A is assigned when measuring
current.
151
Item
Description
Voltage Range
±200V
Resistance Range
1Ω to 10MΩ
Diode
2V
Frequency Range
1Hz to 1MHz
Duty Cycle Range
%1 to 99%
Pulse Width Range
10us to 1000ms
Current Range
0 to 65A (65A current clamp)
0 to 650A (650A current clamp)
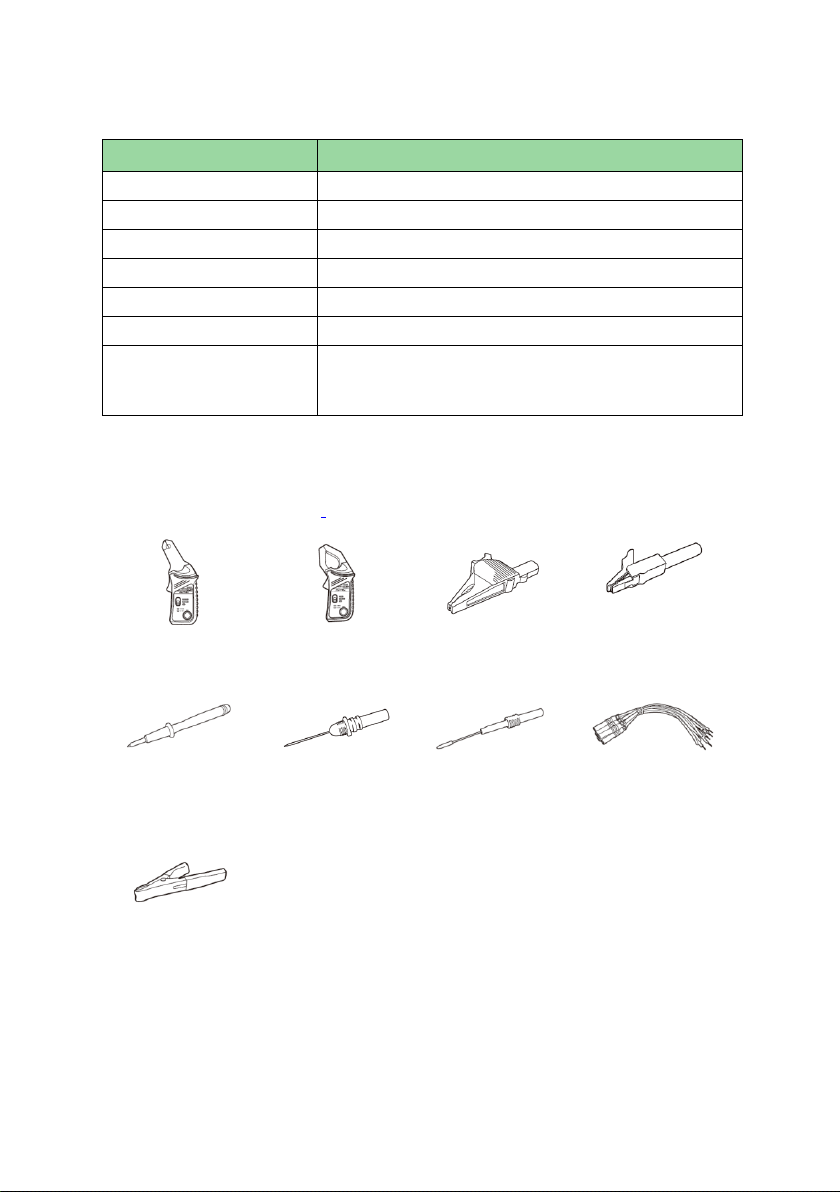
65A current
clamp
650A current
clamp
Large Dolphin
Clip
Small Crocodile
Clip
Multimeter
Probe
Back-pinning
Probe
Flexible
Back-pinning
Probe
Breakout Lead
Battery Clip
8.2.2.2 Technical Specifications
8.2.2.3 Accessories
The following accessories are compatible with the multimeter and oscilloscope.
Please refer to Accessories on page 107 for details.
152

Multimeter Test Lead
Used to connect the multimeter and multimeter probe.
The two multimeter test leads (Red: SA015 / Black: SA016) are standard for the
multimeter and signal generator.
8.2.3 Getting Started
Before opening the Multimeter application, ensure the VCMI device is connected to
the tablet Wi-Fi or with the supplied USB cable. For more information, see Establish
Vehicle Communication on page 20.
Figure 8-1 Sample Connection Diagram
To open the multimeter application
1. Insert the applicable test leads or probe terminal ends into the multimeter
jacks to complete the connection.
2. Tap the Measure icon on the Home screen of the MaxiSys Ultra Tablet. The
Measurement screen opens.
3. Tap the Multimeter icon to open the Multimeter Menu.
4. Select a test to continue.
153
NOTE
Please check the multimeter LED status indicator on the front panel of VCMI device.
The multimeter LED lights green when operating in the multimeter mode.
8.2.4 Multimeter Update
The operating software of the multimeter is continually optimized. Tap the Help
button in the upper half of the screen to update.
Before update the multimeter software, please ensure the tablet has a stable
Internet connection.
8.2.4.1 APK Update
NOTE
The acronym APK (Android Package Kit) is used on the tablet and in this manual.
This file contains all the assets of a particular app. To update the APK, is to install
the latest version of the app on your tablet.
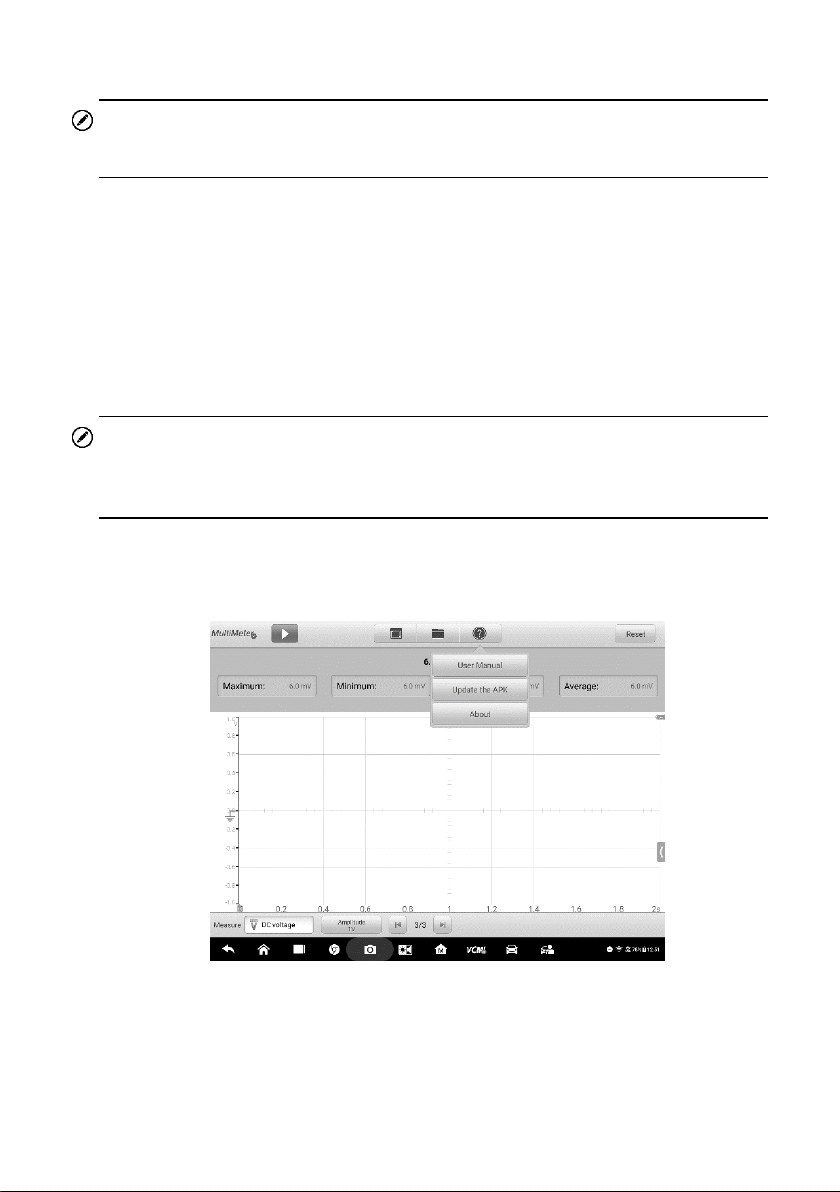
To update the APK
1. Tap the Help button on the upper half of the screen. A dropdown menu
displays.
Figure 8-2 Sample Help Screen
2. Tap the Update the APK in the dropdown menu. A confirmation message
displays.
154
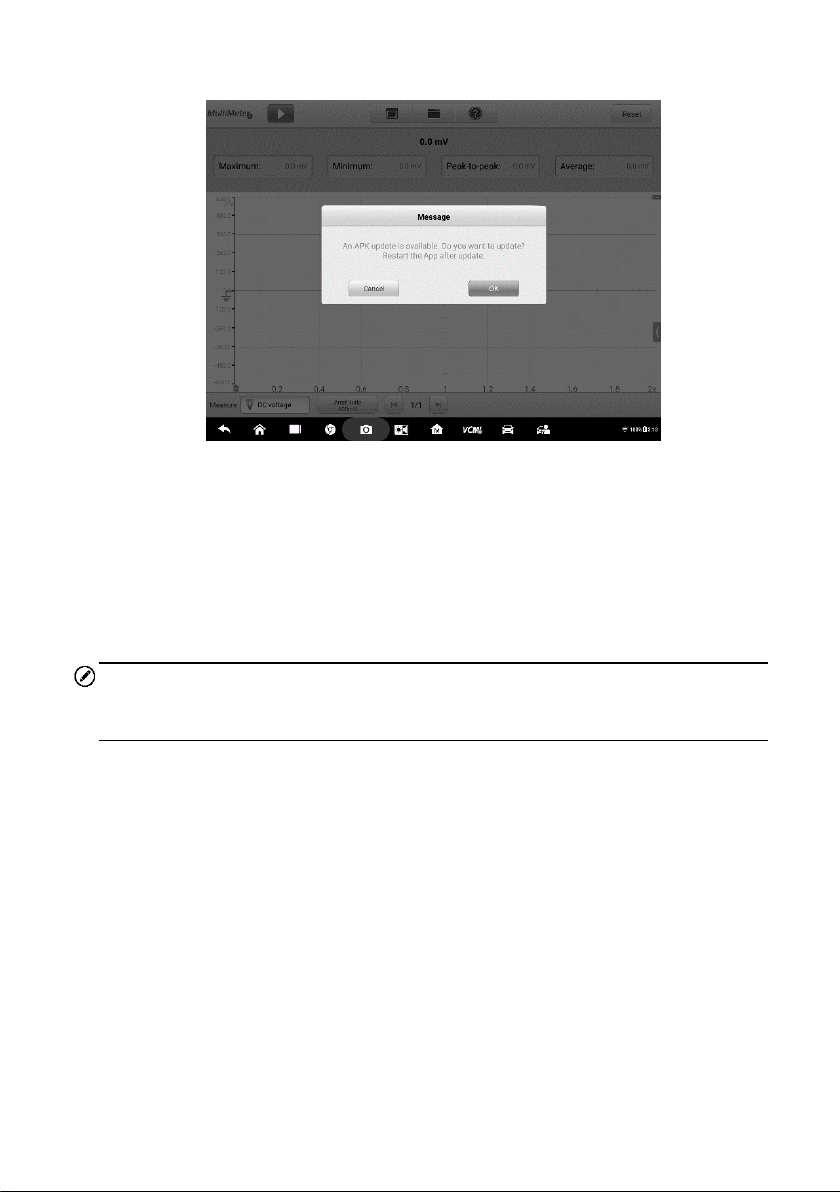
Figure 8-3 Sample Update Confirmation Screen
3. Tap OK to update the software or tap Cancel to exit.
8.2.5 Screen Layout and Operations
Tap the Measurement icon on the home screen then tap the Multimeter icon in the
menu, the multimeter page displays. The screen typically includes the following
button sections.
NOTE
The Multimeter application can also be opened via the Android home screen. Tap
the Measure icon at the top of the Android home screen. Tap Multimeter icon.
155

Name
Button
Description
Multimeter
Icon
Displays the multimeter connection status. See
Multimeter Button on page 173 for more
information.
Start/Stop
Start or stop the multimeter device. See Start/Stop
Button on page 173 for more information.
Display
Mode
Set the display mode. See Display Mode Menu on
page 173 for more information.
Figure 8-4 Sample Multimeter Menu Screen
1. Upper Toolbar Buttons - see 8.2.5.1 Upper Toolbar Buttons on page 172 for
details.
2. Main View Section – see 8.2.5.2 Main View Section on page 177 for details.
3. Lower Toolbar Buttons - see 8.2.5.3 Lower Toolbar Buttons on page 181 for
details.
8.2.5.1 Upper Toolbar Buttons
The upper toolbar buttons are used for configurations of various settings and
operations. The following table provides brief descriptions of each button:
Table 8-1 Upper Toolbar Buttons
156

Name
Button
Description
File
Print, open and save the waveform data. See File
Menu on page 174 for more information.
Help
View the user manual, update the APK and
firmware. See Help Menu on page 176 for more
information.
Reset
Reset the digital readouts displayed in the figure
mode.
Name
Button
Description
Start
Tap to start the multimeter.
Stop
Tap to stop the multimeter.
Multimeter Button
This Multimeter status button displays the multimeter connection status. A green
check mark means the tablet and the Multimeter are connected; a red X means the
device and the tablet are not connected.
Start/Stop Button
Press this Start/Stop Button icon to start and stop the multimeter device.
Display Mode Menu
The position of the digital readouts and waveform in the main view section can be
selected in the Display Mode Menu.
To set the display mode
1. Tap the Display Mode button in the top navigation bar. A submenu opens.
157

Icon
Mode
Description
Digital Mode
Displays the digital readouts only.
Waveform Mode
Displays the waveform only.
Digital +
Waveform Mode
Displays both the digital readouts and waveform.
Figure 8-5 Sample Display Mode Menu Screen
2. Select one of the three display modes.
3. The corresponding display mode will be shown on the screen.
Table 8-2 Display Mode Table
File Menu
The file menu supports the following functions.
158

Figure 8-6 Sample File Menu Screen
Print – Tap to create and print a temporary JPG picture of the current waveforms.
NOTE
Ensure the tablet is configure to print (see Printer setup instructions) and is
connected to the printer. Ensure the tablet and printer share the same network.
Waveform File Operation
Save and open the waveform files in this section. Only Waveform mode and Digital
+ Waveform mode support this operation.
Save Waveform – Tap to capture and save the current waveforms. On the Save
File screen, tap each item to input the corresponding information and then tap Save
or Save Default to finish.
NOTE
The file name is required when saving waveforms.
Open Waveform – Tap to retrieve the saved waveforms. Tap the Edit button in the
upper right corner of the screen to select and/or delete the saved waveform.
Save as text – Tap to save the current waveform data to a text file. Use the ES File
Explorer app on the Android home screen to review file: Home > ES File Explorer >
Local > Internal Storage > Scan > Data > Scope > txt.
159

Configuration Operation
The configurations can be saved and imported.
Save the Configuration – Tap to save the configuration settings (i.e., the
amplitude, the time base, the number of samples) of waveforms on the current
screen.
Import the Configuration – Tap to import the saved configuration settings for
waveforms.
Help Menu
The Help Menu allows you to view the user manual, update the software, and view
versions of the device.
Figure 8-7 Sample Help Menu Screen
User Manual – displays instruction for the prosper use of the multimeter.
Update the APK – connects to the Autel server to check for latest application
software.
About – displays the model number of the multimeter and version numbers of the
installed software and firmware.
8.2.5.2 Main View Section
The main view section displays differently depending on the selected mode.
160

Digital Mode
The main view section in the digital mode displays only the digital readouts such as
values of current measurement, maximum measurement, minimum measurement,
peak to peak measurement and average measurement.
Figure 8-8 Sample Main View Section Screen (Digital Mode)
Current Value: the current value can be the AC voltage, DC voltage, resistance,
frequency, or duty cycle
Maximum: the recorded maximum value of the measurement
Minimum: the recorded minimum value of the measurement
Peak to Peak: the difference between the maximum and minimum values
Average: the average value of the measurements
Waveform Mode
The main view section in the scope mode only displays the waveform.
161

Figure 8-9 Sample Main View Section Screen (Waveform Mode)
The main view section features a coordinate grid with the X-axis representing the
time duration and the Y-axis representing the voltage level.
The voltage level on the Y-axis can be configured in the Amplitude Settings while
the time duration on the X-axis can be set in the Time Base Settings.
Channel Selection
In the main view section, a channel has two conditions: selected and unselected. A
channel must be selected in order for the waveform to be movement, to use the
zoom-in or to add voltage rulers.
To select and unselect the channel
1. Tap the zero baseline marker or the Y-axis (the line thickens when
selected).
2. Tap the zero baseline marker or the Y-axis again to exit the channel
selection.
Waveform Zooming
The zooming function allows you to change the size and position of a signal during
or after capturing a waveform to examine it in greater details. It does not change the
stored data, but the way it displays.
162

The X-axis and Y-axis can be zoomed using your fingertips. The waveform can be
zoomed during or after capturing the signal.
Measurement Rulers
In the coordinate grid, there are two kinds of measurement rulers, which allow the
voltage and time duration of a waveform to be measured precisely. They are useful
when determining signal characteristics such as amplitude at specific points, the
cycle time (duration) and frequency.
The vertical Time Ruler - Tap the Ruler Activator in the bottom left corner of the
grid and drag it across the screen to the desired position. A Time Ruler is
generated.
The horizontal Y-axis Ruler - The Ruler can be generated in the similar way by
tapping the Ruler Activator in the upper right corner and dragging it downwards.
NOTE
The horizontal Y-axis ruler varies according to the settings of the voltage, current,
frequency, duty cycle, etc.
When Measurement Rulers are generated, a Ruler Table showing time and voltage
values for the corresponding channels will be displayed. The Delta icon refers to the
absolute difference between the values of the rulers, which can be locked by
tapping the Lock icon. Tap the X button in the upper right corner of the ruler table to
delete all rulers.
163

Figure 8-10 Sample Measurement Rulers Screen
Zero Baseline
The zero baseline is marked the 0 value in the Y-axis, showing the ground level of
each channel waveform. After the channel is selected, the zero baseline can be
adjusted by dragging the baseline marker up/down along the Y-axis, or dragging the
waveform up/down or moving the screen up/down in the grid.
NOTE
Tap the baseline marker to make the vertical scale line thinner. In this case, the
waveform is unselected and cannot be dragged. Tap the baseline marker again to
select.
Figure 8-11 Sample Zero Baseline Screen
Wiring Diagram and Help
Tap the arrow button in the lower right corner of the screen to open the Wiring
Diagram and Help window.
The Wiring Diagram function provides the connection diagram, operation steps
and operation notes.
The Help function provides the content-sensitive help, displaying information
relevant to the procedure, operation or instructions.
164

Figure 8-12 Sample Wiring Diagram and Help Screen
To open and close the Wiring Diagram and Help window
1. Tap the arrow button on the right-hand side of the screen.
Figure 8-13 Arrow Button Position Screen
2. The Wiring Diagram and Help window displays.
3. Tap the arrow button again or tap any space outside of the window.
165

Name
Button
Description
Measure
Tap to select an appropriate measurement.
See Measure Setting on page 181 for more
information.
Amplitude
Tap to select an appropriate amplitude
value. See Amplitude Setting on page 183
for more information.
Buffer
Tap the Previous or Next button to switch to
the previous or the next waveform. See
Buffer on page 187 for more information.
Digital + Waveform Mode
In this mode, the main view section displays the digital readouts on the top and the
waveform in the grid.
Figure 8-14 Sample Main View Section Screen (Digital + Waveform Mode)
8.2.5.3 Lower Toolbar Buttons
The measurement, buffer and time base can be configured in the lower toolbar.
Table 8-3 Lower Toolbar Buttons
166

Measure Setting
This multimeter can be used to measure or test AC voltage, DC voltage, resistance,
AC electricity, DC electricity, diode, frequency, duty cycle, pulse width, continuity
and period.
The measurement types include:
AC/DC voltage: measures the voltage in the electrical circuit
Resistance: measures the resistance of the electrical circuit or the component
AC/DC electricity: measures current amperage through the input channel A by
using the optional current clamp
Note
The type of current clamp can be selected in the dropdown list.
Diode: conducts the diode test of the electrical circuit
Frequency: measures the frequency of the input signal
Duty Cycle (+)/(-): measures the (+) and (-) duty of the input signal
Continuity: determines whether a low impedance exists two points in the
electrical circuit. If the impedance is less than 10 ohms, the circuit is “closed”,
otherwise, the circuit is “open”.
Period: measures the amount the time that one complete cycle of the input signal
endures
Pulse Width (+)/(-): measures the pulse width of the input signal
To set the measure setting
1. Tap the Measure Setting button in the lower left corner of the screen. A dialog
box appears.
167

Figure 8-15 Sample Measure Setting Position Screen
2. Select the measure type you want to measure or test in the right column of
the dialog box. The blue color indicates the option is selected.
Figure 8-16 Sample Measure Setting Screen
3. Close the dialog box, the measure type you set displays on the screen.
Amplitude Setting
Amplitude value can be configured for the selected measurement type excluding
resistance measurement.
168

The amplitude settings allow you to set up the multimeter to capture signals within
the specified range. If the input signal exceeds the selected range, an over-range
indicator will be displayed. Select Auto to enable the device to adjust the vertical
scale automatically.
There are two modes available to set the amplitude value.
Mode 1: For example, selecting AC 1V sets the amplitude to Voltage 1V (displays
on the amplitude button). The vertical scale range is from -1V to +1V. As the vertical
scale is divided into 10 segments, each segment increases by 0.2V.
Figure 8-17 Channel Setting Dialog Box Screen (AC 1V)
Mode 2: Select the ## /div button to adjust the value increments of each division.
For example, selecting AC 2.0V/div, sets the amplitude to Voltage 2.0V/div
(displays on the amplitude button). Each segment increases by 2V. As the vertical
scale is divided into 10 segments, the entire vertical scale range is from -10V to
+10V.
169

Figure 8-18 Sample Amplitude Setting Screen (AC 2.0V/div)
Testing Procedures
The following section describes how to use the multimeter. The testing procedures
are the same for each measurement type.
The following directions are for measuring AC voltage.
To measure AC voltage
1. Tap the Measure Setting button in the lower left corner of the screen to open
the setting dialog box. Select AC voltage in the dialog box.
2. Set the proper amplitude value in the Amplitude Setting menu in the same
dialog box.
3. Insert the supplied multimeter probes into the VCMI multimeter jacks.
4. Measure the AC voltage by holding the probes to the correct points of the
circuit.
5. The voltage displays onscreen.
Note
Use the optional current clamp connected to the input channel A when measuring
currents. Use the supplied multimeter probes to connect with the multimeter jacks
for other measurement types.
170

Probe Edit
Use the probe edit menu to add the not included robes into the probe menu.
Figure 8-19 Sample Probe Edit Screen 1
To add custom probes
1. Tap the Measure Setting button in the lower left corner of the screen to open
the setting dialog box.
2. Select the Probe Edit option in the left column of the dialog box.
3. Tap each field to open the virtual keyboard and input the required information.
171

Figure 8-20 Sample Probe Edit Screen 2
4. Tap Add to save the settings, or tap Clear to exit without saving.
5. The added probe will be listed in the Measure Settings window.
Figure 8-21 Sample Probe Edit Screen 3
Buffer
The waveform buffer displays the number of the waveform currently displayed
on-screen out of the total number of stored waveforms.
The multimeter can capture and store up to 32 waveforms. Tap the Previous or
Next button to review waveforms.
172

Name
Button
Description
Previous
Tap to display the previous waveform in the buffer.
Buffer Index
Displays the number of the waveform currently
displayed onscreen out of the total number of
buffered waveforms.
Next
Tap to display the next waveform in the buffer.
Figure 8-22 Sample Buffer Screen
8.2.6 Troubleshooting
If the multimeter cannot communicate with the MaxiSys Tablet:
Check if the VCMI device is properly connected to the MaxiSys Tablet via Wi-Fi or
the supplied USB cable.
If the communication between the VCMI device and the MaxiSys still fails, restart
the MaxiSys Tablet and reconnect the VCMI device.
173

8.2.7 Glossary
AC
Alternating Current - electrical current that switches polarity at regular intervals.
DC
Direct Current - electrical current that flows in one direction only.
Amperage
The strength of an electric current, expressed in amperes.
Amplitude
The maximum voltage generated from the zero volts line of the multimeter.
Frequency
The number of signal occurrences per second. Frequency is measured in Hz
(hertz).
Duty Cycle
The length of a signals on time. Specified as a percentage (ratio), of the total cycle
time.
Peak to Peak
The difference between maximum and minimum value.
Cursor
The onscreen markers used to measure time and amplitude.
Diode
A semiconductor device that allows current flow only in one direction.
Grid
A network of horizontal and vertical scales displayed on the scope screen that aids
in the measuring of signal characteristics.
174

8.3 Signal Generator Operation
The VCMI (Vehicle Communication and Measurement Interface) working with
MaxiSys Ultra can function as a signal generator to send out electric signals to the
vehicle’s sensor or actuator for testing or measuring.
8.3.1 Safety Information
Follow the instructions below to reduce the risk of injury from electric shock and
prevent equipment damage.
Use the signal generator only as specified in this manual.
Do not apply more than the rated voltage between terminals or between any
terminal and earth ground.
To minimize shock hazard, please connect the device ground input (chassis) to an
electrical ground.
Do not alter the ground connection. Without the protective ground connection, all
accessible conductive parts can render an electric shock.
To avoid electric shock hazard, disconnect power cable before removing covers.
To prevent injury or death, do not use the signal generator if it appears to be
damaged in any way, and stop use immediately if you are concerned any
abnormal operations.
Inspect the test leads or probes for damage before use.
Use the accessories supplied with the product.
Use the supplied replacement fuses or specified replacement parts.
To prevent damage, always use and store your signal generator in appropriate
environments.
Do not place the signal generator in an area that is directly exposed to sunlight or
under high humidity.
Do not tamper with or disassemble the signal generator, connectors or
accessories. Internal damage will affect performance.
Disconnect multimeter from power source, vehicle and tablet before cleaning.
When cleaning the signal generator, use a damp, soft cloth with mild detergent.
Do not allow water to enter the multimeter casing
175

Item
Description
Voltage Range
0.1 to 12V
Frequency Output
1Hz to 30KHz
Duty Cycle Range
1% to 99% (1Hz to 30KHz)
Accuracy
3%
8.3.2 General Introduction
8.3.2.1 Component Locations
The multimeter jacks are used when operating the signal generator. The two
multimeter jacks are located on the top of the VCMI device.
VCMI Top View
1. Multimeter Jacks – for ground and signal cables
2. USB Port
3. Hook
4. DC Power Supply Input Port
5. Power Button
8.3.2.2 Technical Specifications
8.3.2.3 Accessories
The following accessories are compatible with the signal generator and
oscilloscope. Please refer to Accessories on page 107 for details.
176

Large Dolphin
Clip
Small Crocodile
Clip
Multimeter
Probe
Back-pinning
Probe
Flexible Back-pinning Probe
Breakout Lead
Battery Clip
Multimeter Test Lead
Used to connect the signal generator and the probe.
The multimeter test leads (Red: SA015 / Black: SA016) are standard for the signal
generator and multimeter.
8.3.3 Getting Started
Before opening the Signal Generator application, the VCMI device must be
connected to the Tablet via the provided USB cable or Wi-Fi network. For more
information, see Establish Vehicle Communication on page 20.
177

Figure 8-1 Sample Connection Diagram
To open the signal generator application
1. Insert the multimeter test lead ends into the multimeter jacks on the top of the
VCMI device to compete the connection.
2. Tap the Measure icon on the Home screen of the MaxiSys Ultra Tablet. The
Measurement screen displays.
3. Tap the Signal Generator icon to open the signal generator Menu.
4. Select a test to continue.
NOTE
Please check the signal generator LED status indicator on the front panel of VCMI
device. The signal generator LED lights green when operating in the signal
generator mode.
8.3.4 Signal Generator Update
The operating software of the signal generator is continually optimized. Tap the
Help button in the upper half of the screen to update.
8.3.4.1 APK Update
178

NOTE
The acronym APK (Android Package Kit) is used on the tablet and in this manual.
This file contains all the assets of a particular app. To update the APK, is to install
the latest version of the app on your tablet.
To update the APK
1. Tap the Help button on the upper half of the screen. A dropdown menu
displays.
Figure 8-2 Sample Help Screen
2. Tap the Update the APK in the dropdown menu. A confirmation message
displays.
179

Figure 8-3 Sample Update Confirmation Screen
3. Tap OK to update the software or tap Cancel to exit.
8.3.5 Screen Layout and Operations
Tap the Measurement icon on the home screen and select Signal Generator from
the menu, the signal generator page displays. The screen typically includes the
following button sections.
NOTE
The Signal Generator application can also be opened via the Android home screen.
Tap the Measure icon at the top of the Android home screen. Tap Signal
Generator icon.
180

Name
Button
Description
Signal
Generator
Icon
Displays the signal generator connection status.
See Signal Generator Button on page 197 for
more information.
Start/Stop
Start and stop the signal generator device. See
Start/Stop Button on page 197 for more
information.
File
Print, open and save the waveform data. See File
on page 197 for more information.
Figure 8-4 Sample Signal Generator Menu Screen
1. Upper Toolbar Buttons - see 8.3.5.1 Upper Toolbar Buttons on page 196 for
details.
2. Main View Section – see 8.3.5.2 Main View Section on page 199 for details.
3. Lower Toolbar Buttons - see 8.3.5.3 Lower Toolbar Buttons on page 202 for
details.
8.3.5.1 Upper Toolbar Buttons
The upper toolbar buttons are used to configure settings and operations. The
following table provides brief descriptions of each button.
Table 8-1 Upper Toolbar Buttons
181

Name
Button
Description
Help
View the user manual, update the software and
view version numbers. See Help on page 198 for
more information.
Reset
Reset the configurations and refresh the screen.
Name
Button
Description
Start
Tap to start the signal generator.
Stop
Tap to stop the signal generator.
Signal Generator Button
This Signal Generator Icon displays the signal generator connection status. A
green check mark means the tablet and the signal generator are connected; a red
X means the device and the tablet are not connected.
Start/Stop Button
You can tap the Start/Stop Button icon to start or stop the signal generator device.
File Menu
The file menu supports the following functions.
182

Figure 8-5 Sample File Menu Screen
Print – Tap to create and print a temporary JPG picture of the current waveforms.
NOTE
Ensure the tablet is configure to print (see Printer setup instructions) and is
connected to the printer. Ensure the tablet and printer share the same network.
Save Waveform – Tap to capture and save the current waveform. On the Save
File screen, tap each item to input the corresponding information and then tap
Save or Save Default to finish.
NOTE
You must name the file to save the waveform.
Open Waveform – Tap to retrieve the saved waveforms. Tap the Edit button in
the upper right corner of the screen to select and/or delete the saved waveform.
Save as text – Tap to save the current waveform data to a text file. Use the ES
File Explorer app on the Android home screen to review file: Home > ES File
Explorer > Local > Internal Storage > Scan > Data > Scope > txt.
Help Menu
The Help Menu allows you to view the user manual, update the software, and view
versions of the device.
183

Figure 8-6 Sample Help Menu Screen
User Manual – displays instruction for the prosper use of the signal generator.
Update the APK – connects to the Autel server and check for latest application
software.
About – displays the model numbers of the signal generator and the installed
versions of the software and firmware.
8.3.5.2 Main View Section
The main view section screen displays as a coordinate grid with X-axis and Y-axis,
representing the duration and voltage level respectively.
Channel Selection
In the main view section, a channel has two conditions: selected and unselected. A
channel must be selected in order for the waveform to be movement, to use the
zoom-in or to add voltage rulers.
To select and unselect the channel
1. Tap the zero baseline marker or the Y-axis (the line thickens when selected).
2. Tap the zero baseline marker or the Y-axis again to exit the channel selection.
184

Waveform Zooming
The zooming function allows you to change the size and position of a signal during
or after capturing a waveform to examine it in greater details. It does not change the
stored data, only the way it displays.
The X-axis and Y-axis can be zoomed using your fingertips. The waveform can be
zoomed during or after capturing the signal.
Measurement Ruler
In the coordinate grid, there are two types of measurement rulers, which allow the
voltage and duration of a waveform to be measured precisely. They are useful when
determining signal characteristics such as amplitude at specific points, and the
cycle time (duration).
The vertical Time Ruler - Tap the Ruler Activator in the lower left corner of the grid
and drag it across the screen to the desired position. A Time Ruler is generated.
The horizontal Voltage Ruler - The Voltage Ruler can be generated in the similar
way by clicking the Ruler Activator in the upper right corner and dragging it
downwards.
When Measurement Rulers are generated, a Ruler Table showing time and voltage
values will be displayed. The Delta icon refers to the absolute difference between
the values of the rulers, which can be locked by tapping the Lock icon. Tap the X
button in the upper right corner of the ruler table to delete all rulers.
Figure 8-7 Sample Measurement Rulers Screen
185

Zero Baseline
The zero baseline is marked as the 0 value in the Y-axis, showing the ground level
of each channel waveform. After the channel is selected, the Zero Baseline can be
adjusted by dragging the zero baseline marker up/down along the Y-axis.
Wiring Diagram and Help
Tap the arrow button in the lower right corner of the screen to open the Wiring
Diagram and Help window.
The Wiring Diagram function provides the connection diagram, operation steps
and operation notes.
The Help function provides the content-sensitive help, displaying information
relevant to the procedure, operation or instructions.
Figure 8-8 Sample Wiring Diagram and Help Screen
To open and close the Wiring Diagram and Help window
1. Tap the arrow button on the right-hand side of the screen.
186

Name
Button
Description
Waveform
Mode
Setting
Tap to select an appropriate waveform
mode. See Waveform Mode Setting on page
203 for more information.
Voltage
Setting
Tap to select an appropriate voltage value.
See Voltage Setting on page 208 for more
information.
Frequency
Setting
Tap to select an appropriate frequency
value. See Frequency Setting on page 211
for more information.
Duty Cycle
Setting
Tap to select an appropriate duty cycle
value. See Duty Cycle Setting on page 214
for more information.
Figure 8-9 Arrow Button Position Screen
2. The Wiring Diagram and Help window displays.
3. Tap the arrow button again or tap any space outside of the window.
8.3.5.3 Lower Toolbar Buttons
The waveform mode, voltage, frequency and duty cycle can be configured via the
lower toolbar buttons.
Table 8-2 Lower Toolbar Buttons
187

Waveform Mode Setting
The signal generator supports numerous waveform modes including the DC voltage,
square wave, square wave (X+Y), triangle wave, and actuators drive, and arbitrary
waveform.
Figure 8-10 Waveform Mode Setting Screen
DC Voltage
Figure 8-11 Sample DC Voltage Connection Diagram
188

Set the DC voltage in the signal generator interface. The signal generator can
simulate the signals of numerous sensors including the water temperature sensor,
oil pressure sensor and position sensor and then feed back to the engine ECU.
Actuator Drive
Figure 8-12 Sample Actuator Drive Connection Diagram
This function can drive 2-wire solenoid valve, solenoid coil and low-power motor,
including the canister solenoid valve, injector solenoid valve, transmission hydraulic
valve, hydraulic control valve, ignition coil, idle motor, and throttle motor.
It can change the operation speed and working time of the actuator by setting the
frequency and duty cycle. The higher the frequency, the faster the speed, and the
higher the duty cycle, the longer the working time, and vice versa.
NOTE
To avoid damaging the actuator, do not actuate it for a long time, and do not set too
high a frequency.
This function needs to be tested on the car. If the actuator is removed, it cannot be
driven individually.
189

Square Wave
Figure 8-13 Sample Square Wave Connection Diagram
Once the voltage and frequency are set in the signal generator interface, the square
wave signals simulate the signals of various Hall sensors.
Square Wave (X+Y)
Figure 8-14 Sample Square Wave (X+Y) Connection Diagram
190

This function is mainly used to simulate the missing tooth signals of Hall-type
crankshafts and camshafts. The X value represents the normal tooth signal and the
Y represents the missing tooth signal. The default setting is 58+2, which can be
adjusted as needed.
Triangle Waveform
Figure 8-15 Sample Triangle Waveform Connection Diagram
This is a symmetrical triangular waveform, which is mainly used to simulate the
triangle wave signals. The amplitude and frequency can be configured in this
waveform.
191

Arbitrary Waveform
Figure 8-16 Sample Arbitrary Waveform Connection Diagram
Any type of the mentioned waveforms can be loaded again after the waveform and
parameter settings are saved.
Voltage Setting
After you select the waveform mode, you can also set the amplitude value for that
mode.
There are three methods to adjust the voltage value:
Method 1: Tap the “+” and “-” buttons on the bottom of the screen in the Voltage
Setting.
192

Range
Button
Description
0.1V to 0.9V
Raises the voltage by 0.1V
Lowers the voltage by 0.1V
1V to 12V
Raises the voltage by 1V
Lowers the voltage by 1V
Figure 8-17 Sample Voltage Setting Screen 1
Method 2: Tap the Voltage Setting button at the bottom of the screen to open a
dialog box. Adjust the voltage value by tapping the positive or negative value at
the bottom of the dialog box. Then tap OK to confirm or Cancel to exit without
saving.
193

Value
Description
+0.1V
Raises the voltage by 0.1V
-0.1V
Lowers the voltage by 0.1V
+1.0V
Raises the voltage by 1V
-1.0V
Lowers the voltage by 1V
Figure 8-18 Sample Voltage Setting Screen 2
Method 3: Input the voltage value using the virtual keyboard. Tap the voltage field
to clear the current value and input the new value. Tap OK to confirm or Cancel to
exit without saving.
194

Figure 8-19 Sample Voltage Setting Screen 3
Frequency Setting
When the waveform mode is selected and the signal generator is operating, you
can also set the frequency value for that mode.
There are also three methods to adjust the frequency value:
Method 1: Tap the “+” and “-” buttons on the bottom of the screen in the
Frequency Setting.
195

Range
Button
Description
1Hz to 10Hz
Raises the frequency by 1Hz
Lowers the frequency by 1Hz
10Hz to 100Hz
Raises the frequency by 10Hz
Lowers the frequency by 10Hz
100Hz to 1000Hz
Raises the frequency by 100Hz
Lowers the frequency by 100Hz
1.0KHz to 30.0KHz
Raises the frequency by 1KHz
Lowers the frequency by 1KHz
Figure 8-20 Sample Frequency Setting Screen 1
Method 2: Tap the Frequency Setting button at the bottom of the screen to open a
dialog box. Adjust the frequency value by tapping the positive or negative value at
the bottom of the dialog box. The unit of the frequency can be switched Hz to KHz.
Tap OK to confirm or Cancel to exit without saving.
Figure 8-21 Sample Frequency Setting Screen 2
196

Value
Description
+1.0Hz
Raises the frequency by 1Hz
-1.0Hz
Lowers the frequency by 1Hz
+10.0Hz
Raises the frequency by 10Hz
-10.0Hz
Lowers the frequency by 10Hz
+1.0KHz
Raises the frequency by 1KHz
-1.0KHz
Lowers the frequency by 1KHz
+10.0KHz
Raises the frequency by 10KHz
-10.0KHz
Lowers the frequency by 10KHz
Method 3: Input the frequency value using the virtual keyboard. Tap the frequency
field to clear the current value and input the new value. Tap OK to confirm or
Cancel to exit without saving.
Figure 8-22 Sample Frequency Setting Screen 3
197

Range
Button
Description
1% to 99%
Raises the duty cycle ratio by 1%
Lowers the duty cycle ratio by 1%
Duty Cycle Setting
When the waveform mode is set, you can also set the duty cycle ratio for that mode.
There are three methods to adjust the duty cycle ratio:
Method 1: Tap the “+” and “-” buttons on the bottom of the screen in the Duty
Cycle Setting.
Figure 8-23 Sample Duty Cycle Setting Screen 1
Method 2: Tap the Duty Cycle Setting button at the bottom of the screen to open a
dialog box. Adjust the duty cycle by tapping the positive or negative ratio at the
bottom of the dialog box. Tap OK to confirm or Cancel to exit without saving.
198

Value
Description
+1.0%
Raises the duty cycle ratio by 1.0%
-1.0%
Lowers the duty cycle ratio by 1.0%
+10.0%
Raises the duty cycle ratio by 10%
-10.0%
Lowers the duty cycle ratio by 10%
Figure 8-24 Sample Duty Cycle Setting Screen 2
Method 3: Input the duty cycle ratio using the virtual keyboard. Tap the duty cycle
field to clear the current value and input the new value. Tap OK to confirm or
Cancel to exit without saving.
199

Waveform
Type
Description
Sample Waveform
DC Voltage
A waveform with constant
voltage
Figure 8-25 Sample Duty Cycle Setting Screen 3
8.3.6 Troubleshooting
If the signal generator cannot communicate with the MaxiSys Tablet:
Check if the VCMI device is properly connected to the MaxiSys Tablet through the
supplied USB cable.
IMPORTANT
To avoid damaging the vehicle and/or the equipment, all vehicle communications must
be terminated before resetting the connection. The Internet connection may be aborted
during resetting.
If the communication between the VCMI device and the MaxiSys Tablet still fails,
restart the MaxiSys Tablet and reconnect the VCMI device.
8.3.7 Glossary
200

Waveform
Type
Description
Sample Waveform
Square
Wave
A non-sinusoidal periodic
waveform with the duty cycle
of 50%
Square
Wave (X+Y)
A special square waveform
with normal and missing
teeth signals
Triangle
Wave
A asymmetrical triangular
waveform
201

8.4 OBDII Communication Line Inspection Operation
The VCMI (Vehicle Communication and Measurement Interface) working with MaxiSys
Ultra is designed with the OBDII communication line inspection function by checking
the ON-OFF lamps on the tablet screen.
Generally, the vehicle’s electronic control systems are designed to comply with the
specific communication protocols. The control units in the electronic control systems
communicate with the Tablet through the OBDII (DLC) adapter.
With the OBD communication line inspection function, you can check whether the
control units in vehicle’s electronic control systems work properly or not by illuminating
ON-OFF lamps according to the condition of sending out the communication signals.
8.4.1 Safety Information
Follow the instructions below to ensure proper communication line inspection
performance.
Different preconditions for different functions. Before inspection, please read the
inspection guides carefully.
The pin number for OBDII vary by vehicle modes. Please check and confirm for
correct pin number and then proceed inspection.
Select OBDII connector’s signal pins manually if the test vehicle’s actual
communication signal pins are assigned differently.
Ensure the DLC main cable is connected to the vehicle before inspection.
Ensure the ignition key is in ON position when testing the vehicle’s communication
line.
If the inspection fails due to no signal input, consult vehicle circuit diagram to ensure
correct communications are being tested.
Do not use in wet or damp conditions, or around explosive gas or vapor.
Do not tamper with or disassemble the product, connectors or accessories. Internal
damage will affect performance.
Disconnect the product from power source, vehicle and tablet before cleaning.
When cleaning the product, use a damp, soft cloth with mild detergent. Do not allow
water to enter the product casing, as this will cause damage to the electronics inside.
202

8.4.2 General Introduction
8.4.2.1 Component Locations
The main connectors are located on the bottom of the VCMI device.
1. Ethernet Connector
2. Vehicle Data Connector
3. Input Channel A
4. Input Channel B
5. Input Channel C
6. Input Channel D
8.4.3 Getting Started
Before opening the OBDII Communication Line Inspection application, you have to
complete three steps below:
1) Connect the VCMI device to the Tablet via Wi-Fi or the supplied USB, see Establish
Vehicle Communication on page 20.
2) Connect the VCMI device to the vehicle’s OBDII connector.
3) Place the ignition in the key on position.
203

Figure 8-1 Sample Connection Diagram
To open the OBDII Communication Line Inspection application
1. Please refer to Figure 8-1 Sample Connection Diagram to complete the
connection. Place the ignition in the key on position.
2. Tap the Measure icon on the Home screen of the MaxiSys Ultra Tablet. The
Measurement screen opens.
3. Tap the OBD icon to open the OBDII Communication Line Inspection Menu.
4. Select a communication protocol to test.
8.4.4 Update
The operating software of the device is continually optimized. Tap the Help button in
the upper half of the screen.
8.4.4.1 APK Update
NOTE
The acronym APK (Android Package Kit) is used on the tablet and in this manual. This
file contains all the assets of a particular app. To update the APK, is to install the latest
version of the app on your tablet.
To update the APK
1. Tap the Help button on the upper half of the screen. A dropdown menu displays.
204
 Loading...