

Page 1
Getting Started with Your 2700 Series Instrument
2700 Series
2 7 2 2 2 7 2 0 2 7 1 2 2 7 0 2
USO RESTRITO
Page 2

USO RESTRITO
Page 3
Getting Started with Your
2700 Series Instrument
An Introductory Guide to • SYS-2722 •
and • SYS-2720 • SYS-2712 • SYS-2702 •
with AP2700 3.30 SP1
APIB and GPIB Configurations
USO RESTRITO
Page 4
All content in this manual is owned by Audio Precision and is
protected by United States and international copyright laws.
Audio Precision allows its customers to make a limited number
of copies of this manual, or portions thereof, solely for use in
connection with the Audio Precision product covered by this
manual. Audio Precision may revoke this permission to make
copies at any time. You may not distribute any copies of the
manual, apart from a transfer of ownership of the Audio
Precision product.
Audio Precision®, System One®, System Two™, System Two
Cascade™, System Two Cascade Plus™, Cascade™,
Cascade Plus™, System One + DSP™, System Two + DSP™,
Dual Domain®, FASTTEST®, APWIN™, ATS™, ATS-2™, 2700
series™ and AP2700™ are trademarks of Audio Precision, Inc.
Windows™ is a trademark of Microsoft Corporation.
Audio Precision instruments equipped with the OPT-2711
Dolby™ Digital Generator are manufactured under license from
Dolby Laboratories. Dolby and the double-D symbol are
trademarks of Dolby Laboratories. Confidential unpublished
works. © 1992–2004 Dolby Laboratories, Inc. All rights
reserved.
Published by:
5750 SW Arctic Drive
Beaverton, Oregon 97005
1-800-231-7350
fax 503-641-8906
503-627-0832
ap.com
Printed in the United States of America
Copyright Ó 2003–2013 Audio Precision, Inc.
All rights reserved.
Part Number 8211.0184 Revision 9
This mark signifies that the product conforms to all applicable
requirements of the European Community. A Declaration of
Conformance is included with the user information that
describes the specifications used to demonstrate conformity.
XIII0110110104
USO RESTRITO
Page 5

Contents
Safety Information ..............................v
Safety Symbols ...............................vi
Disclaimer ..................................vi
Chapter 1
General Information..........................1
The 2700 Series: an Overview........................1
APIB....................................2
GPIB....................................2
2700 Series Capabilities ...........................2
About This Manual..............................3
Other 2700 Series Documentation......................3
2700 Se ries User’s Man ual ........................4
AP Ba sic Lan guage Manual ........................4
AP Ba sic Ex ten sions Ref er ence for the 2700 Se ries ...........4
Online Help ................................4
Other Pub li ca tions.............................4
GPIB Documentation for the 2700 series .................5
Chapter 2
Installation and Setup for APIB ...................7
2700 Se ries Components ..........................7
Getting Up and Run ning ...........................8
In stalling AP2700 on a PC..........................8
PC Sys tem Re quire ments.........................8
In stalling the Soft ware...........................9
Set ting Up the Hard ware...........................9
Con necting your 2700 Series Instrument
to the Elec tri cal Mains Sup ply .......................9
Checking the Mains Supply Voltage Configuration ..........10
Opening the Power Entry Module ...................10
Changing the Mains Supply Voltage Configuration ..........11
Getting Started with Your 2700 Series Instrument i
USO RESTRITO
Page 6

Fuse Information .............................12
Changing the Fusing Arrangement ..................12
Connecting the Instrument to Your PC ...................13
The USB-APIB adapter and cables ...................13
The APIB PCI Express card and ca ble..................14
The APIB PCI card and ca ble ......................14
The APIB PCMCIA card and ca ble....................15
APSI and the Dolby Dig i tal Gen er a tor option ..............15
Chapter 3
Hardware Overview .........................17
The SYS-2722 Front Panel.........................17
The 2700 Series Rear Panel ........................19
Chapter 4
2700 Series Control Software....................21
Overview ..................................21
The User Interface ............................21
The Workspace...............................21
The 2700 series panels...........................22
Panel Settings ..............................23
Panel Readings .............................24
The 2700 se ries menus ..........................25
The File Menu ..............................25
The Edit Menu ..............................26
The View Menu .............................27
The Panels Menu ............................28
The Status Bar.............................29
The Toolbars..............................29
The Standard Toolbar .........................29
The Panels Toolbar ..........................29
The Macro Toolbar...........................29
The Learn Mode Toolbar........................30
The Quick Launch Toolbar.......................30
Chapter 5
Quick Guides.............................33
Introduction.................................33
The Analog Signal Path ..........................34
Analog Input Selection ..........................34
Analog Generator Panel .........................34
Using the Analog Analyzer........................35
Audible Signal Monitor ..........................36
Controlling the Analog Generator ....................37
Units ...................................38
Contents
ii Getting Started with Your 2700 Series Instrument
USO RESTRITO
Page 7

Sweeps...................................39
Sweep Fundamentals ..........................40
Settings and Readings.........................40
Source Range, Steps, and Spacing ..................41
Data Display Range ..........................42
Example Sweep: Frequency Response .................42
Example Sweep: Amplitude Linearity ..................43
DSP Analysis................................45
The FFT Spectrum Analyzer ........................45
Real-Time vs. Batch-Mode Instruments .................46
The FFT Concept ............................46
Setting up an FFT ............................47
Panel Fields ..............................47
Time vs. Frequency ..........................47
Quick Sweep Setup ..........................48
Fine-Tuning the Display ........................49
Saving and Loading Tests .........................50
The Next Step ...............................50
Chapter 6
Specifications ............................51
Analog Signal Outputs ...........................51
D/A Generated Analog Signals .......................55
Analog Analyzer ..............................58
Option Filters ................................64
Option S-AES17 ..............................69
DSP Analysis of Analog Signals ......................70
Digital Signal Generator ..........................75
Digital Analyzer...............................80
Digital Interface Analyzer.........................81
Graphs of Typical Digital Domain Performance .............85
Front Panel Auxiliary Signals ........................86
Rear Panel Auxiliary Signals ........................87
Miscellaneous Digital I/O.........................88
General/Environmental ..........................89
Chapter 7
GPIB Configuration .........................91
Introduction.................................91
APIB or GPIB? ..............................92
LabVIEW pro ject files............................92
The GPIB Software Development Process .................92
Using both GPIB and APIB for Software Development .........94
Establishing GPIB Communication....................96
GPIB Connection ...........................96
Contents
Getting Started with Your 2700 Series Instrument iii
USO RESTRITO
Page 8

GPIB Address and Control Mode Switch ...............97
GPIB Status LEDs...........................98
GPIB Program Message Terminators .................98
Contents
iv Getting Started with Your 2700 Series Instrument
USO RESTRITO
Page 9

Safety Information
Do NOT ser vice or re pair this prod uct un less prop erly qual i fied. Ser vicing
should be per formed only by a qual i fied tech ni cian or an au tho rized Au dio
Pre ci sion dis trib u tor.
Do NOT de feat the safety ground con nec tion. This prod uct is de signed to
op er ate only from a 50/60 Hz AC power source (250 V rms max i mum) with
an ap proved three-con duc tor power cord and safety ground ing. Loss of the
pro tec tive ground ing con nec tion can re sult in elec tri cal shock haz ard from the
ac ces si ble con duc tive sur faces of this prod uct.
For con tin ued fire haz ard pro tec tion, fuses should be re placed ONLY with
the ex act value and type in di cated on the rear panel of the in stru ment and dis cussed on page 13 of this man ual. The AC volt age se lec tor also must be set to
the same volt age as the nom i nal power source volt age (100, 120, 230, or
240 V rms) with the ap pro pri ate fuses. Dif fer ent fuses are re quired de pend ing
on the line volt age.
The In ter na tional Electrotechnical Com mis sion (IEC 1010-1) re quires that
mea sur ing cir cuit ter mi nals used for volt age or cur rent mea sure ment be
marked to in di cate their Mea sure ment Cat e gory. The Mea sure ment Cat e gory is
de fined by IEC 664 and is based on the am pli tude of tran sient or im pulse volt age that can be ex pected. This prod uct is clas si fied as Mea sure ment
Category I, ab bre vi ated “CAT I” on the in stru ment front panel. This equip ment
is rated for a max i mum in put of 230 Vpk, 160 Vrms and is in tended to be used
for the mea sure ment of au dio sig nals only. Do NOT use this prod uct for mea sure ments within Cat e go ries II, III, or IV.
Do NOT sub sti tute parts or make any mod i fi ca tions with out the writ ten ap proval of Au dio Pre ci sion. Doing so may cre ate safety haz ards.
This prod uct is for in door use—In stal la tion Cat e gory II, Mea sure ment Cat e gory
I, pol lu tion de gree 2.
Getting Started with Your 2700 Series Instrument v
USO RESTRITO
Page 10
Safety Symbols
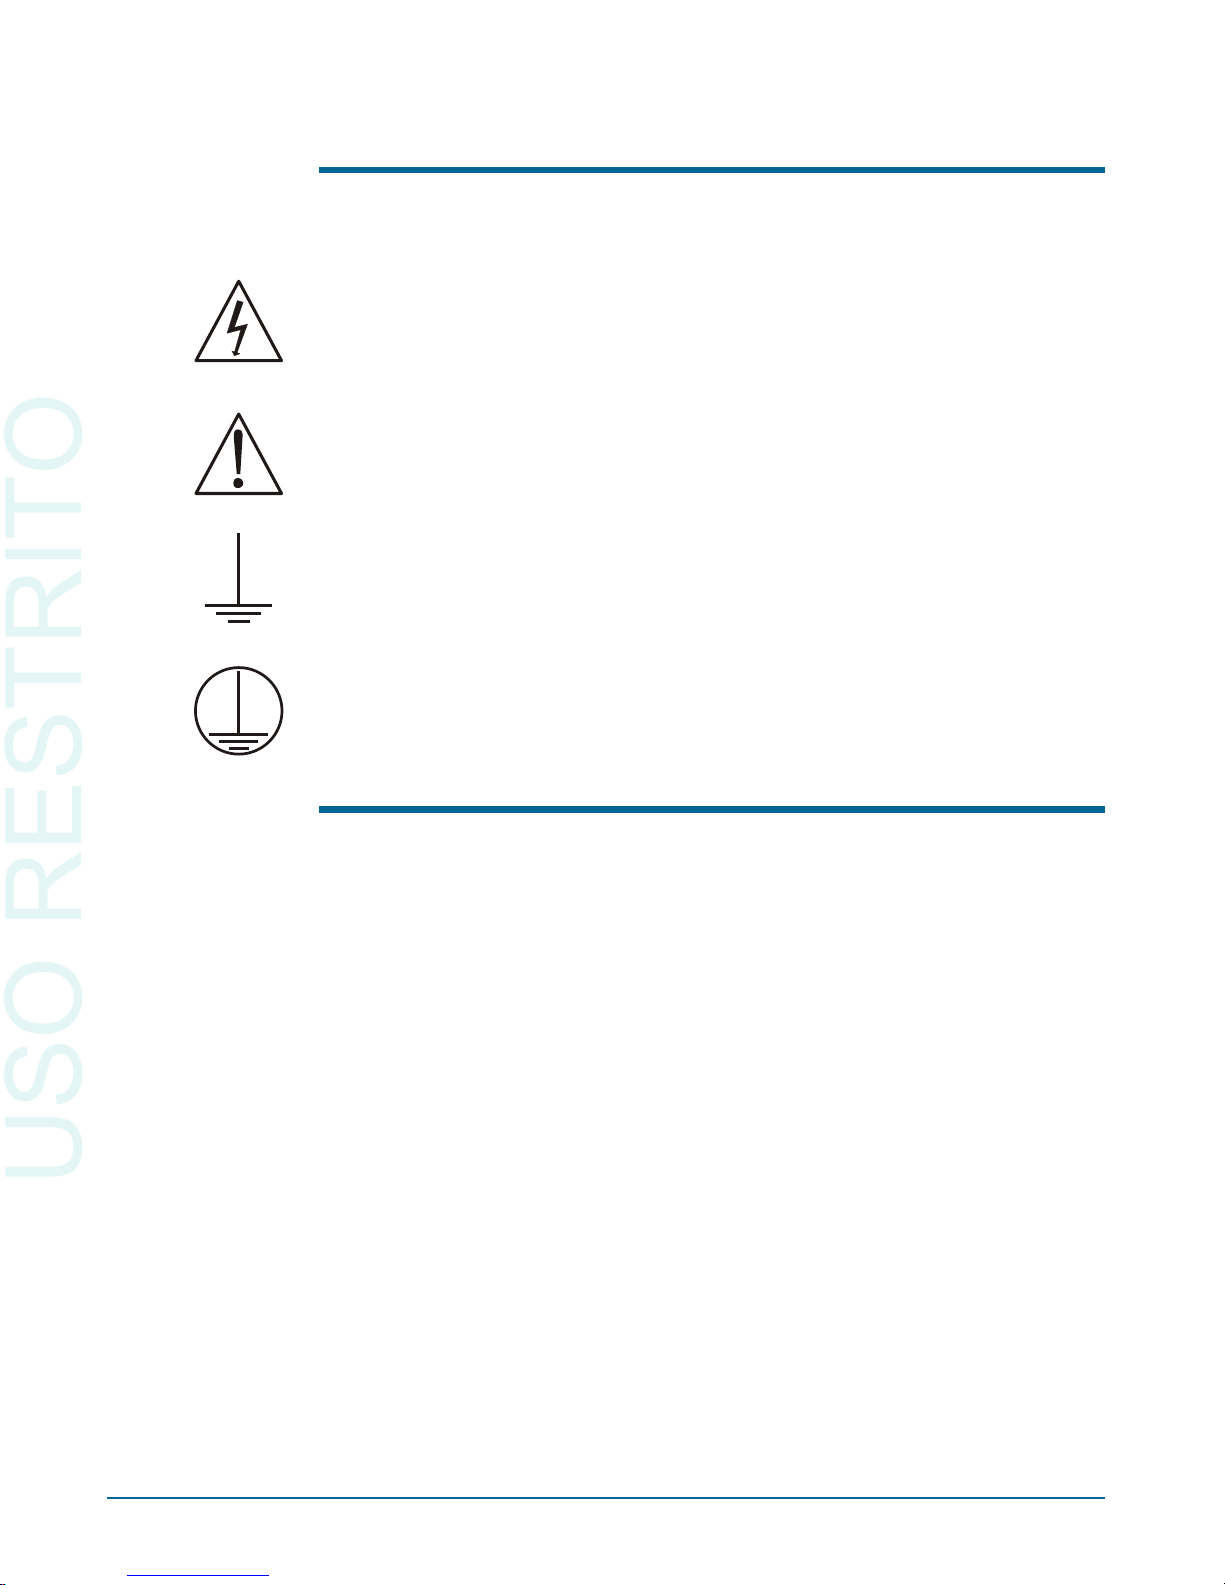
The fol low ing sym bols may be marked on the pan els or cov ers of equip -
ment or mod ules, and are used in this man ual:
WARNING!—This sym bol alerts you to a po ten tially haz ard ous con di tion,
such as the pres ence of dan ger ous volt age that could pose a risk of elec tri cal
shock. Re fer to the ac com pa ny ing Warn ing La bel or Tag, and ex er cise ex treme
cau tion.
ATTENTION!—This sym bol alerts you to im por tant op er at ing con sid er ations or a po ten tial op er at ing con di tion that could dam age equip ment. If you
see this marked on equip ment, re fer to the Op er a tor’s Man ual or User’s Man ual for pre cau tion ary in struc tions.
FUNCTIONAL EARTH TERMINAL—A ter mi nal marked with this sym bol is elec tri cally con nected to a ref er ence point of a mea sur ing cir cuit or out put and is in tended to be earthed for any func tional pur pose other than safety.
PROTECTIVE EARTH TERMINAL—A ter mi nal marked with this sym bol
is bonded to con duc tive parts of the in stru ment and is in tended to be con nected to an ex ter nal pro tec tive earthing sys tem.
Disclaimer
Au dio Pre ci sion cau tions against us ing their prod ucts in a man ner not spec i fied by the man u fac turer. To do oth er wise may void any war ran ties, dam age
equip ment, or pose a safety risk to per son nel.
vi Getting Started with Your 2700 Series Instrument
USO RESTRITO
Page 11
Chapter 1
General Information
The 2700 Series: an Overview
Au dio Pre ci sion 2700 se ries in stru ments are com puter-controlled au dio test
sets of fer ing broad, high-performance ca pa bil i ties for test ing an a log, dig i tal,
and mixed-domain de vices. The 2700 se ries in stru ments are based on mod els
in the Au dio Pre ci sion Sys tem Two Cas cade and Cas cade Plus lines. A 2700
se ries in stru ment con sists of two key com po nents:
§
The 2700 se ries in stru ment hard ware, which pro vides the phys i cal plat form and mea sure ment elec tron ics nec es sary for proper sig nal in ter face
and pre cise sig nal gen er a tion and anal y sis. The hard ware is mounted in a
sturdy alu mi num and steel chas sis that can be in stalled in a stan dard
19"
wide equip ment rack us ing op tional mount ing hard ware.
§
The 2700 se ries con trol soft ware, AP2700. AP2700 runs on a per sonal
com puter (PC) and pro vides the con trol, com pu ta tion, dis play, re port and
au to ma tion func tions for a 2700 se ries in stru ment. (The PC must be pur chased sep a rately). The AP2700 con trol soft ware will run un der
Microsoft Win dows XP and Win dows Vista op er at ing sys tems.
Getting Started with Your 2700 Series Instrument 1
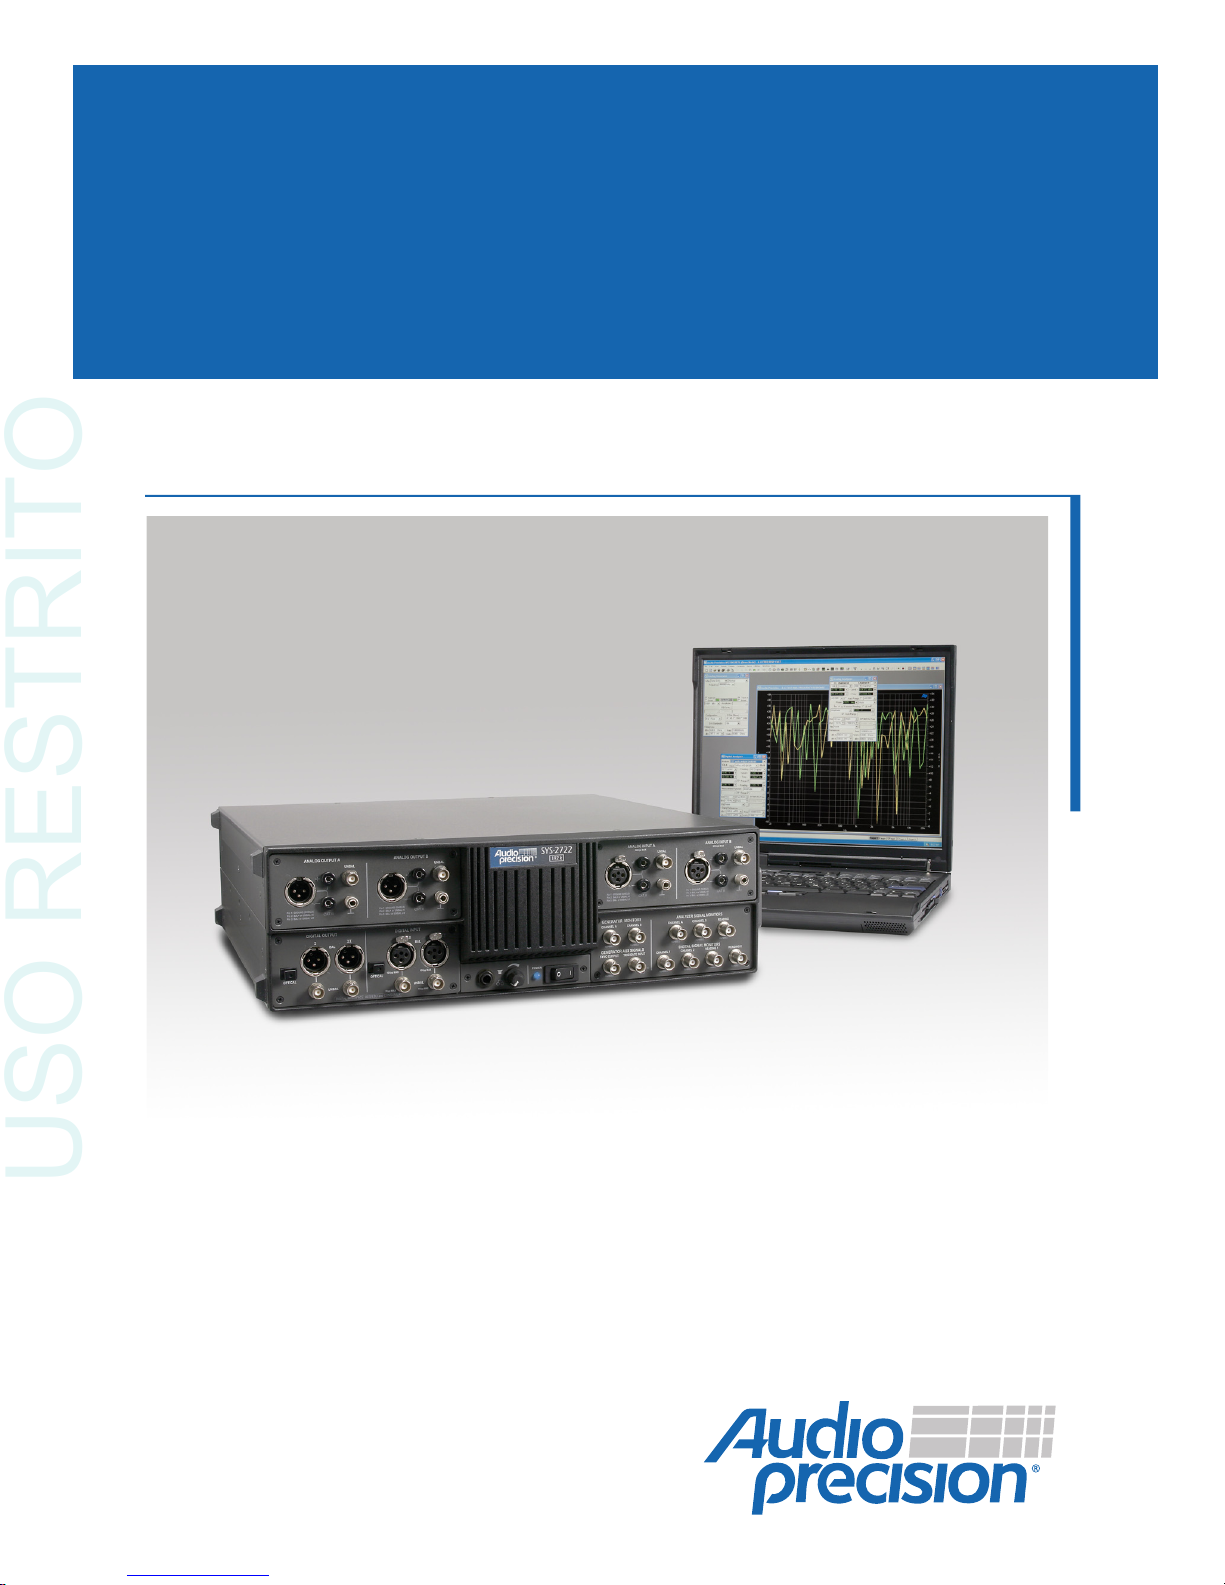
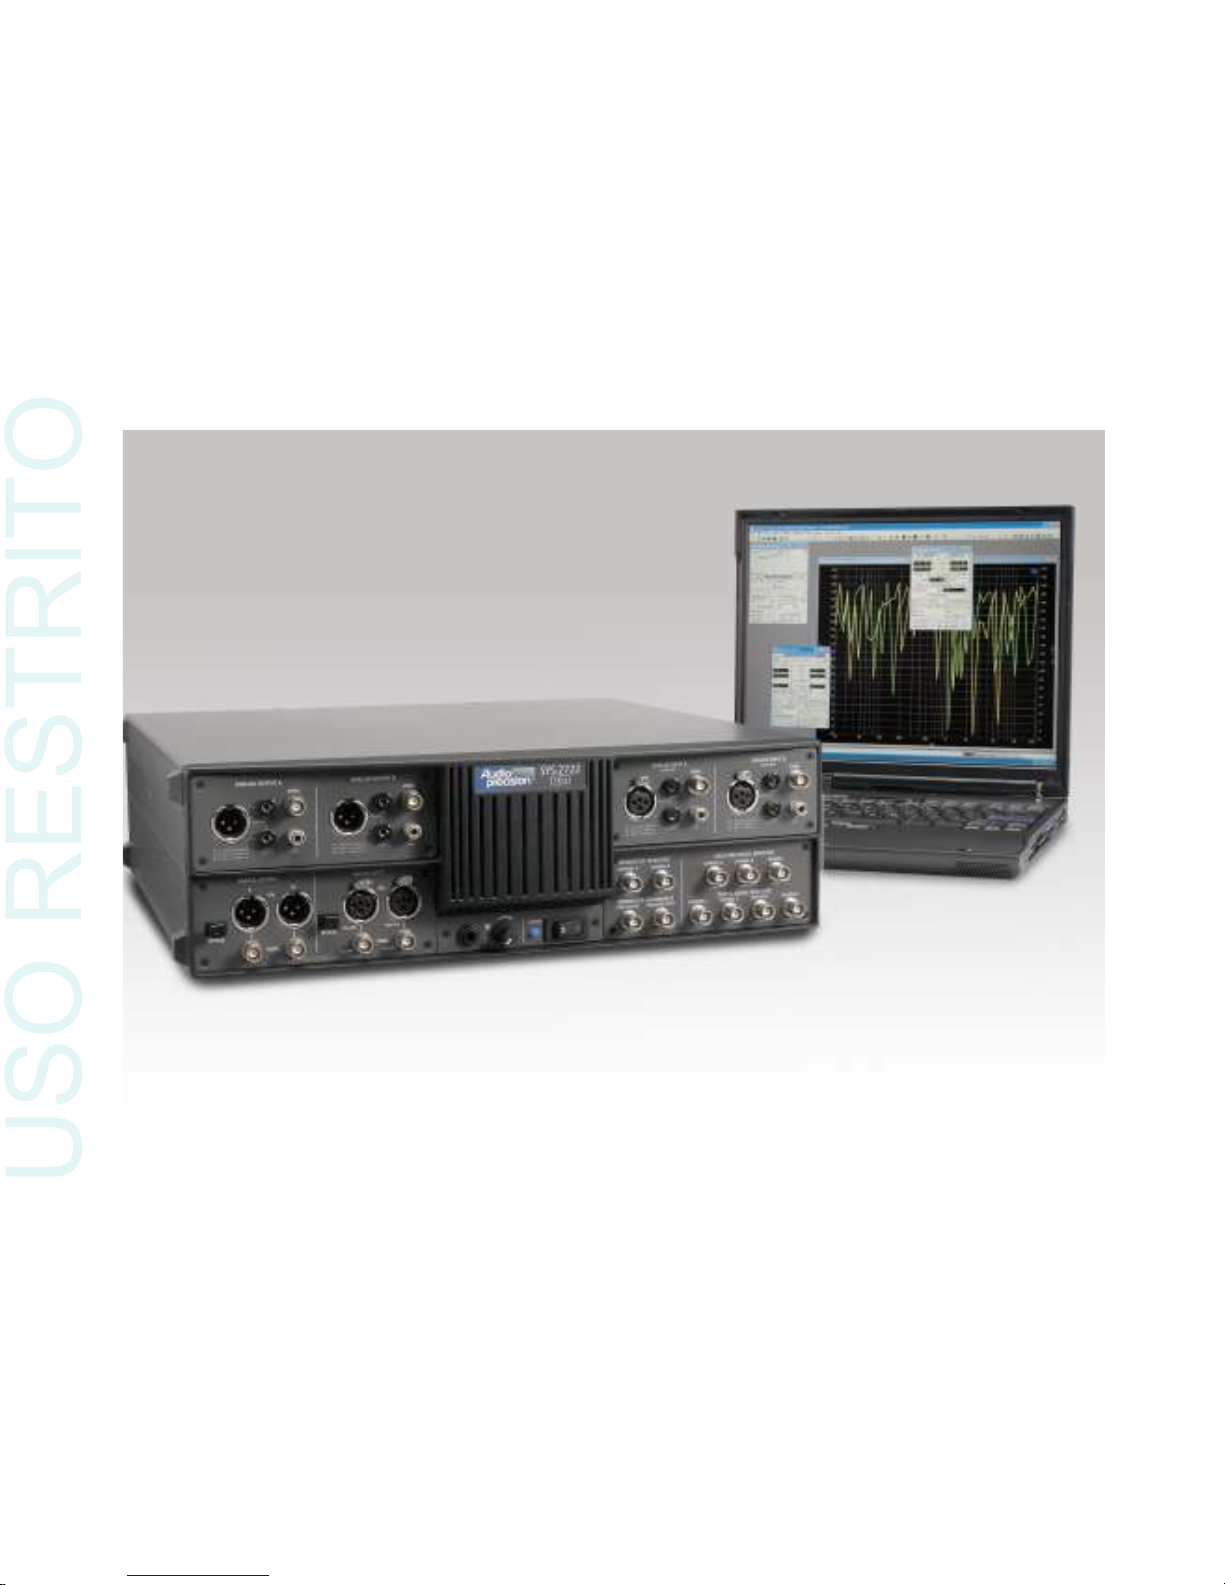
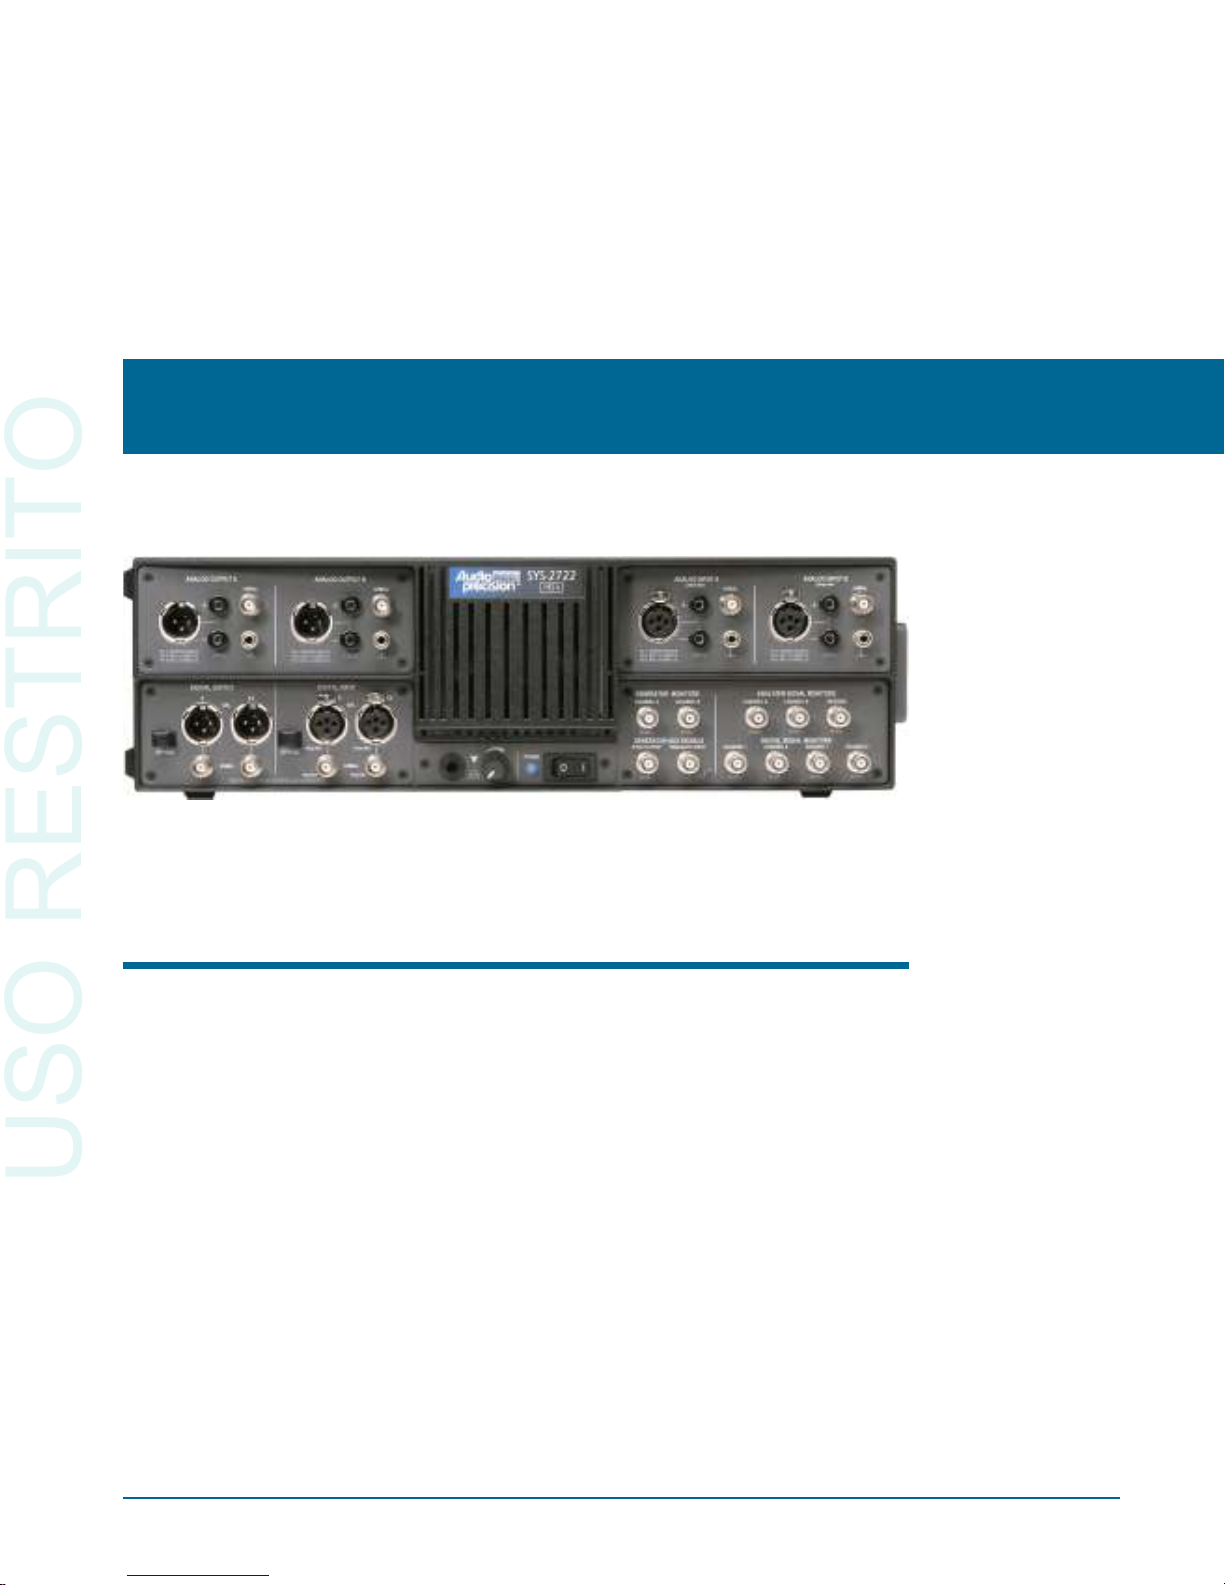
Figure 1. The Audio Precision 2700 series audio test and measurement instrument;
SYS-2722 shown.
USO RESTRITO
Page 12

With the ex cep tion of the mains power switch and the mon i tor speaker vol ume con trol, there are no knobs, di als, con trols, read outs, me ters or switches
on 2700 se ries in stru ment hard ware. All of the mea sure ment set tings and ad just ments are made in soft ware on the PC.
APIB
The AP2700 con trol soft ware on the PC com mu ni cates with the 2700 hard ware in one of two ways:
§
USB-APIB
In tro duced with the re lease of AP2700 ver sion 3.3, the USB-APIB
adapter pro vides a con ve nient USB in ter face to the in stru ment. USB op er a tion is not sup ported by ear lier ver sions of AP2700.
§
APIB
APIB (Au dio Pre ci sion In ter face Bus) is a pro pri etary bus in ter con nec tion that re quires a ded i cated APIB ca ble and PC-mounted APIB in ter face card or adapter. APIB in ter faces are avail able as PCI, PCI Ex press
or PCMCIA-com pat i ble de vices.
The USB-APIB adapter or APIB in ter face are spec i fied at the time your
sys tem is or dered. An in ter face adapter kit can also be or dered separately.
GPIB
When or dered with the op tional GPIB con fig u ra tion (SYS-27xx-G), a 2700
se ries in stru ment can also be con trolled by the in dus try-stan dard IEEE 488.2
Gen eral Pur pose In ter face Bus (GPIB). A LabVIEW pro ject in stru ment driver
is also avail able for use with GPIB. See Chap ter 7 for more in for ma tion about
the 2700 se ries GPIB con fig u ra tion.
2700 Series Capabilities
The fully-equipped 2700 se ries in stru ment, model SYS-2722, is a dual do main in stru ment; it can per form anal y sis in both the an a log do main and the
dig i tal do main si mul ta neously. The func tional com po nents im ple mented in
SYS-2722 in clude an an a log sig nal gen er a tor, a dig i tal sig nal gen er a tor, an an a log an a lyzer, a dig i tal an a lyzer, and dig i tal in put and out put and syn chro ni za tion ca pa bil i ties. “Cross-do main” test ing (for ex am ple, providing an in put in
one do main to a con verter such as an ADC or a DAC, and mea sur ing the out put in the sec ond do main) is straightforward, and can be per formed us ing op ti mal tech niques and com po nents for each domain.
The an a log gen er a tor and an a lyzer have a num ber of hard ware op tions that
can be added to en hance the in stru ment’s ca pa bil ity, in clud ing plug-in fil ters,
Chapter 1: General Information 2700 Series Capabilities
2 Getting Started with Your 2700 Series Instrument
USO RESTRITO
Page 13

noise and tone burst gen er a tor op tions and ded i cated intermodulation and wow
and flut ter mea sure ment mod ules.
An a log sig nals can be gen er ated in an a log circuitry, or can be gen er ated
dig i tally and con verted into an a log signals. In the same way, an a log sig nals
can be mea sured in the an a log do main, or can be con verted to the dig i tal do main for dig i tal anal y sis.
Dig i tal sig nals are al ways gen er ated and mea sured in the dig i tal do main.
Dig i tal anal y sis is per formed by one of seven DSP anal y sis tools, in clud ing a
gen eral-pur pose au dio an a lyzer, an FFT spec trum an a lyzer and a multitone an a lyzer. A ded i cated 80 MHz ADC is con nected across the dig i tal in put, and is
avail able to dig i tize the se rial in ter face bitstream for anal y sis.
These op er a tions are all di rected by AP2700, the 2700 se ries con trol soft ware. Nearly ev ery func tion of AP2700 can be au to mated us ing the Au dio
Pre ci sion pro gram ming lan guage AP Ba sic, which is pro vided with the con trol
soft ware.
About This Manual
You’re read ing Getting Started with Your 2700 Se ries In stru ment. This man -
ual de scribes how to set up the 2700 se ries in stru ment hard ware, and the
AP2700 con trol soft ware. It also con tains a quick tu to rial to fa mil iar ize you
with the sys tem. The manual is or ga nized as fol lows:
§
Chap ter 1: In tro duc tion.
§
Chap ter 2: Soft ware in stal la tion and hard ware setup in for ma tion.
§
Chap ter 3: De scrip tion of the hard ware and its con nec tors.
§
Chap ter 4: De scrip tion of the user in ter face.
§
Chap ter 5: In tro duc tory tu to rial.
§
Chap ter 6: Spec i fi ca tions.
§
Chap ter 7: GPIB Con fig u ra tion
Other 2700 Series Documentation
Au dio Pre ci sion pub lishes a va ri ety of doc u ments, many in elec tronic form,
about hard ware and soft ware prod ucts, au dio the ory, and test and mea sure ment
tech niques. The fol low ing list de scribes the doc u ments that are in cluded as
Adobe Ac ro bat PDF files on the Re sources CD-ROM that is included with
your in stru ment. They can also be down loaded from our Web site at ap.com.
About This Manual Chapter 1: General Information
Getting Started with Your 2700 Series Instrument 3
USO RESTRITO
Page 14

2700 Se ries User’s Man ual
The 2700 Se ries User’s Man ual is the pri mary op er a tion and ref er ence man -
ual for the sys tem. Con sult the 2700 Se ries User’s Man ual for:
§
De tailed de scrip tions of ev ery 2700 se ries fea ture, soft ware panel, con trol, and dis play.
§
Ref er ence in for ma tion on au dio test and mea sure ment tech niques, sam ple and util ity file list ings, and an au dio glos sary.
AP Ba sic Lan guage Manual
You can cre ate tests and mac ros to au to mate your mea sure ments. Macros
are writ ten in the AP Ba sic pro gram ming lan guage, which is a sub set of
Microsoft® Vi sual Ba sic®. The AP Ba sic Lan guage Man ual con tains a list of
the AP Ba sic com mands, each with a full de scrip tion and ex am ple of us age.
AP Ba sic Ex ten sions Ref er ence for the 2700 Se ries
The AP Ba sic Ex ten sions Ref er ence for 2700 Se ries Instruments con tains a
list of ActiveX Au to ma tion (OLE) com mands that con trol the spe cific fea tures
of the 2700 se ries in stru ment hard ware and the AP2700 con trol soft ware.
Online Help
Much of the in for ma tion con tained in the 2700 Se ries User’s Man ual is also
avail able in the on line help sys tem in cluded in the 2700 se ries con trol soft ware. You can ac cess the help sys tem in two ways:
§
Con text-sen si tive Help.
Al most ev ery con trol and dis play on each soft ware panel has a help topic
as so ci ated with it. To view the topic, click on the field or con trol, then
press the F1 func tion key.
§
The Help menu.
On the Menu bar, click Help. The Help menu of fers com mands to search
the 2700 se ries Help files or se lect a spe cific help li brary such as AP
Ba sic Lan guage Help.
Other Pub li ca tions
Au dio Pre ci sion pub lishes ap pli ca tion notes, tech ni cal pa pers, tech notes,
and other material. These publications cover all as pects of au dio test and mea sure ment. In for ma tion about out li brary of tech ni cal pa pers and an nounce ments of new pa pers is avail able on the Au dio Pre ci sion Web site at ap.com.
Chapter 1: General Information Other 2700 Series Documentation
4 Getting Started with Your 2700 Series Instrument
USO RESTRITO
Page 15

GPIB Documentation for the 2700 series
When or dered in the op tional GPIB con fig u ra tion, a 2700 se ries in stru ment
can also be con trolled by the in dus try-stan dard Gen eral Pur pose Interface Bus
(GPIB).
Ba sic in stal la tion with GPIB is cov ered in Chap ter 7 of this man ual. For
GPIB de vel op ment and pro gram ming, or der the 2700 Se ries GPIB Pro gram -
mer’s Ref er ence Man ual, which in cludes a CD-ROM with GPIB sam ple pro gram files.
Other 2700 Series Documentation Chapter 1: General Information
Getting Started with Your 2700 Series Instrument 5
USO RESTRITO
Page 16

Chapter 1: General Information Other 2700 Series Documentation
6 Getting Started with Your 2700 Series Instrument
USO RESTRITO
Page 17

Chapter 2
Installation and Setup for APIB
2700 Se ries Components
The fol low ing items are in cluded with a stan dard, APIB-con fig ured 2700
se ries in stru ment. For a GPIB-con fig ured in stru ment, re fer to Chap ter 7.
§
The 2700 series in stru ment chas sis.
§
A mains power cord.
§
A box con tain ing the 2700 WIN-KIT in ter face kit.
The fol low ing items are con tained within the 2700 WIN-KIT:
§
This man ual, Get ting Started with Your 2700 Se ries In stru ment.
§
The 2700 Se ries User’s Man ual.
§
The AP Ba sic Ex ten sions Ref er ence for 2700 Se ries In stru ments.
§
The AP Ba sic Lan guage Man ual.
§
An Au dio Pre ci sion In ter face Bus (APIB) USB adapter or in ter face card,
as or dered.
§
An AP2700 ap pli ca tion CD-ROM con tain ing AP2700, the con trol soft ware for the 2700 se ries.
§
An Au dio Pre ci sion Re sources Disc CD-ROM, con tain ing sam ple files,
user doc u ments and other re sources.
§
A play able au dio CD AP-CD0, con tain ing au dio test sig nals.
We rec om mend that you keep the ship ping box and pack ing ma te ri als to
pro tect your in stru ment if you need to ship it in the fu ture.
Getting Started with Your 2700 Series Instrument 7
USO RESTRITO
Page 18

Getting Up and Run ning
There are three main tasks to set ting up your 2700 se ries instrument:
§
In stalling the 2700 se ries con trol soft ware (AP2700) on the PC;
§
Con fig uring your 2700 se ries in stru ment for the lo cal mains power sup ply; and
§
Con nect ing the APIB in ter face, us ing ei ther the USB-APIB adapter or
by in stall ing an APIB in ter face card in the PC.
These tasks are de scribed be low.
In stalling AP2700 on a PC
PC Sys tem Re quire ments
Your 2700 se ries in stru ment must be con nected to a Win dows-ca pa ble PC
to op er ate. The cur rent con trol soft ware is AP2700 ver sion 3.30, SP1 (Ser vice
Pack 1). SP1 has added 64-bit com pat i bil ity to AP2700.
The PC must have the fol low ing op er at ing sys tem (OS), fea tures and ca pa bil i ties:
§
for op er a tion us ing a 64-bit OS:
Win dows 7 Pro fes sional SP1 64-bit.
Win dows 7 Ul ti mate SP1 64-bit.
§
for op er a tion us ing a 32-bit OS:
Win dows 7 Pro fes sional SP1 32-bit.
Win dows 7 Ul ti mate SP1 32-bit.
Win dows Vista Busi ness SP2 32-bit.
Win dows Vista Ul ti mate SP2 32-bit.
Win dows XP Pro fes sional SP3 32-bit.
NOTE: You must have lo cal ad min is tra tor rights to in stall
AP2700 soft ware. Go to User Ac counts in the Win dows
Con trol Panel, or check with your net work ad min is tra tor.
§
You must have at least the min i mum pro ces sor type and mem ory re quired by Microsoft for the in stalled op er at ing sys tem.
§
You must have at least 300 MB of free hard disk space.
§
You must have CD-ROM drive.
§
for op er a tion us ing a 64-bit OS:
You must have a USB 2.0 port, and use the Au dio Pre ci sion USB-APIB
adapter.
Chapter 2: Installation and Setup for APIB Getting Up and Run ning
8 Getting Started with Your 2700 Series Instrument
USO RESTRITO
Page 19

§
for op er a tion us ing a 32-bit OS:
You must have a USB 2.0 port for a USB-APIB adapter, or an open PCI,
PCI Ex press or PCMCIA slot to mount the APIB in ter face.
§
You must have a color mon i tor and a video card with at least VGA ca pa bil i ties. Video res o lu tion of 1024´768 or greater is rec om mended.
You will also need sig nal in ter face ca bles to con nect your 2700 se ries in stru ment to your de vice un der test (DUT). Since there are many pos si ble con nec tion con fig u ra tions, sig nal ca bles are not pro vided with the in stru ment.
Au dio Pre ci sion of fers ca ble kits with com mon con nec tors and adapt ers for
pur chase. Con tact a sales rep re sen ta tive or visit the Au dio Pre ci sion Web site
at ap.com for more in for ma tion.
In stalling the Soft ware
To in stall the 2700 se ries control soft ware, use the fol low ing pro ce dure:
§
Close all Win dows pro grams.
§
In sert the AP2700 CD-ROM into the CD-ROM drive. The Win dows
Autorun fea ture should start the in stal la tion pro gram au to mat i cally. If it
does not, click on the Start menu and choose Run. Click Browse and
choose the file Setup.exe on the AP2700 CD-ROM. Click OK in the
Run di a log box.
§
Fol low the in staller on-screen in struc tions.
In stalling AP2700 on a PC Chapter 2: Installation and Setup for APIB
Getting Started with Your 2700 Series Instrument 9
USO RESTRITO
Page 20
Set ting Up the Hard ware
Con necting your 2700 Series Instrument
to the Elec tri cal Mains Sup ply
The 2700 se ries instrument must be con nected to a 50–60 Hz al ter nat ing
cur rent (ac) elec tri cal mains sup ply, max i mum volt age 250 Vrms.
The in stru ment has been con fig ured at the fac tory for the ex pected volt age
at its in tended des ti na tion, as ordered. The volt age set ting and fus ing ar range ment will nor mally be cor rect un less the in stru ment has been trans ported into
an other area. The power en try mod ule has a strip of in di ca tor tape show ing its
mains volt age set ting. This tape must be re moved be fore use.
You MUST be sure that the 2700 series instrument mains
power configuration is correct for the electrical mains power
supplied in your area. If you are not sure, do not plug the
instrument into the mains power. Follow the instructions
below to check or change the instrument mains supply
voltage selection.
The mains power sup ply is ap plied to your 2700 se ries instrument through
the power en try mod ule lo cated on the rear panel. Be fore con nect ing the
power cord, con firm that the in put volt age se lec tion and fus ing ar range ment in
the power en try mod ule are cor rect for your mains power sup ply.
Chapter 2: Installation and Setup for APIB Set ting Up the Hard ware
10 Getting Started with Your 2700 Series Instrument
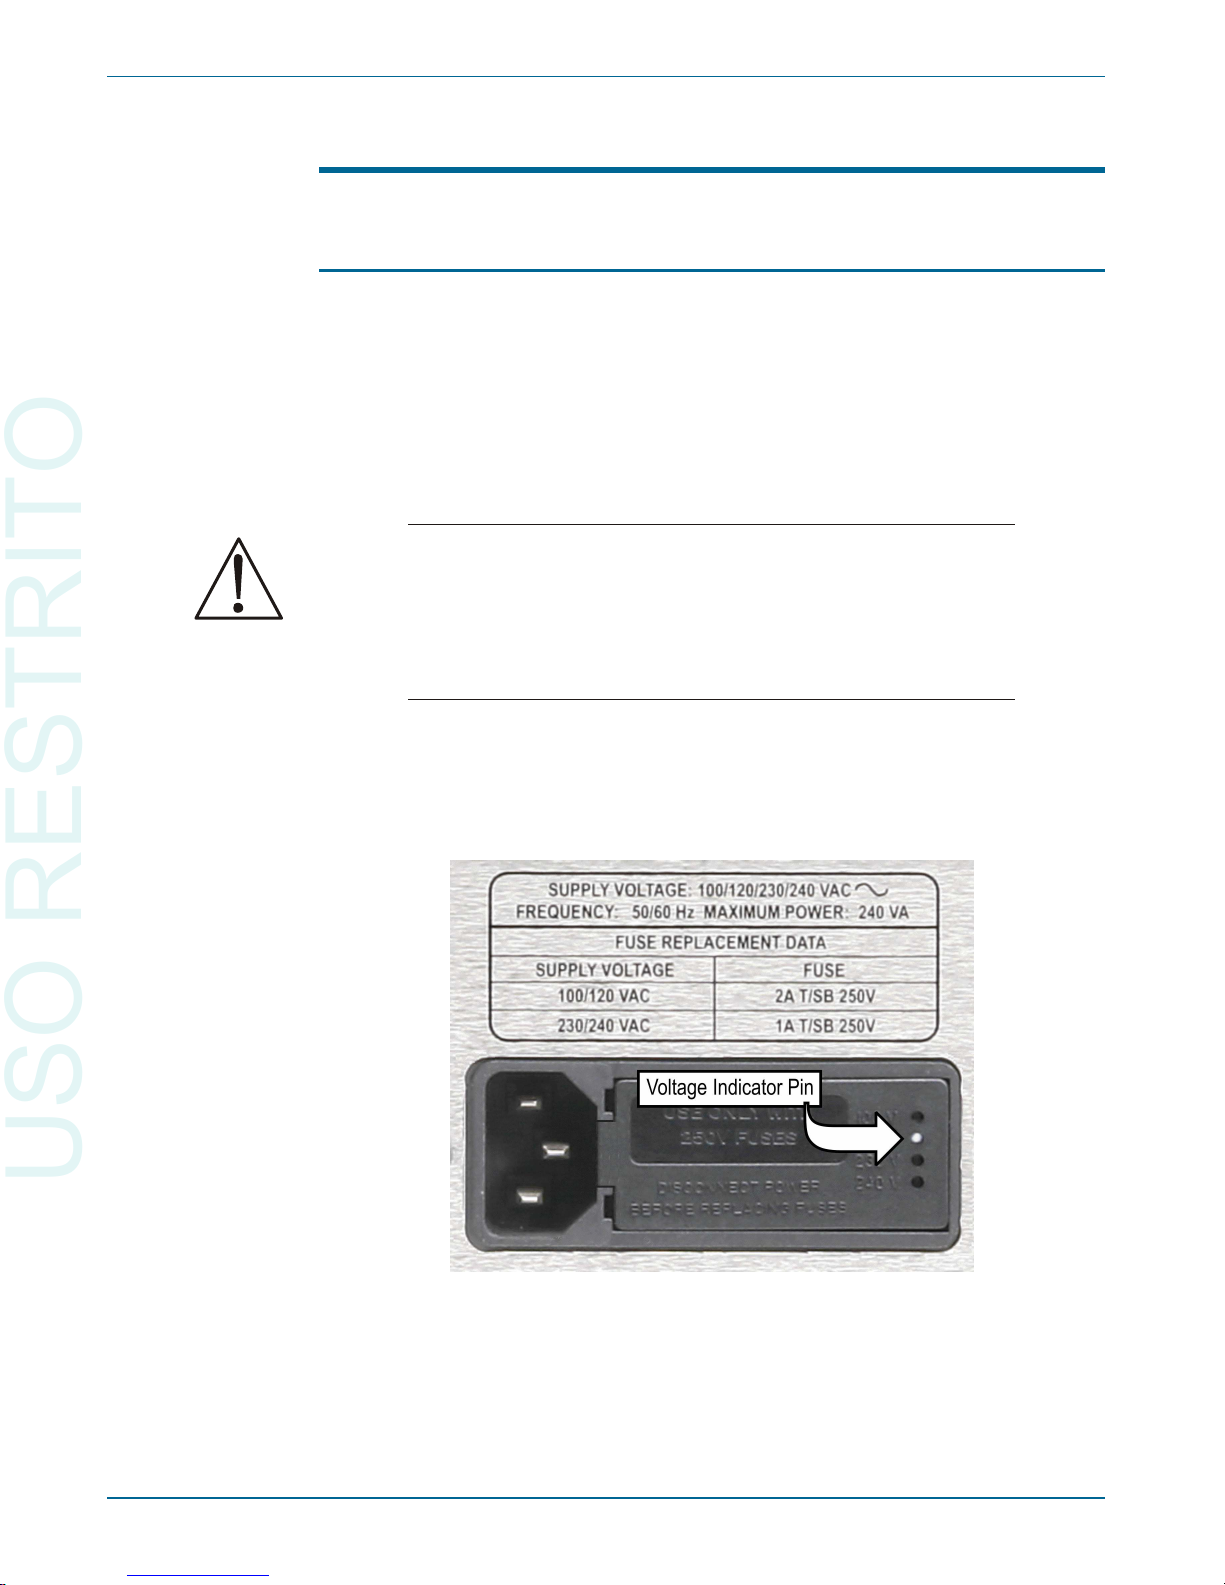
Figure 2. Detail, power entry module on 2700 series instrument rear panel.
USO RESTRITO
Page 21
Checking the Mains Supply Voltage Configuration
The volt age in di ca tor pin pro trudes through one of the four la beled holes in
the mod ule cover to in di cate the se lected in put volt age, as shown in Fig ure 2.
Check that the in di cated volt age matches your mains sup ply volt age.
Opening the Po wer Entry Module
Un plug the power cord from the in stru ment be fore chang ing fuses or per form ing any other op er a tions de scribed in this sec tion.
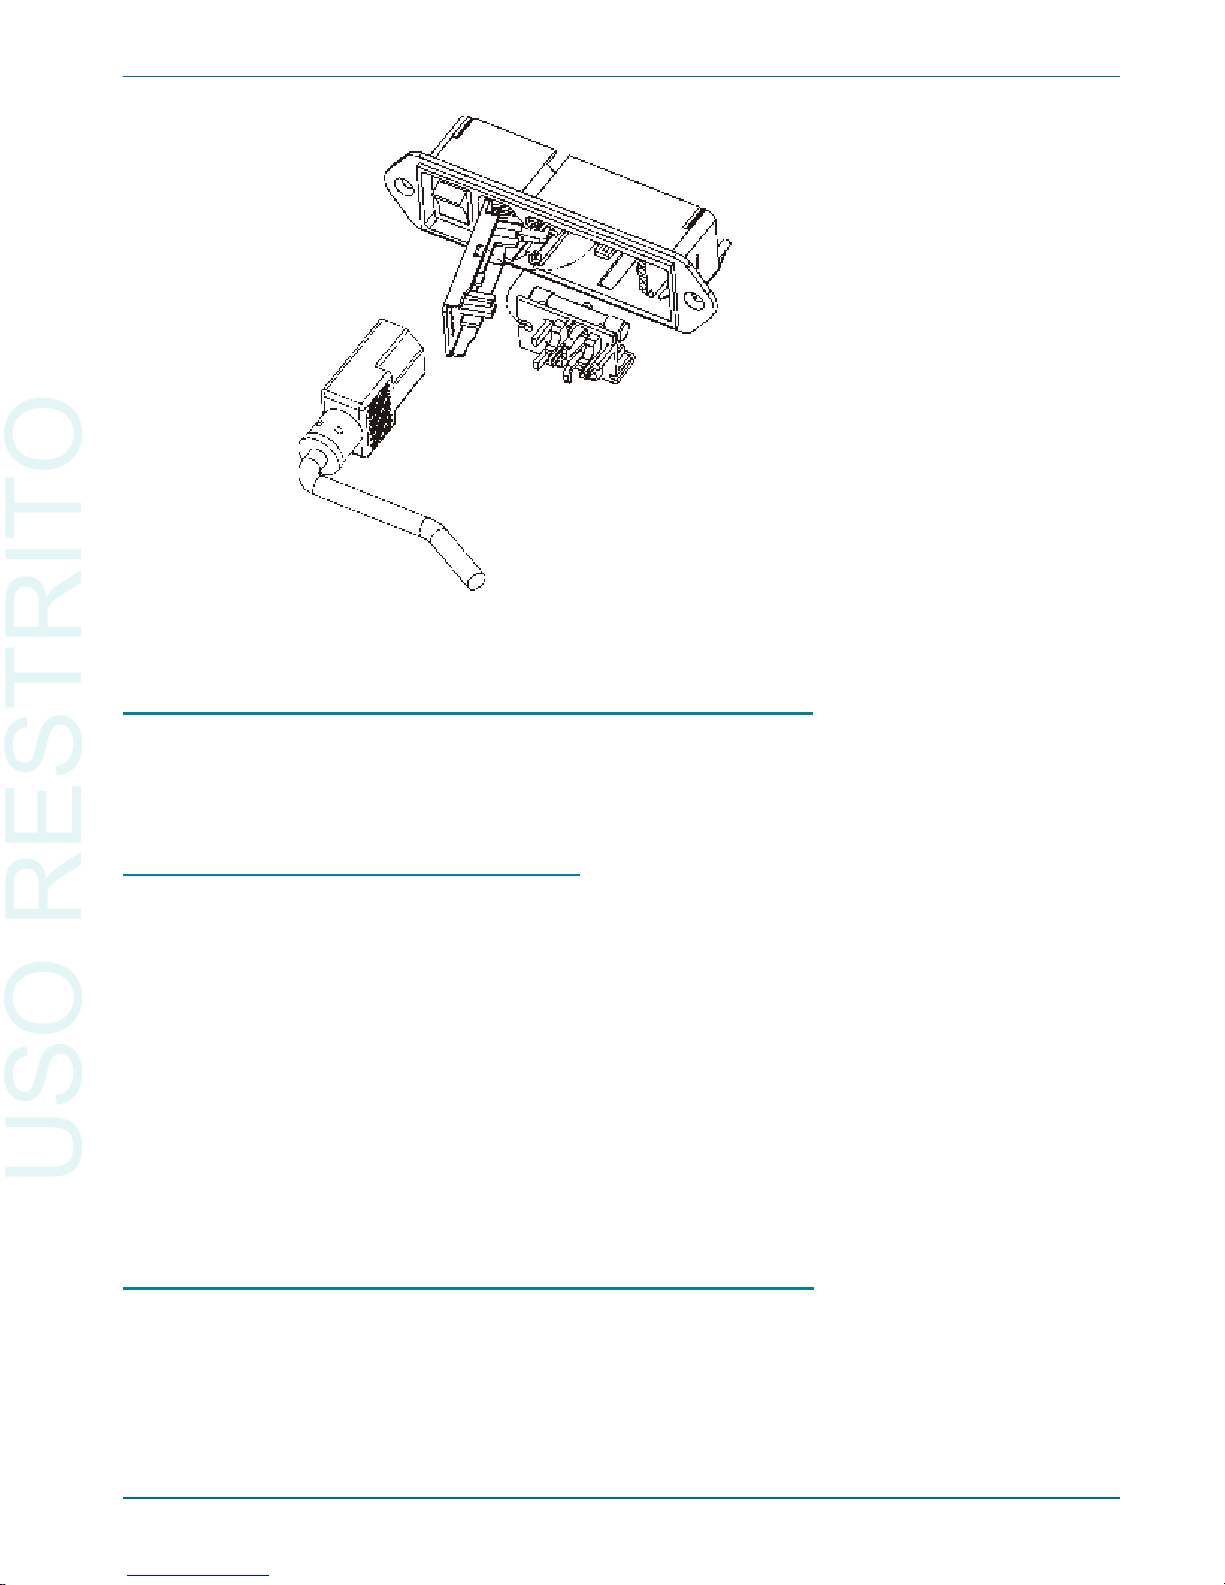
To open the Power En try Mod ule, re fer to Fig ure 3 and pro ceed as fol lows:
§
Re move the mains power sup ply cord from the power cord con nec tor.
§
Lo cate the slot in the mod ule cover door hinge. The hinge is a the left
side of the cover door, and the slot in the hinge is vis i ble in the power
cord con nec tor cav ity. In sert a small screw driver or sim i lar tool in the
slot and pry the cover door hinge out ward. The cover door will snap out,
and then can be piv oted on its hinge for ac cess to the fuse block as sem bly and volt age se lec tor card.
Changing the Mains Supply Voltage Configuration
§
Open the Power En try Mod ule as de scribed above.
§
The volt age se lec tor card is a small cir cuit board fit ted with a white plas tic in di ca tor pin, in stalled in a hous ing on the right side of the Power En try Mod ule as shown in Fig ure 4. Pull the volt age se lec tor card straight
Set ting Up the Hard ware Chapter 2: Installation and Setup for APIB
Getting Started with Your 2700 Series Instrument 11
Figure 3. Power entry module door and fuse block.
USO RESTRITO
Page 22
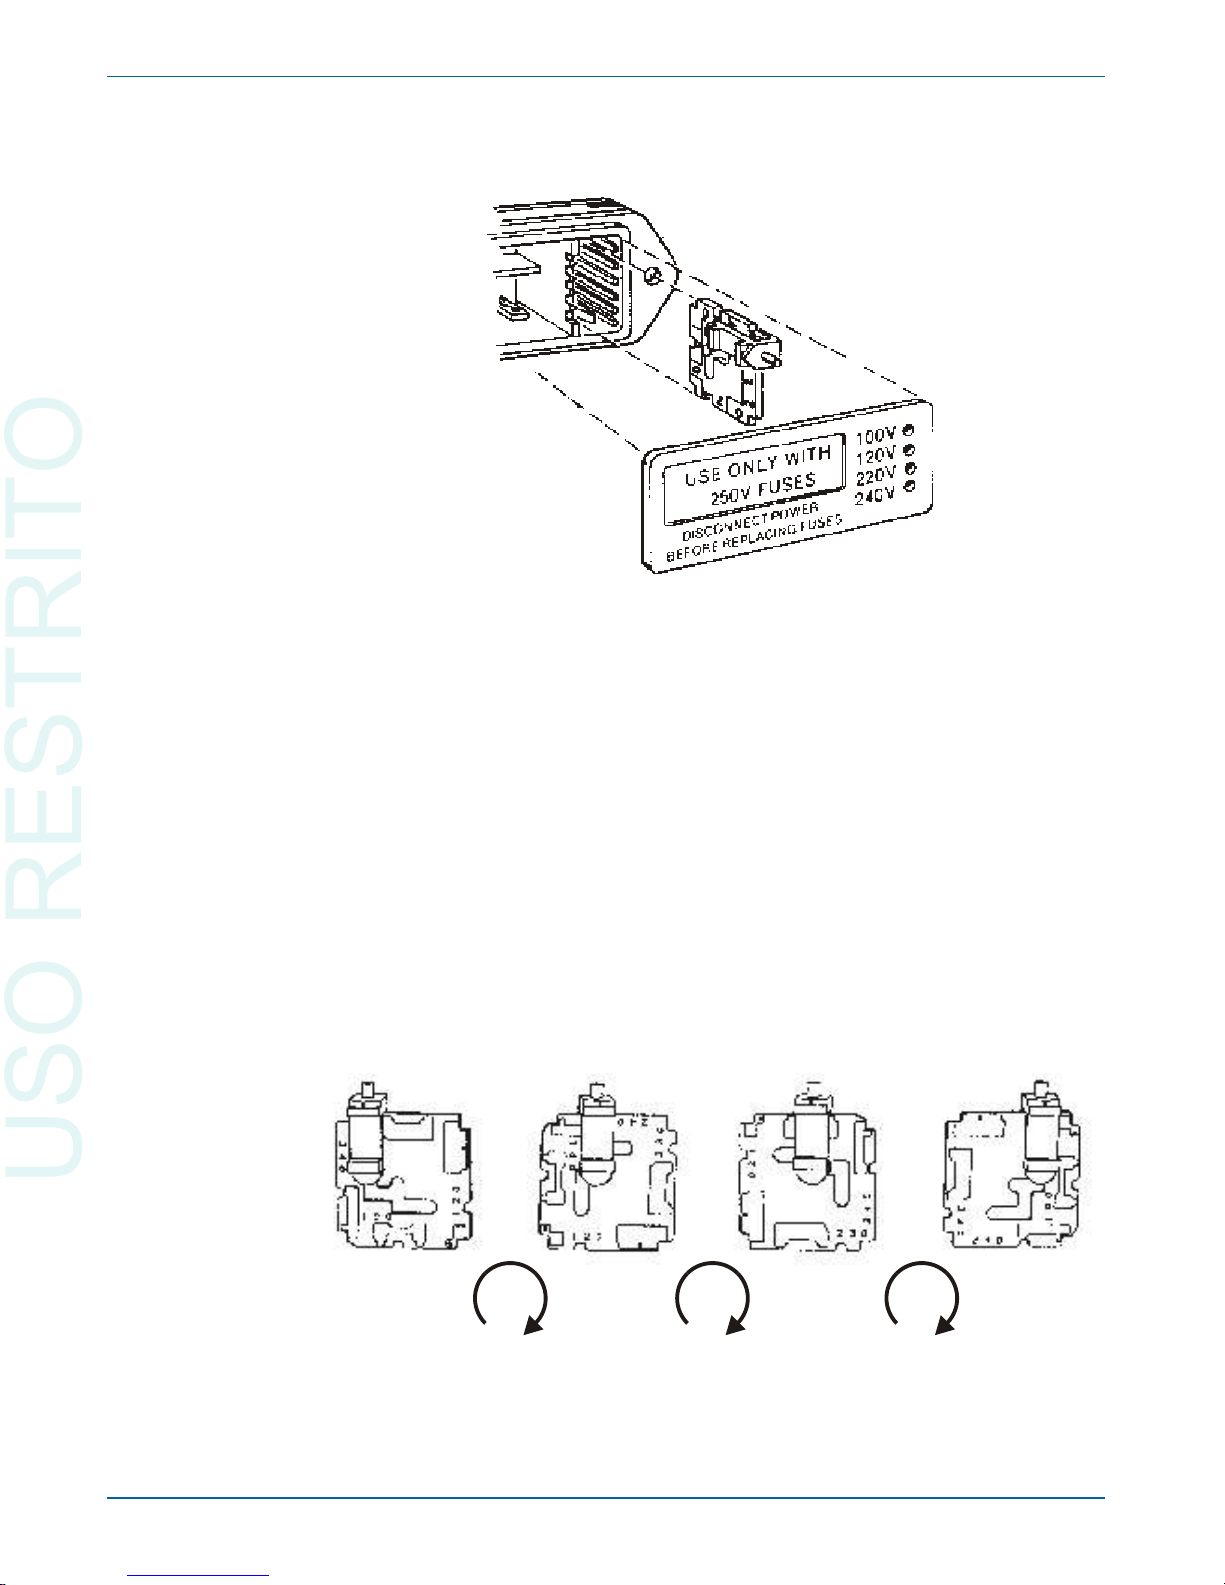
out of the hous ing, us ing nar row pli ers to grab the card. Do not use the
in di ca tor pin as a han dle.
§
Ori ent the se lec tor card so that the de sired in put vo lt age is read able at the
bot tom, shown in Fig ure 5. Then move the in di ca tor pin to point UP, op po site the in di cated volt age. Seat the pin as sem bly in the notch on the
board edge.
§
In sert the volt age se lec tor card into the hous ing with the printed side of
the card fac ing to ward the mains power con nec tor. The card edge in di cat ing the de sired volt age should en ter the hous ing first.
§
Con firm that the cor rect fuse or fuse com bi na tion is in stalled for the in tended in put volt age (re fer to the fuse rat ings marked on the in stru ment
rear panel). If nec es sary, change the fuse type as de scribed in the fol low ing sec tion.
§
Close the mod ule the cover door and ver ify that the in di ca tor pin shows
the de sired volt age.
Chapter 2: Installation and Setup for APIB Set ting Up the Hard ware
12 Getting Started with Your 2700 Series Instrument
Figure 4. Changing the mains power supply voltage.
100V 120V 230V 240V
90° 90° 90°
Figure 5. Voltage card selector orientation.
USO RESTRITO
Page 23
Once you have ver i fied that the line volt age se lec tion is cor rect, con nect the
power cord from a mains power out let to the power cord con nec tor on the in stru ment rear panel.
Fuse Information
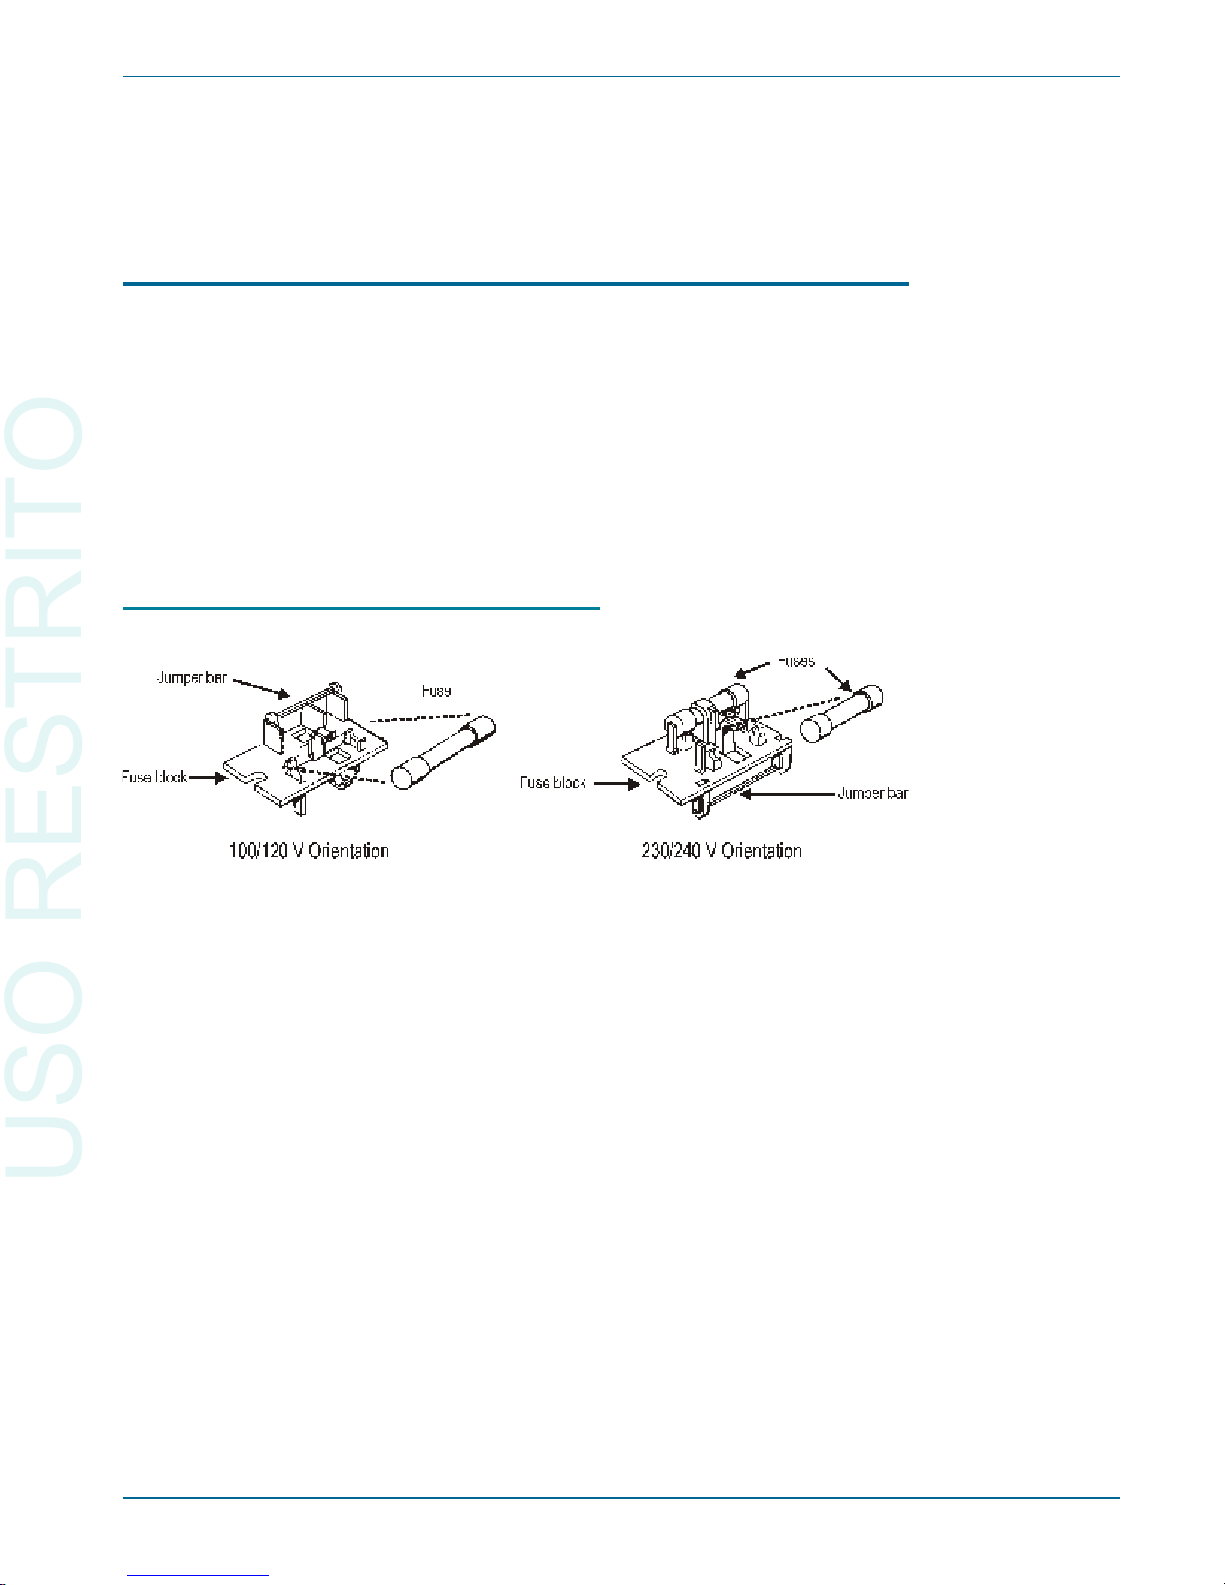
The power en try mod ule ac com mo dates two fus ing ar range ments, as il lus trated in Fig ure .
§
The North Amer i can fus ing ar range ment uses a sin gle type 3AG
(0.25" ´ 1.25") SB (slow blow) fuse.
§
The Eu ro pean fus ing ar range ment uses two 5´20 mm IEC-ap proved
type T fuses.
Re fer to the la bel on the rear panel for fuse cur rent rat ings.
Changing the Fusing Arrangement
To re place a fuse or change the fus ing ar range ment, pro ceed as fol lows:
§
Re move the mains power cord from the power cord con nec tor and open
the Power En try Mod ule as de scribed above.
§
Using nar row pli ers, pull the fuse as sem bly out of the hous ing.
§
Change or add the cor rect fuses as nec es sary, re fer ring to Fig ure 6. Re fer
to the in stru ment rear panel for the cor rect fuse elec tri cal cur rent rat ing.
§
In sert the fuse as sem bly in the hous ing, with the side of the as sem bly
that car ries the fuse(s) for your de sired fus ing ar range ment fac ing into
the hous ing. Press the fuse as sem bly firmly into the hous ing.
§
Con firm that the line volt age se lec tion is cor rect for your mains volt age
and your fus ing ar range ment.
Once you have ver i fied that the line volt age se lec tion is cor rect, con nect the
power cord from a mains power out let to the power cord con nec tor on the in stru ment rear panel.
Set ting Up the Hard ware Chapter 2: Installation and Setup for APIB
Getting Started with Your 2700 Series Instrument 13
Figure 6. Fuse Block Orientation for North American (100/120 V) and European (230/
240 V) operation..
USO RESTRITO
Page 24
Connecting the Instrument to Your PC
The AP2700 con trol soft ware com mu ni cates with the 2700 se ries
instrument through the Au dio Pre ci sion In ter face Bus (APIB). You will have
re ceived one of the fol low ing in ter face adapter op tions with your in stru ment,
as or dered. The in struc tions be low as sume you have al ready in stalled the
AP2700 soft ware on your PC or lap top.
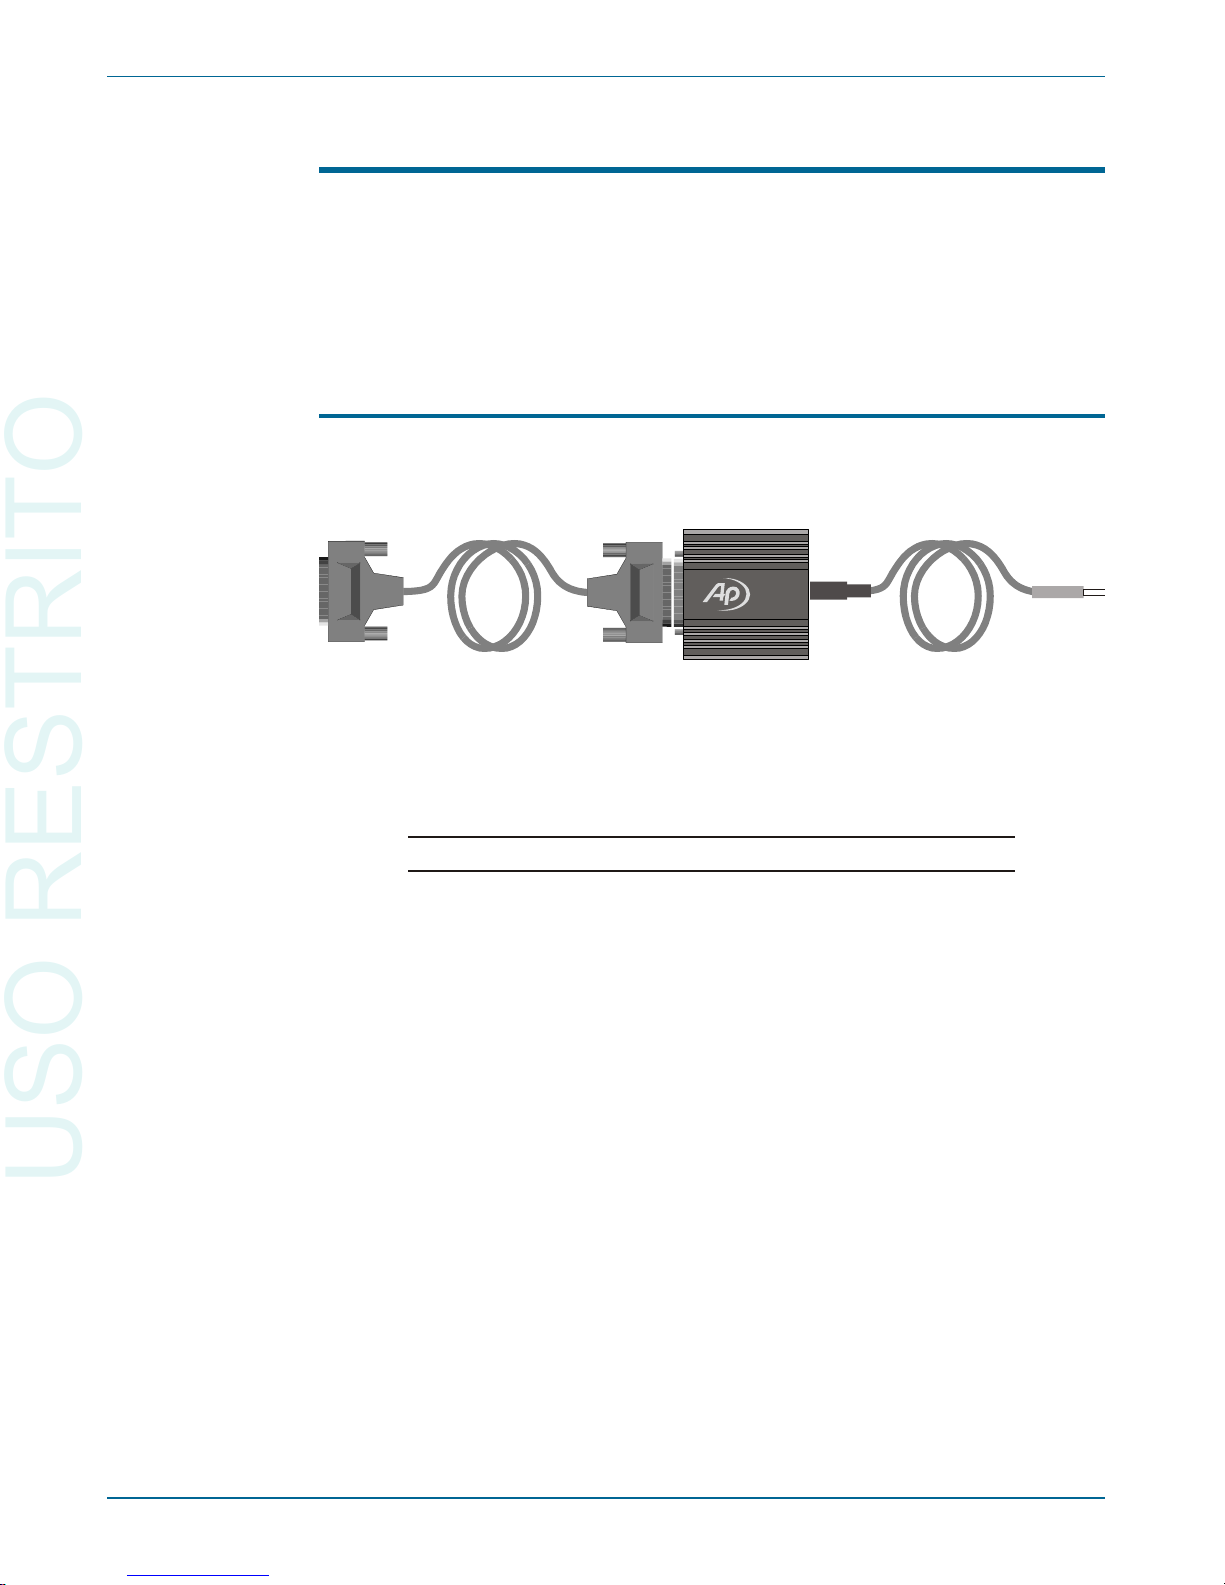
The USB-APIB adapter and cables
Con nect the USB ca ble from a USB 2.0 port on your PC or lap top to the
USB jack on the adapter. Con nect the APIB ca ble from the adapter to your in stru ment. Turn on the in stru ment and the PC and launch AP2700.
For best per for mance, we rec om mend that you con nect the USB-APIB
adapter di rectly to the PC USB 2.0 port, and that you do not use a USB hub
for this con nec tion.
USB 1.0 or 1.1 ports or hubs can not be used.
Chapter 2: Installation and Setup for APIB Connecting the Instrument to Your PC
14 Getting Started with Your 2700 Series Instrument
USB
Figure 7. USB-APIB adapter and cables.
USO RESTRITO
Page 25
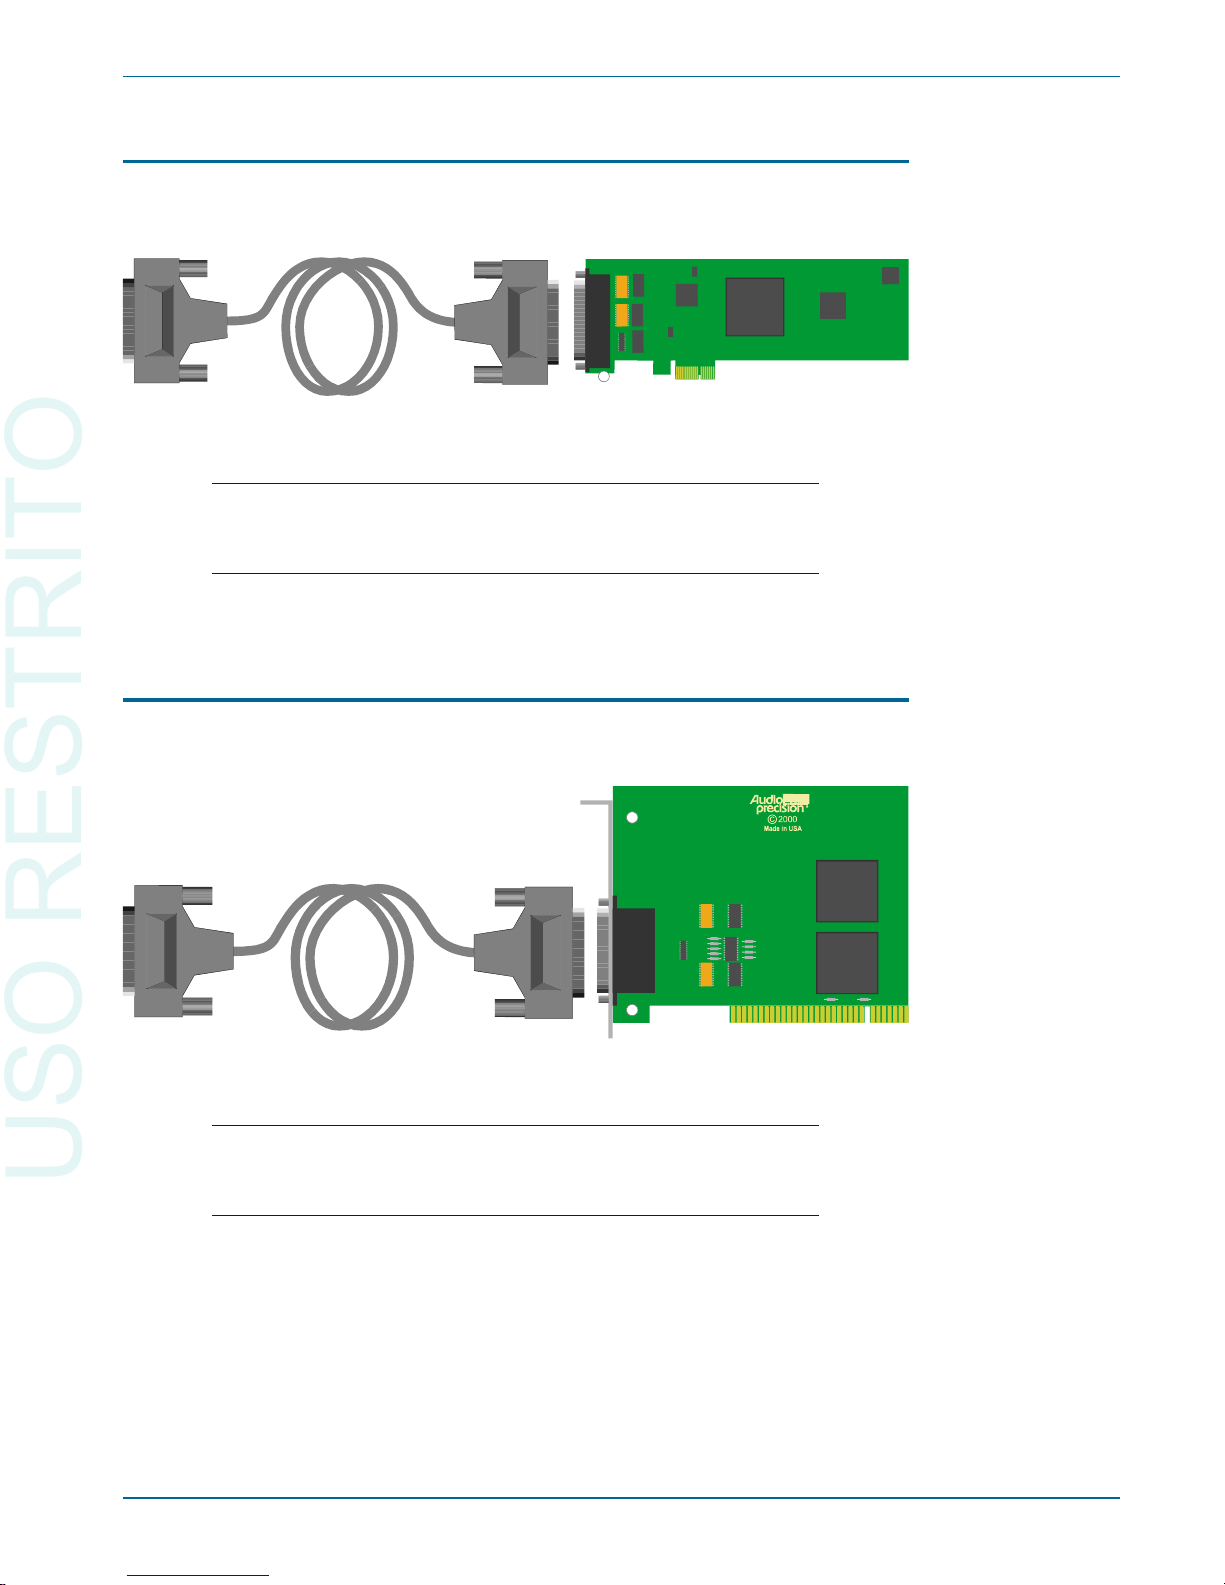
The APIB PCI Express card and ca ble
Turn off your PC and mount the PCI Ex press card in an open PCI Ex press
slot. Con nect the PCI Ex press card to the in stru ment us ing an APIB ca ble.
Note that PCI Ex press cards will not mount in stan dard PCI
slots, and that you may dam age the card and your PC by
forc ing an in ter face card into the wrong slot.
Turn on the PC and the in stru ment, and launch AP2700.
The APIB PCI card and ca ble
Turn off your PC and mount the PCI card in an open PCI slot. Con nect the
PCI card to the in stru ment us ing an APIB ca ble.
Note that standard PCI cards will not mount in the newer PCI
Express slots, and that you may dam age the card and your
PC by forc ing an in ter face card into the wrong slot.
Turn on the PC and the in stru ment, and launch AP2700.
Connecting the Instrument to Your PC Chapter 2: Installation and Setup for APIB
Getting Started with Your 2700 Series Instrument 15
Figure 8. PCI card and cable.
Figure 9. PCI Express card and cable.
USO RESTRITO
Page 26
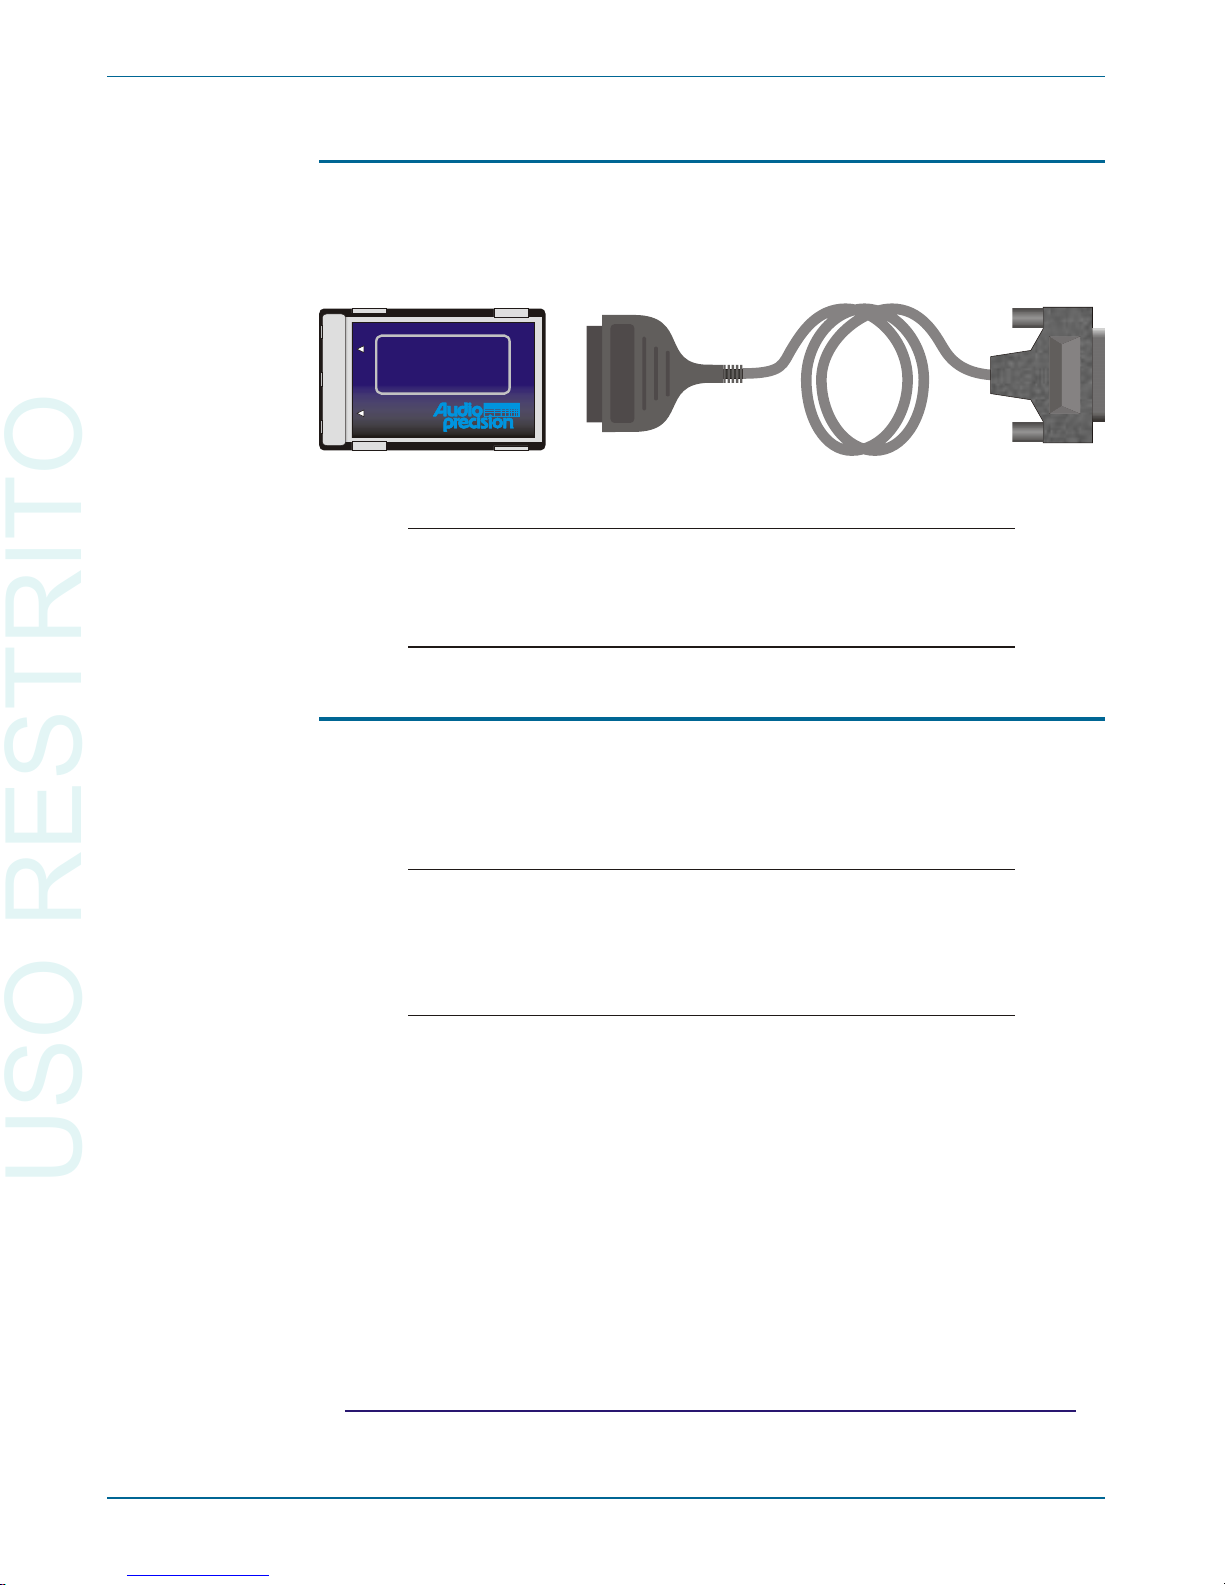
The APIB PCMCIA card and ca ble
Con nect the small con nec tor on the PCMCIA APIB ca ble to the match ing
con nec tor on the PCMCIA card. Turn off your lap top and slide the card into an
open PC card slot. Con nect the other end of the APIB ca ble to the in stru ment.
Turn on you lap top and launch AP2700.
Note: if your PC is fit ted w ith more than one APIB in ter face
adapter, when AP2700 is launched Microsoft Win dows will
se lect one to com mu ni cate with the soft ware. An in stalled
USB-APIB adapter will have pri or ity.
APSI and the Dolby Dig i tal Gen er a tor option
If you have or dered the OPT-2711 Dolby Dig i tal Gen er a tor op tion, you will
need a USB 2.0 port for the Au dio Pre ci sion Stream ing In ter face (APSI). If
you are us ing the USB-APIB adapter for in stru ment con trol, you must have
two USB 2.0 ports, one for APIB and one for APSI.
The APSI in ter face is only used with for the OPT-2711 Dolby*
Dig i tal Gen er a tor op tion, and is only func tional with the
in stal la tion of that op tion and the li censed ac ti va tion of the
soft ware com po nents. In struc tions for use of APSI are
in cluded with the OPT-2711 Dolby Dig i tal Gen er a tor op tion.
Chapter 2: Installation and Setup for APIB Connecting the Instrument to Your PC
16 Getting Started with Your 2700 Series Instrument
INSERT HERE
PCM-WINPCM-WIN
PCMCIA to
Audio Precision
Interface Bus
APIB
For use with S1.EXE, LIB-C or APWIN
Figure 10. PCMCIA card and cable.
* Dolby and the dou ble-D sym bol are trade marks of Dolby Lab o ra to ries.
USO RESTRITO
Page 27
Chapter 3
Hardware Overview
The 2700 se ries in stru ment hard ware in cludes in put and out put con nec tors,
rang ing and sig nal con di tion ing mod ules, dig i tal sig nal pro ces sors, mem ory,
and other cir cuitry needed to per form au dio mea sure ments. It is con nected to
the con trol ler PC by the Au dio Pre ci sion In ter face Bus (APIB). This chap ter
de scribes the con nec tors, con trols and in di ca tors on the in stru ment front and
rear panels. For a full list of hard ware spec i fi ca tions, see Chap ter 6.
When or dered in the op tional GPIB con fig u ra tion (SYS-27xxG), a 2700 se ries in stru ment can also be con trolled by the in dus try-stan dard IEEE 488.2
Gen eral Pur pose In ter face Bus (GPIB). GPIB op er a tion is not cov ered in this
chap ter. See Chap ter 7 for more in for ma tion about the GPIB con fig u ra tion.
All sig nal gen er a tion and measurement is per formed in the 2700 se ries in stru ment hard ware, in clud ing stor age of sig nals ac quired for DSP wave form
dis play or FFT anal y sis.
The SYS-2722 Front Panel
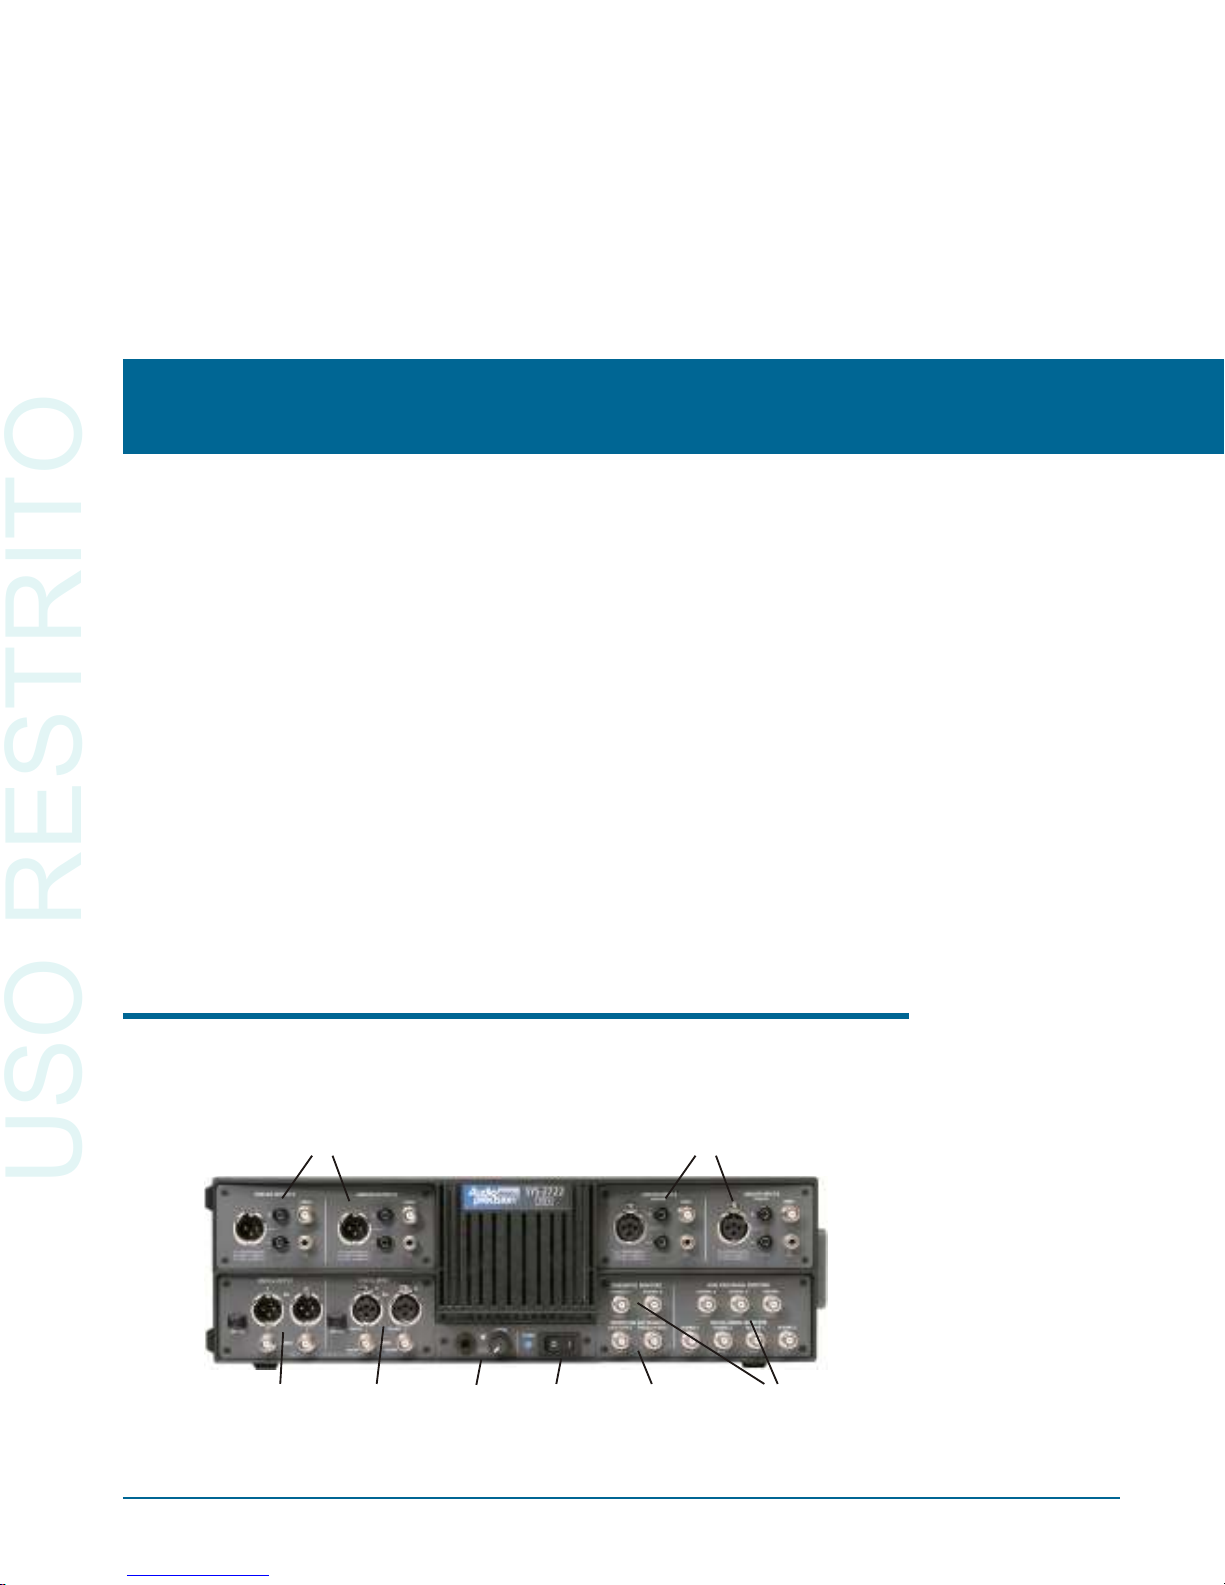
The SYS-2722 in stru ment front panel, shown in Fig ure 11, in cludes the dig i tal and an a log in puts and out puts, sync and mon i tor con nec tors, a head phone
jack and vol ume con trol, and the mains power switch and power in di ca tor.
Getting Started with Your 2700 Series Instrument 17
Analog Outputs Analog Inputs
Digital Output
Headphone Jack
and
Volume Control
Digital Input Mains Power
Switch
Sync and Trigger
Ports
Signal Monitor
Ports
Figure 11. SYS-2722 front panel.
USO RESTRITO
Page 28

§
DIGITAL OUTPUT
In sin gle-con nec tor mode, the 2700 se ries in stru ment trans mits ste reo
dig i tal au dio si mul ta neously on the XLR “I” con nec tor, the BNC con nec tor, and the op ti cal con nec tor. In dual-con nec tor mode, chan nels A and B
are trans mit ted on th e XLR and BNC “I” and “II” con nec tors, re spec tively.
§
DIGITAL INPUT
In sin gle-con nec tor mode, the in stru ment re ceives ste reo dig i tal au dio
from the XLR “I” con nec tor, the BNC con nec tor, or the op ti cal con nec tor. In dual-con nec tor mode, chan nels A and B are re ceived on the XLR
or BNC “I” and “II” con nec tors, re spec tively.
§
ANALOG OUTPUTS
The in stru ment an a log gen er a tor out puts (both “A” and “B” chan nels)
are avail able as balanced sig nals on the XLR and dual ba nana con nec tors, and as unbalanced sig nals on the BNC con nec tors.
§
ANALOG INPUTS
The XLR and dual ba nana (bal anced) and the BNC (un bal anced) con nec tors (both “A” and “B” chan nels) are con nected to the in stru ment an a lyzer in puts.
§
SIGNAL MONITOR PORTS
The in stru ment pro vides seven sig nal mon i tor out puts suit able for au di ble mon i tor ing, os cil lo scope view ing or other mon i tor ing pur poses.
Three of the sig nals orig i nate within the An a log An a lyzer. Four sig nals
orig i nate in the Dig i tal An a lyzer and are con verted to the an a log do main
for mon i tor ing.
§
SYNC and TRIGGER PORTS
Two An a log Generator mon i tor out puts are avail able, along with an An a log Gen er a tor Sync Out put and an An a log Gen er a tor Trig ger In put.
§
GROUND CONNECTORS
Four ba nana-jack / bare-wire-ter mi nal ground con nec tors are pro vided,
each con nected to chas sis ground.
§
HEADPHONE JACK
A 1/4" stereo phone jack con nected to the au di ble mon i tor out put. In serting a plug into this jack in ter rupts the sig nal to the in ter nal speaker.
§
VOLUME CONTROL
The vol ume con trol ad justs the au dio vol ume of both the in ter nal speaker
and the head phone jack.
§
POWER SWITCH and INDICATOR
The power switch turns the mains power sup ply to the in stru ment hard ware ON ( I ) or OFF ( O ).
Chapter 3: Hardware Overview The SYS-2722 Front Panel
18 Getting Started with Your 2700 Series Instrument
USO RESTRITO
Page 29
See Chap ter 4 of the 2700 Se ries User’s Man ual for more in for ma tion about
the instrument in puts and out puts and the pan els as so ci ated with them.
The 2700 Series Rear Panel
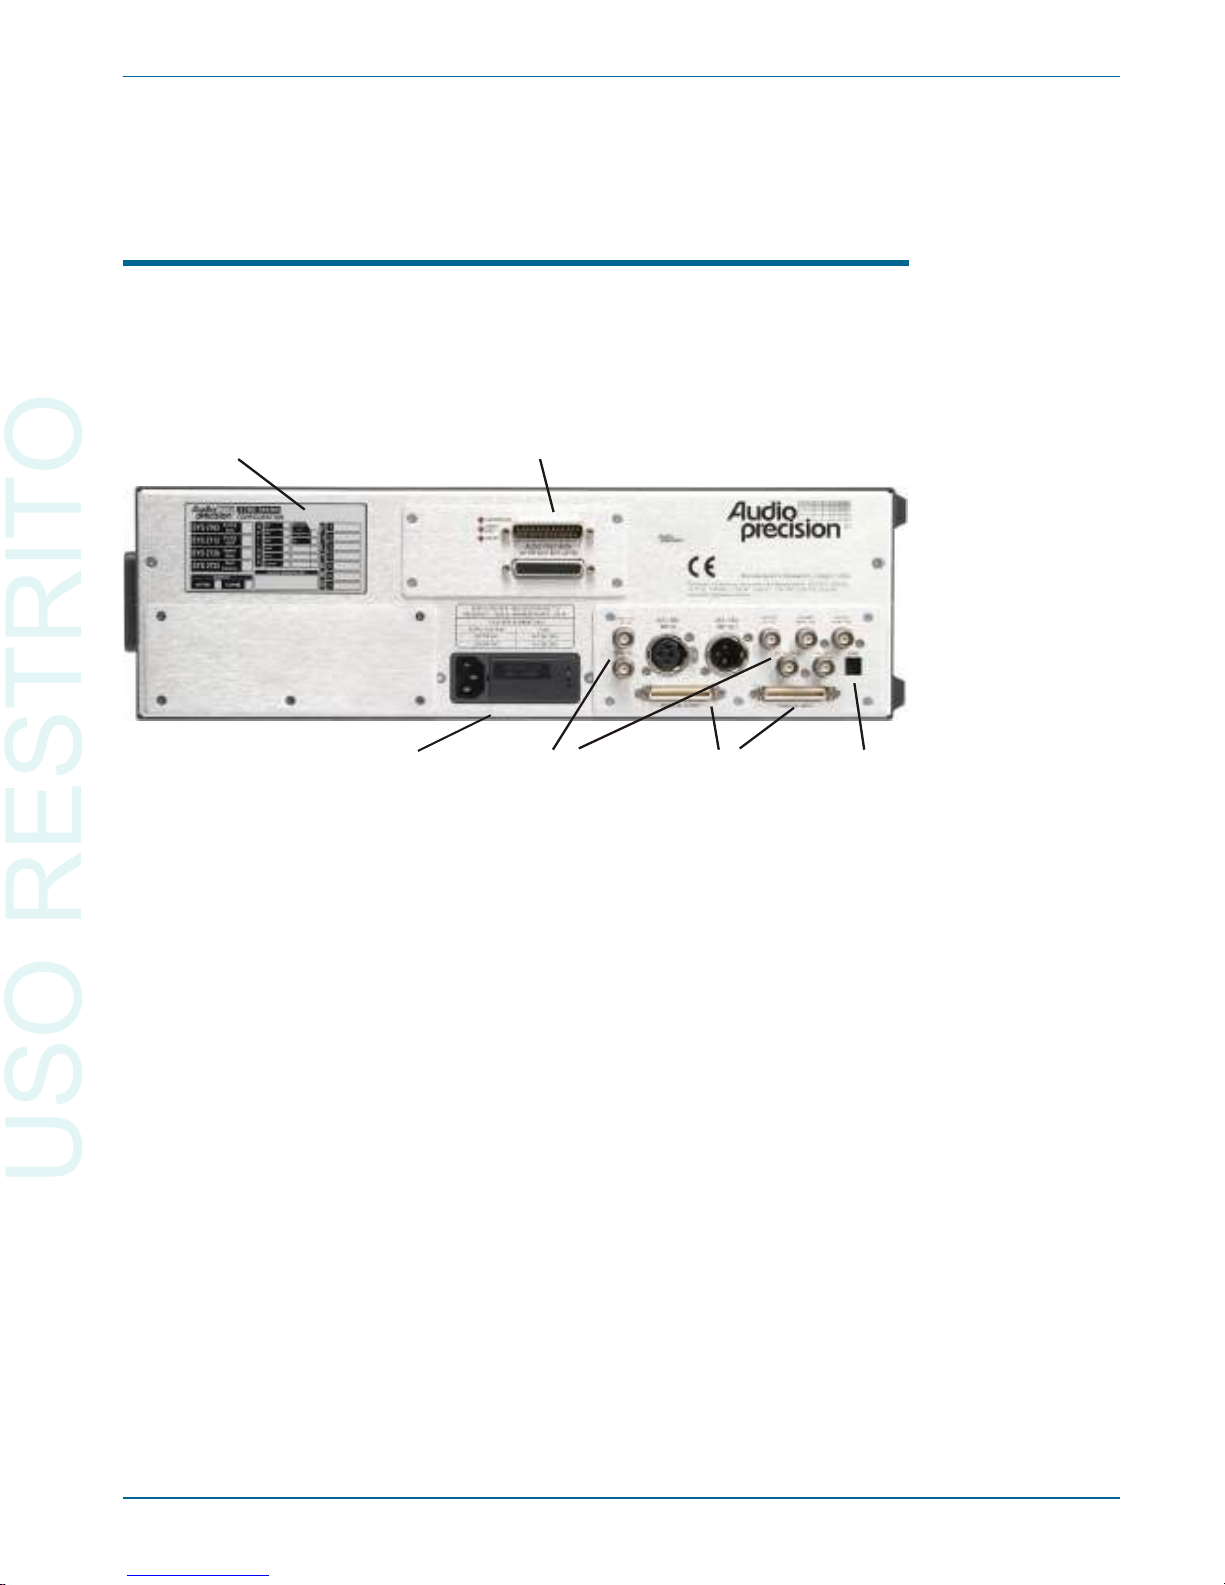
The SYS-2722 in stru ment rear panel, shown in Fig ure 12, in cludes the
power en try mod ule, sync and ref er ence in puts and out puts, par al lel dig i tal in put and out put, APIB in ter face con nec tors and the in stru ment con fig u ra tion
and se rial num ber la bels.
§
POWER ENTRY MODULE—this mod ule in cludes:
POWER CORD CONNECTOR—This is a standard grounded
connector for the mains power supply cord.
FUSE HOLDER/MAINS SUPPLY VOLTAGE JUMPER—Contains
the mains power fuse and the mains supply voltage configuration
jumper card. See Chapter 2.
MAINS SUPPLY VOLTAGE INDICATOR—The white tip of the
plastic indicator on the voltage configuration jumper card appears in
one of four small holes to show the mains voltage selection. See
Chapter 2.
§
SYNC and REFERENCE OUTPUTS
AES/EBU Reference
Master Clock Out
Transmitter Frame Sync Out
Receiver Frame Sync Out
The 2700 Series Rear Panel Chapter 3: Hardware Overview
Getting Started with Your 2700 Series Instrument 19
Configuration Label
APIB Ports
Mains Power Entry
Fusing and Voltage
Configuration
Sync and Reference
Inputs and Outputs
Parallel Digital Input
and Output
APSI
port
Figure 12. SYS-2722 rear panel.
USO RESTRITO
Page 30

Aux Out
Trigger Out
§
SYNC and REFERENCE INPUTS
AES/EBU Reference
Video/TTL Ref er ence
Ex ter nal Trig ger In
§
PARALLEL PORTS
Dig i tal Audio In put and Out put in par al lel for mat, com pat i ble with Au dio Pre ci sion PSIA-2722 Pro gram ma ble Se rial In ter face Adapter in put
and out put.
§
APSI INTERFACE—This con nec tor pro vides the two-way Au dio Pre ci sion Stream ing In ter face. APSI is only used with for the OPT-2711
Dolby Dig i tal Gen er a tor op tion, and is only func tional with the in stal la tion of that op tion and the li censed ac ti va tion of the soft ware com po nents.
§
APIB INTERFACE—These con nec tors pro vide the two-way Au dio Pre ci sion In ter face Bus con nec tion be tween the in stru ment and the PC
running the control soft ware. For con ve nience, both a male and a fe male
con nec tor are pro vided; both con nec tors carry the same two-way data.
See Chap ters 4 and 24 of the 2700 Se ries User’s Man ual for more in for ma -
tion about the in stru ment rear panel par al lel dig i tal and sync and ref er ence in puts and out puts.
Chapter 3: Hardware Overview The 2700 Series Rear Panel
20 Getting Started with Your 2700 Series Instrument
USO RESTRITO
Page 31

Chapter 4
2700 Series Control Software
Overview
Most of your in ter ac tion with your 2700 series in stru ment will be through
the con trol soft ware, AP2700. Once the sys tem is plugged in, turned on and
con nected to your de vice un der test (or DUT), you will be mak ing all your ad just ments and tak ing all your read ings from your com puter screen.
The 2700 se ries con trol soft ware is a pow er ful and com plex pro gram, and
most of the 2700 Se ries User’s Man ual is ded i cated to ex plor ing and ex plain -
ing its many ca pa bil i ties. This chap ter provides an introduction to the soft ware
fea tures. Chap ter 5 pro vides a brief tu to rial on the ba sics of op er at ing the sys tem.
When or dered in the op tional GPIB con fig u ra tion (SYS-27xxG), a 2700 se ries in stru ment can also be con trolled by the in dus try-stan dard IEEE 488.2
Gen eral Pur pose In ter face Bus (GPIB). GPIB op er a tion is not cov ered in this
chap ter. See Chap ter 7 for more in for ma tion about the GPIB con fig u ra tion.
The User Interface
Like many Win dows ap pli ca tions, the 2700 se ries con trol soft ware has a
menu bar, a sta tus bar, toolbars, and a workspace. With these tools you can
save test and data files, ex port and print mea sure ment re sults, con fig ure both
the hard ware and soft ware to your needs, ac cess on line help, de sign and
launch au to mated pro cesses and open and op er ate the mea sure ment con trol
pan els.
The Workspace
The 2700 se ries workspace has five pages that you can se lect by menu com mands (View > Page #) or by click ing the num bered tabs on the Sta tus Bar.
Getting Started with Your 2700 Series Instrument 21
USO RESTRITO
Page 32
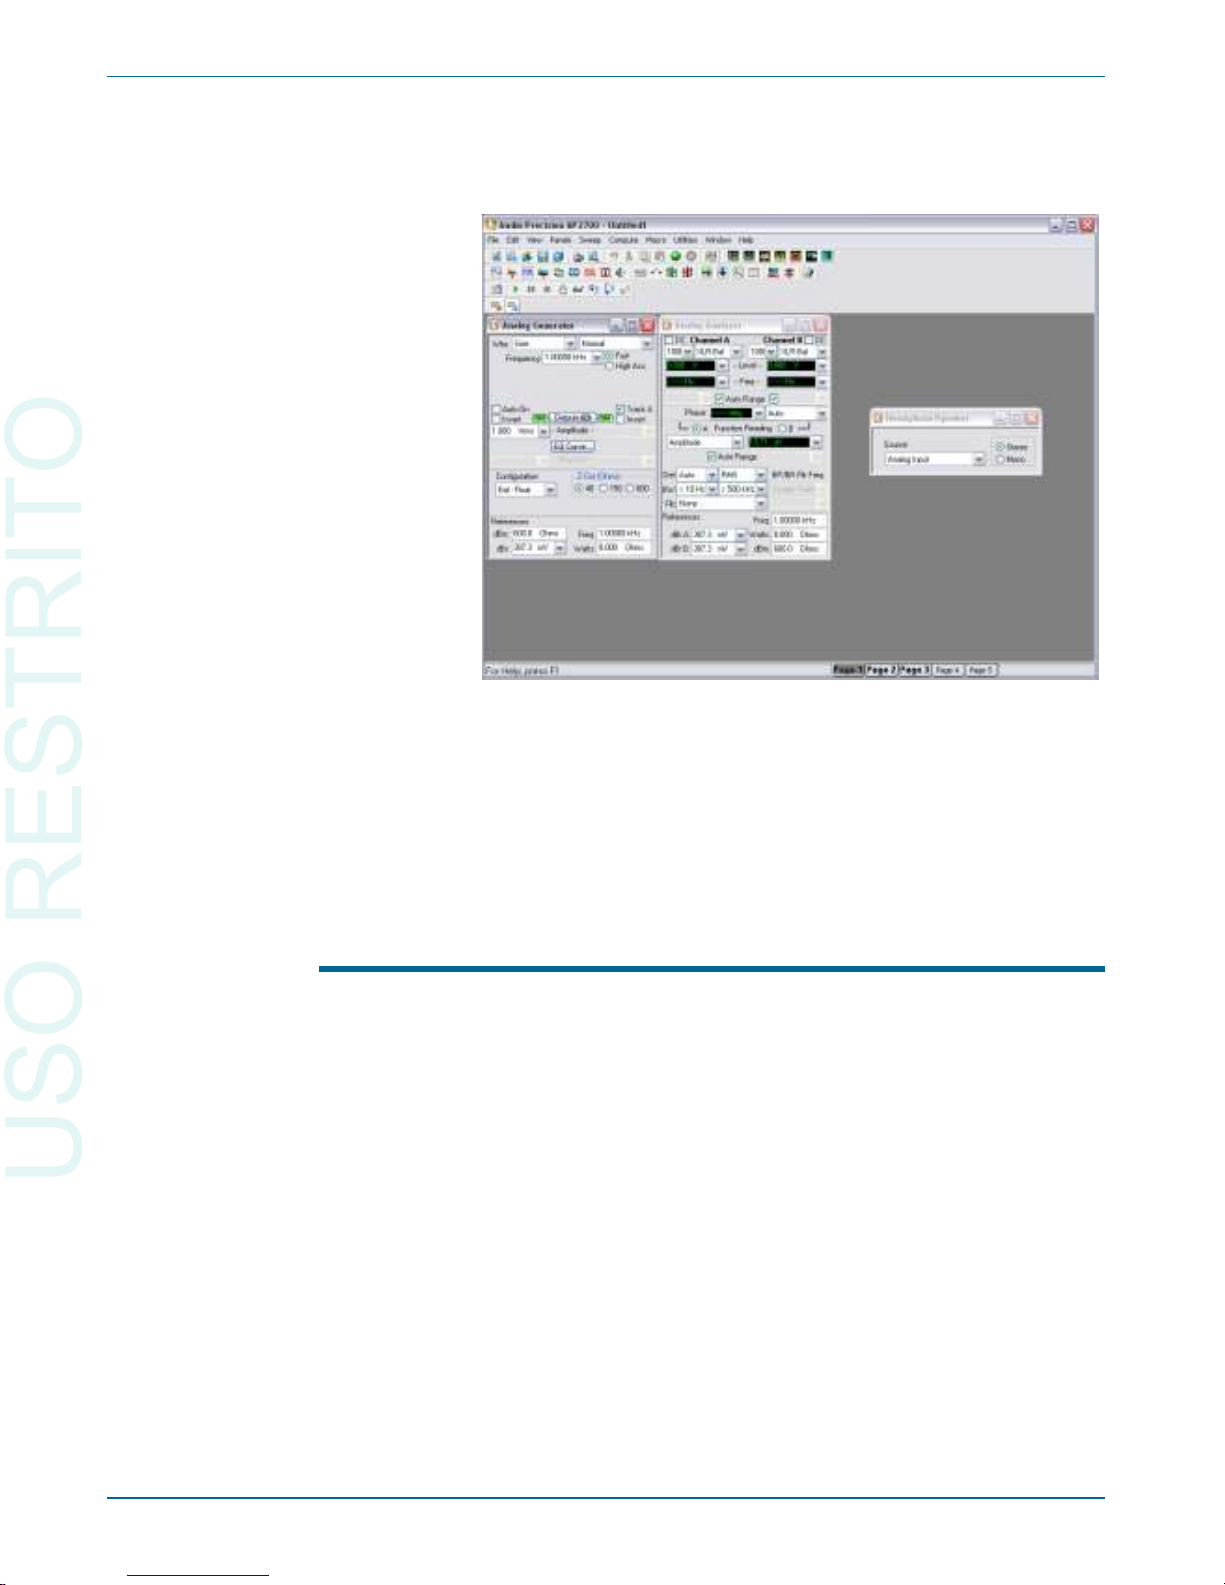
The workspace is like a multi-lay ered desk top where you can dis play and or ga nize the con trol pan els you are us ing for a par tic u lar set of tests.
Panels can be placed on any workspace page, and can be du pli cated on
more than one page. An con trol panel that ap pears on more than one page is
sim ply a re dun dant dis play, for your con ve nience. The set tings and re sults
shown on re dun dant pan els are iden ti cal, and a change made on one page is re flected on the oth ers.
The 2700 series panels
The in ter ac tion be tween the con trol soft ware and the 2700 se ries in stru ment
is through con trol and mea sure ment win dows called pan els. These can be
thought of like the phys i cal con trol pan els of ten found on con ven tional test
and mea sure ment equip ment, with range, func tion and trig ger con trols, ON
and OFF switches, lin ear ad just ment pots and slid ers, nu mer i cal me ter read outs, bar me ters, X-Y wave form dis plays, graphs and so on.
The 2700 se ries pan els are avail able through menu com mands, toolbar
icons and key board short cuts.
You can con trol your 2700 se ries in stru ment from just one or two soft ware
pan els, if that’s all your mea sure ment re quires. A more typ i cal test might in volve four or five pan els; a com pli cated test, per haps six or seven.
Chapter 4: 2700 Series Control Softw are The 2700 series panels
22 Getting Started with Your 2700 Series Instrument
Figure 13. The 2700 series workspace.
USO RESTRITO
Page 33
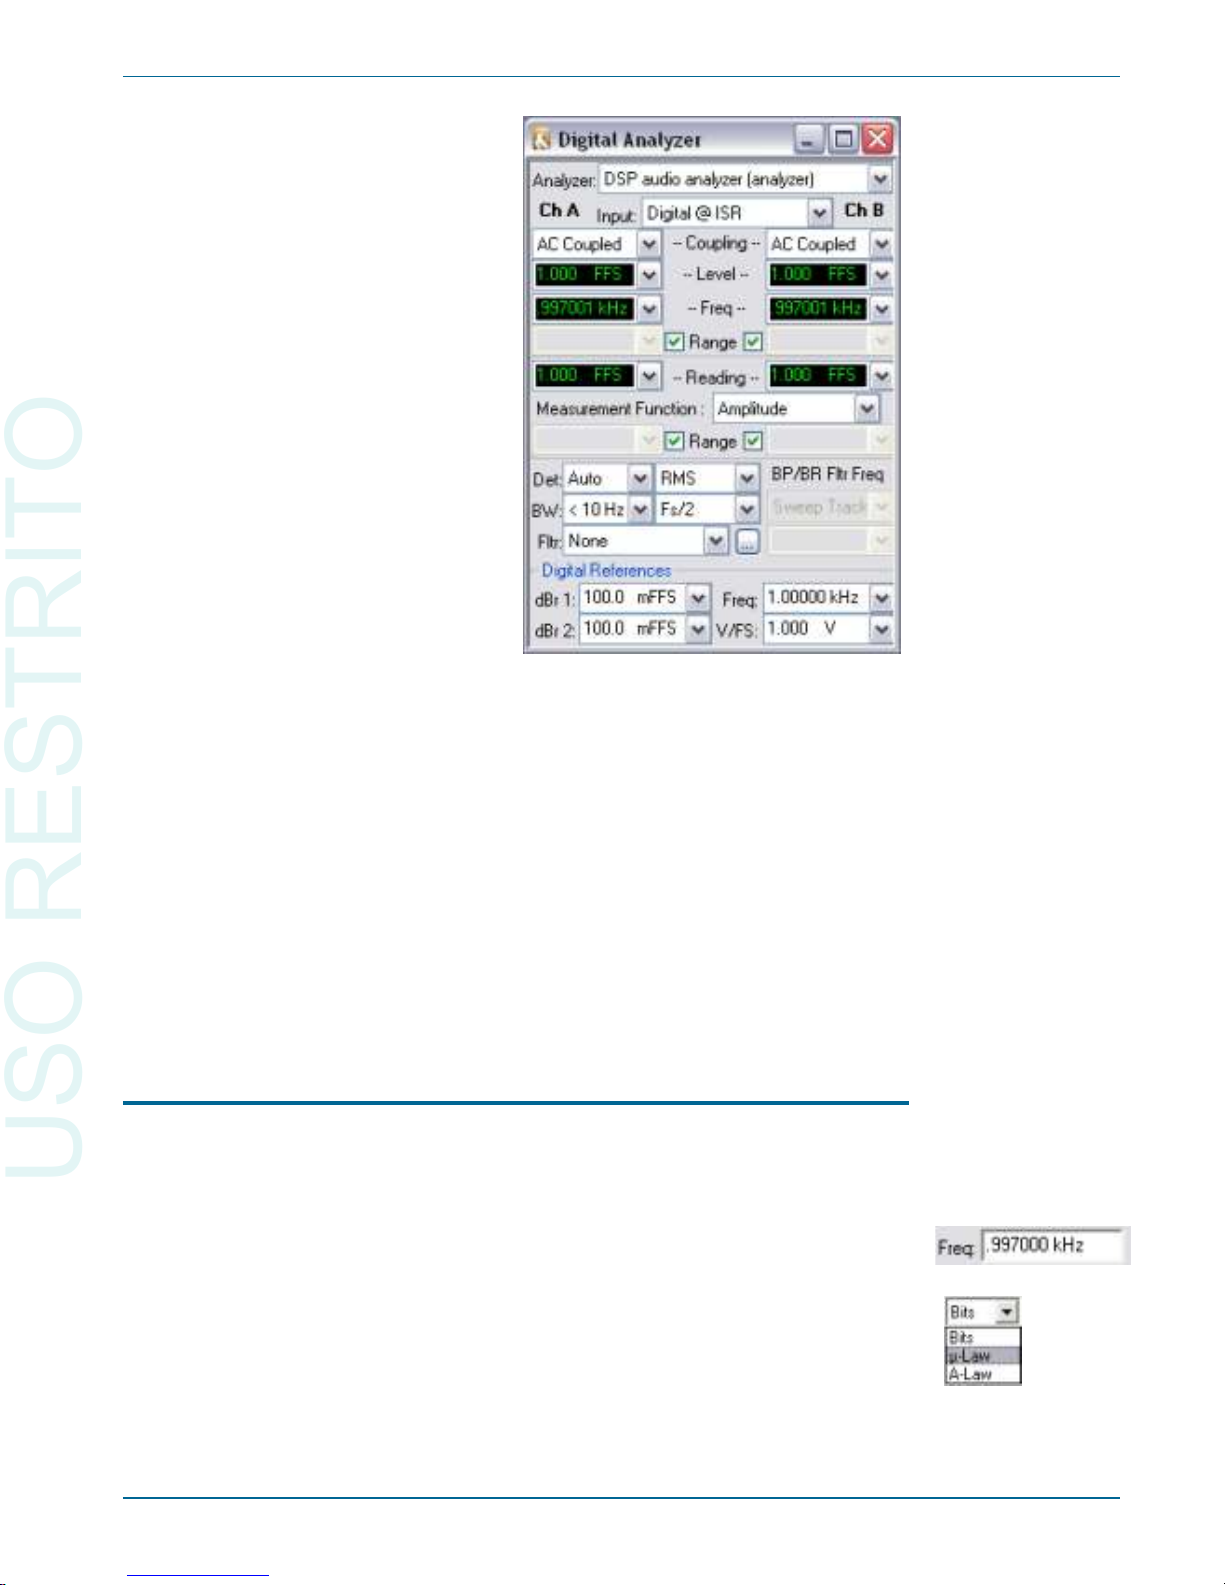
Al though the 2700 se ries pan els can all be placed on one workspace page,
most us ers pre fer to or ga nize their workspace by plac ing pan els on sev eral dif fer ent pages.
You can close a panel with out can cel ing its func tion or ef fect; for ex am ple,
you could set a sig nal’s out put volt age and fre quency on the An a log Gen er a tor
panel, turn the gen er a tor ON, then close the panel win dow. The sig nal will
con tinue at the set tings you’ve made un til you open the panel again and make
changes to the set tings.
Many of the 2700 se ries pan els come in two sizes, the smaller hav ing fewer
com mands and read outs vis i ble, and the larger show ing ev ery op tion. Dou bleclick on the panel ti tle bar to ex pand or con tract it.
Panel Settings
Set tings for tests and mea sure ments are made us ing sev eral dif fer ent types
of con trols on the pan els:
§
Set ting fields, which come in sev eral ver sions:
The text box, in which you can directly enter a value from the
keyboard.
The drop-down list box, in which you can make a selection from a set
of choices.
The 2700 series panels Chapter 4: 2700 Series Control Softw are
Getting Started with Your 2700 Series Instrument 23
Figure 14. A 2700 series panel.
USO RESTRITO
Page 34
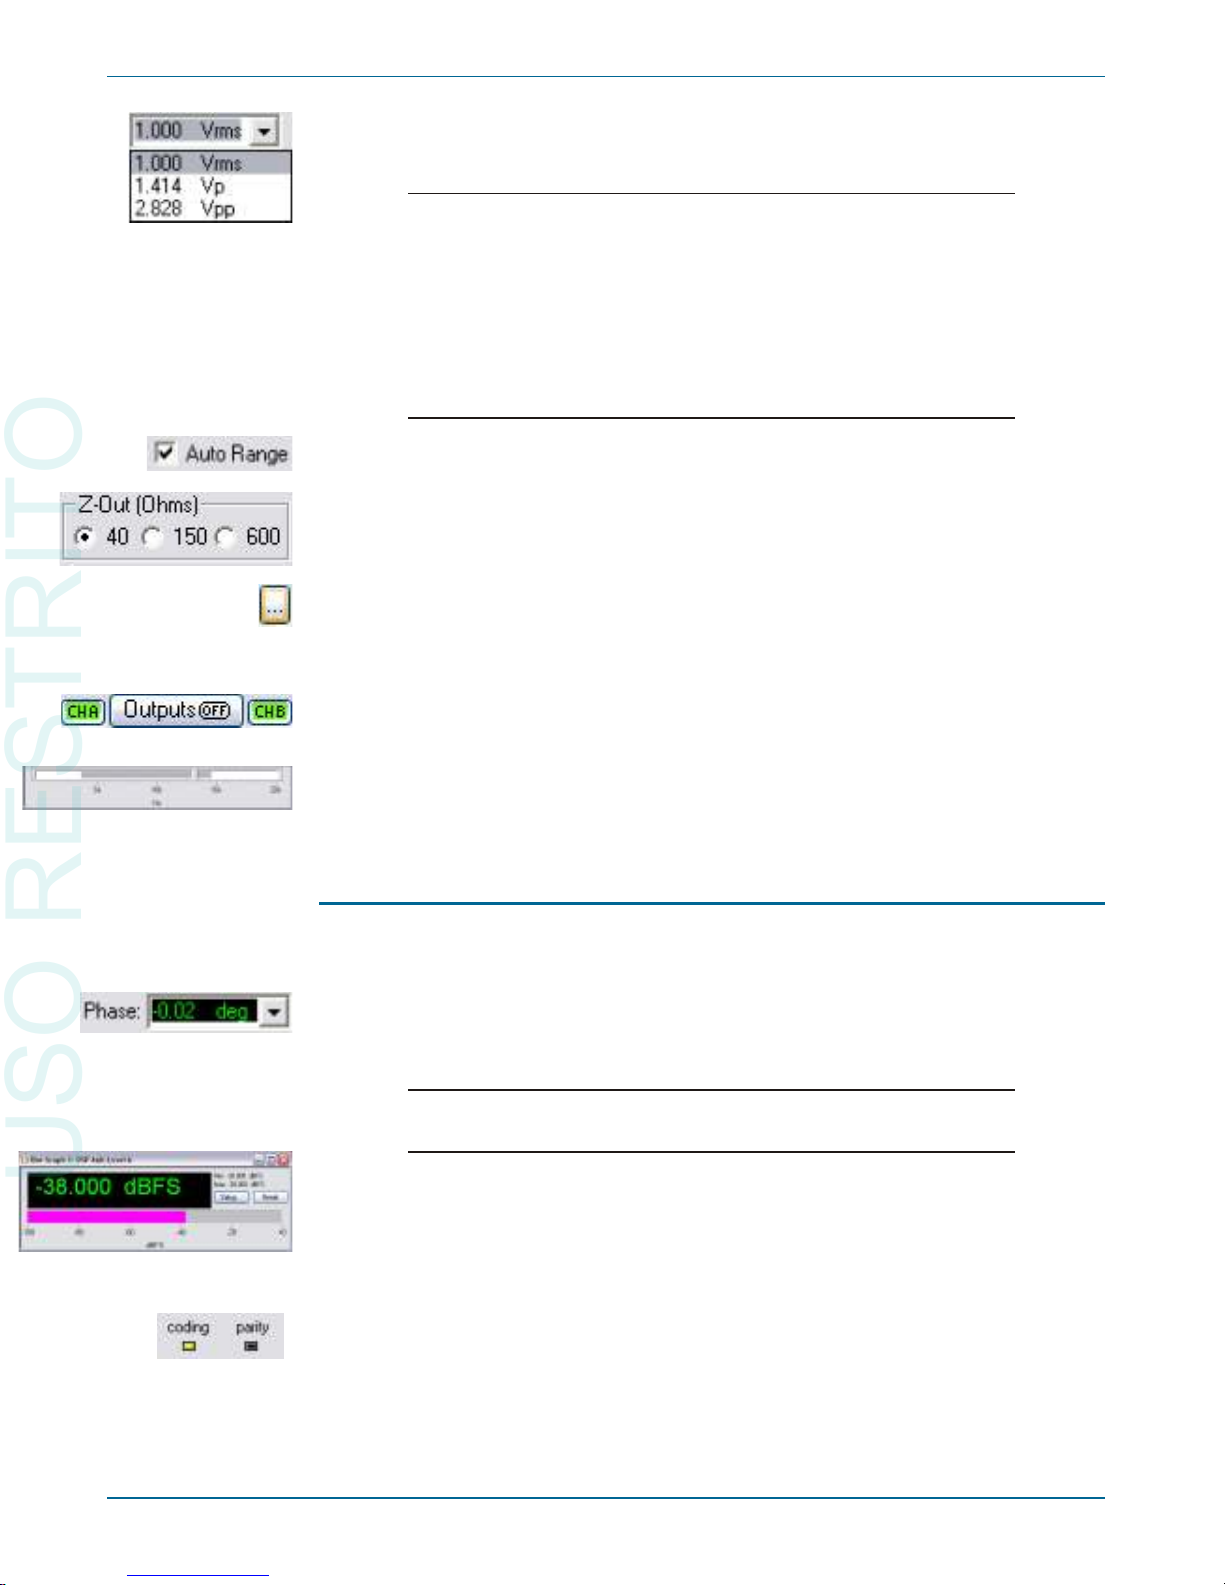
The combo box, a combination of a text box with an added drop-
down list from which you can choose the units to express your value.
Set ting fields dis play dark (black or blue) text or num bers on
a white field. 2700 se ries text boxes and combo boxes,
where ap pro pri ate, will ac cept cer tain let ters as short hand for
stan dard SI multipliers: “n” for nano- (10
–9
), “u” for µ or mi cro-
(10
–6
), “m” for milli- (10
–3
), “k” for kilo- (10 3) and “M” for
mega- (10 6). For ex am ple, entering ei ther “1001” and
“1.001k” in a fre quency field will set the fre quency to
1.001 kHz.
§
Check boxes, which al low you to set non-ex clu sive con di tions.
§
Op tion but tons, which pro vide for ex clu sive con di tions.
§
Browser but tons, which open di a log boxes called brows ers, which al low
you to nav i gate lists of op tions, search for a file by brows ing through a
hi er ar chy of fold ers, and so on. Browser but tons are iden ti fied by the
ellipses mark ( … ).
§
Cus tom but tons that con trol spe cial func tions, such as GO, ON, OFF
and so on.
§
Sliders, with which you can con tin u ously ad just a value. Sliders are
found on Bar Graph pan els. Sliders can be op er ated by ei ther the mouse
pointer or by us ing the ar row keys.
Panel Readings
Re sults of tests or mea sure ments are called read ings, which the 2700 se ries
con trol soft ware can dis play in sev eral ways:
§
Read ing fields, some times called mea sure ment fields or me ters. Read ing
fields come in two vari a tions, with and with out a drop-down list to se lect
units.
Read ing fields al ways dis play green text or num bers on a
black field.
§
Bar graphs, which dis play val ues as a con tin u ous col ored bar, like a con ven tional an a log me ter.
§
Sta tus in di ca tors, which show the pres ence or ab sence of a con di tion by
a small col ored rect an gle.
Chapter 4: 2700 Series Control Software The 2700 series panels
24 Getting Started with Your 2700 Series Instrument
USO RESTRITO
Page 35
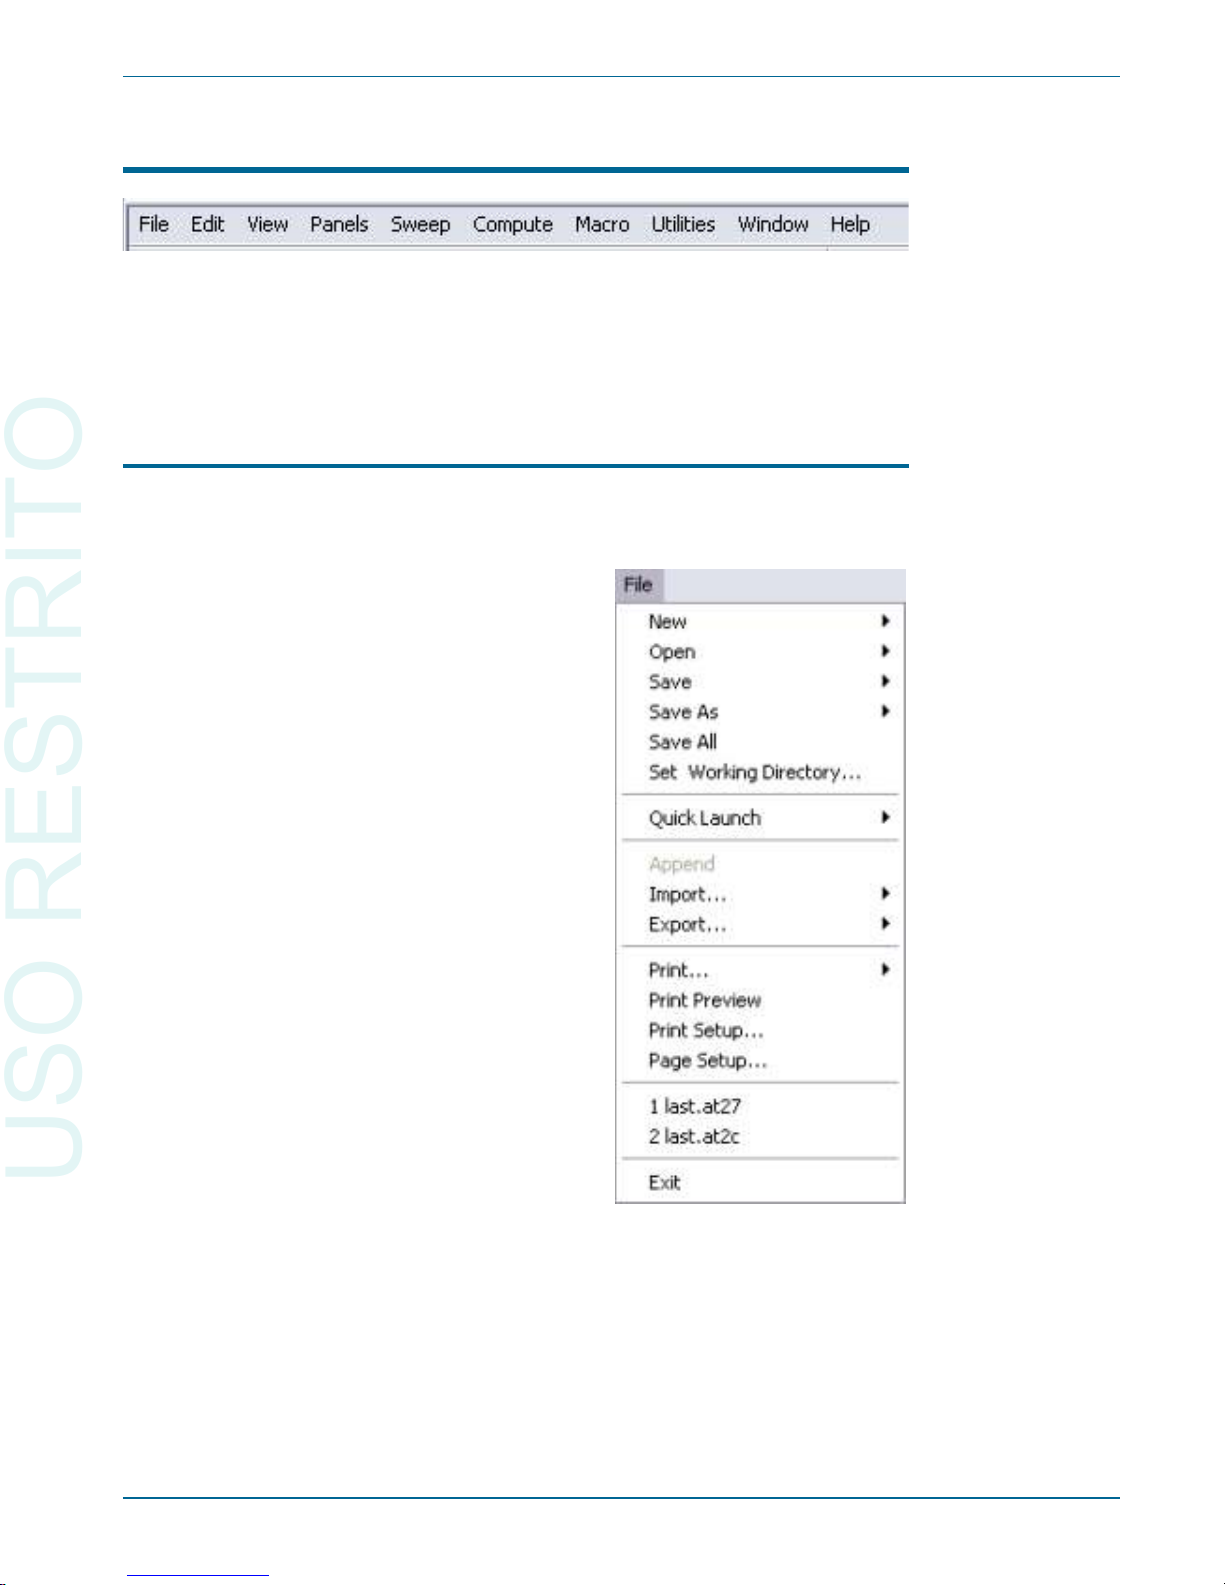
The 2700 se ries menus
The 2700 se ries Menu bar ex tends across the top of the win dow and is al ways vis i ble. In this section we will take a brief tour of the 2700 se ries menus.
De tails of menu op tions, con trols and submenus will be ex plored in the user’s
man ual.
The File Menu
The File menu of fers com mands for open ing, sav ing, ap pend ing, im port ing,
ex port ing and print ing 2700 se ries files, and ac cess to the Quick Launch menu.
Since there are a num ber of dif fer ent files types used by the 2700 se ries,
submenus are avail able (at the small black ar rows } ac com pa ny ing some menu
choices) to choose, for ex am ple, whether to Save As a Test, Data or Macro
file.
The list ings at the bot tom of the File menu show the last tests opened by the
2700 series, and pro vide a con ve nient way to quickly launch a pre vi ously used
test. Sim ply click on the name of the test you would like to open.
The 2700 se ries menus Chapter 4: 2700 Series Control Software
Getting Started with Your 2700 Series Instrument 25
USO RESTRITO
Page 36
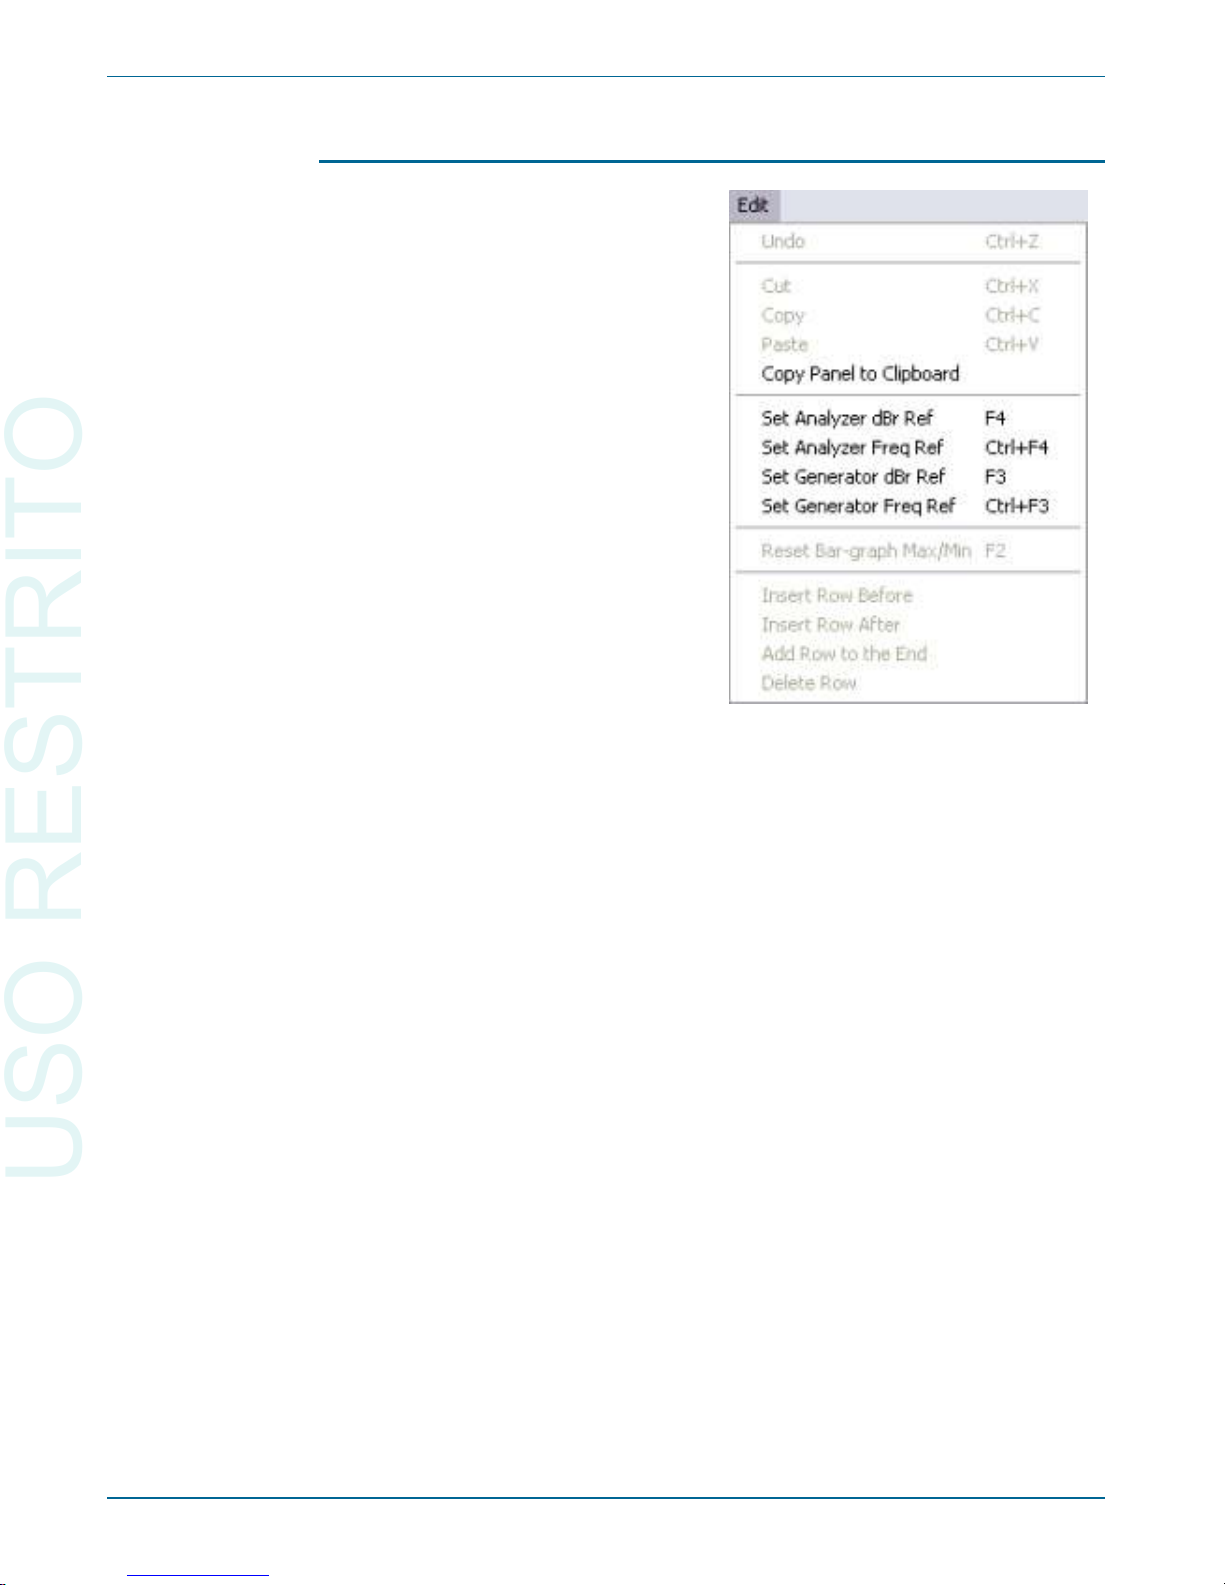
The Edit Menu
The Edit Menu pro vides sev eral groups of com mands:
§
Undo and Cut, Copy, and Paste pro vide ed it ing func tions for 2700 se -
ries text en tries.
§
Copy Panel to Clip board places a bitmap im age of the se lected 2700
se ries panel on the Win dows clip board.
§
The Set An a lyzer and Set Gen er a tor com mands pro vide an easy way to
set ref er ence lev els and fre quen cies for the An a log An a lyzer and An a log
Gen er a tor pan els for rel a tive mea sure ments. These are dis cussed in de tail
in the user’s man ual.
§
Re set Bar-graph Max/Min clears the gray min i mum/max i mum ex cur sion bar from a se lected Bar Graph dis play.
§
The four last com mands are only ac tive when the Data Ed i tor is open
and se lected, and pro vide the means to in sert, add and de lete data rows.
See the user’s man ual for more in for ma tion about us ing the Data Ed i tor.
Chapter 4: 2700 Series Control Softw are The 2700 se ries menus
26 Getting Started with Your 2700 Series Instrument
USO RESTRITO
Page 37
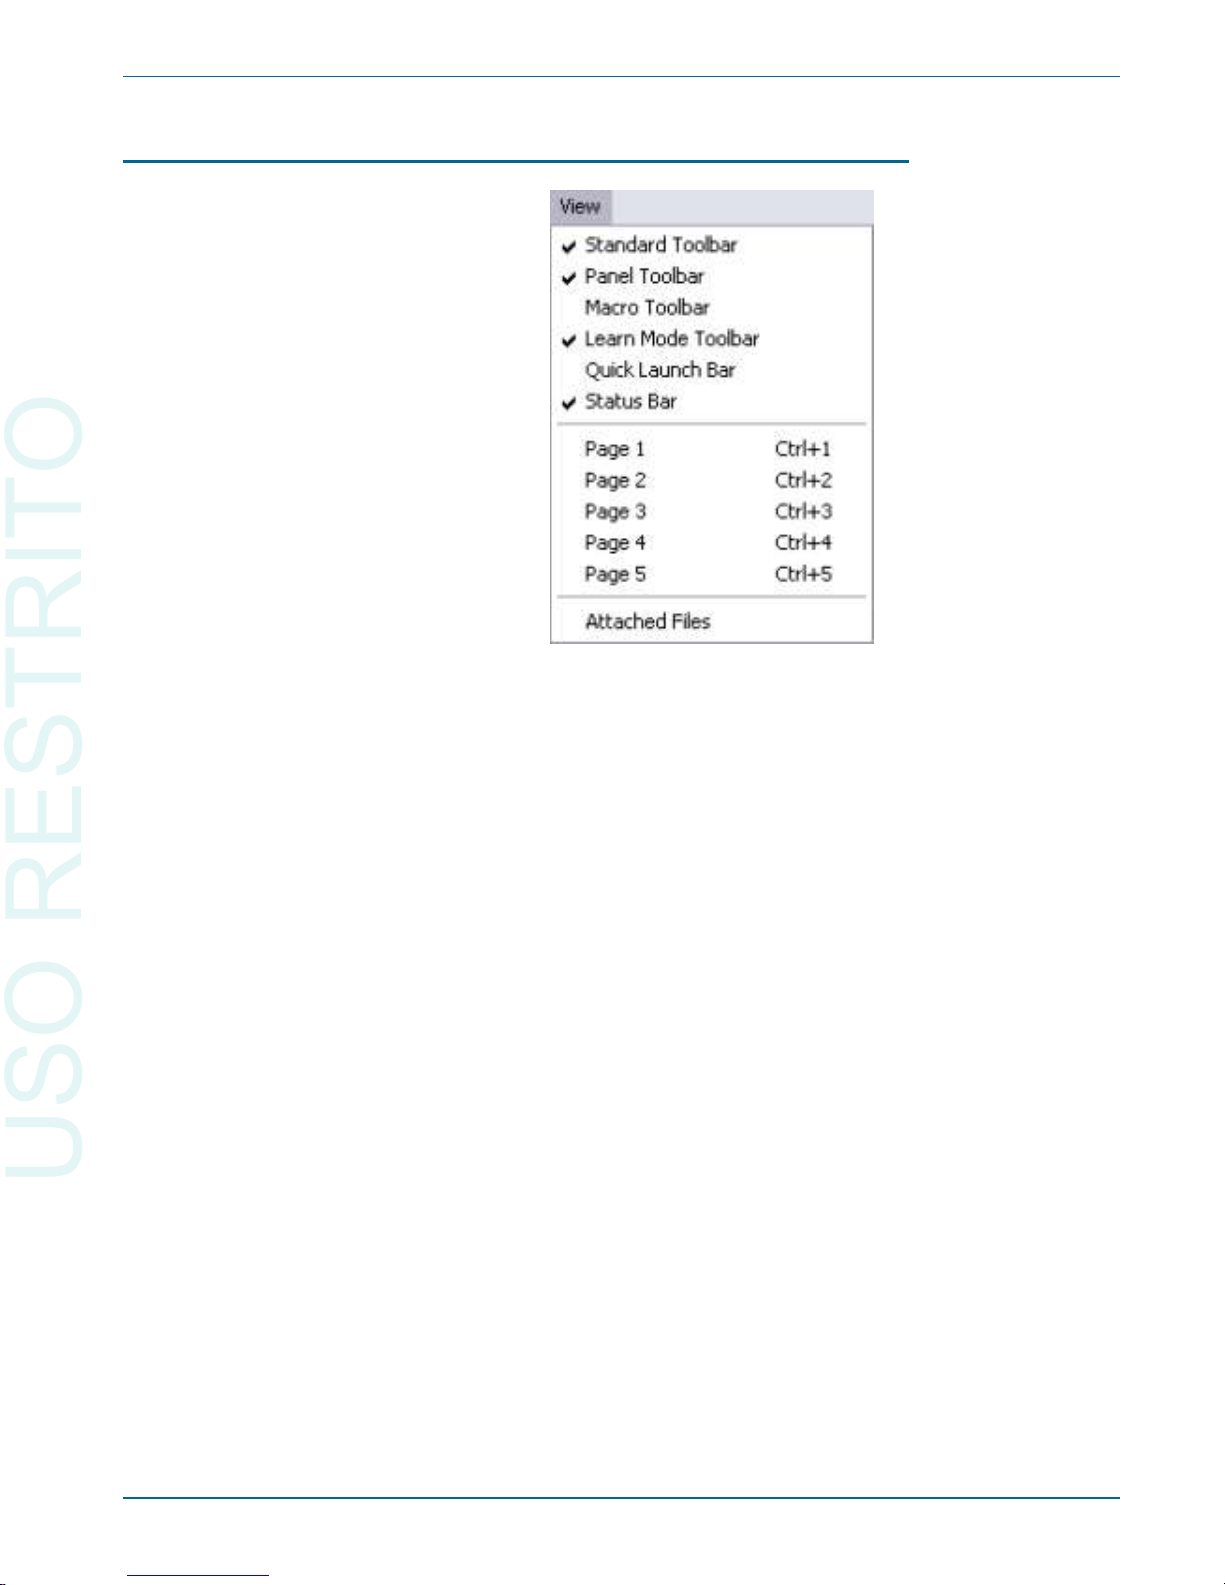
The View Menu
The View menu enables you to choose which workspace page to view, and
whether or not the Sta tus bar and any com bi na tion of Toolbars are dis played.
A checkmark next to a View menu list ing in di cates that the se lec tion is vis i ble.
You can also open the At tached Files viewer from the View menu. Go the
user’s man ual for more in for ma tion about the At tached Files viewer.
Getting Started with Your 2700 Series Instrument 27
The 2700 se ries menus Chapter 4: 2700 Series Control Software
USO RESTRITO
Page 38
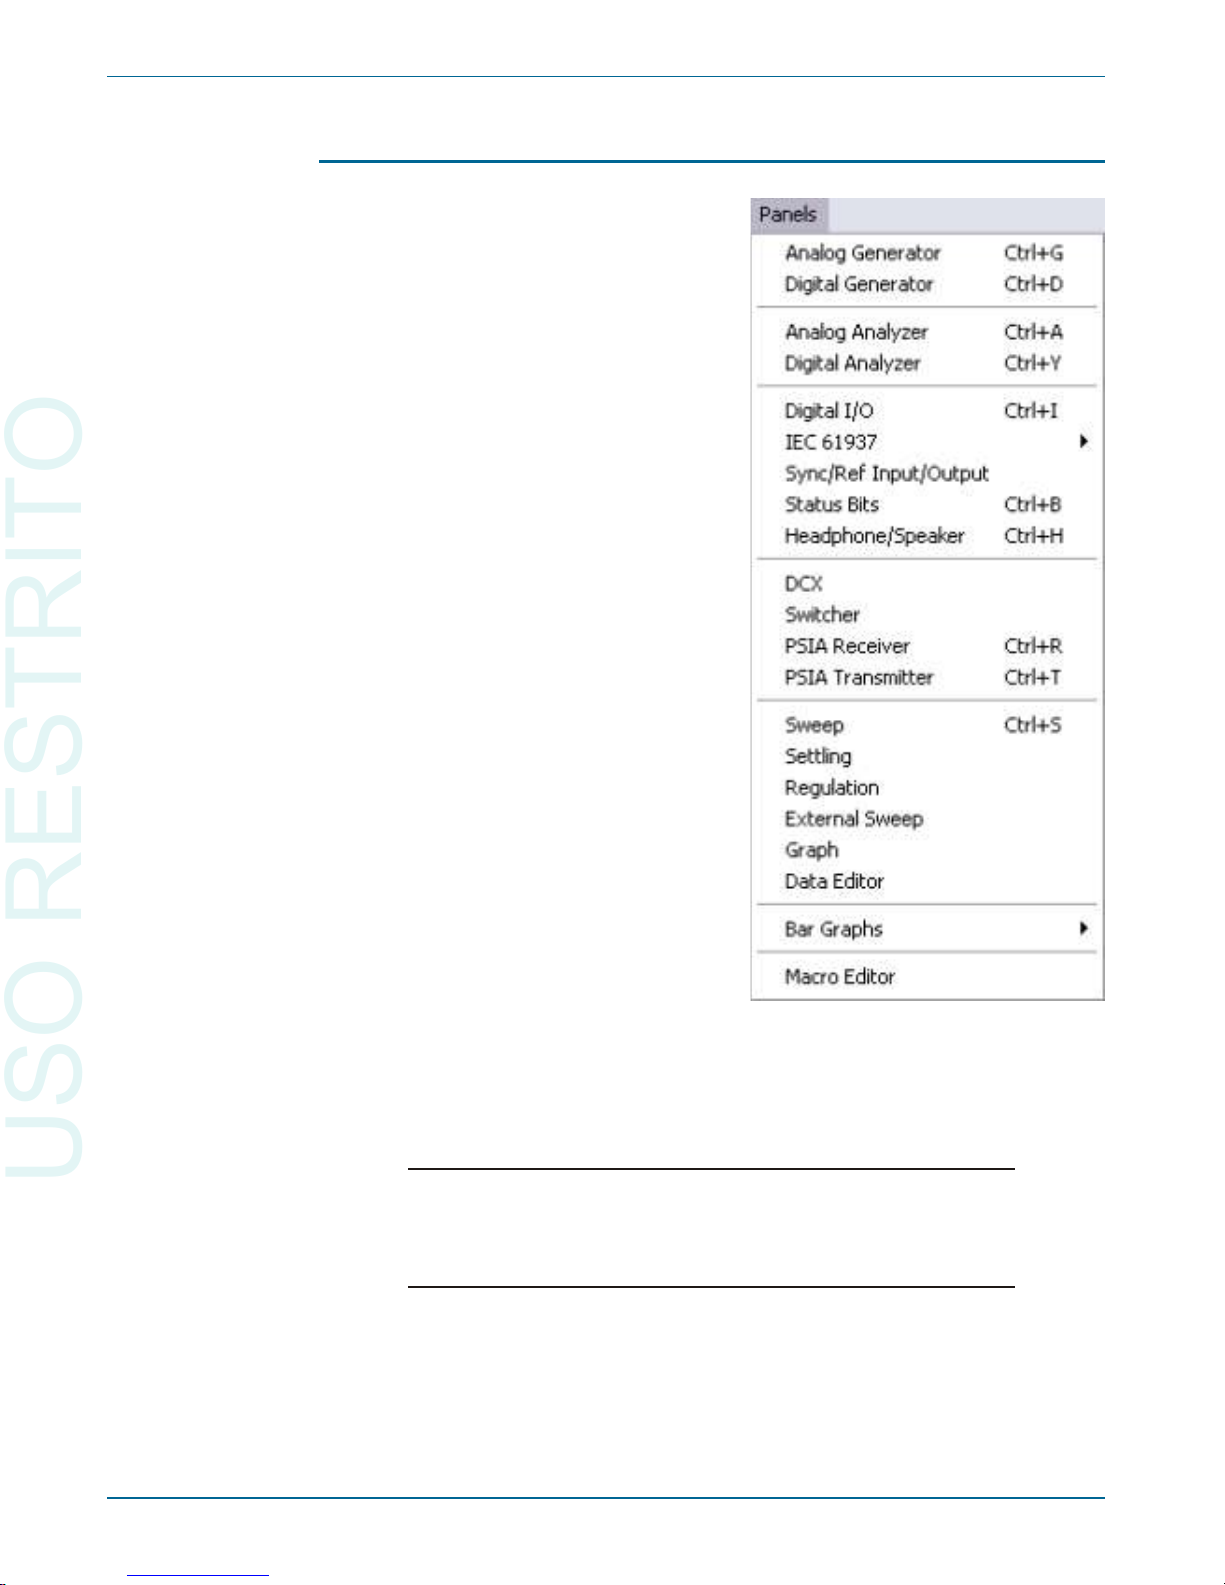
The Panels Menu
The Panels menu shows all the con trol pan els avail able in the con trol soft ware. Click on a Panel name (or on its cor re spond ing Toolbar but ton) to open
a panel on the cur rent workspace page. Panels can be du pli cated on more than
one page for con ve nience.
Closing a panel does not stop its ac tiv ity. If a gen er a tor panel
has been set to out put a sine wave, or an an a lyzer panel to
mea sure a volt age, these activities con tinue whether or not
the panel is vis i ble on any page.
The panel func tions are dis cussed in de tail in the 2700 Se ries User’s Man ual.
28 Getting Started with Your 2700 Series Instrument
Chapter 4: 2700 Series Control Software The 2700 se ries menus
USO RESTRITO
Page 39
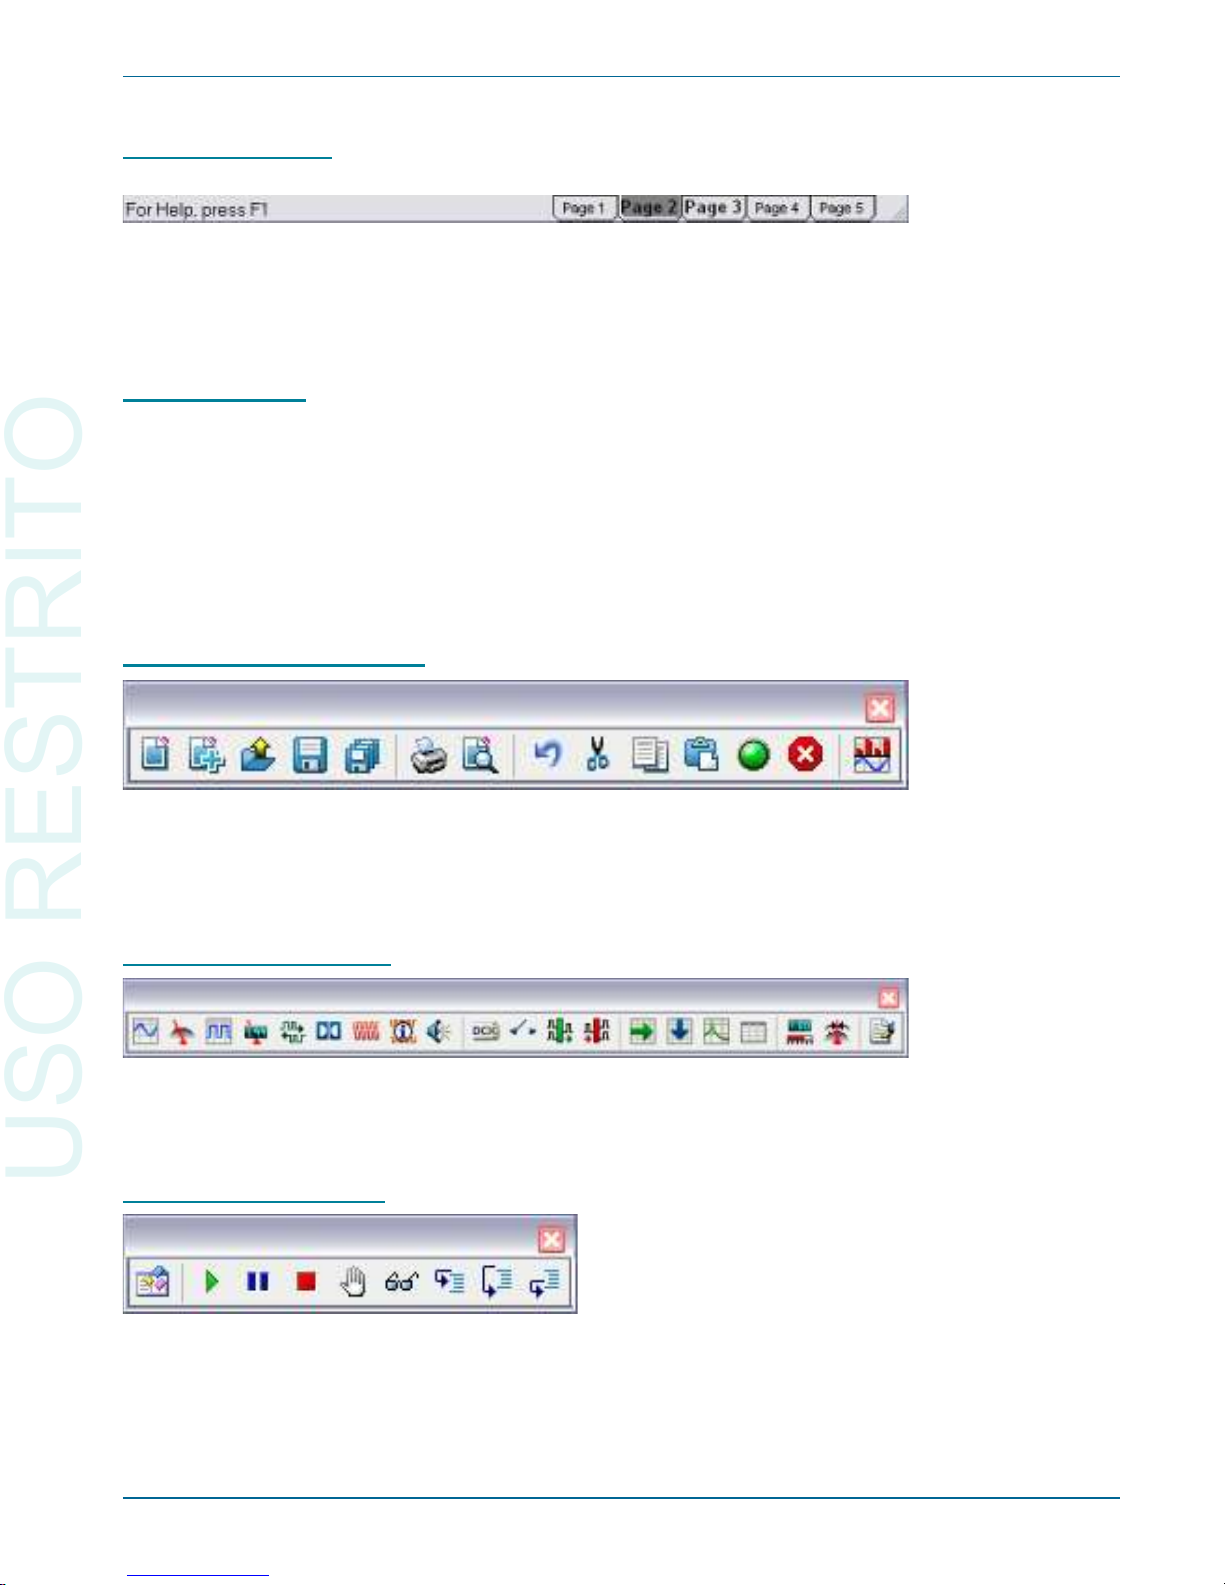
The Status Bar
The Sta tus bar runs across the bot tom of the workspace. On the right, the
Sta tus bar dis plays the workspace page tabs; on the right are sta tus notes up dated as the con trol soft ware op er ates.
The Toolbars
The 2700 se ries con trol soft ware has five toolbars for quick ac cess to pan els
and com mon func tions. The toolbars can “float” at any lo ca tion you place
them on the workspace, or they can be “docked” or at tached to the Menu bar.
Whether docked or float ing, the toolbars ap pear on ev ery workspace page.
The toolbars dis play com mand but tons for one-click ac cess to many of tenused func tions. See the 2700 Se ries User’s Man ual for de tailed in for ma tion.
The Standard Toolbar
The Stan dard toolbar gives you quick ac cess to 2700 se ries file, printer and
ed it ing op er a tions, as well as Sweep Stop/Start and FFT Time/Fre quency do main switch ing. See the 2700 Se ries User’s Man ual for de tailed in for ma tion.
The Panels Toolbar
The Panels toolbar gives you quick ac cess to 2700 se ries mea sure ment and
con trol pan els: See the 2700 Se ries User’s Man ual for de tailed in for ma tion.
The Macro Toolbar
The Macro toolbar of fers one-click op er a tions for run ning and ed it ing an
AP Ba sic macro. See the 2700 Se ries User’s Man ual for de tailed in for ma tion.
The 2700 se ries menus Chapter 4: 2700 Series Control Software
Getting Started with Your 2700 Series Instrument 29
USO RESTRITO
Page 40
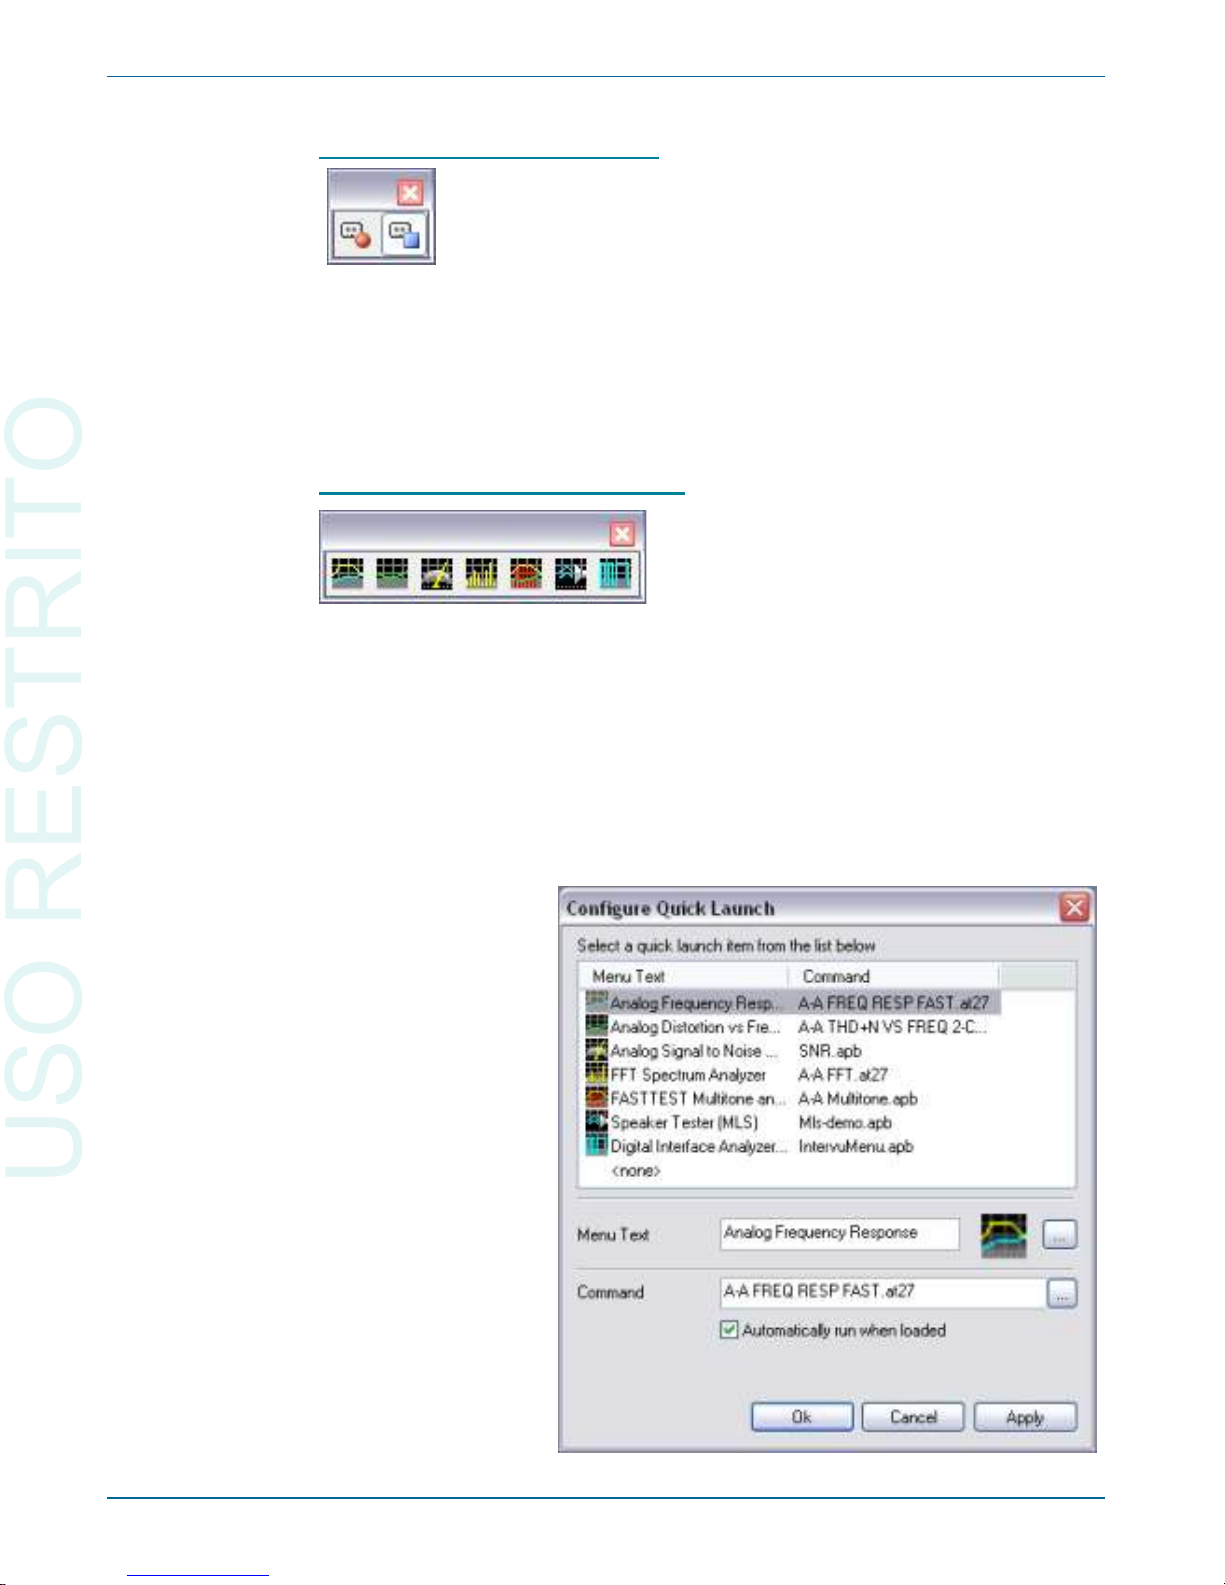
The Learn Mode T oolbar
Learn mode logs all your 2700 se ries op er a tions as you per form them,
build ing a macro (script) for au to ma tion pur poses. The Learn Mode toolbar
gives you the abil ity to turn the macro re cord ing func tion ON and OFF with a
click of the mouse. See the 2700 Se ries User’s Man ual for de tailed in for ma -
tion.
The Quick Launch Toolbar
Quick Launch al lows you to cre ate and use cus tom toolbar but tons to open
2700 se ries tests, run AP Ba sic macros and even launch other Win dows pro grams.
From the Main menu, choose File > Quick Launch > Cus tom ize Quick
Launch to open the Quick Launch Con fig u ra tion panel, where you can view
or edit the ex ist ing Quick Launch com mands or to add new com mands of your
own.
Chapter 4: 2700 Series Control Software The 2700 se ries menus
30 Getting Started with Your 2700 Series Instrument
Figure 15.
The Quick Launch
Configuration panel.
USO RESTRITO
Page 41

For each toolbar com mand, en ter (or browse to) a com mand line with a
com plete path in the Com mand field. Name the com mand in the Menu Text
field, and choose a toolbar but ton icon us ing the icon browser to the right. If
you would like a macro from the Quick Launch toolbar to run im me di ately,
check Au to matically run when loaded.
To open the test, macro or pro gram, click the but ton on the Quick Launch
toolbar.
See the 2700 Se ries User’s Man ual for de tailed in for ma tion.
The 2700 se ries menus Chapter 4: 2700 Series Control Software
Getting Started with Your 2700 Series Instrument 31
USO RESTRITO
Page 42

Chapter 4: 2700 Series Control Software The 2700 se ries menus
32 Audio Precision 2700 Series User’s Manual
USO RESTRITO
Page 43
Chapter 5
Quick Guides
Introduction
The Quick Guides in this chap ter pro vide a way to get fa mil iar with the
2700 se ries user in ter face, and to get some im me di ate re sults from your in stru ment. As you be come more com fort able with the sys tem, please re fer to the
2700 se ries User’s Man ual for fur ther in for ma tion.
The Quick Guides be gin with the as sump tion that your 2700 se ries in stru ment is turned on and con nected to your PC, and that the AP2700 soft ware has
been launched and is in com mu ni ca tion with and prop erly con trol ling your in stru ment. No au dio ca bles or external de vices un der test (DUTs) are needed
for the Quick Guides.
Getting Started with Your 2700 Series Instrument 33
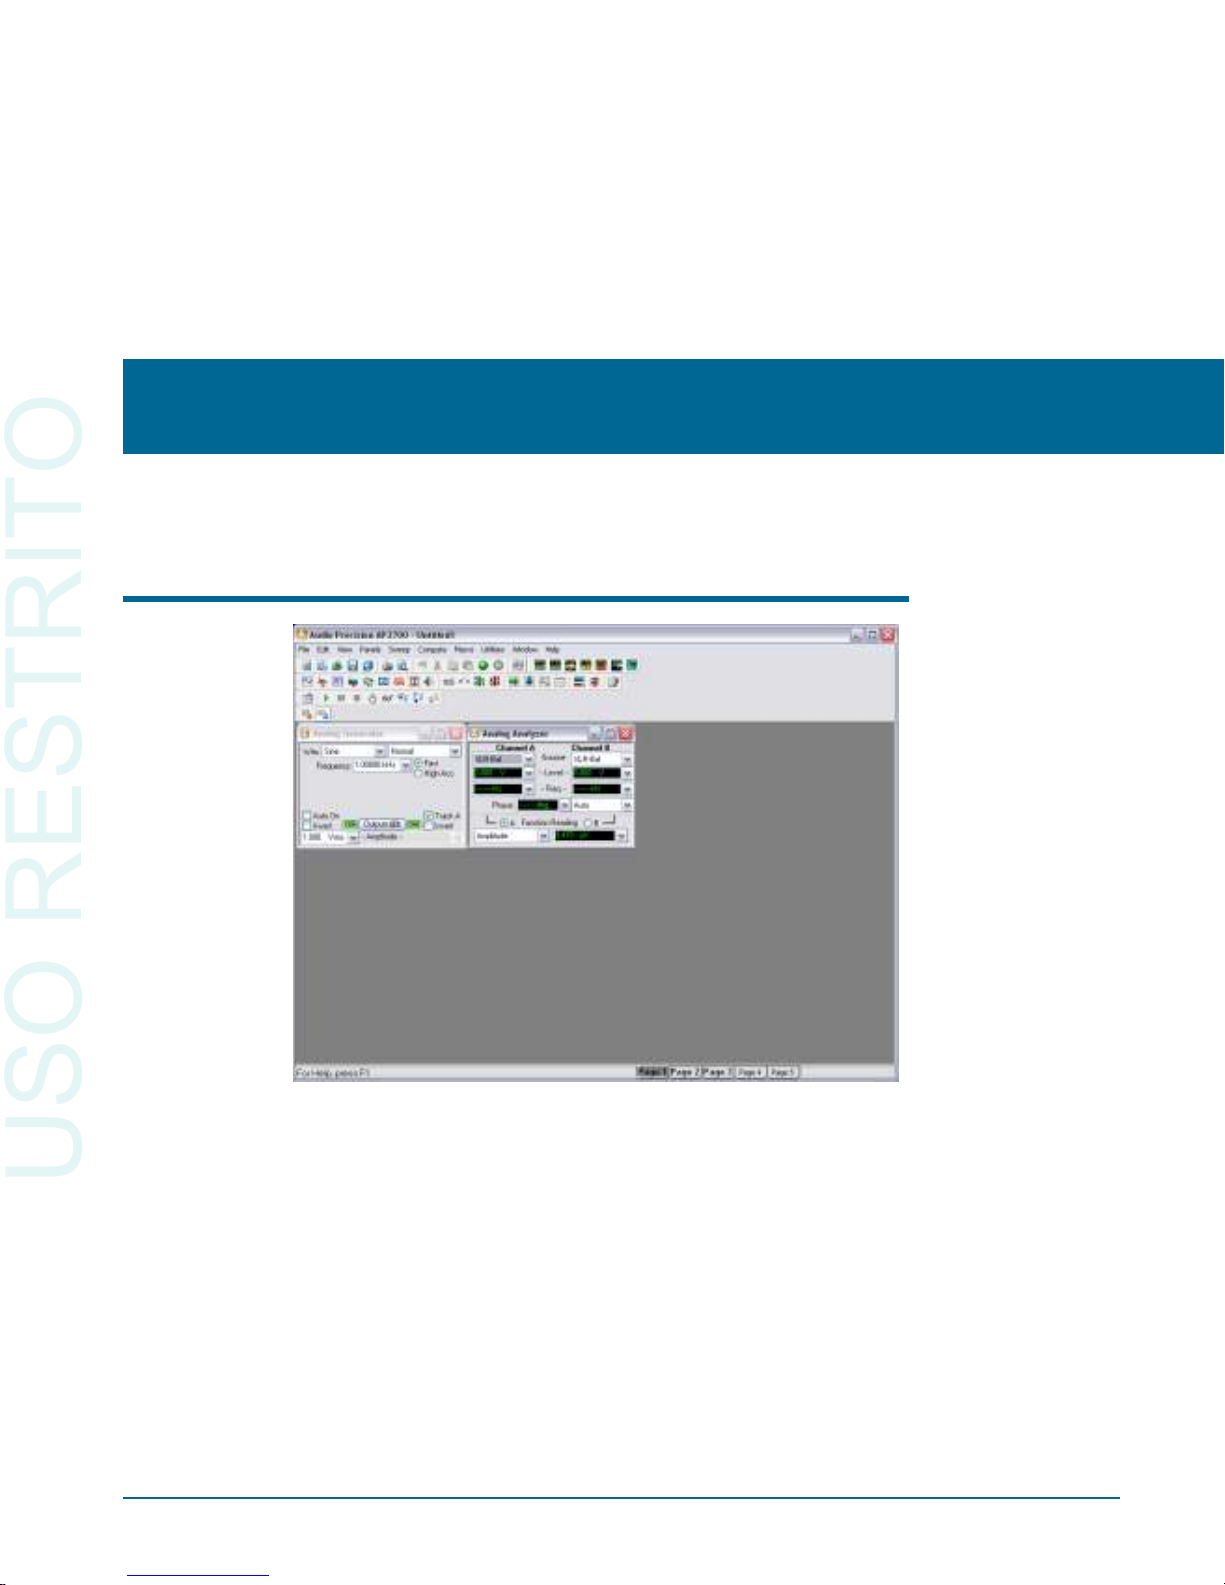
Figure 16. 2700 series workspace, New Test defaults.
USO RESTRITO
Page 44
The Analog Signal Path
When the 2700 se ries con trol soft ware is launched, the de fault Page 1
workspace is loaded with two pan els, the An a log Gen er a tor and the An a log
An a lyzer, as shown in Fig ure 16. To re turn to this con fig u ra tion at any time,
click the New Test but ton. Pre vi ous set tings and data will be dis carded.
Analog Input Selection
The 2700 se ries has two chan nels of an a log in put that are ac cessed from the
An a log An a lyzer panel. Each chan nel can re ceive a sig nal from its front panel
bal anced or un bal anced con nec tor, or via an in ter nal path from the An a log
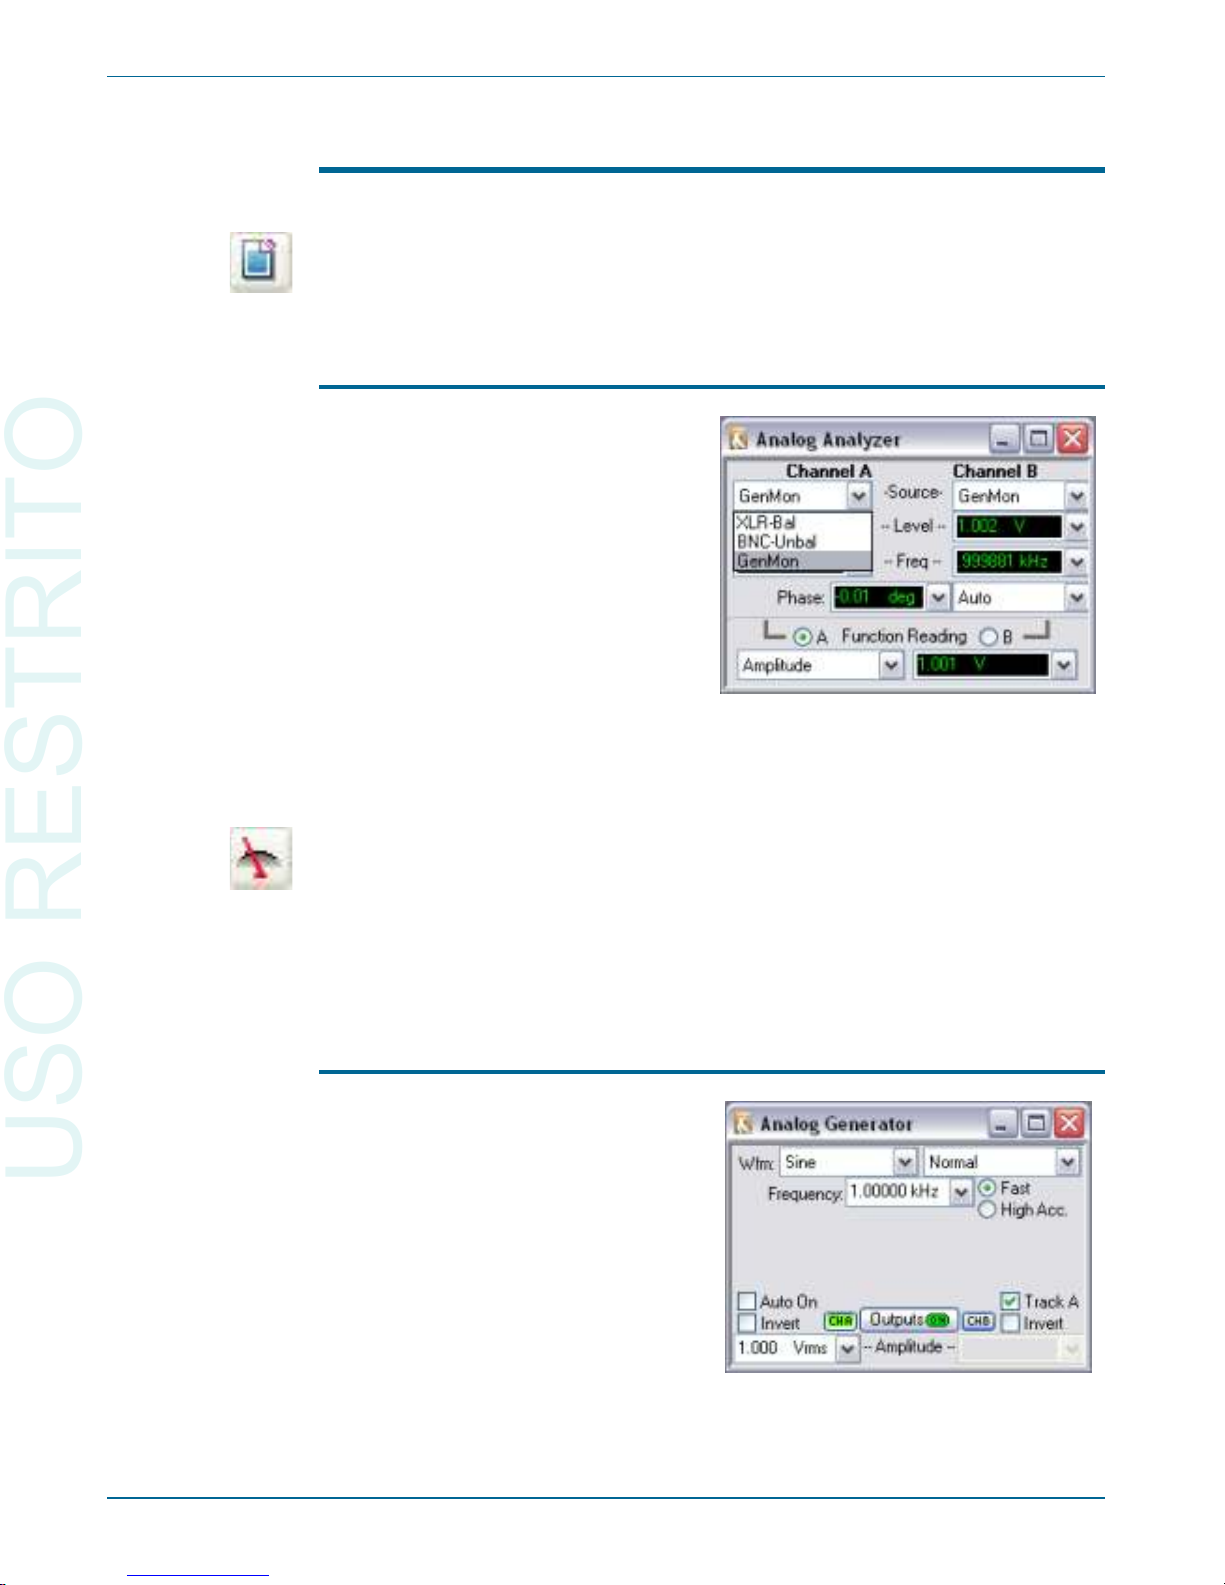
Gen er a tor. The Source fields on the An a log An a lyzer panel pres ent these
choices in a drop-down list. Go to the An a log An a lyzer by se lect ing Panels >
An a log An a lyzer or by click ing the An a log An a lyzer but ton. Choose
GenMon for each chan nel to se lect the in ter nal path.
Analog Generator Panel
Chapter 5: Quick Guides The Analog Signal Path
34 Getting Started with Your 2700 Series Instrument
Figure 17. Analog input selection via
Analog Analyzer Source drop-down lists.
Figure 18. Analog Generator, OUTPUTS
ON, CHB OFF.
USO RESTRITO
Page 45
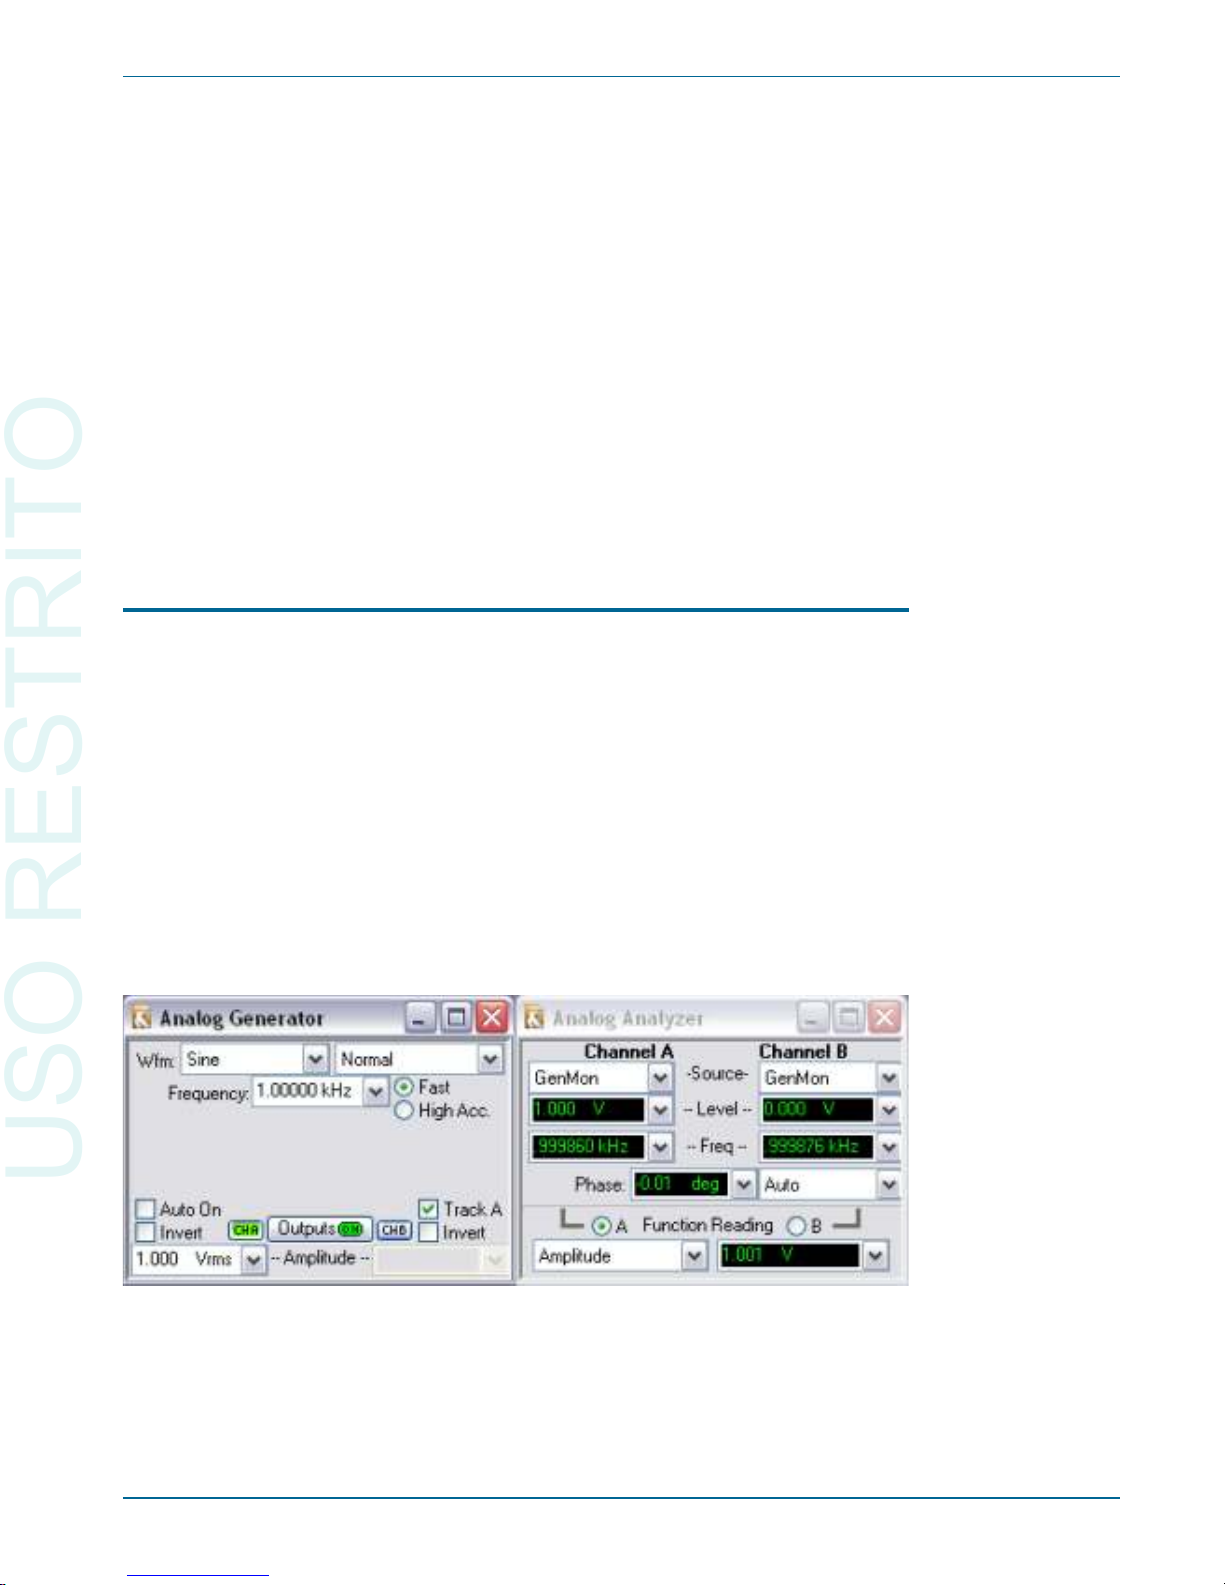
In the de fault con fig u ra tion, the An a log Gen er a tor panel is set for a 1 Vrms,
1 kHz sine wave, but the an a log out puts are dis abled. To turn on the out puts,
click the OUTPUTS OFF but ton near the cen ter of the panel. The but ton will
turn green, and you will hear re lays click in the in stru ment hard ware. The
Level me ters on the An a log An a lyzer panel will show ap prox i mately 1.000 V.
The Level me ters show the rms level of the sig nals at the an a log in puts.
The ste reo An a log Gen er a tor out puts can be in di vid u ally dis abled with the
CHA and CHB but tons next to the OUTPUTS field. Click on the CHB but -
ton. The but ton will turn gray, re lays will click in the in stru ment, and the
Chan nel B Level me ter on the An a log An a lyzer panel will in di cate a level of
0.000 V.
Now that we’ve suc cess fully routed a sig nal from the An a log Gen er a tor to
the An a log An a lyzer, we will perform some ba sic mea sure ments.
Using the Analog Analyzer
The 2700 se ries has two in de pend ent gen eral-pur pose an a lyz ers that can
per form mea sure ments on an a log sig nals. We will be us ing the An a log An a lyzer for the Quick Guide; the al ter na tive DSP Au dio An a lyzer is an anal y sis
tool avail able on the Dig i tal An a lyzer panel that of fers sim i lar anal y sis ca pa bil i ties. You can read about the both an a lyz ers in Chap ters 8 and 10 of the
2700 Se ries User’s Man ual.
The An a log An a lyzer is an an a log-do main real-time au dio an a lyzer, im ple -
mented in in stru ment hard ware. It pro vides con tin u ous read ings of sig nal level
and fre quency for both in put channels. It also al lows you to se lect a chan nel
and ap ply fil ter ing to it, and to mea sure pa ram e ters such as to tal har monic dis tor tion, phase, and so on.
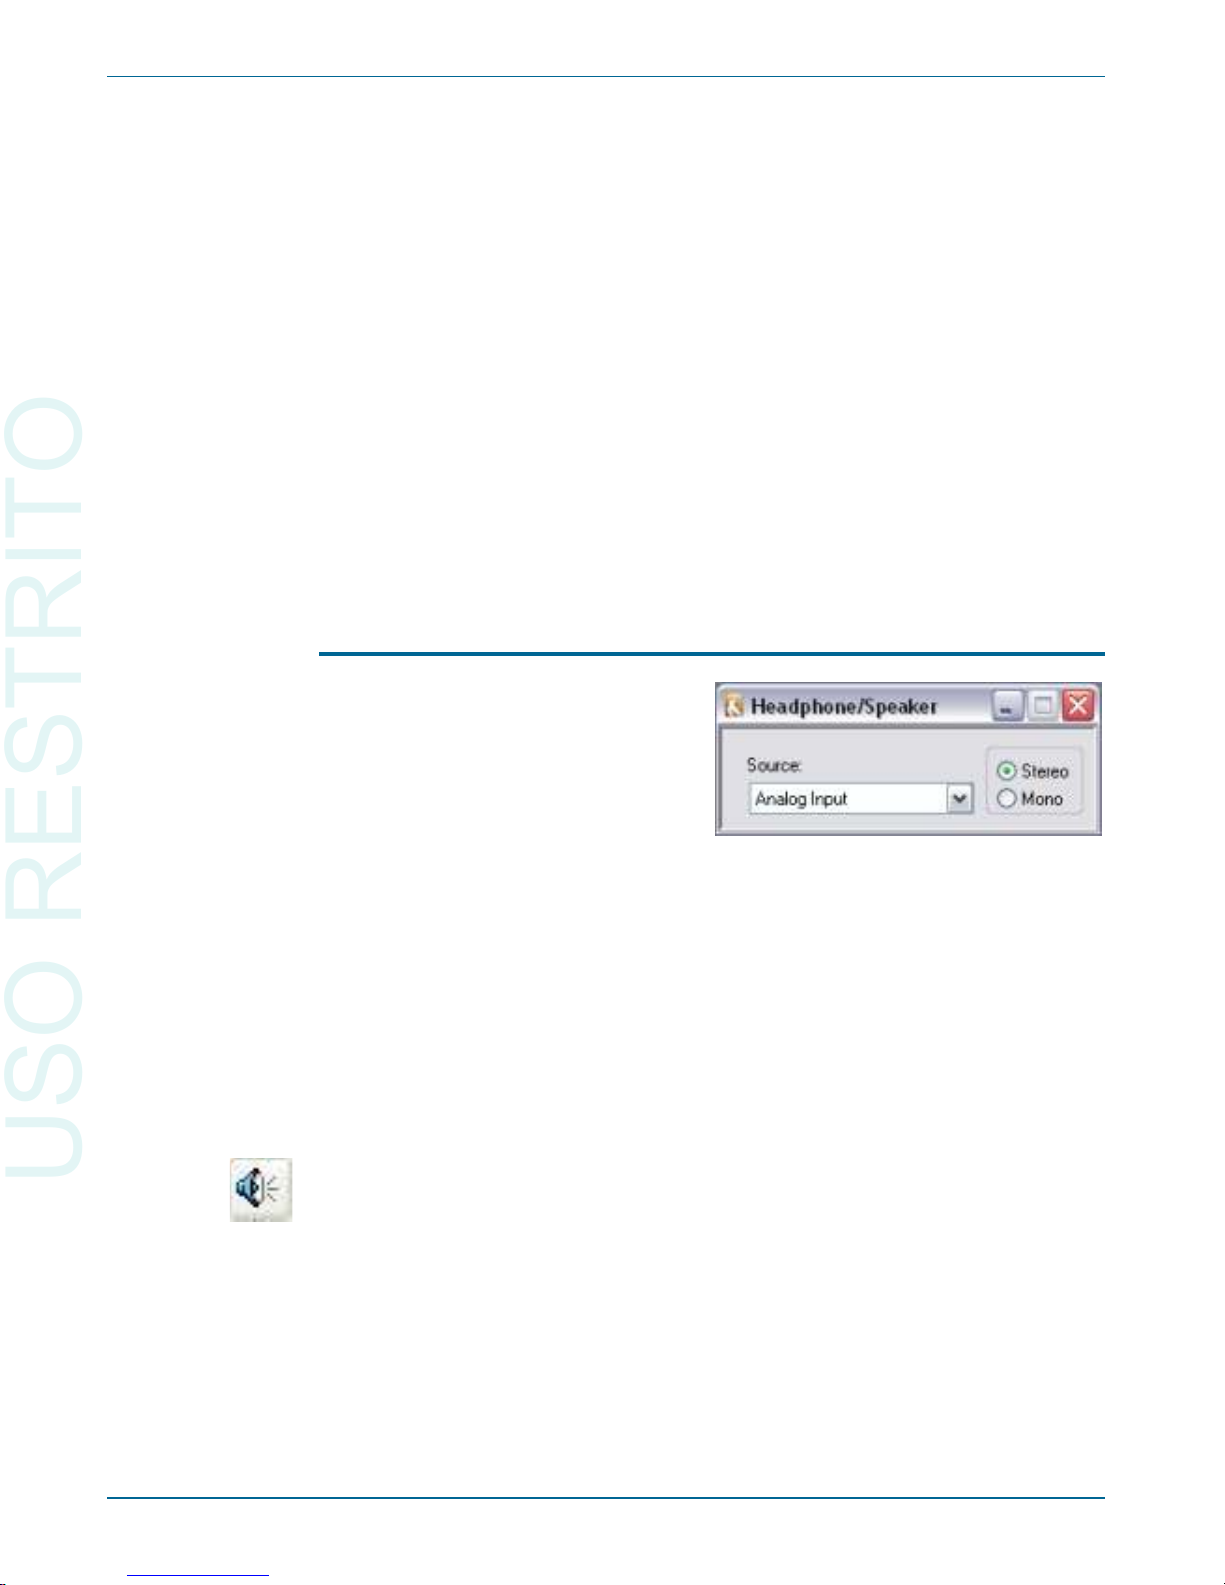
At this point, you should have the setup shown in Fig ure 19:
§
An a log Gen er a tor Chan nel A pro duc ing a 1 V, 1 kHz sine wave.
The Analog Signal Path Chapter 5: Quick Guides
Getting Started with Your 2700 Series Instrument 35
Figure 19. Analog Generator routed to Analog Analyzer inputs; generator Channel B is
set OFF in this illustration.
USO RESTRITO
Page 46
§
An a log Gen er a tor Chan nel B OFF.
§
An a log An a lyzer Chan nel A and B in put Sources set to the in ter nal gen er a tor path, GenMon.
The top most me ters in the An a log An a lyzer panel (just be low the Source
se lec tion fields) show the au dio level in volts. You should see ap prox i mately
1 V in the left-hand me ter (Chan nel A), and ap prox i mately 0 V in the righthand me ter (Chan nel B). Click the CHB but ton on the An a log Gen er a tor panel
to re-en able the Chan nel B gen er a tor sig nal. You now see ap prox i mately 1 V
in the right-hand level me ter on the An a log An a lyzer panel, since the Chan nel
B gen er a tor is now ac tive and its sig nal is be ing routed to the an a lyzer via the
GenMon in ter nal path.
The me ters in the next row of the An a log An a lyzer panel show the fre quency of the sig nal in each chan nel. Both of these me ters should be reading
very close to 1 kHz, the fre quency of the an a log gen er a tor.
Audible Signal Monitor
2700 se ries in stru ments have an in ter nal mono speaker to mon i tor both an a log and dig i tal in put sig nals. In ad di tion, the sig nal at the speaker is avail able
at the head phone jack on the in stru ment front panel. The vol ume con trol for
sig nals ap plied to both the speaker and the head phone jack is lo cated on the
front panel next to the jack. When a head phone plug is in serted into the jack,
the in ter nal speaker is dis con nected.
The sig nal ap plied to the speaker and head phone jack is se lected on the
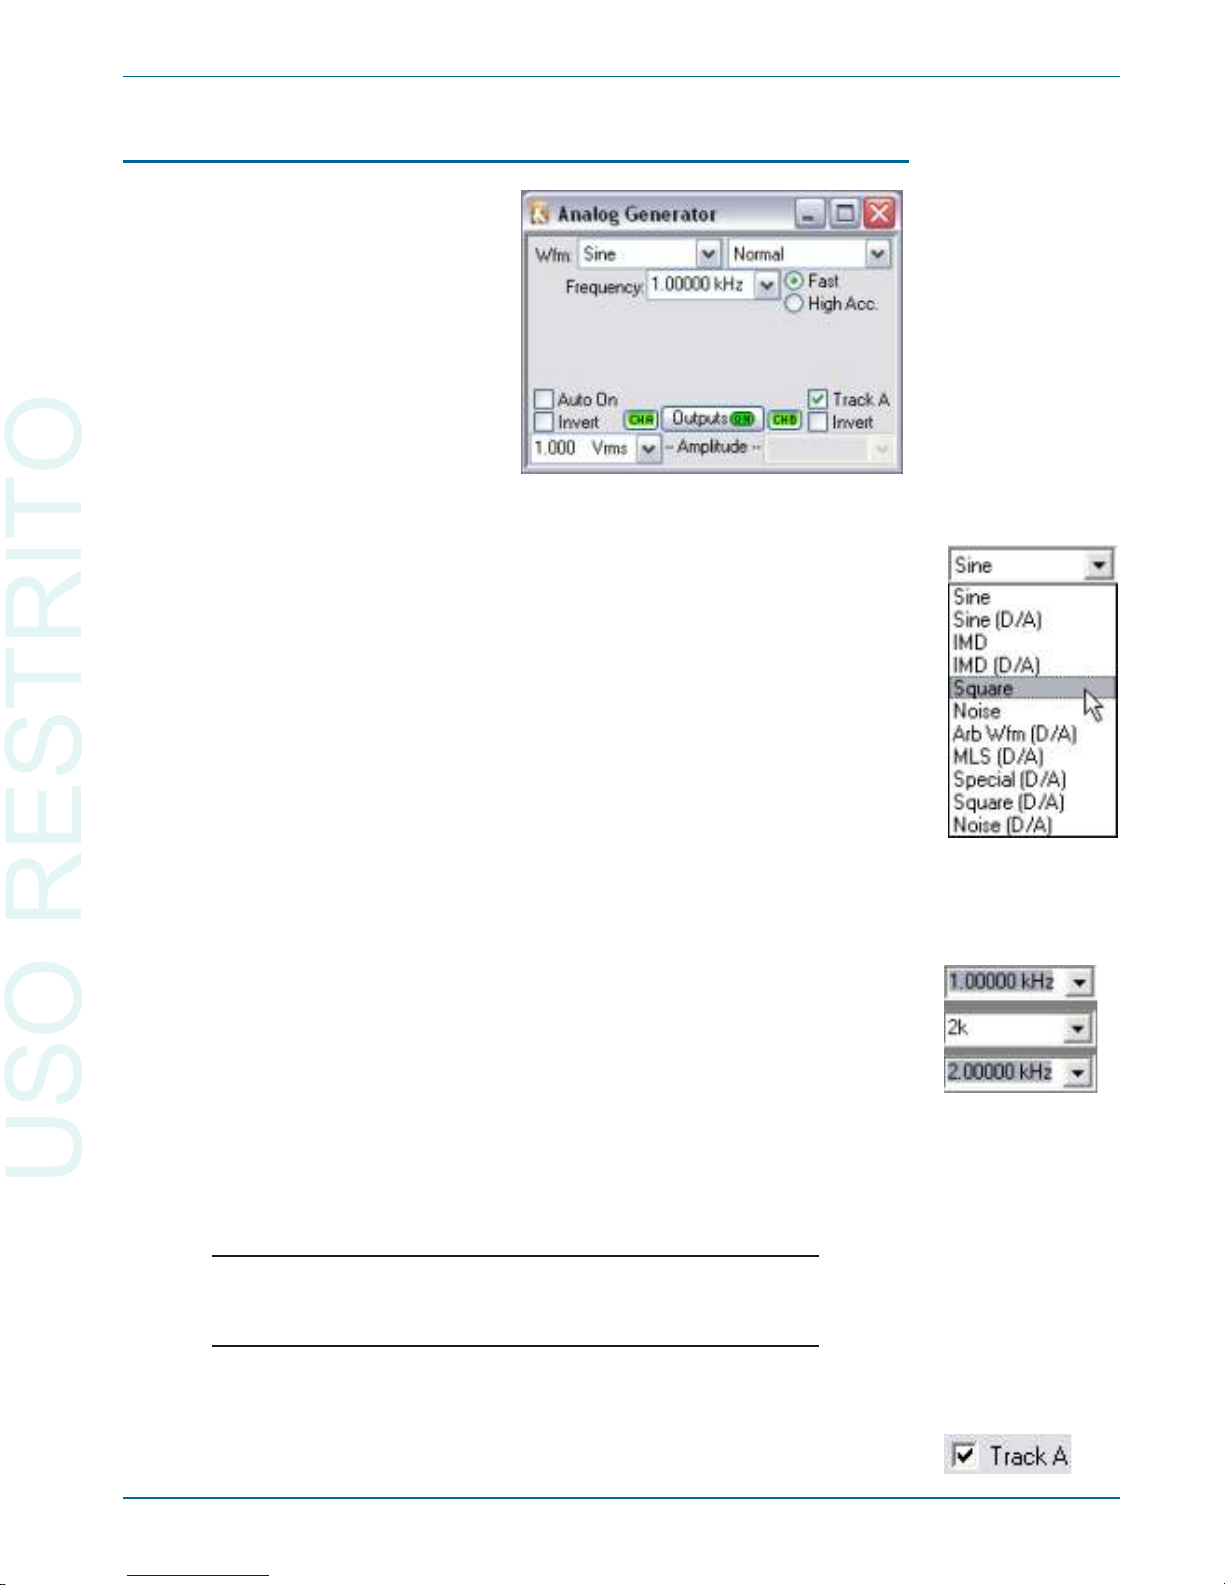
Head phone/Speaker panel. Click the Head phone/Speaker but ton on the Panel
toolbar, or go to Panels > Head phone/Speaker on the Main menu. On the
Head phone/Speaker panel, drop the Source list and se lect An a log In put, and
turn up the front panel vol ume con trol. You will hear the 1 kHz tone from the
gen er a tor be come louder. In the de fault New Test setup, the Head phone/
Speaker mode is ste reo, and the mono speaker in the in stru ment sums both
chan nels of the sig nal. Click the CHA but ton on the An a log Gen er a tor to dis able the chan nel A sig nal. The speaker level will drop by about half, since it is
now re pro duc ing only the chan nel B sig nal. Click CHA ON again, and the
sound will get louder.
Chapter 5: Quick Guides The Analog Signal Path
36 Getting Started with Your 2700 Series Instrument
Figure 20. Headphone/Speaker panel set
for Analog Input Source.
USO RESTRITO
Page 47
Controlling the Analog Generator
The top most two fields in the An a log Gen er a tor panel con trol the gen er a tor
wave form. The An a log Gen er a tor is ca pa ble of pro duc ing sine waves, square
waves, noise and other wave forms. At this point the wave form should be set to
Sine: Nor mal (Sine in the left field, that is, and Nor mal in the right). Drop
down the left-hand list box and choose Square to change the wave form to a
square wave. If you are mon i tor ing the sig nal with the in ter nal speaker, you
will hear the tim bre of the sig nal change. You will also see the sig nal level
change in the An a log An a lyzer panel. (A square wave has a higher rms level
than a sine wave for a given am pli tude set ting.)
The square wave form has one pa ram e ter or set ting available: the fre quency.
This is set in the field be low the wave form se lec tion fields. We will now
change the gen er a tor fre quency to 2 kHz, as fol lows:
§
Click in the Fre quency field in the An a log Gen er a tor panel. The text
1.00000 kHz be comes high lighted.
§
Use the key board to type 2k, the new gen er a tor fre quency. As you can
hear in the mon i tor speaker, the fre quency does not change.
§
Now press the En ter key. The text changes to 2.00000 kHz, the pitch in -
creases from the mon i tor speaker, and the fre quency read ing in the An a log An a lyzer panel changes to about 2 kHz.
Now switch the wave form type back to sine. The cur rent square wave fre quency is used for the sine wave.
You can enter standard SI prefixes for multipliers as you
enter the value in the setting field. For example, ‘2000’, ‘2k’,
‘0.002M’, and ‘2000000m’ all produce the same frequency.
All wave forms can be gen er ated at any am pli tude from 0 V to the max i mum
out put volt age of the in stru ment. The am pli tude for each chan nel is con trolled
by fields be low the OUTPUTS field. If the Track A checkbox is checked, the
The Analog Signal Path Chapter 5: Quick Guides
Getting Started with Your 2700 Series Instrument 37
Figure 21. The Analog Generator.
USO RESTRITO
Page 48
am pli tude is iden ti cal in both chan nels and is set by the Chan nel A Am pli tude
field at the left of the panel. If Track A is un checked, a Chan nel B Am pli tude
field ap pears at the right of the panel, and the am pli tudes of the two chan nels
can be var ied in de pend ently.
Change the Chan nel A Am pli tude to 0.5 V by click ing in the Am pli tude
field on the An a log Gen er a tor panel, typ ing 0.5, and pressing En ter. The level
me ter read ing on the An a log An a lyzer panel will change. (You will also hear
re lays click if the sys tem needs to change the an a log range.) Now uncheck
Track A and set the chan nel B am pli tude to 10 V. The level me ters on the An a lyzer panel will show the dif fer ent lev els. Both fre quency me ters, how ever,
will show the same fre quency. This is be cause the Sine: Nor mal wave form
gen er ates iden ti cal fre quen cies in the two chan nels.
The Sine (D/A): Ste reo wave form, which is ob tained by choos ing Sine (D/
A) from the left-hand wave form field and Ste reo from the right-hand wave -
form field, can gen er ate in de pend ent fre quen cies in the two chan nels. You can
ver ify the fre quency in set each chan nel by re fer ring to the fre quency me ters
on the An a log An a lyzer panel.
Units
Set tings and read ings con sist of a value and a unit. The 2700 se ries can con -
vert the units of a set ting or read ing to a re lated unit. For in stance, the an a log
gen er a tor am pli tude can be set in Vp (volts peak), dBV (deci bels rel a tive to
1 V), and sev eral other units. Sim i larly, read ings can be dis played on a me ter
in any of the re lated units.
The list of units for a set ting or read ing can be viewed by click ing the
down ward-pointing ar row next to the set ting or read ing field. For in stance, the
list of units for the an a log gen er a tor am pli tude can be dis played by click ing on
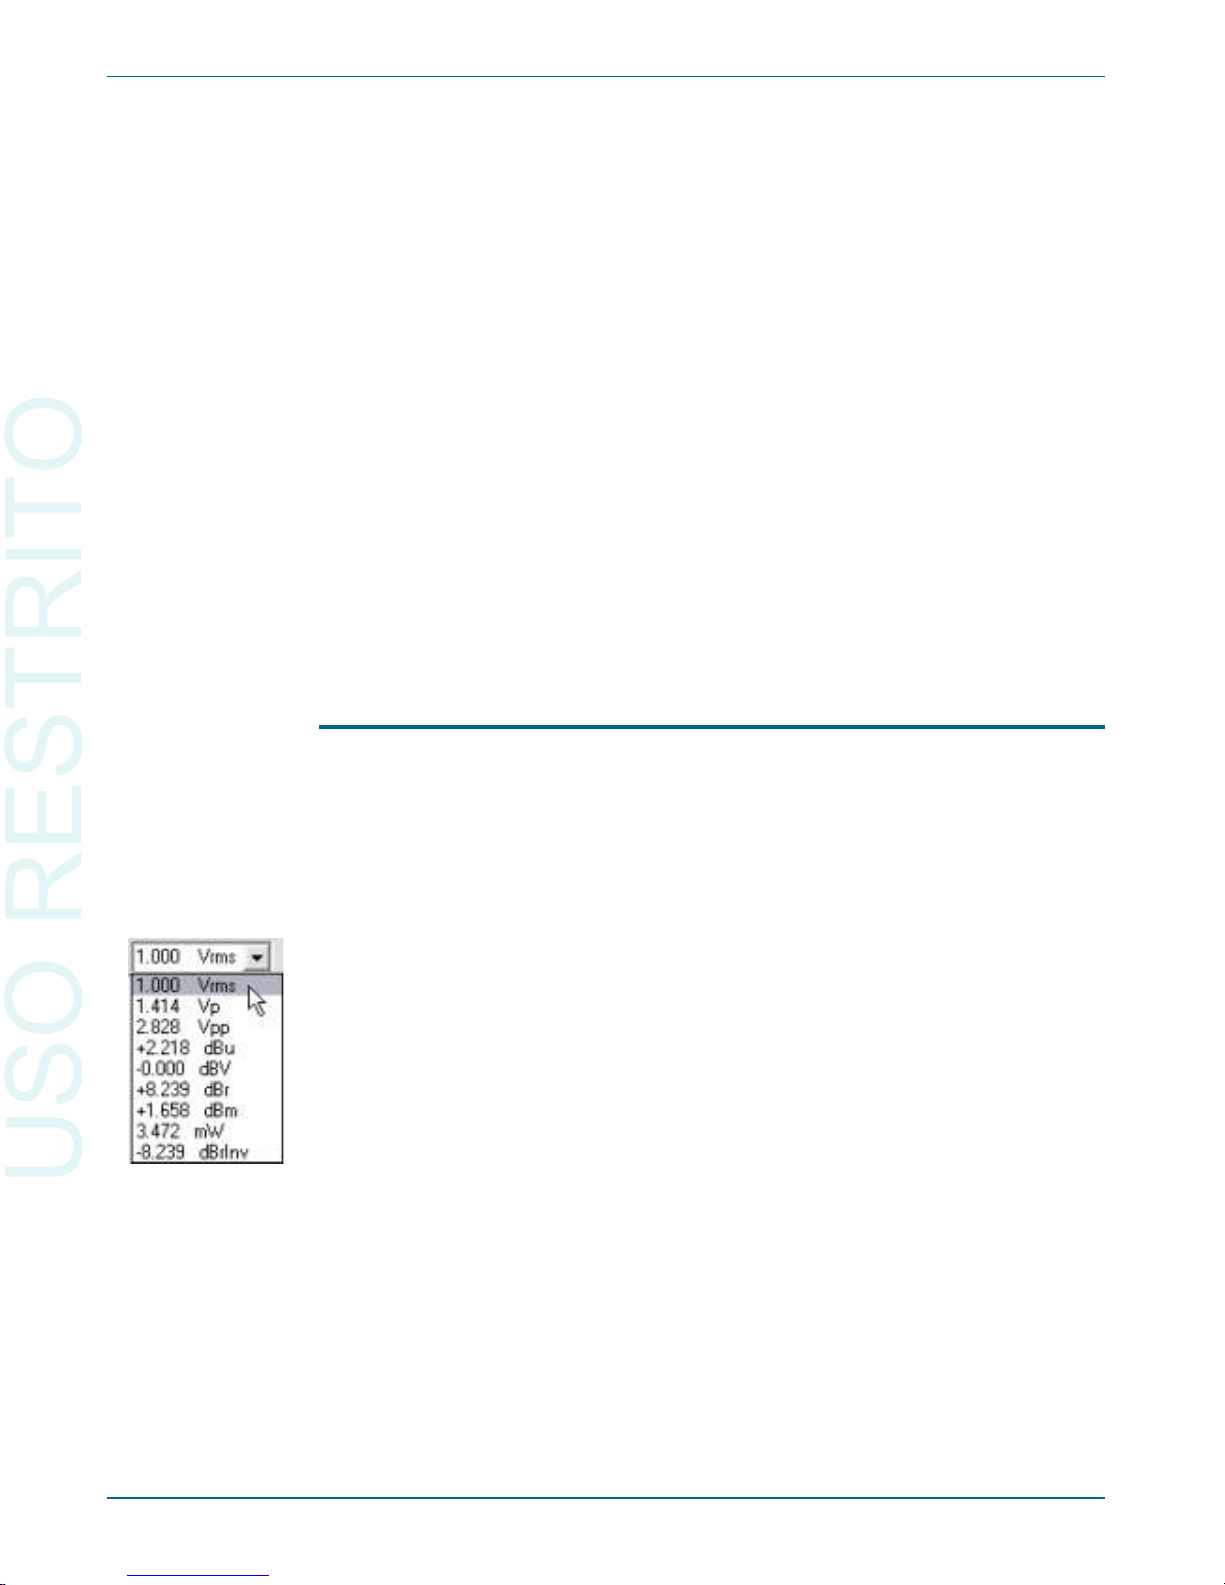
the ar row next to the Am pli tude field on the An a log Gen er a tor panel. The con trol soft ware dis plays the value cur rently in the field, con verted to each avail able unit. By click ing on the list, you can choose a set ting unit.
As an ex am ple, if the am pli tude is set to 1 Vrms, the drop-down list in cludes con ver sions such as 1.414 Vp and 2.220 dBu. If you click on the line
dis play ing the am pli tude in Vp, the set ting changes to 1.414 Vp. The gen er a tor
am pli tude has not changed; the set ting is dis played in a dif fer ent unit. You can
now set the gen er a tor am pli tude in Vp.
Some units, such as dBr, de pend on a ref er ence set in a ref er ence field, such
as those at the bot tom of the large views of the An a log Gen er a tor or An a log
An a lyzer panels. Re fer to Ap pen dix A of the 2700 Se ries User’s Man ual for
more in for ma tion about units of mea sure ment.
Chapter 5: Quick Guides The Analog Signal Path
38 Getting Started with Your 2700 Series Instrument
USO RESTRITO
Page 49
Sweeps
Most de vice test ing with the 2700 series is per formed us ing sweeps. In a
sweep, a set ting is stepped over a pr e-defined range, while se lected read ings
are gath ered. The re sult is a ta ble of data re lat ing the read ings to each value of
the set ting.
For in stance, if you wanted to mea sure the fre quency re sponse of an an a log
am pli fier, you might vary the fre quency of the An a log Gen er a tor from 20 Hz
to 20 kHz in 30 log a rith mic steps, while mon i tor ing the An a log An a lyzer
Chan nel A and Chan nel B level read ings. The re sult would be a ta ble of data
with 30 rows (one for each fre quency step) and 3 col umns (one for the fre quency set ting, one for the Chan nel A level read ing, and one for the Chan nel B
level read ing).
You can force the 2700 series to perform a “single-point
sweep” for special purposes, but generally the term sweep
indicates that a number of data points are included in the
measurement.
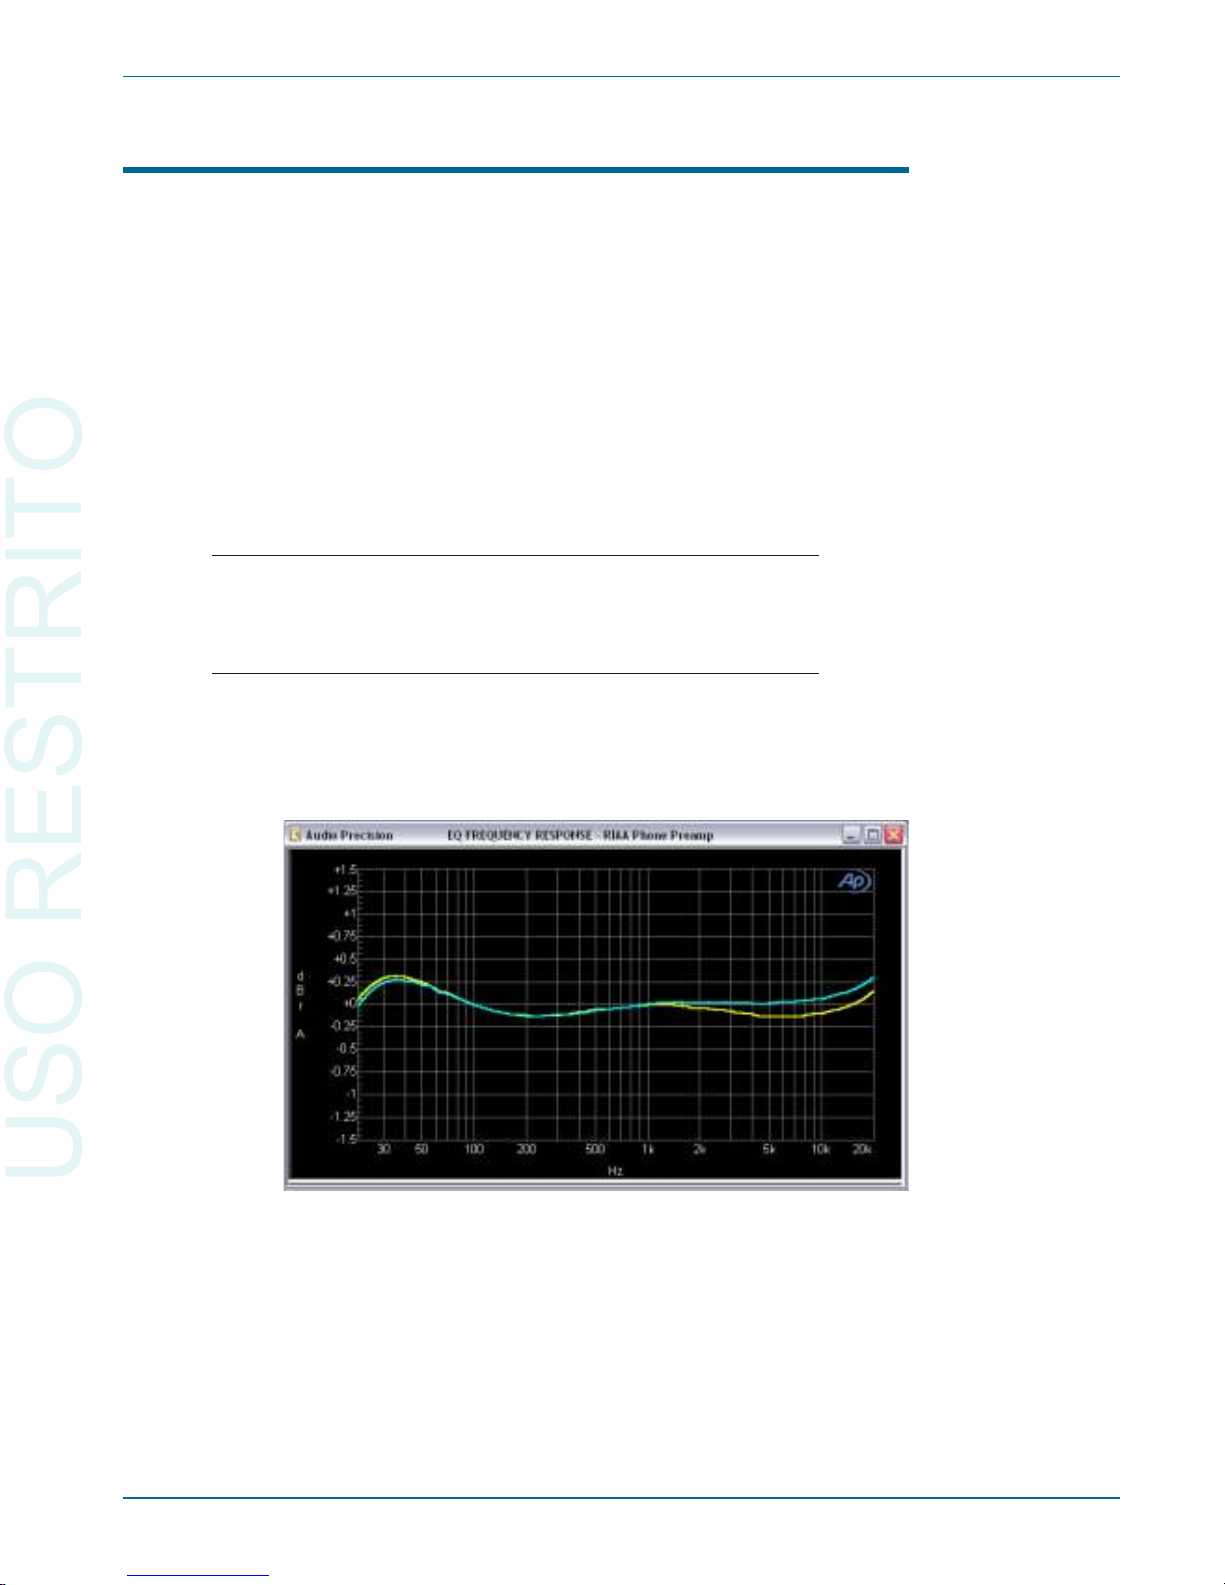
When a sweep is per formed, a graph is also cre ated. This is a graph i cal rep re sen ta tion of the data ob tained dur ing the sweep. Fig ure 22 shows an ex am ple
of a ste reo fre quency re sponse graph.
The Sweep panel con tains many more fea tures than are de scribed here. See
Chap ter 17 of the 2700 Se ries User’s Man ual for more in for ma tion.
Sweeps Chapter 5: Quick Guides
Getting Started with Your 2700 Series Instrument 39
Figure 22. A typical frequency response graph.
USO RESTRITO
Page 50
Sweep Fundamentals
Settings and Readings
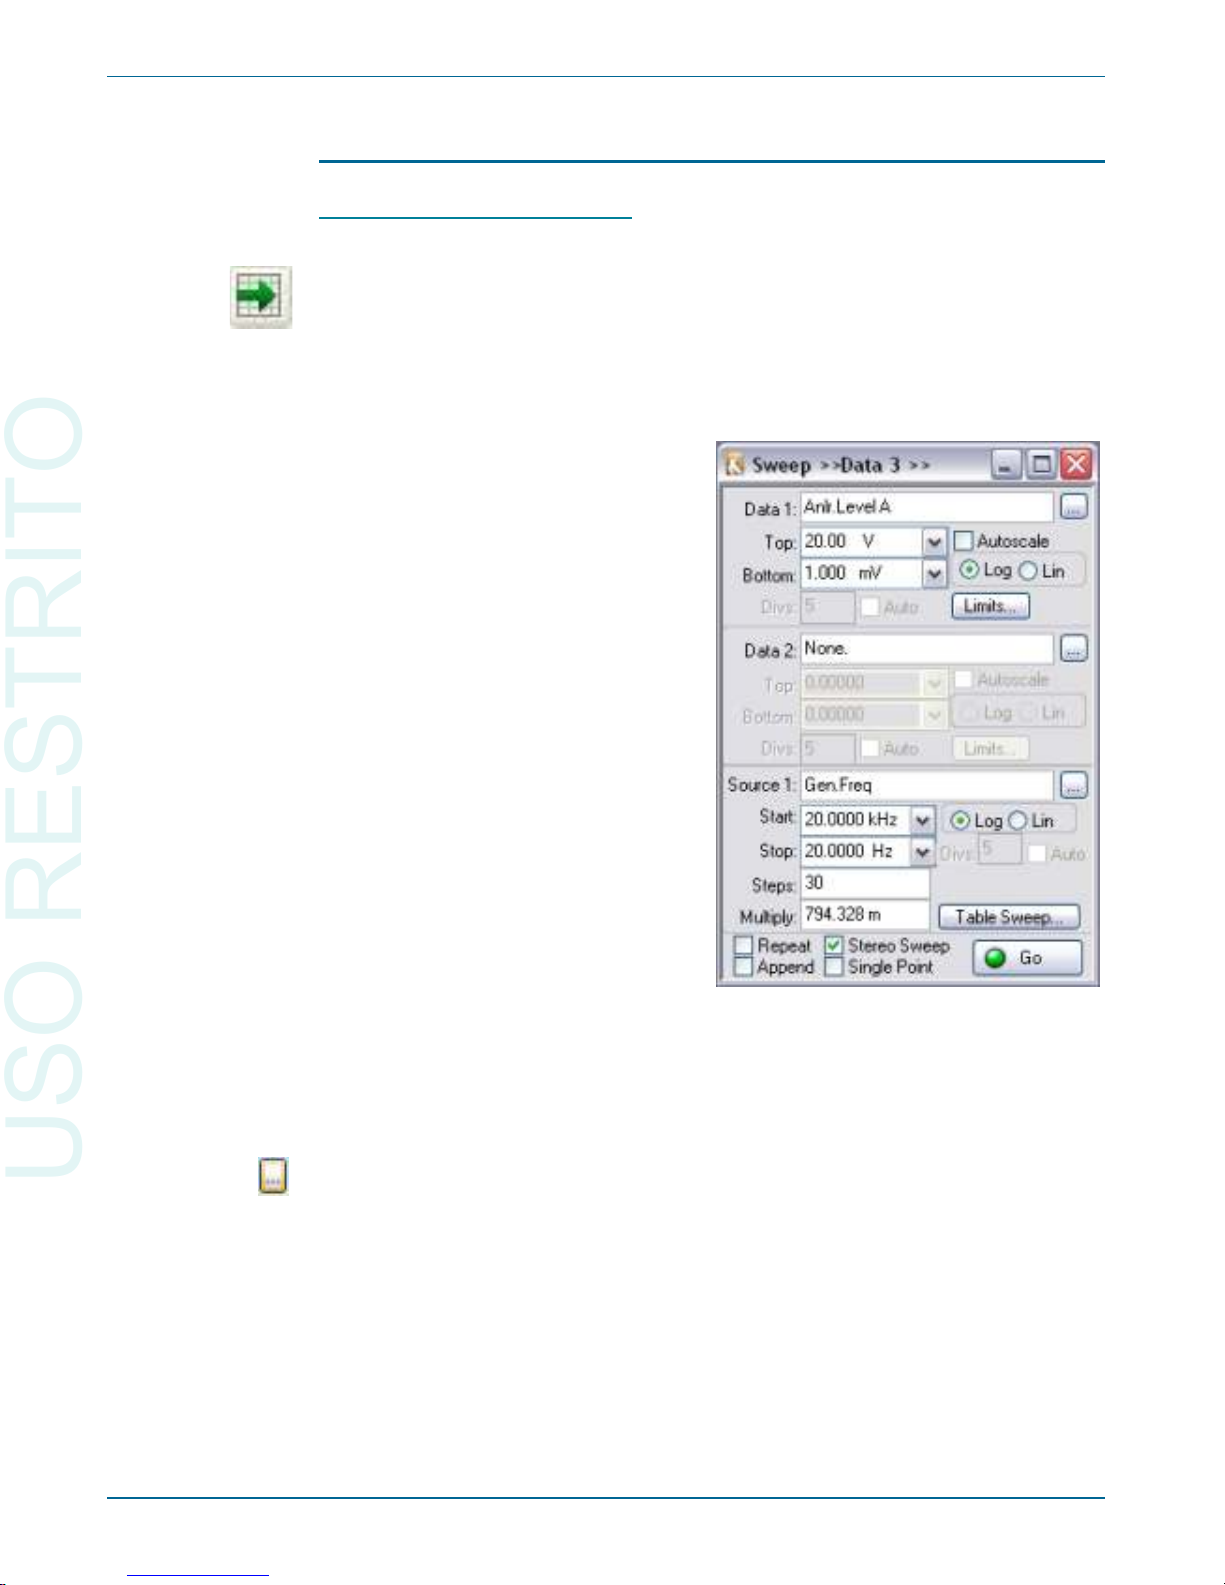
To set up a sweep, open the Sweep panel, ei ther by choos ing
Panels > Sweep, or by click ing on the Sweep but ton. The Sweep panel is di -
vided hor i zon tally into two ma jor ar eas: the Data (read ing) area above, and
the Source (set ting) area be low. Dur ing the sweep, the set ting cho sen in the
Source 1 field is var ied, and the read ings spec i fied in the Data fields are gath -
ered.
To choose the set ting to be var ied, click on the el lip sis but ton to the right of
the Source 1 field. In the browser, choose an in stru ment from the left pane and
a set ting from the right pane. For in stance, if you choose Gen from the in stru ment side and Freq from the set ting side, the fre quency of the An a log Gen er a -
tor will be var ied dur ing the sweep. This is shown in the Source 1 field as
Gen.Freq.
Chapter 5: Quick Guides Sweeps
40 Getting Started with Your 2700 Series Instrument
Figure 23. The Sweep panel. This
configuration was used to create the graph
of Figure 22.
USO RESTRITO
Page 51
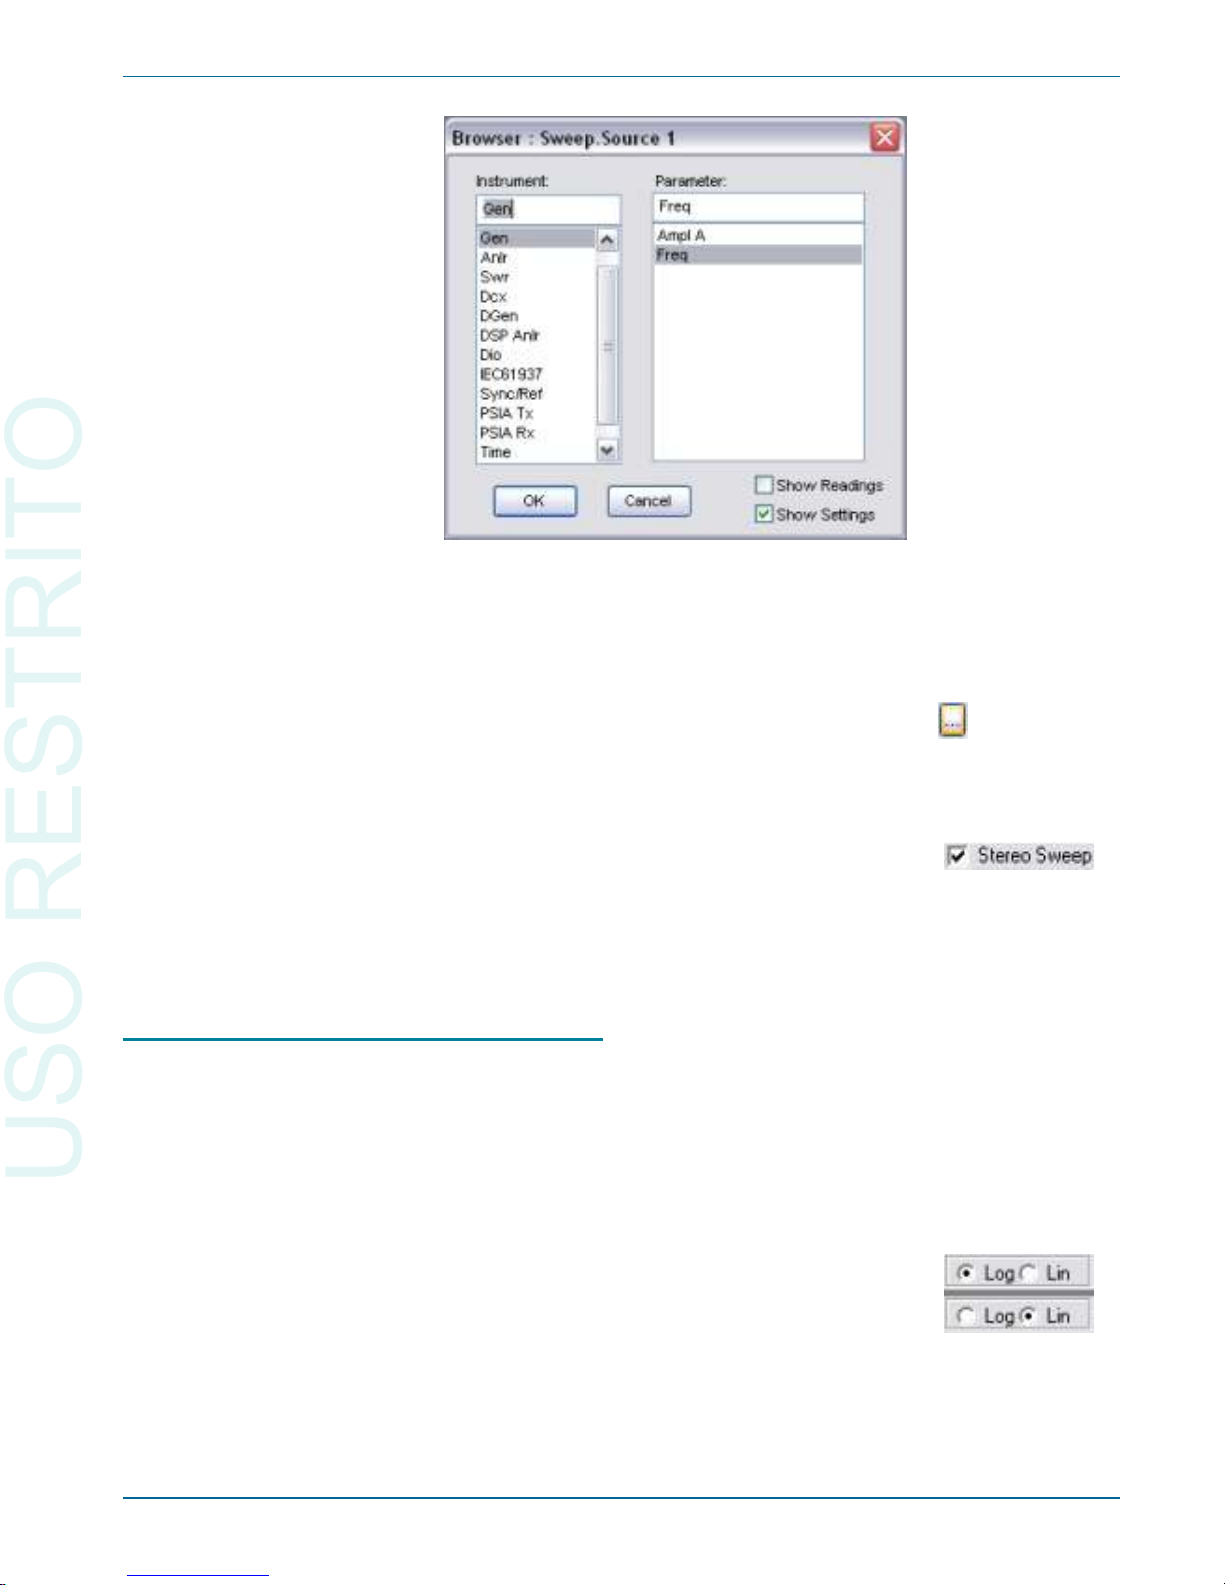
To choose a set of read ings to be gath ered, click on the ellipses but ton to
the right of the Data 1 field. The browser shows in stru ments in the left pane
and read ings in the right pane. If you choose the Anlr in stru ment and the
Level A read ing, the level on chan nel A will be re corded dur ing the sweep.
This is shown in the Data 1 field as Anlr.Level A.
The Ste reo Sweep checkbox near the bot tom of the Sweep panel au to mat i cally en sures that read ings from both chan nels are gath ered dur ing the sweep.
For in stance, if you choose Anlr.Level A as the read ing in Data 1 and then
check the Ste reo Sweep checkbox, the read ing Anlr.Level B will also be gath -
ered (in Data 3) dur ing the sweep.
Source Range, Steps, and Spacing
Dur ing the sweep, the set ting in Source 1 is stepped from the Start value to
the Stop value shown in fields be low Source 1. The num ber of steps in the
sweep is shown in the Steps field. A but ton to the right of these fields con trols
whether suc ces sive set tings are sep a rated lin early or logarithmically. In a lin -
ear sweep, the dif fer ence be tween suc ces sive set tings is con stant. In a log a rith mic sweep, the ra tio be tween suc ces sive set tings is con stant.
For ex am ple, if the Start fre quency is 20 Hz, the Stop fre quency is 20 kHz,
there are 3 steps, and the Spacing is log a rith mic, the con trol soft ware will first
set the gen er a tor to 20 Hz, then 200 Hz, then 2 kHz, and fi nally 20 kHz; that
is, the ra tio be tween suc ces sive fre quency set tings is 10.
On the other hand, if the Spacing is lin ear, the gen er a tor is fir st set to 20 Hz,
then 6680 Hz, then 13340 Hz, and fi nally 20 kHz; that is, the dif fer ence be tween suc ces sive fre quency set tings is 6660 Hz.
Sweeps Chapter 5: Quick Guides
Getting Started with Your 2700 Series Instrument 41
Figure 24. A Sweep browser. Appearance is similar
for Source and Data browsers, for settings or for
readings.
USO RESTRITO
Page 52
Data Display Range
A graph is au to mat i cally cre ated when a sweep is run. The Start and Stop
val ues for Source 1 de fine the ex tent of the hor i zon tal (x-) axis. The ex tent of
the ver ti cal (y-) axis is de ter mined by the val ues in the Top and Bot tom fields
be neath Data 1.
The units of the y-axis are the same as the units in the Top and Bot tom
fields. If you change the units of the Top or Bot tom field, the units in the other
field will also change. See Units on page 38 for more in for ma tion on units.
We will now per form two ex am ple sweeps: a fre quency re sponse sweep,
and an am pli tude lin ear ity sweep.
Example Sweep: Frequency Response
For this ex am ple, we will mea sure the fre quency re sponse flat ness of the
2700 se ries it self. We con nect the an a log out put to the an a log in put, sweep the
fre quency of the an a log gen er a tor over the au dio range, and plot the level mea sured by the an a lyzer against fre quency.
First, click the New Test but ton, turn the an a log gen er a tor on, and set both
An a log An a lyzer in put chan nels to GenMon so that the gen er a tor sig nal is
sent di rectly to the an a log in put. Now click the Sweep but ton to open the
Sweep panel. The de fault sweep is a mono fre quency re sponse sweep, so we
only have to make a few mod i fi ca tions:
§
Check the Ste reo Sweep box to cre ate a ste reo sweep.
§
Change the Steps from 30 to 100 for a more de tailed re sponse.
§
The de fault range for Data 1 is quite wide, and the units are Volts.
Change the units to dBV by click ing on the ar row next to the Top field.
From the list, choose the dBV line. (Note that the units in the Bot tom
Chapter 5: Quick Guides Sweeps
42 Getting Started with Your 2700 Series Instrument
Review
To set up a sweep, you must:
§
set Source 1 to the set ting to be var ied dur ing the sweep;
§
set Data 1 to the read ing to be col lected dur ing the sweep;
§
click Ste reo Sweep if you wish to col lect data from both chan nels;
§
set the Start, Stop, Steps, and Lin/Log for Source 1; and
§
set the Top and Bot tom val ues and units for Data 1.
Once the sweep is set up, you can run it by click ing the Go but ton at
the bot tom of the Sweep panel.
USO RESTRITO
Page 53
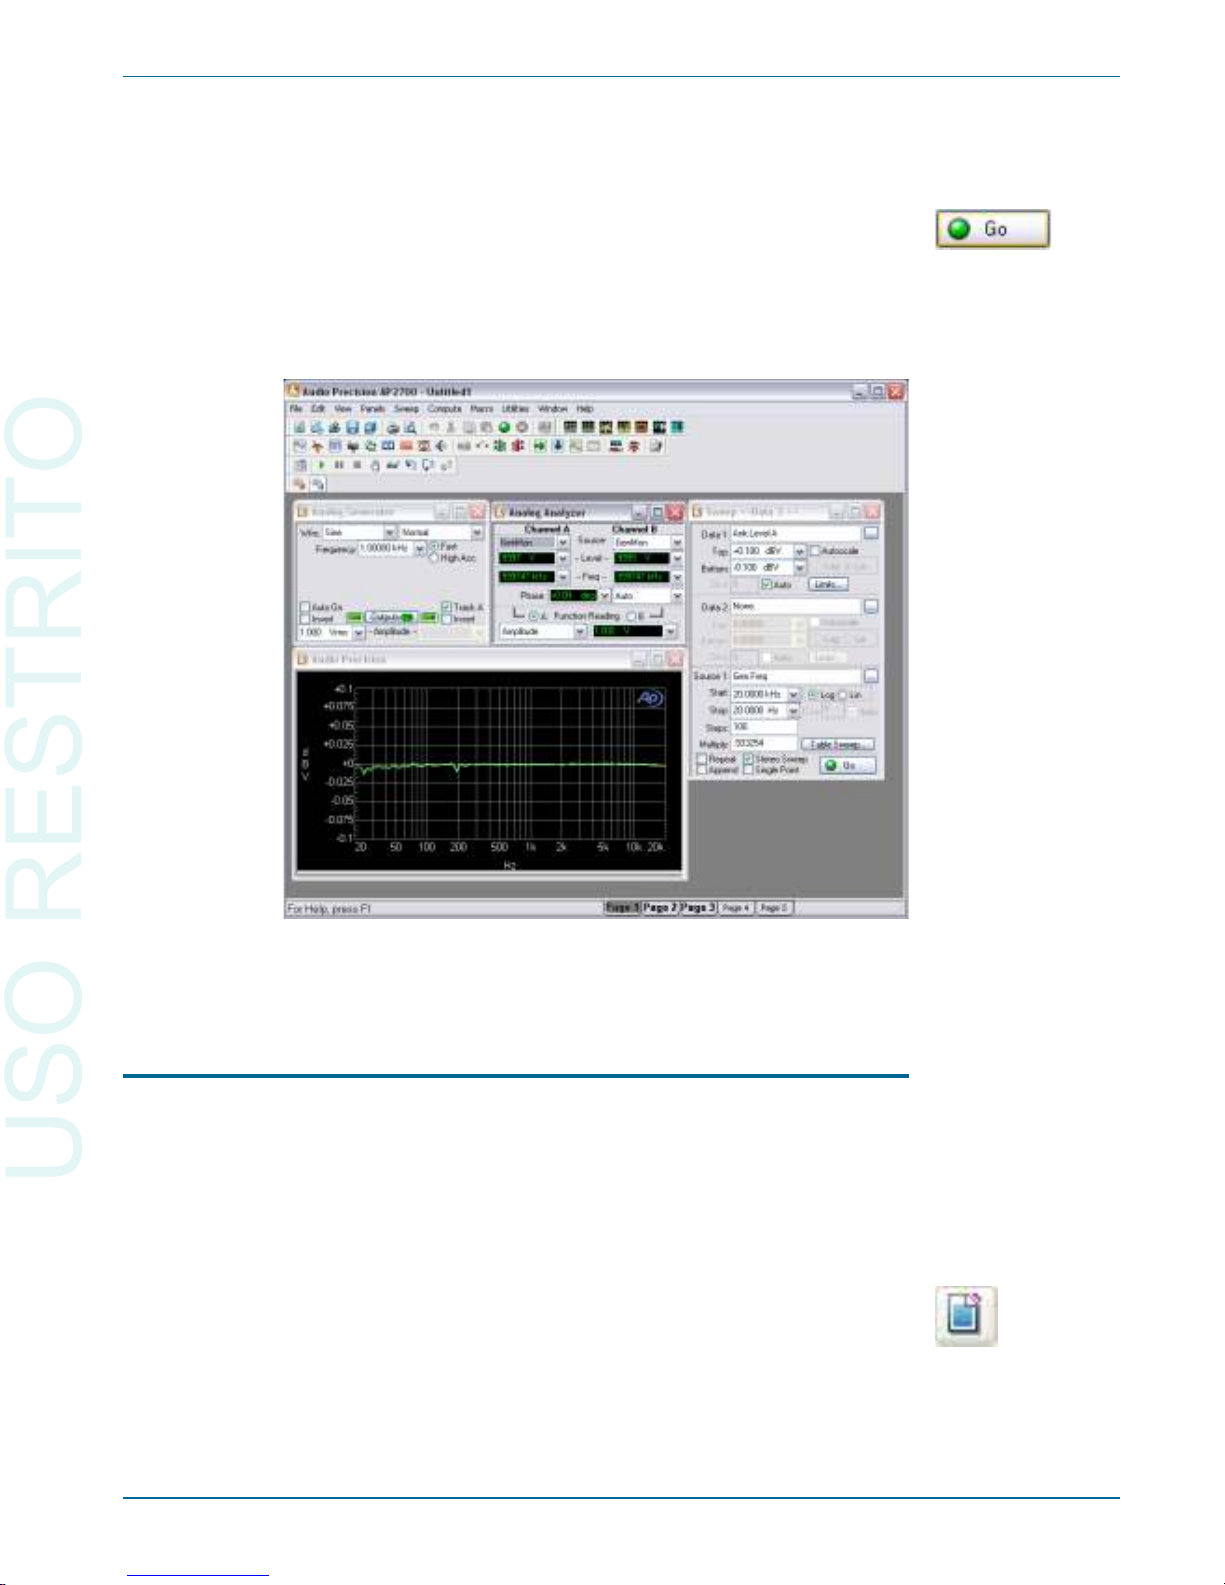
field change also.) In the Top field, type 0.1. In the Bot tom field,
type –0.1.
You can now click the Go but ton to run the sweep. A graph is cre ated, and
the re sponse is plot ted as the sweep pro gresses. If you are mon i tor ing us ing
the in ter nal speaker, you will hear the an a log gen er a tor fre quency step through
the au dio range. The re sult will be a re sponse curve that de vi ates only slightly
from 0 dBV, as shown in Fig ure 25.
Example Sweep: Amplitude Linearity
For this ex am ple, we will mea sure the am pli tude lin ear ity of the 2700 se ries
in stru ment. With the An a log Gen er a tor out put con nected to the An a log An a lyzer in put, we sweep the am pli tude of the An a log Gen er a tor over its full
range, and plot the ra tio of the level mea sured by the An a log Analyzer Level
me ters to the gen er a tor out put level, in dB. Any am pli tude non-lin ear ity in the
sys tem will show as a de vi a tion from 0 dB.
First, click New Test, turn the An a log Gen er a tor ON, and set the An a log
An a lyzer Source A and B to GenMon so that the gen er a tor sig nal is sent di -
Sweeps Chapter 5: Quick Guides
Getting Started with Your 2700 Series Instrument 43
Figure 25. Current workspace after frequency response sweep,
showing typical results.
USO RESTRITO
Page 54
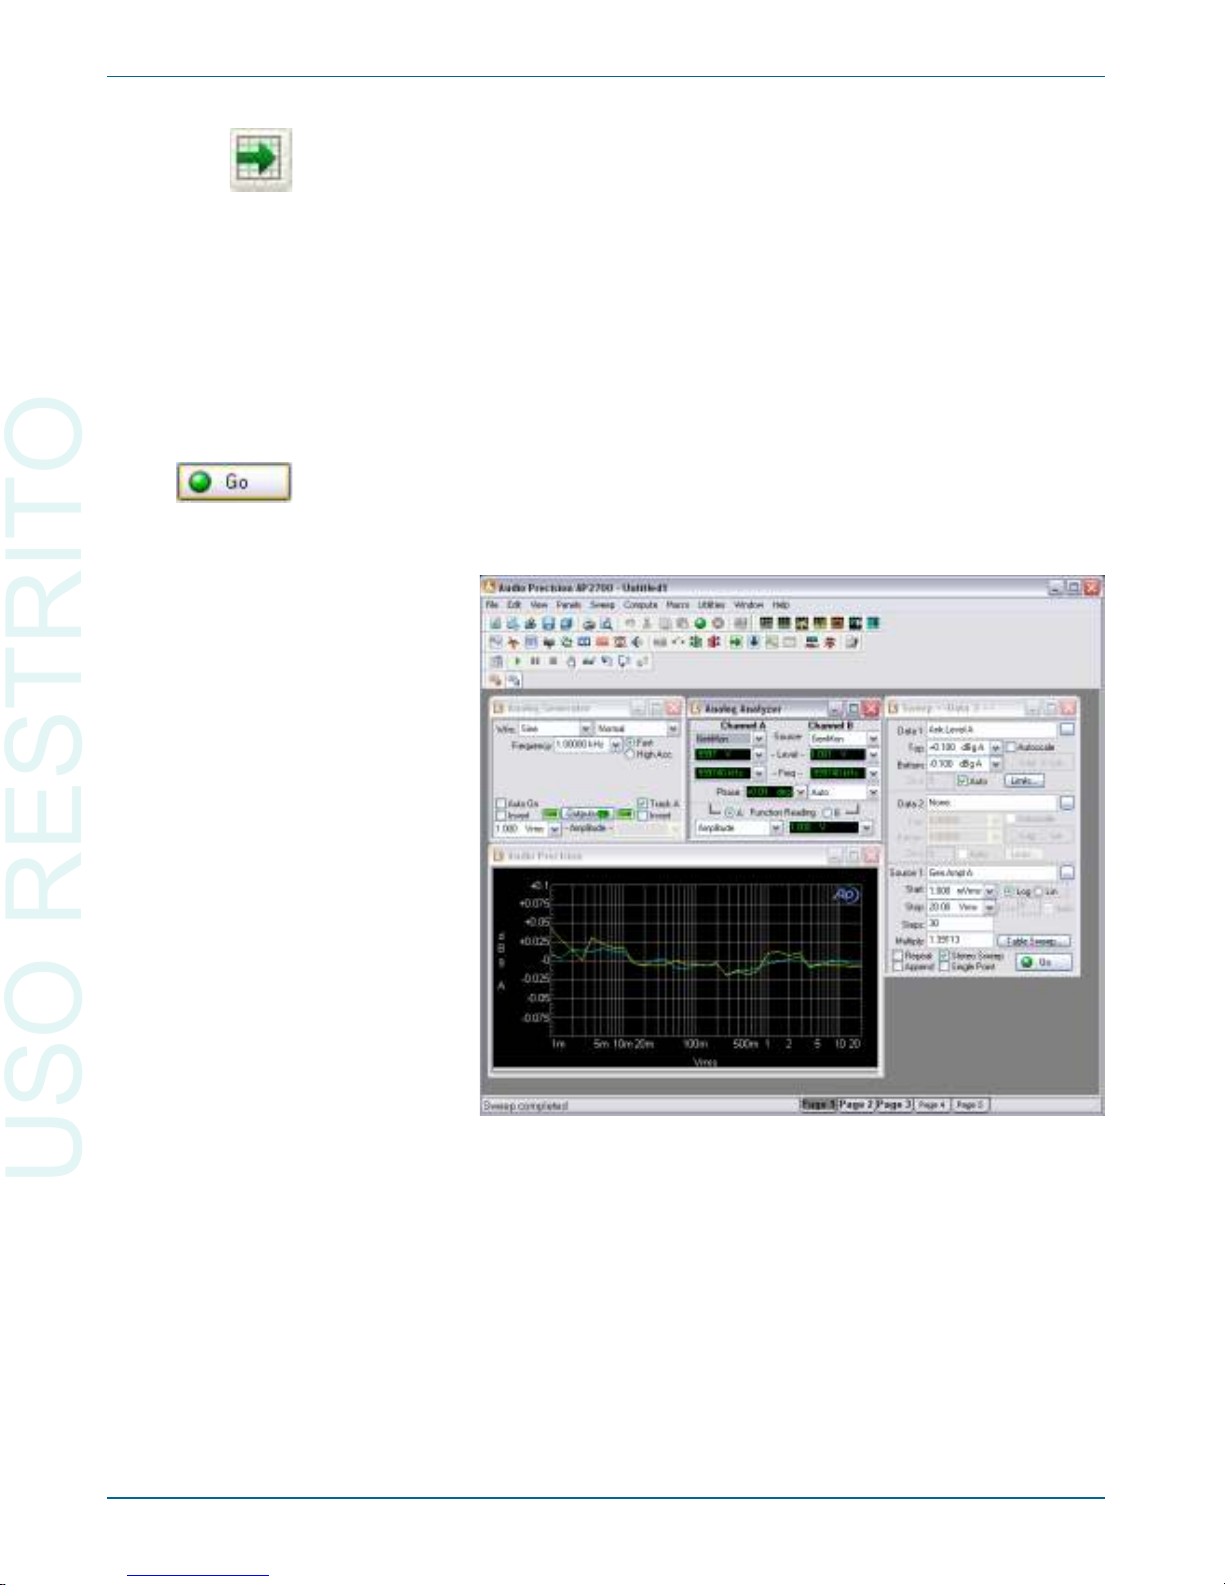
rectly to the an a log in put. Now click the Sweep but ton to open the Sweep
panel and make the fol low ing changes:
§
Click the Source 1 browser but ton, and choose Gen as the in stru ment
and Ampl A as the set ting.
§
Select the dBg A units for Data 1 by click ing on the ar row next to the
Top field, and choos ing the dBg A line from the list. The dBg A units
(deci bels rel a tive to gen er a tor chan nel A) show the ra tio of the read ing to
the level of the An a log Gen er a tor, in dB.
§
Set the Data 1 Top value to 0.1, and the Bot tom value to –0.1.
Click Go to start the sweep. The rang ing re lays will click as the gen er a tor
changes am pli tude. The re sult will be a curve that de vi ates only slightly from
0 dBg A, as shown in Fig ure 26.
Chapter 5: Quick Guides Sweeps
44 Getting Started with Your 2700 Series Instrument
Figure 26. Current workspace after amplitude linearity sweep, showing
typical results.
USO RESTRITO
Page 55
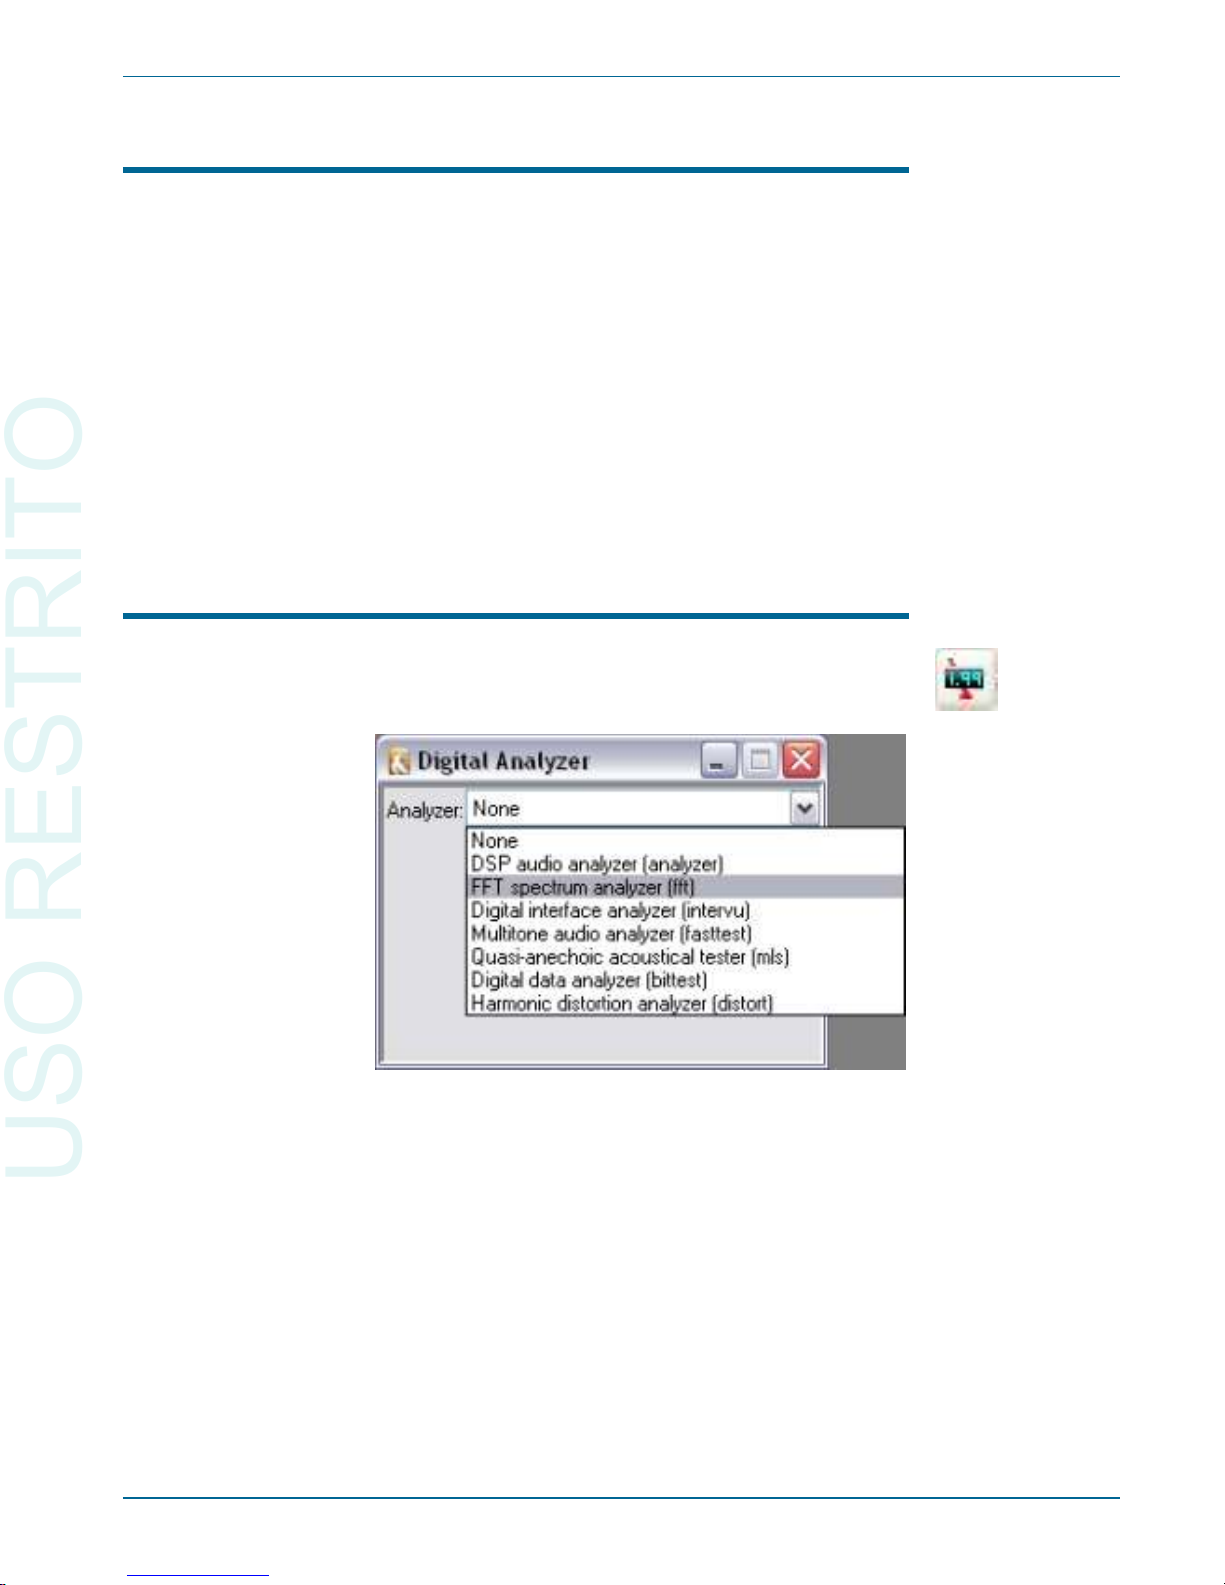
DSP Analysis
In ad di tion to the hard ware-im ple mented An a log An a lyzer, the 2700 se ries
pro vides a num ber of soft ware-im ple mented anal y sis tools in the Dig i tal An a lyzer panel. These tools an a lyze dig i tal do main sig nals us ing dig i tal sig nal
pro cess ing (DSP). The DSP Au dio An a lyzer, which of fers sim i lar ca pa bil i ties
to the An a log An a lyzer, is one ex am ple. An other is the FFT Spec trum An a lyzer, which we will look at next.
An a log sig nals must be con verted from the an a log do main to the dig i tal do main for DSP anal y sis. When per form ing dig i tal anal y sis of an a log sig nals, the
2700 se ries uses the in put cir cuits of the An a log An a lyzer for in ter face and
rang ing, and then routes the an a log sig nals to an an a log-to-dig i tal con verter
(ADC) be fore ap ply ing them to the Dig i tal An a lyzer for DSP anal y sis.
The FFT Spectrum Analyzer
Open the Dig i tal An a lyzer panel by choos ing Panels > Dig i tal An a lyzer or
by click ing the Dig i tal An a lyzer but ton.
At the top of the Dig i tal An a lyzer panel is a drop-down list of the DSP anal y sis tools avail able in the 2700 se ries.
Up to this point, we have been us ing the hard ware-im ple mented An a log
An a lyzer to make mea sure ments. We will now take a look at the FFT Spec -
trum An a lyzer. This anal y sis tool dis plays au dio sig nals in time (os cil lo scopestyle) and in fre quency (spec trum an a lyzer-style). It op er ates in a dif fer ent
fash ion from the An a log An a lyzer, as ex plained next.
DSP Analysis Chapter 5: Quick Guides
Getting Started with Your 2700 Series Instrument 45
Figure 27. Digital Analyzer analysis tool selection.
USO RESTRITO
Page 56

Real-Time vs. Batch-Mode Instruments
The Analog Analyzer is a real-time in stru ment. That is, it re turns r ead ings
con tin u ously, whether or not a sweep is in prog ress. These read ings in clude
level and fre quency, as well as func tions such as dis tor tion or phase. Dur ing a
sweep, read ings from the au dio an a lyzer are di verted f rom the panel me ters to
the sweep en gine for graph ing. Af ter the sweep, the read ings are once again
dis played in the panel me ters.
By con trast, the FFT Spec trum An a lyzer is a batch-mode in stru ment. It does
not gen er ate read ings if a sweep is not be ing per formed. When a sweep is
started, the Spec trum An a lyzer first ac quires a seg ment of au dio by stor ing it
in mem ory. This is in di cated (briefly) on the Sta tus bar as DSP Ac quiring
Data. Once the ac qui si tion is com plete, the Spec trum An a lyzer pro cesses the
data. This is in di cated as DSP Trans forming Data (again, briefly) on the Sta -
tus bar. Once pro cess ing is com plete, the con trol soft ware fetches a batch of
read ings from the Spec trum An a lyzer. At that point, the data is graphed.
The FFT Concept
The FFT (fast Fou rier trans form) is an ef fi cient way to de com pose a pe ri odic sig nal into its com po nent fre quen cies. It trans forms a time-domain sig nal
(such as you might see in an os cil lo scope trace) into a fre quency-domain rep -
re sen ta tion.
As an ex am ple, a high-quality power am pli fier fed with a si nu soi dal in put
will pro duce har monic dis tor tion at its out put that is in vis i ble in an os cil lo scope trace. If an FFT is per formed on the out put sig nal, how ever, the in di vid ual dis tor tion har mon ics can be seen. The pat tern of har mon ics pro vides
in sight into the mech a nisms re spon si ble for the dis tor tion.
The FFT pro cess con sists of the fol low ing steps:
§
Trig gering. The sys tem waits for a trig ger event from the se lected
source, for in stance, a pos i tive-going zero cross ing of the an a log gen er a tor.
§
Ac qui si tion. The sys tem stores the in put au dio in mem ory un til the se lected num ber of au dio sam ples has been re ceived. The more au dio data
ac quired, the more fre quency points there will be in the re sult, and hence
the higher the res o lu tion will be. How ever, lon ger ac qui si tions take more
time.
§
Win dow ing. Be fore trans for ma tion, the au dio data is shaped in time by
mul ti ply ing it with a pre-defined en ve lope. This in creases the ac cu racy
of the am pli tude val ues re turned from the FFT.
Chapter 5: Quick Guides The FFT Spectrum Analyzer
46 Getting Started with Your 2700 Series Instrument
USO RESTRITO
Page 57
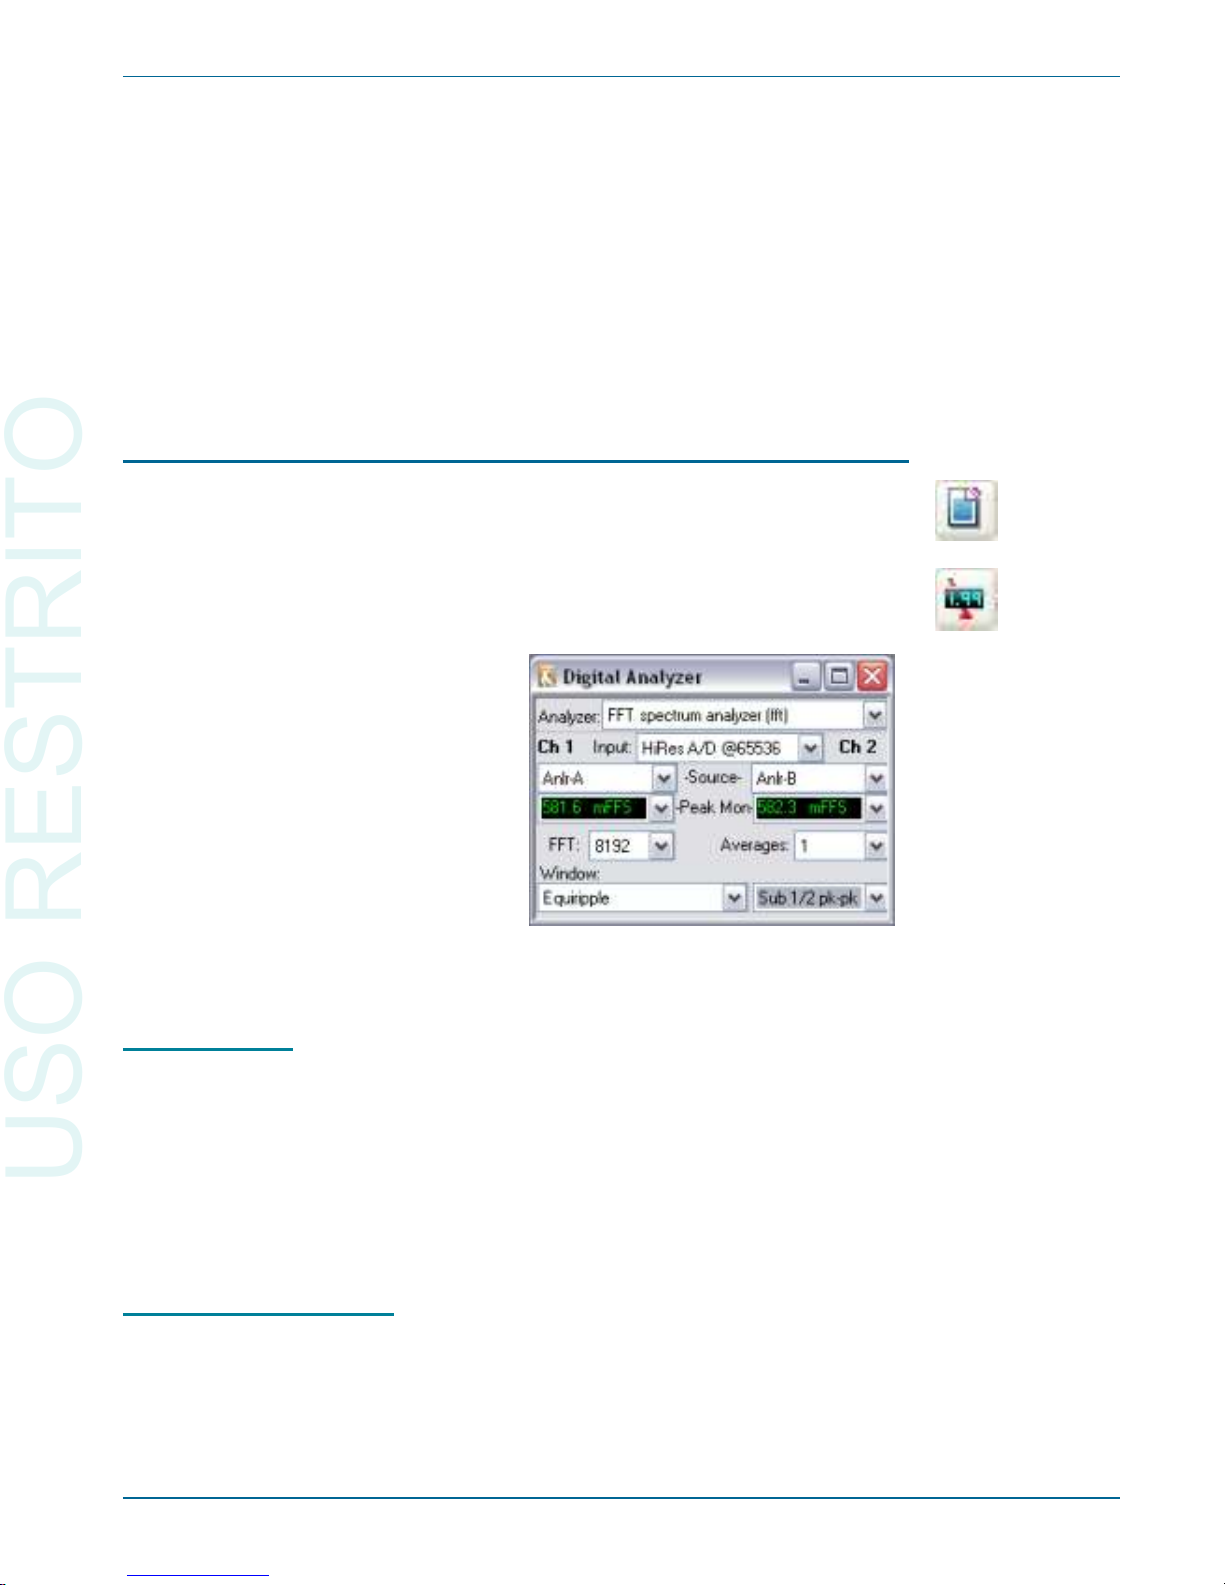
§
Trans for ma tion. The win dowed au dio data is trans formed by the FFT.
This re sults in an ar ray of points de scrib ing the mag ni tude and phase of
each fre quency in the au dio sig nal.
§
Dis play. The con trol soft ware fetches the trans formed au dio data and
graphs it. Be cause the num ber of trans formed points is typ i cally larger
than the num ber of points in the graph, a peak-picking method is used to
en sure that peaks in the fre quency data are not missed.
For more in for ma tion, see Ap pen dix C of the 2700 Se ries User’s Man ual.
Setting up an FFT
Click New Test and open the Dig i tal An a lyzer panel. Af ter a New Test, the
Dig i tal An a lyzer panel de faults to None as its an a lyzer. To switch to the Spec trum An a lyzer, click the down ar row next to the An a lyzer field at the top of
the Dig i tal An a lyzer panel. From the list, choose FFT spec trum an a lyzer
(fft). The panel changes to dis play the anal y sis tool.
Panel Fields
There are two peak mon i tors near the top of the panel, one for each of the
ste reo chan nels. These me ters give an in di ca tion of the pres ence of sig nal at
the FFT in put.
Be low the peak me ters is an ar ray of fields for con fig ur ing the an a lyzer.
Here, we will use the de fault set tings. F or more de tails on the set tings, see
Chap ter 11 of the 2700 Se ries User’s Man ual.
Time vs. Frequenc y
As men tioned, the FFT spec trum an a lyzer can dis play au dio sig nals in the
time do main and the fre quency do main. The choice of do main is de ter mined
by the Source 1 field on the Sweep panel. If it is set to Fft.FFT Time, a time
The FFT Spectrum Analyzer Chapter 5: Quick Guides
Getting Started with Your 2700 Series Instrument 47
Figure 28. FFT Spectrum Analyzer panel.
USO RESTRITO
Page 58
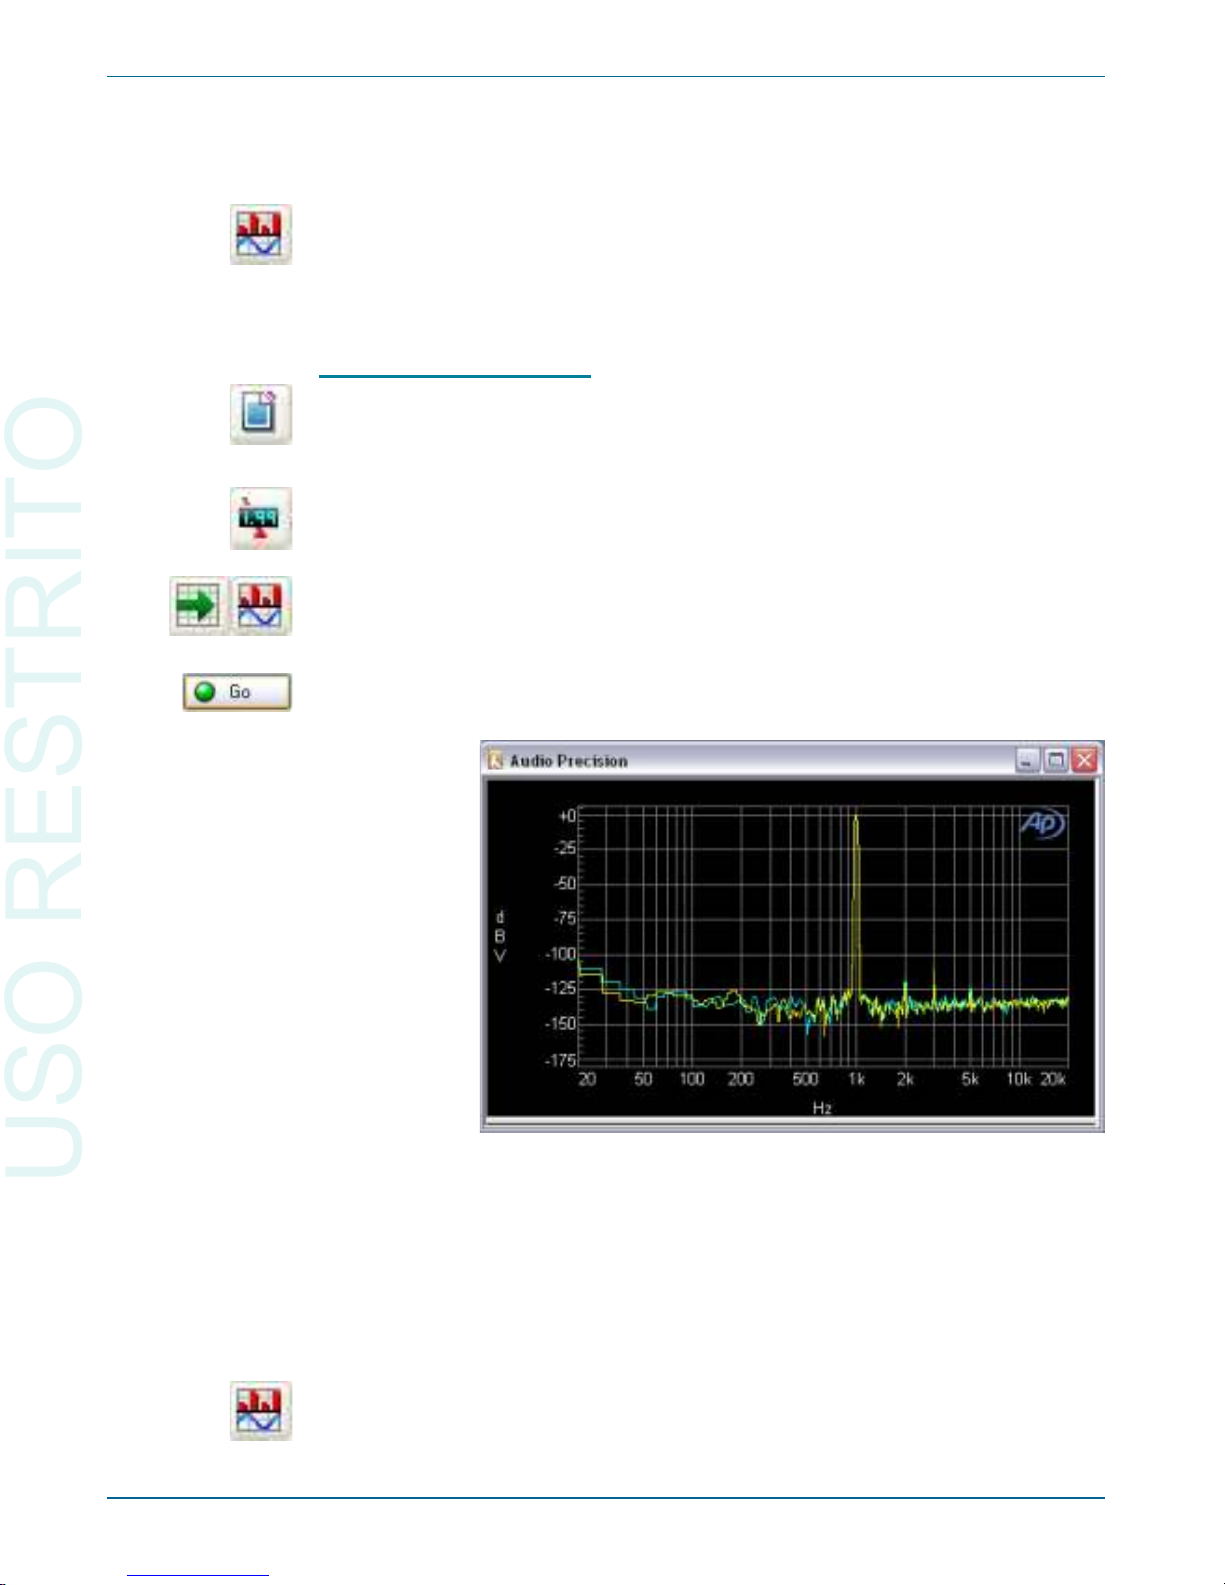
do main dis play re sults. If it is set to Fft.FFT Fre quency, a fre quency do main
dis play re sults.
The Sweep Spec trum/Wave form but ton in the Stan dard toolbar al lows
FFT sweeps to be set up quickly, en ter ing Fft.FFT Time or Fft.FFT Fre -
quency in the Source field and set ting de fault ranges. We will use this fea ture
to ex am ine har monic dis tor tion in the 2700 se ries.
Quick Sweep Setup
Click New Test, turn the An a log Gen er a tor ON, and set the An a log An a -
lyzer Source A and B to GenMon so that the gen er a tor sig nal is sent di rectly
to the an a log in put.
Now open the Dig i tal An a lyzer panel and switch to the Spec trum An a lyzer
by se lect ing FFT spec trum an a lyzer (fft) from the drop-down list.
Open the Sweep panel and click the Sweep Spec trum/Wave form but ton on
the Stan dard toolbar. The sweep is au to mat i cally set up for a ste reo fre quency
do main dis play from 20 Hz to 20 kHz.
Click Go to per form the sweep. A graph sim i lar to Fig ure 29 is cre ated.
The large peak in the mid dle of the spec trum is the 1 kHz, 1 V sine wave
fun da men tal pro duced by the an a log gen er a tor. There are smaller peaks spaced
at 1 kHz in ter vals above the fun da men tal. These are har monic dis tor tion com po nents gen er ated in the 2700 se ries hard ware. These har mon ics rise out of a
wideband sys tem noise floor.
To look at the au dio sig nal in the time do main, click the Sweep Spec trum/
Wave form but ton again. Source 1 changes to Fft.FFT Time and the graph
up dates to show the new data. You should see a graph sim i lar to Fig ure 30.
Chapter 5: Quick Guides The FFT Spectrum Analyzer
48 Getting Started with Your 2700 Series Instrument
Figure 29. Typical default FFT stereo frequency domain graph.
USO RESTRITO
Page 59
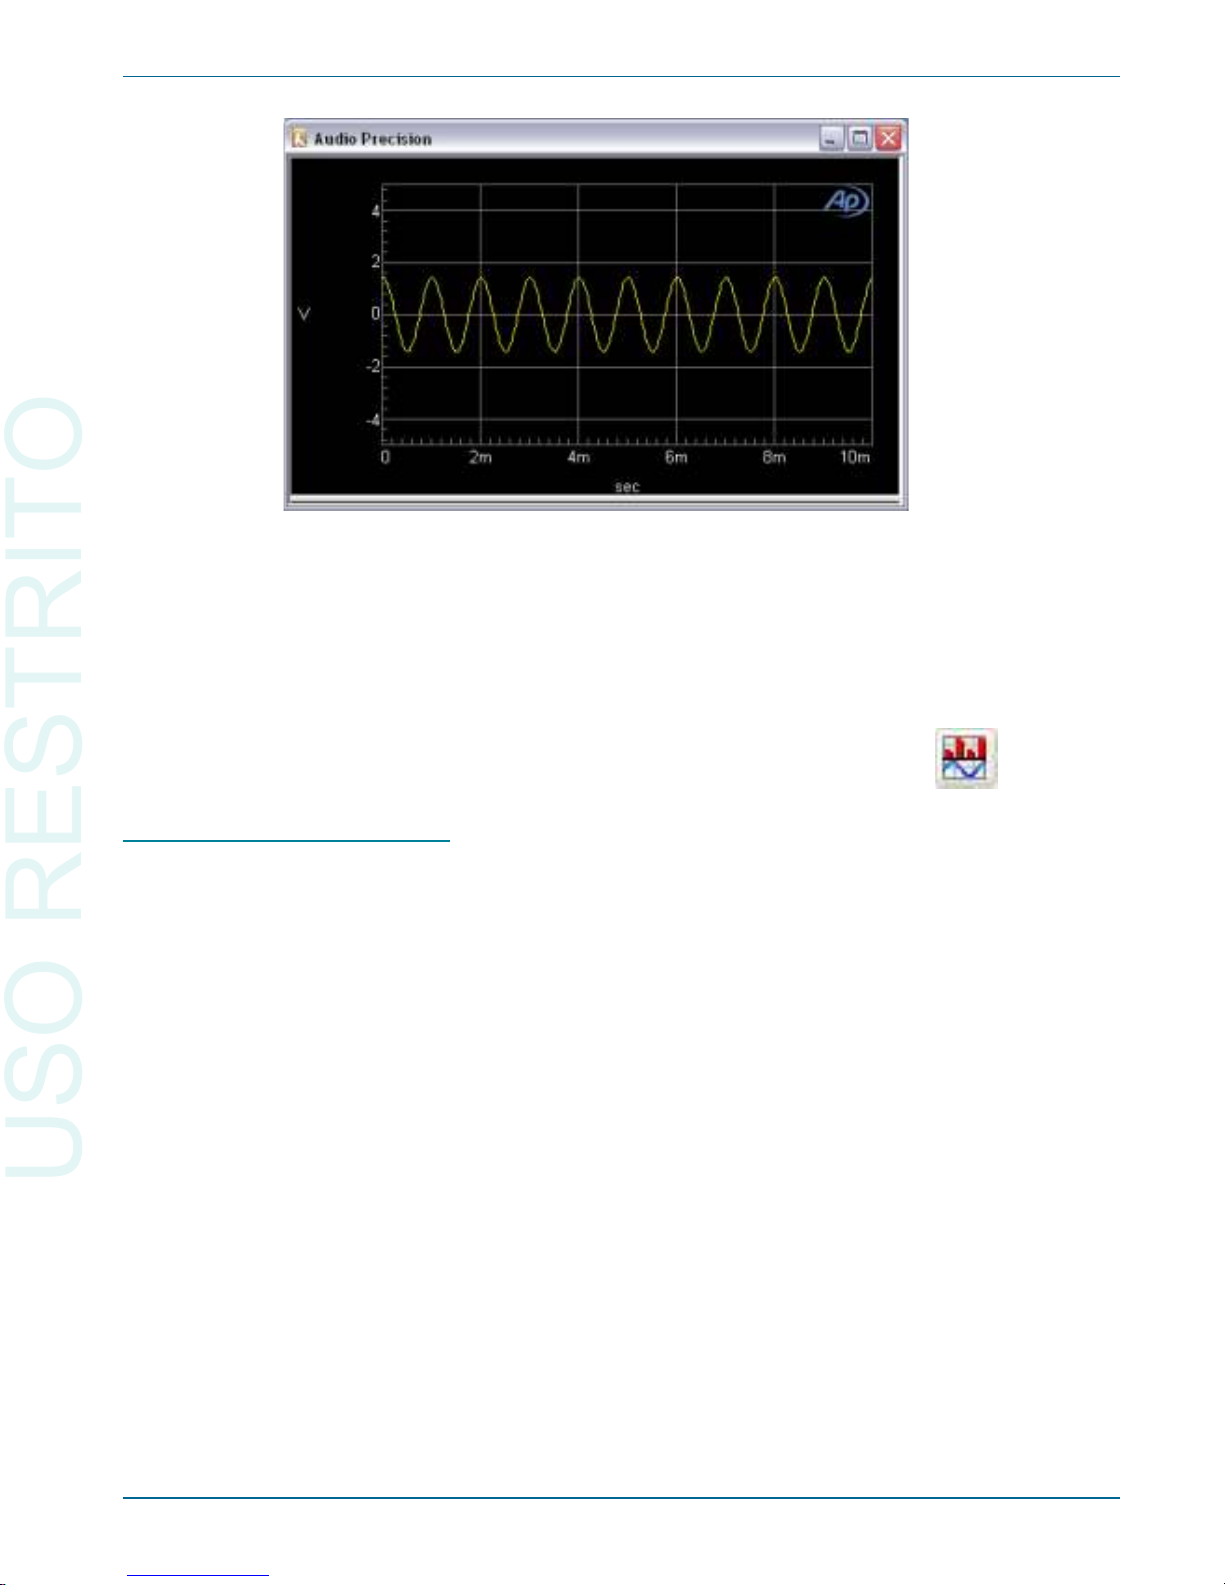
The dis play shows a sine wave with a pe riod of 1 ms (cor re spond ing to a
fre quency of 1 kHz) and a peak ex cur sion of 1.414 V (cor re spond ing to an
am pli tude of 1 Vrms). The ef fect of the dis tor tion on the wave form is not vis i ble in the time do main.
You can switch be tween the time do main and fre quency do main dis plays at
any time by click ing the Sweep Spec trum/Wave form but ton.
Fine-Tuning the Display
There are sev eral ways to ad just the graph dis play to more closely ex am ine
fea tures of the ac quired wave form:
§
Zoom
On the graph, draw a box by hold ing down the left mouse but ton and
mov ing the mouse. When you re lease the but ton, the soft ware zooms the
se lected area to the full graph size.
§
Zoomout
Af ter zoom ing, click the right mouse but ton on the graph. From this
right-click menu, choose Zoomout. The graph zooms out to the prezoom size.
§
Op ti mize
From the right-click menu, choose Op ti mize Left Only. The ver ti cal
axis changes to best fit the data in the graph.
For more de tails, see Chap ter 18 of the 2700 Se ries User’s Man ual.
The FFT Spectrum Analyzer Chapter 5: Quick Guides
Getting Started with Your 2700 Series Instrument 49
Figure 30. Typical default FFT stereo time domain graph.
USO RESTRITO
Page 60
Saving and Loading Tests
At any time, the cur rent workspace setup can be saved to a file. The file
con tains the set tings on all the pan els (in clud ing pan els that are not vis i ble in
the workspace), the panel po si tions, and ref er ences to any other files that were
at tached, such as limit data. The file also con tains the most re cent data ob tained from any sweeps that were run.
When a test is loaded, the workspace re verts to the ex act con fig u ra tion it
had when the test was saved. The data from the test is avail able and can be fur ther pro cessed. It can also be re-graphed au to mat i cally when the test is loaded.
See Chap ter 27 of the 2700 Se ries User’s Man ual for con fig u ra tion de tails.
To save the cur rent workspace, choose File > Save > Test, or click the Save
Test but ton in the Stan dard toolbar. To load a lest, choose File > Open > Test,
or click the Open Test but ton in the Standard toolbar.
The Next Step
In this chap ter, we have in tro duced two anal y sis tools: the An a log An a lyzer,
and the FFT Spec trum An a lyzer. The 2700 se ries has other tools to mea sure
au dio sig nals in dif fer ent ways. The 2700 Se ries User’s Man ual de scribes all
the anal y sis instruments in de tail.
We have also in tro duced the sweep, which is at the heart of 2700 se ries au to mated mea sure ments. The sweep en gine and its fea tures are de scribed in
more de tail in Chap ter 17 of the 2700 Se ries User’s Man ual.
We set up tests by hand us ing the mouse and key board, and saved them to
disk. The con trol soft ware also con tains a com plete pro gram ming lan guage
called AP Ba sic that al lows you to ex e cute com plex mea sure ment se quences
pro gram mat i cally. Chap ter 25 of the 2700 Se ries User’s Man ual in tro duces
pro gram ming and au to ma tion, the AP Ba sic Man ual de scribes the lan guage in
de tail, and the AP Ba sic Ex ten sions Ref er ence for the 2700 Se ries Instruments
de tails the spe cific com mands for this se ries.
Chapter 5: Quick Guides Saving and Loading Tests
50 Getting Started with Your 2700 Series Instrument
USO RESTRITO
Page 61

Chapter 6
Specifications
Analog Signal Outputs
All 2700 series configurations except SYS-2720 contain an ultra-low distortion
analog sine wave generator and two independent transformer-coupled output stages.
The SYS-2712 and SYS-2722 configurations also contain a dual-channel D/A signal
generator for enhanced capabilities. Option “BUR” adds analog-generat ed sine burst,
square wave, and noise signals. Option “IMD” adds analog-generated IMD test signals.
Unless otherwise noted, all specifications are valid only for outputs ³150 µVrms
[420 µVpp].
Analog Output Characteristics
Source Configuration Selectable balanced, unbalanced, or CMTST
(common mode test).
Source Impedances
Balanced or CMTST 40 W (±1 W), 150 W1 (±1.5 W), or 600 W (±3 W).
Unbalanced 20 W (±1 W) or 600 W (±3 W).
Max Floating Voltage 42 Vpk (outputs are isolated from each other).
Output Current Limit Typically >80 mA.
Max Output Power into 600 W
Balanced +30.1 dBm (Rs = 40 W).
Unbalanced +24.4 dBm (Rs = 20 W).
Output Related Crosstalk
10 Hz–20 kHz £ –120 dB or 5 µV, whichever is greater.
20 kHz–100 kHz
£ –106 dB or 10 µV, whichever is greater.
Low Distortion Sine Wave Generator
Frequency Range 10 Hz–204 kHz.
Frequency Accuracy
High-accuracy mode ±0.03%.
Fast mode ±0.5%.
Getting Started with Your 2700 Series Instrument 51
NP0020.00006.009
1
200 W ±2 W with option “EURZ”
USO RESTRITO
Page 62

Frequency Resolution
High-accuracy mode 0.005%.
Fast mode 0.025 Hz, 10 Hz–204.75 Hz,
0.25 Hz, 205 Hz–2.0475 kHz,
2.5 Hz, 2.05 kHz–20.475 kHz,
25 Hz, 20.5 kHz–204 kHz.
Amplitude Range
2
Balanced <10 µV–26.66 Vrms [+30.7 dBu].
Unbalanced <10 µV–13.33 Vrms [+24.7 dBu].
Amplitude Accuracy ±0.7% [±0.06 dB] at 1 kHz.
Amplitude Resolution 0.003 dB or 0.05 µVrms, whichever is larger.
Flatness (1 kHz ref)
10 Hz–20 Hz ±0.010 dB.
20 Hz–20 kHz ±0.008 dB (typically <0.003 dB).
20 kHz–50 kHz ±0.03 dB.
50 kHz–120 kHz ±0.10 dB.
120 kHz–200 kHz +0.2 / –0.3 dB.
Residual THD+N
3,4
At 1 kHz £(0.00025% + 1.0 µV) [–112 dB], 22 kHz BW
(valid only for analyzer inputs £8.5 Vrms).
20 Hz–20 kHz £(0.0003% + 1.0 µV) [–110.5 dB], 22 kHz BW,
£(0.0005% + 2.0 µV) [–106 dB], 80 kHz BW ,
£(0.0010% + 5.0 µV) [–100 dB], 500 kHz BW .
10 Hz–100 kHz £(0.0040% + 5.0 µV) [–88 dB], 500 kHz BW.
Intermodulation Distortion Test Signals
with option “IMD”
SMPTE (or DIN)
LF Tone 40, 50, 60, 70, 100, 125, 250, or 500 Hz,
all ±1.5%.
HF Tone Range 2 kHz–200 kHz.
Mix Ratio 4:1 or 1:1 (LF:HF).
Amplitude Range
5
Balanced 30 µVpp–75.4 Vpp.
Unbalanced 30 µVpp–37.7 Vpp.
Amplitude Accuracy ±2.0% [±0.17 dB].
Residual IMD
6
0.0015% [–96.5 dB],
60 Hz + 7 kHz or 250 Hz + 8 kHz.
Chapter 6: Specifications Analog Signal Outputs
52 Getting Started with Your 2700 Series Instrument
2
20 Hz–50 kHz only. Decrease maximum output by a factor of 2 (–6.02 dB) for the f ull 10 Hz–204 kHz range.
3
System specification measured with the 2700 series analog analyzer set to the indicated measurement
bandwidth (BW). Generator amplitude setting must be £12 Vrms balanced or £6 Vrms unbalanced for
specified performance below 30 Hz. At higher amplitude settings generator THD derates to 0.0020% from
20 Hz–30 Hz.
4
Individual harmonics are typically <–130 dBc at 1 kHz, and <–120 dBc from 25 Hz to 20 kHz measured with a
passive notch filter and FFT analyzer.
5
Calibration with other amplitude units is based upon an equivalent sinewave having the same Vpp amplitude.
6
System specification measured with the 2700 series analog analyzer at any amplitude ³200 mVrms.
USO RESTRITO
Page 63

CCIF and DFD
Difference Frequency 80, 100, 120, 140, 200, 250, 500 or 1 kHz;
all ±1.5%.
Center Frequency 4.5 kHz–200 kHz.
Amplitude Range
5
Balanced 30 µVpp–75.4 Vpp.
Unbalanced 30 µVpp–37.7 Vpp.
Amplitude Accuracy ±3.0% [±0.26 dB].
CCIF Residual IMD
6
£0.0004% [–108 dB], 14 kHz+15 kHz
(odd order & spurious typ <0.05%).
DFD Residual IMD
6
£0.0002% [–114 dB], 14 kHz+15 kHz
(odd order & spurious typ <0.025%).
DIM (or TIM)
Squarewave Frequency 3.15 kHz (DIM-30 and DIM-100),
2.96 kHz (DIM-B); both ±1%.
Sinewave Frequency 15 kHz (DIM-30 and DIM-100),
14 kHz (DIM-B).
Amplitude Range
4
Balanced 30 µVpp–75.4 Vpp.
Unbalanced 30 µVpp–37.7 Vpp.
Amplitude Accuracy ±2.0% [±0.17 dB].
Residual IMD
5
£0.0020% [–94 dB].
Special Purpose Signals
with option “BUR”
Sine Burst
Frequency Range 20 Hz–100 kHz.
Frequency Accuracy Same as Sinewave.
ON Amplitude Range
Accuracy, Flatness Same as Sinewave.
OFF Ratio Range 0 dB to –80 dB.
OFF Ratio Accuracy ±0.3 dB, 0 to –60 dB.
ON Duration 1 cycle–65535 cycles, or externally gated.
Interval Range 2 cycle–65536 cycles.
Square Wave
Frequency Range 20 Hz–20 kHz.
Frequency Accuracy Same as Sinewave.
Amplitude Range
4
Balanced 30 µVpp–37.7 Vpp.
Unbalanced 30 µVpp–18.8 Vpp.
Amplitude Accuracy ±2.0% [±0.17 dB] at 400 Hz.
Rise/fall time Typically 2.0 µs.
Analog Signal Outputs Chapter 6: Specifications
Getting Started with Your 2700 Series Instrument 53
USO RESTRITO
Page 64
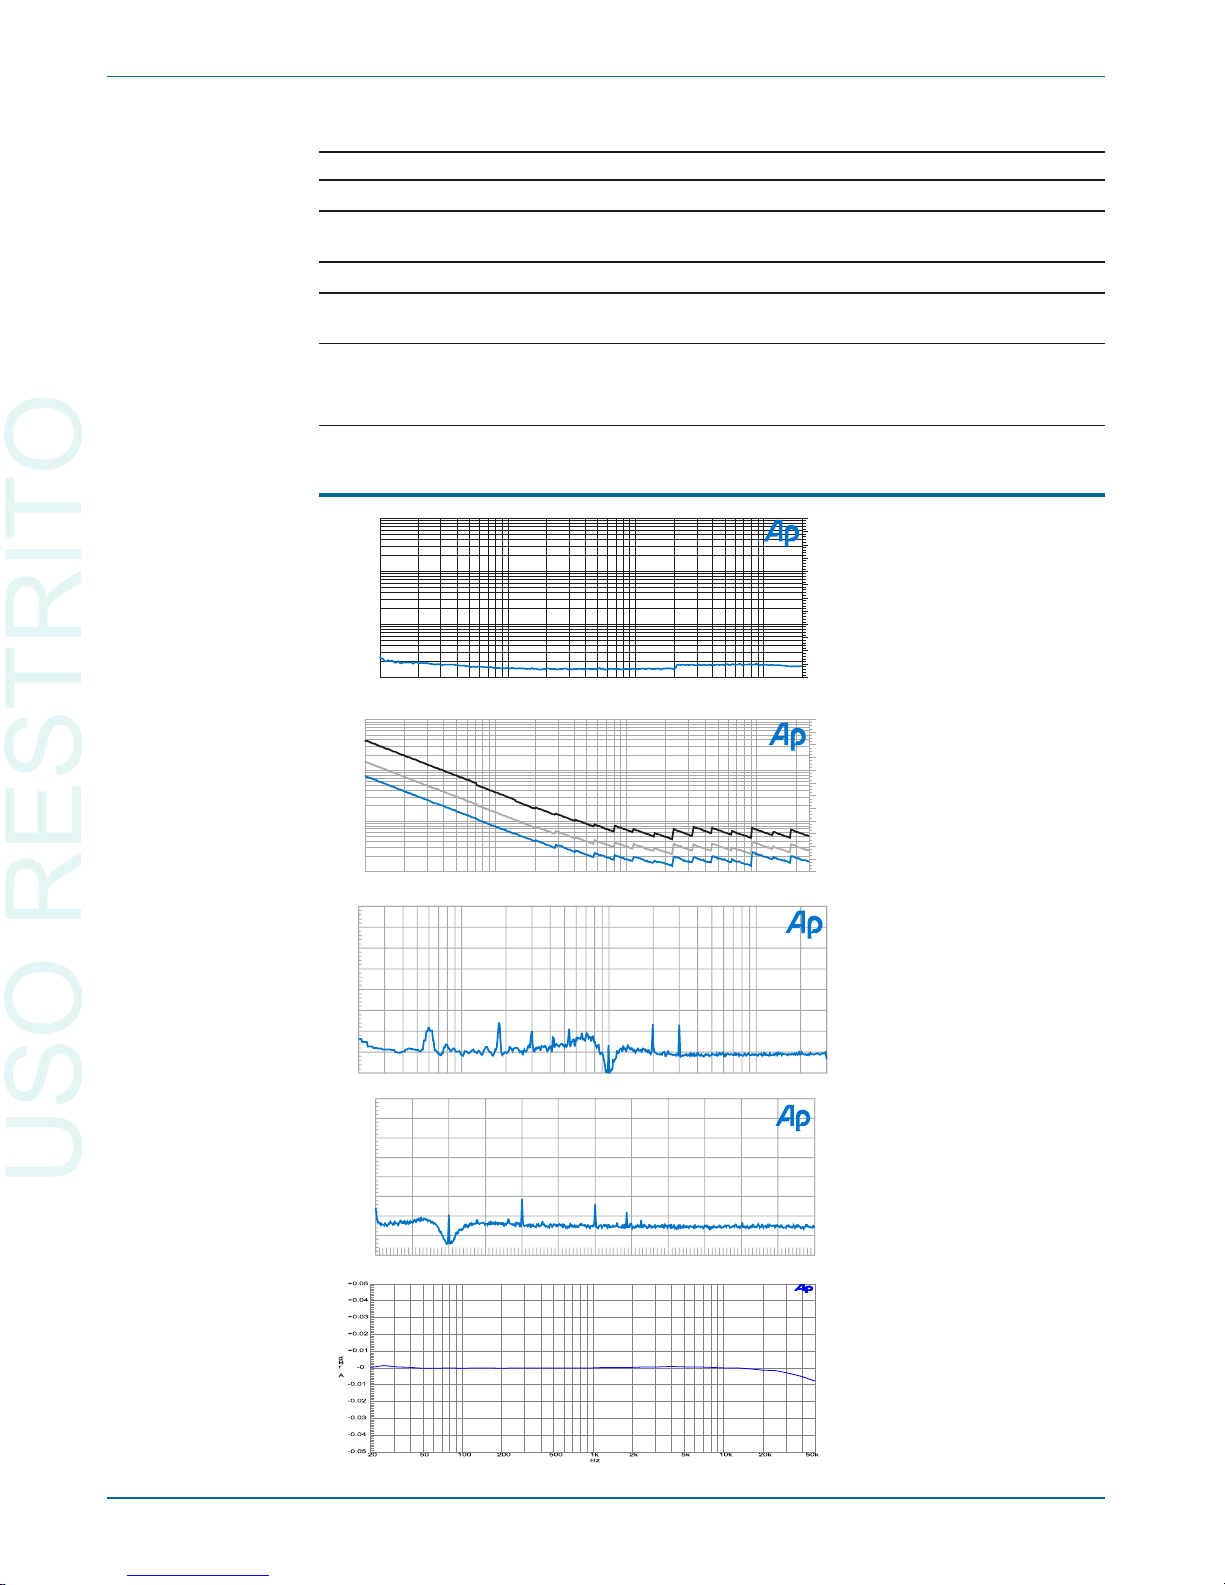
Noise Signals
White Noise Bandwidth limited 10 Hz–23 kHz.
Pink Noise Bandwidth limited 20 Hz–200 kHz.
Bandpass Noise Approximately 1/3-octave (2-pole) filtered pink
noise, continuously tunable from 20 Hz–100 kHz.
Generator True random or pseudo-random.
Pseudo-Random Interval Typically 262 ms
(synchronized to the analyzer 4/s reading rate).
Amplitude Range
5
(Approximate calibration only).
Balanced 30 µVpp–37.7 Vpp.
Unbalanced 30 µVpp–18.8 Vpp.
Graphs of Typical Analog Generator Performance
Chapter 6: Specifications Analog Signal Outputs
54 Getting Started with Your 2700 Series Instrument
-120
-60
-115
-110
-105
-100
-95
-90
-85
-80
-75
-70
-65
d
B
0.0001
0.1
0.0002
0.0005
0.001
0.002
0.005
0.01
0.02
0.05
%
10 20k20 50 100 200 500 1k 2k 5k 10k
Figure 31. Typical system
THD+N versus
Frequency at 2 Vrms
(analog sine).
-120
-60
-115
-110
-105
-100
-95
-90
-85
-80
-75
-70
-65
d
B
0.0001
0.1
0.0002
0.0005
0.001
0.002
0.005
0.01
0.02
0.05
%
10m 2020m 50m 100m 200m 500m 1 2 5 10
Vrms
Figure 32. Typical system
THD+N versus amplitude at
1 kHz. Lower trace is with
22 kHz bandwidth limiting.
Middle trace is with 80 kHz.
-160
-80
-150
-140
-130
-120
-110
-100
-90
d
B
20 30k50 100 200 500 1k 2k 5k 10k 20k
Figure 33. Typical residual
THD+N spectrum at 1 kHz,
2 Vrms. (32768 point FFT of
notch filter output, Sample
Rate = 65.536 ks/s, 16
averages).
-160
-80
-150
-140
-130
-120
-110
-100
-90
d
B
0 120k10k 20k 30k 40k 50k 60k 70k 80k 90k 100k 110k
Figure 34. Typical residual
THD+N spectrum at 20 kHz,
2 Vrms. (32768 point FFT of
notch filter output, Sample
Rate = 262 ks/s, 16
averages).
Figure 35. Typical analog
system flatness at 2 Vrms
signal level (measured with
the analog analyzer’s Level
meter, dc input coupling).
USO RESTRITO
Page 65

D/A Generated Analog Signals
Available only in the SYS-2720 and SYS-2722 configurations. Except for arbitrary
and Pass Thru waveforms, the digitally generated analog output signals and the
embedded output signals are independently selectable and concurrently available. If
both analog and digital outputs are selecting arbitrary waveform, it must be the same
one. If Pass Thru waveforms are selected for both analog and digital generators, they
must be at the same sample rate.
Common Specifications
Sample Rate
Sine, IMD signals fixed at 65.536 ks/s or 131.072 ks/s.
Other signals 8 ks/s–108 ks/s variable,
or fixed at 65.536 ks/s or 131.072 ks/s.
Frequency Accuracy ±0.0002% [2 PPM] internal reference, lockable to
external reference.
D/A Resolution 24-bit sigma-delta.
“SINE (D/A)” Signal Family
The Sine family includes “Normal,” “Var Phase,” “Stereo,” “Dual,” “Shaped Burst,”
and “EQ Sine.” Normal and EQ Sine produce a monaural signal with the best (lowest)
residual THD+N performance. EQ Sine varies the amplitude in accordance with a
selected EQ file. Var Phase produces the same sine wave in both channels but with
settable phase offset. Stereo provides sine waves of independently settable frequency in
each channel (phase is random if both frequencies are set equal). Dual produces a
monaural test signal containing a mixture of two sine waves of independently settable
frequency and amplitude ratio. Shaped Burst produces a monaural sine burst signal
with a raised cosine amplitude envelope (see Figure 60 on page 77).
Frequency Ranges 10 Hz–30 kHz (65.536 ks/s), or
7
10 Hz–60 kHz (131.072 ks/s).
Frequency Resolution Sample Rate ¸ 223.
[0.0078 Hz in the 30 kHz range].
Flatness (1 kHz ref)
20 Hz–20 kHz ±0.01 dB.
10 Hz–30 kHz ±0.03 dB.
30 kHz–50 kHz ±0.10 dB (typically –0.5 dB at 60 kHz).
THD+N8 (20Hz–20kHz)
30 kHz range 0.0007% [–103 dB].
60 kHz range 0.0014% [–97 dB].
Variable Phase Range –180.0 to +179.9 deg.
Dual-Sine Ratio Range 0 dB to –100 dB, usable to –138 dB.
Shaped Burst Interval 2 cycle–65536 cycles.
Shaped Burst On Time 1 to (number of interval cycles minus 1).
D/A Generated Analog Signals Chapter 6: Specifications
Getting Started with Your 2700 Series Instrument 55
7
Significant generator alias products will appear for frequency settings above 29.5 kHz in the ‘30k’ range and
53.5 kHz in the ‘60k’ range.
8
System specification measured with the 2700 series analog analyzer set for a 22 kHz measurement BW.
USO RESTRITO
Page 66

“IMD (D/A)” Signal Family
SMPTE/DIN Test Signal
LF Tone 40 Hz–500 Hz.
HF Tone 2.00 kHz–50 kHz.
Mix Ratio 4:1 or 1:1 (LF:HF).
Residual IMD
7
£0.0010% [–100 dB], 60/7 kHz or 250/8 kHz.
CCIF/DFD Test Signal
Difference Frequency 80 Hz–2 kHz.
Center Frequency 4.50 kHz to >50 kHz.
Residual CCIF IMD
9
CCIF: £0.0004% [–108 dB], 14 kHz/15 kHz.
DFD: £0.0002% [–114 dB], 14 kHz/15 kHz.
DIM Test Signal
Squarewave Frequency 3.15 kHz for DIM30 and DIM100,
2.96 kHz for DIMB.
Sinewave Frequency 15.00 kHz for DIM30 and DIM100,
14.00 kHz for DIMB.
Residual IMD
8
£0.0020% [–94 dB].
Other Signals
Arbitrary and Multitone Waveforms (“Arb Wfm”)
Signal Determined by the associated file specified in the
panel drop-down box.
Frequency Range 20 Hz to 47% of Sample Rate.
Length 256 points–16384 points per channel. Utility is
provided to prepare waveform from frequency,
amplitude, and phase data.
Frequency Resolution Sample Rate ÷ Length
[2.93 Hz at 48 ks/s for a waveform 16384 points
in length].
Maximum Number of Tones (Length / 2) –1 [8191 for Length = 16384].
Maximum Length Sequence (“MLS”)
Sequences Four pink, four white.
Sequence Length “32k” (32767) or “128k” (131071).
Frequency Range 10 Hz to 43% of Sample Rate, ±0.1 dB.
Special Signals
Polarity Sum of two sine waves phased for reinforcement
with normal polarity.
Pass Thru Passes the embedded audio signal from the rear
panel Reference Input. Ratio of reference rate to
output Sample Rate may not exceed 8:1.
Chapter 6: Specifications D/A Generated Analog Signals
56 Getting Started with Your 2700 Series Instrument
9
System specification measured with the 2700 series analog analyzer at any voltage ³200 mVrms.
USO RESTRITO
Page 67

Squarewave
Frequency Range 20 Hz–20.0 kHz.
Rise Time T ypically 2.0 µs.
Noise Signal
Pseudo-random white
D/A Generated Analog Signals Chapter 6: Specifications
Getting Started with Your 2700 Series Instrument 57
USO RESTRITO
Page 68

Analog Analyzer
All 2700 series configurations except SYS-2720 contain an input module with two
independent auto-ranging input stages, each having its own level (rms) and frequency
meters; a phase meter; plus a single channel multi-function analyzer module providing
additional signal processing and gain stages. Standard analog analyzer functions
include amplitude and noise (both wideband and selective), THD+N, and crosstalk.
The SYS-2712 and SYS-2722 configurations add dual-channel A/D converters for
FFT and other special forms of analysis. Option “IMD” adds inter-modulation
distortion measurement capability. Option “W&F” adds wow & flutter measurement
capability.
Unless otherwise noted, all specifications assume dc coupling, rms detection, and
auto-ranging operation.
Analog Input Characteristics
Input Ranges 40 mV–160 V in 6.02 dB steps.
Maximum Rated Input 230 Vpk, 160 Vrms (dc to 20 kHz),
overload protected in all ranges.
Input Impedance
Balanced 200 kW / 95 pF (differential).
Unbalanced 100 kW / 185 pF.
Terminations Selectable 600 W or 300 W, each ±1%,
1 Watt [+30 dBm] maximum power.
CMRR
10
40 mV–2.5 V ranges ³80 dB, 10 Hz–20 kHz.
5 V and 10 V ranges ³65 dB, 10 Hz–20 kHz.
20 V–160 V ranges ³50 dB, 10 Hz–1 kHz.
Input Related Crosstalk
10 Hz–20 kHz £ –140 dB or 1 µV, whichever is greater.
20 kHz–100 kHz £ –126 dB or 2.5 µV, whichever is greater.
Level Meter Related
Measurement Range 5 mV–160 V for specified accuracy and flatness,
usable to <100 µV.
Resolution (full scale)
11
4/s and 8/s 1/40,000 [0.00022 dB].
16/s 1/20,000 [0.00043 dB].
32/s 1/10,000 [0.00087 dB].
64/s 1/5,000 [0.0017 dB].
128/s 1/2,500 [0.0035 dB].
Accuracy (1 kHz) ±0.5% [±0.05 dB].
Chapter 6: Specifications Analog Analyzer
58 Getting Started with Your 2700 Series Instrument
10
Not valid below 50 Hz with ac coupling.
11
Resolution within a given range is equal to its full scale value multiplied by the fraction indicated for the
selected reading rate. (Example: 40 mV input range reading resolution = 4 µV, using the 32/s reading rate).
Numerical displays using a dB unit are rounded to the nearest 0.001 dB.
USO RESTRITO
Page 69

Flatness (1 kHz ref)
12
20 Hz–20 kHz ±0.008 dB (typically <0.003 dB).
15 Hz–50 kHz ±0.03 dB.
10 Hz–120 kHz ±0.10 dB.
120 kHz–200 kHz +0.2 / –0.3 dB (typically <–0.5 dB at 500 kHz).
Frequency Meter Related
Measurement Range 10 Hz–500 kHz.
Accuracy ±0.0006% [±6 PPM].
Resolution 6 digits + 0.000244 Hz.
Minimum Input 5 mV.
Phase Measurement Related
Measurement Ranges ±180, –90 / +270, or 0 / +360 deg.
Accuracy
13
10 Hz–5 kHz ±0.5 deg.
5 kHz–20 kHz ±1 deg.
20 kHz–50 kHz ±2 deg.
Resolution 0.1 deg.
Minimum Input 5 mV, both inputs.
Wideband Amplitude/Noise Function
Measurement Range <1 µV–160 Vrms.
Accuracy (1 kHz) ±1.0% [±0.09 dB].
Flatness (1 kHz ref)
12
20 Hz–20 kHz ±0.02 dB.
15 Hz–50 kHz ±0.05 dB.
50 kHz–120 kHz ±0.15 dB.
120 kHz–200 kHz +0.2 dB / –0.3 dB (typically < –3 dB at 500 kHz).
Analog Analyzer Chapter 6: Specifications
Getting Started with Your 2700 Series Instrument 59
12
Derate flatness above 5 kHz by an additional ±0.02 dB in the 20 V, 40 V, 80 V, and 160 V input ranges.
13
Both analyzer input channels must have same coupling (ac or dc) selection. Accuracy is valid for any input
signal amplitude ratio up to ±30 dB.
USO RESTRITO
Page 70
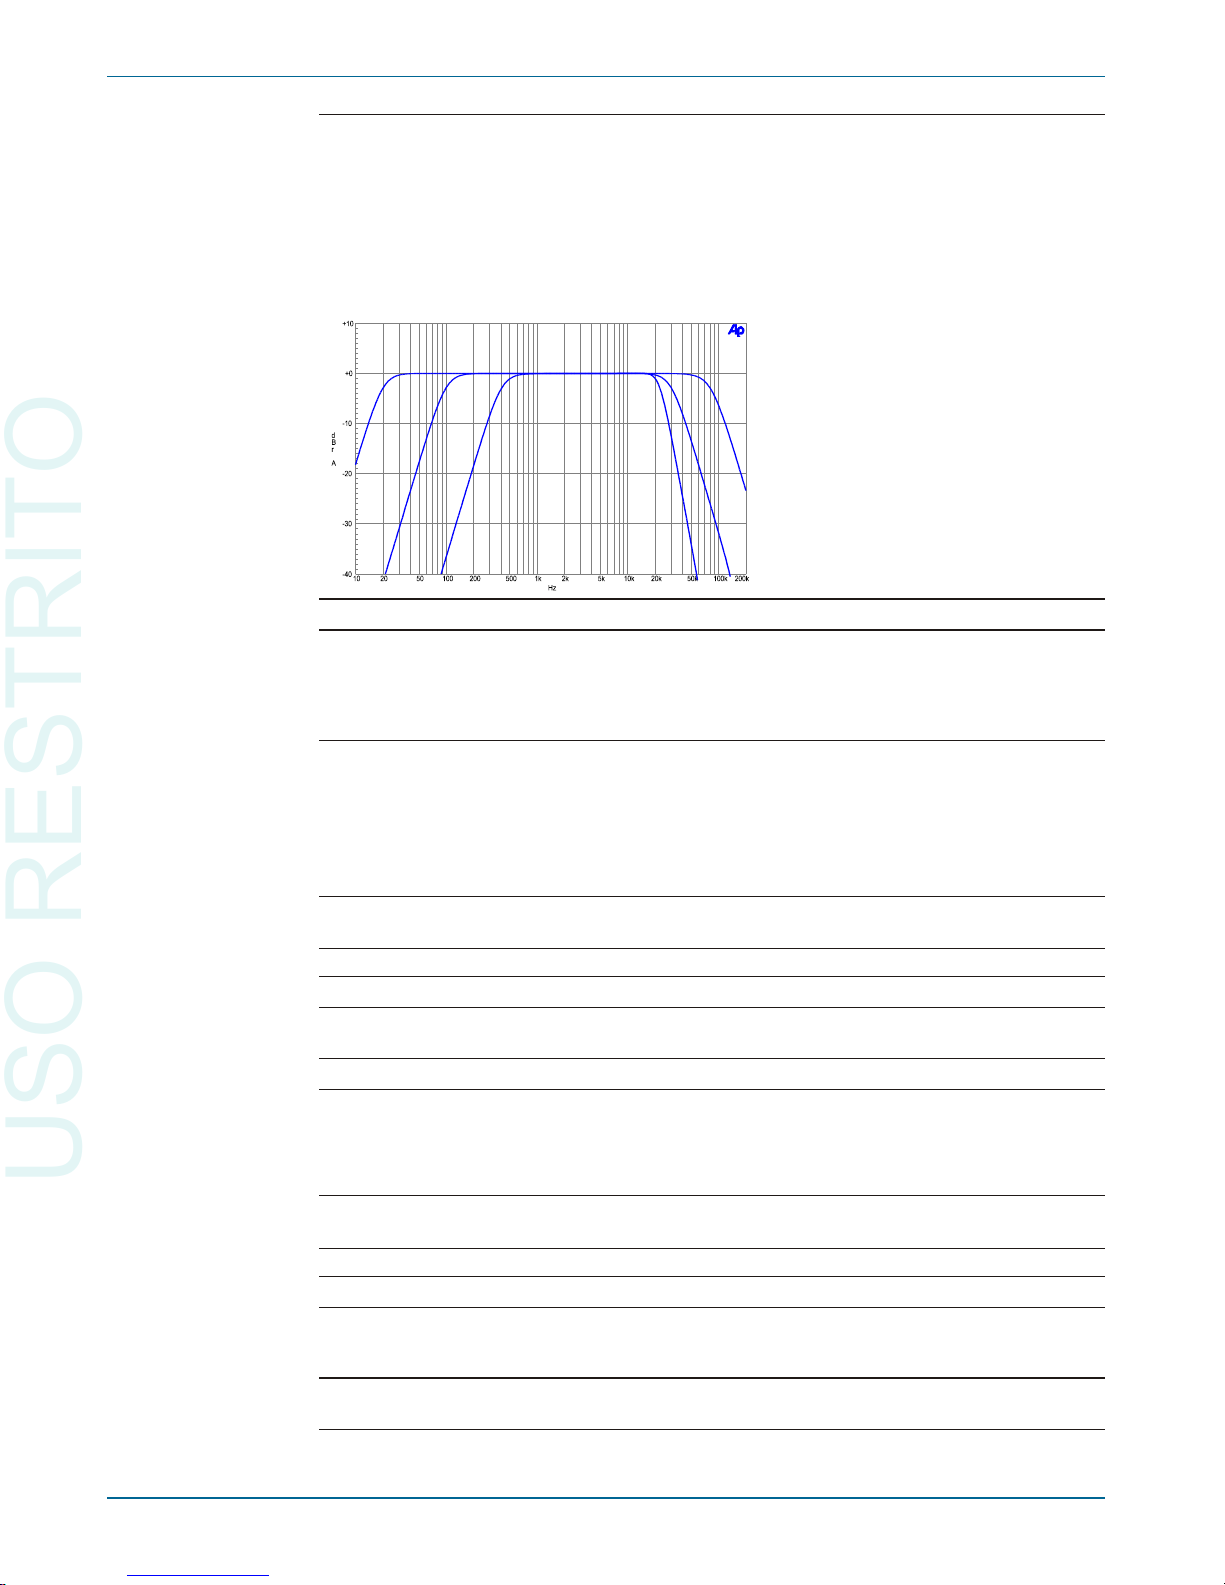
Bandwidth Limiting Filters –see Figure 36
LF –3 dB <10 Hz,
22 Hz per IEC468 (CCIR),
100 Hz ±5% (3-pole), or
400 Hz ±5% (3-pole).
HF –3 dB 22 kHz per IEC468 (CCIR),
30 kHz ±5% (3-pole),
80 kHz ±5% (3-pole), or
>500 kHz.
Optional Filters up to 7 (see section on Option Filters).
Detection RMS (t = 25 ms or 50 ms),
Average,
QPk per IEC468 (CCIR),
Pk (pseudo-peak), or
S-Pk (0.7071 × Pk reading).
Residual Noise
22 Hz–22 kHz BW £1.0 µV [–117.8 dBu].
80 kHz BW £2.0 µV [–111.8 dBu].
500 kHz BW £6.0 µV [–102.2 dBu].
A-weighted £0.7 µV [–120.9 dBu].
CCIR-QPk £3.5 µV [–106.9 dBu].
Bandpass Amplitude Function
Tuning Range (fo) 10 Hz–200 kHz.
Tuning Accuracy ±2%.
Bandpass Response 1/3-octave class II (4-pole),
< –32 dB at 0.5 fo and 2.0 fo.
Accuracy (at fo) ±0.3 dB, 20 Hz–120 kHz.
Residual Noise
10 Hz–5 kHz £0.25 µV [–130 dBu].
5 kHz–20 kHz £0.5 µV [–124 dBu].
20 kHz–200 kHz £1.5 µV [–114 dBu].
Bandreject Amplitude Function
Tuning Range (fo) 10 Hz–200 kHz.
Tuning Accuracy ±2%.
Bandreject Response typically –3 dB at 0.73 fo & 1.37 fo,
–20 dB at fo ±10%,
–40 dB at fo ±2.5%.
Accuracy ±0.3 dB, 20 Hz–120 kHz
(excluding 0.5 fo–2.0 fo).
Chapter 6: Specifications Analog Analyzer
60 Getting Started with Your 2700 Series Instrument
Figure 36. Typical
responses of the standard
band-limiting filters.
USO RESTRITO
Page 71

THD+N Function
Fundamental Range 10 Hz–200 kHz.
Measurement Range 0%–100%.
Accuracy ±0.3 dB, 20 Hz–120 kHz harmonics.
Measurement Bandwidth
LF –3 dB <10, 22, 100, or 400 Hz.
HF –3 dB 22k, 30k, 80k, or >500 kHz
(Option filter selection also affects bandwidth).
Residual THD+N
14
At 1 kHz £(0.00025% + 1.0 µV) [–112 dB], 22 kHz BW
(valid only for analyzer inputs £8.5 Vrms).
20 Hz–20 kHz £(0.0003% + 1.0 µV) [–110.5 dB], 22 kHz BW,
£(0.0005% + 2.0 µV) [–106 dB], 80 kHz BW,
£(0.0010% + 6.0 µV) [–100 dB], 500 kHz BW .
10 Hz–100 kHz £(0.0040% + 6.0 µV) [–88 dB], 500 kHz BW .
Minimum Input 5 mV for specified accuracy, usable to <100 µV
with fixed notch tuning.
Notch Tuning Modes Counter Tuned,
Sweep Track,
AGen-Track (analog generator),
DGen-Track (digital generator), or
Fixed (set by direct entry).
Notch Tracking Range ±2.5% from fixed setting.
Crosstalk Function
Frequency Range 10 Hz–200 kHz.
Accuracy
14
±0.4 dB, 20 Hz–120 kHz.
Residual Crosstalk
15
10 Hz–20 kHz £ –140 or 1 µV.
20 kHz–100 kHz
£ –126 dB or 2.5 µV .
IMD Measurements
with option “IMD”
Option “IMD” adds the capability to measure intermodulation distortion (IMD)
using three of the most popular techniques. The demodulated IMD signal can also be
selected for FFT analysis in SYS-2712 and SYS-2722 configurations.
SMPTE (DIN) IMD Function
Test Signal Compatibility Any combination of 40 Hz–250 Hz (LF) and
2 kHz–100 kHz (HF) tones, mixed in any ratio
from 0:1 to 8:1 (LF:HF).
IMD Measured Amplitude modulation products of the HF tone.
–3 dB measurement bandwidth is typically
20 Hz–750 Hz.
Analog Analyzer Chapter 6: Specifications
Getting Started with Your 2700 Series Instrument 61
14
System specification measured with the 2700 series analog generator and the analog analyzer set to the
indicated measurement bandwidth (BW). Generator amplitude setting must be £12 Vrms balanced or
£6 Vrms unbalanced for specified system performance below 30 Hz. At higher amplitude settings generator
THD derates to 0.0020% from 20 Hz–30 Hz.
15
Uses the 1/3-octave bandpass filter to enhance the measured range in the presence of wideband noise.
Alternate (interfering) channel input must be ³ 5 mV.
USO RESTRITO
Page 72

Measurement Range 0%–20%.
Accuracy ±0.5 dB.
Residual IMD
16
£0.0015% [–96.5 dB], 60/7 kHz or 250/8 kHz.
CCIF and DFD IMD Functions
Test Signal Compatibility Any combination of equal amplitude tones from
4 kHz–100 kHz spaced 80 Hz–1 kHz.
IMD Measured
CCIF 2nd order difference frequency product relative to
the amplitude of either test tone.
DFD u2 (2nd order difference frequency product)
per IEC 268-3 (1986).
Measurement Range 0%–20%.
Accuracy ±0.5 dB.
Residual IMD
15
CCIF £0.0004% [–108 dB], 14 kHz + 15 kHz,
DFD £0.0002% [–114 dB], 14 kHz + 15 kHz.
DIM (TIM) IMD Function
Test Signal Compatibility 2.96 kHz–3.15 kHz squarewave mixed with
14 kHz–15 kHz sine wave (probe tone).
IMD Measured
17
u4 and u5 per IEC 268-3 (1986).
Measurement Range 0%–20%.
Accuracy ±0.7 dB.
Residual IMD15 £0.0020% [–94 dB].
Wow & Flutter Measurements
with option “W&F”
Option “W&F” adds the capability to make both conventional wow & flutter and
scrape flutter measurements (using the technique developed by Dale Manquen of Altair
Electronics, Inc.). The demodulated W&F signal can also be selected for FFT analysis
in SYS-2712 and SYS-2722 configurations.
Test Signal Compatibility
Normal 2.80 kHz–3.35 kHz.
“High-band” 11.5 kHz–13.5 kHz.
Measurement Range 0%–1.2%.
Accuracy (4 Hz) ±(5% of reading + 0.0005%).
Detection Modes IEC/DIN (quasi-peak per IEC-386),
NAB (average),
JIS (per JIS 5551).
Chapter 6: Specifications Analog Analyzer
62 Getting Started with Your 2700 Series Instrument
16
System specification measured with the 2700 series analog generator at any valid input level ³200 mVrms.
17
IEC 268-3 defines nine possible DIM products. The 2700 series IMD option analyzer is sensitive only to the
u4 and u5 products using the simplified measurement technique proposed by Paul Skritek. DIM measurements
using this technique will typically be 6 dB–8 dB lower (better) than the results obtained using FFT-based
techniques which sum all nine products.
USO RESTRITO
Page 73

Response Selections
Weighted 4 Hz bandpass per IEC/DIN/NAB.
Unweighted 0.5 Hz–200 Hz.
Scrape
18
200 Hz–5 kHz.
Wideband
17
0.5 Hz–5 kHz.
Residual W+F
Weighted £0.001%.
Unweighted £0.002%.
Scrape or Wideband £0.005%.
Minimum Input 5 mV, 20 mV for specified residual.
Settling Time
IEC/DIN or NAB Typically 3 seconds–6 seconds.
JIS Typically 15 seconds–20 seconds.
Analog Analyzer Chapter 6: Specifications
Getting Started with Your 2700 Series Instrument 63
18
Operational only with high-band test signals (11.5 kHz–13.5 kHz). Upper –3 dB rolloff is typically 4.5 kHz using
12.5 kHz.
USO RESTRITO
Page 74
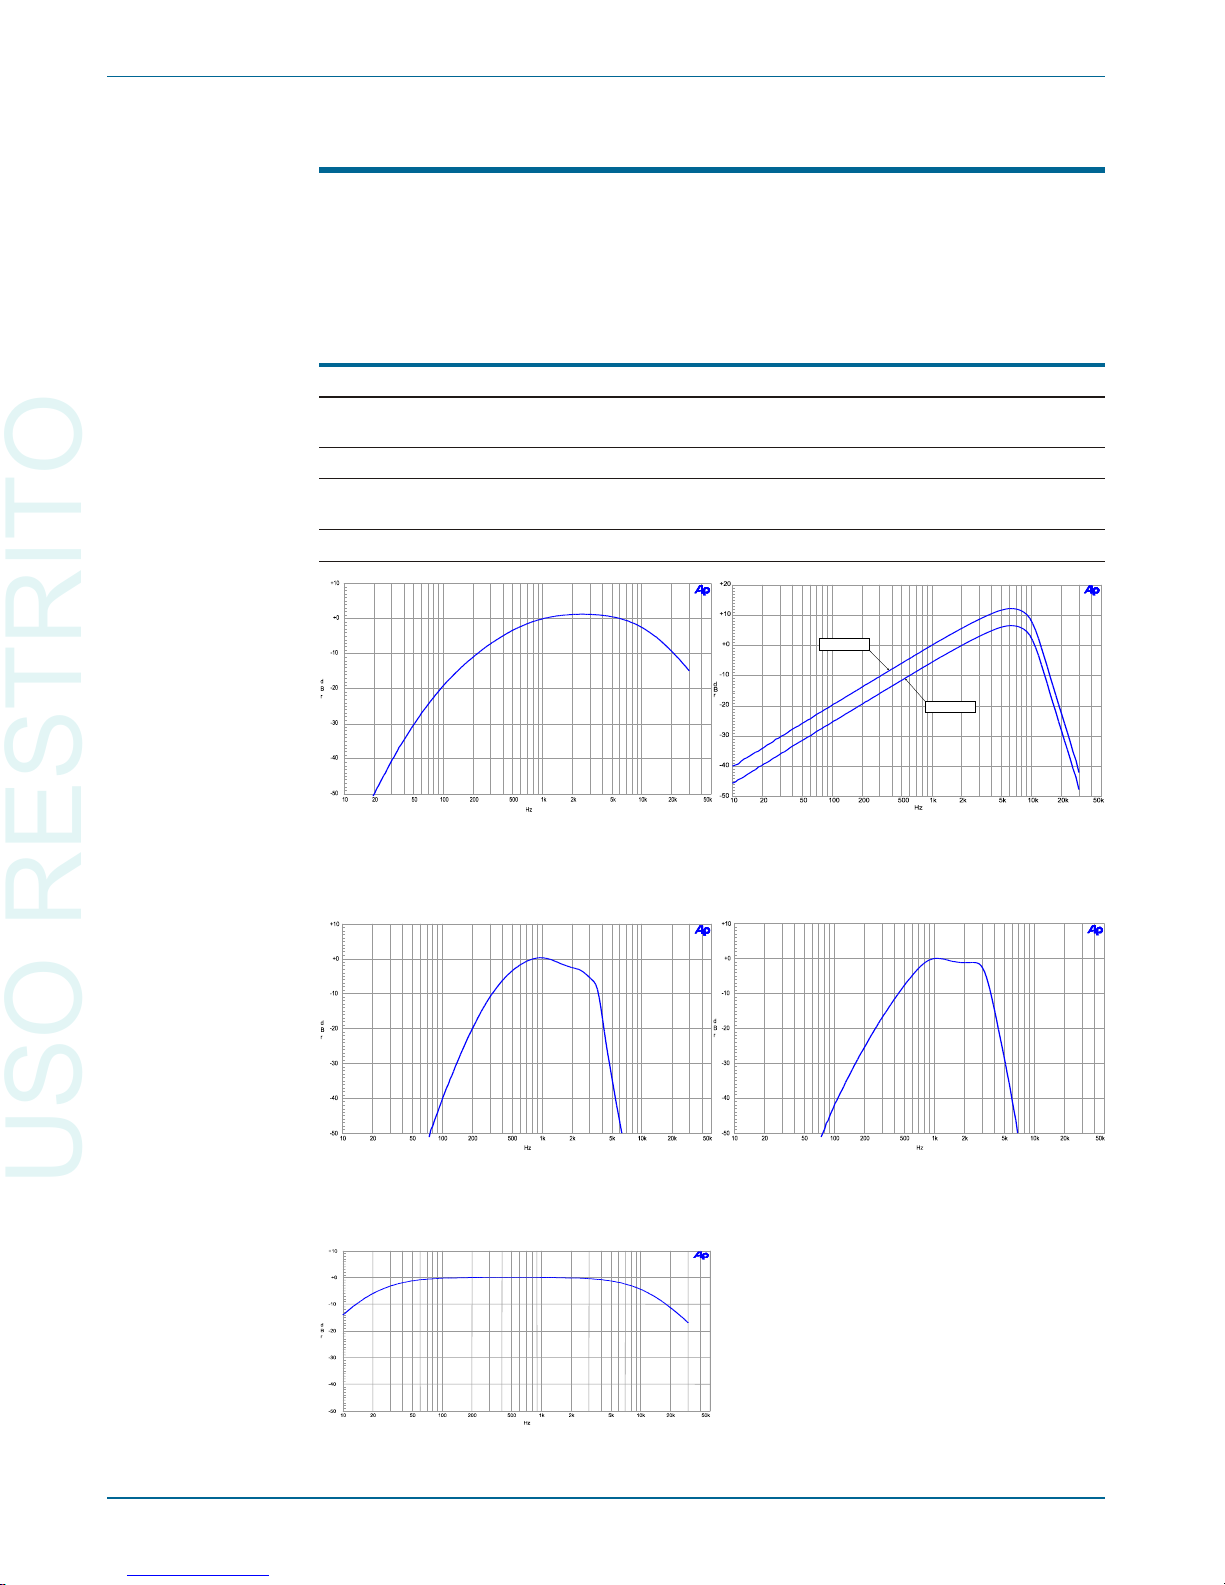
Option Filters
Up to seven option filters can be installed in the analog analyzer for weighted noise
or other special measurements. Only one option filter may be enabled at a time, and it
is cascaded with the standard bandwidth limiting filters. The following tables list only
the most popular types. Consult Audio Precision for custom designs.
Weighted Noise Measurement
FIL-AWT “A” weighting per IEC Rec 179. –see Figure 37
FIL-CCR Weighting per IEC468 (CCIR) and DIN 45404
(Also for CCIR/ARM). –see Figure 38
FIL-CIT Weighting per CCITT Rec P53. –see Figure 39
FIL-CMS “C-message” per BSTM 41004 and ANSI/IEEE
St d 743-1984. –see Figure 40
FIL-CWT “C” weighting per IEC Rec 179. –see Figure 41
Chapter 6: Specifications Option Filters
64 Getting Started with Your 2700 Series Instrument
Figure 37. FIL-AWT. ANSI-IEC “A”
Weighting Filter.
CC IR -4 6 8- 4
DO L BY
Figure 38. FIL-CCR. IEC468 (CCIR)/ DIN
45404 Noise Weighting Filter.
Figure 39. FIL-CIT. CCITT P53 Noise
Weighting Filter.
Figure 40. FIL-CMS.C-Message Weighting
Filter (ANSI/IEEE 743-1984).
Figure 41. FIL-CWT. “C”
Weighting (IEC-179).
USO RESTRITO
Page 75
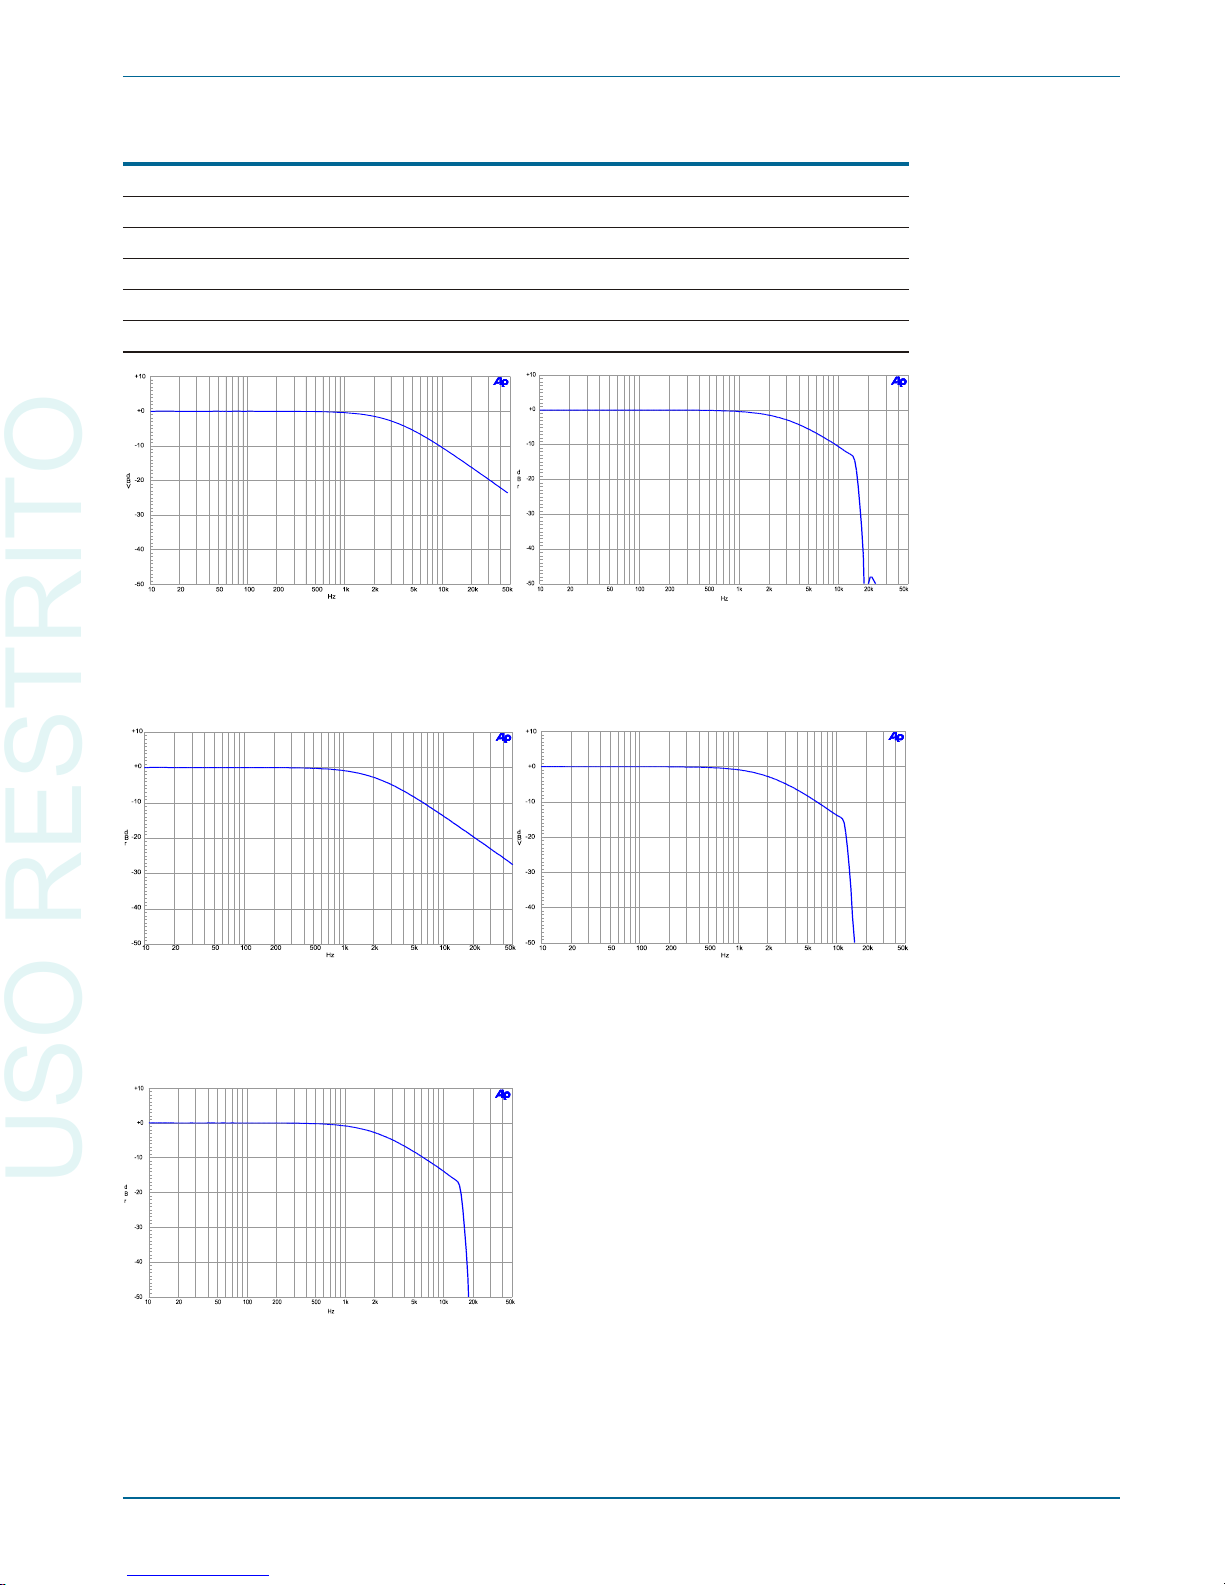
Precision De-emphasis Family
FIL-D50 50 µs ±1%. –see Figure 42
FIL-D50E 50 µs ±1% + 15.625 kHz notch.
FIL-D50F 50 µs ±1% + 19.0 kHz notch. –see Figure 43
FIL-D75 75 µs ±1%. –see Figure 44
FIL-D75B 75 µs ±1% + 15.734 kHz notch. –see Figure 45
FIL-D75F 75 µs ±1% + 19.0 kHz notch. –see Figure 46
Option Filters Chapter 6: Specifications
Getting Started with Your 2700 Series Instrument 65
Figure 42. FIL-D50.50 µs De-emphasis
Filter.
Figure 43. FIL-D50F. 50 µs with 19 kHz
(FM) notch De-emphasis Filter.
Figure 44. FIL-D75. 75 µs De-emphasis
Filter.
Figure 45. FIL-D75B. 75 µs with 15.734
kHz (NTSC) notch De-emphasis Filter.
Figure 46. FIL-D75F. 75 µs with 19 kHz
(FM) notch De-emphasis Filter.
USO RESTRITO
Page 76
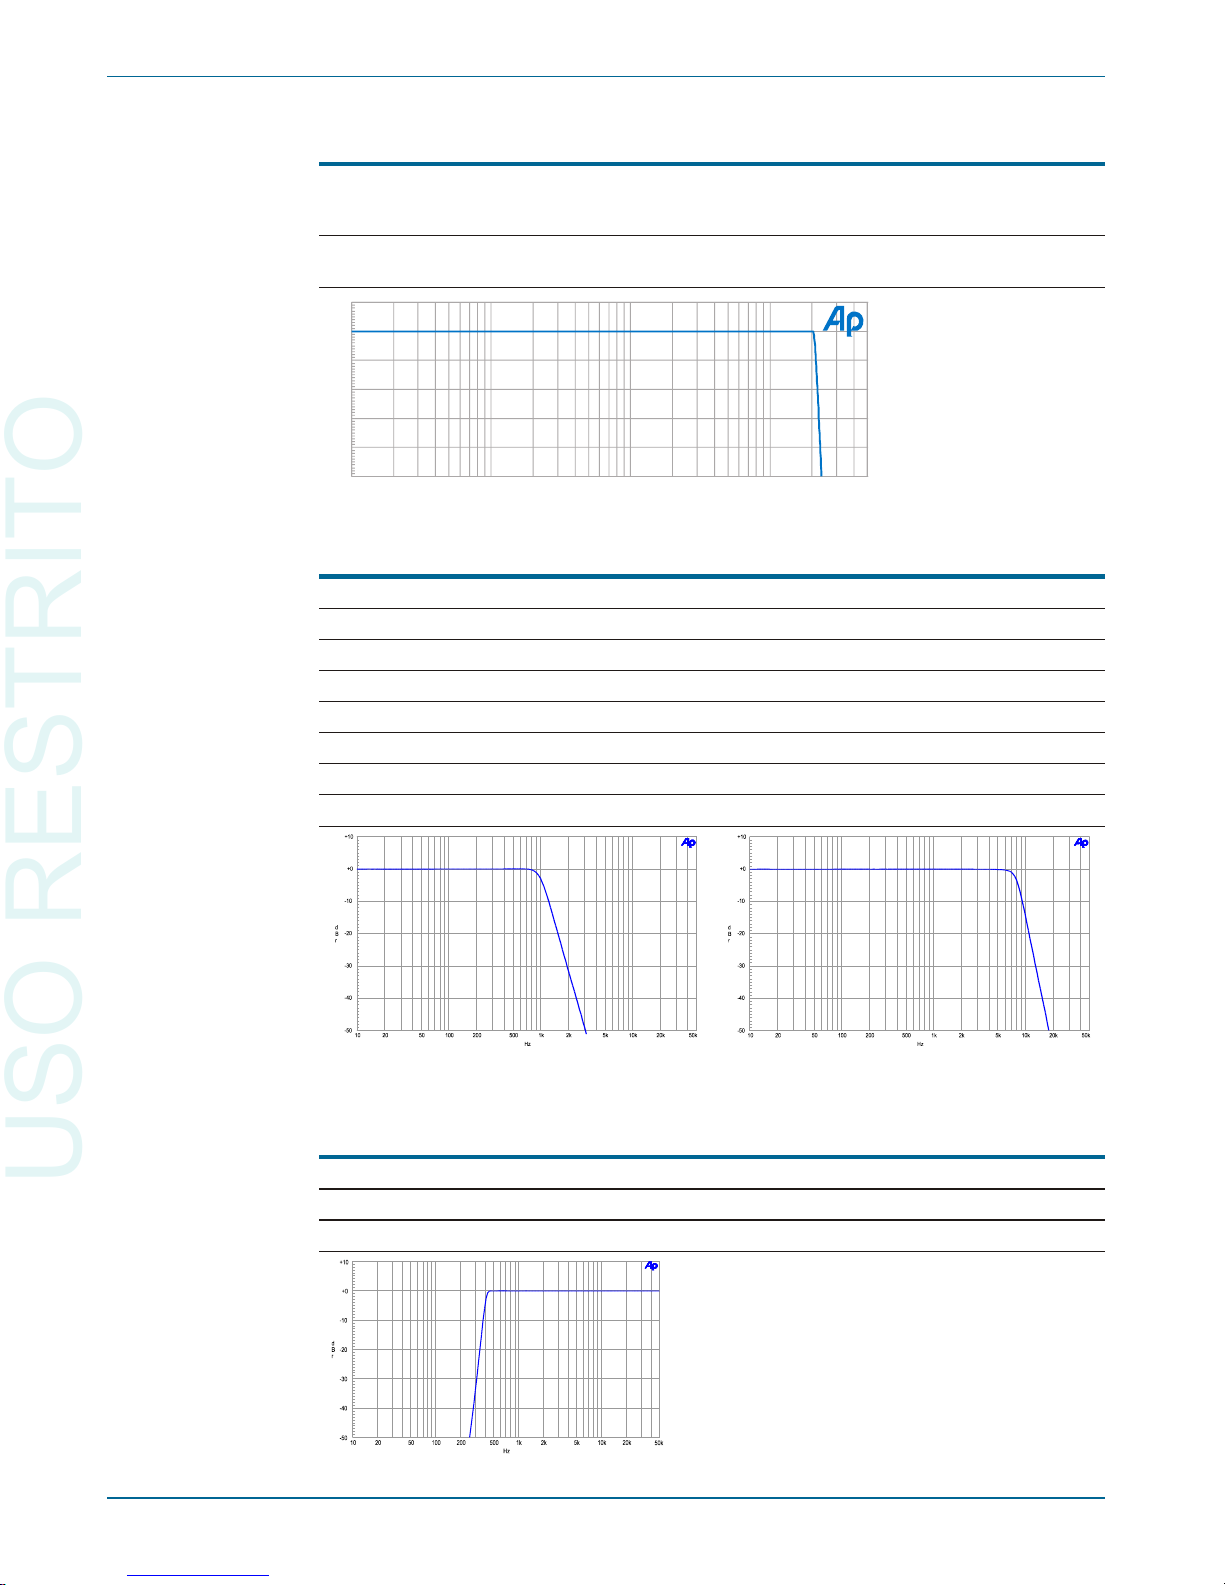
Very Sharp Cutoff Low-Pass Filter Family
FLP-B20K ±0.1 dB, 10 Hz–20 kHz; >60 dB attenuation at
24 kHz and higher. Complies with AES17.
–see Figure 47
FLP-B40K ±0.1 dB, 10 Hz–40 kHz; >60 dB attenuation at
48 kHz and higher. Complies with AES17.
General Purpose Low-Pass
FLP-300 300 Hz ±3%, 5-pole.
FLP-400 400 Hz ±3%, 5-pole.
FLP-500 500 Hz ±3%, 5-pole.
FLP-1K 1 kHz ±3%, 5-pole. –see Figure 48
FLP-3K 3 kHz ±3%, 7-pole.
FLP-4K 4 kHz ±3%, 7-pole.
FLP-8K 8 kHz ±3%, 7-pole. –see Figure 49
FLP-50K 50 kHz ±5%, 3-pole.
General Purpose High-Pass
FHP-70 70 Hz ±3%, 8-pole.
FHP-400 400 Hz ±3%, 9-pole. –see Figure 50
FHP-2K 2 kHz ±3%, 9-pole.
Chapter 6: Specifications Option Filters
66 Getting Started with Your 2700 Series Instrument
-50
+10
-40
-30
-20
-10
+0
d
B
r
A
10 50k20 50 100 200 500 1k 2k 5k 10k 20k
Figure 47. FLP-B20K
“Brick Wall” 20 kHz low
pass filter. Complies
with requirements of
AES17 for D/A converter
THD+N measurements.
Figure 48. 1 kHz 5-pole Low Pass Filter.
Figure 49. 8 kHz 7-pole Low Pass Filter.
Figure 50. FHP-
400. 400 Hz 9pole High Pass
Filter.
USO RESTRITO
Page 77
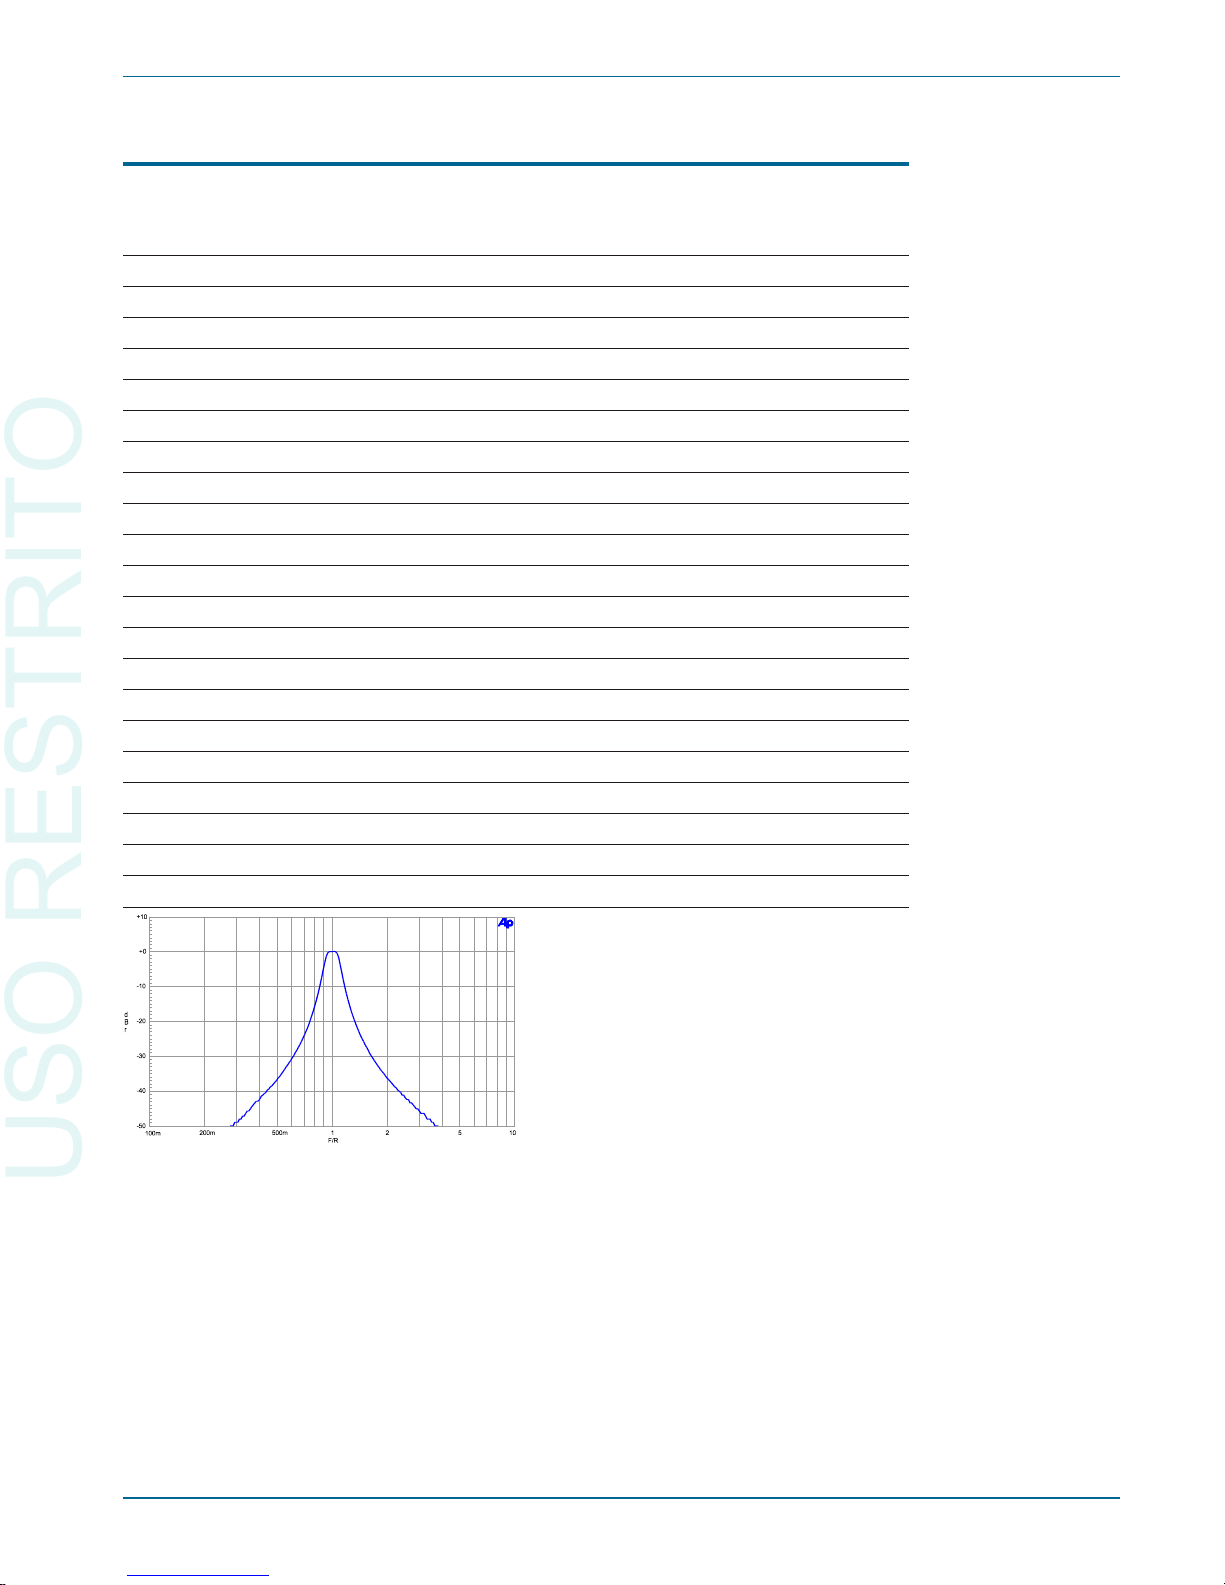
1/3-Octave (Class II) Bandpass Family
Family Response Class II (4-pole)
±0.2 dB from 0.97 fo–1.03 fo ;
<–12 dB at 0.8 fo and 1.25 fo ;
<–32 dB at 0.5 fo and 2.0 fo.
–see Figure 51
FBP-120 fo = 120 Hz.
FBP-250 fo = 250 Hz.
FBP-300 fo = 300 Hz.
FBP-400 fo = 400 Hz.
FBP-500 fo = 500 Hz.
FBP-600 fo = 600 Hz.
FBP-800 fo = 800 Hz.
FBP-1000 fo = 1.00 kHz.
FBP-1200 fo = 1.20 kHz.
FBP-1500 fo = 1.50 kHz.
FBP-2000 fo = 2.00 kHz.
FBP-3000 fo = 3.00 kHz.
FBP-4000 fo = 4.00 kHz.
FBP-5000 fo = 5.00 kHz.
FBP-6000 fo = 6.00 kHz.
FBP-8000 fo = 8.00 kHz.
FBP-10000 fo = 10.0 kHz.
FBP-12500 fo = 12.5 kHz.
FBP-15000 fo = 15.0 kHz.
FBP-20000 fo = 20.0 kHz.
FBP-30000 fo = 30.0 kHz.
Option Filters Chapter 6: Specifications
Getting Started with Your 2700 Series Instrument 67
Figure 51. FBP-xxxx.
Normalized Response of 1/3Octave Band Pass Filters
USO RESTRITO
Page 78
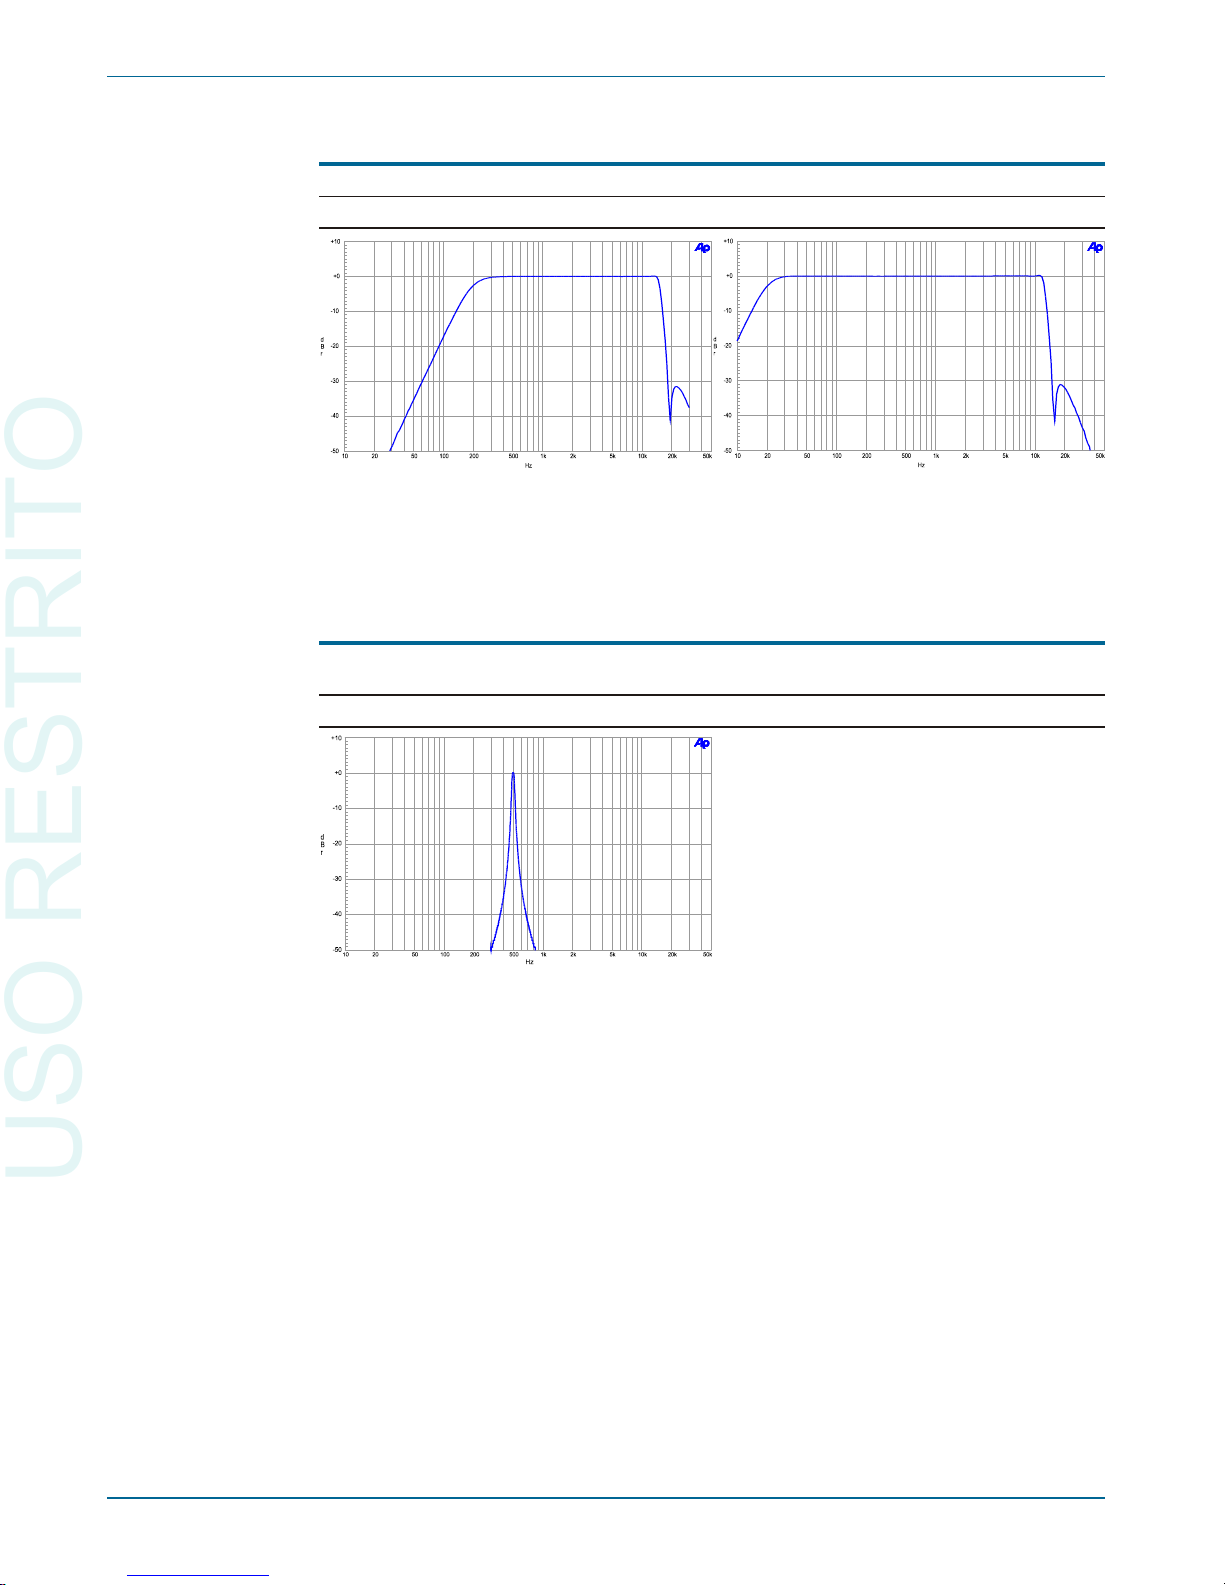
Receiver Testing
FIL-RCR 200 Hz–15 kHz + 19.0 kHz notch. –see Figure 52
FIL-IECR 20 Hz–15 kHz + 15.625 kHz notch –see Figure 53
Miscellaneous
FBP-500X High-Q 500 Hz bandpass for CD DAC linearity
measurements. –see Figure 54
FIL-USR Kit for building custom filters.
Chapter 6: Specifications Option Filters
68 Getting Started with Your 2700 Series Instrument
Figure 52. FIL-RCR. 200 Hz to 15 kHz with
19 kHz (FM) notch.
Figure 53. FIL-IECR. 20 Hz to 15 kHz with
15.625 kHz (PAL) notch.
Figure 54. FBP-500X. HighQ 500 Hz Band Pass Filter
(for CD linearity testing).
USO RESTRITO
Page 79
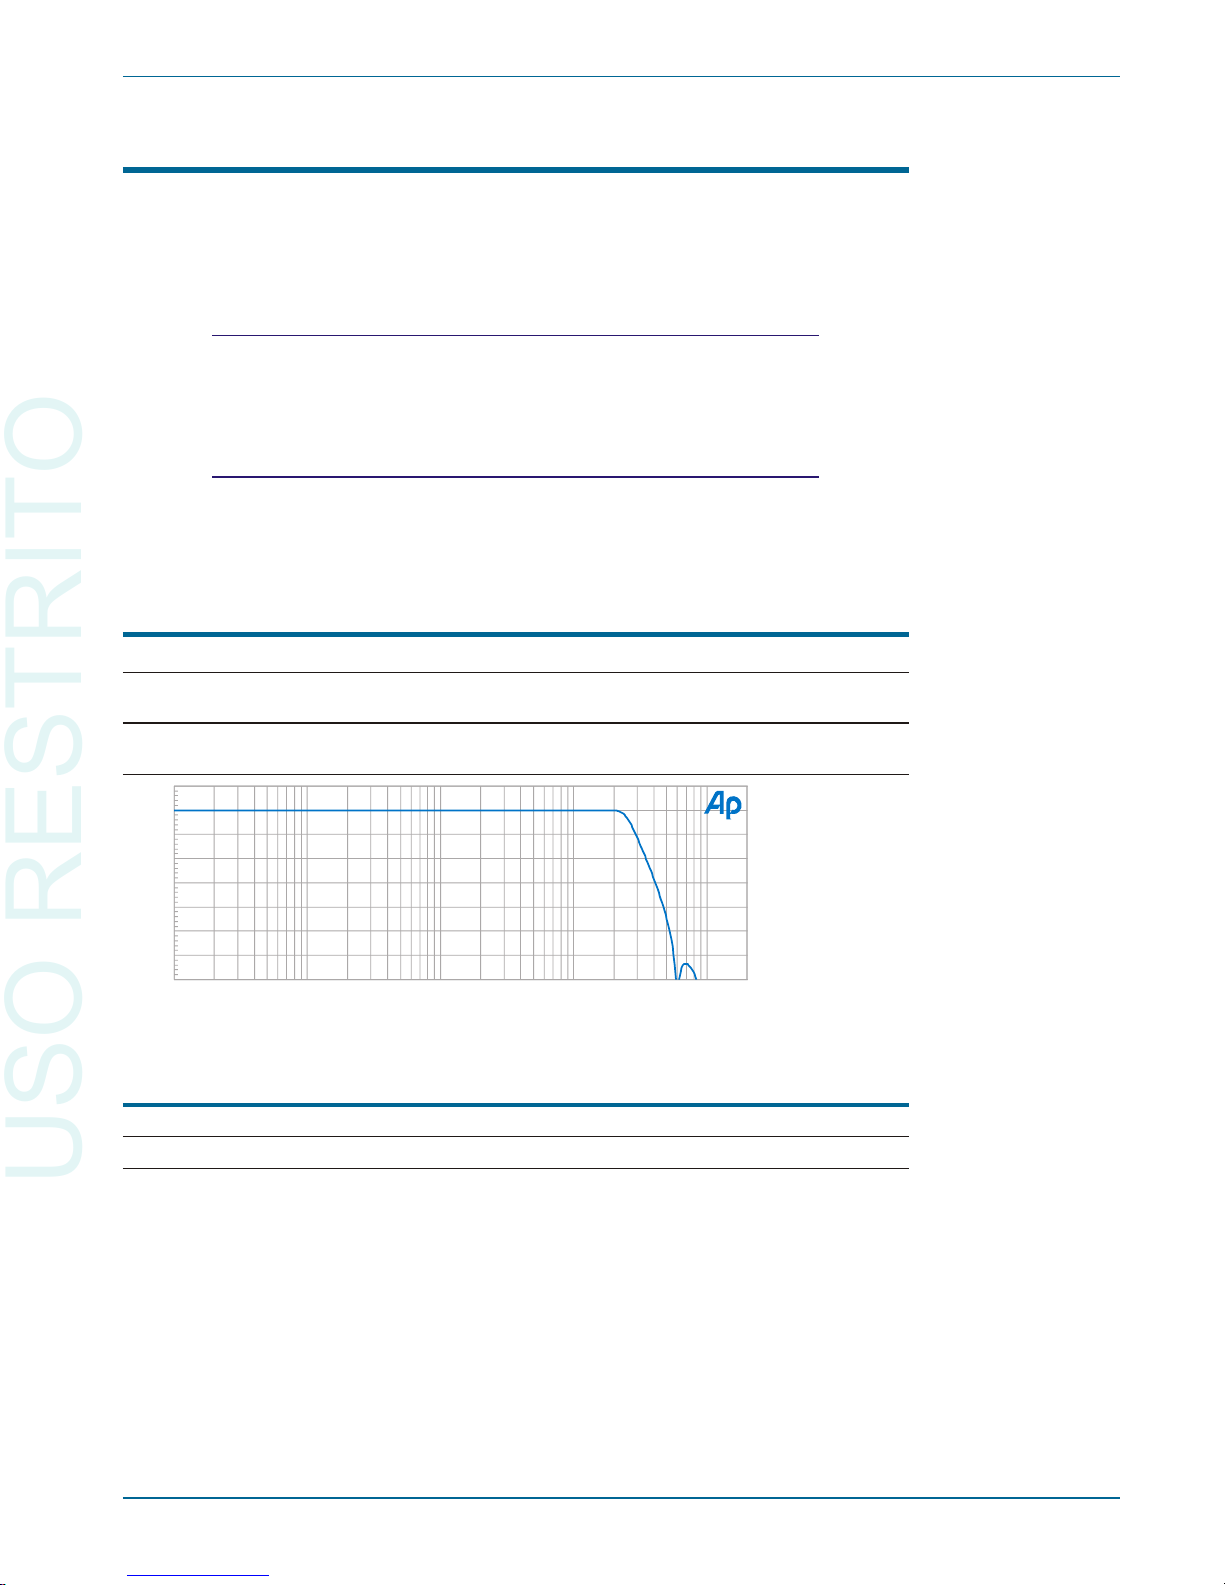
Option S-AES17
Option S-AES17 adds the capability to insert a 20 kHz or 40 kHz low-pass filter
following the selected analog input preamplifier, but before any signal processing
within the analog analyzer. It enables accurate noise and THD+N measurements of
sigma-delta converters and switching power amplifiers that contain large amounts of
unwanted energy above the normal audio bandwidth.
High performance sigma-delta converter s and switching power
amplifiers often contain out-of-band energy that can exceed the
in-band audio signal. Standard bandwidth limiting and noise
weighting filters will not give accurate measurements due to
their relatively low roll-off rates.
Option S-AES17 also includes the FLP-B20K and FLP-B40K option filters. These
have been designed to work in tandem with the selectable pre-analyzer filters to
provide THD+N measurements in accordance with AES17-1998.
Pre-Analyzer Filter Response
(also affects the LEVEL and FREQUENCY meters of the selected channel)
20 kHz ±0.10 dB, 10 Hz–20 kHz
(typ –3 dB at 25 kHz, <–60 dB above 60 kHz).
40 kHz ±0.10 dB, 10 Hz–40 kHz
(typ –3 dB at 50 kHz, <–60 dB above 120 kHz).
Residual THD+N (1 kHz)
“20k AES17” mode £(0.00030% + 1.0 µV) [–110.5 dB].
“40k AES17” mode £(0.00040% + 1.4 µV) [–108 dB].
Option S-AES17 Chapter 6: Specifications
Getting Started with Your 2700 Series Instrument 69
-70
+10
-60
-50
-40
-30
-20
-10
+0
d
B
r
A
10
200k20 50 100 200 500 1k 2k 5k 10k 20k 50k 100k
Figure 55. Typical response of 20 kHz “pre-analyzer” filter.
USO RESTRITO
Page 80

DSP Analysis of Analog Signals
Available only in SYS-2712 and SYS-2722 configurations. Signals connected to
the analog analyzer input connector may be routed through stereo A/D converters for
enhanced analysis capabilities. There are two selectable converters. The highresolution converter (“HiRes A/D”) is optimized for signal analysis and FFT displays
up to 30 kHz. It offers the best residual noise and distortion performance. The high
bandwidth converter (“HiBW A/D”) is optimized for signal analysis up to 120 kHz.
The term “fs” refers to sample frequency (also called sample rate), in hertz.
High Resolution Converter
A/D Resolution 24-bit sigma-delta.
Sample Rate (fs) 8 ks/s–108 ks/s variable; or 65.536 ks/s fixed.
Flatness (1 kHz ref) ±0.01 dB to
045. ´ SR
or 20 kHz, whichever is
lower.
Alias Rejection
19
typically >115 dB for signals >0.554 x fs.
Distortion –105 dB for fs £65.536 ks/s,
–102 dB for fs up to 100 ks/s.
High Bandwidth Converter
A/D Resolution 16-bit sigma-delta.
Sample Rate (fs) 16 ks/s–200 ks/s variable; or 131.072 ks/s, or
262.144 ks/s fixed.
Flatness (1 kHz ref) ±0.01 dB to 20 kHz,
±0.10 dB to 120 kHz (262.144 ks/s).
Alias Rejection
18
typically >85 dB for signals > 0.540 x fs.
Distortion –92 dB for fs £200 ks/s,
–90 dB with fs = 262.144 ks/s.
FFT Signal Analyzer
(With “FFT” DSP program)
Acquisition Length 800 samples to 4 M samples in 15 steps.
Transform Length 256–32768 samples in binary steps.
Processing 48 bit.
Amplitude Accuracy ±0.09 dB, 20 Hz–20 kHz,
Flat-top or Move to Bin Center windows.
Averaging 1–4096 averages in binary steps. Averaging is
power-based (frequency domain), or synchronous
(time domain).
Waveform Display Modes
Time Domain Normal, Interpolate, Peak or Max.
Frequency Domain Peak pick (highest bin amplitude is displayed
between the requested graph points).
Frequency Display Modes Peak pick, individual bin.
Chapter 6: Specifications DSP Analysis of Analog Signals
70 Getting Started with Your 2700 Series Instrument
19
Alias rejection is provided by digital filters within the A/D converters.
USO RESTRITO
Page 81
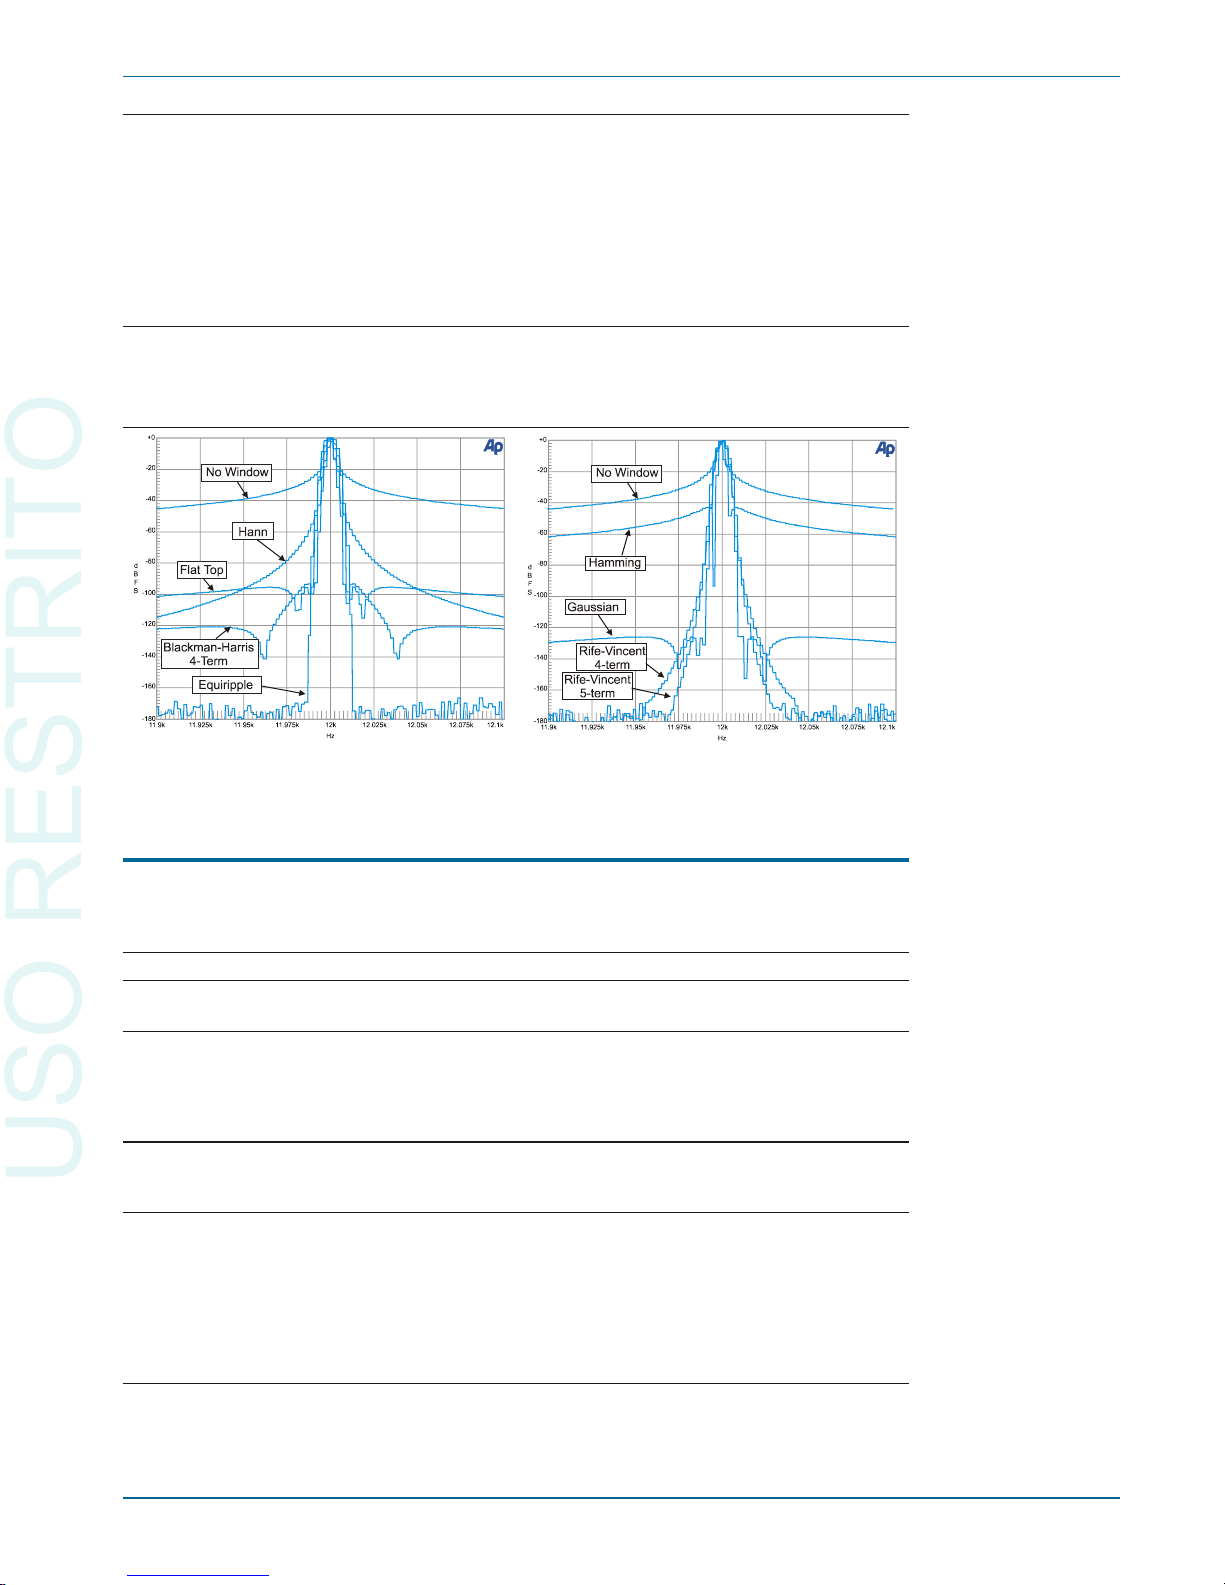
Windows Blackman-Harris (4-term with –92 dB sidelobes),
–see Figures 56 and 37. Hann,
Flat-top,
Equiripple (AP design with –160 dB sidelobes),
None,
None, move to bin center,
Hamming,
Gaussian,
Rife-Vincent 4-term,
Rife-Vincent 5-term.
Move to bin center Window
Frequency Range ±4% of input frequency, 7th FFT bin (low limit),
to 0.45 x fs (high limit).
Spurious Products <–120 dB.
DSP Audio Analyzer
with “Analyzer” DSP program
Wideband Level/Amplitude
Accuracy (1 kHz) ±0.09 dB [±1.0%]
Frequency Range <10 Hz to 45% of Sample Rate
[10 Hz–21.6 kHz at 48 ks/s].
High pass Filters <10 Hz 4-pole,
22 Hz 4-pole,
100 Hz 4-pole,
400 Hz 4-pole (4-pole Butterworth or 10-pole
elliptic if no other filters are enabled).
Low pass Filters FS/2 (maximum bandwidth),
20 kHz (6-pole elliptic),
15 kHz (6-pole elliptic).
Weighting Filters ANSI-IEC “A” weighting, per IEC Rec 179,
CCIR QPk per IEC468 (CCIR),
CCIR RMS per AES17,
C-message per IEEE Std 743-1978,
CCITT per CCITT Rec. O.41,
“F” weighting corresponding to 15 phon loudness
contour, –see Figure 58
HI-2 Harmonic weighting.
DSP Analysis of Analog Signals Chapter 6: Specifications
Getting Started with Your 2700 Series Instrument 71
Figure 56. Windowing functions for FFT (A)
Figure 57. Windowing functions for FFT (B)
USO RESTRITO
Page 82
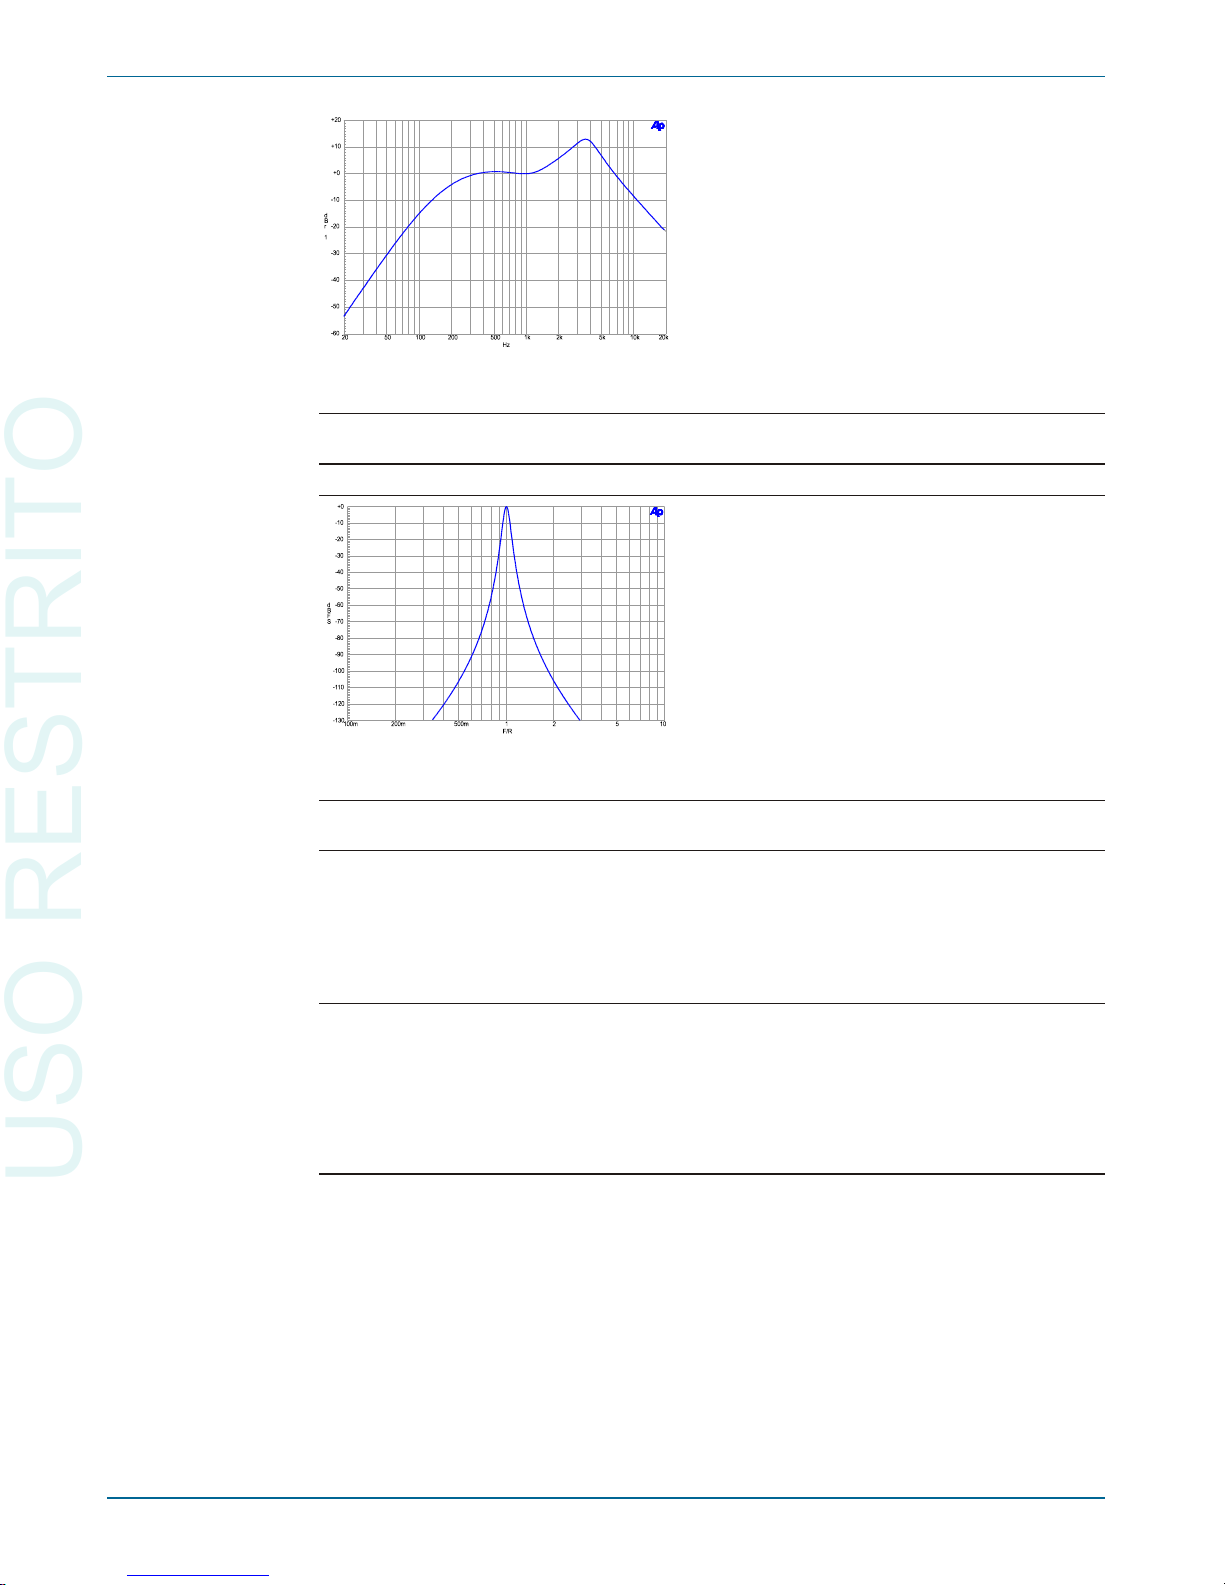
Narrow Band Amplitude
Frequency Range <10 Hz to 47% of Sample Rate
[10 Hz–22.56 kHz at 48 ks/s].
Filter Shape 10-pole, Q=19 (BW = 5.3% of fo). –see Figure 59
THD+N Measurements
Frequency Range <10 Hz to 47% of Sample Rate
[10 Hz–22.56 kHz at 48 ks/s].
High pass Filters <10 Hz (4-pole),
22 Hz (4-pole),
100 Hz (4-pole),
400 Hz (4-pole Butterworth).
Low pass Filters FS/2 (maximum bandwidth),
20 kHz (6-pole elliptic),
15 kHz (6-pole elliptic).
Weighting Filters ANSI-IEC “A” weighting, per IEC Rec 179,
CCIR QPk per IEC468 (CCIR),
CCIR RMS per AES17,
C-message per IEEE Std 743-1978,
CCITT per CCITT Rec. O.41,
“F” weighting corresponding to 15 phon loudness
contour, –see Figure 29
HI-2 Harmonic weighting.
Chapter 6: Specifications DSP Analysis of Analog Signals
72 Getting Started with Your 2700 Series Instrument
Figure 58. Digital Analyzer
F-weighting curve.
Figure 59. Digital Domain
Bandpass filter response.
USO RESTRITO
Page 83

Frequency Measurements
Range <10 Hz to 47% of Sample Rate
[10 Hz–23.0 kHz at 48 ks/s].
Accuracy ±0.01% of reading or 0.0001% of Sample Rate,
whichever is greater.
Resolution 0.003% of reading or 0.0001% of Sample Rate,
whichever is greater.
Phase Measurements
Measurement Ranges ±180, –90/+270, or 0/+360 degrees.
Accuracy
20
10 Hz–5 kHz ±0.5 degree.
5 kHz–20 kHz ±1 degree.
20 kHz–50 kHz ±2 degrees.
Resolution 0.01 degree.
Minimum Input 1 mV, both inputs.
SMPTE IMD Measurements
Test Signal Compatibility Any combination of 40 Hz–250 Hz (LF) and 2 kHz
to 45% of Sample Rate (HF) tones, mixed in any
ratio from 1:1 to 5:1 (LF:HF).
IMD Measured Amplitude modulation products of the HF tone.
–3dB measurement bandwidth is 10 Hz–750 Hz.
Measurement Range 0%–20%.
Accuracy ±0.5 dB.
Residual IMD
21
£0.0025%, 60 + 7 kHz or 250 + 8 kHz.
Quasi-Anechoic Acoustical Tester
With “MLS” DSP program
Signals Four pink sequences, four white sequences.
Frequency Range (Sample Rate ¸ 2000) to (Sample Rate ¸ 2).
Frequency Resolution (Max) 1.465 Hz at 48.0 ks/s.
Acquisition Length 32767 or 131071 samples.
FFT Length 32768.
Energy Time Windows half Hann,
Hann,
<240 Hz to >8 kHz,
<120 Hz to >16 kHz.
Time Windows <5%,
(per cent of data re cord to <10%,
transition from 0 to full <20%,
amplitude) <30%.
Averaging 1–4096 averages in binary steps. Averaging
algorithm is synchronous.
DSP Analysis of Analog Signals Chapter 6: Specifications
Getting Started with Your 2700 Series Instrument 73
20
Both analog analyzer input channels must have same coupling (ac or dc) selection, and both DSP analyzer
input channels must have same coupling (ac or dc) selection. Accuracy is valid for any input signal amplitude
ratio up to ±30 dB. Upper frequency range limited to 45% of Sample Rate.
21
System specification measured with the 2700 series analog generator. Valid for input levels ³200 mVrms.
USO RESTRITO
Page 84

Multitone Audio Analyzer
With “FASTTEST” DSP program
Acquisition Length 512–32768 samples in binary steps.
Transform Length 512–32768 samples in binary steps.
Processing 48 bit.
Measurements Level vs frequency (Response),
Total distortion vs frequency,
Noise vs frequency,
Phase vs frequency,
Crosstalk vs frequency,
Masking curve.
Frequency Resolution (Sample Rate ¸ Transform Length)
[1.465 Hz with fs = 48 ks/s
& Transform Length = 32768].
Frequency Correction Range ±3%.
Distortion £–115 dB.
Chapter 6: Specifications DSP Analysis of Analog Signals
74 Getting Started with Your 2700 Series Instrument
USO RESTRITO
Page 85

Digital Signal Generator
Available only in the SYS-2720 and SYS-2722 configurations. The 2700 series
digital generator consists of a DSP signal generator, hardware impairment generators
and processing (for example, variable risetime and induced jitter), and digital output
stages supporting the most popular formats.
Except for arbitrary and Pass Thru waveforms, the embedded output signals and the
digitally generated analog output signals are inde pendently selectable and concurrently
available. If both digital and analog outputs are select ing arbitrary waveform, it must
be the same one. If Pass Thru waveforms are selected for both analog and digital
generators, they must be at the same sample rate.
Interface Signal Characteristics
Output Formats Balanced XLR (AES/EBU per AES3-r1997),
Dual Connector XLR,
Unbalanced BNC (SPDIF-EIAJ per IEC-60958),
Dual Connector BNC,
Optical (Toslink®) per IEC-60958,
General purpose parallel, or
Serial interface to chip via optional PSIA-2722.
Sam ple Rate (“SR”)
Range 28 kHz–200 kHz for fully specified performance.
Usable from 16 kHz–216 kHz.
Res o lu tion <0.0001 Hz.
Ac cu racy ±0.0002% [±2 PPM],
lockable to external reference.
Out put Am pli tude
Bal anced (XLR)
Range 0 Vpp–10.20 Vpp into 110 W.
Out put is un spec i fied above 8.00 Vpp if
SR >108 kHz.
Res o lu tion 40 mV, 4 mV be low 1 Vpp.
Ac cu racy ±(10% + 80 mV).
Unbal anced (BNC)
Range 0 Vpp–2.55 Vpp into 75 W.
Out put is un spec i fied above 2.00 Vpp if
SR >108 kHz.
Res o lu tion 10 mV, 1 mV be low 0.25 Vpp.
Ac cu racy ±(8% + 20 mV).
Op ti cal Fixed using Toslink® TOTX142L.
Out put im ped ance
Bal anced (XLR) Nom i nally 110 W.
Un bal anced (BNC) Nom i nally 75 W.
Chan nel Sta tus Bits Full im ple men ta tion per IEC 60958, Eng lish
lan guage de coded, Pro fes sional or con sumer or
hex for mats; in de pend ent in each chan nel.
User Bits Set to 0.
Va lid ity Flag Selectable-set or cleared, com mon to both
outputs.
Digital Signal Generator Chapter 6: Specifications
Getting Started with Your 2700 Series Instrument 75
USO RESTRITO
Page 86

Interface Signal Impairments
Variable Rise/Fall Time 12 ns–100 ns, ±(10% + 2 ns).
Cable Simulation Approximates the signal degradation of
40 m–100 m of typical digital audio cable.
Induced Jitter (sine wave)
Frequency Range
22
2 Hz–200 kHz.
Amplitude Range
21
0 UI–0.127 UI in 0.0005 UI steps,
0.13 UI–1.27 UI in 0.005 UI steps,
1.3 UI–12.7 UI in 0.05 UI steps.
Accuracy ±(10% + 2.0 ns), peak calibrated.
Flatness
23
±1 dB, 100 Hz–50 kHz.
Residual Jitter
24
£600 ps (700 Hz–100 kHz an a lyzer band width),
£1.0 ns (50 Hz–100 kHz an a lyzer band width).
Spu ri ous Jit ter Prod ucts Typically 30 dB be low jit ter sig nal or 0.001 UI,
which ever is larger.
Nor mal Mode Noise
Wave form Pseudo-random pulse train.
Bal anced (XLR) 0 Vpp–2.55 Vpp in 10 mV steps, ±(10% +
100 mV).
Un bal anced (BNC) 0 mVpp–635 mVpp in 2.5 mV steps, ±(10% +
25 mV).
Com mon Mode Sig nal Ap plies to Bal anced (XLR) out puts only.
Fre quency Range 20 Hz–100 kHz.
Am pli tude Range 0 Vpp–20.4 Vpp in 80 mV steps,
±(10% + 160 mV).
De lay from rear panel –64 UI to +63.5 UI in 0.5 UI steps.
Ref er ence Output
Embedded Signal Generation
En coding is selectable 8–24 bit Lin ear, µ-Law, or A-Law
Sine Family Common Characteristics
Waveforms Sine, Sine Burst (rectangular envelope), Variable
Phase Sine (two sine waves of same frequency
but settable phase), Stereo Sine (independent
frequency and amplitude in each channel), Dual
Sine (sum of two sine waves with variable ratio),
Sine + Offset, and Shaped Sine Burst (raised
cosine envelope).
Frequency Range 10 Hz to 47% of Sample Rate
[22.56 kHz at 48 ks/s].
Frequency Resolution Sample Rate ¸ 2
23
[0.006 Hz at 48 ks/s].
Flatness ±0.001 dB.
Chapter 6: Specifications Digital Signal Generator
76 Getting Started with Your 2700 Series Instrument
22
Combinations of jitter amplitude and frequency must not result in greater than 50% reduction in transmitted bit
width.
23
System specification at 32, 44.1, 48, 88.2, 96, 176.4, and 192 ks/s. Flatness of the jitter generator wil l exhibit
degradation at other sample rates.
24
Applies to electrical signal formats only. Specification subject to the following conditions: (1) all jitter generator
impairments must be turned off or disabled including the delay from reference output feature; (2) the digital
input signal must be ³ 1.5 Vpp (AES/EBU) or ³ 300 mVpp (SPDIF-EIAJ) and have a risetime £ 20 ns.
Jitter via the optical path may be considerably worse with embedded audio or dither enabled (limited by
Toslink® technology).
USO RESTRITO
Page 87
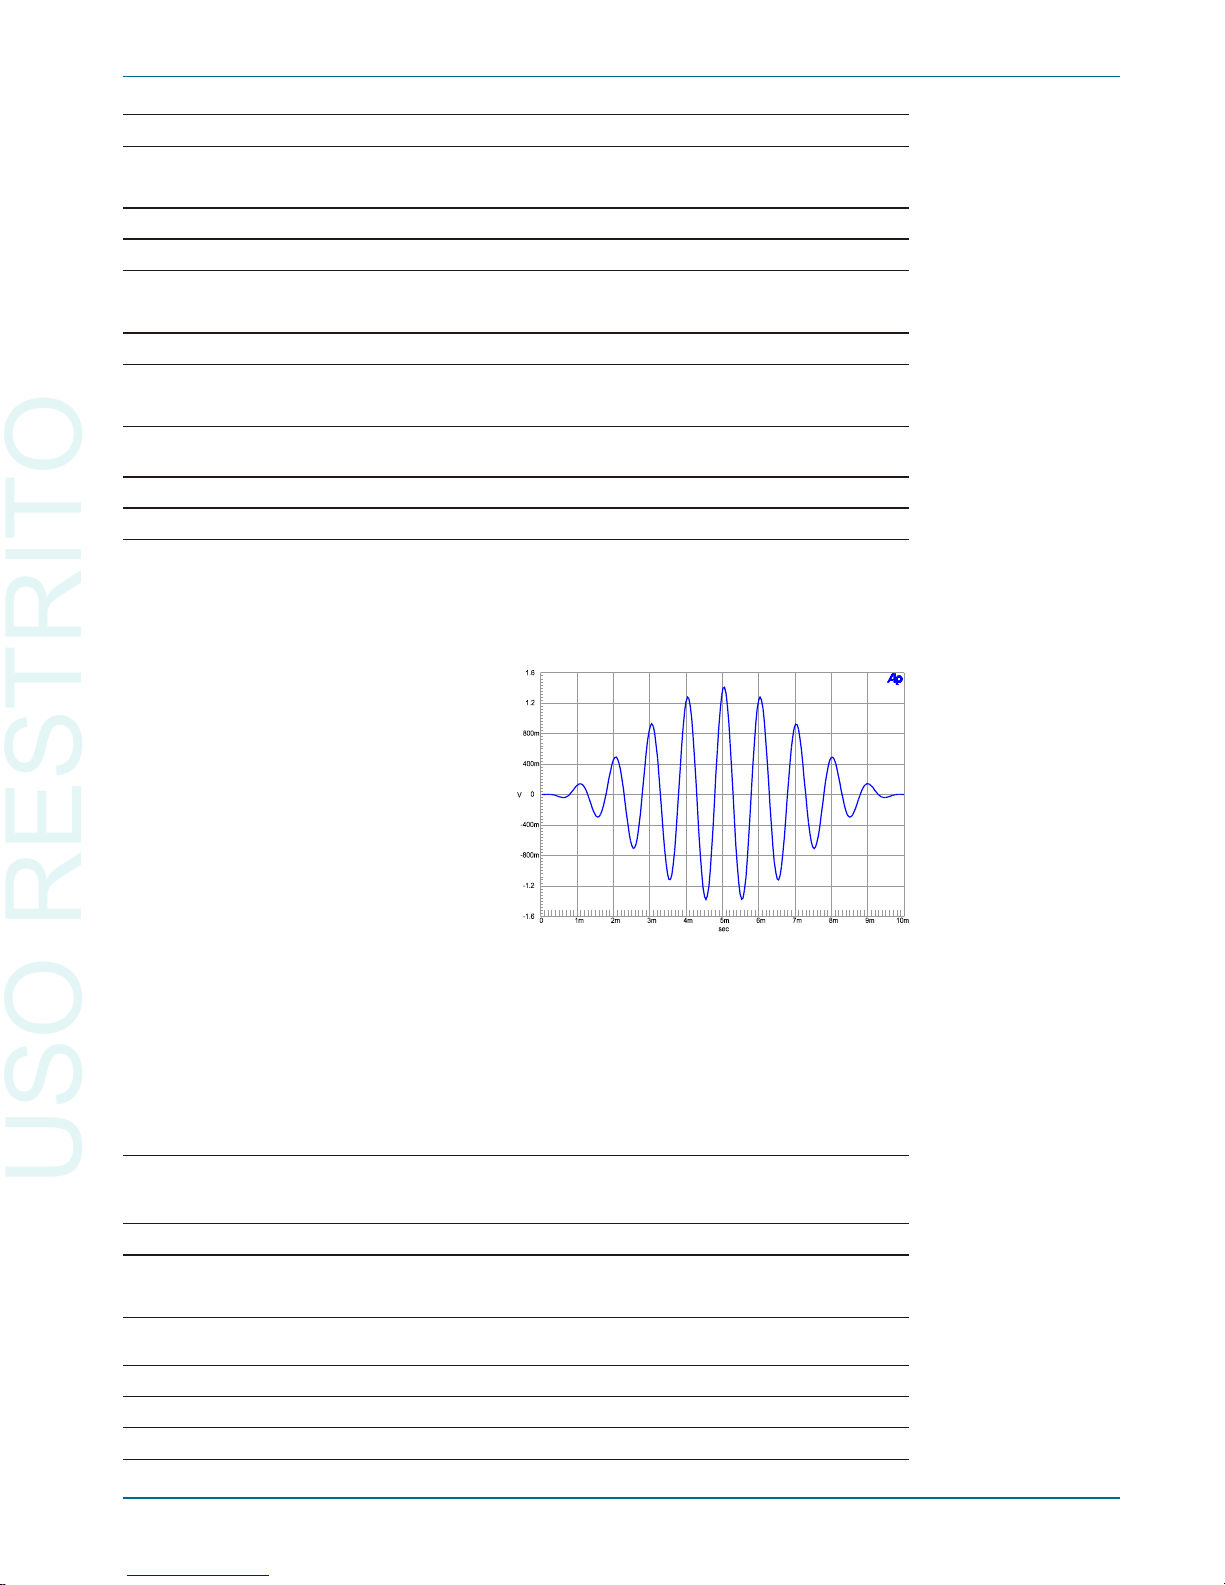
Harmonics/Spurious Products £0.000001% [–160 dB].
Variable Phase Sine Wave
Phase Range ±180 deg.
Phase Resolution 0.01 deg.
Sine + Offset
Offset Amplitude Sine amplitude + |offset amplitude| £100% FS.
Sine Burst and Shaped Sine Burst
Envelope Rectangular for Sine Burst,
Raised cosine for Shaped Burst. –see Figure 60
Interval 2 cycles–65536 cycles.
Burst On 1 to (number of Interval cycles minus 1).
Square Wave
Frequency Range £1 Hz to 1/6 Sample Rate. Frequencies are
limited to even integer sub-multiples of the
Sample Rate.
Even Harmonic Content £0.000001% [–160 dB].
SMPTE/DIN Waveform
Upper Tone Range 2 kHz to 47% of Sample Rate
[22.56 kHz at 48 ks/s].
Lower Tone Range 40 Hz–500 Hz.
Amplitude Ratio 1:1 or 4:1 (LF:HF).
Distortion/Spurious £0.000001% [–160 dB] at 4:1 ratio.
Digital Signal Generator Chapter 6: Specifications
Getting Started with Your 2700 Series Instrument 77
Figure 60. Shaped Sine Burst signal.
(1 kHz, 10 cycles)
USO RESTRITO
Page 88

CCIF and DFD IMD Waveforms
Center Frequency Range 3.00 kHz to (47% of Sample Rate –½ IM freq.).
IM Frequency Range 80 Hz–2.00 kHz.
Distortion/Spurious £0.000001% [–160 dB].
DIM IMD Waveform
Square/Sine Frequencies Determined by Sample Rate (see Note below).
Distortion/Spurious £0.000001% [–160 dB].
The DIM test signal consists of a square wave and a sine wave
mixed in a 4:1 amplitude ratio. Since digital square waves are
generated by alternately turning the output on and off for the
same number of sample periods, the frequencies achievable
are limited to even sub-multiples of the Sample Rate. Because
of this constraint, the square wave frequency is chosen first to
be as close to the “ideal” analog test frequency as possible.
The sine wave frequency is then chosen based upon the ideal
sine/square frequency ratio. The following table lists some
examples for the DIM and DIMB signals:
Noise
Types Pink, White, Burst, USASI.
Special Signals
Monotonicity Low level staircase waveform for D/A linearity
testing.
J-Test Produces a maximum amount of data-induced
jitter on low-bandwidth transmission links.
Polarity Two sinewaves phased for reinfor cement with
normal polarity.
Walking Ones A single binary one value “walked” from LSB to
MSB.
Walking Zeros A single binary zero value “walked” from LSB to
MSB.
Constant Value
(Digital dc) 32-bit resolution when using triangular dither.
Chapter 6: Specifications Digital Signal Generator
78 Getting Started with Your 2700 Series Instrument
DIM: “ideal” square frequency = 3150, sine/square frequency ratio = 100/21
Sample Rate Square Wave Frequency Sine Wave Frequency
44100 3150 15000
48000 3000 14285.7
DIMB: “ideal” square frequency = 2960, sine/square frequency ratio = 175/37
44100 3150 14898.65
48000 3000 14189.19
USO RESTRITO
Page 89

Random (Bittest) Pseudo-random binary states of all bits.
Pass Thru Passes the signal from the rear panel Ref Input.
Accepts sample rates from 27 kHz–200 kHz and
outputs at programmed sample rate. Ratio of
rates may not exceed 7.75:1.
Quasi-Anechoic Acoustical Tester (MLS)
(Also see MLS in Digital Analyzer section, page 84)
Signals Four pink sequences, four white sequences.
Frequency Range dc to Sample Rate ¸ 2.
Sequence Length 32767 samples or 131071 samples.
Arbitrary and Multitone Waveforms (“Arb Wfm”)
Stored waveform consisting of multiple sine waves, each at independent frequency,
amplitude, and phase
Signal Determined by the associated file specified in the
panel drop-down box.
Frequency Range dc to Sample Rate ¸ 2.
Length 256 points–16384 points per channel. Utility is
provided to prepare waveform from user specified
frequency, amplitude, and phase data.
Frequency Resolution Sample Rate ¸ Length
[2.93 Hz at 48 ks/s for a waveform 16384 points
in length].
Maximum Number of Tones (Length / 2) –1 [8191 for Length = 16384].
Dither
(May be enabled for all waveforms except Monotonicity, J-Test, Walking Ones and Zeroes,
and Random)
Probability Distribution Triangular or rectangular; pseudo random,
independent for each channel.
Spectral Distribution Flat (white) or Shaped (+6 dB/oct).
Amplitude 8 bit–24 bit, or OFF.
Pre-Emphasis Filters
(all waveforms)
Filter Shape 50/15 µs or J17.
Response Accuracy ±0.02 dB, 10 Hz to 45% of Sample Rate.
Residual Distortion £0.00003% [–130 dB].
Digital Signal Generator Chapter 6: Specifications
Getting Started with Your 2700 Series Instrument 79
USO RESTRITO
Page 90

Digital Analyzer
Available only in the SYS-2720 and SYS-2722 configurations.
Digital Interface Signal Measurements
Input Sample Rate
Range 28 kHz–200 kHz for fully specified performance.
Usable from 16 kHz–216 kHz.
Accuracy
Int. Reference ±(0.0003% + 1 digit) [±3 PPM].
Ext. Reference ±(0.0001% + 1 digit) [±1 PPM].
Input Amplitude
Balanced (XLR) 0 Vpp–10.00 Vpp, ±(5% + 25 mV).
Unbalanced (BNC) 0 Vpp–2.5 Vpp, ±(5% + 6 mV).
Optical Displays voltage of internal logic signal (not
linearly related to optical input power).
Jitter Measurement
Range
25
0 UI–0.200 UI [0 ns–32 ns at 48k, 0 ns–8.0 ns at
192k, etc.].
Accuracy ±(10% + 1.0 ns), peak calibrated.
Detection “Pk” (for measurements per AES-3), or
“Avg” (for transfer function measurements).
Bandwidth <50 Hz–100 kHz,
120 Hz–100 kHz,
700 Hz–100 kHz, or
1.2 kHz–100 kHz.
Flatness
26
±1 dB, 100 Hz–50 kHz.
Residual Jitter
27
£600 ps with “700 Hz–100 kHz” bandwidth,
£1.0 ns with “50 Hz–100 kHz” bandwidth.
Jitter Spectrum Spurious products are typically 40 dB below jitter
signal or <0.0003 UI [–70 dBUI], whichever is
larger.
Common Mode Amplitude 0 Vpp–20.0 Vpp, ±(10% + 50 mV),
100 Hz–100 kHz.
Channel Status Bits Full implementation, English language decoded
(Professional or Consumer) hex formats,
independent in each channel.
User Bits Not displayed.
Validity Flag Displayed for each channel.
Parity Displayed for total signal (both channels
combined).
Output to Input Delay Measures propagation from the rear panel AES/
EBU Reference Output to the input.
Range –12.7 to +115.1 UI [–10% to +90% of frame] in
seconds, 60 ns resolution.
Chapter 6: Specifications Digital Analyzer
80 Getting Started with Your 2700 Series Instrument
25
The maximum measureable jitter increases to 1.000 UI for sine wave jitter signals below 1 kHz decreasing to
0.200 UI at or above 8 kHz.
26
System specification at 32, 44.1, 48, 88.2, 96, 176.4, and 192 ks/s using the “50 Hz to 100 kHz” analyzer
bandwidth selection. Flatness of the jitter generator will exhibit degradation at other sample rates.
27
Applies to electrical signal formats only. Specification subject to the following conditions: (1) all jitter generator
impairments must be turned off or disabled including the delay from reference output feature; (2) the digital
input signal must be ³ 1.5 Vpp (AES/EBU) or ³ 300 mVpp (SPDIF-EIAJ) and have a risetime £ 20 ns.
Jitter via the optical path may be considerably worse with embedded audio or dither enabled (limited by
Toslink® technology).
USO RESTRITO
Page 91

Signal Confidence Displayed for total signal (both channels
combined)
Receiver Lock Displayed for total signal (both channels
combined).
Coding Error Displayed for total signal (both channels
combined).
Digital Interface Analyzer
with “INTERVU” DSP program
The Digital Interface Analyzer (Intervu) operates in conjunction with an 8-bit A/D
converter clocked at 80.0 MHz. The analyzer can display the interface signal in time or
frequency domain, as an eye pattern, or probability graphs of amplitude or pulse width.
The Digital Interface Analyzer can also demodulate the jitter signal and display it in
time or frequency domain or as a histogram. The jitter signal or the dat a on the
interface may be reproduced through the monitor loudspeaker.
AES/EBU Input Voltage
Balanced 0 Vpp–10.00 Vpp,
±(10% + 50 mV).
Unbalanced 0 Vpp–2.5 Vpp,
±(8% + 12 mV).
Jitter Amplitude 0 UI–5 UI pk,
±(5% + 0.015 UI).
Residual Jitter £0.01 UI (50 Hz–1 MHz BW).
Spurious Jitter Product s £0.001 UI, or £–60 dB below jitter signal.
Common Mode Amplitude 0 Vpp–20.00 Vpp, ±(30% + 50 mV),
20 kHz–1 MHz.
Jitter Probability Display 256 bins, auto-ranging.
Input Probability Display 256 bins, auto-ranging.
Bit Width Probability Display 32768 bins.
Risetime Typically 17 ns–20 ns.
Acquisition time / memory 19.66 ms / 1,572,864 samples.
Embedded Audio Measurements
With “ANALYZER” DSP program
Wideband Level/Amplitude
Range –120 dBFS to 0 dBFS (usable to –140 dBFS).
Frequency Range 10 Hz to 45.8% of Sample Rate,
[10 Hz–20.2 kHz at 44.1 ks/s],
[10 Hz–22.0 kHz at 48 ks/s],
[10 Hz–44.0 kHz at 96 ks/s].
Accuracy ±0.01 dB.
Flatness ±0.01 dB, 15 Hz–22 kHz
(<10 Hz high-pass filter selection).
Digital Analyzer Chapter 6: Specifica tions
Getting Started with Your 2700 Series Instrument 81
USO RESTRITO
Page 92

High pass Filters <10 Hz (4-pole),
22 Hz (4-pole),
100 Hz (4-pole),
400 Hz (4-pole Butterworth, or 10-pole elliptic if
no other filters are enabled).
Low pass Filters fS/2 (maximum bandwidth),
20 kHz (6-pole elliptic),
15 kHz (6-pole elliptic).
Weighting Filters ANSI-IEC “A” weighting, per IEC Rec 179,
CCIR QPk per CCIR Rec. 468,
CCIR RMS per AES17,
C-message per IEEE Std 743-1978,
CCITT per CCITT Rec. O.41,
“F” weighting corresponding to 15 phon loudness
contour, –see Figure 58, page 72
HI-2 Harmonic weighting.
Residual Noise –141 dBFS unweighted,
(at 48 ks/s and 96 ks/s fs) –144 dBFS A-weighted,
–140 dBFS CCIR RMS,
–130 dBFS CCIR QPk,
–142 dBFS 20 kHz LP,
–143 dBFS 15 kHz LP,
–139 dBFS “F” weighting,
–152 dBFS CCITT,
–151 dBFS C Message.
Narrow Band Amplitude
Frequency Range 10 Hz to 40% of Sample Rate,
[10 Hz–17.6 kHz at 44.1 ks/s],
[10 Hz–19.2 kHz at 48 ks/s],
[10 Hz–38.4 kHz at 96 ks/s].
Filter Shape 10-pole, Q=19 (BW = 5.3% of fo).
–see Figure 59, page 72
Residual Distortion £–150 dBFS.
THD+N Measurements
Frequency Range <10 Hz to 47% of Sample Rate,
[10 Hz–19.9 kHz at 44.1 ks/s],
[10 Hz–21.6 kHz at 48 ks/s],
[10 Hz–43.2 kHz at 96 ks/s].
Residual THD+N £–138 dBFS. –see Figure 61, page 85
High pass Filters <10 Hz (4-pole),
22 Hz (4-pole),
100 Hz (4-pole),
400 Hz (4-pole Butterworth).
Low pass Filters FS/2 (maximum bandwidth),
20 kHz (6-pole elliptic),
15 kHz (6-pole elliptic).
Weighting Filters Same as Wideband Level/Amplitude.
Residual Noise Same as Wideband Level/Amplitude.
Frequency Measurements
Range
10 Hz to 47% of Sample Rate,
[10 Hz–21.0 kHz at 44.1 ks/s],
[10 Hz–23.0 kHz at 48 ks/s],
[10 Hz–46.0 kHz at 96 ks/s].
Chapter 6: Specifications Digital Analyzer
82 Getting Started with Your 2700 Series Instrument
USO RESTRITO
Page 93

Accuracy ±0.01% of reading or 0.0001% of Sample Rate,
whichever is greater .
Resolution 0.003% of reading or 0.0001% of Sample Rate,
whichever is greater .
Phase Measurements
Measurement Ranges ±180, –90/+270, or 0/+360 degrees.
Accuracy
28
±1 degree, 10 Hz to 45% of Sample Rate.
Resolution 0.01 degree.
Minimum Input –30 dBFS, both inputs.
SMPTE IMD Measurements
Test Signal Compatibility Any combination of 40 Hz–250 Hz (LF) and
(2 kHz to 45% of Sample Rate) (HF) tones, mixed
in any ratio from 1:1 to 5:1 (LF:HF).
IMD Measured Amplitude modulation products of the HF tone.
(–3 dB measurement bandwidth is
10 Hz–750 Hz.)
Measurement Range 0%–20%.
Accuracy ±0.5 dB.
Residual IMD £–130 dB at 0 dBFS, 60 + 7 kHz or 250 + 8 kHz
£–110 dB at –25 dBFS, 60 + 7 kHz or 250 +
8 kHz.
Embedded Audio, FFT Spectrum Analyzer
with “FFT” DSP program (48-bit processing)
Acquisition Length 800 samples–4 M samples in 15 steps.
Transform Length 256–32768 samples in binary steps.
Windows Blackman-Harris (4-term with –92 dB sidelobes),
(see Figures 56 and 57, Hann,
page 71) Flat-top,
Equiripple (AP design –160 dB sidelobes),
None,
None, move to bin center,
Hamming,
Gaussian,
Rife-Vincent 4-term,
Rife-Vincent 5-term.
Amplitude Accuracy ±0.001 dB, 20 Hz–20 kHz,
with Flat-top window.
Phase Accuracy
29
±0.05 degree, 10 Hz to 45% of Sample Rate.
Resolution 0.01 degree.
Averaging 1–4096 averages in binary steps. Averaging is
power-based (frequency domain), or synchronous
(time domain).
Digital Analyzer Chapter 6: Specifica tions
Getting Started with Your 2700 Series Instrument 83
28
Both DSP analyzer input channels must have the same coupling (ac or dc) selection. Accuracy is valid for any
input signal amplitude ratio up to ±30 dB.
29
Both DSP analyzer input channels must have same coupling (ac or dc) selection. Accuracy is valid for any
input signal amplitude ratio up to ±30 dB
USO RESTRITO
Page 94

Distortion Products £–160 dB.
Display Modes
Time Domain Normal, Interpolate, Peak or Max.
Frequency Domain Peak pick, individual bin, Smoothing.
Move to bin center Window
Frequency Range 7
th
bin to 45% of Sample Rate, and ±4% of input
frequency[21.6 kHz at 48 ks/s].
Amplitude Accuracy ±0.025 dB.
Spurious Product s £–120 dB.
Embedded Audio, Multitone Audio Analyzer
with “FASTTEST” DSP program (48 bit processing)
Acquisition Length 512–32768 samples in binary steps.
Transform Length 512–32768 samples in binary steps.
Measurements Level vs frequency,
Total distortion vs frequency,
Noise vs frequency,
Phase vs frequency,
Crosstalk vs frequency,
Masking curve.
Frequency Resolution Sample Rate ÷ 215 [1.465 Hz with 48 ks/s].
Frequency Correction Range ±3%.
Distortion £–140 dB.
Embedded Audio, Quasi-Anechoic Acoustical Tester
with “MLS” DSP program
Signals Four pink sequences and four white sequences,
selected by triggering generator MLS setting.
Frequency Range (Sample Rate ¸ 2000) to (Sample Rate ¸ 2).
Frequency Resolution (Max) 1.465 Hz at 48 ks/s.
Acquisition Length 32767 or 131071 samples, selected by triggering
generator MLS setting.
FFT Length 32768.
Energy Time Windows half Hann,
Hann,
<240 Hz >8 kHz,
<120 Hz >16 kHz.
Time Windows <5%,
(percent of data record to <10%,
transition from 0 to full <20%,
amplitude) <30%.
Averaging 1–4096 averages in binary steps, synchronous.
Chapter 6: Specifications Digital Analyzer
84 Getting Started with Your 2700 Series Instrument
USO RESTRITO
Page 95
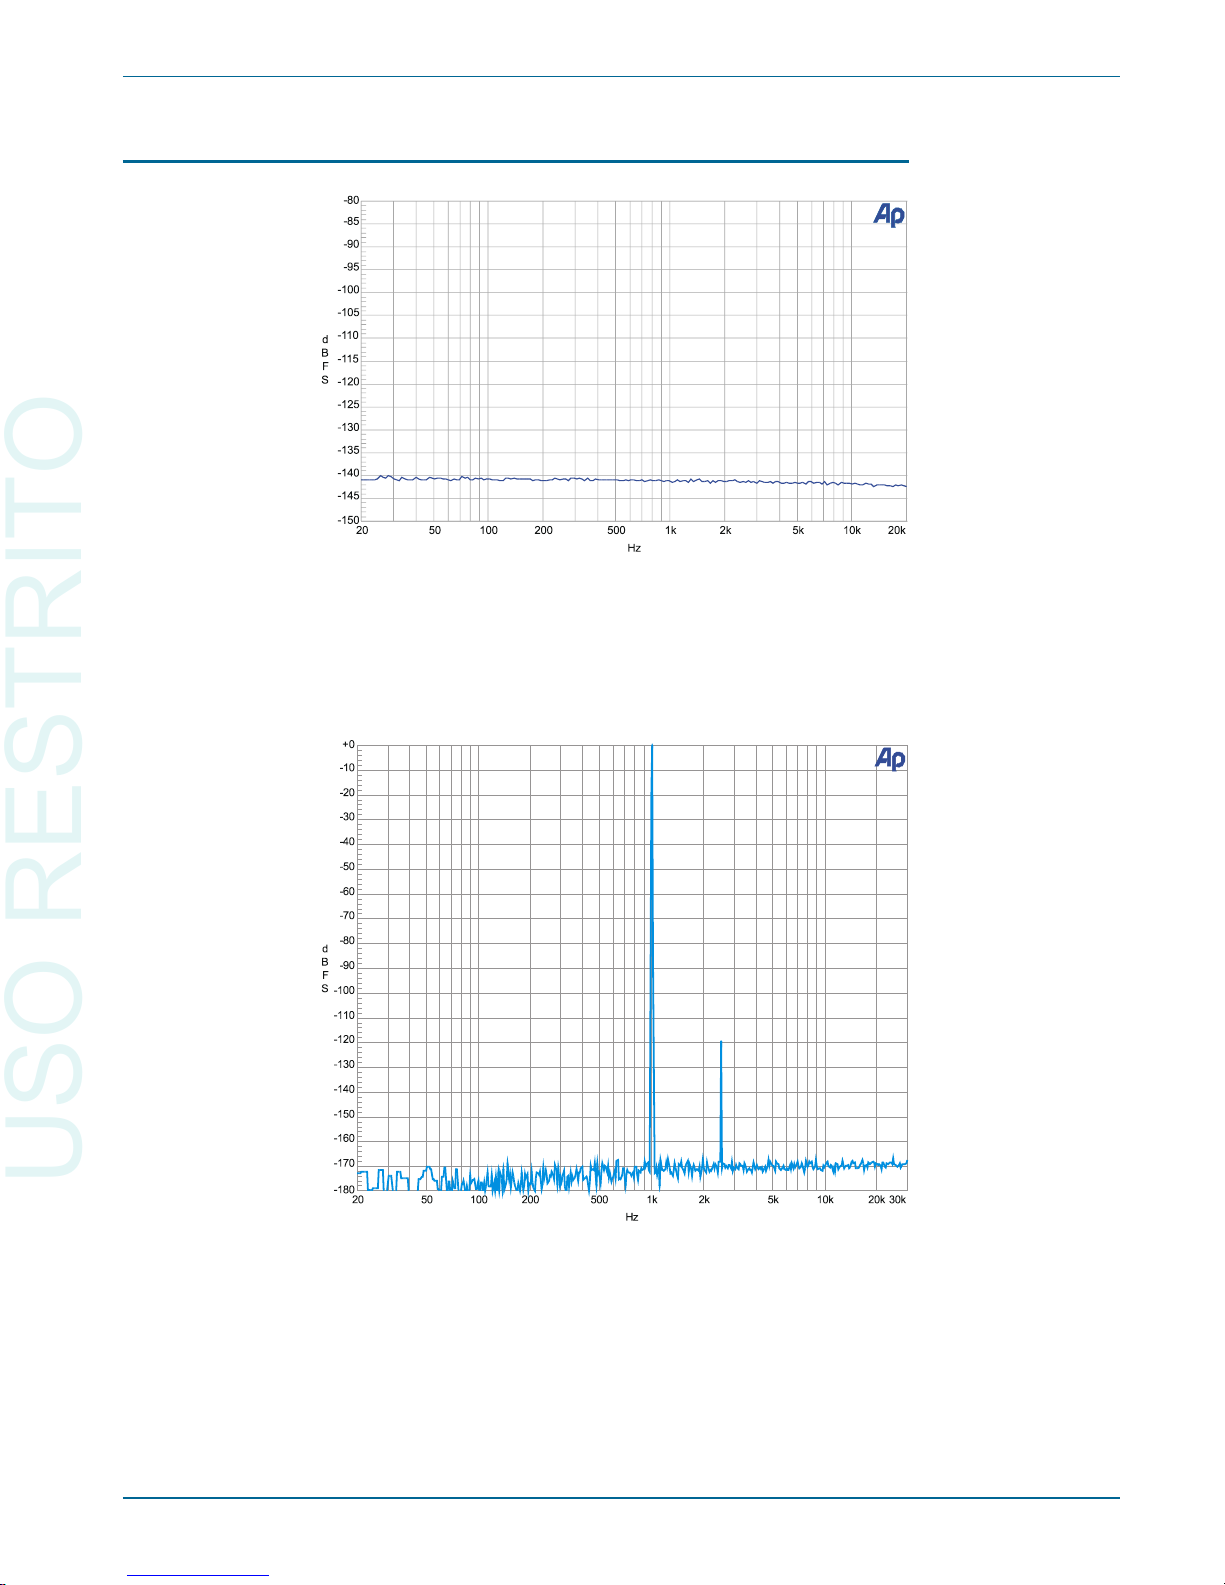
Graphs of Typical Digital Domain Performance
Digital Analyzer Chapter 6: Specifica tions
Getting Started with Your 2700 Series Instrument 85
Figure 61. Typical Digital Domain system residual THD+N showing
components below –140 dB.
Figure 62. Illustration of typical Digital Domain FFT dynamic range.
Signal is 0 dB 1 kHz with a secondary signal at –120 dB and
2.5 kHz.
USO RESTRITO
Page 96
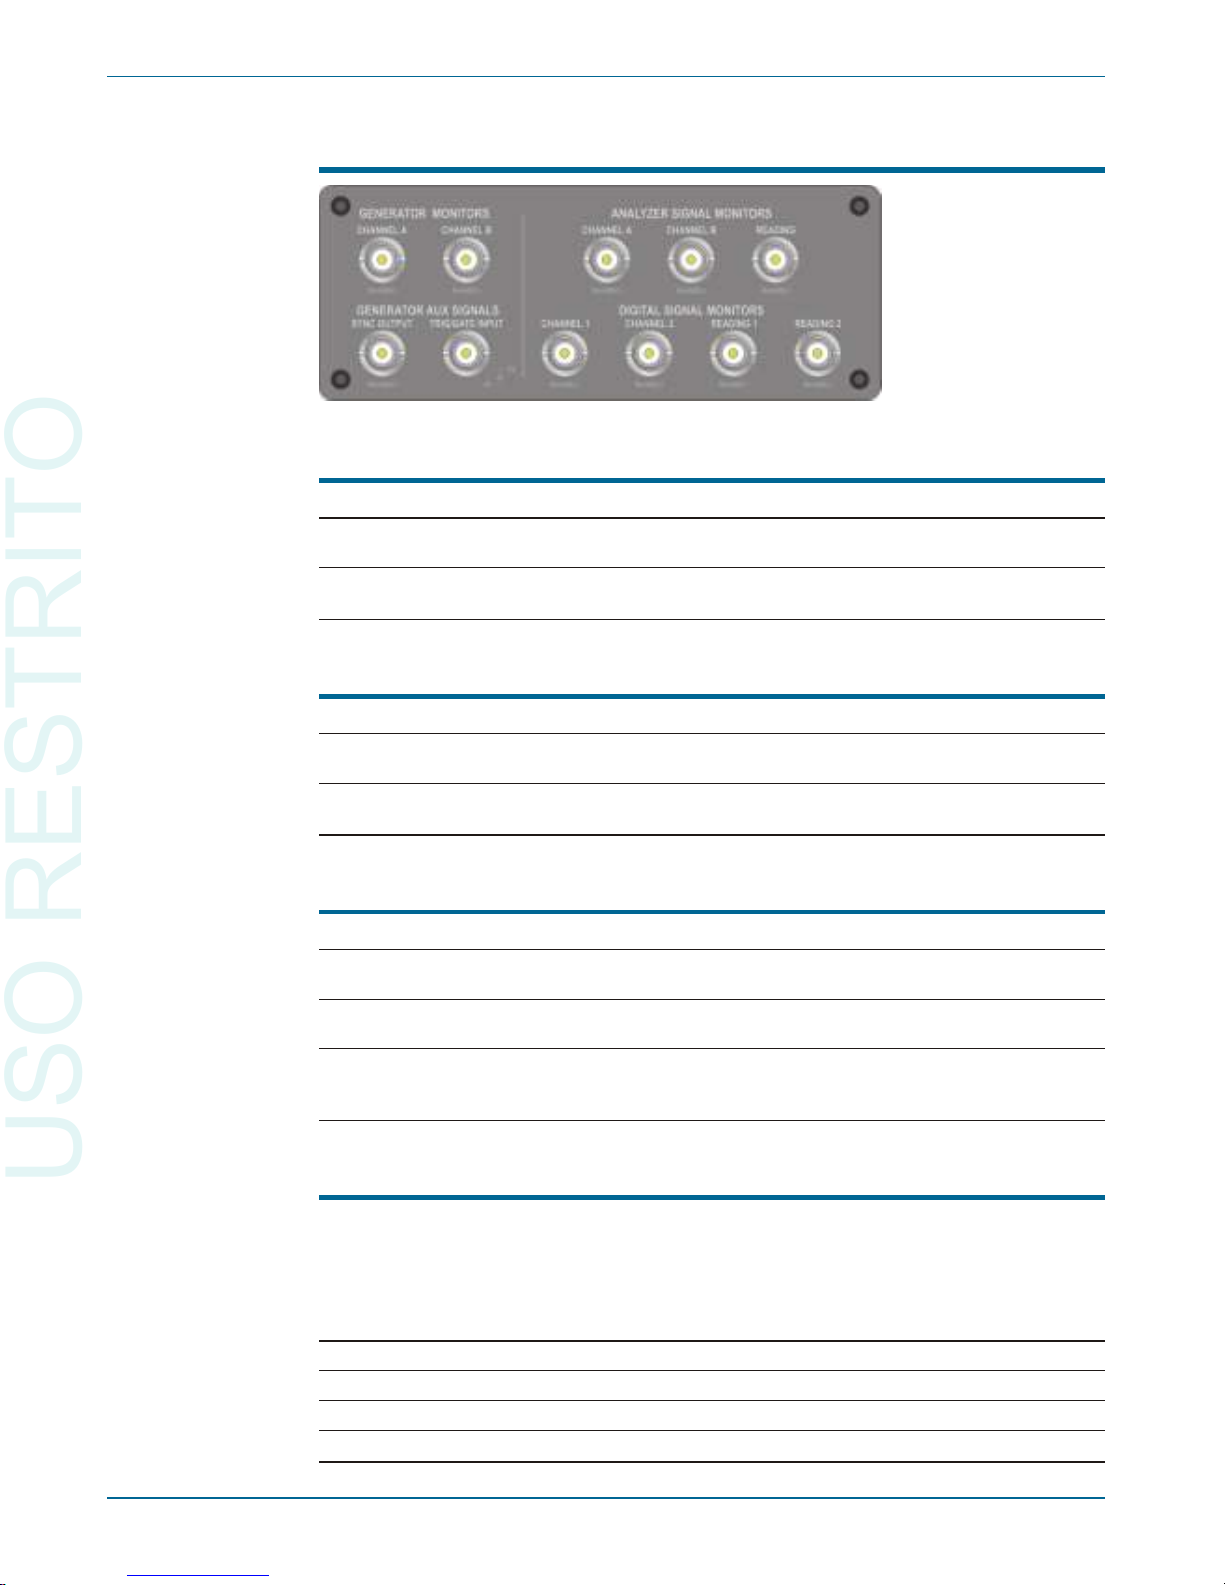
Front Panel Auxiliary Signals
Gen er a tor Mon i tors
(all units ex cept SYS-2720.)
Chan nel A Buffered ver sion of the chan nel A an a log
gen er a tor sig nal. Am pli tude is typically 2.8 Vpp.
Chan nel B Buffered ver sion of the chan nel B an a log
gen er a tor sig nal. Am pli tude is typ i cally 2.8 Vpp.
Gen er a tor Aux il iary Sig nals
(all units ex cept SYS-2720.)
Sync Out put LSTTL com pat i ble sig nal that is in tended to be
used as a trig ger for sta ble os cil lo scope dis plays.
Trig/Gate In put LSTTL com pat i ble in put, func tional with option
“BUR” only.
An a lyzer Sig nal Mon i tors
(all units ex cept SYS-2720.)
Chan nel A Buffered ver sion of the chan nel A an a log in put
sig nal. Am pli tude is typ i cally 0 Vpp–3.6 Vpp.
Chan nel B Buffered ver sion of the chan nel B an a log in put
sig nal. Am pli tude is typ i cally 0 Vpp–3.6 Vpp.
Read ing Buffered ver sion of the an a log an a lyzer out put
sig nal af ter all fil ter ing and gain stages. Am pli tude
is typ i cally 0 Vpp–3.6 Vpp.
Dig i tal Sig nal Mon i tors
(SYS-2720 & SYS-2722 only. )
Via four 24-bit D/A con vert ers. Func tion mon i tored de pends upon an a lyzer
pro gram loaded; for ex am ple, noise and dis tor tion prod ucts af ter the notch fil ter are mon i tored with “DSP Au dio An a lyzer” in its THD+N func tion.
Chan nel 1 Buffered ver sion of the dig i tal chan nel 1 sig nal.
Chan nel 2 Buffered ver sion of the dig i tal chan nel 2 sig nal.
Read ing 1 Dis tor tion of the dig i tal chan nel 1 sig nal.
Read ing 2 Dis tor tion of the dig i tal chan nel 2 sig nal.
Chapter 6: Specifications Front Panel Auxiliary Signals
86 Getting Started with Your 2700 Series Instrument
Figure 63. Monitors
panel.
USO RESTRITO
Page 97
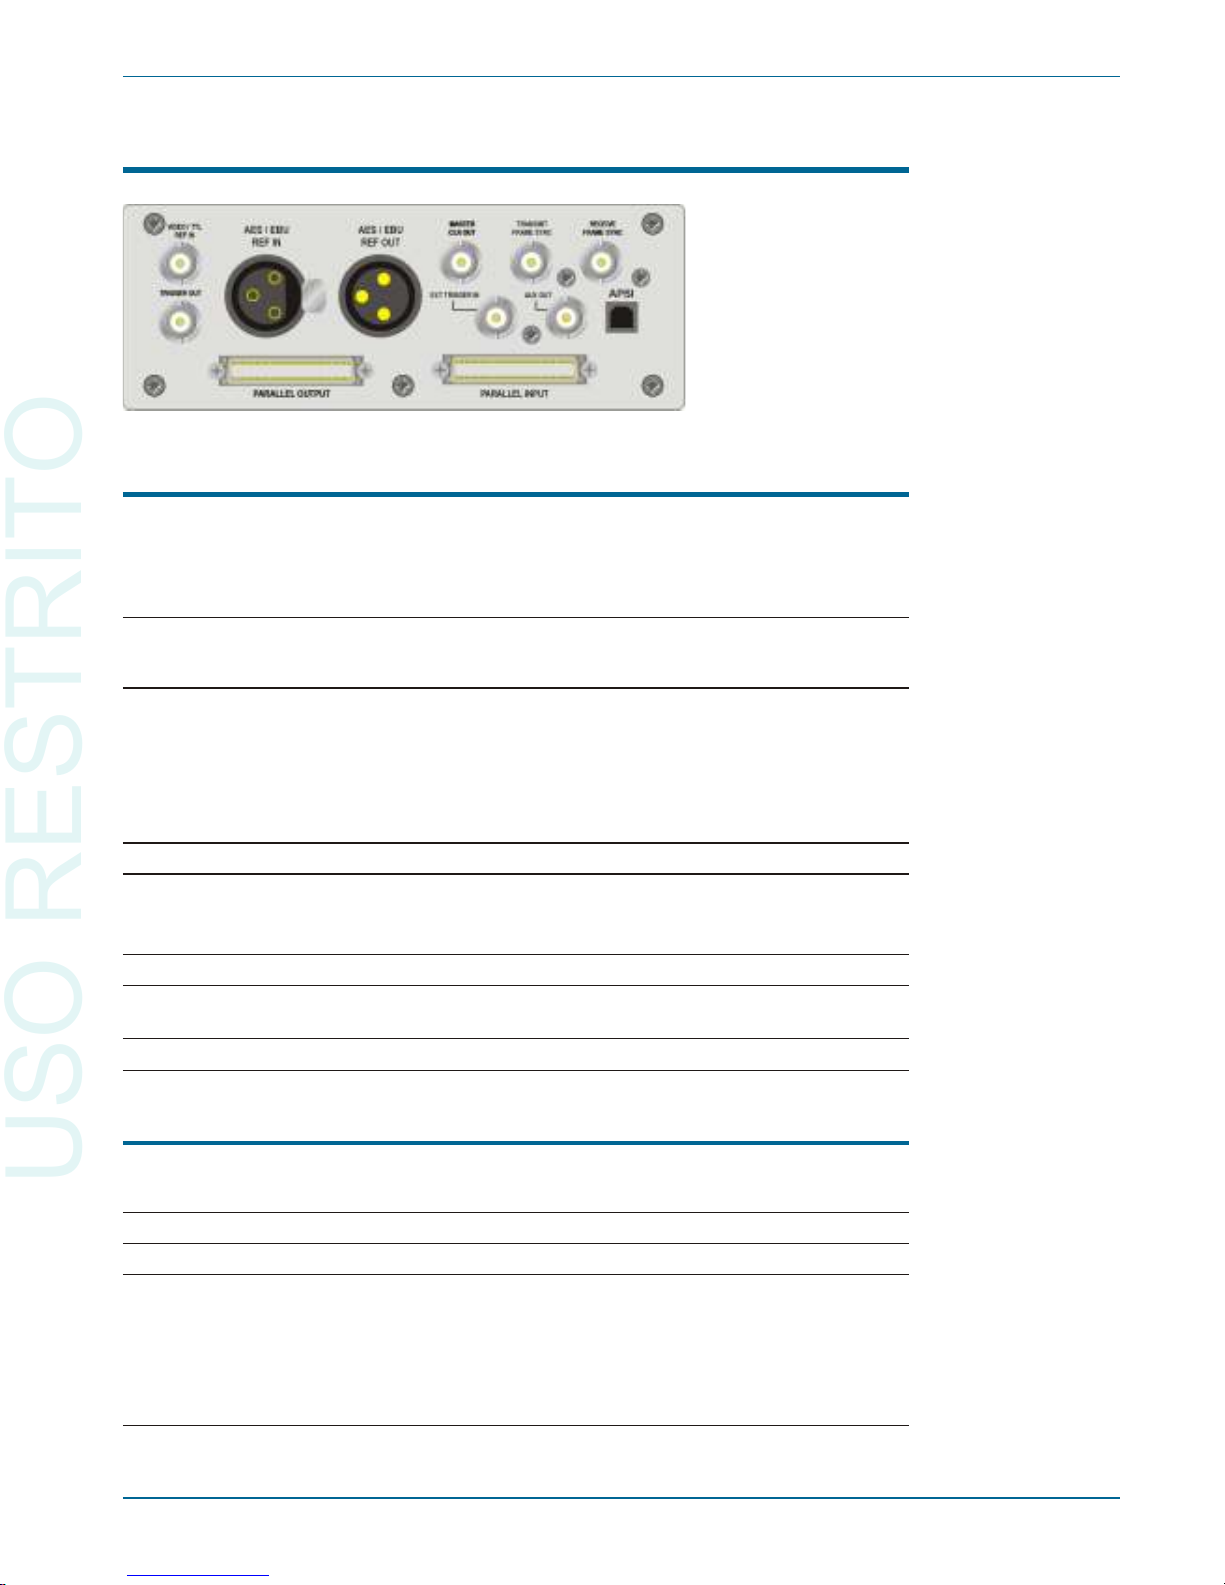
Rear Panel Auxiliary Signals
Ref er ence In put (“REF IN”) Char ac ter is tics
The ref er ence in put pro vides the abil ity to syn chro nize the internal sam ple rate
gen er a tor to an ex ter nal sig nal. The sam ple rate need not be at 1:1 ra tio to the
ref er ence, but will be locked to the ref er ence over the fully spec i fied range of sam ple
rate and Ref er ence in puts. PLL band width is ap prox i mately 5 Hz.
In put for mats 28 kHz–200 kHz AES/EBU,
NTSC, PAL, or SECAM video, or
8 kHz–10 MHz square wave.
Sam ple Rate Res o lu tion
8 kHz–65 kHz 1/128 Hz [0.0078125 Hz].
65 kHz–256 kHz 1/32 Hz [0.03125 Hz].
256 kHz–1 MHz 1/8 Hz [0.125 Hz].
1 MHz–4 MHz ½ Hz [0.5 Hz].
4 MHz–10 MHz 2 Hz.
In put Am pli tude 200 mVpp–5.0 Vpp.
In put Im ped ance Selectable ter mi nated or high im ped ance.
AES/EBU (XLR) Nom i nally 110W or 5kW.
Video/TTL (BNC) Nom i nally 75W or 5kW.
Lock Range ±0.0015% [±15 PPM].
In put De lay from –12.7 to +115.1 UI [–10 to +90% of fram e] in
Ref er ence Dis play sec onds, ±60 ns, AES/EBU signals only.
Ref er ence Rate Dis play Mea sures ap prox i mate ref er ence in put rate.
Reference Output (“REF OUT”) Characteristics
Intended to drive de vices un der test tha t re quire their own ref er ence in put. The
ref er ence out put sig nal is not jit tered.
Out put for mat AES/EBU (per AES3-r1997).
Out put Sam ple Rates 8 kHz–216 kHz, locked to front panel out put.
Sta tus Bits For mat “Pro fes sional,”
Type “Grade 2 ref er ence,”
Or i gin “SYS2,”
Reliability flags im ple mented,
CRCC im ple mented,
Time of Day not im ple mented,
Sam ple Count not im ple mented.
Rear Panel Auxiliary Signals Chapter 6: Specifications
Getting Started with Your 2700 Series Instrument 87
Figure 64.
Miscellaneous digital I/
O Panel (rear of SYS2720 and SYS-2722
instruments only).
USO RESTRITO
Page 98

Out put De lay from –64 to +63.5 UI in 0.5 UI steps,
Ref er ence Out put ±(5% + 0.5 UI).
Re sid ual Jit ter £600 ps (700 Hz–100 kHz BW).
Miscellaneous Digital I/O
Trans mit Frame Sync Square wave at the pro grammed in ter nal sam ple
rate (SR).
Re ceive Frame Sync Square wave at the frame rate of the re ceived
AES/EBU sig nal.
Mas ter Clock Out Square wave at 256 x System Sample Rate
(SSR).
Selectable be tween jit tered and un-jittered
sig nals.
Aux il iary In put LSTTL com pat i ble trig ger in put for DSP pro gram
data ac qui si tion.
Aux il iary Out put HCMOS sig nal, func tion un der DSP pro gram
con trol.
Trig ger Out put HCMOS sig nal, co in ci dent with pe riod of
gen er ated sig nal wave form.
Par al lel In put and Out put For use with op tional PSIA-2722 accessory.
Chapter 6: Specifications Rear Panel Auxiliary Signals
88 Getting Started with Your 2700 Series Instrument
USO RESTRITO
Page 99

Audio Monitor
All configurations contain an internal loudspeaker and headphone jac k for listening
to the generator, analyzer, or digital signal monitor points, including noise and
distortion following analog or digital notch filters or the AES/EBU jitter signal. Use of
the audio monitor does not preclude the use of any measurements.
Power Output Typically 1 Watt.
General/Environmental
Power Requirements 100/120/230/240 Vac (–10%/+6%),
50/60 Hz, 240 VA max.
Temperature Range
Operating +5°C to +40°C.
Storage –40°C to +75°C.
Humidity 90% RH (non-condensing).
Altitude 2000 m.
EMC
30
Complies with 89/336/EEC, IEC 61326-1:
Electrical Equipment for Measurement, Control
and Laboratory Use–EMC Requirements - Part 1:
General Requirements, CISPR 11/22 (class B),
and FCC 15 sub J (class B).
Dimensions
Width 41.9 cm [16.5 inches].
Height 14.6 cm [5.75 inches] bench-top (feet attached)
3U [5.25 inches] rack-mount.
Depth 34.5 cm [13.6 inches].
Weight Approximately 15.4 kg [34 lbs].
Safety Complies with:
73/23/EEC, 93/68/EEC, and EN61010-1 2001
Second Edition, Equipment Class I, Installation
Category II, Pollution Degree 2, Measurement
Category I.
CAN/CSA-C22.2 No 61010.1-4, Safety
Requirements for Electrical Equipment for
Measurement, Control, and Laboratory Use, Part
1: General Requirements (with Amendment 1).
UL Std No 61010-1 Second Edition, Equipment
for Measurement Use; Part I: General
Requirements.
General/Environmental Chapter 6: Specifications
Getting Started with Your 2700 Series Instrument 89
30
Emission and immunity levels are influenced by the shielding performance of the connecting cables. The
shield ing per for mance will de pend on the in ter nal de sign of the ca ble, con nec tor qual ity, and the as sem bly
meth ods used. EMC com pli ance was dem on strated us ing Au dio Pre ci sion pn 4155.0117 ca bles for all ports
us ing XLR-type con nec tors, Au dio Pre ci sion pn 4155.0301 ca ble for the Mas ter Clk port, and Pasternack
Model No. PE3067-36 for all remaining ports using BNC-type connectors.
USO RESTRITO
Page 100

Chapter 6: Specifications General/Environmental
90 Getting Started with Your 2700 Series Instrument
USO RESTRITO
 Loading...