

Page 1
Audio Precision Application Note #1
Compact Disc Player Tests
Page 2
Compact Disc Player Tests
using Audio Precision
System One or System Two
Application Note #1A
Version 1.0
January, 1998
Page 3
Copyright © 1998 Audio Precision, Inc.
All rights reserved
Version 1.0 January, 1998
No part of this manual may be reproduced or transmitted in any form or by any means, electronic or
mechanical, including photocopying, recording, or by any information storage and retrieval system,
without permission in writing from the publisher.
Audio Precision®, System One®, Systen One + DSP™, System Two™,
Portable One®, and Dual Domain® are trademarks or registered trademarks of Audio Precision, Inc.
Windows™ is a trademark of Microsoft Corporation.
FAST
TEST®, APWIN™,
Published by:
Audio Precision
P.O. Box 2209
Beaverton, Oregon 97075-2209
Tel: (503) 627-0832 Fax: (503) 641-8906
®
US Toll Free: 1-800-231-7350
Email: [email protected]
Web Site: www.audioprecision.com
Printed in the United States of America
Audio Precision Part # 8211-0030
Page 4

Preface
Rapid and Accurate testing of CD players using APWIN
This expansion and revision of the original Audio Precision
Compact Disc Player Testing Application Note (AN-1) includes many
new test techniques as well as refinements and improvements on the
original tests. Test and procedure files supplied with this application
note provide new convenience and ease-of-use for testing CD players
using these instruments. Files created for both System One and System
Two using APWIN are available. All audio tests are described with an
explanation of the critical settings for each test and discussion of
interpreting the test results.
New test procedures using the powerful APWIN Basic procedure
language streamline and automate test selection, setup and operation.
For a fast start select File, Open Procedure CDTEST and Procedure,
Run from the toolbar at the top of APWIN. The common audio tests:
frequency response, distortion and noise (THD+N), signal-to-noise
ratio, crosstalk and interchannel phase - are all available. Also included
are specialized and difficult tests such as distortion at low amplitudes,
decoder linearity measured to below the Least Significant Bit,
quantization noise, dynamic range, SMPTE and twin-tone (CCIF)
intermodulation distortion and Wow and Flutter as an impulse noise
test. All are explained in detail.
Tests using the DSP and Dual Domain versions of the System One
and System Two expand the detail and accuracy available for
evaluating modern CD players. These include FFT frequency and
amplitude analysis tests for noise components to 80 kHz, SMPTE and
twin-tone intermod products to below -110 dBFS and residual noise
components after distortion measurement to below -125 dBFS. A
waveform display that works like a triggered oscilloscope for viewing
special waveforms is also included.
Page 5

This Application Note uses any of four commercially-available test
CDs as the signal test source. A selection dialog in the CDTEST
procedure allows the user to choose which test CD is being used. The
procedure lists the tests available for your selection from the tracks on
the selected CD. Onscreen prompts advise the operator what CD
tracks to play. These test procedures make establishing level
references, test setups and connection checks nearly foolproof.
Accomplishing difficult tests with accuracy can be done easily. Tests
can be repeated, printed and saved without interrupting the test
procedure. The Visual Basic compatible procedure code contains
many examples of code use that can be copied and used in your own
procedures. The procedures are fully annotated so that the user can
understand the actual operation of the program and find useful code
routines for use elsewhere.
Page 6

CONTENTS
CONTENTS
Introduction . . . . . . . . . . . . . . . . . . . . . . . . . . . . . . . . . . 1
Configuring APWIN . . . . . . . . . . . . . . . . . . . . . . . . . . . . . . . 2
Connection Considerations . . . . . . . . . . . . . . . . . . . . . . . . . . 3
“Sweep Testing” Across a Series of Tracks . . . . . . . . . . . . . . . . . . 5
Externally Controlled Sweeps . . . . . . . . . . . . . . . . . . . . . . . . . 6
Frequency Response Sweeps . . . . . . . . . . . . . . . . . . . . . . . . . 8
Discrete Track Frequency Response . . . . . . . . . . . . . . . . . . . . . . . . 8
High-Resolution Frequency Response Measurements . . . . . . . . . . . . . . 15
Frequency Response With De-Emphasis . . . . . . . . . . . . . . . . . . . . . . 20
Setup For Noise And Distortion Measurements . . . . . . . . . . . . . . . 22
Single Number Signal-to-Noise Ratio . . . . . . . . . . . . . . . . . . . . . . . . 22
Noise Spectrum Analysis . . . . . . . . . . . . . . . . . . . . . . . . . . . 24
FFT Noise Analysis . . . . . . . . . . . . . . . . . . . . . . . . . . . . . . . . . . 24
Analog Bandpass Filter Noise Analysis . . . . . . . . . . . . . . . . . . . . . . 29
Compact Disc Player Tests – Application Note #1A Page A
Page 7

CONTENTS
D-to-A Converter Noise . . . . . . . . . . . . . . . . . . . . . . . . . . . . . 33
Dynamic Range . . . . . . . . . . . . . . . . . . . . . . . . . . . . . . . . . . . 33
Quantization Noise . . . . . . . . . . . . . . . . . . . . . . . . . . . . . . . . . 36
Distortion Measurements . . . . . . . . . . . . . . . . . . . . . . . . . . . 40
THD+N versus Frequency . . . . . . . . . . . . . . . . . . . . . . . . . . . . . 40
Low Level Spectral Analysis . . . . . . . . . . . . . . . . . . . . . . . . . . . . 43
THD+N vs. Amplitude Measurements . . . . . . . . . . . . . . . . . . . . . . 46
THD+N vs. Amplitude-Analog Analyzer only . . . . . . . . . . . . . . . . . . . 48
THD+N vs. Amplitude—DSP controlled Sweep . . . . . . . . . . . . . . . . . 55
THD+N vs. Amplitude—Digital Input controlled Sweep . . . . . . . . . . . . 57
Replacing Horizontal Axis Data with Actual Amplitudes . . . . . . . . . . . . 60
Linearity . . . . . . . . . . . . . . . . . . . . . . . . . . . . . . . . . . . . 63
Full-Range Linearity Tests . . . . . . . . . . . . . . . . . . . . . . . . . . . . . 63
Linearity Tests with Dither . . . . . . . . . . . . . . . . . . . . . . . . . . . . 67
“Fade-to-Noise” Low Level Amplitude Linearity . . . . . . . . . . . . . . . . . 68
InterModulation Distortion . . . . . . . . . . . . . . . . . . . . . . . . . . 70
Setup for SMPTE/DIN/IEC IMD Measurements . . . . . . . . . . . . . . . . . . 70
SMPTE—Spectral Analysis of Intermodulation Products . . . . . . . . . . . . 71
CCIF and DFD IMD Measurements . . . . . . . . . . . . . . . . . . . . . . . . . 72
Spectral Analysis of Harmonics, Intermodulation and Noise . . . . . . . . . . 74
Phase Measurements . . . . . . . . . . . . . . . . . . . . . . . . . . . . . 75
Stereo Separation . . . . . . . . . . . . . . . . . . . . . . . . . . . . . . . 78
Frequency Accuracy . . . . . . . . . . . . . . . . . . . . . . . . . . . . . . 82
Wow And Flutter Tests . . . . . . . . . . . . . . . . . . . . . . . . . . . . . 84
Waveform Display . . . . . . . . . . . . . . . . . . . . . . . . . . . . . . . 87
Page B Compact Disc Player Tests – Application Note #1A
Page 8

CONTENTS
Special Problems . . . . . . . . . . . . . . . . . . . . . . . . . . . . . . . . 90
Excessive Inter-Track Noise . . . . . . . . . . . . . . . . . . . . . . . . . . . . . 90
Excessive Clock Signal Leakage . . . . . . . . . . . . . . . . . . . . . . . . . . . 90
Appendix 1 Setting up Stereo Sweeps in APWIN . . . . . . . . . . . . . . . 92
Appendix 2 CD Test Procedures . . . . . . . . . . . . . . . . . . . . . . . . 95
Appendix 3 Tests, Test File Names and CD Track Number Reference . . . . 98
Appendix 4 Distribution File Names . . . . . . . . . . . . . . . . . . . . . 99
Compact Disc Player Tests – Application Note #1A Page C
Page 9

CONTENTS
Page D Compact Disc Player Tests – Application Note #1A
Page 10

Introduction
Introduction
Compact Disc player performance is fast and easy to measure with
APWIN. In addition to common tests such as frequency response,
harmonic and intermodulation distortion, and signal-to-noise ratio,
Compact Disc player testing also brings up the opportunity to measure
quantization distortion and noise (mechanisms not present in analog
audio devices) plus ultra-wide-range linearity. Tests for both System
One (.at1 file extension) and System Two (.at2 file extension) are
included in the distribution files. Tests that operate very similarly to the
tests in the S1 DOS version of this Application Note retain the same
root names with different extensions depending on whether they are
for System One or System Two. In the distribution files these test titles
are in all-capitals. Newer tests written to use the abilities of APWIN
have mixed capitalization. Appendix 3 has a useful cross-reference for
test function, test names and CD tracks appropriate for specific tests.
In a few cases APWIN Basic procedures are used to automate a
test process. Also in one case the additional abilities of a procedure is
used to accomplish a test that cannot yield useable results with a test
alone (“Fade-to-Noise” low-level linearity). A group of procedures that
access and run tests useable with one of the four test CDs listed in
Appendix 3 is also provided in the distribution files. An easy “Quick
Start” for all of the supplied tests is to Open Procedure CDTEST.apb
and run the procedure. The procedures are detailed in Appendix 2.
Compact Disc Player Tests – Application Note #1A Page 1
Page 11

Configuring APWIN
Configuring APWIN
Some settings in APWIN Configuration should be checked in the
Utilities, Configuration drop-down menu. To automatically view the
saved data and graphs in the distribution files check Display Data on
Test Open. In some of the supplied tests bar graphs are used to display
readings during a sweep. For these to be active check the “Keep all
readings active during sweeps” box. Note that this can slow down data
acquisition in some test situations. If you are using FFTs and wish to
take a closer look at your results check—“Reprocess FFT Data on
Zoom”. Also, if you are using a Log file to save test results provide the
path and file name in the section on Log files and be sure that logging
is on. In System One check that the Utility Filters configuration has
been done if you are using installed optional filters.
Page 2 Compact Disc Player Tests – Application Note #1A
Page 12

Connection Considerations
Connection Considerations
The theoretical near 100 dB dynamic range of CD players places
more stringent requirements on the quality of interconnections
between player and the test system than when measuring many other
audio devices. Poor shielding of the interconnect cables and lack of
proper grounding between the player and the test system can create a
noise “floor” which artificially limits many of the measurements. Since
only a few CD players are designed with balanced outputs and
nominal 0 or +4 dBu levels the distribution tests are set up for
unbalanced inputs to the System with nominal 0 dBFS source (CD
output) levels of 2 Volts RMS. The CD source connection is typically
an unbalanced, chassis-grounded phono (RCA) connector. Thus
testing a CD player requires consideration of grounding connections,
prevention of ground loops and shielding the test connections from
other potential interference. Care in the test connections can make a
substantial difference in test results. See the Signal-to-Noise ratio
section on testing for noise using the infinity-zero track available on
most test CDs.
System One (.at1) tests use the balanced inputs, either XLR or
double-banana. An adapting cable set is required with a male XLR
connector at one end and (typically) a Phono (RCA) connector at the
other. The cable should be a shielded pair type such as good-quality
microphone cable. It is best to retain a balanced structure in the
adapter cables. In this case the XLR pin 2 wire (+) connects to the
center pin of the phono (RCA) connector using one of the wires of the
shielded pair. XLR pin 3 (-) connects to the shell of the phono (RCA)
connector using the other wire of the shielded pair. Pin 1 of the XLR
connector is connected to the shield of the cable. No cable shield
connection is made at the phono (RCA) connector; this should be
carefully done so an accidental short does not occur. An optional test
cable set in this configuration is available from Audio Precision, part
number CAB-XBR. For minimum noise it may be necessary to
separately connect the chassis grounds of the System and the unit
being tested. This is best done with a larger gauge cable—12 gauge
speaker wire is very good and is flexible. Fit a banana plug on one end
Compact Disc Player Tests – Application Note #1A Page 3
Page 13

Connection Considerations
to connect to the System ground and a large clip to connect firmly to
the CD player chassis on the other. System One chassis ground is the
banana jack under the BNC Aux Input. System Two chassis ground is
any of the four metal jacks under the BNC Unbal connectors.
chosen as the analyzer source. These can be used with BNC-RCA
adapters for connection using high quality shielded phono (RCA)
connector cables. The unbalanced inputs in System Two are floating
inputs to a differential stage—the BNC shell is not grounded to the
chassis. Alternately, the XLR to RCA cable adapters discussed for
System One can be used. The BNC Unbal Inputs are recommended
for System Two. The separate ground cable discussed above may also
be helpful in minimizing low level interference to the tests.
System Two tests (.at2) are set up with the BNC Unbalanced Inputs
Page 4 Compact Disc Player Tests – Application Note #1A
Page 14

“Sweep Testing” Across a Series of Tracks
“Sweep Testing” Across a Series of Tracks
Certain tracks lend themselves to a single “spot” measurement,
such as intermodulation distortion at a fixed set of frequencies. Many
measurements, however, are best made and graphed as a set of
measurements versus frequency or amplitude. Examples are frequency
response, THD+N versus frequency, interchannel phase versus
frequency, and distortion versus amplitude.
All of these test discs were designed to be usable with manual test
equipment. They have sets of tracks or indexed segments within a
track with sequential frequency or amplitude steps, typically with from
30 seconds to 1 minute of continuous signal at each available
frequency or level. To obtain graphs of sets of measurements requires
that the CD player reproduces a series of tracks or indexed segments
while APWIN measures and graphs the data. APWIN typically requires
only 1 to 3 seconds of signal to perform a two-channel pair of
measurements. Most of the tests described here are most efficiently
made by manually advancing the Compact Disc player from track to
track or from index point to index point as APWIN acquires the data.
The plotted graph thus results from a “sweep” across perhaps a dozen
adjacent tracks or indexed segments. The total time required for the
“sweep” is typically more dependent on the Compact Disc player’s
track-to-track access time than on the measurement speed of APWIN.
Some discs may have many separately indexed segments within a
single track. This reduces the total track count, which may simplify
testing with CD players that cannot directly select more than 16 to 20
tracks. On the other hand, use of these discs will significantly slow the
testing of any players which do not have indexing capability. In
general, each indexed segment is one minute long and a player
without indexing facilities must simply be permitted to play through
them.
Compact Disc Player Tests – Application Note #1A Page 5
Page 15
Externally Controlled Sweeps
Since Compact Discs are a playback-only medium, Compact Disc
players are principally tested in the External Frequency and External
Level sweep modes. On the Sweep Panel this is done by selecting the
Source 1 ellipsis button to bring up the Sweep Panel Source 1 browser.
Select Anlr on the Instrument window on the left side and check the
Show Readings box (lower right) to list the analyzer measurement
parameters available. When the Sweep Panel Source 1 field is
configured for any meter reading parameter from the Analyzer, the
Sweep panel Source 1 area is reconfigured for an external source
sweep. Notice that no choices appear in the Source 1 browser for the
Analyzer if the Show Readings box is not checked.
Test Discs
This application note refers to the following Compact Discs
available, as a convenience, from Audio Precision. These CDs are in
common use in audio testing and many users will already have one or
more of these discs. Test Procedures that provide easy access to the
appropriate tests along with on-screen prompts to assist testing are
included with the distribution software—see Appendix 2. The name of
the appropriate procedure follows the CD name information.
Externally Controlled Sweeps
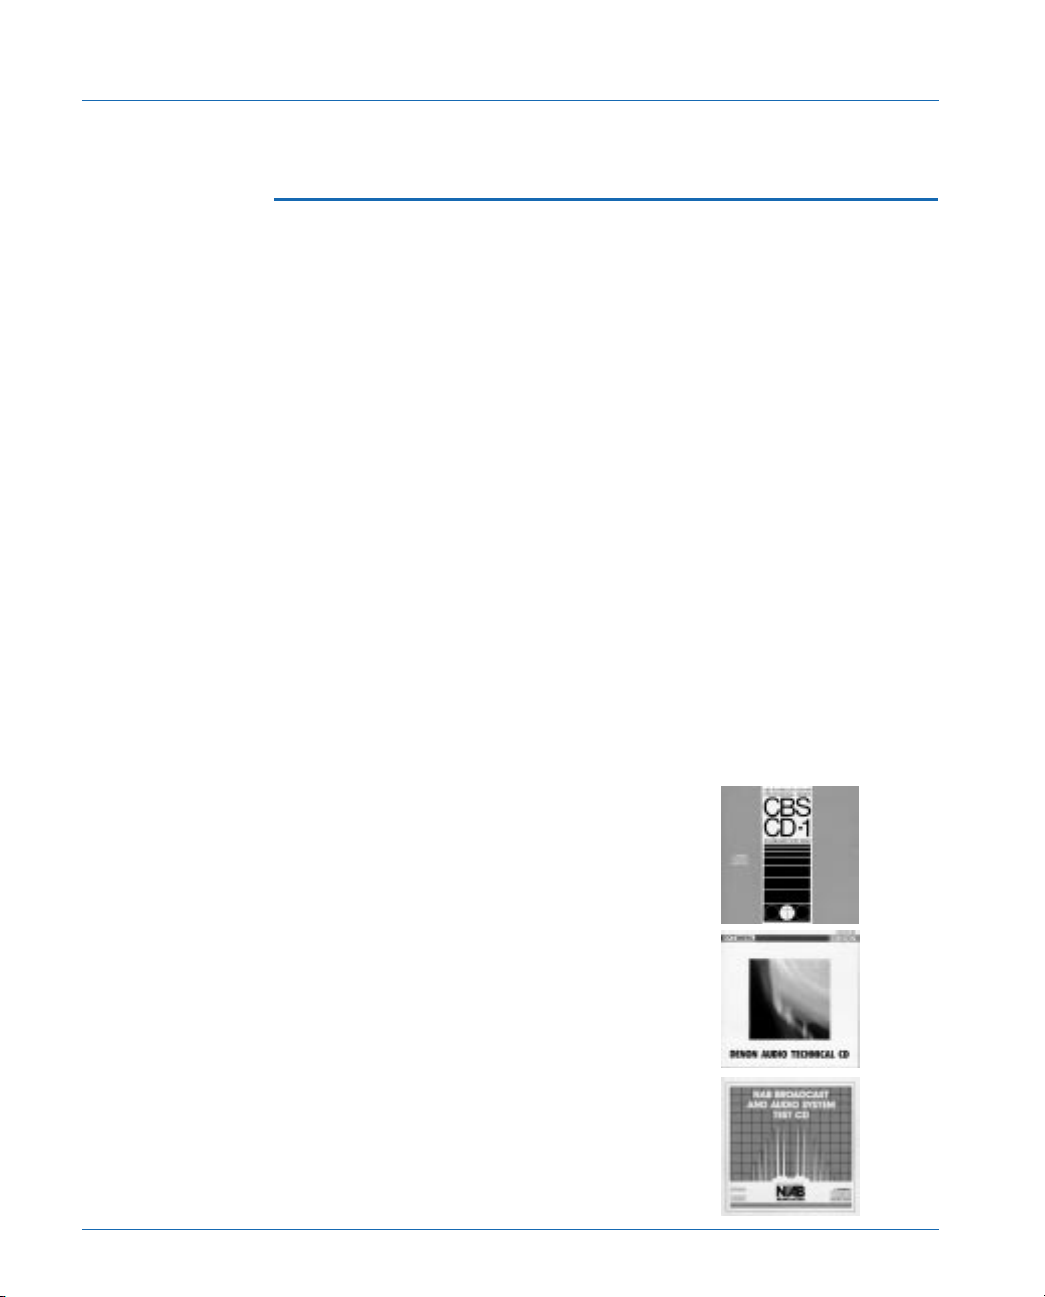
CBS CD-1 Standard Test Disc
PROCEDURE NAME: CBS.apb
Denon Audio Technical CD 38C39-7147
PROCEDURE NAME: Denon.apb
NAB Broadcast and Audio System Test CD
PROCEDURE NAME: NAB.apb
Page 6 Compact Disc Player Tests – Application Note #1A
Page 16

Externally Controlled Sweeps
Philips Audio Signals Disc 1 SBC429
PROCEDURE NAME: Philips.apb
Other Compact Disc test discs that Audio Precision has significant
experience with are listed below. Some of these were used in the DOS
S1.EXE version of this application note.
EIAJ CD-1 Standard Test Disc (YGDS 13)
Japan Audio Society CD-1 (YDDS-2)
Philips Test Sample 3 (410 055-2)
Sony Test CD Type 3 YEDS-7
Technics CD Test Disc 1 SH-CD001
All contain signals appropriate for measuring frequency response,
THD+N versus frequency, and at least one form of intermodulation
distortion. Most contain signals suitable for inter-channel phase, stereo
separation, noise, and signal-to-noise ratio measurements. Most
contain some unique signals not found on the others.
The CBS, Denon, Philips SBC429 and NAB have “glide tone”
continuously swept signals across the spectrum, permitting frequency
response and interchannel phase versus frequency measurements with
the greatest resolution. The CBS disc has the best signals for measuring
de-emphasis error of a CD player. The CBS and Philips discs provide
fixed-frequency signals over a wide amplitude range for measuring
distortion versus amplitude and linearity; the Philips SBC429 provides
the most amplitude levels. The CBS is unique among these discs in
providing two sets of amplitude—stepped or amplitude—swept signals
with dither. The CBS disc thus permits much more thorough
exploration of the low-amplitude linearity of CD players than do any of
the other discs. Most of the tracks on the Denon disc have signals on
only the left or right channel at any one time, limiting its usefulness for
phase versus frequency measurements and increasing its utility for
stereo separation versus frequency.
Compact Disc Player Tests – Application Note #1A Page 7
Page 17
Frequency Response Sweeps
Discrete Track Frequency Response
Single tone tracks are available in all listed test CDs. In those CDs
with very low frequency tones greater level measurement precision can
be realized since the tone length allows more accurately settled
readings. Since discrete tones are required in any case for distortion
measurement it is possible to set up a single test using System Two that
measures THD+N, frequency response and phase.
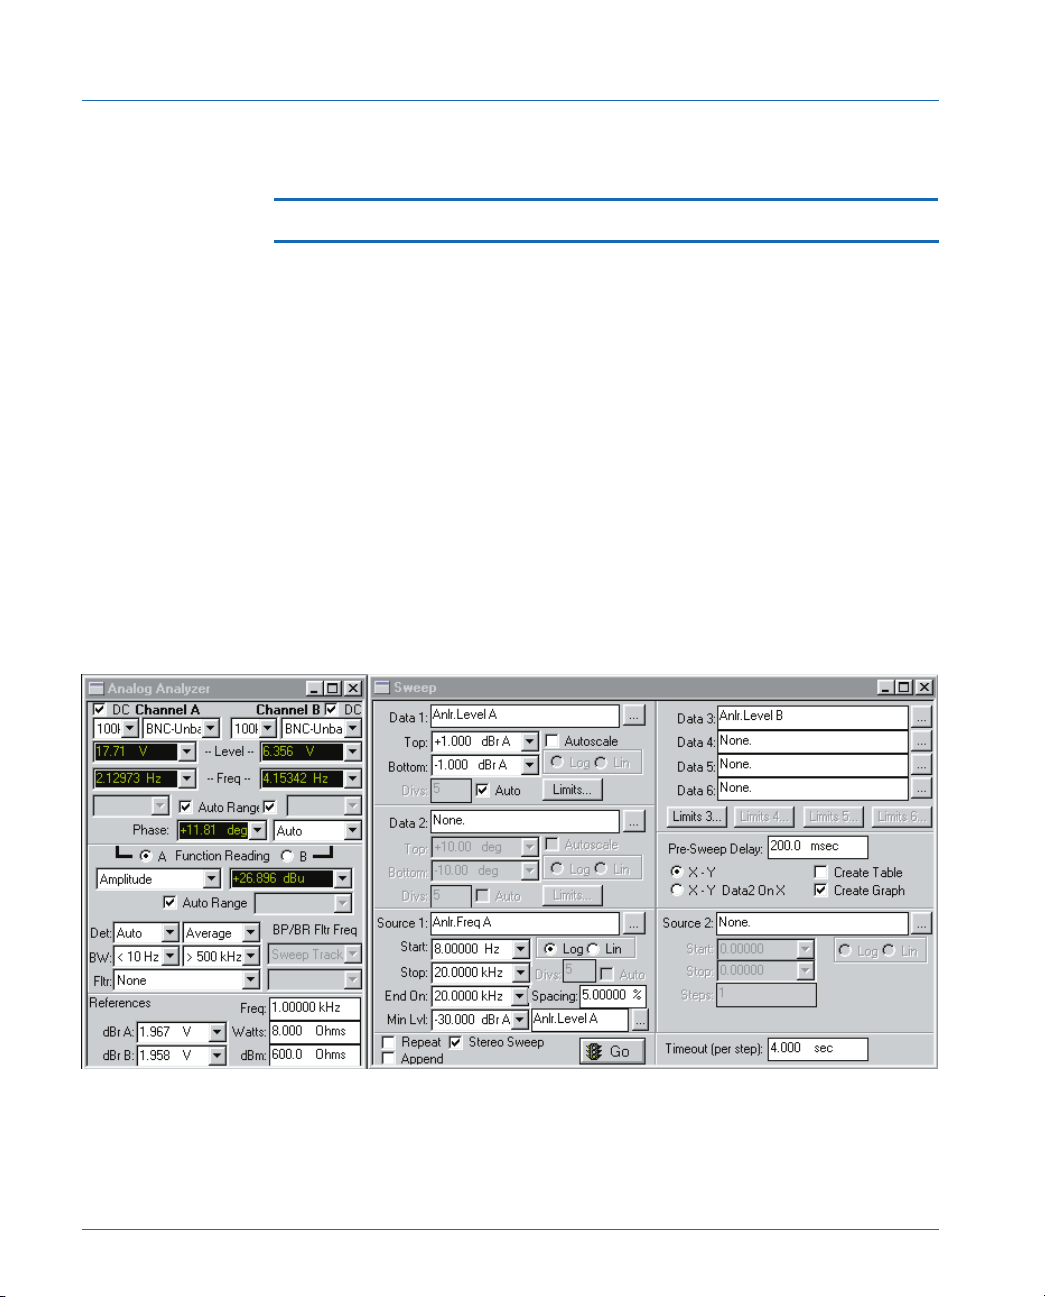
Setup
This panel setup is illustrated in Figure 1 and stored as
FRQRSPD.at2 (FReQuency ReSPonse, Discrete tone tracks) with the
supplied files. This test is for External Frequency sweeps across a series
of tracks where the frequency increases from track to track. The panels
for System One are different in several details. These may be reviewed
by loading FRQRSPD.at1 and viewing page one.
Frequency Response Sweeps
Figure 1 FRQRSPD test - Page 1 panels
Page 8 Compact Disc Player Tests – Application Note #1A
Page 18
Frequency Response Sweeps
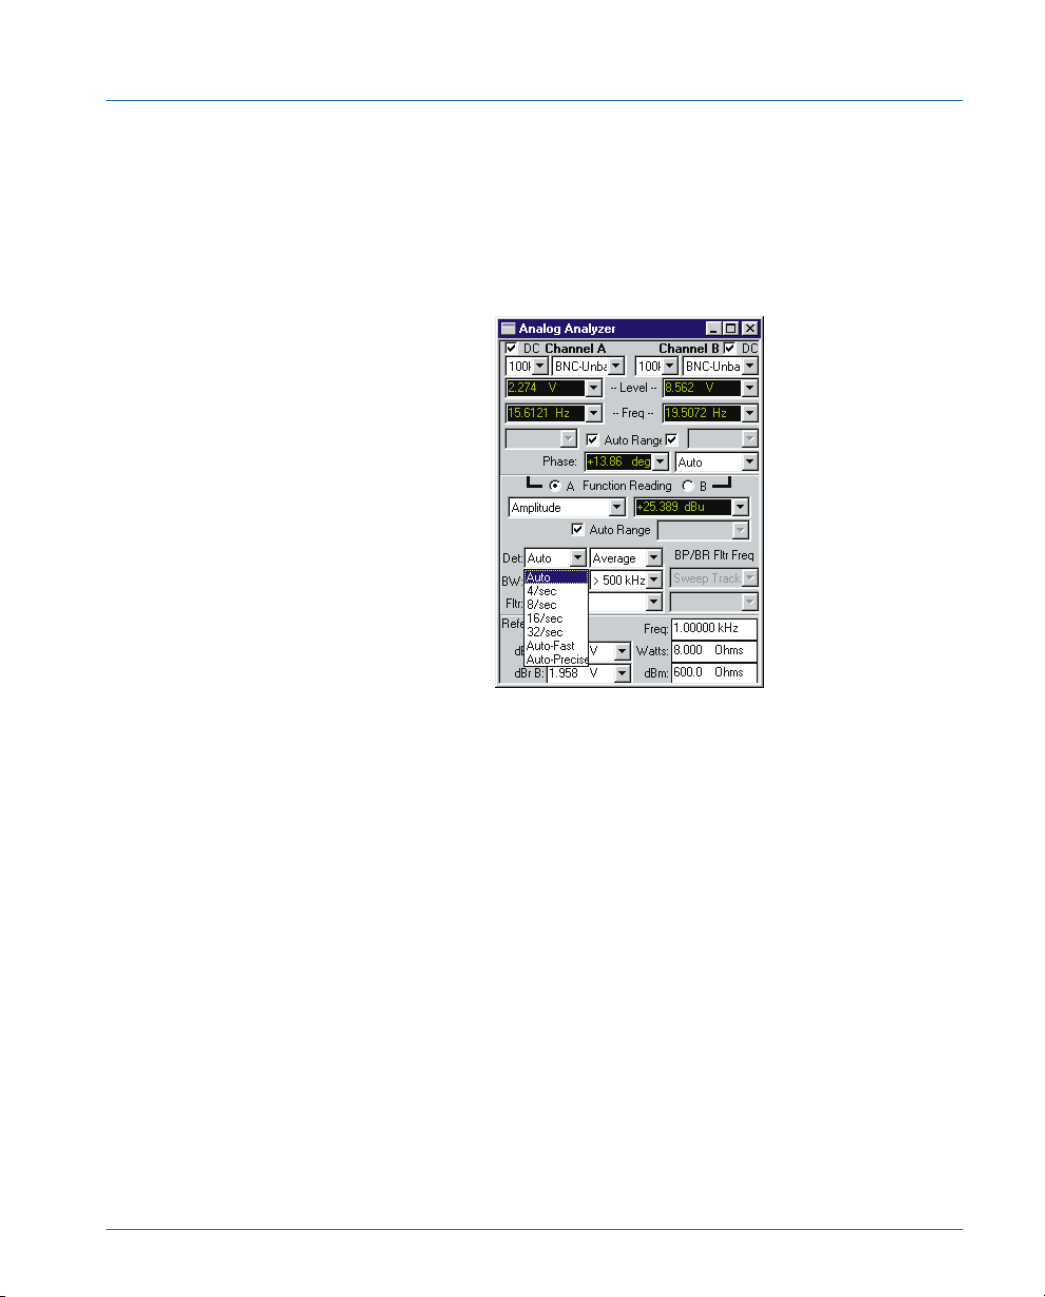
The key parameters and factors are:
a. Analog Analyzer panel: In both System One and System Two
select the Det drop down list box and choose a detector reading
rate no faster than 8 per second for full specified accuracy at 20
Hz. Use of “Auto” (16/sec in External Sweep mode) will produce
only about 0.1 dB additional potential error at 20 Hz.
The Average detector, which is slightly more accurate at low
frequencies, may be selected if desired since the signal is a very
pure sine wave. In External sweep modes, the reading rate
selected on the Analog Analyzer panel is used throughout the
test. This differs from Generator-based sweeps where the
reading rate is automatically changed during the sweep as a
function of the generator frequency. A 32/sec rate guarantees
specified amplitude measurement accuracy down to 50 Hz. The
16/sec rate will produce rated accuracy at 30 Hz and higher. The
8/sec rate provides specified accuracy to 20 Hz.
When using System One set the Function Reading meter to
2-Channel Amplitude mode (2-Ch. Ampl) and select Channel A.
When using the Function Reading meter in 2 Channel mode for
frequency response measurements set the High-pass filter to Hz
and the Low pass filter no lower than 80 kHz since a narrower
bandwidth will affect the measured response as a result of the
Compact Disc Player Tests – Application Note #1A Page 9
Page 19
Frequency Response Sweeps
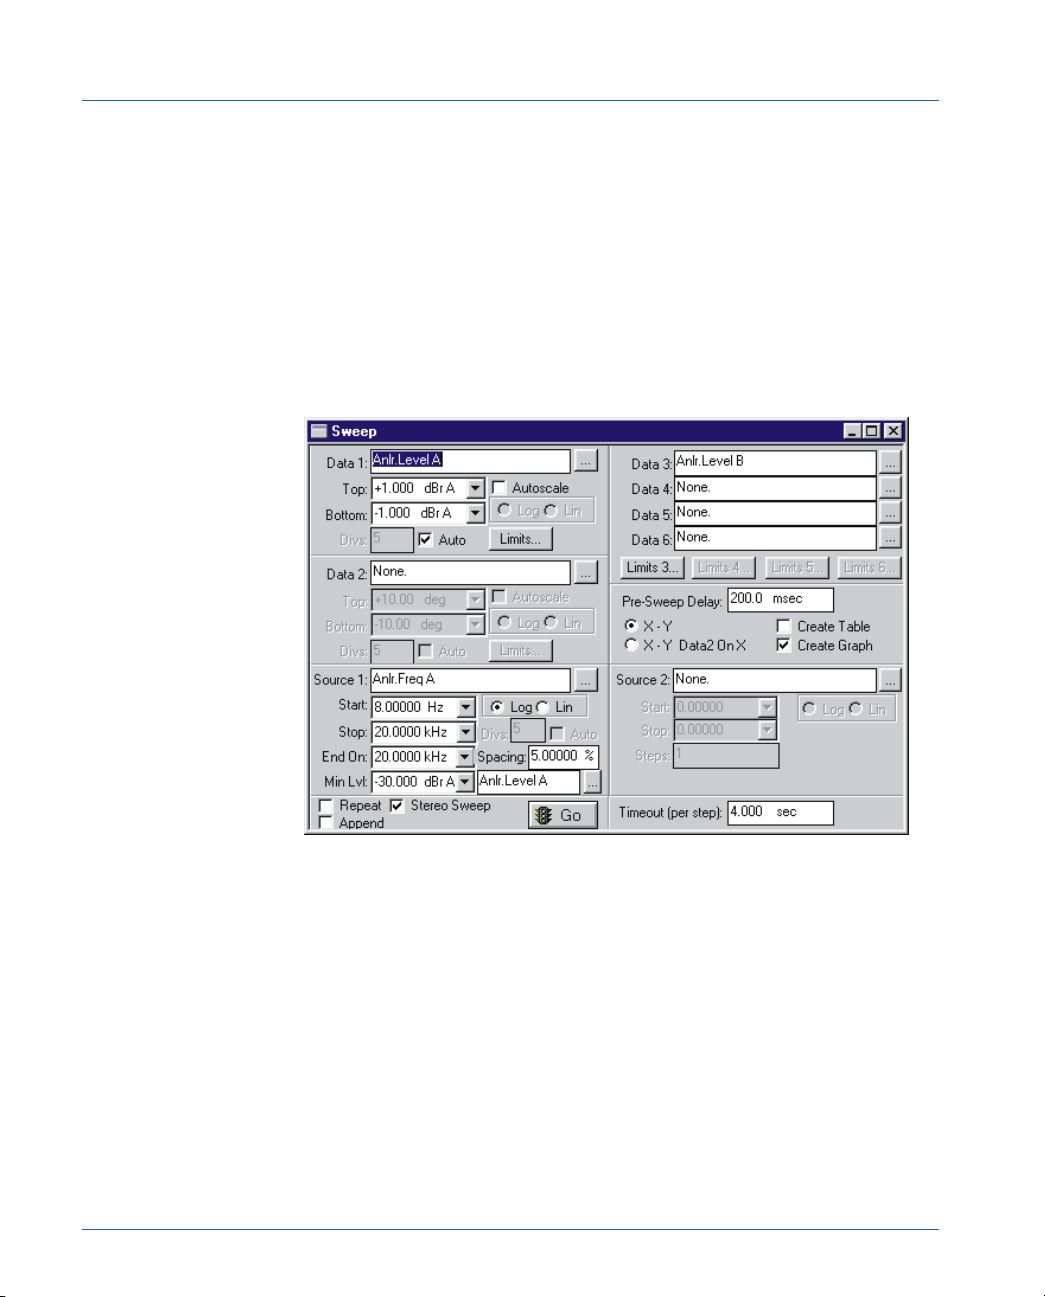
b. Sweep panel: System Two testing uses the two Level meters.
filter skirts. In System Two the two Level meters are used for the
response measurement and no filters or bandwidth limitation is
available to them. Low frequency reading performance can be
improved in System Two by selecting DC coupled inputs (upper
corners of the expanded Analog Analyzer panel).
Select Anlr.Level A for Data 1. If you wish the displayed
response to go through 0 dB at 1 kHz, select the dBr A (relative
dB) units for Data 1. Checking the Stereo Sweep box
automatically selects the Channel B Level meter for Data 3.
For System One first select 2-Ch.Ampl from the Function
Reading meter drop down list (Analog Analyzer panel) with the
radio button set to Channel A. Next on the Sweep Panel, choose
Anlr.2-Ch Ampl from the Data 1 browser and check the Stereo
Sweep box. This sets Data 3 to Anlr.Level B. The Data 2
measurement and right graph axis is available for other readings.
Measurements will then be made simultaneously on both
channels, with the Function Reading meter measuring the
selected channel (A, usually connected to the left channel) while
the Level meter measures the alternate (B, or right) channel.
Page 10 Compact Disc Player Tests – Application Note #1A
Page 20
Frequency Response Sweeps
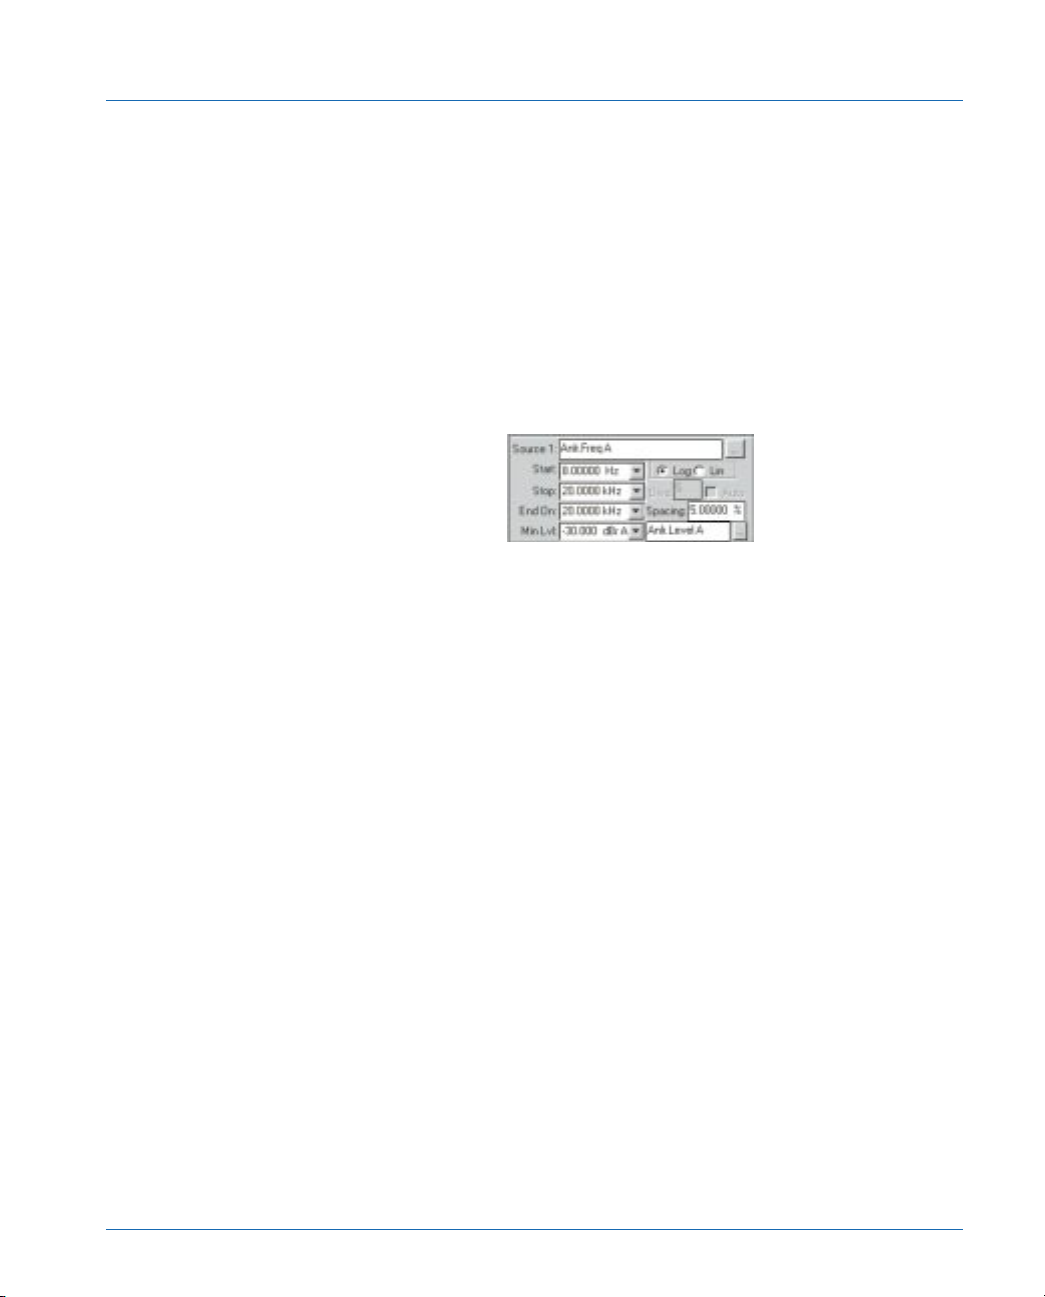
Also on the Sweep panel select Source 1 as Anlr.Freq A
(Anlr.Freq for System One) with 8 Hz as the Start and 20 kHz as
the Stop frequency. The direction of “sweep” of the signals on
the disc must be matched by the direction implied by these Start
and Stop frequencies; all of these test CDs have tracks in
sequence from low to high frequency.
The End On frequency should be set to the next tone that
appears after the Stop frequency. This is most often another 1
kHz tone. If the End On frequency tone doesn’t exist then the
sweep can be stopped by pressing the Stop button or Esc key.
The Spacing parameter determines the minimum percentage
change in the frequency required before APWIN will acquire and
plot another point. A 5% value is satisfactory for any of the
series of CD tracks with discrete frequencies.
Set Min Lvl to a level below the CD signal output level but well
above the noise floor. This can be most easily done by selecting
the dBr unit (dBr A or B in System Two) and setting the Min Lvl
to around -35 dBr. If Min Lvl is set too close to the signal level
any readings that fall below the Min Lvl setting will be ignored
and not included in the measurements. If Min Lvl is set too low,
noise between tracks may be taken as readings. This false data
can cause the sweep data to interrupt. If the dBr value is set to
the 0 dBFS level from the CD (recommended) the Min Lvl value
of -35 dBr will be safely below the typical frequency sweep
amplitude but well above the noise level. The dBr settings in the
supplied tests have a default value of 2 Volts RMS, typical for
unbalanced consumer equipment outputs.
c. Settling panel: Settling panel conditions will vary depending on
the specific readings being done and whether the source is a
discrete, stable tone or a continuously changing glide tone. In
the FRQRSPD test the settings are appropriate for a discrete
Compact Disc Player Tests – Application Note #1A Page 11
Page 21
Frequency Response Sweeps
Referencing Frequency Response—the dBr
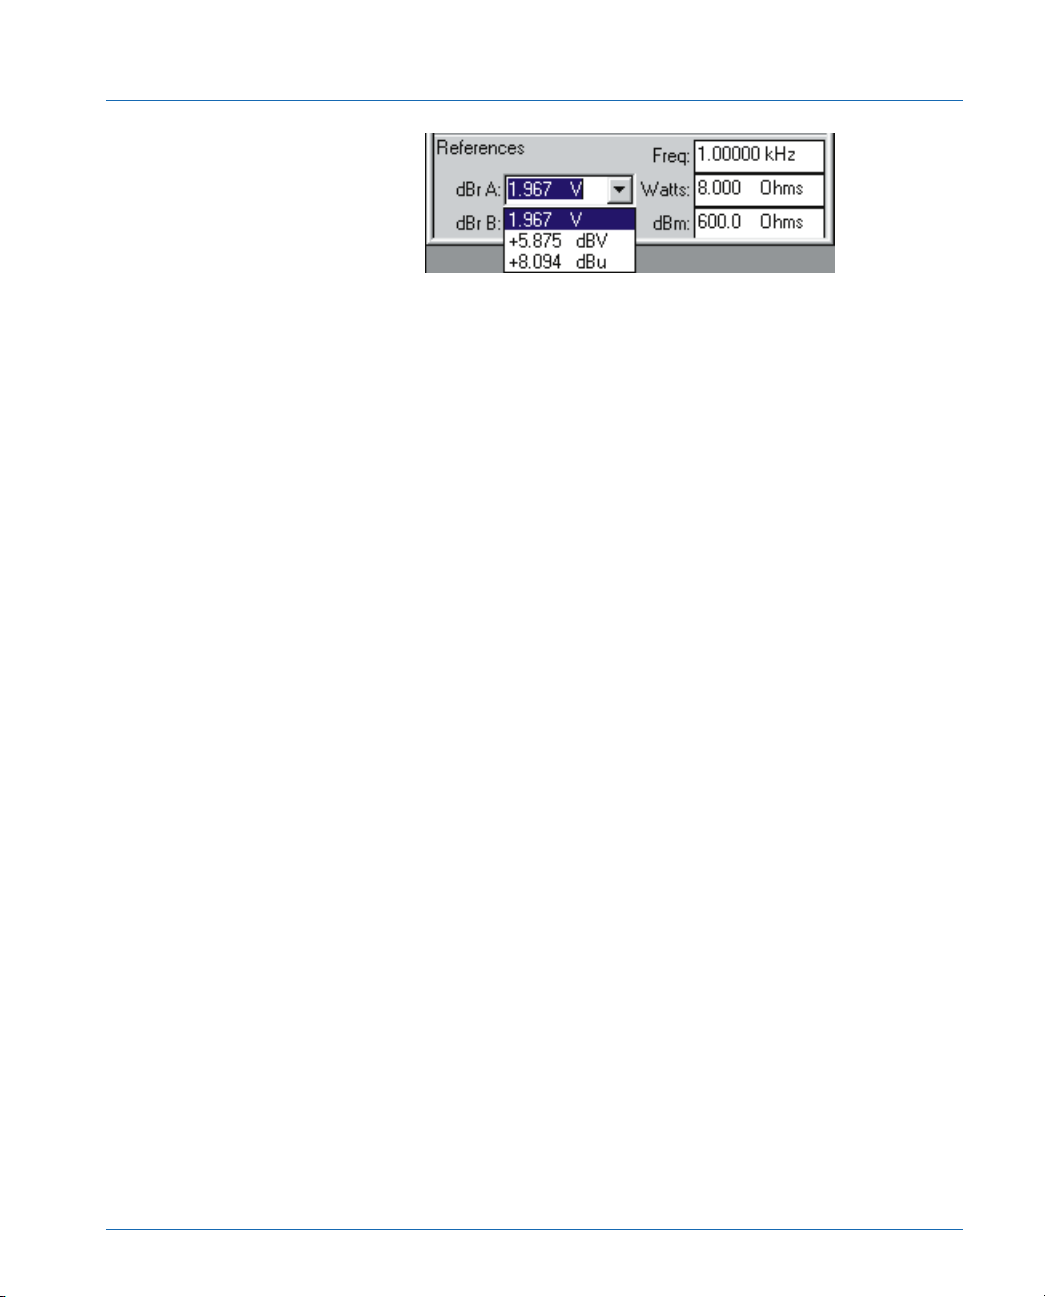
The supplied test default value for the dBr fields is 2 Volt RMS
(+6.02 dBV). There are three methods in APWIN that may be used to
set the dBr value to yield results relative to a reference level:
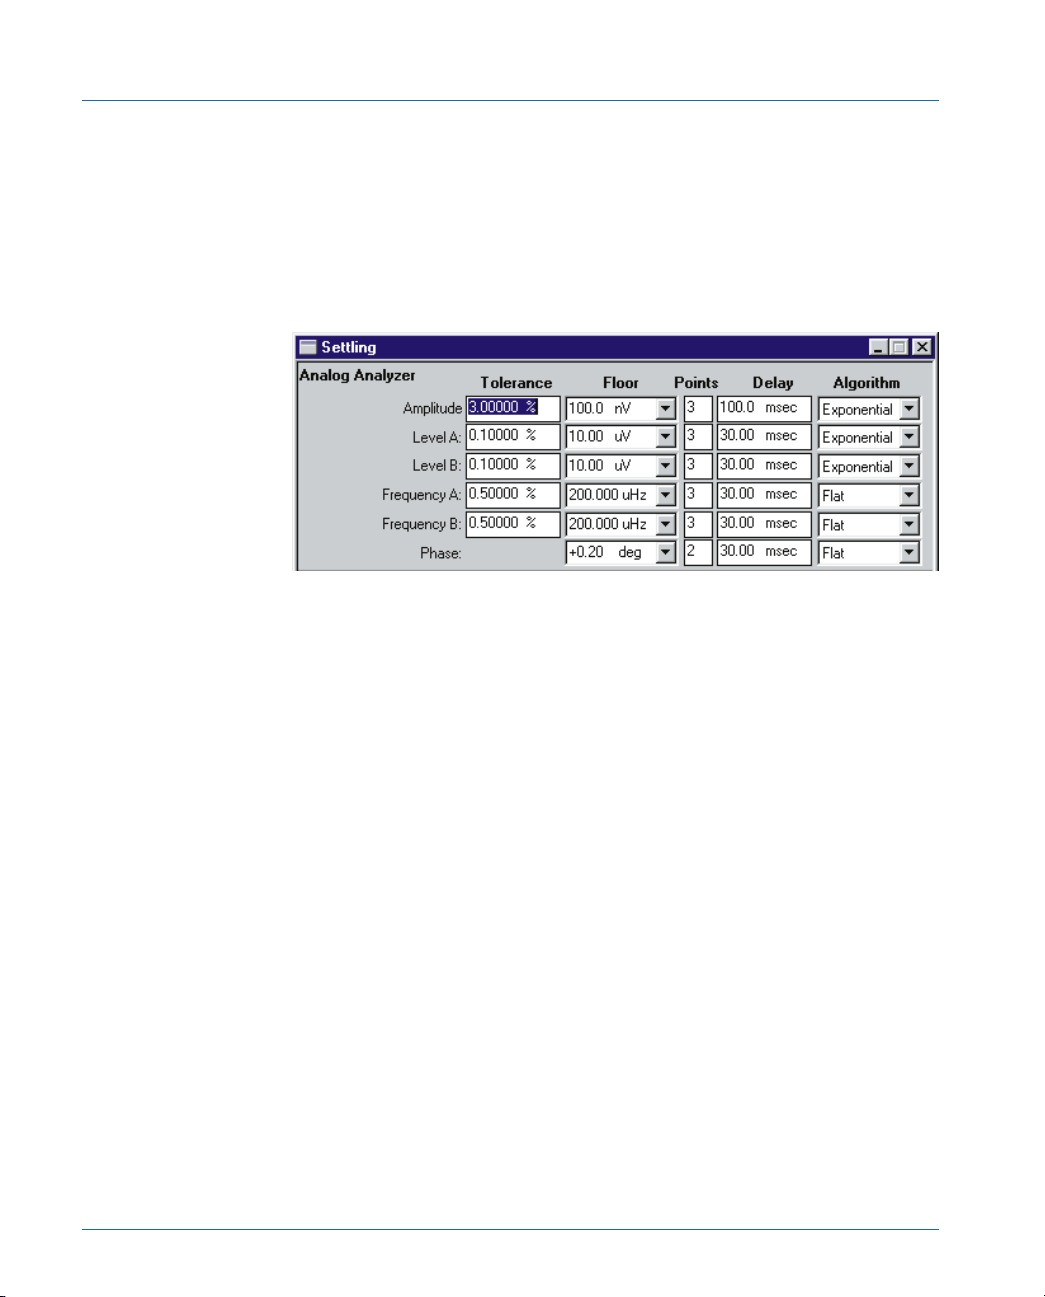
tone source and frequency response readings. Since response
flatness of 0.1 dB and better is not unusual in good CD players,
the settling tolerances of the Settling panel should be tightened
from their usual default value of 1% (0.1 dB). Values of 0.1% to
0.5% (0.01 to 0.05 dB) are appropriate for both 2-Ch.Ampl and
Level meters at a detector rate setting of 8/sec.
1. Actively setting the dBr reference—To set the analyzer reference
to 0 dBr from the CD player select a track with a 1 kHz reference
level track of the same level as the frequency sweep being used
and press the F4 key while this track is playing. This
automatically sets the player’s output levels as the Reference dBr
values. There will likely be at least a small difference in graphed
level between Channel A and Channel B due to difference in the
output level calibration of the CD player. The advantage of using
F4 is that the measurement results can be seen on the graph as
the sweep progresses.
2. Manually entering the dBr value—If tests are being done to a
specification the specification reference value can be entered
directly by typing the value into the References dBr fields. Volts
RMS, dBu and dBV units are available.
Page 12 Compact Disc Player Tests – Application Note #1A
Page 22
Frequency Response Sweeps
3. After-sweep referencing of data—APWIN can also adjust the
measurement data after the sweep so that the reference levels
are set to the 0 dBr value based on the actual measured
amplitudes at that reference frequency. This is accomplished by
using the Compute Normalize function. The sweep data values
are changed based on the settings in the Horizontal Value and
Target Value boxes in the Compute Normalize window. A
possible disadvantage of using Compute Normalize alone is the
sweep may not be visible while the sweep is running if the CD
output level is much different then the analyzer’s current dBr
reference value. Also realize that the Compute function replaces
the original test data with data changed as defined by the
compute function used. This means the original test data is no
longer available—there is no “undo”. In this case the
information lost is the original dBr values in the test.
To reference readings to the 1 kHz level value: Set 1 kHz in the
Horizontal Value window. Set the Target Value to 0 dBr.
Indicate which Data columns are to be calculated by checking
the appropriate Data To Compute box.—Data 1 and Data 3 in
most stereo sweeps. Computation can be done automatically by
checking the Apply After Sweep check box in the Compute
Normalize window. However, if the sweep has to be stopped by
pressing the Stop button (as when there is no End On frequency
available), the automatic Apply After Sweep function will not
operate since it requires a normally ended, rather than stopped,
sweep. With Apply After Sweep checked the data can be seen to
center themselves to the reference frequency immediately after
the sweep ends.
Testing
Appropriate CD sources for this test setup include tracks 46-55 of
the Denon disc, tracks 8-23 of the Philips SBC429 disc, and tracks
Compact Disc Player Tests – Application Note #1A Page 13
Page 23

Frequency Response Sweeps
15-29 of the NAB Test disc. Tracks 6-10 of the CBS disc are also
tested with this setup, but require index advances at some points and
track advances at others since they contain indexed segments within
each track.
Sequence the CD to the lowest-frequency track, press F9 or GO,
and Play the CD. Watch the graph for plots of both newly measured
points and advance the player to the next track as each segment is
plotted (or the next index point if the test disc used has multiple
indexed sections within a track.) Note that since two points are needed
for a line, the first point doesn’t provide an indication on the graph. If
the Data Editor is displayed (APWIN page 3 tab) the readings can be
seen accumulating. After each reading the sweep will then wait for the
frequency to change by more than the Source 1 Spacing value. While
the player could simply be allowed to play through the series of tracks,
the fastest testing will result from advancing the player one track (or to
the next index point depending on the disc) after each reading is
plotted. After acquiring data from the last track, save the test to disk
under an appropriate name. You may also wish to change the Data
section Top and Bottom units to better display the particular
measurements or, while the mouse cursor is on the graph, use the right
mouse button menu and pick Optimize Left Only. The Optimized
graph settings can also be copied back to the Sweep panel by clicking
the mouse right button and selecting Copy to Sweep Panel.
Page 14 Compact Disc Player Tests – Application Note #1A
Page 24
Frequency Response Sweeps
Audio Precision CD Frequency Response - Discrete Tone
+1
+0.8
L
+0.6
+0.4
a
n
+0.2
d
+0
R
-0.2
-0.4
d
B
-0.6
r
-0.8
-1
9 20k20 50 100 200 500 1k 2k 5k 10k
FREQUENCY RESPONSE
Hz
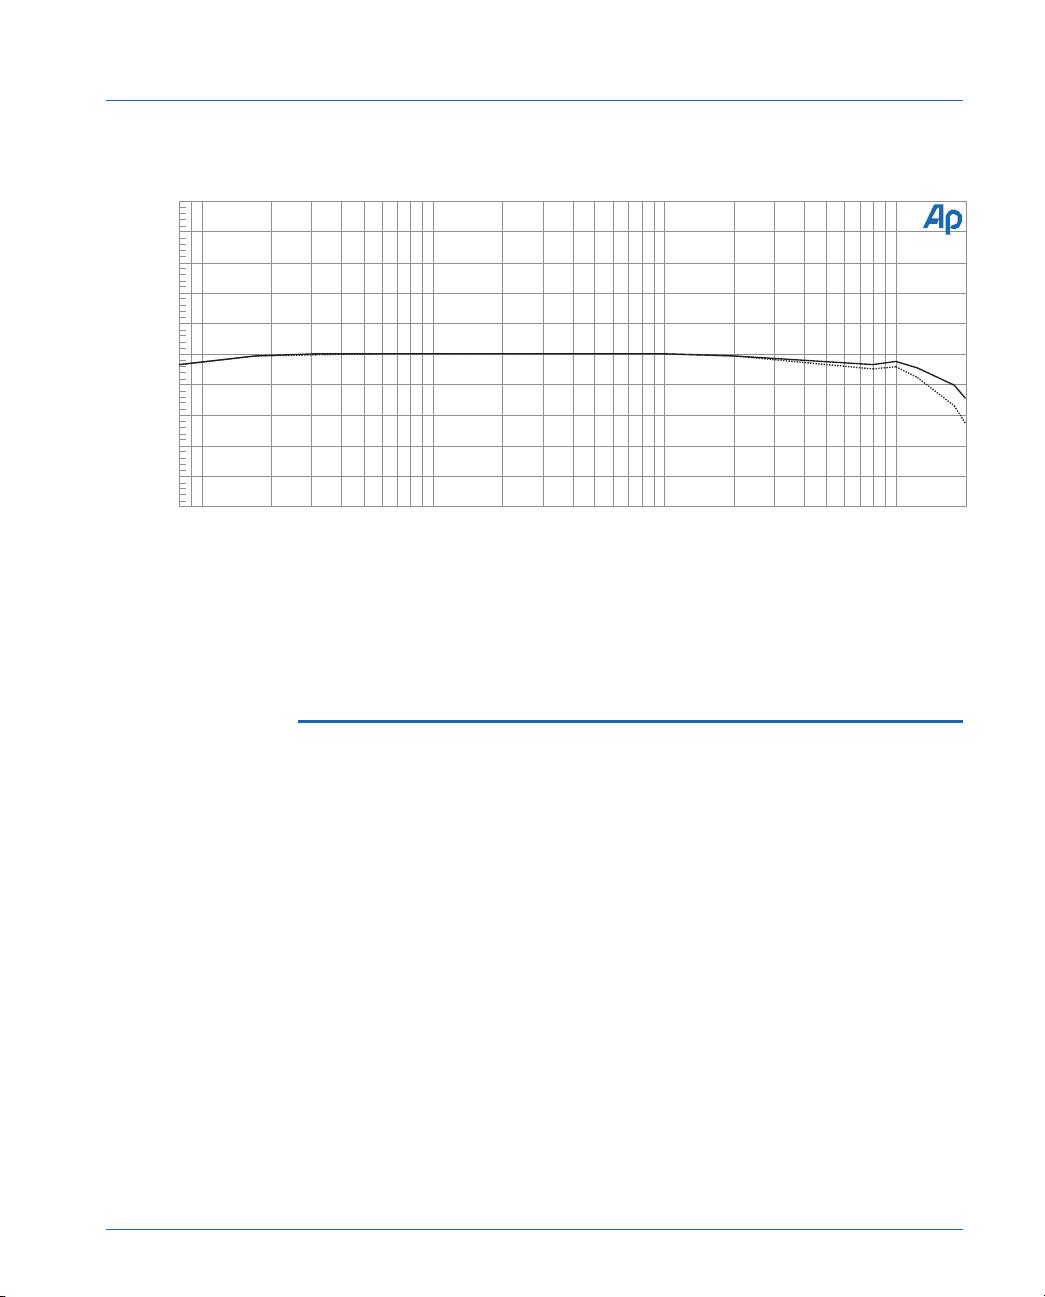
Figure 2 Discrete Frequency Response graph from FRQRSPD test
High-Resolution Frequency Response
Measurements
The sequence of fixed-frequency tracks on the test CDs limit the
frequency resolution to between 10 and 31 points across the spectrum
depending on the number of discrete tone tracks available. Many discs
permit much higher resolution measurements if they have a continuous
analog sweep (glide tone) from 20 Hz or lower to 20 kHz or higher.
Note that these continuously changing tones cannot be used for
THD+N measurements since the reading cannot be settled properly.
Track 11 on the CBS, 65 on the Denon, and 7 on the NAB discs are
continuous stereo sweeps from 5 Hz to 22 kHz. Track 5 on the Philips
disc is a continuous stereo sweep from 20 Hz to 20 kHz. All of these
have total sweep times in the 50 to 70 second range.
This setup and data are supplied in the distribution files as
FRQRSPG.at1 or .at2 (FReQuency ReSPonse, Glide tone track) in the
distribution files. As in the previous test (FRQRSPD) the System One
test is similarly configured to the System Two test. Additional
Compact Disc Player Tests – Application Note #1A Page 15
Page 25
Frequency Response Sweeps
measurements (such as Phase) may be added by using the Data 2 field
and the right graph axis.
Setup
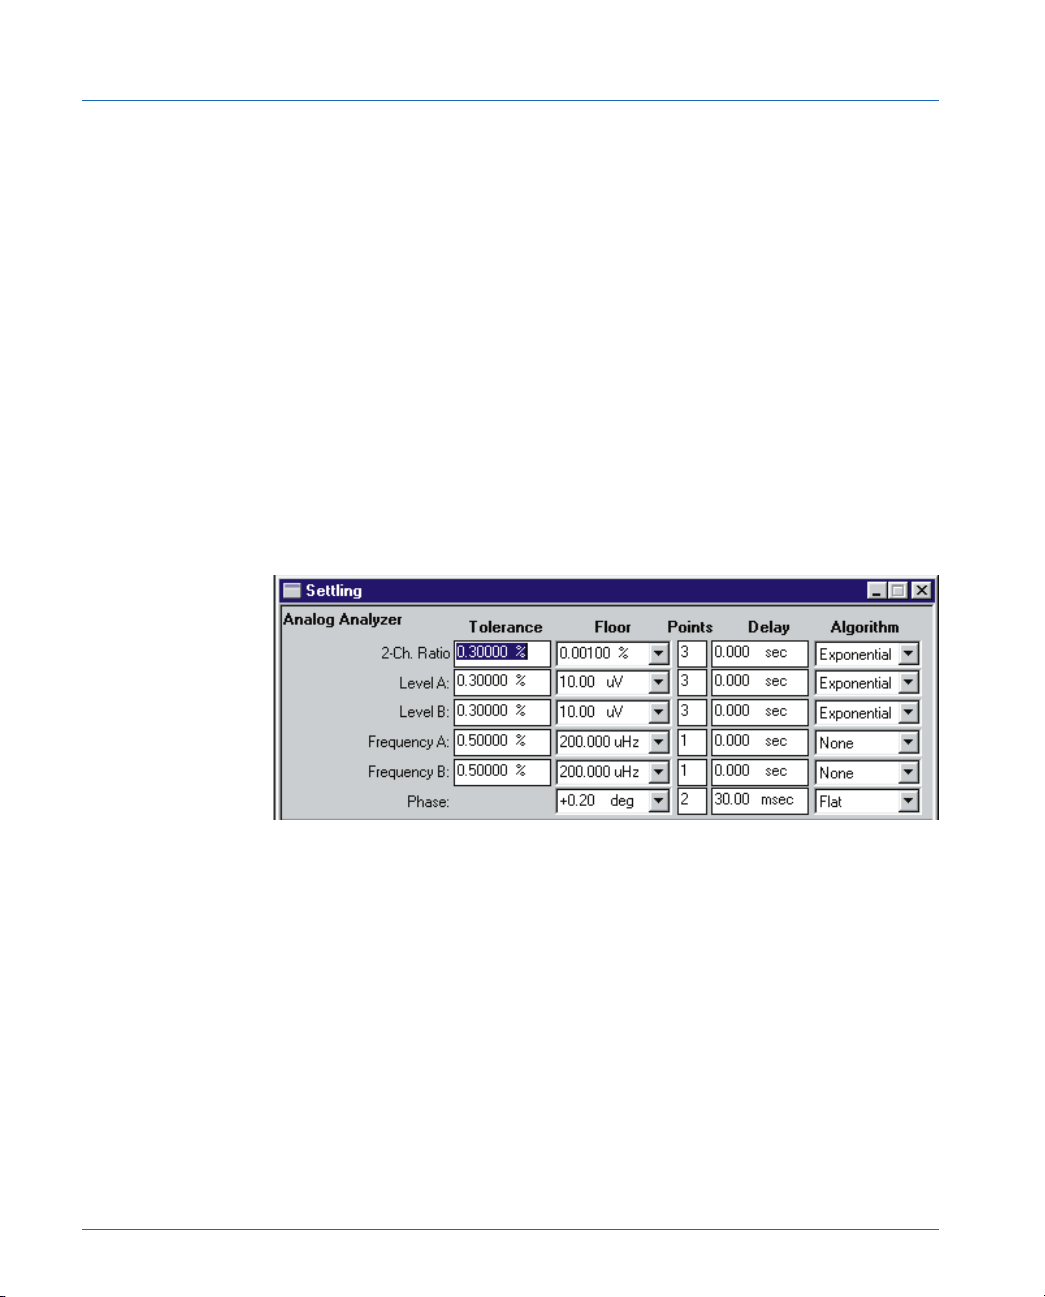
In order to make successful External Frequency sweep tests with a
continuously changing sweep signal, the Settling panel must be
changed. Every meter in APWIN has its own line in the Settling panel.
The test setups previously described have software-settling algorithms
in use for the data parameters: Anlr.Level A (Anlr. 2 Ch. Ampl in
System One); Anlr.Level B and Anlr.Freq A or B. (Anlr.Freq in System
One). The default value of 3 Points specifies that three measurement
samples of the data parameter must agree within the Tolerance
percentage before they are captured and plotted. In these examples
the Tolerance value is further adjusted by an exponential weighting
function when Exponential is chosen as the Algorithm.
For a glide-tone test, key setup points on the Settling panel are:
a. The reading rate of 16/sec (selected by Auto) may compromise
accuracy below 30 Hz, but produces more samples and thus
more detail at high frequencies. On System Two DC input
coupling should be selected on the Analog Analyzer panel for
very low frequency level accuracy.
b. With the continuous “glide tone” sweeps, the Source 1 Spacing
value on the Sweep panel will determine how many points are
taken across the audio spectrum. Values as low as 1% or 2%
may be selected for a maximum number of data points.
Page 16 Compact Disc Player Tests – Application Note #1A
Page 26

Frequency Response Sweeps
c. Since the frequency meter reading—Anlr.Freq A or B—is
continuously changing on a “glide tone” track, 3 consecutive
frequency samples will never be equal and the APWIN software
will not acquire data. For measurements to be taken, the Settling
panel Algorithm must be changed from its default setting of
Exponential to None. This disables the settling algorithm for the
frequency measurement.
d. Depending on the rate of change of the measured
parameters—Anlr.Level A (or 2 Ch Ampl in System One) and
Anlr.Level B—and the tightness of the Tolerance for these
parameters, it is usually desirable to change the Points settings
from 3 to 2, or to loosen the Tolerance somewhat from values
which are acceptable on the steady-signal tracks. If data is not
taken smoothly and continuously all the way to 20 kHz, it is
normally because the response is varying rapidly at high
frequencies. The settling must consequently be loosened if data
is to be obtained.
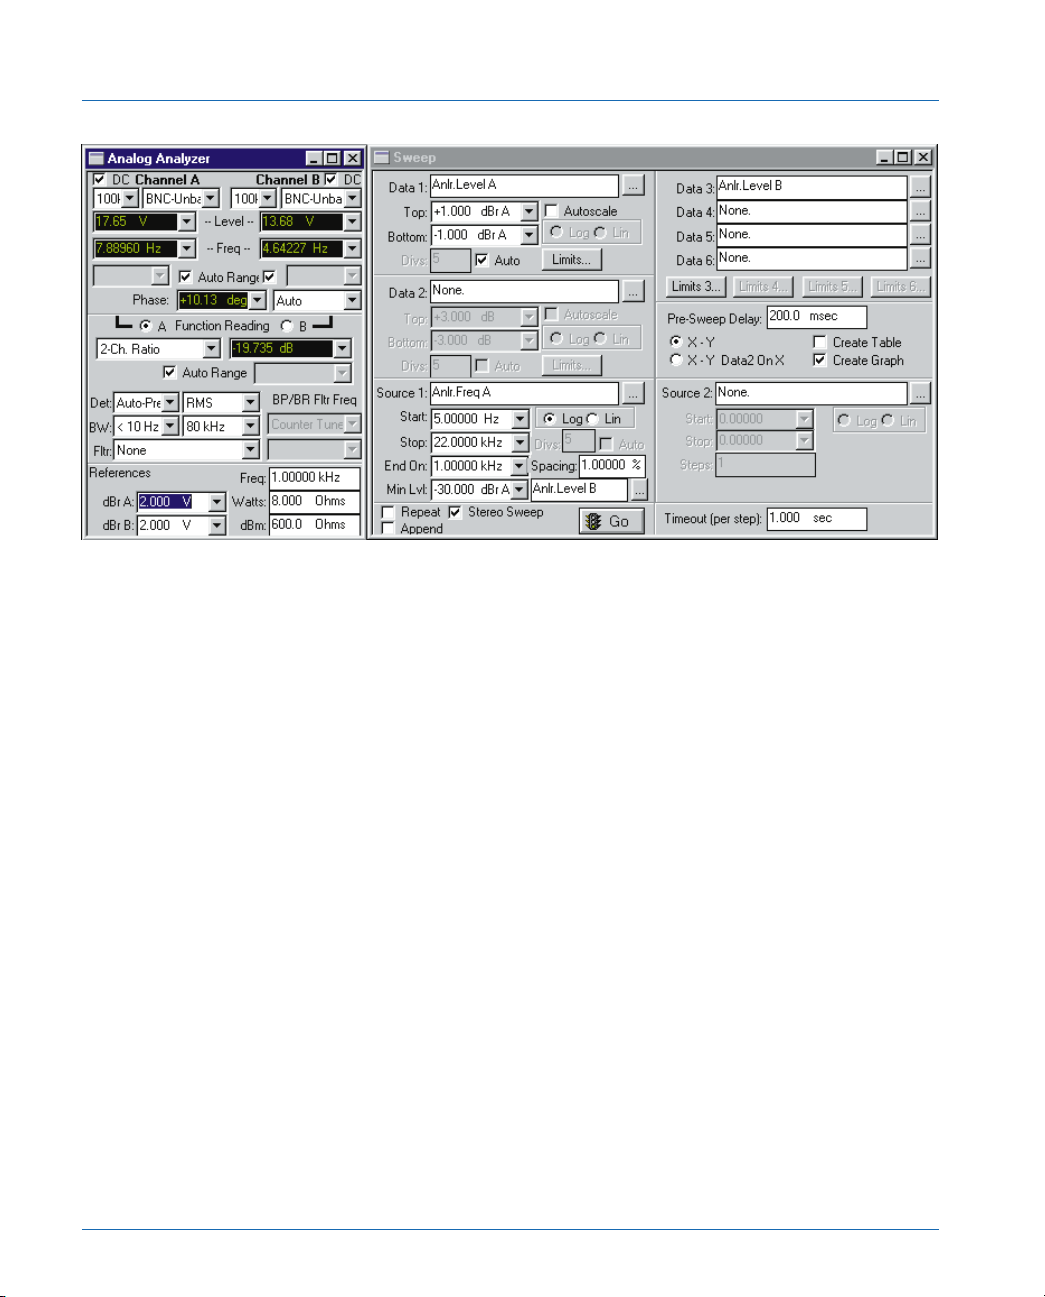
Figure 3 shows the System Two test (.at2) Analog Analyzer panel,
Sweep panel, and the Settling panel from a test for a stereo frequency
response measurement from a stereo “glide tone” track. Anlr.Level A
(Channel A) is displayed at Data 1 and, after checking the Stereo
Sweep check box, Anlr.Level B (Channel B) at Data 3. The Function
Reading meter is not used. Figure 4 shows the results of a test that also
measures the difference between the amplitudes of the left and right
channels. The FR&Diff.at2 (Frequency Response & channel
Difference) test displays the left and right frequency response using the
left vertical axis and the difference in amplitude between the two
channels on the right vertical axis. This test uses the Function Reading
meter in 2 Ch Ratio mode and graphs the results as Data 2.
Compact Disc Player Tests – Application Note #1A Page 17
Page 27
Frequency Response Sweeps
Figure 3 Glide tone sweep set up panels from FRQRSPG.at2
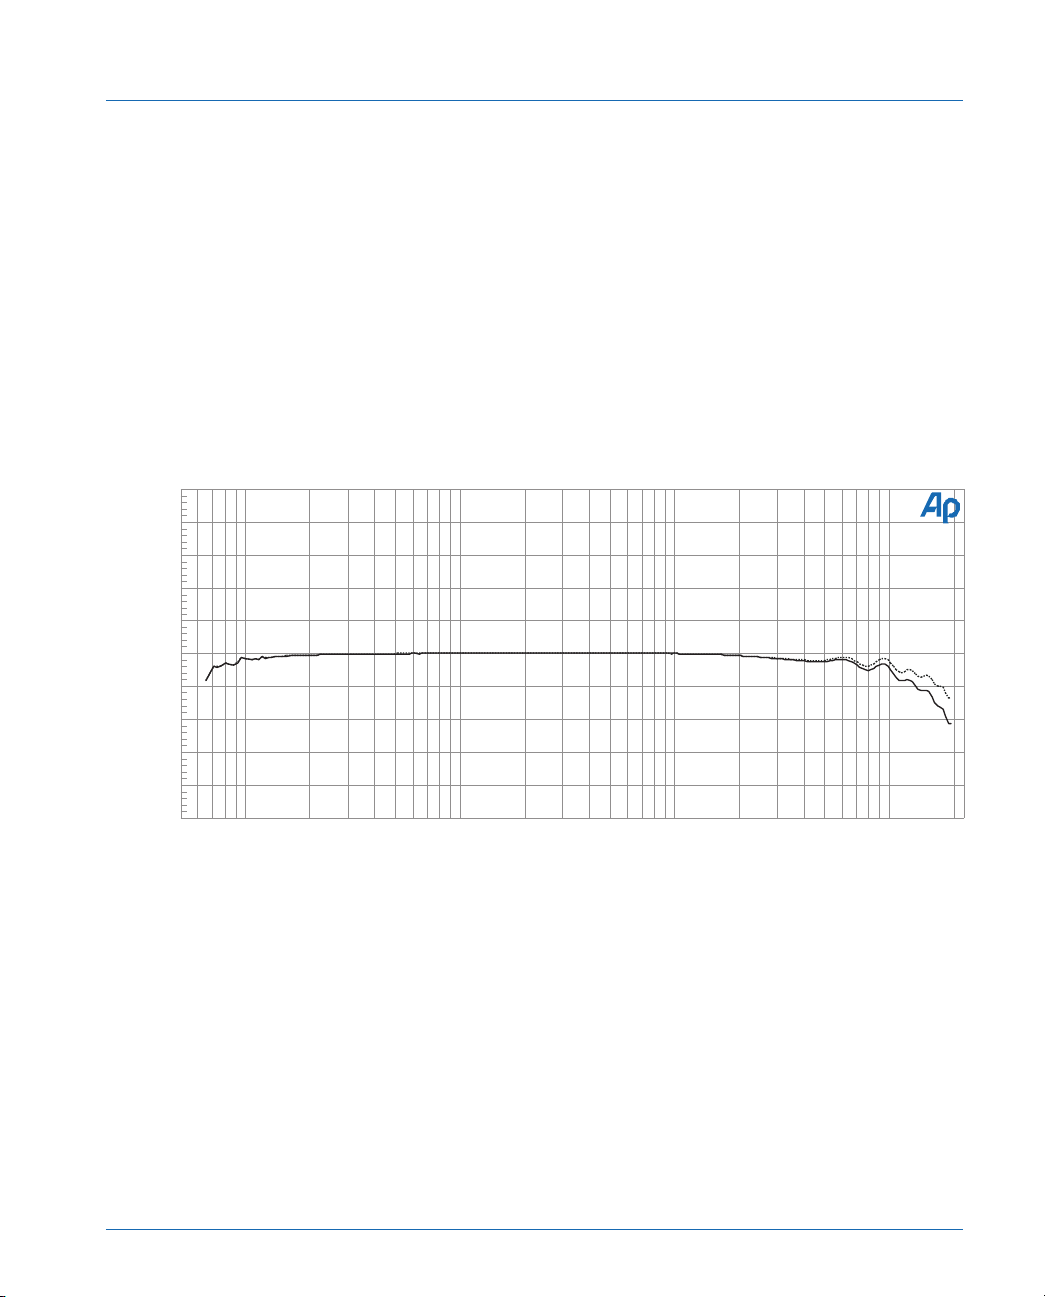
Figures 2 and 4 may also be compared to see the effect of the
increased frequency resolution.
Testing
Testing with the continuously swept glide-tone tracks does not
require the operator to advance the player after each reading as the
discrete tracks do. THD+N measurements cannot be made on these
continuously changing frequencies because the notch filter that
removes the fundamental tone cannot accurately follow the
continuously changing frequency.
To set the dBr value before the sweep, select and play a reference
tone at the same level as the sweep and press F4. Some test CDs
provide a reference just before the beginning of the sweep. Note that
the 1 kHz tone at the beginning of track 65 on the Denon disc is not at
the same level as the swept tone. In this case the dBr Reference may
be set to the midband value for the CD player by first playing track 65
while watching the Frequency measurement on the Analog Analyzer
panel or a Bar Graph displaying the Analog Analyzer frequency
reading. As the measured frequency reaches the 1 kHz area, press F4
Page 18 Compact Disc Player Tests – Application Note #1A
Page 28
Frequency Response Sweeps
to store the level measurement from channel A as the dBr REF. Then,
reset the CD player to the start of the track, press F9, and start the
player. On the Denon disc, the 1 kHz tone lasts for about 8 seconds
and data is usually not acquired until the frequency has swept upwards
several Hz from the 5 Hz Start. Either 5, 8 or 10 Hz is an appropriate
Start selection at Source 1 with the CBS, NAB, and Denon discs, while
the Philips disc starts at 20 Hz. System Two has DC coupling input
choices available. Selecting DC coupling (upper corners of the Analog
Analyzer panel) will improve the accuracy of low frequency level
readings.
Audio Precision CD Frequency Response - Glide Tone
+1
+0.8
+0.6
L
+0.4
a
n
+0.2
d
+0
R
-0.2
d
B
-0.4
r
-0.6
-0.8
Frequency Response
-1
6 20k10 20 50 100 200 500 1k 2k 5k 10k
Hz
Figure 4 High Resolution frequency response graph from FRQRSPG test.
Results
The graph has a range of only ±1 dB and presents a detailed view
of the frequency response. Mouse right-button and Optimize Left can
be used to view the data with maximum detail. The response below 20
Hz cannot be attributed purely to the player, due to the 16/sec reading
rate and because, in System One, the input coupling flatness is not
Compact Disc Player Tests – Application Note #1A Page 19
Page 29

Frequency Response Sweeps
specified below 10 Hz. On System Two the low frequency accuracy is
improved by selecting the DC coupled input mode.
Frequency Response With De-Emphasis
Compact Discs may be recorded with or without pre-emphasis.
When pre-emphasis is used, a “flag” is also digitally recorded which
tells the CD player to switch in de-emphasis circuitry in order to
provide overall flat frequency response. The simplest tests for
de-emphasis accuracy can be made with the CBS discs. Track 12
contains five frequencies recorded using pre-emphasis. If the player
de-emphasis (and other circuitry) is perfectly accurate, all five
frequencies will be reproduced as a flat graph at -20 dB. The same test
setup (FRQRSPD.at1 or .at2) used for other frequency response tests
may also be used for the de-emphasis accuracy tests. Start the player
at the beginning of the track (1 kHz reference) and press the F4 key.
Advance the index to 2 (125 Hz) and press F9 to start the test. When
the measurement is taken (view the Data Editor) index back to 1 (1
kHz) for the next point. When the measurement is taken (a new line in
the Data Editor), index to 3 (4 kHz), then 4 (10 kHz), and finally 5 (16
kHz). This index sequence of 1, 2, 1, 3, 4, 5 is necessary because
APWIN software requires a monotonically increasing or decreasing
signal to properly graph and the frequencies in track 12 on these discs
are not in monotonic order. The final graph is a measurement of the
player’s deviation from perfect de-emphasized frequency response
including any imperfect frequency flatness of the player circuitry.
If it is desired to further examine only the de-emphasis circuit
accuracy without the influence of the CD player’s basic frequency
response and channel imbalance, the Compute Delta function can be
used to subtract a previously made non-emphasized frequency
response measurement on the same unit from the test data. The test
source for the Delta information (a previously saved test file) should be
opened, then select Save As, Data, name the data (.ada) file and Save
it. Next run the response test with the de-emphasis circuitry active
(selected CD track has emphasis turned on). Next, on the drop-down
Compute Delta window, select the saved reference data file as the
Delta Source file. Select the Data to Compute and the Delta Source
Page 20 Compact Disc Player Tests – Application Note #1A
Page 30
Frequency Response Sweeps
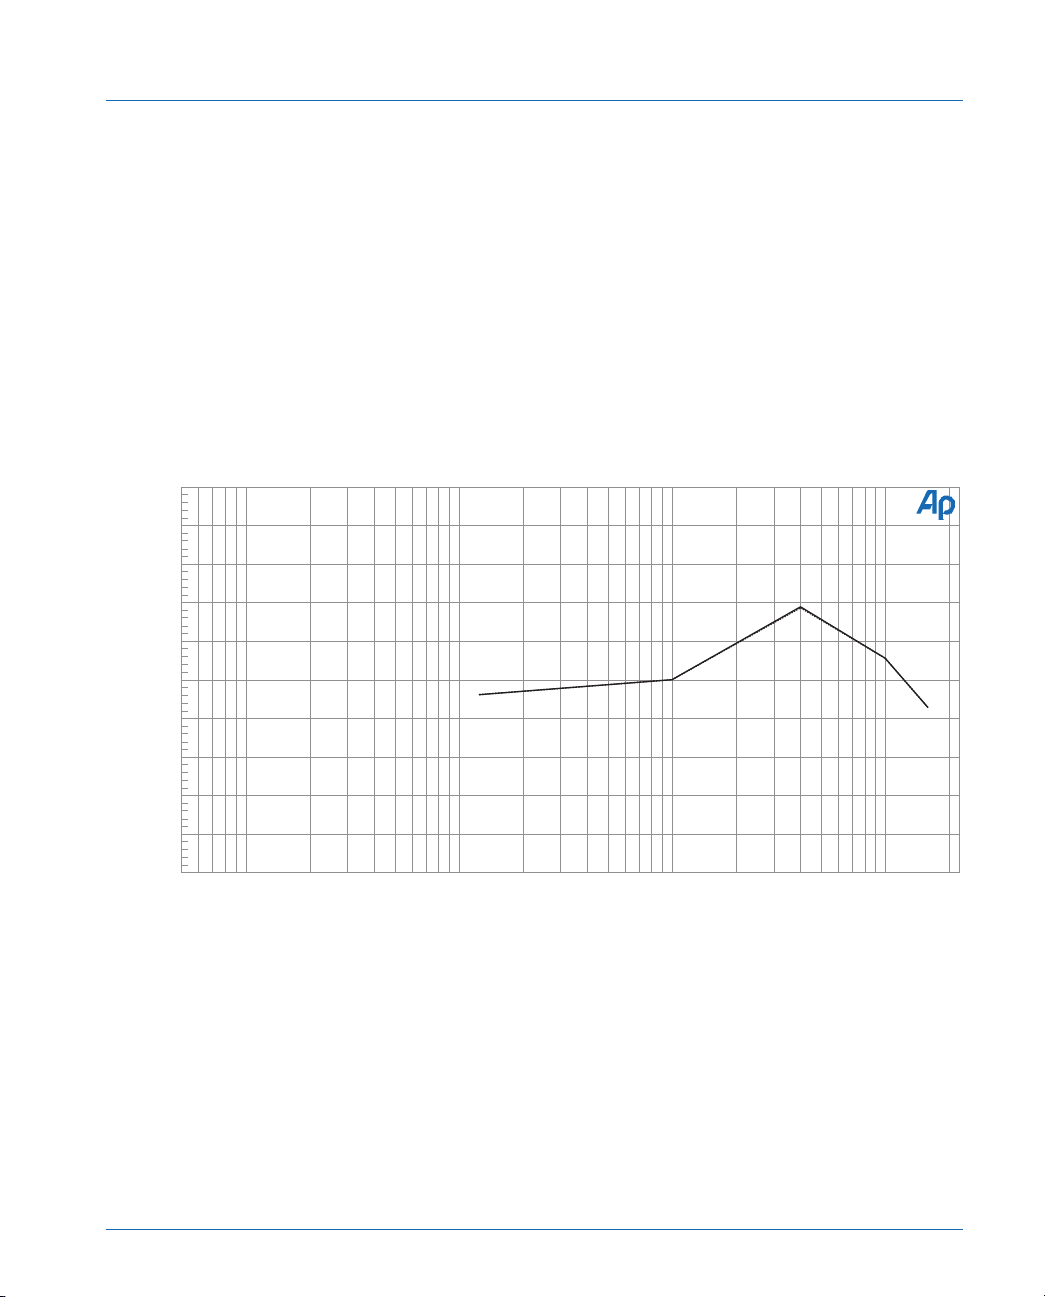
Column that is to be subtracted from the new measurement data. For
the supplied tests check Data 1 and select Delta Source Column 1;
Data 3 and select Data Source Column 2. Figure 5 shows the graphed
data after a Compute Delta operation to subtract the basic player
frequency response and channel imbalance. This data shows the total
deviation from perfect flatness due both to de-emphasis error and to
imperfect flatness of the basic player circuitry even when de-emphasis
is not in use. It also shows any level imbalance between left and right
channels, since the Analyzer dBr reference was set while measuring the
left channel in both cases.
Audio Precision CD Frequency Response - de-emphasis error
+1
+0.8
+0.6
+0.4
+0.2
d
B
+0
r
A
-0.2
-0.4
-0.6
-0.8
-1
6 20k10 20 50 100 200 500 1k 2k 5k 10k
De-emphasis error
Hz
Figure 5 De-emphasis response test with player overall frequency response and channel imbalance
removed.
Compact Disc Player Tests – Application Note #1A Page 21
Page 31

Setup For Noise And Distortion Measurements
Setup For Noise And Distortion Measurements
It is important to have good connections and correct grounding to
measure the extremely low level residual signals in a quality CD player.
See the discussion at the beginning on connection considerations.
Noise from poor connections or shielding plus analog reproduce
channel noise can be measured on the quiet (“infinity zero”) tracks.
Noise can be expressed as signal-to-noise ratio by first using F4 to set
the dBr REF on a maximum level (0 dBFS) track, then playing a quiet
track. Quiet tracks include 4 (without emphasis) on the CBS disc, 12
on the NAB disc, 49 (with emphasis) and 50 (without emphasis) on
the Philips SBC429 disk and tracks 34 (without emphasis) and 35
(with emphasis) on the Denon disc.
Single Number Signal-to-Noise Ratio
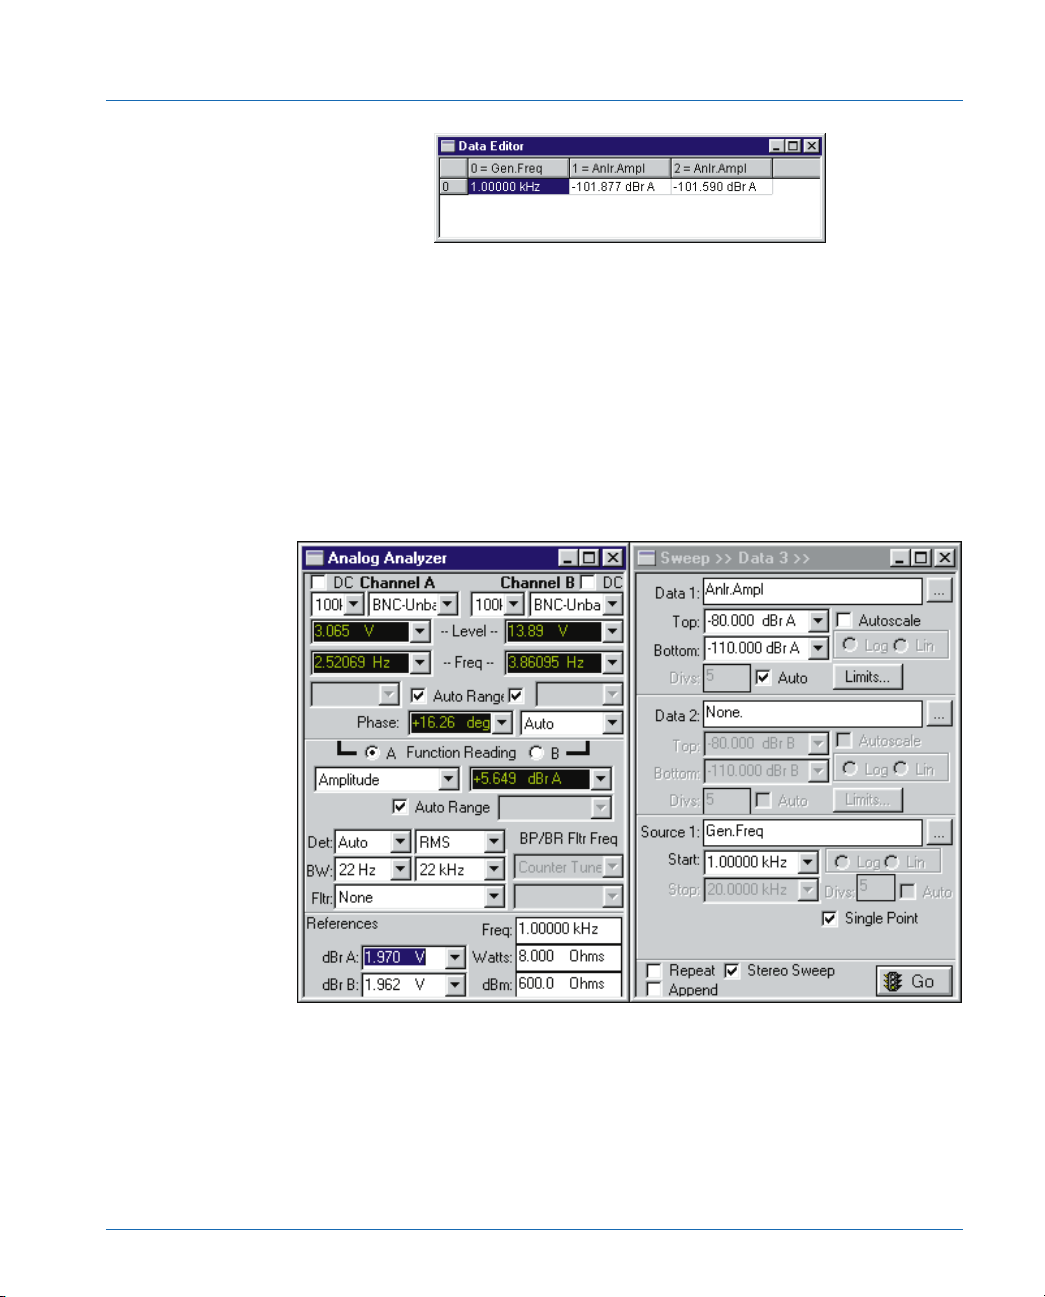
Figure 6 shows APWIN Page 1 with the panel setups after a 0
dBFS track has been played and F4 pressed to capture and set the dBr
REF value. The Function Reading meter, in Amplitude mode, has
been set up with a bandwidth of 22 Hz to 22 kHz by selecting these
values in the BW line on the Analog Analyzer panel. In addition an
optional installed filter (Fltr) can be specified such as the 20 kHz
lowpass (FLP-20k) or 20 kHz “brick wall” (FLP-A20k) filters. These
can make a significant difference in the measured noise if there is high
frequency noise present. For weighted noise measurements, such as A
weighting (FIL-AWT) or CCIR 468 (FIL-CCR) weighting, specify the
required filter in the option filter window. The filter requested must, of
course, have been installed in one of the option filter sockets in the
System One or Two.
Set Data 1 for Anlr.Ampl and check the Stereo Sweep box for B
channel data on Data 3. Check the Single Point box in the Source 1
area to produce a spot pair of measurements and automatically display
the Data Editor and the tabular display format. Measurements are
made for each channel sequentially.
Page 22 Compact Disc Player Tests – Application Note #1A
Page 32
Setup For Noise And Distortion Measurements
The lower part of Figure 6 shows the Data Editor with the
measurements resulting from pressing F9 while a quiet (infinity zero)
track is being played. This test is stored as NOISEWB.at1 or .at2
(NOISE, Wide-Band) in the distribution files. Note that this test
produces no information on the digital portions of the CD player since
the D-to-A converter is not being exercised and will normally mute
outputs when there is no audio data. A different test, DYNRANGE.at2
or at1, is used to measure the CD player noise while the D-to-A
converter is active.
Figure 6 Panels and test results for single-point audio band noise measurement NOISEWB.at2
Compact Disc Player Tests – Application Note #1A Page 23
Page 33

Noise Spectrum Analysis
the total noise can be determined by using one of the spectrum
analysis techniques. There are two basic approaches described here.
With FFT analysis the amplitude and frequencies of interfering signal
can be accurately determined. However, the maximum frequency and
dynamic range is limited by the available sample rates and the number
of bits of resolution of the A-to-D converter used. The other, much
older method uses the Analog Analyzer tunable Bandpass filter to
measure the amplitude of noise components within narrow frequency
bands. The frequency resolution is much less than the FFT method
since the filter bandwidth (1/3 octave) is much wider than the
individual FFT frequency bins. The analog method has the advantage
in frequency coverage since the upper frequency can be as high as 200
kHz. Also the amplitude measurement range of the bandpass analyzer
function is not limited by bit resolution of the A-to-D converter. This
results in a somewhat wider dynamic range of possible amplitude
measurements. A combination of both approaches is useful for
measuring very low level noise components in the presence of a strong
single tone signal. The Analog Analyzer notch filter in THD+N mode
can be used to remove the single tone fundamental and the output of
the filter analyzed by FFT analysis.
Noise Spectrum Analysis
The frequency and amplitude of noise components contributing to
FFT Noise Analysis
A spectral analysis of the CD player’s output while playing a quiet
(“infinity zero”) track will quickly show a great deal of information on
potentially limiting noise problems. On an infinity zero track, the
D-to-A converter is quiescent and contributes no noise due to
conversions (this is the only testing value from an infinity zero track).
The analysis will show whether the CD player’s power supply is
adequately filtered. It will also show whether other noise sources are
coupling into the CD player or cables, such as the magnetic field from
the deflection circuits of the computer CRT monitor used with APWIN.
In a System with DSP ability these measurements can be done by an
Page 24 Compact Disc Player Tests – Application Note #1A
Page 34
Noise Spectrum Analysis
FFT of the signal. This will display excellent detail of the frequency
components of the noise.
In an FFT analysis the maximum graphed frequency is determined
by the sample rate. Just under one-half the sample rate frequency is
the maximum frequency useful for an FFT analysis. In System Two the
sample rate can be 192 kHz set by selecting a maximum Sample Rate
of 48 kHz and selecting the Input to the High BW (4X) A/D which
multiplies the sample rate by 4. This makes the maximum band just
slightly over 80 kHz. For System One the maximum sample rate is also
192k using the Spectrum Analyzer (fftslide) digital analyzer program.
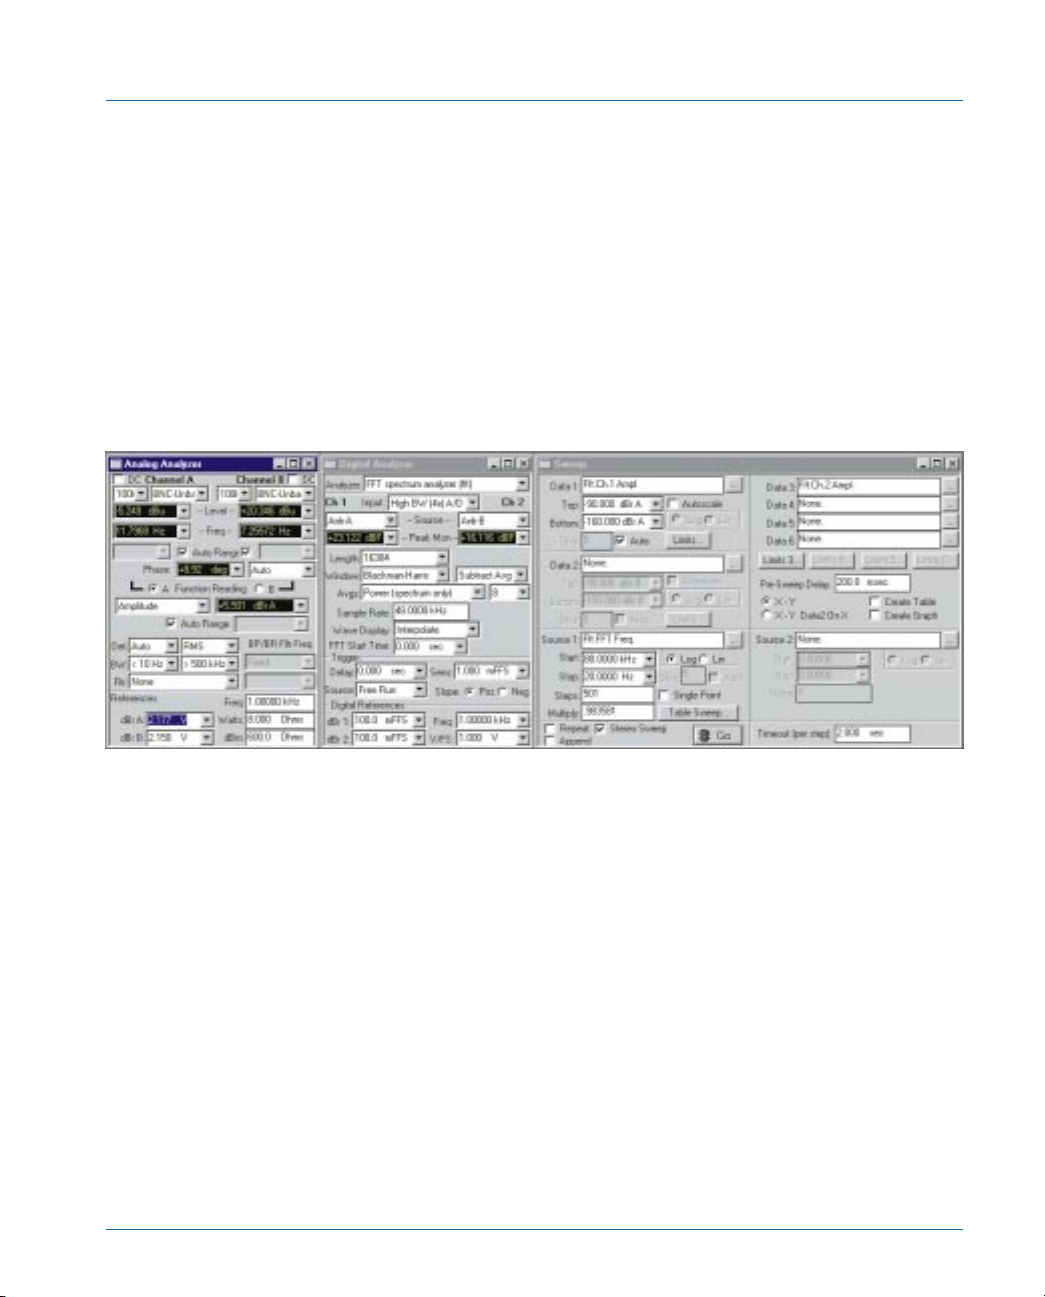
Figure 7 NoiseFFT test Page 1 panels
Setup
The Analog Analyzer is set up for a two channel input level test.
Other key factors for FFT spectrum analysis for maximum bandwidth
are:
a. For System Two select FFT Spectrum Analyzer from the Analyzer
drop-down list on the Digital Analyzer panel. Choose the High
BW (4X) A/D as Input. In the Sample Rate field enter 48 kHz.
This produces the 192 k sample rate (4 x 48k). For System One,
select Spectrum Analyzer (fftslide) from the Analyzer drop-down
list.
Compact Disc Player Tests – Application Note #1A Page 25
Page 35
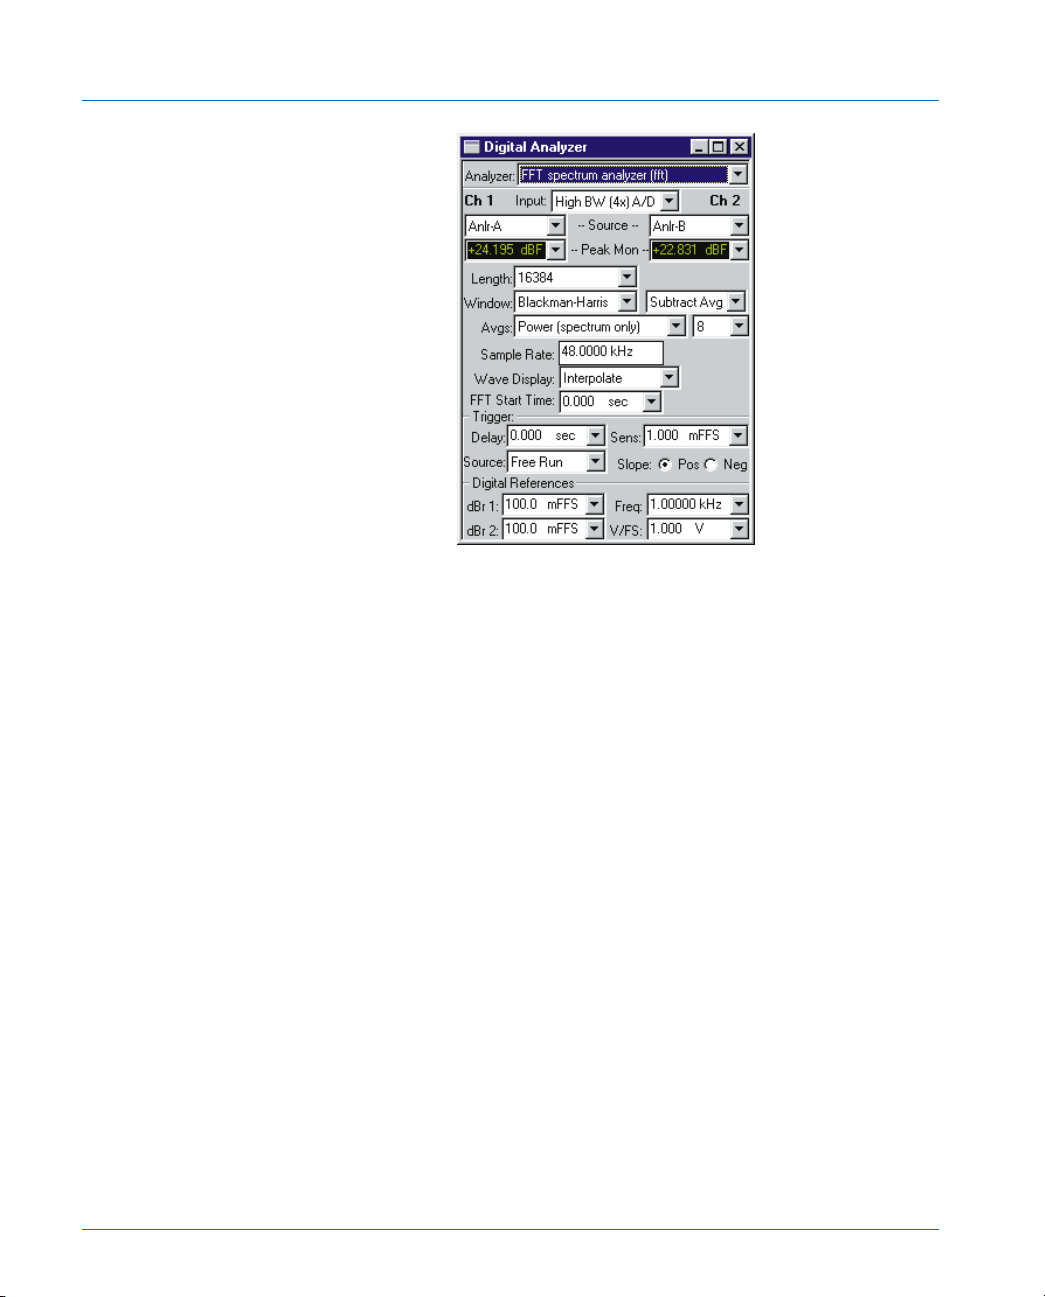
Noise Spectrum Analysis
Select A/D as the Input in the Digital Analyzer and 192k Sample
Rate on the Digital I/O panel.
Select Source on the Digital Analyzer panel as Anlr A and Anlr B
for either System One or Two. The FFT will receive signal from
the Analog Analyzer Level inputs after ranging.
On the System Two Digital Analyzer panel set FFT Length to
16384. Also Subtract Avg will remove any DC component or
extremely low frequency components of the signal. If a higher
number than one is chosen for Avgs, additional FFT samples are
taken. The power spectrum averaged data will lower the
variability of the random noise shown while repetitive
components are undisturbed. Do not use Synch averaging
(System Two) since this requires a discrete tone to use as a
synchronization reference. Power spectrum averaging is useful
for looking more closely at non-noise data that may be buried in
the noise. On System One select Maximum for FFT Length and
check Remove DC. Data averaging is not available in fftslide.
Averaging is available in Spectrum generator/analyzer (fftgen)
but the maximum sample rate is 48 ks.
Page 26 Compact Disc Player Tests – Application Note #1A
Page 36
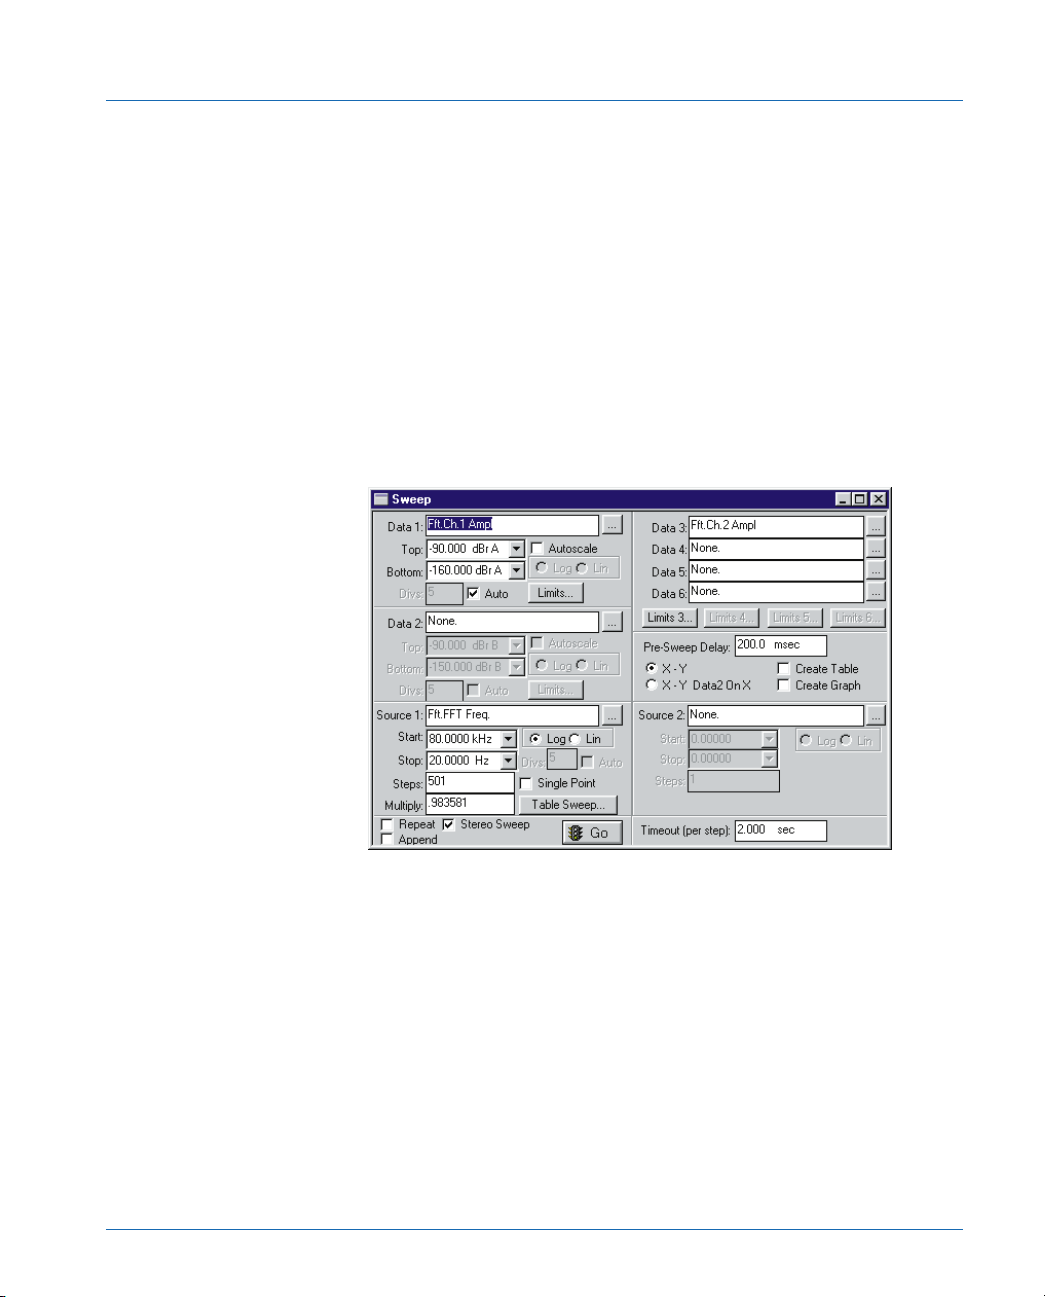
Noise Spectrum Analysis
b. On the Sweep panel set Data 1 to FFT.Chan.1 Ampl and select
dBr A for the Unit (dBr in System One). This will plot the noise
in dB below the output of the player when playing a
maximum-level track. Of course, the dBr value must be set at the
0 dBFS level as discussed previously. Next, check the Stereo
Sweep box so that the B channel data is taken as Data 3
(FFT.Chan.2 Ampl). Always fully set up Data 1 before selecting
the Stereo Sweep check box. The Top and Bottom fields on the
Sweep panel Data 1 of the graph should have low values. Top
of -90 dBr and Bottom of -160 dBr are reasonable. In the
Source 1 area of the Sweep panel select Fft.FFT Freq and a Start
value of 80 kHz and a Stop value of 20 Hz. Set the Steps value
to a high number for good sweep detail—500 or more.
Figure 6 shows the panels for an FFT to 80 kHz using FFT
Spectrum Analyzer of System Two. This test uses eight readings
to reduce the variance of random noise components so that
specific frequency spikes can be more clearly seen. This test is in
the distribution software as NoiseFFT.at2. A similar test without
reading averaging for System One is NoiseFFT.at1.
A variation of this test is useful for looking at mains and power
supply related interference. Set the A to D converter sample rate
to the 8 k sample rate by selecting Low BW(/4) A-D for Input
and set the Sample Rate to 32 kHz. Change the Sweep panel
Compact Disc Player Tests – Application Note #1A Page 27
Page 37
Noise Spectrum Analysis
Source 1 Start and Stop frequencies to low frequency values
such as 720 Hz to 10 Hz. The highest frequency possible with
this configuration is slightly below 4 kHz—half the sample rate.
Testing
First calibrate the dBr reference by playing a 0 dBFS track and set
the dBr reference (F4). Select a track with an “infinity zero” signal,
without emphasis if available, and Play the track. An FFT is made
when F9 or a GO button is pressed.
Audio Precision CD FFT Noise Spectrum 80 kHz - 20 Hz No filters, ref 0 dBFS 8 avgs
L
a
-90
n
d
-100
R
-110
d
-120
b
-130
r
e
-140
f
-150
0
d
-160
B
F
S
20 80k50 100 200 500 1k 2k 5k 10k 20k 50k
L and R Noise Spectrum "Infinity Zero"
Hz
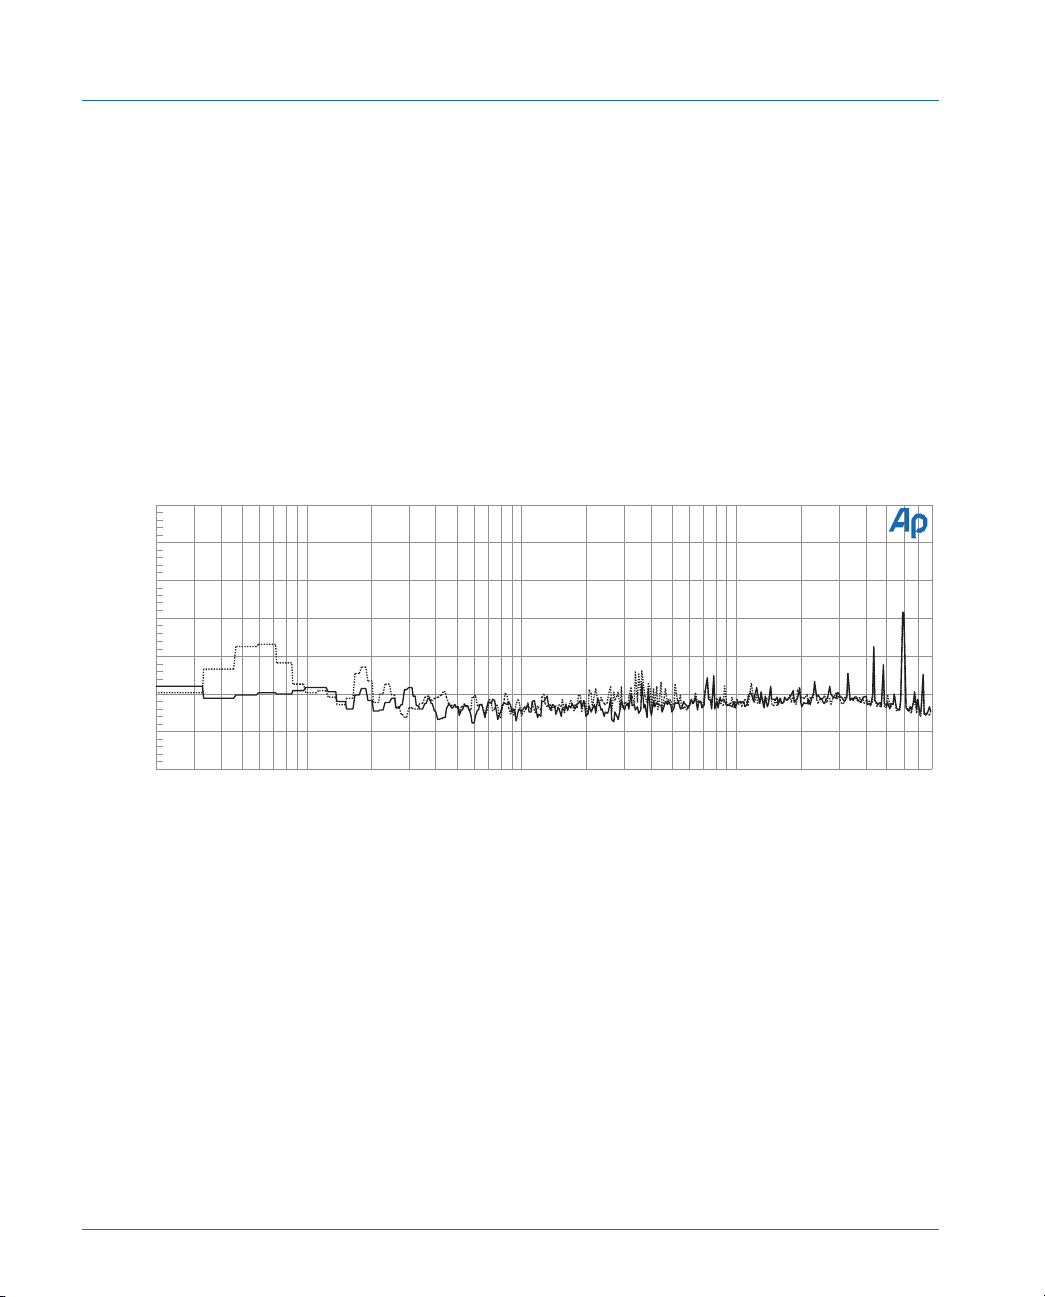
Figure 8 Graph of FFT of noise components - NoiseFFT.at2
Results
Figure 8 is the graph from a NoiseFFT test. The appearance of
mains (AC power) frequencies of 60 (or 50) Hz can indicate either
grounding connection problems or magnetic interference. Some mains
frequency interference is often not avoidable. The appearance of
second harmonic of the mains frequency is often associated with
inadequately filtered or shielded power supplies. Sometimes the
difference in these numbers indicates which channel is physically
closest to the power supply or AC mains entrance within the chassis.
Page 28 Compact Disc Player Tests – Application Note #1A
Page 38

Noise Spectrum Analysis
The computer monitor itself can be a major source of both mains
related interference and horizontal scan rate interference. In computer
monitors the vertical and horizontal rates are determined by the
monitor’s characteristics and signal configuration. In a similar way a
strong video source of interference can show a horizontal rate spike at
15,734 Hz for NTSC and 15,625 Hz for PAL video. An undithered
digital signal will display a lower noise floor than a correctly dithered
signal but it will also show spikes at every harmonic of the
fundamental. Another signature to be aware of is the presence of odd
harmonics as an indicator for the onset of clipping. The internal clock
frequencies of digital equipment and computers can beat against each
other and produce intermodulation products within the audio band.
Oversampling and sigma-delta converters often create spikes at a
multiple of the sample rate.
Analog Bandpass Filter Noise Analysis
For Systems without DSP ability, the Analog Analyzer in Bandpass
filter mode can produce useful, though less detailed, results. The
Bandpass filter may be swept by the Sweep panel and measure
narrowed (1/3 octave) bands of the noise level for evaluation of the
noise level. NOISSPEC.at1 or at2 (NOISe SPECtrum) displays the
noise bandpass spectrum to 20 kHz. If the analysis extends to
sufficiently high frequencies, it may also show signal leakage from an
internal CD clock at 44.1 kHz, 88.2 kHz (double oversampling), or
176.4 kHz (quadruple oversampling) frequencies. NoiSwpWB.at1 or
.at2 (Noise Sweep Wide Band) has an extended upper end to 200 kHz.
Setup
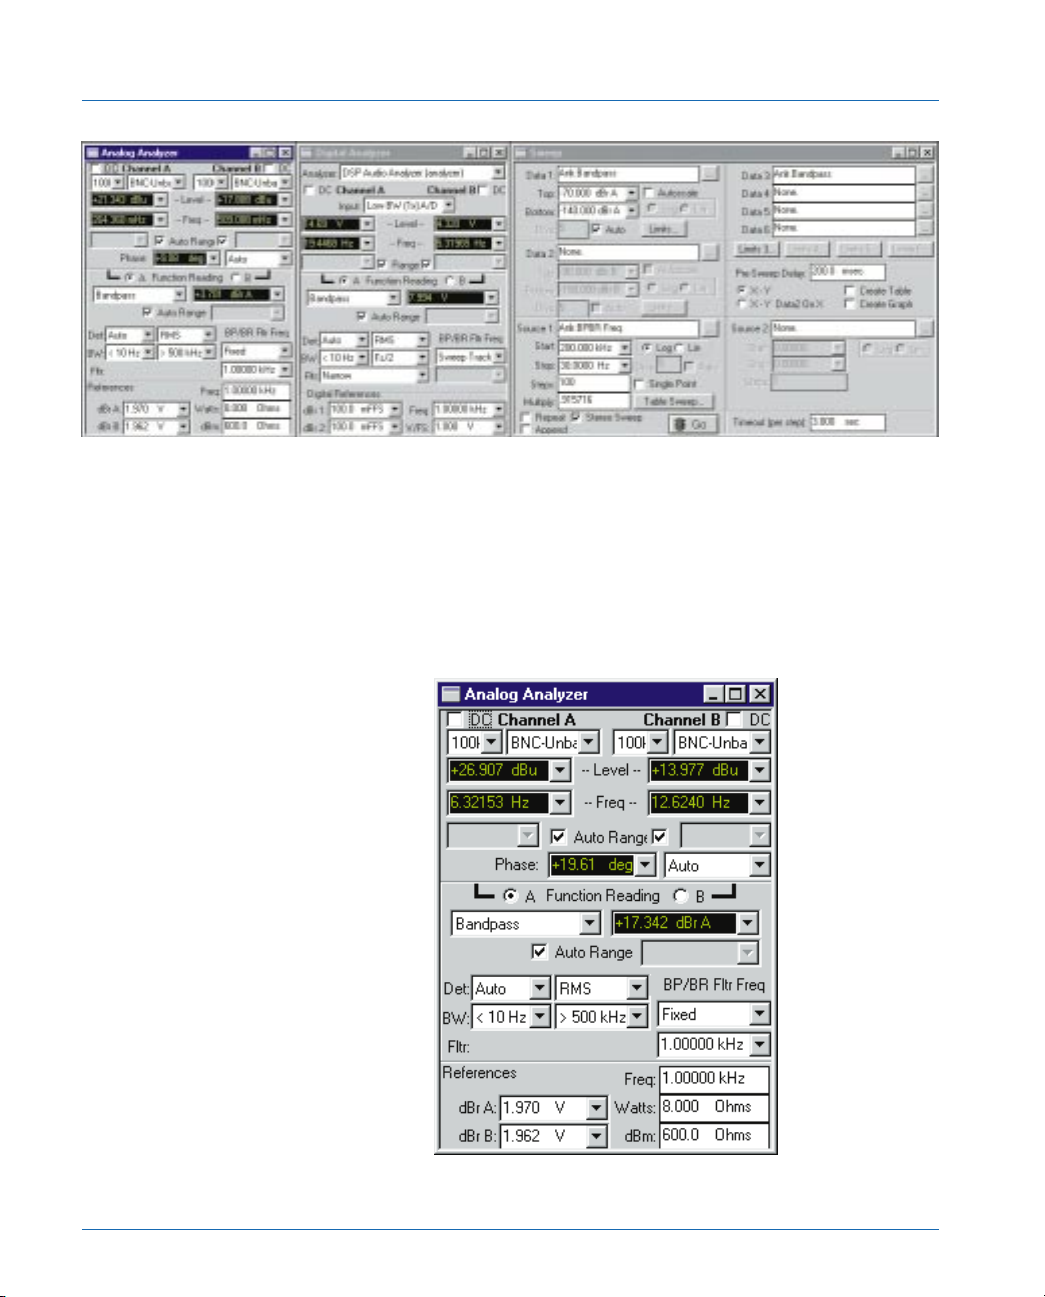
Figure 9 shows the panels for a spectral analysis to 200 kHz using
the Analog Analyzer Bandpass mode of System Two.
Compact Disc Player Tests – Application Note #1A Page 29
Page 39
Noise Spectrum Analysis
Figure 9 Set up panels for a Analog Analyzer Bandpass filter sweep to 200 kHz.
Key factors for analog bandpass spectrum analysis are:
a. On the Analog Analyzer select Bandpass as the Analog Analyzer
Function Reading meter measurement mode. Set the BP/BR Fltr
Freq drop-down list box to Fixed. This selection assures that the
Sweep Source 1 controls the bandpass filter frequency.
Page 30 Compact Disc Player Tests – Application Note #1A
Page 40
Noise Spectrum Analysis
No high-pass or low-pass filters are selected on the BW line in
the Analog Analyzer.
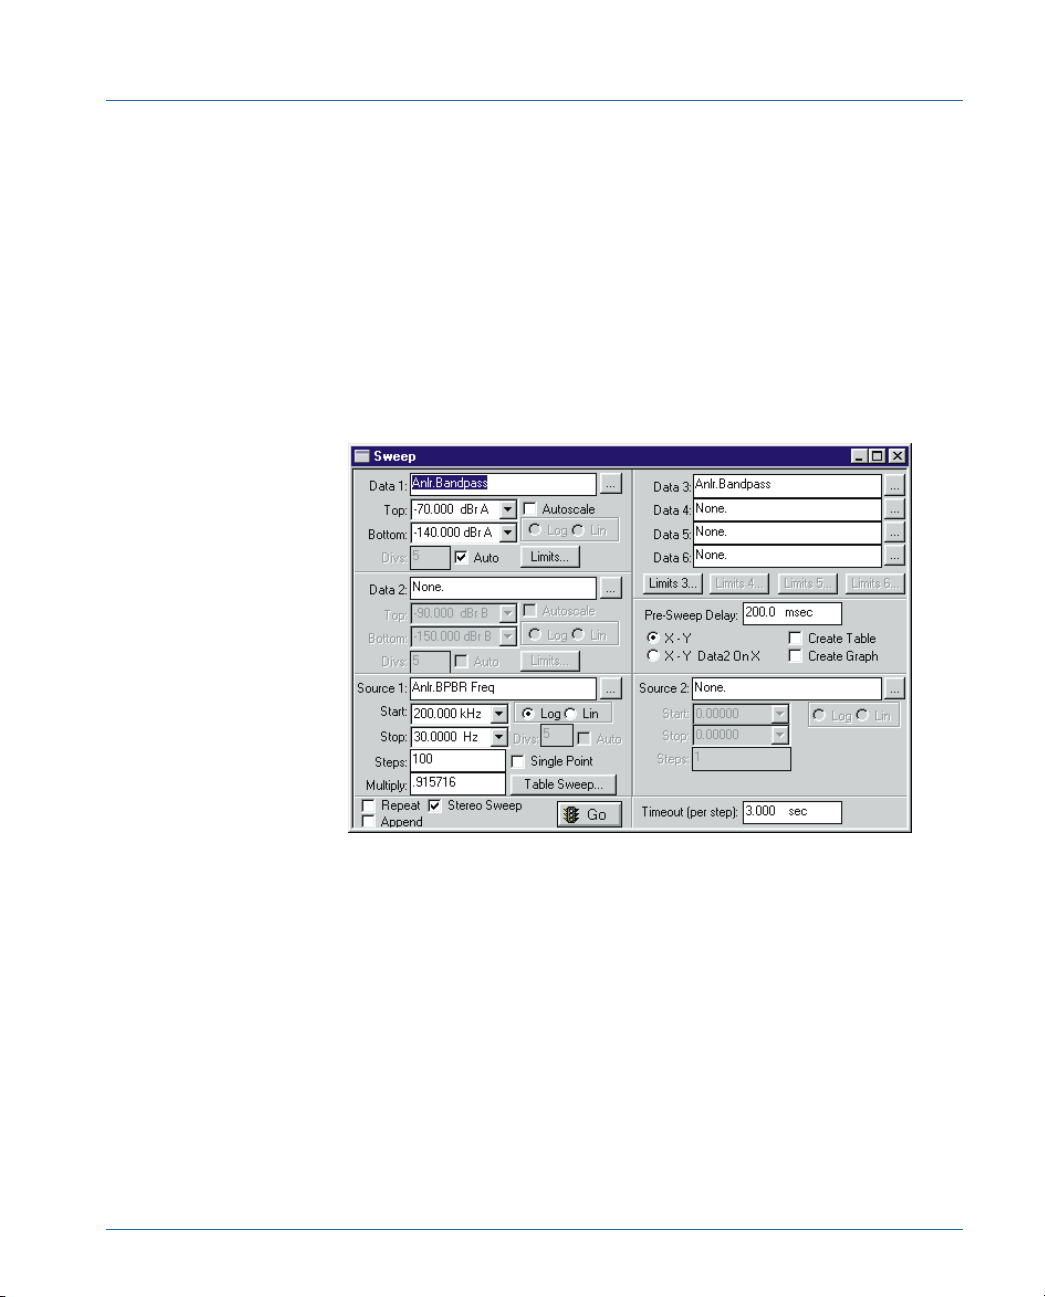
b. Sweep panel Data 1 is set to Anlr.Bandpass and select dBr to
plot the noise in dB below the output of the player when playing
a maximum-level track. The Top and Bottom fields on the
Sweep panel Data 1 of the graph should have low values. Top
of -70 dBr and Bottom of -140 dBr are reasonable. Next, check
the Stereo Sweep box so that the B channel data are taken as
Data 3. Always fully set up Data 1 before selecting the Stereo
Sweep check box. Data 1 and Data 3 are displayed with
Anlr.Bandpass, which is the bandpass-filtered signal.
Source 1 is selected as an (Anlr.BPBR Freq) sweep from 200
kHz to 30 Hz.
c. At low noise levels the amplitude measurements will normally not
repeat accurately from sample to sample due to the random
nature of noise. For faster settling and to avoid Timeout flags (a
“T” displayed at the top of the graph), set the Bandpass
Tolerance on the Settling panel to a relatively loose value such
as 10% (1 dB). This test setup is in NoiSwpWB.at1 or at2 in the
distribution files.
Compact Disc Player Tests – Application Note #1A Page 31
Page 41
Noise Spectrum Analysis
dBFS track and set the dBr reference (F4). Select a track with an
“infinity zero” signal, without emphasis if available, and Play the track.
A sweep is done when F9 or a GO button is pressed. The bandpass
filter first sweeps Channel A, switches the Function Reading meter to
Channel B and then sweeps Channel B.
Testing
First calibrate the Analog Analyzer dBr reference by playing a 0
L
-70
a
n
-80
d
R
-90
d
-100
B
-110
r
e
-120
f
0
-130
d
B
-140
F
S
30 200k50 100 200 500 1k 2k 5k 10k 20k 50k 100k
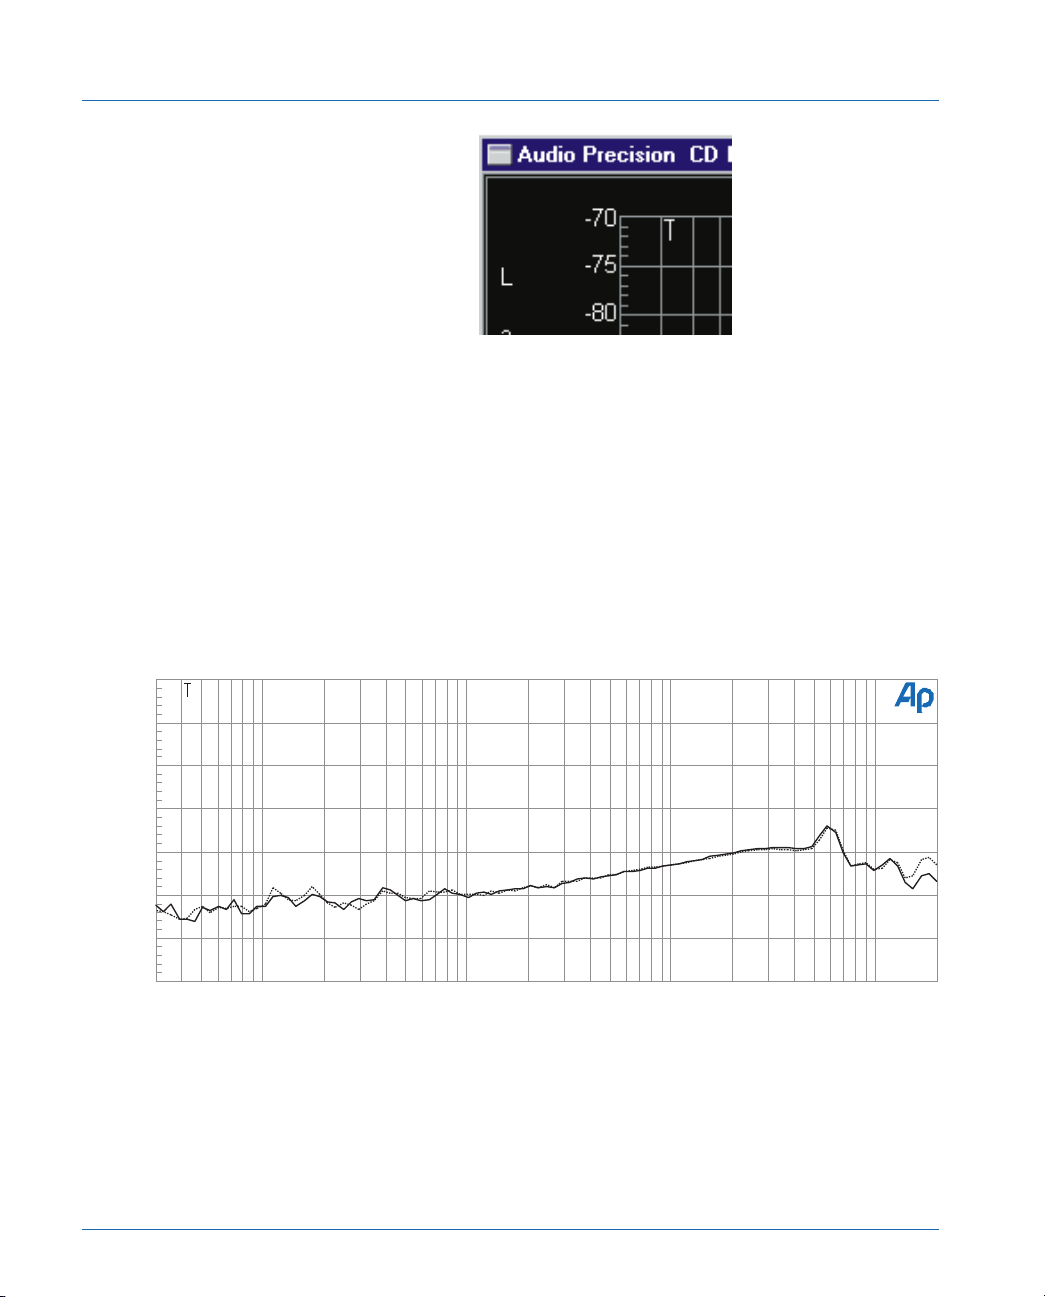
Noise Spectrum - Analog Bandpass Filter
Hz
Figure 10 Analog Function Reading meter Bandpass filter sweep of noise to 200 kHz - See the discussion
after the FFT noise spectrum in the previous section on interpretation of results.
Audio Precision CD Noise Spectrum 200 kHz - 30 Hz No filters, 0 dBr = 0 dBFS
Page 32 Compact Disc Player Tests – Application Note #1A
Page 42

D-to-A Converter Noise
D-to-A Converter Noise
D-to-A converters normally are in a muted state when the digital
signal is zero (infinity zero) so a traditional signal-to-noise
measurement will measure only the analog circuit performance after
the muted stage. Dynamic Range is a test for measuring the noise floor
while the D-to-A converter is active with a low level signal.
Quantization noise is tested using a low frequency full scale 0 dBFS
signal. FFT analysis of the residual components of either of these test
approaches can be done using the LoLvlFFT (.at1 or .at2) test
described in the Distortion and Linearity section.
Dynamic Range
Some testing methods define dynamic range measurement of a CD
player as a THD+N measurement on a -60 dB track, corrected by
adding 60 dB. Document CP-307 of the Electronic Industries
Association of Japan (EIAJ) list this specification. This method
eliminates any distortion introduced at higher levels in the CD player.
This test is a more valid measurement of actual operating noise since
the D to A converter is active due to the presence of signal and,
consequently, no muting occurs as is the case with an infinity zero
track.
Compact Disc Player Tests – Application Note #1A Page 33
Page 43
D-to-A Converter Noise
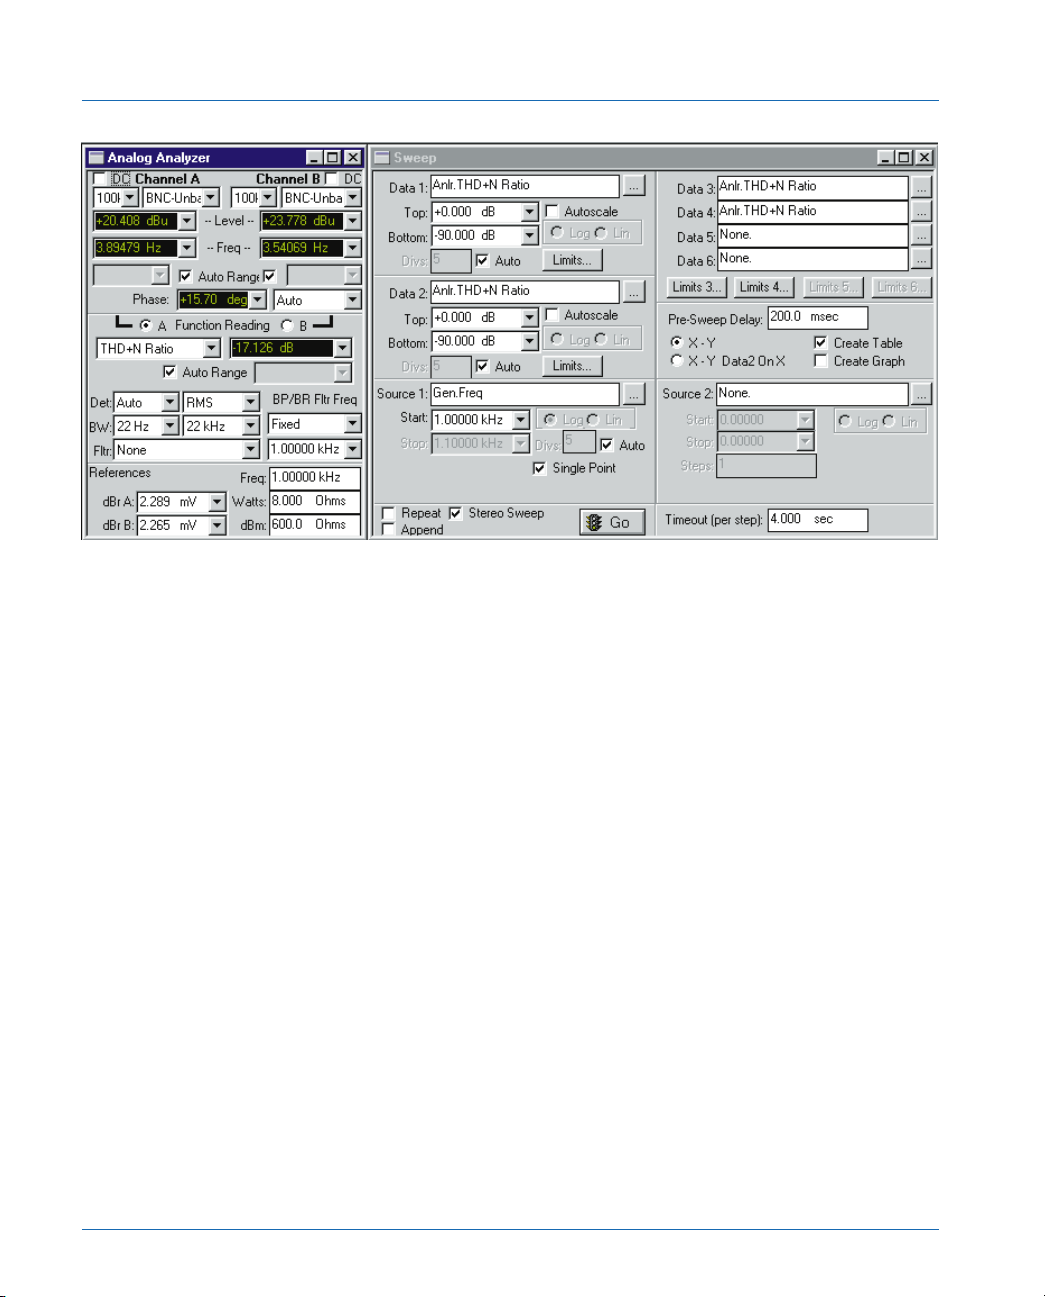
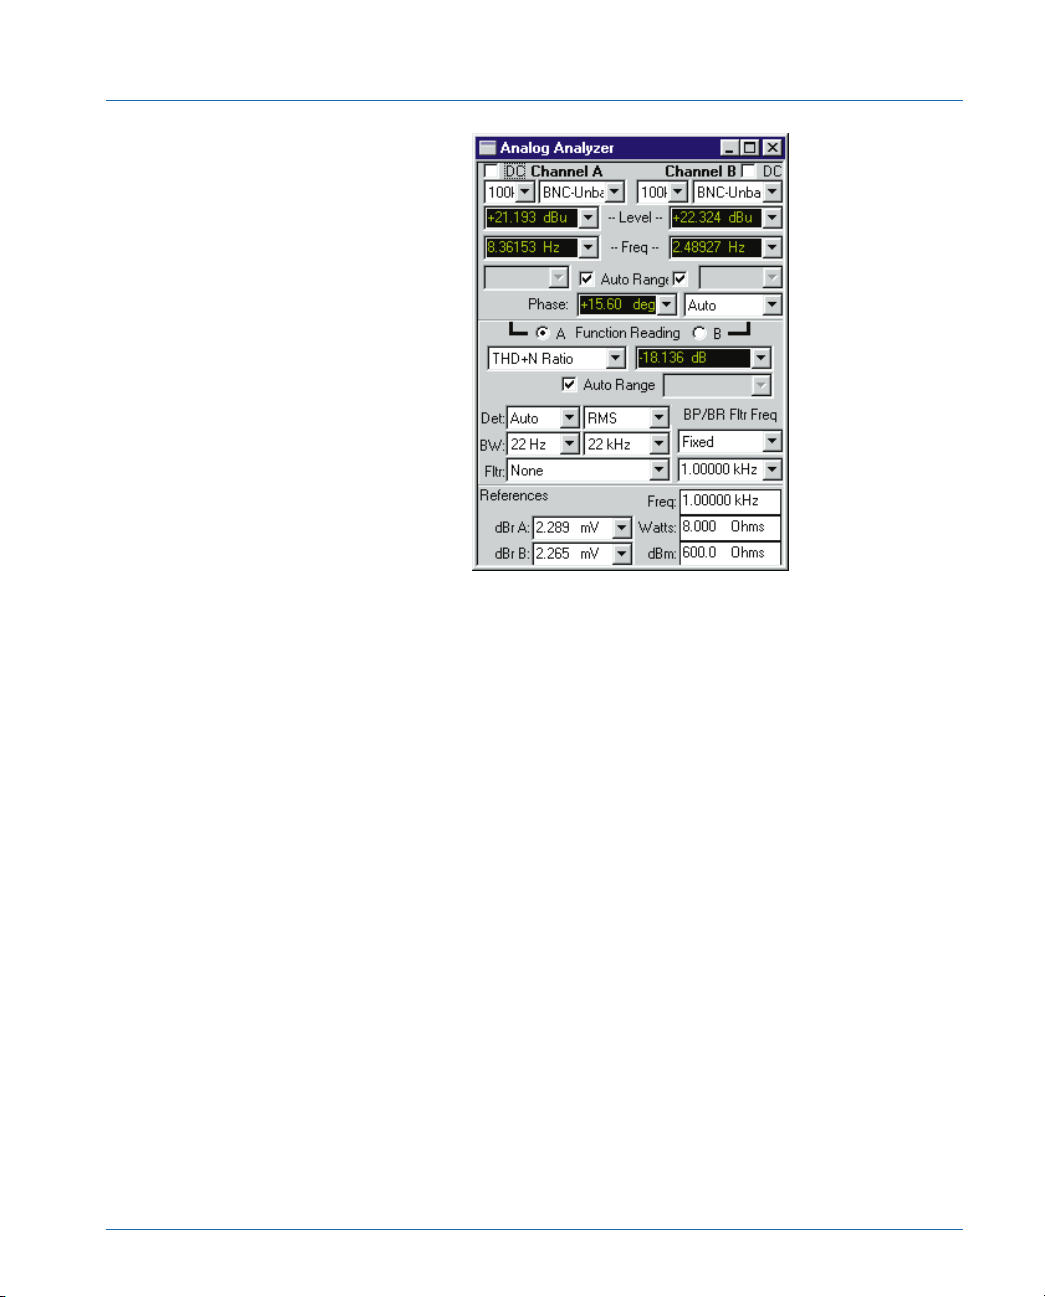
Figure 11 Dynamic Range test panels - Results of a measurement using the -60 dB 1 kHz track 5 of the
CBS disc. The Data Editor displays the original data for channel A and B in Data 1 and 3 and the adjusted
data in Data 2 and 4. After the measurement Data 2 and Data 4 are automatically adjusted by Compute
Delta adding 60 dB, which should result in dynamic range measurements in the 90 plus dB range.
Figure 11 shows the test setup to make a single point measurement
directly with System Two. Key factors for Dynamic Range testing are:
a. On the Analog Analyzer panel select THD+N Ratio and Channel
A for the Function Reading meter. Fixed and 1.000 kHz should
be selected in the BP/BR Fltr Freq fields. This will steer the notch
filter used by the THD+N Function Reading meter accurately to
the -60 dB tone frequency. The 22 kHz low-pass filter and RMS
detector should be selected. The other bandwidth limiting
optional filters discussed under noise and THD+N
measurements would also be appropriate here. The A-weighting
filter is specified by the EIAJ for this test, since it is really more
akin to a noise measurement than a distortion measurement and
it is desired that the results be directly comparable to A-weighted
noise measurements. The optional A weight filter is required for
this specification (part number FIL-AWT).
Page 34 Compact Disc Player Tests – Application Note #1A
Page 44
D-to-A Converter Noise
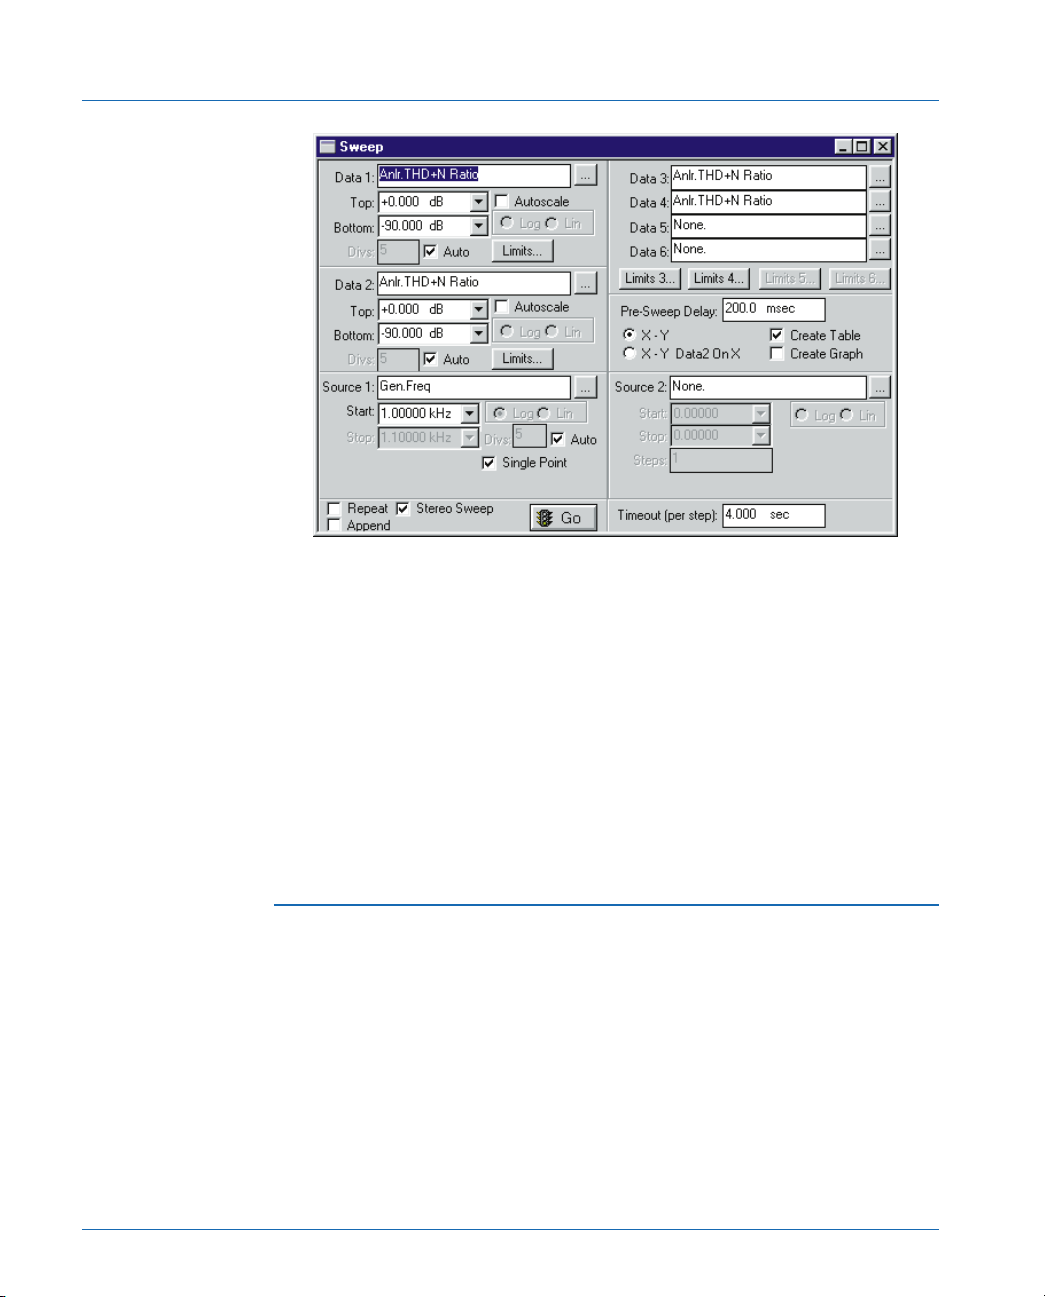
b. This test provides an example of the use of multiple copies of the
same data in different columns so that post-sweep computation
can be done. On the Sweep panel select Anlr.THD+N Ratio for
Data 1 and Data 2 and dB as the unit for both. Check Single
Point in the Source 1 area and the Stereo Sweep check box at
the bottom. In this test Channel A data will be taken in both
Data 1 and Data 3 and Channel B measurements in Data 2 and
Data 4. Source 1 is set as Gen.Freq with the test frequency of 1
kHz entered in the Start field. The value entered into the Source
1 Start field appears as the first column value for the only row of
readings taken in this test. This provides a record of what
source-tone frequency was used.
Compact Disc Player Tests – Application Note #1A Page 35
Page 45
D-to-A Converter Noise
c. In the Compute Delta drop-down a Delta file has been specified
that was made with the Data Editor and Saved as a Data (.ada)
file. This file (60dB.ada) has values of 60 dB in the two data
columns; the (only) row is given as 1000 Hz. Compute Delta
automatically applies these values to the data taken in the Data
2 and Data 4 columns with Apply after Sweep right after the test
is done. This test is supplied as DYNRANGE.at1 or .at2
(DYNamic RANGE). The test also requires the data file
60db.ada which is the reference file for the Compute Delta
operation.
Quantization Noise
Quantization noise measurement in a digital system also differs
fundamentally from noise measurement on a quiet (infinity zero) track
by exercising the D-to-A converter with a 0 dBFS low frequency signal.
A maximum amplitude (zero dBFS) signal must be played to properly
measure quantization noise. This single point measurement also uses
THD+N Amplitude on the Function Reading meter to remove the
fundamental component of this signal. In this test all low-to-moderate
order harmonics are also removed with a high-pass filter in order to
prevent actual harmonic distortion products from obscuring the
Page 36 Compact Disc Player Tests – Application Note #1A
Page 46
D-to-A Converter Noise
quantization noise measurement. A zero dB level track with a low
frequency signal, preferably 20 Hz or lower, must be selected. On the
CBS disc track 6 index 3 is 17 Hz. NAB track 15 is 20 Hz. Philips
SBC429 track 9 is 16 Hz. On the Denon disc the left track is 26 and
the right is 27, both are 21.5 Hz. Uncheck Stereo Sweep if using the
Denon disc source.
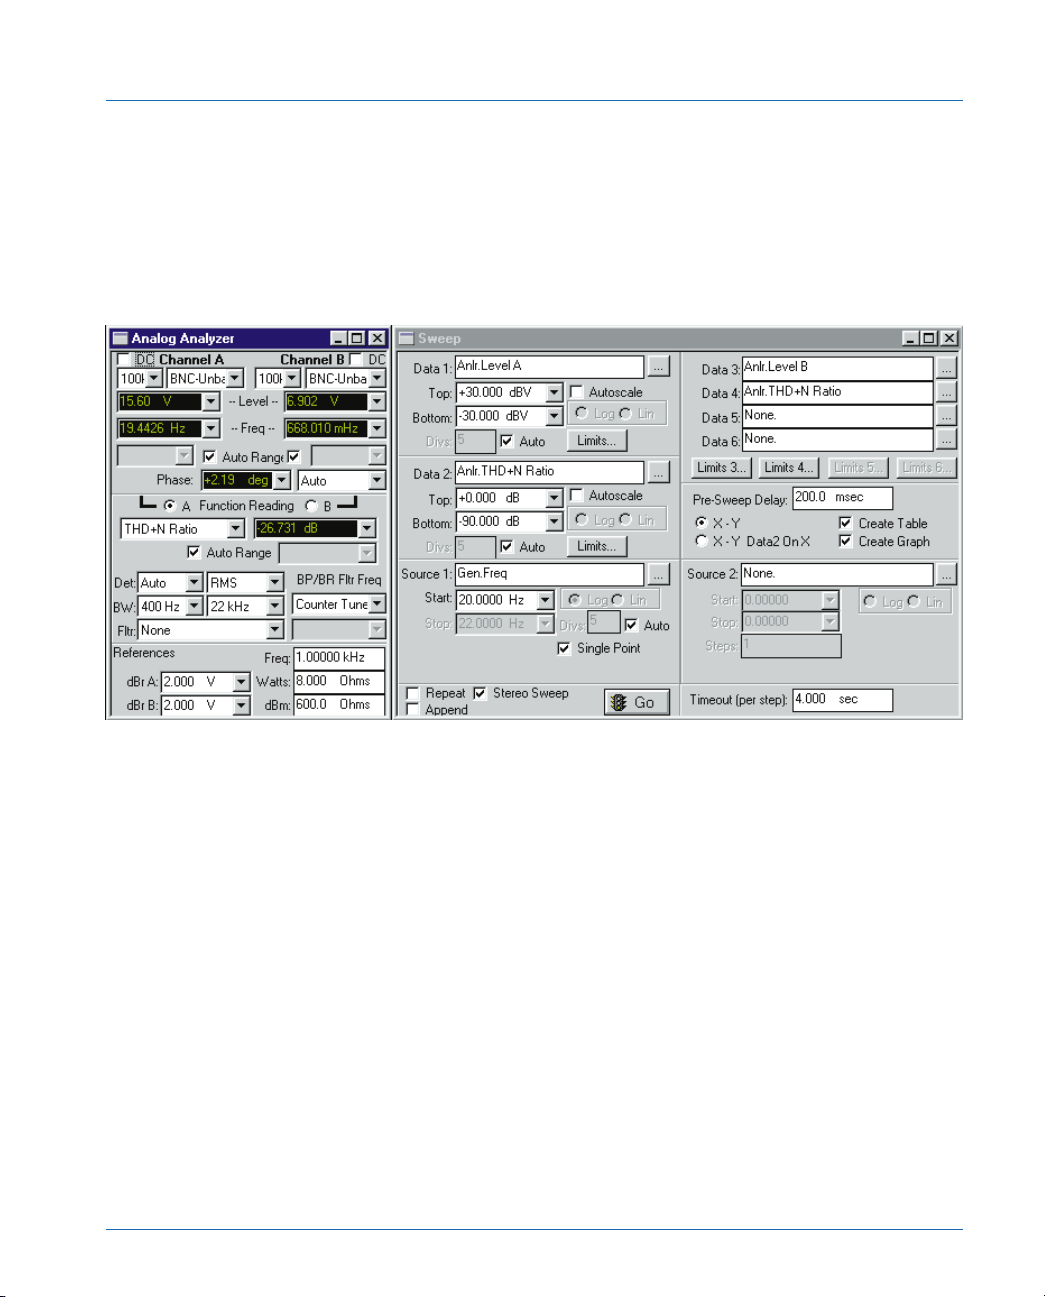
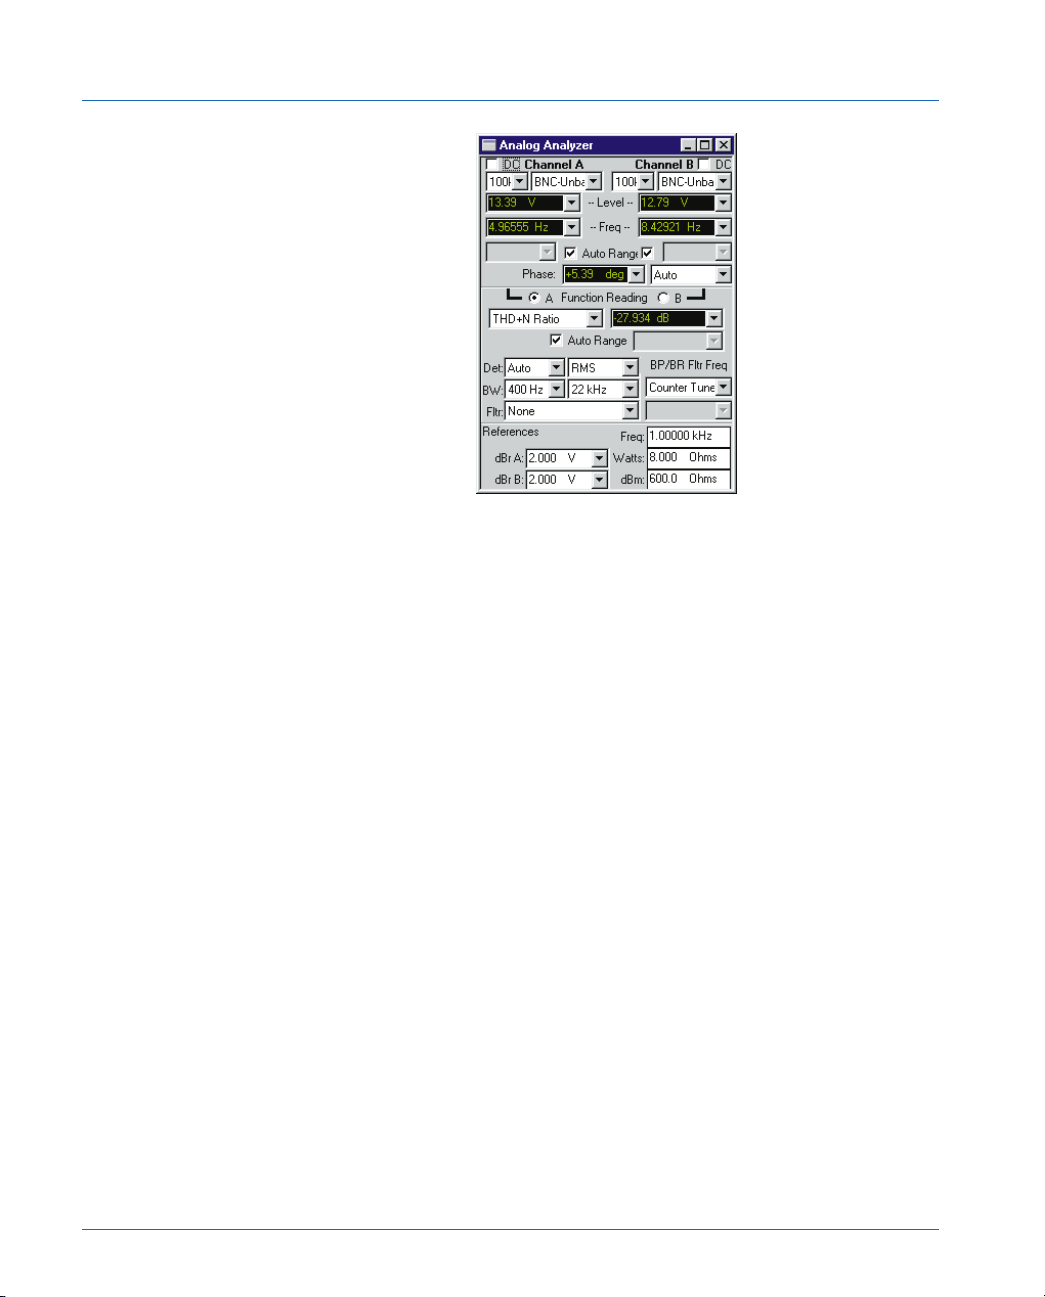
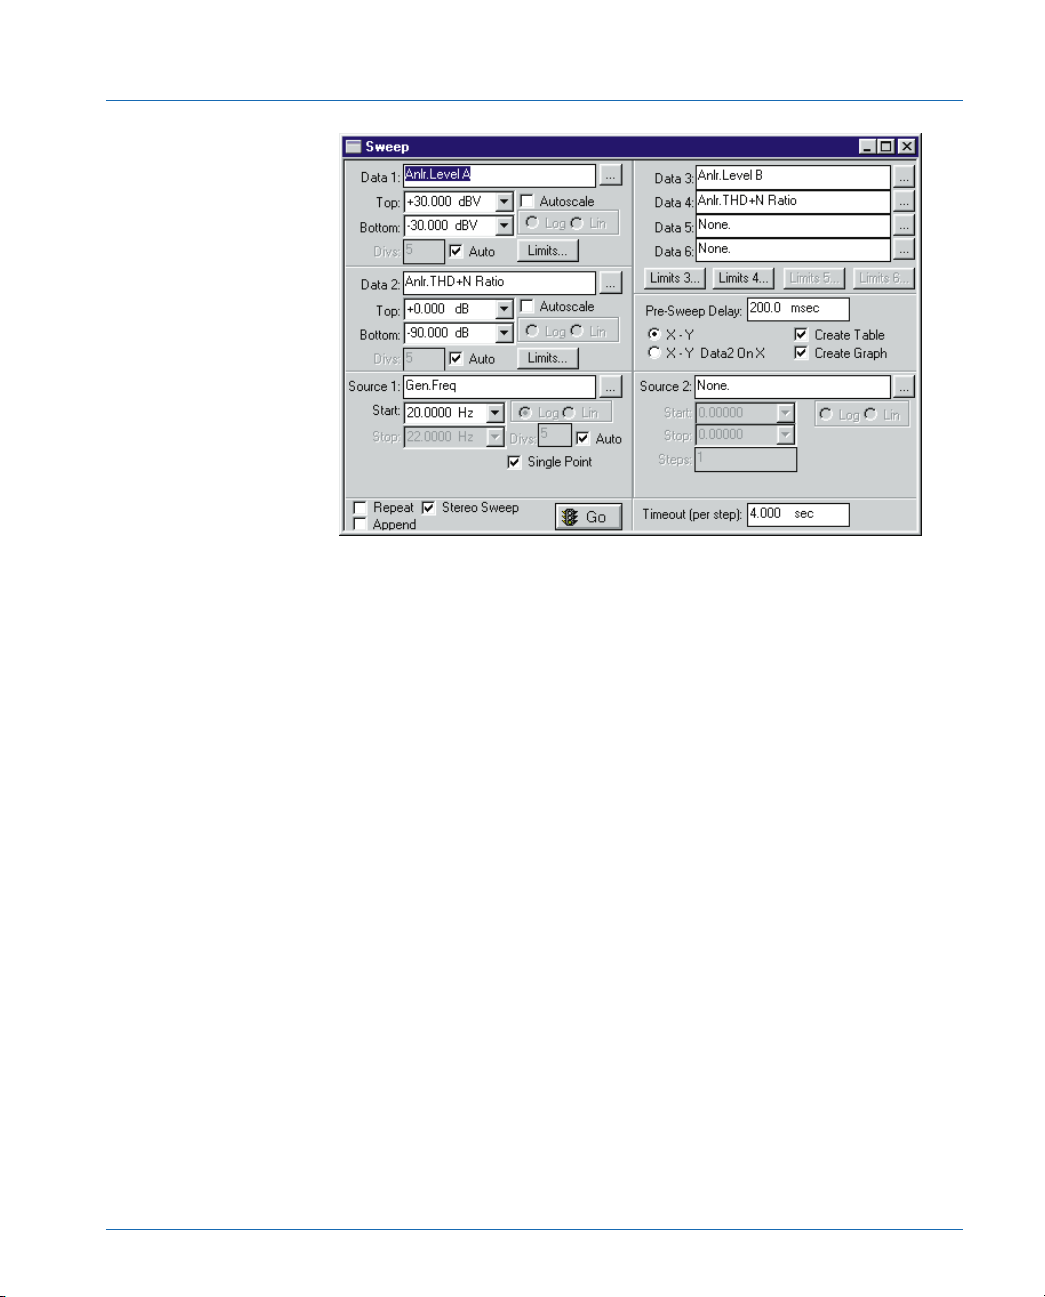
Figure 12 shows the Quantization Noise test panel setups and the test results in the Data Editor. This test is
supplied as QNTZNOIS.at1 or .at2 (QuaNTiZation NOISe) in the distribution files.
Setup
a. On the Analog Analyzer panel select THD+N Ratio for the
Function Reading meter. The BP/BR Fltr Freq should be set to
Counter Tuned to respond to the low frequency fundamental
used as the test tone. The 400 Hz high-pass filter selection
attenuates low and moderate order harmonics of the 20 Hz
signal before the Function Reading meter; any signals below 200
Hz will be attenuated by 20 dB or more. Only quantization noise
across the audio spectrum above 400 Hz up to the 22 kHz filter
low pass filter cutoff will be measured.
Compact Disc Player Tests – Application Note #1A Page 37
Page 47
D-to-A Converter Noise
b. On the Sweep panel select Anlr.THD+N Ratio as Data 1 and dB
as the unit choice. At Data 2 choose Anlr.Level A and select an
appropriate unit such as dBV, V. or dBu. Check the Stereo
Sweep box. A Single Point selection at Source 1 provides a
single spot measurement on each channel, as shown in Figure
12. Also type in the CD track frequency used in the Source 1
Start field so that it will appear included in the Data Editor in the
left hand column. This will display the complete test results and
signal conditions in the five Data Editor columns after running
the test.
For a more detailed analysis of the noise components using
FFTs see the test description in FFT Noise Analysis. The low
level residual FFT spectrum analysis file LoLvlFFT.at1 or .at2
may be used with Quantization Noise test tracks to display the
residual spectrum relative to 0 dBFS. In this case the source
signal from the CD should have frequency above 15 Hz so that
the low frequency bandpass of the System does not make
control of the notch filter frequency too difficult.
Page 38 Compact Disc Player Tests – Application Note #1A
Page 48
D-to-A Converter Noise
Compact Disc Player Tests – Application Note #1A Page 39
Page 49

Distortion Measurements
another by measurements of a complete CD player, but inferences can
often be made. Analog section distortion is likely to make the greatest
contribution at maximum signal levels. Analog noise can be separated
from digitally generated noise sources by measuring an “infinity-zero”
track, as described earlier. Measuring THD+N vs. amplitude can show
D-to-A converter problems.
Distortion Measurements
Sources contributing to distortion and noise in a CD player include:
1. The theoretical quantization distortion and noise of the D-to-A
conversion process. This is a direct function of the number of
bits in a linear PCM system, such as a CD, with -98.08 dB being
the theoretical value for 16 bits. Dither in the recording process
can convert quantization distortion to quantization noise by
redistributing the quantization error energy from specific
harmonics into a broad distribution similar to white noise. The
CBS and Philips SBC429 test discs include dithered signals.
2. Distortion due to practical imperfections of the D-to-A
3. Distortion and noise in the sample and hold circuitry
4. Non-linearity and noise in the analog sections
Most of these mechanisms cannot be cleanly separated from one
THD+N versus Frequency
Setup
Key factors for a THD+N distortion versus frequency test are:
a. Select THD+N Ratio for the Function Reading meter mode on
the Analog Analyzer panel, with dB or percent as units. Select
the RMS detector. Make an appropriate choice of low-pass filter
frequency in the BW line. The 22 kHz selection will produce
maximum rejection of the CD player clock and out-of-band
components. More rejection of these signals can be obtained by
use of the optional 20 kHz low pass filter (part number
FLP-20000) with 50 dB rejection at 40 kHz. Also available is a
“Brick wall” 20 kHz low pass filter (FLP-A20K) with 35 dB
Page 40 Compact Disc Player Tests – Application Note #1A
Page 50
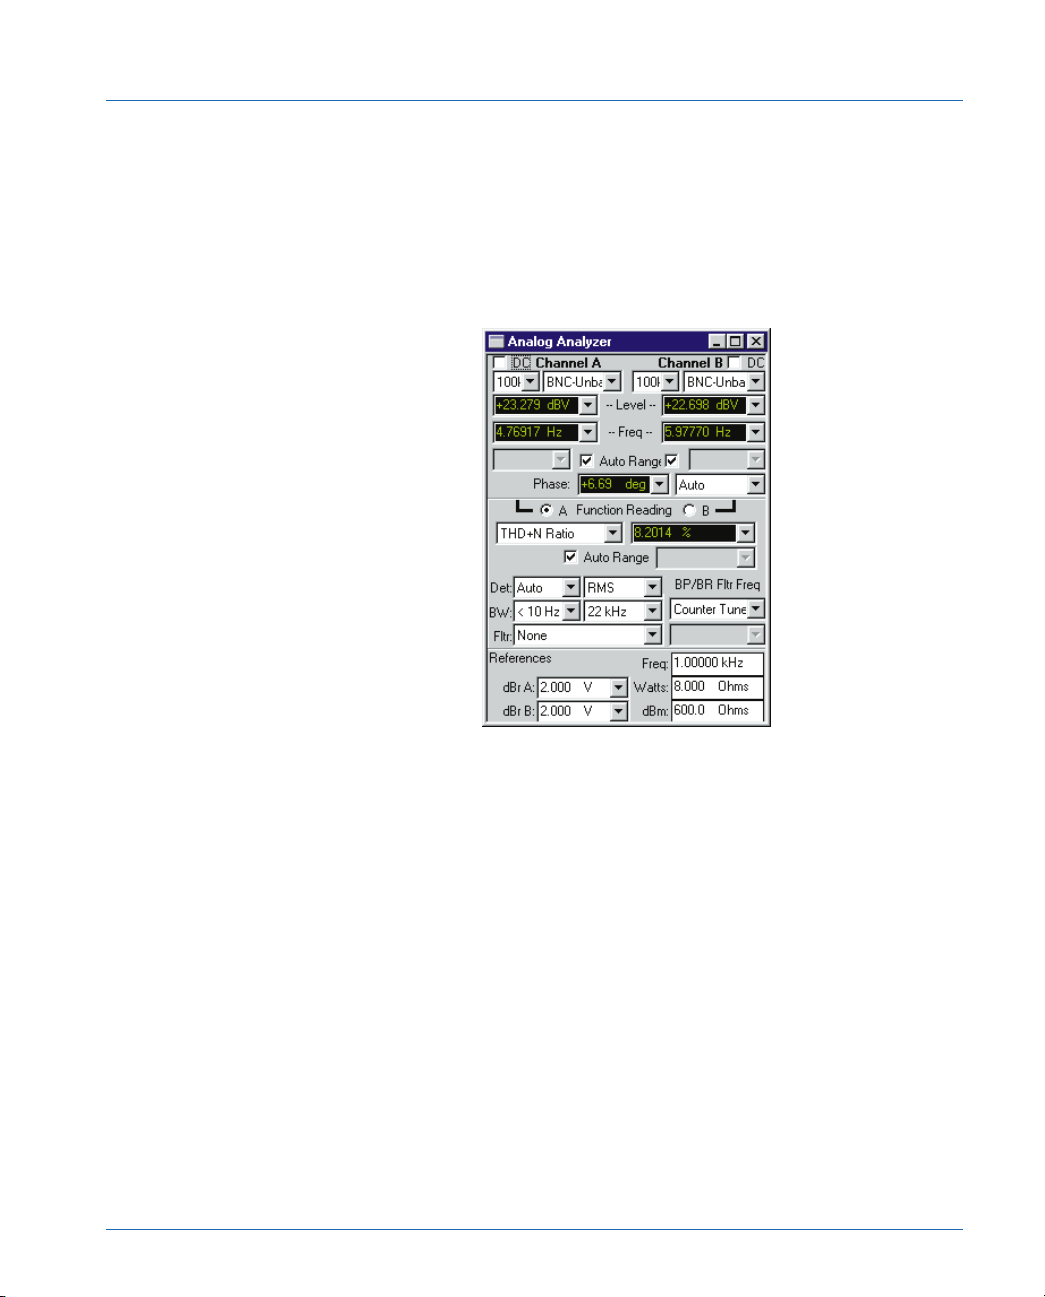
Distortion Measurements
attenuation at 24 kHz and over 90 dB beyond 30 kHz. If a
weighted measurement is required select the desired installed
weighting filter in the Fltr window. Note that only one option
filter may be used at a time. The frequency of the THD+N notch
filter should be set by the frequency counter while measuring the
input. To do this, set BP/BR Freq to Counter Tuned in the
drop-down list box.
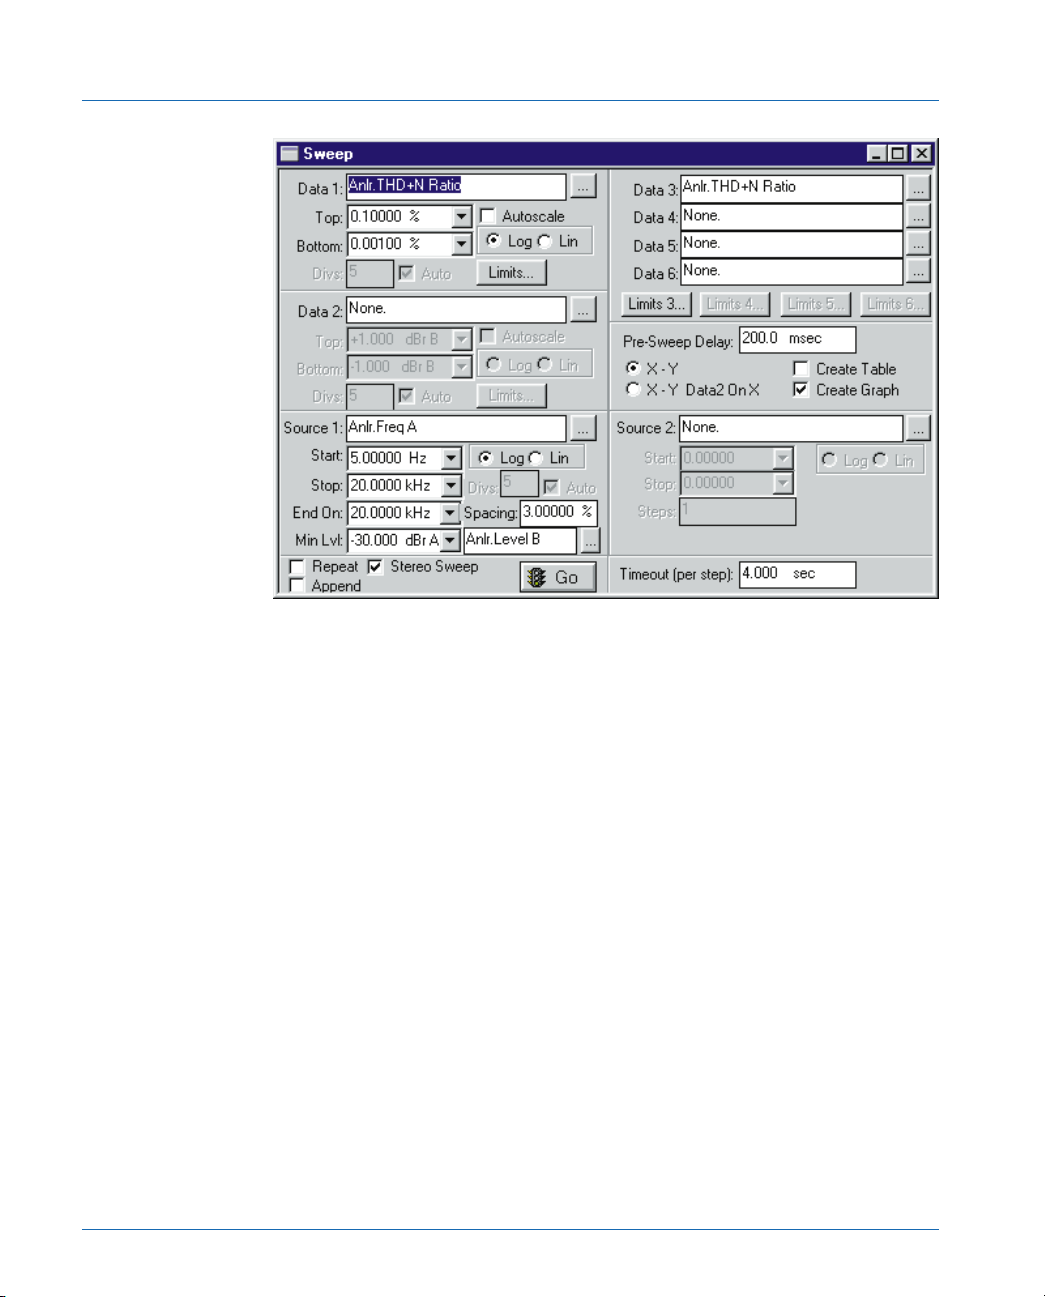
b. On the Sweep panel select Anlr.THD Ratio as the displayed
measurement at Data 1. Appropriate values of Data 1 Top and
Bottom for most CD players are 0.1% and 0.001% or -60 dB
and -100 dB, respectively. Check the Stereo Sweep check box
instead of setting Data 2 to “Anlr.THD Ratio” so that both
channels will be measured and plotted at each step of the
frequency sweep. The second channel data will be in Data 3. Set
Source 1 to Anlr.Freq A for System Two or Anlr.Freq for System
One. Figure 13 shows the panels for this test.
Compact Disc Player Tests – Application Note #1A Page 41
Page 51
Distortion Measurements
Figure 13 Distortion (THD+N) versus Frequency test set up panels - THDFREQ.at2
Data 1 (and 3) may also either % or dB.
Testing
Select the first track (lowest frequency) of the series of tracks
recorded at 0 dBFS level. Press F9 and Play the CD. Watch the graph
for plots of newly measured points on both channels and advance the
player to the next track (or the next index point if the test disc used has
multiple indexed sections within a track). If the Data Editor is displayed
the readings can be seen accumulating. Following the final track in the
series, you may save the test setup and results or optimize the display
by right clicking the mouse and choosing Optimize Left. Figure 14 is a
THD+N measurement using System One’s 22 kHz low-pass filter. This
test setup and data are stored as THDFREQ.at1 or .at2 in the
distribution files available as a companion to this applications note.
Page 42 Compact Disc Player Tests – Application Note #1A
Page 52
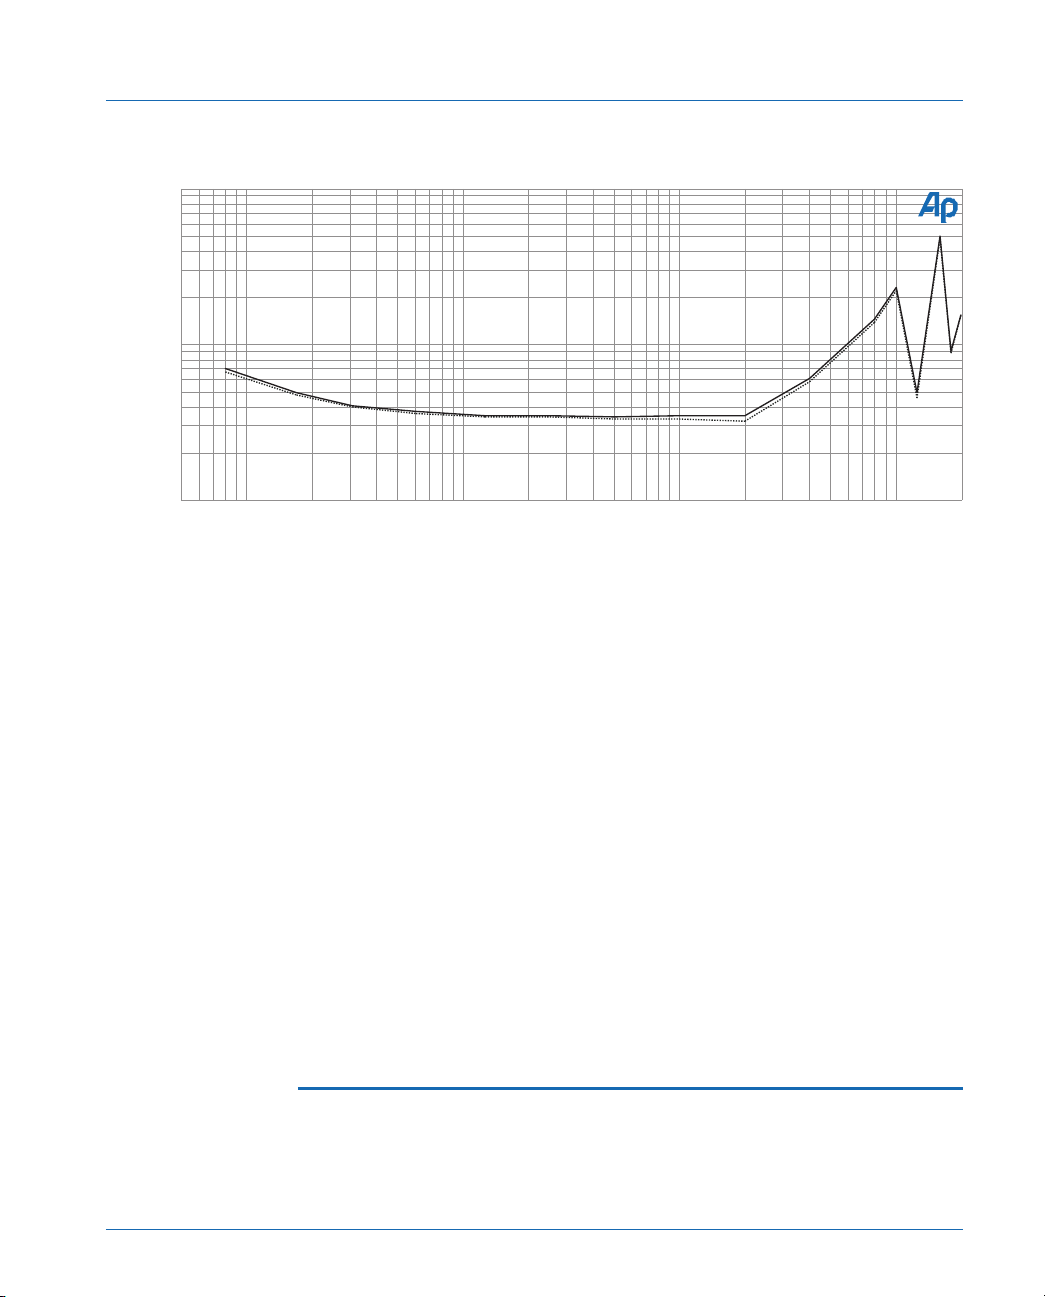
Audio Precision CD TotalHarmonic Distortion + Noise (THD+N) vs. Frequency
0.1
0.05
T
0.02
H
D
+
0.01
N
%
0.005
0.002
0.001
6 20k10 20 50 100 200 500 1k 2k 5k 10k
DISTORTION (THD+N) vs. FREQUENCY
Figure 14 Distortion vs. Frequency graph (THDFREQ.at2)
Results
Note that the levels of THD+N obtainable from good CD players
(0.0025% to 0.003%, or -90 to -92 dB) are lower than those
measurable through a complete digital recording (A-to-D) and
playback (D-to-A) cycle with professional 16-bit PCM or 16-bit
consumer machines such as RDAT. This is because most of the signals
on the test CDs never existed as an analog signal and thus never
passed through the theoretical and practical imperfections of A-to-D
conversion. Instead, the test CDs contain computer-generated signals
whose total RMS quantization error is at the theoretical levels. Dither is
not used on any of the high amplitude tracks on any of these test discs.
The distortion measured thus results from theoretical quantization
distortion and noise in the D-to-A conversion plus imperfections in the
D-to-A conversion and non-linearity in the analog sections of the
player.
Distortion Measurements
Hz
Low Level Spectral Analysis
Another approach to quantization distortion measurement is to
perform spectral analysis of the CD player’s signal, thereby separating
Compact Disc Player Tests – Application Note #1A Page 43
Page 53

Distortion Measurements
broadband quantization noise from discrete harmonic distortion. The
ability of Audio Precision Systems to do an FFT analysis of the output
of the Analog Analyzer Function Reading meter allows a very detailed
look at the distortion components of a signal after the THD+N notch
filter has removed the fundamental frequency. In LoLvlFFT.at1 and
.at2 a THD+N measurement is set up in the Analog Analyzer Function
Reading meter and the Digital Analyzer has Anlr Rdg Ampl selected for
the channel 1 Source. The graph range of 60 to 160 dBFS is
appropriate for the results of this FFT analysis. If the FFT is set for a
number of spectrum averages the random noise component is reduced
in the results so that the actual distortion or other interference
components can be clearly seen even at extremely low levels.
is the discrete tone THD test. The Analog Analyzer is set up as it is in
the THDFREQ. Test—see Figure 13.
Setup
The basis for the low level residual FFT tests LoLvlFFT.at1 and .at2
The additional key factors are:
a. Digital Analyzer is the FFT Spectrum Analyzer (fftslide in System
One). The Ch 1 Source is set to Anlr Rdg Ampl and Ch 2 Source
is None. This means the FFT analyzer will be looking at the
output from the Analog Analyzer after the notch filter doing the
THD+N analysis has removed the fundamental tone. This
results in the input to the A to D converter being scaled by the
peak value of the resulting distortion components (and noise) so
that a “magnified” FFT of that amplitude range is produced. The
remainder of the Digital Analyzer panel is set up in the same way
as in the NoiseFFT tests above.
b. Data 1 should be set to Fft Ch1 Ampl with units and Top and
Bottom values of -60 to -160 dBr A. Source 1 is set to the 20 Hz
to 20 kHz range. The Lin (linear) check box is often chosen since
harmonically related frequencies appear as easily seen multiples.
To view a particular fundamental’s related harmonics you can
change the Source 1 sweep range to scale conveniently the
frequency harmonics of interest.
Page 44 Compact Disc Player Tests – Application Note #1A
Page 54
Distortion Measurements
Last check the Stereo Sweep box at the bottom of the Sweep
panel. In this configuration the FFT data are taken through the Analog
analyzer notch filter sequentially one channel at a time. The Analog
Analyzer switches inputs after the first channel’s FFT is done and
acquires the second channel FFT. If multiple acquisitions are
requested, as for power spectrum averaging, all of the acquisitions are
done before the Analog Analyzer switches channels.
Testing
This test is designed to view the frequency components of a single
tone. From the discrete frequencies used for the THD+N versus
frequency test select a tone. Play the selected track and acquire the
FFT sample by using F9. If averaging is being used there will be
additional acquisitions—see lower left corner of the APWIN window
after the F9 button has been keyed.
Audio Precision CD THD+N Residual Spectrum 4 Power spectrum averages
-60
-70
-80
-90
d
-100
B
-110
r
-120
A
-130
-140
-150
-160
2k 20k4k 6k 8k 10k 12k 14k 16k 18k
THD+N FFT Spectrum after Notch filter
Hz
Figure 15 FFT (LoLvlFFT.at2) of the low level after the 4 kHz fundamental has removed in the Analog
Analyzer.
Compact Disc Player Tests – Application Note #1A Page 45
Page 55

Distortion Measurements
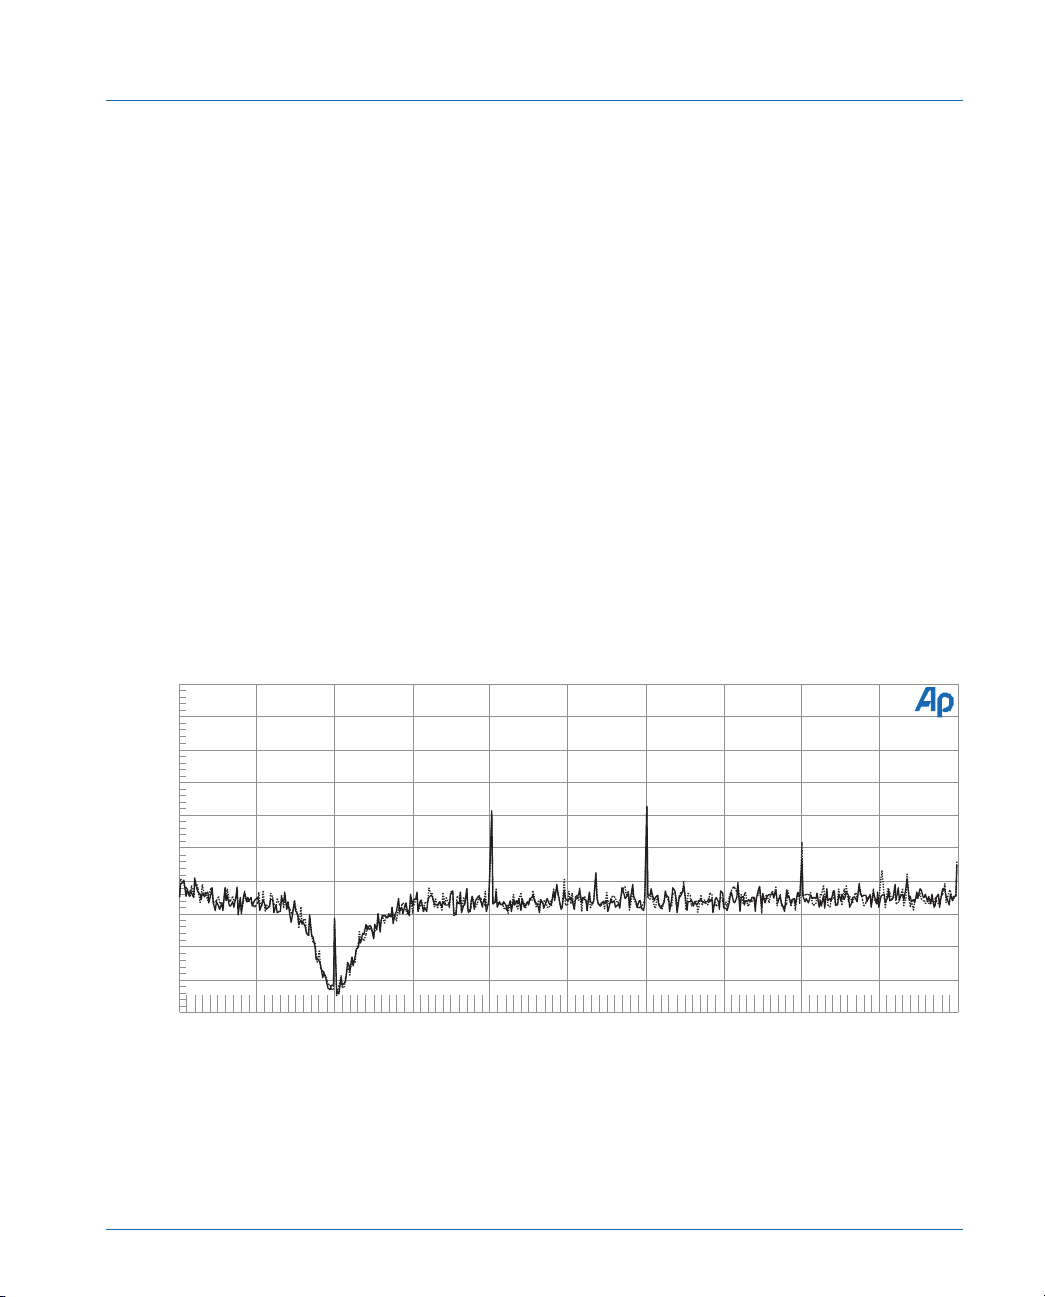
kHz. This can be easily seen in the data by the depression around that
frequency. This is an “upside down” view of the filter skirts of the
Analog Analyzer notch filter with the residual amplitude of the test tone
seen at the center of the depression. Second, third and fourth and fifth
harmonic components can be clearly seen to the right of the
fundamental and above the noise floor of about -125 dBFS.
THD+N vs. Amplitude Measurements
round-off”) when converting an analog signal amplitude to the nearest
available binary number during the digitization process. If all other
forms of distortion were negligible, quantization noise and distortion
would set a floor of -98.08 dB for the 16-bit linear system of CDs. This
floor would be constant in absolute magnitude across the entire
dynamic range of the Compact Disc player. Some players show a rise
in distortion at high signal amplitudes, most likely due to distortion in
their analog amplifier sections.
Results
In Figure 15 the fundamental used for this test was located at 4
Quantization distortion and noise are due to errors (“binary
Stereo distortion-versus-amplitude measurements can be made
using track 18 (13 indexed segments) of the CBS disc or tracks 32
through 48 of the Philips SBC429 disc. These start with a 0 dBFS high
amplitude signal and move downward to the -90 dBFS level. All have
closely-spaced amplitudes at the higher levels and move to larger steps
at lower levels. The CBS disc and Philips SBC429 discs have high
resolution, with 10 dB steps from -10 to -90 dB.
Three different tests for accomplishing measurement of distortion
(THD+N) versus amplitude are described here. The first of these uses
only the Analog Analyzer hardware to determine the amplitude level
changes of the tracks being played. A Level meter reading is used to
increment the sweep based on measured amplitude changes. Since the
Level meters have high bandwidth (greater than 500 kHz)
measurements can be handicapped by frequency components above
22 kHz and the noise performance of the CD player being tested. The
second variation uses the DSP hardware to control the amplitude
Page 46 Compact Disc Player Tests – Application Note #1A
Page 56

Distortion Measurements
sweep by using the DSP Bandpass function in the Digital Audio
Analyzer to reduce sharply any noise and high frequency interference
to detection of the audio tone. This variation requires the DSP version
of System Two-System One with DSP cannot be used for this test
variation. The third test variation can be used if the CD player has a
digital audio output. The Dual Domain version of either System is also
required. The amplitude changes of the CD test track control the sweep
amplitude steps directly by using the digital audio signal without
D-to-A conversion. Since both analog and digital versions of the same
signal are simultaneously available direct measurement of the D-to-A
and analog output sections of the CD player are possible.
The test tone frequency used can be a factor in the validity of test
results. A synchronous relationship between signal and clock will not
test linearity of every state of the player’s D-to-A converter, since the
points at which the signal waveform will be sampled repeat after a
relatively small number of cycles. The non-synchronous relationships
are theoretically preferable since the waveform “wanders” through a
variety of timing relationships with the clock, causing every state of the
converter to be exercised. Some test discs use a reference frequency
slightly different than the traditional 1000 Hz frequency reference since
the 1 kHz frequency is synchronous with the clock frequency at a ratio
of 44.1:1. The Denon, for instance, uses a 1001 Hz reference tone to
avoid the synchronous relationship. On single tone tracks both the
CBS and the Denon discs use frequencies slightly off the ISO
frequencies. For example, 10 kHz becomes 10,007 Hz.
Distortion across the 90 plus dB dynamic range of a Compact Disc
player is impossible for many distortion analyzers to measure. This
measurement requires holding the fundamental rejection notch fixed at
the signal fundamental frequency even when the signal amplitude is as
low as approximately 60 microVolts (90 dB below a typical 2 Volt
maximum output). Other analyzers with a notch lock-up feature may
not maintain the correct setting for the time required to complete this
test. System One and System Two architecture makes this
straightforward, since the notch frequency may be programmed at any
desired frequency.
Compact Disc Player Tests – Application Note #1A Page 47
Page 57
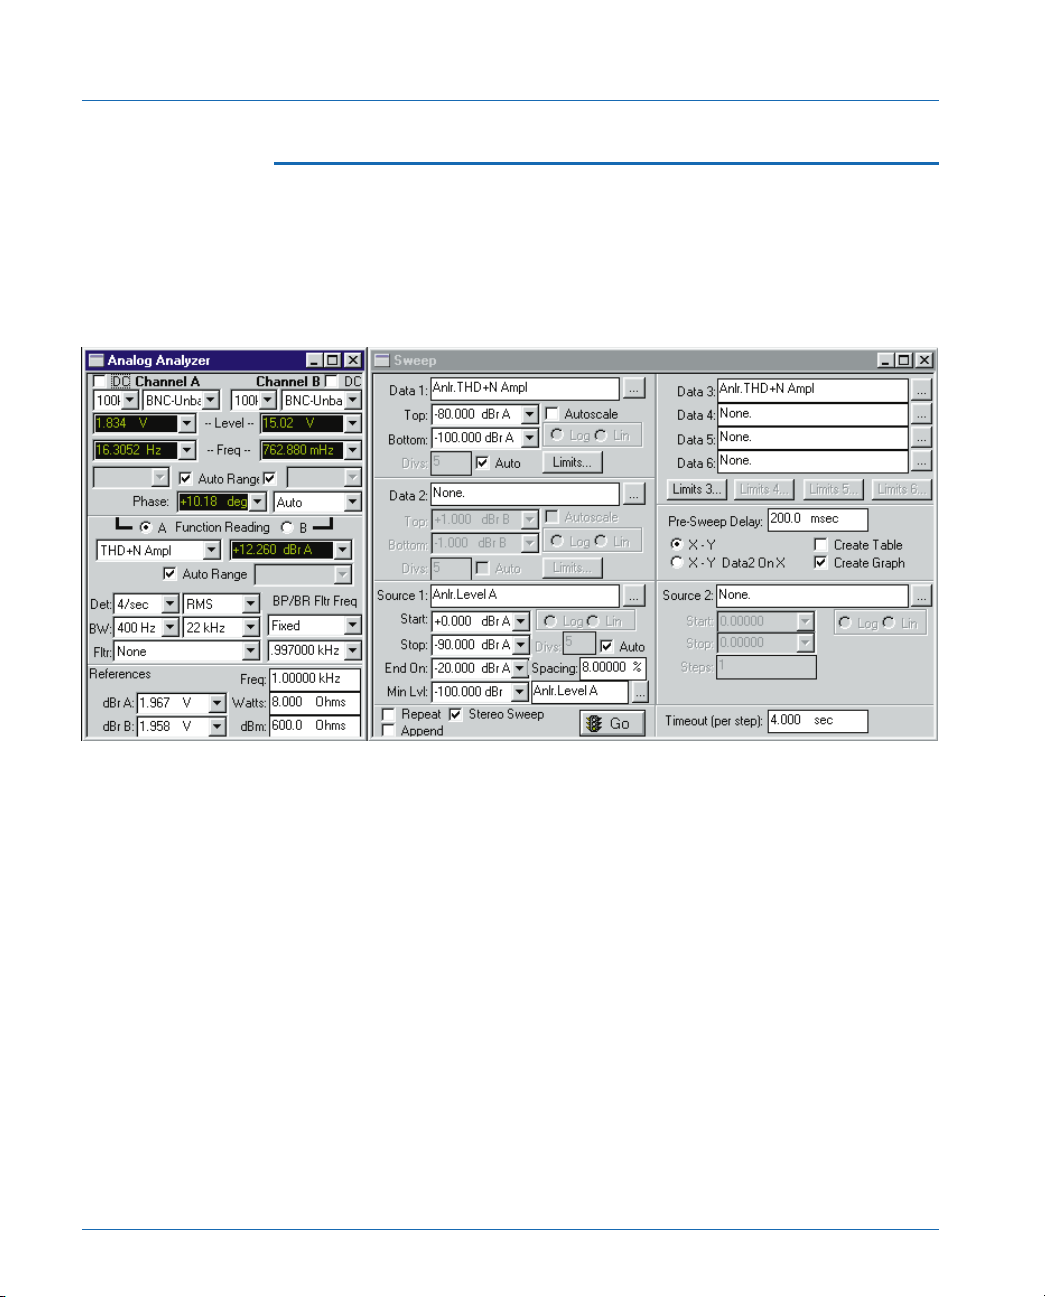
Distortion Measurements
THD+N vs. Amplitude-Analog Analyzer only
for a distortion versus amplitude test using the Analog Analyzer
abilities.
Setup
Figure 16 shows the Analog Analyzer, Sweep, and Settling panels
Figure 16 Set up panels for an Analog Distortion vs. Amplitude sweep
The key factors and parameters in making these measurements on
Compact Disc players are:
a. THDAMPL.at1 or .at2 are supplied in the distribution files for
this application note. In the expanded Analog Analyzer panel:
Select THD+N Ampl for the Function meter mode and RMS for
the detector. For the Function meter absolute amplitude units
(Volts, dBu, dBV, etc.) rather than the relative units % or dB are
used. Measuring and graphing THD+N in an absolute unit
(Ampl) will help separate the fixed quantization distortion
mechanism and show steps in distortion due to errors that occur
at particular bit levels. Both % and dB express distortion
Page 48 Compact Disc Player Tests – Application Note #1A
Page 58
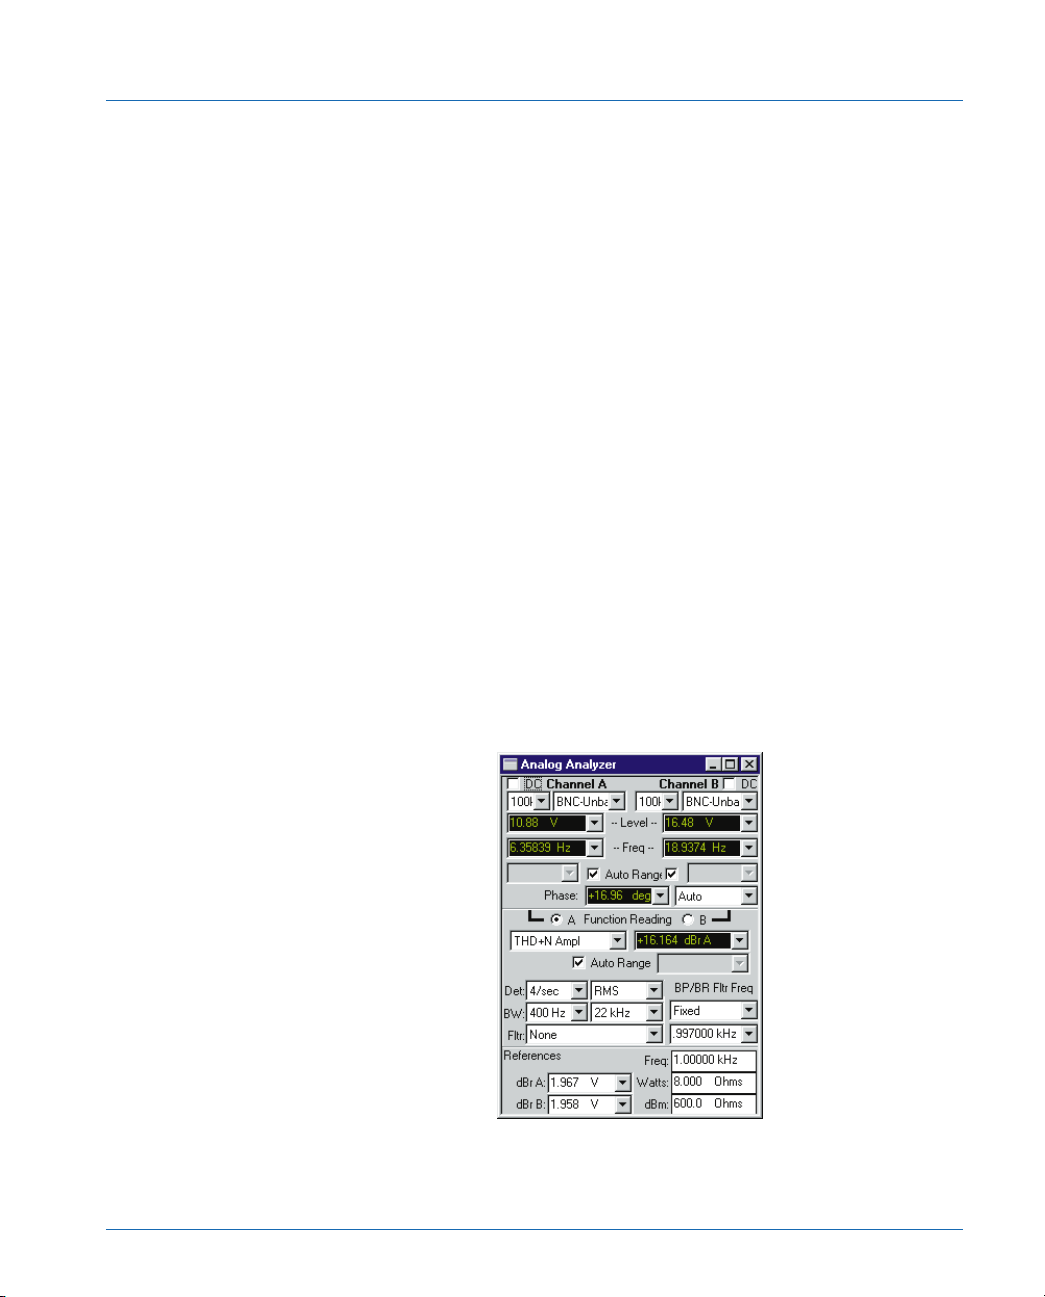
Distortion Measurements
products relative to the total signal amplitude at each
measurement point. At very low amplitudes in a digital or other
noise-limited system, distortion expressed as a percentage
approaches 100% (0 dB). This obscures the fact that the
fundamental quantization distortion and noise mechanism (on
linear PCM converter systems) is essentially independent of
signal amplitude.
In this External Level sweep the test is driven by, and horizontal
axis data obtained from, the Level voltmeter. The Level
voltmeter does not have low-amplitude performance equal to
the Function meter, but its resolution is maximized by selecting
the 4/sec reading rate instead of Auto on the Detector line of the
Analog Analyzer panel. The Level meter resolution at the 4/sec
rate is about 3.2 microVolts in the lowest (80 milliVolt) range of
System One and 1 microVolt in the lowest (40 milliVolt) range of
System Two
In the Function Reading meter select the 400 Hz high-pass and
22 kHz low-pass filters for minimum noise bandwidth. Set the
BP/BR Fltr Frq to Fixed and set the frequency for the track
sequence used—997 Hz for CBS track 18 and 1 kHz for Philips
track 32.
Compact Disc Player Tests – Application Note #1A Page 49
Page 59

Distortion Measurements
At the bottom of the Analog Analyzer panel the References dBr
values must be correct for the 0 dBFS level signal for valid
horizontal axis graph values. Check that the levels appearing in
the two Level meters during the 0 dBFS track are the same as
those entered into the References dBr fields. (System
One—Channel A Level meter and the single Reference dBr
field.) If different, enter the measured maximum output
amplitude of the CD player on channel A as the References dBr
value near the bottom of the expanded Analog Analyzer panel.
The default value is 2 Volts in the supplied test (THDAMPL.at1
or .at2)—typical for most consumer CD players. Do not use the
F4 key while THD+N Ampl is selected in the Function Reading
meter because an incorrect dBr reference will result. If you wish
to capture (F4 key) the dBr reference from the first track of this
test sequence you must change the Function Reading meter to
Amplitude, play the 0 dBFS track (Trk 18.1 on the CBS, Trk 32
on the Philips), and take a reference with the F4 key. Reset the
Function Reading meter to THD+N Ampl.
b. On the Sweep panel:
Select Anlr.Level A sweep mode at Source 1, with the Source 1
Start and Stop points implying a downward sweep. The most
useful horizontal axis calibration is “dBr”—dB relative to
maximum output. To accomplish this calibration, set 0 dBr for
Start and -90 dBr for Stop. Check the Stereo Sweep check box
for second channel in Data 3. Absolute amplitude calibrations
are also possible for the horizontal axis. Most CD players with
consumer level outputs have an output amplitude of about 2
Volts at maximum recorded signal level (0 dBFS). To calibrate
the horizontal axis of the graph in Volts, select 2.0 Volts for Start
and 50 microVolts for Stop. To calibrate in dBV(for typical
unbalanced output consumer players), select +6 dBV for Start
and -84 or -90 dBV for Stop.
Page 50 Compact Disc Player Tests – Application Note #1A
Page 60
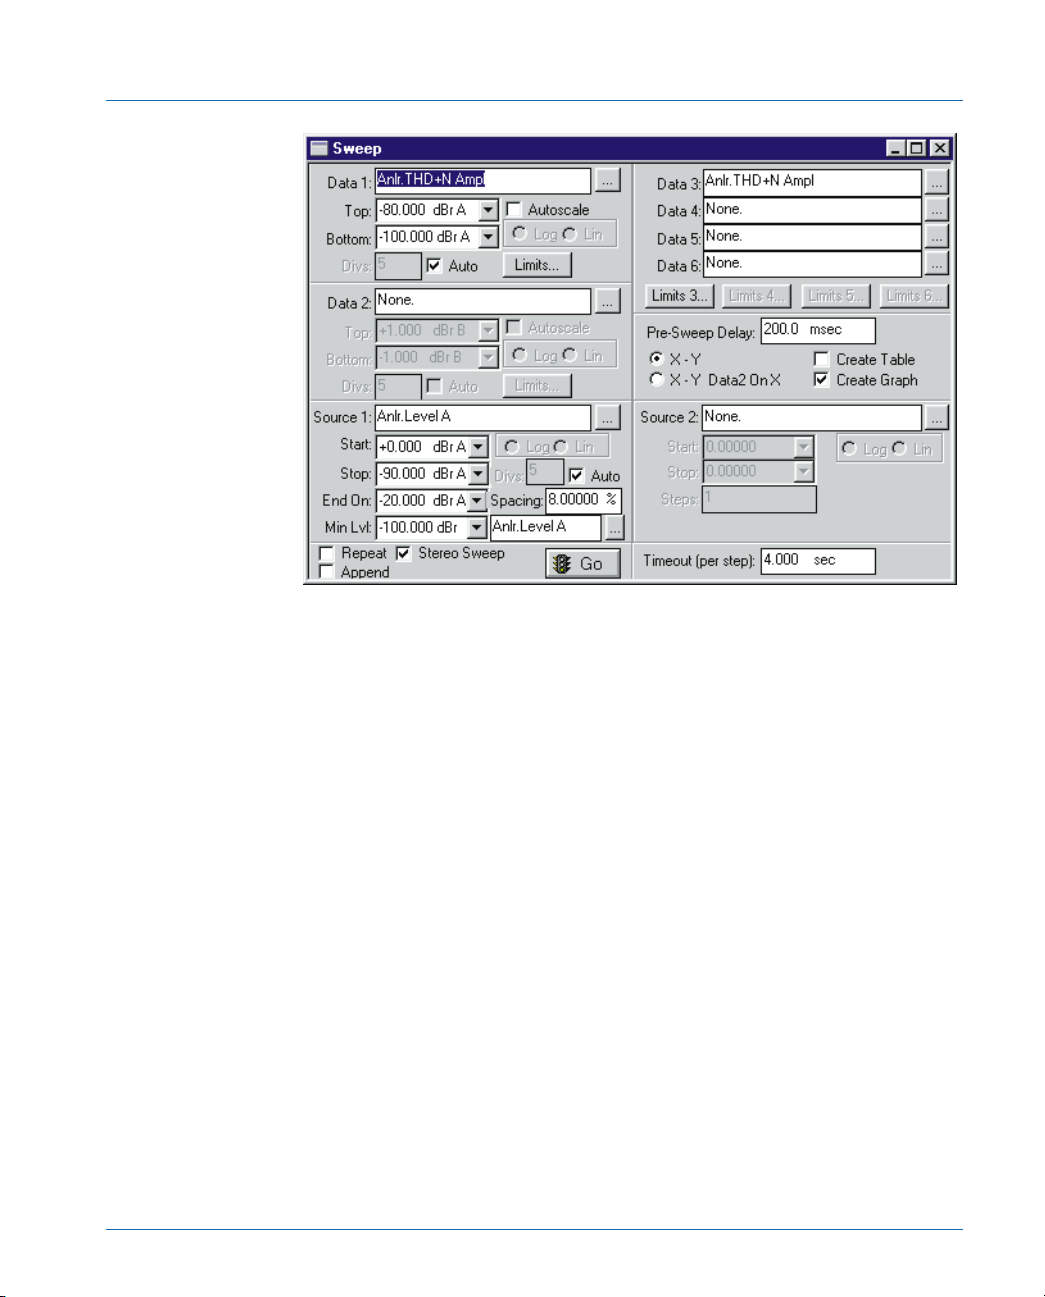
Distortion Measurements
In External sweeps, APWIN collects new data each time the
Source 1 parameter changes to a new settled value which differs
from the previous settled value by at least the Spacing value.
Enter a Source 1 Spacing value (near the bottom of Sweep
panel) only slightly smaller than the smallest percentage change
in voltage between tracks. On the CBS, and Philips discs, the 0
dB to 1 dB step is the smallest change (approximately 10%) and
a Spacing value of 8% or 9% is appropriate. The Spacing value
should be set as large as possible to improve metering on the -90
dB track. Note that in External mode and a Stereo Sweep,
APWIN re-checks the Source 1 value after acquiring the right
channel data (Data 3) at each step. If the Source 1 value is not
within the Spacing percentage of its earlier reading at that step,
the right channel data will not be plotted. The system assumes
that the track may have ended before the right channel reading
was completed. In System One the Level meter repeatability can
be a more difficult issue. System One Level meter resolution at
the lowest input levels (80 mV range) is about 3.2 microVolts.
With a level of -90 dBFS the input levels are nominally around
the 60 microVolt level and sample-to-sample variations of one
Compact Disc Player Tests – Application Note #1A Page 51
Page 61

Distortion Measurements
bit will just fall within an 8% Spacing value. Two-bit repeatability
(6.4 microVolts) will fall within a 15% Spacing. This is not a
problem with System Two with its improved Level meter
resolution of about 1 microVolt per bit at 4 and 8 readings per
second at the lowest input levels (40 mV range).
CD players have some finite value of noise output even when
muted during their transitions from track to track. If possible, the
minimum level (MinLvl) parameter on the Sweep panel should
be set to a value above this “inter-track noise” output (as
measured by the Level voltmeter of the System One or System
Two in use) to prevent the measurement system from mistaking
that noise as a legitimate low-amplitude signal track. In external
sweep mode, APWIN suspends data acquisition and plotting
whenever the signal level measured by the Level voltmeter drops
below the minimum level value.
To determine the noise level from the player during transitions
from track to track, observe the Level (in Volts) on the Analog
Analyzer panel while operating the track advance control of the
player. Enter a value a few dB higher than this inter-track noise
level into the MinLvl (Minimum Level) field of the Sweep panel.
(In System One use a value of 4 to 8 microVolts above the
average noise value.) On players with rapid track change, it may
be difficult to obtain a good reading of this value. When this is
the case, observe the Level reading while playing the -90 dB
track (index 13 of track 19 on the CBS disc, and track 46 or 48
on the Philips test discs). Since it is desired to measure this track,
enter a value a few dB below the measured level into the MinLvl
field. (In System One this setting should be about 4 microVolts
lower than the reading.)
c. On the Settling panel:
Set the Level Tolerance to 15% and the Level Floor to 1
microVolt (4 microVolts in System One). In System One this
permits the Level meter measurements to be accepted as settled
even with one or two bits of Level meter reading variation with a
Page 52 Compact Disc Player Tests – Application Note #1A
Page 62

Distortion Measurements
-90 to -100dB signal.) The THD+N Ampl line should be set to a
5% tolerance. Delay should be enough to allow any mechanical
or switching instability to settle. A 500 milli-second amount is
useful at noisy low levels. Delay may also be used to prevent
readings between tracks or if the CD player track selection
mechanism is slow. Some CD players have been measured in
which the “inter-track noise” is actually higher than the recorded
signal on the -90 dB (or even -80 dB) tracks. If the minimum
level (MinLvl) is set higher than this value, those tracks cannot be
measured. Alternate test techniques using the DSP bandpass
filter (next test section) or a CD digital output (“THD+N vs.
Amplitude—Digital Input controlled Sweep”) to control the
sweep steps are the best approach to this problem. If restricted to
the Analog Analyzer only, Settling Delay may be used to disable
data acquisition for a sufficient period each time the CD player is
sequenced to the next track, permitting the MinLvl to be set to a
value lower than the player output on the -90 dB track. Set the
Level meter Delay on the Settling panel to a value somewhat
longer than the time required by the CD player to provide
output on the next track when the track advance control is
operated. Each time APWIN finds the Source 1 value to be
settled it invokes this Settling Delay before it attempts to find
settled data. Thus, even if APWIN accepts the noise level
between tracks as a legitimately settled Source 1 value, the
Settling Delay prevents immediately taking data. The next track
then begins with a new value of Source 1 amplitude, the settling
algorithm discards the value from the inter-track noise, and the
algorithm Starts again to obtain settled measurements on the
desired signal from the track. Settling Delay is also invoked after
changing channels on a stereo test, so the measurement time per
track will be increased by approximately twice the Settling Delay
value.
Testing
Initiate the test by F9 or a Go button while playing the 0
dBFS—track 32 on the Philips disk, 18 on the CBS. The first data is
taken when two new line listings appear in the Graph legend. This is
more easily seen on the Data Editor panel (pg. 3). After the data has
been taken for both channels the next track or index can be selected.
Compact Disc Player Tests – Application Note #1A Page 53
Page 63
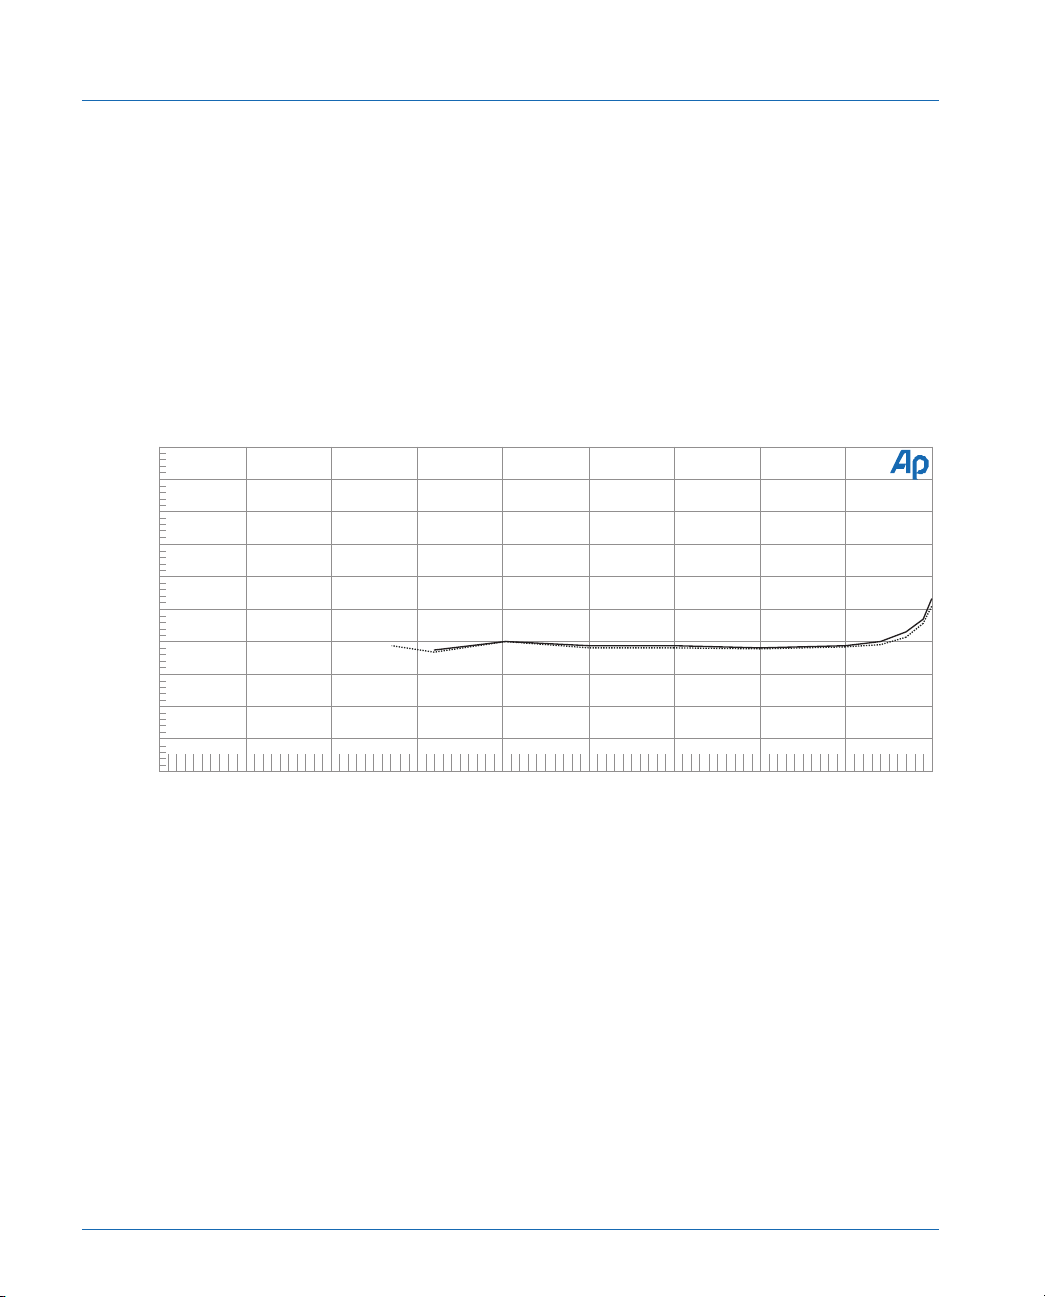
Distortion Measurements
Again wait for both channels to be read, continue with the next pair of
readings at the next lower amplitude step. At a certain point one of the
data channels may not plot or indicate a “B” in the Data Editor. This
indicates that the data is not valid. This is the lowest practical
amplitude that acceptable readings can be made in that channel. The
sweep will not automatically stop, you must press either a Stop button
or the Esc key. To replace the Source 1 horizontal axis (first column)
data with the exact values from the CD test disc see the section
“Replacing Horizontal Axis Data with Actual Amplitudes”
Audio Precision CD TotalHarmonic Distortion + Noise (THD+N) vs. Amplitude
-80
T
-82
H
D
-84
+
N
-86
-88
r
e
-90
f
-92
0
-94
d
B
-96
r
-98
A
-100
-90 +0-80 -70 -60 -50 -40 -30 -20 -10
THD+N Absolute Amplitude ref 0 dBr
Analog Input Level dBr A
Figure 17 Graph of THD+N distortion vs. Amplitude - THDAMPL.at2
Results
Figure 17 shows the THD+N distortion from the 0 dBFS level
down to the point that is the limit for the Level meter to detect the
change in Amplitude within the Settling panel tolerances. Increased
distortion near the maximum amplitude in the analog output of the CD
player is related to circuitry after the D-to-A converter. At low levels
noise interferes causing the meters to be inaccurate. Where strong high
frequency noise above the audio range exists the Level meter can be
inaccurate since it has bandwidth to above 500 kHz.
Page 54 Compact Disc Player Tests – Application Note #1A
Page 64

Distortion Measurements
THD+N vs. Amplitude—DSP controlled Sweep
CD players with large amounts of clock signal leakage may prevent
External Level sweeps to the -90 dB area, since the Level meter is a
wideband voltmeter and will “see” the clock signal the same as the
recorded signal. CD players have been measured with clock signal as
high as -60 dB, preventing distortion vs. amplitude and linearity
measurements at low amplitudes using analog techniques. These high
frequency components and the general noise level in the wide band
meter contribute to the inability of the Level meter to control the sweep
in the previous setup when signal levels are low. Better sweep control
can be realized by using the DSP audio analyzer available in DSP and
Dual Domain versions of both Systems. The DSP based analysis of the
signal using Bandpass mode provides a very tightly controlled
bandwidth allowing accurate determination of the signal tone well
below the wideband noise floor. The Bandpass measurement
specification for the DSP implemented filter is considerable sharper
than the Analog analyzer bandpass filter. The DSP narrow band filter is
a 10 pole with a bandwidth of 5.3% of the frequency whereas the
analog bandpass filter is a class II 1/3 octave 4 pole. The DSP signal is
not used to produce the analog measurements of distortion but only to
control the sweep and determine the signal amplitudes plotted on the
horizontal axis.
Setup
This test variation is only applicable to System Two either with DSP
or Dual Domain. This test setup is supplied as THDAmpl2.at2. The
setup for Analog Analyzer and Sweep panels for the DSP controlled
variation is very similar to the Analog only version (THDAMPL.at2).
The addition of the Digital Analyzer panel and appropriate changes to
the Source 1 area of the Sweep panel are the principal differences. See
Figure 18
a. The Digital Analyzer panel requires the selection of a DSP
program before any panel settings can be done. Select DSP
Audio Analyzer in the Analyzer window. This digital analyzer is
configured to make most measurements that can be done in the
analog analyzer in either the digital domain or with analog audio
Compact Disc Player Tests – Application Note #1A Page 55
Page 65
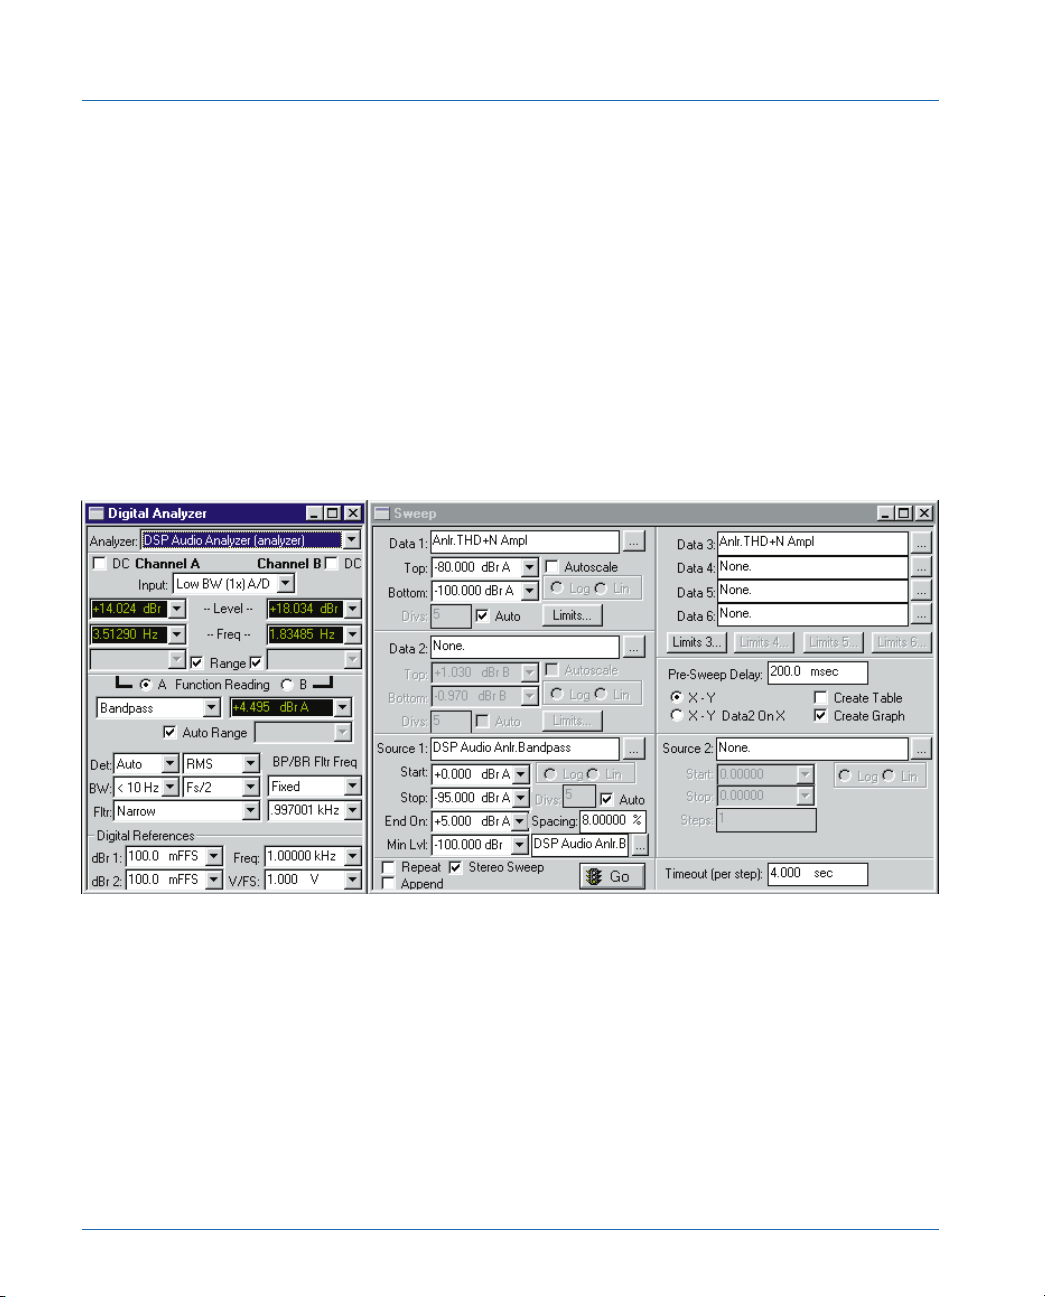
Distortion Measurements
signals through the A-to-D converters. In this case our interest is
in tightly controlling the bandwidth so that the sweep can be well
controlled to levels well down in the noise. At Input select Low
BW (1x) A/D and Bandpass from the Function Reading meter
drop-down list. The default settings for the BW (bandwidth) and
Detector can remain. Set the BP/BR Fltr Freq to Fixed and set
the frequency window to the frequency of the track used—997
Hz for the CBS and 1 kHz for the Philips.
b. Change the Sweep panel Source 1 settings so that Source 1 is
DSP Audio Anlr.Bandpass. Start and Stop sweep amplitudes can
be about the same as before or down a little farther to -95 dB.
For Min Lvl select the DSP Audio Anlr.Bandpass as the source
and -100 dB dBr A for the Min Lvl amplitude.
Figure 18 Panels for the DSP controlled version of a distortion vs. amplitude sweep - THDAmpl2.at2.
Testing
As in the test above initiate the test by F9 or a Go button while
playing the 0 dBFS—track 32 on the Philips disk, 18 on the CBS. The
first data is taken when two new line listings appear in the Graph
legend. After the data has been taken for both channels the next track
or index can be selected. Again wait for both channels to be read,
select the next amplitude and take another pair if readings. The sweep
Page 56 Compact Disc Player Tests – Application Note #1A
Page 66
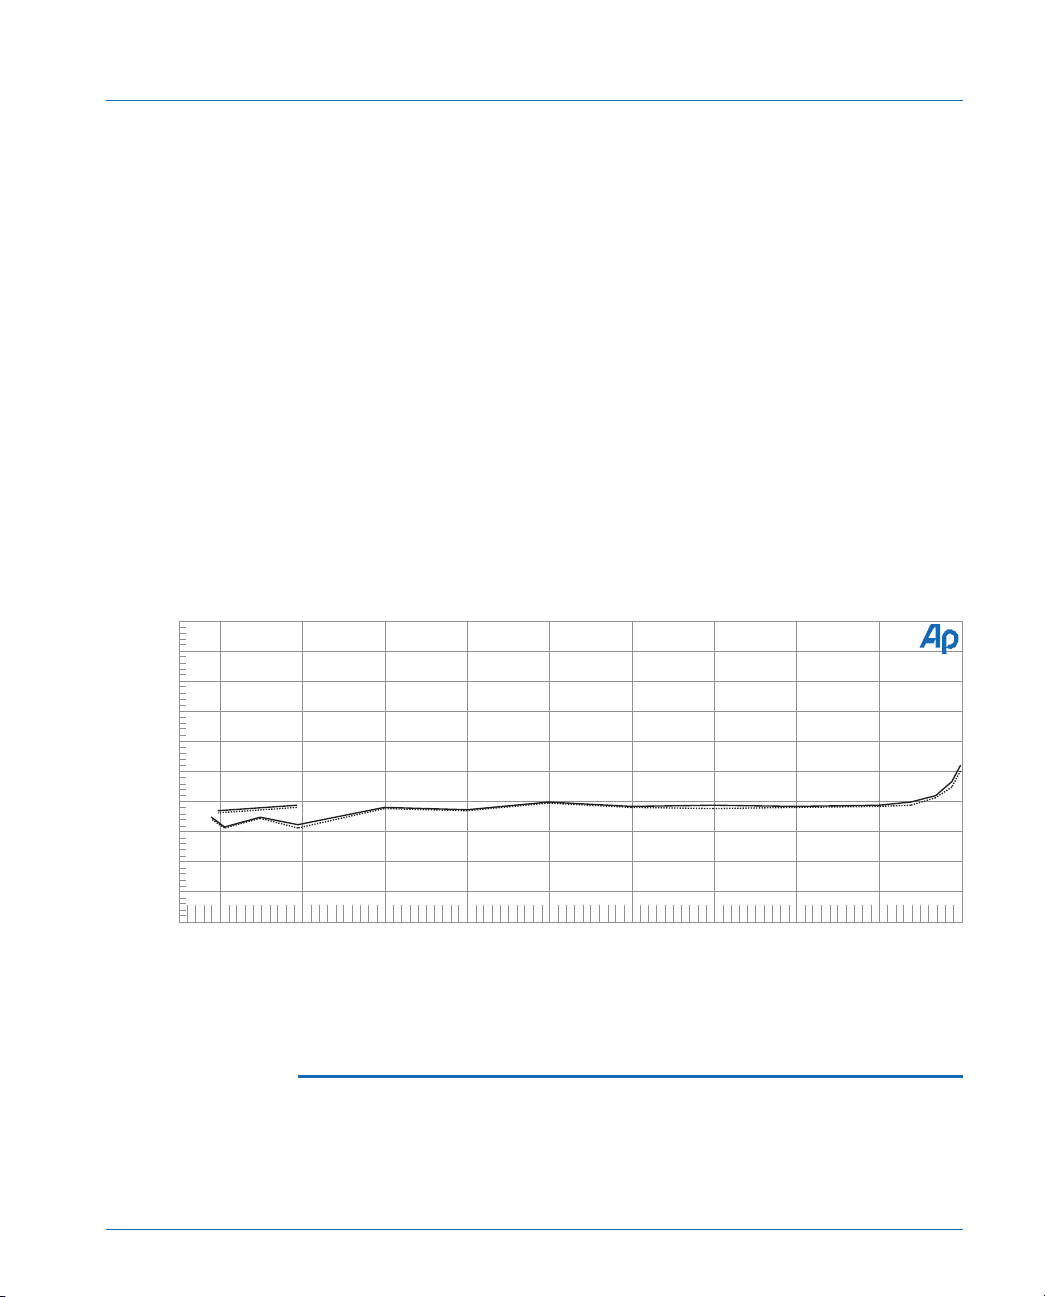
Distortion Measurements
will continue to take data down to the last track of the sequence at
about a -90 dB level (CBS track 18.13, Philips track 46). The sweep
will not automatically stop, you must press either a Stop button or the
Esc key.
Results
Fig. 19 shows the results from measuring a 5 disc carousel CD
player. Compare with the Analog Analyzer Level meter controlled
sweep in Figure 17. The Data Editor indicates horizontal axis values
differ less than 0.1 dB from the CD manufacturer’s data sheet down to
the -90 dBFS point where the reading error is still less than 2 dB. The
additional upper lines between -80 and -90 dB are from tracks 47 and
48 from the Philips disc which have dither added. The effect is
clear—less of a “zig-zag” from the undithered signal but a higher noise
level about the same as the undithered signal at -70 dB.
Audio Precision CD Total Harmonic Distortion + Noise (THD+N) vs. Amplitude
-80
T
H
-82
D
+
-84
N
-86
-88
r
e
-90
f
-92
0
-94
d
-96
B
r
-98
A
-100
-90 +0-80 -70 -60 -50 -40 -30 -20 -10
THD+N Absolute Amplitude ref. 0 dBr A
Narrow Band Input Am plitude dBr A
Figure 19 Graph of DSP bandpass filter controlled sweep of distortion vs. amplitude.
THD+N vs. Amplitude—Digital Input controlled
Sweep
The above two tests both use the analog signal to determine the
horizontal axis of the sweep. If the CD player has a digital output direct
Compact Disc Player Tests – Application Note #1A Page 57
Page 67
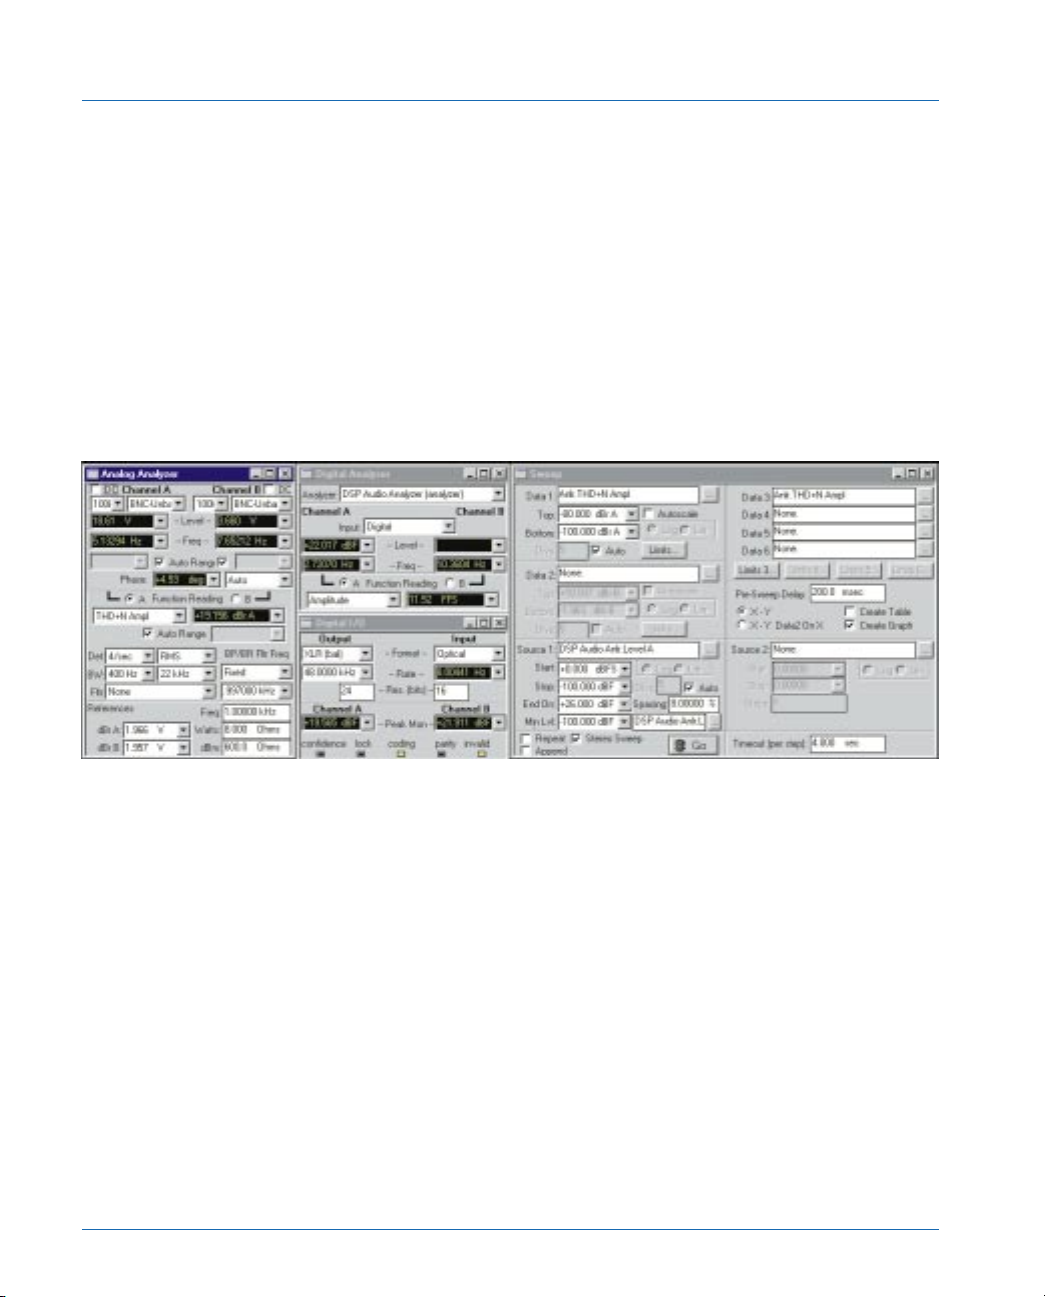
Distortion Measurements
access to the digital data is possible using the Dual Domain System
One or System Two. The digital data can be used to increment the
Source 1 horizontal axis data more accurately. Since this data is not
subject to the noise present in the analog signal or to D-to-A converter
non-linearity the Sweep panel Source 1 can be set to look at a DSP
Digital Audio Analyzer Level meter to increment the sweep.
settings unchanged from their condition in THDAMPL.at1 or .at2. The
additional panels used are the Digital Analyzer and Digital I/O panel.
Setup
THDAmplD.at1 and at2 also use the Analog Analyzer panel
Figure 20 Panels for digital audio input control of distortion vs. amplitude sweep
a. The Digital Analyzer panel requires the selection of a DSP
program before any panel settings can be done. Select DSP
Audio Analyzer in the Analyzer window (Digital domain audio
tester (genanlr) in System One). The Source should be Digital
(System Two only). The remainder of the panel setup can be
ignored since only the digital Level meter is used.
Page 58 Compact Disc Player Tests – Application Note #1A
Page 68
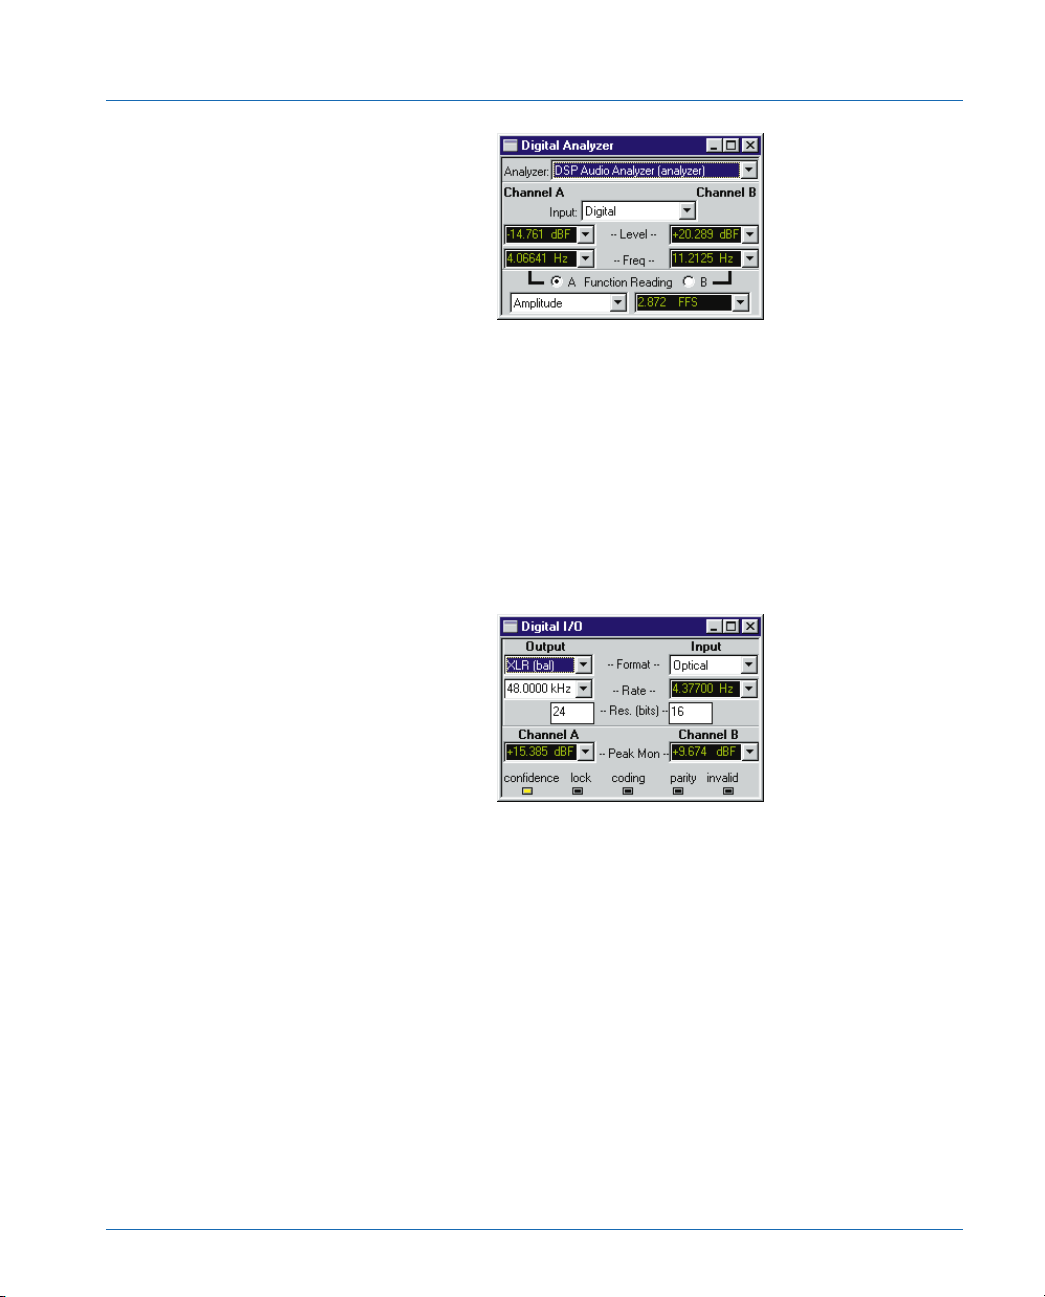
Distortion Measurements
b. Select the digital signal input appropriate to the type of digital
output from the CD on the Digital I/O panel Input field. In
System Two there are three likely choices: Select BNC (unbal) if
you have an SPDIF source—you will require a BNC to Phono
(RCA) adapter. Select Optical for the TOSlink connection. If an
AES3 interface is available use either XLR(Bal) or the
BNC(unbal) input as needed. On the Digital I/O panel in System
One set the Input Format to Serial and set the Serial Type to
AES/EBU & SPDIF. The optical TOSlink connection is active in
this setup also.
c. Select the DSP Audio Anlr.Level A for Source 1 on the Sweep
panel (Genanlr.Level A or B in System One). Set Start to 0
dBFS and Stop to -95 dBFS for the same sweep range as in the
above tests. Set MinLvl to -100 dBFS and set End On to some
unrealistic high number such as +5 dBFS to prevent stopping
the sweep. 8% Spacing is still appropriate.
Compact Disc Player Tests – Application Note #1A Page 59
Page 69
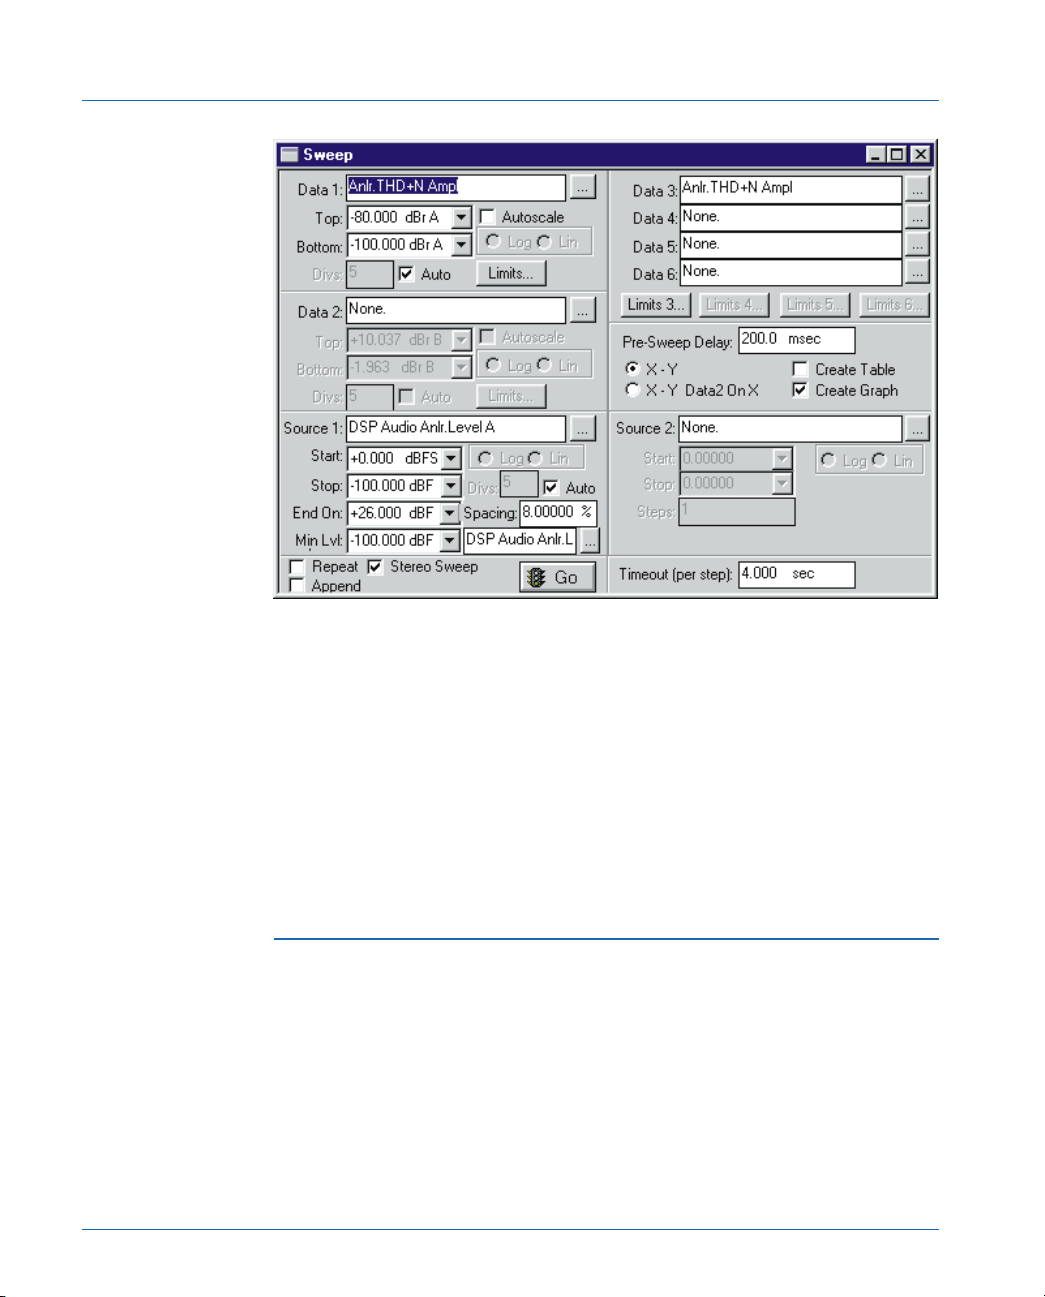
Distortion Measurements
Testing
Initiate the test by F9 or a Go button while playing the 0
dBFS—track 32 on the Philips disk, 18 on the CBS. The first data is
taken when two new line listings appear in the Graph legend. Select
the next level or let the CD run. The sweep will continue to take data
down to the last track of the sequence at about a -90 dB level (CBS
track 18.13, Philips track 46). The sweep will not automatically stop,
you must press either a Stop button or the Esc key.
Replacing Horizontal Axis Data with Actual
Amplitudes
The end results of the distortion vs. amplitude and linearity tests
include a horizontal axis consisting of the actual amplitudes recorded
on the test disc. If we use the Analog Analyzer Level meter to control
the sweep there is no theoretical way in which these amplitudes can be
accurately measured, since they are recoverable only through the CD
player that is being tested and which may be to some extent
non-linear. The distortion (vertical graph axis) will not be in error since
Page 60 Compact Disc Player Tests – Application Note #1A
Page 70

Distortion Measurements
distortion is measured with the wide-range Function Reading meter.
However, the Source 1 Level readings in the Analog Analyzer may be
plotted a few dB in error horizontally from the -80 dB and -90 dB lines
on the graph. The Analog Analyzer Level voltmeter performance is
specified only down to 5 milliVolts in System Two and 10 milliVolts in
System One. It may have several dB of linearity error at the 60
microVolt level. Wideband noise also contributes error since the Level
meter has a bandwidth in excess of 500 kHz. The CD player D-to-A
converter non-linearity is also a major factor. Using either the DSP
bandpass analyzer variation of the test (THDAmpl2.at2) or the digital
audio output sweep control test (THDAmplD.at2 or .at1) provide
much greater horizontal data accuracy, but leaves the CD player
D-to-A converter non-linearity.
Since the test CD track amplitudes are stated by the CD
manufacturer, the Data Editor may be used to manually substitute
them for the measured values. For the THD vs. Amplitude tests this is
method to achieve greater accuracy in the horizontal values of the
graph. It may not be needed if either the DSP or digital input version
of the THD versus Amplitude tests is used. In the Linearity tests Source
1 horizontal axis data replacement is required to produce the actual
versus measured plot of amplitudes.
To review the Source 1 amplitude errors select the Data Editor at
the conclusion of a test. In the Data Editor the Source 1 (Anlr.Level A)
data is in the first column, Channel A (normally left channel) data is in
the second column (Anlr.THD Ampl) and Channel B data in the third
column (also Anlr.THD Ampl). The second (Data 1) and third columns
(Data 3) were measured with the Function Reading meter which has
specified accuracy to much lower levels than the lowest available from
CD players. At the higher amplitudes, typically down through the -60
dBFS track (about 2 milliVolts), the first column should match the
values given by the test CD manufacturer except for any systematic
offset due to not setting the dBr REF value correctly on a 0 dBFS track.
Increasing errors will typically be seen at lower levels.
Compact Disc Player Tests – Application Note #1A Page 61
Page 71
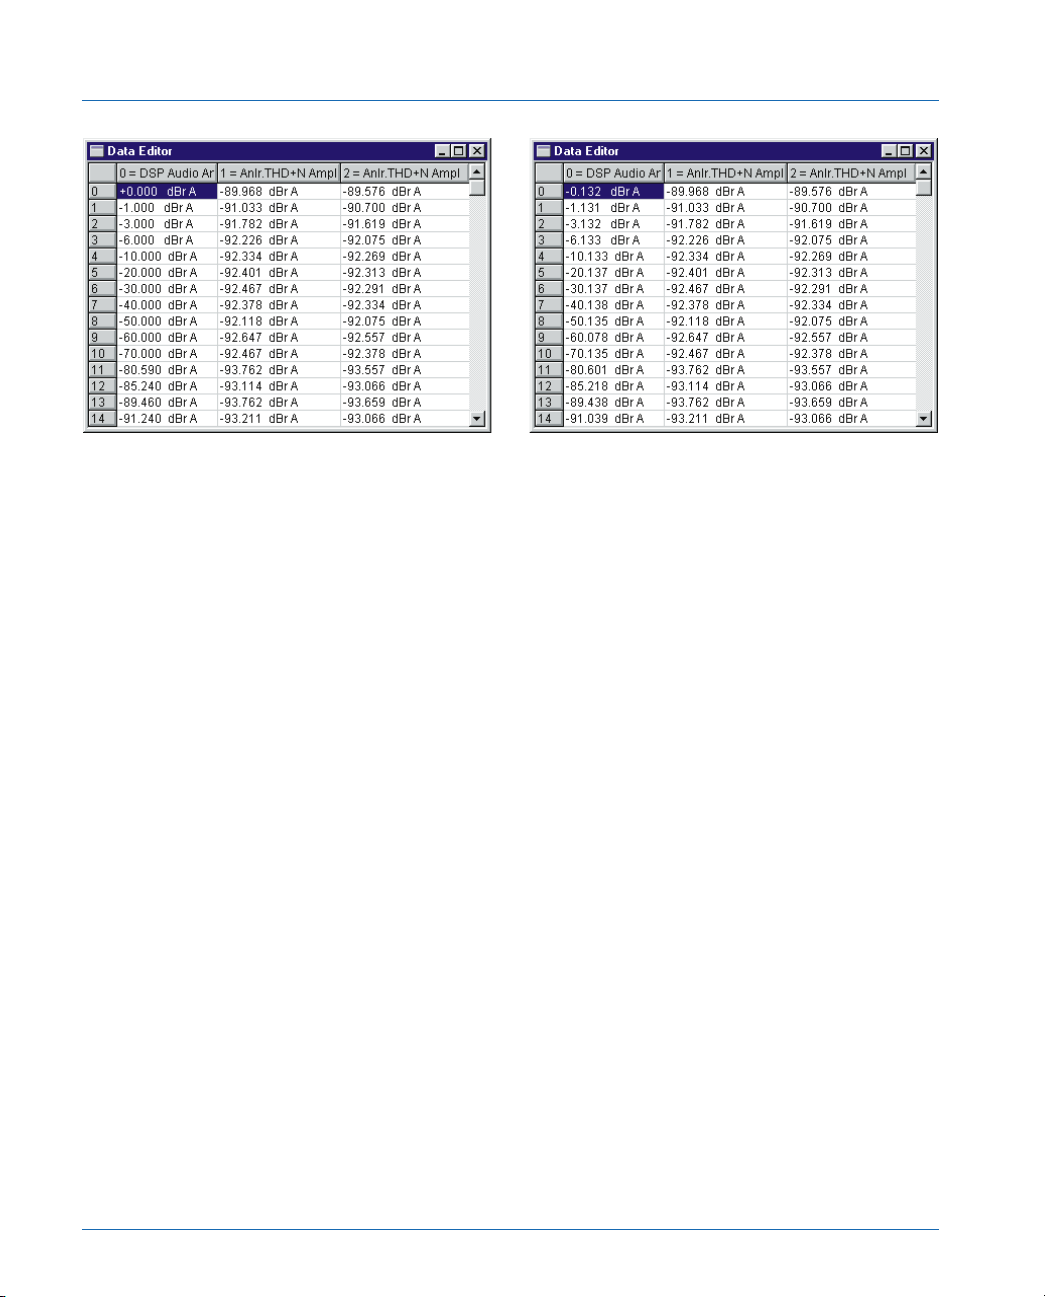
Distortion Measurements
Figure 21 The Data Editor first column shows the readings from the test before (left) and after (right)
correction. Data from the CD documentation is typed into the Source 1 fields.
To manually correct the data, The measured values in the first
column can be replaced with the values from the test CD
documentation. With the mouse, highlight the cell in the first column
that needs to be corrected and type in the documented value. Digits
beyond 0.01 dB are not significant. When the first column data has
been corrected, re-save the test.
For more automatic operation, a procedure can be run which will
replace the sweep horizontal axis (Source 1) measured values with the
theoretical values furnished by the test disc manufacturer. A general
purpose procedure for changing the horizontal axis data (first
column—Source 1) is provided as EditCol1.apb. See Appendix 2 on
CD procedures for a description.
Page 62 Compact Disc Player Tests – Application Note #1A
Page 72

Linearity
Linearity
Linearity is a measurement of actual output amplitude versus the
known amplitudes on the test disc. The same sets of decreasing
amplitude tracks used for distortion versus amplitude may also be used
for linearity measurements with either System One or System Two.
Furthermore, additional tracks on the CBS and Philips discs provide
still more measurement capabilities at very low amplitudes.
After running the test the graph horizontal axis data must be
replaced with the correct data from the CD test disk documentation.
This data provides the expected output level for perfect linearity in the
CD player.
Since deviation from perfect linearity is the desired end
measurement, the data should be further operated upon by the
Compute Linearity function. Compute Linearity first calculates a
best-fit straight line (using the least-squares method) to a specified
section of the data. It then calculates the deviation of every data point
from that straight line. In these tests the amplitudes within the -6 dBFS
to -40 dBFS range are used for the reference since linearity deviation
of only around 0.01 dB is typical of CD player output in this amplitude
range. The result is a graph of deviation from perfect linearity that may
normally be displayed with a high resolution of only a few dB. This
provides much better indication of the actual CD player linearity than
attempting to interpret a graph with a 90 dB range.
Full-Range Linearity Tests
The structure of the linearity tests supplied with distribution files is
very similar to the THD versus amplitude tests. Instead of measuring
distortion our interest in a linearity test is comparing the actual output
amplitudes with the ideal amplitudes as listed in the data for the CD
test disc tracks used. These tests acquire duplicate measured amplitude
data on both the vertical and horizontal axes. The horizontal (Source
1) data in the first column must be replaced with the correct levels from
the CD data sheet. The CD test track amplitudes are substituted for the
Compact Disc Player Tests – Application Note #1A Page 63
Page 73

Linearity
corresponding measured amplitude steps by using the Data Editor. A
procedure is also supplied for doing this more easily—EditCol1.apb.
Setup
There are again three variations (two for System One) of these
linearity tests depending on the method used to control the sweep:
Linarty.at1 or .at2—uses the Analog Analyzer only; Linarty2.at2—uses
the DSP Digital Audio Analyzer in Bandpass mode to control the
sweep; and LinartyD.at1 or.at2—uses the CD digital output to control
the sweep. In all three cases the panels are set up very similarly to the
panels in the THDAmpl tests. Refer to the setup descriptions above for
details. The differences in these tests are:
a. The Analog Analyzer Function Reading meter is set to Bandpass
mode to minimize the effects of noise and high frequencies. Note
that a detector reading rate of 4/second rather than Auto is
critical. At 1 kHz, Bandpass mode will produce an approximate
20 dB reduction of noise compared to Amplitude mode with the
minimum 22 kHz bandwidth, since the bandpass filter Q of
approximately 4.32 results in a bandwidth of about 230 Hz
when tuned to a 1 kHz center frequency. The BP/BR filter is set
to Fixed with the frequency set for the CD track used—997 Hz
for CBS track 18 and 1 kHz for Philips tracks 32 to 46.
Reference dBr values previously set in Amplitude mode or with
the Level meter cannot be used in Bandpass mode, since the
bandpass filter may have a gain error compared to Amplitude
mode or the Level meter. This reference error in System Two is
typically 0.1 dB with a specification limit of 0.2 dB (up to 0.5 dB
in System One). To set the 0 dBr Reference, be sure the
Function Reading meter unit is set to dBr, play the first (0 dBFS)
track in the test CD sequence, and press the F4 key.
Page 64 Compact Disc Player Tests – Application Note #1A
Page 74
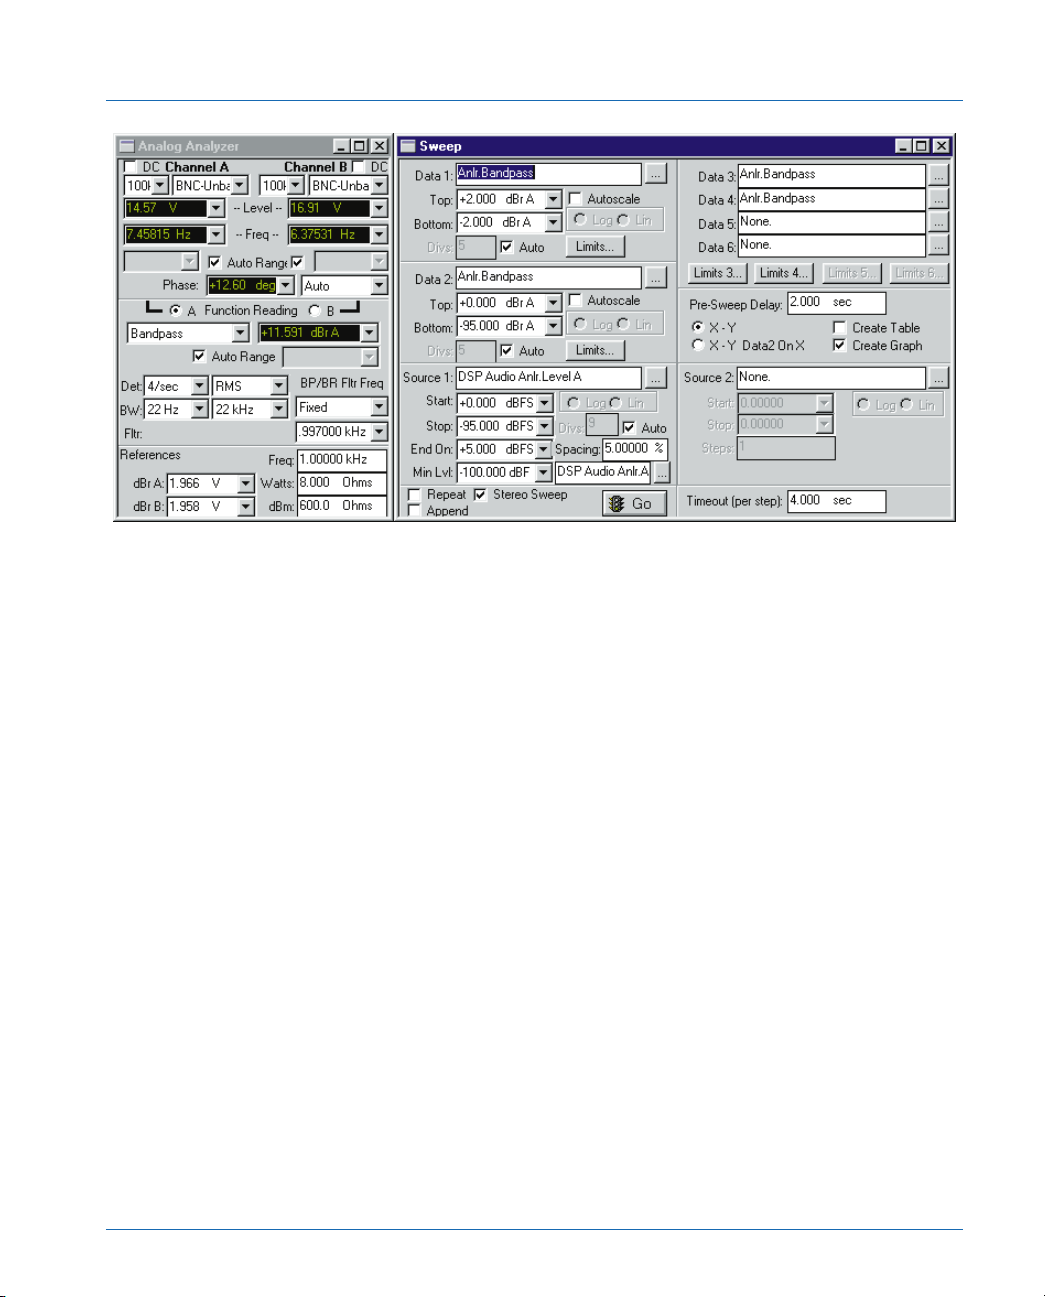
Linearity
Figure 22 Set up panels for linearity testing. Changes are made to the THDAmpl tests as shown in all three
versions of the linearity tests.
b. The tests that use the Digital Analyzer and the Digital I/O panels
use the same panel settings as the THD vs. amplitude tests of the
same type.
c. Sweep panel—Two different approaches for displaying the data
can be found in the supplied test files. Either Sweep panel
configuration can be used.
The first case—Linarty.at2 is an example—has the Sweep panel
Data 1 set to Anlr.Bandpass with Top set to 0 dBr A and Bottom
set to -95 dBr A (dBr in System One). Check the Stereo Sweep
box after setting Data 1. The test data is seen on the graph
during the test as a line progressing from the upper right corner
down to the lower left corner. After the test is run and horizontal
data corrected Compute Linearity converts the data into a nearly
horizontal line at the top of the graph. To view the linearity data
in great detail select the right mouse button and Optimize Left.
This expands the vertical axis to display the full range of the
linearity error.
The DSP controlled sweep test—Linarty2.at2—uses a duplicate
Compact Disc Player Tests – Application Note #1A Page 65
Page 75

Linearity
data approach. The Sweep panel Data 1 (Anlr.Bandpass) is set
to +2 dBr for the Top value and -2 dBr for the Bottom value.
Data 2 (also Anlr.Bandpass) Top is set to 0 dBr and Bottom is
set to -95 dBr. At this point check the Stereo Sweep box. The
result is duplicate data on Data 1 and 2 (Channel A) and Data 3
and 4 (Channel B) but with different vertical axis scaling. As the
test progresses data is seen on the graph as a line progressing
from the upper right corner down to the lower left corner. Initial
test results are scaled on the graph right axis. After the test the
Horizontal data is corrected in the Data Editor and the Compute
Linearity function applied to Data 1 and Data 3 for a linearity
error view of the data. The expanded scale on the left axis is
used to read the error.
d. The Compute Linearity drop-down should be set to compute
Data 1 and Data 3 with linearity range set to -6 dBFS Start and
-40 dBFS Stop values. Compute Linearity should not be done
until the first column (Source 1—horizontal axis) data has been
replaced with the amplitude data for the CD tracks used. See
“Replacing Horizontal Axis Data with Actual Amplitudes” above.
Testing
Play the 0 dBFS reference—track 32 on the Philips disk, 18 on the
CBS and take a new dBr reference value by pressing F4. Initiate the
test by pressing the F9 or a Go button. Since the graph scale has been
set for a narrow amplitude range for display after linearity has been
computed the data will not appear for most of the test. Instead, set
APWIN to pg. 1 and coordinate the CD track changes with the data as
it collects in the Data Editor. Select the next level or let the CD run.
Note that it is faster to manually step the CD to the next amplitude.
The sweep will continue to take data down to the last track of the
sequence at about a -90 dB level (CBS track 18.13, Philips track 46).
The sweep will not automatically stop, you must press either a Stop
button or the Esc key.
Next go to the Data Editor panel and replace the first column
values with the corrected amplitudes from the test CD documentation.
The EditCol1.apb procedure may be used to expedite this process.
Page 66 Compact Disc Player Tests – Application Note #1A
Page 76
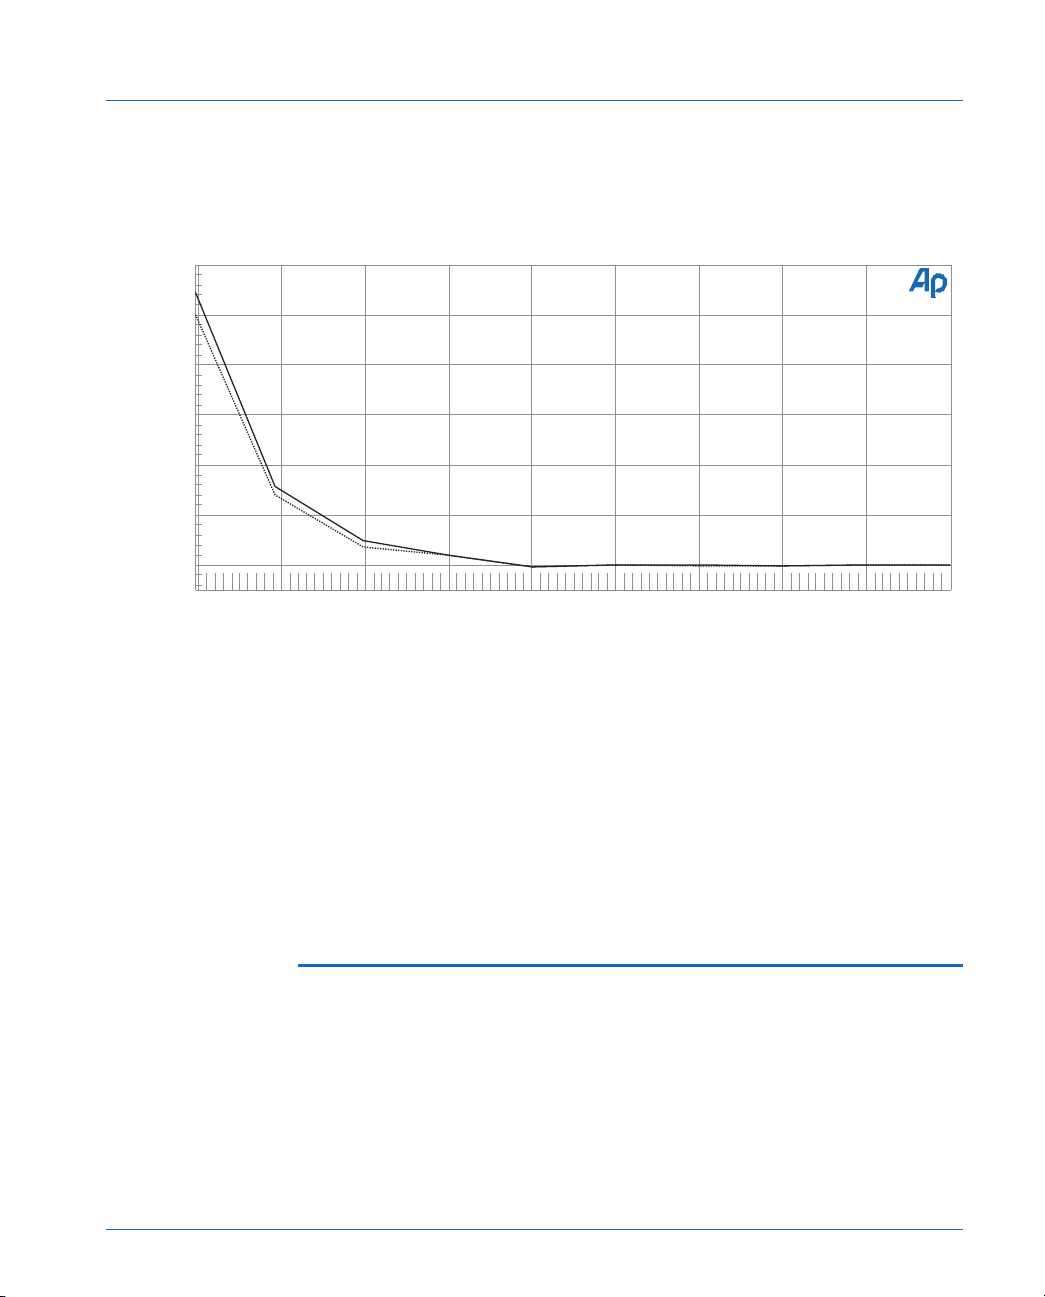
Last select Compute Linearity from the Compute drop-down list
and press the Compute and Close button.
Linearity
Audio Precision
+1.2
L
I
+1
N
E
A
+0.8
R
I
T
+0.6
Y
E
+0.4
R
R
O
+0.2
R
d
+0
B
-90 +0-80 -70 -60 -50 -40 -30 -20 -10
CD LINEARITY - Computed Results
CD absolute amplitude dBFS
CD Linearity
Figure 23 Graph of Analog Level meter controlled sweep from Linarty.at2 Horizontal axis (first column) data
has been replaced with the actual values and Compute Linearity done.
Results
The Fig. 23 full-range linearity graph shows the increasing
non-linearity at low levels with high resolution amplitude scaling on the
vertical axis. The “zig-zag ” of a non-dithered signal is evident. Left
vertical axis scaling may need to be changed for variation in CD player
performance—right-button mouse menu and select Optimize Left.
Linearity Tests with Dither
Dither is a low-amplitude noise signal of at least ±1/2 LSB
amplitude. While dither reduces the ultimate signal-to-noise ratio of the
system, it effectively reduces distortion (improves linearity) at low
amplitudes and extends linear operation below the undithered
theoretical limit. Signals below 1/2 LSB in peak amplitude would never
be converted (recorded) in a non-dithered system. With dither, signals
Compact Disc Player Tests – Application Note #1A Page 67
Page 77

Linearity
at arbitrarily low amplitudes are still converted and recorded since the
dither acts to assure the LSB is continually being toggled. On a
frequency domain basis, dither can be thought of as spreading the
quantization noise across the spectrum, rather than having that energy
all concentrated at harmonics of the signal frequency. In practice, most
digitally recorded program material contains dither, either via
deliberate addition, or simply from noise inherent in the analog
equipment (pre-amplifiers, consoles, etc.) used prior to the A-to-D
conversion
Track 19 on the CBS disc contains four dithered signal levels for
linearity testing at low amplitudes. Three are the same amplitudes as
the last three sections of undithered track 18—at -70.31, -80.77, and
-90.31 dB. The fourth signal on track 19 is at a -100 level. Dither is 1/2
LSB with a uniform probability distribution.
The Philips disc adds two additional low-level amplitude signals
with dither after the conclusion of the stepped amplitude sweep
without dither (Tracks 32 through 46). These tracks (Tracks 47 and 48)
are at -80.70 and -90.31 dBFS levels and are clearly seen in figure 19
as the additional upper pair of lines between the -80 to -90 points on
the graph. These tracks are not at a low enough level to see the
significance of dither to a signal below the theoretical noise floor.
Track 19 of the CBS disk and the dithered low amplitude signals
on the Philips disk can be tested using a modification of the full range
linearity tests described above. The most accurate is Linarty2.at2. The
LinartyD.at2 or .at1 test is not useable down to the -100 level since the
presence of dither is a requirement for the existence of this amplitude.
“Fade-to-Noise” Low Level Amplitude Linearity
The CBS test disc is unique among those listed in that it contains a
low level “Fade to Noise” track with dither added. Track 20 contains a
500 Hz signal, which begins at a -60 dBFS level, and then fades
linearly with time to a -120 dBFS level. The dither has a triangular
probability distribution. The signal fades linearly from -60 dB to -120
dB during 30 seconds (2 dB per second rate) and then repeats a
second time. This is the only CD track known to Audio Precision which
Page 68 Compact Disc Player Tests – Application Note #1A
Page 78
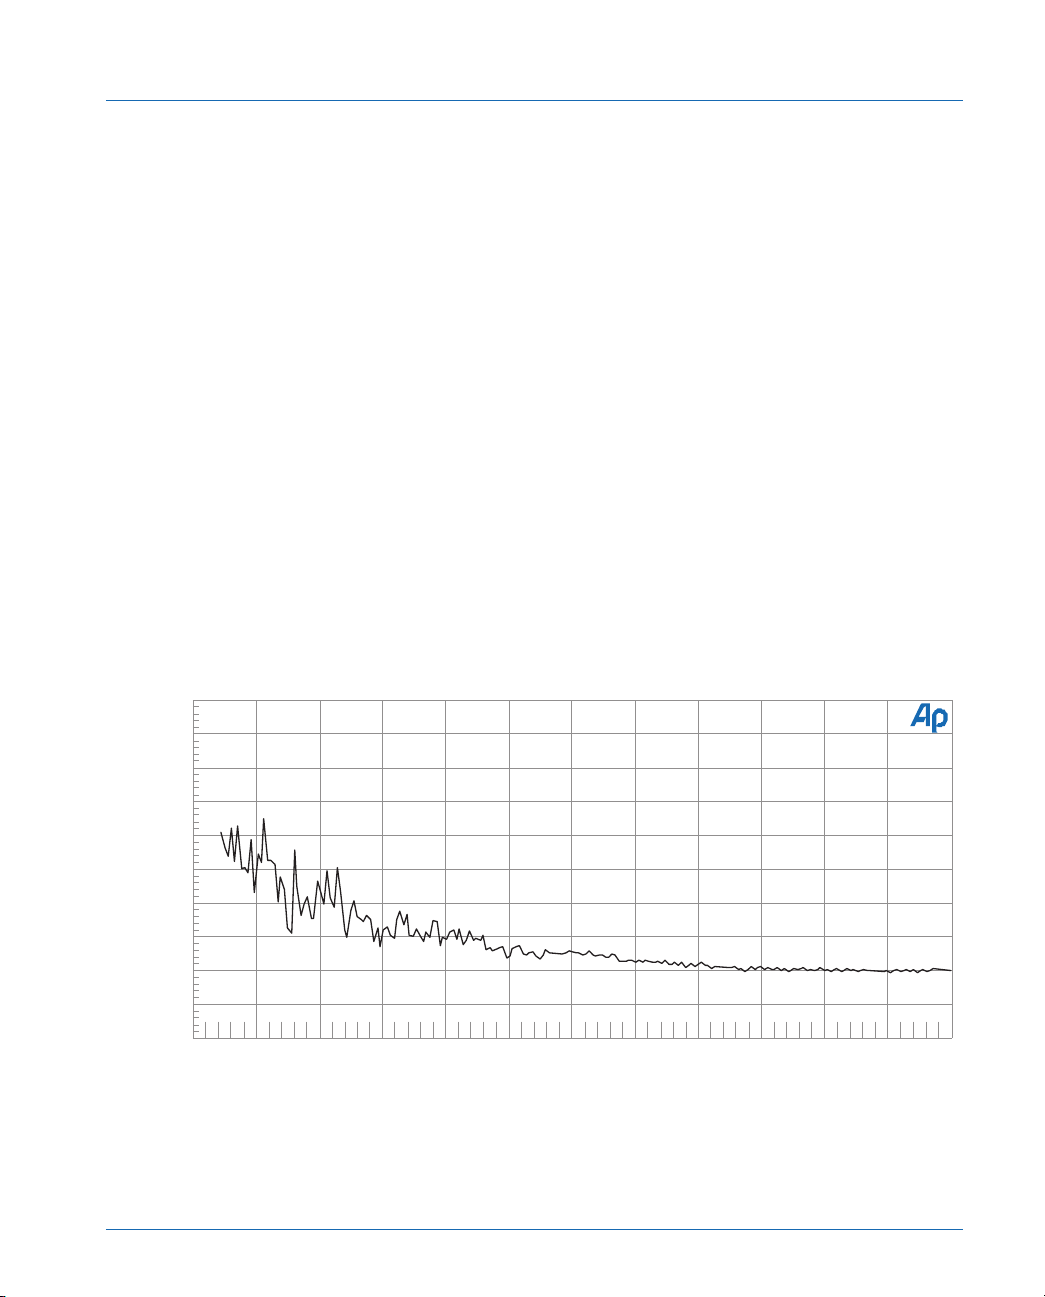
Linearity
permits linearity measurement with better than 10 dB resolution at low
amplitudes.
This track cannot be directly measured with an External Level
sweep selection at Source 1 External Level sweeps use amplitude
changes as measured by the Level voltmeter to drive the data
acquisition process. The Level voltmeter has a bandwidth of greater
than 500 kHz, unaffected by the bandpass filter or any other filter
selection in APWIN. On the lower portions of the fade-to-noise signal
on track 20, the signal is below the wideband noise level and the Level
meter will not detect changes. Instead, this track is measured with an
External Time test. Since the signal fade rate is linear with time, the
time information may then be used to compute the signal amplitude.
Procedures that do this amplitude vs. time measurement and then
calculate the equivalent linearity are supplied with the test files as
CBS20_S1.apb for System One and CBS20_S2.apb for System Two.
See Appendix 2 CD Test Procedures for a description of these
procedures.
Audio Precision CD Linearity
+8
d
+7
B
+6
L
I
+5
N
E
+4
A
R
+3
I
T
+2
Y
+1
E
R
+0
R
O
-1
R
-2
-120 -60-115 -110 -105 -100 -95 -90 -85 -80 -75 -70 -65
LINEARITY -"Fade-to-Noise" CBS CD-1 Track20
CD REFERENCE AMPLITUDES below0 dBFS
Figure 24 “Fade-to-Noise” linearity test result from CBS20_S1.apb using track 20 of the CBS disc. More
than 200 measurements are graphed.
Compact Disc Player Tests – Application Note #1A Page 69
Page 79

InterModulation Distortion
(Sys 1 IMD, Sys 2 S2-IMD) installed can measure most of the
intermodulation distortion test signals on the discs discussed. With IMD
signals of fixed frequency and amplitude, a “spot” measurement of
both channels is appropriate. This provides an integrated measurement
of all IMD products within the analysis bandwidth. This is most easily
accomplished by selecting Single Point at Source 1, even though the
generator will not be used. Single Point automatically uses the Data
Editor display format even though Create Graph may be selected on
the Sweep panel, and produces a single point measurement on one or
both channels.
Setup for SMPTE/DIN/IEC IMD Measurements
DIN-like pair of signals with one low-frequency tone (40 Hz to 500 Hz)
and one high-frequency tone (2.5 kHz or higher), with the amplitude
ratio of the signals anywhere from 5:1 to 1:1 (low-frequency amplitude
to high-frequency amplitude). Example tracks are 13 index 1 on the
CBS, and 54 on the Philips disc, which are standard SMPTE 60 Hz
and 7 kHz mixed 4:1 with maximum at 0 dBFS. Track 40 and 41 on
the Denon disc use a very different frequency pair: 250 and 8020 Hz,
again with a 0 dBFS maximum. Track 30 index 1 on the NAB disk is
also a standard 4:1 60 Hz and 7 kHz but is recorded 6 dB below
maximum level. Figure 25 is an example of the measurements made
with track 54 of the Philips CD. This single point sweep setup is
supplied in the distribution files as SMPTSPOT.at1 and .at2 in the
distribution files.
InterModulation Distortion
System One or System Two with intermodulation analysis options
Figure 25 shows the panel setups for measuring a SMPTE-like or
Page 70 Compact Disc Player Tests – Application Note #1A
Page 80
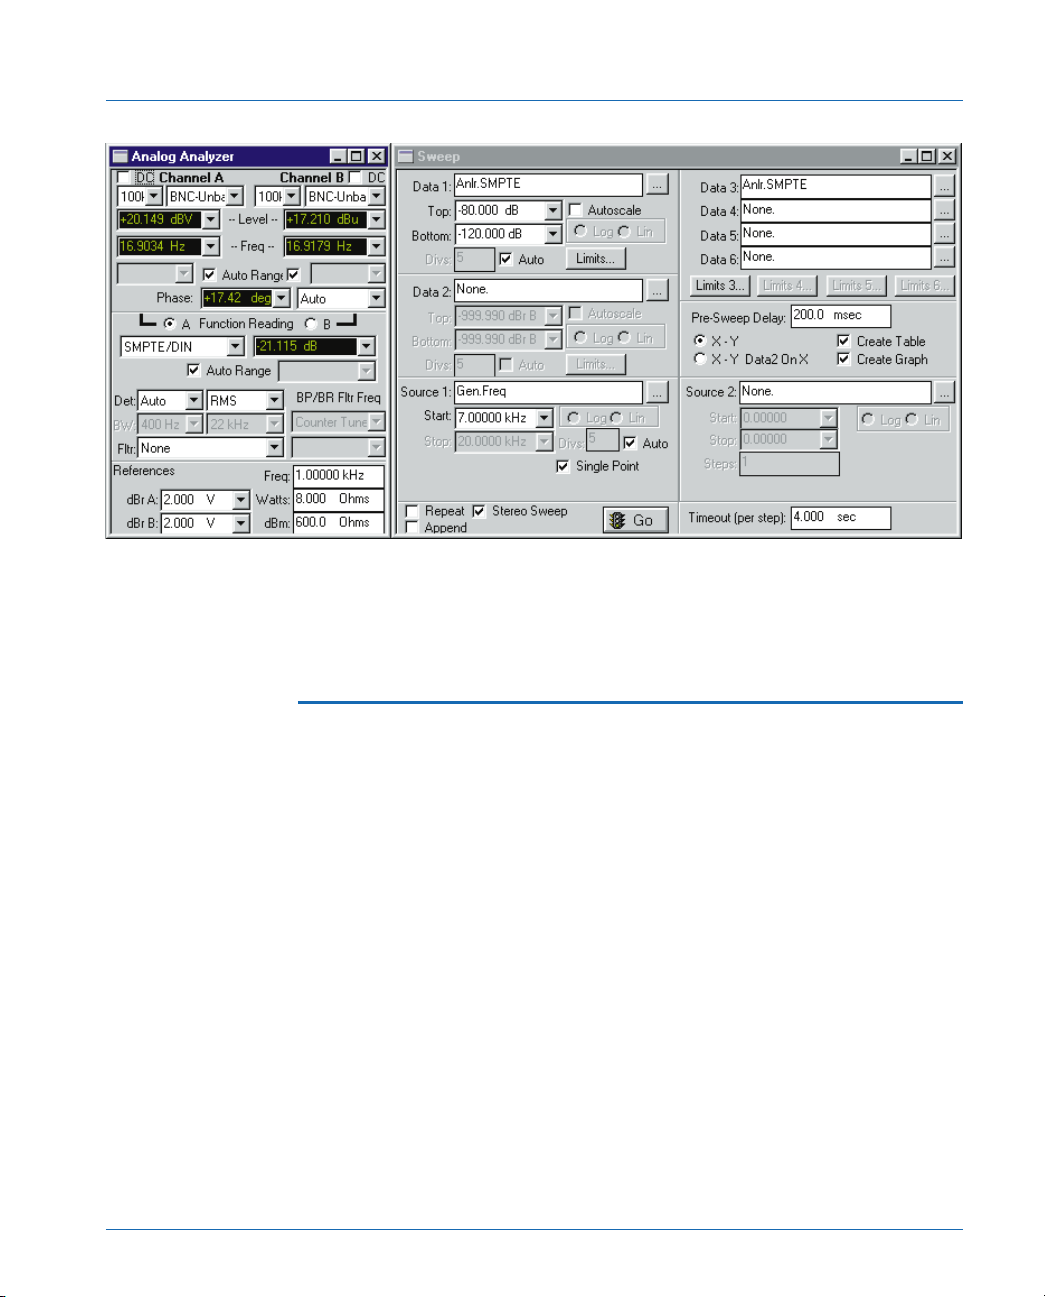
InterModulation Distortion
Figure 25 Set up panels and single-point test result of a SMPTE intermodulation distortion test SMPTSPOT.at2
SMPTE—Spectral Analysis of Intermodulation
Products
The distribution file SmpteFFT.at1 or .at2 is an example of using
the System’s ability to analyze a signal after the Function Reading
meter filters have acted. In this case the residual distortion and noise
components can be seen down to extremely low levels since the
full-range of the FFT digital analyzer is applied to the signal remaining
after the Analog Analyzer has removed the fundamental test tones.
The panel setup for this FFT has several interesting features. In
System Two the Digital Analyzer panel should have the FFT spectrum
analyzer (fft) loaded. Set up the Input field to Low BW (/4) A/D and
the Sample Rate field set to 32 kHz. This sets up the actual sample rate
to 8 kHz. With FFT length of 16384 point this will produce excellent
resolution of the 20 to 720 Hz band set up in the Sweep panel Source
1 area. Using the Blackman-Harris window set Subtract Avg in the
adjacent window. Just below the Avg field is set to 4. This will take 4
Compact Disc Player Tests – Application Note #1A Page 71
Page 81
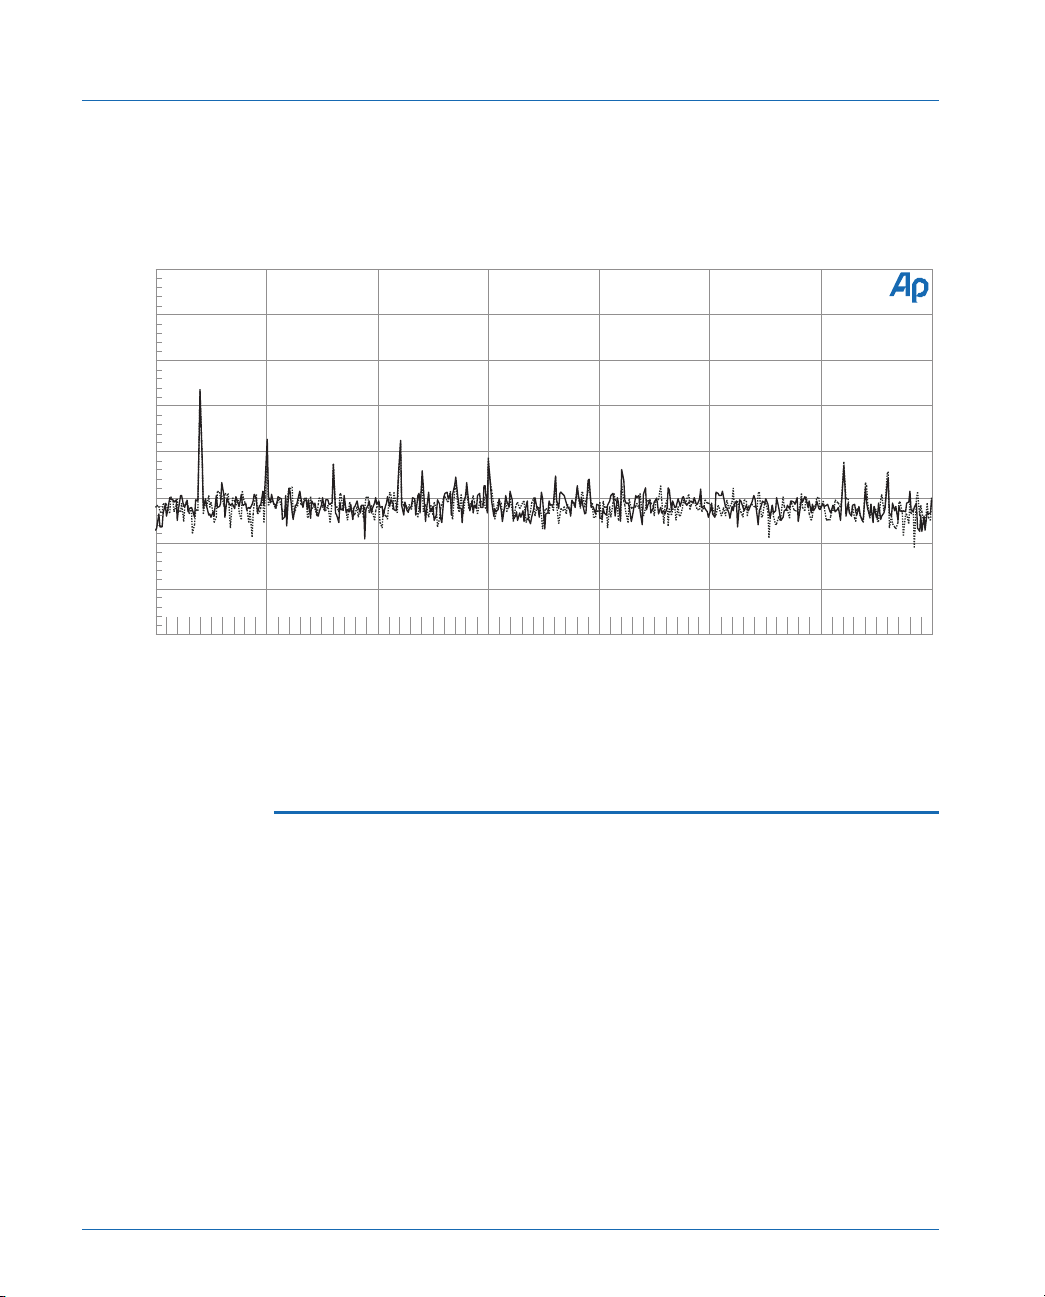
InterModulation Distortion
sets of data and average the data together thus lowering the variability
of the random noise component of the displayed spectrum.
Audio Precision CD SMPTE Intermod Distortion 4 averages
-60
-70
d
B
-80
b
e
-90
l
o
-100
w
0
-110
d
B
-120
F
S
-130
-140
20 720120 220 320 420 520 620
SMPTE IMD Distortion FFT
Hz
Figure 26 FFT of low level components after the Analog Analyzer SMPTE IMD function analyzer has
removed the 60 Hz and 7 kHz tones.
CCIF and DFD IMD Measurements
Figure 27 has the panel setup for CCIF-type measurements with
two equal amplitude, closely spaced tones at a relatively high
frequency. Sometimes called twin-tone this test is usually done with
two frequencies near the upper frequency bandwidth limit of the
system under test. A maximum frequency difference of 1000 Hz is
allowed. The low frequency second order intermodulation product
(difference tone) is analyzed by use of a low pass filter. This test does
not include the third order symmetrical products around the twin tone
frequencies in the measurement result. For the DFD (Difference
Frequency Distortion) version change the Function Reading meter to
the DFD choice. A DFD test will typically produce a number about 6
dB better due to the 6.02 dB calibration difference (IEC 268).
Page 72 Compact Disc Player Tests – Application Note #1A
Page 82
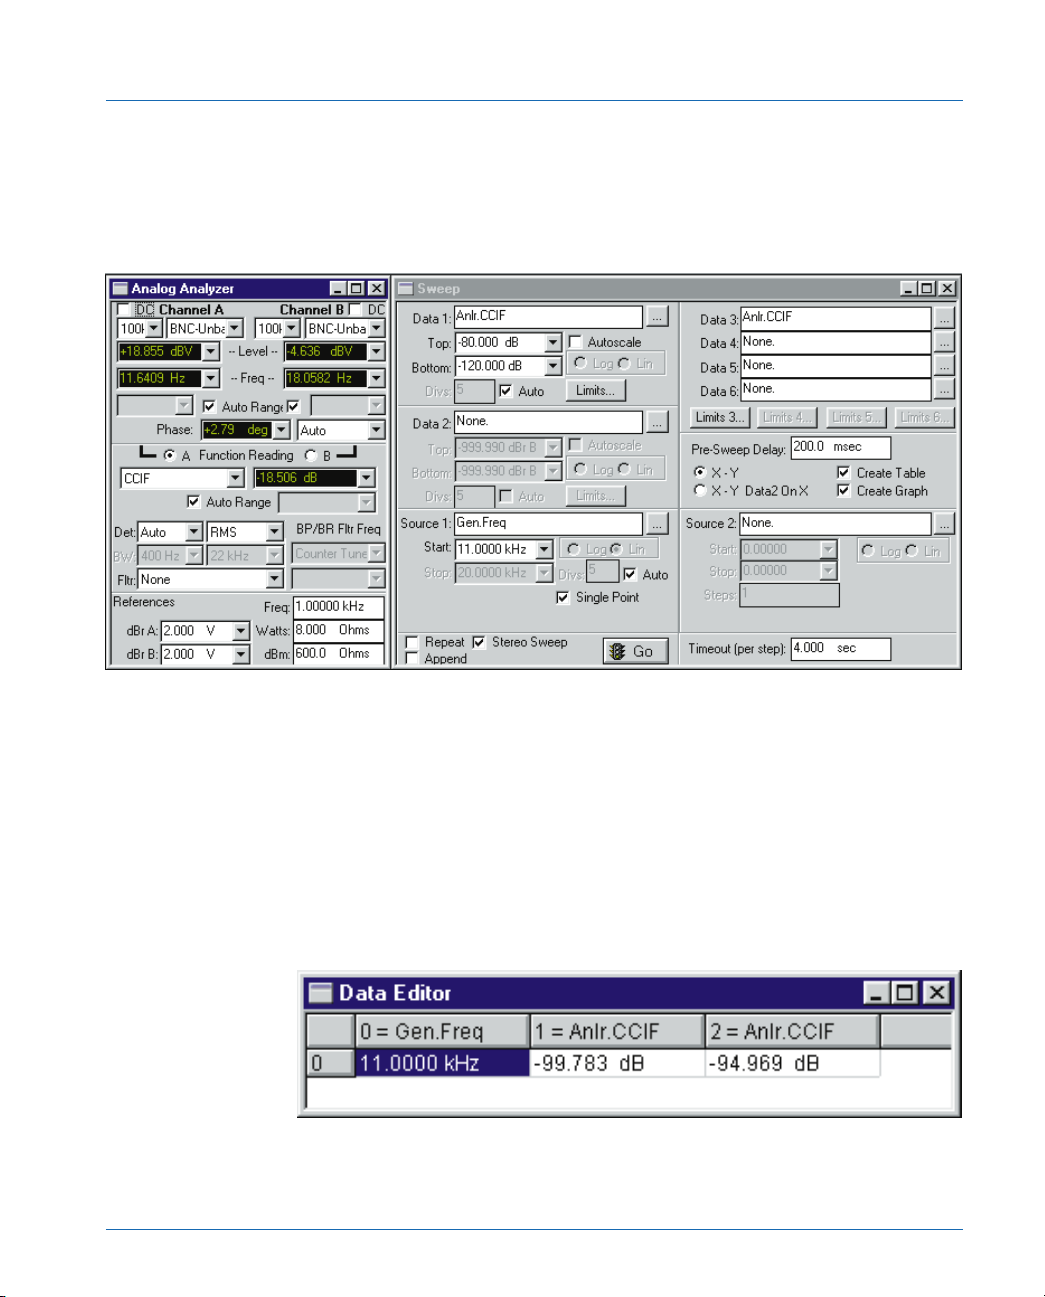
InterModulation Distortion
CCIFSPOT.at1 or .at2 is a single point test for CCIF measurements.
The Function Reading meter can be changed to DFD mode to adjust
for the calibration difference in that standard. This setup is supplied in
the distribution files as CCIFSPOT.at1 or .at2 in the distribution files.
Figure 27 Set up panels and single point test of a CCIF twin-tone intermodulation distortion test.
Testing
CD sources providing 11 and 12 kHz at a 1:1 ratio are—track 13
index 2 on the CBS disc; 43 (left) and 44 (right) on the Denon disc.
On the Nab disk track 35 provides 11 and 12 kHz at a -6 dBFS level.
Track 55 on the Philips disc has 19 and 20 kHz frequencies at 0 dBFS.
Results
Compact Disc Player Tests – Application Note #1A Page 73
Page 83
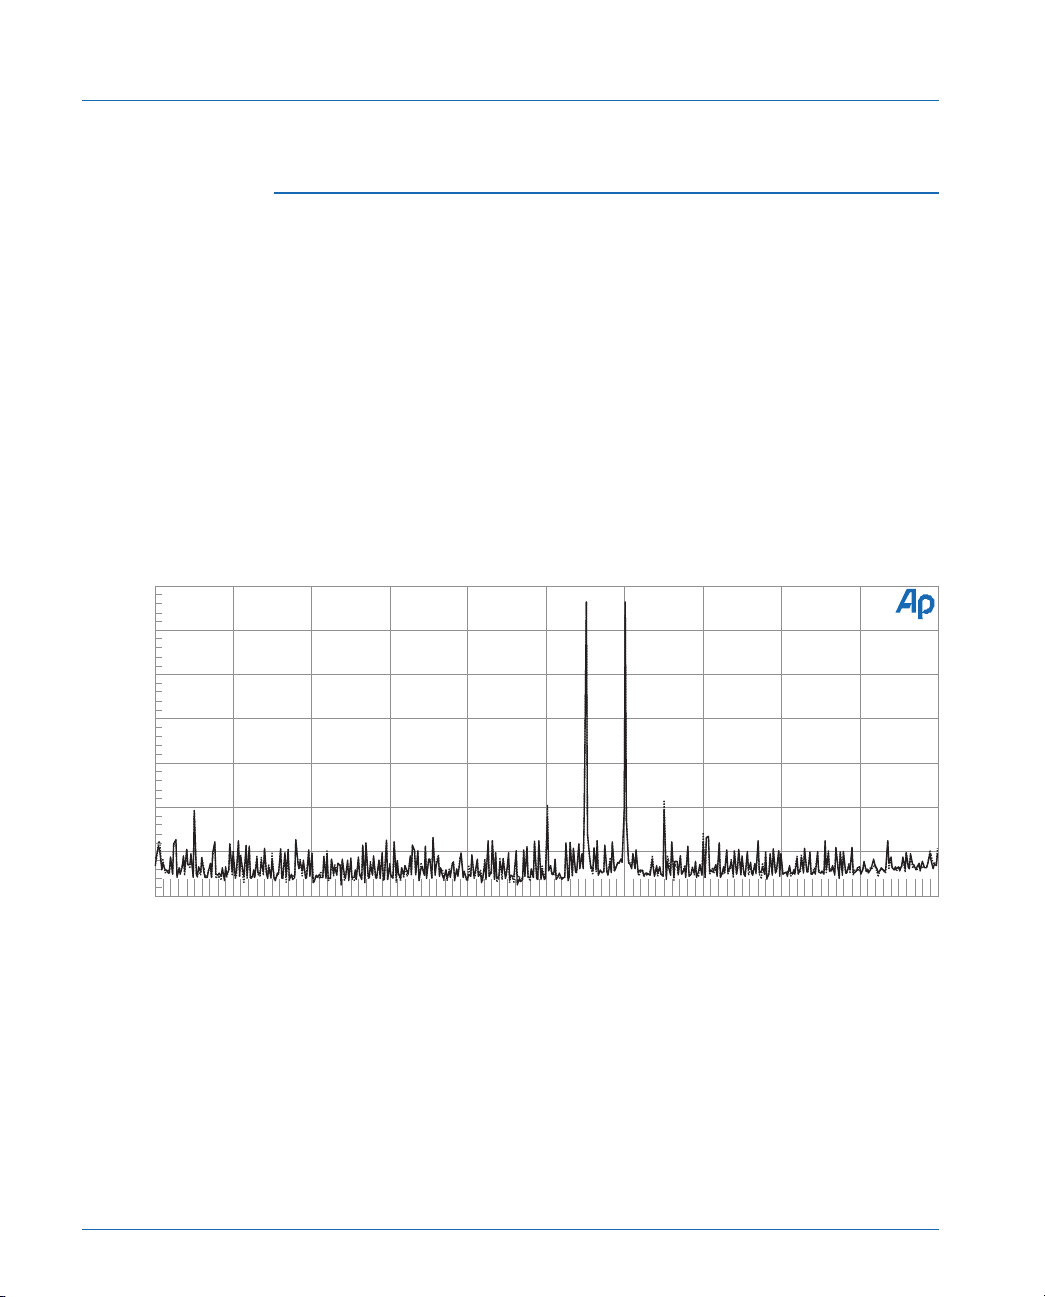
InterModulation Distortion
Spectral Analysis of Harmonics, Intermodulation
and Noise
by doing a spectral analysis of the signal using the DSP based FFT
analyzer. Dynamic range and twin-tone (CCIF/DVD) inter modulation
distortion (IMD) are examples of tests where the distortion and noise
components can be usefully seen in detail at very low levels. The
distribution files test SpectFFT.at1 and .at2 are general purpose FFTs
using the Digital Analyzer. The test uses a 48 kHz sample rate for a
two-channel FFT of the spectrum including the fundamental and
residuals.
Audio Precision CD FFT Spectrum 4 power spectrum averages
+0
d
-20
B
r
-40
A
More information from several of these specialized tests is available
Results
FFT SPECTRUM below 0 dBFS
r
-60
e
f
-80
0
-100
d
B
-120
F
S
-140
2k 20k4k 6k 8k 10k 12k 14k 16k 18k
Hz
Figure 28 shows the results of SpectFFT.at2 used with a twin tone IMD test. The two tones are clearly seen
at 11 and 12 kHz. IMD tones at 1 and 2 kHz spacing can also be seen at -90 and below. Odd order IMD
products can be seen at -90 and below; when 11k and 12k are f1 and f2 the odd order harmonics would be
10k + 13 k, 9k + 14k, etc. The graph data can be made relative to the peak value of the test tones by using
Compute Normalize and setting either the 11k or 12k value to 0 dBr.
Page 74 Compact Disc Player Tests – Application Note #1A
Page 84

Phase Measurements
Phase Measurements
Interchannel phase may be measured and displayed as Data 1 or
Data 2. This will produce a vertical axis display of the degree unit.
Simultaneous collection of the phase data may also be done with other
measurements that use a frequency sweep such as frequency response
or THD+N vs. frequency. In these cases the phase data could be taken
by using Data 2 after the Stereo Sweep box has been checked as in the
FR&Phase test. See Appendix 1 on setting up stereo sweeps.
Most CD players now use dual D-to-A converters with very small
phase error between the channels. The test PHASE.at1 or .at2 displays
phase (5 degrees full scale from a glide tone frequency sweep. This can
be further optimized by mouse right-button click and select Optimize
Left which expands the graph scaling to better display the results. The
dual-purpose test FR&Phase measures both frequency response in
stereo and interchannel phase from a glide tone in a single sweep.
The phase measurement may give an indication of whether the
player has a single D-to-A converter multiplexed between the channels
or two separate converters, though a multiplexed player with time
delay compensation will obscure that fact. If a single D-to-A converter
without delay compensation is used, the amount of measured phase
shift at 20 kHz can indicate whether the player is a single sampling
(44.1 kHz clock), double oversampling (88.2 kHz clock), or quadruple
oversampling (176.4 kHz clock) design. A 44.1 kHz multiplexed unit
with no other significant sources of interchannel time or phase delay
will show about 82 degrees phase shift at 20 kHz. This number derives
from a delay of one-half clock period (11.338 microseconds at the
44.100 kHz clock frequency). At the 50 microsecond period of a 20
kHz signal, the Phase meter expresses the result as
(11.338/50.000)*360 or 81.632 degrees. An 88.2 kHz clocked
converter may show about 41 degrees at 20 kHz (5.7 microseconds
delay), and a 176.4 kHz unit about 20 degrees (2.8 microseconds).
The delay between channels will cause loss of high frequency response
if the two channels are summed for monaural reproduction, as
happens often in broadcasting.
Compact Disc Player Tests – Application Note #1A Page 75
Page 85

Phase Measurements
Setup
Figure 29 shows the Sweep and Settling panels for the
inter-channel phase measurement, assuming that a glide tone sweep
track will be used.
The setup for a glide tone phase test is based on the glide tone
frequency response setup as discussed in the High Resolution
Frequency Response Measurements section. Panel setup is illustrated
in Fig. 3. Referring to the FRQRSPG.at2 test the changes made for the
Phase versus frequency test are on the Sweep panel: set Data 1 to
Anlr.Phase and Top and Bottom values of ±5 degrees respectively.
These are the same parameters that are entered into Data 2 in the
FR& Phase.at1 or .at2 tests.
Testing
Use the glide tone sweep used for the frequency response test. CBS
track 11, Denon track 65, NAB track 7 or Philips track 5 or 6.
Page 76 Compact Disc Player Tests – Application Note #1A
Page 86
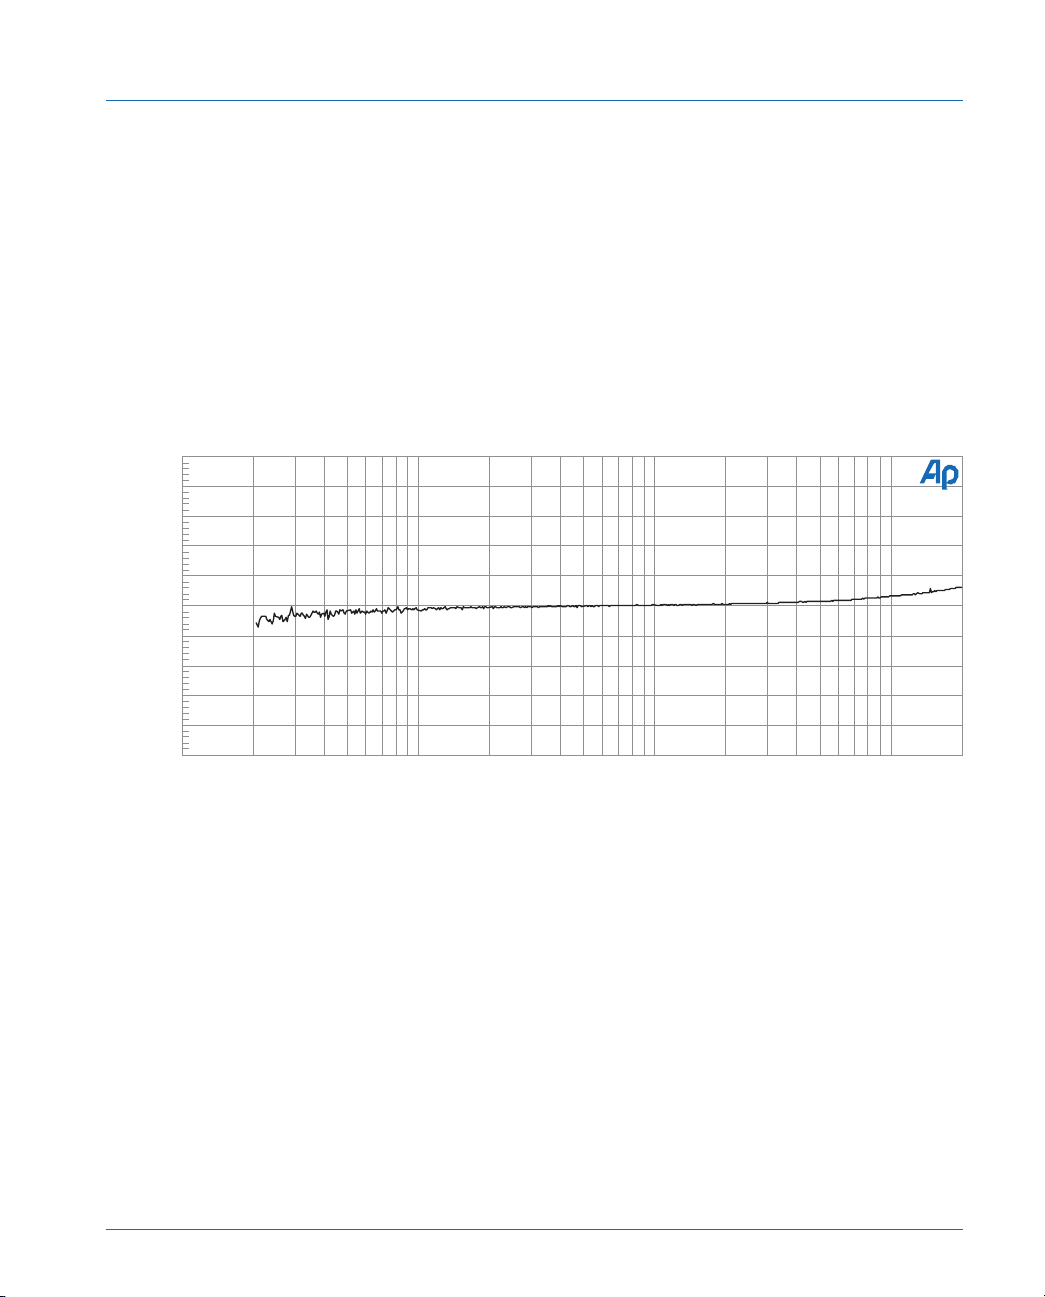
Phase Measurements
Results
Figure 29 is a test graph made with track 5 of the Philips disc,
displaying inter-channel phase of a small portable oversampling player.
This test setup and data is stored as PHASE.at1 or .at2 in the
distribution files. On most players measured, the departure from linear
phase difference is less than five degrees at high frequencies.
Audio Precision CD Interchannel (Relative)Phase - Glide Tone
+5
L
+4
t
+3
o
+2
R
+1
P
+0
h
a
-1
s
e
-2
-3
d
-4
e
g
-5
10 20k20 50 100 200 500 1k 2k 5k 10k
InterchannelPhase
Hz
Figure 29 Simple inter-channel phase test - PHASE.at2. This test can be easily added to a glide-tone
frequency response measurement - see FR&Phase.at1 or at2.
Compact Disc Player Tests – Application Note #1A Page 77
Page 87
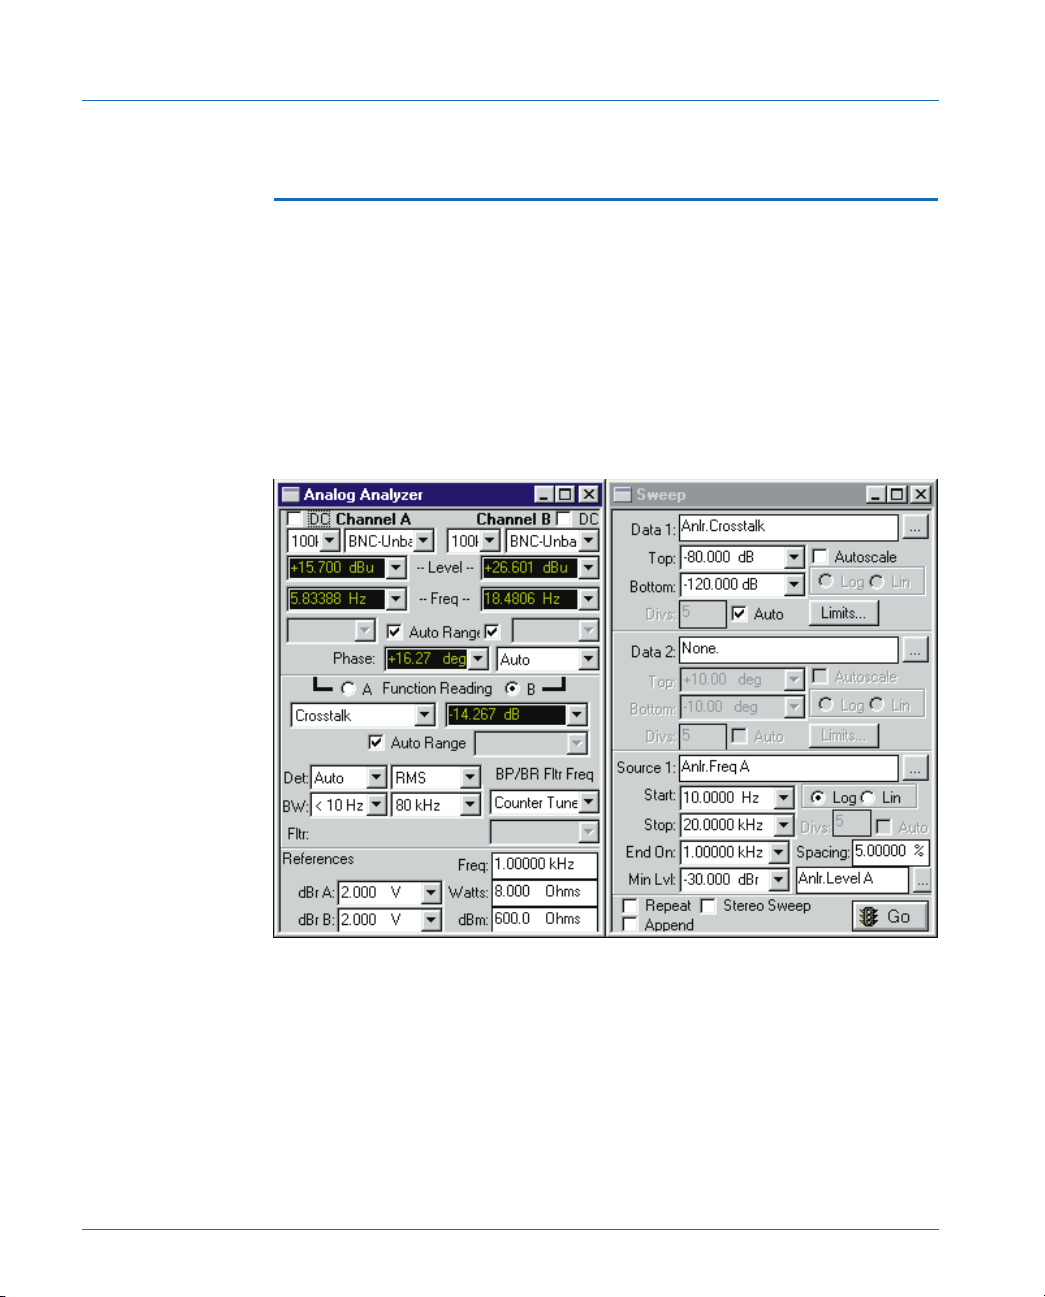
Stereo Separation
Stereo Separation
Stereo separation can be measured using any CD track or series of
tracks with test frequencies recorded at maximum level on only one
channel. CD sources are CBS CD-1 track 2 and 3, Denon tracks 18
through 27 and Philips tracks 66 through 73. In the CBS disc the tones
are not in monotonic order and consequently require index selections
out of order. The Denon disc alternates left and right channel signals
so that every other track must be selected for a sweep. The Philips disc
tracks are in ascending frequency order but there are only four
frequencies available.
Figure 30 shows the panels for a separation test. SEP_L-R.at1 or .at2
(SEParation_Left-Right) in the distribution files has the test setup shown.
Setup
a. On the Analog Analyzer panel select Crosstalk from the Function
Reading meter drop-down list and set the Function Reading
meter channel to the input which does not have signal recorded
Page 78 Compact Disc Player Tests – Application Note #1A
Page 88
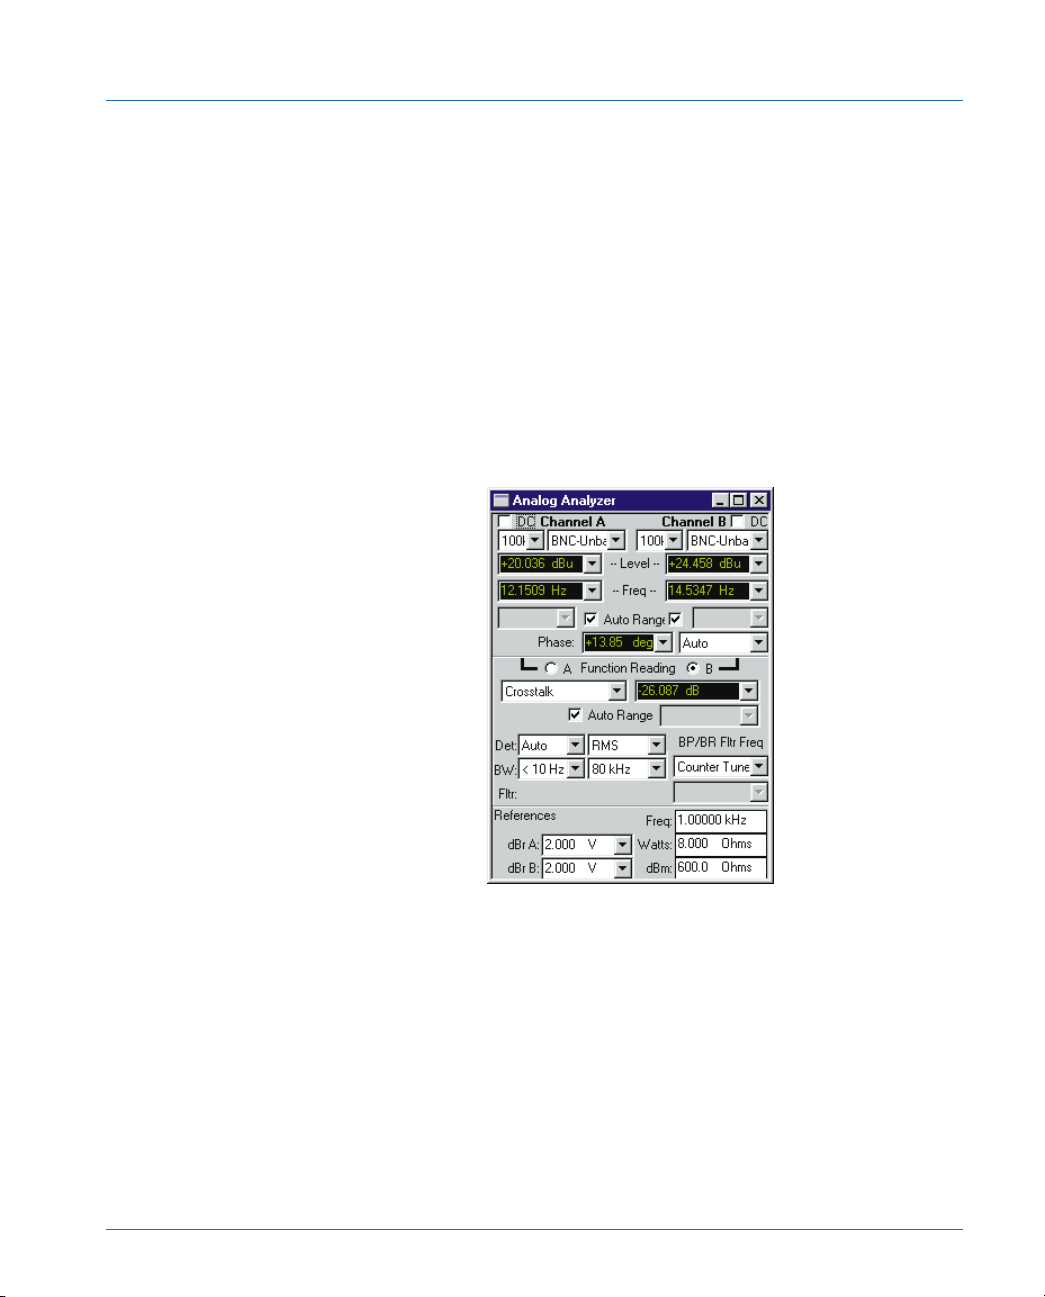
Stereo Separation
(B channel in this case). Assuming that the CD player left
channel is connected to the systems A input and right channel to
the B input, select B Crosstalk while playing tracks recorded on
the left channel only. In Crosstalk mode, the Function Reading
meter in Bandpass mode is connected to the selected channel,
while the Level meter and frequency counter are connected to
the alternate channel. The frequency counter can thus steer the
bandpass filter to the frequency of the recorded signal on the
driven track, the Level meter measures the amplitude of the
driven track, and the Function Reading meter measures the
non-driven track with the bandpass filter selectivity
discriminating against wideband noise.
The BP/BR must be set to Counter Tuned to permit the filter to
be steered by the frequency counter.
b. On the Sweep panel select Anlr.Crosstalk for Data 1 and select
the dB unit. This directly measures the difference in amplitude
between the Function Reading and Level meters. The level in
the driven channel is the reference.
Compact Disc Player Tests – Application Note #1A Page 79
Page 89
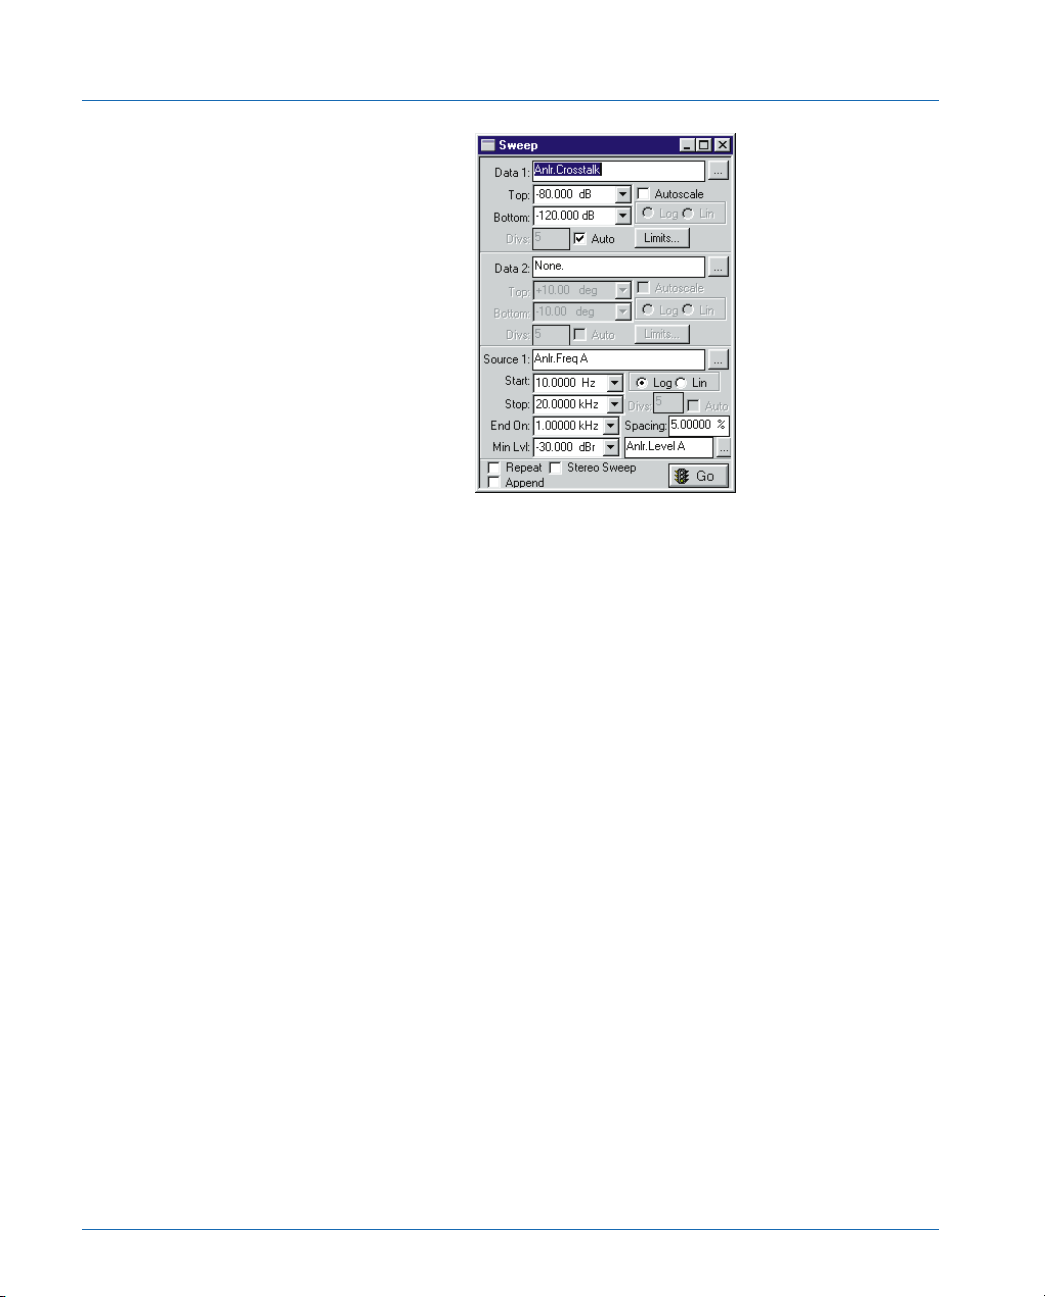
Stereo Separation
The Source 1 settings are nearly identical to all the other External
Frequency sweeps across a series of fixed-frequency tracks
described earlier.
c. Select an Amplitude Tolerance on the Settling panel such as 10%
(1 dB) to provide rapid settling on the noisy signal on the
non-driven channel.
To measure separation from right to left, change the channel
selection for the Function Reading meter on the Analog Analyzer
panel from B to A. This test is supplied as SEP_R-L.at1 or at2.
To display both measurements on the same plot change the
channel from B to A, check the Append box at the bottom of the
Sweep panel and test (F9 or GO).
Testing
The Separation tests present some problems since some CDs do
not present the single channel tones in a consistent frequency order.
The easiest is the Philips disc where tracks 66 through 69 are played in
order for Left-to-Right measurements and 70 through 73 are played for
Right-to-Left measurement. On the CBS disc index changes are
required to access the tracks in the correct order. The Left-to-Right test
must be done by playing track 2 index 2 first followed by index 2.1,
skip 2.2, then play 2.3 and 2.4. Similarly, the Right-to-Left test is done
by first playing track 3 index 2 followed by 3.1 and then 3.3 and 3.4.
Page 80 Compact Disc Player Tests – Application Note #1A
Page 90
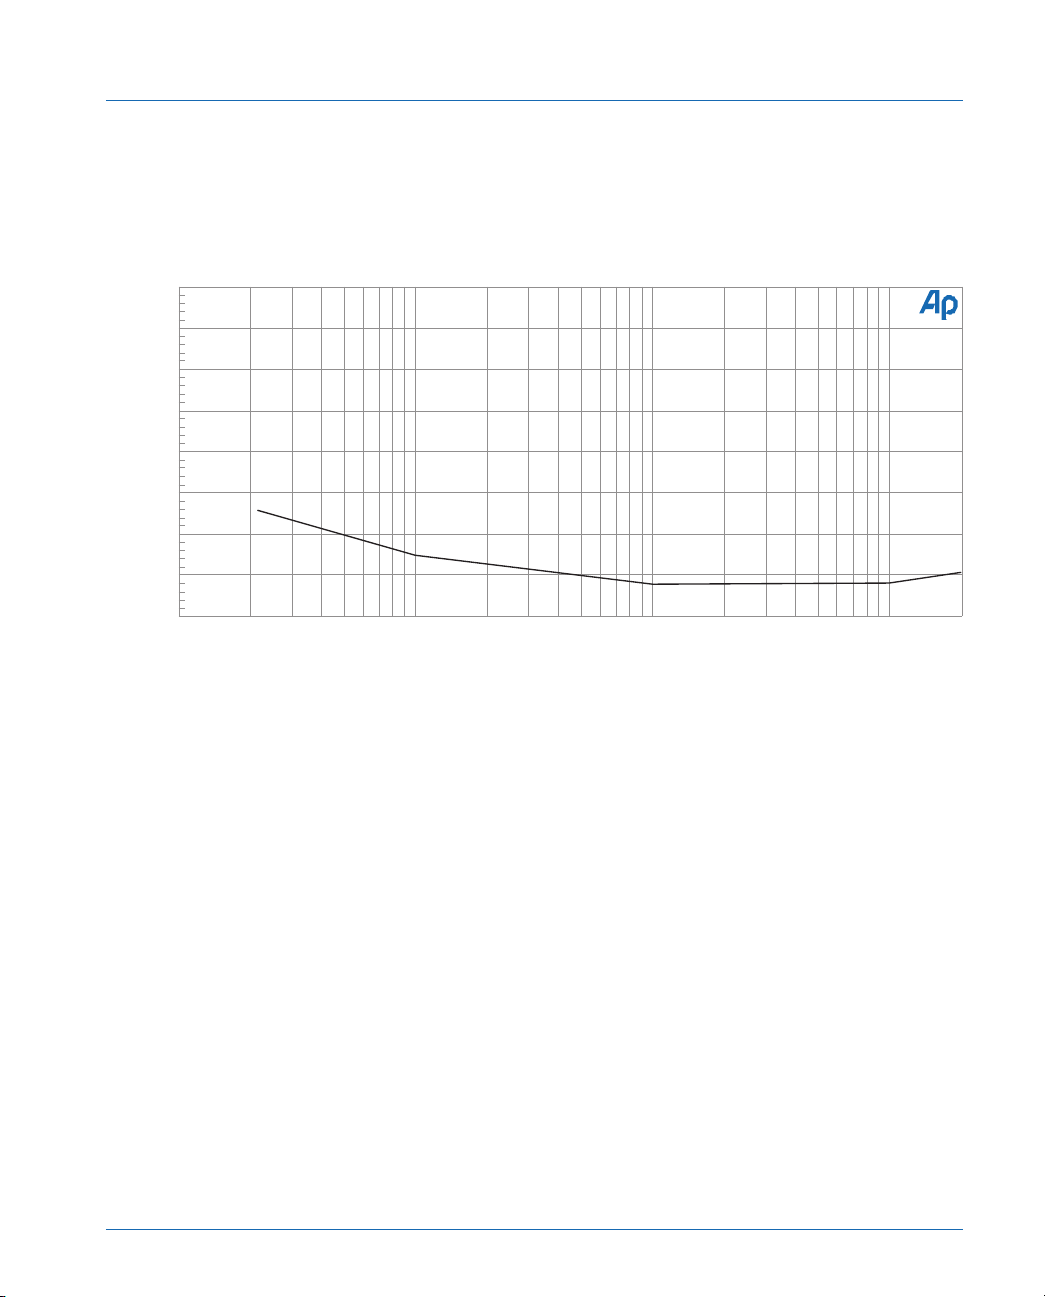
On the Denon disc track changes are required: For Left to-Right start
with 26, then in order, tracks 22, 18, 20, 24. For the Denon
Right-to-Left test first play 27, then in order, 23, 19, 21, 25.
Audio Precision CD Crosstalk Left (Ch A) to Right (Ch B)
-80
X
T
-85
A
L
K
-90
d
-95
B
-100
r
e
f
-105
C
-110
H
A
N
-115
A
-120
10 20k20 50 100 200 500 1k 2k 5k 10k
CROSSTALK vs. FREQUENCY Ch A to Ch B
Hz
Figure 31 is a graph of left-to-right separation using the CD left channel only signals.
Stereo Separation
Results
Since a CD is not based on magnetic media the low frequency
crosstalk mechanism of analog tape recorders caused by low frequency
magnetic fields being read by adjacent tracks is not present. However,
AC power mains related frequencies can increase readings at low
frequencies. Testing for electronic crosstalk is sometimes done as a
single frequency test at 10 kHz or higher since normally electronic
crosstalk increases with frequency. Complex factors can influence
crosstalk so it is still worthwhile to investigate the whole spectrum.
Compact Disc Player Tests – Application Note #1A Page 81
Page 91

Frequency Accuracy
Frequency Accuracy
The measured frequency accuracy of most tracks, test discs and CD
players is quite high. Figure 32 shows the panel setup and
measurement result of a CD player frequency accuracy test using the
System’s relative frequency measurement capability. The Data Editor
shows the directly measured frequency in column 2 and the difference
in percent from the reference frequency in column 3. The reference
frequency value is in the References Freq. field in the section at the
bottom of the expanded Analog Analyzer panel. This test is supplied in
the distribution files as FREQACUR.at1 or at2. The CBS disc contains
track 10 with a precision 19997 Hz signal. The Denon disc track 24
and NAB track 5 are 19,999 Hz. The Philips SBC429 is 20 kHz. The
same test could be used with other frequencies by changing the value
in the References Freq. field to correspond to the CD data for the track
in use. It is also useful for future reference to set the Start frequency
field in the Sweep panel so that the frequency reference is in the Data
Editor in column one. Other CD tracks that may be used are listed in
the legend in the FREQACUR. tests.
Setup
a. On the Analog Analyzer panel enter the reference frequency
from the CD data sheet for the track to be used in the Analog
Analyzer References Freq field and as the Start value for Source
1 in the Sweep panel.
b. On the Sweep panel select Anlr.Freq.A at Data 1 with delta % as
the units (use Anlr.Freq for System One). This expresses the
measured frequency in terms of percentage deviation from the
References Freq value. Select the same measurement again for
Data 2 but use Hz as the unit to include the actual measured
frequency in the data. Select Single Point at Source 1 for a single
point measurement. Enter the reference frequency from the CD
track used in the Source 1 Start field so that the reference
frequency is also part of the test data. This setup then lists the
reference frequency, the measured frequency difference in per
Page 82 Compact Disc Player Tests – Application Note #1A
Page 92
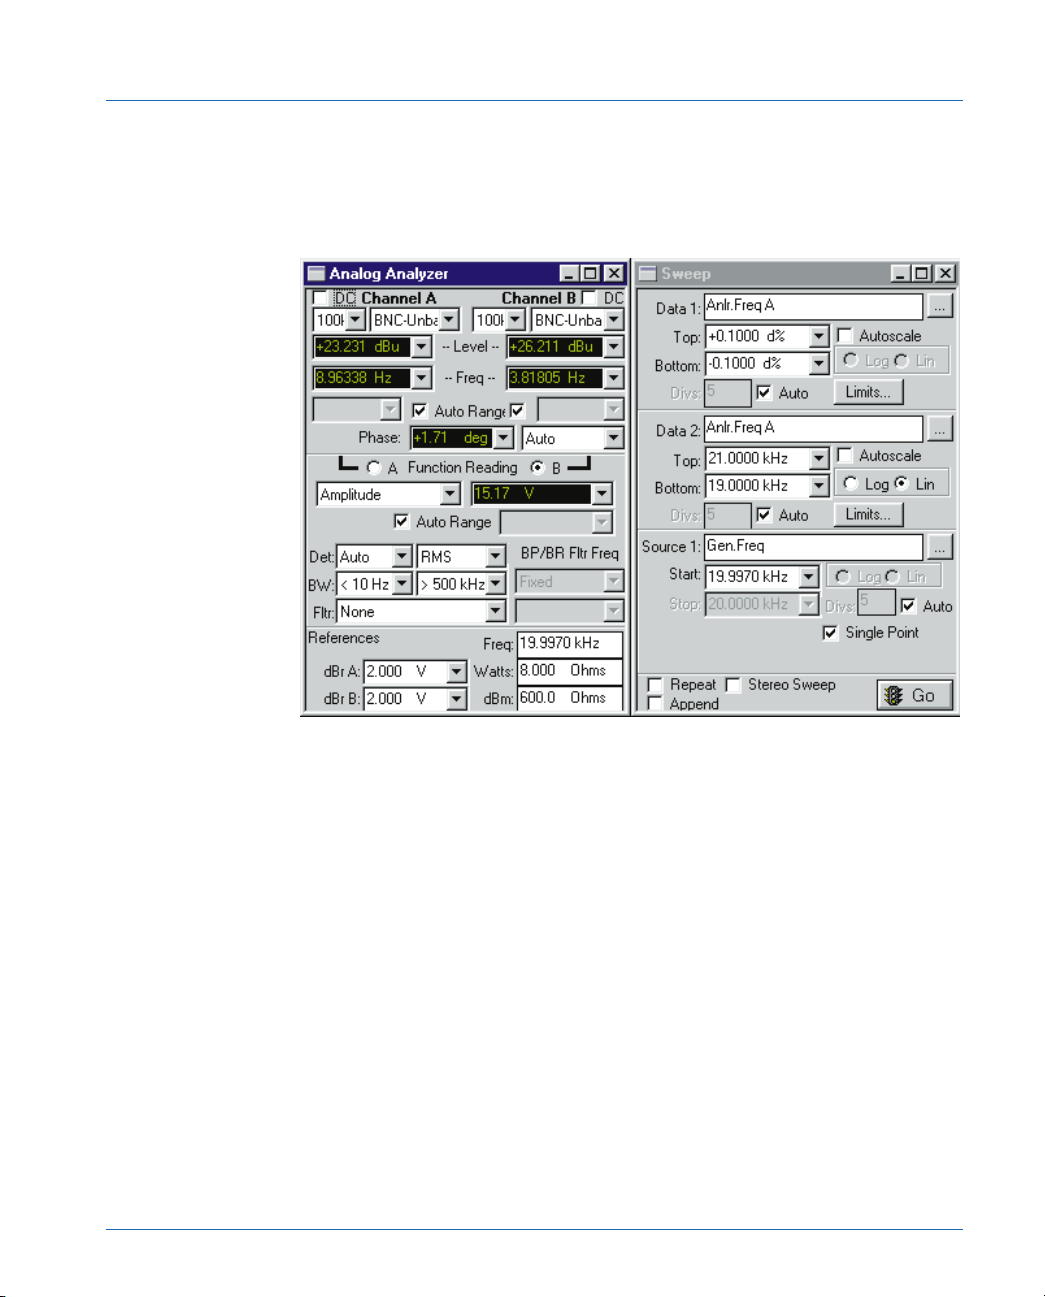
Frequency Accuracy
cent and the measured frequency in Hz in a single line of data in
the Data Editor panel when the test is run.
c. On the Settling panel enter a tight Tolerance such as 0.001% for
Frequency A (Frequency in System One).
Figure 32 Set up panels and single-point test results for frequency accuracy FREQACUR.at2.
Testing and Results
Play the CD track and press F9. Figure 32 is the result of this test
on a common CD player. The accuracy of the internal reference
oscillator of the CD player is the variable in this test. These are usually
crystal locked but, damage or circuit failure is possible. Page 2 of the
test has been set up with two bar-graphs to display the frequency and
the frequency delta percentage.
Compact Disc Player Tests – Application Note #1A Page 83
Page 93
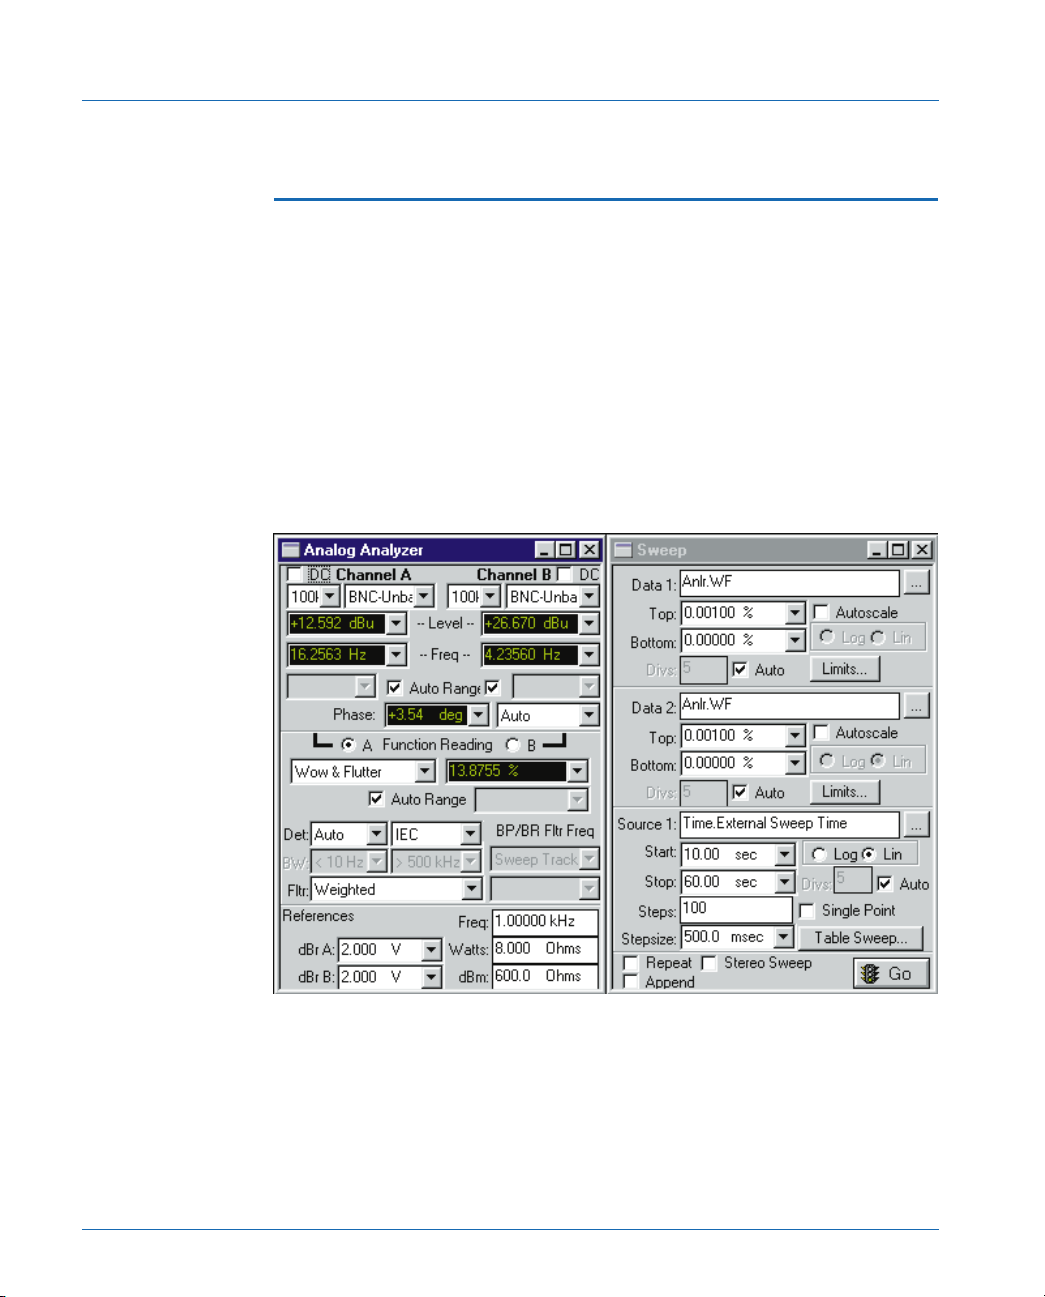
Wow And Flutter Tests
Wow And Flutter Tests
The fundamental physical mechanisms that produce wow and
flutter in analog tape machines and turntables do not exist in CD
players. Even if there were instantaneous short-term variations in the
speed of the disc rotation, they would not translate into pitch
(frequency) changes since data is actually clocked into the D-to A
converter(s) at a quartz-crystal-based rate. However, the EIAJ has
detailed a test procedure for wow and flutter. Many discs have tracks
intended for use as a source for the 3 kHz or 3.15 kHz frequency used
for Wow and Flutter tests of other devices. The CBS CD-1 track 14,
Denon track 91 and NAB track 72 provide the 3150 Hz tone used for
this test.
Figure 33 Wow and Flutter test panels
Setup
Figure 33 shows the panels for WOW&FLUT.at1 or .at2 in the
distribution files which makes the measurement as specified by the
Page 84 Compact Disc Player Tests – Application Note #1A
Page 94
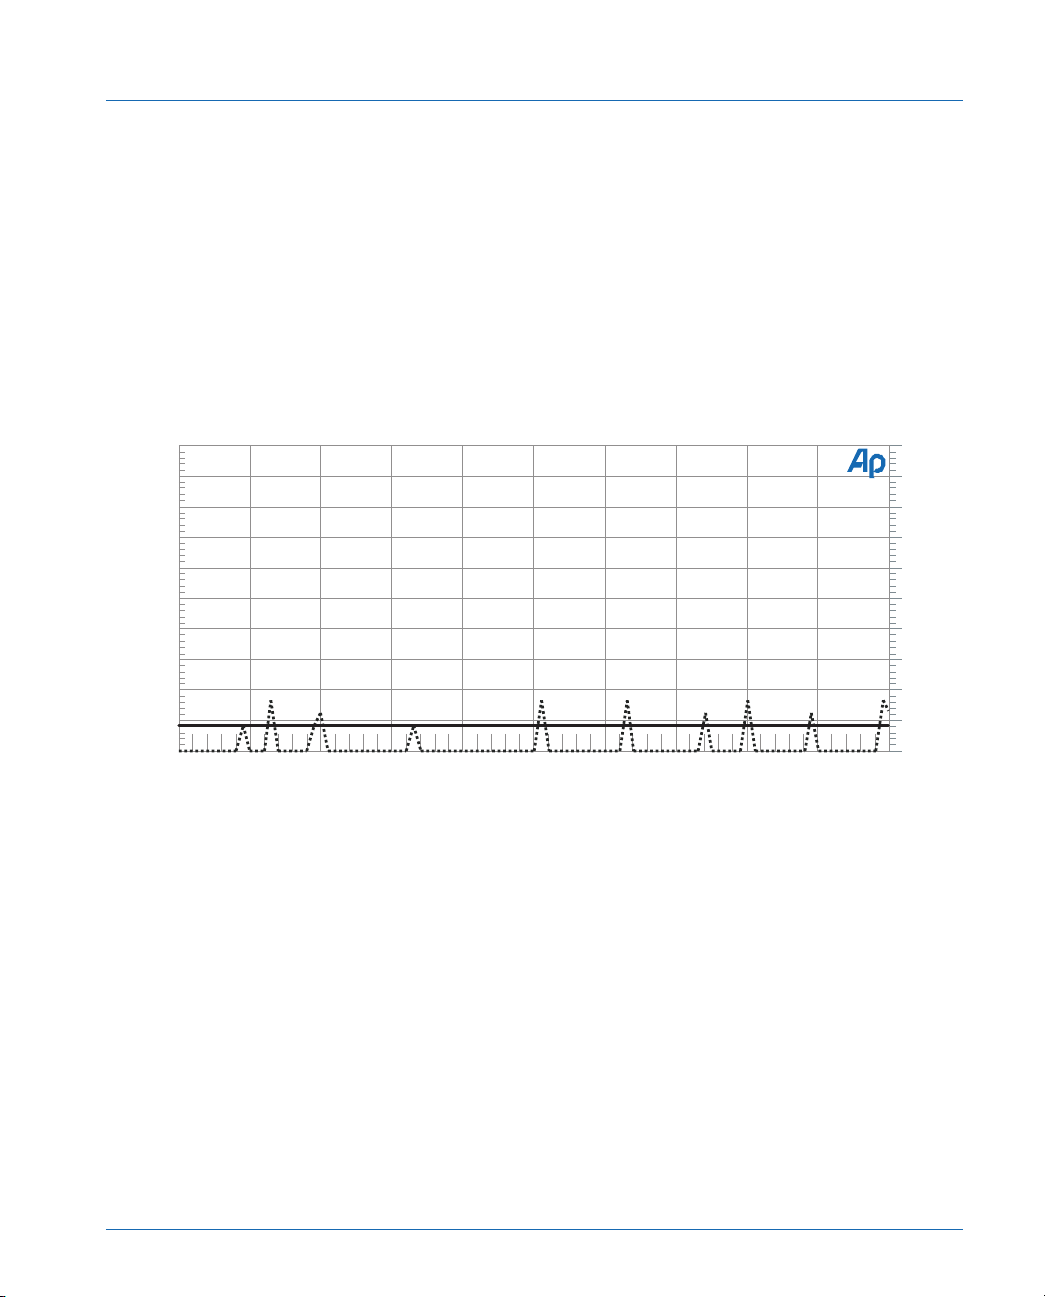
Wow And Flutter Tests
EIAJ standard. This standard refers to the IEC 386 standard (peak
detector, weighted) for wow and flutter measurement specifications.
WOW&FLUT.at1 or .at2 is a time chart recording for 20 seconds. The
EIAJ specifies measurements to be made for at least 5 but not more
than 30 seconds. Note that the long time constant required of a wow
and flutter detector will produce a decaying transient at the beginning
of most wow and flutter tests. It is thus normally desirable to set the
time chart axis to not begin until perhaps five seconds after the
beginning of the test so that this transient can die away.
Audio Precision CD - Wow + Flutter vs Time and 2 Sigma value
0.001
0.0009
0.0008
0.0007
0.0006
0.0005
%
0.0004
0.0003
0.0002
0.0001
0
10 6015 20 25 30 35 40 45 50 55
sec
Figure 34 is a graph of a wow and flutter measurement versus time - WOW&FLUT.at2.
0.001
0.0009
0.0008
0.0007
0.0006
0.0005
0.0004
0.0003
0.0002
0.0001
0
%
Results
A plotted graph line below the System One or Two guaranteed
residual of 0.001% is typical for high quality players, unless an isolated
noise impulse causes a spike. The EIAJ specifies that spikes occurring
less than twice in ten seconds should be ignored. An alternative to
manual interpretation of the graph is use of the Compute 2-Sigma
function. The 2-Sigma value for a series of wow and flutter
measurements is defined as the magnitude value which is exceeded
exactly five percent of the time. The WOW&FLUT.at1 or .at2 tests in
the distribution files displays both the raw data and the 2 Sigma
Compact Disc Player Tests – Application Note #1A Page 85
Page 95

Wow And Flutter Tests
computed value. Noise spikes may be clearly seen while the 2-Sigma
value is usually zero.
Page 86 Compact Disc Player Tests – Application Note #1A
Page 96

Waveform Display
Waveform Display
An additional test is supplied in the distribution files that requires
the DSP or Dual Domain version of the Systems for display of
waveform information in an oscilloscope style display. O’scope.at2 and
.at1 is setup as a repeating sweep and is useful for viewing square
wave response and polarity and impulse test signals. Principal factors
involved in setup are:
a. Notice that the Analog Analyzer panel is set with fixed Level
meter ranging of 10 Volts. This prevents the Level meters from
“chasing” a low frequency voltage and prevents range switching
within a sweep. Since Auto Range is off some care must be
observed if higher voltage inputs are planned. A safe way of
determining range is check the Level meter’s Auto Range boxes,
supply the signal to be used at it’s maximum amplitude and,
while the signal is present, uncheck the Auto Range boxes. This
captures the correct range for the meters. The Analog Analyzer
DC check boxes at the upper corners of the expanded panel
control whether the input signal to the DSP is AC or DC
coupled.
b. The FFT Spectrum Analyzer (Spectrum Analyzer (fftslide) in
System One) program is used in the Digital Analyzer with the
low BW (1x) A/D selected (A/D in System One). Note that in
System Two the other two A-to-D converters can also be used to
give a wide choice of possible measurements and resolution. If
either the /4 or the 4x A-to-D converters is used the actual
sample rate will be either one-fourth or four times respectively
that shown in the Sample Rate window. Anlr A and Anlr B are
selected as the Sources for the FFT. The maximum FFT Length
available should be selected. Wave Display is set to interpolate.
The Trigger sub-section allows control of triggering similar to
oscilloscope trigger control.
c. On the Sweep panel Data 1 (left vertical axis) Top is set with
positive Voltage values and Bottom in negative Voltage values.
These settings can also be used to asymmetrically offset the zero
voltage level. A dual trace can be set up by either selecting the
Compact Disc Player Tests – Application Note #1A Page 87
Page 97
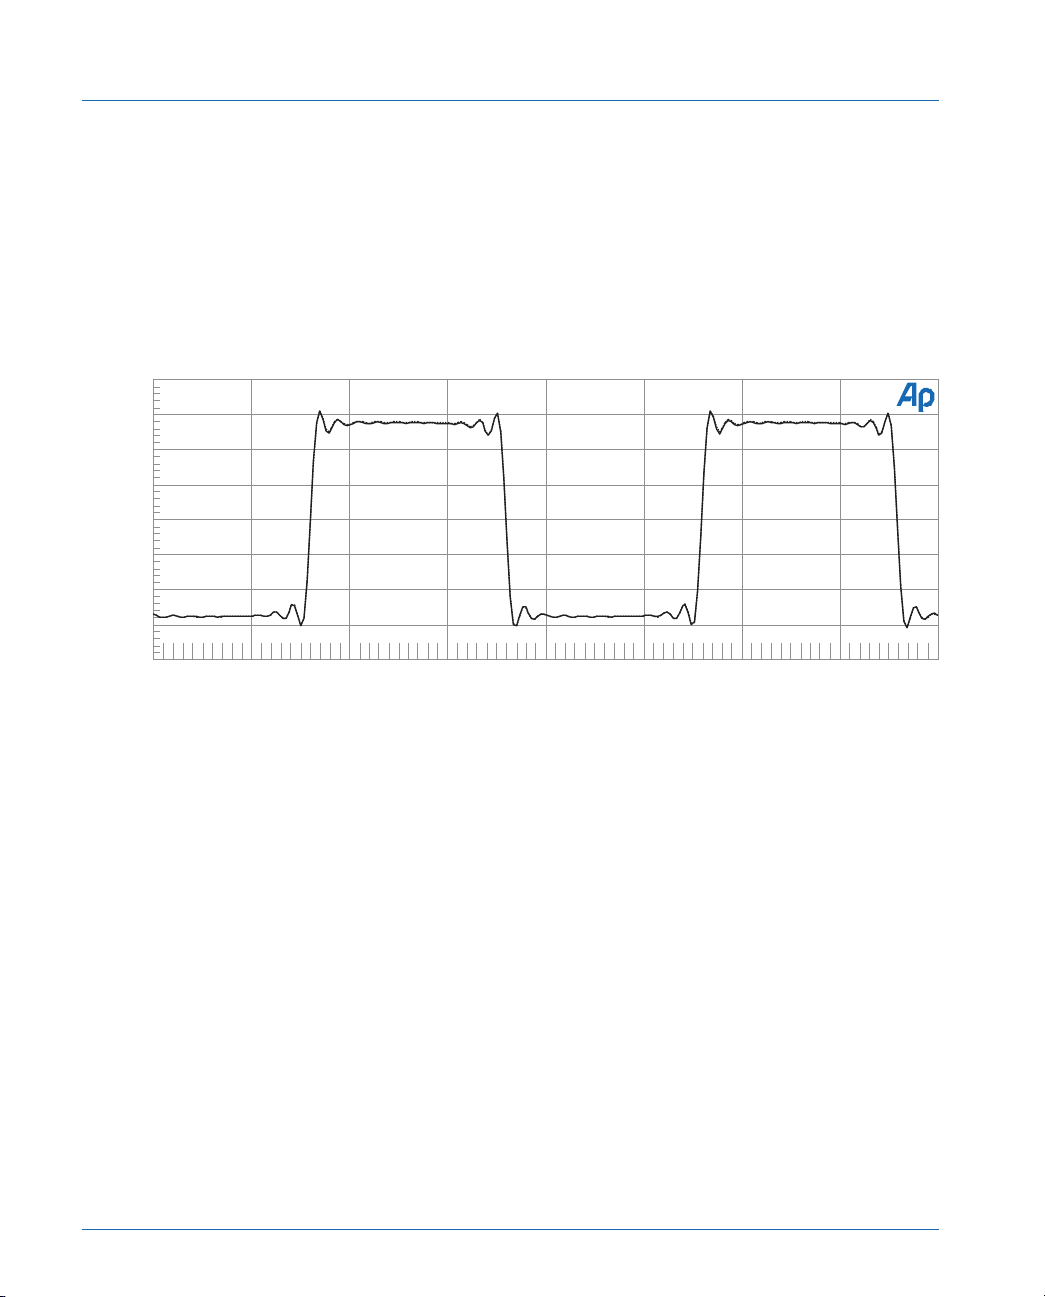
Waveform Display
4
3
2
1
0
V
-1
-2
-3
-4
0 2m250u 500u 750u 1m 1.25m 1.5m 1.75m
Stereo Sweep check box—which will show two traces on the left
axis—or setting up Data 2 (right vertical axis) to shift the 0
voltage level or set a different amplitude range. Source 1 is set to
fft.FFT Time for a time display on the horizontal axis. The time
range will vary depending on the waveforms viewed. A large
number of points (500 or more) will display better detail.
Audio Precision Waveform Display
Time Domain Display of Signal
sec
Figure 35 Square wave waveform display from O’scope.at1
Page 88 Compact Disc Player Tests – Application Note #1A
Page 98
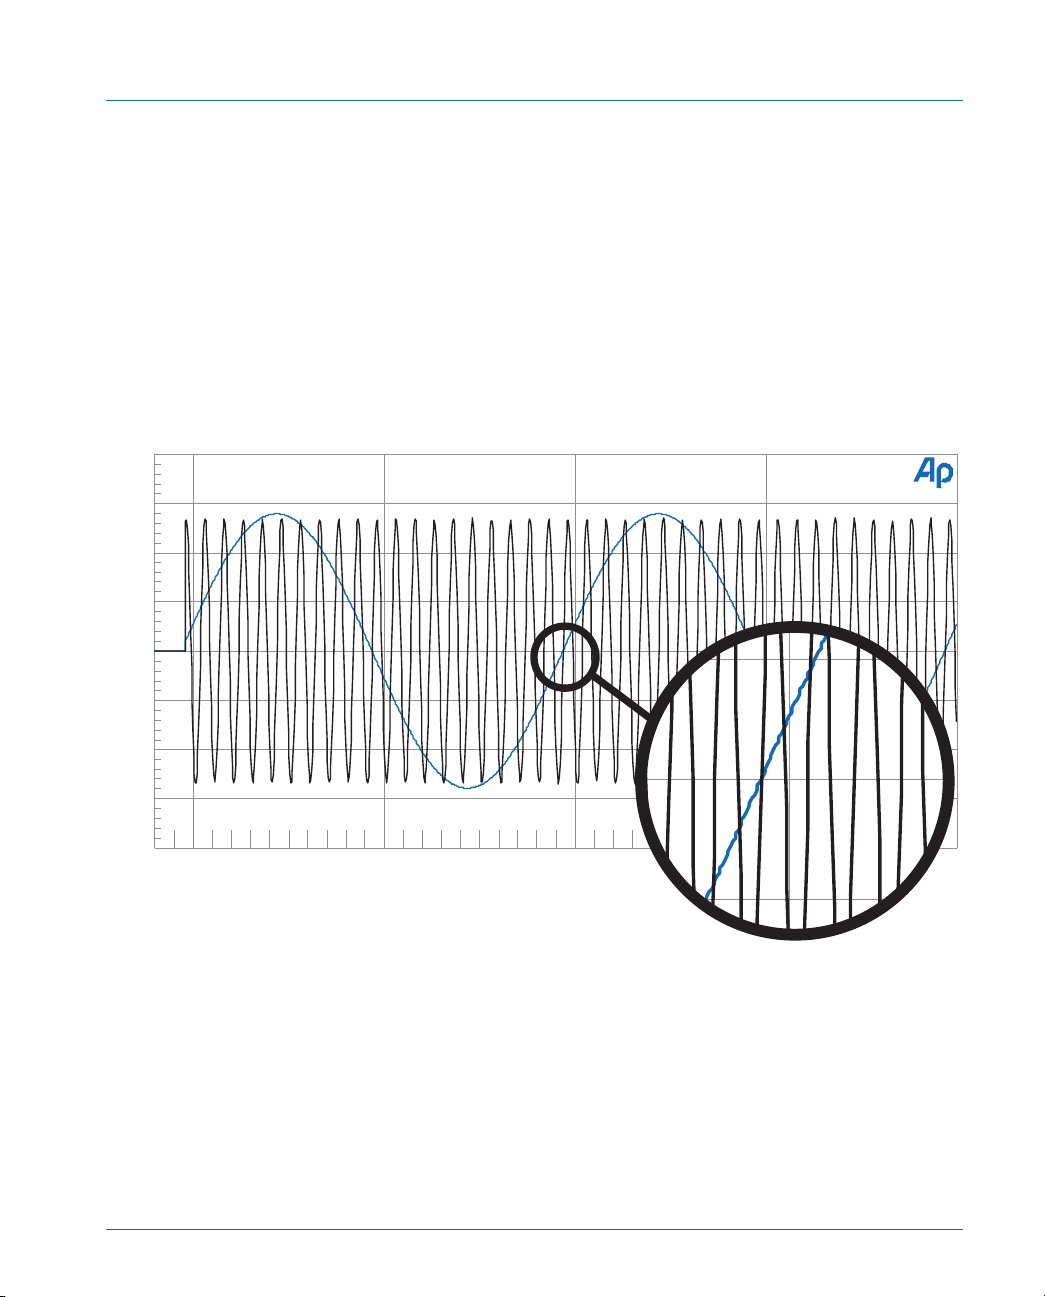
Waveform Display
An interesting signal for testing group delay is provided on the
Philips disc (track 74). This signal contains a 1 kHz signal on the left
channel and a 20 kHz signal on the right channel with coherent
phasing of the two signals. Every tenth zero crossing of the 20 kHz
wave should exactly align with the zero crossing of the 1 kHz wave. If
this is so the group delay (frequency-dependent phase) is the same for
both frequencies. This is the waveform saved in the O’scope.at2 file as
supplied.
Audio Precision CD Tiggered O'scope mode
4
3
2
1
0
V
-1
-2
-3
-4
0 2m500u 1m 1.5m
sec
Figure 36 Two different frequencies (1k and 10k) on different channels from the Philips disc track 74. The
zero cross of both signals should coincide with no offset when phase vs. frequency and interchannel phase
is correct.
Compact Disc Player Tests – Application Note #1A Page 89
Page 99

Special Problems
Special Problems
Occasionally compact disc players are found with defects that
require special measurement techniques in order to obtain data.
Excessive Inter-Track Noise
As noted earlier, some CD players have noise output while seeking
between tracks that is larger than their signal output on low amplitude
tracks such as -80 and -90 dB. This condition makes it more difficult
for the system to perform linearity and THD+N versus amplitude tests,
since the system may interpret the inter-track noise as a legitimate
low-amplitude signal. If restricted to using a System without DSP or
digital input ability (assuming the CD player has a digital output) the
options for achieving these low level measurements are limited. One
solution is to increase the Settling Panel Delay beyond the time
required for the player to seek from track to track. The software will
then discard data during that interval, and will capture and plot
properly the measurement from the next track. A disadvantage of this
approach is overall measurement speed. Settling Delay is invoked at
every measurement, on both stereo channels. If, for example, the CD
player is very slow in track seeking and requires a 5 second Settling
Delay to operate properly in a linearity test, the cumulative effect will
be 130 seconds of delay while testing both channels of a player across
13 amplitude levels.
If a System Two with DSP is used test versions that use this ability
are preferred—THDAmpl2.at2 and Linarty2.at2. If the CD player has a
digital output the Dual Domain version of either System can be used
with the “D” versions of these tests—THDAmplD and LinartyD.
Excessive Clock Signal Leakage
Several CD players have been measured with a rather high level of
leakage from oversampling and sigma-delta converters. In at least two
cases, this signal (at the audio output connectors) was only 60 dB
below full output. At low signal levels the Level meter sees this signal
since the Level voltmeter bandwidth is greater than 500 kHz. The
Page 90 Compact Disc Player Tests – Application Note #1A
Page 100

Special Problems
Level voltmeter will thus be unable to drive a test if the recorded
amplitudes go below the -60 dBFS level. In tests at low levels this can
produce multiple independent data points which can be seen on the
Data Editor but do not produce a useable (or any) graph. At low levels
reduced bandwidth measurement is required to remove these high
frequency signals from consideration. This requires the use of the
Function Reading meter with its bandwidth setting and optional filter
abilities. The DSP bandpass filter or digital input controlled sweeps are
the most reliable means to accomplish this.
These high frequency components are outside of the audible audio
band but many high-quality audio power amplifiers will also amplify
these signals because of their extended power-bandwidth. Since high
frequency speakers have much less power handling ability than the low
and mid range components the possibility exists that these high
frequency out-of-band signals could cause tweeter damage or reduce
their range (and probably contribute to distortion) by modulating
in-band audio signals.
Compact Disc Player Tests – Application Note #1A Page 91
 Loading...