

Page 1
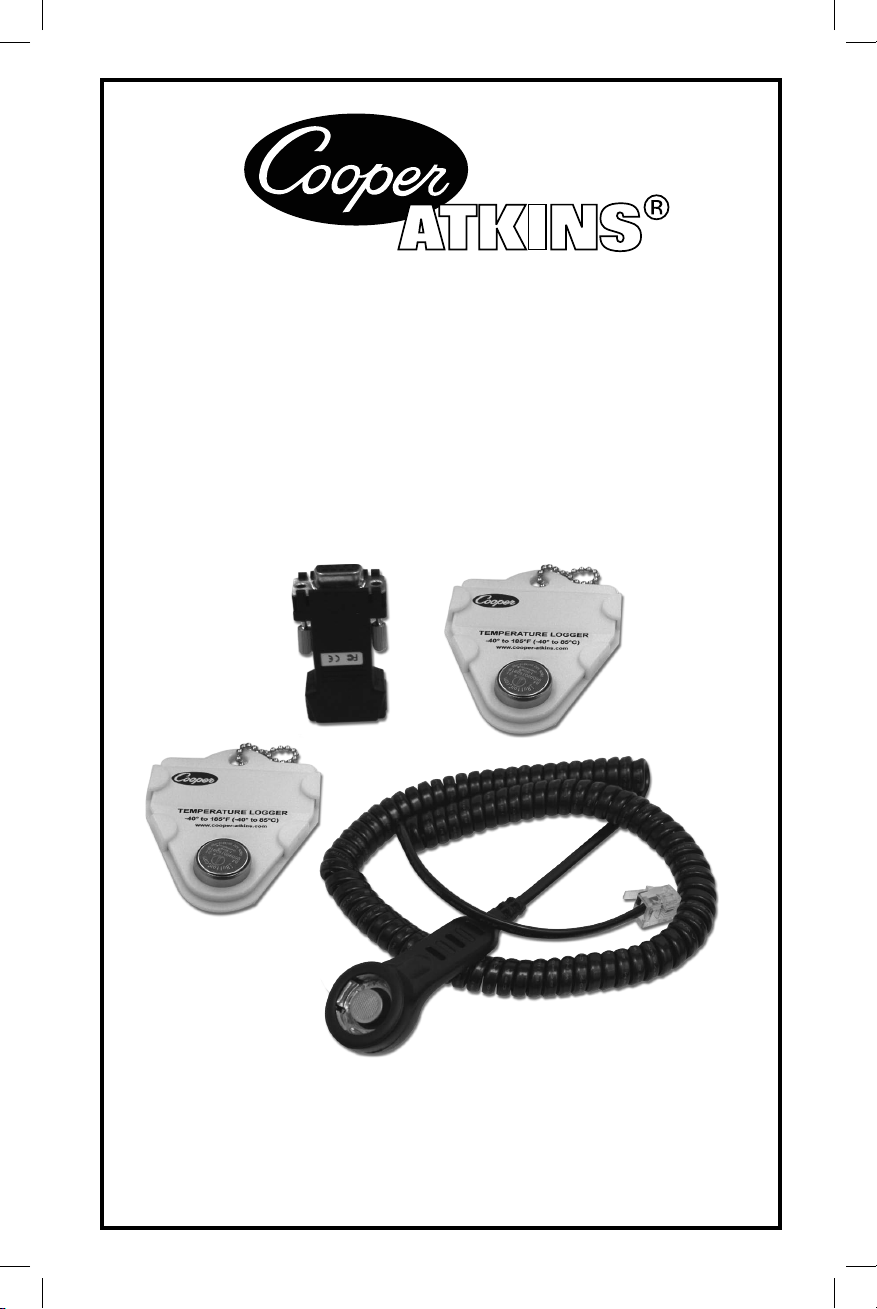
GL100
Data Logger Kit
User Guide and Instrument Warranty
Page 2

TABLE OF CONTENTS
Introduction .........................................................................................................................................3
What is the GL100 Manager? .....................................................................................................3
System Requirements................................................................................................................. 3
Connecting the Download Cable .................................................................................................3
Data Logging Missions ......................................................................................................................3
Beginning a New Mission ........................................................................................................3-4
Viewing Mission Status ..............................................................................................................4
Downloading Mission Data .........................................................................................................5
Mission Details ...........................................................................................................................5
Ending the Mission .....................................................................................................................5
Continuing the Mission ...............................................................................................................5
Settings ............................................................................................................................................5-6
Set the Working Directory .......................................................................................................5-6
The Settings Dialog Window .......................................................................................................6
Backing Up Your Data .................................................................................................................6
Features ...........................................................................................................................................6-7
The Mission Graph ..................................................................................................................... 6
Zooming & Panning ....................................................................................................................7
Paging.........................................................................................................................................7
The Download Log ......................................................................................................................7
The Temperature Table ................................................................................................................7
Selecting Multiple Missions ........................................................................................................ 7
The Active mission List ...............................................................................................................7
Printing .............................................................................................................................................7-8
Printing the Download Log .........................................................................................................7
Printing the Active Mission List ..................................................................................................8
Printing the Temperature Table .................................................................................................. 8
Printing the Mission Graph ......................................................................................................... 8
Printing the Corrective Actions List ............................................................................................8
Printing the Group List ...............................................................................................................8
Troubleshooting .................................................................................................................................. 8
GL100 Not Found ....................................................................................................................... 8
Technical Support .......................................................................................................................8
Limited Warranty ...............................................................................................................................8
Product Registry .................................................................................................................................8
2
Page 3

INTRODUCTION
WHAT IS THE GL100 MANAGER?
The GL100 Manager is a software program that works in tandem with the GL100 Data Logger. It allows the set up of loggers
for missions and to examine data collected by them. At least one GL100 Logger must be connected to your computer to
use all the features of the GL100 Manager.
The GL100 Manager helps monitor and record accurate food storage and preparation temperatures. It is also suited for
other applications that require the monitoring and recording of temperature data. When run on a personal computer, it can
collect, store and display temperature data for critical control points (CCP) and can be programmed for specific applications.
The GL100 Data Logger operates in temperatures ranging from -40° to 185°F (-40° to 85°C). Its water resistance
(rated to IP56) and small size make it ideal for many applications that require long-term data collection. To use the
GL100 Data Logger, first program it using the GL100 Manager software, then place the Logger in the area where
temperature data is to be collected.
SYSTEM REQUIREMENTS
To run the GL100 Manager software it needs to meet the following requirements:
• IBM or IBM compatible (386 or higher)
• Microsoft Windows 98 SE (or higher)
• Universal Serial Bus (USB) port or a 9-pin serial communication port
• 100 MB of hard disk space
• Compact Disk (CD) drive or internet connection
• Mouse or other pointing device
• Printer
The last two items, although not essential, are highly recommended. Installation on some systems (such as Windows
Vista) requires administrator privileges. Right-click on SETUP.EXE and select RUN AS ADMINISTRATOR from the
drop- down menu. In addition, the GL100 Manager needs to be allowed to write to the C:\ drive, so make sure the user
has this permission.
See also
Technical Support (back page).
CONNECTING THE DOWNLOAD CABLE
The Data Logger and computer communicate via the USB port or 9-pin RS232 serial port, so there must be a cable
hook-up between them to allow the transfer of data, or to program a GL100 Tag. The GL100 Manager Kit ships with
a download cable to allow use of either a USB port or a 9-pin RS232 port. Check your computer manual for specific
recommendations regarding connecting a serial cable. The Reader Cable can have only one Logger Tag installed at any time.
The newer cable design holds one tag, but the older design can hold two.
NOTE: IF USING THE OLDER VERSION (3.1), EITHER OF THE TAG PORTS CAN BE USED BUT ONLY ONE AT ANY TIME.
IF LOGGER TAGS ARE INSTALLED INTO BOTH PORTS AT THE SAME TIME THE SYSTEM WILL NOT DETECT
EITHER TAG. IN THIS CASE, REMOVE ONE OF THE TAGS AND RETRY THE OPERATION.
Automatic installation
When using the USB adapter for the first time, the computer will attempt to install drivers for the adapter.
Manual installation
If drivers do not install automatically when using the USB adapter for the first time, The driver files are located in the install
folder inside the GL100 program files on the hard drive (...Install Folder \ Drivers). In this case you can install the drivers
manually.
See also
Settings (pages 5-6).
DATA LOGGING MISSIONS
BEGINNING A NEW MISSION
Install a Logger Tag into the Reader cable port. On the DATA LOGGER COMMANDS menu, click once on the green UP arrow
to begin a new mission. The Begin New Mission dialog will diplay:
Tag Serial Number: (Shown in the dialog title bar) refers to the unique serial number laser-etched onto the front of the
Logger Tag.
3
Page 4

Mission description: Type a meaningful description to identify the name or purpose of the new mission. You may enter up
to a maximum of 40 characters.
Record interval: Set the desired recording time interval between data points. The shortest interval allowed is one minute;
the longest interval allowed is 4 hours and 15 minutes.
Action when full: Click on the DOWN arrow to select either STOP or ROLL-OVER. Selecting Stop will end the recording
when the Logger memory reaches its limit (2048 records). Selecting Roll-Over tells the Logger to begin overwriting the
oldest records when memory limit is reached. It will maintain only the most recent 2048 records on an continuous basis.
Start time & date: Delays the start of the mission so that the Logger can be in position when the first record is taken. Use
the calendar to set the start day. Use the time editor to set the time of day. Click on the NOW button to begin the mission.
NOTE: THERE IS A LIMIT TO THE LENGTH OF THE START DELAY. THE CALENDAR WILL ONLY ADVANCE TO THE LIMIT
OF THE START DELAY MAXIMUM. THE STATUS BAR AT THE BOTTOM OF THE DIALOG WILL INDICATE THE
ESTIMATED STOP (OR ROLL-OVER) TIME AND DATE.
Group: Use the drop-down menu to select the group (if any) to which the Logger belongs.
Watch limits: Activate the upper and / or lower limit watch by placing a check inside the select box. Set the temperature
for the watch limit.
NOTE: THE LOWER LIMIT MAY NOT BE GREATER THAN THE UPPER LIMIT, NOR MAY THE UPPER LIMIT BE LESS THAN
THE LOWER LIMIT.
Battery life remaining: This indicates an estimated battery life remaining based on a lifetime reading total of 1,000,000.
Actual battery life varies depending on the frequency of record intervals and the ambient temperature.
Launch button: Begins a new mission with new settings. A message displays indicating that the tag has been successfully
set. If communication with the Logger Tag is interrupted a message indicates that programming has failed. Check the
connections and retry.
Cancel button: Abandons the new mission and return to the main program.
VIEWING MISSION STATUS
Install a Logger Tag into the Reader cable port. On the Data logger Commands menu, click once on the magnifying glass
to examine the mission status. The Mission Status dialog will display:
Tag serial number: (Shown in the dialog title bar) refers to the unique serial number laser-etched onto the front of the
Logger Tag.
Mission description: Shows the name or purpose of the mission.
Data collection: Displays the recording time interval between data points and shows what action the mission will take when
the logger memory limit is reached.
Roll-over: Means the logger will begin overwriting the oldest records when the memory limit is reached.
Stop: Means recording will end when the logger memory limit (2048 records) is reached.
Status: Shows the current state of the logger.
Date & time: Displays the current time based on the computer system’s clock. The GL100 time retrieved from the clock
inside the GL100. The time will be set to match the current time automatically when a beginning a new mission.
Temperature alarm limits: Shows any watch limits in use for this mission.
Group: Shows the group (if any) to which the logger belongs.
Battery life remaining: Estimates remaining battery life based on a lifetime reading total of 1,000,000. Actual battery life
varies depending on the frequency of record intervals and the ambient temperature.
Begin a new mission: Sets up a new mission.
NOTE: ALL RECORDS IN THE GL100 WILL BE ERASED WHEN THE NEW MISSION IS LAUNCHED, SO BE SURE YOU
HAVE PERFORMED A DOWNLOAD PRIOR TO LAUNCHING A NEW MISSION (UNLESS THE CURRENT DATA HAS
NO IMPORTANCE).
4
Page 5

Download: Loads the contents of the logger into the GL100 manager database.
Stop the data logger: Click once on this button to stop the logger internal clock. This is good practice to preserve the logger
battery life when not on an active mission. The logger clock will be restarted automatically when a beginning a new mission.
DOWNLOADING MISSION DATA
Install a Logger Tag into the Reader cable port. On the Data logger Commands menu, click once on the DOWN ARROW to
download the mission data. In the resulting dialog box, choose from the following:
Turn off the data logger: Ends the active mission by turning off the GL100 internal clock; Mission data held in the GL100
after the clock is off will remain unchanged until a new mission is begun.
Begin a new mission: Opens the Begin New Mission dialog (see page 3).
Continue this mission: Leaves the contents of the GL100 data logger intact and mission data will continue.
When selecting one of these options, if the View Mission Details check box is checked (see page 5), that dialog box will
open and allow notes and corrective actions to be added to the download log entry.
MISSION DETAILS
Comments and corrective actions can be entered and edited.
Mission description: Edits the original mission description by changing the text here.
Group: If a group has been assigned to this mission the group name will appear here. Add or change the group name by
changing the selection here.
Info: Lists the number of records in the mission as well as mission lowest temperature, highest temperature, and average
temperature.
Select corrective action: Enter a description of any corrective action taken as a result of the mission. Select from a list of
often-used corrective actions by clicking on the DOWN arrow to the right of the edit box.
Enter comment: Adds any notes or comments regarding the mission.
Save button: Saves any changes made to the mission details and closes the Mission Detail dialog.
Cancel button: Click here once to discard any changes made to the mission details and close the Mission Details dialog.
The Mission Details dialog can also be opened by double-clicking on the desired log entry in the Download Log.
ENDING THE MISSION
Ending the mission means turning off the GL100 internal clock. When the clock is turned off, the GL100 enters a low-power
state to preserve the internal battery life, and all data collection ceases. At this point , the mission cannot be restarted but
the mission data is available for viewing and downloading.
To end the mission immediately (without first downloading), click once on the END THE MISSION button located on the
Data Logger Commands menu.
The GL100 internal clock will restart automatically when the GL100 data logger begins a new mission.
See also
Downloading Mission Data (see above).
CONTINUING THE MISSION
After downloading the GL100, rather than ending the mission, you may want the mission to continue. To do this, select the
Continue Mission option in the dialog box that appears after a successful download. All mission settings and mission data
collected to date will be unchanged and the mission will continue.
See also
Downloading Mission Data (see above).
SETTINGS
SET THE WORKING DIRECTORY
The working directory refers to the folder on the computer’s hard drive where the GL100 Manager saves its data. By default
this folder is located within the GL100 Manager installation folder, but can be changed to be located on a remote server.
5
Page 6

NOTE: THE GL100 MANAGER IS NOT A NETWORKED DATABASE. IT CANNOT BE ACCESSED BY MORE THAN ONE USER
AT A TIME, REGARDLESS OF WHERE THE WORKING DIRECTORY IS LOCATED. FAILURE TO COMPLY WILL
RESULT IN LOSS OF DATA.
To change the working directory: On the main menu click on FILE, then click on SET WORKING DIRECTORY.
The Set Working Directory dialog window will appear. When the dialog window opens, the current working directory is
shown near the top of the window, and also is selected in the folder tree below. Navigate to the location of the desired
working directory, and then click once on the OK button to set that folder as the working directory.
To create a new working directory: On the main menu click on FILE, then click on SET WORKING DIRECTORY.
The Set Working Directory dialog window will appear. Click on the MAKE NEW FOLDER button to create a new folder and
click on the OK button. The Create Working Directory dialog will appear; select OPTION 1 to include data from the current
working folder; OPTION 2 to exclude data from previous working folders in the new working folder; or OPTION 3 to abandon
the changes to the working directory and resume using the current working directory.
THE SETTINGS DIALOG WINDOW
Settings allow you to choose the way the GL100 Manager looks, displays data, and communicates with your computer.
To examine or make changes to the settings, open the Settings form from the main menu by clicking once on the SETTINGS
menu option. The Settings dialog window dispalys several tabs near the top:
General: Accesses communication settings, temperature display formats, and general application color setting.
Corrective actions & groups: Edits the Corrective Actions or Group lists.
Mission graph: Changes the way the Mission graph renders, and allows use of the graph paging option. If more than one
log entry is selected, you can set the front-to-back position of the graphed series lines: click on the SERIES ORDER button
and then use the MOVE buttons to change the position of the selected series. When finished, click once on the OK button
to close the Settings dialog window.
BACKING UP YOUR DATA
As with any database application, the data maintained by the GL100 Manager should be protected from accidental loss by
periodically saving the data to a secure storage location.
To create a backup of your data:
On the main menu, click on FILE and then click on BACK-UP. Use the browser to select the desired back-up folder, or click
on the MAKE NEW FOLDER button. Click on the OK button to finish the back-up operation. Click on the CANCEL button to
abandon the back-up operation
FEATURES
THE MISSION GRAPH
The Mission Graph displays the temperature versus time data for the mission(s) selected in the Download Log. Various
settings are available to adjust the appearance of the graph. The graph can be printed or cut and pasted into other
applications. Right-click the mouse over the mission graph to see a pop-up menu with options.
When set for view in 3D:
When not set for view in 3D, and only one download is selected:
When not set for view in 3D, and more than one download is selected:
Change the color of the Upper and Lower Limits by clicking on the COLOR SELECTOR button to the right off the
Show Upper Limit or Show Lower Limit check boxes. Change the Upper Limit color by clicking once on the color selector
to the right of the Show Upper Limit check box.
SEE ALSO
Settings (see pages 5-6).
• Graphed data that exceeds the mission’s Upper Limit is shown in the Upper Limit color
• Graphed data that exceeds the mission’s lower Limit is shown in the Lower Limit color
• Mission data is shown in green
• Mission’s Upper Limit is shown as a horizontal red line
• Mission’s Lower Limit is shown as a horizontal blue line
• Mission data for each download is shown in a different color
• To see Upper or Lower limits the POINTS box must be checked
• Mission’s Upper Limit points are shown in red
• Mission’s Lower Limit points are shown in blue
6
Page 7

ZOOMING AND PANNING
Zooming in: Hold down the LEFT MOUSE button and drag a rectangle from left to right around the selected area of the
graph and release the mouse button.
Zooming out: Click on the ZOOM OUT button near the upper-left corner of the graph. Each click of the ZOOM OUT button
will decrease the zoom by 10%. To zoom out all at once, hold down the LEFT MOUSE button, drag a rectangle from right
to left and release the mouse button.
Panning: Hold down the RIGHT MOUSE button on the graph and drag the graph image within the Mission Graph window.
To stop panning, release the mouse button.
PAGING
Paging allows data from a long mission to be spread out across multiple graph pages for easier viewing.
To activate paging:
Scroll through the pages by clicking on the NEXT PAGE and PREVIOUS PAGE buttons.
Changing the selection in the Download Log will turn off paging and reset the number of graph pages to one.
• Open the Settings form by clicking SETTINGS on the main menu
• Select the MISSION GRAPH tab
• Change the value in the PAGES box to increase or decrease the number of pages (maximum is 20 pages)
THE DOWNLOAD LOG
The Download Log is a list of each of the GL100 missions that have been downloaded. The log is automatically updated
when the GL100 is downloaded. Mission information is listed in the table columns. Additionally, the Mission Graph (see
page 6) plots the mission data for the selected mission. Select a mission by left-clicking the mouse. Additional information
is available by double-clicking the selected mission to open the Mission Details window. Delete an entry by selecting the
entry and then click on the DELETE SELECTED ROWS button (trash can on the Mission Data menu bar). Export temperature
table to .XLS format by clicking on the EXPORT button.
See also
Selecting Multiple Missions (see below).
THE TEMPERATURE TABLE
The Temperature Table lists all of the temperature data for the selected mission or missions. Each line of the table indicates
the specific time and date that each temperature was recorded. Multiple missions cannot be printed from the Temperature
Table - you must select and print each mission separately. Clicking on a point in the Mission Graph will locate that point
within the Temperature Table. Export Temperature Table to XLS format by clicking on the EXPORT button, then name the
file and click SAVE button.
See also
Printing the Temperature Table (see page 8).
SELECTING MULTIPLE MISSIONS
To view multiple missions on the Mission Graph:
Hold down the keyboard CTRL button and using the mouse, left-click on SELECTED MISSIONS.
THE ACTIVE MISSION LIST
The Active Mission List displays information about the GL100 data loggers that have been programmed for a mission.
Also, checking the status of a GL100 Data Logger will register that tag in the Active Mission List.
To view the Active Missions list click on the ACTIVE MISSIONS tab at the bottom of the GL100 Manager window, or click on
VIEW (on the main menu) and then select ACTIVE MISSIONS to display the active mission list.
The active missions list offers two view options:
Table view: Displays active mission data in column format. Click on the Search Bar option to search the Active mission
list for a particular mission name.
Panel view: Displays active mission data in separate panels. Delete an entry by selecting the entry and then click on the
Delete selected rows button (trash can on the Active Missions menu bar).
PRINTING
PRINTING THE DOWNLOAD LOG
Selecting this print option will prepare a report which lists all of the missions that have been downloaded. The report
includes only mission information.
To print a report for a particular mission, see PRINTING THE TEMPERATURE TABLE (see page 8).
To print the graph of a particular mission, see PRINTING THE MISSION GRAPH (see page 8).
7
Page 8

PRINTING THE ACTIVE MISSION LIST
Selecting this option will prepare a report showing the entire active mission list.
PRINTING THE TEMPERATURE TABLE
Selecting this option will prepare a report of the currently selected mission.
NOTE: IF MULTIPLE MISSIONS ARE SELECTED, THIS WILL PRINT ONLY THE FIRST MISSION. EACH ADDITIONAL
MISSION MUST BE SELECTED ONE AT A TIME FOR PRINTING.
PRINTING THE MISSION GRAPH
Selecting this print option will prepare a report showing the graphed mission data as it appears in the Mission Graph
window. Make any desired changes to the appearance of the graph prior to selecting the print command.
Select or change the printer and printer settings by clicking on the PRINTER SETUP button.
Change the page orientation by selecting either portrait or landscape in the ORIENTATION section.
Choose to print the graph title or notes by checking the boxes in the TEXT OPTIONS section.
Edit the graph title and graph notes by directly editing the text within the preview window.
If the PROPORTIONAL check box is selected, changing the graph width or height will maintain the graph length to
height proportions.
If you want the graph report saved in Acrobat Reader format (PDF) select the SAVE TO A PDF FILE check box.
Then, when you click on the PRINT button select the filename and location where the pdf file will be created.
When the print preview window opens you may adjust the size of the graph by moving the mouse cursor to the top or left
side of the graph image until the double bars appear, then left-click and drag to the desired size. Move the graph image on
the page by placing the mouse cursor near the middle of the graph and left-click and drag to the new location.
PRINTING THE CORRECTIVE ACTIONS LIST
Selecting this option will prepare a report showing the list of corrective actions.
PRINTING THE GROUP LIST
Selecting this option will prepare a report showing the list of groups.
TROUBLESHOOTING
GL100 NOT FOUND
If the GL100 cannot be detected check the cable and adapter connections and make sure the GL100 is clean and properly
seated in the reader cradle. On the main menu, click on SETTINGS, then in the Settings window, click on the GENERAL tab.
Make sure the COMMUNICATIONS settings are correct.
If using the USB adapter provided with the GL100 kit, check Windows Device Manager to verify that the 1-Wire adapter is
shown on the list.
TECHNICAL SUPPORT
For technical support contact Cooper-Atkins at the number below.
LIMITED WARRANTY
Any instrument, which proves to be defective in material or workmanship within one year of original purchase, will be
repaired or replaced without charge upon receipt of the unit prepaid with proof of purchase. This Limited Warranty does
not cover damage in shipment or failure caused by tampering, obvious carelessness, or abuse and is the purchaser’s
sole remedy.
PRODUCT REGISTRY
Please register your Cooper-Atkins product today. It is the only way to notify you of future software / product upgrades.
There is no fee to register. Go to: www.cooper-atkins.com/registry.asp and complete the online form.
Manufactured in the U.S.A. by Cooper-Atkins Corporation
V1111 27-958605
An ISO 9001 Registered Facility
Cooper-Atkins Corporation
33 Reeds Gap Road • Middlefield, CT 06455-0450 U.S.A.
860-347-2256 • Fax 860-347-5135 • www.cooper-atkins.com
Made in U.S.A
 Loading...